The Generalized Extreme Value (GEV) Distribution, Implied Tail Index and Option Pricing1
37
- 1 - The Generalized Extreme Value (GEV) Distribution, Implied Tail Index and Option Pricing 1 Sheri Markose #* and Amadeo Alentorn # * Department of Economics # Centre for Computational Finance and Economics Agents (CCFEA) University of Essex 23 April 2005 Crisis events such as the 1987 stock market crash, the Asian Crisis and the bursting of the Dot-Com bubble have radically changed the view that extreme events in financial markets have negligible probability. This paper argues that the use of the Generalized Extreme Value (GEV) distribution to model the Risk Neutral Density (RND) function provides a flexible framework that captures the negative skewness and excess kurtosis of returns, and also delivers the market implied tail index of asset returns. We obtain an original analytical closed form solution for the Harrison and Pliska (1981) no arbitrage equilibrium price for the European option in the case of GEV asset returns. The GEV based option prices successfully remove the well known pricing bias of the Black-Scholes model. We explain how the implied tail index is efficacious at identifying the fat tailed behaviour of losses and hence the left skewness of the price RND functions, particularly around crisis events. Keywords: Generalized Extreme Value Distribution; Risk neutral probability density function; Implied Tail Index; Option Pricing Model; Fat Tails. JEL Classification: G10, G12, G13. 1 We are grateful for comments from Thomas Lux, Chris Schwab and other participants of the Workshop on Computational Finance at the CAU University of Kiel where an earlier draft of the paper was presented on 5 November 2004. We are also grateful for comments from Olaf Menkens and participants of the CCFEA seminars. Corresponding author is Sheri Markose: e-mail address [email protected].
Transcript of The Generalized Extreme Value (GEV) Distribution, Implied Tail Index and Option Pricing1

- 1 -
The Generalized Extreme Value (GEV) Distribution,
Implied Tail Index and Option Pricing1
Sheri Markose#* and Amadeo Alentorn#
* Department of Economics # Centre for Computational Finance and Economics Agents (CCFEA)
University of Essex
23 April 2005
Crisis events such as the 1987 stock market crash, the Asian Crisis and the bursting of the
Dot-Com bubble have radically changed the view that extreme events in financial markets have
negligible probability. This paper argues that the use of the Generalized Extreme Value (GEV)
distribution to model the Risk Neutral Density (RND) function provides a flexible framework that
captures the negative skewness and excess kurtosis of returns, and also delivers the market implied tail
index of asset returns. We obtain an original analytical closed form solution for the Harrison and
Pliska (1981) no arbitrage equilibrium price for the European option in the case of GEV asset returns.
The GEV based option prices successfully remove the well known pricing bias of the Black-Scholes
model. We explain how the implied tail index is efficacious at identifying the fat tailed behaviour of
losses and hence the left skewness of the price RND functions, particularly around crisis events.
Keywords: Generalized Extreme Value Distribution; Risk neutral probability density function; Implied
Tail Index; Option Pricing Model; Fat Tails.
JEL Classification: G10, G12, G13.
1 We are grateful for comments from Thomas Lux, Chris Schwab and other participants of the Workshop on Computational Finance at the CAU University of Kiel where an earlier draft of the paper was presented on 5 November 2004. We are also grateful for comments from Olaf Menkens and participants of the CCFEA seminars. Corresponding author is Sheri Markose: e-mail address [email protected].
- 2 -
1. Introduction
The 1987 stock market crash, the Asian Crisis (July–October 1997), the September 1998
LTCM debacle, the bursting of the high technology Dot-Com bubble of 2000-02 with 30% losses of
equity values, events such as 9/11, and sudden corporate collapses of the magnitude of Enron - have
radically changed the view that extreme events have negligible probability. In mainstream financial
theory extreme events which occur with small probabilities have not been a matter of concern as in the
dominant model of lognormal asset prices the probability of extreme events is negligible.2 However,
recently there has been a growing pragmatic and theoretical interest in the shape and fatness of the tails
of the distributions of stock returns.
Extreme value theory is a robust framework to analyse the tail behaviour of distributions.
Extreme value theory has been applied extensively in hydrology, climatology and also in the insurance
industry (see, Embrechts et. al. 1997). Despite early work by Mandelbrot (1963) on the possibility of
fat tails in financial data and evidence on the inapplicability of the assumption of log normality in
option pricing, a systematic study of extreme value theory for financial modelling and risk management
has only begun recently. Embrechts et. al. (1997) is a comprehensive source on extreme value theory
and applications.3
The objective of this paper is to use the Generalized Extreme Value (GEV) distribution in the
context of European option pricing with the view to overcoming the problems associated with existing
option pricing models. Within the Harrison and Pliska (1981) asset pricing framework, the risk neutral
probability density function (RND, for short) exists under an assumption of no arbitrage. By definition
of a no arbitrage equilibrium, the current price of an asset is the present discounted value of its
expected future payoff given a risk-free interest rate where the expectation is evaluated by the RND
function. Breeden and Litzenberger (1978) were first to show how the RND function can be extracted
from traded option prices.
The Black-Scholes (1973) and lognormal based RND models have well known drawbacks.
First, the implied volatility smiles or smirks are inconsistent with the constancy required in the
lognormal case for volatility across different strikes for options with the same maturity date. Further,
this class of models cannot explicitly account for the negative skewness and the excess kurtosis of asset
returns. Since, Jackwerth and Rubinstein (1996) demonstrated the discontinuity in the implied
skewness and kurtosis across the divide of the 1987 stock market crash - a large literature has
developed which aims to extract the RND function from traded option prices so that the skewness and
fat tail properties of the distribution are better captured than is the case in lognormal models.
2 As noted by Jackwerth and Rubinstein (1996) in a lognormal model of assets prices, the probability of a stock market crash with some 28% loss of equity values is 10-160, an event which is unlikely to happen even in the life time of the universe. 3 Embrechts (1999, 2000) considers the potential and limitations of extreme value theory for risk management. Without being exhaustive here, De Haan et. al. (1994) and Danielsson and de Vries (1997) study quantile estimation. Bali (2003) uses the GEV distribution to model the empirical distribution of returns. Mc Neil (1999) gives an extensive overview of extreme value theory for risk management, see also Dowd (2002, pp.272-284). The EVIM package of Gençay et. al. (2001) for extreme value analysis in MatLab has become a user friendly tool for financial data analysis.

- 3 -
Pricing biases caused by left skewness of asset returns that cannot be captured in the implied
lognormal asset pricing models are now well understood (see, Savickas, 2002, 2004). Typically, in
periods when the left skewness of asset prices increases, the Black-Scholes option prices for them will
overprice out-of-the-money call options and underprice in- the-money call options relative to when
there is greater symmetry in the distribution function. Further, there is evidence that the option price is
highly sensitive to the tail shape change which is a matter that is distinct to its sensitivity to the
variance of the price distribution. However, the lack of closed form solutions to the option pricing
model, the large number or parameters needed or the lack of easy interpretation of implied parameters
have prevented many of the proposed models intended to deal with both the fat tails and the skew in
asset prices from being of practical use in pricing and hedging.
This paper argues for the use of the Generalized Extreme Value (GEV) distribution for asset
returns in call option pricing models for the following reasons:
(i) It can provide a closed form solution for the European option price.
(ii) It yields a parsimonious European option pricing model with only three
parameters defining the tail shape, location and scale.
(iii) It provides a flexible framework that subsumes as special cases a number of
classes of distributions that have been assumed to date in more restrictive settings.
(iv) It most significantly, can deliver the market implied tail index for the asset returns.
The latter is found to be time varying in a way that mirrors the lack of invariance
in the recursively estimated tail index of asset returns (see, Quintos, Fan and
Phillips, 2001) with jumps in the fat tailedness in crisis periods.
(v) We follow the convention (see Dowd 2002, p.272) that asset returns are modelled
in terms of losses when Extreme Value Theory is used. When extreme events are
prominent, the GEV model for negative returns yields a Fréchet type implied
density function for returns. The corresponding RND for the price is left skewed
and exhibits a fat tail on the left.
(vi) The success of the GEV based RND for the asset price in removing well known
pricing biases associated with the Black Scholes model can be now established
precisely in terms of changes in tail shape.
(vii) Having obtained a closed form solution for the option pricing model, we can also
obtain a closed form solution for the new “greek” in the lexicon of option pricing,
which measures the sensitivity of the option price to the tail index.
(viii) The closed form delta hedging formulation can also be given.
This paper covers the first (vi) features listed above of the GEV RND model of option pricing
and leave the last two for further work.
We will briefly now comment on how the GEV RND based option pricing model fits into the
large edifice, given in Figure 1 below, built of the different methods used for the extraction of the
implied distributions and their respective option pricing models that have arisen since the work of

- 4 -
Breeden and Litzenberger (1978). Based on Jackwerth (1999) survey, the different methods can be
classified into three main categories: parametric, semi parametric and non-parametric. Parametric
methods can be divided into three sub-categories: generalized distribution methods, specific
distributions and mixture methods. Generalized distribution methods introduce more flexible
distributions with additional parameters beyond the two parameters of the normal or lognormal
distributions. Within this subcategory, Aparicio and Hodges (1998) use generalized Beta functions of
the second kind, which are described by four parameters, and Corrado (2001) uses the generalized
Lambda distribution. Under the specific distributions being assumed for the RND function, we find the
Weibull distribution by Savickas (2002 and 2004), and the skewed Student-t by de Jong and Huisman
(2000). The Variance Gamma distribution used by Madan, Carr and Chang (1998), and Levy processes
used among others by Matache, Nitsche and Schwab (2004) are more recent specifications with these
methods having parameters that can control fat tails and skewness of the asset price. Up to seven
parameters are associated with these models.
Parametricmethods
Non-parametricmethods
Generalizeddistributions
Specificdistributions
Mixturemethods
Generalized Beta functions (Aparicio and Hodges1998)
Generalized Lambda Distribution (Corrado 2000)
Generalized Extreme Value (GEV) distribution
Mixture of two normals (Ritchey 1990)
Mixture of three lognormals (Melick and Thomas 1997)
Kernel methods (Ait-Sahalia and Lo 1998)
Maximum entropy methods (Buchen and Kelly 1996)
Curve fitting methods (Shimko 1993)
Semi parametricmethods
Hypergeometric functions (Abadir and Rockinger 1997)
Gram-Charlier expansions (Corrado and Su 1997)
Edgeworth expansions (Jarrow and Rudd 1982)
Weibull distribution (Savickas 2002, 2004)
Skewed Student-t (de Jong and Huisman 2000)
Variance Gamma (Madan, Carr and Chang1998)Lévy process (Matache, Nitsche and Schwab 2004)
Figure 1: Classification of most common RND estimation methods

- 5 -
Finally, the third sub-category within parametric methods is the mixture methods, which
achieve greater flexibility by taking a weighted sum of simple distributions. The most popular method
here is mixture of lognormals. Ritchey (1990) and Gemmill and Saflekos (2000) use two lognormals,
and Melick and Thomas (1997) use three lognormals. One problem associated with the mixture of
distributions is that the number of parameters is usually large, and thus they may overfit the data. For
example, the mixture of two lognormals needs to estimate five parameters.
Under the category of semi parametric methods, we find the Hypergeometric function used by
Abarid and Rockinger (1997), and expansion methods such as the Gram-Charlier expansions used by
Corrado and Su (1997) and Edgeworth expansions used by Jarrow and Rudd (1982). The non-
parametric methods can be again divided in three groups: kernel methods, maximum-entropy methods,
and curve fitting methods. Kernel methods are related to regressions since they try to fit a function to
observed data, without specifying a parametric form. Second, the methods based on maximum-entropy
find a non-parametric probability distribution that tries to match the information content, while at the
same time satisfying certain constraints, such as pricing observed options correctly. In the third group
in this category, there are the curve fitting methods that try to fit the implied volatilities or the risk-
neutral density with some flexible function. The model presented in this paper, as highlighted in
Figure 1, falls in the general category of parametric models, and more specifically, within the sub-
category of generalized distributions. In Section 2 of the paper we give a brief introduction on Extreme
Value Theory and present the Generalized Extreme Value (GEV) distribution and its properties to
indicate how the flexibility of this three parameter class of distribution can capture skew and fat tails as
and when dictated by the data with no a priori restrictions.
The rest of the paper is organized as follows. In section 3.1, the use of the GEV distribution
for the RND returns in the context of the Harrision and Kreps (1991) no arbitrage pricing model is
discussed. In Section 3.2, the closed form solutions for the arbitrage free European call and put option
price equations are derived in the case of the GEV distribution for the RND function. Sections 3.3 and
3.4 discuss the components of the closed form solution for the proposed GEV option pricing model.
Section 4 reports the empirical results on the estimated implied GEV parameters and RND function for
the FTSE 100 European option price data from 1997 to 2003. Section 4.1 gives the data description,
and Section 4.2 the methodology. In Sections 4.3 and 4.4, the fit of the postulated GEV option pricing
model is compared to the benchmark Black-Scholes and is found to be superior at all levels of
moneyness and at all time horizons, removing the well known price bias of the Black-Scholes model.
In Section 4.5, the analysis of the implied tail indexes is given, and in Section 4.6, the role of implied
RND functions in the event studies surrounding periods of “extreme” downward movements of the
FTSE-100 index is given. Finally, Section 5 gives the conclusions of the paper.

- 6 -
2. Extreme Value Theory and the GEV distribution
Unlike the normal distribution that arises from the use of the central limit theorem on sample
averages, the extreme value distribution arises from the limit theorem of Fisher and Tippet (1928) on
extreme values or maxima in sample data. The class of GEV distributions is very flexible with the tail
shape parameter ξ (and hence the tail index defined as α= ξ-1) controlling the shape and size of the tails
of the three different families of distributions subsumed under it. The three families of extreme value
distributions can be nested into a single parametric representation, as shown by Jenkinson (1955) and
von Mises(1936). This representation is known as the “Generalized Extreme Value” (GEV) distribution
and is given by:
( )( ) 0,01with1exp)( /1 ≠>++−= − ξξξ ξ
ξ xxxF . (1.a)
Applying the formula that xex →+ − ξξ /1)1( , as 0→ξ we have,
.)exp()(0xexF −= (1.b)
The standardized GEV distribution, in the form in von Mises (1936) (see, Reiss and Thomas, 2001, p.
16-17), incorporates a location parameter μ and a scale parameter σ, and is given by:
( ) ( ) 0,01with1exp)(/1
,, ≠>−
+⎟⎟⎠
⎞⎜⎜⎝
⎛⎟⎠⎞
⎜⎝⎛ −
+−=−
ξσ
μξσ
μξξ
σμξxxxF , (2.a)
and ( )
.0with)exp()(,,0 =−=−
−ξσ
μ
σμ
x
exF (2.b)
The corresponding probability density functions obtained as the derivative of the distribution function,
are respectively:
( ) ( )
⎟⎟⎠
⎞⎜⎜⎝
⎛⎟⎠⎞
⎜⎝⎛ −
+−⎟⎠⎞
⎜⎝⎛ −
+=−−− ξξ
σμξ σμξ
σμξ
σ
/1/11
,, 1exp11)( xxxf 0=ξ , (3.a)
and
)(exp1)( /)(/)(,,0
σμσμσμ σ
−−−− −= xx eexf 0=ξ . (3.b)
The distributions associated with ξ > 0 are called Fréchet and these include well known fat
tailed distributions such as the Pareto, Cauchy, Student-t and mixture distributions. If ξ = 0, the GEV
distribution is the Gumbel class and includes the normal, exponential, gamma and lognormal
distributions where only the lognormal distribution has a moderately heavy tail. Finally, in the case
where ξ < 0, the distribution class is Weibull. These are short tailed distributions with finite lower
bounds and include distributions such as uniform and beta distributions. Figure 2 below illustrates the
GEV density functions for each the three classes of distributions that the GEV can take based on the
- 7 -
shape parameter ξ. Note that the three graphs only differ in the value of ξ, having the same value for
location and scale parameters. Typically, ξ > 0 is known to characterize asset returns in terms of losses,
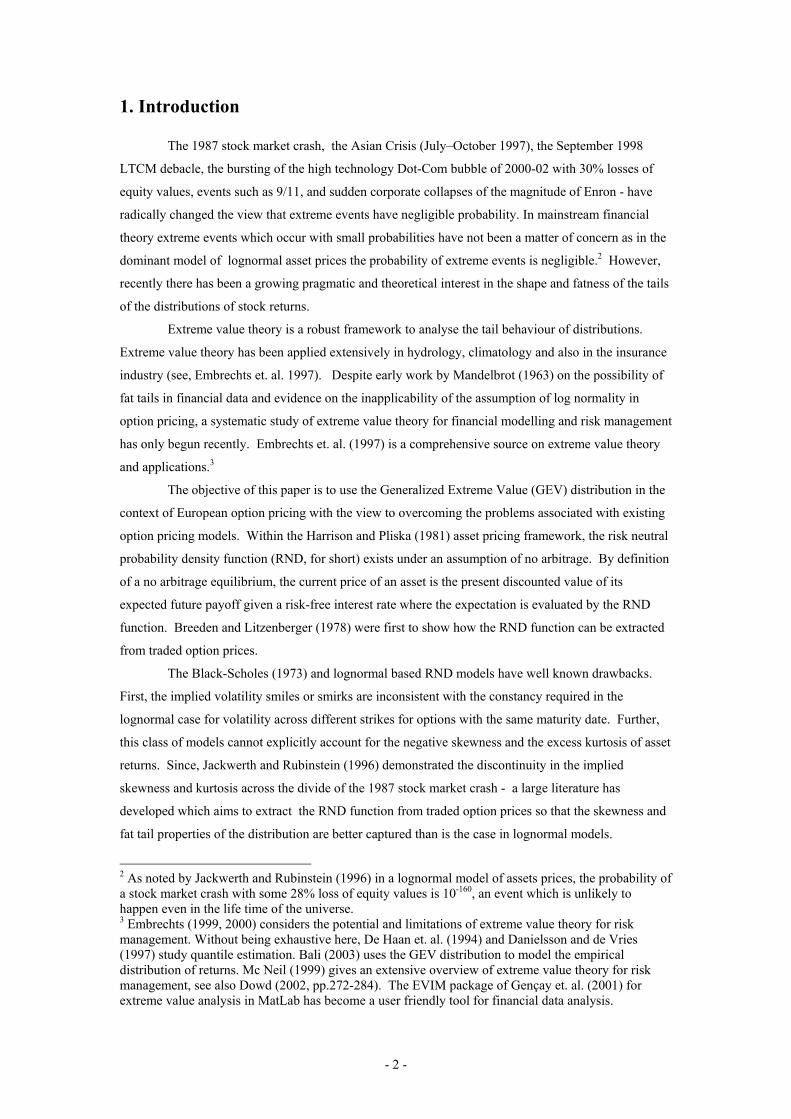
as given in Figure 2c. The corresponding density functions for the price in each of these cases are
shown in Figure 3. Note the left skew in the price density function is greatest in Figure 3c, for the case
when ξ > 0, when the negative returns density function belongs to the GEV-Fréchet class. This
observation plays a crucial role in the analysis that follows.
(a) ξ = - 0.3
(b) ξ = 0
(c) ξ = + 0.3
Figure 2: Density functions for returns: (a) GEV-Weibull, (b) GEV-Gumbel and (c) GEV-Fréchet.
(a) ξ = - 0.3
(b) ξ = 0
(c) ξ = + 0.3
Figure 3: Density functions for the corresponding prices: (a) GEV- Weibull returns, (b) GEV-
Gumbel returns and (c) GEV- Fréchet returns.
3. The GEV Option Pricing Model
3.1 Arbitrage Free Option Pricing and the Risk Neutral Density
Let St denote the underlying asset price at time t. The European call option Ct is written on
this asset with strike K and maturity T. We assume the interest rate r is constant. Following the
Harrison and Pliska (1981) result on the arbitrage free European call option price, there exists a risk
neutral density (RND) function, g(ST), such that the equilibrium call option price can be written as:
( ) ( ) ( )∫
∞−−−− −=−=K TTT
tTrT
tTrQtt dSSgKSeKSeEKC )()0,max( )()( . (4)
Here [ ]⋅Q
tE is the risk-neutral expectation operator, conditional on all information available at time t,
and g(ST) is the risk-neutral density function of the underlying at maturity. Similarly, the arbitrage free
option pricing equation for a put option is given by:

- 8 -
[ ] ∫ −=−= −−−− K
TTTtTr
TQt
tTrt dSSgSKeSKEeKP
0
)()( )()()0,max()(. (5)
In an arbitrage-free economy, the following martingale condition must also be satisfied:
( )T
Qt
tTrt SEeS )( −−= . (6)
3.2 European Call and Put Option Price with GEV returns
In this paper, we assume that the distribution of asset returns for a holding period equal to
time to maturity of the option is represented by the GEV distribution. We derive closed form solutions
for the call and put option pricing equations by analytically solving the integrals in (4) and (5). For the
purpose of obtaining an analytic closed form solution, it was found necessary to define returns as
simple returns. 4 Further, following the convention in Extreme Value Theory (see Dowd 2002, p.272),
where Fréchet type distributions with ξ > 0 for the tail shape parameter are associated with losses, we
model asset returns in terms of losses:
t
T
t
tTTT S
SS
SSRL −=−
−=−= 1 . (7)
By assuming that LT follows the standardised GEV distribution given in (2.a), 0≠ξ , the density
function for the negative returns is given by:
( ) ( )⎟⎟⎠
⎞⎜⎜⎝
⎛⎟⎠⎞
⎜⎝⎛ −
+−⎟⎠⎞
⎜⎝⎛ −
+=−−− ξξ
σμξ
σμξ
σ
/1/11
1exp11)( TTT
LLLf . (8)
The RND function g(ST) in (4) for the underlying price ST is given by the general formula:
( ) ( ) ( )t
TT
TTT S
LfSLLfSg 1
=∂∂
= . (9)
By substituting (8) into (9), we obtain the RND function of the underlying price in terms of the
standardized GEV density function as in equation (3.a):
( ) ( )⎟⎟⎠
⎞⎜⎜⎝
⎛⎟⎠⎞
⎜⎝⎛ −
+−⎟⎠⎞
⎜⎝⎛ −
+=−−− ξξ
σμξ
σμξ
σ
/1/11
1exp11)( TT
tT
LLS
Sg (10)
with
( ) 0111 >⎟⎟⎠
⎞⎜⎜⎝
⎛−−+=−+ μ
σξμ
σξ
t
TT S
SL . (11)
4 Numerical results not reported in this paper show that the implied parameters (ξ, μ, σ ) obtained when using simple returns or log returns are not statistically different from each other.

- 9 -
We will consider the case when ξ > 0.5 Note that when ξ > 0, the negative returns distribution
is Fréchet and this implies that the price RND function g(ST) in (10), in order to satisfy the condition in
(11), is truncated on the right,6 and therefore, the upper limit of integration for the call option price in
(4) becomes ( )ξσμ +−1tS . Substituting g(ST) in (10) into the call price equation in (4), we have:
( ) ( ) ( ) ( )( )∫
+−−−−
−−
⎟⎟⎠
⎞⎜⎜⎝
⎛⎟⎠⎞
⎜⎝⎛ −
+−⎟⎠⎞
⎜⎝⎛ −
+−=ξσμ
ξξ
σμξ
σμξ
σ1
/1/11)( 1exp11tS
K TTT
tT
tTrt dSLL
SKSeKC . (12)
Consider the change of variable:
( ) ⎟⎟⎠
⎞⎜⎜⎝
⎛−−+=−+= μ
σξμ
σξ
t
TT S
SLy 111 . (13)
Under this change of variable, the underlying price ST and dST can be written in terms of y as follows:
( )⎟⎟⎠
⎞⎜⎜⎝
⎛−−−= 11 ySS tT ξ
σμ and dySdS tT ξσ
−= . (14)
Also, the density function in (10) for the underlying price at maturity in terms of y becomes:
( ) ( )ξξ
σ/1/11 exp1)( −−− −= yy
Syg
t
, (15)
Note now that under the change of variable the lower limit of integration for the call option equation in
(12) becomes:
⎟⎟⎠
⎞⎜⎜⎝
⎛−−+= μ
σξ
tSKH 11 , (16)
while the upper limit of integration in (12) becomes 0. Substituting for ST and dST as defined in (14)
into (12), and using the new limits of integration we have:
( ) ( ) ( ) dySyyS
KySeC tt
H ttTr
t ⎟⎟⎠
⎞⎜⎜⎝
⎛−−⎟⎟
⎠
⎞⎜⎜⎝
⎛−⎟⎟
⎠
⎞⎜⎜⎝
⎛−−−= −−−− ∫ ξ
σσξ
σμ ξξ /1/110)( exp111 . (17)
Simplifying and rearranging (17) we have:
5 An identical result is obtained for the case when ξ < 0 (see footnote below). Appendix B derives the closed form solutions for the call and the put in the case of ξ = 0. 6 On the other hand, when ξ < 0 the distribution of ST is truncated on the left, and therefore, the lower limit of integration for the call option price in (4) becomes max[K, St (1 - μ + σ/ξ)] and the upper limit remains ∞ . However, the closed form solutions for the call and the put is identical for both cases when ξ > 0 and ξ < 0.

- 10 -
( ) ( ) ( )
( ) ( ) ( ) ( )
.11
exp1exp1
exp111
21
0 /1/110 /1/11
/1/110)(
⎥⎥⎦
⎤
⎢⎢⎣
⎡⎟⎟⎠
⎞⎜⎜⎝
⎛−⎟⎟
⎠
⎞⎜⎜⎝
⎛+−−=
⎥⎥⎦
⎤
⎢⎢⎣
⎡−⎟⎟
⎠
⎞⎜⎜⎝
⎛−⎟⎟
⎠
⎞⎜⎜⎝
⎛+−−−=
−⎟⎟⎠
⎞⎜⎜⎝
⎛−⎟⎟
⎠
⎞⎜⎜⎝
⎛−−−−=
∫∫
∫
−−−−−−
−−−−
ψξσμψ
ξσ
ξ
ξσμ
ξσ
ξ
ξσμ
ξ
ξξξξ
ξξ
KSS
dyyyKSdyyyyS
dyyyKySeC
tt
HtHt
H ttTr
t
(18)
The integral 1ψ in (18) above can be evaluated in terms of the incomplete Gamma function (see
Appendix C for proof), and its solution is:
( ) ( )ξξξ ξξψ /1/1/11 ,1exp −∞ −− −Γ−=−= ∫ Hdyyy
H. (19)
The solution of integral 2ψ in (18) is:
( ) ( ) ( )[ ] ( )( )ξξξξ ξξψ /10/10 /1/112 expexpexp −−−−− −−=−=−= ∫ Hydyyy HH
. (20)
Combining results for 1ψ and 2ψ , we obtain a closed form for the GEV call option price
( ) ( )⎪⎭
⎪⎬⎫
⎪⎩
⎪⎨⎧
−⎟⎟⎠
⎞⎜⎜⎝
⎛−⎟⎟
⎠
⎞⎜⎜⎝
⎛+−−−Γ
−=
−−−−− ξ
ξσμξ
ξσ ξ /1
1,1)( /1)( Ht
ttTrt eKSHSeKC . (21)
Grouping the terms with St together we have:
( ) ( )⎭⎬⎫
⎩⎨⎧
−⎟⎟⎠
⎞⎜⎜⎝
⎛−Γ−+−=
−− −−−−− ξξ ξξξσξσμ
/1/1 /1)( ,11)( HHt
tTrt eKHeSeKC . (22)
The derivation of closed form solution for the put option price under GEV returns can be found in the
Appendix A, and yields the following equation:
( ) ( )( ) ( )⎭⎬⎫
⎩⎨⎧
⎟⎟⎠
⎞⎜⎜⎝
⎛−Γ−−+−−−= −−−−−−−− −−−− ξξξ
ξσξσμ
ξξξξ /1/1)( ,,11)(/1/1/1/1
HheeSeeKeKP hHt
HhtTrt (23)
where ( ) 011 >−+= μσξh . Note that h is a constant, given a set of parameters μ, σ, and ξ.

- 11 -
3.3 Analysis of the GEV call option pricing model
This section aims to give some insights into the closed form solution for the GEV based call
option pricing equation derived in the previous section. The closed form solution for the call option
price with the implied GEV related RND function given in (22) has two components: the first
involving St, and the second involving K. These two components can be interpreted along the same
lines as the Black-Scholes model. The key to understanding the GEV option pricing formula lies with
the term
ξ
ξμ
σξ
/1
/111
−
− ⎟⎟⎠
⎞⎜⎜⎝
⎛⎟⎟⎠
⎞⎜⎜⎝
⎛−−+−
− = tSK
H ee . (24)
This term can be found to be the cumulative GEV distribution function as defined in (2.a) for
the “standardized moneyness” of the option defined as ( ) tt SKS /− . Hence, it corresponds to the
probability p of the call option being in the money at maturity.7 For a given set of implied GEV
parameters {μ, σ , ξ} we can work out (see, Figure 4) the range of exercise prices K in relation to the
given St which yield: ξ/1−−He = 1 for deep in-the-money call options,
ξ/1−−He = 0 for deep out-of-the-
money call options, and 0 < ξ/1−−He < 1 for all other cases.
Figure 4: Probability of the option being in the money at maturity: for
GEV p=exp(-H-1/ ξ) and for Black-Scholes p=N(d2)
Figure 4 plots the probability p= ξ/1−−He of exercising the option at maturity, given by the
GEV model with two different values of ξ, and also for the Black-Scholes model8. When ξ>0, the
density function of losses is Fréchet, and thus, the implied price density function is left skewed with a 7 Recall that in the case of the Black-Scholes model the probability of the option being in the money at maturity is given by N(d2), where N() is the standard cumulative normal distribution function, and
TTrKSd t
σσ )2/()/ln( 2
2−+
=
8 To make the three cases comparable, we use the same traded call option price data to estimate the GEV model (see Section 4 for details) and the Black-Scholes model. Then, to obtain the second case for the GEV model, we fix ξ to be equal to the initial estimate, but with opposite sign, and estimate the other two GEV parameters.

- 12 -
fat tail on the left, as shown respectively in Figures 2c and 3c. Since the latter implies there is a higher
probability of downward moves of the underlying than in the Black-Scholes case, we see from Figure
4 how the probability of exercising the option when ξ < 0 approaches 1 much slower than for the
Black-Scholes model.
On the other hand, when ξ < 0, the GEV density of the losses is of Weibull type, and thus the
implied price density function is right-skewed, resulting in a higher probability of upward moves.
Therefore, the probability p of exercising the option as we lower the strike price K reaches 1 faster than
in the Black-Scholes case. Note that for high strike prices and for any value of ξ, the probability of the
option being in the money goes to zero faster than for the Black-Scholes case.
When the call option is deep in-the-money (ITM) with K << St and ξ/1−−He = 1 , the call
price converges to a linear function of the expected payoff (see Appendix D for proof). Thus,
[ ]( ) KeSKSEeKC tTrtT
QGEVt
tTrt
)()()( −−−− −=−= . (25)
Here [ ]T
QGEVt SE is the conditional first moment of the price RND function, which by the
martingale condition equals St. For this range of strike prices, the option prices obtained with the GEV
model converge to those given by the Black-Scholes model. When the option is deep out of the money,
then tSK >> and ξ/1−−He = 0 , and it is easy to verify that the call price is zero.
Figure 5 below displays the call option prices obtained with the GEV model (dashed lines)
and with the Black-Scholes model (solid line). The Black-Scholes model overprices the out-of-the-
money (OTM) options with respect to the GEV model. The GEV model yields higher values of call
prices when ξ< 0 than when ξ > 0. For in-the-money options, the Black-Scholes model underprices call
options with respect to the GEV model. The GEV model gives higher prices when ξ > 0 than when ξ <
0. For at-the-money (ATM) options, the price given by both models is approximately the same. Note
that for deep ITM options, i.e. for much lower values of K (not shown in the graph) both GEV and
Black-Scholes prices converge to the present discounted value of the intrinsic value of the option,
increasing linearly as K falls.
For OTM options, the GEV model gives higher call option prices when ξ < 0, because in that
case upward movements in the underlying price are more likely and the price density is truncated on
the left (see Figure 3a). On the other hand, when ξ > 0 downward movements in the price are more
likely and the price density function is truncated on the right (see Figure 3c). In contrast, for ITM
options, the GEV model gives higher option prices when ξ > 0. This can be explained in terms of the
asymmetry in the peakedness of the two densities. When ξ > 0, the RND function for the price is left
skewed, with peakedness at higher values of the underlying than when ξ < 0.

- 13 -
Figure 5: Call option prices for the GEV model and the Black-Scholes model
(ITM: in-the-money; ATM: at-the-money; OTM: out-of-the-money)
3.4 Analysis of the GEV put option pricing model
The analysis for the closed form solution of the GEV put option pricing model in equation
(23) is analogous to what was done in the case of the call option. The probability of a put being in the
money is given by
ξξξ /1/1/1
1−−− −−− −≈− HHh eee . (26)
Here, note ξ/1−−he is approximately equal to 1 and hence (26) is one minus the probability of
the call being in the money at maturity. In Figure 6 , while considering the case of a Fréchet
distribution in losses with ξ > 0 , for low strike prices relative to the underlying, we have a greater
probability of the put option being in the money at maturity as compared to either the Black-Scholes
case or the GEV case when ξ < 0.
Figure 6: Probability of the put option being in the money at maturity: for
GEV p= 1 - exp(-H-1/ ξ) and for Black-Scholes p=N(-d2)

- 14 -
Figure 7 below displays the put option prices obtained with the GEV model (dashed lines)
along with the Black-Scholes model (solid line). The Black-Scholes model substantially underprices
the out-of-the-money (OTM) put options relative to the GEV model. The GEV model yields higher
values of OTM put prices when ξ > 0 than when ξ < 0. For in-the-money (ITM) options, the Black-
Scholes model only marginally overprices put options with respect to the GEV model. The GEV model
gives higher prices for ITM put options when ξ < 0 than when ξ > 0. For at-the-money (ATM) options,
the prices given by both the GEV and the Black-Scholes models is approximately the same. Note that
for deep ITM put options, both GEV and Black-Scholes prices converge to the present discounted
value of the intrinsic value of the option, ttTr SKe −−− )( , which increases linearly with K.
Figure 7: Put option prices for the GEV model and the Black-Scholes model
(ITM: in-the-money; ATM: at-the-money; OTM: out-of-the-money)

- 15 -
4. Results 4.1 Data description
The data used in this study are the daily settlement prices of the FTSE 100 index call and put
options published by the London International Financial Futures and Options Exchange (LIFFE). These
settlement prices are based on quotes and transactions during the day and are used to mark options and
futures positions to market. Options are listed at expiry dates for the nearest four months and for the
nearest June and December. FTSE 100 options expire on the third Friday of the expiry month. The
FTSE 100 option strikes are in intervals of 50 or 100 points depending on time-to-expiry, and the
minimum tick size is 0.5. There are four FTSE 100 Futures contracts a year, expiring on the third
Friday of March, June, September and December.
To synchronize the maturity dates for futures and options we only consider options with the
same four maturity dates as the FTSE 100 futures contracts. The period of study was from 1997 to
2003, so there were 28 expiration dates (7 years with 4 contracts per year). This period includes some
events, such as the Asian crisis, the LTCM crisis and the 9/11 attacks, which will be used to analyze
how the implied RNDs behave before/after such events, which resulted in a sudden fall of the
underlying FTSE 100 index. Table 1 below summarizes the average number of different daily strikes
for each of the years in the period under study, including both call and put options.
Period Average Number of daily strikes 1997 20 1998 26 1999 31 2000 35 2001 39 2002 38 2003 34 All Years 32
Table 1: Average number of strikes per year
The European-style FTSE100 options, though they are options on the FTSE 100 index, can be
considered as options on the futures on the index, because the futures contract expires at the same date
as the option. Therefore, the futures will have the same value as the index at maturity, and can be used
as a proxy of the underlying FTSE 100 index. By using this method, we avoid having to use the
dividend yield of the FTSE 100 index, and the martingale condition in (6) becomes:
( )T
Qtt SEF = , (27)
where Ft is the price of the FTSE 100 futures contract at t, and ST is the FTSE 100 index at maturity T.
The LIFFE exchange quotes settlement prices for a wide range of options, even though some
of them may have not been traded on a given day. In this study we only consider prices of traded
options, that is, options that have a non-zero volume. The data were also filtered to exclude days when

- 16 -
the cross-sections of options had less than three option strikes, since a minimum of three strikes is
required to estimate the three parameters of the GEV model. Also, options whose prices were quoted as
zero or that had less than 2 days to expiry were eliminated. Finally, option prices were checked for
violations of the monotonicity condition.9
The risk-free rates used are the British Bankers Association’s 11 a.m. fixings of the 3-month
Short Sterling London InterBank Offer Rate (LIBOR) rates from the website www.bba.org.uk. Even
though the 3-month LIBOR market does not provide a maturity-matched interest rate, it has the
advantages of liquidity and of approximating the actual market borrowing and lending rates faced by
option market participants (Bliss and Panigirtzoglou 2004).
The option data used in this study can be divided into 6 moneyness categories, following the
classification in Bakshi, Cao and Chen (1997). Note that moneyness is defined as S/K. A call option is
out-of-the-money (OTM) if S/K is smaller than 0.97; at the money (ATM) if S/K is greater than 1.03,
and at-the-money when S/K is in the range (0.97, 10.3). On the other hand, a put option is out-of-the-
money (OTM) if S/K is greater than 1.03, in-the-money if S/K is smaller than 0,97, but in-the-money is
defined as with call options. An additional classification is done in terms of days to expiration: short
term (less than 30 days to expiration), medium term (30-60 days), and long term (60-90). There are
options data available for time to expiration longer than 90 days, but the number of prices available for
such long time horizons is smaller. Table 2a and Table 2b below report the average option price for
call and put options for each category, and the number of option observations in that range (shown in
braces).
Days to Expiration
Moneyness
S/K <30 30-60 60-90 Subtotal OTM <0.94 £6.47 £20.27 £35.61 {1327} {2599} {2219} {6145} 0.94-0.97 £19.66 £59.75 £100.55 {1416} {1494} {915} {3825} ATM 0.97-1 £51.85 £117.94 £170.36 {1655} {1436} {895} {3986} 1-1.03 £130.15 £192.56 £250.25 {1370} {1046} {695} {3111} ITM 1.03-1.06 £248.87 £293.68 £355.07 {819} {562} {303} {1684} >1.06 £584.89 £631.84 £702.52 {993} {715} {493} {2201} Subtotal {7580} {7852} {5520} {20952}
Table 2a: Sample properties of call options in period 1997-2003.
As can be seen, the medium term time to maturity category has the greatest number of data
points, followed by the short term and then long term, for both puts and calls. In terms of moneyness, 9 Monotonicity requires that the call (put) prices are strictly decreasing (increasing) with respect to the exercise price.

- 17 -
the largest number of observations is found in the OTM category (47% of total number of
observations). For put options, the largest number of observations is also found in the OTM category,
accounting for 60% of the total number of observations.
Days to Expiration
Moneyness
S/K <30 30-60 60-90 Subtotal ITM <0.94 £704.87 £640.78 £775.36 {1128} {579} {552} {2259} 0.94-0.97 £255.18 £297.75 £348.61 {746} {558} {280} {1584} ATM 0.97-1 £129.78 £193.59 £248.69 {1362} {987} {578} {2927} 1-1.03 £58.70 £129.17 £184.05 {1583} {1352} {813} {3748} OTM 1.03-1.06 £30.06 £82.74 £133.13 {1378} {1225} {744} {3347} >1.06 £11.96 £29.19 £50.13 {3416} {5375} {3880} {12671} Subtotal {9613} {10076} {6847} {26536}
Table 2b: Sample properties of put options in period 1997-2003. 4.2 Methodology
For each expiry date listed in Table 3 below, a target observation date was determined with
horizons of 90, 60, 30 and 10 days to maturity. If no options were traded on the target observation date,
the nearest date with traded options was used. The estimation of the implied RND was conducted using
the GEV model and the Black-Scholes model, for each of these dates, separately for calls and for puts.
The structural GEV parameters ξ, μ and σ were estimated by minimizing the sum of squared
errors (SSE) between the analytical solution of the GEV option pricing equations in (22) and (23) and
the observed traded option prices with strikes Ki, as indicated in (19) below:
( ) ( )( )⎭⎬⎫
⎩⎨⎧
−+−= ∑=
N
iT
Qttitit SEFKCKCtSSE
1
22
.,)(~)(min)(
σμζ. (28)
The optimization problem was solved subject to the constraint of satisfying the martingale
condition in (27). The optimization was performed using the non-linear least squares algorithm from
the Optimization toolbox in MatLab.
4.3 Pricing performance
The pricing performance of the GEV and Black-Scholes model is reported in Table 3 and
Table 4 below in terms of the root mean square error RMSE, which represents the average pricing
error in pence per option:

- 18 -
)(1)( tSSEN
tRMSE = . (29)
The GEV option pricing model outperforms the Black-Scholes model at all time horizons.
Both models consistently display an improvement in performance as time to maturity decreases.
Specially, the GEV model removes the pricing bias that the Black-Scholes (BS) model exhibits for
options far from maturity, with the Black-Scholes model having an average error of 11.72 pence per
option at 90 days to maturity, while the GEV model has an average error of 2.09 pence per option,
representing a 82% reduction. For options very close to maturity, the average price per option with the
Black-Scholes model is 3.48 pence, while with the GEV model is 1.06 pence. Even though the Black-
Scholes model improves considerably for options close to maturity, the GEV model still represents a
70% reduction in pricing error.
90 60 30 10 BS GEV BS GEV BS GEV BS GEV
Mar-97 20.47 0.58 9.13 1.33 7.96 0.72 3.74 0.85 Jun-97 7.16 0.55 1.4 0.24 8.68 1.5 5.72 0.6 Sep-97 4.97 0.49 5.67 1.01 7.57 1.71 3.19 1.29 Dec-97 37.63 0.47 19.09 1.54 5.69 2.17 2.72 0.98 Mar-98 7.36 2.56 6.84 2.92 5.17 1.27 6.85 1.52 Jun-98 47.86 4.65 20.24 2.34 3.33 1.82 4.62 1.14 Sep-98 3.73 1.91 3.47 0.81 4.63 1.07 5.21 1.83 Dec-98 23.63 3.59 14.07 2.75 8.16 2.19 2.66 1.05 Mar-99 20.34 9.1 13.8 5.68 7.66 2.69 4.53 0.71 Jun-99 9.55 2.66 13.13 2.91 5.33 1.03 2.47 0.69 Sep-99 10.85 3.16 10.37 2.16 7.89 0.76 2.99 0.53 Dec-99 5.38 0.77 17.62 3.91 6.58 2.75 3.13 0.85 Mar-00 7.65 1.69 6.23 1.46 7.35 1.38 2.21 0.73 Jun-00 7.31 4.55 10.1 0.55 5.35 0.46 4.45 0.4 Sep-00 7.48 0.78 14.53 1.01 18.63 1.04 5.92 0.55 Dec-00 2.39 0.58 11.58 2.26 2.7 0.87 4.8 0.43 Mar-01 5.58 1.11 3.6 0.94 3.84 1.8 3.62 1.56 Jun-01 5.93 1.15 10.12 1.36 3.15 1.89 1.55 0.78 Sep-01 3.19 0.69 8.82 1.01 2.33 0.79 7.68 3.38 Dec-01 9.87 2.88 11.72 3.63 4.62 1.99 1.19 2.34 Mar-02 22.26 3.08 2.72 1.07 2.28 2.02 2.28 0.32 Jun-02 1.24 0.73 1.77 1.48 3.23 1.46 0.94 0.84 Sep-02 9.3 1.16 9.61 0.62 7.22 1.28 4.58 0.6 Dec-02 17.01 1.63 11.58 2.86 4.75 1.41 3.77 1.26 Mar-03 17.51 2.23 10.15 1.02 4.29 0.99 1.68 1.46 Jun-03 6.1 1.5 4.9 1.94 4.53 0.55 2.27 0.71 Sep-03 3.89 0.63 2.54 1.28 1.21 1.69 1.36 1.38 Dec-03 2.49 3.57 7.46 3.15 2.62 2.47 1.2 1.02
Average 11.72 2.09 9.37 1.90 5.60 1.49 3.48 1.06
Table 3: RMSE for call options in pence

- 19 -
A similar result is obtained for put options, shown in Table 4 below, even though the average
error per option is greater for puts than for calls, for all times to maturity and for both models. As
anticipated from the analysis in Section 3.4, it is important to note that for put options, the Black-
Scholes model suffers a far greater deterioration in pricing performance when compared to the GEV
model. 10 The pricing performance improves in both models as time to maturity decreases, with the
GEV model removing the pricing bias that the Black-Scholes model exhibits for options far from
maturity.
90 60 30 10 BS GEV BS GEV BS GEV BS GEV
Mar-97 1.11 0.42 2.99 1.74 1.88 0.79 1.66 0.67 Jun-97 5.27 0.41 4.96 0.51 3.78 1.28 1.03 0.84 Sep-97 3.08 0.56 3.45 0.77 3.9 0.49 1.69 1.24 Dec-97 6.31 0.79 6.04 1.12 10.59 0.98 3.16 0.83 Mar-98 20.38 4.13 11.27 0.72 6.08 1.73 2.43 1.25 Jun-98 11.57 2.13 13.29 2.65 10.01 1.44 3.41 0.88 Sep-98 13.52 4.4 10.4 2.09 9.89 2.91 6.83 1.78 Dec-98 38.22 5.82 28.57 1.51 13.82 1.7 4.64 0.78 Mar-99 29.75 5.14 19.36 4.39 11.53 2.12 3.5 0.66 Jun-99 22.64 3.17 15.14 1.55 10.25 2.04 3.12 0.72 Sep-99 24.35 4.05 17.97 1.52 11.37 1.23 3.56 0.52 Dec-99 22.25 3.28 25.68 4.88 7.79 2.28 2.79 0.69 Mar-00 15.9 2.82 14.41 2.45 9.81 1.77 2.1 0.92 Jun-00 13.99 1.23 17.35 1.44 6.53 0.99 2.72 0.33 Sep-00 8.33 0.86 4.37 0.53 1.14 0.43 5.19 0.49 Dec-00 6.72 1.23 9.04 2.15 8.45 1.16 5.38 0.46 Mar-01 15.48 1.67 9.76 1.25 4.81 1.74 5.71 1.24 Jun-01 12.7 1.26 8.17 2.01 5.79 2.94 4.94 0.75 Sep-01 7.08 0.9 10.75 0.8 4.45 0.41 21.16 6.06 Dec-01 23.11 4.24 18.89 3.14 8.22 2.11 4.86 2.14 Mar-02 16.19 1.74 6.76 1.48 7.42 2.29 1.68 0.31 Jun-02 6.46 1.79 9.02 2.22 8.57 2.28 4.26 1.33 Sep-02 13.99 1.32 18.34 1.38 9.58 1.65 4.86 0.49 Dec-02 24.63 1.84 15.98 2.02 8.97 0.86 4.98 0.91 Mar-03 20.72 1.49 14.05 1.08 8.25 1.51 3.34 1.62 Jun-03 14.04 2.29 9.87 0.77 6.68 0.67 1.54 0.64 Sep-03 8.76 1.65 6.41 1.03 4.25 1.93 2.39 1.27 Dec-03 9.84 1.43 10.89 1.5 5.17 1.56 1.52 1.13
Average 14.87 2.22 12.26 1.74 7.46 1.55 4.09 1.11
Table 4: RMSE for put options in pence
10 The deterioration of pricing performance is calculated as the average increase in RMSE across all maturities for put options relative to call options. It was found to be 27.1% for the Black-Scholes model, and 1.6% for the GEV model.

- 20 -
4.4 Removal of pricing bias
It has been well documented that the Black-Scholes model exhibits a pricing bias for out of
the money and in the money options, while pricing quite accurately in the money options (Rubinstein,
1985). The pricing bias is defined in equation (30) as the deviation of the calculated price with respect
to the observed market price for each option contract:
Price bias = Market price – Calculated price . (30)
To summarize the results, the pricing bias was averaged across the 28 maturities given in
Table 3 at each level of moneyness, and for a 90 day and 10 day time horizon. The average pricing
bias for call options is plotted below in Figure 8a for a 90 day time horizon and in Figure 8b for a 10
day time horizon. In keeping with the results obtained in the previous section, the Black-Scholes model
shows deterioration in pricing accuracy for far from maturity contracts. The GEV model outperforms
the Black-Scholes model at all levels of moneyness, and at both time horizons. At far from maturity,
see Figure 8a, the Black-Scholes model overprices OTM and deep ITM call options, while it
underprices ATM and ITM call options. The Black-Scholes model performs at its worst for deep OTM
call options, with the highest error at 20 pence per option. We can see that the GEV model greatly
removes this pricing bias, giving an maximum error of 4 pence for deep OTM options, and around 1
penny at the other levels of moneyness.
-20
-15
-10
-5
0
5
10
0.8 0.85 0.9 0.95 1 1.05 1.1 1.15 1.2
Moneyness
Pric
ing
bias
BSGEV
OTM ATM ITM
Figure 8a: Average price bias in terms of moneyness for call options 90 days to maturity
In Figure 8b, we can see that for close to maturity options, the Black-Scholes model
overprices OTM and ITM options, and underprices ATM options, but with the pricing bias oscillating
only between +2 pence and -5 pence. The GEV model displays a modest pricing bias of about ±1
pence. Both models display a reduction in pricing bias as time to maturity decreases.

- 21 -
-20
-15
-10
-5
0
5
10
0.8 0.85 0.9 0.95 1 1.05 1.1 1.15 1.2
Moneyness
Pric
ing
bias
BSGEV
OTM ATM ITM
Figure 8b: Average price bias in terms of moneyness for call options 10 days to expiration
Figure 9a and Figure 9b below display the pricing bias for put options. From Figure 9a we
can see that for far from maturity put options (90 days to maturity) the Black-Scholes model overprices
ITM and ATM put options, and underprices OTM put options. The pricing bias is considerable for
OTM put options, at 20 pence on average. On the other hand, the GEV model has a small pricing bias
of around one penny across the board. For close to maturity options, Figure 9b shows that the Black-
Scholes model underprices ITM and OTM put options by a maximum of around 5 pence, and
overprices ATM put options by 3.5 pence, whereas the GEV model displays a small pricing error that
oscillates around ±1.3 pence.
-25
-20
-15
-10
-5
0
5
10
15
20
25
0.8 0.9 1 1.1 1.2 1.3 1.4
Moneyness
Pric
ing
bias
BSGEV
ITM ATM OTM
Figure 9a: Average price bias in terms of moneyness for puts 90 days to expiration

- 22 -
-25
-20
-15
-10
-5
0
5
10
15
20
25
0.8 0.9 1 1.1 1.2 1.3 1.4
Moneyness
Pric
ing
bias
BSGEV
ITM ATM OTM
Figure 9b: Average price deviations in terms of moneyness for puts 10 days to expiration
4.5 Implied tail indices and summary statistics of implied RNDs
The time series of the implied GEV tail shape parameter ξ for negative returns from 1997 to
2003 are displayed in Figure 10a for put options and in Figure 10b for call options. These were
obtained by taking holding periods equal to the time to maturity of the option with the closest
expiration date. Note at two days to maturity we switch to the GEV returns implied by the next option
contracts with the nearest expiration date. Only the values of ξ that were found to be statistically
significant different from zero at 95% confidence interval are displayed. There is a typical time-to-
maturity effect for the implied ξs, by which they tend to become smaller closer to maturity. For
example, if ξ > 0 when far from maturity, then ξ become either close to zero or negative as time to
maturity approaches. If ξ < 0 at far from maturity, then ξ becomes more negative as time to maturity
approaches. However, sometimes close to maturity contracts can manifest a jump from a negative ξ to
a positive ξ, as in some crisis events, with 9/11 being a good example.
On comparing Figure 10a and Figure 10b, it can be seen that fat tails in negative returns are
best captured when using put options, since there are a larger number of traded put options at low strike
prices than there are call options (the OTM put options, see Table 2b). The number of option
observations at low strike prices, i.e. where S/K > 1.06, is six times greater for put options than for call
options. These put options traded at low strike prices relative to the value of the underlying are used to
protect portfolios against downside moves of the index, and thus, it can be argued that they contain
more market information regarding extreme downward moves of the underlying.

- 23 -
-0.4
-0.3
-0.2
-0.1
0
0.1
0.2
0.3
Jan
97
Apr
97
Jul 9
7
Oct
97
Dec
97
Apr
98
Jul 9
8
Sep
98
Dec
98
Mar
99
Jun
99
Sep
99
Dec
99
Mar
00
Jun
00
Sep
00
Dec
00
Mar
01
Jun
01
Sep
01
Dec
01
Mar
02
Jun
02
Sep
02
Dec
02
Mar
03
Jun
03
Sep
03
Dec
03
Impl
ied
tail
shap
e pa
ram
eter
Asian Crisis20 Oct 97
LTCM Crisis24 Sep 98 9/11
FTSE 100 reaches max value of 6930
FTSE 100 reaches min value 3287
Figure 10a: Implied shape parameter ξ of GEV returns for put options
-0.4
-0.3
-0.2
-0.1
0
0.1
0.2
0.3
Jan
97
Apr 9
7
Jul 9
7
Oct
97
Dec
97
Apr 9
8
Jul 9
8
Sep
98
Dec
98
Mar
99
Jun
99
Sep
99
Dec
99
Mar
00
Jun
00
Sep
00
Dec
00
Mar
01
Jun
01
Sep
01
Dec
01
Mar
02
Jun
02
Sep
02
Dec
02
Mar
03
Jun
03
Sep
03
Dec
03
Impl
ied
tail
shap
e pa
ram
eter
Asian Crisis20 Oct 97
LTCM Crisis24 Sep 98 9/11
FTSE 100 reaches max value of 6930
FTSE 100 reaches min value 3287
Figure 10b: Implied shape parameter ξ of GEV returns for call options

- 24 -
This is also reflected in Table 5 below, which shows that the percentage of statistically
significant positive values of ξ is roughly four times more for put options (12.7%) than for call options
(3.1%).
Table 5: Number of days in which the implied tail shape parameter ξ is positive (ξ > 0), negative (ξ < 0) or not statistically different from zero (ξ ≈ 0) for calls (in rows) and puts (in columns).
The percentage of days when each case occurs is also shown, below the number of days.
On the days when both put and call options give positive ξ (2.73% of days), on average the
value of ξ for put options is 61.7% larger than for call options. In contrast, when ξ < 0 for both put and
call options(59.54% of days), the ξs obtained when using call options are on average 50% more
negative that when using put options. There are 64 days when put options give positive ξ and call
options give negative ξ. In fact, on days corresponding to crisis events such as 11th September 2001
and 24th September 1998 (LTCM crisis), put options yielded some of the highest positive ξs, while call
options implied a value of ξ not significantly different from zero, i.e. implying a GEV-Gumbel
distribution for returns. The RND functions for 11th September 2001 when using call options and put
options separately is shown in Figure 11 below to illustrate this point.
Figure 11: The GEV based implied RND functions when using calls, with ξ calls ≈ 0 puts, with ξ puts = 0.139, and the Black-Scholes implied RND on 11th September 2001
Puts Calls ξ puts > 0 ξ puts < 0 ξ puts ≈ 0 Total
45 1 5 51 ξ calls > 0
2.73% 0.06% 0.30% 3.10% 64 980 311 1355
ξ calls < 0 3.89% 59.54% 18.89% 82.32%
100 14 126 240 ξ calls ≈ 0
6.08% 0.85% 7.65% 14.58% 209 995 442 1646
Total 12.70% 60.45% 26.85%

- 25 -
Table 6 below displays the yearly summary moment statistics of the implied RND functions
for the Black-Scholes and GEV models. 11 The GEV statistics show a consistent left skewness and
leptokurtosis in the implied RND function of the price, with 1998 and 1999 showing the greatest
deviations from the Gaussian assumptions. On average, the RNDs implied by put option prices yield a
more left-skewed and more leptokurtic densities than the ones implied by call option prices. The values
of volatility, given by the standard deviation of the RND function, when using put option or call option
prices are almost the same for the GEV based RNDs. In contrast, in the Black-Scholes case, the
average standard deviation of the RND functions implied by call options is substantially lower than for
put options.
Volatility (%) BS Volatility (%) GEV Skewness GEV Kurtosis GEV Year
Calls Puts Calls Puts Calls Puts Calls Puts 1997 4.53 6.95 7.25 7.19 -0.69 -0.87 3.81 4.49 1998 7.14 10.12 10.11 10.42 -1.02 -1.21 5.37 6.07 1999 6.63 9.20 9.35 9.32 -1.01 -1.38 5.03 7.23 2000 5.68 8.15 8.35 8.36 -0.70 -0.91 3.84 4.67 2001 6.11 8.16 8.5 8.31 -0.61 -0.86 3.54 4.36 2002 7.51 9.49 9.67 9.7 -0.68 -0.97 3.78 4.75 2003 6.34 8.07 8.56 8.56 -0.69 -1.02 3.88 4.97
All years 6.28 8.59 8.83 8.84 -0.77 -1.03 4.18 5.22
Table 6: Yearly summary statistics of implied GEV based and Black-Scholes (BS) RND functions of the price from 1997 to 2003
11 Skewness is the third central moment of the implied probability density function standardised by the third power of the standard deviation. It provides a measure of asymmetry, and measures the relative probabilities above and below the mean outcome. Kurtosis is the fourth central moment of the implied probability density function standardised by the fourth power of the standard deviation. It provides a measure of the degree of 'fatness' of the tails of the implied density function. Fatter tails in a density function are usually associated with a greater degree of ‘peakedness’ in the centre of the density function.

- 26 -
4.6 Event study
In this section the changes in RND functions for the price and the implied density functions
for the returns before and after special events are compared. The major events that occurred within the
period of study (1997 – 2003) are the Asian Crisis, the LTCM crisis and the 9/11. The implied
distributions in this section are obtained by using put options only, because, as explained in the
previous section, put options are used for protecting against downside risk, and therefore, they reflect
more accurately the implied probability of downward moves.
4.6.1 The Asian Crisis
The Asian Crisis has been pin pointed to happen around 20th October 1997. Figure 12 below
displays the RND functions for prices (left panel) and the implied returns density functions (right
panel)using the GEV and the Black-Scholes models. In both cases the GEV density exhibits a fatter
than normal left tail. Note that in the case of implied return distributions, since we have modelled
negative returns, losses are on the positive side, and profits are on the negative side of the x axis. In all
cases, after the Asian crisis, the implied densities show a fatter tail for losses, implying higher than
normal probabilities of downside moves.
Price
Negative returns
Price
Negative returns
Figure 12: RND functions for prices and implied density functions for negative returns before
and after the LTCM Crisis

- 27 -
4.6.2 The LTCM crisis
Figure 13 below shows the RND functions for prices (left panel) and the implied returns
density functions (right panel) extracted from option prices before the major events in the LTCM crisis
happened, on 14 September 1998, and after, on 24 September 1998. The options used had expiration in
December 1998. The density functions shown were extracted using both the GEV and the Black-
Scholes models. The tail shape parameter ξ changed from -0.035 before the LTCM crisis, to 0.076 on
the 24th of September. The skewness of the GEV distribution changed from -0.94 to -1.68, and the
kurtosis almost doubled, from 4.55 to 8.88 the day of the event (see Table 7 below). This indicates that
the market expectations changed considerably after the 24th of September, expecting more downward
moves of the index.
Price
Negative returns
Price
Negative returns
Figure 13: RND functions for prices and implied density functions for returns before and after
the LTCM Crisis
4.6.3 The 11th September 2001 events
Figure 14 shows the RND functions for the prices (left panel) and the implied density
function for returns (right panel) extracted from option prices with expiration on September 2001, for
the GEV and the Black-Scholes models. The implied tail shape parameter ξ for returns changed from -
0.104 the day before the events, implying a thin tail, to 0.139, implying a fatter tail. As can be seen in
Figure 14 below, the tail of the GEV based RND price distribution is fatter than the equivalent Black-

- 28 -
Scholes density function for the 11 of September. The skewness of the GEV distribution changed from
-0.62 to-2.37, and the kurtosis more than quadrupled, from 3.53(which is close to the kurtosis of the
normal distribution) the day before the events to 16.69 the day of the event. This indicates that the
market expectations changed immediately, expecting more downward moves of the index.
Price
Negative returns
Price
Negative returns
Figure 14: Implied RND functions (price) and implied density functions for returns before and
after the 9/11 events 4.6.4 Implied moments of the RND functions around special events
Table 7 below summarizes the higher moments of the GEV based and Black-Scholes implied
RND functions before and after each of the three events.
Event Expiry Date ξ Std Dev Skewness Kurtosis BS σ (%)
17-Oct-97 -0.0844 8.89 -0.7059 3.7533 10.32 Asian Crisis Dec-97
10-Nov-97 -0.0120 11.62 -1.0420 5.0470 12.57 14-Sep-98 -0.0351 5.54 -0.9439 4.5481 4.13
LTCM Dec-98 24-Sep-98 0.0756 22.12 -1.6806 8.8816 21.62 10-Sep-01 -0.1042 5.11 -0.6199 3.5256 5.31
9/11 Sep-01 11-Sep-01 0.1390 10.46 -2.3706 16.6929 9.32
Table 7: Moments of the GEV based implied RND functions, and the standard deviation of the implied Black-Scholes (BS σ) RND function around special events
In all three events, the tail shape parameter ξ increases after the event, which indicates that the
implied densities reflect the market sentiment of increased fear of downward moves. However, as

- 29 -
noted in previous studies (Gemmill and Saflekos, 2000), the RND functions do not predict the
downward moves. After each of the three events, left skewness increases, indicating a higher
asymmetry in the returns distribution and greater probability of losses. In the GEV cases, kurtosis
doubles or even quadruples after the events, implying that extreme losses become more probable.
5. Conclusions
We have developed a new option pricing model that is based on the GEV distribution of the
returns, and obtained closed form solutions for the Harrison and Pliska (1981) no arbitrage equilibrium
price for the European call and put options. It was argued that the three parameter (ξ, μ, σ ) GEV
density function for asset negative returns which in turn yielded the GEV based RND function, has
great flexibility in defining the tail shape of the latter implied by traded option price data without
aprioiri restrictions on the class of distributions. In particular, no apriori restriction is imposed that the
GEV distribution function of negative returns belongs to the Fréchet class with fat tails. That, as we
saw, results in the RND function for the price to display left skewness and leptokurtosis. Some recent
option pricing models that aim to capture the leptokurtosis and left skew in the RND function, in
contrast, start with assumptions of fat tailed distributions. Other option pricing models that attempt to
overcome the drawbacks of the Black-Scholes model fail to obtain closed form solutions or have far
too many parameters.
As discussed in Section 3.1, the closed form solution for the GEV based call option pricing
model has an analogous interpretation as the Black-Scholes price equation in that it crucially depends
on the probability of being in the money. In the GEV case, the latter is governed by the cumulative
distribution for the GEV, which is defined by the implied GEV parameters ξ, μ and σ. From the
analysis in Sections 3.3 and 3.4, there is a very clear indication that ξ > 0 results in a smaller
probability for a call option being in the money at maturity compared to the Black-Scholes case. In
contrast, for the put option, ξ > 0 results in a higher probability of being in the money at lower strikes
when compared to the Black-Scholes case. When applying the GEV option pricing model for the FTSE
100 index options, it was found that the GEV based pricing biases were substantially smaller than the
ones from the Black-Scholes, for all times to maturity and at all moneyness levels.
From Figures 8a and 8b, we can see that the implied tail shape parameter for returns was
found to be time varying. Though this has a strong time-to-maturity effect, cases of high positive ξ in
the market implied density function for negative returns associated with the GEV-Fréchet class were
confined to periods associated with crisis events. For most other periods, the implied tail shape
parameter indicated Weibull or Gumbel distributions for negative returns. However, the annual
summary statistics of the moments of the GEV implied RND functions in Table 6 consistently shows
considerable left skewness and excess kurtosis. Based on both the analysis on implied tail index (Table
5) and that of the moments for the GEV RND function (Table 6), we find that put options, which have
more observations at low strike prices, yield greater evidence of left skewness and leptokurtosis than
do call options.

- 30 -
In all three event studies that were undertaken, the shape parameter ξ increases after the crisis
event, which indicates that the implied distributions reflect the market sentiment of increased fear of
downward moves. However, as noted in previous studies (Gemmill and Saflekos, 2000), the implied
RND functions do not predict the downward moves but only reflect it. Additionally after each of the
three events, both left skewness and kurtosis increase, exceeding well in excess of the normal
distribution.
Future work will analyse the hedging properties of the GEV based option pricing model, and
its scope for delta hedging. Further, the market implied tail index and the GEV based RND have useful
and interesting applications in risk management. Indeed, we can obtain the Ait-Sahalia and Lo (2000)
Economic-VaR (E-VaR)12 under GEV assumption for returns and compare it with the statistical or
historical VaR calculations. It will be interesting to see if the quantile analysis of the GEV based RND
functions obtained from traded put options can deliver better VaR performance than the conventional
methods.
Department of Economics and Centre of Computational Finance and Economic
Agents (CCFEA), University of Essex, Wivenhoe Park, Colchester, CO4 3SQ, UK.;
[email protected];http://www.essex.ac.uk./~sheri/,
and
Centre of Computational Finance and Economic Agents (CCFEA), University of
Essex, Wivenhoe Park, Colchester, CO4 3SQ, UK.;[email protected];
http://privatewww.essex.ac.uk/~aalent/.
12 It has been argued that E-VaR is a more general measure risk since it incorporates the market’s evaluation of risk, the demand–supply effects, and the probabilities that correspond to extreme losses (Panigirtzoglou and Skiadopoulos 2004).

- 31 -
Appendix A: Derivation of the put option price equation for ξ > 0
The derivation of the closed form solution for the put option price equation is similar to the
derivation for the call option price equation. When applying the change of variable defined in (13) to
the put option price equation, after having substituted for the price RND function g(ST) in (10), the
upper limit of integration K in the put option equation becomes H as defined in (16), while the lower
limit of integration in the put option equation becomes ( ) σμξ /11 −+=h . Using these new limits
of integration we have
( ) ( ) ( ) ( )⎥⎥⎦
⎤
⎢⎢⎣
⎡⎟⎟⎠
⎞⎜⎜⎝
⎛⎟⎟⎠
⎞⎜⎜⎝
⎛+−−−
−= ∫∫
−− −−−−−−− H
h
yt
H
h
ytTrt dyeySKdyeyySeP
ξξ ξξ
ξσμ
ξσ
ξ/1/1 /11/110)( 11
.1121
0
⎥⎥⎦
⎤
⎢⎢⎣
⎡⎟⎟⎠
⎞⎜⎜⎝
⎛⎟⎟⎠
⎞⎜⎜⎝
⎛+−−−
−= ψ
ξσμψ
ξσ
ξ tSKS (A.1)
Evaluating the first integral in (A.1) yields:
( ) ( ) ( )[ ] ( ) ( )( )ξξξξ
ξξψ ξ /1/1/1/1/111
−−−− −−−−−− −=== ∫ hHHh
yH
h
y eeedyey . (A.2)
To solve the second integral in (A.1), consider the change of variable ξ/1−= yt , and ξ−= ty
dttdy ξξ −−−= 1 , which yields:
( ) dtetdtettdtetH
h
tH
h
tH
h
t ∫∫∫−
−
−
−
−
−
−−−−−−−−− −=−==ξ
ξ
ξ
ξ
ξ
ξ
ξξξξ ξξψ/
/
/
/
/
/
1)1(12 . (A.3)
We can solve this integral directly by using the definition of the generalized Gamma function (see
Appendix C):
∫ −−=Γ=Γ−Γ 1
0
11010 ),,(),(),(
z
z
ta dtetzzazaza , (A.4)
and we obtain the following result:
( ) ( )ξξξξ ξξψ /1/1/1/12 ,,1exp −−−− −Γ−=−= ∫ Hhdyyy
H
h. (A.5)
Combining results for 1ψ and 2ψ and rearranging, we obtain a closed form solution for the put option
equation:
( ) ( )( ) ( )⎭⎬⎫
⎩⎨⎧
⎟⎟⎠
⎞⎜⎜⎝
⎛−Γ−−+−−−= −−−−−−−− −−−− ξξξ
ξσξσμ
ξξξξ /1/1)( ,,11)(/1/1/1/1
HheeSeeKeKP hHt
HhtTrt
(A.6)
Appendix B: Derivation of the call option price equation for ξ = 0
The derivation of the closed form solution of the call option price when ξ = 0 follows a similar
procedure than the one outlined in Section 3.2. By assuming that negative returns are distributed
following the standardised GEV distribution when ξ = 0 given in (2b), and applying the formula in (9)

- 32 -
we obtain the RND function of the underlying price g(ST) in terms of the standardized GEV density
function given in equation (3b) as follows:
( ) ( )
⎟⎟⎠
⎞⎜⎜⎝
⎛⎟⎠⎞
⎜⎝⎛ −
−−⎟⎠⎞
⎜⎝⎛ −
−=σ
μσ
μσ
TT
tT
LLS
Sg expexpexp1)( (B.1)
Substituting g(ST) in (B.1) into the call price equation in (4), we have:
( ) ( ) ( ) ( )∫
∞−−⎟⎟⎠
⎞⎜⎜⎝
⎛⎟⎠⎞
⎜⎝⎛ −−−⎟
⎠⎞
⎜⎝⎛ −−−=
K TTT
tT
tTrt dSLL
SKSeKC
σμ
σμ
σexpexpexp1)( . (B.2)
Consider the change of variable:
( )
⎟⎟⎠
⎞⎜⎜⎝
⎛+−=
−−= μ
σσμ 11
t
TT
SSLy . (B.3)
Under this change of variable, the underlying price ST and dST can be written in terms of y as follows:
( )ySS tT σμ +−= 1 and dySdS tT σ= . (B.4)
Also, the density function in (B.1) for the underlying price at maturity in terms of y becomes:
))exp(exp(1)( yyS
ygt
−=σ
. (B.5)
Note now that under the change of variable the lower limit of integration for the call option equation in
(B.2) becomes:
⎟⎟⎠
⎞⎜⎜⎝
⎛+−= μ
σ11
tSKH , (B.6)
while the upper limit of integration in (B.2) remains infinity. Substituting for ST and dST as defined in
(B.4) into (B.2), using the new limits of integration, and rearranging we have:
( )( )
( )( )( )( ) .1
))exp(exp(1)exp(exp(
))exp(exp(1
21
)(
ψμψσ
μσ
σμ
KSS
dyyyKSdyyyyS
dyyyKySeC
tt
HtHt
H ttTr
t
−−+=
−−−+−=
−−+−=
∫∫
∫∞∞
∞−
(B.7)
The integral 1ψ in (B.7) above can be evaluated in terms of the incomplete gamma function , and its
solution is:

- 33 -
[ ]
))exp(,0())exp(exp(
))exp(,0())exp(exp())exp(exp(1
HH
yydyyyy HH
Γ+−=
Γ−−−=−= ∞∞
∫ψ. (B.8)
The solution of integral 2ψ in (B.7) is:
( )[ ] ))exp(exp()exp(exp)exp(exp(2 Hydyyy HH−=−−=−= ∞∞
∫ψ . (B.9)
Combining results for 1ψ and 2ψ and rearranging, we obtain a closed form for the GEV call option
price:
( )( )[ ]HH eHet
tTrt eKeeSeKC −−−− −Γ++−= ),0(1)( )( σσμ . (B.10)
Following a similar procedure, the closed form solution of the GEV model for the put option price
when ξ = 0 is found to be:
( ) ( ) ( )( )[ ]),,0(1)( )( Hheet
eetTrt eeeeSeeKeKP
HhHh
Γ+−+−−−= −−−−−− σσμ . (B.11)
Appendix C: The Gamma function
The function )(aΓ is the Euler gamma function, and is defined as: ∫∞ −−=Γ
0
1)( dteta ta .
When the lower limit of integration is greater than zero, it is know as the incomplete gamma function
),( 0zaΓ , and is defined as:
∫∞ −−=Γ0
10 ),(
z
ta dtetza . (C.1)
The definition of the generalized incomplete gamma function ),,( 10 zzaΓ is given by the integral:
∫ −−=Γ=Γ−Γ 1
0
11010 ),,(),(),(
z
z
ta dtetzzazaza . (C.2)
The three versions of Gamma functions are summarized in the Table C.1 below:
Table C.1: Definitions of the Gamma functions
Name Notation Definition
Gamma function )(aΓ ∫∞ −−=
0
1 dtet ta
Incomplete Gamma function ),( 0zaΓ ∫∞ −−=0
1
z
ta dtet
Generalized incomplete Gamma function ),,( 10 zzaΓ ∫ −−= 1
0
1z
z
ta dtet

- 34 -
Appendix D: Simplification for deep in the money options
The GEV option pricing equation in (22) can be simplified for the special case when the
option is deep in the money, i.e St >> K. In that case, the terms involving H can be simplified, and as
1/1
→−− ξHe , it implies that 0/1 →− ξH . Substituting these approximations into the call option
equation in (22) and rearranging, the call option price becomes a linear function of K:
( )( )⎭⎬⎫
⎩⎨⎧
−⎟⎟⎠
⎞⎜⎜⎝
⎛−Γ−+−= −− KSeKC t
tTrt ξ
ξσμ 111)( )( . (D.1)
The mean of the standardized GEV returns distribution is given by (see Dowd, 2002, p.273):
[ ] ( )( )ξξσμ −Γ−−= 11T
QGEV RE . (D.2)
Using the definition of tTT SSR −=1 , and applying the expectations operator:
[ ] [ ]( ) ( )( )⎟⎟⎠
⎞⎜⎜⎝
⎛−Γ−+−=−= ξ
ξσμ 1111 tT
QGEVtT
QGEV SRESSE . (D.3)
Thus, we can rewrite the simplified equation for the call option in (D.1) to yield the result given in (25):
[ ]( ) KeSKSEeKC tTrtT
QGEV
tTrt
)()()( −−−− −=−= . (D.4)

- 35 -
References Abadir, K., and M. Rockinger (1997). “Density-Embedding Functions.” Working paper, HEC. Ait-Sahalia,Y. and A.W. Lo (1998). “Nonparametric Estimation of State-Price Densities Implicit in Financial Asset Prices”. Journal of Finance, 53, 499-547. _______________________ (2000). “Nonparametric Risk Management and Implied Risk Aversion”. Journal of Econometrics 94, 9-51. Aparicio, S. D., and S.D. Hodges (1998), “Implied Risk-Neutral Distribution: A Comparison of Estimation Methods”, FORC Preprint, University of Warwick. Bali, T. G. (2003). “The generalized extreme value distribution”. Economics Letters 79, 423-427. Bakshi, G., C. Cao and Z. Chen (1997), "Empirical Performance of Alternative Option Pricing Models," Journal of Finance, 52, 2003-2050. Black, F. and M. Scholes (1973). “The Pricing of Options and Corporate Liabilities”. Journal of PoliticalEconomy 81, 637-659. Bliss, R., and N. Panigirtzoglou (2004). “Option-Implied Risk Aversion Estimates”. Journal of Finance, 59, 407–446. Breeden, D. and R. Litzenberger (1978). “Prices of State-Contingent Claims Implicit in Option Prices”.Journal of Business, 51, 621-651. Buchen, P. W. and M. Kelly (1996) “The maximum entropy distribution of an asset inferred from option prices”. Journal of Financial and Quantitative Analysis, 31, 143-159. Corrado, C.J. (2001). “Option pricing based on the Generalized Lambda Distribution”. Journal of Futtures Markets, 21, 213 – 236. Corrado, C.J. and T. Su (1997). “Implied Volatility Skews and Stock Index Skewness and Kurtosis Implied by S&P500 Index Option Prices”. Journal of Derivatives 4, 8-19. Danielsson, J. and C.G. de Vries (1997) “Tail index estimation with very high frequency data”, Journal of Empirical Finance, 4, 241-257. De Haan, L., D.W. Cansen, K. Koedijk and C.G. de Vries (1994) “Safety first portfolio selection, extreme value theory and long run asset risks. Extreme value theory and applications” (J. Galambos et al., eds.) 471-487. Kluwer, Dordrecht. De Jong, C. and R. Huisman (2000) “From Skews to a Skewed-t”. ERIM Report Series Reference No. ERS-2000-12-F&A. Dowd, K. (2002), Measuring Market Risk, John Wiley and Sons. Embrechts, P., C. Klüppelberg and T. Mikosch (1997) Modelling Extremal Events for Insurance and Finance. Berlin: Springer. Embrechts P., S. Resnick and G. Samorodnitsky (1999).”Extreme value theory as a risk management tool” North American Actuarial Journal 3, 30-41. Embrechts, P. (2000) “Extreme Value Theory: Potential and Limitations as an Integrated Risk Management Tool” Derivatives Use, Trading & Regulation, 6, 449-456. Fisher, R.A. and L.H.C. Tippett (1928) “Limiting forms of the frequency distributions of the largest or smallest member of a sample.” Proceedings of the Cambridge Philosophical Society, 24, 180-190.

- 36 -
Gemmill G, and A. Saflekos (2000) “How Useful are Implied Distributions? Evidence from Stock-Index Options” Journal of Derivatives 7, 83-98. Gençay, R., F. Selçuk and A. Ulugülyagci (2001) "EVIM: A Software Package for Extreme Value Analysis in MATLAB ," Studies in Nonlinear Dynamics and Econometrics, 5, 213-239. Harrison, J. M. and S. R. Pliska (1981) “Martingales and stochastic integrals in the theory of continuous trading.” Stochastic Processes Applications, 11, 215-260. Jackwerth, J. C. and M. Rubinstein (1996): “Recovering Probability Distributions from Options Prices”. Journal of Finance, 51, 1611-1631. Jackwerth, J. C. (1999). “Option-Implied Risk-Neutral Distributions and Implied Binomial Trees: A Literature Review”. The Journal of Derivatives, 7, 66-82. Jarrow, R. and A. Rudd (1982). “Approximate Option Valuation for Arbitrary Stochastic Processes”. Journal of Financial Economics, 10, 347-369. Jenkinson, A. F. (1955) “The frequency distribution of the annual maximum (or minimum) values of meteorological elements”. Quarterly Journal of the Royal Meteorological Society, 87, 158-171. Lux, T. and D. Sornette (2002) “On Rational Bubbles and Fat Tails”, Journal of Money, Credit and Banking, 34, 589-610. Mandelbrot B. (1963), “The Variation of Certain Speculative Prices”, Journal of Business, 36, 394-419. Madan, D., P. Carr and E. Chang (1998) “The variance gamma process and option pricing”. European Finance Review, v.2, 79-105. Matache, A.M., P.A. Nitsche and C. Schwab (2004) “Wavelet Galerkin Pricing of American Options on Levy Driven Assets”. Research Report No. 2003-06 ETH Zürich. McNeil, A. J. (1999). “Extreme value theory for risk managers”. Internal Modelling and CAD II published by RISK Books, 93-113. Melick, W. R. (1999). “Results of the estimation of implied PDFs from a common data set”. Proceedings of the Bank for International Settlements Workshop on ‘Estimating and Interpreting Probability Density Functions’, Basel, Switzerland. Melick, W. R. and C. P. Thomas (1996). “Using Option prices to infer PDFs for asset Prices: An application to oil prices during the gulf war crisis”. International Finance Discussion Paper, No. 541, Board of Governors of the Federal Reserve System. ————————————–(1997). “Recovering an Asset’s Implied PDF from Option Prices: An application to Crude Oil during the Gulf Crisis”. Journal of Financial and Quantitative Analysis, 32, 91-115. ————————————– (1999). “Confidence Intervals and Constant-Maturity Series for Probability Measures Extracted From Option Prices”. Information in Financial Asset Prices: Proceedings of a Conference at the Bank of Canada, May 1998, 293-320. Panigirtzoglou, N. and G. Skiadopoulos (2004) “A New Approach to Modeling the Dynamics of Implied Distributions: Theory and Evidence from the S&P 500 Options” Journal of Banking and Finance, 28, 1499-1520. Quintos, C., Z. Fan, and P. C. B. Phillips. (2001). "Structural Change Tests in Tail Behavior and the Asian Crisis." Review of Economic Studies, 68, 633–663.

- 37 -
Reiss, R. D. and M. Thomas (2001) “Statistical Analysis of Extreme Values”. 2nd ed. Birkhäuser, Basel. Ritchey, R. J. (1990) “Call Option Valuation for Discrete Normal Mixtures”. Journal of Financial Research, 13, 285-296. Rubinstein, M. (1985) "Nonparametric Tests of Alternative Option Pricing Models Using All Reported Trades and Quotes on the 30 Most Active CBOE Option Classes from August 23, 1976 through August 31, 1978," Journal of Finance, 40, 455-480. Savickas, R. (2002). “A simple option-pricing formula”. The Financial Review, 37, 207-226. Savickas, R. (2004). “Evidence on Delta Hedging and Implied Volatilities for the Black-Scholes, Gamma and Weibull Option-Pricing Models”. Forthcoming in the Journal of Financial Research. Shimko, D (1993): “Bounds of Probability”, Risk, Vol. 6, 33-37. von Mises, R. (1936). "La Distribution de la Plus Grande de n Valeurs." In Selected Papers of Richard von Mises, 2, 271-294. Providence, RI: American Mathematical Society