Safer Rides. Smarter Solutions. Sustainable Future. - CEAT ...
Upload
khangminh22Category
view
1download
0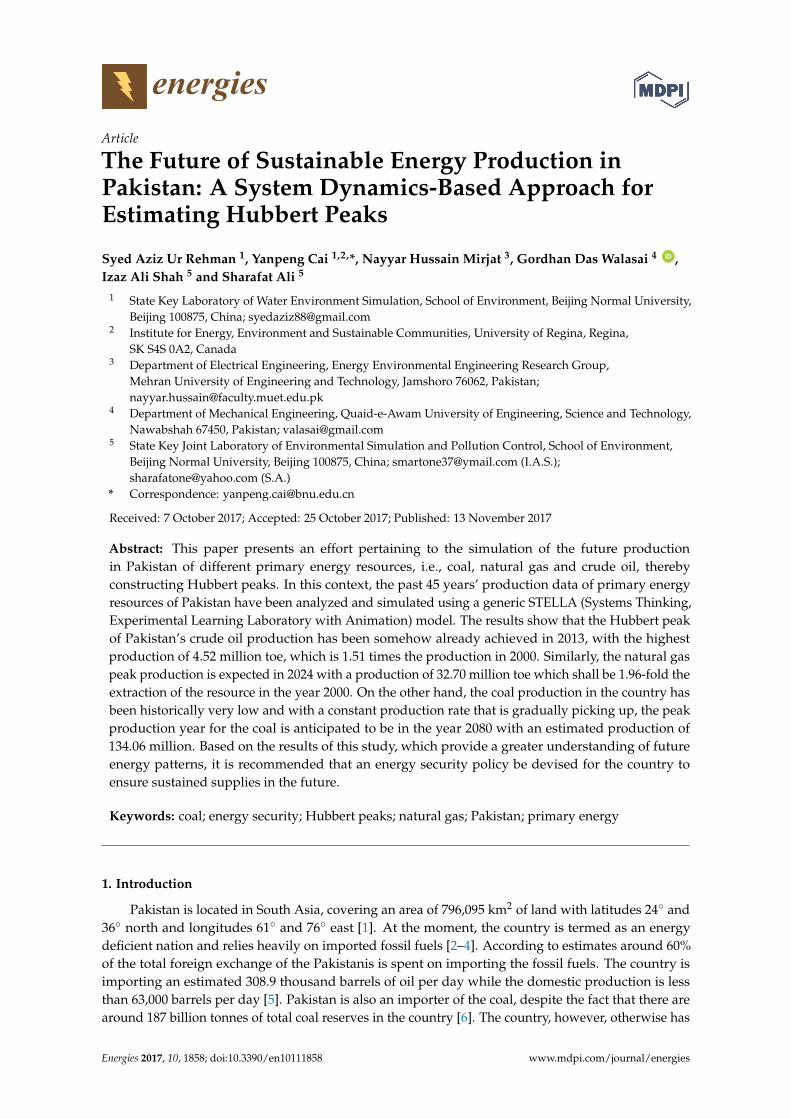
energies
Article
The Future of Sustainable Energy Production inPakistan: A System Dynamics-Based Approach forEstimating Hubbert Peaks
Syed Aziz Ur Rehman 1, Yanpeng Cai 1,2,*, Nayyar Hussain Mirjat 3, Gordhan Das Walasai 4 ID ,Izaz Ali Shah 5 and Sharafat Ali 5
1 State Key Laboratory of Water Environment Simulation, School of Environment, Beijing Normal University,Beijing 100875, China; [email protected]
2 Institute for Energy, Environment and Sustainable Communities, University of Regina, Regina,SK S4S 0A2, Canada
3 Department of Electrical Engineering, Energy Environmental Engineering Research Group,Mehran University of Engineering and Technology, Jamshoro 76062, Pakistan;[email protected]
4 Department of Mechanical Engineering, Quaid-e-Awam University of Engineering, Science and Technology,Nawabshah 67450, Pakistan; [email protected]
5 State Key Joint Laboratory of Environmental Simulation and Pollution Control, School of Environment,Beijing Normal University, Beijing 100875, China; [email protected] (I.A.S.);[email protected] (S.A.)
* Correspondence: [email protected]
Received: 7 October 2017; Accepted: 25 October 2017; Published: 13 November 2017
Abstract: This paper presents an effort pertaining to the simulation of the future productionin Pakistan of different primary energy resources, i.e., coal, natural gas and crude oil, therebyconstructing Hubbert peaks. In this context, the past 45 years’ production data of primary energyresources of Pakistan have been analyzed and simulated using a generic STELLA (Systems Thinking,Experimental Learning Laboratory with Animation) model. The results show that the Hubbert peakof Pakistan’s crude oil production has been somehow already achieved in 2013, with the highestproduction of 4.52 million toe, which is 1.51 times the production in 2000. Similarly, the natural gaspeak production is expected in 2024 with a production of 32.70 million toe which shall be 1.96-fold theextraction of the resource in the year 2000. On the other hand, the coal production in the country hasbeen historically very low and with a constant production rate that is gradually picking up, the peakproduction year for the coal is anticipated to be in the year 2080 with an estimated production of134.06 million. Based on the results of this study, which provide a greater understanding of futureenergy patterns, it is recommended that an energy security policy be devised for the country toensure sustained supplies in the future.
Keywords: coal; energy security; Hubbert peaks; natural gas; Pakistan; primary energy
1. Introduction
Pakistan is located in South Asia, covering an area of 796,095 km2 of land with latitudes 24◦ and36◦ north and longitudes 61◦ and 76◦ east [1]. At the moment, the country is termed as an energydeficient nation and relies heavily on imported fossil fuels [2–4]. According to estimates around 60%of the total foreign exchange of the Pakistanis is spent on importing the fossil fuels. The country isimporting an estimated 308.9 thousand barrels of oil per day while the domestic production is lessthan 63,000 barrels per day [5]. Pakistan is also an importer of the coal, despite the fact that there arearound 187 billion tonnes of total coal reserves in the country [6]. The country, however, otherwise has
Energies 2017, 10, 1858; doi:10.3390/en10111858 www.mdpi.com/journal/energies
Energies 2017, 10, 1858 2 of 24
limited fossil energy resources of its own and has a low per capita energy consumption of 501.6 kgoil equivalent compared to the global average of 1790 kg oil equivalent [7,8]. Pakistan is, therefore,facing significant challenges in the energy sector towards meeting the demand which is growing ata rate of 11 to 13% per year. The energy requirement of Pakistan was 62.56 million tons of oil equivalent(toe) in 2008–2009 [9] which are estimated to rise to the level of reach to 179 million toe in the nexttwo decades.
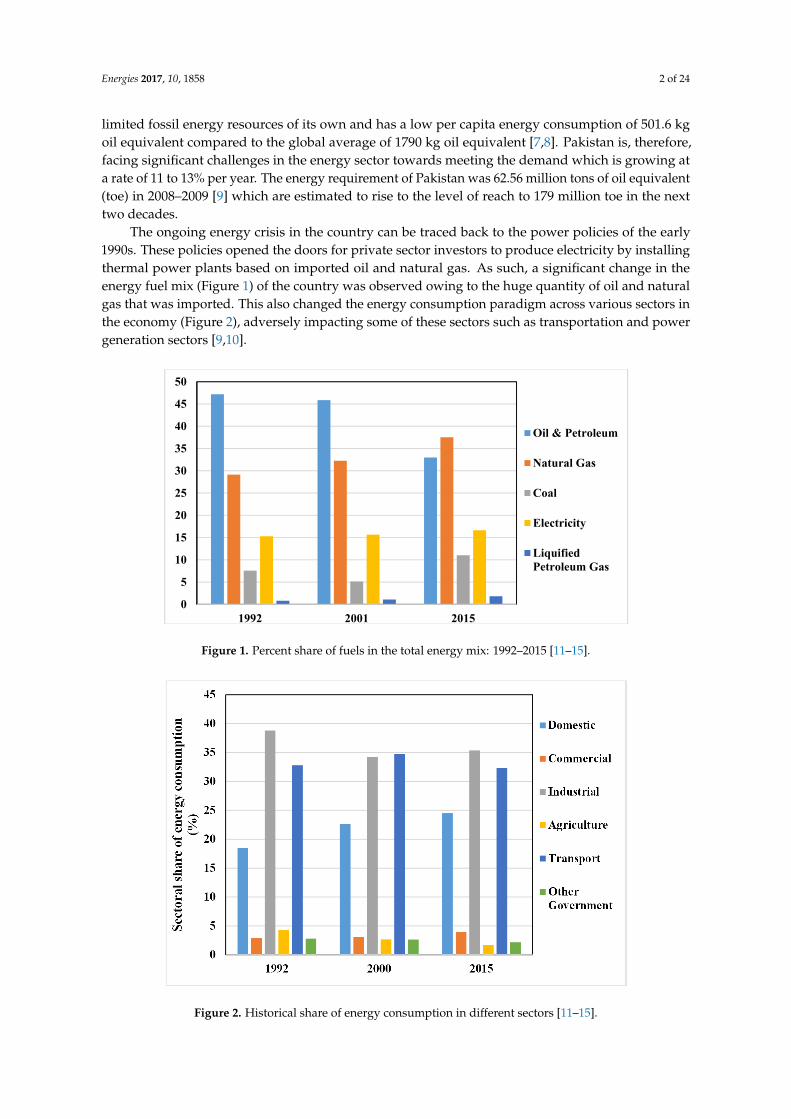
The ongoing energy crisis in the country can be traced back to the power policies of the early1990s. These policies opened the doors for private sector investors to produce electricity by installingthermal power plants based on imported oil and natural gas. As such, a significant change in theenergy fuel mix (Figure 1) of the country was observed owing to the huge quantity of oil and naturalgas that was imported. This also changed the energy consumption paradigm across various sectors inthe economy (Figure 2), adversely impacting some of these sectors such as transportation and powergeneration sectors [9,10].
Energies 2017, 10, 1858 2 of 23
has limited fossil energy resources of its own and has a low per capita energy consumption of 501.6 kg oil equivalent compared to the global average of 1790 kg oil equivalent [7,8]. Pakistan is, therefore, facing significant challenges in the energy sector towards meeting the demand which is growing at a rate of 11 to 13% per year. The energy requirement of Pakistan was 62.56 million tons of oil equivalent (toe) in 2008–2009 [9] which are estimated to rise to the level of reach to 179 million toe in the next two decades.
The ongoing energy crisis in the country can be traced back to the power policies of the early 1990s. These policies opened the doors for private sector investors to produce electricity by installing thermal power plants based on imported oil and natural gas. As such, a significant change in the energy fuel mix (Figure 1) of the country was observed owing to the huge quantity of oil and natural gas that was imported. This also changed the energy consumption paradigm across various sectors in the economy (Figure 2), adversely impacting some of these sectors such as transportation and power generation sectors [9,10].
Figure 1. Percent share of fuels in the total energy mix: 1992–2015 [11–15].
Figure 2. Historical share of energy consumption in different sectors [11–15].
The import of fossil fuels had substantially raised Pakistan’s energy import bill over the years. As a result of these power policies, the oil import bill, which was USD 530 million in 1994, has surpassed USD 1400 million in recent years. This expenditure on importing oil represents 40% of the
0
5
10
15
20
25
30
35
40
45
50
1992 2001 2015
Oil & Petroleum
Natural Gas
Coal
Electricity
LiquifiedPetroleum Gas
0
5
10
15
20
25
30
35
40
45
1992 2000 2015
Sec
tora
l sh
are
of e
ner
gy c
onsu
mp
tion
(%
)
Domestic
Commercial
Industrial
Agriculture
Transport
OtherGovernment
Figure 1. Percent share of fuels in the total energy mix: 1992–2015 [11–15].
Energies 2017, 10, 1858 2 of 23
has limited fossil energy resources of its own and has a low per capita energy consumption of 501.6 kg oil equivalent compared to the global average of 1790 kg oil equivalent [7,8]. Pakistan is, therefore, facing significant challenges in the energy sector towards meeting the demand which is growing at a rate of 11 to 13% per year. The energy requirement of Pakistan was 62.56 million tons of oil equivalent (toe) in 2008–2009 [9] which are estimated to rise to the level of reach to 179 million toe in the next two decades.
The ongoing energy crisis in the country can be traced back to the power policies of the early 1990s. These policies opened the doors for private sector investors to produce electricity by installing thermal power plants based on imported oil and natural gas. As such, a significant change in the energy fuel mix (Figure 1) of the country was observed owing to the huge quantity of oil and natural gas that was imported. This also changed the energy consumption paradigm across various sectors in the economy (Figure 2), adversely impacting some of these sectors such as transportation and power generation sectors [9,10].
Figure 1. Percent share of fuels in the total energy mix: 1992–2015 [11–15].
Figure 2. Historical share of energy consumption in different sectors [11–15].
The import of fossil fuels had substantially raised Pakistan’s energy import bill over the years. As a result of these power policies, the oil import bill, which was USD 530 million in 1994, has surpassed USD 1400 million in recent years. This expenditure on importing oil represents 40% of the
0
5
10
15
20
25
30
35
40
45
50
1992 2001 2015
Oil & Petroleum
Natural Gas
Coal
Electricity
LiquifiedPetroleum Gas
0
5
10
15
20
25
30
35
40
45
1992 2000 2015
Sec
tora
l sh
are
of e
ner
gy c
onsu
mp
tion
(%
)
Domestic
Commercial
Industrial
Agriculture
Transport
OtherGovernment
Figure 2. Historical share of energy consumption in different sectors [11–15].

Energies 2017, 10, 1858 3 of 24
The import of fossil fuels had substantially raised Pakistan’s energy import bill over the years.As a result of these power policies, the oil import bill, which was USD 530 million in 1994, has surpassedUSD 1400 million in recent years. This expenditure on importing oil represents 40% of the country’stotal fossil fuel import bill, which is otherwise USD 14.5 billion and accounts for 20% of all foreignexchange spending [16]. It is, therefore high time to adopt energy management practices which shouldfocus on reducing the country’s reliance on imported fossil fuels and explore the local potential ofprimary energy supplies as well as harnessing renewable energy resources in the overall energyfuel mix.
This paper analyses, assesses and simulates the historical and future primary energy productionof Pakistan to provide an opportunity to the energy planning and policy makers to consider theestimated results of this study which duly take care existing reserves and their expected lifetime.
In this context, one of the possible ways to simulate the oil, coal and natural gas cumulativeproduction and ultimate recovery is to construct Hubbert peaks based on historical data by assumingconstant extraction rates of these resources. This paper is thus the first effort of its kind which takinginto account the historical and anticipated future production rates of primary energy commoditieshypothesises the production pattern in the way proposed by M.K. Hubbert.
The remainder of the paper is organized as follows: Section 2 provides a detailed account ofthe primary energy resources of Pakistan, while Hubbert peaks and their applications are discussedin Section 3. The methodological framework is implemented in Section 4. The results of this studyare provided and discussed in Section 5, and finally conclusions and policy recommendations arecontained in Section 6.
2. Primary Energy Resources of Pakistan
2.1. Coal
Among the different primary energy resources, coal is the most abundant fossil fuel of Pakistan.Hence, with huge estimated coal reserves of 185.175 billion tons, Pakistan ranks as the fourth richestcountry worldwide [17,18]. Some studies suggest that by utilising this huge coal potential, Pakistancould produce as much as 100,000 MW of electricity for a lifetime of 30 years [19].
The lignite coal reserves of the country constitute about 97% of the total coal reserves, whereasthe remaining 3% are bituminous and sub-bituminous coal [20]. The total coal reserves in the countryas on 30 June 2014, are reported by the Hydrocarbon Development Institute of Pakistan (HDIP) to be186,007 million tons, which has been categorized as measured reserves; 7775 million tons, indicatedreserves; 19,412.5 million tons; inferred reserves; 44,524 million tons and hypothetical reserves being114,293 million tons (Table 1).
Table 1. Pakistan coal reserves as on 30 June 2014 (million tonnes).
Province Measured Indicated Inferred Hypothetical Total
Sindh 7664 19,370 44,290 114,132 185,456Balochistan 54 13 134 16 217
Punjab 55 24 11 145 235Khyber
Pakhtunkhwa 1.5 4.5 84 - 90
Azad Kashmir 1 1 7 - 9Grand Total 7775.5 19,412.5 44,524 114,293 186,007
Data source: Energy Yearbook 2015.
Balochistan province is believed to be one of the most mineral-rich areas of the country, but inthe 1990s huge reserves of lignite coal were discovered in the Tharparkar district of Sindh Province(Figure 3). These reserves are so huge that they represent almost 95% of the total reserves of the
Energies 2017, 10, 1858 4 of 24
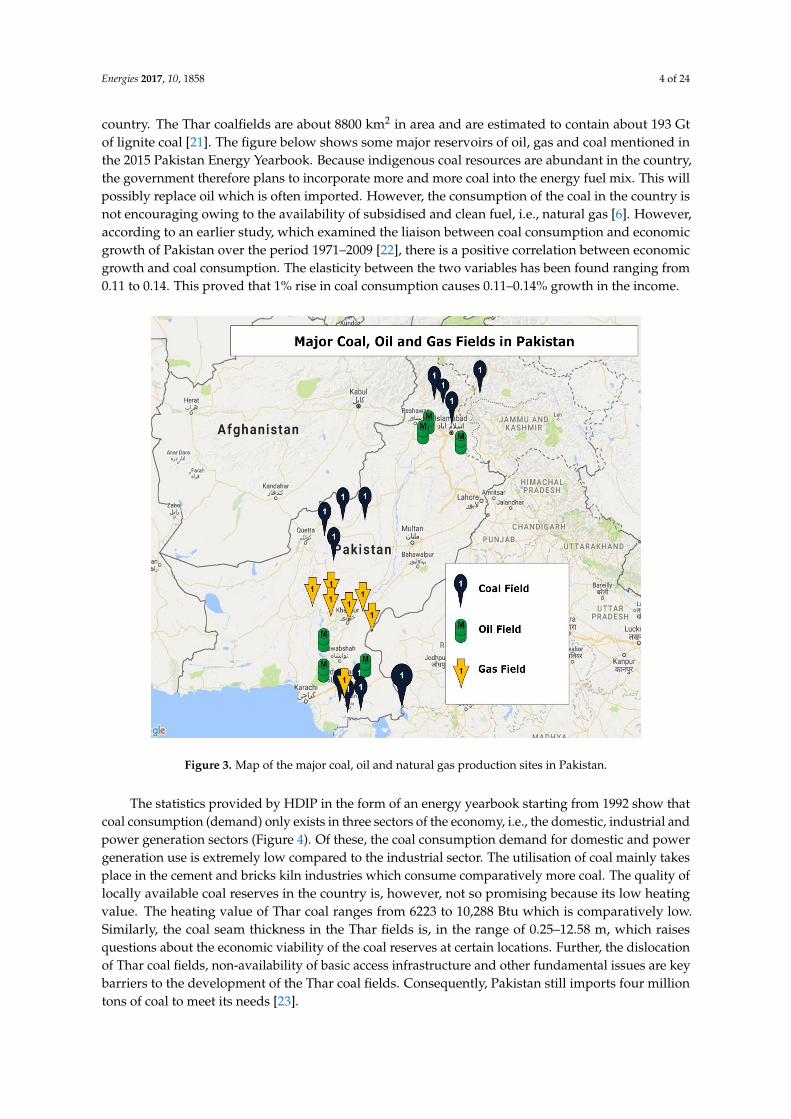
country. The Thar coalfields are about 8800 km2 in area and are estimated to contain about 193 Gtof lignite coal [21]. The figure below shows some major reservoirs of oil, gas and coal mentioned inthe 2015 Pakistan Energy Yearbook. Because indigenous coal resources are abundant in the country,the government therefore plans to incorporate more and more coal into the energy fuel mix. This willpossibly replace oil which is often imported. However, the consumption of the coal in the country isnot encouraging owing to the availability of subsidised and clean fuel, i.e., natural gas [6]. However,according to an earlier study, which examined the liaison between coal consumption and economicgrowth of Pakistan over the period 1971–2009 [22], there is a positive correlation between economicgrowth and coal consumption. The elasticity between the two variables has been found ranging from0.11 to 0.14. This proved that 1% rise in coal consumption causes 0.11–0.14% growth in the income.
Energies 2017, 10, 1858 4 of 23
growth of Pakistan over the period 1971–2009 [22], there is a positive correlation between economic growth and coal consumption. The elasticity between the two variables has been found ranging from 0.11 to 0.14. This proved that 1% rise in coal consumption causes 0.11–0.14% growth in the income.
Figure 3. Map of the major coal, oil and natural gas production sites in Pakistan.
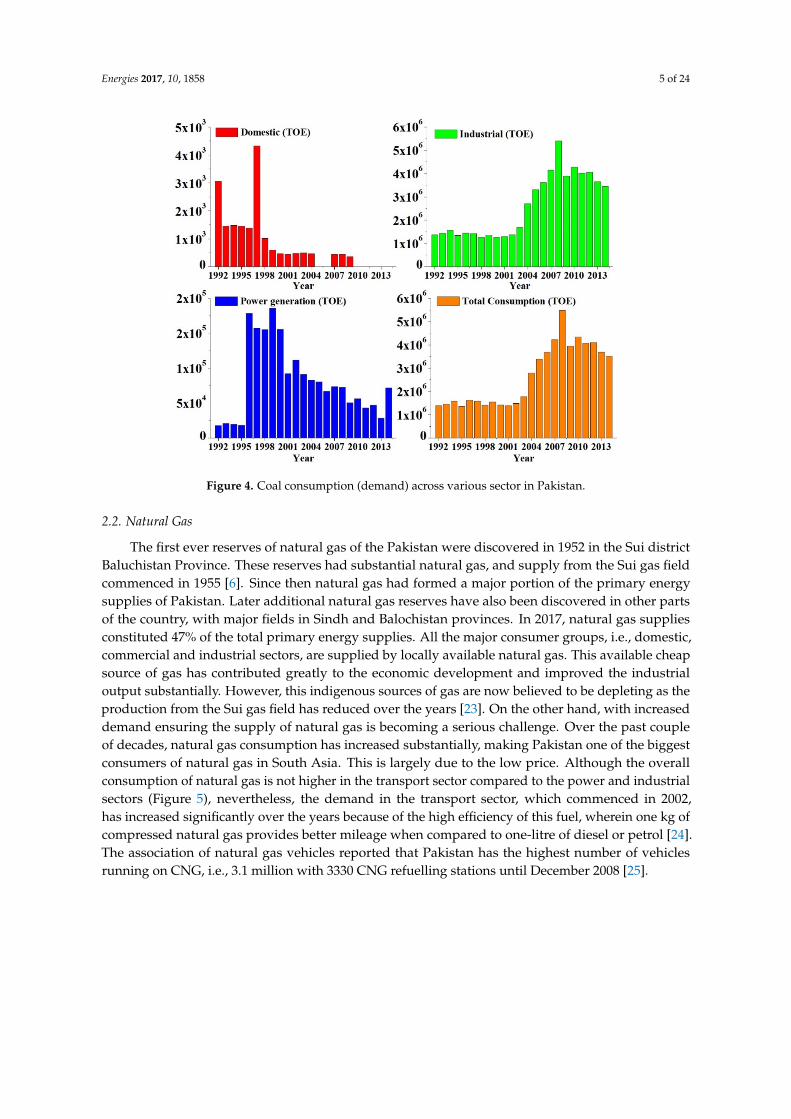
The statistics provided by HDIP in the form of an energy yearbook starting from 1992 show that coal consumption (demand) only exists in three sectors of the economy, i.e., the domestic, industrial and power generation sectors (Figure 4). Of these, the coal consumption demand for domestic and power generation use is extremely low compared to the industrial sector. The utilisation of coal mainly takes place in the cement and bricks kiln industries which consume comparatively more coal. The quality of locally available coal reserves in the country is, however, not so promising because its low heating value. The heating value of Thar coal ranges from 6223 to 10,288 Btu which is comparatively low. Similarly, the coal seam thickness in the Thar fields is, in the range of 0.25–12.58 m, which raises questions about the economic viability of the coal reserves at certain locations. Further, the dislocation of Thar coal fields, non-availability of basic access infrastructure and other fundamental issues are key barriers to the development of the Thar coal fields. Consequently, Pakistan still imports four million tons of coal to meet its needs [23].
Figure 3. Map of the major coal, oil and natural gas production sites in Pakistan.
The statistics provided by HDIP in the form of an energy yearbook starting from 1992 show thatcoal consumption (demand) only exists in three sectors of the economy, i.e., the domestic, industrial andpower generation sectors (Figure 4). Of these, the coal consumption demand for domestic and powergeneration use is extremely low compared to the industrial sector. The utilisation of coal mainly takesplace in the cement and bricks kiln industries which consume comparatively more coal. The quality oflocally available coal reserves in the country is, however, not so promising because its low heatingvalue. The heating value of Thar coal ranges from 6223 to 10,288 Btu which is comparatively low.Similarly, the coal seam thickness in the Thar fields is, in the range of 0.25–12.58 m, which raisesquestions about the economic viability of the coal reserves at certain locations. Further, the dislocationof Thar coal fields, non-availability of basic access infrastructure and other fundamental issues are keybarriers to the development of the Thar coal fields. Consequently, Pakistan still imports four milliontons of coal to meet its needs [23].
Energies 2017, 10, 1858 5 of 24Energies 2017, 10, 1858 5 of 23
Figure 4. Coal consumption (demand) across various sector in Pakistan.
2.2. Natural Gas
The first ever reserves of natural gas of the Pakistan were discovered in 1952 in the Sui district Baluchistan Province. These reserves had substantial natural gas, and supply from the Sui gas field commenced in 1955 [6]. Since then natural gas had formed a major portion of the primary energy supplies of Pakistan. Later additional natural gas reserves have also been discovered in other parts of the country, with major fields in Sindh and Balochistan provinces. In 2017, natural gas supplies constituted 47% of the total primary energy supplies. All the major consumer groups, i.e., domestic, commercial and industrial sectors, are supplied by locally available natural gas. This available cheap source of gas has contributed greatly to the economic development and improved the industrial output substantially. However, this indigenous sources of gas are now believed to be depleting as the production from the Sui gas field has reduced over the years [23]. On the other hand, with increased demand ensuring the supply of natural gas is becoming a serious challenge. Over the past couple of decades, natural gas consumption has increased substantially, making Pakistan one of the biggest consumers of natural gas in South Asia. This is largely due to the low price. Although the overall consumption of natural gas is not higher in the transport sector compared to the power and industrial sectors (Figure 5), nevertheless, the demand in the transport sector, which commenced in 2002, has increased significantly over the years because of the high efficiency of this fuel, wherein one kg of compressed natural gas provides better mileage when compared to one-litre of diesel or petrol [24]. The association of natural gas vehicles reported that Pakistan has the highest number of vehicles running on CNG, i.e., 3.1 million with 3330 CNG refuelling stations until December 2008 [25].
Figure 4. Coal consumption (demand) across various sector in Pakistan.
2.2. Natural Gas
The first ever reserves of natural gas of the Pakistan were discovered in 1952 in the Sui districtBaluchistan Province. These reserves had substantial natural gas, and supply from the Sui gas fieldcommenced in 1955 [6]. Since then natural gas had formed a major portion of the primary energysupplies of Pakistan. Later additional natural gas reserves have also been discovered in other partsof the country, with major fields in Sindh and Balochistan provinces. In 2017, natural gas suppliesconstituted 47% of the total primary energy supplies. All the major consumer groups, i.e., domestic,commercial and industrial sectors, are supplied by locally available natural gas. This available cheapsource of gas has contributed greatly to the economic development and improved the industrialoutput substantially. However, this indigenous sources of gas are now believed to be depleting as theproduction from the Sui gas field has reduced over the years [23]. On the other hand, with increaseddemand ensuring the supply of natural gas is becoming a serious challenge. Over the past coupleof decades, natural gas consumption has increased substantially, making Pakistan one of the biggestconsumers of natural gas in South Asia. This is largely due to the low price. Although the overallconsumption of natural gas is not higher in the transport sector compared to the power and industrialsectors (Figure 5), nevertheless, the demand in the transport sector, which commenced in 2002,has increased significantly over the years because of the high efficiency of this fuel, wherein one kg ofcompressed natural gas provides better mileage when compared to one-litre of diesel or petrol [24].The association of natural gas vehicles reported that Pakistan has the highest number of vehiclesrunning on CNG, i.e., 3.1 million with 3330 CNG refuelling stations until December 2008 [25].
Energies 2017, 10, 1858 6 of 24Energies 2017, 10, 1858 6 of 23
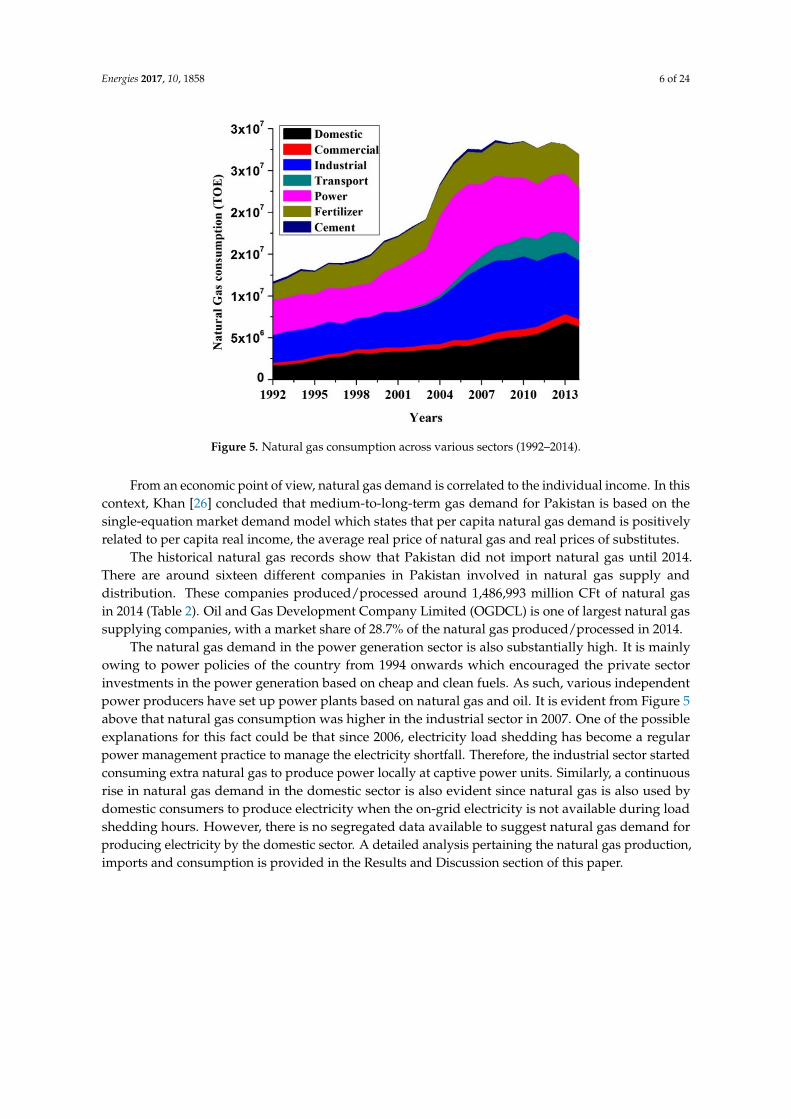
Figure 5. Natural gas consumption across various sectors (1992–2014).
From an economic point of view, natural gas demand is correlated to the individual income. In this context, Khan [26] concluded that medium-to-long-term gas demand for Pakistan is based on the single-equation market demand model which states that per capita natural gas demand is positively related to per capita real income, the average real price of natural gas and real prices of substitutes.
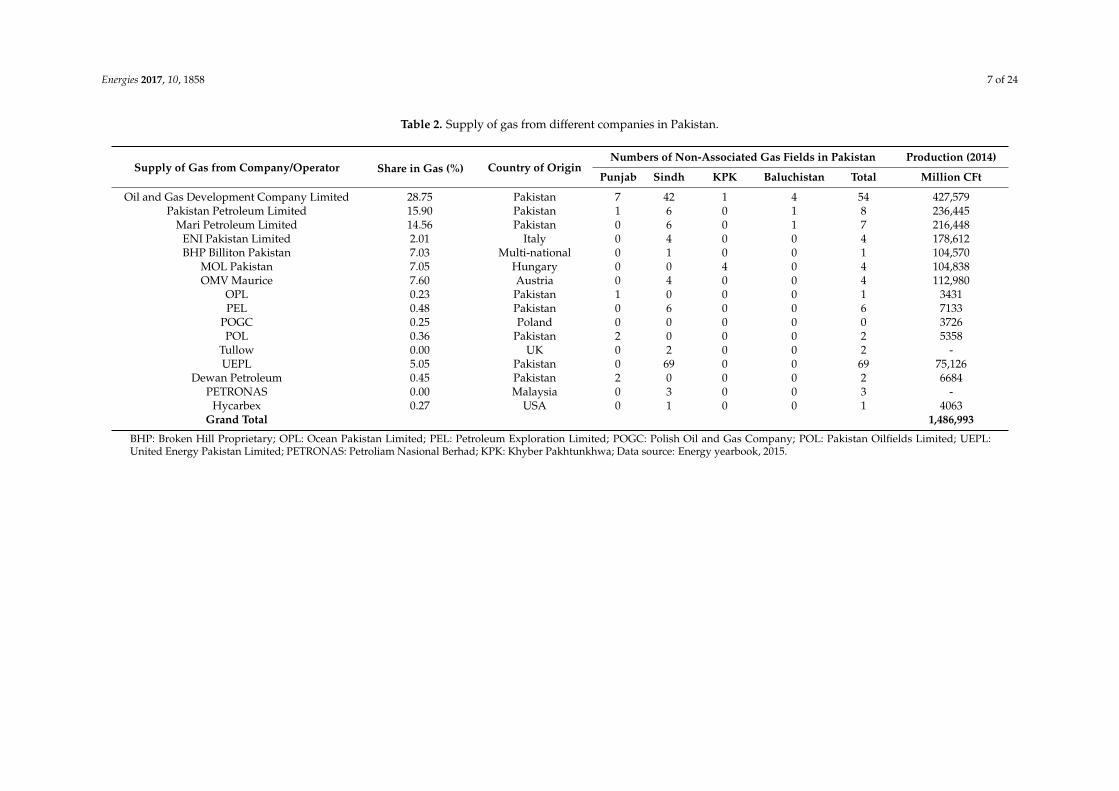
The historical natural gas records show that Pakistan did not import natural gas until 2014. There are around sixteen different companies in Pakistan involved in natural gas supply and distribution. These companies produced/processed around 1,486,993 million CFt of natural gas in 2014 (Table 2). Oil and Gas Development Company Limited (OGDCL) is one of largest natural gas supplying companies, with a market share of 28.7% of the natural gas produced/processed in 2014.
The natural gas demand in the power generation sector is also substantially high. It is mainly owing to power policies of the country from 1994 onwards which encouraged the private sector investments in the power generation based on cheap and clean fuels. As such, various independent power producers have set up power plants based on natural gas and oil. It is evident from Figure 5 above that natural gas consumption was higher in the industrial sector in 2007. One of the possible explanations for this fact could be that since 2006, electricity load shedding has become a regular power management practice to manage the electricity shortfall. Therefore, the industrial sector started consuming extra natural gas to produce power locally at captive power units. Similarly, a continuous rise in natural gas demand in the domestic sector is also evident since natural gas is also used by domestic consumers to produce electricity when the on-grid electricity is not available during load shedding hours. However, there is no segregated data available to suggest natural gas demand for producing electricity by the domestic sector. A detailed analysis pertaining the natural gas production, imports and consumption is provided in the Results and Discussion section of this paper.
Figure 5. Natural gas consumption across various sectors (1992–2014).
From an economic point of view, natural gas demand is correlated to the individual income. In thiscontext, Khan [26] concluded that medium-to-long-term gas demand for Pakistan is based on thesingle-equation market demand model which states that per capita natural gas demand is positivelyrelated to per capita real income, the average real price of natural gas and real prices of substitutes.
The historical natural gas records show that Pakistan did not import natural gas until 2014.There are around sixteen different companies in Pakistan involved in natural gas supply anddistribution. These companies produced/processed around 1,486,993 million CFt of natural gasin 2014 (Table 2). Oil and Gas Development Company Limited (OGDCL) is one of largest natural gassupplying companies, with a market share of 28.7% of the natural gas produced/processed in 2014.
The natural gas demand in the power generation sector is also substantially high. It is mainlyowing to power policies of the country from 1994 onwards which encouraged the private sectorinvestments in the power generation based on cheap and clean fuels. As such, various independentpower producers have set up power plants based on natural gas and oil. It is evident from Figure 5above that natural gas consumption was higher in the industrial sector in 2007. One of the possibleexplanations for this fact could be that since 2006, electricity load shedding has become a regularpower management practice to manage the electricity shortfall. Therefore, the industrial sector startedconsuming extra natural gas to produce power locally at captive power units. Similarly, a continuousrise in natural gas demand in the domestic sector is also evident since natural gas is also used bydomestic consumers to produce electricity when the on-grid electricity is not available during loadshedding hours. However, there is no segregated data available to suggest natural gas demand forproducing electricity by the domestic sector. A detailed analysis pertaining the natural gas production,imports and consumption is provided in the Results and Discussion section of this paper.
Energies 2017, 10, 1858 7 of 24
Table 2. Supply of gas from different companies in Pakistan.
Supply of Gas from Company/Operator Share in Gas (%) Country of OriginNumbers of Non-Associated Gas Fields in Pakistan Production (2014)
Punjab Sindh KPK Baluchistan Total Million CFt
Oil and Gas Development Company Limited 28.75 Pakistan 7 42 1 4 54 427,579Pakistan Petroleum Limited 15.90 Pakistan 1 6 0 1 8 236,445
Mari Petroleum Limited 14.56 Pakistan 0 6 0 1 7 216,448ENI Pakistan Limited 2.01 Italy 0 4 0 0 4 178,612BHP Billiton Pakistan 7.03 Multi-national 0 1 0 0 1 104,570
MOL Pakistan 7.05 Hungary 0 0 4 0 4 104,838OMV Maurice 7.60 Austria 0 4 0 0 4 112,980
OPL 0.23 Pakistan 1 0 0 0 1 3431PEL 0.48 Pakistan 0 6 0 0 6 7133
POGC 0.25 Poland 0 0 0 0 0 3726POL 0.36 Pakistan 2 0 0 0 2 5358
Tullow 0.00 UK 0 2 0 0 2 -UEPL 5.05 Pakistan 0 69 0 0 69 75,126
Dewan Petroleum 0.45 Pakistan 2 0 0 0 2 6684PETRONAS 0.00 Malaysia 0 3 0 0 3 -
Hycarbex 0.27 USA 0 1 0 0 1 4063Grand Total 1,486,993
BHP: Broken Hill Proprietary; OPL: Ocean Pakistan Limited; PEL: Petroleum Exploration Limited; POGC: Polish Oil and Gas Company; POL: Pakistan Oilfields Limited; UEPL:United Energy Pakistan Limited; PETRONAS: Petroliam Nasional Berhad; KPK: Khyber Pakhtunkhwa; Data source: Energy yearbook, 2015.
Energies 2017, 10, 1858 8 of 24
2.3. Crude Oil and Petroleum Products
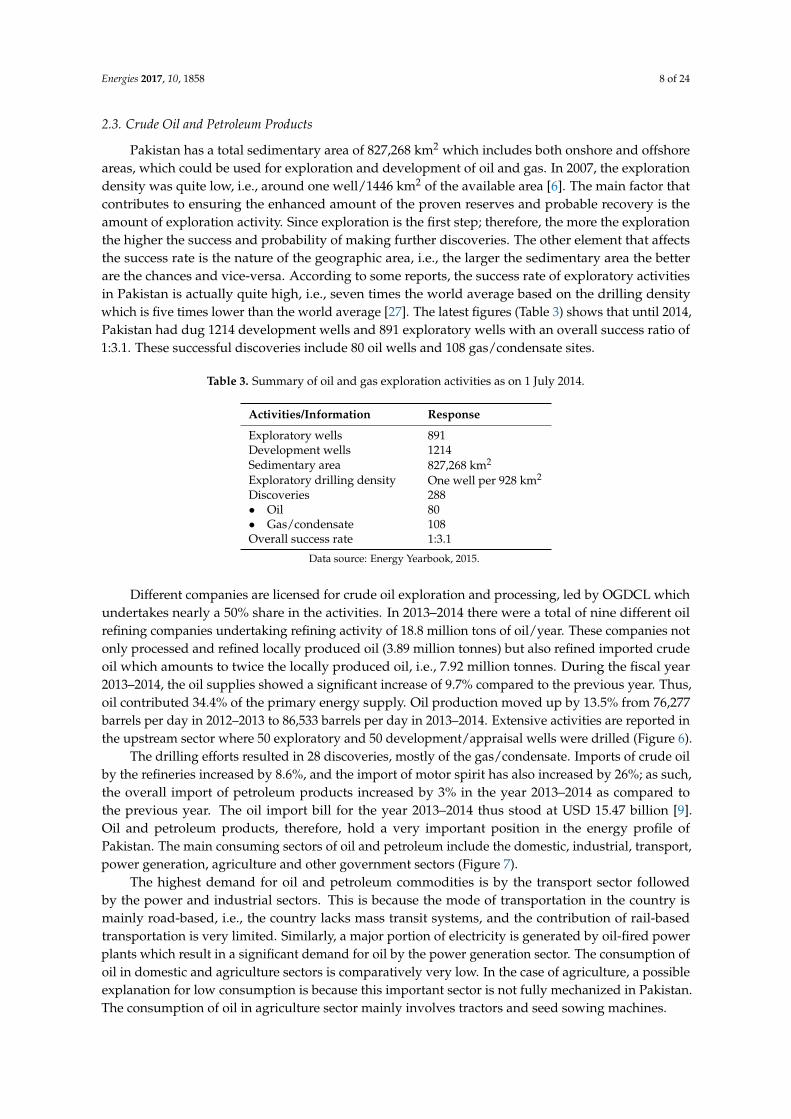
Pakistan has a total sedimentary area of 827,268 km2 which includes both onshore and offshoreareas, which could be used for exploration and development of oil and gas. In 2007, the explorationdensity was quite low, i.e., around one well/1446 km2 of the available area [6]. The main factor thatcontributes to ensuring the enhanced amount of the proven reserves and probable recovery is theamount of exploration activity. Since exploration is the first step; therefore, the more the explorationthe higher the success and probability of making further discoveries. The other element that affectsthe success rate is the nature of the geographic area, i.e., the larger the sedimentary area the betterare the chances and vice-versa. According to some reports, the success rate of exploratory activitiesin Pakistan is actually quite high, i.e., seven times the world average based on the drilling densitywhich is five times lower than the world average [27]. The latest figures (Table 3) shows that until 2014,Pakistan had dug 1214 development wells and 891 exploratory wells with an overall success ratio of1:3.1. These successful discoveries include 80 oil wells and 108 gas/condensate sites.
Table 3. Summary of oil and gas exploration activities as on 1 July 2014.
Activities/Information Response
Exploratory wells 891Development wells 1214Sedimentary area 827,268 km2
Exploratory drilling density One well per 928 km2
Discoveries 288• Oil 80• Gas/condensate 108Overall success rate 1:3.1
Data source: Energy Yearbook, 2015.
Different companies are licensed for crude oil exploration and processing, led by OGDCL whichundertakes nearly a 50% share in the activities. In 2013–2014 there were a total of nine different oilrefining companies undertaking refining activity of 18.8 million tons of oil/year. These companies notonly processed and refined locally produced oil (3.89 million tonnes) but also refined imported crudeoil which amounts to twice the locally produced oil, i.e., 7.92 million tonnes. During the fiscal year2013–2014, the oil supplies showed a significant increase of 9.7% compared to the previous year. Thus,oil contributed 34.4% of the primary energy supply. Oil production moved up by 13.5% from 76,277barrels per day in 2012–2013 to 86,533 barrels per day in 2013–2014. Extensive activities are reported inthe upstream sector where 50 exploratory and 50 development/appraisal wells were drilled (Figure 6).
The drilling efforts resulted in 28 discoveries, mostly of the gas/condensate. Imports of crude oilby the refineries increased by 8.6%, and the import of motor spirit has also increased by 26%; as such,the overall import of petroleum products increased by 3% in the year 2013–2014 as compared tothe previous year. The oil import bill for the year 2013–2014 thus stood at USD 15.47 billion [9].Oil and petroleum products, therefore, hold a very important position in the energy profile ofPakistan. The main consuming sectors of oil and petroleum include the domestic, industrial, transport,power generation, agriculture and other government sectors (Figure 7).
The highest demand for oil and petroleum commodities is by the transport sector followedby the power and industrial sectors. This is because the mode of transportation in the country ismainly road-based, i.e., the country lacks mass transit systems, and the contribution of rail-basedtransportation is very limited. Similarly, a major portion of electricity is generated by oil-fired powerplants which result in a significant demand for oil by the power generation sector. The consumption ofoil in domestic and agriculture sectors is comparatively very low. In the case of agriculture, a possibleexplanation for low consumption is because this important sector is not fully mechanized in Pakistan.The consumption of oil in agriculture sector mainly involves tractors and seed sowing machines.

Energies 2017, 10, 1858 9 of 24
Energies 2017, 10, 1858 8 of 23
2.3. Crude Oil and Petroleum Products
Pakistan has a total sedimentary area of 827,268 km2 which includes both onshore and offshore areas, which could be used for exploration and development of oil and gas. In 2007, the exploration density was quite low, i.e., around one well/1446 km2 of the available area [6]. The main factor that contributes to ensuring the enhanced amount of the proven reserves and probable recovery is the amount of exploration activity. Since exploration is the first step; therefore, the more the exploration the higher the success and probability of making further discoveries. The other element that affects the success rate is the nature of the geographic area, i.e., the larger the sedimentary area the better are the chances and vice-versa. According to some reports, the success rate of exploratory activities in Pakistan is actually quite high, i.e., seven times the world average based on the drilling density which is five times lower than the world average [27]. The latest figures (Table 3) shows that until 2014, Pakistan had dug 1214 development wells and 891 exploratory wells with an overall success ratio of 1:3.1. These successful discoveries include 80 oil wells and 108 gas/condensate sites.
Table 3. Summary of oil and gas exploration activities as on 1 July 2014.
Activities/Information ResponseExploratory wells 891 Development wells 1214 Sedimentary area 827,268 km2 Exploratory drilling density One well per 928 km2 Discoveries 288 • Oil 80 • Gas/condensate 108 Overall success rate 1:3.1
Data source: Energy Yearbook, 2015.
Different companies are licensed for crude oil exploration and processing, led by OGDCL which undertakes nearly a 50% share in the activities. In 2013–2014 there were a total of nine different oil refining companies undertaking refining activity of 18.8 million tons of oil/year. These companies not only processed and refined locally produced oil (3.89 million tonnes) but also refined imported crude oil which amounts to twice the locally produced oil, i.e., 7.92 million tonnes. During the fiscal year 2013–2014, the oil supplies showed a significant increase of 9.7% compared to the previous year. Thus, oil contributed 34.4% of the primary energy supply. Oil production moved up by 13.5% from 76,277 barrels per day in 2012–2013 to 86,533 barrels per day in 2013–2014. Extensive activities are reported in the upstream sector where 50 exploratory and 50 development/appraisal wells were drilled (Figure 6).
Figure 6. Exploratory and development wells drilled in Pakistan.
2334
13 16 18 1432 29 19
33 36 27 27 26 16 2135
5023
13
19 1931 30
4524
28
3141 53 59
42
3436
6250
0
20
40
60
80
100
120
Exploratory Development
Figure 6. Exploratory and development wells drilled in Pakistan.
Energies 2017, 10, 1858 9 of 23
The drilling efforts resulted in 28 discoveries, mostly of the gas/condensate. Imports of crude oil by the refineries increased by 8.6%, and the import of motor spirit has also increased by 26%; as such, the overall import of petroleum products increased by 3% in the year 2013–2014 as compared to the previous year. The oil import bill for the year 2013–2014 thus stood at USD 15.47 billion [9]. Oil and petroleum products, therefore, hold a very important position in the energy profile of Pakistan. The main consuming sectors of oil and petroleum include the domestic, industrial, transport, power generation, agriculture and other government sectors (Figure 7).
Figure 7. Oil and petroleum products consumption across various sectors (1992–2014).
The highest demand for oil and petroleum commodities is by the transport sector followed by the power and industrial sectors. This is because the mode of transportation in the country is mainly road-based, i.e., the country lacks mass transit systems, and the contribution of rail-based transportation is very limited. Similarly, a major portion of electricity is generated by oil-fired power plants which result in a significant demand for oil by the power generation sector. The consumption of oil in domestic and agriculture sectors is comparatively very low. In the case of agriculture, a possible explanation for low consumption is because this important sector is not fully mechanized in Pakistan. The consumption of oil in agriculture sector mainly involves tractors and seed sowing machines.
3. Hubbert Peaks and Its Applications
3.1. History and Rationale
Depletion of hydrocarbon resources is of great concern due to the limited availability and peak production of these resources expected in the near future. Worldwide estimates of these limited resources in different regions compel us to take this matter more seriously. Therefore, the growth curve models based on historical data using Hubbert’s thesis has been constructed to forecast future production and estimate the current reserves around the world [28]. M.K. Hubbert was the first to use a quantitative technique called Logistic Growth Curve or Hubbert’s Curves to simulate the production of conventional crude oil in the lower 48 states of the USA. Based on historical production data and existing reserves, Hubbert predicted that crude oil production in the USA would peak in
Figure 7. Oil and petroleum products consumption across various sectors (1992–2014).
3. Hubbert Peaks and Its Applications
3.1. History and Rationale
Depletion of hydrocarbon resources is of great concern due to the limited availability and peakproduction of these resources expected in the near future. Worldwide estimates of these limitedresources in different regions compel us to take this matter more seriously. Therefore, the growthcurve models based on historical data using Hubbert’s thesis has been constructed to forecast futureproduction and estimate the current reserves around the world [28]. M.K. Hubbert was the first to usea quantitative technique called Logistic Growth Curve or Hubbert’s Curves to simulate the productionof conventional crude oil in the lower 48 states of the USA. Based on historical production data andexisting reserves, Hubbert predicted that crude oil production in the USA would peak in the late
Energies 2017, 10, 1858 10 of 24
1960s or early 1970s and decline thereafter [29]. He faced some critics at that time, but despite that,the predicted peak indeed occurred in the 1970s and despite remarkable advances in technology andadditional reserves discoveries in Alaska, currently, the USA produce 50% of the oil compared to 1970level. The Hubbert peak production idea was initially rejected by the majority of academicians andbusinessmen. It was not until 1998 when two geologists, Dr. Colin J. Campbell and Jean Laherrerepublished a paper entitled “The end of cheap oil” followed by a speech on oil depletion at the ClausthalUniversity of Technology in Germany; when Hubbert curves again gained attention [30]. From thereonwards, the Hubbert theory of oil depletion has been used as a method to forecast the future theglobal oil production stating that oil production in large regions follows a bell-shaped curve overtime [31,32]. Hubbert theory and production curves continue to have both followers and critics today.The theory is especially criticized for not considering the likelihood of an increase in the price of crudeoil due to decreased supply and varying production from time to time which will eventually affect thetotal size of reserves. Thus, the main criticism of the Hubbert curve concerns two factors: the impact oftechnological development and the effect of the oil price on oil supply [33].
Originally, Hubbert developed his prediction empirically. He simulated past production databy a normal or Gauss bell-shaped curve based on two major assumptions: (i) the production ratemust start from zero, rise to a maximum, then decline to zero and (ii) the area under the productioncurve is equal to the ultimate oil recovery as time approaches infinity. Later, Hubbert established themathematical base for the model where a logistic curve was employed to fit cumulative oil productionagainst time [34]. According to Gallagher [35], an idealised Hubbert curve (IHC) is defined as havingfeatures of production data as a result of a constant growth-rate under constant resource limits.Thus, IHC represents a potential production curve developed from cumulative production data andoffers a new perspective for estimating peak production periods and leftover resources. He providedthe IHC model data which shows that idealized global peak crude oil production would happen in2009 at 83.2 Mb/d (30.4 Gb/y). Thus, IHC simulations of truncated past oil production data providedsimilar results and indicated that this methodology could be useful as a forecasting tool. The Hubbertproduction model can be used to simulate the historical production data (say coal production) andpredict production in the future as under [36]:
Q =URR
1 + e−(t−tmax)/w(1)
where Q is the cumulative coal production, URR the ultimately recoverable resources, t the year,tmax the year of coal peak and w a parameter that varies to least the residual sum of squares of fittedvalues and observed values.
In the literature based on Hubbert curves addressing the fossil fuels resources and reserves mostly,certain terms with acronyms such as: “Estimated Ultimate Recovery” (EUR), “Ultimate RecoverableResources” (URR), “Ultimate Recovery” (UR), or simply “Ultimate” are used. These terms describethe total recovery from a field, which is the sum of past cumulative production, remaining proved plusprobable (2P) reserves, backdated reserves and undiscovered risked mean resources. However, thesequantities should not be confused with the different levels of recoverability of different amounts offossil fuels [37]. The logistic fit used to forecast coal extraction in the USA varies with the length ofdata used in the simulation process. The results obtained by using time series up to 1989, 1999 or 2009predicts different results, i.e., 52, 71 or 96 Gigatonnes of reserves, respectively. It further forecastedthat the peak production should have arrived in 1951, 1967 or 1986, which is not the case. Instead,production has improved since 1986. This explains the drawback of the Hubbert model, i.e., not beingable to project the decline in supply. On the other hand, an exponential curve depicts the samevariation with the difference being an everlasting increase in the supply which is also not acceptable.However, it can be said that without sufficient evidence the logistic curve cannot be accepted either [38].According to Brandt [31], there are noteworthy challenges in the present approaches for forecastingfuture oil production. Two types of issues arise, the first one as a result of using poor data, and the
Energies 2017, 10, 1858 11 of 24
second one coming from the uncertain terminology and procedures employed. The problem of dataavailability is due to lack of access to oil data and available resources, i.e., the exact quantity of oil isstill not known. However, this uncertainty is addressable as the exploration activities improve theestimates of the reserves.
3.2. Comparisons of Hubbert Peak for Forecasting Fossil Fuel Production
There has been an active debate for a long time about the availability of oil in the future. Thus,according to one school of thought, peak oil production is likely to happen, which will end theavailability of cheap oil now or in the near future. The other school of thought are the “unconcerned”ones who believe that there will be no problem in the availability of oil in future. This differenceof opinion between concerned and unconcerned groups is because of a potential lack of commonpoints of reference [39]. However, it is a fact that the production rate of any mineral resource willpeak and then decrease till the exhaustion of the economically recoverable reserves. Thus, what is leftfor debate is the time at which the production will reach its peak. Hence, what needs to be done ifthe peak is likely to happen in the near future is to arrange alternative fuels and ways of recycling.Nevertheless, the debate about the time of peak is still ongoing, for resources ranging from oil tophosphate rocks [40].
In the meantime, there are various studies in the literature pertaining to forecasting and findingthe peak consumption of fossil fuels. A few of these important studies are discussed hereinunder.Forecasts of oil production in Brazil, according to the Hubbert model and different probabilities foradding reserves were made by Szklo, et al. [41]. They explained why the Hubbert model might bemore appropriate to the Brazilian oil industry than that of Hoteling, as it implicitly emphasises theimpacts of information and depletion on the derivative over the time of the accumulated discoveries.Their findings showed that Brazilian oil industry is at a stage where the positive impacts of informationon expanding reserves (mainly through discoveries) may offset the negative impacts of depletion.Tao and Li [42] used the generic STELLA (Systems Thinking, Experimental Learning Laboratory withAnimation) model to simulate the Hubbert Peak for Chinese oil production. This model has providedsome solid results, and therefore, demonstrated to be robust. In this study, three scenarios weredeveloped to estimate the Chinese oil peak. According to scenario 1 of this model, the Hubbert Peakfor China’s crude oil production would arise in the year 2019 with a value of 199.5 million tonnes,which is about 1.1 times the 2005 output. For the Chinese raw coal production, Tao and Li [43] appliedthe generic STELLA model to simulate the Hubbert Peak. According to this simulation, the coalpeak in China would be attained between the year 2025 and 2032, with peak production at about3339–4452 million tonnes. Using the logistic growth model of Lin and Liu [36], the coal peak of Chinais estimated to be reached in the year 2025, and the peak production would be 3.83 billion tons.
Lin and Wang [44] used a logistic growth model and Gaussian curve model to forecast theproduction peak and import trends of natural gas in China. The logistic growth curve was usedto fit the historical data of natural gas production and predict the future production of naturalgas. Reference [45] estimated Brazil’s oil production curves according to different URR scenarios(P95, P50 and P5) by applying a modified multi-Hubbert model. This model improved the classicmethodology by adding productive cycles and allowing the revision of the assumption that productionrate is strictly proportional to the first power of both depletion and information effects. Chavez [46]evaluated two scenarios for the oil production in Peru applying a Hubbert model. The first, in whicha low investments in exploration and production and social and environmental barriers undermine thedevelopment of oil resources beyond the limits characterized as 2P; the second one is more optimistic,wherein current exploratory and production areas in Amazonia and low-explored offshore-shelf basinsare developed, thus, increasing EUR to 3P reserves plus contingent resources. Maggio and Cacciola [37]used a predictive model based on a variant of the multi-cyclic Hubbert approach to forecasting thefuture trends of the world’s fossil fuel production. Starting from historical data on oil (crude andNGL), natural gas, and coal production, and taking into consideration three possible scenarios for
Energies 2017, 10, 1858 12 of 24
the global scale (i.e., cumulative production plus remaining reserves plus undiscovered resources).This approach allowed them to determine that when these important energy sources would peakand start to deplete. Wang, et al. [47] used a multicycle Hubbert model to forecast China’s annualnatural gas production and determine the peak production. In this study, the peak year and the futureproduction trends based on several different URR scenarios were estimated. Moreover, in this study,a small-sample effective rolling GM (1,1) model was proposed for the first time to forecast exponentialnatural gas consumption with different lengths of data sets.
4. Theoretical and Methodological Framework
Hubbert’s thesis can be expressed as: “the yearly production pattern of any mineral adaptsa bell-shaped symmetrical curve because of its geological occurrence (volume). Thus, when halfof the total reserves are produced the curve reaches its peak, it is from this point onwards whenthe production gradually decreased to extraction, and the depletion of the resource starts” [40].The curve fitting models such as the one proposed by Hubbert has been reported in the literature tobe appropriate for forecasting first-order future production. It is especially considered suitable fordata having indeterminate ultimately recoverable resources (URR) and when the producers are theprice-takers in an economy. Therefore, various methods have been used to simulate oil productioncurves worldwide. These techniques can be broadly classified into three categories: the economic-basedapproach, the geophysical and hybrid models [45]. The economics-based approaches encompasseconomic variables such as oil prices, production costs, technological inputs and regulatory policieswhich drive the oil supply. The geophysical techniques involve curve fittings such as Hubbertproduction peaks and oil depletion theory being the most accepted approach [46]. Wang and Feng [48]identified four key factors that affect the results of curve fitting models, i.e., ultimately recoverableresources (URR), curve shape, number of cycles and maximum depletion rate. They also analyzed theinfluence of these factors on the model results theoretically.
The practice of looking into all fossil fuels and their reserve depletion independently and seriouslyis because certain fuels cannot be directly substituted by the others. This is evident from the high oilprices which would not have been as high if it could be replaced with natural gas. The plateau of oilproduction had already been witnessed in the year 2005 and even since the oil price is continuouslyrising which indicates that there are issues with respect to substituting oil with fuels. [49]. The Hubbertproduction model which was originally developed for oil has been used several times for forecastingall manner of fossil fuels since the time it was first introduced. This technique is used widely becauseof its simplicity and accuracy to estimate peak production, the peak year, and production of oil, naturalgas and coal by stimulating growth over the time using simple derivation [47]. Suppose, for naturalgas; peak production will be a point when its production will reach to its highest production andthen the production will decline. The supporters of this theory further argue that for every fossil fuelbefore we determine the Hubbert peak, the reserves would have been fully explored, identified andconfirmed and therefore at any point in time these reserves would continue to deplete. On the otherhand, the opponents of peak theory claim that although the volumes of fossil fuels reserves are fixed,the estimates derived from peak theory are ambiguous and that the technological and economic factorsare equally significant as of geological considerations [44].
It is true that there exist many uncertainties in estimating peak production for oil or other fossilfuels. Therefore, to find out the exact time of peak level production is difficult owing to multiplereasons. It is mainly because of inadequate knowledge of fossil fuels reserves in the undergroundfollowed by the complex relationship between economic factors such as oil production, demand,regional GDP growth, and global oil production. Similarly, the urge for exploration activities increaseswith increase in demand and when supply is limited accompanied by high prices, leaving little spacefor geological reasoning [50]. Despite these apprehensions, it is important to estimate the futureprimary energy production especially for a country like Pakistan which is suffering from an energycrisis. These crises are the result of poor planning and foresightedness in the energy sector. Therefore,
Energies 2017, 10, 1858 13 of 24
the estimation of peak production of oil, natural gas and coal in the country will open new horizonsfor policy planners to consider and help minimize the import of fossil fuel by anticipating indigenouspotential production and finding alternatives. The methodology followed in this study follows thework of Tao and Li [43] and Tao and Li [42] which has been briefly discussed in an earlier section ofthis paper. As such, the Hubbert peak production for coal, natural gas and oil of Pakistan has beensimulated using historical data from the year 1971 to 2015. There are two key sources of historicaldata used in this study which are International Energy Agency (IEA) and Hydrocarbon DevelopmentInstitute of Pakistan (HDIP), the ministry of petroleum and natural resources of the Government ofPakistan. However, in most of our analysis, we have used the IEA data because it dates back to 1971,while the HDIP’s data is only available from 1992 onwards. The HDIP data has been used for tworeasons: one, to validate the IEA data by comparing it to the HDIP data and secondly because theIEA data does not consider imports. Therefore, we used the HDIP data for reporting the imports.The calculation of import of energy commodities have been performed in two ways: one from 1992onwards we used the actual or real import data provided by HDIP; second, from 1971 to 1992 weused the definition of IEA for supply, i.e., Supply = Total production + import—international marinebunkers—international aviation bunkers. Thus, for the period where we did not have the actual import,we omitted the consumption in international marine and aviation bunkers and simply subtracted theproduction from supply and have reported it as the import.
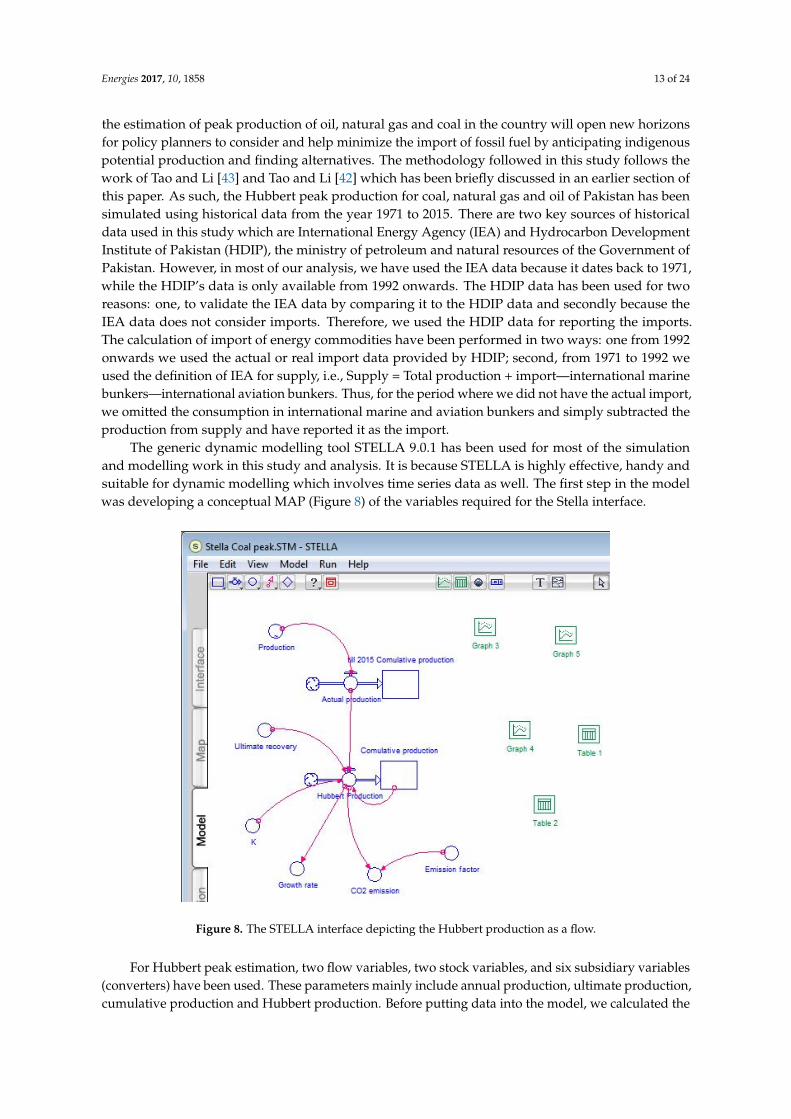
The generic dynamic modelling tool STELLA 9.0.1 has been used for most of the simulationand modelling work in this study and analysis. It is because STELLA is highly effective, handy andsuitable for dynamic modelling which involves time series data as well. The first step in the modelwas developing a conceptual MAP (Figure 8) of the variables required for the Stella interface.
Energies 2017, 10, 1858 13 of 23
has been simulated using historical data from the year 1971 to 2015. There are two key sources of historical data used in this study which are International Energy Agency (IEA) and Hydrocarbon Development Institute of Pakistan (HDIP), the ministry of petroleum and natural resources of the Government of Pakistan. However, in most of our analysis, we have used the IEA data because it dates back to 1971, while the HDIP’s data is only available from 1992 onwards. The HDIP data has been used for two reasons: one, to validate the IEA data by comparing it to the HDIP data and secondly because the IEA data does not consider imports. Therefore, we used the HDIP data for reporting the imports. The calculation of import of energy commodities have been performed in two ways: one from 1992 onwards we used the actual or real import data provided by HDIP; second, from 1971 to 1992 we used the definition of IEA for supply, i.e., Supply = Total production + import—international marine bunkers—international aviation bunkers. Thus, for the period where we did not have the actual import, we omitted the consumption in international marine and aviation bunkers and simply subtracted the production from supply and have reported it as the import.
The generic dynamic modelling tool STELLA 9.0.1 has been used for most of the simulation and modelling work in this study and analysis. It is because STELLA is highly effective, handy and suitable for dynamic modelling which involves time series data as well. The first step in the model was developing a conceptual MAP (Figure 8) of the variables required for the Stella interface.
For Hubbert peak estimation, two flow variables, two stock variables, and six subsidiary variables (converters) have been used. These parameters mainly include annual production, ultimate production, cumulative production and Hubbert production. Before putting data into the model, we calculated the historical production in the suitable units, cumulative production till a base year (2015), and ultimate recovery (using proven reserves + cumulative production until the base year).
Figure 8. The STELLA interface depicting the Hubbert production as a flow.
The sub-window called “Model” in STELLA is used to transfer data into the model by defining information flow using converters. The production function is a temporal phenomenon, therefore, to be transferred to a graphical import table. The sub-window called “Equation” in Stella was used to set up equations for calculating Hubbert peaks used by Tao and Li [43] and Tao and Li [42] in their analysis for calculating Hubbert peaks for Chinese oil and coal. We repeatedly simulated coal, natural gas and crude oil using STELLA software by updating the annual production, ultimate production, cumulative production and Hubbert production for each commodity. One of the advantages of using
Figure 8. The STELLA interface depicting the Hubbert production as a flow.
For Hubbert peak estimation, two flow variables, two stock variables, and six subsidiary variables(converters) have been used. These parameters mainly include annual production, ultimate production,cumulative production and Hubbert production. Before putting data into the model, we calculated the
Energies 2017, 10, 1858 14 of 24
historical production in the suitable units, cumulative production till a base year (2015), and ultimaterecovery (using proven reserves + cumulative production until the base year).
The sub-window called “Model” in STELLA is used to transfer data into the model by defininginformation flow using converters. The production function is a temporal phenomenon, therefore, to betransferred to a graphical import table. The sub-window called “Equation” in Stella was used to set upequations for calculating Hubbert peaks used by Tao and Li [43] and Tao and Li [42] in their analysisfor calculating Hubbert peaks for Chinese oil and coal. We repeatedly simulated coal, natural gas andcrude oil using STELLA software by updating the annual production, ultimate production, cumulativeproduction and Hubbert production for each commodity. One of the advantages of using STELLAamongst the other tools is that we simulated three different levels of production elasticity being thelow, medium and high rate of future production which resulted into different peaks in different yearsin the future. The detailed results obtained in these cases are provided in the following Section 5 alongwith the discussion.
5. Results and Discussion
5.1. The Peak Production of Coal
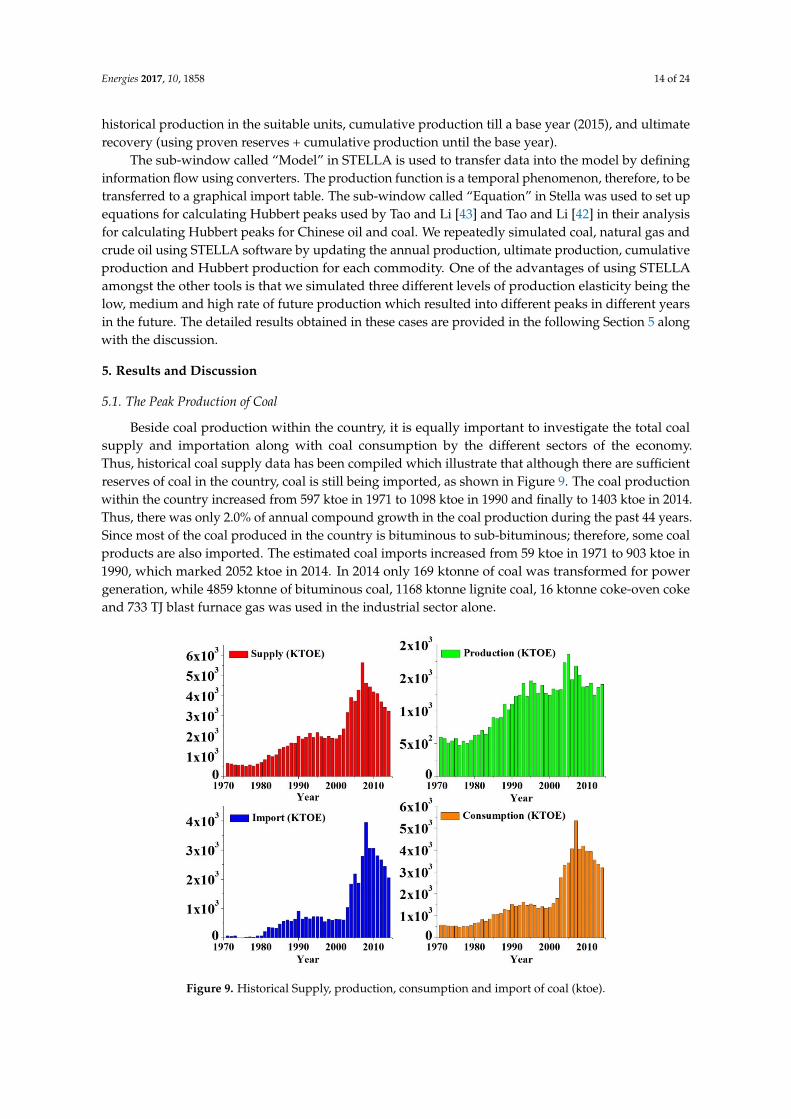
Beside coal production within the country, it is equally important to investigate the total coalsupply and importation along with coal consumption by the different sectors of the economy.Thus, historical coal supply data has been compiled which illustrate that although there are sufficientreserves of coal in the country, coal is still being imported, as shown in Figure 9. The coal productionwithin the country increased from 597 ktoe in 1971 to 1098 ktoe in 1990 and finally to 1403 ktoe in 2014.Thus, there was only 2.0% of annual compound growth in the coal production during the past 44 years.Since most of the coal produced in the country is bituminous to sub-bituminous; therefore, some coalproducts are also imported. The estimated coal imports increased from 59 ktoe in 1971 to 903 ktoe in1990, which marked 2052 ktoe in 2014. In 2014 only 169 ktonne of coal was transformed for powergeneration, while 4859 ktonne of bituminous coal, 1168 ktonne lignite coal, 16 ktonne coke-oven cokeand 733 TJ blast furnace gas was used in the industrial sector alone.
Energies 2017, 10, 1858 14 of 23
STELLA amongst the other tools is that we simulated three different levels of production elasticity being the low, medium and high rate of future production which resulted into different peaks in different years in the future. The detailed results obtained in these cases are provided in the following Section 5 along with the discussion.
5. Results and Discussion
5.1. The Peak Production of Coal
Beside coal production within the country, it is equally important to investigate the total coal supply and importation along with coal consumption by the different sectors of the economy. Thus, historical coal supply data has been compiled which illustrate that although there are sufficient reserves of coal in the country, coal is still being imported, as shown in Figure 9. The coal production within the country increased from 597 ktoe in 1971 to 1098 ktoe in 1990 and finally to 1403 ktoe in 2014. Thus, there was only 2.0% of annual compound growth in the coal production during the past 44 years. Since most of the coal produced in the country is bituminous to sub-bituminous; therefore, some coal products are also imported. The estimated coal imports increased from 59 ktoe in 1971 to 903 ktoe in 1990, which marked 2052 ktoe in 2014. In 2014 only 169 ktonne of coal was transformed for power generation, while 4859 ktonne of bituminous coal, 1168 ktonne lignite coal, 16 ktonne coke-oven coke and 733 TJ blast furnace gas was used in the industrial sector alone.
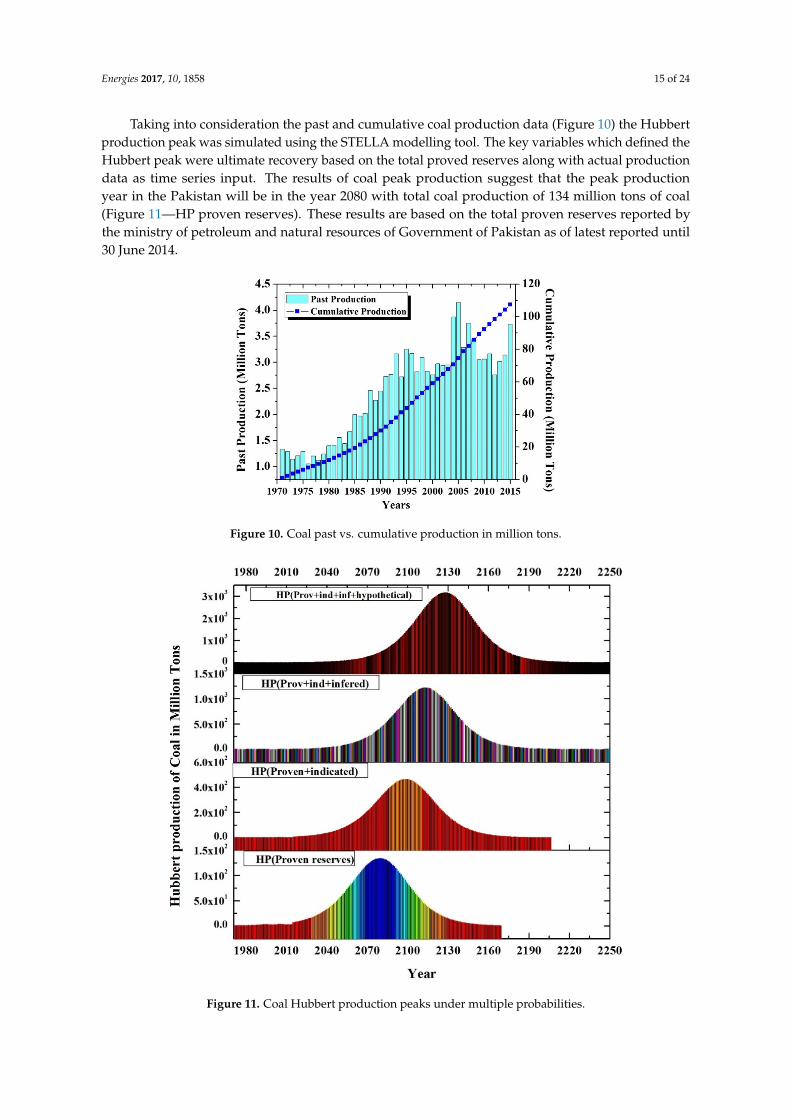
Taking into consideration the past and cumulative coal production data (Figure 10) the Hubbert production peak was simulated using the STELLA modelling tool. The key variables which defined the Hubbert peak were ultimate recovery based on the total proved reserves along with actual production data as time series input. The results of coal peak production suggest that the peak production year in the Pakistan will be in the year 2080 with total coal production of 134 million tons of coal (Figure 11—HP proven reserves). These results are based on the total proven reserves reported by the ministry of petroleum and natural resources of Government of Pakistan as of latest reported until 30 June 2014.
Figure 9. Historical Supply, production, consumption and import of coal (ktoe). Figure 9. Historical Supply, production, consumption and import of coal (ktoe).
Energies 2017, 10, 1858 15 of 24
Taking into consideration the past and cumulative coal production data (Figure 10) the Hubbertproduction peak was simulated using the STELLA modelling tool. The key variables which defined theHubbert peak were ultimate recovery based on the total proved reserves along with actual productiondata as time series input. The results of coal peak production suggest that the peak productionyear in the Pakistan will be in the year 2080 with total coal production of 134 million tons of coal(Figure 11—HP proven reserves). These results are based on the total proven reserves reported bythe ministry of petroleum and natural resources of Government of Pakistan as of latest reported until30 June 2014.Energies 2017, 10, 1858 15 of 23
Figure 10. Coal past vs. cumulative production in million tons.
Figure 11. Coal Hubbert production peaks under multiple probabilities.
The existence of coal reserves follows a classical phenomenon of geological occurrence and abundance based on exploratory surveys and are, therefore, they are reported as being proven, indicated, inferred and hypothetical coal reserves. We do not have such a classification and record keeping published by the government for other fossil fuels, i.e., crude oil and natural gas. It is believed that other countries may have such data which could be useful for in-depth analysis and more appropriate estimates of reserves under various probabilities. As such, besides forecasting coal peak production based on proven reserves, the analysis has also been undertaken considering the reserves with other levels of probabilities. Thus, we also estimated peak production by hypothesizing that the reserves suggested by geological studies being indicative, inferred or hypothetical and if these turn out to be recoverable would require determining updated production peaks. This supposition has an obvious effect on the estimates, and our results support the same outcome, i.e.,
Figure 10. Coal past vs. cumulative production in million tons.
Energies 2017, 10, 1858 15 of 23
Figure 10. Coal past vs. cumulative production in million tons.
Figure 11. Coal Hubbert production peaks under multiple probabilities.
The existence of coal reserves follows a classical phenomenon of geological occurrence and abundance based on exploratory surveys and are, therefore, they are reported as being proven, indicated, inferred and hypothetical coal reserves. We do not have such a classification and record keeping published by the government for other fossil fuels, i.e., crude oil and natural gas. It is believed that other countries may have such data which could be useful for in-depth analysis and more appropriate estimates of reserves under various probabilities. As such, besides forecasting coal peak production based on proven reserves, the analysis has also been undertaken considering the reserves with other levels of probabilities. Thus, we also estimated peak production by hypothesizing that the reserves suggested by geological studies being indicative, inferred or hypothetical and if these turn out to be recoverable would require determining updated production peaks. This supposition has an obvious effect on the estimates, and our results support the same outcome, i.e.,
Figure 11. Coal Hubbert production peaks under multiple probabilities.

Energies 2017, 10, 1858 16 of 24
The existence of coal reserves follows a classical phenomenon of geological occurrence andabundance based on exploratory surveys and are, therefore, they are reported as being proven,indicated, inferred and hypothetical coal reserves. We do not have such a classification and recordkeeping published by the government for other fossil fuels, i.e., crude oil and natural gas. It isbelieved that other countries may have such data which could be useful for in-depth analysis andmore appropriate estimates of reserves under various probabilities. As such, besides forecasting coalpeak production based on proven reserves, the analysis has also been undertaken considering thereserves with other levels of probabilities. Thus, we also estimated peak production by hypothesizingthat the reserves suggested by geological studies being indicative, inferred or hypothetical and if theseturn out to be recoverable would require determining updated production peaks. This suppositionhas an obvious effect on the estimates, and our results support the same outcome, i.e., the peak goesfurther than the peak obtained when the only smaller volume of proven coal reserves are considered.
For Pakistan, the definition of reserves being proven implies the measured reserves, having a highlevel of geological assurance, i.e., coal that lies within a radius of 0.4 km from the point of measurement.On the other hand, coal with lesser geological assurance are classified as indicated reserves, inferredreserves and hypothetical reserves being 1.4 to 1.2 km, 1.2 to 4.8 km and beyond 4.8 km away from thepoint of its measurement. Thus, after including even the three less probable reserves alongside theproven reserves, the peak production year varies (Figure 11).
This proves that there is an obvious effect of the total size of the reserves on production cycle andthat with the passage of time as the technology advances and more and more exploratory activitiesare conducted the volume of the reserves will increase and hence the peak years will move forward(Table 4). On the other hand, if the rate of extraction increases due to government policies then theresource will deplete quickly and peak year will be experienced sooner.
Table 4. Hubbert production peak of Coal under various assumptions of reserves size.
Reserves Type ReservesQuantity 1
CumulativeProduction Till 2015 2
UltimateRecovery 3
PeakProduction 4 Peak Year
Measure or Proven 7776 110 7886 134 2080
Proven + Indicated 27,188 110 27,298 464 2099
Proven + Indicated +Inferred 71,714 110 71,824 1221 2114
Proven + Indicated +Inferred + Hypothetical 186,007 110 186,117 3164 2128
1, 2, 3, 4: all in million tons.
5.2. The Peak Production of Natural Gas
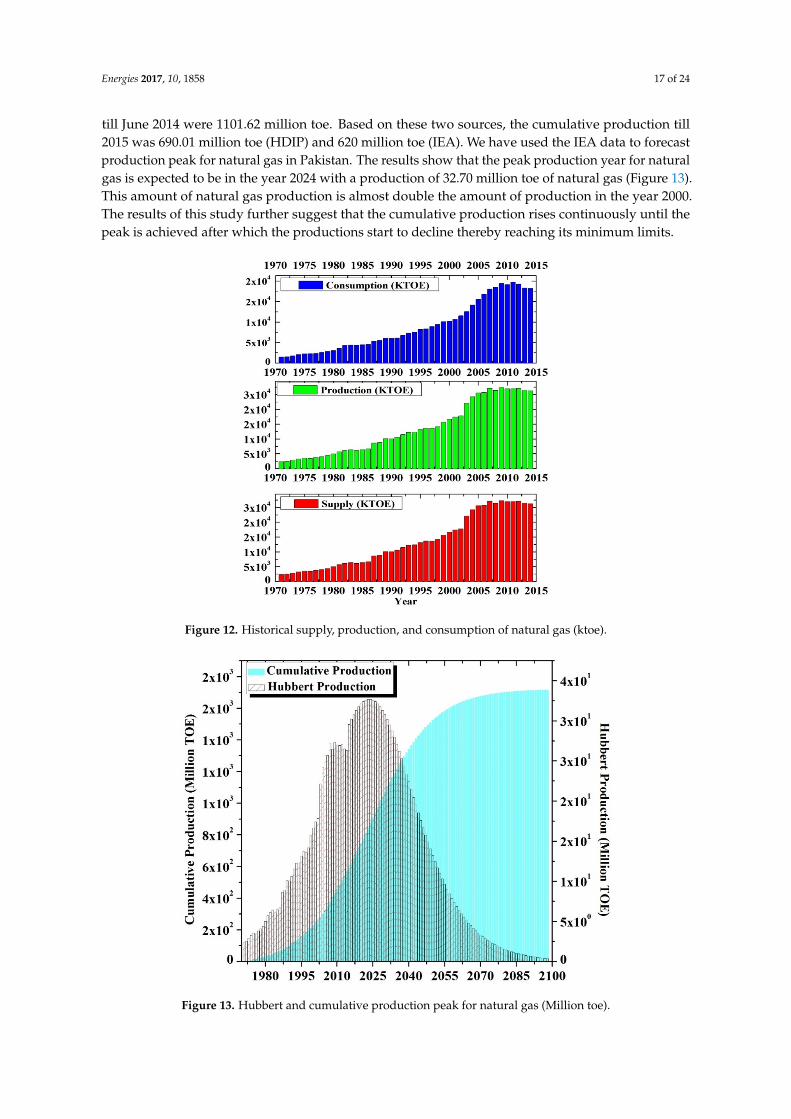
For the future production and availability of natural gas, we have assessed the historicaltotal natural gas supply as the sum of domestic production and import. Besides, the total supply,an important component of the demand-supply management is the final consumption (Figure 12).A detailed description of natural gas consumption across various sectors of the economy of Pakistanhas already been presented in Section 2.2 of the paper. Out of the all the primary energy supply sources,natural gas is the only source of energy which has not been imported till 2014. This is perhaps becausethe government had plans to produce and utilize the enormous amount of natural gas from domesticreserves. The total supply of natural gas, therefore, increased from 2361.2 ktoe in 1971 to 10,077.2 ktoein 1990 which reached the level of 26,285.3 ktoe in 2014. Thus, an overall 5.5% of annual compoundgrowth can be observed in the past 44 years.
In order to estimate future production using Hubbert peak, we followed the yearly natural gasproduction data of IEA. Since it required total original recoverable reserves, so we followed the HDIP,the ministry of petroleum and natural resources data, according to which original recoverable reserves
Energies 2017, 10, 1858 17 of 24
till June 2014 were 1101.62 million toe. Based on these two sources, the cumulative production till2015 was 690.01 million toe (HDIP) and 620 million toe (IEA). We have used the IEA data to forecastproduction peak for natural gas in Pakistan. The results show that the peak production year for naturalgas is expected to be in the year 2024 with a production of 32.70 million toe of natural gas (Figure 13).This amount of natural gas production is almost double the amount of production in the year 2000.The results of this study further suggest that the cumulative production rises continuously until thepeak is achieved after which the productions start to decline thereby reaching its minimum limits.Energies 2017, 10, 1858 17 of 23
Figure 12. Historical supply, production, and consumption of natural gas (ktoe).
Figure 13. Hubbert and cumulative production peak for natural gas (Million toe).
There are various oil and gas exportation and development companies currently operating in Pakistan as mentioned in Section 2.2 of this paper. These exploratory and development activities are ongoing in all provinces of the country. Therefore, the production from different wells/sites is different from the estimations, i.e., certain wells have already reached their peak production limits and are in the stage of decline, while the others are still young. In this regard, an important study has also been undertaken by the Petroleum Institute of Pakistan (PIP) [51] thereby forecasting the future production of oil and gas in the country till 2025. However, according to the results of PIP [51] production of natural gas will be highest in 2017, i.e., 4.2 BCFD and from 2017 onwards the
Figure 12. Historical supply, production, and consumption of natural gas (ktoe).
Energies 2017, 10, 1858 17 of 23
Figure 12. Historical supply, production, and consumption of natural gas (ktoe).
Figure 13. Hubbert and cumulative production peak for natural gas (Million toe).
There are various oil and gas exportation and development companies currently operating in Pakistan as mentioned in Section 2.2 of this paper. These exploratory and development activities are ongoing in all provinces of the country. Therefore, the production from different wells/sites is different from the estimations, i.e., certain wells have already reached their peak production limits and are in the stage of decline, while the others are still young. In this regard, an important study has also been undertaken by the Petroleum Institute of Pakistan (PIP) [51] thereby forecasting the future production of oil and gas in the country till 2025. However, according to the results of PIP [51] production of natural gas will be highest in 2017, i.e., 4.2 BCFD and from 2017 onwards the
Figure 13. Hubbert and cumulative production peak for natural gas (Million toe).
Energies 2017, 10, 1858 18 of 24
There are various oil and gas exportation and development companies currently operating inPakistan as mentioned in Section 2.2 of this paper. These exploratory and development activities areongoing in all provinces of the country. Therefore, the production from different wells/sites is differentfrom the estimations, i.e., certain wells have already reached their peak production limits and are inthe stage of decline, while the others are still young. In this regard, an important study has also beenundertaken by the Petroleum Institute of Pakistan (PIP) [51] thereby forecasting the future productionof oil and gas in the country till 2025. However, according to the results of PIP [51] production ofnatural gas will be highest in 2017, i.e., 4.2 BCFD and from 2017 onwards the production will declineand shall be 2.4 BCFD in 2024. Thus, from the PIP study perspective, 2017 can be regarded as the peakproduction year of natural gas. PIP [51] further reported that in 2016 and 2017 the production fromUnited Energy Pakistan (UEP) would rise along with a contribution from OGDCL’s KPD-TAY (KunarPasakhi Deep and Tando Allah Yar Field Development Project).
Mari gas is expected to remain the largest producer till the end of the forecast period (2025) withsupplies of slightly less than 500 MMCFD in 2024. This field contributed to 15% of the country’stotal gas supplies in 2015, and its share will increase to 21% by 2024 as output from other maturingfields declines at a higher rate. The production from the Uch field will peak around 450 MMCFD in2017/2018 before declining to nearly 300 MMCFD in 2024. A declining trend also persists in the Suifield’s gas output throughout the forecast period, from an average of 420 MMCFD in 2015 to less than250 MMCFD in 2024. A similar trend will be observed in the Qadirpur field, however, with a higherdepletion rate as production is estimated at below 230 MMCFD in 2024 compared 450 MMCFD in 2015.The Qadirpur and Sui fields combined are nevertheless still anticipated to contribute about 20% of thetotal natural gas output of the country in 2024.
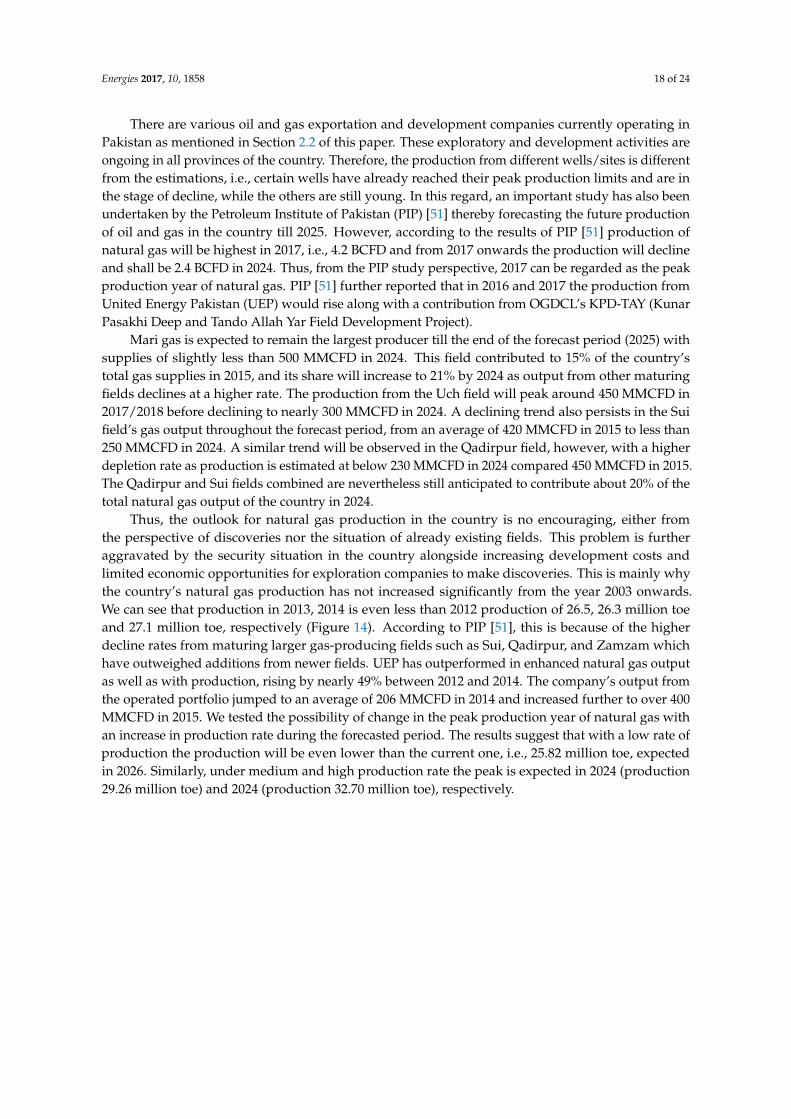
Thus, the outlook for natural gas production in the country is no encouraging, either fromthe perspective of discoveries nor the situation of already existing fields. This problem is furtheraggravated by the security situation in the country alongside increasing development costs andlimited economic opportunities for exploration companies to make discoveries. This is mainly whythe country’s natural gas production has not increased significantly from the year 2003 onwards.We can see that production in 2013, 2014 is even less than 2012 production of 26.5, 26.3 million toeand 27.1 million toe, respectively (Figure 14). According to PIP [51], this is because of the higherdecline rates from maturing larger gas-producing fields such as Sui, Qadirpur, and Zamzam whichhave outweighed additions from newer fields. UEP has outperformed in enhanced natural gas outputas well as with production, rising by nearly 49% between 2012 and 2014. The company’s output fromthe operated portfolio jumped to an average of 206 MMCFD in 2014 and increased further to over 400MMCFD in 2015. We tested the possibility of change in the peak production year of natural gas withan increase in production rate during the forecasted period. The results suggest that with a low rate ofproduction the production will be even lower than the current one, i.e., 25.82 million toe, expectedin 2026. Similarly, under medium and high production rate the peak is expected in 2024 (production29.26 million toe) and 2024 (production 32.70 million toe), respectively.
Energies 2017, 10, 1858 19 of 24
Energies 2017, 10, 1858 18 of 23
production will decline and shall be 2.4 BCFD in 2024. Thus, from the PIP study perspective, 2017 can be regarded as the peak production year of natural gas. PIP [51] further reported that in 2016 and 2017 the production from United Energy Pakistan (UEP) would rise along with a contribution from OGDCL’s KPD-TAY (Kunar Pasakhi Deep and Tando Allah Yar Field Development Project).
Mari gas is expected to remain the largest producer till the end of the forecast period (2025) with supplies of slightly less than 500 MMCFD in 2024. This field contributed to 15% of the country’s total gas supplies in 2015, and its share will increase to 21% by 2024 as output from other maturing fields declines at a higher rate. The production from the Uch field will peak around 450 MMCFD in 2017/2018 before declining to nearly 300 MMCFD in 2024. A declining trend also persists in the Sui field’s gas output throughout the forecast period, from an average of 420 MMCFD in 2015 to less than 250 MMCFD in 2024. A similar trend will be observed in the Qadirpur field, however, with a higher depletion rate as production is estimated at below 230 MMCFD in 2024 compared 450 MMCFD in 2015. The Qadirpur and Sui fields combined are nevertheless still anticipated to contribute about 20% of the total natural gas output of the country in 2024.
Thus, the outlook for natural gas production in the country is no encouraging, either from the perspective of discoveries nor the situation of already existing fields. This problem is further aggravated by the security situation in the country alongside increasing development costs and limited economic opportunities for exploration companies to make discoveries. This is mainly why the country’s natural gas production has not increased significantly from the year 2003 onwards. We can see that production in 2013, 2014 is even less than 2012 production of 26.5, 26.3 million toe and 27.1 million toe, respectively (Figure 14). According to PIP [51], this is because of the higher decline rates from maturing larger gas-producing fields such as Sui, Qadirpur, and Zamzam which have outweighed additions from newer fields. UEP has outperformed in enhanced natural gas output as well as with production, rising by nearly 49% between 2012 and 2014. The company’s output from the operated portfolio jumped to an average of 206 MMCFD in 2014 and increased further to over 400 MMCFD in 2015. We tested the possibility of change in the peak production year of natural gas with an increase in production rate during the forecasted period. The results suggest that with a low rate of production the production will be even lower than the current one, i.e., 25.82 million toe, expected in 2026. Similarly, under medium and high production rate the peak is expected in 2024 (production 29.26 million toe) and 2024 (production 32.70 million toe), respectively.
Figure 14. Natural gas past and cumulative production (million toe).
Figure 14. Natural gas past and cumulative production (million toe).
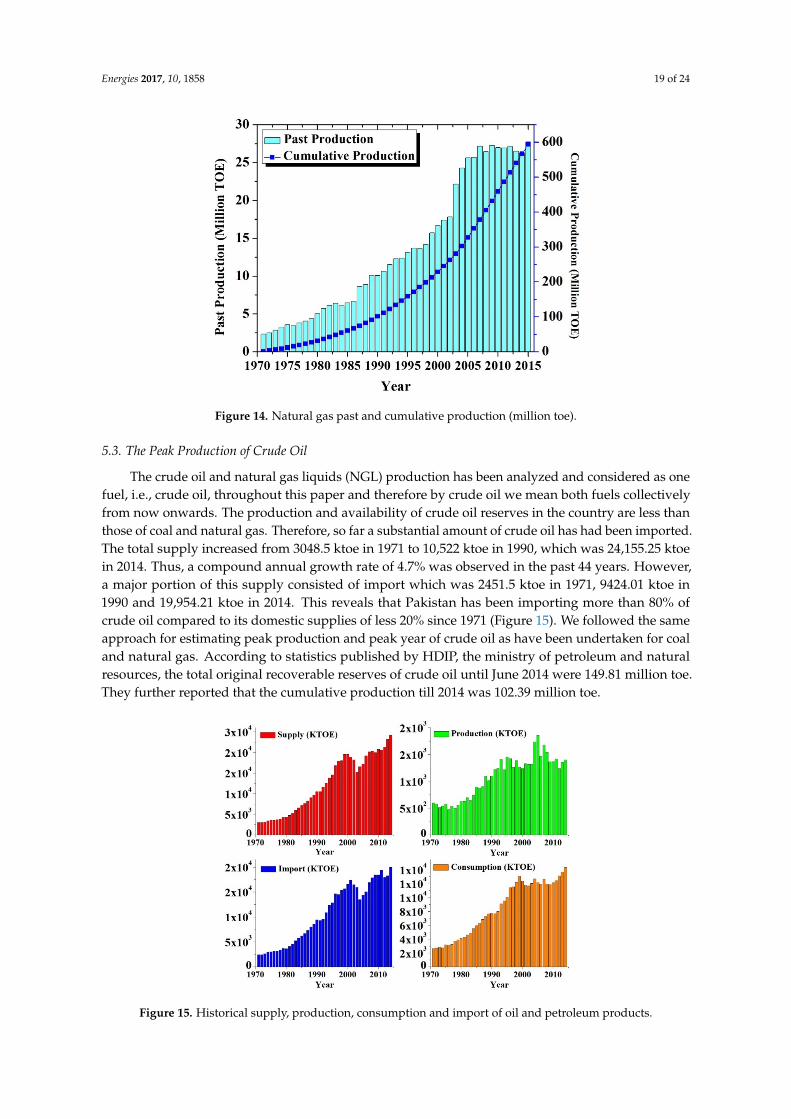
5.3. The Peak Production of Crude Oil
The crude oil and natural gas liquids (NGL) production has been analyzed and considered as onefuel, i.e., crude oil, throughout this paper and therefore by crude oil we mean both fuels collectivelyfrom now onwards. The production and availability of crude oil reserves in the country are less thanthose of coal and natural gas. Therefore, so far a substantial amount of crude oil has had been imported.The total supply increased from 3048.5 ktoe in 1971 to 10,522 ktoe in 1990, which was 24,155.25 ktoein 2014. Thus, a compound annual growth rate of 4.7% was observed in the past 44 years. However,a major portion of this supply consisted of import which was 2451.5 ktoe in 1971, 9424.01 ktoe in1990 and 19,954.21 ktoe in 2014. This reveals that Pakistan has been importing more than 80% ofcrude oil compared to its domestic supplies of less 20% since 1971 (Figure 15). We followed the sameapproach for estimating peak production and peak year of crude oil as have been undertaken for coaland natural gas. According to statistics published by HDIP, the ministry of petroleum and naturalresources, the total original recoverable reserves of crude oil until June 2014 were 149.81 million toe.They further reported that the cumulative production till 2014 was 102.39 million toe.
Energies 2017, 10, 1858 19 of 23
5.3. The Peak Production of Crude Oil
The crude oil and natural gas liquids (NGL) production has been analyzed and considered as one fuel, i.e., crude oil, throughout this paper and therefore by crude oil we mean both fuels collectively from now onwards. The production and availability of crude oil reserves in the country are less than those of coal and natural gas. Therefore, so far a substantial amount of crude oil has had been imported. The total supply increased from 3048.5 ktoe in 1971 to 10,522 ktoe in 1990, which was 24,155.25 ktoe in 2014. Thus, a compound annual growth rate of 4.7% was observed in the past 44 years. However, a major portion of this supply consisted of import which was 2451.5 ktoe in 1971, 9424.01 ktoe in 1990 and 19,954.21 ktoe in 2014. This reveals that Pakistan has been importing more than 80% of crude oil compared to its domestic supplies of less 20% since 1971 (Figure 15). We followed the same approach for estimating peak production and peak year of crude oil as have been undertaken for coal and natural gas. According to statistics published by HDIP, the ministry of petroleum and natural resources, the total original recoverable reserves of crude oil until June 2014 were 149.81 million toe. They further reported that the cumulative production till 2014 was 102.39 million toe.
Figure 15. Historical supply, production, consumption and import of oil and petroleum products.
Since we followed the IEA’s historical production data, a cumulative production amount of 104.84 million toe till 2015 have been used in our analysis (Figure 16). The results suggest that the peak production year for crude oil year had already passed in 2013 when the production was 4.52 million toe (Figure 17). Thus, from this point onwards the production is already on the decline and is continuously decreasing. Therefore, it is anticipated that the if further reserves of crude oil are not found in the country then the situation regarding availability of crude oil will worsen for the country and the imports of oil would rise in coming years.
Figure 15. Historical supply, production, consumption and import of oil and petroleum products.
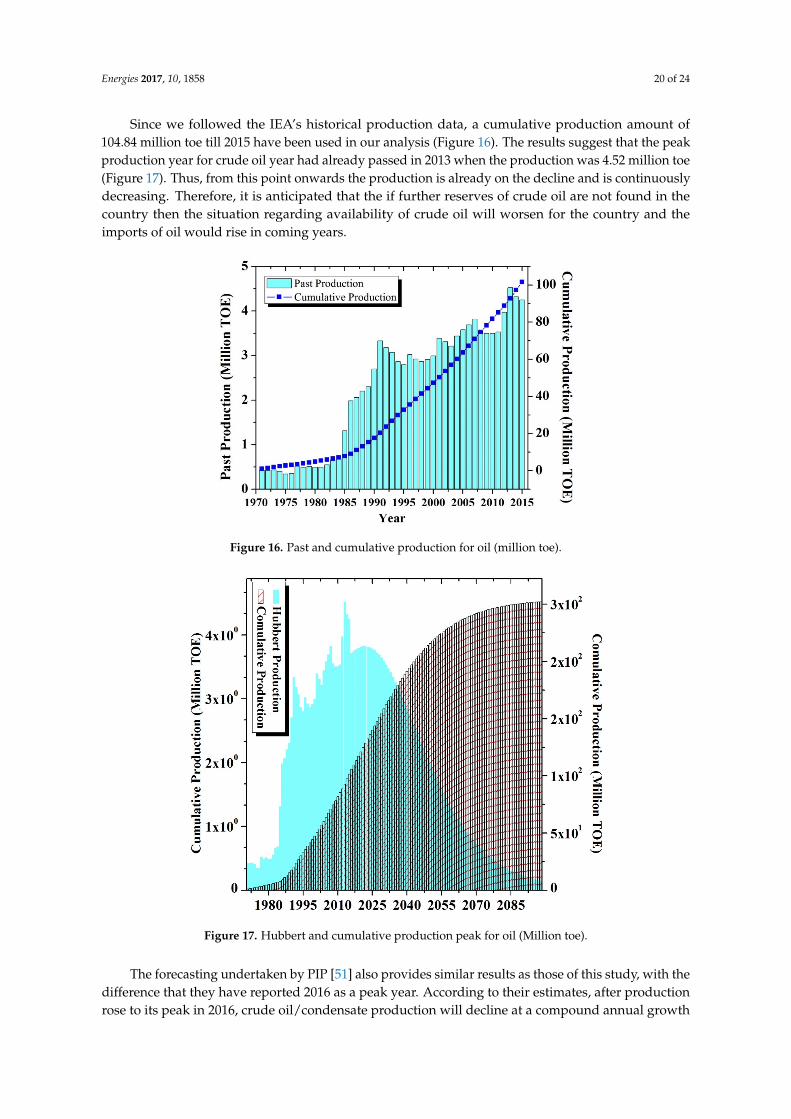
Energies 2017, 10, 1858 20 of 24
Since we followed the IEA’s historical production data, a cumulative production amount of104.84 million toe till 2015 have been used in our analysis (Figure 16). The results suggest that the peakproduction year for crude oil year had already passed in 2013 when the production was 4.52 million toe(Figure 17). Thus, from this point onwards the production is already on the decline and is continuouslydecreasing. Therefore, it is anticipated that the if further reserves of crude oil are not found in thecountry then the situation regarding availability of crude oil will worsen for the country and theimports of oil would rise in coming years.Energies 2017, 10, 1858 20 of 23
Figure 16. Past and cumulative production for oil (million toe).
Figure 17. Hubbert and cumulative production peak for oil (Million toe).
The forecasting undertaken by PIP [51] also provides similar results as those of this study, with the difference that they have reported 2016 as a peak year. According to their estimates, after production rose to its peak in 2016, crude oil/condensate production will decline at a compound annual growth rate of 13.7% till 2024. The major share of crude oil production until 2016 is reported to come from OGDCL. Similarly, the Adhi field is expected to witness an increase in output to the tune of 8500 BPD in 2016 before entering its declining phase, while the Tal block is projected to enter a declining phase from 2015 onwards. Likewise, the production from the Nashpa field which currently produces around 20,500 BPD is anticipated to fall to approximately 14,000 BPD by 2020 and less than 10,000 BPD by 2024. Thus, both theoretical and ground situation support the thesis that crude oil reserves are on the verge of exhaustion in the country. Although around 50 exploratory and 50 development wells were drilled in 2014 alone, yet these attempts are not only insufficient, but have not delivered so far for fulfilling the country’s ever-rising demand for oil and petroleum products.
Figure 16. Past and cumulative production for oil (million toe).
Energies 2017, 10, 1858 20 of 23
Figure 16. Past and cumulative production for oil (million toe).
Figure 17. Hubbert and cumulative production peak for oil (Million toe).
The forecasting undertaken by PIP [51] also provides similar results as those of this study, with the difference that they have reported 2016 as a peak year. According to their estimates, after production rose to its peak in 2016, crude oil/condensate production will decline at a compound annual growth rate of 13.7% till 2024. The major share of crude oil production until 2016 is reported to come from OGDCL. Similarly, the Adhi field is expected to witness an increase in output to the tune of 8500 BPD in 2016 before entering its declining phase, while the Tal block is projected to enter a declining phase from 2015 onwards. Likewise, the production from the Nashpa field which currently produces around 20,500 BPD is anticipated to fall to approximately 14,000 BPD by 2020 and less than 10,000 BPD by 2024. Thus, both theoretical and ground situation support the thesis that crude oil reserves are on the verge of exhaustion in the country. Although around 50 exploratory and 50 development wells were drilled in 2014 alone, yet these attempts are not only insufficient, but have not delivered so far for fulfilling the country’s ever-rising demand for oil and petroleum products.
Figure 17. Hubbert and cumulative production peak for oil (Million toe).
The forecasting undertaken by PIP [51] also provides similar results as those of this study, with thedifference that they have reported 2016 as a peak year. According to their estimates, after productionrose to its peak in 2016, crude oil/condensate production will decline at a compound annual growth
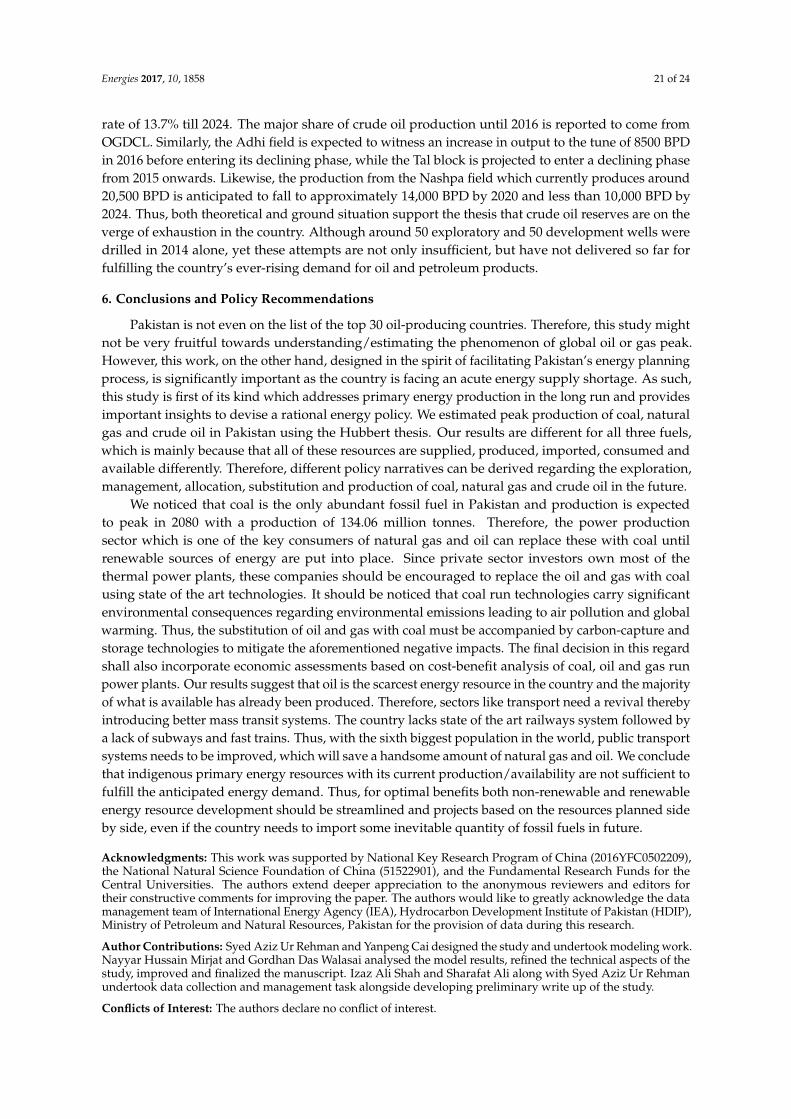
Energies 2017, 10, 1858 21 of 24
rate of 13.7% till 2024. The major share of crude oil production until 2016 is reported to come fromOGDCL. Similarly, the Adhi field is expected to witness an increase in output to the tune of 8500 BPDin 2016 before entering its declining phase, while the Tal block is projected to enter a declining phasefrom 2015 onwards. Likewise, the production from the Nashpa field which currently produces around20,500 BPD is anticipated to fall to approximately 14,000 BPD by 2020 and less than 10,000 BPD by2024. Thus, both theoretical and ground situation support the thesis that crude oil reserves are on theverge of exhaustion in the country. Although around 50 exploratory and 50 development wells weredrilled in 2014 alone, yet these attempts are not only insufficient, but have not delivered so far forfulfilling the country’s ever-rising demand for oil and petroleum products.
6. Conclusions and Policy Recommendations
Pakistan is not even on the list of the top 30 oil-producing countries. Therefore, this study mightnot be very fruitful towards understanding/estimating the phenomenon of global oil or gas peak.However, this work, on the other hand, designed in the spirit of facilitating Pakistan’s energy planningprocess, is significantly important as the country is facing an acute energy supply shortage. As such,this study is first of its kind which addresses primary energy production in the long run and providesimportant insights to devise a rational energy policy. We estimated peak production of coal, naturalgas and crude oil in Pakistan using the Hubbert thesis. Our results are different for all three fuels,which is mainly because that all of these resources are supplied, produced, imported, consumed andavailable differently. Therefore, different policy narratives can be derived regarding the exploration,management, allocation, substitution and production of coal, natural gas and crude oil in the future.
We noticed that coal is the only abundant fossil fuel in Pakistan and production is expectedto peak in 2080 with a production of 134.06 million tonnes. Therefore, the power productionsector which is one of the key consumers of natural gas and oil can replace these with coal untilrenewable sources of energy are put into place. Since private sector investors own most of thethermal power plants, these companies should be encouraged to replace the oil and gas with coalusing state of the art technologies. It should be noticed that coal run technologies carry significantenvironmental consequences regarding environmental emissions leading to air pollution and globalwarming. Thus, the substitution of oil and gas with coal must be accompanied by carbon-capture andstorage technologies to mitigate the aforementioned negative impacts. The final decision in this regardshall also incorporate economic assessments based on cost-benefit analysis of coal, oil and gas runpower plants. Our results suggest that oil is the scarcest energy resource in the country and the majorityof what is available has already been produced. Therefore, sectors like transport need a revival therebyintroducing better mass transit systems. The country lacks state of the art railways system followed bya lack of subways and fast trains. Thus, with the sixth biggest population in the world, public transportsystems needs to be improved, which will save a handsome amount of natural gas and oil. We concludethat indigenous primary energy resources with its current production/availability are not sufficient tofulfill the anticipated energy demand. Thus, for optimal benefits both non-renewable and renewableenergy resource development should be streamlined and projects based on the resources planned sideby side, even if the country needs to import some inevitable quantity of fossil fuels in future.
Acknowledgments: This work was supported by National Key Research Program of China (2016YFC0502209),the National Natural Science Foundation of China (51522901), and the Fundamental Research Funds for theCentral Universities. The authors extend deeper appreciation to the anonymous reviewers and editors fortheir constructive comments for improving the paper. The authors would like to greatly acknowledge the datamanagement team of International Energy Agency (IEA), Hydrocarbon Development Institute of Pakistan (HDIP),Ministry of Petroleum and Natural Resources, Pakistan for the provision of data during this research.
Author Contributions: Syed Aziz Ur Rehman and Yanpeng Cai designed the study and undertook modeling work.Nayyar Hussain Mirjat and Gordhan Das Walasai analysed the model results, refined the technical aspects of thestudy, improved and finalized the manuscript. Izaz Ali Shah and Sharafat Ali along with Syed Aziz Ur Rehmanundertook data collection and management task alongside developing preliminary write up of the study.
Conflicts of Interest: The authors declare no conflict of interest.
Energies 2017, 10, 1858 22 of 24
References
1. Bhutto, A.W.; Bazmi, A.A.; Zahedi, G. Greener energy: Issues and challenges for Pakistan—Biomass energyprospective. Renew. Sustain. Energy Rev. 2011, 15, 3207–3219. [CrossRef]
2. Douggar, M.G. Energy situation in Pakistan: Options and issues. Renew. Energy 1995, 6, 151–157. [CrossRef]3. Valasai, G.; Uqaili, M.; Memon, H.; Samoo, S.; Mirjat, N.; Harijan, K. Assessment of Renewable Energy for
Electricity Generation: Using Pakistan TIMES Energy Model. Sindh Univ. Res. J. 2016, 48, 775–778.4. Valasai, G.D.; Uqaili, M.A.; Memon, H.R.; Samoo, S.R.; Mirjat, N.H.; Harijan, K. Overcoming electricity
crisis in Pakistan: A review of sustainable electricity options. Renew. Sustain. Energy Rev. 2017, 72, 734–745.[CrossRef]
5. Khan, H.A.; Pervaiz, S. Technological review on solar PV in Pakistan: Scope, practices and recommendationsfor optimized system design. Renew. Sustain. Energy Rev. 2013, 23, 147–154. [CrossRef]
6. Muneer, T.; Asif, M. Prospects for secure and sustainable electricity supply for Pakistan. Renew. Sustain.Energy Rev. 2007, 11, 654–671. [CrossRef]
7. Shaikh, F.; Ji, Q.; Fan, Y. The diagnosis of an electricity crisis and alternative energy development in Pakistan.Renew. Sustain. Energy Rev. 2015, 52, 1172–1185. [CrossRef]
8. Baloch, M.H.; Abro, S.A.; Sarwar Kaloi, G.; Mirjat, N.H.; Tahir, S.; Nadeem, M.H.; Gul, M.; Memon, Z.A.;Kumar, M. A Research on Electricity Generation from Wind Corridors of Pakistan (Two Provinces):A Technical Proposal for Remote Zones. Sustainability 2017, 9, 1611. [CrossRef]
9. Energy-Yearbook, P. Pakistan Energy Yearbook; Hydrocarbon Development Institute of Pakistan: Islamabad,Pakistan, 2015; p. 142.
10. Memon, T.A.; Harijan, K.; Soomro, M.I.; Meghwar, S.; Valasai, G.D.; Khoharo, H. Potential of ElectricityGeneration from Rice Husk-A Case Study of Rice Mill. Sindh Univ. Res. J. 2017. [CrossRef]
11. Hydrocarbon Development Institute of Pakistan (HDIP). Pakistan Energy Yearbook 1997; HydrocarbonDevelopment Institute of Pakistan, Ministry of Petroleum and Natural Resources, Government of Pakistan:Islamabad, Pakistan, 1998; p. 75.
12. Hydrocarbon Development Institute of Pakistan (HDIP). Pakistan Energy Yearbook 2002; HydrocarbonDevelopment Institute of Pakistan, Ministry of Petroleum and Natural Resources, Government of Pakistan:Islamabad Pakistan, 2003; p. 91.
13. Hydrocarbon Development Institute of Pakistan (HDIP). Pakistan Energy Yearbook 2007; HydrocarbonDevelopment Institute of Pakistan, Ministry of Petroleum and Natural Resources, Government of Pakistan:Islamabad, Pakistan, 2008; p. 120.
14. Hydrocarbon Development Institute of Pakistan (HDIP). Pakistan Energy Yearbook 2012; HydrocarbonDevelopment Institute of Pakistan, Ministry of Petroleum and Natural Resources, Government of Pakistan:Islamabad, Pakistan, 2013; p. 125.
15. Hydrocarbon Development Institute of Pakistan (HDIP). Pakistan Energy Yearbook 2015; HydrocarbonDevelopment Institute of Pakistan, Ministry of Petroleum and Natural Resources, Government of Pakistan:Islamabad, Pakistan, 2016; p. 147.
16. Uddin, W.; Khan, B.; Shaukat, N.; Majid, M.; Mujtaba, G.; Mehmood, A.; Ali, S.M.; Younas, U.; Anwar, M.;Almeshal, A.M. Biogas potential for electric power generation in Pakistan: A survey. Renew. Sustain.Energy Rev. 2016, 54, 25–33. [CrossRef]
17. Mirjat, N.H.; Uqaili, M.A.; Harijan, K.; Valasai, G.D.; Shaikh, F.; Waris, M. A review of energy and powerplanning and policies of Pakistan. Renew. Sustain. Energy Rev. 2017, 79, 110–127. [CrossRef]
18. Valasai, G.D.; Mirjat, N.H.; Uqaili, M.A.; Memon, H.U.R.; Samoo, S.R.; Harijan, K. Decarbonization ofElectricity Sector of Pakistan—An Application of Times Energy Model. J. Clean Energy Technol. 2017, 5.[CrossRef]
19. Javaid, M.A.; Hussain, S.; Maqsood, A.; Arshad, Z.; Arshad, M.A.; Idrees, M. Electrical Energy Crisis inPakistan and Their Possible Solutions. Int. J. Basic Appl. Sci. 2011, 11, 38–52.
20. Malkani, M.S. A review of coal and water resources of Pakistan. Sci. Tech. Dev. 2012, 31, 202–218.21. Karim, S.; Bhutto, A.W. Coal gasification for sustainable development of the energy sector in Pakistan.
Energy Sustain. Dev. 2005, 9, 60–68.22. Kumar, S.; Shahbaz, M. Coal Consumption and Economic Growth Revisited: Structural Breaks, Cointegration
and Causality Tests for Pakistan. Energy Explor. Exploit. 2012, 30, 499–522. [CrossRef]
Energies 2017, 10, 1858 23 of 24
23. Rauf, O.; Wang, S.; Yuan, P.; Tan, J. An overview of energy status and development in Pakistan. Renew. Sustain.Energy Rev. 2015, 48, 892–931. [CrossRef]
24. Malik, S.N.; Sukhera, O.R. Management of natural gas resources and search for alternative renewable energyresources: A case study of Pakistan. Renew. Sustain. Energy Rev. 2012, 16, 1282–1290. [CrossRef]
25. Zuberi, M.J.S.; Torkmahalleh, M.A.; Ali, S.M.H. A comparative study of biomass resources utilization forpower generation and transportation in Pakistan. Int. J. Hydrog. Energy 2015, 40, 11154–11160. [CrossRef]
26. Khan, M.A. Modelling and forecasting the demand for natural gas in Pakistan. Renew. Sustain. Energy Rev.2015, 49, 1145–1159. [CrossRef]
27. Alahdad, Z. Pakistan’s Energy Sector: From Crisis to Crisis-Breaking the Chain; Pakistan Institute of DevelopmentEconomics: Islamabad, Pakistan, 2012; p. 50.
28. Sorrell, S.; Speirs, J. Using growth curves to forecast regional resource recovery: Approaches, analytics andconsistency tests. Philos. Trans. A Math. Phys. Eng. Sci. 2014, 372, 20120317. [CrossRef] [PubMed]
29. Al-Husseini, M. The debate over Hubbert’s Peak: A review. GeoArabia 2006, 11, 181–210.30. Zhao, L.; Feng, L.; Hall, C.A.S. Is peakoilism coming? Energy Policy 2009, 37, 2136–2138. [CrossRef]31. Brandt, A.R. Testing Hubbert. Energy Policy 2007, 35, 3074–3088. [CrossRef]32. Bardi, U.; Lavacchi, A. A Simple Interpretation of Hubbert’s Model of Resource Exploitation. Energies 2009,
2, 646–661. [CrossRef]33. Rehrl, T.; Friedrich, R. Modelling long-term oil price and extraction with a Hubbert approach: The LOPEX
model. Energy Policy 2006, 34, 2413–2428. [CrossRef]34. Nashawi, I.S.; Malallah, A.; Al-Bisharah, M. Forecasting World Crude Oil Production Using Multicyclic
Hubbert Model. Energy Fuels 2010, 24, 1788–1800. [CrossRef]35. Gallagher, B. Peak oil analyzed with a logistic function and idealized Hubbert curve. Energy Policy 2011, 39,
790–802. [CrossRef]36. Lin, B.-Q.; Liu, J.-H. Estimating coal production peak and trends of coal imports in China. Energy Policy 2010,
38, 512–519. [CrossRef]37. Maggio, G.; Cacciola, G. When will oil, natural gas, and coal peak? Fuel 2012, 98, 111–123. [CrossRef]38. Keith, D.; Moreno-Cruz, J. Pitfalls of coal peak prediction. Nature 2011, 469. [CrossRef] [PubMed]39. Jakobsson, K.; Bentley, R.; Söderbergh, B.; Aleklett, K. The end of cheap oil: Bottom-up economic and
geologic modeling of aggregate oil production curves. Energy Policy 2012, 41, 860–870. [CrossRef]40. Giraud, P.-N. A Note on Hubbert’s Thesis on Mineral Commodities Production Peaks and derived
Forecasting Techniques. Procedia Eng. 2012, 46, 22–26. [CrossRef]41. Szklo, A.; Machado, G.; Schaeffer, R. Future oil production in Brazil—Estimates based on a Hubbert model.
Energy Policy 2007, 35, 2360–2367. [CrossRef]42. Tao, Z.; Li, M. System dynamics model of Hubbert Peak for China’s oil. Energy Policy 2007, 35, 2281–2286.
[CrossRef]43. Tao, Z.; Li, M. What is the limit of Chinese coal supplies—A STELLA model of Hubbert Peak. Energy Policy
2007, 35, 3145–3154. [CrossRef]44. Lin, B.; Wang, T. Forecasting natural gas supply in China: Production peak and import trends. Energy Policy
2012, 49, 225–233. [CrossRef]45. Saraiva, T.A.; Szklo, A.; Lucena, A.F.P.; Chavez-Rodriguez, M.F. Forecasting Brazil’s crude oil production
using a multi-Hubbert model variant. Fuel 2014, 115, 24–31. [CrossRef]46. Chavez-Rodriguez, M.F.; Szklo, A.; de Lucena, A.F.P. Analysis of past and future oil production in Peru
under a Hubbert approach. Energy Policy 2015, 77, 140–151. [CrossRef]47. Wang, J.; Jiang, H.; Zhou, Q.; Wu, J.; Qin, S. China’s natural gas production and consumption analysis based
on the multicycle Hubbert model and rolling Grey model. Renew. Sustain. Energy Rev. 2016, 53, 1149–1167.[CrossRef]
48. Wang, J.; Feng, L. Curve-fitting models for fossil fuel production forecasting: Key influence factors. J. Nat.Gas Sci. Eng. 2016, 32, 138–149. [CrossRef]
49. Reynolds, D.B. World oil production trend: Comparing Hubbert multi-cycle curves. Ecol. Econ. 2014, 98,62–71. [CrossRef]

Energies 2017, 10, 1858 24 of 24
50. Brecha, R. Ten Reasons to Take Peak Oil Seriously. Sustainability 2013, 5, 664–694. [CrossRef]51. Petroleum Institute of Pakistan (PIP). Pakistan Energy Outlook, 2015; Petroleum Institute of Pakistan: Karachi,
Pakistan, 2015; p. 148.
© 2017 by the authors. Licensee MDPI, Basel, Switzerland. This article is an open accessarticle distributed under the terms and conditions of the Creative Commons Attribution(CC BY) license (http://creativecommons.org/licenses/by/4.0/).
Copyright © 2022 FDOKUMEN