
Energy for Sustainable Future - MDPI
232
Edited by Energy for Sustainable Future T M Indra Mahlia and Islam Md Rizwanul Fattah Printed Edition of the Special Issue Published in Energies www.mdpi.com/journal/energies
-
Upload
khangminh22 -
Category
Documents
-
view
1 -
download
0
Transcript of Energy for Sustainable Future - MDPI

Edited by
Energy for Sustainable Future
T M Indra Mahlia and Islam Md Rizwanul FattahPrinted Edition of the Special Issue Published in Energies
www.mdpi.com/journal/energies

Energy for Sustainable Future


Energy for Sustainable Future
Editors
T M Indra Mahlia
Islam Md Rizwanul Fattah
MDPI • Basel • Beijing • Wuhan • Barcelona • Belgrade • Manchester • Tokyo • Cluj • Tianjin

Editors
T M Indra Mahlia
University of Technology
Sydney
Australia
Islam Md Rizwanul Fattah
University of Technology
Sydney
Australia
Editorial Office
MDPI
St. Alban-Anlage 66
4052 Basel, Switzerland
This is a reprint of articles from the Special Issue published online in the open access journal
Energies (ISSN 1996-1073) (available at: https://www.mdpi.com/journal/energies/special issues/
energy sustainable future).
For citation purposes, cite each article independently as indicated on the article page online and as
indicated below:
LastName, A.A.; LastName, B.B.; LastName, C.C. Article Title. Journal Name Year, Volume Number,
Page Range.
ISBN 978-3-0365-2614-0 (Hbk)
ISBN 978-3-0365-2615-7 (PDF)
© 2021 by the authors. Articles in this book are Open Access and distributed under the Creative
Commons Attribution (CC BY) license, which allows users to download, copy and build upon
published articles, as long as the author and publisher are properly credited, which ensures maximum
dissemination and a wider impact of our publications.
The book as a whole is distributed by MDPI under the terms and conditions of the Creative Commons
license CC BY-NC-ND.
Contents
About the Editors . . . . . . . . . . . . . . . . . . . . . . . . . . . . . . . . . . . . . . . . . . . . . . vii
T. M. Indra Mahlia and I. M. Rizwanul Fattah
Energy for Sustainable FutureReprinted from: Energies 2021, 14, 7962, doi:10.3390/en14237962 . . . . . . . . . . . . . . . . . . . 1
Muhammad Heikal Hasan, Teuku Meurah Indra Mahlia, M. Mofijur, I.M. Rizwanul Fattah,
Fitri Handayani, Hwai Chyuan Ong and A. S. Silitonga
A Comprehensive Review on the Recent Development of Ammonia as a Renewable EnergyCarrierReprinted from: Energies 2021, 14, 3732, doi:10.3390/en14133732 . . . . . . . . . . . . . . . . . . . 3
Dominic Samoita, Charles Nzila, Poul Alberg Østergaard and Arne Remmen
Barriers and Solutions for Increasing the Integration of Solar Photovoltaic in Kenya’sElectricity MixReprinted from: Energies 2020, 13, 5502, doi:10.3390/en13205502 . . . . . . . . . . . . . . . . . . . 35
Mohammad I. Jahirul, Farhad M. Hossain, Mohammad G. Rasul and Ashfaque Ahmed
Chowdhury
A Review on the Thermochemical Recycling of Waste Tyres to Oil for Automobile EngineApplicationReprinted from: Energies 2021, 14, 3837, doi:10.3390/en14133837 . . . . . . . . . . . . . . . . . . . 53
Hamed Pourzolfaghar, Faisal Abnisa, Wan Mohd Ashri Wan Daud, Mohamed Kheireddine
Aroua and Teuku Meurah Indra Mahlia
Catalyst Characteristics and Performance of Silica-Supported Zinc for Hydrodeoxygenationof PhenolReprinted from: Energies 2020, 13, 2802, doi:10.3390/en13112802 . . . . . . . . . . . . . . . . . . . 71
Mei Yin Ong, Saifuddin Nomanbhay, Fitranto Kusumo, Raja Mohamad Hafriz Raja
Shahruzzaman and Abd Halim Shamsuddin
Modeling and Optimization of Microwave-Based Bio-Jet Fuel from Coconut Oil: Investigationof Response Surface Methodology (RSM) and Artificial Neural Network Methodology (ANN)Reprinted from: Energies 2021, 14, 295, doi:10.3390/en14020295 . . . . . . . . . . . . . . . . . . . . 85
Samuel Matthew G. Dumlao and Keiichi N. Ishihara
Weather-Driven Scenario Analysis for Decommissioning Coal Power Plants in High PVPenetration GridsReprinted from: Energies 2021, , 2389, doi:10.3390/en14092389 . . . . . . . . . . . . . . . . . . . . 103
Olumide Hassan, Stephen Morse and Matthew Leach
The Energy Lock-In Effect of Solar Home Systems: A Case Study in Rural NigeriaReprinted from: Energies 2020, 13, 6682, doi:10.3390/en13246682 . . . . . . . . . . . . . . . . . . . 127
Ramsey Jadim, Mirka Kans, Jesko Schulte, Mohammed Alhattab, May Alhendi and Ali
Bushehry
On Approaching Relevant Cost-Effective Sustainable Maintenance of Mineral Oil-FilledElectrical TransformersReprinted from: Energies 2021, 14, 3670, doi:10.3390/en14123670 . . . . . . . . . . . . . . . . . . . 151
v

Remigiusz Jasinski, Marta Galant-Gołebiewska, Mateusz Nowak, Monika Ginter, Paula
Kurzawska, Karolina Kurtyka and Marta Maciejewska
Case Study of Pollution with Particulate Matter in Selected Locations of Polish CitiesReprinted from: Energies 2021, 14, 2529, doi:10.3390/en14092529 . . . . . . . . . . . . . . . . . . . 169
Sarwo Edhy Sofyan, Eric Hu, Andrei Kotousov, Teuku Meurah Indra Riayatsyah and Razali
Thaib
Mathematical Modelling and Operational Analysis of Combined Vertical–Horizontal HeatExchanger for Shallow Geothermal Energy Application in Cooling ModeReprinted from: Energies 2020, 13, 6598, doi:10.3390/en13246598 . . . . . . . . . . . . . . . . . . . 181
Satya Widya Yudha, Benny Tjahjono and Philip Longhurst
Stakeholders’ Recount on the Dynamics of Indonesia’s Renewable Energy SectorReprinted from: Energies 2021, 14, 2762, doi:10.3390/en14102762 . . . . . . . . . . . . . . . . . . . 201
vi

About the Editors
T M Indra Mahlia (Distinguished Professor)
T M Indra Mahlia is a Distinguished Professor in the School of Information, Systems, and
Modelling at UTS, and a highly cited researcher in the field of engineering. Professor Mahlia is a core
member of the University’s Centre for Green Technology, which aims to develop novel technology for
future clean fuels, vehicle emissions measurement, and environmental decontamination. His research
interests include sustainable energy, renewable energy conversion and storage, forestry biomass and
bioproducts, automotive combustion, and fuel engineering. He is involved as a researcher in a $5
million project funded by various sources. He was listed as a Highly Cited Researcher by Clarivate
Analytics in 2017, 2018, 2019, 2020, and 2021, and a field leader in Sustainable Energy (Engineering
& Computer Science) in a special report published by The Australian in 2019. He was appointed as a
professor at the Department of Mechanical Engineering at the University of Malaya, Kuala Lumpur
in 2009. His publications include more than 350 journal articles, proceedings, and research reports,
of which more than 300 are in WOS and Scopus indexed. A polyglot, Professor Mahlia is fluent in
and can peer review in English, Indonesian, Malay, and Achinese.
Islam Md Rizwanul Fattah (Dr)
Dr IMR Fattah is a Postdoctoral Research Fellow in the School of ISM, Faculty of Engineering
and IT at the University of Technology Sydney (UTS), researching the effective use of waste for
sustainable energy applications. He has accomplished his PhD in reducing PM and soot emissions
from diesel combustion from the University of New South Wales (UNSW, Sydney) in 2019. Previously,
he completed his Master of Engineering Science from the University of Malaya (UM) in 2014 and
Bachelor of Science in Mechanical Engineering from Bangladesh University of Engineering and
Technology (BUET) in 2011. He has been actively engaged in the field since 2012 by publishing over
70 articles and gaining over 5000 citations of his works. He serves as an Editorial Board Member at
Energies (MDPI). He also has peer-reviewed over 250 WOS-indexed journals throughout his career.
vii

energies
Editorial
Energy for Sustainable Future
T. M. Indra Mahlia * and I. M. Rizwanul Fattah *
���������������
Citation: Mahlia, T.M.I.; Fattah,
I.M.R. Energy for Sustainable Future.
Energies 2021, 14, 7962. https://
doi.org/10.3390/en14237962
Received: 22 November 2021
Accepted: 23 November 2021
Published: 29 November 2021
Publisher’s Note: MDPI stays neutral
with regard to jurisdictional claims in
published maps and institutional affil-
iations.
Copyright: © 2021 by the authors.
Licensee MDPI, Basel, Switzerland.
This article is an open access article
distributed under the terms and
conditions of the Creative Commons
Attribution (CC BY) license (https://
creativecommons.org/licenses/by/
4.0/).
Centre for Green Technology, Faculty of Engineering and I.T., University of Technology Sydney,Ultimo, NSW 2007, Australia* Correspondence: [email protected] (T.M.I.M.); [email protected] (I.M.R.F.)
Energy and the environment are interrelated, and they are critical factors that influencethe development of societies. The pollution of the environment, without consideringvarious consequences, has become one of the most important global issues today. Thisenvironmental pollution is mainly the result of increases in economic activities, population,transportation, electricity generation, agriculture, forestry, and land use. The exigency ofenergy for these activities, the rapidly rising price of petroleum oil, the harmful effect ofgreenhouse gases, and the quest for energy security have steered our attention towardssustainable sources of energy. It is fundamental to find innovative solutions that aresustainable from the perspective of energy management and environmental protection.These solutions will provide a promising future in terms of energy sources meeting energydemand, together with maintaining the environment.
This book includes three review articles, which review the state-of-the-art of differentsustainable energy resources. These articles include ammonia as a renewable energycarrier [1], integration of solar photovoltaic [2], and bio-oil from waste tires for automotiveengine applications [3]. In addition, eight research studies reveal new knowledge aboutenergy for a sustainable future. The topics covered span many diverse areas associatedwith sustainable energy, including various biofuels [4,5], photovoltaic [6], and other aspectsof sustainability [7–11]. These complementary contributions provide a substantial body ofknowledge in the field of renewable and sustainable energy.
We would like to thank the academic and managing editors, as well as the reviewers,for their efforts and input. We enjoyed editing the papers for this collection.
Author Contributions: Writing—original draft preparation, I.M.R.F.; writing—review and edit-ing, T.M.I.M.; supervision, T.M.I.M. All authors have read and agreed to the published version ofthe manuscript.
Funding: This research received no external funding.
Institutional Review Board Statement: Not applicable.
Informed Consent Statement: Not applicable.
Conflicts of Interest: The author declares no conflict of interest.
Energies 2021, 14, 7962. https://doi.org/10.3390/en14237962 https://www.mdpi.com/journal/energies
1

Energies 2021, 14, 7962
References
1. Hasan, M.H.; Mahlia, T.M.I.; Mofijur, M.; Rizwanul Fattah, I.M.; Handayani, F.; Ong, H.C.; Silitonga, A.S. A ComprehensiveReview on the Recent Development of Ammonia as a Renewable Energy Carrier. Energies 2021, 14, 3732. [CrossRef]
2. Samoita, D.; Nzila, C.; Østergaard, P.A.; Remmen, A. Barriers and Solutions for Increasing the Integration of Solar Photovoltaic inKenya’s Electricity Mix. Energies 2020, 13, 5502. [CrossRef]
3. Jahirul, M.I.; Hossain, F.M.; Rasul, M.G.; Chowdhury, A.A. A Review on the Thermochemical Recycling of Waste Tyres to Oil forAutomobile Engine Application. Energies 2021, 14, 3837. [CrossRef]
4. Pourzolfaghar, H.; Abnisa, F.; Wan Daud, W.M.A.; Aroua, M.K.; Mahlia, T.M.I. Catalyst Characteristics and Performance ofSilica-Supported Zinc for Hydrodeoxygenation of Phenol. Energies 2020, 13, 2802. [CrossRef]
5. Ong, M.Y.; Nomanbhay, S.; Kusumo, F.; Raja Shahruzzaman, R.M.H.; Shamsuddin, A.H. Modeling and Optimization ofMicrowave-Based Bio-Jet Fuel from Coconut Oil: Investigation of Response Surface Methodology (RSM) and Artificial NeuralNetwork Methodology (ANN). Energies 2021, 14, 295. [CrossRef]
6. Dumlao, S.M.G.; Ishihara, K.N. Weather-Driven Scenario Analysis for Decommissioning Coal Power Plants in High PV PenetrationGrids. Energies 2021, 14, 2389. [CrossRef]
7. Hassan, O.; Morse, S.; Leach, M. The Energy Lock-In Effect of Solar Home Systems: A Case Study in Rural Nigeria. Energies 2020,13, 6682. [CrossRef]
8. Jadim, R.; Kans, M.; Schulte, J.; Alhattab, M.; Alhendi, M.; Bushehry, A. On Approaching Relevant Cost-Effective SustainableMaintenance of Mineral Oil-Filled Electrical Transformers. Energies 2021, 14, 3670. [CrossRef]
9. Jasinski, R.; Galant-Gołebiewska, M.; Nowak, M.; Ginter, M.; Kurzawska, P.; Kurtyka, K.; Maciejewska, M. Case Study of Pollutionwith Particulate Matter in Selected Locations of Polish Cities. Energies 2021, 14, 2529. [CrossRef]
10. Sofyan, S.E.; Hu, E.; Kotousov, A.; Riayatsyah, T.M.I.; Thaib, R. Mathematical Modelling and Operational Analysis of CombinedVertical–Horizontal Heat Exchanger for Shallow Geothermal Energy Application in Cooling Mode. Energies 2020, 13, 6598.[CrossRef]
11. Yudha, S.W.; Tjahjono, B.; Longhurst, P. Stakeholders’ Recount on the Dynamics of Indonesia’s Renewable Energy Sector. Energies2021, 14, 2762. [CrossRef]
2

energies
Review
A Comprehensive Review on the Recent Development ofAmmonia as a Renewable Energy Carrier
Muhammad Heikal Hasan 1,*, Teuku Meurah Indra Mahlia 1,*, M. Mofijur 1, I.M. Rizwanul Fattah 1,
Fitri Handayani 2, Hwai Chyuan Ong 1 and A. S. Silitonga 3
���������������
Citation: Hasan, M.H.; Mahlia,
T.M.I.; Mofijur, M.; Rizwanul Fattah,
I.M.; Handayani, F.; Ong, H.C.;
Silitonga, A.S. A Comprehensive
Review on the Recent Development
of Ammonia as a Renewable Energy
Carrier. Energies 2021, 14, 3732.
https://doi.org/10.3390/en14133732
Academic Editor: Rob J.M. Bastiaans
Received: 30 April 2021
Accepted: 16 June 2021
Published: 22 June 2021
Publisher’s Note: MDPI stays neutral
with regard to jurisdictional claims in
published maps and institutional affil-
iations.
Copyright: © 2021 by the authors.
Licensee MDPI, Basel, Switzerland.
This article is an open access article
distributed under the terms and
conditions of the Creative Commons
Attribution (CC BY) license (https://
creativecommons.org/licenses/by/
4.0/).
1 Centre for Green Technology, Faculty of Engineering and IT, University of Technology Sydney,Sydney, NSW 2007, Australia; [email protected] (M.M.);[email protected] (I.M.R.F.); [email protected] (H.C.O.)
2 Department of Mechanical Engineering, Syiah Kuala University, Banda Aceh 23111, Indonesia;[email protected]
3 Department of Mechanical Engineering, Politeknik Negeri Medan, Medan 20155, Indonesia;[email protected]
* Correspondence: [email protected] (M.H.H.); [email protected](T.M.I.M.); Tel.: +61-4123-08541 (M.H.H.); +61-2951-490571 (T.M.I.M.)
Abstract: Global energy sources are being transformed from hydrocarbon-based energy sources torenewable and carbon-free energy sources such as wind, solar and hydrogen. The biggest challengewith hydrogen as a renewable energy carrier is the storage and delivery system’s complexity. There-fore, other media such as ammonia for indirect storage are now being considered. Research hasshown that at reasonable pressures, ammonia is easily contained as a liquid. In this form, energydensity is approximately half of that of gasoline and ten times more than batteries. Ammonia canprovide effective storage of renewable energy through its existing storage and distribution network.In this article, we aimed to analyse the previous studies and the current research on the prepara-tion of ammonia as a next-generation renewable energy carrier. The study focuses on technicaladvances emerging in ammonia synthesis technologies, such as photocatalysis, electrocatalysis andplasmacatalysis. Ammonia is now also strongly regarded as fuel in the transport, industrial andpower sectors and is relatively more versatile in reducing CO2 emissions. Therefore, the utilisation ofammonia as a renewable energy carrier plays a significant role in reducing GHG emissions. Finally,the simplicity of ammonia processing, transport and use makes it an appealing choice for the linkbetween the development of renewable energy and demand.
Keywords: ammonia; renewable energy storage; hydrogen storage
1. Introduction
Industrial activity in parts of the world often has several direct and indirect adverseenvironmental consequences. Carbon dioxide (CO2), a natural greenhouse gas (GHG)that helps keep the globe warm, is out of control and triggering a climate crisis. Thisanthropogenic emission endangers human health, agriculture, natural ecosystems andatmospheric stability [1]. As reported in the Intergovernmental Panel on Climate Change(IPCC) Climate Change Mitigation Report (2014), CO2 is the main contributor to GHGemissions, which have 76% (including 11% of forests and land use) of the overall share,while CH4 and N2O accounted for 16% and 6%, respectively [2]. According to NationalOceanic and Atmospheric Administration (NOAA), global ambient CO2 concentrationsrose from 280 ppm to 407.4 ppm in 2018, setting a new high for the last 800,000 years [3,4].
A growing number of international reports illustrates the health and environmentaleffects of GHG emissions [5–7]. The ultimate goal is to maintain GHG concentrationsat a point where the dangerous effect of climate change can be prevented. In 1997, theconvention was supplemented and updated by the Kyoto Protocol [8]. Unlike the United
Energies 2021, 14, 3732. https://doi.org/10.3390/en14133732 https://www.mdpi.com/journal/energies
3

Energies 2021, 14, 3732
Nations Framework Convention on Climate Change (UNFCCC), the Kyoto Protocol bindsparties from a developed country to reduce GHG emissions [9]. Recently, under the termsof the Paris Agreement of 2015, the United Nations (UN) has committed itself to a long-termtarget to keep temperatures below 2 ◦C, compared to pre-industrial levels, to avoid theworst consequences of global warming [10,11]. Figure 1 shows the top 10 countries on CO2emissions worldwide and their goal in the Paris Agreement.
In the last decades, the world has put great effort and investment into developingrenewable energy to decarbonise the economy. The global pandemic disruption caused byCOVID-19 teaches humanity that reducing the proportion of fossil fuels in human activitywill substantially increase the regeneration of the Earth’s atmosphere due to a reductionin air pollution. For example, in China, restricting the activity of people caused by theCOVID-19 pandemic resulted in a 25% and 50% reduction in CO2 and NOX emissions,respectively [12,13]. However, the problem with these renewable sources of energy isthat they are highly weather-dependent. Therefore, it is necessary to have an affordableand efficient method for storing energy. Several prevailing storage technologies, such aschemical, mechanical, electrical and thermal energy storages, can be applied from small tolarge-scale applications. Prominent storage solutions, such as batteries, provide durabilityand technological sophistication but are far too expensive and cannot provide the powerneeded for seasonal and grid-scale demand. Consequently, hydrogen has been the bestcandidate since the 1970s, positioning this as both energy storage and a clean energysource [14]. However, storage and delivery issues associated with H2 remain an obstacleto its implementation [15]. To store and distribute H2 efficiently, other indirect storagemedia such as ammonia (NH3), with its proven transportability and high flexibility, isrequired [16].
Figure 1. Top 10 global CO2 emitters and the target in the Paris Agreement [17].
In some countries, ammonia has become a part of their energy roadmap. For ex-ample, Japan’s Cross-Ministerial Strategic Innovation Program (SIP) attempts to showammonia, hydrides and hydrogen as essential elements of the nation’s hydrogen energysystem [18]. The Japanese Ministry of Economy, Trade and Industry (METI) describedammonia in conjunction with “the concept of importing renewable energy produced inother countries” [19]. In the United States, The Advanced Research Projects Agency-Energy(ARPA-E) announced a cumulative grant of $32.7 million for 16 projects, 13 of which focuson ammonia [16]. Governments in New Zealand and Australia have announced federalgrants to support the development of ammonia plants driven by renewable energy. Morerecently, Australia has awarded Yara and ENGIE AU$995,000 for their solar ammoniaproject, Yara Pilbara, from the Australian Renewable Energy Agency (ARENA). As forNew Zealand, Ballance-Agri Nutrients and Hiringa Energy received NZ$19.9 million from
4
Energies 2021, 14, 3732
the Provincial Growth Fund for their wind-fed ammonia plant in Kapuni [20]. Similarlyto Japan, the country is also looking into the possibility of exporting renewable energy inthe form of ammonia. In addition, Toyota and Commonwealth Scientific and IndustrialResearch Organization (CSIRO) designed the first ammonia fuel car tested in Australia in2018 [21].
Today, with a global production rate of more than 176 million metric tonnes of ammo-nia, the chemical is being used as fertiliser and a building block in the manufacture of manyproducts [22,23]. With 28.5% of global production, China is known as the main producer ofammonia [24]. The uses of ammonia as an intermediate for the production of fertilisersaccount for over 80% of the total production of ammonia [25]. Other applications includefibre and plastics, pharmaceuticals, mining and metallurgy, pulp and paper, refrigerationand explosives [26]. Other than that, ammonia has also being recently proposed to be usedin automotive applications for NOx emission control (DeNOx) technologies [27]. Further-more, ammonia has also been researched as a source of energy for fuel cells, transport,industry and power generation [28].
Unfortunately, the current industrial ammonia synthesis method is complicated,energy-intensive and heavily dependent on hydrocarbon. The Haber–Bosch process that iscurrently used to synthesise ammonia is responsible for almost 11% of global industrialCO2 emissions [29,30]. In addition, the nature of renewable energy sources, which areirregular, requires turnkey systems that can be instantly switched on and off [31]. Thus, thechallenge for the global deployment of ammonia as energy storage is, therefore, the simplerand more efficient production of ammonia from abundant sources, such as ambient air andwater, with a ready to go system, which can be driven by intermittent energy sources.
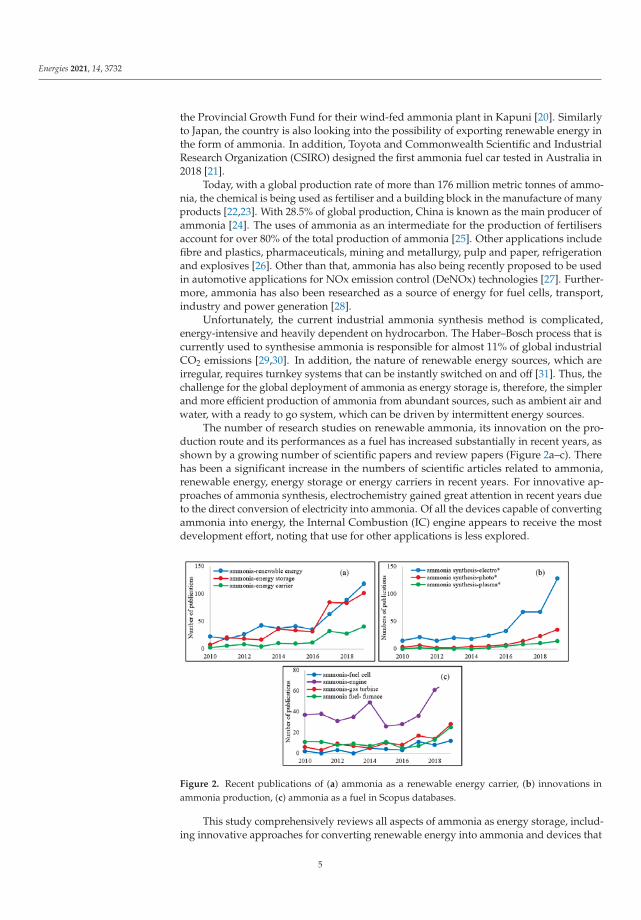
The number of research studies on renewable ammonia, its innovation on the pro-duction route and its performances as a fuel has increased substantially in recent years, asshown by a growing number of scientific papers and review papers (Figure 2a–c). Therehas been a significant increase in the numbers of scientific articles related to ammonia,renewable energy, energy storage or energy carriers in recent years. For innovative ap-proaches of ammonia synthesis, electrochemistry gained great attention in recent years dueto the direct conversion of electricity into ammonia. Of all the devices capable of convertingammonia into energy, the Internal Combustion (IC) engine appears to receive the mostdevelopment effort, noting that use for other applications is less explored.
Figure 2. Recent publications of (a) ammonia as a renewable energy carrier, (b) innovations inammonia production, (c) ammonia as a fuel in Scopus databases.
This study comprehensively reviews all aspects of ammonia as energy storage, includ-ing innovative approaches for converting renewable energy into ammonia and devices that
5
Energies 2021, 14, 3732
convert ammonia into energy. The comparison of the recent review article of ammonia asrenewable energy and this work is given in Table 1.
Table 1. The comparison of recent review articles on ammonia as a renewable energy carrier and this work.
Category [16] [32] [33] [34] [35] [36] [37] This Work
Ammonia economy√
- - -√
-√ √
Photocatalysis - - - - - - -√
Electrocatalysis -√ √ √
-√
-√
Plasmacatalysis - -√
- -√
-√
Fuel cell√
- - -√
-√ √
IC engine√
- - -√
- -√
Gas turbine√
- - -√
- -√
2. Key-Driver of Ammonia Economy
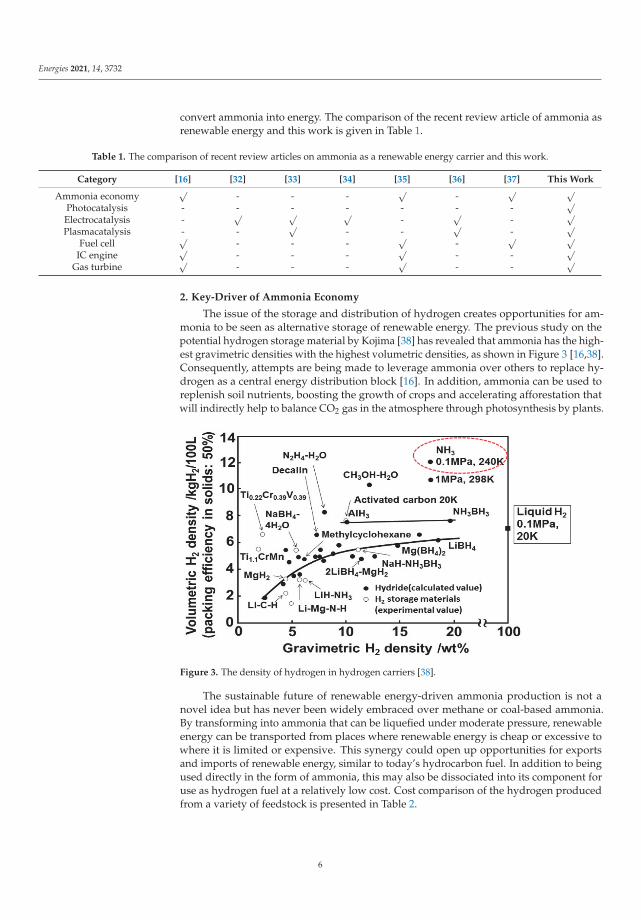
The issue of the storage and distribution of hydrogen creates opportunities for am-monia to be seen as alternative storage of renewable energy. The previous study on thepotential hydrogen storage material by Kojima [38] has revealed that ammonia has the high-est gravimetric densities with the highest volumetric densities, as shown in Figure 3 [16,38].Consequently, attempts are being made to leverage ammonia over others to replace hy-drogen as a central energy distribution block [16]. In addition, ammonia can be used toreplenish soil nutrients, boosting the growth of crops and accelerating afforestation thatwill indirectly help to balance CO2 gas in the atmosphere through photosynthesis by plants.
Figure 3. The density of hydrogen in hydrogen carriers [38].
The sustainable future of renewable energy-driven ammonia production is not anovel idea but has never been widely embraced over methane or coal-based ammonia.By transforming into ammonia that can be liquefied under moderate pressure, renewableenergy can be transported from places where renewable energy is cheap or excessive towhere it is limited or expensive. This synergy could open up opportunities for exportsand imports of renewable energy, similar to today’s hydrocarbon fuel. In addition to beingused directly in the form of ammonia, this may also be dissociated into its component foruse as hydrogen fuel at a relatively low cost. Cost comparison of the hydrogen producedfrom a variety of feedstock is presented in Table 2.
6

Energies 2021, 14, 3732
Table 2. Cost comparison of hydrogen production via various feedstock [39–43].
Method Electricity SourceHydrogen Production
(kg/day)Hydrogen Cost ($/kg)
Water electrolysis Wind 1400–62,950 5.10–23.37Solar PV 1356 10.49
Solar Thermal 1000 7.00Nuclear 1000 4.15
Thermochemical water splitting Solar 6000 7.98–8.40Nuclear 7000–800,000 2.17–2.63
Natural Gas steam reforming With carbon capture storage - 2.27Without carbon capture storage - 2.08
Coal gasification With carbon capture storage - 1.63Without carbon capture storage - 1.34
Biomass gasification - - 1.77–2.05
In addition to the aforementioned factors, ammonia transportation and storage fa-cilities already exist today, where around 18 million tonnes of ammonia are exchangedannually. Unlike hydrogen that cannot be liquefied under a pressurised tank, ammoniamay be kept in liquid form when at least 8.58 bar is maintained. Under this load, carbonsteel tanks are sufficient to be used. Ammonia may also be contained as a liquid in lowertemperature storage if the temperature of −33 ◦C is preserved while hydrogen only can beliquefied under cryogenic cooling at −252.87 ◦C. The energy density in this form is roughlyhalf that of petrol and more than ten times that of batteries. Ammonia also offers a muchlower storage cost compared to hydrogen. Commonly, long-distance ammonia transport isaccomplished by using carbon steel pipelines that are opposed to hydrogen, which nowstill has material issues with the pipeline. For transporting ammonia via pipeline over1610 km, it requires 1119 kJ/kg-H2, which is much lower than that of hydrogen transportof 14,814 kJ/kg-H2. This disparity can be described by the state of the two fluids wherehydrogen gas is distributed with the aid of compressors while the ammonia is carried as aliquid using a pump. The comparison between ammonia and hydrogen is given in Table 3.
Table 3. Difference between NH3 and H2 in terms of storage and distribution [39,44,45].
Parameter Ammonia Hydrogen Hydrogen
Storage method Liquid Compressed LiquidStorage pressure (MPa) 1.1 70 -
Liquefy temperature (◦C) −33 - −252.87Fuel density (kg m−3) 600 39.1 70.99
Storage cost over 182 days ($/kg-H2) 0.54 - 14.95Transporting over 1610 km pipeline
(kJ/kg-H2) 1119 14,814 -
Ammonia also can be transported as a pressurised liquid via truck and rail. Trailerscan transport 43,530 L ammonia at 2.07 MPa. Such a tank could hold up to 26 tonnesor 600 GJ of energy of ammonia [46]. In contrast, a hydrogen lorry only can be used totransport around 340 kg of hydrogen gas at 17.91 MPa, equivalent to 48 GJ of hydrogenenergy content, while transporting in liquid form in a hydrogen trailer could hold around3.9 tonnes of hydrogen, equal to 553 GJ of energy [47]. Rail transport uses a pressurised tankwith a capacity of 126,810 L at 1.55 MPa, which indicates the capability to carry 77.5 tonnesof NH3 [46]. Ammonia can be transported by ship or barge using pressurised storagevessels. By using these vessels, existing ocean-going ships can transport 55,000 tonnes ofammonia [48]. The NH3 and H2 transport methods are summarised in Table 4.
7
Energies 2021, 14, 3732
Table 4. Differences in NH3 and H2 transport methods [44].
ParameterAmmonia Hydrogen
Truck Rail Ship Truck Truck
Storage method Liquid Liquid Liquid Compressed LiquidStorage pressure (MPa) 2.07 1.55 - 17.91 -
Capacity (tonnes) 26 77.5 55,000 0.34 3.9Energy capacity (GJ-HHV) 600 1746 1,240,000 48 553
Note: HHV (higher heating value).
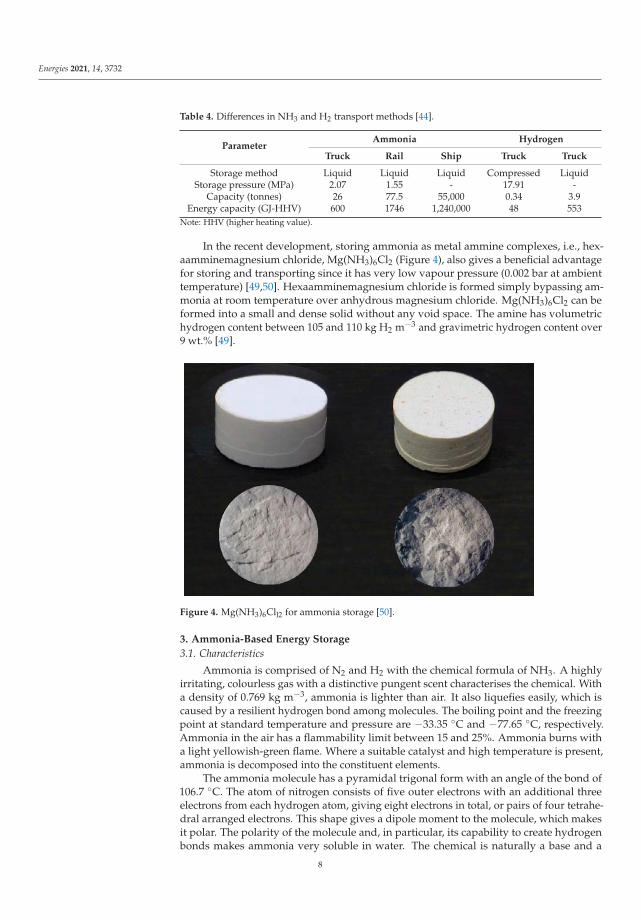
In the recent development, storing ammonia as metal ammine complexes, i.e., hex-aamminemagnesium chloride, Mg(NH3)6Cl2 (Figure 4), also gives a beneficial advantagefor storing and transporting since it has very low vapour pressure (0.002 bar at ambienttemperature) [49,50]. Hexaamminemagnesium chloride is formed simply bypassing am-monia at room temperature over anhydrous magnesium chloride. Mg(NH3)6Cl2 can beformed into a small and dense solid without any void space. The amine has volumetrichydrogen content between 105 and 110 kg H2 m−3 and gravimetric hydrogen content over9 wt.% [49].
Figure 4. Mg(NH3)6Cll2 for ammonia storage [50].
3. Ammonia-Based Energy Storage
3.1. Characteristics
Ammonia is comprised of N2 and H2 with the chemical formula of NH3. A highlyirritating, colourless gas with a distinctive pungent scent characterises the chemical. Witha density of 0.769 kg m−3, ammonia is lighter than air. It also liquefies easily, which iscaused by a resilient hydrogen bond among molecules. The boiling point and the freezingpoint at standard temperature and pressure are −33.35 ◦C and −77.65 ◦C, respectively.Ammonia in the air has a flammability limit between 15 and 25%. Ammonia burns witha light yellowish-green flame. Where a suitable catalyst and high temperature is present,ammonia is decomposed into the constituent elements.
The ammonia molecule has a pyramidal trigonal form with an angle of the bond of106.7 ◦C. The atom of nitrogen consists of five outer electrons with an additional threeelectrons from each hydrogen atom, giving eight electrons in total, or pairs of four tetrahe-dral arranged electrons. This shape gives a dipole moment to the molecule, which makesit polar. The polarity of the molecule and, in particular, its capability to create hydrogenbonds makes ammonia very soluble in water. The chemical is naturally a base and a
8

Energies 2021, 14, 3732
proton acceptor. Ammonia aqueous solution with a concentration 1.0 M has a pH of 11.6at 298 K [51]. Even though accidental explosion or combustion is relatively low [16], theUS-National Fire Protection Association (NFPA) has identified this as a hazardous material,putting it at high safety risk [52]. Safety concerns regarding ammonia storage for end-usersarise due to the high vapour pressure of liquid ammonia. At high temperatures, ammoniacan decompose, forming highly flammable hydrogen and toxic nitrogen oxide. Ammoniais also known to be corrosive with certain alloys such as copper, brass and bronze, aspresented in Table 5.
Table 5. Material compatibility of ammonia and its derivative [16,53–55].
MaterialsAmmonium Hydroxide
(Ammonia in Water)Ammonia Anhydrous
ABS plastic - DAcetal (Delrin ®) D D
Aluminium C ABrass - D
Bronze - DBuna N (Nitrile) D BCarbon graphite - A
Carbon steel D BCarpenter 20 - A
Cast iron D AChemRaz (FFKM) - B
Cooper - DCPVC - AEPDM A AEpoxy - A
Fluorocarbon (FKM) B DHastelloy-C ® B B
Hypalon ® A DHytrel ® - DKalrez - AKel-F ® - ALDPE - B
Leather DNatural rubber - D
Neoprene B ANORYL ® - B
Nylon C APolycarbonate - D
PEEK - APolypropylene A APolyurethane - DPPS (Ryton ®) - A
PTFE A APVC - A
PVDF (Kynar ®) A ASantropene A A
Silicone - CStainless Steel 304 B AStainless Steel 316 A A
Titanium - CTygon ® - AViton ® - D
Note: A (excellent); B (good); C (fair); D (poor).
Ammonia is also fatal if inhaled, causing a lung injury. Some people may be somewhatirritated by 30 ppm for 10 min, while the remainder is sensitive to 50 ppm. At 500 ppm,the nose and throat get immediate and severe irritation. Short exposure to levels over
9

Energies 2021, 14, 3732
1500 ppm can lead to fluid accumulation in the lungs [56]. Immediately Dangerous to Lifeand Health (IDLH) is the degree whereby a healthy person can get 30 min of exposurewithout causing permanent health effects. Ammonia is also believed to be responsible forthe depletion of ozone by an accumulation of nitrous compounds in the atmosphere [57].Table 6 summarises the Health and Safety data, including their vapour pressure, IDLHand toxicity.
Table 6. Health and Safety data of ammonia and its derivatives [58–60].
CarriersVP at 20 ◦C
(Bar)IDLH(ppm)
AT 20 ◦C(IDLH−1)
35 wt.% NH3 solution 1.24 - ~4133NH3 (liquid) 8 300 ~27,000Mg(NH3)6Cl2 1.4 × 10⁻³ - 4.65
Note: VP (vapour pressure); AT (apparent toxicity).
3.2. Ammonia production Using Haber–Bosch Method
Fritz Haber and Carl Bosch invented the Haber–Bosch (H–B) process in the middle ofthe 20th century, replacing the Birkeland–Eyde process and Frank–Caro process to synthe-sise ammonia [37]. Since its discovery, the Haber–Bosch process dominating the industrialprocess and has undergone many substantial improvements and optimisations. The min-imum energy consumption in the mid-1950s is reduced from more than 60 GJ tNH3
−1 to27.4–31.8 GJ tNH3
−1 today [61]. Such improvements represent an improvement in overallenergy efficiency from 36 to 65%. The most significant increase in productivity was madeby replacing coal with CH4 to produce H2.
In short, the production cycle of ammonia can be broken down into two major phases;the first is synthetic mixture production, and the subsequent is the synthesis of ammoniasynthesis by the H–B process. In the first phase, hydrogen production takes place viatwo-stage steam methane reforming (SMR) reactors before being transferred for water-gas-shifting (WGS) reaction, CO2 subtraction and then methanation [61]. The primary SMRreactor works at 850–900 ◦C and 25–35 bar that travels through the catalyst. In this process,the energy needed for the endothermal reactions generated by the external combustion ofmethane fuel through the furnace [61]. Water-saturated methane is then fed into a catalyticconverter that converts methane to hydrogen and carbon monoxide before it is transferredto a second SMR. In the secondary SMR, ambient air is compressed and transferred at900–1000 ◦C to partially oxidise reagents in the next reactor. In this process, air–oxygen andsteam convert unreacted methane into hydrogen and carbon monoxide, besides providingthe stoichiometric nitrogen required for Haber–Bosch downstream reactions [58].
The next process involves converting carbon monoxide to carbon dioxide by steaminjection in the WGS reactor to prevent coke from forming on the catalyst and side reactions.The feed is then sent to a CO2 remover column, giving a nitrogen and hydrogen-rich feedwith high purity for the next process [61]. The ammonia production then takes place onHaber–Bosch reactor when the process is usually performed in a reactor with two to fourcatalytic converter beds at 200 to 350 bar and 300 to 500 ◦C [58]. Since the process haslow single-pass conversion efficiency (~15%), it is necessary to recycle the unreacted gas.The nitrogen fixation process for ammonia and the reaction process that occurs during theHaber–Bosch process is shown below:
N2+3H2 → 2NH3 ΔH298K= −92 kJ mol−1 (1)
CH4+H2O → CO + 3H2 (Primary Steam Reforming) (2)
4CH4+O2+2H2O → 10H2+4CO (Secondary Steam Reforming) (3)
CO + H2O → CO2+H2 (Water − gas shift) (4)
10

Energies 2021, 14, 3732
3.3. Electrically-Driven Haber–Bosch Process
Notwithstanding the technological reliability of the existing Haber–Bosch process, thequestion remains as to whether or not such a process can be CO2-free. To answer thesequestions, research and development are underway worldwide to substitute the centuries-old Haber–Bosch method for the production of ammonia, driven by renewable electricity.It includes switching H2 obtained from the steam-reformed CH4 to H2 obtained from theelectrolysed H2O. Given the trend in renewable energy prices to compete with fossil fuels,the green Haber–Bosch process is no longer a vision. Figure 5 shows the electrically drivenHaber–Bosch plant powered by renewable energy.
Figure 5. Schematic of renewable energy-driven Haber–Bosch plant [62].
Ammonia synthesis processes powered by renewable energy have been demonstratedin many countries. For example, in the USA, Schmuecker Pinehurst Farm LLC has built asolar ammonia plant and has been in operation for many years where H2 and N2 are gener-ated from water and air by electrolysis and power swing system before pressurised andfed into the ammonia production facility [63]. In Zimbabwe, Africa, an ammonium nitrateplant was developed where ammonia is supplied from renewable energy-driven Haber–Bosch process. This production facility has been productive for years, with 240,000 tonnesof ammonium nitrate produced annually [64]. In Australia, several projects have beendeveloped near Yara Pilbara, Western Australia [65] and Port Lincoln, South Australia [66]to evaluate the feasibility of renewable energy-driven ammonia plants. At the same timeas optimisation of the renewable energy-driven Haber–Bosch process, the development ofalternative methods to allow the N2 reduction reaction at atmospheric pressure and moder-ate ambient temperature, such as photocatalysis, electrocatalysis and plasmacatalysis hasattracted widespread interest in ammonia synthesis today.
4. Innovative Approaches for Ammonia Synthesis
In the absence of high temperatures and pressures, nature converts molecular N2to NH3. This natural process uses enzyme nitrogenises containing metal ions (iron andmolybdenum) to induce ammonia reactions from atmospheric nitrogen, electrons andprotons. This phenomenon has aroused the researcher’s interest in imitating nature.
In recent times, significant progress in understanding the process for nitrogenisesreactions and in creating a modern synthetic method has been achieved. Photocatalysis,plasmacatalysis and electrocatalysis have been studied as alternative green routes forammonia production. These new techniques offer distinct advantages compared to the oldHaber–Bosch method.
Among those, the plasma-enabled ammonia synthesis is both energy and cost-effectivein theory. The potential energy consumption of non-thermal plasma (NTP) ammonia
11
Energies 2021, 14, 3732
production has been reported to be around 0.2 MJ/mol, which is lower than the Haber–Bosch technique (0.48 MJ/mol) [67]. This section details the method and provides adiscussion on emerging technology for facilitating the N2 reduction reaction to ammonia.
4.1. Photocatalysis
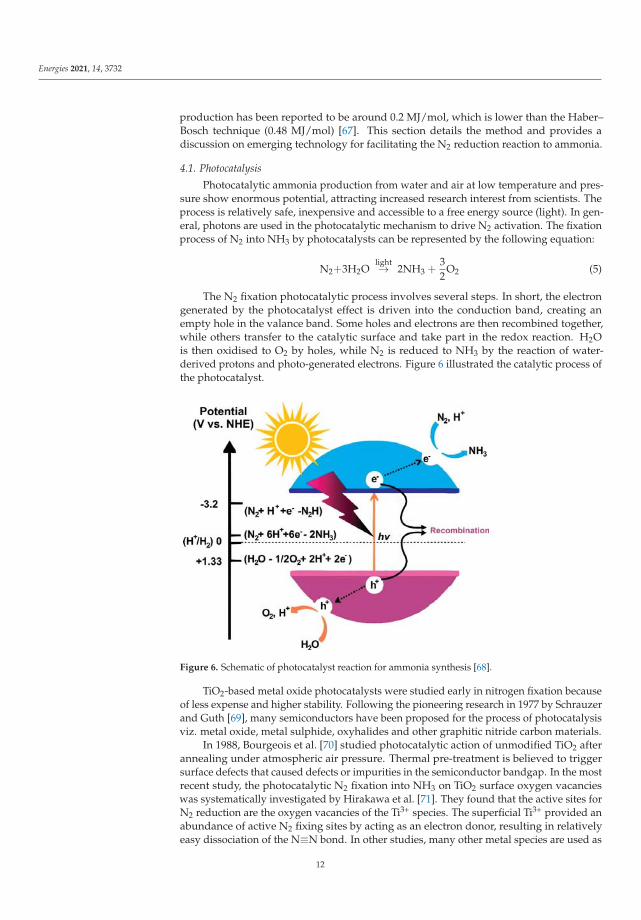
Photocatalytic ammonia production from water and air at low temperature and pres-sure show enormous potential, attracting increased research interest from scientists. Theprocess is relatively safe, inexpensive and accessible to a free energy source (light). In gen-eral, photons are used in the photocatalytic mechanism to drive N2 activation. The fixationprocess of N2 into NH3 by photocatalysts can be represented by the following equation:
N2+3H2Olight→ 2NH3 +
32
O2 (5)
The N2 fixation photocatalytic process involves several steps. In short, the electrongenerated by the photocatalyst effect is driven into the conduction band, creating anempty hole in the valance band. Some holes and electrons are then recombined together,while others transfer to the catalytic surface and take part in the redox reaction. H2Ois then oxidised to O2 by holes, while N2 is reduced to NH3 by the reaction of water-derived protons and photo-generated electrons. Figure 6 illustrated the catalytic process ofthe photocatalyst.
Figure 6. Schematic of photocatalyst reaction for ammonia synthesis [68].
TiO2-based metal oxide photocatalysts were studied early in nitrogen fixation becauseof less expense and higher stability. Following the pioneering research in 1977 by Schrauzerand Guth [69], many semiconductors have been proposed for the process of photocatalysisviz. metal oxide, metal sulphide, oxyhalides and other graphitic nitride carbon materials.
In 1988, Bourgeois et al. [70] studied photocatalytic action of unmodified TiO2 afterannealing under atmospheric air pressure. Thermal pre-treatment is believed to triggersurface defects that caused defects or impurities in the semiconductor bandgap. In the mostrecent study, the photocatalytic N2 fixation into NH3 on TiO2 surface oxygen vacancieswas systematically investigated by Hirakawa et al. [71]. They found that the active sites forN2 reduction are the oxygen vacancies of the Ti3+ species. The superficial Ti3+ provided anabundance of active N2 fixing sites by acting as an electron donor, resulting in relativelyeasy dissociation of the N≡N bond. In other studies, many other metal species are used as
12

Energies 2021, 14, 3732
doping in the TiO2 catalyst; however, the photocatalytic was unsatisfactory. The transitionmetal atoms loaded into TiO2 can function as co-catalysts while acting as a dopant in theTiO2 matrix. In addition, the Schottky junction formation on the semiconductor interfaceand the transition metal induces electrical fields and facilitates the separation of photo-induced electrons and holes.
In addition to metal doping, noble metals may also be embedded onto the surfaceof TiO2. Ranjit et al. [72], in 1996, compared four noble metals (Ru, Rh, Pd, Pt) as TiO2co-catalysts. They found Ru > Rh > Pd > Pt to be the order of photoactivity betweenmetals, which is closely related to the strength of the noble metals and the hydrogen bond.The experiment revealed that noble metals with higher barriers to H2 evolution exhibitsurprisingly higher NH3 yields.
The development of metal-doped TiO2 in N2 fixation sparked interest in the develop-ment of binary metal oxide and ternary metal oxides as doping. The study by Lashgariand Zeinalkhani [73], on the synthesis of Fe2O3 by precipitation method, found that theammonia is efficiently formed from N2 at Fe2O3 nanoparticles. It was also reported thatpartially reduced Fe2O3 may be used for the reduction of photocatalytic N2. More recently,bismuth monoxide (BiO) was employed for N2 photoreduction. It has been stated thatBiO quantum dots will significantly decrease N2 at 1226 μmol gcat−1h−1 NH3 with thesimulated rate of sunlight [74].
In addition to metal oxides, the study of metal sulphides in the field of photocatal-ysis has also seen a significant increase in the scientific community. The metal sulphideband gap is conducive to intense visible light absorption, resulting in highly effectivesolar use. As a result of the growing multidisciplinary research in biology and materialscience, organic-sulphide has also been developed as a catalyst for NH3 synthesis [68].Researchers questioned whether sulphur vacancies could effectively promote the photo-catalytic event. Motivated by this idea, Hu et al. [75] studied the sulphur vacancies effecton the efficiency of ternary metal sulphide for N2 fixation. Sulphur vacancies have beenfound to introduce surface chemical adsorption sites, which have helped to activate N2molecules by widening the bonding space from 1.164 Å to 1.213 Å. In the recent develop-ment, Cd0.5Zn0.5S solid solution loaded with Ni2P was effectively reduced N2 with theNH3 yield of 253.8 μmol gcat
−1 h−1 [76]. Other materials, such as Bismuth oxyhalides, arealso found to be promising photocatalysts due to their layered crystal structure and suitableband gaps [68,77].
Other than the material mentioned above, graphitic nitride carbon photocatalyst forN2 fixation has been designed and developed in recent years. Dong et al. [78] have shownthat introducing vacancies in nitrogen will dramatically boost the photocatalytic behaviourof g-C3N4. It was because the nitrogen vacancies, which had the size and forms as thenitrogen atoms, are advantageous for adsorbing and activating the chemically inert N2. Inanother study, honeycombed g-C3N4 doped with Fe3+ has shown enhanced photocatalyticperformance [79]. After that, various forms of photocatalysts based on g-C3N4 wereemployed in photochemical ammonia synthesis. A summary of various photochemicalcatalysts by previous studies is presented in Table 7.
Table 7. Recent studies on photochemical catalysis systems for ammonia production.
Groups Catalyst T (K) ScavengerCatalyst Loading
(g L−1)NH3 Yield
(μmolgcat−1h−1)
Ref
Metal oxides TiO2 500 - - 0.83 [70]0.4 wt.% Co-doped TiO2 313 - - 6.3 [69]0.4 wt% Cr-doped TiO2 313 - - 0.37 [69]0.4 wt% Mo-doped TiO2 313 - - 6.7 [69]2 wt% Mg-doped TiO2 - - 0.67 6.9 μM h−1 [80]0.5 wt% Fe-doped TiO2 353 - - 6 [81]10 wt% Ce-doped TiO2 - - 0.8 3.4 μM h−1 [82]10 wt% V-doped TiO2 - - 0.8 4.9 μM h−1 [82]
13

Energies 2021, 14, 3732
Table 7. Cont.
Groups Catalyst T (K) ScavengerCatalyst Loading
(g L−1)NH3 Yield
(μmolgcat−1h−1)
Ref
0.24 wt% Ru-loaded TiO2 - - - 17.3 [72]0.8 wt% Pt-loaded TiO2 - - - 4.8 [72]
0.69 wt% Pd-loaded TiO2 - - - 11.8 [72]0.2 wt% Rh-loaded TiO2 - - - 12.6 [72]0.2 wt% Fe-doped TiO2 313 - - 10 [69]
Fe-doped TiO2 298 Ethanol 1 400 μM h−1 [83]JRC-TIO-6 (rutile) 313 2-PrOH 1 2.5 μM h−1 [71]
Pt-loaded ZnO - Na-EDTA - 860 [84]Fe2O3 298 Ethanol 0.5 1362.5 μM h−1 [73]
Partially reduced Fe2O3 303 - - 10 [85]BiO quantum dots 298 - - 1226 [74]
H-Bi2MoO6 - - - 10 [86]Metal sulphides Zn0.1Sn0.1Cd0.8S 303 Ethanol 0.4 105.2 μM h−1 [75]
CdS/Pt 311 - - 3.26 [87]CdS/Pt/RuO2 - 4 620 μM h−1 [88]
MoS2 298 - - 325 [89]Mo0.1Ni0.1Cd0.8S 303 Ethanol 0.4 71.2 μM h−1 [90]
g-C3N4/ZnMoCdS 298 Ethanol 0.4 77.6 μM h−1 [91]g-C3N4/ZnSnCdS 303 Ethanol 0.4 167.6 μM h−1 [92]Ni2P/Cd0.5Zn0.5S 293 - - 253.8 [76]
Oxyhalides Bi5O7I 293 Methanol 0.5 111.5 μM h−1 [93]BiOCl 298 Methanol 0.67 46.2 μM h−1 [94]BiOBr 298 - 0.5 1042 μM h−1 [95]
Bi5O7Br nanotubes - - - 1380 [96]Graphitic
nitride carbon Fe-doped g-C3N4 303 Ethanol 0.4 120 μM h−1 [79]
g-C3N4 - Methanol 1 160 μM h−1 [78]g-C3N4/MgAlFeO 303 Ethanol 0.4 166.8 μM h−1 [97]
g-C3N4/rGO 303 Na-EDTA 0.4 206 μM h−1 [98]Ga2O3-DBD/g-C3N4 - Ethanol 0.4 112.5 μM h−1 [99]
W18O49/g-C3N4 - Ethanol 0.4 57.8 μM h−1 [100]
4.2. Electrocatalysis
In addition to photocatalysis, the synthesis of ammonia by the electrocatalysis processis also currently being explored. In a traditional proton-conductive electrolyte cell, gaseousH2 passes through the anode where it is changed to protons (H+) while the nitrogenreduction reaction occurs at the cathode [101]. The H+ then diffuses into the cathode, whereit forms NH3 in combination with the dissociated N. The following equations can describethe reaction:
3H2 → 6H++ 6e− (6)
N2+ 6H++ 6e− → 2NH3 (7)
N2 + 3H2 → 2NH3 (8)
The problem, though, is such cell configuration had to work at low temperatureswhere the kinetics of reaction were sluggish [102]. Moreover, an electrochemical cell is moreadvantageous when operating at higher temperatures since higher rates of reaction can beachieved in the same electrode area, and hydrazine development can be prevented [103].As a result, proton (H+) conductivity solid-state materials that operate at a temperatureabove 500 ◦C were developed [102].
Based on the working temperature, electrocatalytic ammonia synthesis can be brokendown into high (higher than 500 ◦C), intermediate (between 100 ◦C and 500 ◦C) and low(lower than 100 ◦C) [36]. In the high-temperature electrocatalysis process, most of thestudies occupy solid electrolytes with perovskite as the material in reactor configuration.
14
Energies 2021, 14, 3732
Among the studies, quite high ammonia rates were reported by Wang et al. [104,105]using doped Ceria-Ca3(PO4)2-K3PO4 composite electrolyte in combination with a Ag-Pdelectrode. Ammonia yields up to 9.5 × 10⁻⁹ mol s−1cm−2 can be achieved using N2/H2 asfeedstock and up to 6.95 × 10⁻⁹ mol s−1cm−2 using N2/natural gas. In 2009, the novel SolidState Ammonia Synthesis (SSAS) configuration using the Ag-Ru/MgO cathode developedby Skodra and Staukides [106] was able to directly use water as a source of hydrogen. Otherthan the configurations mentioned above, the oxygen-ion (O2−) conductor has also beenshown to be used for ammonia synthesis in SSAS where both processes of electrolysis andammonia synthesis occur at the cathode but have suffered very low ammonia productionrates [106,107].
In intermediate electrocatalysis processes with operating temperatures ranging from500 ◦C to 100 ◦C, molten salts are typically used as electrolytes. Murakami et al. [108]made the earliest study in this temperature range in 2003, using a molten salt mixtureelectrolyte and porous nickel as electrodes. Other sources of hydrogen, such as watersteam [109,110], hydrogen chloride [111], methane [112] and hydrogen sulphide [113],have also been tested. More recently, Licht et al. [114] used a similar configuration forthe experiment with NaOH/KOH as electrolyte and nickel as the electrode but added aFe2O3 nanoparticle catalyst to the molten salt. The maximum forming rate of ammonia1 × 10−8 mols−1cm−2 could be achieved by this setup, although it is much lower comparedto the works of Murakami’s group.
In low-temperature electrochemical ammonia synthesis below 100 ◦C, Nafion andSulfonate Polysulfone (SPSF) are commonly used as proton electrolyte conductors [103].Kordali et al. [115] in 1999 reported a novel configuration that could synthesise ammoniabelow 100 ◦C using a combination of the Nafion membrane and KOH solution. The anodewas Pt, while the anode was carbon cloth on which Ru had been deposited. The hydrogensource was either hydrogen gas or water. A summary of the selected electrochemicalsystem by previous studies is presented in Table 8.
Table 8. A summary of the selected electrocatalytic ammonia synthesis by previous studies.
Temperature Electrolyte Cathode/AnodeNH3 Yield
(×10−9 mol/s.cm2)FE(%)
Ref
High (T > 500 ◦C) SCY Pd 4.50 78 [116]BCN Ag-Pd 1.42 - [117]
BCZN Ag-Pd 1.82 - [117]BCNN Ag-Pd 2.16 - [117]
BCS Ag-Pd 5.23 - [118]BCGS Ag-Pd 5.82 - [118]BZCY Ni- BZCY/Rh 2.86 6.2 [119]LSGM Ag-Pd 2.37 70 [120]LCZ Ag-Pd 2.00 - [121]LCC Ag-Pd 1.30 - [121]LCZ Ag-Pd 1.76 80 [122]BCG Ag-Pd 3.09 - [123]BCY1 Ag-Pd 2.10 60 [124]BZCY Ni- BZCY/Cu 1.70 2.7 [125]BZCY Ni- BZCY/Cu 4.10 10 [125]
BCY2 − ZnO Ag-Pd 2.60 45 [126]CYO − Ca3(PO4)2/K3PO4 Ag-Pd 9.50 - [105]CYO − Ca3(PO4)2/K3PO4 Ag-Pd 6.95 - [104]
CSO Ag-Pd 7.20 - [127]CGO Ag-Pd 7.50 - [127]CYO Ag-Pd 7.70 - [127]CLO Ag-Pd 8.20 - [127]
LCGM Ag-Pd 1.63 47 [128]LSGM Ag-Pd 2.53 73 [128]LBGM Ag-Pd 2.04 60 [128]LBGM Ag-Pd 1.89 60 [129]
15

Energies 2021, 14, 3732
Table 8. Cont.
Temperature Electrolyte Cathode/AnodeNH3 Yield
(×10−9 mol/s.cm2)FE(%)
Ref
BCG2 Ag-Pd/Ni- BCG 5.00 70 [130]BCZS Ag-Pd 2.67 50 [131]BCC Ag-Pd 2.69 50 [132]
Intermediate(100 ◦C < T <
500 ◦C)(Li, Na, K)2CO3-CSO LSFC/Ni- CSO 5.39 7.5 [133]
LiCl-KCl-CsCl Porous Ni Plate 3.33 72 [108]LiCl-KCl-CsCl Al/Porous Ni Plate 33.3 72 [134]
LiCl-KCl-CsClPorous Ni
Plate/Baron-dopeddiamond
5.80 80 [111]
LiCl-KCl-CsCl Porous Ni Plate/Glassycarbon rod 20 23 [109]
NaOH/KOH/Nano-Fe2O3 Ni 10 35 [114]Na0.5K0.5OH/Nano-Fe2O3 Monel/Ni 16.2 76 [135]
NaOH-KOH molten salt (Fe2O3/AC)/Ni 8.27 13.7 [136]Low (T < 100 ◦C) Nafion SBCF/Ni-CSO 6.90 - [137]
Nafion SBCF/Ni-CSO 7.20 - [137]Nafion SBCC/Ni-CSO 8.70 - [137]Nafion Pt 3.13 2.2 [138]Nafion Pt 3.50 0.7 [138]Nafion Pt 1.14 0.55 [138]SPSF SSC/NiO−CSO 6.50 - [139]SPSF NiO−CSO 2.40 - [139]
Nafion SSN/NiO−CSO 10.5 - [140]SPSF SSN/NiO−CSO 10.3 - [141]
Nafion SFCN/NiO−CSO 11.3 90.4 [141]Nafion MOF (Fe)/Pt 2.12 1.43 [142]Nafion MOF (Co)/Pt 1.64 1.06 [142]Nafion MOF (Cu)/Pt 1.24 0.96 [142]Nafion MOF (Fe)/Pt 1.52 0.88 [142]Nafion Rh NNs/Carbon rod 6.24 0.7 [143]Nafion Carbon nanospikes/Pt 1.59 11.56 [144]
Note: SCY denotes ScCe0.95Yb0.05O3-α, BCN denotes Ba3(Ca1.18Nb1.82)O9-δ, BCZN denotes Ba3CaZr0.5Nb1.5O9−δ, BCNN denotesBa3Ca0.9Nd0.28Nb1.82O9−δ, BCS denotes BaCe0.9Sm0.1O3−δ, BCGS denotes BaCe0.8Gd0.1Sm0.1O3−δ, BZCY denotes BaZr0.7Ce0.2Y0.1O3−δ,LSGM denotes La0.9Sr0.1Ga0.8Mg0.2O3−α, LCZ denotes La1.95Ca0.05Zr2O7−δ, LCC denotes La1.95Ca0.05Ce2O7−δ, BCG1 denotesBaCe0.8Gd0.2O3−δ, BCY1 denotes BaCe0.85Y0.15O3−α, BCY2 denotes Ba0.98Ce0.8Y0.2O3−α, CYO denotes Ce0.8Y0.2O1.9, CSO de-notes Ce0.8Sm0.2O1.9, CGO denotes Ce0.8Gd0.2O1.9, CLO denotes Ce0.8La0.2O1.9, LCGM denotes La0.9Ca0.1Ga0.8Mg0.2O3−α, LSGMdenotes La0.9Sr0.1Ga0.8Mg0.2O3−α, LBGM denotes La0.9Ba0.1Ga0.8Mg0.2O3−α, BCG2 denotes BaCe0.85Gd0.15O3−α, BCZS denotesBaCe0.7Zr0.2Sm0.1O3−α, BCC denotes BaCe0.9Ca0.1O3−α, LSFC denotes La0.6Sr0.4Fe0.8Cu0.2O3−δ, SBCF denotes SmBaCuFeO5+δ, SBCCdenotes SmBaCuCoO5+δ, SSC denotes Sm0.5Sr0.5CoO3−δ, SSN denotes Sm1.5Sr0.5NiO4, SFCN denotes SmFe0.7Cu0.1Ni0.2O3.
4.3. Plasmacatalysis
The plasmacatalysis process was described as a possible alternative to many chemicals’high-temperature and pressure synthesis systems. In addition to positive and negativeions, plasma often contains a large number of neutral particles, such as atoms, molecules,radicals and excited particles, resulting in highly reactive physical and chemical reactionswhen used in chemical synthesis. The plasma’s ionised and excited species concentration isconsiderably higher than the traditional thermally heated gas phases. These properties can,therefore, benefit from attaining further effective interaction even without a catalyst [145].In the interaction of plasma and catalyst, plasma creates a more active spot yielding tohigher catalytic activity. When the beneficial effect of plasma and catalyst is combinedeffectively, it is likely to produce a much higher yield [146].
Depending on the thermal equilibrium or not, plasma could be classified into thermaland non-thermal plasma (NTP). The temperature of plasma, like that of any other gas, isdetermined by the average energies of the plasma particles (neutral and charged) and their
16
Energies 2021, 14, 3732
degrees of freedom (translational, rotational, vibrational and those related to electronicexcitation) [147,148]. Plasmas can thus exhibit multiple temperatures as a multi-componentsystem. In common electrical discharge for plasma generation, energy is transferred toheavy articles by collision with electron. In thermal plasma, electron and heavy particlesachieved thermal equilibrium due to joule heating. Joule heating or ohmic heating definethe process in which the energy of an electric current is converted into heat as it flowsthrough a resistance. The temperature of the gas in thermal plasma is extremely high,typically ranging from 4000 K to 20,000 K. On the other hand, non-thermal plasma ischaracterised by multiple different temperatures related to different plasma particles anddifferent degrees of freedom. In non-thermal plasma, thermal equilibrium between electronand heavy particles is not achieved, and the temperature of the NTP may be as low asroom temperature, although the electron, the excited and the ionised species have a hightemperature (Te >> T0) [147].
The temperature of the gas in thermal plasma is extremely high, typically rangingfrom 4000 K to 20,000 K and is equivalent to that of the electron, which has achieved athermodynamic equilibrium between the electron and other species. On the other hand,the temperature of the NTP may be as low as room temperature, although the electron,the excited and the ionised species have a high temperature. Since NTP offers less powerinput, this plasma is a more attractive option for chemical synthesis.
Many researchers have explored the mechanism of plasmacatalytic synthesis of am-monia since the 1900s. The first attempt to utilise plasma to synthesis ammonia can betraced back to 1929 when Brewer et al. [149] successfully synthesised ammonia using glowdischarge plasma and achieved an energy yield of 3.03 g-NH3/kWh. The system used wascomplex in that high voltage, vacuum and magnetic fields were applied. The magneticfield was reported to have no significant impact on the yield of ammonia. Since theseexperiments demonstrated the principle of using plasma to produce ammonia, researchershave begun to conduct detailed investigations into the process of plasma-assisted am-monia synthesis using other types of plasma. Table 9 summarises previous research onplasmacatalytic ammonia synthesis.
Table 9. Summary of previous research on plasma-chemical for ammonia synthesis.
Groups CatalystPressure
(Torr)H2/N2
Flow Rate(mL/min)
NH3 Yield(%)
Energy Yield(g-NH3/kWh)
Ref
GD - 3 3 - - 3.5 [149]Pt 50 3 833.3 2 - [150]Pt 50 3 833.3 7.9 - [151]Pt 7 2.5 - 8.1 0.12 [152]
MgCl2 10 3 - - - [153]Ag 5 0.6 78 80.8 - [154]
RF - 4.97 4 20 0.27 - [155]Fe 4.97 4 20 0.35 0.01 [156]Au 0.26 4 20 0.2 0.1 [157]
Ga-In 0.26 4 20 0.3 0.3 [158]Ni-MOF-74 0.26 4 20 0.23 0.23 [159]
MW Rh 2.25 0.56 7.5 11.25 0.01 [160]- 760 0.11 15,000 3.1 0.04 [161]
Co/Al2O3 760 1.167 120 0.112 0.01 [162]DBD Pd 760 3 - 3.13 - [163]
MgO 760 0.8 2266.7 0.33 - [164]- 760 3.56 730 1.36 1.83 [165]
Ru/alumina 760 3 40 4.36 0.37 [166]Ru/alumina 760 3 30 4.62 0.40 [167]
- 760 6 500 0.74 0.69 [168]PZT 760 1 11.5 5.9 0.7 [169]
Alumina 760 3 60 0.67 0.18 [170]Cs-Ru/MgO 760 3 4000 2.41 2.3 [171]
17

Energies 2021, 14, 3732
Table 9. Cont.
Groups CatalystPressure
(Torr)H2/N2
Flow Rate(mL/min)
NH3 Yield(%)
Energy Yield(g-NH3/kWh)
Ref
PZT 760 3 11.5 0.5 0.75 [172]Ru-Mg/alumina 760 4 2000 2.55 35.7 [173]
Cu 760 1 100 3.5 3.3 [174]Ru/alumina 760 1.5 - - 0.64 [175]
Ni/silica withBaTiO3
760 3 25 12 0.75 [176]
Ru/alumina 760 3 1000 0.05 1.9 [176]Ru/Si-MCM-41 760 1 - - 1.7 [177]
Ni/alumina 760 2 100 2 0.89 [178]MgCl2 760 1 4000 - 20.5 [179]
Note: GD: glow discharge, RF: radiofrequency, MW: microwave; DBD: dielectric barrier discharge.
Following the initial study, Eremin et al. [151] revealed that ammonia is formed bysurface reactions. Afterwards, Venugopalan et al. [152] achieved high productivity ofammonia on Ag coated quartz. Uyama et al. [156,180] found the formation of nitride inaddition to hydrazine and ammonia in their study. Nakajima and Sekiguchi [161] foundthat when plasma is generated by H2/N2 gas mixture, the nitrogen gas activation inthe plasma has been depressed by hydrogen while hydrogen injection into the afterglowarea increased the production of ammonia. In addition to the plasma mentioned above,dielectric barrier discharge was also widely explored. In 2000, researchers [164] tested MgOas a catalyst in combination with DBD. The result shows that the catalyst could increase theammonia yield by up to 75% more than a plasma-assisted reaction. The group also studiedthe synthesis of ammonia from methane and nitrogen without any catalyst and achievedan energy yield of as much as 0.69 g-NH3/kWh [168]. The use of porous materials forammonia absorption was also studied by Peng et al. [171]. They found that by using aporous material for ammonia absorption, the rate of ammonia synthesis increases due to thelower gas phase of ammonia. The group also examined some metal catalysts as a promoterfor improving Ru loaded on magnesium-oxide particles. Caesium (Cs) was reported asthe best promoter and capable of achieving energy yield as high as 2.41 g-NH3/kWh [171].Akay and Zhang [181] performed research where barium titanate enhanced by Ni/SiO2was used as the catalyst. The overall energy yield of 1.9 g-NH3/kWh was achieved by thisconfiguration. More recently, in a pulsed DBD plasma reactor, Peng et al. [179] used MgCl2as a catalyst and ammonia absorber. The study discovered that MgCl2 was effective tostore generated ammonia for later extraction. The configuration also achieved a very highenergy yield with 20.5 g-NH3/kWh.
More recently, an attempt was made to synthesis NH3 in the catalyst-free plasma–water interfaces system based on the batch reactor process. Breakthroughs have recentlyoccurred in which plasmas in contact with water surfaces have achieved significant results,putting the interfaces between plasma and water as an NH3 reaction locus by using acombination of electrochemical and plasma. In these studies, the metal anode was replacedwith N2-plasma gas and successfully produced up to 0.44 mg/hour of NH3 on 1 mm2
plasma–liquid interfaces [182].
5. Ammonia as a Renewable Fuel
5.1. Direct Fuel Cell
Fuel cells are currently intensively examined as a breakthrough candidate for carbon-free power generation. The device provides a highly efficient conversion directly fromchemical to electricity and has a low environmental footprint. In an early study, ammonia,which has 17% hydrogen by weight, was proposed for use in PEM fuel cells. Though, dueto the low operating temperature of the PEM fuel cell, the thermodynamics decompositionof ammonia cannot occur [183]. On top of that, ammonia is lethal to the Nafion membrane
18
Energies 2021, 14, 3732
utilised in PEM fuel cells. Thus, external cracking reactors are required to completelyconvert ammonia into hydrogen, giving an extra energy input and additional costs [184].
Based on electrolyte and reaction, a direct ammonia-fed fuel cell can be divided intothree major systems, alkaline fuel cell (AFC), alkaline membrane fuel cell (AMFC) and solidoxide fuel cells (SOFC). The discussion of each configuration is provided below. Ammoniahas been reported as a feed for a fuel cell as early as the 1960s based on the alkaline fuelcell developed by Francis Thomas Bacon [185]. The cells use alkaline electrolytes suchas potassium hydroxide (KOH) and platinum cathodes. Most recently, Hejze et al. [186]reported the potential of molten hydroxide (NaOH/KOH) as an electrolyte. Unfortunately,the use of KOH and NaOH is not favourable for air-intake fuel cells since it reacts withCO2 to form K2CO3 and Na2CO3 and degrades the performance of the alkaline electrolyte.
Recently, alkaline membrane fuel cells (AMFCs) gained attention from the fuel cellsociety due to the compatibility with CO2. As reported by Unlu et al. [187], CO2 introducedin the cathode has a positive effect on improving fuel cell performance. In a recent develop-ment, room temperature AMFC has been developed by Lan and Tao [185]. Compared tofuel cells based on acidic polymer electrolytes, low-cost non-precious catalysts, includingMnO2, silver or nickel, may be used for AMFCs [37]. Moreover, Pt/C, PtRu/C and Ru/Cwere recently investigated AMFCs and can also be used as anodes [188].
Other types of ammonia fuel cells, namely SOFC, are initially developed to preventNOX formation [189]. However, the number of scientists who studied SOFC becomesmore intense caused by the potencies of the cell to operate at high temperature, thusovercoming the disadvantage suffered by PEMs. At high temperatures, ammonia can bedirectly decomposed into hydrogen, normally ranging between 500 and 1000 ◦C, and hencethe need for an external cracking reactor is negated. In addition, there was no evidence ofammonia having a bad effect on the ceramic electrolytes used in SOFCs [190]. Nonetheless,because of the fragility of porcelain materials, SOFCs are usually not appropriate fortransport use [191].
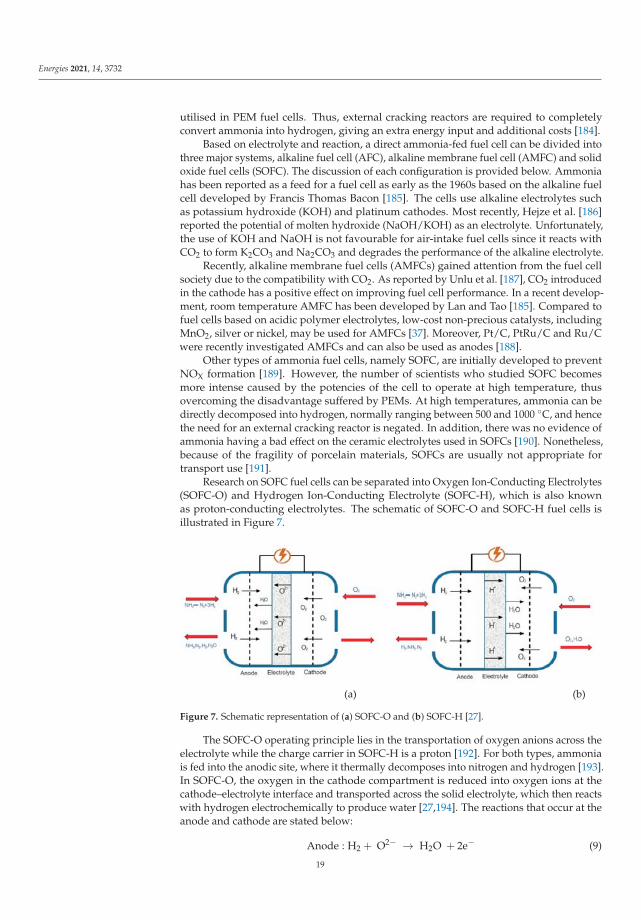
Research on SOFC fuel cells can be separated into Oxygen Ion-Conducting Electrolytes(SOFC-O) and Hydrogen Ion-Conducting Electrolyte (SOFC-H), which is also knownas proton-conducting electrolytes. The schematic of SOFC-O and SOFC-H fuel cells isillustrated in Figure 7.
(a) (b)
Figure 7. Schematic representation of (a) SOFC-O and (b) SOFC-H [27].
The SOFC-O operating principle lies in the transportation of oxygen anions across theelectrolyte while the charge carrier in SOFC-H is a proton [192]. For both types, ammoniais fed into the anodic site, where it thermally decomposes into nitrogen and hydrogen [193].In SOFC-O, the oxygen in the cathode compartment is reduced into oxygen ions at thecathode–electrolyte interface and transported across the solid electrolyte, which then reactswith hydrogen electrochemically to produce water [27,194]. The reactions that occur at theanode and cathode are stated below:
Anode : H2 + O2− → H2O + 2e− (9)
19
Energies 2021, 14, 3732
Cathode :12
O2 + 2e− → O2− (10)
The SOFC-O electrolytes tend to be built based on solid ceramics with metal oxide.YSZ is most widely used because of its high ionic conversion, which facilitates the efficientmovement of oxygen anions through the electrolyte [195]. These solid electrolytes alsoshow strong chemical and thermal stability, which is crucial for the treatment of hightemperatures. Samarium doped ceria (SDC)-based electrolytes also sparked interest due toits capability to have high ionic conductivities at lower temperatures [196].
In SOFC-H, the hydrogen in the anode compartment is oxidised into a proton which isthen transported across solid electrolyte into the cathode [197]. This later reacts with oxygento produce water. The reactions that occur at the anode and cathode are given below:
Anode : H2 → 2H+ + 2e− (11)
Cathode : O2 + 2H+ + 2e− → H2O (12)
An SOFC-H system electrolyte is selected based on the conductivity of a proton aswell as chemical and mechanical stability. The extraordinarily high proton conductivitiesof doped BaCeO3(BCO) and BaZrO3(BZO) have been shown over a wide 300 to 1000 ◦Ctemperature range [198].
In addition to the qualities of the employed material, electrolyte thickness has adirect effect on fuel cell performance. When a thinner electrolyte has been used, theinternal resistance of SOFC decreases. However, reducing electrolyte thickness can affectthe mechanical strength and consequently stability over the long term [198]. Table 10summarises the preceding SOFC fuel cell work that turns ammonia into electricity.
Table 10. Summarization of previous research on SOFC for ammonia synthesis.
Groups ElectrolyteThickness
(μm)Cathode Anode T(◦C)
Power Density(mW/cm2)
Ref
SOFC-O YSZ 200 Ag Pt-YSZ 800–1000 50–125 [199]YSZ 400 Ag planar Ni-YSZ 800 75 [200]YSZ 1000 Ag tubular Ni-YSZ 800 10 [200]YSZ 400 Ag NiO-YSZ 800 60 [196]YSZ 150 LSM NiO-YSZ 700 55 [201]YSZ 30 YSZ -LSM Ni-YSZ 750–850 299 [201]YSZ 15 YSZ -LSM Ni-YSZ 800 526 [202]SDC 24 SSC-SDC NiO-SDC 650 467 [203]SDC 10 BSCF Ni-SDC 700 1190 [204]
SOFC-H BCGP 1300 Pt Pt 700 35 [205]BCG 1300 Pt Pt 700 25 [206]BCE 1000 Pt Pt 700 32 [207]
BCGP 1000 Pt Ni-BCE 600 23 [208]BCG 50 LSC Ni-BCG 700 355 [209]
BZCY 35 BSCF Ni- BZCY 450–700 135–420 [210]BCG 30 BSCF Ni-CGO 600 147 [211]BCN 20 LSC NiO-BCN 700 315 [212]
Note: YSZ denotes yttria-stabilized zirconia, SDC denotes samarium doped ceria, LSM denotes La0.5Sr0.5MnO3, SSC denotesSm0.5Sr0.5Co3−δ, BSCF denotes Ba0.5Sr0.5Co0.8Fe0.2O3−δ, BCGP denotes BaCe0.8Gd0.19Pr0.01O3-δ, BCG denotes BaCe0.8Gd0.2O3-δ, BCEdenotes BaCe0.85Eu0.15O3, LSC denotes La0.5Sr0.5CoO3−δ, BZCY denotes BaZr0.1Ce0.7Y0.2O3-δ, BSCF denotes Ba0.5Sr0.5Co0.8Fe0.2O3-δ, CGOdenotes Ce0.8Gd0.2O1.9, BCN denotes BaCe0. 9Nd0.1O3−δ.
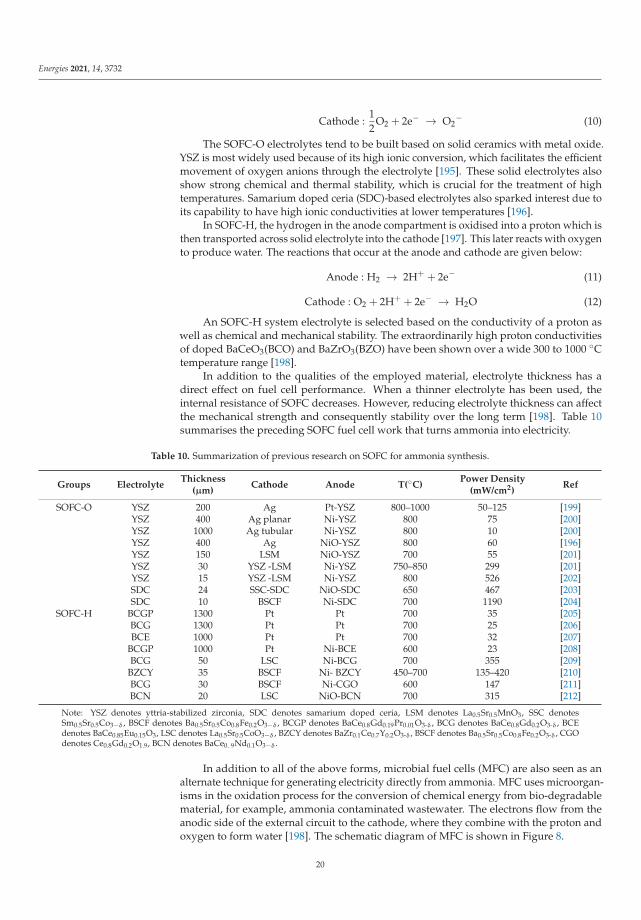
In addition to all of the above forms, microbial fuel cells (MFC) are also seen as analternate technique for generating electricity directly from ammonia. MFC uses microorgan-isms in the oxidation process for the conversion of chemical energy from bio-degradablematerial, for example, ammonia contaminated wastewater. The electrons flow from theanodic side of the external circuit to the cathode, where they combine with the proton andoxygen to form water [198]. The schematic diagram of MFC is shown in Figure 8.
20
Energies 2021, 14, 3732
Figure 8. Schematic diagram of MFC [213].
According to Li et al. [214], MFC has been deemed a potential technique for treatingwastewater while producing energy, but low power, high cost and reactor scalability issuesseverely limit its advancement. In addition to wastewater treatment, MFC technologyhas been proposed as a feasible alternative for air cleaning by removing ammonia fromthe environment. Yan and Liu [215], in 2020, found Sn-doped V2O5 nanoparticles to bea good catalyst for the rapid removal of ammonia in the air using photo-electrocatalysis(PEC) MFCs.
5.2. IC Engine
One of the main industries contributing to GHG emissions worldwide is the transportindustry. The search for the right alternative energy source to reduce fossil fuel addictionhas been a long, challenging journey. Ammonia-fuelled vehicles, which have received alot of publicity recently, are one of the solutions to reduce GHG emissions and fossil fueldependency. Ammonia can be used as fuel in both spark ignition (SI) and compressionignition (CI). Numerous companies and research groups have tested these engines inthe last decades. However, ammonia poses undesirable combustion properties, whichrequire further study of its combustion properties. Table 11 compares the characteristics ofammonia with other IC engine fuels.
Table 11. Comparison of NH3 combustion properties with other fuels at 27 ◦C [216–220].
NH3 H2 MeOH DME Gasoline Diesel
Storage L C L L L LStorage pressure (MPa) 1.1 70 0.1 0.5 0.1 0.1
Density (kg m−3) 600 39.1 784.6 668 740 820Laminar burning velocity (m s−1) 0.07 3.51 0.36 0.54 0.58 1.28
Low heating value (MJ/kg) 18.8 120 19.92 28.43 42.9 44.41Latent heat of vaporization (kJ/kg) 1369 0 1100 467 71.78 47.86
Minimum ignition energy (MJ) 8 0.011 0.14 0.29 0.24 0.24Auto-ignition temperature (K) 930 773–850 712 598–623 530.37 588.7
Octane/cetane number 130 >100 119 55–65 90–98 40–55AFT (K) 1850 2483 1910 - 2138 -
HCR 1.32 1.41 1.20 - 1.28 -Explosion limit in air (% vol) 15–28 4.7–75 6.7–36 3.2–18.6 0.6–8 0.6–5.5
Gravimetric hydrogen density (%) 17.8 100 12.5 13 13 12.75
Note: L (liquid); C (compressed); AFT (adiabatic flame temperature); HCR (heat capacity ratio).
21

Energies 2021, 14, 3732
Ammonia has low flame velocity, very high auto-ignition temperatures, narrowflammability limits and high vaporisation heat compared to other fuels [217]. Narrowflammability limits and high auto-ignition temperatures create problems for NH3 to beused in the engine [221]. Although NH3 can be used as single fuel in the CI engine, ex-tremely higher CR is required to auto-ignite the fuel [222,223]. In addition, high latentheat of vaporisation at the time of injection decreases the gas temperature in the engine,which further complicates it [221]. In the SI engine, the use of ammonia is restricted bylow flame velocity and narrow explosion limits resulting in incomplete combustion [224].Ammonia combustion in the SI-engine can be improved by providing stronger igniterssuch as plasma jet igniters, smaller combustion chambers to overcome the resistance ofNH3 combustion [223]. Supercharging can also achieve improved combustion [225].
In addition to the problems mentioned above, ammonia also shows low flame speedand specific energy in combination with high ignition energies and high auto-ignitiontemperatures, resulting in a relatively low propagation rate from the combustion [16].Although ammonia has been successfully used as mono-fuel both in SI and CI engines, sucha low ammonia combustion rate induces inconsistency in combustion under conditions oflow engine load or high engine speed [225]. Thereby, it is essential to mix with secondaryfuel to overcome its disadvantages as a fuel. In addition to ammonia, potential fuels to beused in SI engines are hydrogen, methanol, ethanol, ethane and gasoline. For CI engines,fuels with higher cetane numbers are preferred as a combustion promoter due to the betterignition characteristics [223]. However, these approaches require some special features [16].
On a dual fuel CI engine, ammonia could be used up to 95% of the fuel energy basiswith diesel as a combustion promoter. An optimal mixture, however, is 60% of ammoniaon an energy basis because a smaller amount of ammonia would limit the flammability ofammonia [226]. Other studies suggested that an optimal content of ammonia is between60–80% based on the mass basis [225]. A demonstration of biodiesel as a combustionpromoter by Kong et al. [227] revealed that the fuel performed similar engine performancecharacteristics with ammonia/diesel blends. The operating characteristics are, however,different when Dimethyl Ether (DME) is used as the ammonia fuel combustion promoter.The study shows that ammonia could be used up to 80% only when DME is used as acombustion promoter [217]. Moreover, the study also revealed that the fuel mix of ammoniaand DME has a competitive energy cost with current diesel fuel. Even the addition of NH3in the blend has been shown to significantly raise emissions of CO, HC and NOx [228].
On the SI engine, gasoline is used as a combustion promoter in most of the studies. Acompression ratio of 10:1 is required to get optimal operation of the engine with ammoniacontent 70% [229]. Gaseous fuels are chosen for SI-engines due to the same phase withammonia gas, while anhydrous ammonia would lower the temperature of the in-cylinder,thus adversely affecting subsequent turbulence triggering deteriorated combustion andmisfire [228]. In the SI engine powered by ammonia/gasoline, gasoline is port-injectedwhile ammonia gas is direct-injected. Direct injection of ammonia gas substantially lowersthe cylinder temperature due to the high latent heat of ammonia. Thus, creating turbulencein the combustion chamber will enhance the combustion of the fuel. However, too smallswirls do not affect the combustion, while too large swirls have a negative effect on thecombustion by blowing out the flames due to the slow propagation of the ammoniaflames [223].
Another alternative is by using hydrogen as a secondary fuel by installing an on-boardreformer to split ammonia into hydrogen and nitrogen [230]. Morch et al. [219] give acomplete database of SI engine performance with ammonia/hydrogen mixture as a fuel.Ammonia and hydrogen have, in this investigation, been incorporated into the CFR engineintake manifold. A series of studies were undertaken with different excess air ratios andhydrogen ammonia ratios. The results revealed that a fuel mixture with 10 vol.% hydrogenshas the best performance in terms of efficiency and power. In a comparison study withgasoline, there is a high possibility that an increase in efficiency and power is caused by agreater compression ratio. The analysis of the system has also shown that most of the heat
22
Energies 2021, 14, 3732
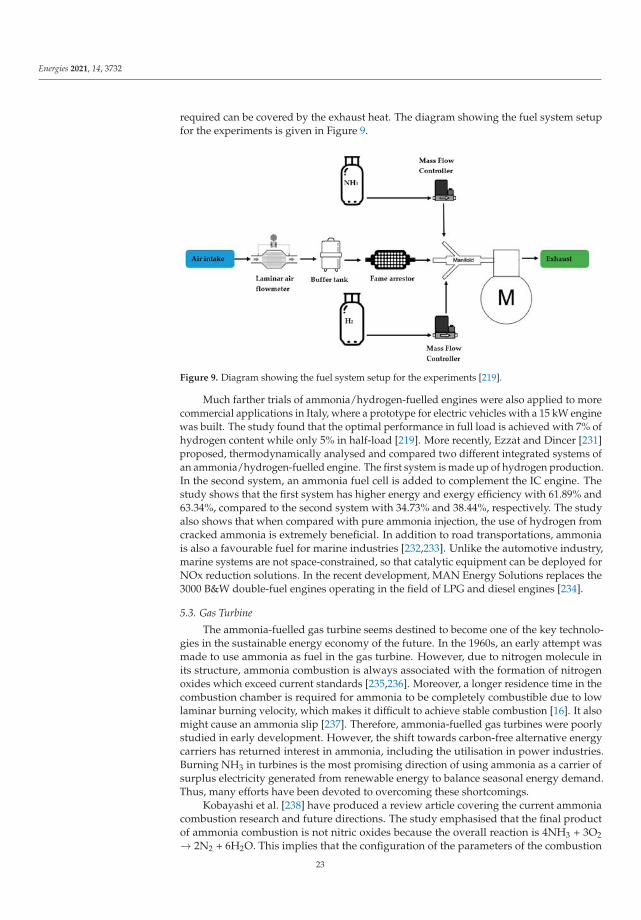
required can be covered by the exhaust heat. The diagram showing the fuel system setupfor the experiments is given in Figure 9.
Figure 9. Diagram showing the fuel system setup for the experiments [219].
Much farther trials of ammonia/hydrogen-fuelled engines were also applied to morecommercial applications in Italy, where a prototype for electric vehicles with a 15 kW enginewas built. The study found that the optimal performance in full load is achieved with 7% ofhydrogen content while only 5% in half-load [219]. More recently, Ezzat and Dincer [231]proposed, thermodynamically analysed and compared two different integrated systems ofan ammonia/hydrogen-fuelled engine. The first system is made up of hydrogen production.In the second system, an ammonia fuel cell is added to complement the IC engine. Thestudy shows that the first system has higher energy and exergy efficiency with 61.89% and63.34%, compared to the second system with 34.73% and 38.44%, respectively. The studyalso shows that when compared with pure ammonia injection, the use of hydrogen fromcracked ammonia is extremely beneficial. In addition to road transportations, ammoniais also a favourable fuel for marine industries [232,233]. Unlike the automotive industry,marine systems are not space-constrained, so that catalytic equipment can be deployed forNOx reduction solutions. In the recent development, MAN Energy Solutions replaces the3000 B&W double-fuel engines operating in the field of LPG and diesel engines [234].
5.3. Gas Turbine
The ammonia-fuelled gas turbine seems destined to become one of the key technolo-gies in the sustainable energy economy of the future. In the 1960s, an early attempt wasmade to use ammonia as fuel in the gas turbine. However, due to nitrogen molecule inits structure, ammonia combustion is always associated with the formation of nitrogenoxides which exceed current standards [235,236]. Moreover, a longer residence time in thecombustion chamber is required for ammonia to be completely combustible due to lowlaminar burning velocity, which makes it difficult to achieve stable combustion [16]. It alsomight cause an ammonia slip [237]. Therefore, ammonia-fuelled gas turbines were poorlystudied in early development. However, the shift towards carbon-free alternative energycarriers has returned interest in ammonia, including the utilisation in power industries.Burning NH3 in turbines is the most promising direction of using ammonia as a carrier ofsurplus electricity generated from renewable energy to balance seasonal energy demand.Thus, many efforts have been devoted to overcoming these shortcomings.
Kobayashi et al. [238] have produced a review article covering the current ammoniacombustion research and future directions. The study emphasised that the final productof ammonia combustion is not nitric oxides because the overall reaction is 4NH3 + 3O2→ 2N2 + 6H2O. This implies that the configuration of the parameters of the combustion
23
Energies 2021, 14, 3732
system is crucial to perform the reaction according to this direction. Karabeyoglu et al. [239]developed a test rig and conducted a series of trials with a pre-burner system to partiallycrack ammonia into H2. The study revealed that ammonia combustion could be self-sustained when 10% cracking is applied. In 2014, Iki et al. [240] developed a 50 kWemicro gas-turbine system that enables a bi-fuel supply of kerosene and ammonia. Thesystem was able to achieve over 25-kWe power generation by supplying about 10% heatfrom ammonia gas. In 2015, Iki et al. [241] were able to achieve 21 kWe by replacing thestandard combustor with a prototype combustor. The gas turbine performance showedan efficiency of combustion up to 96% with NOx emission above 1000 ppm at 16% O2.Hayakawa et al. [242] investigated stretching limits for high-pressure flames and observedlower NO formation with higher mixture pressure. Okafor et al. [243], in their experimentand numerical calculations, concluded that predominant rate-limiting reactions in methane–ammonia flames are belonging to the ammonia oxidation path, which controls H and OHradicals. These radicals influence the burning velocity.
NO + NH2 → NNH + OH (13)
NH2 + O → HNO + H (14)
HNO + H → NO + H2 (15)
The study also revealed that the NO concentration decreases when ammonia increasesunder rich conditions.
In 2016, Ito et al. [244] developed a gas-turbine combustion system with controlledemissions, which uses a mixture of NH3 and natural gas as the fuel. Combustion propertieshave been explored via the use of a swirl burner, generally employed in gas turbines,experimentally and numerically. Detailed compositions of the burner exhaust gas weremeasured under atmospheric pressure and lean fuel circumstances. The results show thatwith this system, the combustion efficiency above 97% can be achieved for an ammoniamixing ratio below 50%. The study also shows that with an increase of equivalency ratio,unburned species such as NH3, CO and THC decrease while NO and N2O emissionsincrease. The study concludes that low emissions and good combustion efficiency aredifficult to obtain in a single-stage reactor.
In 2017, Onishi et al. [245] attempted to create novel ways for reducing NOx emissionswhile burning an ammonia-natural gas combination in a gas turbine combustor. The con-cept of low-emission combustion in two-stage combustion was examined numerically andexperimentally. In the main zone, methane and ammonia are used as fuel. The secondaryzone is then only supplied ammonia. The results indicated two methods for attaining lowNOx combustion: rich-lean combustion and a combination of lean combustion and extraammonia delivery. In the first technique, NOx is created only in the main zone when thefuel is abundant, and the burnt gas is diluted in the secondary zone by secondary air. As aresult, primary zone NOx production dominates emission. A lean combustion state in theprimary zone results in a low temperature and oxygen concentration in the secondary zonein the second approach. The NOx concentration at the combustor outlet is low as a resultof these circumstances. These expected combustion qualities have been experimentally val-idated. The experimental findings showed that the NOx emission behaviour correspondedto the numerical results.
In 2018, Ito et al. [246] studied a mixture of ammonia and natural gas fuel in a 2 MWegas turbine. Their results indicated that ammonia is suitable for use in large turbines.Before ammonia is fed to the combustor, the gas turbine power is raised up to 2 MWe usingnatural gas. The ammonia’s heat input ratio to total fuel is used to calculate the ammoniafeed to the engine. The result shows that the gas turbine engine’s operation was shown tobe steady across a wide variety of ammonia mixing ratios ranging from 0% to 20%. As theratio of ammonia in the mixture increases, the concentration of NOx at the turbine outletrises significantly up to 5% mixing ratio, then remains steady until it reaches 20%.
24

Energies 2021, 14, 3732
6. Conclusions
Ammonia is among the most commonly shipped bulk-produced chemicals, marketedfor more than a decade in mass all over the globe. Originally used in the chemical in-dustries and as an intermediate for the production of fertilisers, ammonia has also beenexplored recently as a hydrogen storage media and a substitute fuel for hydrocarbon.Unlike the conventional ammonia production process that used natural gas as a feedstockand is responsible for carbon emission, ammonia is a means of renewable energy storageformulated from H2 generated by an electrically driven electrolyser and N2 separate fromthe atmospheric air. In addition to that, innovative approaches, such as photocatalysis, elec-trocatalysis and plasmacatalysis, have attracted widespread interest in ammonia synthesistoday. Thus, the application of ammonia as a renewable energy carrier not only plays a keyrole to lower GHG emissions but also allows transporting H2 efficiently and economically,permits the direct conversion to electricity by fuel cell and provides versatility in its use, asfuel for the IC engine and power generation. Thus, the ease of processing, transportingand using NH3 makes it an appealing choice to serve as the link between renewable energyproduction and demands. However, work is still needed to improve the efficiency of theconversion process for the chemical to compete with hydrocarbon fuel.
Author Contributions: Original draft preparation, M.H.H.; Supervision, T.M.I.M. and M.M.; Reviewand Editing, H.C.O. and I.M.R.F. Revision, A.S.S.; and F.H. All authors have read and agreed to thepublished version of the manuscript.
Funding: This research received no external funding.
Acknowledgments: This study was carried out under the International Research Scholarship(IRS) and UTS Presidential Scholarship (UTSP) program, funded by the University of TechnologySydney, Australia.
Conflicts of Interest: The authors declare no conflict of interest.
References
1. Cavicchioli, R.; Ripple, W.J.; Timmis, K.N.; Azam, F.; Bakken, L.R.; Baylis, M.; Behrenfeld, M.J.; Boetius, A.; Boyd, P.W.; Classen,A.T. Scientists’ warning to humanity: Microorganisms and climate change. Nat. Rev. Microbiol. 2019, 17, 569–586. [CrossRef][PubMed]
2. Edenhofer, O. Climate Change 2014: Mitigation of Climate Change; Cambridge University Press: Cambridge, UK, 2015; Volume 3.3. Lüthi, D.; Le Floch, M.; Bereiter, B.; Blunier, T.; Barnola, J.-M.; Siegenthaler, U.; Raynaud, D.; Jouzel, J.; Fischer, H.; Kawamura, K.
High-resolution carbon dioxide concentration record 650,000–800,000 years before present. Nature 2008, 453, 379–382. [CrossRef][PubMed]
4. Pachauri, R.K.; Allen, M.R.; Barros, V.R.; Broome, J.; Cramer, W.; Christ, R.; Church, J.A.; Clarke, L.; Dahe, Q.; Dasgupta, P. ClimateChange 2014: Synthesis Report. Contribution of Working Groups I, II and III to the Fifth Assessment Report of the Intergovernmental Panelon Climate Change; IPCC: Geneva, Switzerland, 2014.
5. United Nations Framework Convention on Climate Change. 1992. Available online: https://unfccc.int/files/essential_background/background_publications_htmlpdf/application/pdf/conveng.pdf (accessed on 13 January 2021).
6. Olivier, G.J.; Peters, J.A. Trends In Global CO2 and Total Greenhouse Gas Emissions: 2017 Report; PBL Netherlands EnvironmentalAssessment Agency: The Hague, The Netherland, 2017.
7. Jiang, X.; Guan, D. The global CO2 emissions growth after international crisis and the role of international trade. Energy Policy2017, 109, 734–746. [CrossRef]
8. Protocol, K. United Nations framework convention on climate change. Kyoto Protoc. 1997, 19. Available online: https://unfccc.int/kyoto_protocol (accessed on 18 January 2021).
9. International Cooperation on Climate Change; United Nations Framework Convention on Climate Change (UNFCCC). Availableonline: https://www.dfat.gov.au/international-relations/themes/climate-change/Pages/international-cooperation-on-climate-change (accessed on 19 May 2020).
10. Appl, M. The Haber-Bosch heritage: The ammonia production technology. In Proceedings of the 50th Anniversary of the IFATechnical Conference, Seville, Spain, 25–26 September 1997.
11. Klein, D.; Carazo, M.P.; Doelle, M.; Bulmer, J.; Higham, A. The Paris Agreement on Climate Change: Analysis and Commentary; OxfordUniversity Press: Oxford, UK, 2017.
12. Myllyvirta, L. Analysis: Coronavirus Temporarily Reduced China’s CO2 Emissions by a Quarter; Carbon Brief. 2020. Avail-able online: https://www.carbonbrief.org/analysis-coronavirus-has-temporarily-reduced-chinas-co2-emissions-by-a-quarter(accessed on 8 January 2021).
25

Energies 2021, 14, 3732
13. Zhang, R.; Zhang, Y.; Lin, H.; Feng, X.; Fu, T.-M.; Wang, Y. NOx Emission Reduction and Recovery during COVID-19 in EastChina. Atmosphere 2020, 11, 433. [CrossRef]
14. Viswanathan, B. Chapter 9—Hydrogen as an Energy Carrier. In Energy Sources; Viswanathan, B., Ed.; Elsevier: Amsterdam, TheNetherlands, 2017; pp. 161–183.
15. Edwards, P.; Kuznetsov, V.; David, W. Hydrogen energy. Philos. Trans. R. Soc. A Math. Phys. Eng. Sci. 2007, 365, 1043–1056.[CrossRef]
16. Valera-Medina, A.; Xiao, H.; Owen-Jones, M.; David, W.I.; Bowen, P.J. Ammonia for power. Prog. Energy Combust. Sci. 2018, 69,63–102. [CrossRef]
17. Paris 2015: Tracking Country Climate Pledges. 2017. Available online: https://www.carbonbrief.org/paris-2015-tracking-country-climate-pledges (accessed on 24 June 2020).
18. Innovation Promotion Program Energy Carriers. SIP 2016. Available online: https://www8.cao.go.jp/cstp/panhu/sip_english/20-23.pdf (accessed on 8 January 2021).
19. Crolius, S.H. Ammonia Included in Japan’s International Resource Strategy. 2020. Available online: https://www.ammoniaenergy.org/articles/ammonia-included-in-japans-international-resource-strategy/ (accessed on 18 May 2020).
20. Brown, T. Green Ammonia Plants Win Financing in Australia and New Zealand. 2020. Available online: https://www.ammoniaenergy.org/articles/green-ammonia-plants-win-financing-in-australia-and-new-zealand/ (accessed on 19 May 2020).
21. Service, R.F. Ammonia—A Renewable Fuel Made From Sun, Air, and Water—Could Power the Globe Without Carbon. 2018. Avail-able online: https://www.sciencemag.org/news/2018/07/ammonia-renewable-fuel-made-sun-air-and-water-could-power-globe-without-carbon# (accessed on 17 May 2020).
22. Pattabathula, V.; Richardson, J. Introduction to Ammonia Production. 2016. Available online: https://www.aiche.org/resources/publications/cep/2016/september/introduction-ammonia-production (accessed on 15 May 2020).
23. Nitrogen Statistics and Information. 2020. Available online: https://www.usgs.gov/centers/nmic/nitrogen-statistics-and-information (accessed on 20 May 2021).
24. Mineral. Commodity Summaries. 2020. Available online: https://pubs.usgs.gov/periodicals/mcs2020/mcs2020,pdf (accessedon 18 June 2020).
25. Egenhofer, C.; Schrefler, L.; Rizos, V.; Marcu, A.; Genoese, F.; Renda, A.; Wieczorkiewicz, J.; Roth, S.; Infelise, F.; Luchetta, G. TheComposition and Drivers of Energy Prices and Costs in Energy-Intensive Industries: The Case of Ceramics, Glass and Chemicals.2014. Available online: http://aei.pitt.edu/50255/1/CEPS_Energy_Prices_Study_Consolidated_version.pdf (accessed on 14January 2021).
26. Patil, B.; Wang, Q.; Hessel, V.; Lang, J. Plasma N2-fixation: 1900–2014. Catal. Today 2015, 256, 49–66. [CrossRef]27. Afif, A.; Radenahmad, N.; Cheok, Q.; Shams, S.; Kim, J.H.; Azad, A.K. Ammonia-fed fuel cells: A comprehensive review. Renew.
Sustain. Energy Rev. 2016, 60, 822–835. [CrossRef]28. Davis, B.L.; Dixon, D.A.; Garner, E.B.; Gordon, J.C.; Matus, M.H.; Scott, B.; Stephens, F.H. Efficient regeneration of partially spent
ammonia borane fuel. Angew. Chem. Int. Ed. 2009, 48, 6812–6816. [CrossRef]29. Leigh, G. Haber-Bosch and Other Industrial Processes. In Catalysts for Nitrogen Fixation; Springer: Dordrecht, The Netherlands,
2004; pp. 33–54. [CrossRef]30. Boerner, L.K. Industrial ammonia production emits more CO2 than any other chemical-making reaction. Chem. Eng. News 2019,
97. Available online: https://cen.acs.org/environment/green-chemistry/Industrial-ammonia-production-emits-CO2/97/i24#:~{}:text=It%20belched%20up%20to%20about,reaction%20(see%20page%2023) (accessed on 12 February 2021).
31. Snoeckx, R.; Bogaerts, A. Plasma technology–a novel solution for CO 2 conversion? Chem. Soc. Rev. 2017, 46, 5805–5863.[CrossRef]
32. MacFarlane, D.R.; Choi, J.; Suryanto, B.H.; Jalili, R.; Chatti, M.; Azofra, L.M.; Simonov, A.N. Liquefied sunshine: Transformingrenewables into fertilizers and energy carriers with electromaterials. Adv. Mater. 2020, 32, 1904804. [CrossRef]
33. Yan, Z.; Ji, M.; Xia, J.; Zhu, H. Recent Advanced Materials for Electrochemical and Photoelectrochemical Synthesis of Ammoniafrom Dinitrogen: One Step Closer to a Sustainable Energy Future. Adv. Energy Mater. 2020, 10, 1902020. [CrossRef]
34. Xu, H.; Ithisuphalap, K.; Li, Y.; Mukherjee, S.; Lattimer, J.; Soloveichik, G.; Wu, G. Electrochemical Ammonia Synthesis throughN2 and H2O under Ambient Conditions: Theory, Practices, and Challenges for Catalysts and Electrolytes. Nano Energy 2020, 69,104469. [CrossRef]
35. MacFarlane, D.R.; Cherepanov, P.V.; Choi, J.; Suryanto, B.H.R.; Hodgetts, R.Y.; Bakker, J.M.; Vallana, F.M.F.; Simonov, A.N. ARoadmap to the Ammonia Economy. Joule 2020, 4, 1186–1205. [CrossRef]
36. Wang, L.; Xia, M.; Wang, H.; Huang, K.; Qian, C.; Maravelias, C.T.; Ozin, G.A. Greening ammonia toward the solar ammoniarefinery. Joule 2018, 2, 1055–1074. [CrossRef]
37. Lan, R.; Irvine, J.T.; Tao, S. Ammonia and related chemicals as potential indirect hydrogen storage materials. Int. J. Hydrog. Energy2012, 37, 1482–1494. [CrossRef]
38. Kojima, Y. High Purity Hydrogen Generation from Ammonia. 2017. Available online: https://ep70.eventpilotadmin.com/web/page.php?page=IntHtml&project=ACS17FALL&id=2747276 (accessed on 22 January 2021).
39. Makepeace, J.W.; He, T.; Weidenthaler, C.; Jensen, T.R.; Chang, F.; Vegge, T.; Ngene, P.; Kojima, Y.; de Jongh, P.E.; Chen, P.Reversible ammonia-based and liquid organic hydrogen carriers for high-density hydrogen storage: Recent progress. Int. J.Hydrog. Energy 2019, 44, 7746–7767. [CrossRef]
26

Energies 2021, 14, 3732
40. Bartels, R.J.; Pate, M.B.; Olson, N.K. An economic survey of hydrogen production from conventional and alternative energysources. Int. J. Hydrog. Energy 2010, 35, 8371–8384. [CrossRef]
41. Schultz, K.R. Use of the Modular Helium Reactor for Hydrogen Production; General Atomics (US): San Diego, CA, USA, 2003. Availableonline: https://www.osti.gov/biblio/821808-use-modular-helium-reactor-hydrogen-production (accessed on 3 February 2021).
42. Orhan, M.F.; Dincer, I.; Naterer, G.F. Cost analysis of a thermochemical Cu–Cl pilot plant for nuclear-based hydrogen production.Int. J. Hydrog. Energy 2008, 33, 6006–6020. [CrossRef]
43. Charvin, P.; Stéphane, A.; Florent, L.; Gilles, F. Analysis of solar chemical processes for hydrogen production from water splittingthermochemical cycles. Energy Convers. Manag. 2008, 49, 1547–1556. [CrossRef]
44. Bartels, J.R. A Feasibility Study of Implementing an Ammonia Economy. Master’s Theses, Iowa State University, Iowa, IA, USA,2008.
45. Andersson, J.; Grönkvist, S. Large-scale storage of hydrogen. Int. J. Hydrog. Energy 2019, 44, 11901–11919. [CrossRef]46. Anhydrous Ammonia Transportation Information. 2007. Available online: http://www.mda.state.mn.us/chemicals/spills/
ammoniaspills/transportation.htm (accessed on 15 June 2020).47. Paster, M. Hydrogen Deliver Options and Issues. Available online: http://www1.eere.energy.gov/hydrogenandfuelcells/
analysis/pdfs/paster_h2_delivery.pdf (accessed on 15 June 2020).48. Appl, M. Ammonia: Principles and Industrial Practice; Vch Verlagsgesellschaft Mbh: Weinheim, Germany, 1999. Available online:
https://trove.nla.gov.au/work/32581098 (accessed on 15 June 2020).49. Christensen, C.H.; Johannessen, T.; Sørensen, R.Z.; Nørskov, J.K. Towards an ammonia-mediated hydrogen economy? Catal.
Today 2006, 111, 140–144. [CrossRef]50. Christensen, C.H.; Sørensen, R.Z.; Johannessen, T.; Quaade, U.J.; Honkala, K.; Elmøe, T.D.; Køhler, R.; Nørskov, J.K. Metal ammine
complexes for hydrogen storage. J. Mater. Chem. 2005, 15, 4106–4108. [CrossRef]51. Haynes, W.M. CRC Handbook of Chemistry and Physics; CRC Press: Boca Raton, FL, USA, 2014.52. Karabeyoglu, A.; Evans, B. Fuel conditioning system for ammonia fired power plants. In Proceedings of the NH3 Congress, Ames,
IA, USA, 1 October 2012; Available online: https://www.ammoniaenergy.org/wp-content/uploads/2021/01/evans-brian.pdf(accessed on 23 January 2021).
53. Cole-Parmer Instrument Company. Chemical Compatibility Database, Ammonia, Anhydrous. 2017. Available online: https://www.coleparmer.co.uk/chemical-resistance (accessed on 10 June 2021).
54. Pincha, M.E.; Heizer, B.L.; McHale, M.P. Material Compatibility Problems for Ammonia Systems; SAE Technical Paper: Washington,DC, USA, 1988.
55. Graco, Chemical Compatibility Guide. 2013. Available online: https://www.graco.com/content/dam/graco/ipd/literature/misc/chemical-compatibility-guide/Graco_ChemCompGuideEN-B.pdf (accessed on 9 June 2021).
56. CDC. Ammonia. Available online: https://www.cdc.gov/niosh/idlh/7664417 (accessed on 26 May 2020).57. Ravishankara, A.; Daniel, J.S.; Portmann, R.W. Nitrous oxide (N2O): The dominant ozone-depleting substance emitted in the 21st
century. Science 2009, 326, 123–125. [CrossRef]58. Klerke, A.; Christensen, C.H.; Nørskov, J.K.; Vegge, T. Ammonia for hydrogen storage: Challenges and opportunities. J. Mater.
Chem. 2008, 18, 2304–2310. [CrossRef]59. Organization, W.H. Ammonia Health and Safety Guide-Health and Safety Guide 37; International Programme on Chemical Safety:
Geneva, Switzerland, 1990.60. Ryer-Powder, J.E. Health effects of ammonia. Plant/Oper. Prog. 1991, 10, 228–232. [CrossRef]61. Smith, C.; Hill, A.K.; Torrente-Murciano, L. Current and future role of Haber-Bosch ammonia in a carbon-free energy landscape.
Energy Environ. Sci. 2020, 13, 331–344. [CrossRef]62. Wilkinson, I. Green Ammonia. 2017. Available online: Siemens.com (accessed on 23 January 2021).63. Schmuecker, J. Schmuecker Pinehurst Farm, l.L.C. Available online: http://solarhydrogensystem.com/ (accessed on 16 June
2020).64. Cholteeva, Y. Sable Chemicals and Tatanga Energy to Construct Solar Energy Plant in Zimbabwe. Available online: https://www.
power-technology.com/news/sable-chemicals-and-tatanga-energy-to-construct-solar-energy-plant-in-zimbabwe/ (accessed on18 June 2020).
65. Solar Ammonia. 2017. Available online: https://www.yara.com/ (accessed on 13 June 2020).66. Brown, T. Renewable Ammonia Demonstration Plant Announced in South Australia. 2018. Available online: https://
ammoniaindustry.com/renewable-ammonia-demonstration-plant-announced-in-south-australia/ (accessed on 14 June 2020).67. Rusanov, V.D.; Fridman, A.A.; Sholin, G.V. The physics of a chemically active plasma with nonequilibrium vibrational excitation
of molecules. Sov. Phys. Uspekhi 1981, 24, 447. [CrossRef]68. Chen, X.; Li, N.; Kong, Z.; Ong, W.-J.; Zhao, X. Photocatalytic fixation of nitrogen to ammonia: State-of-the-art advancements and
future prospects. Mater. Horiz. 2018, 5, 9–27. [CrossRef]69. Schrauzer, G.; Guth, T. Photolysis of water and photoreduction of nitrogen on titanium dioxide. J. Am. Chem. Soc. 2002, 99,
7189–7193. [CrossRef]70. Bourgeois, S.; Diakite, D.; Perdereau, M. A study of TiO2 powders as a support for the photochemical synthesis of ammonia.
React. Solids 1988, 6, 95–104. [CrossRef]
27

Energies 2021, 14, 3732
71. Hirakawa, H.; Hashimoto, M.; Shiraishi, Y.; Hirai, T. Photocatalytic conversion of nitrogen to ammonia with water on surfaceoxygen vacancies of titanium dioxide. J. Am. Chem. Soc. 2017, 139, 10929–10936. [CrossRef] [PubMed]
72. Ranjit, K.T.; Varadarajan, T.K.; Viswanathan, B. Photocatalytic reduction of dinitrogen to ammonia over noble-metal-loaded TiO2.J. Photochem. Photobiol. A Chem. 1996, 96, 181–185. [CrossRef]
73. Lashgari, M.; Zeinalkhani, P. Photocatalytic N2 conversion to ammonia using efficient nanostructured solar-energy-materials inaqueous media: A novel hydrogenation strategy and basic understanding of the phenomenon. Appl. Catal. A Gen. 2017, 529,91–97. [CrossRef]
74. Sun, S.; An, Q.; Wang, W.; Zhang, L.; Liu, J.; Goddard, W.A., III. Efficient photocatalytic reduction of dinitrogen to ammonia onbismuth monoxide quantum dots. J. Mater. Chem. A 2017, 5, 201–209. [CrossRef]
75. Hu, S.; Chen, X.; Li, Q.; Zhao, Y.; Mao, W. Effect of sulfur vacancies on the nitrogen photofixation performance of ternary metalsulfide photocatalysts. Catal. Sci. Technol. 2016, 6, 5884–5890. [CrossRef]
76. Ye, L.; Han, C.; Ma, Z.; Leng, Y.; Li, J.; Ji, X.; Bi, D.; Xie, H.; Huang, Z. Ni2P loading on Cd0.5Zn0.5S solid solution for exceptionalphotocatalytic nitrogen fixation under visible light. Chem. Eng. J. 2017, 307, 311–318. [CrossRef]
77. Wei, P.; Yang, Q.; Guo, L. Bismuth oxyhalide compounds as photocatalysts. Prog. Chem. 2009, 21, 1734–1741.78. Dong, G.; Ho, W.; Wang, C. Selective photocatalytic N2 fixation dependent on gC3N4 induced by nitrogen vacancies. J. Mater.
Chem. A 2015, 3, 23435–23441. [CrossRef]79. Hu, S.; Chen, X.; Li, Q.; Li, F.; Fan, Z.; Wang, H.; Wang, Y.; Zheng, B.; Wu, G. Fe3+ doping promoted N2 photofixation ability
of honeycombed graphitic carbon nitride: The experimental and density functional theory simulation analysis. Appl. Catal. BEnviron. 2017, 201, 58–69. [CrossRef]
80. Ileperuma, O.A.; Tennakone, K.; Dissanayake, W.D.D.P. Photocatalytic behaviour of metal doped titanium dioxide: Studies onthe photochemical synthesis of ammonia on Mg/TiO2 catalyst systems. Appl. Catal. 1990, 62, L1–L5. [CrossRef]
81. Soria, J.; Conesa, J.; Augugliaro, V.; Palmisano, L.; Schiavello, M.; Sclafani, A. Dinitrogen photoreduction to ammonia overtitanium dioxide powders doped with ferric ions. J. Phys. Chem. 1991, 95, 274–282. [CrossRef]
82. Ileperuma, O.A.; Thaminimulla, C.T.K.; Kiridena, W.C.B. Photoreduction of N2 to NH3 and H2O to H2 on metal doped TiO2catalysts (M = Ce, V). Sol. Eergy Mater. Sol. Cells 1993, 28, 335–343. [CrossRef]
83. Zhao, W.; Zhang, J.; Zhu, X.; Zhang, M.; Tang, J.; Tan, M.; Wang, Y. Enhanced nitrogen photofixation on Fe-doped TiO2 withhighly exposed (1, 0 1) facets in the presence of ethanol as scavenger. Appl. Catal. B Environ. 2014, 144, 468–477. [CrossRef]
84. Janet, C.; Navaladian, S.; Viswanathan, B.; Varadarajan, T.; Viswanath, R. Heterogeneous wet chemical synthesis of superlattice-type hierarchical ZnO architectures for concurrent H2 production and N2 reduction. J. Phys. Chem. C 2010, 114, 2622–2632.[CrossRef]
85. Khader, M.M.; Lichtin, N.N.; Vurens, G.H.; Salmeron, M.; Somorjai, G.A. Photoassisted catalytic dissociation of water andreduction of nitrogen to ammonia on partially reduced ferric oxide. Langmuir 1987, 3, 303–304. [CrossRef]
86. Hao, Y.; Dong, X.; Zhai, S.; Ma, H.; Wang, X.; Zhang, X. Hydrogenated bismuth molybdate nanoframe for efficient sunlight-drivennitrogen fixation from air. Chem.–A Eur. J. 2016, 22, 18722–18728. [CrossRef]
87. Miyama, H.; Fujii, N.; Nagae, Y. Heterogeneous photocatalytic synthesis of ammonia from water and nitrogen. Chem. Phys. Lett.1980, 74, 523–524. [CrossRef]
88. Khan, T.M.M.; Bhardwaj, R.C.; Bhardwaj, C. Catalytic Fixation of Nitrogen by the Photocatalytic CdS/Pt/RuO2 ParticulateSystem in the Presence of Aqueous [Ru (Hedta) N2]� Complex. Angew. Chem. Int. Ed. Engl. 1988, 27, 923–925. [CrossRef]
89. Sun, S.; Li, X.; Wang, W.; Zhang, L.; Sun, X. Photocatalytic robust solar energy reduction of dinitrogen to ammonia on ultrathinMoS2. Appl. Catal. B Environ. 2017, 200, 323–329. [CrossRef]
90. Cao, Y.; Hu, S.; Li, F.; Fan, Z.; Bai, J.; Lu, G.; Wang, Q. Photofixation of atmospheric nitrogen to ammonia with a novel ternarymetal sulfide catalyst under visible light. RSC Adv. 2016, 6, 49862–49867. [CrossRef]
91. Zhang, Q.; Hu, S.; Fan, Z.; Liu, D.; Zhao, Y.; Ma, H.; Li, F. Preparation of gC3N4/ZnMoCdS hybrid heterojunction catalyst withoutstanding nitrogen photofixation performance under visible light via hydrothermal post-treatment. Dalton Trans. 2016, 45,3497–3505. [CrossRef] [PubMed]
92. Hu, S.; Li, Y.; Li, F.; Fan, Z.; Ma, H.; Li, W.; Kang, X. Construction of g-C3N4/Zn0.11Sn0.12Cd0.88S1.12 hybrid heterojunction catalystwith outstanding nitrogen photofixation performance induced by sulfur vacancies. ACS Sustain. Chem. Eng. 2016, 4, 2269–2278.[CrossRef]
93. Bai, Y.; Ye, L.; Chen, T.; Wang, L.; Shi, X.; Zhang, X.; Chen, D. Facet-dependent photocatalytic N2 fixation of bismuth-rich Bi5O7Inanosheets. ACS Appl. Mater. Interfaces 2016, 8, 27661–27668. [CrossRef]
94. Li, H.; Shang, J.; Shi, J.; Zhao, K.; Zhang, L. Facet-dependent solar ammonia synthesis of BiOCl nanosheets via a proton-assistedelectron transfer pathway. Nanoscale 2016, 8, 1986–1993. [CrossRef]
95. Li, H.; Shang, J.; Ai, Z.; Zhang, L. Efficient visible light nitrogen fixation with BiOBr nanosheets of oxygen vacancies on theexposed facets. J. Am. Chem. Soc. 2015, 137, 6393–6399. [CrossRef]
96. Wang, S.; Hai, X.; Ding, X.; Chang, K.; Xiang, Y.; Meng, X.; Yang, Z.; Chen, H.; Ye, J. Light-Switchable Oxygen Vacancies inUltrafine Bi5O7Br Nanotubes for Boosting Solar-Driven Nitrogen Fixation in Pure Water. Adv. Mater. 2017, 29, 1701774. [CrossRef]
97. Wang, Y.; Wei, W.; Li, M.; Hu, S.; Zhang, J.; Feng, R. In situ construction of Z-scheme gC3N4/Mg 1.1Al0.3Fe 0.2O1.7 nanorodheterostructures with high N2 photofixation ability under visible light. RSC Adv. 2017, 7, 18099–18107. [CrossRef]
28
Energies 2021, 14, 3732
98. Hu, S.; Zhang, W.; Bai, J.; Lu, G.; Zhang, L.; Wu, G. Construction of a 2D/2D gC3N4/rGO hybrid heterojunction catalyst withoutstanding charge separation ability and nitrogen photofixation performance via a surface protonation process. RSC Adv. 2016,6, 25695–25702. [CrossRef]
99. Cao, S.; Zhou, N.; Gao, F.; Chen, H.; Jiang, F. All-solid-state Z-scheme 3, 4-dihydroxybenzaldehyde-functionalizedGa2O3/graphitic carbon nitride photocatalyst with aromatic rings as electron mediators for visible-light photocatalyticnitrogen fixation. Appl. Catal. B Environ. 2017, 218, 600–610. [CrossRef]
100. Liang, H.; Zou, H.; Hu, S. Preparation of the W 18 O49/gC3N4 heterojunction catalyst with full-spectrum-driven photocatalytic N2 photofixation ability from the UV to near infrared region. New J. Chem. 2017, 41, 8920–8926. [CrossRef]
101. Cong, L.; Yu, Z.; Liu, F.; Huang, W. Electrochemical synthesis of ammonia from N2 and H2O using a typical non-noble metalcarbon-based catalyst under ambient conditions. Catal. Sci. Technol. 2019, 9, 1208–1214. [CrossRef]
102. Kyriakou, V.; Garagounis, I.; Vasileiou, E.; Vourros, A.; Stoukides, M. Progress in the electrochemical synthesis of ammonia. Catal.Today 2017, 286, 2–13. [CrossRef]
103. Garagounis, I.; Vourros, A.; Stoukides, D.; Dasopoulos, D.; Stoukides, M. Electrochemical Synthesis of Ammonia: Recent Effortsand Future Outlook. Membranes 2019, 9, 112. [CrossRef]
104. Wang, B.H.; de Wang, J.; Liu, R.; Xie, Y.H.; Li, Z.J. Synthesis of ammonia from natural gas at atmospheric pressure with dopedceria–Ca3(PO 4)2–K3 PO4 composite electrolyte and its proton conductivity at intermediate temperature. J. Solid State Electrochem.2007, 11, 27–31. [CrossRef]
105. Wang, B.; Liu, R.; Wang, J.; Li, Z.; Xie, Y. Doped ceria-Ca-3 (PO4) 2-K3PO4 composite electrolyte: Proton conductivity atintermediate temperature and application in atmospheric pressure ammonia synthesis. Chin. J. Inorg. Chem. 2005, 21, 1551–1555.
106. Skodra, A.; Stoukides, M. Electrocatalytic synthesis of ammonia from steam and nitrogen at atmospheric pressure. Solid State Ion.2009, 180, 1332–1336. [CrossRef]
107. Jeoung, H.; Kim, J.N.; Yoo, C.-Y.; Joo, J.H.; Yu, J.H.; Song, K.C.; Sharma, M.; Yoon, H.C. Electrochemical synthesis of ammoniafrom water and nitrogen using a Pt/GDC/Pt cell. Korean Chem. Eng. Res. 2014, 52, 58–62. [CrossRef]
108. Murakami, T.; Nishikiori, T.; Nohira, T.; Ito, Y. Electrolytic synthesis of ammonia in molten salts under atmospheric pressure. J.Am. Chem. Soc. 2003, 125, 334–335. [CrossRef]
109. Murakami, T.; Nohira, T.; Goto, T.; Ogata, Y.H.; Ito, Y. Electrolytic ammonia synthesis from water and nitrogen gas in molten saltunder atmospheric pressure. Electrochim. Acta 2005, 50, 5423–5426. [CrossRef]
110. Murakami, T.; Nohira, T.; Araki, Y.; Goto, T.; Hagiwara, R.; Ogata, Y.H. Electrolytic Synthesis of Ammonia from Water andNitrogen under Atmospheric Pressure Using a Boron-Doped Diamond Electrode as a Nonconsumable Anode. Electrochem. SolidState Lett. 2007, 10, E4. [CrossRef]
111. Murakami, T.; Nishikiori, T.; Nohira, T.; Ito, Y. Electrolytic ammonia synthesis from hydrogen chloride and nitrogen gases withsimultaneous recovery of chlorine under atmospheric pressure. Electrochem. Solid-State Lett. 2005, 8, D19–D21. [CrossRef]
112. Murakami, T.; Nohira, T.; Ogata, Y.H.; Ito, Y. Electrolytic ammonia synthesis in molten salts under atmospheric pressure usingmethane as a hydrogen source. Electrochem. Solid-State Lett. 2005, 8, D12–D14. [CrossRef]
113. Murakami, T.; Nohira, T.; Ogata, Y.H.; Ito, Y. Electrochemical synthesis of ammonia and coproduction of metal sulfides fromhydrogen sulfide and nitrogen under atmospheric pressure. J. Electrochem. Soc. 2005, 152, D109–D112. [CrossRef]
114. Licht, S.; Cui, B.; Wang, B.; Li, F.-F.; Lau, J.; Liu, S. Ammonia synthesis by N2 and steam electrolysis in molten hydroxidesuspensions of nanoscale Fe2O3. Science 2014, 345, 637–640. [CrossRef]
115. Kordali, V.; Kyriacou, G.; Lambrou, C. Electrochemical synthesis of ammonia at atmospheric pressure and low temperature in asolid polymer electrolyte cell. Chem. Commun. 2000, 17, 1673–1674. [CrossRef]
116. Marnellos, G.; Stoukides, M. Ammonia synthesis at atmospheric pressure. Science 1998, 282, 98–100. [CrossRef]117. Li, Z.; Liu, R.; Xie, Y.; Feng, S.; Wang, J. A novel method for preparation of doped Ba3(Ca1.18Nb1.82)O9−δ: Application to ammonia
synthesis at atmospheric pressure. Solid State Ion. 2005, 176, 1063–1066. [CrossRef]118. Li, Z.; Liu, R.; Wang, J.; Xu, Z.; Xie, Y.; Wang, B. Preparation of double-doped BaCeO3 and its application in the synthesis of
ammonia at atmospheric pressure. Sci. Technol. Adv. Mater. 2007, 8, 566. [CrossRef]119. Vasileiou, E.; Kyriakou, V.; Garagounis, I.; Vourros, A.; Stoukides, M. Ammonia synthesis at atmospheric pressure in a
BaCe0.2Zr0.7Y0.1O2.9 solid electrolyte cell. Solid State Ion. 2015, 275, 110–116. [CrossRef]120. Zhang, F.; Yang, Q.; Pan, B.; Xu, R.; Wang, H.; Ma, G. Proton conduction in La0.9Sr0.1Ga0.8Mg0.2O3−α ceramic prepared via
microemulsion method and its application in ammonia synthesis at atmospheric pressure. Mater. Lett. 2007, 61, 4144–4148.[CrossRef]
121. Wang, J.-D.; Xie, Y.-H.; Zhang, Z.-F.; Liu, R.-Q.; Li, Z.-J. Protonic conduction in Ca2+-doped La2M2O7 (M= Ce, Zr) with itsapplication to ammonia synthesis electrochemically. Mater. Res. Bull. 2005, 40, 1294–1302. [CrossRef]
122. Xie, Y.-H.; Wang, J.-D.; Liu, R.-Q.; Su, X.-T.; Sun, Z.-P.; Li, Z.-J. Preparation of La1.9Ca0.Zr2O6.95 with pyrochlore structure and itsapplication in synthesis of ammonia at atmospheric pressure. Solid State Ion. 2004, 168, 117–121. [CrossRef]
123. Li, Z.-J.; Liu, R.-Q.; Wang, J.-D.; Xie, Y.-H.; Yue, F. Preparation of BaCe0.8Gd0.2O3−δ by the citrate method and its application inthe synthesis of ammonia at atmospheric pressure. J. Solid State Electrochem. 2005, 9, 201–204. [CrossRef]
124. Guo, Y.; Liu, B.; Yang, Q.; Chen, C.; Wang, W.; Ma, G. Preparation via microemulsion method and proton conduction atintermediate-temperature of BaCe1−xYxO3−α. Electrochem. Commun. 2009, 11, 153–156. [CrossRef]
29

Energies 2021, 14, 3732
125. Vasileiou, E.; Kyriakou, V.; Garagounis, I.; Vourros, A.; Manerbino, A.; Coors, W.; Stoukides, M. Electrochemical enhancement ofammonia synthesis in a BaZr0. 7Ce0. 2Y0. 1O2. 9 solid electrolyte cell. Solid State Ion. 2016, 288, 357–362. [CrossRef]
126. Zhang, M.; Xu, J.; Ma, G. Proton conduction in BaxCe0.8Y0.2O3− α + 0.04ZnO at intermediate temperatures and its application inammonia synthesis at atmospheric pressure. J. Mater. Sci. 2011, 46, 4690–4694. [CrossRef]
127. Liu, R.-Q.; Xie, Y.-H.; Wang, J.-D.; Li, Z.-J.; Wang, B.-H. Synthesis of ammonia at atmospheric pressure with Ce0.8M0.2O2− δ (M=La, Y, Gd, Sm) and their proton conduction at intermediate temperature. Solid State Ion. 2006, 177, 73–76. [CrossRef]
128. Chen, C.; Wang, W.; Ma, G. Proton conduction in La0.9M0.1cGa0.8Mg0.2O3-α at intermediate temperature and its application tosynthesis of ammonia at atmospheric pressure. Acta Chim. Sin. 2009, 67, 623–628.
129. Chen, C.; Ma, G. Preparation, proton conduction, and application in ammonia synthesis at atmospheric pressure ofLa0.9Ba0.1Ga1–xMgxO3–α. J. Mater. Sci. 2008, 43, 5109–5114. [CrossRef]
130. Chen, C.; Ma, G. Proton conduction in BaCe1−xGdxO3−α at intermediate temperature and its application to synthesis of ammoniaat atmospheric pressure. J. Alloy. Compd. 2009, 485, 69–72. [CrossRef]
131. Wang, X.; Yin, J.; Xu, J.; Wang, H.; Ma, G. Chemical stability, ionic conductivity of BaCe0.9−xZrxSm0.10O3−α and its application toammonia synthesis at atmospheric pressure. Chin. J. Chem. 2011, 29, 1114–1118. [CrossRef]
132. Liu, J.; Li, Y.; Wang, W.; Wang, H.; Zhang, F.; Ma, G. Proton conduction at intermediate temperature and its application inammonia synthesis at atmospheric pressure of BaCe 1−xCaxO3−α. J. Mater. Sci. 2010, 45, 5860–5864. [CrossRef]
133. Amar, I.A.; Petit, C.T.; Zhang, L.; Lan, R.; Skabara, P.J.; Tao, S. Electrochemical synthesis of ammonia based on doped-ceria-carbonate composite electrolyte and perovskite cathode. Solid State Ion. 2011, 201, 94–100. [CrossRef]
134. Murakami, T.; Nishikiori, T.; Nohira, T.; Ito, Y. Investigation of anodic reaction of electrolytic ammonia synthesis in molten saltsunder atmospheric pressure. J. Electrochem. Soc. 2005, 152, D75–D78. [CrossRef]
135. Li, F.-F.; Licht, S. Advances in understanding the mechanism and improved stability of the synthesis of ammonia from air andwater in hydroxide suspensions of nanoscale Fe2O3. Inorg. Chem. 2014, 53, 10042–10044. [CrossRef]
136. Cui, B.; Zhang, J.; Liu, S.; Liu, X.; Xiang, W.; Liu, L.; Xin, H.; Lefler, M.J.; Licht, S. Electrochemical synthesis of ammonia directlyfrom N2 and water over iron-based catalysts supported on activated carbon. Green Chem. 2017, 19, 298–304. [CrossRef]
137. Zhang, Z.; Zhong, Z.; Ruiquan, L. Cathode catalysis performance of SmBaCuMO5+δ (M= Fe, Co, Ni) in ammonia synthesis. J.Rare Earths 2010, 28, 556–559. [CrossRef]
138. Lan, R.; Irvine, J.T.; Tao, S. Synthesis of ammonia directly from air and water at ambient temperature and pressure. Sci. Rep. 2013,3, 1–7. [CrossRef]
139. Wang, J.; Liu, R.-Q. Property research of SDC and SSC in ammonia synthesis at atmospheric pressure and low temperature. ActaChim. Sin 2008, 66, 717–721.
140. Liu, R.; Xu, G. Comparison of electrochemical synthesis of ammonia by using sulfonated polysulfone and nafion membrane withSm1.5 Sr0.5 NiO4. Chin. J. Chem. 2010, 28, 139–142. [CrossRef]
141. Xu, G.; Liu, R.; Wang, J. Electrochemical synthesis of ammonia using a cell with a Nafion membrane and SmFe0.7Cu0.3−xNixO3(x= 0−0.3) cathode at atmospheric pressure and lower temperature. Sci. China Ser. B Chem. 2009, 52, 1171–1175. [CrossRef]
142. Zhao, X.; Yin, F.; Liu, N.; Li, G.; Fan, T.; Chen, B. Highly efficient metal–organic-framework catalysts for electrochemical synthesisof ammonia from N 2 (air) and water at low temperature and ambient pressure. J. Mater. Sci. 2017, 52, 10175–10185. [CrossRef]
143. Liu, H.-M.; Han, S.-H.; Zhao, Y.; Zhu, Y.-Y.; Tian, X.-L.; Zeng, J.-H.; Jiang, J.-X.; Xia, B.Y.; Chen, Y. Surfactant-free atomicallyultrathin rhodium nanosheet nanoassemblies for efficient nitrogen electroreduction. J. Mater. Chem. A 2018, 6, 3211–3217.[CrossRef]
144. Song, Y.; Johnson, D.; Peng, R.; Hensley, D.K.; Bonnesen, P.V.; Liang, L.; Huang, J.; Yang, F.; Zhang, F.; Qiao, R. A physical catalystfor the electrolysis of nitrogen to ammonia. Sci. Adv. 2018, 4, e1700336. [CrossRef] [PubMed]
145. Carreon, M.L. Plasma catalytic ammonia synthesis: State of the art and future directions. J. Phys. D Appl. Phys. 2019, 52, 483001.[CrossRef]
146. Chen, G.; Wang, L.; Godfroid, T.; Snyders, R. Progress in Plasma-Assisted Catalysis for Carbon Dioxide Reduction, In Plasma Chemistryand Gas Conversion; IntechOpen: London, UK, 2018.
147. Fridman, A. Plasma Chemistry; Cambridge University Press: Cambridge, UK, 2008.148. Bruggeman, P.; Sadeghi, N.; Schram, D.; Linss, V. Gas temperature determination from rotational lines in non-equilibrium
plasmas: A review. Plasma Sources Sci. Technol. 2014, 23, 023001. [CrossRef]149. Brewer, K.A.; Westhaver, J.W. The Synthesis of Ammonia in the Glow Discharge. J. Phys. Chem. 1928, 33, 883–895. [CrossRef]150. Maltsev, A.; Churina, L.; Eremin, E. Activity of heterogeneous catalysts in synthesis of ammonia in glow discharge. Russ. J. Phys.
Chem. USSR 1968, 42, 1235.151. Eremin, E.N.; Maltsev, A.N.; Belova, V.M. Behaviour of a Catalyst in a Glow-discharge Plasma. Russ. J. Phys. Chem. 1969, 43, 443.152. Yin, S.K.; Venugopalan, M. Plasma chemical synthesis. I. Effect of electrode material on the synthesis of ammonia. Plasma Chem. Plasma
Process. 1983, 3, 343–350. [CrossRef]153. Sugiyama, K.; Akazawa, K.; Oshima, M.; Miura, H.; Matsuda, T.; Nomura, O. Ammonia synthesis by means of plasma over MgO
catalyst. Plasma Chem. Plasma Process. 1986, 6, 179–193. [CrossRef]154. Touvelle, M.; Licea, J.M.; Venugopalan, M. Plasma chemical synthesis. II. Effect of wall surface on the synthesis of ammonia. Plasma
Chem. Plasma Process. 1987, 7, 101–108. [CrossRef]
30

Energies 2021, 14, 3732
155. Uyama, H.; Uchikura, T.; Niijima, H.; Matsumoto, O. Synthesis of ammonia with RF discharge. Adsorption of products on zeolite.Chem. Lett. 1987, 16, 555–558. [CrossRef]
156. Uyama, H.; Matsumoto, O. Synthesis of ammonia in high-frequency discharges. Plasma Chem. Plasma Process. 1989, 9, 13–24.[CrossRef]
157. Shah, J.; Wang, W.; Bogaerts, A.; Carreon, M.L. Ammonia synthesis by radio frequency plasma catalysis: Revealing the underlyingmechanisms. ACS Appl. Energy Mater. 2018, 1, 4824–4839. [CrossRef]
158. Shah, R.J.; Harrison, J.M.; Carreon, M.L. Ammonia plasma-catalytic synthesis using low melting point alloys. Catalysts 2018, 8,437. [CrossRef]
159. Shah, J.; Wu, T.; Lucero, J.; Carreon, M.A.; Carreon, M.L. Nonthermal Plasma Synthesis of Ammonia over Ni-MOF-74. ACSSustain. Chem. Eng. 2018, 7, 377–383. [CrossRef]
160. Siemsen, L.G. The Synthesis of Ammonia from Hydrogen and Atomic Nitrogen on the Rh Surfac. 1990. Available online:https://lib.dr.iastate.edu/cgi/viewcontent.cgi?article=12220&context=rtd (accessed on 9 January 2021).
161. Nakajima, J.; Sekiguchi, H. Synthesis of ammonia using microwave discharge at atmospheric pressure. Thin Solid Film. 2008, 516,4446–4451. [CrossRef]
162. Bai, X.; Tiwari, S.; Robinson, B.; Killmer, C.; Li, L.; Hu, J. Microwave catalytic synthesis of ammonia from methane and nitrogen.Catal. Sci. Technol. 2018, 8, 6302–6305. [CrossRef]
163. Eremin, E.; Maltsev, A.; Syaduk, V. Catalytic synthesis of ammonia in a barrier discharge. Russ. J. Phys. Chem. USSR 1971, 45, 635.164. Mingdong, B.; Xiyao, B.; Zhitao, Z.; Mindi, B. Synthesis of ammonia in a strong electric field discharge at ambient pressure.
Plasma Chem. Plasma Process. 2000, 20, 511–520. [CrossRef]165. Bai, M.; Zhang, Z.; Bai, X.; Bai, M.; Ning, W. Plasma synthesis of ammonia with a microgap dielectric barrier discharge at ambient
pressure. IEEE Trans. Plasma Sci. 2003, 31, 1285–1291.166. Mizushima, T.; Matsumoto, K.; Sugoh, J.-I.; Ohkita, H.; Kakuta, N. Tubular membrane-like catalyst for reactor with dielectric-
barrier-discharge plasma and its performance in ammonia synthesis. Appl. Catal. A Gen. 2004, 265, 53–59. [CrossRef]167. Mizushima, T.; Matsumoto, K.; Ohkita, H.; Kakuta, N. Catalytic effects of metal-loaded membrane-like alumina tubes on ammonia
synthesis in atmospheric pressure plasma by dielectric barrier discharge. Plasma Chem. Plasma Process. 2007, 27, 1–11. [CrossRef]168. Bai, M.; Zhang, Z.; Bai, M.; Bai, X.; Gao, H. Synthesis of ammonia using CH4/N2 plasmas based on micro-gap discharge under
environmentally friendly condition. Plasma Chem. Plasma Process. 2008, 28, 405–414. [CrossRef]169. Bai, M.; Zhang, Z.; Bai, M.; Bai, X.; Gao, H. Conversion of methane to liquid products, hydrogen, and ammonia with environmen-
tally friendly condition-based microgap discharge. J. Air Waste Manag. Assoc. 2008, 58, 1616–1621. [CrossRef]170. Hong, J.; Aramesh, M.; Shimoni, O.; Seo, D.H.; Yick, S.; Greig, A.; Charles, C.; Prawer, S.; Murphy, A.B. Plasma catalytic synthesis
of ammonia using functionalized-carbon coatings in an atmospheric-pressure non-equilibrium discharge. Plasma Chem. PlasmaProcess. 2016, 36, 917–940. [CrossRef]
171. Peng, P.; Li, Y.; Cheng, Y.; Deng, S.; Chen, P.; Ruan, R. Atmospheric pressure ammonia synthesis using non-thermal plasmaassisted catalysis. Plasma Chem. Plasma Process. 2016, 36, 1201–1210. [CrossRef]
172. Gómez-Ramírez, A.; Montoro-Damas, A.M.; Cotrino, J.; Lambert, R.M.; González-Elipe, A.R. About the enhancement of chemicalyield during the atmospheric plasma synthesis of ammonia in a ferroelectric packed bed reactor. Plasma Process. Polym. 2017, 14,1600081. [CrossRef]
173. Kim, H.H.; Teramoto, Y.; Ogata, A.; Takagi, H.; Nanba, T. Atmospheric-pressure nonthermal plasma synthesis of ammonia overruthenium catalysts. Plasma Process. Polym. 2017, 14, 1600157. [CrossRef]
174. Aihara, K.; Akiyama, M.; Deguchi, T.; Tanaka, M.; Hagiwara, R.; Iwamoto, M. Remarkable catalysis of a wool-like copperelectrode for NH 3 synthesis from N 2 and H 2 in non-thermal atmospheric plasma. Chem. Commun. 2016, 52, 13560–13563.[CrossRef]
175. Xie, D.; Sun, Y.; Zhu, T.; Fan, X.; Hong, X.; Yang, W. Ammonia synthesis and by-product formation from H2O, H2 and N2 bydielectric barrier discharge combined with an Ru/Al2 O3 catalyst. RSC Adv. 2016, 6, 105338–105346. [CrossRef]
176. Patil, B. Plasma (Catalyst)-Assisted Nitrogen Fixation: Reactor Development for Nitric Oxide and Ammonia Production; Micro FlowChemistry and Synthetic Methodology: Eindhoven, The Netherlands, 2017.
177. Peng, P.; Cheng, Y.; Hatzenbeller, R.; Addy, M.; Zhou, N.; Schiappacasse, C.; Chen, D.; Zhang, Y.; Anderson, E.; Liu, Y. Ru-basedmultifunctional mesoporous catalyst for low-pressure and non-thermal plasma synthesis of ammonia. Int. J. Hydrog. Energy 2017,42, 19056–19066. [CrossRef]
178. Mehta, P.; Barboun, P.; Herrera, F.A.; Kim, J.; Rumbach, P.; Go, D.B.; Hicks, J.C.; Schneider, W.F. Overcoming ammonia synthesisscaling relations with plasma-enabled catalysis. Nat. Catal. 2018, 1, 269–275. [CrossRef]
179. Peng, P.; Chen, P.; Addy, M.; Cheng, Y.; Anderson, E.; Zhou, N.; Schiappacasse, C.; Zhang, Y.; Chen, D.; Hatzenbeller, R.Atmospheric plasma-assisted ammonia synthesis enhanced via synergistic catalytic absorption. ACS Sustain. Chem. Eng. 2018, 7,100–104. [CrossRef]
180. Uyama, H.; Nakamura, T.; Tanaka, S.; Matsumoto, O. Catalytic effect of iron wires on the syntheses of ammonia and hydrazine ina radio-frequency discharge. Plasma Chem. Plasma Process. 1993, 13, 117–131. [CrossRef]
181. Akay, G.; Zhang, K. Process intensification in ammonia synthesis using novel coassembled supported microporous catalystspromoted by nonthermal plasma. Ind. Eng. Chem. Res. 2017, 56, 457–468. [CrossRef]
31

Energies 2021, 14, 3732
182. Hawtof, R.; Ghosh, S.; Guarr, E.; Xu, C.; Sankaran, R.M.; Renner, J.N. Catalyst-free, highly selective synthesis of ammonia fromnitrogen and water by a plasma electrolytic system. Sci. Adv. 2019, 5, eaat5778. [CrossRef]
183. Cheddie, D. Ammonia as a Hydrogen Source for Fuel Cells: A Review; InTechOpen: London, UK, 2012.184. Yu, X.; Ye, S. Recent advances in activity and durability enhancement of Pt/C catalytic cathode in PEMFC: Part, I. Physico-
chemical and electronic interaction between Pt and carbon support, and activity enhancement of Pt/C catalyst. J. Power Sources2007, 172, 133–144. [CrossRef]
185. Lan, R.; Tao, S. Direct ammonia alkaline anion-exchange membrane fuel cells. Electrochem. Solid-State Lett. 2010, 13, B83–B86.[CrossRef]
186. Hejze, T.; Besenhard, J.; Kordesch, K.; Cifrain, M.; Aronsson, R. Current status of combined systems using alkaline fuel cells andammonia as a hydrogen carrier. J. Power Sources 2008, 176, 490–493. [CrossRef]
187. Unlu, M.; Zhou, J.; Kohl, P.A. Anion exchange membrane fuel cells: Experimental comparison of hydroxide and carbonateconductive ions. Electrochem. Solid-State Lett. 2009, 12, B27–B30. [CrossRef]
188. Suzuki, S.; Muroyama, H.; Matsui, T.; Eguchi, K. Fundamental studies on direct ammonia fuel cell employing anion exchangemembrane. J. Power Sources 2012, 208, 257–262. [CrossRef]
189. Carrette, L.; Friedrich, K.A.; Stimming, U. Fuel cells: Principles, types, fuels, and applications. ChemPhysChem 2000, 1, 162–193.[CrossRef]
190. Meng, G.; Ma, G.; Ma, Q.; Peng, R.; Liu, X. Ceramic membrane fuel cells based on solid proton electrolytes. Solid State Ion. 2007,178, 697–703. [CrossRef]
191. Li, T.; Rabuni, M.; Kleiminger, L.; Wang, B.; Kelsall, G.; Hartley, U.; Li, K. A highly-robust solid oxide fuel cell (SOFC):Simultaneous greenhouse gas treatment and clean energy generation. Energy Environ. Sci. 2016, 9, 3682–3686. [CrossRef]
192. Siddiqui, O.; Dincer, I. A review and comparative assessment of direct ammonia fuel cells. Therm. Sci. Eng. Prog. 2018, 5, 568–578.[CrossRef]
193. Lan, R.; Tao, S. Ammonia as a suitable fuel for fuel cells. Front. Energy Res. 2014, 2, 35. [CrossRef]194. Ishak, F.; Dincer, I.; Zamfirescu, C. Thermodynamic analysis of ammonia-fed solid oxide fuel cells. J. Power Sources 2012, 202,
157–165. [CrossRef]195. Vayenas, C.; Farr, R. Cogeneration of electric energy and nitric oxide. Science 1980, 208, 593–594. [CrossRef]196. Fournier, G.; Cumming, I.; Hellgardt, K. High performance direct ammonia solid oxide fuel cell. J. Power Sources 2006, 162,
198–206. [CrossRef]197. Hossain, S.; Abdalla, A.M.; Jamain, S.N.B.; Zaini, J.H.; Azad, A.K. A review on proton conducting electrolytes for clean energy
and intermediate temperature-solid oxide fuel cells. Renew. Sustain. Energy Rev. 2017, 79, 750–764. [CrossRef]198. Jeerh, G.; Zhang, G.M.; Tao, S. Recent progress in ammonia fuel cells and their potential applications. J. Mater. Chem. A 2021.199. Wojcik, A.; Middleton, H.; Damopoulos, I. Ammonia as a fuel in solid oxide fuel cells. J. Power Sources 2003, 118, 342–348.
[CrossRef]200. Choudhary, V.T.; Goodman, D. CO-free fuel processing for fuel cell applications. Catal. Today 2002, 77, 65–78. [CrossRef]201. Ma, Q.; Ma, J.; Zhou, S.; Yan, R.; Gao, J.; Meng, G. A high-performance ammonia-fueled SOFC based on a YSZ thin-film electrolyte.
J. Power Sources 2007, 164, 86–89. [CrossRef]202. Zhang, L.; You, C.; Weishen, Y.; Liwu, L. A direct ammonia tubular solid oxide fuel cell. Chin. J. Catal. 2007, 28, 749–751.
[CrossRef]203. Liu, M.; Peng, R.; Dong, D.; Gao, J.; Liu, X.; Meng, G. Direct liquid methanol-fueled solid oxide fuel cell. J. Power Sources 2008, 185,
188–192. [CrossRef]204. Meng, G.; Jiang, C.; Ma, J.; Ma, Q.; Liu, X. Comparative study on the performance of a SDC-based SOFC fueled by ammonia and
hydrogen. J. Power Sources 2007, 173, 189–193. [CrossRef]205. Pelletier, L.; McFarlan, A.; Maffei, N. Ammonia fuel cell using doped barium cerate proton conducting solid electrolytes. J. Power
Sources 2005, 145, 262–265. [CrossRef]206. Maffei, N.; Pelletier, L.; Charland, J.; McFarlan, A. An intermediate temperature direct ammonia fuel cell using a proton
conducting electrolyte. J. Power Sources 2005, 140, 264–267. [CrossRef]207. Maffei, N.; Pelletier, L.; Charland, J.; McFarlan, A. An ammonia fuel cell using a mixed ionic and electronic conducting electrolyte.
J. Power Sources 2006, 162, 165–167. [CrossRef]208. Maffei, N.; Pelletier, L.; McFarlan, A. A high performance direct ammonia fuel cell using a mixed ionic and electronic conducting
anode. J. Power Sources 2008, 175, 221–225. [CrossRef]209. Ma, Q.; Peng, R.; Lin, Y.; Gao, J.; Meng, G. A high-performance ammonia-fueled solid oxide fuel cell. J. Power Sources 2006, 161,
95–98. [CrossRef]210. Lin, Y.; Ran, R.; Guo, Y.; Zhou, W.; Cai, R.; Wang, J.; Shao, Z. Proton-conducting fuel cells operating on hydrogen, ammonia and
hydrazine at intermediate temperatures. Int. J. Hydrog. Energy 2010, 35, 2637–2642. [CrossRef]211. Zhang, L.; Yang, W. Direct ammonia solid oxide fuel cell based on thin proton-conducting electrolyte. J. Power Sources 2008, 179,
92–95. [CrossRef]212. Xie, K.; Ma, Q.; Lin, B.; Jiang, Y.; Gao, J.; Liu, X.; Meng, G. An ammonia fuelled SOFC with a BaCe0.9Nd0.1O3−δ thin electrolyte
prepared with a suspension spray. J. Power Sources 2007, 170, 38–41. [CrossRef]
32

Energies 2021, 14, 3732
213. Khan, M.R.; Amin, M.; Rahman, M.; Akbar, F.; Ferdaus, K. Factors affecting the performance of double chamber microbial fuelcell for simultaneous wastewater treatment and power generation. Pol. J. Chem. Technol. 2013, 15, 7–11. [CrossRef]
214. Li, W.-W.; Yu, H.-Q.; He, Z. Towards sustainable wastewater treatment by using microbial fuel cells-centered technologies. EnergyEnviron. Sci. 2014, 7, 911–924. [CrossRef]
215. Yan, C.; Liu, L. Sn-doped V2O5 nanoparticles as catalyst for fast removal of ammonia in air via PEC and PEC-MFC. Chem. Eng. J.2020, 392, 123738. [CrossRef]
216. Zacharakis-Jutz, G. Performance Characteristics of Ammonia Engines Using Direct Injection Strategies. 2013, p. 13032. Availableonline: https://lib.dr.iastate.edu/etd/13032 (accessed on 15 February 2021).
217. Gross, W.C.; Kong, S.-C. Performance characteristics of a compression-ignition engine using direct-injection ammonia–DMEmixtures. Fuel 2013, 103, 1069–1079. [CrossRef]
218. Zamfirescu, C.; Dincer, I. Ammonia as a green fuel and hydrogen source for vehicular applications. Fuel Process. Technol. 2009, 90,729–737. [CrossRef]
219. Mørch, C.S.; Bjerre, A.; Gøttrup, M.P.; Sorenson, S.C.; Schramm, J. Ammonia/hydrogen mixtures in an SI-engine: Engineperformance and analysis of a proposed fuel system. Fuel 2011, 90, 854–864. [CrossRef]
220. Zamfirescu, C.; Dincer, I. Using ammonia as a sustainable fuel. J. Power Sources 2008, 185, 459–465. [CrossRef]221. Brohi, E. Ammonia as Fuel for Internal Combustion Engines? 2014. Available online: https://publications.lib.chalmers.se/
records/fulltext/207145/207145.pdf (accessed on 23 December 2020).222. Reiter, J.A.; Kong, S.-C. Diesel engine operation using ammonia as a carbon-free fuel. In ASME 2010 Internal Combustion Engine
Division Fall Technical Conference; American Society of Mechanical Engineers Digital Collection: San Antonio, TX, USA, 2010.223. Pearsall, J.T.; Garabedian, C.G. Combustion of anhydrous ammonia in diesel engines. SAE Trans. 1968, 3213–3221.224. Garabedian, G.C.; Johnson, J.H. The Theory of Operation of an Ammonia Burning Internal Combustion Engine; Army Tank-Automotive
Center: Warren, MI, USA, 1966; pp. 333–348.225. Cooper, J.; Crookes, R.; Mozafari, A.; Rose, J. Ammonia as a Fuel for the IC Engine. In Proceedings of the International Conference
on Environmental Pollution, Zurich, Switzerland, 31 December 1991.226. Reiter, J.A.; Kong, S.-C. Demonstration of compression-ignition engine combustion using ammonia in reducing greenhouse gas
emissions. Energy Fuels 2008, 22, 2963–2971. [CrossRef]227. Kong, S.-C. A study of natural gas/DME combustion in HCCI engines using CFD with detailed chemical kinetics. Fuel 2007, 86,
1483–1489. [CrossRef]228. Ryu, K.; Zacharakis-Jutz, G.E.; Kong, S.-C. Effects of gaseous ammonia direct injection on performance characteristics of a
spark-ignition engine. Appl. Energy 2014, 116, 206–215. [CrossRef]229. Grannell, S.M.; Assanis, D.N.; Bohac, S.V.; Gillespie, D.E. The operating features of a stoichiometric, ammonia and gasoline
dual fueled spark ignition engine. In ASME 2006 International Mechanical Engineering Congress and Exposition; American Societyof Mechanical Engineers Digital Collection: New York, NY, USA, 2006; Available online: https://nh3fuelassociation.org/wp-content/uploads/2012/05/grannell_nh3.pdf (accessed on 18 January 2021).
230. Duynslaegher, C. Experimental and Numerical Study of Ammonia Combustion; University of Leuven: Leuven, Belgium, 2011; pp.1–314. Available online: https://dial.uclouvain.be/pr/boreal/object/boreal:89103 (accessed on 12 January 2021).
231. Ezzat, M.; Dincer, I. Comparative assessments of two integrated systems with/without fuel cells utilizing liquefied ammonia as afuel for vehicular applications. Int. J. Hydrog. Energy 2018, 43, 4597–4608. [CrossRef]
232. Hansson, J.; Fridell, E.; Brynolf, S. On the Potential of Ammonia as Fuel for Shipping: A Synthesis of Knowledge; Lighthouse SwedishMaritime Competence Centre: Göteborg, Sweden, 2020.
233. De Vries, N. Safe and Effective Application of Ammonia as a Marine Fuel; Delft University of Technology: Delft, The Netherland, 2019.234. Laursen, R.S. Ship operation using LPG and ammonia as fuel on MAN B&W dual fuel ME-LGIP engines. In Proceedings of the
15th Annual NH3 Fuel Conference, Pittsburgh, PA, USA, 31 October–1 November 2018.235. Shrestha, K.P.; Seidel, L.; Zeuch, T.; Mauss, F. Detailed kinetic mechanism for the oxidation of ammonia including the formation
and reduction of nitrogen oxides. Energy Fuels 2018, 32, 10202–10217. [CrossRef]236. Jojka, J.; Slefarski, R. Dimensionally reduced modeling of nitric oxide formation for premixed methane-air flames with ammonia
content. Fuel 2018, 217, 98–105. [CrossRef]237. Nakamura, H.; Shindo, M. Effects of radiation heat loss on laminar premixed ammonia/air flames. Proc. Combust. Inst. 2019, 37,
1741–1748. [CrossRef]238. Kobayashi, H.; Hayakawa, A.; Somarathne, K.K.A.; Okafor, E.C. Science and technology of ammonia combustion. Proc. Combust.
Inst. 2019, 37, 109–133. [CrossRef]239. Karabeyoglu, A.; Evans, B.; Stevens, J.; Cantwell, B.; Micheletti, D. Development of ammonia based fuels for environmentally
friendly power generation. In Proceedings of the 10th International Energy Conversion Engineering Conference, Atlanta, GA,USA, 30 July–1 August 2012.
240. Iki, N.; Kurata, O.; Matsunuma, T.; Inoue, T.; Suzuki, M.; Tsujimura, T.; Furutani, H. Micro gas turbine operation with keroseneand ammonia. In Proceedings of the 11th annual NH3 Fuel Conference, Iowa, IA, USA, 21–24 September 2014.
241. Iki, N.; Kurata, O.; Matsunuma, T.; Inoue, T.; Suzuki, M.; Tsujimura, T.; Furutani, H. Micro gas turbine firing kerosene andammonia. In ASME Turbo Expo 2015: Turbine Technical Conference and Exposition; American Society of Mechanical Engineers DigitalCollection: Montreal, QC, Canada, 2015.
33

Energies 2021, 14, 3732
242. Hayakawa, A.; Goto, T.; Mimoto, R.; Arakawa, Y.; Kudo, T.; Kobayashi, H. Laminar burning velocity and Markstein length ofammonia/air premixed flames at various pressures. Fuel 2015, 159, 98–106. [CrossRef]
243. Okafor, E.C.; Naito, Y.; Colson, S.; Ichikawa, A.; Kudo, T.; Hayakawa, A.; Kobayashi, H. Experimental and numerical study of thelaminar burning velocity of CH4–NH3–air premixed flames. Combust. Flame 2018, 187, 185–198. [CrossRef]
244. Ito, S.; Kato, S.; Saito, T.; Fujimori, T.; Kobayashi, H. Development of ammonia/natural gas dual fuel gas turbine combustor. InProceedings of the NH3 Fuel Conference, Los Angeles, CA, USA, 18–21 September 2016.
245. Onishi, S.; Ito, S.; Uchida, M.; Kato, S.; Saito, T.; Fujimori, T.; Kobayashi, H. Methods for Low NOx Combustion in Ammo-nia/Natural Gas Dual Fuel Gas Turbine Combustor. In Proceedings of the 2017 AIChE Annual Meeting, AIChE, MinneapolisConvention Center, Minneapolis, MN, USA, 29 October–3 November 2017.
246. Ito, S.; Uchida, M.; Onishi, S.; Fujimor, T.; Kobayashi, T. Performance of Ammonia–Natural Gas Co-fired Gas Turbine for PowerGeneration. In Proceedings of the 15th Annu. NH3 Fuel Conference, Pittsburgh, PA, USA, 31 October–1 November 2018.
34

energies
Review
Barriers and Solutions for Increasing the Integrationof Solar Photovoltaic in Kenya’s Electricity Mix
Dominic Samoita 1, Charles Nzila 2, Poul Alberg Østergaard 3,* and Arne Remmen 4
1 Department of Electrical and Communications Engineering, Moi University, P.O. Box 3900 Eldoret, Kenya;[email protected]
2 Department of Manufacturing, Industrial and Textiles Engineering, Moi University,P.O. Box 3900 Eldoret, Kenya; [email protected]
3 Department of Planning, Aalborg University, Rendsburggade 14, 9000 Aalborg, Denmark4 Department of Planning, Aalborg University, A.C. Meyers Vænge 15, 2450 Copenhagen, Denmark;
[email protected]* Correspondence: [email protected]; Tel.: +45-9940-8424
Received: 4 September 2020; Accepted: 13 October 2020; Published: 20 October 2020
Abstract: Currently, Kenya depends mainly on oil, geothermal energy and hydro resources forelectricity production, however all three have associated issues. Oil-based electricity generationis environmentally harmful, expensive and a burden to the national trade balance. The rivers forhydropower and their tributaries are found in arid and semi-arid areas with erratic rainfall leading toproblems of supply security, and geothermal exploitation has cost and risk issues amongst others.Given these problems and the fact that Kenya has a significant yet underexploited potential forphoto voltaic (PV)-based power generation, the limited—although growing—exploitation of solarPV in Kenya is explored in this paper as a means of diversifying and stabilising electricity supply.The potential for integration of PV into the Kenyan electricity generation mix is analysed togetherwith the sociotechnical, economic, political, and institutional and policy barriers, which limit PVintegration. We argue that these barriers can be overcome with improved and more robust policyregulations, additional investments in research and development, and improved coordination of theuse of different renewable energy sources. Most noticeably, storage solutions and other elements offlexibility need to be incorporated to balance the intermittent character of electricity generation basedon solar PV.
Keywords: technical; economic; institutional; policy; pumped hydro storage
1. Introduction
Nations in the developed world are transitioning towards the use of renewable energy sources(RES) as the main resource for meeting energy needs because of its potential to address issues of climatechange [1]. As applications in the economically developed countries have helped to drive down cost,low and middle-income countries are also increasingly looking towards RES. Up until 2008, however,most countries had not included PV technology into their electricity generation mix [2]. One of thereasons is that PV technology lacked cost competitiveness when compared to other RES like windpower as well as when compared to power generation based on fossil fuels.
In general, in terms of installations, fossil fuel-based technologies have had an upper hand overPV on a global scale. Concerns, however, have mounted over the steady increase of greenhousegas emissions, which has been prompting governments to adopt planning practices and policies [3]as well as subsidies favouring RES [4]. Such concerns as well as reductions in cost of PV technologyhave resulted in increased uptake and technology development in parallel.
Energies 2020, 13, 5502; doi:10.3390/en13205502 www.mdpi.com/journal/energies35

Energies 2020, 13, 5502
The cost of PV systems in Germany for example, has been declining steadily and significantlyover the past decade; this is attributed to the rapid technological development spurred by governmentsubsidies [5]. Installed costs between 2006 and 2013 declined by an average of 16% per year. By thefirst quarter of 2017, the typical cost of solar PV in typical roof top applications had fallen to 1640 EURper kWp from over 5000 EUR per kWp in 2006 [6].
This decrease in installation cost took place as installed capacity increased in the same time period.By the end of 2018, 1.5 million rooftop installations had thus been installed in Germany [7]—a countryof approximately 42 million households [8].
Concurrently, the development of PV technology that resulted in increased efficiency from 15% toover 30% [9]. The decreasing module costs combined with increasing efficiencies have resulted in acompound decrease in the cost of electricity from PV modules. Consequently, in the global context,PV has become much more competitive and the cumulative capacity of PV technology has increasedsignificantly [10].
The development has been uneven across the globe though. In a study by [11], the currentstatus and outlook of RES in Morocco was assessed. Morocco has exceptional good potential for theexploitation of particularly PV, but also good prospects for wind power—two technologies alreadyadopted in the country. In the study, challenges and barriers to the development of RES and thenational strategy for energy security and how the challenges will be met was evaluated using timeseries method. Results of the study showed that in the long term, towards 2030, wind and solar powercan be injected without creating constraints of transit on the solar and wind power.
Kenya, on the other hand is neither as ambition nor as successful in terms of PV developmentin spite of a good solar radiation. Data show that the total installed PV capacity in Kenya was onlyabout 50.25 MWp as of 2019 [12]. This capacity is marginal compared to the total installed powerproduction capacity of approximately 5000 MW in Kenya. PV is projected to grow at 15% annually [12]in Kenya mainly attributed to the decreasing prices and PV thus becoming more competitive, but thisis still marginal compared to potentials, and in many case developments is on off-grid systems.For these applications, in addition to wishing to save money, consumers like the idea of beingautonomous [13]—a motivational factor also seen in e.g., Denmark, where PV owners may even optfor costly storage systems to increase their level of electricity autonomy [14].
While a 15% annual increase in other areas would seem high, it does, however, not suffice fora transition as this expansion rate would require many decades of installations. Also, concurrently,an increase in income and a process of urbanization is generating increases in fossil fuel usage inKenya [15] that also needs to be balanced through increased RES exploitation. Besides, the peakdemand for electricity increased by 3.6% from 2018 to 2019, and the peak is projected to increase from1802 MW in 2018 to 15,000 MW by 2030 [12]. More RES development is thus needed and any barriershave to be overcome.
In fact, the Kenyan electricity generation mix (See Figure 1) shows that fossil fuels only providedapproximately one quarter of the electricity while hydropower and geothermal had even moresignificant shares of approximately 30% each. Thus Kenya is heavily supplied by RES as it is.
Kenya has a high potential for the use of geothermal energy, with potentials to increase fromcurrently about 200 MW up towards 10 GW [16]. The exploitation faces several challenges howeverincluding rising investment charges, increasing resource exploration and expansion risks, land-useconflicts, inadequate expertise, and high investment in grid infrastructure due to long distances fromgeothermal sites to existing load centres [17].
Hydropower in Kenya is mainly in the form of dammed hydro power plants with productionsusceptible to drought. This results in a less-than-optimal robustness and outright load shedding [18].Pumped hydro storage could provide more flexibility by also enabling also excess generation fromwind and PV to be stored for later use. Wind and PV could thus assist Kenyan hydropower and makingit more robust against drought.
36

Energies 2020, 13, 5502
Figure 1. Kenyan electricity production mix shares in 2019. Based on data from [12].
Also, both hydropower and geothermal projects are characterised by long lead-times, thus in spiteof potentials, these may not be adequate to fill the projected production gap.
Thus, as it is—and also combined with other constraints—the electricity system in Kenya suffersfrom frequent power outages. In a typical month, firms and homesteads connected to the gridexperience on an average about six power outages, each lasting approximately five hours [19].The economic cost of power interruptions is assessed to be about 7.1% of the power distributioncompanies’ sales. Power outages therefore have a significant economic cost on businesses [19] and inturn on the Kenyan society.
Kenya has a large potential for PV since it is located near the equator, which provides it with ahigh insolation [18]. The insolation levels in Kenya and the large rural population is a stimulant for thepenetration of solar power. According to [20] about 70% of the land area in Kenya has the potential ofreceiving approximately 5 kWh/m2/day throughout the year with an annual mean radiation of 6.98 kWh/m2.
A literature survey on the integration of PV in the electricity generation mix reveals, however,that focus is predominantly on Europe and United States of America. Little attention has beenpaid to emerging economies such as Kenya where electricity production and demand is expectedto grow considerably in the coming years. Besides, there is room for adopting an infrastructurecapable of meeting the future power demands using RES from the outset—and given the resourceavailability—notably PV.
Also, no study has highlighted the potential of and possible barriers to solar PV generationwhere hydropower already exists. Studies on PV in Kenya have a leaning towards ensuring access toelectricity in areas located far away from the national grid as opposed to grid-connected projects [21,22].This of course limits the analyses of interplay with hydropower. The only exceptions to off-gridanalyses to date are viability studies in South Africa [23] and a review focussing on the development ofmini-grids [24]. This paper therefore focuses on the prospects of balancing grid-connected PV systemswith hydropower generation.
In spite of the demonstrated large potential of PV utilisation in Kenya, current exploitation isstill limited, and projections show a modest growth that may not even match the increase in electricityand general energy consumption. Also, a predominant focus in the existing studies on Kenya ison the potential of PV as a source of renewable energy from a technical perspective and with aparticular focus on stand-alone applications. While other countries—especially more economicallydeveloped—already target an increased PV exploitation even with poorer solar insulation conditionsthan Kenya, the country is still lagging behind in this respect. To exploit the potential more thoroughly,there is need for proper analysis of the opportunities and barriers for integration of PV in Kenya’selectricity generation mix. The scope of this paper is therefore to analyse the potentials and barriers fordeployment of PV technology in Kenya’s electricity generation mix.
37

Energies 2020, 13, 5502
The paper is based on a review of the existing knowledge within the field, which is subsequentlysynthesized to provide a multifaceted perspective on opportunities and barriers to grid-connected PVin Kenya. The paper does not investigate off-grid PV systems.
2. Materials and Methods
The paper is based on existing literature as well as primary data collection from selected cases ofgrid-connected solar PV that have either recently been added to the national grid or is in the process ofbeing connected in Kenya.
2.1. Literature Survey
The literature survey included a systematic four-step literature review where Scopus was used tolocate the published literature.
In the first step, a combination of keywords was identified as follows: (“barriers” OR“opportunities”) AND “PV”. This combination was searched for in the abstracts, titles and keywordsof the publications from 2012 to 2020 yielding 264 journal papers. Note that the search was notrestricted to Kenya but yielded results from analyses worldwide to capture barriers and opportunitiesmore generally.
In the second step, each publication was evaluated for its relevance to the integration of PVsystems in the electricity generation mix, based on the abstract, title and keywords. If a publicationhad relevance, it was eligible for inclusion in the third step. This resulted in 102 journal papers.
In the third step, the full texts were evaluated in detail for their relevance to the barriers andopportunities for integration of PV technology in Kenya’s electricity generation mix. This procedureensured that no relevant information was missed from the publications. If a study addressed any kindof opportunity or barrier to the diffusion, it was included for analysis in the fourth step. Consequently,this resulted in 46 journal papers.
2.2. Analytical Framework
Barriers to renewable energy technology penetration in general and to PV technology specificallyare global phenomena, and appear quite similarly in the literature, with only some country ortechnology-specific differences. Child et al. [25] has categorized major barriers to renewable energytechnology penetration in six categories: “market failure/imperfection, market distortions, economicand financial, institutional, technical, and social, cultural and behavioural”.
Some of the barriers noted by [25] include limited access to information, a bias for establishedenergy resources, financial barriers, the circumstance that externalities are not factored into thedecision-main process, lack of training, and a lacking acceptance [26].
Hvelplund has paid extensive attention to ownership [27,28] as a barrier and as an incentive forthe advancement of energy technologies, however in our assessment we found little indication of theimpacts of ownership in terms of acting as a barrier or opportunity. Some anecdotal evidence exists interms of what type of actors have adapted PV technology in Kenya—but mainly on off-grid applications.
Also, not all the barriers identified by [25] are relevant or applicable in the Kenyan context.These categories of barriers and opportunities for success were therefore revisited and updated to makethem relevant in the Kenyan context. Consequently, the range of barriers constraining the deploymentof PV was categorized into technological, economic, institutional and policy as shown in Figure 2.This categorization is applied as the analytical framework.
As the fourth step in this analysis, the four categories of barriers and opportunities identified inthe analytical framework presented in Figure 2 were evaluated. In addition to the literature searchand analysis of other secondary materials such as government reports, conference papers and peerreviewed articles, this paper draws on in-sights from case studies on the Garissa solar PV project andthe UNDP solar PV project—both in Kenya. The first author also draws on first-hand experiencewith installation of PV systems in the western part of Kenya. The first author reflects on his practical
38

Energies 2020, 13, 5502
experiences on barriers that limit the uptake of PV and the existing opportunities and how they applyon a national scale to enrich the content of this paper.
Figure 2. Analytical framework for assessing barriers and opportunities for increased integration ofsolar PV in Kenya.
As a last step in the analyses, international experience with pumped hydro storage is exploredin order to show that it is technically and economically feasible to roll out this technology in Kenya.
3. Barriers to Increasing Integration of PV in Kenya
The barriers identified in the literature review are presented in this section—organised accordingto the analytical framework present in Section 2. These barriers are categorized into three: technological,economic and institutional barriers.
The advent of the PV technology in Kenya in the 1970s was mainly facilitated by donors andparticularly in the 1980s, PV systems were donated to facilities such as health clinics that wereoff-grid [17]. During the implementation of PV in rural off-grid areas it was established that therewas a market for PV technology beyond the scope of health clinics and off-grid missions [21]. Thus,within two years from 2000 to 2002, households increased the purchases of PV systems from 20% to40% of total annual PV purchases. However, the benefits from the solar PV systems were mainlyaccrued by the rural middle class [28]. Consequentially, poorer rural households were sidestepped interms of receiving subsidized PV systems [29].
With time, a focus on the rural affluent allowed the PV sector to be commercially viable withoutreliance on donors or subsidies. Specifically, in the 2000s, focus was on the middle-income segment,which was propelled by reduced costs of PV systems and a desire for the middle class to watchtelevision [28]. These advances have led to the development of a considerable amount of PV systemsbeing installed [30], however most of the development in Kenya has been in the form of stand-alone(i.e., off-grid) systems that are not connected to national grid. Thus, the PV market in Kenya hasevidenced use of Solar Home Systems, which has been considered the most successful off-grid solarmarket in the developing economies [31].
3.1. Technological Barriers
Although PV technology has advanced significantly in the last decades, there are still severaltechnical barriers to its adoption as highlighted in the literature. The quality of PV systems is of vitalimportance for its integration. Lack of adequate knowledge is a crucial barrier that may result inimproper usage and inability to maintain the systems [13]. This may create a negative perception andprevent potential customers making a decision to adopt the systems.
A large technological challenge for PV in Kenya has been the lack of energy storage systems [32].Meanwhile since Kenya relies largely on reservoir/dammed hydroelectric power supply, a PV-based
39

Energies 2020, 13, 5502
pumped storage hydropower could offer an even more flexible solution to the variability of theresidual production (demand minus non-dispatchable power production). Battery storage solutionsalso exist but the accompanying initial cost is high (though falling) for grid-connected systems henceresearch has pointed the need to look at development of hybrid systems combining solar PV withhydropower as a viable alternative option [33]. The storage requirement is of course dependent onboth the composition of the rest of the electricity systems and on the share of PV. While a small share ofPV can be integrated into the grid with no technical issues, large-scale integration of PV sets higherdemands for the flexibility of energy systems.
Mathiesen at al. [34] identifies three phases of implementing RES. The first stage is the introductionphase where RES only marginally replaces production based on fossil fuels. The second stage is thelarge-scale integration phase where the integration of fluctuating renewables in the system becomescomplex and where grid stability becomes an issue in the power system. The third stage is the fullrenewable energy phase with a complex system with suitable storage and conversion technologies tomaintain the temporal balance of the energy system.
As the national Kenyan system is in the second phase—similar to most other countries in theworld—the integration issues of large-scale integration are not faced yet, but a strong focus on PV willeventually bring the country there.
In this connection, the key technical issues that demand to be addressed when integrating solarPV on the grid include voltage level and point of common coupling, network voltage variations,power quality, voltage ride-through capability, reactive power compensation capability, frequencyregulation capability and protection issues.
3.2. Economic Barriers
The main economic barrier for PV integration has been the high upfront cost and an unwillingnessof banks to fund such investments [35]. The higher construction costs have previously made financialinstitutions more likely to perceive renewables as risky, lending money at higher rates and making itharder for utilities or developers to justify the investment. Perceptions of the (high) costs associatedwith solar PV can still be a barrier even if prices have come down considerably in recent years.
There have been efforts towards establishing the economic viability of solar PV in different regionsof the world. A study focusing on the Middle East and North Africa regions concluded that rooftop PVsystems were competitive with other energy producing plants in the region [33], however developmenthas not followed suit. Nevertheless, a study in the Kenyan context confirms this. In [36] the authorsused a levelised cost of energy evaluation and established that solar power in combination withother renewable energy generation technologies is competitive in relation to non-renewable energy.In spite of the high insolation levels, solar PV has mainly been used for off-grid application such assolar lanterns because of the high upfront investment costs of grid-connected solar PV systems [37].However, currently, solar PV has been highly incentivized and prices have dropped significantly thusmaking it a viable option compared to diesel-fuel generators that are expensive to run [38].
Cost comparisons and competitiveness of solar PV with the conventional fossil fuels to electricityproduction are among the most significant barriers for adoption of solar PV in Kenya both for theutility company and for individual investors [17]. From the perspective of both the national utilitycompany Kenya Power and Lighting Company (Nairobi, Kenya) and independent power producers,large-scale PV electricity generation without a well-functioning energy storage system maybe tooexpensive considering the fact these companies are also required to maintain the grid infrastructureand manage other running costs [31].
To mitigate these challenges, the incumbent could consider selling or leasing out PV energystorage systems, provide financing and grid connections or build a service relationship with individualinvestors. Once the domestic market grows, the installation costs will become cheaper; this couldfurther be facilitated by training and certification of solar PV installers at the national level [39].
40
Energies 2020, 13, 5502
3.3. Institutional Barriers
The institutional barriers vary largely and are here grouped into four categories; (a) grid access,(b) research and development programmes, (c) university linkages and (d) policy experience fromother African nations.
3.3.1. Grid Access
Kenya has an interconnected national electricity grid operated and run by the monopoly KenyaPower and Lighting Company Limited (Nairobi, Kenya). Unfortunately, the process of grid connection fornew PV systems is long and complicated (that requires up to fourteen licensing steps) which discouragespotential investment in PV power generation [18].
3.3.2. Role of Education, Training, Research and Development Programmes
Globally, China is a powerhouse for solar technology [40]. In 2001, China had thirty researchinstitutes and universities that were working collaboratively to develop the materials used inPV cells [41]. Notably, key Chinese producers of PV manufacturing equipment have emergedwith a number of firms being tasked with PV system design, technology research and development,manufacturing of the components as well as sales and after-sales service.
In Kenya, most solar PV firms have been involved in the government led rural electrificationprogramme [42]. However, there is minimal research and development within the firms since most ofthem rarely devote a portion of their annual turnover to facilitate their technological capabilities andthe competitiveness regarding PV [43]. Hence, in view of the extant literature, instances of researchand development in the PV in Kenya are close to none.
In 2015, Maclean and Brass [44] noted that the Kenya Industrial Research and DevelopmentInstitute is engaged in researching the development of low-carbon and climate-resilient technologiessuch as PV. The authors noted that Migori, Bungoma, Kirinyaga, Embu and Samburu were amongthe counties that were surveyed for low-carbon technologies. This is referred as a niche developmentfor Kenya relevant to make affordable PV systems for off-grid rural areas. This study concluded thata policy brief should be developed to spur a pico solar market in Kenya. Pico refers to the smallestportable photovoltaic systems mainly typified by rechargeable battery.
3.3.3. University-Industry Linkages
Institutions of higher learning are instrumental players in both national and regional innovationsystems [45]. In the recent past, universities have received substantial attention with regard to theirrole in innovation and spurring economic development. Universities are credited with major advancesin scientific research and the creation of innovations with impact on the society.
Universities in Kenya have historically played a role in its National Innovation System alsoin development of RES. Strathmore Energy Research Centre (SERC)—a brainchild of StrathmoreUniversity in Nairobi—offers professional training, project development, and technical research in therenewable energy sector [36]. Since its inception in 2012, SERC has been at the forefront in implementinginnovative pilot projects with the intention to promote RES into Africa. Trained technicians from SERCare able to do PV installation, repair and maintenance thereby raising awareness and contributingtowards uptake of PV technology.
Furthermore, the centre for research on New and Renewable Energies at Maseno University hasalso been instrumental in promoting RES exploitation locally and regionally with special emphasis onrural application [44]. The centre focuses on harnessing bio-energy, geothermal, solar and wind energy.
The energy technology programmes offered in Kenyan universities are created to developindividuals with the capacity to address the national and global challenges in the energy sector.Therefore, this indicates that university-industry linkages exist and maybe utilized to foster increasedintegration of PV in the electricity generation mix.
41

Energies 2020, 13, 5502
3.3.4. Policy Experience from Africa
The African continent has a rich source of solar energy and in the recent years, PV has beenbecoming a viable alternative source of electricity for both small and large-scale application in Africa [42].Like Kenya, solar PV deployment in most other countries in Africa has mainly been driven by rural(off-grid) electrification. As opposed to most of the African nations, Morocco saw the need for spurringPV on a larger scale for electricity generation at an early stage. In fact, a Moroccan integrated solarproject was launched that comprised of solar and wind technologies that complement each other [46].In addition, the Moroccan government commissioned a 500 MWp PV plant in 2018 [46].
In 2015, Rwanda was at an early stage of solar power integration according to [1]. At the time,there were at most eight companies which were mainly donor-driven and whose scope was to installsolar systems in government hospitals and schools. According to the authors, there was a growingmarket for solar PV mainly among the private households.
Despite this, Rwanda possesses the highest grid connection in East Africa ahead of Kenya andTanzania [1]. Nonetheless, there has been a tremendous growth in PV for off-grid Rwandan ruralelectrification since 2009 [28]. Further development of the technology was due to a strong focus on theRwandan vision 2020 [47], which puts emphasis on renewable energy technology.
Besides, the Monetary Growth and Poverty reduction policy in Rwanda states that the governmentin collaboration with the private sector should facilitate the distribution and the sale of solar PVsystems and further provide a regulatory environment that is conducive for the rapid integrationof PV [47]. Experience from Rwanda and Morocco could be used to inspire policies in Kenya to helpfoster increased integration of solar PV in the country.
3.4. Political Barriers
Policy measures are of vital importance for large-scale introduction of PV. A lack of stability ofincentives for the adoption of PV can be a significant barrier—for instance a sudden removal of existingsubsidies or inconsistencies in policy measures.
Kenya has instituted policies meant to increase the integration of PV [1]. Particularly, amongthese policies is the Kenya Rural Electrification Master Plan [48], a Feed-in Tariff policy [49] and theVision 2030 [50]. The government has also made a move towards ensuring that entrepreneurs willingto invest in solar PV are catered for [47].
As early as 2008, Kenya developed a feed-in tariff policy meant to ensure market stability forinvestors in PV. The feed-in tariffmade it possible for independent power producers to deliver powerfrom wind and hydro sources to the national grid. In 2012, the feed-in tariff policy was revised to alsoinclude solar power [37]. However, these policies have not translated to higher installed grid-connectedPV capacity largely because the policies are not well coordinated during implementation or at worst,they are not implemented at all [1].
Under- or over-prioritization of investments in certain sectors in relation to others is usuallynot based on technical decisions but rather involves political choices and prioritizations. Large-scalePV projects are essentially large infrastructure projects that are typically highly political and thatinvolve a multitude of actors with competing interests and negotiations across various levels.For example, [51] argue that the push for RE in Kenya is not necessarily being driven by environmentalconcerns, but rather by the need to provide access to electricity to the highest number of people withinthe shortest time possible. These authors highlight the tensions that come from pursuing the multipleobjectives of ‘growth’, ‘inclusiveness’ and ‘sustainability’.
4. Pumped Hydro Storage Solution
This section discusses pumped hydro storage solution by reflecting on experiences from variouscountries which have similar conditions as Kenya. The importance of pumped hydro as a possible
42
Energies 2020, 13, 5502
solution that can be replicated locally to meet electricity demand can therefore be proven since it hasbeen applied in various countries with similar conditions as Kenya.
The shift from fossil fuel-fired power production to RES such as PV requires some form of storageor flexibility to cope with intermittency of the sources. A limitation with batteries is that they cannotoffer multiple-hour storage capacity and discharge over a long time period. Moreover, batteries havea specific lifespan beyond which their performance is not guaranteed. Batteries also require amplehousing space for large power output.
Pumped hydro storage (PHS) is a form of energy storage whereby gravitational potential energy ofwater is pumped from a lower reservoir to a higher one serve as a dispatchable reservoir to feed turbineson request [52]. PHS is the largest form of grid energy storage available; currently, PHS accounts forabout 95% of all active and tracked storage [53]. The first PHS systems were commissioned in AlpineSwitzerland, Austria and Italy in the 1890’s. World-wide installed capacity stands at over 181 GW,of which about 29 GW are in the USA [52].
Modern PHS plants have a cycle efficiency of about 80% [54,55], and allow the utilization of excesselectricity from base-load power sources (such as coal or nuclear) or fluctuating RES to be saved for useduring periods of higher demand. Reservoirs used in these systems are generally smaller compared toconventional hydroelectric dams of similar power capacity and their generating periods are often lessthan half a day.
Chile has vast amounts of solar and wind resources which are increasingly being harnessed toreplace fossil fuel generation. The impact of large scale integration of these variable RES for grid-levelelectricity storage was evaluated by [55]. In this study, a cost-based linear optimization of the Chileanelectricity system was developed to analyse and optimize various RES generation, transmissionand energy storage scenarios until 2050. Results of this study showed that for the base scenario ofdecommissioning of aging coal plants and no new coal and large hydro generation, the generationgap can be filled by PV, concentrated solar power and flexible gas generation resulting in a drop of78% in carbon dioxide emissions. Integration of PV for on-grid storage increases the solar PV fractionwhich consequently leads to a 6% reduction in operation and investment costs by 2050 [55].
Switzerland was a pioneer in electricity generation and a European leader in power storage [56].The country’s mountains, extensive snows and glaciers favour development of hydro technology whichis well developed and mature. As a result, hydro power generation from Switzerland is critical inwestern European electric power system supply backup and means of storage of reserve power [5,55].Power management and storage are also critical towards achieving 100% renewable energy-basedsystem in Switzerland. The country utilizes two different hydro storage systems; PHS and hydrosystems with natural inflows to reservoirs that are subsequently feed to turbines on demand
A steady increase of the RES share in Australia’s electricity mix is causing a move away fromdependency on fossil fuels. A study by [57] focusing on the South West Interconnected Systemin Western Australia modelled several high penetration scenarios for renewables comprising windand PV and PHS. The scenarios were examined using a chronological dispatch model restricting totechnologies that were already deployed on a large scale i.e., greater than 150GW were utilized. Resultsobtained demonstrated that 100% penetration of wind and PV electricity is compatible with a balancedgrid—though requiring PHS. Furthermore, with the integration of PHS, a RES share over 90% will stillbe allowed at a competitive electricity supply cost.
A case study by [58] based on Ometepe island, Nicaragua simulated a PHS and geothermal plantusing HOMER software. The island was chosen because it has wind, solar and geothermal resourcesas well as an extinct volcano with a crater on its top that can serve as the upper reservoir for thePHS system. Different system configurations were demonstrated and the results obtained revealedthat PHS technology is able to serve the base load of the system, therefore reducing the requiredinstalled capacity of other power resources as well as decreasing the storage requirements and excesselectricity production.
43
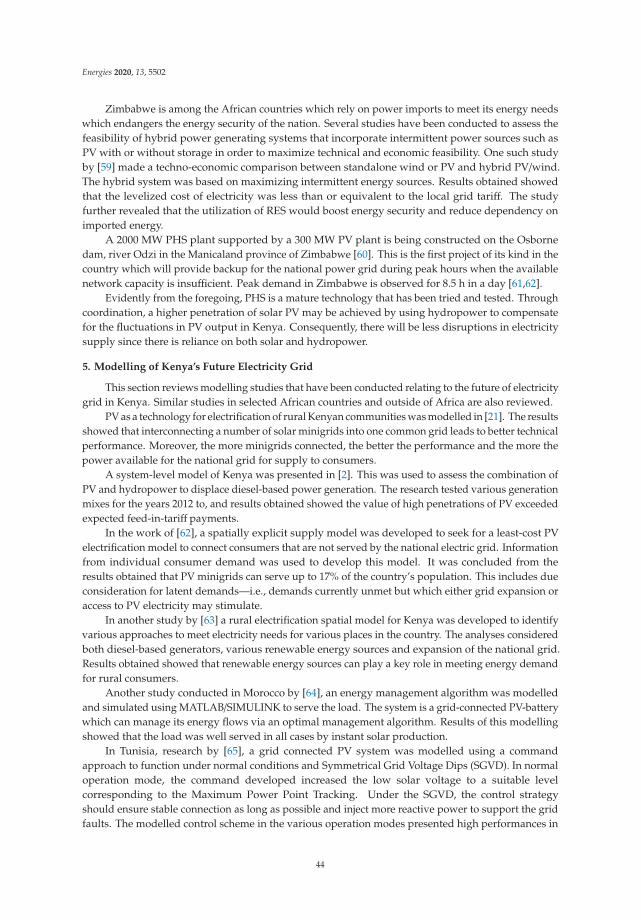
Energies 2020, 13, 5502
Zimbabwe is among the African countries which rely on power imports to meet its energy needswhich endangers the energy security of the nation. Several studies have been conducted to assess thefeasibility of hybrid power generating systems that incorporate intermittent power sources such asPV with or without storage in order to maximize technical and economic feasibility. One such studyby [59] made a techno-economic comparison between standalone wind or PV and hybrid PV/wind.The hybrid system was based on maximizing intermittent energy sources. Results obtained showedthat the levelized cost of electricity was less than or equivalent to the local grid tariff. The studyfurther revealed that the utilization of RES would boost energy security and reduce dependency onimported energy.
A 2000 MW PHS plant supported by a 300 MW PV plant is being constructed on the Osbornedam, river Odzi in the Manicaland province of Zimbabwe [60]. This is the first project of its kind in thecountry which will provide backup for the national power grid during peak hours when the availablenetwork capacity is insufficient. Peak demand in Zimbabwe is observed for 8.5 h in a day [61,62].
Evidently from the foregoing, PHS is a mature technology that has been tried and tested. Throughcoordination, a higher penetration of solar PV may be achieved by using hydropower to compensatefor the fluctuations in PV output in Kenya. Consequently, there will be less disruptions in electricitysupply since there is reliance on both solar and hydropower.
5. Modelling of Kenya’s Future Electricity Grid
This section reviews modelling studies that have been conducted relating to the future of electricitygrid in Kenya. Similar studies in selected African countries and outside of Africa are also reviewed.
PV as a technology for electrification of rural Kenyan communities was modelled in [21]. The resultsshowed that interconnecting a number of solar minigrids into one common grid leads to better technicalperformance. Moreover, the more minigrids connected, the better the performance and the more thepower available for the national grid for supply to consumers.
A system-level model of Kenya was presented in [2]. This was used to assess the combination ofPV and hydropower to displace diesel-based power generation. The research tested various generationmixes for the years 2012 to, and results obtained showed the value of high penetrations of PV exceededexpected feed-in-tariff payments.
In the work of [62], a spatially explicit supply model was developed to seek for a least-cost PVelectrification model to connect consumers that are not served by the national electric grid. Informationfrom individual consumer demand was used to develop this model. It was concluded from theresults obtained that PV minigrids can serve up to 17% of the country’s population. This includes dueconsideration for latent demands—i.e., demands currently unmet but which either grid expansion oraccess to PV electricity may stimulate.
In another study by [63] a rural electrification spatial model for Kenya was developed to identifyvarious approaches to meet electricity needs for various places in the country. The analyses consideredboth diesel-based generators, various renewable energy sources and expansion of the national grid.Results obtained showed that renewable energy sources can play a key role in meeting energy demandfor rural consumers.
Another study conducted in Morocco by [64], an energy management algorithm was modelledand simulated using MATLAB/SIMULINK to serve the load. The system is a grid-connected PV-batterywhich can manage its energy flows via an optimal management algorithm. Results of this modellingshowed that the load was well served in all cases by instant solar production.
In Tunisia, research by [65], a grid connected PV system was modelled using a commandapproach to function under normal conditions and Symmetrical Grid Voltage Dips (SGVD). In normaloperation mode, the command developed increased the low solar voltage to a suitable levelcorresponding to the Maximum Power Point Tracking. Under the SGVD, the control strategyshould ensure stable connection as long as possible and inject more reactive power to support the gridfaults. The modelled control scheme in the various operation modes presented high performances in
44

Energies 2020, 13, 5502
transient and permanent phased. The system improved safety of the overall system and increased theconnection time.
Experience from outside Africa has demonstrated how a decentralisation of power production oncogeneration of heat and power plants [66,67] and wind power [68,69] reduce grid loading thus enablingweaker grids, leave capacity for transit if so needed while at the same time reduces grid losses [70].These analyses are based on a combination of energy systems analyses [71] using the EnergyPLANmodel [72,73] and transmission grid analyses taking into consideration hour-step analyses of the 150and 400 kV transmission grid.
All in all, experience from the literature demonstrate that a decentral deployment of grid connectedPV systems could benefit the energy system—though due concern of ancillary services is still required.
6. Discussion
This section discusses the key challenges facing integration of PV into Kenya’s electricity generation mix,and also puts some of the issues into a wider perspective.
A key technical challenge for integration of PV technology is the temporal match with the demand;solar power is available during the day and there must be a viable way of harnessing it for use when thesun is not up. In Kenya, electricity generation in the form of pumped hydroelectric power generationis seen as a viable option to replace run-of-river hydroelectric power plants whose production insusceptible to drought which result in reduced electricity generation capacity as well as outrightpower outages.
As it is, the electricity system in Kenya suffers from frequent power outages that are welldocumented. In a typical month, firms and homesteads connected to the grid experience on average6.3 power outages, each lasting approximately five hours [19]. The economic cost of power interruptionsis approximately 7.1% of the firms’ sales; power outages therefore have a significant economic cost onbusinesses [19] and in turn on the Kenyan society.
There has been less emphasis on solar PV in Kenya. Specifically, no study has highlighted thepotential of and possible barriers to solar PV generation where hydropower already exists. Studies onPV in Kenya have a leaning to integrate PV with other technologies. For policy-makers and internationalorganizations keen to reduce carbon emissions and dependence on imported fuels, the deployment ofhydro resources alongside solar PV is a viable option for many sub-Saharan African countries. It ishere important to note the role played by hydropower sources, which supply approximately 30% ofthe end-use electricity demand in Kenya.
Kenya has a great potential for pumped-hydro storage for the integration of PV [2]. Dammedhydro or even pumped hydro storage are both dispatchable and thus offering regulating capability tothe power system. For pumped hydro storage, low-cost surplus off-peak electric power can be usedto fill reservoirs which is subsequently released through turbines during periods of high electricaldemand. The cost of pumping water can easily be met from the revenue generated from sellingpower during peak demand periods—even when factoring in the cycle losses. At any rate, with cycleefficiencies in the 70% to 80% bracket [74] and modest cost per size [75], pumped hydro systems are agood storage candidate for large-scale PV integration.
In colder climates where heating systems offer flexibility through system-integration, optionsare more diverse with the use of cogeneration of heat and power [70,76–78], heat pumps [79,80],heat storage [75] and smart energy systems [81–84] for the integration of renewables. The potentialfor this sectorial integration between heat and electricity is not so pronounced in warmer climates.Also, in the future, electric vehicles provide an opportunity for integrating PV power [35,85–87],however this solution comes with a cost barrier.
There are conflicting standpoints and expectations of policy makers and utilities that constituteinstitutional and policy barriers. Incumbent electricity companies in Kenya are likely to favourmaintaining the status quo since they have made investments in the existing electricity generation system.This creates path dependency and lock-in effect [87]. Kenya Power has the sole monopoly of managing
45
Energies 2020, 13, 5502
costs of connecting PV systems to the grid and they manage the grid single-handedly. At the same time,new forms of electricity generation such as PV generation try to break the lock-in and this clasheswith the current Kenyan electricity regime that is mainly based on hydro, geothermal and fossil fuels.Resistance from the utility or other industry players can be sensed in the context of path dependenceand lock-in, and therefore undermines integration of renewable sources of energy [36].
On the other hand, the supportive policies advanced by the Kenyan government towardsrenewable energy have contributed towards a growing interest among citizens related to solar energy.There is a range of different kinds of support instruments in use, such as a conducive environmentfor investment, innovative financing schemes, exemptions from value added tax and import taxes,standardized power purchase agreements and feed-in-tariffs which have led to the growth of PVmarket in Kenya [49].
These policies have raised the point that dynamic support structures for renewable energytechnologies can aid in increasing their market penetration. A period of high subsidy may be particularlyimportant to establish early growth in market share, but should be followed by adjustments in subsidiesto prevent markets from growing too quickly. At the same time, [87] reminds that support must gobeyond financial measures to be sustainable by offering training programs on operation and maintenance.Also, [87] found that one-off investment support or tax rebates were preferable to feed-in tariffs, as theywere deemed more cost efficient and were likely to instil greater confidence in investors.
In addition, research institutions play a critical role in integration of PV systems through buildingof local capacity to handle installation, operation and maintenance of PV systems. As highlightedearlier, research and development has played a key in the advancement of PV technology in countriessuch as China. Kenya needs to invest more in research and development in order to scale up electricitygeneration from PV technology and therefore increase economic competitiveness of solar PV.
These linkages can be extended to collaborations between Kenya and the international community.In most African countries integration of solar PV systems (mainly small-scale) has been driven bydonor-supported projects aimed at serving specific needs for electricity [1]. Historically, developmentof PV systems has been aided by the donor community which has facilitated acquisition of solar systemsto local communities and institutions by providing the requisite resources. Arguably, availability ofresources from PV actors from outside Kenya may also help scaling up of PV technology in the country.PV development in Kenya is also shaped by the market forces of demand and supply.
In terms of the proposed storage solution, PHS is already a well-established technology in severalcountries—and as our analyses show, it is also a technology that is applied or considered in conjunctionwith PV. The non-technical prospects of PHS in a Kenyan context have not been considered, but it is atechnology that is traditionally owned and operated by larger players in electricity markets—powerproducers or transmission system operators e.g., Kenya Generating Company Limited and KenyaTransmission Company Limited could thus fit institutionally well into a system as the Kenyan with astrong central player in Kenyan Power and Lighting Company.
7. Conclusions
This paper has discussed the barriers and possibilities for overcoming these for the integration ofPV technology in Kenya based on a literature review to achieve high installed capacities. Significantchanges must occur in the Kenyan electricity sector. Most noticeably, storage solutions and otherelements of flexibility need to be incorporated to balance the intermittent nature of electricity generationbased on solar PV. This is particularly eminent for large-scale deployment of PV technology in Kenya.A complement between hydro and solar PV to address the storage challenge was proposed inthis investigation.
Such a hybrid system represents a complete transformation from the current scenario. A varietyof technical, economic, institutional, political barriers have been pointed out which currently restrictfurther increase of PV technology.
46

Energies 2020, 13, 5502
Some of the technological barriers identified include lack of adequate knowledge of PV technologyand lack of energy storage systems or energy system flexibility to integrate PV. An important economicbarrier identified is the high upfront costs and unwillingness of banks to fund PV investments. Some ofthe institutional and policy barriers identified are lack of stability incentives for adoption of PV andthe long and complicated grid connection process.
These barriers can be overcome with robust policy regulations, additional investments in education,training, research and development, better regulation of the electricity sector and improved coordinationbetween key actors.
While this analysis focused on the barriers for solar PV in the Kenyan grid system, the results maybe applicable to other sub-Saharan African countries, many of whom are faced with the same challenges:growing demand for electricity, insufficient generating capacity, and long lead times and extensivefinancial investments required for planned generation projects. As a result, many countries haveturned to short-term expensive solutions such as diesel plants. Further, the other characteristic—thatmay make solar PV a favourable option in Kenya such as abundant solar resource—is also presentacross the continent.
Author Contributions: Conceptualization, D.S.; methodology, D.S.; investigation, D.S.; writing—original draftpreparation, D.S.; writing—review and editing, C.N., P.A.Ø., A.R.; supervision, C.N., P.A.Ø., A.R.; fundingacquisition, C.N. All authors have read and agreed to the published version of the manuscript.
Funding: This article was prepared with support from the Danish Ministry of Foreign Affairs through theInnovation and Renewable Electrification in Kenya (IREK) project—Grant DFC 14-09AAU.
Acknowledgments: The present paper is a substantially revised and improved version of a working paperpublished at the Aalborg University repository VBN [87].
Conflicts of Interest: The authors declare no conflict of interest.
References
1. Hansen, U.E.; Pedersen, M.B.; Nygaard, I. Review of solar PV policies, interventions and diffusion in EastAfrica. Renew. Sustain. Energy Rev. 2015, 46, 236–248. [CrossRef]
2. Rose, A.; Stoner, R.; Pérez-Arriaga, I. Prospects for grid-connected solar PV in Kenya: A systems approach.Appl. Energy 2016, 161, 583–590. [CrossRef]
3. Østergaard, P.A.; Sperling, K. Towards sustainable energy planning and management. Int. J. Sustain. EnergyPlan. Manag. 2014, 1, 1.
4. Adam, A.D.; Apaydin, G. Grid connected solar photovoltaic system as a tool for greenhouse gas emissionreduction in Turkey. Renew. Sustain. Energy Rev. 2016, 53, 1086–1091. [CrossRef]
5. Lang, T.; Ammann, D.; Girod, B. Profitability in absence of subsidies: A techno-economic analysis of rooftopphotovoltaic self-consumption in residential and commercial buildings. Renew. Energy 2016. [CrossRef]
6. Kausar, A.S.M.Z.; Reza, A.W.; Saleh, M.U.; Ramiah, H. Energizing wireless sensor networks by energy harvestingsystems: Scopes, challenges and approaches. Renew. Sustain. Energy Rev. 2014, 38, 973–989. [CrossRef]
7. Heesen, H.t.; Herbort, V.; Rumpler, M. Performance of roof-top PV systems in Germany from 2012 to 2018.Sol. Energy 2019, 194, 128–135. [CrossRef]
8. Society and Environment—Housing. Statistisches Bundesamt. Available online: http://www.destatis.de/EN/Themes/Society-Environment/Housing/_no (accessed on 16 April 2020).
9. Fukushima Renewable Energy Institute. 2014. Available online: https://www.japantimes.co.jp/news/2018/03/11/national/fukushima-powers-toward-100-goal-renewables-grid-cost-woes-linger/ (accessed on 30 May 2020).
10. Xu, Q.; Li, H.; Hao, G.; Ding, Y. Study on Several Influencing Factors of Performance Evaluation Index ofPhotovoltaic System. J. Clean Energy Technol. 2016, 4, 424–429. [CrossRef]
11. Tazi, G.; Jbaihi, O.; Ghennioui, A.; Merrouni, A.A.; Bakkali, M. Estimating the Renewable Energy Potential inMorocco: Solar energy as a case study. IOP Conf. Ser. Earth Environ. Sci. 2018, 161, 1–8. [CrossRef]
12. ERC, Energy Regulatory Commission Biomass. 2019. Available online: https://www.epra.go.ke/ (accessed on12 January 2020).
13. Karakaya, E.; Sriwannawit, P. Barriers to the adoption of photovoltaic systems: The state of the art.Renew. Sustain. Energy Rev. 2015, 49, 60–66. [CrossRef]
47

Energies 2020, 13, 5502
14. Marczinkowski, H.M.; Østergaard, P.A. Residential versus communal combination of photovoltaic andbattery in smart energy systems. Energy 2018, 152, 466–475. [CrossRef]
15. Kwakwa, P.A.; Adu, G.; Osei-Fosu, A.K. A time series analysis of fossil fuel consumption in Sub-SaharanAfrica: Evidence from Ghana, Kenya and South Africa. Int. J. Sustain. Energy Plan. Manag. 2018, 17, 4.
16. Ogola, P.F.A.; Davidsdottir, B.; Fridleifsson, I.B. Potential contribution of geothermal energy to climatechange adaptation: A case study of the arid and semi-arid eastern Baringo lowlands, Kenya. Renew. Sustain.Energy Rev. 2012, 16, 4222–4246. [CrossRef]
17. Phillips, M.A. Renewable Energy Incentives in Kenya: Feed-in-Tariffs and Rural Expansion; Ministry of Energy:Nairobi, Kenya, 2016.
18. Lai, C.S.; McCulloch, M.D. Levelized cost of electricity for solar photovoltaic and electrical energy storage.Appl. Energy 2017, 190, 191–203. [CrossRef]
19. Ramirez, A. Indium Oxide as a Superior Catalyst for Methanol Synthesis by CO2 Hydrogenation.Energy Access 2016. [CrossRef]
20. Oloo, F.; Olang, L.; Strobl, J. Spatial Modelling of Solar energy Potential in Kenya. Int. J. Sustain. EnergyPlan. Manag. 2015, 6, 17–30.
21. Opiyo, N. Modelling PV-based communal grids potential for rural western Kenya. Sustain. Energy Grids Netw.2015, 4, 54–61. [CrossRef]
22. Johannsen, R.M.; Østergaard, P.A.; Hanlin, R. Hybrid photovoltaic and wind mini-grids in Kenya:Techno-economic assessment and barriers to diffusion. Energy Sustain. Dev. 2020, 54, 111–126. [CrossRef]
23. Azimoh, C.L. Sustainability and Development Impacts of off-grid electrification in developing countries:An assessment of South Africa’s rural electrification program. Ph.D. Thesis, Malardalen University, Vasteras,Sweden, 2016.
24. Sharma, P.; Walker, A.W.; Wheeldon, J.F.; Hinzer, K.; Schriemer, H. Enhanced efficiencies for highconcentration, multijunction PV systems by optimizing grid spacing under non uniform illumination.Int. J. Photoenergy 2014, 2014, 582083. [CrossRef]
25. Child, M.; Haukkala, T.; Breyer, C. The Role of Solar Photovoltaics and Energy Storage Solutions in a 100 %Renewable Energy System for Finland in 2050. Sustainability 2017, 9, 1358. [CrossRef]
26. Hvelplund, F.; Möller, B.; Sperling, K. Local ownership, smart energy systems and better wind powereconomy. Energy Strateg. Rev. 2013, 1, 164–170. [CrossRef]
27. Hvelplund, F.; Djørup, S. Consumer ownership, natural monopolies and transition to 100% renewable energysystems. Energy 2019, 181, 440–449. [CrossRef]
28. Kirubi, C.; Jacobson, A.; Kammen, D.M.; Mills, A. Community-Based Electric Micro-Grids Can Contribute toRural Development: Evidence from Kenya. World Dev. 2009, 37, 1208–1221. [CrossRef]
29. Simiyu, J.; Waita, S.; Musembi, R.; Ogacho, A.; Aduda, B. Promotion of PV uptake and sector growth inkenya through value added training in PV sizing, installation and maintenance. Energy Procedia 2014, 57,817–825. [CrossRef]
30. Tigabu, A.; Kingiri, A.; Odongo, F.; Hanlin, R.; Andersen, M.H.; Lema, R. Capability development andcollaboration for Kenya’s solar and wind technologies: Analysis of major energy policy frameworks.IREK Rep. 2017, 2, 1–13.
31. Rolffs, P.; Ockwell, D.; Byrne, R. Beyond technology and finance: Pay-as-you-go sustainable energy accessand theories of social change. Environ. Plan. A 2015, 47, 2609–2627. [CrossRef]
32. Munro, P.; van der Horst, G.; Willans, S.; Kemeny, P.; Christiansen, A.; Schiavone, N. Social enterprisedevelopment and renewable energy dissemination in Africa: The experience of the community chargingstation model in Sierra Leone. Prog. Dev. Stud. 2016, 16, 24–38. [CrossRef]
33. Werner, C.; Breyer, C. Analysis of mini-grid installations: An overview on system configurations.In Proceedings of the 27th European Photovoltaic Solar Energy Conference Exhibition, Frankfurt, Germany,23–27 September 2012; pp. 3885–3892.
34. Mathiesen, B.V. Smart Energy Systems for coherent 100% renewable energy and transport solutions.Appl. Energy 2015, 145, 135–154. [CrossRef]
35. Energy, R. Renewable Energy Policies in a Time of Transition. Available online: http://energyaccess.org/wp-content/uploads/2018/04/IRENA_IEA_REN21_Policies_2018.pdf (accessed on 21 August 2020).
48
Energies 2020, 13, 5502
36. Da Silva, I.P.; Batte, G.; Ondraczek, J.; Ronoh, G.; Ouma, C.A. Diffusion of solar energy technologies in ruralAfrica: Trends in Kenya and the LUAV. In Proceedings of the 1st Africa Photovoltaic Solar Energy Conferenceand Exhibition, Durban, South Africa, 27–29 March 2014; Volume 1, pp. 27–29.
37. Ministry of Energy. Republic of Kenya, Strategic Plan; Ministry of Energy: Nairobi, Kenya, 2014.38. Aris, A.M.; Shabani, B. Sustainable Power Supply Solutions for Off-Grid Base Stations. Energies 2015, 8,
10904–10941. [CrossRef]39. Opiyo, N. A survey informed PV-based cost-effective electrification options for rural sub-Saharan Africa.
Energy Policy 2016, 91, 1–11. [CrossRef]40. Tian, Y.; Zhao, C.Y. A review of solar collectors and thermal energy storage in solar thermal applications.
Appl. Energy 2013, 104, 538–553. [CrossRef]41. Zhao, Z.; Venayagamoorthy, K.; Burg, T.; Groff, R.; Belotti, P. Optimal Energy Management for Micro grids.
Energies 2018, 11, 1–22.42. Elmer, U.; Brix, M. Review of Solar PV Market Development in East Africa. UNEP Risø CentreUNEP Risø
Cent. Work. Pap. Ser. 2014. [CrossRef]43. Marigo, N.; Foxon, T.J.; Pearson, P.J. Comparing innovation systems for solar photovoltaics in the United
Kingdom and in China. Available online: https://core.ac.uk/download/pdf/9715618.pdf (accessed on21 August 2020).
44. Maclean, L.M.; Brass, J.N. Foreign Aid, NGOs and the Private Sector: New Forms of Hybridity in RenewableEnergy Provision in Kenya and Uganda. Afr. Today 2015, 62, 57–82. [CrossRef]
45. Osman, J. Utilizing Solar Energy in King Faisal Specialist Hospital & Research Center Riyadh, Saudi Arabia.Master’s Thesis, King Faisal Specialist Research Center, Riyadh, Saudi Arabia, 2012.
46. Attari, K.; Elyaakoubi, A.; Asselman, A. Performance analysis and investigation of a grid-connectedphotovoltaic installation in Morocco. Energy Rep. 2016, 2, 261–266. [CrossRef]
47. Nygaard, I.; Hansen, U.E.; Pedersen, M.B. Measures for diffusion of solar PV in selected African countries.J. Clean. Prod. 2015, 1–15. [CrossRef]
48. Borah, R.R.; Palit, D.; Mahapatra, S. Comparative analysis of solar photovoltaic lighting systems in India.Energy Procedia 2014, 54, 680–689. [CrossRef]
49. Government of Kenya (Ministry of Energy and Petroleum). Draft National Energy and Petroleum Policy;Ministry of Energy: Nairobi, Kenya, 2015; pp. 1–130.
50. Parthasarathy, M.; Anandaraj, A.V. Vision—2030; Government of Kenya: Nairobi, Kenya, 2011.51. Elmer, U.; Gregersen, C.; Lema, R.; Samoita, D.; Wandera, F. Technological shape and size: A disaggregated
perspective on sectoral innovation systems in renewable electrification pathways. Energy Res. Soc. Sci. 2018,42, 13–22.
52. Lund, H. Practical operation strategies for pumped hydroelectric energy storage ( PHES ) utilising electricityprice arbitrage Practical operation strategies for pumped hydroelectric energy storage ( PHES ) utilisingelectricity price arbitrage. Energy Policy 2011, 39, 4189–4196.
53. Williams, B.K. No Batteries Required: Pumped Hydro for Solar Energy Storage. Available online: http://reneweconomy.com.au/2016/no-batteries-needed-pumped-hydro-for-energy-storage-79785 (accessed on12 August 2020).
54. Schlecht, I.; Weigt, H. Linking Europe: The Role of the Swiss Electricity Transmission Grid until 2050. Swiss J.Econ. Stat. 2015, 151, 125–165. [CrossRef]
55. Maximov, S.A.; Harrison, G.P.; Friedrich, D. Long Term Impact of Grid Level Energy Storage on ChileanElectric System. Energies 2019, 12, 1070. [CrossRef]
56. Limpens, G.; Moret, S. The role of storage in the Swiss energy transition. In Proceedings of the 32ndInternational Conference On efficiency, Cost, Optimization, Simulation and Environmental Impact of EnergySystems, Wroclaw, Poland, 23–28 June 2019; Volume 1, pp. 761–774.
57. Generation, W.O. 100% Renewable Energy for Australia. Swiss J. Econ. Stat. 2016. Availableonline: http://www.uts.edu.au/sites/default/files/article/downloads/ISF_100%25_Australian_Renewable_Energy_Report.pdf (accessed on 12 June 2020).
58. Canales, F.A.; Jurasz, J.K.; Beluco, A. A Geothermal Hydro Wind Pv Hybrid System with Energy Storage in anExtinct Volcano for 100 % Renewable Supply in; pp. 1–19. Available online: https://arxiv.org/pdf/1907.04357(accessed on 10 July 2020).
49

Energies 2020, 13, 5502
59. Al-ghussain, L.; Samu, R.; Taylan, O. Techno-Economic Comparative Analysis of Renewable Energy Systems:Case Study in Zimbabwe. Available online: https://www.researchgate.net/publication/342707080_Techno-Economic_Comparative_Analysis_of_Renewable_Energy_Systems_Case_Study_in_Zimbabwe (accessed on21 August 2020).
60. Profile, S. Zimbabwe. 2016. Available online: https://constructionreviewonline.com/2019/05/zimbabwe-to-construction-of-three-250mw-solar-power-plants (accessed on 6 August 2020).
61. Makonese, T. Renewable Energy in Zimbabwe Renewable Energy in Zimbabwe. In Proceedings of the DomesticUse of Energy (DUE) 2018 International Conference, Cape Town, South Africa, 3–5 April 2018; pp. 1–5.
62. Zeyringer, M.; Pachauri, S.; Schmid, E.; Schmidt, J.; Worrell, E.; Morawetz, U.B. Energy for SustainableDevelopment Analyzing grid extension and stand-alone photovoltaic systems for the cost-effectiveelectrification of Kenya. Energy Sustain. Dev. 2020, 25, 75–86. [CrossRef]
63. Moner-Girona, M. Decentralized rural electrification in Kenya: Speeding up universal energy access.Energy Sustain. Dev. 2019, 52, 128–146. [CrossRef]
64. Chakir, A. Optimal energy management for a grid connected PV-battery system. Energy Rep. 2020, 6,218–231. [CrossRef]
65. Hamrouni, N.; Younsi, S.; Jraidi, M. A flexible active and reactive power control strategy of a LV gridconnected PV system. Energy Procedia 2019, 162, 325–338. [CrossRef]
66. Lund, H.; Østergaard, P.A. Electric grid and heat planning scenarios with centralised and distributed sourcesof conventional, CHP and wind generation. Energy 2000, 25, 299–312. [CrossRef]
67. Østergaard, P.A. Geographic aggregation and wind power output variance in Denmark. Energy 2008, 33,1453–1460. [CrossRef]
68. Østergaard, P.A. Transmission-grid requirements with scattered and fluctuating renewable electricity-sources.Appl. Energy 2003, 76, 247–255. [CrossRef]
69. Østergaard, P.A. Regulation strategies of cogeneration of heat and power (CHP) plants and electricity transitin Denmark. Energy 2010, 35, 2194–2202. [CrossRef]
70. Østergaard, P.A. Modelling grid losses and the geographic distribution of electricity generation. Renew. Energy2005, 30, 977–987. [CrossRef]
71. Østergaard, P.A. Reviewing EnergyPLAN simulations and performance indicator applications inEnergyPLAN simulations. Appl. Energy 2015, 154, 921–933. [CrossRef]
72. Lund, H.; Münster, E. Modelling of energy systems with a high percentage of CHP and wind power.Renew. Energy 2003, 28, 2179–2193. [CrossRef]
73. Danish Energy Agency. Technology data Energy Storage. 2018. Available online: https://ens.dk/sites/ens.dk/files/Analyser/technology_data_catalogue_for_energy_storage.pdf (accessed on 16 September 2019).
74. Lund, H. Energy Storage and Smart Energy Systems. Int. J. Sustain. Energy Plan. Manag. 2016, 11, 3–14.75. Sorknæs, P.; Lund, H.; Andersen, A.N.; Ritter, P. Small-scale combined heat and power as a balancing
reserve for wind—the case of participation in the German secondary control reserve. Int. J. Sustain. EnergyPlan. Manag. 2014, 4. [CrossRef]
76. Andersen, A.N.; Lund, H. New CHP partnerships offering balancing of fluctuating renewable electricityproductions. J. Clean. Prod. 2007, 15, 288–293. [CrossRef]
77. Lund, R.; Mathiesen, B.V. Large combined heat and power plants in sustainable energy systems. Appl. Energy2015, 142, 389–395. [CrossRef]
78. Østergaard, P.A.; Andersen, A.N. Booster heat pumps and central heat pumps in district heating. Appl. Energy2016, 184, 1374–1388. [CrossRef]
79. Østergaard, P.A.; Andersen, A.N. Economic feasibility of booster heat pumps in heat pump-based districtheating systems. Energy 2018, 155, 921–929. [CrossRef]
80. Bacekovic, I.; Østergaard, P.A. Local smart energy systems and cross-system integration. Energy 2018, 151,812–825. [CrossRef]
81. Prina, M.G. Smart energy systems applied at urban level: The case of the municipality of Bressanone-Brixen.Int. J. Sustain. Energy Plan. Manag. 2016, 10, 33–52.
82. Connolly, D. Smart Energy Systems: Holistic and Integrated Energy Systems for the era of 100% Renewable Energy;Aalborg University: Aalborg, Denmark, 2013.
83. Lund, H.; Mathiesen, B.V.; Connolly, D.; Østergaard, P.A. A smart energy systems approach to the choice andmodelling of 100 % renewable solutions. Renew. Energy Syst. 2014, 39, 5–12.
50

Energies 2020, 13, 5502
84. Pfeifer, A.; Krajacic, G.; Ljubas, D.; Duic, N. Increasing the integration of solar photovoltaics in energy mixon the road to low emissions energy system—economic and environmental implications. Renew. Energy2019, 5, 80. [CrossRef]
85. Lund, H.; Kempton, W. Integration of renewable energy into the transport and electricity sectors through V2G.Energy Policy 2008, 36, 3578–3587. [CrossRef]
86. Juul, N.; Pantuso, G.; Iversen, J.E.B.; Boomsma, T.K. Strategies for Charging Electric Vehicles in theElectricity Market. Int. J. Sustain. Energy Plan. Manag. 2015, 7, 67–74.
87. Samoita, D.; Remmen, A.; Nzila, C.; Østergaard, P.A. Renewable Electrification in Kenya: Potentials and Barriers;(IREK Working Paper No. 7). Copenhagen/Nairobi/Eldoret: AAU, ACTS and MU; 2019. Available online:https://www.irekproject.net/wp-content/uploads/IREK.Paper7_.pdf (accessed on 12 November 2019).
Publisher’s Note: MDPI stays neutral with regard to jurisdictional claims in published maps and institutionalaffiliations.
© 2020 by the authors. Licensee MDPI, Basel, Switzerland. This article is an open accessarticle distributed under the terms and conditions of the Creative Commons Attribution(CC BY) license (http://creativecommons.org/licenses/by/4.0/).
51


energies
Review
A Review on the Thermochemical Recycling of Waste Tyres toOil for Automobile Engine Application
Mohammad I. Jahirul 1,2,*, Farhad M. Hossain 3,4, Mohammad G. Rasul 1,2 and Ashfaque Ahmed Chowdhury 1,2
���������������
Citation: Jahirul, M.I.; Hossain, F.M.;
Rasul, M.G.; Chowdhury, A.A. A
Review on the Thermochemical
Recycling of Waste Tyres to Oil for
Automobile Engine Application.
Energies 2021, 14, 3837. https://
doi.org/10.3390/en14133837
Academic Editor: Idiano D’Adamo
Received: 10 May 2021
Accepted: 21 June 2021
Published: 25 June 2021
Publisher’s Note: MDPI stays neutral
with regard to jurisdictional claims in
published maps and institutional affil-
iations.
Copyright: © 2021 by the authors.
Licensee MDPI, Basel, Switzerland.
This article is an open access article
distributed under the terms and
conditions of the Creative Commons
Attribution (CC BY) license (https://
creativecommons.org/licenses/by/
4.0/).
1 School of Engineering and Technology, Central Queensland University, Rockhampton, QLD 4702, Australia;[email protected] (M.G.R.); [email protected] (A.A.C.)
2 Centre for Intelligent Systems, Clean Energy Academy, Central Queensland University,Rockhampton, QLD 4702, Australia
3 Biofuel Engine Research Facility, Queensland University of Technology (QUT), Brisbane, QLD 4000, Australia;[email protected] or [email protected]
4 Green Distillation Technologies Corporation Limited (GDTC), P.O. Box 4075, Richmond, VIC 3142, Australia* Correspondence: [email protected] or [email protected]; Tel.: +614-1380-9227
Abstract: Utilising pyrolysis as a waste tyre processing technology has various economic and socialadvantages, along with the fact that it is an effective conversion method. Despite extensive researchand a notable likelihood of success, this technology has not yet seen implementation in industrial andcommercial settings. In this review, over 100 recent publications are reviewed and summarised togive attention to the current state of global tyre waste management, pyrolysis technology, and plasticwaste conversion into liquid fuel. The study also investigated the suitability of pyrolysis oil for usein diesel engines and provided the results on diesel engine performance and emission characteristics.Most studies show that discarded tyres can yield 40–60% liquid oil with a calorific value of morethan 40 MJ/kg, indicating that they are appropriate for direct use as boiler and furnace fuel. It has alow cetane index, as well as high viscosity, density, and aromatic content. According to diesel engineperformance and emission studies, the power output and combustion efficiency of tyre pyrolysis oilare equivalent to diesel fuel, but engine emissions (NOX, CO, CO, SOX, and HC) are significantlygreater in most circumstances. These findings indicate that tyre pyrolysis oil is not suitable for directuse in commercial automobile engines, but it can be utilised as a fuel additive or combined withother fuels.
Keywords: waste tyre; waste management; pyrolysis; automobile engine
1. Introduction
The fast growth of industrialisation around the world has resulted in an expansion invehicle production as a main mode of transportation to mobilise the population and expandeconomies. At the same time, oil consumption in the transportation sector is fast increasing,resulting in a rapid depletion of non-renewable petroleum-based fuel [1–3]. Alterna-tive renewable and environmentally friendly sources of car fuel, such as biodiesel [4–8],oxygenated fuel [6,9,10], and blends with petroleum-based fuels [11,12], have receivedincreased attention in recent decades. However, due to economic and environmental con-cerns, waste-to-fuel technology has received increased attention from researchers aroundthe world in recent years [13]. Solid waste disposal in landfills is both expensive and dam-aging to the environment [14,15]. As a result, waste-to-fuel technology offers enormouspotential to reduce global waste while also replacing petroleum-based gasoline.
The increasing use of transportation vehicles results in a global stockpile of wastetyres, which is one of the biggest sources of pollution [5,16–19]. Around 1.5 billion tyresare produced worldwide each year, which implies the same number of tyres end upas waste tyres, amounting to nearly 17 million tons [20–22]. About 15–20 per cent oftyres are considered for recycling or reuse once they have reached the end of their useful
Energies 2021, 14, 3837. https://doi.org/10.3390/en14133837 https://www.mdpi.com/journal/energies
53

Energies 2021, 14, 3837
life, while the remaining 70–80 per cent are disposed of in landfills and remain in theenvironment [23]. Every year, one billion WT are disposed of in landfills around the world,and one car per person is disposed of each year in industrialised countries [6]. Due to thehigh likelihood of hazardous fumes from fire, these landfills are a severe hazard for theenvironment and human health [24], and they provide ideal conditions for rats, snakes,and mosquito breeding.
Due to their highly complicated structure, the variable composition of the raw material,and the chemical structure of the rubber from which the tyres are formed, recycling wastetyres is exceedingly challenging [18]. Tyres are made up of 45–47% rubber, 21.5–22%carbon black, 16.5–25% steel belts, and 4.5–5.5% textile overlays, which give the tyre itsultimate form and practical features. In addition, depending on the production methodand specification, numerous different materials can be added to the tyre [25,26]. Thecross-linkages formed between the elastomer and various components throughout theproduction process produce a three-dimensional chemical network, resulting in excellentelasticity and strength. Tyres are difficult to break down due to their complicated chemicalcomposition [25,27,28]. As a result, decomposition in the landfill will take more than acentury [29]. Furthermore, landfilling ignores the enormous energy potential of waste tyreswhile also posing a fire risk, resulting in dangerous gas emissions as well as the poisoningof water and soil. Several investigations have been undertaken in the last few decades tocreate effective technology for converting used tyres to energy [30–32]. Pyrolysis [33–36],gasification [37,38], and hydrothermal liquefaction [39] are the most prevalent methods forturning waste tyres into energy in the form of fuels. Pyrolysis, in particular, has received alot of interest for scraping tyre waste treatment because of its efficiency compared to othermethods. Pyrolysis can be used to turn waste tyres into petrol and diesel, as well as fuel oil,without harming the environment. It is the mechanism of thermally degrading long-chainmolecules into smaller molecules by heat and pressure in an oxygen-free environment,which results in the production of liquid hydrocarbons (oil), gases, and char [35,40,41].During pyrolysis, the tyres are cracked in a medium temperature range between 400 and700 ◦C, which produces char, tar, and gaseous fuels as well as steel [16]. This techniqueproduces oil that can be utilised directly in industrial applications and diesel engines, orit can be refined further. In comparison to petroleum-derived fuel oils, the most essentialfeature of this oil is its low exhaust pollution. There has been a lot of research on theperformance and emissions of diesel engines utilising tyre pyrolysis oil [21,42–44].
In recent decades, waste tyre pyrolysis technology has shown to be an effective waste-management strategy. This technology’s ultimate goal is to manufacture high-quality fuelsfrom scraping tyres that can compete with and eventually replace non-renewable fossil fuels.Despite extensive study and great advancements, waste tyre to vehicle fuel technologyhas not yet reached its full potential. This technology will need more development beforeit can be scaled up to an industrial level. However, in order to advance waste tyre toenergy technology and upgrade the technology on an industrial scale, it is critical tothoroughly comprehend the current development stage. This paper review over 100up-to-date papers from the literature and discussed the key findings, the current status,and the development of this technology. The information only considered from the peer-reviewed literature published in reputed international journals, conference proceedings,and reports. More emphasis was given to the recently published literature on the relatedtopic. For the analysis, data were only taken from the literature where the experimentswere carried out by the authors themselves in accordance with internationally recognisedtesting standards. Certain extreme information was removed from the database due to theunanticipated nature of the outcomes. The novelty of this article is to elaborate the wayto utilise tyre pyrolysis oil as a substitution for conventional petroleum-based automobilefuel. Additionally, limitations of current waste tyre to automobile fuel technology havebeen identified and based on the observation of literature research; the future direction ofresearch for commercialising the technology has been indicated. It has been expected that
54
Energies 2021, 14, 3837
the findings of this literature review will serve as a basis on which the industrial productionof waste tyre pyrolysis automobile engine oil will be possible.
2. Waste Tyre Management Practice
The goal of waste tyre management is to identify the most efficient approach to limitthe waste’s environmental impact. Reduction in consumption, reuse/recycling, and energyrecovery are all strategies for solving the WT problem. The primary reason for developingthose methods was the restrictions imposed by the government for collecting tyres forlandfills. In recent years, the methods that are used for waste tyre management includes:reuse and rethreading, product recycling, and recovery of energy [45]. Figure 1 depicts theprocess of a typical waste tyre management system.
Figure 1. A typical waste tire management system.
2.1. Reuse and Rethreading
The rethreading process is used for the repair of limited worn-out tyres because ofthe initial wearing and certification requirement of the damaged areas that need to berethreaded [46]. It is one of the most ideal strategies that require the limited deployment ofadditional energy and resources, mainly rubber, which accounts for 50% of the materialinvolved. It involves 20% usage in the damaged situation, whereas the remaining partconstitutes a tyre carcass [47]. Practically, rethreading requires about 25% of raw materialsand 30% of energy and only 30% of the energy needed to produce new tyres, which makethis process economically profitable [48]. However, because of the safety issue at highspeed, rethreading tyres is not used in automobile application [49].
2.2. Recycling
Recycling is also one of the widely used methods for managing waste tyre. Sienk-iewicz et al. [22] referred to recycling that does not include any treatment, be it physical orchemical in nature, and only disintegration is important. Moreover, the role of the shape ofthe tyre, their initial development in terms of size, durability, elasticity, vibration capacity,high damping, etc., makes this material very useful and important in works of many otherpurposes. There are many applications for the tyres recycled; some of the end products
55

Energies 2021, 14, 3837
from recycled rubber include: manufacturing new tyres, tracks for athletics, insulation inbuildings, matting surface, surfaces for playgrounds, marine non-slip surfaces, etc [50].
2.3. Energy Recovery
Various industrial processes rely on non-renewable energy sources, such as coal. Theabundance of coal and the combustion process are sufficient to meet the demand. Recoveryof waste tyres from other rubber products is one of the processes that can be used todeploy them as energy sources, such as fuel. Waste tyres can be used as an alternativefuel in cement kilns and for electricity generation, but their combustion and burningpollutes the environment. The cement industry uses tyres as a source of energy, makingit a cost-effective way to meet their high-temperature requirements. However, comparedto pollution levels in the air caused by the coal combustion process [22], this has a minorimpact. Figure 2 shows that 53% of used tyres in the United States are capable of meetingfuel requirements [51]. Cement and paper mills use 68% of waste tyre for their energyneeds, as shown in Figure 2.
Figure 2. US scrap tyre disposition.
3. Waste Tyre to Fuel Using Thermochemical Conversion
Thermochemical conversion is conducted at high temperatures, with or without thepresence of oxygen, to chemically degrade waste tyres. To produce bio-oil, syngas, andchar, mostly pyrolysis and gasification conversion methods are used. In comparison togasification, this study focused solely on pyrolysis because of its high liquid fuel recoveryand low environmental impact [51–54].
3.1. Waste Tyre Conversion Using Pyrolysis
Due to its nature and fewer processing steps, the pyrolysis process, such as othersimilar thermochemical processes, is thought to be the most environmentally friendly [39].The process involves the decomposition of the solid at a considerably inflated temperatureof around 300–900 ◦C in an environment that is free of oxygen and as a result producesproducing char, oil, and gas [54–58]. The important products of pyrolysis gas in most casesare H2, CO, CO2, CH4, whereas the liquid consists of mainly CH3OH, CH3COOH, andH2O. The rest of the solid products consist of carbon and ash [58–60]. The steps of thewaste tyre pyrolysis process are depicted in Figure 3.
56
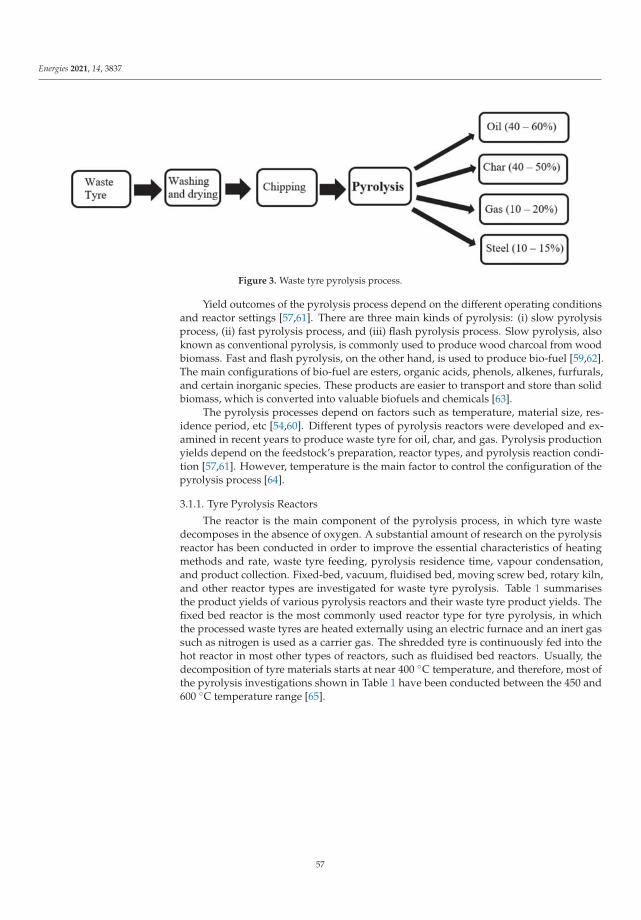
Energies 2021, 14, 3837
Figure 3. Waste tyre pyrolysis process.
Yield outcomes of the pyrolysis process depend on the different operating conditionsand reactor settings [57,61]. There are three main kinds of pyrolysis: (i) slow pyrolysisprocess, (ii) fast pyrolysis process, and (iii) flash pyrolysis process. Slow pyrolysis, alsoknown as conventional pyrolysis, is commonly used to produce wood charcoal from woodbiomass. Fast and flash pyrolysis, on the other hand, is used to produce bio-fuel [59,62].The main configurations of bio-fuel are esters, organic acids, phenols, alkenes, furfurals,and certain inorganic species. These products are easier to transport and store than solidbiomass, which is converted into valuable biofuels and chemicals [63].
The pyrolysis processes depend on factors such as temperature, material size, res-idence period, etc [54,60]. Different types of pyrolysis reactors were developed and ex-amined in recent years to produce waste tyre for oil, char, and gas. Pyrolysis productionyields depend on the feedstock’s preparation, reactor types, and pyrolysis reaction condi-tion [57,61]. However, temperature is the main factor to control the configuration of thepyrolysis process [64].
3.1.1. Tyre Pyrolysis Reactors
The reactor is the main component of the pyrolysis process, in which tyre wastedecomposes in the absence of oxygen. A substantial amount of research on the pyrolysisreactor has been conducted in order to improve the essential characteristics of heatingmethods and rate, waste tyre feeding, pyrolysis residence time, vapour condensation,and product collection. Fixed-bed, vacuum, fluidised bed, moving screw bed, rotary kiln,and other reactor types are investigated for waste tyre pyrolysis. Table 1 summarisesthe product yields of various pyrolysis reactors and their waste tyre product yields. Thefixed bed reactor is the most commonly used reactor type for tyre pyrolysis, in whichthe processed waste tyres are heated externally using an electric furnace and an inert gassuch as nitrogen is used as a carrier gas. The shredded tyre is continuously fed into thehot reactor in most other types of reactors, such as fluidised bed reactors. Usually, thedecomposition of tyre materials starts at near 400 ◦C temperature, and therefore, most ofthe pyrolysis investigations shown in Table 1 have been conducted between the 450 and600 ◦C temperature range [65].
57

Energies 2021, 14, 3837
Table 1. Various amount of product yield from waste tyre using pyrolysis reactor.
Reactor Type Temp. (◦C)Maximum Oil Yield (wt%)
ReferencesOil Char Gas
Fixed bed, batch 500 40.26 47.88 11.86 [17]Fixed bed, batch 450 63 30 7 [66]Fixed bed, batch 500 54.12 20.22 26.40 [67]Fixed bed, batch 400 38.8 34.0 27.2 [34]Fixed bed, batch, 475 55 36 9 [68]
Fluidised bed 450 55 42.5 2.5 [69]Fluidised bed 450 52 28 15 [33]
Moving screw bed 600 48.4 39.9 11.7 [70]Two stages fixed bed 600 22 37 27.2 [71]
Microwave oven reactor - 43 45 12 [46]Rotary kiln 600 40.21 52.67 7.12 [72]Rotary kiln 500 45.1 41.3 13.6 [73]Rotary kiln 550 38.12 49.09 2.39 [73]
Vacuum 500 56.5 33.4 10.1 [74]Vacuum 550 47.1 36.9 16 [74]
Fixed Bed Pyrolysis Reactor
Fixed bed pyrolysis reactors, as shown in Figure 4, are relatively simple to constructand efficient at producing clean fuel. These reactors are typically operated in batch mode.The waste tyre is fed into a fixed bed inside a cylindrical steel pyrolyser. Heat is suppliedto the waste tyre via the pyrolyser wall by an electrical heater or furnace mounted aroundthe reactor. By purging pressurised nitrogen (N2) from the external cylinder, all the oxygeninside the pyrolyser is eliminated. When waste tyres decompose, solid char accumulatesat the bottom of the pyrolyser, while vapour (both condensable and non-condensable)escapes to the top. The vapour is then cooled by a condenser, which condenses thecondensable vapour into oil, which is then stored and collected in a liquid storage container.The non-condensable vapour remains gaseous and is collected as syngas [74]. The basiccharacteristics of fixed bed reactors are higher carbon conservation rate, lower velocity ofgas, lower gas carryover rate, and a long residence period of solid. Generally, small-scaleheat and power applications are considered for these reactors [75,76]. The removal oftar from fixed bed reactors is a major issue; however, recent advances in thermal andcatalytic tar conversion have provided a possible solution to eliminate the problem [77–79].In a 1.15-L, nitrogen fixed bed reactor in a temperature range of 400–700 ◦C, Aydin andIlkilic [17] investigate the pyrolysis of waste tyres in stationary reactors, with removedfabric and steel. The oil output increase from 31% at 400 ◦C to 40% at 500 ◦C, and thereturn at higher temperatures increased slightly. Kar [67] investigated the effect of pyrolysistemperature ranging from 375 to 500 ◦C in a laboratory model fixed bed pyrolysis reactor.The highest oil output of 60.0 wt% oils was reported to be attained at 425 ◦C in this study.However, the oil output reduced to 54.12 wt% at higher pyrolysis temperatures, at 500◦C. The output of gas increased from 2.99% to 20.22%W while the output of char fellfrom 50.67% to 26.40%, with pyrolysis temperature increasing from 375 ◦C to 500 ◦C. In asimilar pyrolysis reactor, Banar et al. [34] obtained 38.8 wt% of oil, 27.2 wt% of gas and 34wt% of char at 400 ◦C pyrolysis temperature. The study further investigated the effect onwaste tyre pyrolysis on the heating rate and found that the heating rate was influencedby a decrease in oil production to 35.1 wt% and gas yield to 33.8 wt% as the heating rateincreased at a pyrolysis temperature of 400 ◦C from 5 ◦C min−1 to 35 ◦C min−1.
58

Energies 2021, 14, 3837
Figure 4. Diagram of a fixed bed pyrolysis reactor.
Fluidised Bed Reactor
In the oil and chemical industries, fluidised bed pyrolysis reactors are widely used.In contrast to fixed bed reactors, waste tyres in fluidised bed reactors can be processedcontinuously, making them very efficient and cost-effective, particularly in industrialplants [80]. This type of reactor can produce high-quality oil, with a liquid yield of 50–60%of the dry weight of the waste tyre. Waste plastics are shredded into smaller piecesand continuously fed into a pyrolyser’s hot sand or other stable solid beds. To makethe pyrolyser oxygen-free, the solid bed is fluidised with N2 or other inert gases. Theshredded tyre quickly heated up on the solid hotbed and decomposed into vapour, char,and aerosols [81–83]. Char is removed with a cyclone separator, and the remaining vapouris quickly cooled into bio-oil and stored with a quench cooler, as shown in Figure 5. Theheat required to run this type of reactor can be created by burning a portion of the producedgas in the bed or by burning char produced in another chamber and transferring the heatto the solid bed [84]. One essential feature of the fluidising bed reactor is that the shreddedtyre particle sizes of less than 2–3 mm are needed to achieve the desired heating rate [85,86].The investigations were made in this types of reactor including an industrial scale with athroughput of 200 kg h−1, a pilot scale with a throughput of 30 kg h−1, and a laboratoryscale with a throughput of 1 kg h−1 [65]. Williams et al. [69] pyrolysed tyre crumb (up to1.4 mm size) in a laboratory-scale fluidised bed reactor ranging the temperature between450 and 600 ◦C. The reactor dimensions were 100 cm in height and 7.5 cm in diameter,with a feedstock processing capacity of 220 gm kg h−1. The quartz sand was utilised asa fluidised bed, with nitrogen serving as the fluidising air, and was pre-heated to 400 ◦Cusing an external electrical furnace. For pyrolysis vapour condensation, a series of water-cooled and dry ice/acetone-cooled condensers were used. This study found a maximumoil yield of 55% at 450 ◦C. However, the oil yield was reduced to 43.5% at 600 ◦C pyrolysistemperature and at the same time, the gas yield was increased from 2.5% to 14%.
59

Energies 2021, 14, 3837
Figure 5. Diagram of a fluidised bed pyrolysis reactor.
Rotary Kiln Reactor
In a rotary kiln reactor shown in Figure 6, the waste tyres are fed into the front endof the reactor. The waste tyres inside the reactor are heated, moving down the cylinder,and pyrolytic gases are released. The reactor is slowly rotated and its inclined featureensures the mixing and uniform heating of waste tyre [87]. This reactor offers variousunique characteristics, such as the capacity to process heterogeneous feedstock, flexibilityin residence time adjustment, proper and uniform waste tyre mixing, no need for wastetyre pre-treatment, and simple and easy maintenance. However, because of the sluggishheating rate, these reactors are mostly employed for slow pyrolysis applications. Thereason for the low heating rates is that heat is transported to the feedstock from the outsidereactor via the reactor wall only, and the particle size and contact area between the reactorwall surface and the feedstock are minimal. The heating rate can be achieve a maximum of100 ◦C/min with a minimum residence time of 1 h [88]. Galvagno et al. [73] conducted anexperiment on waste tyre pyrolysis in a pilot-scale rotary kiln reactor. The rotary reactorhad a diameter of 0.4 m and rotated at 3 rpm, and was heated externally using 4.8 kg h−1
electrical furnaces. Condensed fractions of heavy and light pyrolysis oil were condensed ina condensation system, and the non-condensable gases were cleaned to remove acid gasesbefore being combusted in a flare. The pyrolysis char (residue) was continuously releasedin a water-cooled tank. They obtained 45.1% of oil, 44.3% of char, and 13.6% of gas whileconducting waste tyre pyrolysis at 500 ◦C.
60

Energies 2021, 14, 3837
%endparacol
Figure 6. Diagram of a rotary kiln reactor pyrolysis reactor.
Screw Bed Reactor
The screw bed reactors consist of a rotating screw (Figure 7), are tubular in shape,and operate continuously. Rotation of the screw assists feedstock delivery into the reactor,while heat required for the pyrolysis process is conveyed across the tubular reactor wall.Thus, the screw serves two functions: first, mixing the feedstock and second, regulatingthe feedstock residence time in the reactor. A large hopper is used to feeds waste tyresinto the screw bed. Inert gases are usually N2. The hopper is supplied to the hopperto eliminate oxygen from the feedstock and also make the pyrolysis system oxygen-free.By creating a modest positive pressure at the screw bed, the inert gas also aids in thetransmission of pyrolysis vapour [89]. Steel and ceramic pellets are normally packed withfeedstock particles, which serves as a solid heat carrier for pyrolysis. This allows feedstockparticles to interact more closely as they move through the screw bed. The oil is producedby drawing the vapours produced by the pyrolysis process into a condenser. An importantadvantage of a screw bed reactor is that it may be made to be very compact and evenportable in some situations, allowing the reactor to be used at the feedstock generatingsite or anywhere there is lots of feedstock. On-site feedstock processing reduces operatingexpenses by lowering feedstock transportation expenses to the biorefinery [90]. However,if the reactor is not designed properly, there will be poor heat transfer and temperaturecontrol, resulting in the deposition of polymeric materials in the reactor’s interior [91].
Figure 7. Diagram of a rotary screw bed pyrolysis reactor.
61
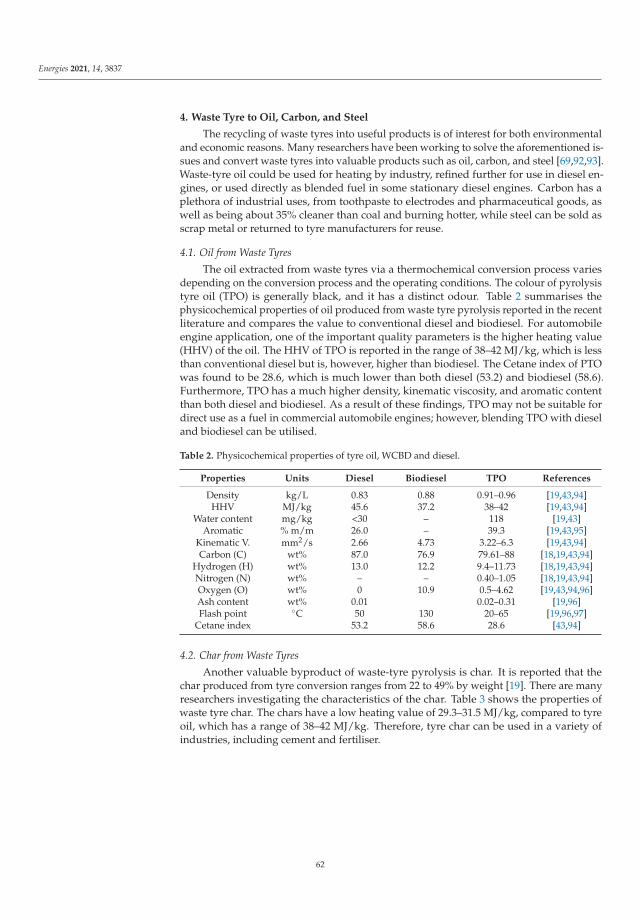
Energies 2021, 14, 3837
4. Waste Tyre to Oil, Carbon, and Steel
The recycling of waste tyres into useful products is of interest for both environmentaland economic reasons. Many researchers have been working to solve the aforementioned is-sues and convert waste tyres into valuable products such as oil, carbon, and steel [69,92,93].Waste-tyre oil could be used for heating by industry, refined further for use in diesel en-gines, or used directly as blended fuel in some stationary diesel engines. Carbon has aplethora of industrial uses, from toothpaste to electrodes and pharmaceutical goods, aswell as being about 35% cleaner than coal and burning hotter, while steel can be sold asscrap metal or returned to tyre manufacturers for reuse.
4.1. Oil from Waste Tyres
The oil extracted from waste tyres via a thermochemical conversion process variesdepending on the conversion process and the operating conditions. The colour of pyrolysistyre oil (TPO) is generally black, and it has a distinct odour. Table 2 summarises thephysicochemical properties of oil produced from waste tyre pyrolysis reported in the recentliterature and compares the value to conventional diesel and biodiesel. For automobileengine application, one of the important quality parameters is the higher heating value(HHV) of the oil. The HHV of TPO is reported in the range of 38–42 MJ/kg, which is lessthan conventional diesel but is, however, higher than biodiesel. The Cetane index of PTOwas found to be 28.6, which is much lower than both diesel (53.2) and biodiesel (58.6).Furthermore, TPO has a much higher density, kinematic viscosity, and aromatic contentthan both diesel and biodiesel. As a result of these findings, TPO may not be suitable fordirect use as a fuel in commercial automobile engines; however, blending TPO with dieseland biodiesel can be utilised.
Table 2. Physicochemical properties of tyre oil, WCBD and diesel.
Properties Units Diesel Biodiesel TPO References
Density kg/L 0.83 0.88 0.91–0.96 [19,43,94]HHV MJ/kg 45.6 37.2 38–42 [19,43,94]
Water content mg/kg <30 – 118 [19,43]Aromatic % m/m 26.0 – 39.3 [19,43,95]
Kinematic V. mm2/s 2.66 4.73 3.22–6.3 [19,43,94]Carbon (C) wt% 87.0 76.9 79.61–88 [18,19,43,94]
Hydrogen (H) wt% 13.0 12.2 9.4–11.73 [18,19,43,94]Nitrogen (N) wt% – – 0.40–1.05 [18,19,43,94]Oxygen (O) wt% 0 10.9 0.5–4.62 [19,43,94,96]Ash content wt% 0.01 0.02–0.31 [19,96]Flash point ◦C 50 130 20–65 [19,96,97]
Cetane index 53.2 58.6 28.6 [43,94]
4.2. Char from Waste Tyres
Another valuable byproduct of waste-tyre pyrolysis is char. It is reported that thechar produced from tyre conversion ranges from 22 to 49% by weight [19]. There are manyresearchers investigating the characteristics of the char. Table 3 shows the properties ofwaste tyre char. The chars have a low heating value of 29.3–31.5 MJ/kg, compared to tyreoil, which has a range of 38–42 MJ/kg. Therefore, tyre char can be used in a variety ofindustries, including cement and fertiliser.
62

Energies 2021, 14, 3837
Table 3. Properties of waste-tyre chars.
Properties UnitsTyre Pyrolysis Char
[98] [87] [73] [99]
HHV MJ/kg 30.8 31.5 30.7 29.3Water content mg/kg 0.37 2.35 3.57
Carbon (C) wt% 88.19 82.17 85.31 80.3Hydrogen (H) wt% 0.6 2.28 1.77 1.3Nitrogen (N) wt% 0.1 0.61 0.34 0.3Sulphur (S) wt% 1.9 2.32 2.13 2.7Ash content wt% 8.27 12.32 15.33
4.3. Gas from Waste Tyre
The gas obtained from waste tyre pyrolysis is called pyrogas or syngas. It is nor-mally a mixture of hydrogen (H2) and olefins, and paraffins with carbon numbers rangingfrom one to six (C2–C6) with a low concentration of nitrogen (N2) and sulphur (S) com-pounds [100,101]. The syngas’ calorific value ranges from 50 to 70 MJ/m3 [93–95]. It hasbeen commonly reported that the syngas produces from waste tyre pyrolysis is sufficientfor supplying the required heat for the process [18,73,102,103].
4.4. Steel from Waste Tyre
Waste tyres also produce steel when converted by a thermochemical process. It isreported that the amount of steel recovered from waste tyres typically ranges from 10to 15% by weight of the waste tyre [19]. The recovered steel can be reused by the tyremanufacturer or diverted to steel re-rolling mills.
5. Diesel Engine Performance and Exhaust Emission Using Tyre Oil
According to various researchers [95,104], the properties of waste-tyre pyrolysis aresimilar to those of diesel and gasoline. In today’s world, the diesel engine is the most widelyused internal combustion engine. Increased demand for diesel fuel, combined with limitedresources, has prompted a search for alternative fuels for diesel engines, such as alcohol,LPG, biodiesel, and compressed natural gas (CNG) [55]. The results of studies on enginetesting with tyre oil in the literature vary due to the different properties of the test fuelsand different test-engine technology [102]. In an engine-emissions analysis, many variablesmust be controlled, such as engine speed, fuel composition, and load condition. Tyre fuelhas proven to be one of the most important and useful research outputs. However, fundingfor the use of tyre-derived pyrolytic fuel or diesel-blend fuel has been limited because theeffects on overall engine performance and emissions have not been sufficiently confirmed.As a result, additional research focusing on diesel engine emissions using oil from wastetyres is expected to have a positive impact in alternative industries. Furthermore, it couldbe a promising option in the search for low-emission energy sources.
Several researchers have conducted tests on diesel engine performance with tyre oil inrecent years. Table 4 summarises their findings. Vihar et al. [43] experimentally analysedthe combustion characteristics and emission of tyre pyrolysis oil in a turbo-charged six-cylinder compression ignition engine using 100% TPO as fuel. They found a stable dieselrunning throughout the experiment with an almost similar thermal efficiency and specificfuel combustion. However, due to the higher density of TPO compared with diesel whichhas a direct link with fuel spray to the cylinder, the ignition delay (ID) of combustion andcylinder peak pressure (CPP) were found to be higher. Engine exhaust emission NOX,CO, SO2 and HC was found to be significantly higher (2–50%), whereas smoke emissionwas found slightly lower while running the engine with 100% TPO compared with diesel.Similar results were reported by Žvar Baškovic et. al. [105] when conducting an experimentin a 1.6-litre multi-cylinder common-rail diesel engine running with 100% pure TPO. Tuduet al. [42] examined the effect of diethyl ether in a diesel engine running on a tyre-derivedfuel-diesel blend. They blended 40% tyre-pyrolysis oil with diesel and simultaneously 4%
63
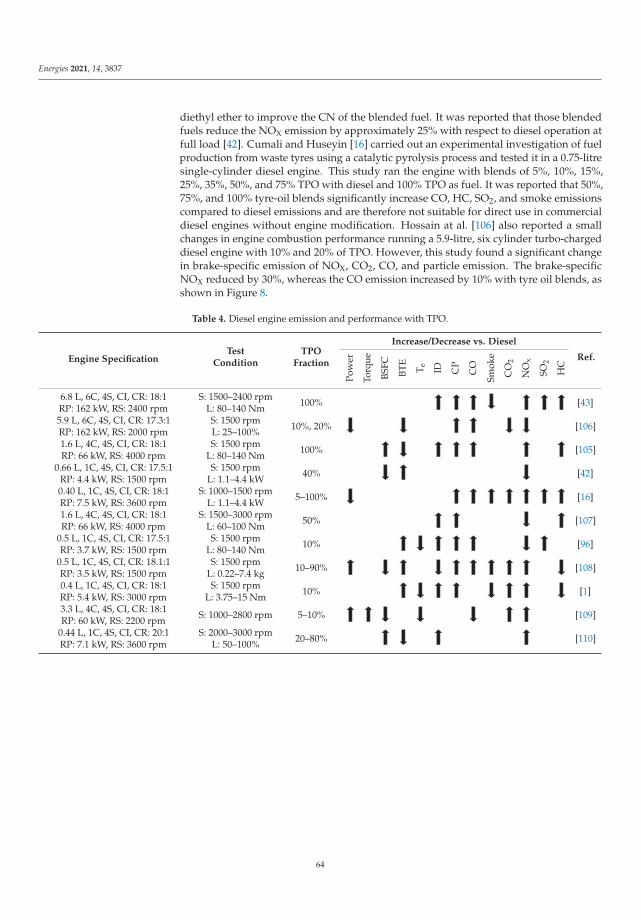
Energies 2021, 14, 3837
diethyl ether to improve the CN of the blended fuel. It was reported that those blendedfuels reduce the NOX emission by approximately 25% with respect to diesel operation atfull load [42]. Cumali and Huseyin [16] carried out an experimental investigation of fuelproduction from waste tyres using a catalytic pyrolysis process and tested it in a 0.75-litresingle-cylinder diesel engine. This study ran the engine with blends of 5%, 10%, 15%,25%, 35%, 50%, and 75% TPO with diesel and 100% TPO as fuel. It was reported that 50%,75%, and 100% tyre-oil blends significantly increase CO, HC, SO2, and smoke emissionscompared to diesel emissions and are therefore not suitable for direct use in commercialdiesel engines without engine modification. Hossain at al. [106] also reported a smallchanges in engine combustion performance running a 5.9-litre, six cylinder turbo-chargeddiesel engine with 10% and 20% of TPO. However, this study found a significant changein brake-specific emission of NOX, CO2, CO, and particle emission. The brake-specificNOX reduced by 30%, whereas the CO emission increased by 10% with tyre oil blends, asshown in Figure 8.
Table 4. Diesel engine emission and performance with TPO.
Engine SpecificationTest
ConditionTPO
Fraction
Increase/Decrease vs. Diesel
Ref.Po
wer
Torq
ue
BSFC
BTE
Te
ID CP
CO
Smok
e
CO
2
NO
x
SO2
HC
6.8 L, 6C, 4S, CI, CR: 18:1RP: 162 kW, RS: 2400 rpm
S: 1500–2400 rpmL: 80–140 Nm 100% [43]
5.9 L, 6C, 4S, CI, CR: 17.3:1RP: 162 kW, RS: 2000 rpm
S: 1500 rpmL: 25–100% 10%, 20% [106]
1.6 L, 4C, 4S, CI, CR: 18:1RP: 66 kW, RS: 4000 rpm
S: 1500 rpmL: 80–140 Nm 100% [105]
0.66 L, 1C, 4S, CI, CR: 17.5:1RP: 4.4 kW, RS: 1500 rpm
S: 1500 rpmL: 1.1–4.4 kW 40% [42]
0.40 L, 1C, 4S, CI, CR: 18:1RP: 7.5 kW, RS: 3600 rpm
S: 1000–1500 rpmL: 1.1–4.4 kW 5–100% [16]
1.6 L, 4C, 4S, CI, CR: 18:1RP: 66 kW, RS: 4000 rpm
S: 1500–3000 rpmL: 60–100 Nm 50% [107]
0.5 L, 1C, 4S, CI, CR: 17.5:1RP: 3.7 kW, RS: 1500 rpm
S: 1500 rpmL: 80–140 Nm 10% [96]
0.5 L, 1C, 4S, CI, CR: 18.1:1RP: 3.5 kW, RS: 1500 rpm
S: 1500 rpmL: 0.22–7.4 kg 10–90% [108]
0.4 L, 1C, 4S, CI, CR: 18:1RP: 5.4 kW, RS: 3000 rpm
S: 1500 rpmL: 3.75–15 Nm 10% [1]
3.3 L, 4C, 4S, CI, CR: 18:1RP: 60 kW, RS: 2200 rpm S: 1000–2800 rpm 5–10% [109]
0.44 L, 1C, 4S, CI, CR: 20:1RP: 7.1 kW, RS: 3600 rpm
S: 2000–3000 rpmL: 50–100% 20–80% [110]
64

Energies 2021, 14, 3837
Figure 8. Brake-specific NOx (a) and CO (b) emission with TPO. (100D—100% diesel; 90D10T—90% diesel + 10% TPO;80D20T—80% diesel + 20% TPO).
6. Discussion and Synthesis
The idea of waste tyre management is to find the best way to reduce the environmentalimpact produced by this waste. Waste tyre pyrolysis technology is proven as an efficientmethod in waste tyre management in recent decades. High-quality fuels from scrapetyre can be produced through pyrolysis, which will eventually replace non-renewablefossil fuels. Despite the fact that there has been a lot of research interest in waste tyrethermochemical conversion to fuel in recent decades, the commercialisation of TPO as anautomotive engine fuel technology is still a long way off. It is necessary to fully recognisethe current development stage as well as many technical and economical hurdles that needto be overcome for further development of waste tyre to energy technology and upgradethe technology on an industrial scale. There is minimal study regarding the industrialcost of tyre pyrolysis. It is essential that the financial and environmental benefits of thetyre pyrolysis have been thoroughly researched, and the cost has been decreased furtherfor a large-scale commercial application to be viable in the long term. To realise the fullpotential of waste tyre pyrolysis technology, further research and development are needed,and some of the future challenges are described below:
• Conduct in-depth energy and economic studies of integrated waste tyre pyrolysisplants over their entire life cycle.
• Recognise the trade-offs between the scale of the waste tyre pyrolysis plant andfeedstock, as well as the costs of transportation to a centralised upgrading facility.
• Development of the technology to overcome the limitations of the tyre pyrolysisreactor and process and improve the reliability.
• Identify TPO criteria and quality standards for manufacturers and end-user.• Improve quality and consistency of TPO through the development of more effec
-tive technologies.• Develop catalyst for TPO upgrading in order to meet vehicle fuel-quality standards.• Develop deoxygenated catalysts to extract oxygen-containing compounds for pyroly-
sis processes for oil property improvement.• Advocacy to develop relevant policy, regulation, and financial incentives for the tyre
recyclers, refineries and start-ups who take up the challenges of recycling used tyresto oil.
65

Energies 2021, 14, 3837
7. Conclusions
The purpose of this study was to investigate the use of waste tyres as an alternativefuel to address the global problem of waste tyre management and environmental concerns.This paper summarises, describes, and presents research findings from recent publicationson these topics. According to the literature, pyrolysis is the most common thermochemicalmethod for addressing the waste tyre management issue due to its simplicity, high recoveryof liquid and solid materials, and low environmental impact. As a result, the technologicalaspects of waste-tyre pyrolysis, including product yield, consistency, and applications, havereceived increased attention. The findings of this literature review lead to the followingconclusions:
The product yield and composition of waste tyre pyrolysis depends on reactor typeand operating condition. The average production yield of oil, char, syngas, and steelfrom waste tyre pyrolysis is 40–60%, 40–50%, 10–20%, and 10–15% by weight.The pyrolysis temperature range of 450–500 ◦C is favourable for the high yield ofliquid oil, whereas over 600 ◦C is for gas, and below 400 ◦C is for solid char production.Waste tyre pyrolysis products (oil, gas, and char) contain a high calorific value whichis suitable to be directly used as a heat source in boiler, furnace, and other applications.The cetane index of WTO is much lower than that of petroleum diesel and biodiesel.The other important properties for automobile engine application, such as den-sity, kinematic viscosity, and aromatic content of TPO, were higher than dieseland biodiesel.Many studies have attempted to run diesel with pure TPO and attempted to run dieselwith pure TPO and blended with diesel to observe engine combustion performanceand exhaust emissions. The summary of these research findings indicated similarpower output of engines with TPO and diesel. However, ignition delay and cylinderpressure were found to be higher with TPO due to its high density and viscosity.Incorporated with high content of aromatic compound and combustion variations,TPO shows significantly higher NOx, CO, CO, SOx, and HC emission reported bymost of the studies.Although pure TPO is not recommended to directly use in commercial automobileengine fuel due to engine durability and exhaust emission issues, a blending below20% of TPO with diesel can be utilisd.The commercialisation and industrial production of waste tyre to commercial auto-mobile liquid fuel requires more in-depth techno-economic assessment and qualityimprovement of WTO.
Author Contributions: Conceptualization, M.I.J., F.M.H.; Data collection and curation, M.I.J., F.M.H.;Formal analysis, M.I.J., F.M.H., M.G.R.; Writing original draft, M.I.J., F.M.H.; Writing—review andediting—M.G.R., A.A.C. All authors have read and agreed to the published version of the manuscript.
Funding: This research received no external funding.
Institutional Review Board Statement: Not applicable.
Informed Consent Statement: Not applicable.
Data Availability Statement: Not applicable as it is a review article.
Conflicts of Interest: The authors declare no conflict of interest.
References
1. Uyumaz, A.; Aydogan, B.; Solmaz, H.; Yılmaz, E.; Yesim Hopa, D.; Aksoy Bahtli, T.; Solmaz, Ö.; Aksoy, F. Production of waste tyreoil and experimental investigation on combustion, engine performance and exhaust emissions. J. Energy Inst. 2019, 92, 1406–1418.[CrossRef]
2. Murugan, S.; Ramaswamy, M.C.; Nagarajan, G. A comparative study on the performance, emission and combustion studies of aDI diesel engine using distilled tyre pyrolysis oil–diesel blends. Fuel 2008, 87, 2111–2121. [CrossRef]
66

Energies 2021, 14, 3837
3. Saidur, R.; Jahirul, M.I.; Moutushi, T.Z.; Imtiaz, H.; Masjuki, H.H. Effect of partial substitution of diesel fuel by natural gas onperformance parameters of a four-cylinder diesel engine. Proc. Inst. Mech. Eng. Part. A J. Power Energy 2007, 221, 1–10. [CrossRef]
4. Jahirul, M.I.; Koh, W.; Brown, R.J.; Senadeera, W.; Hara, I.; Moghaddam, L. Biodiesel Production from Non-Edible Beauty Leaf(Calophyllum inophyllum) Oil: Process Optimization Using Response Surface Methodology (RSM). Energies 2014, 7, 5317–5331.[CrossRef]
5. Rahman, M.M.; Pourkhesalian, A.M.; Jahirul, M.I.; Stevanovic, S.; Pham, P.X.; Wang, H.; Masri, A.R.; Brown, R.J.; Ristovski,Z.D. Particle emissions from biodiesels with different physical properties and chemical composition. Fuel 2014, 134, 201–208.[CrossRef]
6. Jahirul, M.I.; Brown, R.J.; Senadeera, W.; Ashwath, N.; Rasul, M.G.; Rahman, M.M.; Hossain, F.M.; Moghaddam, L.; Islam, M.A.;O’Hara, I.M. Physio-chemical assessment of beauty leaf (Calophyllum inophyllum) as second-generation biodiesel feedstock.Energy Rep. 2015, 1, 204–215. [CrossRef]
7. Haseeb, A.S.M.A.; Fazal, M.A.; Jahirul, M.I.; Masjuki, H.H. Compatibility of automotive materials in biodiesel: A review. Fuel2011, 90, 922–931. [CrossRef]
8. Jahirul, M.I.; Brown, R.J.; Senadeera, W.; O’Hara, I.M.; Ristovski, Z.D. The Use of Artificial Neural Networks for IdentifyingSustainable Biodiesel Feedstocks. Energies 2013, 6, 3764–3806. [CrossRef]
9. Guan, C.; Cheung, C.S.; Li, X.; Huang, Z. Effects of oxygenated fuels on the particle-phase compounds emitted from a dieselengine. Atmos. Pollut. Res. 2017, 8, 209–220. [CrossRef]
10. Alptekin, E. Emission, injection and combustion characteristics of biodiesel and oxygenated fuel blends in a common rail dieselengine. Energy 2017, 119, 44–52. [CrossRef]
11. Feng, Z.; Zhan, C.; Tang, C.; Yang, K.; Huang, Z. Experimental investigation on spray and atomization characteristics ofdiesel/gasoline/ethanol blends in high pressure common rail injection system. Energy 2016, 112, 549–561. [CrossRef]
12. Valentino, G.; Corcione, F.E.; Iannuzzi, S.E.; Serra, S. Experimental study on performance and emissions of a high speed dieselengine fuelled with n-butanol diesel blends under premixed low temperature combustion. Fuel 2012, 92, 295–307. [CrossRef]
13. Wang, W.-C.; Bai, C.-J.; Lin, C.-T.; Prakash, S. Alternative fuel produced from thermal pyrolysis of waste tires and its use in a DIdiesel engine. Appl. Therm. Eng. 2016, 93, 330–338. [CrossRef]
14. Mokhtar, N.M.; Omar, R.; Idris, A. Microwave Pyrolysis for Conversion of Materials to Energy: A Brief Review. Energy SourcesPart A Recovery Util. Environ. Eff. 2012, 34, 2104–2122. [CrossRef]
15. Damodharan, D.; Rajesh Kumar, B.; Gopal, K.; de Poures, M.V.; Sethuramasamyraja, B. Utilization of waste plastic oil in dieselengines: A review. Rev. Environ. Sci. BioTechnol. 2019, 18, 681–697. [CrossRef]
16. Ilkılıç, C.; Aydın, H. Fuel production from waste vehicle tires by catalytic pyrolysis and its application in a diesel engine. FuelProcess. Technol. 2011, 92, 1129–1135. [CrossRef]
17. Aydın, H.; Ilkılıç, C. Optimization of fuel production from waste vehicle tires by pyrolysis and resembling to diesel fuel byvarious desulfurization methods. Fuel 2012, 102, 605–612. [CrossRef]
18. Martínez, J.D.; Puy, N.; Murillo, R.; García, T.; Navarro, M.V.; Mastral, A.M. Waste tyre pyrolysis—A review. Renew. Sustain.Energy Rev. 2013, 23, 179–213. [CrossRef]
19. Williams, P.T. Pyrolysis of waste tyres: A review. Waste Manag. 2013, 33, 1714–1728. [CrossRef]20. ETRMA. European Tyre and Rubber Industry Statistics. European Tyre and Rubber Manufacturing Association. Available online:
http://www.etrma.org (accessed on 20 December 2014).21. Martínez, J.D.; Rodríguez-Fernández, J.; Sánchez-Valdepeñas, J.; Murillo, R.; García, T. Performance and emissions of an
automotive diesel engine using a tire pyrolysis liquid blend. Fuel 2014, 115, 490–499. [CrossRef]22. Sienkiewicz, M.; Kucinska-Lipka, J.; Janik, H.; Balas, A. Progress in used tyres management in the European Union: A review.
Waste Manag. 2012, 32, 1742–1751. [CrossRef]23. Parthasarathy, P.; Choi, H.S.; Park, H.C.; Hwang, J.G.; Yoo, H.S.; Lee, B.-K.; Upadhyay, M. Influence of process conditions on
product yield of waste tyre pyrolysis—A review. Korean J. Chem. Eng. 2016, 33, 2268–2286. [CrossRef]24. Verma, P.; Zare, A.; Jafari, M.; Bodisco, T.A.; Rainey, T.; Ristovski, Z.D.; Brown, R.J. Diesel engine performance and emissions with
fuels derived from waste tyres. Sci. Rep. 2018, 8, 2457. [CrossRef]25. Mastral, A.M.; Murillo, R.; Callén, M.S.; García, T. Application of coal conversion technology to tire processing. Fuel Process.
Technol. 1999, 60, 231–242. [CrossRef]26. Mastral, A.M.; Murillo, R.; Callén, M.S.; García, T.; Snape, C.E. Influence of Process Variables on Oils from Tire Pyrolysis and
Hydropyrolysis in a Swept Fixed Bed Reactor. Energy Fuels 2000, 14, 739–744. [CrossRef]27. Gent, A.N. Chapter 1—Rubber Elasticity: Basic Concepts and Behavior. In The Science and Technology of Rubber, 4th ed.; Mark, J.E.,
Erman, B., Roland, C.M., Eds.; Academic Press: Boston, MA, USA, 2013; pp. 1–26. [CrossRef]28. Kyari, M.; Cunliffe, A.; Williams, P.T. Characterization of Oils, Gases, and Char in Relation to the Pyrolysis of Different Brands of
Scrap Automotive Tires. Energy Fuels 2005, 19, 1165–1173. [CrossRef]29. Leung, D.Y.C.; Wang, C.L. Kinetic study of scrap tyre pyrolysis and combustion. J. Anal. Appl. Pyrolysis 1998, 45, 153–169.
[CrossRef]30. Lorber, K.E.; Sarc, R.; Aldrian, A. Design and quality assurance for solid recovered fuel. Waste Manag. Res. 2012, 30, 370–380.
[CrossRef] [PubMed]
67

Energies 2021, 14, 3837
31. Sarc, R.; Lorber, K.E. Production, quality and quality assurance of Refuse Derived Fuels (RDFs). Waste Manag. 2013, 33, 1825–1834.[CrossRef] [PubMed]
32. Sarc, R.; Lorber, K.E.; Pomberger, R.; Rogetzer, M.; Sipple, E.M. Design, quality, and quality assurance of solid recovered fuels forthe substitution of fossil feedstock in the cement industry. Waste Manag. Res. 2014, 32, 565–585. [CrossRef]
33. Dai, X.; Yin, X.; Wu, C.; Zhang, W.; Chen, Y. Pyrolysis of waste tires in a circulating fluidized-bed reactor. Energy 2001, 26, 385–399.[CrossRef]
34. Banar, M.; Akyıldız, V.; Özkan, A.; Çokaygil, Z.; Onay, Ö. Characterization of pyrolytic oil obtained from pyrolysis of TDF (TireDerived Fuel). Energy Convers. Manag. 2012, 62, 22–30. [CrossRef]
35. Jahirul, M.I.; Rasul, M.G.; Chowdhury, A.A.; Ashwath, N. Biofuels Production through Biomass Pyrolysis—A TechnologicalReview. Energies 2012, 5, 4952–5001. [CrossRef]
36. Rasul, M.G.; Jahirul, M.I. Recent Developments in Biomass Pyrolysis for Bio-Fuel Production: Its Potential for Commercial Applications;Centre for Plant and Water Science, Faculty of Sciences, Engineering and Health, Central Queensland University: NormanGardens, Australia, 2012; pp. 256–265.
37. Donatelli, A.; Iovane, P.; Molino, A. High energy syngas production by waste tyres steam gasification in a rotary kiln pilot plant.Experimental and numerical investigations. Fuel 2010, 89, 2721–2728. [CrossRef]
38. Janajreh, I.; Raza, S.S. Numerical simulation of waste tyres gasification. Waste Manag. Res. 2015, 33, 460–468. [CrossRef]39. Zhang, L.; Zhou, B.; Duan, P.; Wang, F.; Xu, Y. Hydrothermal conversion of scrap tire to liquid fuel. Chem. Eng. J. 2016, 285,
157–163. [CrossRef]40. Uddin, M.N.; Techato, K.; Taweekun, J.; Rahman, M.M.; Rasul, M.G.; Mahlia, T.M.I.; Ashrafur, S.M. An Overview of Recent
Developments in Biomass Pyrolysis Technologies. Energies 2018, 11, 3115. [CrossRef]41. Ward, J.; Rasul, M.G.; Bhuiya, M.M.K. Energy Recovery from Biomass by Fast Pyrolysis. Procedia Eng. 2014, 90, 669–674.
[CrossRef]42. Tudu, K.; Murugan, S.; Patel, S.K. Effect of diethyl ether in a DI diesel engine run on a tyre derived fuel-diesel blend. J. Energy
Inst. 2016, 89, 525–535. [CrossRef]43. Vihar, R.; Seljak, T.; Rodman Oprešnik, S.; Katrašnik, T. Combustion characteristics of tire pyrolysis oil in turbo charged
compression ignition engine. Fuel 2015, 150, 226–235. [CrossRef]44. Sharma, A.; Murugan, S. Potential for using a tyre pyrolysis oil-biodiesel blend in a diesel engine at different compression ratios.
Energy Convers. Manag. 2015, 93, 289–297. [CrossRef]45. Zebala, J.; Ciepka, P.; Reza, A.; Janczur, R. Influence of rubber compound and tread pattern of retreaded tyres on vehicle active
safety. Forensic Sci. Int. 2007, 167, 173–180. [CrossRef]46. Song, Z.; Yang, Y.; Zhao, X.; Sun, J.; Wang, W.; Mao, Y.; Ma, C. Microwave pyrolysis of tire powders: Evolution of yields and
composition of products. J. Anal. Appl. Pyrolysis 2017, 123, 152–159. [CrossRef]47. Ferrer, G. The economics of tire remanufacturing. Resour. Conserv. Recycl. 1997, 19, 221–255. [CrossRef]48. Gieré, R.; Smith, K.; Blackford, M. Chemical composition of fuels and emissions from a coal+tire combustion experiment in a
power station. Fuel 2006, 85, 2278–2285. [CrossRef]49. Pipilikaki, P.; Katsioti, M.; Papageorgiou, D.; Fragoulis, D.; Chaniotakis, E. Use of tire derived fuel in clinker burning. Cem. Concr.
Compos. 2005, 27, 843–847. [CrossRef]50. Collins, K.J.; Jensen, A.C.; Mallinson, J.J.; Roenelle, V.; Smith, I.P. Environmental impact assessment of a scrap tyre artificial reef.
ICES J. Mar. Sci. 2002, 59, S243–S249. [CrossRef]51. Zhang, L.; Xu, C.; Champagne, P. Overview of recent advances in thermo-chemical conversion of biomass. Energy Convers. Manag.
2010, 51, 969–982. [CrossRef]52. Bridgewater, A.V. Thermal Conversion of Biomass and Waste; Bio-Energy Research Group Aston University: Birmingham, UK, 2001.53. Bridgewater, A.V.; Peacocke, G.V.C. Fast pyrolysis processes for biomass. Renew. Sustain. Energy Rev. 2000, 4, 1–73. [CrossRef]54. Srirangan, K.; Akawi, L.; Moo-Young, M.; Chou, C.P. Towards sustainable production of clean energy carriers from biomass
resources. Appl. Energ. 2012, 100, 172–186. [CrossRef]55. Dogan, O.; Çelik, M.B.; Özdalyan, B. The effect of tire derived fuel/diesel fuel blends utilization on diesel engine performance
and emissions. Fuel 2012, 95, 340–346. [CrossRef]56. White, J.E.; Catall, W.J.; Legendre, B.L. Biomass pyrolysis kinetics: A comparative critical review with relevant agricultural
residue case studies. J. Anal. Appl. Pyrol. 2011, 91, 1–33. [CrossRef]57. Panwar, N.L.; Kothari, R.; Tyagi, V.V. Thermo chemical conversion of biomass—Eco friendly energy routes. Renew. Sustain. Energy
Rev. 2012, 16, 1801–1816. [CrossRef]58. Balat, M.; Balat, M.; Kırtay, E.; Balat, H. Main routes for the thermo-conversion of biomass into fuels and chemicals. Part 1:
Pyrolysis systems. Energy Convers. Manag. 2009, 50, 3147–3157. [CrossRef]59. Goyal, H.B.; Seal, D.; Saxena, R.C. Bio-fuels from thermochemical conversion of renewable resources: A review. Renew. Sustain.
Energy Rev. 2008, 12, 504–517. [CrossRef]60. Capareda, S.C. Biomass Energy Conversion. Texas A&M University, USA. Available online: https://www.intechopen.com/
(accessed on 22 November 2013).61. Ceylan, R.; Bredenberg, J.B.s. Hydrogenolysis and hydrocracking of the carbon-oxygen bond. 2. Thermal cleavage of the
carbon-oxygen bond in guaiacol. Fuel 1982, 61, 377–382. [CrossRef]
68

Energies 2021, 14, 3837
62. Mohan, D.; Pittman, C.U.; Steele, P.H. Pyrolysis of Wood/Biomass for Bio-oil: A Critical Review. Energy Fuels 2006, 20, 848–889.[CrossRef]
63. Zhang, Q.; Chang, J.; Wang, T.; Xu, Y. Review of biomass pyrolysis oil properties and upgrading research. Energy Convers. Manag.2007, 48, 87–92. [CrossRef]
64. Sharma, A.; Pareek, V.; Zhang, D. Biomass pyrolysis—A review of modelling, process parameters and catalytic studies. Renew.Sustain. Energy Rev. 2015, 50, 1081–1096. [CrossRef]
65. Kumaravel, S.T.; Murugesan, A.; Kumaravel, A. Tyre pyrolysis oil as an alternative fuel for diesel engines—A review. Renew.Sustain. Energy Rev. 2016, 60, 1678–1685. [CrossRef]
66. Miranda, M.; Pinto, F.; Gulyurtlu, I.; Cabrita, I. Pyrolysis of rubber tyre wastes: A kinetic study. Fuel 2013, 103, 542–552. [CrossRef]67. Kar, Y. Catalytic pyrolysis of car tire waste using expanded perlite. Waste Manag. 2011, 31, 1772–1782. [CrossRef]68. Islam, M.R.; Joardder, M.U.H.; Kader, M.; Sarker, M. Valorization of solid tire wastes available in Bangladesh by thermal treatment.
In Proceedings of the WasteSafe 2011—2nd International Conference on Solid Waste Management in the Developing Countries,Khulna, Bangladesh, 13–15 February 2011.
69. Williams, P.T.; Brindle, A.J. Catalytic pyrolysis of tyres: Influence of catalyst temperature. Fuel 2002, 81, 2425–2434. [CrossRef]70. Aylón, E.; Fernández-Colino, A.; Murillo, R.; Navarro, M.; García, T.; Mastral, A. Valorisation of waste tyre by pyrolysis in a
moving bed reactor. Waste Manag. 2010, 30, 1220–1224. [CrossRef] [PubMed]71. Zhang, Y.; Williams, P.T. Carbon nanotubes and hydrogen production from the pyrolysis catalysis or catalytic-steam reforming of
waste tyres. J. Anal. Appl. Pyrolysis 2016, 122, 490–501. [CrossRef]72. Luo, S.; Feng, Y. The production of fuel oil and combustible gas by catalytic pyrolysis of waste tire using waste heat of blast-furnace
slag. Energy Convers. Manag. 2017, 136, 27–35. [CrossRef]73. Galvagno, S.; Casu, S.; Casabianca, T.; Calabrese, A.; Cornacchia, G. Pyrolysis process for the treatment of scrap tyres: Preliminary
experimental results. Waste Manag. 2002, 22, 917–923. [CrossRef]74. Roy, C.; Chaala, A.; Darmstadt, H. The vacuum pyrolysis of used tires: End-uses for oil and carbon black products. J. Anal. Appl.
Pyrolysis 1999, 51, 201–221. [CrossRef]75. Sangeeta, C.; Jain, A.K. A review of fixed bed gasification systems for biomass. Agric. Eng. Int. 2007, 9, 5.76. Altafini, C.R.; Wander, P.R.; Barreto, R.M. Prediction of the working parameters of a wood waste gasifier through an equilibrium
model. Energy Convers. Manag. 2003, 44, 2763–2777. [CrossRef]77. Leung, D.Y.C.; Yin, X.L.; Wu, C.Z. A review on the development and commercialization of biomass gasification technologies in
China. Renew. Sustain. Energy Rev. 2004, 8, 565–580. [CrossRef]78. Hu, C.; Xiao, R.; Zhang, H. Ex-situ catalytic fast pyrolysis of biomass over HZSM-5 in a two-stage fluidized-bed/fixed-bed
combination reactor. Bioresour. Technol. 2017, 243, 1133–1140. [CrossRef] [PubMed]79. Wang, J.; Zhong, Z.; Ding, K.; Li, M.; Hao, N.; Meng, X.; Ruan, R.; Ragauskas, A.J. Catalytic fast co-pyrolysis of bamboo sawdust
and waste tire using a tandem reactor with cascade bubbling fluidized bed and fixed bed system. Energy Convers. Manag. 2019,180, 60–71. [CrossRef]
80. Yang, M.; Shao, J.; Yang, H.; Zeng, K.; Wu, Z.; Chen, Y.; Bai, X.; Chen, H. Enhancing the production of light olefins and aromaticsfrom catalytic fast pyrolysis of cellulose in a dual-catalyst fixed bed reactor. Bioresour. Technol. 2019, 273, 77–85. [CrossRef][PubMed]
81. Lewandowski, W.M.; Januszewicz, K.; Kosakowski, W. Efficiency and proportions of waste tyre pyrolysis products depending onthe reactor type—A review. J. Anal. Appl. Pyrolysis 2019, 140, 25–53. [CrossRef]
82. Edwin Raj, R.; Robert Kennedy, Z.; Pillai, B.C. Optimization of process parameters in flash pyrolysis of waste tyres to liquid andgaseous fuel in a fluidized bed reactor. Energy Convers. Manag. 2013, 67, 145–151. [CrossRef]
83. Rodríguez, E.; Gutiérrez, A.; Palos, R.; Azkoiti, M.J.; Arandes, J.M.; Bilbao, J. Cracking of Scrap Tires Pyrolysis Oil in a FluidizedBed Reactor under Catalytic Cracking Unit Conditions. Effects of Operating Conditions. Energy Fuels 2019, 33, 3133–3143.[CrossRef]
84. Kaminsky, W. 8—Fluidized bed pyrolysis of waste polymer composites for oil and gas recovery. In Management, Recycling andReuse of Waste Composites; Goodship, V., Ed.; Woodhead Publishing: Sawston, UK, 2010; pp. 192–213. [CrossRef]
85. Hasan, M.M.; Rasul, M.G.; Khan, M.M.K.; Ashwath, N.; Jahirul, M.I. Energy recovery from municipal solid waste using pyrolysistechnology: A review on current status and developments. Renew. Sustain. Energy Rev. 2021, 145, 111073. [CrossRef]
86. Heo, H.S.; Park, H.J.; Park, Y.-K.; Ryu, C.; Suh, D.J.; Suh, Y.-W.; Yim, J.-H.; Kim, S.-S. Bio-oil production from fast pyrolysis ofwaste furniture sawdust in a fluidized bed. Bioresour. Technol. 2010, 101, S91–S96. [CrossRef]
87. Li, S.Q.; Yao, Q.; Chi, Y.; Yan, J.H.; Cen, K.F. Pilot-scale pyrolysis of scrap tires in a continuous rotary kiln reactor. Ind. Eng. Chem.Res. 2004, 43, 5133–5145. [CrossRef]
88. Fantozzi, F.; Colantoni, S.; Bartocci, P.; Desideri, U. Rotary Kiln Slow Pyrolysis for Syngas and Char Production From Biomassand Waste—Part I: Working Envelope of the Reactor. J. Eng. Gas. Turbines Power 2007, 129, 901–907. [CrossRef]
89. Bortolamasi, M.F.J. Design and sizing of screw feeders. Proceedings of International Congress for Particle Technology (PARTEC),Nuremberg, Germany, 27–29 March 2001.
90. Badger, P.C.; Fransham, P. Use of mobile fast pyrolysis plants to densify biomass and reduce biomass handling costs—Apreliminary assessment. Biomass. Bioenergy 2006, 30, 321–325. [CrossRef]
69

Energies 2021, 14, 3837
91. Qureshi, M.S.; Oasmaa, A.; Pihkola, H.; Deviatkin, I.; Tenhunen, A.; Mannila, J.; Minkkinen, H.; Pohjakallio, M.; Laine-Ylijoki, J.Pyrolysis of plastic waste: Opportunities and challenges. J. Anal. Appl. Pyrolysis 2020, 152, 104804. [CrossRef]
92. Kaminsky, W.; Mennerich, C.; Zhang, Z. Feedstock recycling of synthetic and natural rubber by pyrolysis in a fluidized bed. J.Anal. Appl. Pyrolysis 2009, 85, 334–337. [CrossRef]
93. Pantea, D.; Darmstadt, H.; Kaliaguine, S.; Roy, C. Heat-treatment of carbon blacks obtained by pyrolysis of used tires. Effect onthe surface chemistry, porosity and electrical conductivity. J. Anal. Appl. Pyrolysis 2003, 67, 55–76. [CrossRef]
94. Islam, M.A.; Rahman, M.M.; Heimann, K.; Nabi, M.N.; Ristovski, Z.D.; Dowell, A.; Thomas, G.; Feng, B.; von Alvensleben,N.; Brown, R.J. Combustion analysis of microalgae methyl ester in a common rail direct injection diesel engine. Fuel 2015, 143,351–360. [CrossRef]
95. Murugan, S.; Ramaswamy, M.C.; Nagarajan, G. The use of tyre pyrolysis oil in diesel engines. Waste Manag. 2008, 28, 2743–2749.[CrossRef]
96. Hariharan, S.; Murugan, S.; Nagarajan, G. Effect of diethyl ether on Tyre pyrolysis oil fueled diesel engine. Fuel 2013, 104, 109–115.[CrossRef]
97. Jahirul, M.I.; Brown, J.R.; Senadeera, W.; Ashwath, N.; Laing, C.; Leski-Taylor, J.; Rasul, M.G. Optimisation of Bio-Oil ExtractionProcess from Beauty Leaf (Calophyllum Inophyllum) Oil Seed as a Second Generation Biodiesel Source. Procedia Eng. 2013, 56,619–624. [CrossRef]
98. Conesa, J.A.; Martín-Gullón, I.; Font, R.; Jauhiainen, J. Complete Study of the Pyrolysis and Gasification of Scrap Tires in a PilotPlant Reactor. Environ. Sci. Technol. 2004, 38, 3189–3194. [CrossRef]
99. Olazar, M.; Aguado, R.; Arabiourrutia, M.; Lopez, G.; Barona, A.; Bilbao, J. Catalyst effect on the composition of tire pyrolysisproducts. Energy Fuels 2008, 22, 2909–2916. [CrossRef]
100. Zhang, X.; Wang, T.; Ma, L.; Chang, J. Vacuum pyrolysis of waste tires with basic additives. Waste Manag. 2008, 28, 2301–2310.[CrossRef]
101. Teng, H.; Serio, M.A.; Wojtowicz, M.A.; Bassilakis, R.; Solomon, P.R. Reprocessing of used tires into activated carbon and otherproducts. Ind. Eng. Chem. Res. 1995, 34, 3102–3111. [CrossRef]
102. Aylón, E.; Murillo, R.; Fernández-Colino, A.; Aranda, A.; García, T.; Callén, M.S.; Mastral, A.M. Emissions from the combustion ofgas-phase products at tyre pyrolysis. J. Anal. Appl. Pyrolysis 2007, 79, 210–214. [CrossRef]
103. Leung, D.Y.C.; Yin, X.L.; Zhao, Z.L.; Xu, B.Y.; Chen, Y. Pyrolysis of tire powder: Influence of operation variables on the compositionand yields of gaseous product. Fuel Process. Technol. 2002, 79, 141–155. [CrossRef]
104. Quek, A.; Balasubramanian, R. Liquefaction of waste tires by pyrolysis for oil and chemicals—A review. J. Anal. Appl. Pyrolysis2013, 101, 1–16. [CrossRef]
105. Žvar Baškovic, U.; Vihar, R.; Seljak, T.; Katrašnik, T. Feasibility analysis of 100% tire pyrolysis oil in a common rail Diesel engine.Energy 2017, 137, 980–990. [CrossRef]
106. Hossain, F.M.; Nabi, M.N.; Rainey, T.J.; Bodisco, T.; Bayley, T.; Randall, D.; Ristovski, Z.; Brown, R.J. Novel biofuels derived fromwaste tyres and their effects on reducing oxides of nitrogen and particulate matter emissions. J. Clean. Prod. 2020, 242, 118463.[CrossRef]
107. Vihar, R.; Žvar Baškovic, U.; Seljak, T.; Katrašnik, T. Combustion and emission formation phenomena of tire pyrolysis oil in acommon rail Diesel engine. Energy Convers. Manag. 2017, 149, 706–721. [CrossRef]
108. Pote, R.N.; Patil, R.K. Combustion and emission characteristics analysis of waste tyre pyrolysis oil. SN Appl. Sci. 2019, 1, 294.[CrossRef]
109. Koc, A.B.; Abdullah, M. Performance of a 4-cylinder diesel engine running on tire oil–biodiesel–diesel blend. Fuel Process. Technol.2014, 118, 264–269. [CrossRef]
110. Frigo, S.; Seggiani, M.; Puccini, M.; Vitolo, S. Liquid fuel production from waste tyre pyrolysis and its utilisation in a Dieselengine. Fuel 2014, 116, 399–408. [CrossRef]
70

energies
Article
Catalyst Characteristics and Performance ofSilica-Supported Zinc for Hydrodeoxygenationof Phenol
Hamed Pourzolfaghar 1, Faisal Abnisa 2, Wan Mohd Ashri Wan Daud 1,*,
Mohamed Kheireddine Aroua 3,4 and Teuku Meurah Indra Mahlia 5,*
1 Department of Chemical Engineering, Faculty of Engineering, University of Malaya,Kuala Lumpur 50603, Malaysia; [email protected]
2 Department of Chemical and Materials Engineering, Faculty of Engineering, King Abdulaziz University,Jeddah 21589, Saudi Arabia; [email protected]
3 Centre for Carbon Dioxide Capture and Utilization (CCDCU), School of Science and Technology,Sunway University, Bandar Sunway, Petaling Jaya 47500, Malaysia; [email protected]
4 Department of Engineering, Lancaster University, Lancaster LA1 4YW, UK5 School of Information, Systems and Modelling, Faculty of Engineering and Information Technology,
University of Technology Sydney, Sydney, NSW 2007, Australia* Correspondence: [email protected] (W.M.A.W.D.); [email protected] (T.M.I.M.)
Received: 25 April 2020; Accepted: 23 May 2020; Published: 1 June 2020
Abstract: The present investigation aimed to study the physicochemical characteristics of supportedcatalysts comprising various percentages of zinc dispersed over SiO2. The physiochemicalproperties of these catalysts were surveyed by N2 physisorption (BET), thermogravimetry analysis(TGA), H2 temperature-programmed reduction, field-emission scanning electron microscopy(FESEM), inductively coupled plasma-optical emission spectrometry (ICP-OES), and NH3
temperature-programmed desorption (NH3-TPD). In addition, to examine the activity andperformance of the catalysts for the hydrodeoxygenation (HDO) of the bio-oil oxygenated compounds,the experimental reaction runs, as well as stability and durability tests, were performed using3% Zn/SiO2 as the catalyst. Characterization of silica-supported zinc catalysts revealed an evendispersion of the active site over the support in the various dopings of the zinc. The acidity of thecalcinated catalysts elevated clearly up to 0.481 mmol/g. Moreover, characteristic outcomes indicatethat elevating the doping of zinc metal led to interaction and substitution of proton sites on the SiO2
surface that finally resulted in an increase in the desorption temperature peak. The experiments wereperformed at temperature 500 ◦C, pressure 1 atm; weight hourly space velocity (WHSV) 0.32 (h−1);feed flow rate 0.5 (mL/min); and hydrogen flow rate 150 (mL/min). Based on the results, it wasrevealed that among all the prepared catalysts, that with 3% of zinc had the highest conversionefficiency up to 80%. However, the selectivity of the major products, analyzed by gas chromatographyflame-ionization detection (GC-FID), was not influenced by the variation in the active site doping.
Keywords: heterogeneous catalyst; hydrodeoxygenation (HDO); zinc; phenol; bio-oil
1. Introduction
Due to global warming, many countries have moved from fossil fuel-based energy towardrenewable energy. There are several forms of renewable energy that have been effectively executed outthere. Many countries have successfully implemented renewable energy generated from solar [1,2].Where some others have successfully utilized hydro, wave, geothermal, and wind as a secondaryenergy source [1,3], Malaysia and Indonesia have successfully utilized biofuel as one of the alternativeenergy sources [4–6]. Biofuel has been proven to reduce greenhouse gas emissions significantly
Energies 2020, 13, 2802; doi:10.3390/en13112802 www.mdpi.com/journal/energies71

Energies 2020, 13, 2802
in these countries [7]. Therefore, among all alternative sources of energy to replace the restrictednatural fossil fuel reservoirs, biofuel represents the sole available sustainable energy source that couldproperly replace petroleum [8,9]. Nevertheless, due to its component’s complexity, which resultsin its instability, corrosiveness, and low heating value, the pyrolyzed biomass, known as bio-oil,must be upgraded before utilization [10–12]. Hydrodeoxygenation is a catalytic reaction that applieshydrogen to eliminate oxygen from the oxygenated compounds. These reactions are an efficientalternative method to attain bio-oils from biomass-derived oxygenated compounds [13]. Nevertheless,several issues must first be addressed before the hydrodeoxygenation (HDO) process can be entirelycommercialized. The development of efficient, robust, cost-effective, and selective catalysts enable theadvancement of this method to partly prevail these disadvantages [14].
Various kinds of active sites have been tested in the last decade for the HDO of the oxygenatedcompounds, which have had promising results including transition metal oxides such as MoO3 [15,16],Mo2C [17], Pt/(Al2O3, SiO2, H-Beta zeolie, activated carbon) [18–20], Fe/(SiO2, activated carbon) [21,22],Ni/(Al2O3, SiO2, HZSM-5 zeolite) [23], and Ga/(HBETA, SiO2, ZSM-5) [24]; precious metals such asRu/TiO2 [25], and W/carbon [26]; phosphides such as Ni2P/SiO2, Fe2P/SiO2, MoP/SiO2, Co2P/SiO2,and WP/SiO2 [27]; and bifunctional such as NiMo/Al2O3 [28] and Pd-FeOX/SiO2 [29].
Zinc has been reported as an active site for the hydroprocessing of bio-oil oxygenated compounds,resulting in aromatic compounds and/or hydrocarbons [30–38]. The interdependent effect of nickeland zinc metals on Al2O3 support has been investigated by Cheng et al. [39]. They found that the pinesawdust bio-oil could efficiently be converted by 15%Ni.5%Zn/Al2O3 at 44.64 wt%. According to theirreport, the highest hydrocarbon content of 50.12% could be achieved by applying this bifunctionalcatalyst. Bifunctional catalysts possess two types of active sites and catalyze two dissimilar types ofreactions. In another study by Parsell et al. [40], Zn/Pd was used for the HDO of lignin. Based on theauthor’s claims, 80%–90% of conversion yield could be achieved using Pd/Zn as the HDO catalyst.Besides, they reported that the bifunctional Pd/Zn/C catalyst was more effective in the HDO oflignin molecules (β-O-4) and aromatic compounds, in comparison to the Pd/C sample. Additionally,they expressed that the bifunctional Pd/Zn/C sample is recyclable and robust, and no further additionof the zinc metal is required after each reaction cycle. The efficiency upsurge of the Kapuk seedoil hydrocracking process using the zinc metal has been reported recently by Mirzayanti et al. [41].They stated that using Zn-Mo/HZSM-5 with a loading of 2.99 wt% for Zn and 7.55 wt% for Mo,the highest performance of the catalyst for the hydrocracking process could be reached.
Due to the complexity of the bio-oils causing complicated reactions during the HDO process,model compounds such as phenol, lignin, and others have been applied. Using the model compounds,one can attain enough data regarding the mechanism and reaction networks of the process. Phenoland its derivatives are known as the most refractory compound in the bio-oil and, hence, it has beenselected as the model compound in this investigation [42].
The current research aims to study the physicochemical characteristics of the Zn/SiO2 catalystas a potential and promising catalyst for the HDO of bio-oil oxygenated compounds using variousanalytical equipment. Furthermore, using the phenol as a model compound for the oxygenated bio-oilcompound, the reactivity, performance, stability, and reusability of the selected catalyst have beenexamined in a continuous fixed-bed reactor.
2. Materials and Methods
2.1. Materials
Zinc powder (used to synthesize Zn/SiO2), anhydrous benzene (99.8%), phenol (≥89%), HPLCgrade cyclohexane (99.9%), acetone (HPLC grade), and analytical tetrahydrobenzene or cyclohexene(99%) were purchased from Sigma Aldrich (St. Louis, MO, USA). Synthesis grade n-decane (≥95%)and SiO2 (Pure silica) have been purchased from Aldrich and R & M chemicals, respectively.
72

Energies 2020, 13, 2802
2.2. Catalyst Synthesis
The incipient wetness impregnation method was used in this investigation to prepare the catalystsamples with various doping percentages of the zinc metal onto the silica surface. Silica-supported3% zinc was prepared using 10 g of silica (catalyst support) and 0.31 g of the powdered Zn metal andsome water. The compounds were mixed in a stirrer, roughly 2 h. Afterward, it was dried overnight inan electric oven at 105 ◦C. The dried sample was then taken to a furnace for the calcination step for 5 hunder 500 ◦C and air atmosphere. Other impregnated samples were prepared with the same procedure.
2.3. Characterization of the Catalysts
The prepared calcinated catalysts and the bare support were analyzed by XRD (PANalyticalX’Pert with Cu-Kα radiation). Scherrer’s formula was applied to estimate the crystallite size ofsilica-supported zinc catalysts. In Equation (1), λ represents the X-ray wavelength, dxrd denotes themean size of the crystallite, βhkl stands for the full-width at half-maximum (FWHM), k is the shape factor,and θ denotes the Bragg angle. Data were collected at ambient conditions at a scanning range from 5◦to 80◦ with a step size of 0.0260◦. The slit and the time step were set to 0.1 mm and 0.1 s, respectively.
dxrd =kλ
βhklcosθ(1)
N2-adsorption analysis was performed using a Micromeritics TrisStar II 3020 V1.04 to detect theBET surface area, pore size, and pore volume of the calcinated catalysts in this study. The measurementtemperature was set at −196 ◦C and the degassing of the catalysts were performed for one hour at90 ◦C and, subsequently, 4 h at 200 ◦C, prior to the test and under vacuum atmosphere.
Thermogravimetric (TGA) analysis was employed for the bare SiO2 and freshly calcinatedcatalysts to examine the extent of water and organic compounds on the samples. A TGA Q500 V20.10(TA instruments) instrument was applied in this survey. In a typical run, 80 mg of a sample was placedin the sample holder and was heated with a heating rate of 20 ◦C/min up to 800 ◦C.
H2 temperature-programmed reduction (H2-TPR) was conducted by a Micromeritics Chemisorb2720 apparatus. Prior to hydrogen adsorption, using the pure nitrogen at 500 ◦C, the samples wereoutgassed for 30 min. Subsequently, the catalysts were reduced, using 5% hydrogen diluted in argongas, for one hour and 500 ◦C. In the following, the catalysts were cooled and, to remove the physicallyadsorbed molecules, flushed with N2 gas at a flow rate of 20 mL/min. Finally, the catalysts wereheated up to 900 ◦C in the nitrogen atmosphere. A thermal conductivity detector (TCD) monitoredand recorded the H2 consumption during the reduction process.
A QUANTA 450 FEG instrument was applied for the FESEM analysis. The morphology of twocalcinated catalysts (1% Zn/SiO2 and 3% Zn/SiO2) and the bare silica was examined.
Inductively coupled plasma optical emission spectrometry (ICP–OES) was applied to determinethe metal content of the prepared catalysts. In this analysis, 100 mg of each catalyst was digested withHNO3 (10 mL). Zinc metal solutions for the calibration standard preparation were made using a certainquantity of Zn metal to 7 mL of nitric acid and 14 mL of distilled water, for each standard sample.
The total acidity of the prepared catalysts was tested using the NH3-TPD method. Prior tooutgassing the catalyst (50 mg) in the quartz U-tube, it was heated from room temperature up to300 ◦C. Then, under a flow rate of 20 mL/min of helium, the sample was degassed for 30 min at300 ◦C. Subsequently, the catalyst was cooled down to room temperature and was then ready for theammonia chemisorption step. A 5% NH3/He gas mixture was selected for this step and the ammoniachemisorbed on the sample for 30 min. To remove the physisorbed molecules, the sample was purgedusing the helium gas at 100 ◦C (30 min). Finally, applying the heating rate of 40 ◦C/min, the samplewas heated up to 900 ◦C in the helium atmosphere (20 mL/min). For this analysis, a Micromeriticsapparatus was used (Model: Chemisorb 2720).
73
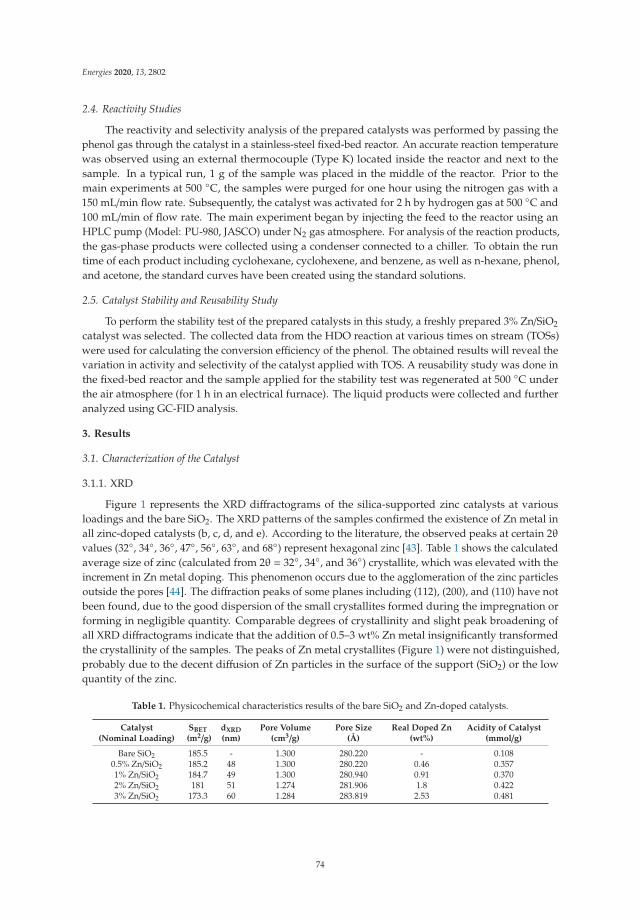
Energies 2020, 13, 2802
2.4. Reactivity Studies
The reactivity and selectivity analysis of the prepared catalysts was performed by passing thephenol gas through the catalyst in a stainless-steel fixed-bed reactor. An accurate reaction temperaturewas observed using an external thermocouple (Type K) located inside the reactor and next to thesample. In a typical run, 1 g of the sample was placed in the middle of the reactor. Prior to themain experiments at 500 ◦C, the samples were purged for one hour using the nitrogen gas with a150 mL/min flow rate. Subsequently, the catalyst was activated for 2 h by hydrogen gas at 500 ◦C and100 mL/min of flow rate. The main experiment began by injecting the feed to the reactor using anHPLC pump (Model: PU-980, JASCO) under N2 gas atmosphere. For analysis of the reaction products,the gas-phase products were collected using a condenser connected to a chiller. To obtain the runtime of each product including cyclohexane, cyclohexene, and benzene, as well as n-hexane, phenol,and acetone, the standard curves have been created using the standard solutions.
2.5. Catalyst Stability and Reusability Study
To perform the stability test of the prepared catalysts in this study, a freshly prepared 3% Zn/SiO2
catalyst was selected. The collected data from the HDO reaction at various times on stream (TOSs)were used for calculating the conversion efficiency of the phenol. The obtained results will reveal thevariation in activity and selectivity of the catalyst applied with TOS. A reusability study was done inthe fixed-bed reactor and the sample applied for the stability test was regenerated at 500 ◦C underthe air atmosphere (for 1 h in an electrical furnace). The liquid products were collected and furtheranalyzed using GC-FID analysis.
3. Results
3.1. Characterization of the Catalyst
3.1.1. XRD
Figure 1 represents the XRD diffractograms of the silica-supported zinc catalysts at variousloadings and the bare SiO2. The XRD patterns of the samples confirmed the existence of Zn metal inall zinc-doped catalysts (b, c, d, and e). According to the literature, the observed peaks at certain 2θvalues (32◦, 34◦, 36◦, 47◦, 56◦, 63◦, and 68◦) represent hexagonal zinc [43]. Table 1 shows the calculatedaverage size of zinc (calculated from 2θ = 32◦, 34◦, and 36◦) crystallite, which was elevated with theincrement in Zn metal doping. This phenomenon occurs due to the agglomeration of the zinc particlesoutside the pores [44]. The diffraction peaks of some planes including (112), (200), and (110) have notbeen found, due to the good dispersion of the small crystallites formed during the impregnation orforming in negligible quantity. Comparable degrees of crystallinity and slight peak broadening ofall XRD diffractograms indicate that the addition of 0.5–3 wt% Zn metal insignificantly transformedthe crystallinity of the samples. The peaks of Zn metal crystallites (Figure 1) were not distinguished,probably due to the decent diffusion of Zn particles in the surface of the support (SiO2) or the lowquantity of the zinc.
Table 1. Physicochemical characteristics results of the bare SiO2 and Zn-doped catalysts.
Catalyst(Nominal Loading)
SBET
(m2/g)dXRD
(nm)Pore Volume
(cm3/g)Pore Size
(Å)Real Doped Zn
(wt%)Acidity of Catalyst
(mmol/g)
Bare SiO2 185.5 - 1.300 280.220 - 0.1080.5% Zn/SiO2 185.2 48 1.300 280.220 0.46 0.3571% Zn/SiO2 184.7 49 1.300 280.940 0.91 0.3702% Zn/SiO2 181 51 1.274 281.906 1.8 0.4223% Zn/SiO2 173.3 60 1.284 283.819 2.53 0.481
74

Energies 2020, 13, 2802
Figure 1. XRD patterns of bare SiO2 and doped catalysts applied in this study [bare SiO2 (a),0.5% Zn/SiO2 (b), 1% Zn/SiO2 (c), 2% Zn/SiO2 (d), and 3% Zn/SiO2 (e)].
3.1.2. BET
The surface area, pore size, and pore volume of the bare silica and the freshly calcinated samplevalues have been detailed in Table 1. The analysis results specified that the BET surface area of thecalcinated impregnated samples was slightly lower than the bare SiO2. Nie [45] has also reported thesame range of surface area for the silica. The surface area and pore volume of the impregnated samples,as expected and documented previously in the literature, decreased by increasing the zinc load on thesupport surface [46,47]. In a study by Clerk et al., they declared that various loadings of molybdenumand the surface result in a decrease in the BET surface area [48]. Whilst the loading of the active siteresulted in an increase in the BET surface area and pore volume of the samples, it caused decreases inthe pore sizes of the samples. This expected trend is due to the selective closing of the small poreswith the loading of the zinc metal of the surface of the SiO2 [49]. According to the results, all samplesoffered type IV isotherms, which indicate a mesoporous texture with capillary condensation.
3.1.3. Thermogravimetric Analysis (TGA)
Thermogravimetry analysis was performed to detect the content of the water and organiccompounds of all calcinated samples, and their weight loss was recorded as a function of temperature.TGA results of the samples are presented in Figure 2. In all cases, the weight loss occurred up to 100 ◦C,which is mainly due to the humidity. As it can be observed from Figure 2, calcinated bare SiO2 hasaround a 2% weight loss whilst the calcinated metalized samples have a minor one (less than 1%).This specifies that by loading the support by zinc metal, less humidity can be absorbed, thus havinglower weight loss during the HDO experiments. No high-temperature weight loss was monitored inTGA analysis, which indicates that the samples had no organic carbon impurites.
96
97
98
99
100
0 100 200 300 400 500 600 700 800
Wei
ght (
%)
Temperature ( ˚C)
Bare SiO₂ 0.5% Zn/SiO₂ 1% Zn/SiO₂
2% Zn/SiO₂ 3% Zn/SiO₂
Figure 2. Thermogravimetric analysis for the samples as a function of temperature.
75

Energies 2020, 13, 2802
3.1.4. H2-TPR
Figure 3 represents the results for the reducibility of the bare silica and the calcinated samples,which were investigated by H2-TPR. Some preliminary tests of the SiO2 support showed that it did notconsume any hydrogen (between 300 ◦C to 700 ◦C). Accordingly, any usage of hydrogen gas in theimpregnated catalysts could be credited to the Zn metal doped on the silica support. The catalyst with0.5% Zn loading showed the lowest maximum reduction temperature (Tmax) at 448 ◦C. The Tmax of theimpregnated samples gradually raised with the elevation in Zn doping probably due to the elevationin the crystallite size of the active metal on the surface of the support. This outcome agrees with theabovementioned XRD findings. Therefore, the 3% Zn/SiO2 sample offered the uppermost maximumreduction in temperature among other catalysts (498 ◦C).
0
10
20
30
40
50
60
70
80
90
100
300 400 500 600 700
Inte
nsity
(a.u
.)
Temperature ( °C)
0.5% Zn/SiO₂ 1% Zn/SiO₂
2% Zn/SiO₂ 3% Zn/SiO₂
Figure 3. Temperature-programmed reduction profiles of the impregnated catalysts.
3.1.5. FESEM
Micrographs of the bare silica and the selected impregnated catalysts are presented in Figure 4(1% Zn/SiO2 and 3% Zn/SiO2). The image of the silica represents a big slab formed surface with clustersof silica nanoparticles. From the micrographs of the impregnated samples, it can be perceived that thebright spots, which are the zinc metal, become more densely colonized as the Zn loading was elevatedfrom 1% to 3%. However, no agglomeration of the zinc metal particles has been detected in the samplewith the highest loading of the active site (3% Zn/SiO2). Previous studies have mentioned that byoverloading the catalyst surface by an active site, some of the particles might cause agglomeration andmight, therefore, result in a reduction in the catalyst performances [44].
Figure 4. Field-emission scanning electron microscopy (FESEM) micrographs of the selected samples.
76

Energies 2020, 13, 2802
3.1.6. ICP-OES
The metal content of each catalyst was detected using ICP-OES analysis (Perkin Elmer, Optima5300DV). Table 1 indicates the analysis result for the catalysts. In all samples, as shown in the Table,the real metal contents were slightly lower than the calculated extent. The variant between thecalculated and real extent of zinc metal on the silica support was between 8%–15%. The calculatedvariant was mainly because of the impurity of the Zn as the error percentages elevated with the increasein the doped percentages of the impregnated catalysts.
3.1.7. NH3-TPD
Figure 5 represents the NH3-TPD profile of the catalysts. It can be observed that all samplesabsorb ammonia in a broad range of temperatures (100 ◦C–800 ◦C). From Figure 5 and Table 1, it canbe observed that after the 0.5%–3% zinc metal was doped on SiO2, the total acidity of the impregnatedsamples evidently raised and an elevation in the area of the ammonia desorption peak could beperceived. Furthermore, considering the desorption peak temperature of the samples, the position ofthe NH3 desorption peak temperatures increased by elevating the zinc doping to the samples. It couldbe concluded that doping the zinc metal onto the silica surface results in the interaction and exchangeof proton sites on the support surface. This might be due to the interaction and exchange of protonspots on the silica surface with the loading of zinc metal, initiating the renewal of new proton spots onthe samples. As Table 1 indicates, the total acidity of the catalysts was expressively raised from 0.108 to0.481 mmol/g within the upsurge in zinc doping from 0% to 3%. According to Kernajanakon et al. [50],loading the optimum amount of active sites on the support is crucial and ranges from 1% to 2.5%.By increasing the loading amount such as 5% and 10%, the acidity of the catalysts decreases due tothe concealing of acid spots by the produced ZnO cluster. Furthermore, the authors implied that thedispersion efficiency of the metal on the surface of the support might be influenced by the amount ofthe loaded metal.
0
20
40
60
80
100
120
140
100 200 300 400 500 600 700 800
Sign
al (m
V)
Temperature ( °C)
Bare SiO₂
0.5% Zn/SiO₂
1% Zn/SiO₂
2% Zn/SiO₂
3% Zn/SiO₂
Figure 5. NH3-TPD profile of the impregnated catalysts and the bare SiO2.
3.2. Reactivity
Products selectivity and phenol conversion over xZn/SiO2 catalysts in the hydrodeoxygenation ofphenol at various loadings of the zinc metal are shown in Figure 6. From Figure 6, it can be perceivedthat all impregnated samples are active and able to convert the phenol. Table 2 details the data attainedby GC-FID analysis. Phenol conversion efficiency using various loads of Zn metal, 0.5–3%, varied
77

Energies 2020, 13, 2802
from 15% to 80%, respectively. By elevating the zinc metal loading of the catalysts, the total conversionincreased, and the highest conversion efficiency was achieved with 3% doping of the active site. In aseparate study [42], we observed that a loading of 4% of the active metal (Zn) on the support surface(SiO2) resulted in a slight reduction in the HDO conversion efficiency. The main reason was found tobe the occupation of the support surface pores by zinc metal. However, the zinc metal loading (0.5–3%)had a slight effect (up to 13%) on the selectivity of the products including cyclohexane, cyclohexene,and phenol. The selectivity of the cyclohexane represents the highest value (71.62%) using the 2%Zn/SiO2. However, around a 3.14% decrease has been observed in its selectivity, by elevating theloading of the active site from 2% to 3%. This minor reduction in selectivity might be referred to theoccupying of the surface porosities by the zinc metal nanoparticles.
0
20
40
60
80
100
0
50
100
150
200
0 0.5 1 1.5 2 2.5 3 3.5
Conv
ersio
n (%
)
Sele
ctiv
ity o
f the
pro
duct
s (%
)
Zinc loading (%)
Cyclohexane Cyclohexene
Benzene Conversion
Figure 6. Conversion efficiency and selectivity of the products at various dopings of Zn metal.
Table 2. Results of selectivity and performance of the catalysts.
Catalyst(Nominal Loading)
Conversion ofPhenol (%)
Selectivity (%)
Benzene Cyclohexene Cyclohexane
0.5% Zn/SiO2 15 0 34.57 65.431% Zn/SiO2 59 6.62 34.40 58.982% Zn/SiO2 68 3.60 24.78 71.623% Zn/SiO2 80 6.10 25.42 68.48
Note: The experimental conditions for all samples include temperature 500 ◦C; pressure 1 atm; WHSV (h−1) 0.32;feed flow rate (mL/min) 0.5; and hydrogen flow rate (mL/min) 150.
3.3. Catalyst Stability and Reusability
The catalyst with the highest reactivity, 3% Zn/SiO2, was selected for the stability studies of phenolHDO. To identify the activity alteration of the catalyst with the time on stream, the conversion ofthe phenol was assessed using the extracted experimental data at various TOS (Figure 7). As canbe illustrated from the Figure, the catalyst was highly active up to 240 min with a minor decreasein inactivity. Following that, the activity of the catalyst steadily diminished with elevating TOS.After around 340 min of TOS, the alteration in the catalyst activity became insignificant and was around43%. Additionally, the variation in the product selectivity was likewise insignificant after 420 minof the TOS. In terms of the selectivity of the products, after a TOS of 420 min, the selectivity of thecyclohexane slightly decreased with a minor increase in the selectivity on cyclohexene. Henceforth,from the stability results, it could be concluded that the silica-supported zinc with 3% loading is highlyactive until 340 min and, after that, must be replaced or regenerated.
78
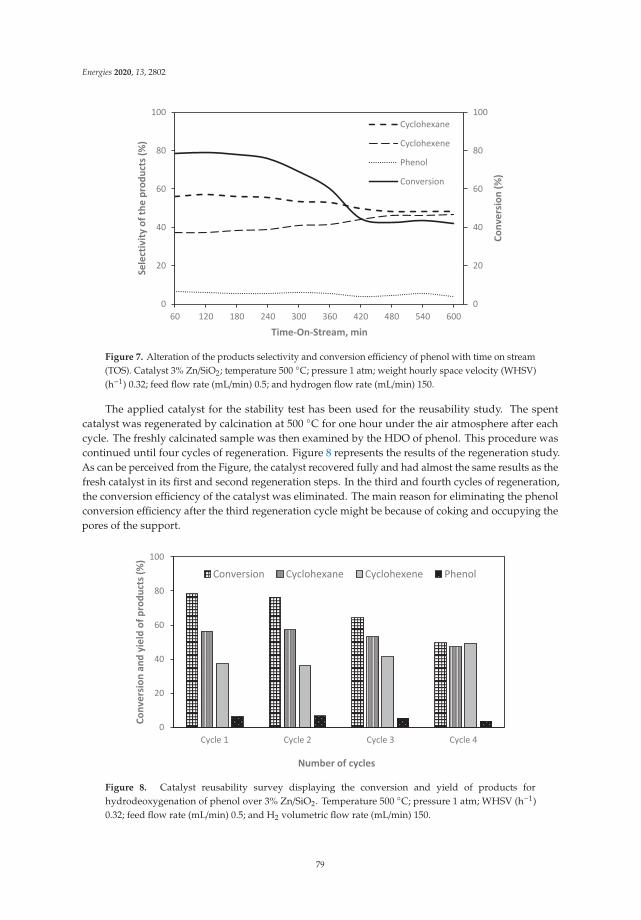
Energies 2020, 13, 2802
0
20
40
60
80
100
0
20
40
60
80
100
60 120 180 240 300 360 420 480 540 600
Conv
ersio
n (%
)
Sele
ctiv
ity o
f the
pro
duct
s (%
)
Time-On-Stream, min
Cyclohexane
Cyclohexene
Phenol
Conversion
Figure 7. Alteration of the products selectivity and conversion efficiency of phenol with time on stream(TOS). Catalyst 3% Zn/SiO2; temperature 500 ◦C; pressure 1 atm; weight hourly space velocity (WHSV)(h−1) 0.32; feed flow rate (mL/min) 0.5; and hydrogen flow rate (mL/min) 150.
The applied catalyst for the stability test has been used for the reusability study. The spentcatalyst was regenerated by calcination at 500 ◦C for one hour under the air atmosphere after eachcycle. The freshly calcinated sample was then examined by the HDO of phenol. This procedure wascontinued until four cycles of regeneration. Figure 8 represents the results of the regeneration study.As can be perceived from the Figure, the catalyst recovered fully and had almost the same results as thefresh catalyst in its first and second regeneration steps. In the third and fourth cycles of regeneration,the conversion efficiency of the catalyst was eliminated. The main reason for eliminating the phenolconversion efficiency after the third regeneration cycle might be because of coking and occupying thepores of the support.
0
20
40
60
80
100
Cycle 1 Cycle 2 Cycle 3 Cycle 4
Conv
ersio
n an
d yi
eld
of p
rodu
cts (
%)
Number of cycles
Conversion Cyclohexane Cyclohexene Phenol
Figure 8. Catalyst reusability survey displaying the conversion and yield of products forhydrodeoxygenation of phenol over 3% Zn/SiO2. Temperature 500 ◦C; pressure 1 atm; WHSV (h−1)0.32; feed flow rate (mL/min) 0.5; and H2 volumetric flow rate (mL/min) 150.
79

Energies 2020, 13, 2802
4. Discussions
A catalyst characterization study using various analytical techniques including XRD, BET, TGA,H2-TPR, NH3-TPD, and ICP-OES along with topography analysis of the samples using the FESEMmethod revealed that the zinc metal is a promising active site to be applied for hydrodeoxygenation ofoxygenated compounds such as phenol. Zinc is an abundant element in the earth’s crust, which makesit a promising candidate as a cost-effective active site. Thermogravimetry analysis revealed that thesilica-supported zinc catalysts are highly stable at high temperatures up to 800 ◦C, which is a crucialfactor for a catalyst to be applied for HDO reactions. High surface area and large porosities of thesamples, analyzed by N2-adsorption analysis, make the surface reactions possible during the HDOprocess. Significant H2 consumption of the samples in the range of 400–550 ◦C explored by H2-TPRproved that the catalysts have decent reducibility due to the zinc metal. Furthermore, as it can beperceived from Figure 3, all the samples have one broad peak, which is representative of the one-stepreduction of the active metal. Based on the literature [50], the surface acidity of a catalyst plays animportant role in the reactivity and selectivity of the HDO reactions. In other words, higher acidityresults in a higher conversion efficiency and selectivity of the products. NH3-TPD analysis proved thatthe total acidities of the samples were in the range of 0.108–0.481 mmol/g. Elevating the active sitedoping resulted in a higher value for the total acidity, and the sample with 3% of Zn represented thehighest surface acidity of 0.408 mmol/g. The topography analysis micrographs (Figure 4) of the selectedsamples showed no sign of agglomeration of the zinc metals on the silica surface. Agglomeration is animperative reason for a reduction in conversion efficiency [51].
Along with the characterization analysis, reactivity analysis revealed that the highest conversionefficiency could be achieved using the sample with 3% metal loading (80%), which was predictable.The selectivity of the HDO reaction products was analyzed using the GC-FID method and revealedthat the products of the reactions were cyclohexane, cyclohexene, and benzene. According tothe literature [52–54], hydrodeoxygenation of phenol progresses through two dissimilar reactionmechanisms. The first one is breaking the C-O bonds of phenol through direct hydrogenolysis.The final main product of this mechanism is cyclohexane. The second mechanism proceeds throughhydrogenation of the aromatic ring, which results in different products in comparison to the firstmechanism such as cyclohexanone, cyclohexanol, cyclohexene, and cyclohexane. Accordingly,regarding the selectivity of the products, the second mechanism is the main route in this survey.
5. Conclusions
In summary, the catalyst characterization study revealed that the physicochemical propertiesof zinc-supported catalysts depended on their active site content. The incorporation of zinc as anactive site over SiO2 mostly involved the filling of pores with zinc, which occupied up to 6.58% ofthe surface area. The accumulation of zinc on silica also caused an upsurge in acid site concentrationdue to the regeneration of new proton sites on the catalyst. The effect of metal loading amount on thecatalyst performance was also studied in a continuous fixed-bed reactor. It was found that 3%Zn/SiO2
represents the highest phenol conversion efficiency among other samples. However, the results indicatethat the selectivity of the products including cyclohexane, cyclohexene, and phenol remained almoststeady by varying the doping amount of the active site. The time-on-stream investigation showedthat the silica-supported zinc was highly active up to 240 min of phenol HDO, with a conversionefficiency up to 80%, and after 420 min of TOS, the activity decreased to around a conversion rate of 43%.Deposition of the impurities and coke on the surface of the catalysts is responsible for the deactivationof the catalysts. Reusability tests revealed that the catalyst displayed outstanding reusability and couldbe regenerated fully after several reusing rounds. Further investigation on catalyst design, reactionmechanism, and regeneration should facilitate the progress of bio-oil oxygenated compounds usingsilica-supported zinc catalysts.
80

Energies 2020, 13, 2802
Author Contributions: Conceptualization, H.P., W.M.A.W.D. and F.A.; Methodology, H.P. and F.A.; Software, H.P.and M.K.A.; Validation, H.P., F.A. and W.M.A.W.D.; Formal analysis, H.P. and F.A.; investigation, H.P.; resources,F.A., W.M.A.W.D., M.K.A. and T.M.I.M.; Data curation, H.P. and F.A.; Writing—original draft preparation, H.P.;Writing—review and editing, F.A. and T.M.I.M.; Visualization, H.P.; Supervision, W.M.A.W.D., M.K.A. and F.A.;Project administration, W.M.A.W.D. and F.A.; Funding acquisition, W.M.A.W.D., F.A. and T.M.I.M. All authorshave read and agreed to the published version of the manuscript.
Funding: The authors gratefully acknowledge the financial support from the University of Malaya, Malaysia,and the Deanship of Scientific Research (DSR) at King Abdulaziz University, Jeddah.
Acknowledgments: The authors gratefully acknowledge the financial support from the University of Malaya,Malaysia, and the Deanship of Scientific Research (DSR) at King Abdulaziz University, Jeddah.
Conflicts of Interest: The authors declare no conflict of interest.
References
1. Ismail, M.; Moghavvemi, M.; Mahlia, T.M.I. Characterization of PV panel and global optimization of itsmodel parameters using genetic algorithm. Energy Convers. Manag. 2013, 73, 10–25. [CrossRef]
2. Alinejad, M.; Arof, A.K. Effect of Extraction Time and Concentration of Crocus sativus on Behavior ofDye-Sensitized Solar Cells. Ionics 2017, 23, 1579–1584. [CrossRef]
3. Mason, I.; Page, S.; Williamson, A. A 100% renewable electricity generation system for New Zealand utilisinghydro, wind, geothermal and biomass resources. Energy Policy 2010, 38, 3973–3984. [CrossRef]
4. Silitonga, A.; Shamsuddin, A.; Mahlia, T.M.I.; Milano, J.; Kusumo, F.; Siswantoro, J.; Dharma, S.; Sebayang, A.;Masjuki, H.; Ong, H.C. Biodiesel synthesis from Ceiba pentandra oil by microwave irradiation-assistedtransesterification: ELM modeling and optimization. Renew. Energy 2020, 146, 1278–1291. [CrossRef]
5. Ong, H.C.; Milano, J.; Silitonga, A.S.; Hassan, M.H.; Shamsuddin, A.H.; Wang, C.-T.; Mahlia, T.M.I.;Siswantoro, J.; Kusumo, F.; Sutrisno, J. Biodiesel production from Calophyllum inophyllum-Ceiba pentandraoil mixture: Optimization and characterization. J. Clean. Prod. 2019, 219, 183–198. [CrossRef]
6. Mahlia, T.; Syazmi, Z.; Mofijur, M.; Abas, A.P.; Bilad, M.; Ong, H.C.; Silitonga, A. Patent landscape review onbiodiesel production: Technology updates. Renew. Sustain. Energy Rev. 2020, 118, 109526. [CrossRef]
7. Ong, H.C.; Hassan, M.; Mahlia, T.M.I.; Silitonga, A.S.; Chong, W.T.; Yusaf, T. Engine performance andemissions using Jatropha curcas, Ceiba pentandra and Calophyllum inophyllum biodiesel in a CI dieselengine. Energy 2014, 69, 427–445. [CrossRef]
8. Silitonga, A.S.; Masjuki, H.; Mahlia, T.M.I.; Ong, H.; Chong, W.T.; Boosroh, M. Overview properties ofbiodiesel diesel blends from edible and non-edible feedstock. Renew. Sustain. Energy Rev. 2013, 22, 346–360.[CrossRef]
9. Bhatt, A.H.; Zhang, Y.M.; Heath, G.A. Air Pollutant Emissions and Regulatory Implications of Co-Processing RawBio-Oil in US Petroleum Refineries; National Renewable Energy Lab (NREL): Golden, CO, USA, 2020.
10. Pourzolfaghar, H.; Abnisa, F.; Daud, W.M.A.W.; Aroua, M.K. Atmospheric hydrodeoxygenation of bio-oiloxygenated model compounds: A review. J. Anal. Appl. Pyrolysis 2018, 133, 117–127. [CrossRef]
11. Lee, X.J.; Ong, H.; Gan, Y.Y.; Chen, W.-H.; Mahlia, T.M.I. State of art review on conventional andadvanced pyrolysis of macroalgae and microalgae for biochar, bio-oil and bio-syngas production.Energy Convers. Manag. 2020, 210, 112707. [CrossRef]
12. Goh, B.H.H.; Ong, H.; Cheah, M.Y.; Chen, W.-H.; Yu, K.L.; Mahlia, T.M.I. Sustainability of direct biodieselsynthesis from microalgae biomass: A critical review. Renew. Sustain. Energy Rev. 2019, 107, 59–74. [CrossRef]
13. Kim, S.; Kwon, E.E.; Kim, Y.T.; Jung, S.; Kim, H.J.; Huber, G.W.; Lee, J. Recent advances in hydrodeoxygenationof biomass-derived oxygenates over heterogeneous catalysts. Green Chem. 2019, 21, 3715–3743. [CrossRef]
14. Boullosa-Eiras, S.; Lødeng, R.; Bergem, H.; Stocker, M.; Hannevold, L.; Blekkan, A. Catalytichydrodeoxygenation (HDO) of phenol over supported molybdenum carbide, nitride, phosphide andoxide catalysts. Catal. Today 2014, 223, 44–53. [CrossRef]
15. Prasomsri, T.; Nimmanwudipong, T.; Román-Leshkov, Y. Effective hydrodeoxygenation of biomass-derivedoxygenates into unsaturated hydrocarbons by MoO3 using low H2 pressures. Energy Environ. Sci. 2013,6, 1732. [CrossRef]
16. Prasomsri, T.; Shetty, M.; Murugappan, K.; Román-Leshkov, Y. Insights into the catalytic activity and surfacemodification of MoO 3 during the hydrodeoxygenation of lignin-derived model compounds into aromatichydrocarbons under low hydrogen pressures. Energy Environ. Sci. 2014, 7, 2660–2669. [CrossRef]
81
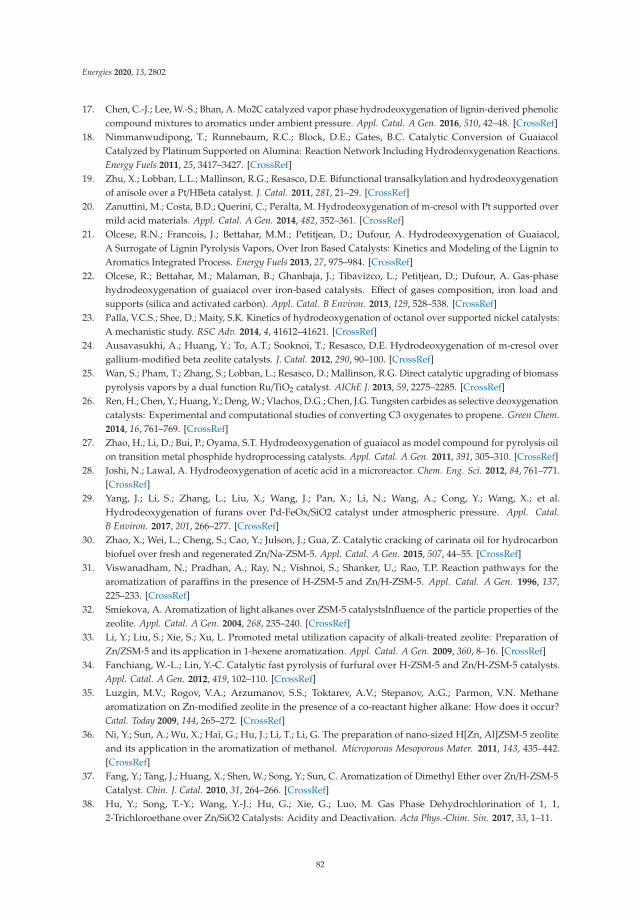
Energies 2020, 13, 2802
17. Chen, C.-J.; Lee, W.-S.; Bhan, A. Mo2C catalyzed vapor phase hydrodeoxygenation of lignin-derived phenoliccompound mixtures to aromatics under ambient pressure. Appl. Catal. A Gen. 2016, 510, 42–48. [CrossRef]
18. Nimmanwudipong, T.; Runnebaum, R.C.; Block, D.E.; Gates, B.C. Catalytic Conversion of GuaiacolCatalyzed by Platinum Supported on Alumina: Reaction Network Including Hydrodeoxygenation Reactions.Energy Fuels 2011, 25, 3417–3427. [CrossRef]
19. Zhu, X.; Lobban, L.L.; Mallinson, R.G.; Resasco, D.E. Bifunctional transalkylation and hydrodeoxygenationof anisole over a Pt/HBeta catalyst. J. Catal. 2011, 281, 21–29. [CrossRef]
20. Zanuttini, M.; Costa, B.D.; Querini, C.; Peralta, M. Hydrodeoxygenation of m-cresol with Pt supported overmild acid materials. Appl. Catal. A Gen. 2014, 482, 352–361. [CrossRef]
21. Olcese, R.N.; Francois, J.; Bettahar, M.M.; Petitjean, D.; Dufour, A. Hydrodeoxygenation of Guaiacol,A Surrogate of Lignin Pyrolysis Vapors, Over Iron Based Catalysts: Kinetics and Modeling of the Lignin toAromatics Integrated Process. Energy Fuels 2013, 27, 975–984. [CrossRef]
22. Olcese, R.; Bettahar, M.; Malaman, B.; Ghanbaja, J.; Tibavizco, L.; Petitjean, D.; Dufour, A. Gas-phasehydrodeoxygenation of guaiacol over iron-based catalysts. Effect of gases composition, iron load andsupports (silica and activated carbon). Appl. Catal. B Environ. 2013, 129, 528–538. [CrossRef]
23. Palla, V.C.S.; Shee, D.; Maity, S.K. Kinetics of hydrodeoxygenation of octanol over supported nickel catalysts:A mechanistic study. RSC Adv. 2014, 4, 41612–41621. [CrossRef]
24. Ausavasukhi, A.; Huang, Y.; To, A.T.; Sooknoi, T.; Resasco, D.E. Hydrodeoxygenation of m-cresol overgallium-modified beta zeolite catalysts. J. Catal. 2012, 290, 90–100. [CrossRef]
25. Wan, S.; Pham, T.; Zhang, S.; Lobban, L.; Resasco, D.; Mallinson, R.G. Direct catalytic upgrading of biomasspyrolysis vapors by a dual function Ru/TiO2 catalyst. AIChE J. 2013, 59, 2275–2285. [CrossRef]
26. Ren, H.; Chen, Y.; Huang, Y.; Deng, W.; Vlachos, D.G.; Chen, J.G. Tungsten carbides as selective deoxygenationcatalysts: Experimental and computational studies of converting C3 oxygenates to propene. Green Chem.2014, 16, 761–769. [CrossRef]
27. Zhao, H.; Li, D.; Bui, P.; Oyama, S.T. Hydrodeoxygenation of guaiacol as model compound for pyrolysis oilon transition metal phosphide hydroprocessing catalysts. Appl. Catal. A Gen. 2011, 391, 305–310. [CrossRef]
28. Joshi, N.; Lawal, A. Hydrodeoxygenation of acetic acid in a microreactor. Chem. Eng. Sci. 2012, 84, 761–771.[CrossRef]
29. Yang, J.; Li, S.; Zhang, L.; Liu, X.; Wang, J.; Pan, X.; Li, N.; Wang, A.; Cong, Y.; Wang, X.; et al.Hydrodeoxygenation of furans over Pd-FeOx/SiO2 catalyst under atmospheric pressure. Appl. Catal.B Environ. 2017, 201, 266–277. [CrossRef]
30. Zhao, X.; Wei, L.; Cheng, S.; Cao, Y.; Julson, J.; Gua, Z. Catalytic cracking of carinata oil for hydrocarbonbiofuel over fresh and regenerated Zn/Na-ZSM-5. Appl. Catal. A Gen. 2015, 507, 44–55. [CrossRef]
31. Viswanadham, N.; Pradhan, A.; Ray, N.; Vishnoi, S.; Shanker, U.; Rao, T.P. Reaction pathways for thearomatization of paraffins in the presence of H-ZSM-5 and Zn/H-ZSM-5. Appl. Catal. A Gen. 1996, 137,225–233. [CrossRef]
32. Smiekova, A. Aromatization of light alkanes over ZSM-5 catalystsInfluence of the particle properties of thezeolite. Appl. Catal. A Gen. 2004, 268, 235–240. [CrossRef]
33. Li, Y.; Liu, S.; Xie, S.; Xu, L. Promoted metal utilization capacity of alkali-treated zeolite: Preparation ofZn/ZSM-5 and its application in 1-hexene aromatization. Appl. Catal. A Gen. 2009, 360, 8–16. [CrossRef]
34. Fanchiang, W.-L.; Lin, Y.-C. Catalytic fast pyrolysis of furfural over H-ZSM-5 and Zn/H-ZSM-5 catalysts.Appl. Catal. A Gen. 2012, 419, 102–110. [CrossRef]
35. Luzgin, M.V.; Rogov, V.A.; Arzumanov, S.S.; Toktarev, A.V.; Stepanov, A.G.; Parmon, V.N. Methanearomatization on Zn-modified zeolite in the presence of a co-reactant higher alkane: How does it occur?Catal. Today 2009, 144, 265–272. [CrossRef]
36. Ni, Y.; Sun, A.; Wu, X.; Hai, G.; Hu, J.; Li, T.; Li, G. The preparation of nano-sized H[Zn, Al]ZSM-5 zeoliteand its application in the aromatization of methanol. Microporous Mesoporous Mater. 2011, 143, 435–442.[CrossRef]
37. Fang, Y.; Tang, J.; Huang, X.; Shen, W.; Song, Y.; Sun, C. Aromatization of Dimethyl Ether over Zn/H-ZSM-5Catalyst. Chin. J. Catal. 2010, 31, 264–266. [CrossRef]
38. Hu, Y.; Song, T.-Y.; Wang, Y.-J.; Hu, G.; Xie, G.; Luo, M. Gas Phase Dehydrochlorination of 1, 1,2-Trichloroethane over Zn/SiO2 Catalysts: Acidity and Deactivation. Acta Phys.-Chim. Sin. 2017, 33, 1–11.
82

Energies 2020, 13, 2802
39. Klein, I.; Marcum, C.; Kenttamaa, H.I.; Abu-Omar, M.M. Mechanistic investigation of the Zn/Pd/C catalyzedcleavage and hydrodeoxygenation of lignin. Green Chem. 2016, 18, 2399–2405. [CrossRef]
40. Parsell, T.H.; Jarrell, T.M.; Haupert, L.J.; Amundson, L.M.; Abu-Omar, M.M.; Owen, B.J.; Klein, I.; Marcum, C.;Kenttamaa, H.I.; Ribeiro, F.H.; et al. Cleavage and hydrodeoxygenation (HDO) of C–O bonds relevant tolignin conversion using Pd/Zn synergistic catalysis. Chem. Sci. 2013, 4, 806–813. [CrossRef]
41. Mirzayanti, Y.W.; Prajitno, D.H.; Roesyadi, A. Catalytic hydrocracking of Kapuk seed oil (Ceiba pentandra) toproduce biofuel using Zn-Mo supported HZSM-5 catalyst. IOP Conf. Ser. Earth Environ. Sci. 2017, 67, 12023.[CrossRef]
42. Pourzolfaghar, H.; Abnisa, F.; Daud, W.M.A.W.; Aroua, M.K. Gas-phase hydrodeoxygenation of phenol overZn/SiO2 catalysts: Effects of zinc load, temperature, weight hourly space velocity, and H2 volumetric flowrate. Biomass Bioenergy 2020, 138, 105556. [CrossRef]
43. Rusu, D.; Rusu, G.; Luca, D. Structural Characteristics and Optical Properties of Thermally Oxidized ZincFilms. Acta Phys. Pol. A 2011, 119, 850–856. [CrossRef]
44. Sacco, O.; Vaiano, V.; Sannino, D.; Picca, R.; Cioffi, N. Ag modified ZnS for photocatalytic water pollutantsdegradation: Influence of metal loading and preparation method. J. Colloid Interface Sci. 2019, 537, 671–681.[CrossRef]
45. Nie, L. Catalytic Hydrodeoxygenation of Phenolic Compounds of Importance in Bio-oil Upgrading. 2014.Available online: https://hdl.handle.net/11244/10369 (accessed on 21 March 2020).
46. Oyama, S.T.; Clark, P.; Da Silva, V.T.; Lede, E.J.; Requejo, F.G. XAFS Characterization of Highly ActiveAlumina-Supported Molybdenum Phosphide Catalysts (MoP/Al2O3) for Hydrotreating. J. Phys. Chem. B2001, 105, 4961–4966. [CrossRef]
47. Phillips, D.C.; Sawhill, S.J.; Self, R.; Bussell, M.E. Synthesis, Characterization, and HydrodesulfurizationProperties of Silica-Supported Molybdenum Phosphide Catalysts. J. Catal. 2002, 207, 266–273. [CrossRef]
48. Clark, P.; A Clark, P.; Oyama, S.T. Alumina-supported molybdenum phosphide hydroprocessing catalysts.J. Catal. 2003, 218, 78–87. [CrossRef]
49. Asphaug, S. Catalytic Hydrodeoxygenation of Bio-oils with Supported MoP-Catalysts. Master′s Thesis,Norwegian University of Science and Technology, Trondheim, Norway, 2013.
50. Karnjanakom, S.; Bayu, A.; Hao, X.; Kongparakul, S.; Samart, C.; Abudula, A.; Guan, G.-Q. Selectivelycatalytic upgrading of bio-oil to aromatic hydrocarbons over Zn, Ce or Ni-doped mesoporous rod-likealumina catalysts. J. Mol. Catal. A Chem. 2016, 421, 235–244. [CrossRef]
51. Huynh, T.M.; Armbruster, U.; Kreyenschulte, C.R.; Nguyen, L.H.; Phan, B.M.Q.; Nguyen, D.A.; Martin, A.Understanding the Performance and Stability of Supported Ni-Co-Based Catalysts in Phenol HDO.Catalysts 2016, 6, 176. [CrossRef]
52. Bu, Q.; Lei, H.; Zacher, A.H.; Wang, L.; Ren, S.; Liang, J.; Wei, Y.; Liu, Y.; Tang, J.; Zhang, Q.; et al. A review ofcatalytic hydrodeoxygenation of lignin-derived phenols from biomass pyrolysis. Bioresour. Technol. 2012,124, 470–477. [CrossRef]
53. Echeandia, S.; Arias, P.L.; Barrio, V.; Pawelec, B.; Fierro, J.L.G. Synergy effect in the HDO of phenol overNi–W catalysts supported on active carbon: Effect of tungsten precursors. Appl. Catal. B Environ. 2010,101, 1–12. [CrossRef]
54. Zhao, C.; He, J.; Lemonidou, A.A.; Li, X.; Lercher, J.A. Aqueous-phase hydrodeoxygenation of bio-derivedphenols to cycloalkanes. J. Catal. 2011, 280, 8–16. [CrossRef]
© 2020 by the authors. Licensee MDPI, Basel, Switzerland. This article is an open accessarticle distributed under the terms and conditions of the Creative Commons Attribution(CC BY) license (http://creativecommons.org/licenses/by/4.0/).
83


energies
Article
Modeling and Optimization of Microwave-Based Bio-Jet Fuelfrom Coconut Oil: Investigation of Response SurfaceMethodology (RSM) and Artificial Neural NetworkMethodology (ANN)
Mei Yin Ong 1,2, Saifuddin Nomanbhay 1,2,*, Fitranto Kusumo 1,2, Raja Mohamad Hafriz Raja Shahruzzaman 1,2
and Abd Halim Shamsuddin 2
���������������
Citation: Ong, M.Y.; Nomanbhay, S.;
Kusumo, F.; Raja Shahruzzaman,
R.M.H.; Shamsuddin, A.H. Modeling
and Optimization of
Microwave-Based Bio-Jet Fuel from
Coconut Oil: Investigation of
Response Surface Methodology
(RSM) and Artificial Neural Network
Methodology (ANN). Energies 2021,
14, 295. https://doi.org/10.3390/
en14020295
Received: 15 December 2020
Accepted: 5 January 2021
Published: 7 January 2021
Publisher’s Note: MDPI stays neu-
tral with regard to jurisdictional clai-
ms in published maps and institutio-
nal affiliations.
Copyright: © 2021 by the authors. Li-
censee MDPI, Basel, Switzerland.
This article is an open access article
distributed under the terms and con-
ditions of the Creative Commons At-
tribution (CC BY) license (https://
creativecommons.org/licenses/by/
4.0/).
1 Institute of Sustainable Energy, Universiti Tenaga Nasional (UNITEN), Kajang 43000, Selangor, Malaysia;[email protected] (M.Y.O.); [email protected] (F.K.); [email protected] (R.M.H.R.S.)
2 AAIBE Chair of Renewable Energy, Universiti Tenaga Nasional (UNITEN), Kajang 43000, Selangor, Malaysia;[email protected]
* Correspondence: [email protected]; Tel.: +603-8921-7285
Abstract: In this study, coconut oils have been transesterified with ethanol using microwave tech-nology. The product obtained (biodiesel and FAEE) was then fractional distillated under vacuum tocollect bio-kerosene or bio-jet fuel, which is a renewable fuel to operate a gas turbine engine. Thisprocess was modeled using RSM and ANN for optimization purposes. The developed models wereproved to be reliable and accurate through different statistical tests and the results showed that ANNmodeling was better than RSM. Based on the study, the optimum bio-jet fuel production yield of74.45 wt% could be achieved with an ethanol–oil molar ratio of 9.25:1 under microwave irradiationwith a power of 163.69 W for 12.66 min. This predicted value was obtained from the ANN modelthat has been optimized with ACO. Besides that, the sensitivity analysis indicated that microwavepower offers a dominant impact on the results, followed by the reaction time and lastly ethanol–oilmolar ratio. The properties of the bio-jet fuel obtained in this work was also measured and comparedwith American Society for Testing and Materials (ASTM) D1655 standard.
Keywords: bio-jet fuel; microwave-assisted transesterification; RSM; ANN; optimization; coconut oil
1. Introduction
Amongst renewable energy technologies the current trend is technology which aimsto optimally utilize clean and sustainable energy sources, based on current and futureeconomic and societal needs. Social and economic development is always followed withan increase in energy demand. Currently, most of the energy demand is fulfilled by non-renewable fossil fuels, including natural gas, coal, and petroleum. The formation of fossilfuels took hundreds of million years. It is predicted that with the current consumptionrate, fossil fuel will deplete in the near future [1,2]. Furthermore, the burning of fossilfuels results in negative environmental impacts, such as global warming, acid rain, climatechange, and others. Hence, it is crucial to look for alternative energy resources that areclean and sustainable to replace the non-renewable fossil fuel.
There are a series of studies that have been done in exploring renewable energy tech-nologies, such as solar energy, wind energy, tidal energy, and biofuels [3–8]. Among theavailable renewable energy, liquid biofuel from biomass resources has received a lot ofattention [9–11], especially in the transportation sector, as it offers an opportunity to replacepetroleum in operating the combustion engine with little to no modification [12,13]. In fact,over 90% of transportation nowadays is still dependent on non-renewable fossil fuel [14].Therefore, many works have been done to enhance and improve the biofuel production
Energies 2021, 14, 295. https://doi.org/10.3390/en14020295 https://www.mdpi.com/journal/energies
85

Energies 2021, 14, 295
technologies, especially biodiesel, a renewable replacement of diesel fuel [15–18]. Nev-ertheless, there is only a little information about the production of bio-kerosene (bio-jetfuel). Bio-jet fuel is a promising alternative fuel for a jet engine. Other than the aviationsector, bio-jet fuel also can be used in the power generation sector to operate the gas tur-bine engine. Hence, the bio-jet fuel production technologies should be further exploredand investigated in obtaining a comparable renewable replacement for petroleum-basedkerosene at sufficient volume.
Based on the statistical report, flights produced 859 Mt of carbon dioxide (CO2)globally in 2017. In the other words, approximately 2% of the CO2 emitted through humanactivities is contributed by the global aviation sector. In addition, this 859 Mt of CO2 isresponsible for 12% of CO2 emission from all transports sources [19,20]. CO2 is one ofthe greenhouse gases that will trap heat within the Earth’s atmosphere, causing globalwarming and climate change. In order to mitigate the CO2 emissions from air transportand, at the same time, to address the global challenge of climate change, the InternationalAir Transport Association (IATA) has adopted a set of targets and approaches. One of theambitious targets is to achieve 50% reduction in net aviation carbon emissions by 2050 ascompared to 2005, through the deployment of sustainable low-carbon fuels, such as bio-jetfuel [19].
Generally, aviation liquid fuel can be produced from different biomass feedstock withdifferent methods [21–23]. Currently, transesterification and hydrotreating are the mainproduction method of bio-jet fuel [24]. Unlike the hydrotreating process, transesterificationrequires an upgrading process to separate bio-jet fuel from the product of transesterification(biodiesel). Although an additional downstream process is required, however, the trans-esterification process operates under milder condition as compared to the hydrotreatingprocess. Hence, its operating cost are relatively lower. The transesterification processinvolves three consecutive and reversible reactions (refer to Equations (1)–(3)) that reacttriglyceride with alcohol in the presence or absence of a catalyst and produce a mixture offatty acid alkyl ester (FAAE or biodiesel) and glycerol as a by-product. In overall, trans-esterification requires 1 mole of triglyceride and 3 moles of alcohol to produce 3 moles ofbiodiesel, as shown in Equation (4). However, practically, the excess amount of alcohol isusually used to shift the equilibrium to the product side and allow the phase separation ofbiodiesel from the glycerol [25].
Triglyceride (oil or f at) + ROH (alcohol) ↔ Diglyceride + R′COOR (1)
Diglyceride + ROH ↔ Monoglyceride + R′COOR (2)
Monoglyceride + ROH ↔ Glycerol + R′COOR (3)
Triglyceride (oil or f at) + 3ROH (alcohol) ↔ Glycerol + 3R′COOR (FAAE) (4)
Commonly, methanol is used for biodiesel production via transesterification reactions.This is because methanol is cheaper, allows phase separation to be conducted more easily,and permits the transesterification process to be conducted under milder conditions [26].However, methanol is very toxic to humans, as in the body methanol is metabolized intoformaldehyde and then formic acid. Therefore, there is the scope of using ethanol forproducing biodiesel. Ethanol has several advantages to methanol, such as offering bettersolvent properties and low toxicity relative to methanol [27,28] Furthermore, there is astudy reported that the biodiesel formed using ethanol, the fatty acid ethyl ester (FAEE)present a higher cetane number, calorific value, oxidation stability, lubricant characteristics,lower cloud and pour points, and also have lower tailpipe emissions in comparison to theproduct collected using methanol, fatty acid methyl ester (FAME) [29,30].
In addition, microwave technology is deployed to replace conventional heating in thisstudy. Microwave technology is a green processing method that offers several advantages,such as by being more environmental-friendly, in terms of lower energy consumption. Fur-thermore, the volumetric heating mechanism of microwave heating also allows rapid heating,
86

Energies 2021, 14, 295
enhances chemical reaction rate and selectivity, and improves the production quality andyield [25]. Microwave heating has received a lot of attention since the 1970s, especially inthe chemical research. Conventional heating transfers heat into the reactant through thereactant vessel via conduction and convection (wall heating). However, microwave heating ishighly dependent on the dielectric properties of the reactant [25,31]. It allows direct heatingof the material without heat-up of the reactant vessel [32]. Hence, microwave heating allowsselective and rapid heating, as mentioned previously.
Numerous studies have been done on the microwave-assisted transesterification pro-cess for biodiesel production [25,33,34]. Compared to other approaches, transesterificationis the simplest and a widely-accepted method to reduce oil viscosity because it is cost-effective. Therefore, modeling the process and optimizing the process input variablesinvolved are important in order to save time, achieve high product yield and reduce theoverall cost to produce biodiesel. Response surface methodology (RSM) and artificial neu-ral network (ANN) are one of the mathematical methods for modeling transesterificationprocesses [35–38]. Some of the advantages that RSM has are the durability under optimalsetting conditions and the ability to minimize the number of trials required to providesufficient evidence for statistically acceptable results [37].
Artificial neural network (ANN) is an information processing system that has charac-teristics such as biological neural networks that imitates the behaviour and learning processof the human brain. An interesting characteristic of this ANN is its ability to learn (learningand training). The training process at ANN aims to find convergent weights betweenlayers so that the weights obtained to produce the desired output. ANNs are universalapproximators and their predictions are based on prior available data, have shown greatability in solving complex nonlinear systems [39].
Ant colony optimization (ACO) is a swarm intelligence technique which is inspiredby natural metaphors, namely communication and cooperation between ants to find theshortest path from the nest ants to the food. It is desirable to integrate ACO with ANNmodel since ACO is capable of optimizing complex process parameters [15,40]. CouplingACO with the ANN is desirable since the ACO algorithm is capable of optimizing complexprocess parameters [41].
This study proposed the production of bio-jet fuel through microwave-assisted cat-alytic transesterification from coconut oil. Coconut oil was selected as the raw feedstockas it consists of a high percentage of medium-chain triglycerides, which made it suitableto be used for bio-jet fuel production [22,42]. An optimization study was conducted inthis work based on three parameters, including oil to ethanol molar ratio, reaction timeand microwave power, using response surface methodology (RSM) and artificial neuralnetwork (ANN) coupled with ant colony optimization (ACO) algorithm. Additionally, therelevant characterizations of coconut oil through the application of gas chromatographic-mass spectrometry and Fourier transform infrared spectrometry analyses of the coconutoil, FAEE, and bio-jet fuel were conducted and reported. The physicochemical propertiesof the bio-jet fuel collected and their comparison with the ASTM standard are also reportedin this paper.
2. Materials and Methods
2.1. Materials and Equipment
Coconut oil was purchased from the local market in Selangor, Malaysia. The co-conut oil was then analyzed using gas chromatography, GC (Agilent, 7890A, Wilmington,DE, USA) to obtain its fatty acid profile, as reported in Table 1. Ethanol (C2H5OH) andpotassium hydroxide (KOH) were purchased from Sigma–Aldrich (St. Louis, MO, USA).
87

Energies 2021, 14, 295
Table 1. Fatty acid composition of coconut oil.
Fatty Acid Composition (wt%)
Caprylic acid, C8:0 6.0Capric acid, C10:0 5.1Lauric acid, C12:0 48.5
Myristic acid, C14:0 16.9Palmitic acid, C16:0 9.6Stearic acid, C18:0 2.3Oleic acid, C18:1 8.2
Linoleic acid, C18:2 3.4
2.2. Microwave-Assisted Catalytic Transesterification
The experiments of this work involve the catalytic transesterification of coconut oilunder microwave irradiation. Firstly, coconut oil and ethanol at a specific molar ratio with0.5 wt% of potassium hydroxide (KOH) catalyst concentration was prepared. Then, themixture (reactant) was poured into a 250 mL round bottom flask with a magnetic stirrer barand put into the microwave reactor. Next, the reflux system was attached, and the reactantwas then subjected to microwave irradiation with different power settings under differentreaction times at a stirring speed of 200 rpm. At the same time, the temperature of thereflux system was maintained at −4 ◦C by using a chiller to condense back the vaporizedreactant. After completion, the product of this transesterification process was cooled toroom temperature. The equipment used in producing bio-jet fuel via transesterificationwas a modified microwave oven equipped with a reflux system, as shown in Figure 1.
Figure 1. Experimental setup for microwave-assisted catalytic transesterification.
Then, the product was left in a separating funnel to split the liquid phases. The upperlayer, which is the fatty acid ethyl ester (FAEE), was washed using warm water three timesand dried at 100 ◦C for 1 h in the conventional oven to remove the moisture.
2.3. Distillation
The bio-jet fuel fraction of the FAEE was obtained by fractional distillation process,which was carried out as shown in Figure 2. The bio-jet fuel with a lower boiling point(C8-C14 of FAEE) was separated from the FAEE by using a rotary evaporator at 165 ◦C and
88
Energies 2021, 14, 295
25 mbar for 120 min. The bio-jet fuel was collected, and the percentage yield of bio-jet fuelwas calculated by using the equation below:
%yield o f biojet f uel =amount o f biojet f uel obtained (g)
amount o f coconut oil f eedstock (g)× 100% (5)
Figure 2. Experimental setup for distillation.
2.4. Response Surface Methodology (RSM)
To investigate the optimal condition for bio-jet fuel production through microwave-assisted catalytic transesterification, response surface methodology (RSM) was applied byusing Design Expert 11 software (Stat-Ease, Minneapolis, MN, USA). RSM was normallyused to optimize an experiment based on the selected variables [43–45]. Traditionally,the one-factor-at-a-time (OFAT) methodology, which varies one variable at a time whilemaintaining the others as constant, is time-consuming and expensive because many experi-mental runs are required to evaluate the relationship between the studied variables. Hence,RSM is recommended as the optimization can be achieved with less experimental runs ascompared to OFAT by varying different parameters at a time. Moreover, a mathematicalmodel can be generated to describe the experiments by using a polynomial function thatfitted by the least square method:
Y = β0 + ∑ βiXi + ∑ βijXiXj + ∑ βiβiXiXi + e (6)
where Xi indicates the studied variable, while Y symbolize the results to be optimized. β0,βi, and βij, however, are the regression coefficient. Finally, e represents the random error.
In this project, the Box–Behnken design was selected as it able to estimate the re-gression coefficient of a second-degree quadratic equation with less experimental runsin comparison to central composite design. In this optimization study, three parameterswere considered, namely, coconut oil to ethanol molar ratio, reaction time, and microwavepower. The respective levels of different parameters are summarized in Table 2 and notethat the center point was repeated three times to determine the experimental errors. The3-levels-3-parameters Box–Behnken Design was implemented and showed that a total15 experimental runs with different reaction conditions (refer to Table 3) are required toconduct the optimization study. From there, bio-jet fuel was produced, and the resultobtained was inserted into software for further analysis. Analysis of variance (ANOVA)was conducted to generate a mathematical model for the studied response, in this case, thebiokerosene yield.
89

Energies 2021, 14, 295
Table 2. Experimental level of studied parameters.
Experimental LevelCoconut Oil to Ethanol
Molar Ratio, F1Reaction Time, F2 (min)
Microwave Power,F3 (W)
Low level, L (−1) 1:6 5 100Medium level, M (0) 1:9 10 300
High level, H (+1) 1:12 15 500
Table 3. Fit summary table.
SourceSequential
p-ValueLack of Fit
p-ValueAdjusted
R-SquaredPredicted
R-SquaredRemarks
Linear 0.0418 0.0211 0.3787 0.22892 Factors
Interaction 0.9898 0.0143 0.1574 −0.4111
Quadratic <0.0001 0.4277 0.9792 0.9130 SuggestedCubic 0.4277 0.9839 Aliased
2.5. Artificial Neural Network (ANN)
MATLAB’s Neural Network in MATLAB R2011b (MathWorks Inc., Natick, MA, USA)was used to train the backpropagation ANN developed in this study. The hyperbolictangent sigmoid (Equation (7)) and the purelin (Equation (8)) transfer function was used forthe input layer to the hidden layer and the hidden layer to the output layer, respectively.
tangent sigmoid (x) =2
(1 + e−2x)− 1 (7)
A = purelin (x) = x (8)
The proposed ANN has an input layer with three neurons (coconut oil to ethanolmolar ratio, reaction time and microwave power), a hidden layer and an output layer withone neuron (bio-jet fuel yield). The ANN model was trained until the mean square error(MSE) was minimized and the average correlation coefficient was close or equal to 1. Theoptimum number of hidden neurons was selected by heuristic procedure. The datasetcontaining the bio-jet fuel yield and the process input variables were divided into threesubsets: training (70%), validating (15%), and testing (15%).
2.6. Ant Colony Optimization (ACO)
Ant colony optimization (ACO) is also known as a swarm intelligence technique,which is inspired by the foraging pattern of ant colonies. Ants can find the shortest pathfrom a food source to their nest, without having to see it directly. The ants have a uniqueand very advanced solution, namely using a pheromone trail on a path to communicateand building a solution, the more pheromone traces are left, the other ants will follow thatpath. These pheromones too relate to the previous good element solutions formed by theants. Equation (9) describes the probability of an ant move from one node (i) to another (j):
Pi,j =
(τα
i,j
) (nβ
i,j
)∑(
ταi,j
) (nβ
i,j
) (9)
where τi,j indicates the amount of pheromone on edge i,j (refer to Equation (10)) and theα symbolizes the factors selected to regulate the impact of τi,j. τi,j. Meanwhile, ni,j is thedesirability of edge i,j (commonly 1/di,j) and the β implies the factors selected to regulatethe impact of ni,j.
τi,j = 1 − ρτi,j + Δτi,j (10)
90

Energies 2021, 14, 295
where ρ is the rate of pheromone evaporation and Δτi,j is the amount of pheromonedeposited.
If ant k travels on edge i,j, the amount of pheromone deposited is given by Equation (11):
Δτki,j =
{1Lk
, if ant k travels on edge i, j0, Otherwise
(11)
where Lk is the cost of the kth ant’s tour (typically length).
2.7. Statistical Evaluation of the Developed Models
Different statistical measures, including correlation coefficient (R), coefficient of deter-mination (R2), root mean absolute error (RMSE), standard error of prediction (SEP), meanabsolute error (MAE) and Chi-square were used to test the developed models, as describedin Equations (12)–(17) [39]:
R =∑n
i=1(
Mp − Mp,avg) × (
Me − Me,avg)
√[∑n
i=1 (Mp − Mp.avg)2][
∑ni=1 (Me − Me.avg)
2] (12)
R2 = 1 − ∑ni=1 (Me − Mp)
2
∑ni=1 (Me,avg − Mp)
2 (13)
RMSE =
√1n ∑n
i=1 (Me − Mp)2 (14)
SEP =
√1n ∑n
i=1 (Me − Mp)2
Me,avg× 100 (15)
MAE =1n
(n
∑i=1
∣∣(Me − Mp)∣∣) (16)
Chi − square =n
∑i=1
(Me − Mp
)2
Me(17)
where n shows the number of points, and Mp, Me, Mp,avg and Me,avg are the predicted value,experimental value and the average of the predicted and experimental values, respectively.
2.8. Sensitivity Analysis
The importance of the studied variables (coconut oil to ethanol molar ratio, reactiontime, and microwave power) was explored through conducting the sensitivity analysis. Inthis analysis, Equation (18) is used with the “sum of squares” values obtained from theANOVA table generated from response surface methodology (RSM).
sensitivity% =Sx
Sy× 100 (18)
where Sx and Sy indicate the sum of square of the individual variable and total sum ofsquares of all the variables, correspondingly.
The significance input variables for ANN, were calculated based on Equation (19) [37]:
Fk =
∑j=Moj=1
(( ∣∣∣Wagkj
∣∣∣∑
Myh=1
∣∣∣Wachj
∣∣∣)×
∣∣∣Wgljm
∣∣∣)
∑h=Myh=1
{∑
j=Moj=1
((∣∣∣Wanqr
∣∣∣∣∣∣Wag
hj
∣∣∣∑
Mpd=1
∣∣∣Waghj
∣∣∣)×
∣∣∣Wgljm
∣∣∣)} (19)
91

Energies 2021, 14, 295
where, Fk is the relative significance of the kth input variable on the output variable.Mo is the number of input neurons and My is the number of hidden neurons. W is theconnection weight. The superscript a, g, and l represent the input, output, and hidden layer,respectively, whereas the subscript h, j, and m represent the input, output, and hiddenneuron, respectively.
2.9. Optimization of Transesterification Process Variables
RSM and ANN-ACO were used to evaluate the optimal value of the three respectivestudied parameters in order to obtain the highest bio-jet fuel yield. The bio-jet fuel yieldand the studied parameters were set at “maximum” and “in the range” individually in thecase of RSM. ACO was used to determine the optimal values with the maximum bio-jetfuel yield for ANN. By conducting triplicate experiments, the optimal values determinedby each approach were validated and the average values obtained were compared with theexpected values.
2.10. Bio-Jet Fuel Properties
The bio-jet fuel isolated from biodiesel (FAEE) was then analyzed and compared withthe standard requirements for aviation turbine fuels (ASTM D1655) of the American Societyfor Testing and Materials. In this work, according to the respective ASTM test process,physicochemical properties including density at 15 ◦C, kinetic viscosity at −20 ◦C, flashpoint, and freezing point were calculated. Using a bomb calorimeter, the lower heatingfactor, also known as calorific value, was calculated as well.
3. Results
3.1. RSM
Based on this result, a fit summary table was generated to evaluate the suitablemodel for the optimization study. The fit summary table is shown in Table 3, and theoutcomes indicate that the quadratic model is adequate to model the studied response(bio-jet fuel yield). This finding is based on the sequential p-value of the quadratic model,which is less than 0.05. In other words, the quadratic model consists of more than 95%confidence in modeling the experiments. Besides that, inclusion of cubic model termsmight cause the model to be aliased and hence, the quadratic model is the best with thehighest polynomial order.
The model used in this quadratic equation using a notation such as F1 for the coconutoil ethanol molar ratio, F2 for the reaction time, and F3 for microwave power. The exper-imental and predicted results in this work are summarized in Table 4 and the uncodedquadratic equation is shown in the following equation:
Bio − jet fuel yield (%) = 21.84F1 + 2.419F2 + 0.0416F3 − 0.00717F1F2 + 0.00227F1F3 − 0.000165F2F3−1.18644F2
1 − 0.082917F22 − 0.00016F2
3 − 50.84552(20)
Table 4. Experimental runs in RSM design with the different operating conditions and their respective experimental andpredicted bio-jet fuel yield.
ExperimentalRun
Coconut Oil toEthanol Molar
Ratio, F1
Reaction Time,F2
(min)
MicrowavePower, F3
(W)
ExperimentalBio-Jet Fuel
Yield (%)
Predicted Bio-JetFuel Yield (%)
RSM
Predicted Bio-JetFuel Yield (%)
ANN
1 1:6 10 500 40.92 40.07 41.102 1:9 15 100 70.86 71.12 70.733 1:12 5 300 56.05 56.11 56.184 1:6 5 300 48.21 49.32 47.975 1:12 15 300 63.88 62.77 64.136 1:9 15 500 55.73 56.64 55.697 1:9 5 100 64.83 63.92 64.848 1:9 5 500 50.36 50.10 50.38
92

Energies 2021, 14, 295
Table 4. Cont.
ExperimentalRun
Coconut Oil toEthanol Molar
Ratio, F1
Reaction Time,F2
(min)
MicrowavePower, F3
(W)
ExperimentalBio-Jet Fuel
Yield (%)
Predicted Bio-JetFuel Yield (%)
RSM
Predicted Bio-JetFuel Yield (%)
ANN
9 1:6 10 100 57.14 56.94 56.6410 1:12 10 500 49.16 49.36 49.1911 1:12 10 100 59.94 60.79 59.96
12 * 1:9 10 300 69.82 68.85 69.8113 1:6 15 300 56.47 56.41 55.96
14 * 1:9 10 300 69.15 68.85 69.8115 * 1:9 10 300 67.59 68.85 69.81
* The center points of the experiments are replicated for 3 times.
The effect of the studied parameters as linear, quadratic, and interaction coefficientson the studied responses was determined for their significance through analysis of variance(ANOVA). The ANOVA results of this work are reported in Table 5. The studied parameterscoconut oil to ethanol molar ratio, reaction time and microwave power represent as F1, F2,and F3 terms particularly. It is noted that the model used was statistically significant with aconfidence level of 95%. From the table, it observed that parameters F1, F2, and F3 have asignificant influence on bio-jet fuel production (p-values < 0.0500). Furthermore, note thatthe “lack of fit” of the model consists of a p-value of 0.4227 (not significant as >0.05). In theother words, the model is fit to be used for further analysis.
Table 5. Analysis of Variance for the modeling of bio-jet fuel production.
Source Sum of Squares df Mean Square F-Value * p-Value Remarks
Model 1127.25 9 125.25 74.3 <0.0001 significantF1-Ethanol 86.4 1 86.4 51.25 0.0008
F2-Time 94.46 1 94.46 56.04 0.0007F3-Power 400.45 1 400.45 237.55 <0.0001
F1F2 0.0462 1 0.0462 0.0274 0.875F1F3 7.4 1 7.4 4.39 0.0903F2F3 0.1089 1 0.1089 0.0646 0.8095
F21 420.99 1 420.99 249.74 <0.0001
F22 15.11 1 15.11 8.96 0.0303
F23 150.55 1 150.55 89.31 0.0002
Residual 8.43 5 1.69Lack of Fit 5.81 3 1.94 1.48 0.4277 not significantPure Error 2.62 2 1.31Cor Total 1135.68 14
* The F value for a term shows the test in order to compare the variance of that particular term with the residual variance.
Effect of the ParameterEffect of the Ethanol to Oil Molar Ratio
Figure 3a shows the effect of ethanol to oil molar ratio and reaction time for the bio-jetfuel production. It is shown, from the ANOVA analysis (Table 5), that ethanol to oil molarratio has the positive effect for bio-jet fuel production (p value < 0.05). Increasing theethanol to oil molar ratio from 1:6 to 1:9.36, the bio-jet fuel yield increases until an optimalpoint and then decreases. Similar trends have been reported in several studies [46]. Asstated before, the stoichiometry of the transesterification requires three moles of alcohol toreact with one mole of triglyceride. However, since it involves a reversible reaction, so, anexcessive amount of alcohol is usually needed to shift the reaction equilibrium toward theproduction of biodiesel. In the work done by Encinar et al. [47], the conventional alkali-catalyzed transesterification was reported to be incomplete for the molar ratio of methanolto Cynara oil that was less than 4.05. As expected, the methyl esters yield increases with themethanol molar ratio and achieve an optimal yield at a molar ratio of 5.67. However, for themethanol molar ratio higher than 5.67, the methyl esters yield drops. This result tallies with
93
Energies 2021, 14, 295
current work. This phenomenon is observed because the separation and recovery processof glycerol has been interfered by the high alcohol molar ratio [48]. The high amount ofethanol, in this case, has increased the solubility of the glycerol in the ester phase and shiftsthe reaction equilibrium towards the reactant side. As the result, biodiesel yield decreasesas well as bio-jet fuel.
Figure 3. Three-dimensional response for the interaction on bio-jet fuel yield between (a) reaction time and ethanol to oilmolar ratio, (b) microwave power and reaction time and, (c) ethanol to oil molar ratio and microwave power.
Effect of the Reaction Time
The relationship between reaction time and microwave power is shown in Figure 3b.The p-value = 0.0007 of the reaction time parameter suggested that there was a reasonablylarge impact of reaction time on the production of bio-jet fuel yield (Table 5). With theincrease in reaction time from 5 to 14.34 min followed by the increase in microwave powerfrom 100–189.53 W, bio-jet fuel yield improved, which may be due to the explanation thatmore reaction time causes a more productive reaction time. It can be noticed that the bio-jetfuel yield increases as the reaction time increases, similar to the studies done by otherresearchers [42].
Effect of the Microwave Power
It is observed that the interaction of the microwave power and ethanol molar ratiohave positively approached the bio-jet fuel yield. From Figure 3c, it observed that increasingthe microwave power from 100 to 189.53 W, and the ethanol to oil molar ratio from 1:6to 1:9.36, will increase the bio-jet fuel into maximum point and then it will decrease. Thebio-jet fuel yield was decreasing when the microwave power reached above 189.53 W, with
94

Energies 2021, 14, 295
an ethanol molar ratio of more than 1:9.36. This might be due to the possibility of highmicrowave power causes the destruction of triglycerides [49]. Hence, less triglycerideswere reacted with alcohol, and resulting in lower yield.
3.2. Analysis of the Developed ANN Model
The design of the ANN architecture chosen for this work was based on the minimummean square error (MSE) and the highest coefficient correlation value (R). The ANNnetwork modeling output plots (predicted values) versus target (actual values) for training,validation, testing and entire datasets with R values of 0.997, 1, 1, and 0.99785, respectively,are shown in Figure 4. In this study, the best topology was found to be 3-8-1, (Figure 5).The architecture consists of a three-neuron input layer.
Figure 4. Artificial neural network modeling.
Figure 5. Artificial neural network architecture.
95

Energies 2021, 14, 295
3.3. Comparison of the Predictive Capability of Models
Table 6 displays the findings obtained from different statistical metrics used to testthe built models. For both developed models (RSM and ANN), the high R values (Table 6)indicate that there is a strong link between the real and the predicted yields of bio-jet fuel.For both RSM and ANN, the R and R2, were 0.9963, 0.9926, and 0.9979,0.9957, respectively.
Table 6. Statistical analysis.
Statistical Analysis RSM ANN
R 0.9963 0.9979R2 0.9926 0.9957
RSME 0.5619 0.4048SEP (%) 0.9563 0.6889
MAE 0.0414 0.0220Chi-square 0.0096 0.0061
The good fit of the models is representative of these high values. RMSE is a test ofthe dataset adherence to the regression line. For both RSM and ANN models, the valuesof RMSE that were obtained were all low, confirming the models’ good fit. To calculatethe residuals (deviation from actual objective) of the built models, SEP (percent) and MAEwere used. The ANN model had less divergence from experimental values of SEP (0.6889percent) and MAE (0.022) than the RSM model, as seen in Table 6. In comparison, lowerchi-square (0.782) values confirmed that the most reliable was the ANN model with thelowest error term values and highest R and R2 values. It was noted in this analysis thatANN was found to be superior than RSM.
3.4. Sensitivity Analysis Results of the Input Variables on the Developed Models
The sensitivity analysis findings for both RSM and ANN are shown in Figure 6. Theresult for both models have the same pattern in that the most influential response inputvariable (bio-jet fuel yield) was seen to be microwave power, followed by reaction timeand finally by ethanol to oil molar ratio. The degrees of significance distributions, however,differed between the methods of modeling. The significance level of 68.89% microwavepower, 16.25% reaction time and 14.86% ethanol to the molar ratio for RSM. While forANN, the important microwave power rating was 42.29%, the reaction time was 29.03%and the ethanol oil molar ratio was 28.68%.
Figure 6. Sensitivity analysis for bio-jet fuel production.
96

Energies 2021, 14, 295
3.5. Optimization of the Process Variables for Bio-Jet Fuel
To obtain the highest value of bio-jet fuel yield, the optimization of the studiedvariables was carried out using RSM and ANN-ACO. In the case of RSM, the in-buildoptimization method in the Design Expert software was used for the optimisation study. Onthe other hand, the ANN models acted as the fitness functions when combined with ACO inthe case of optimization using the ANN-ACO method. Table 7 shows the optimum valuesexpected by each system. For each model bio-jet fuel validated by triplicate experimentsin the laboratory, the expected optimal condition and the average bio-jet fuel yields werereported (Table 7). From the result, it was observed that RSM predicted 72.49% of bio-fueljet yield. While for ANN-ACO, the predicted yield was 74.45% with process variables(9.25:1 ethanol oil molar ratio, 12.66 min reaction time and 163.69% microwave power) washigher than most RSM values.
Table 7. Optimization of RSM and ANN-ACO.
Modeling Method Ethanol Time Power Predicted Observed
RSM 9.35 14.34 189.53 72.49 73.02ANN 9.25 12.66 163.69 74.8 74.45
3.6. FTIR
The results obtained from the FTIR study of the spectrum of coconut oil, FAEE andbio-jet fuel are given in Figure 7. The peaks shown in between 3000 to 2800 cm−1 indicatethe stretching vibration of = C-H (alkene) and C-H (alkane) functional groups [50], whichcontributed by the esters chain of the samples. The characteristics peak at wavenumber of1743 cm−1, 1742 cm−1, and 1740 cm−1 in the spectrum of coconut oil, FAEE and bio-jet fuel,respectively, show the occurrence of C=O stretching. Although this peak is shorter in thebio-jet fuel as compared to FAEE, however, the presence of this peak showing that thereis a need for deoxygenation process to remove the oxygen content in the jet fuel. Besides,blending of the bio-jet fuel with the conventional fossil-based jet fuel is also recommendedto balance the bio-jet fuel property deficiency. Furthermore, it is noted that an extra peakat 1437 cm−1 in the spectrum of FAEE and bio-jet fuel in comparison to the spectrum ofcoconut oil. This peak can be explained by the bending vibration of C-H groups in thesamples. In addition, it confirms the transesterification process was successfully conductedand converted triglycerides in the coconut oil into ethyl esters in biodiesel (FAEE) andbio-jet fuel [44,51,52].
Figure 7. FTIR spectrum for coconut oil, FAEE, and bio-jet fuel.
97
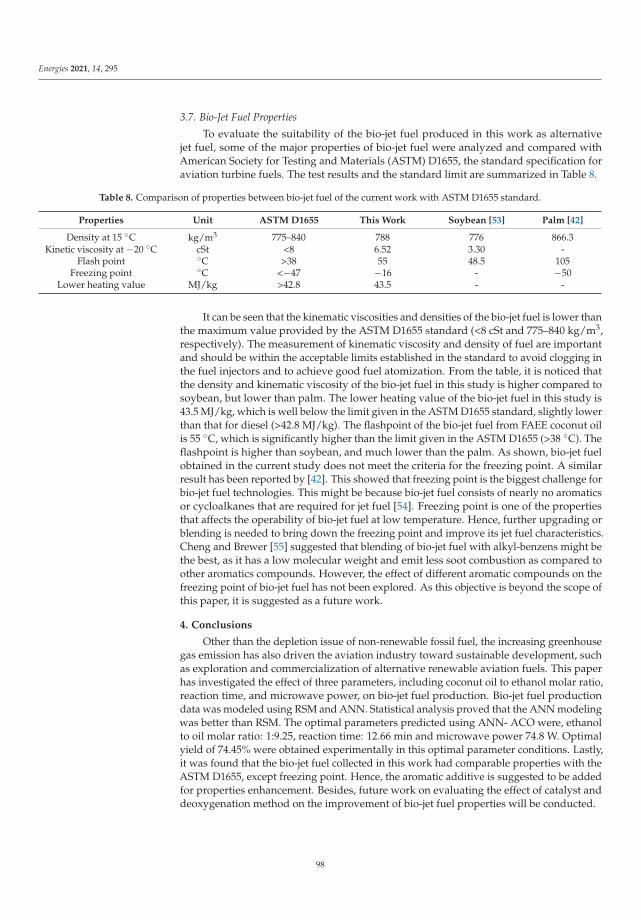
Energies 2021, 14, 295
3.7. Bio-Jet Fuel Properties
To evaluate the suitability of the bio-jet fuel produced in this work as alternativejet fuel, some of the major properties of bio-jet fuel were analyzed and compared withAmerican Society for Testing and Materials (ASTM) D1655, the standard specification foraviation turbine fuels. The test results and the standard limit are summarized in Table 8.
Table 8. Comparison of properties between bio-jet fuel of the current work with ASTM D1655 standard.
Properties Unit ASTM D1655 This Work Soybean [53] Palm [42]
Density at 15 ◦C kg/m3 775–840 788 776 866.3Kinetic viscosity at −20 ◦C cSt <8 6.52 3.30 -
Flash point ◦C >38 55 48.5 105Freezing point ◦C <−47 −16 - −50
Lower heating value MJ/kg >42.8 43.5 - -
It can be seen that the kinematic viscosities and densities of the bio-jet fuel is lower thanthe maximum value provided by the ASTM D1655 standard (<8 cSt and 775–840 kg/m3,respectively). The measurement of kinematic viscosity and density of fuel are importantand should be within the acceptable limits established in the standard to avoid clogging inthe fuel injectors and to achieve good fuel atomization. From the table, it is noticed thatthe density and kinematic viscosity of the bio-jet fuel in this study is higher compared tosoybean, but lower than palm. The lower heating value of the bio-jet fuel in this study is43.5 MJ/kg, which is well below the limit given in the ASTM D1655 standard, slightly lowerthan that for diesel (>42.8 MJ/kg). The flashpoint of the bio-jet fuel from FAEE coconut oilis 55 ◦C, which is significantly higher than the limit given in the ASTM D1655 (>38 ◦C). Theflashpoint is higher than soybean, and much lower than the palm. As shown, bio-jet fuelobtained in the current study does not meet the criteria for the freezing point. A similarresult has been reported by [42]. This showed that freezing point is the biggest challenge forbio-jet fuel technologies. This might be because bio-jet fuel consists of nearly no aromaticsor cycloalkanes that are required for jet fuel [54]. Freezing point is one of the propertiesthat affects the operability of bio-jet fuel at low temperature. Hence, further upgrading orblending is needed to bring down the freezing point and improve its jet fuel characteristics.Cheng and Brewer [55] suggested that blending of bio-jet fuel with alkyl-benzens might bethe best, as it has a low molecular weight and emit less soot combustion as compared toother aromatics compounds. However, the effect of different aromatic compounds on thefreezing point of bio-jet fuel has not been explored. As this objective is beyond the scope ofthis paper, it is suggested as a future work.
4. Conclusions
Other than the depletion issue of non-renewable fossil fuel, the increasing greenhousegas emission has also driven the aviation industry toward sustainable development, suchas exploration and commercialization of alternative renewable aviation fuels. This paperhas investigated the effect of three parameters, including coconut oil to ethanol molar ratio,reaction time, and microwave power, on bio-jet fuel production. Bio-jet fuel productiondata was modeled using RSM and ANN. Statistical analysis proved that the ANN modelingwas better than RSM. The optimal parameters predicted using ANN- ACO were, ethanolto oil molar ratio: 1:9.25, reaction time: 12.66 min and microwave power 74.8 W. Optimalyield of 74.45% were obtained experimentally in this optimal parameter conditions. Lastly,it was found that the bio-jet fuel collected in this work had comparable properties with theASTM D1655, except freezing point. Hence, the aromatic additive is suggested to be addedfor properties enhancement. Besides, future work on evaluating the effect of catalyst anddeoxygenation method on the improvement of bio-jet fuel properties will be conducted.
98

Energies 2021, 14, 295
Author Contributions: Conceptualization, S.N. and M.Y.O.; methodology, M.Y.O., F.K. and R.M.H.R.S.;software, M.Y.O. and F.K.; validation, R.M.H.R.S. and F.K.; resources, F.K.; data curation, R.M.H.R.S.;writing—original draft preparation, M.Y.O.; writing—review and editing, M.Y.O., F.K. and S.N.; super-vision, S.N.; funding acquisition, A.H.S. All authors have read and agreed to the published version ofthe manuscript.
Funding: This research was funded by AAIBE Chair of Renewable Energy (Project code: 202006KET-THA) and BOLD 2020 research grant (grant number: RJO010517844/116) under iRMC, UNITEN.
Institutional Review Board Statement: Not applicable.
Informed Consent Statement: Not applicable.
Data Availability Statement: The data presented in this study are available in Ong, M.Y.; No-manbhay, S.; Kusumo, F.; Shahruzzaman, R.M.H.R.; Shamsuddin, A.H. Modeling and Optimizationof Microwave-Based Bio-Jet Fuel from Coconut Oil: Investigation of Response Surface Method-ology (RSM) and Artificial Neural Network Methodology (ANN). Energies 2021, 14, x. https://doi.org/10.3390/xxxxx.
Acknowledgments: The authors would like to acknowledge UNITEN for the research facilities.M.Y.O would also like to thank UNITEN for the UNITEN Postgraduate Excellence Scholarship 2019(YCU-COGS).
Conflicts of Interest: The authors declare no conflict of interest.
References
1. Malaysiakini Ten Years Before Known Oil, Gas Reserves Run Dry 2019. Available online: https://www.malaysiakini.com/news/467781 (accessed on 24 June 2020).
2. Silitonga, A.S.S.; Masjuki, H.H.H.; Ong, H.C.; Sebayang, A.H.H.; Dharma, S.; Kusumo, F.; Siswantoro, J.; Milano, J.; Daud, K.;Mahlia, T.M.I.M.I.; et al. Evaluation of the engine performance and exhaust emissions of biodiesel-bioethanol-diesel blends usingkernel-based extreme learning machine. Energy 2018, 159, 1075–1087. [CrossRef]
3. Holtsmark, N.; Agheb, E.; Molinas, M.; Høidalen, H.K. High frequency wind energy conversion system for offshore DC collectiongrid—Part II: Efficiency improvements. Sustain. Energy Grids Netw. 2016, 5, 177–185. [CrossRef]
4. Heriche, H.; Rouabah, Z.; Bouarissa, N. High-efficiency CIGS solar cells with optimization of layers thickness and doping. Opt.Int. J. Light Electron. Opt. 2016, 127, 11751–11757. [CrossRef]
5. Saifuddin, N.; Ong, M.Y.; Priatharsini, P. Optimization of photosynthetic hydrogen gas production by green alga in sulfurdeprived condition. Indian J. Sci. Technol. 2016, 9, 1–13. [CrossRef]
6. Abdul Latif, N.I.S.; Ong, M.Y.; Nomanbhay, S. Hydrothermal liquefaction of Malaysia’s algal biomass for high-quality bio-oilproduction. Eng. Life Sci. 2019, 19, 246–269. [CrossRef]
7. Mazaheri, H.; Ong, H.C.; Masjuki, H.H.; Amini, Z.; Harrison, M.D.; Wang, C.-T.; Kusumo, F.; Alwi, A. Rice bran oil basedbiodiesel production using calcium oxide catalyst derived from Chicoreus brunneus shell. Energy 2018, 144, 10–19. [CrossRef]
8. Mahlia, T.M.I.; Syazmi, Z.A.H.S.; Mofijur, M.; Abas, A.E.P.; Bilad, M.R.; Ong, H.C.; Silitonga, A.S. Patent landscape review onbiodiesel production: Technology updates. Renew. Sustain. Energy Rev. 2020, 118, 109526. [CrossRef]
9. Salman, B.; Ong, M.Y.; Nomanbhay, S.; Salema, A.A.; Sankaran, R.; Show, P.L. Thermal analysis of nigerian oil palm biomass withsachet-water plasticwastes for sustainable production of biofuel. Processes 2019, 7, 475. [CrossRef]
10. Mohd Mokhta, Z.; Ong, M.Y.; Salman, B.; Nomanbhay, S.; Salleh, S.F.; Chew, K.W.; Show, P.L.; Chen, W.H. Simulation studies onmicrowave-assisted pyrolysis of biomass for bioenergy production with special attention on waveguide number and location.Energy 2020, 190, 116474. [CrossRef]
11. Rahman, S.M.A.; Fattah, I.M.R.; Maitra, S.; Mahlia, T.M.I. A ranking scheme for biodiesel underpinned by critical physicochemicalproperties. Energy Convers. Manag. 2021, 229, 113742. [CrossRef]
12. Ong, H.C.; Masjuki, H.H.; Mahlia, T.M.I.; Silitonga, A.S.; Chong, W.T.; Leong, K.Y. Optimization of biodiesel production andengine performance from high free fatty acid Calophyllum inophyllum oil in CI diesel engine. Energy Convers. Manag. 2014, 81,30–40. [CrossRef]
13. Silitonga, A.S.; Hassan, M.H.; Ong, H.C.; Kusumo, F. Analysis of the performance, emission and combustion characteristics of aturbocharged diesel engine fuelled with Jatropha curcas biodiesel-diesel blends using kernel-based extreme learning machine.Environ. Sci. Pollut. Res. 2017, 24, 25383–25405. [CrossRef] [PubMed]
14. IEA. Electricity Information 2019; OECD: Paris, France, 2019.15. Ong, H.C.; Milano, J.; Silitonga, A.S.; Hassan, M.H.; Shamsuddin, A.H.; Wang, C.T.; Indra Mahlia, T.M.; Siswantoro, J.; Kusumo, F.;
Sutrisno, J. Biodiesel production from Calophyllum inophyllum-Ceiba pentandra oil mixture: Optimization and characterization.J. Clean. Prod. 2019, 219, 183–198. [CrossRef]
99

Energies 2021, 14, 295
16. Silitonga, A.S.; Shamsuddin, A.H.; Mahlia, T.M.I.; Milano, J.; Kusumo, F.; Siswantoro, J.; Dharma, S.; Sebayang, A.H.; Masjuki,H.H.; Ong, H.C. Biodiesel synthesis from Ceiba pentandra oil by microwave irradiation-assisted transesterification: ELMmodeling and optimization. Renew. Energy 2020, 146, 1278–1291. [CrossRef]
17. Ong, H.C.; Masjuki, H.H.; Mahlia, T.M.I.; Silitonga, A.S.; Chong, W.T.; Yusaf, T. Engine performance and emissions using Jatrophacurcas, Ceiba pentandra and Calophyllum inophyllum biodiesel in a CI diesel engine. Energy 2014, 69, 427–445. [CrossRef]
18. Gholami, A.; Pourfayaz, F.; Maleki, A. Recent Advances of Biodiesel Production Using Ionic Liquids Supported on NanoporousMaterials as Catalysts: A Review. Front. Energy Res. 2020, 8, 144. [CrossRef]
19. ATAG. Aviation Benefits beyond Borders; Air Transport Action Group: Geneva, Switzerland, 2018.20. Jeff, O. Fact Sheet: The Growth in Greenhouse Gas Emissions from Commercial Aviation; Environmental and Energy Study Institute:
Washington, DC, USA, 2019.21. Gutiérrez-Antonio, C.; Gómez-Castro, F.I.; de Lira-Flores, J.A.; Hernández, S. A review on the production processes of renewable
jet fuel. Renew. Sustain. Energy Rev. 2017, 79, 709–729. [CrossRef]22. Llamas, A.; García-Martínez, M.J.; Al-Lal, A.M.; Canoira, L.; Lapuerta, M. Biokerosene from coconut and palm kernel oils:
Production and properties of their blends with fossil kerosene. Fuel 2012, 102, 483–490. [CrossRef]23. Wang, W.C.; Tao, L. Bio-jet fuel conversion technologies. Renew. Sustain. Energy Rev. 2016, 53, 801–822. [CrossRef]24. Wang, M.; Chen, M.; Fang, Y.; Tan, T. Highly efficient conversion of plant oil to bio-aviation fuel and valuable chemicals by combination
of enzymatic transesterification, olefin cross-metathesis, and hydrotreating. Biotechnol. Biofuels 2018, 11, 30. [CrossRef]25. Nomanbhay, S.; Ong, M.Y. A Review of Microwave-Assisted Reactions for Biodiesel Production. Bioengineering 2017, 4, 57. [CrossRef]26. Yusoff, M.F.M.; Xu, X.; Guo, Z. Comparison of fatty acid methyl and ethyl esters as biodiesel base stock: A review on processing
and production requirements. JAOCS J. Am. Oil Chem. Soc. 2014, 91, 525–531. [CrossRef]27. Mendow, G.; Veizaga, N.S.; Sánchez, B.S.; Querini, C.A. Biodiesel production by two-stage transesterification with ethanol.
Bioresour. Technol. 2011, 102, 10407–10413. [CrossRef]28. Kishi, A.; Shironita, S.; Umeda, M. H2O2 detection analysis of oxygen reduction reaction on cathode and anode catalysts for
polymer electrolyte fuel cells. J. Power Sources 2012, 197, 88–92. [CrossRef]29. Encinar, J.M.; González, J.F.; Rodríguez, J.J.; Tejedor, A. Biodiesel fuels from vegetable oils: Transesterification of Cynara
cardunculus L. Oils with ethanol. Energy Fuels 2002, 16, 443–450. [CrossRef]30. Verma, P.; Sharma, M.P. Comparative analysis of effect of methanol and ethanol on Karanja biodiesel production and its
optimisation. Fuel 2016, 180, 164–174. [CrossRef]31. Dev, S.R.S.; Gariepy, Y.; Orsat, V.; Raghavan, G.S.V. FDTD modeling and simulation of microwave heating of in-shell eggs. Prog.
Electromagn. Res. M 2010, 13, 229–243. [CrossRef]32. Ong, M.Y.; Nomanbhay, S. Design and Modeling of an Enhanced Microwave Reactor for Biodiesel Production. Int. J. Sci. Res.
Publ. 2018, 8, 527–534. [CrossRef]33. Wahidin, S.; Idris, A.; Yusof, N.M.; Kamis, N.H.H.; Shaleh, S.R.M. Optimization of the ionic liquid-microwave assisted one-step
biodiesel production process from wet microalgal biomass. Energy Convers. Manag. 2018, 171, 1397–1404. [CrossRef]34. Patil, P.D.; Reddy, H.; Muppaneni, T.; Ponnusamy, S.; Cooke, P.; Schuab, T.; Deng, S. Microwave-mediated non-catalytic
transesterification of algal biomass under supercritical ethanol conditions. J. Supercrit. Fluids 2013, 79, 67–72. [CrossRef]35. Silitonga, A.; Mahlia, T.; Shamsuddin, A.; Ong, H.; Milano, J.; Kusumo, F.; Sebayang, A.; Dharma, S.; Ibrahim, H.; Husin, H.;
et al. Optimization of Cerbera manghas Biodiesel Production Using Artificial Neural Networks Integrated with Ant ColonyOptimization. Energies 2019, 12, 3811. [CrossRef]
36. Oloko-Oba, M.I.; Taiwo, A.E.; Ajala, S.O.; Solomon, B.O.; Betiku, E. Performance evaluation of three different-shaped bio-digestersfor biogas production and optimization by artificial neural network integrated with genetic algorithm. Sustain. Energy Technol.Assess. 2018, 26, 116–124. [CrossRef]
37. Ishola, N.B.; Okeleye, A.A.; Osunleke, A.S.; Betiku, E. Process modeling and optimization of sorrel biodiesel synthesis usingbarium hydroxide as a base heterogeneous catalyst: Appraisal of response surface methodology, neural network and neuro-fuzzysystem. Neural Comput. Appl. 2019, 31, 4929–4943. [CrossRef]
38. Dharma, S.; Masjuki, H.H.; Ong, H.C.; Sebayang, A.H.; Silitonga, A.S.; Kusumo, F.; Mahlia, T.M.I. Optimization of biodieselproduction process for mixed Jatropha curcas-Ceiba pentandra biodiesel using response surface methodology. Energy Convers.Manag. 2016, 115, 178–190. [CrossRef]
39. Kusumo, F.; Mahlia, T.M.I.; Shamsuddin, A.H.; Ong, H.C.; Ahmad, A.R.; Ismail, Z.; Ong, Z.C.; Silitonga, A.S. The effect ofmulti-walled carbon nanotubes-additive in physicochemical property of rice brand methyl ester: Optimization analysis. Energies2019, 12, 3291. [CrossRef]
40. Sebayang, A.H.; Masjuki, H.H.; Ong, H.C.; Dharma, S.; Silitonga, A.S.; Kusumo, F.; Milano, J. Optimization of bioethanol productionfrom sorghum grains using artificial neural networks integrated with ant colony. Ind. Crops Prod. 2017, 97, 146–155. [CrossRef]
41. Chandra Mohan, B.; Baskaran, R. A survey: Ant Colony Optimization based recent research and implementation on severalengineering domain. Expert Syst. Appl. 2012, 39, 4618–4627. [CrossRef]
42. Truong, N.T.T.; Boontawan, A. Development of Bio-Jet Fuel Production Using Palm Kernel Oil and Ethanol. Int. J. Chem. Eng.Appl. 2017, 8, 153–161. [CrossRef]
100

Energies 2021, 14, 295
43. Milano, J.; Ong, H.C.; Masjuki, H.H.; Silitonga, A.S.; Kusumo, F.; Dharma, S.; Sebayang, A.H.; Cheah, M.Y.; Wang, C.T.Physicochemical property enhancement of biodiesel synthesis from hybrid feedstocks of waste cooking vegetable oil and Beautyleaf oil through optimized alkaline-catalysed transesterification. Waste Manag. 2018, 80, 435–449. [CrossRef]
44. Ong, M.Y.; Chew, K.W.; Show, P.L.; Nomanbhay, S. Optimization and kinetic study of non-catalytic transesterification of palm oilunder subcritical condition using microwave technology. Energy Convers. Manag. 2019, 196, 1126–1137. [CrossRef]
45. Silitonga, A.S.; Mahlia, T.M.I.; Kusumo, F.; Dharma, S.; Sebayang, A.H.; Sembiring, R.W.; Shamsuddin, A.H. Intensification ofReutealis trisperma biodiesel production using infrared radiation: Simulation, optimisation and validation. Renew. Energy 2019,133, 520–527. [CrossRef]
46. Binnal, P.; Amruth, A.; Basawaraj, M.P.; Chethan, T.S.; Murthy, K.R.S.; Rajashekhara, S. Microwave-assisted esterification andtransesterification of dairy scum oil for biodiesel production: Kinetics and optimisation studies. Indian Chem. Eng. 2020. [CrossRef]
47. Encinar, J.M.; González, J.F.; Sabio, E.; Ramiro, M.J. Preparation and properties of biodiesel from Cynara cardunculus L. oil. Ind.Eng. Chem. Res. 1999, 38, 2927–2931. [CrossRef]
48. Lee, J.S.; Saka, S. Biodiesel production by heterogeneous catalysts and supercritical technologies. Bioresour. Technol. 2010, 101,7191–7200. [CrossRef]
49. Saifuddin, A.; Chua, K.H. Production of Ethyl Ester (Biodiesel) from Used Frying Oil: Optimization of Transesterification ProcessUsing Microwave Irradiation. MJ. Chem. 2004, 6, 77–82.
50. Oyerinde, A.; Bello, E. Use of Fourier Transformation Infrared (FTIR) Spectroscopy for Analysis of Functional Groups in PeanutOil Biodiesel and Its Blends. Br. J. Appl. Sci. Technol. 2016, 13, 1–14. [CrossRef]
51. Jimoh, A.; Abdulkareem, A.S.; Afolabi, A.S.; Odigure, J.O.; Odili, U.C. Production and Characterization of Biofuel from RefinedGroundnut Oil. In Energy Conservation; InTech: London, UK, 2012; pp. 10–12.
52. Saifuddin, N.; Refal, H. Spectroscopic Analysis of Structural Transformation in Biodiesel Degradation. Res. J. Appl. Sci. Eng.Technol. 2014, 8, 1149–1159. [CrossRef]
53. Rabaev, M.; Landau, M.V.; Vidruk-Nehemya, R.; Koukouliev, V.; Zarchin, R.; Herskowitz, M. Conversion of vegetable oils onPt/Al2O3/SAPO-11 to diesel and jet fuels containing aromatics. Fuel 2015, 161, 287–294. [CrossRef]
54. Amanda, B. The Future of Advanced Bio-Jet Fuel; Linköping University: Linköping, Sweden, 2017.55. Cheng, F.; Brewer, C.E. Producing jet fuel from biomass lignin: Potential pathways to alkyl-benzenes and cycloalkanes. Renew.
Sustain. Energy Rev. 2017, 72, 673–722. [CrossRef]
101

energies
Article
Weather-Driven Scenario Analysis for Decommissioning CoalPower Plants in High PV Penetration Grids
Samuel Matthew G. Dumlao * and Keiichi N. Ishihara
���������������
Citation: Dumlao, S.M.G.;
Ishihara, K.N. Weather-Driven
Scenario Analysis for
Decommissioning Coal Power Plants
in High PV Penetration Grids.
Energies 2021, 14, 2389. https://
doi.org/10.3390/en14092389
Academic Editors: T M Indra Mahlia
and Islam Md Rizwanul Fattah
Received: 29 March 2021
Accepted: 19 April 2021
Published: 22 April 2021
Publisher’s Note: MDPI stays neutral
with regard to jurisdictional claims in
published maps and institutional affil-
iations.
Copyright: © 2021 by the authors.
Licensee MDPI, Basel, Switzerland.
This article is an open access article
distributed under the terms and
conditions of the Creative Commons
Attribution (CC BY) license (https://
creativecommons.org/licenses/by/
4.0/).
Department of Socio-Environmental Energy Science, Graduate School of Energy Science, Kyoto University,Yoshidahonmachi, Sakyo-ku, Kyoto 606-8501, Japan; [email protected]* Correspondence: [email protected]
Abstract: Despite coal being one of the major contributors of CO2, it remains a cheap and stablesource of electricity. However, several countries have turned to solar energy in their goal to “green”their energy generation. Solar energy has the potential to displace coal with support from natural gas.In this study, an hourly power flow analysis was conducted to understand the potential, limitations,and implications of using solar energy as a driver for decommissioning coal power plants. Toensure the results’ robustness, the study presents a straightforward weather-driven scenario analysisthat utilizes historical weather and electricity demand to generate representative scenarios. Thisapproach was tested in Japan’s southernmost region, since it represents a regional grid with high PVpenetration and a fleet of coal plants older than 40 years. The results revealed that solar power coulddecommission 3.5 GW of the 7 GW coal capacity in Kyushu. It was discovered that beyond 12 GW,solar power could not reduce the minimum coal capacity, but it could still reduce coal generation.By increasing the solar capacity from 10 GW to 20 GW and the LNG quota from 10 TWh to 28 TWh,solar and LNG electricty generation could reduce the emissions by 37%, but the cost will increase by5.6%. Results also show various ways to reduce emissions, making the balance between cost and CO2
a policy decision. The results emphasized that investing in solar power alone will not be enough,and another source of energy is necessary, especially for summer and winter. The weather-drivenapproach highlighted the importance of weather in the analysis, as it affected the results to varyingdegrees. The approach, with minor changes, could easily be replicated in other nations or regionsprovided that historical hourly temperature, irradiance, and demand data are available.
Keywords: scenario analysis; scenario generation; weather influence; coal decommissioning; highPV penetration; energy balance; CO2 reduction
1. Introduction
In 2013, signatories to the Paris Agreement committed to submit a national climateplan to mitigate climate change by reducing greenhouse gas emissions. Subsequently, oneof the United Nations’ Sustainable Development Goals, established in 2015, is focused onaffordable and clean energy. These two global initiatives have motivated several nations topromote renewable energy sources such as wind, solar, and biomass into their energy mix.As a result, several “green energy transition” initiatives are ongoing in countries such asGermany and Denmark, and subnational jurisdictions such as California, Scotland, andSouth Australia [1]. Besides these major players, more than 150 countries have nationaltargets for renewable energy in the power sector [2].
The Japanese government recently reiterated its commitment to the projected energymix for 2030, where fossil fuel-based generation will be reduced to 46%, and renewableenergy will comprise 22–24%, of which solar energy will have a 7% contribution [3]. Therewas a recent influx of solar PV installation mainly driven by the FIT program. The Kyushuregion, located on Japan’s western tip, is one of the country’s leading regions in solar PVgeneration. Relative to the rest of the country, the region has higher solar power potential
Energies 2021, 14, 2389. https://doi.org/10.3390/en14092389 https://www.mdpi.com/journal/energies
103

Energies 2021, 14, 2389
and cheaper land, which has driven solar power investments. As of early 2021, the regionhas a total installed capacity of 10 GW, and additional plants, which will increase thiscapacity further to roughly 16 GW [4] by around 2027, are already approved. The shareof solar PV generation has been steadily increasing in the region. In 2017, 2018, and 2019,solar PV generation accounted for 8.5%, 9.2%, and 10.1% of the total yearly generation,respectively. The International Energy Agency (IEA) classifies the impact of variablerenewable energy (VRE) on the energy system’s operation into four phases. Japan, as acountry, is already in phase 2 where there is a minor to moderate impact on the systemoperation, whereas Kyushu, as a region, was categorized as phase 3, where VRE determinesthe operation pattern of the system [5]. This further shows that Kyushu is leading thecountry in terms of solar PV penetration and is already facing issues ahead of the rest ofthe country. Kyushu’s situation lends itself as a viable case study in exploring the potentialimpact of solar energy in reducing CO2 emissions by replacing traditional energy sourceswith solar energy.
Coal remains to be the cheapest and most economically stable source of electricity formany countries. However, it is also one of the major contributors of CO2, which leads toglobal warming. Among the G7 countries, Germany (by 2038 [6]), France (by 2023 [7]), theUnited Kingdom (by 2024 [7]), Italy (by 2025 [7]), and Canada (by 2030 [8]) have presentedtheir coal phase-out plans. Other European Union member countries have also developedtheir phase-out plans within the next two decades, and Austria and Belgium have alreadyphased-out their coal plants [7]. Nonetheless, removing coal is a significant roadblock tothe green energy transition in many countries, and as countries install increasing amountsof renewable energy, it might be time to consider reducing coal in the energy mix. Solarphotovoltaics (PV) can be a green alternative to coal. However, the generation profileof solar energy is different from that of coal, which complicates the process of replacingcoal with solar energy. Simultaneously, the variability of solar power requires anotherflexible source. Liquefied petroleum gas (LNG), given its flexibility, is often used to balancethe VRE. Given these intertwined variables, it is necessary to understand the potential,limitations, and implications of using solar energy to replace coal, which are currentlyunclear.
Many countries see LNG as a bridge to a clean energy future that will pave the wayfor less coal in the energy mix [9]. It is still a fossil fuel, but it produces less CO2, whichis acceptable for now until a superior technology is available. Due to many countries’tendency to rely on LNG to reduce their CO2 emissions, the demand for LNG has steadilybeen increasing, which threatens its supply and price. Shell reported in their LNG Outlook2020 that global demand for LNG increased by 12.5% to 359 million tons in 2019, whichthey attributed mainly to the role of LNG in the low-carbon energy transition [10]. It hasbeen reported that the price of LNG increased in October 2020 in anticipation of a colderwinter in East Asia [11]. This shows the volatility of LNG’s supply and price on the globalmarket, which presents another factor for consideration in the analysis, since solar energyproduction needs LNG to a certain extent.
Aside from the potential CO2 reduction benefits, reducing coal capacity could alsoreduce solar curtailment experienced by grids with high PV penetration. Kyushu startedto suffer from curtailment in October 2018, which was explored in a previous study [12].Several studies have also explored this recent issue in Kyushu. Bunodiere and Lee [13]explored several scenarios to mitigate solar curtailment in Kyushu using a logic-basedforecasting method and concluded that reducing the region’s nuclear capacity will reducecurtailment. However, in their approach, they considered coal and LNG as thermalgenerators as a whole due to data limitations. A coal station behaves like a nuclear plant,since these two technologies are considered baseload generators. By treating coal asseparate from LNG and as a baseload generator, it could also be said that coal could reducecurtailment. Although Japan initially used their pump hydro energy storage (PHES) toimprove the flexibility of nuclear power plants [14], it is now used to store excess solarelectricity generation. Li et al. [15] conducted a techno-economic assessment of large-scale
104
Energies 2021, 14, 2389
PV integration with PHES and concluded that the PHES could effectively absorb some ofthe surplus PV production and could maintain low generation cost by using the surplusproduction. Since the available data regarding power generation in the region aggregatecoal and LNG together, the understanding of coal generation in the energy balance islimited.
In order to fully understand the optimal conditions for coal, solar, and LNG produc-tion, it is necessary to conduct a power flow analysis to evaluate the impact of investingin more solar PV for driving coal decommissioning. This analysis will provide additionalinformation about the energy balance, including information about solar power generationand curtailment, which are difficult to estimate. By gathering the generators’ capacity andgeneration profiles and the demand profiles, the optimization can calculate the hourlyenergy balance and minimize the necessary coal capacity and generation. This insightprovides the necessary understanding of the potential and limitations of solar energy inregard to replacing coal. However, to ensure the robustness of the analysis and the recom-mendation, the demand and solar power generation’s stochasticity must be considered.It will be challenging to recommission a decommissioned plant due to an unforeseencircumstance; thus, careful analysis is necessary to account for potential variations.
Replacing part of coal’s electricity production with solar electricity production, cou-pled with LNG electricity production, is a subset of the generation expansion planning(GEP) problem. Koltsaklis and Dagoumas [16] wrote a review article exploring the state-of-the-art generation expansion planning where they listed seven challenges to the GEPproblem. One of the mentioned challenges is rooted in the risks involved in GEP. Theyenumerated several potential sources of risks and categorized them according to eco-nomic, political, regulatory, environmental, technical, social, and climate categories. Ioan-nou et al. [17] reviewed the risk-based methods for sustainable energy system planningand categorized the risks in the same manner. They identified seven risk-based methods:mean-variance portfolio theory, real option analysis, Monte Carlo simulation, stochasticoptimization technique, multi-criteria decision analysis, and scenario analysis.
Santos et al. [18] conducted a study to identify uncertainties in the electricity systemand demonstrated the corresponding impacts on the energy mix through scenario analysis.Their results highlighted that climate uncertainty represents primary risk sources for VRE,since it dictates the system’s power generation. A review on the energy sector vulnerabilityto climate change [19] summarizes the authors’ contributions on climate and energy, andthey noted that climate change could affect variables that influence electricity generationfrom photovoltaics and concentrated solar power. The review highlighted that global solarradiation has increased in southeastern Europe [20] and decreased in Canada [21]. Theyalso highlighted that power output calculations should account for air temperature, sinceit impacts the solar cell’s efficiency [19].
Ioannou et al. [17] noted that energy planning has extensively used stochastic opti-mization techniques, and the stakeholder’s motivation mainly drives the constraints. Theyalso mentioned that the Monte Carlo simulation has many advantages, but it requiresconsiderable data inputs to create probability density functions. Alternatively, scenarioanalysis evaluates the risks by creating potential future developments that range from theworst-case to the best-case scenario, which could then cover all the possible risks in theanalysis. As highlighted by several authors [18–21], climate, and by extension weather,must be considered in modeling solar energy generation. Factors such as the changing solarirradiance and ambient temperature could influence solar panels’ variability and efficiency.
By carefully identifying the test cases, scenario analysis is sufficient for ensuring therobustness of the analysis. The initial problem is then rooted in creating the scenariosrepresenting the worst case, the best case, and the cases in between. The weather dataanalysis can provide the representative years that fit the scenario targets, such as warmsummers, colder winters, extreme summers, and extreme winters. Although such dataare limited, datasets could be synthesized based on the historical relationship betweentemperature and demand. Solar generation could be calculated from the irradiance and
105

Energies 2021, 14, 2389
ambient temperature data. The robustness of the analysis and recommendation can beaddressed by combining scenario analysis and past weather data.
Therefore, in this study, an hourly power flow analysis was conducted to understandthe potential, limitations, and implications of using solar energy as a driver for decom-missioning coal power plants. Understanding these factors can provide the necessaryrecommendations and precautions for energy planners. Since LNG scarcity is anticipated,LNG quota is one of the primary constraints. In order to ensure the robustness of theresults, this study presents a straightforward weather-driven scenario generation thatutilizes historical weather and electricity demand data processed through machine learn-ing algorithms to generate scenarios that account for weather variations. Through theweather-driven approach, the study aims to reveal the impact of yearly variations in thefactors that must be considered for long-term planning that reduce CO2 emissions whileensuring grid reliability. The Kyushu region in Japan was used as a case study since (a) it iscontinuously increasing its solar capacity, (b) it has a fleet of coal power plants older than40 years old ready for decommissioning, and (c) it has enough LNG power plant capacityto support the initial transition.
The code for the weather-driven approach used in this study is available through apublic GitHub repository [22], where most of the code and diagrams used in this paperare documented in jupyter notebooks. The approach, with minor changes, could easilybe replicated in other nations or regions provided that historical hourly temperature,irradiance, and demand data are available.
Section 2 discusses the methodology for the weather-driven approach, including dataand data processing, weather-based data generation, and hourly simulation. The resultsare then presented in Section 3, and the implications are discussed in Section 4. Finally, theconclusions are drawn in Section 5.
2. Methodology
The overview of the proposed weather-driven approach can be seen in Figure 1,where it is divided into four stages. First, data were collected from Kyushu ElectricPower Company (KyEPCO) [4] and Japan Meteorological Agency (JMA) [23] and werepre-processed to fit the intended applications. The weather-based data generation has threecomponents. A weather selection metric was designed based on comfort-levels to identifythe years that could represent the scenarios in the region. The pvlib Python library [24] wasused to calculate the photovoltaic systems’ generation under various weather conditions.A demand fingerprint was developed to generate synthetic demand for the selected years.These synthetic data were then used as input to the hourly power flow optimizationdone in Python for Power System Analysis (PyPSA) [25]. Finally, the simulation resultswere analyzed.
Figure 1. The proposed weather-driven scenario-based analysis approach capable of handling weather-related variations inelectricity demand and solar energy production.
106
Energies 2021, 14, 2389
2.1. Data and Data Pre-Processing2.1.1. Energy Demand
The energy data were collected from Kyushu Electric Company [4], where the hourlyinformation about generation, transmission, and demand is published since April 2016.The data also include curtailment information for both solar and wind power. Transmissionand pump hydro energy storage (PHES) could be positive or negative. For transmission,negative values represent energy export while positive values indicate electricity import.For PHES, negative and positive values represent the charging and generation phases,respectively. Although the data until December 2020 are already published, only data untilMarch 2019 were used in the study since this represents four full fiscal years.
As seen in Figure 1, the energy data are used in both the demand fingerprint andsimulation phase. Only the demand data were necessary for the demand fingerprint, whilethe other hourly data were used as parameters for the other generations and PHES.
2.1.2. Temperature and Irradiance
The temperature and irradiance data were collected from the Japan MeteorologicalAgency (JMA) [23], where the hourly weather data are published since 1946. For this study,30 years of data were collected from 1990 to 2019 to serve as reference weather scenarios. Arepresentative temperature was collected from each of the major cities’ weather stations, asshown in Table 1.
Table 1. Weather stations in Kyushu.
Prefecture Prefecture No. Precinct Code Block Code
Fukuoka 40 82 47,807Saga 41 85 47,813Nagasaki 42 84 47,817Kumamoto 43 86 47,819Oita 44 83 47,815Miyazaki 45 87 47,830Kagoshima 46 88 47,827
In order to represent the mean temperature and mean irradiance in the region, solar-capacity-weighted mean and monthly-demand-weighted mean were used for the solargeneration calculation and demand generation, respectively. Using the consolidated datafrom [26], Table 2 shows the shares of the solar PV installation in Kyushu since 2012 and theshares in 2019 were used as the reference for the solar-capacity-weighted mean temperatureand irradiance. The Ministry of Economy, Trade, and Industry (METI) publishes eachprefecture’s monthly energy demand since April 2016 [27]. Table 3 shows the mean ofeach prefecture’s shares from 2016 until 2019. These values were used to calculate themonthly-demand-weighted temperature mean used in the demand fingerprint.
The solar capacity ratio was used for the solar power generation calculation becausethe power generation’s distribution is influenced by the distribution of the capacity. It isnecessary to use this weighted mean because the temperature where more solar panels areinstalled should have a more significant representation in the temperature used in the solargeneration calculation. However, the temperature where there is greater demand shouldhave more influence on the temperature used for demand calculations.
107
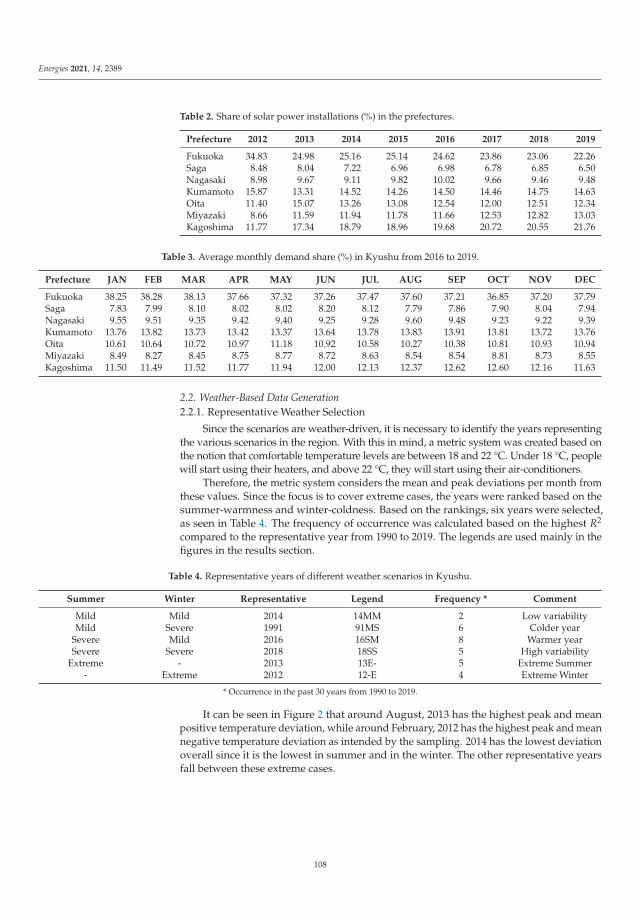
Energies 2021, 14, 2389
Table 2. Share of solar power installations (%) in the prefectures.
Prefecture 2012 2013 2014 2015 2016 2017 2018 2019
Fukuoka 34.83 24.98 25.16 25.14 24.62 23.86 23.06 22.26Saga 8.48 8.04 7.22 6.96 6.98 6.78 6.85 6.50Nagasaki 8.98 9.67 9.11 9.82 10.02 9.66 9.46 9.48Kumamoto 15.87 13.31 14.52 14.26 14.50 14.46 14.75 14.63Oita 11.40 15.07 13.26 13.08 12.54 12.00 12.51 12.34Miyazaki 8.66 11.59 11.94 11.78 11.66 12.53 12.82 13.03Kagoshima 11.77 17.34 18.79 18.96 19.68 20.72 20.55 21.76
Table 3. Average monthly demand share (%) in Kyushu from 2016 to 2019.
Prefecture JAN FEB MAR APR MAY JUN JUL AUG SEP OCT NOV DEC
Fukuoka 38.25 38.28 38.13 37.66 37.32 37.26 37.47 37.60 37.21 36.85 37.20 37.79Saga 7.83 7.99 8.10 8.02 8.02 8.20 8.12 7.79 7.86 7.90 8.04 7.94Nagasaki 9.55 9.51 9.35 9.42 9.40 9.25 9.28 9.60 9.48 9.23 9.22 9.39Kumamoto 13.76 13.82 13.73 13.42 13.37 13.64 13.78 13.83 13.91 13.81 13.72 13.76Oita 10.61 10.64 10.72 10.97 11.18 10.92 10.58 10.27 10.38 10.81 10.93 10.94Miyazaki 8.49 8.27 8.45 8.75 8.77 8.72 8.63 8.54 8.54 8.81 8.73 8.55Kagoshima 11.50 11.49 11.52 11.77 11.94 12.00 12.13 12.37 12.62 12.60 12.16 11.63
2.2. Weather-Based Data Generation2.2.1. Representative Weather Selection
Since the scenarios are weather-driven, it is necessary to identify the years representingthe various scenarios in the region. With this in mind, a metric system was created based onthe notion that comfortable temperature levels are between 18 and 22 °C. Under 18 °C, peoplewill start using their heaters, and above 22 °C, they will start using their air-conditioners.
Therefore, the metric system considers the mean and peak deviations per month fromthese values. Since the focus is to cover extreme cases, the years were ranked based on thesummer-warmness and winter-coldness. Based on the rankings, six years were selected,as seen in Table 4. The frequency of occurrence was calculated based on the highest R2
compared to the representative year from 1990 to 2019. The legends are used mainly in thefigures in the results section.
Table 4. Representative years of different weather scenarios in Kyushu.
Summer Winter Representative Legend Frequency * Comment
Mild Mild 2014 14MM 2 Low variabilityMild Severe 1991 91MS 6 Colder year
Severe Mild 2016 16SM 8 Warmer yearSevere Severe 2018 18SS 5 High variability
Extreme - 2013 13E- 5 Extreme Summer- Extreme 2012 12-E 4 Extreme Winter
* Occurrence in the past 30 years from 1990 to 2019.
It can be seen in Figure 2 that around August, 2013 has the highest peak and meanpositive temperature deviation, while around February, 2012 has the highest peak and meannegative temperature deviation as intended by the sampling. 2014 has the lowest deviationoverall since it is the lowest in summer and in the winter. The other representative yearsfall between these extreme cases.
108
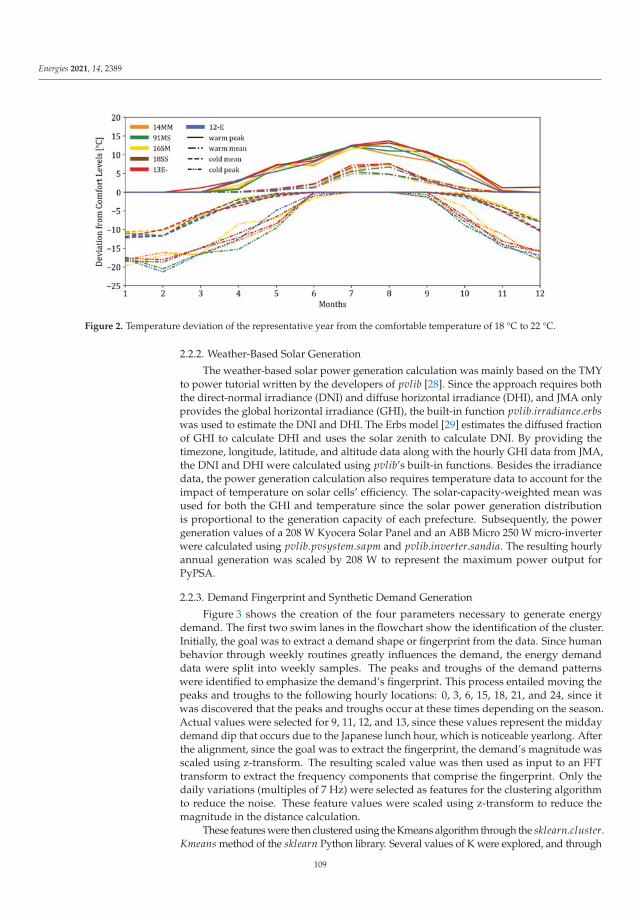
Energies 2021, 14, 2389
Figure 2. Temperature deviation of the representative year from the comfortable temperature of 18 °C to 22 °C.
2.2.2. Weather-Based Solar Generation
The weather-based solar power generation calculation was mainly based on the TMYto power tutorial written by the developers of pvlib [28]. Since the approach requires boththe direct-normal irradiance (DNI) and diffuse horizontal irradiance (DHI), and JMA onlyprovides the global horizontal irradiance (GHI), the built-in function pvlib.irradiance.erbswas used to estimate the DNI and DHI. The Erbs model [29] estimates the diffused fractionof GHI to calculate DHI and uses the solar zenith to calculate DNI. By providing thetimezone, longitude, latitude, and altitude data along with the hourly GHI data from JMA,the DNI and DHI were calculated using pvlib’s built-in functions. Besides the irradiancedata, the power generation calculation also requires temperature data to account for theimpact of temperature on solar cells’ efficiency. The solar-capacity-weighted mean wasused for both the GHI and temperature since the solar power generation distributionis proportional to the generation capacity of each prefecture. Subsequently, the powergeneration values of a 208 W Kyocera Solar Panel and an ABB Micro 250 W micro-inverterwere calculated using pvlib.pvsystem.sapm and pvlib.inverter.sandia. The resulting hourlyannual generation was scaled by 208 W to represent the maximum power output forPyPSA.
2.2.3. Demand Fingerprint and Synthetic Demand Generation
Figure 3 shows the creation of the four parameters necessary to generate energydemand. The first two swim lanes in the flowchart show the identification of the cluster.Initially, the goal was to extract a demand shape or fingerprint from the data. Since humanbehavior through weekly routines greatly influences the demand, the energy demanddata were split into weekly samples. The peaks and troughs of the demand patternswere identified to emphasize the demand’s fingerprint. This process entailed moving thepeaks and troughs to the following hourly locations: 0, 3, 6, 15, 18, 21, and 24, since itwas discovered that the peaks and troughs occur at these times depending on the season.Actual values were selected for 9, 11, 12, and 13, since these values represent the middaydemand dip that occurs due to the Japanese lunch hour, which is noticeable yearlong. Afterthe alignment, since the goal was to extract the fingerprint, the demand’s magnitude wasscaled using z-transform. The resulting scaled value was then used as input to an FFTtransform to extract the frequency components that comprise the fingerprint. Only thedaily variations (multiples of 7 Hz) were selected as features for the clustering algorithmto reduce the noise. These feature values were scaled using z-transform to reduce themagnitude in the distance calculation.
These features were then clustered using the Kmeans algorithm through the sklearn.cluster.Kmeans method of the sklearn Python library. Several values of K were explored, and through
109
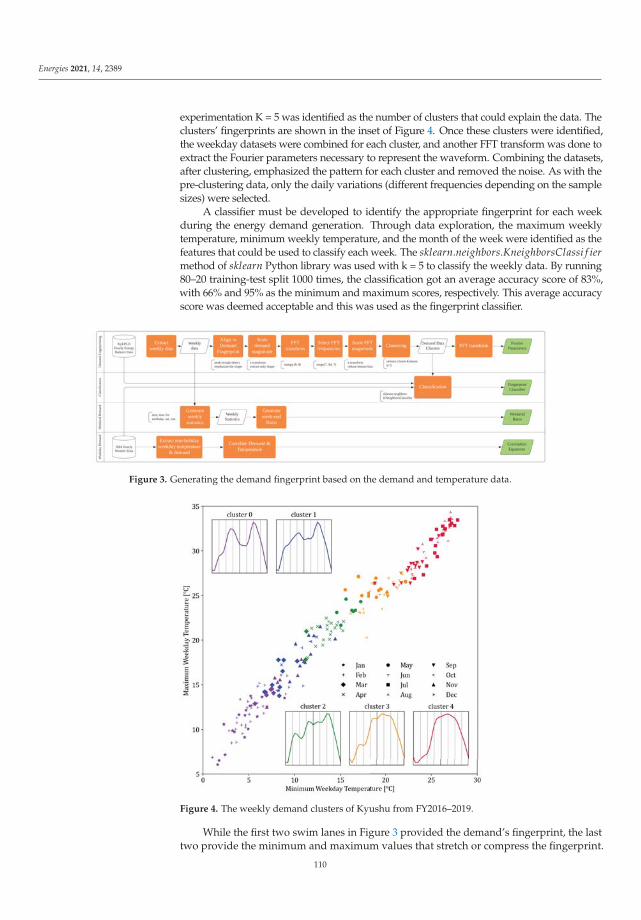
Energies 2021, 14, 2389
experimentation K = 5 was identified as the number of clusters that could explain the data. Theclusters’ fingerprints are shown in the inset of Figure 4. Once these clusters were identified,the weekday datasets were combined for each cluster, and another FFT transform was done toextract the Fourier parameters necessary to represent the waveform. Combining the datasets,after clustering, emphasized the pattern for each cluster and removed the noise. As with thepre-clustering data, only the daily variations (different frequencies depending on the samplesizes) were selected.
A classifier must be developed to identify the appropriate fingerprint for each weekduring the energy demand generation. Through data exploration, the maximum weeklytemperature, minimum weekly temperature, and the month of the week were identified as thefeatures that could be used to classify each week. The sklearn.neighbors.KneighborsClassi f iermethod of sklearn Python library was used with k = 5 to classify the weekly data. By running80–20 training-test split 1000 times, the classification got an average accuracy score of 83%,with 66% and 95% as the minimum and maximum scores, respectively. This average accuracyscore was deemed acceptable and this was used as the fingerprint classifier.
Figure 3. Generating the demand fingerprint based on the demand and temperature data.
Figure 4. The weekly demand clusters of Kyushu from FY2016–2019.
While the first two swim lanes in Figure 3 provided the demand’s fingerprint, the lasttwo provide the minimum and maximum values that stretch or compress the fingerprint.
110

Energies 2021, 14, 2389
Through data exploration, it was observed that non-holiday weekday temperature anddemand have a strong correlation; thus, it was extracted and fitted into known functions.Using scipy.optimize.curve_ f it method of the scipy Python library, as seen in Figure 5, theminimum temperature and minimum demand were fitted to a quadratic curve with an R2
of 0.80. The curve fitting for the maximum temperature and maximum demand required apiece-wise linear equation and was similarly fitted with an R2 of 0.88. The weekend andholiday fitting were explored, but no meaningful functions were derived; thus, a simpleweekday-to-weekend ratio was extracted by averaging all the known values. Seasonalvariations in the ratio were initially explored, but no meaningful trend was seen; thus, theconcept was dropped.
Figure 5. Correlation of Temperature and Demand in Kyushu.
Generating yearly demand based on temperature is shown in Figure 6 where thegreen input blocks represent the models, values, and functions generated from Figure 3,and the red input block represents the weekly temperature statistics from the selected year.Using these inputs, a fingerprint assignment and the minimum and maximum demandper day were identified. The fingerprint is then fitted to the daily min-max demand usingscipy.optimize.curve_ f it method and provides the A0 and B0 coefficient for the Fourierrepresentation. This is done for all weeks of the year to generate the entire year. Testing thisapproach with the known values for 2017, 2018, and 2019, the synthetic demand approachcould get R2 of 0.8675, 0.8714, and 0.8177, respectively. A sample of the demand curvecan be seen in Figure 7, where the demand were closely synthesized. The problem withholidays (e.g., new year) is noticeable and some weekends are not reproduced accurately.However, the general shape or f ingerprint of the demand fits well with the actual values.
Figure 6. Temperature-dependent demand generation.
111

Energies 2021, 14, 2389
Figure 7. Sample demand synthesis for 2018.
2.3. Hourly Simulation and Scenario Analysis
The hourly simulation used Python for the Power System Analysis (PyPSA) ModelingFramework [25]. The PyPSA environment provides a framework for the buses, lines,loads, generators, and storage, units among many other parameters. In this simulation,since Kyushu was modeled as a single point, only one bus was used, and all the loads,generators, and storage units were connected directly to this bus. The single-bus networkwas constructed based on Figure 8, where the coal generator, the Kyushu demand, and thetransmission demand were directly connected to a single bus. The rest of the generatorswas then connected to a sub-bus, which was then connected to the main bus. Creating thesub-bus ensured that the PHES could not charge from the coal generator, which preventedthe optimizer from generating and storing more power from coal for later use. For thisstudy, the synthetic load and solar power generation profile for the representative years(Table 4) were used iteratively during the optimization.
Figure 8. Configuration of the single-bus network used in the optimization.
The installed solar capacity was increased by 1 GW increments from 0 GW until20 GW. The latest known capacities for the other generators as of FY2019 are shownin Table 5, which was consolidated based on various sources [27,30,31]. Although thenuclear, geothermal, and biomass could change within the year, as a baseload, they werefixed to their respective maximum capacities to provide consistency throughout the yearsunder simulation. Hydropower generation was based on the daily dispatch capacitycalculated using the total daily dispatch in the 2019 data. The simulator allocated thehourly dispatch based on the optimization. However, minimum and maximum dispatchwere still considered based on the actual data. The PHES was treated as both a generatorand a load with a maximum transfer capacity of 2.3 GW, a total capacity of 13.8 GWh, andround trip efficiency of 0.70% (0.84% one way).
112

Energies 2021, 14, 2389
Table 5. Generators in Kyushu as of FY2019.
Generator Power (MW) Carrier Outputmin (%) Ramp Limit (%)
Coal 7037 Coal 30 1LNG 5250 Gas 15 40Geothermal 160 Renewable 100 0Biomass 450 Renewable 100 0Solar 9000 Renewable 0 100Nuclear 4140 Non-GHG 100 0Wind 355 Renewable 15 40Hydro 4000 Renewable 15 40
The optimization aims to minimize the coal capacity while ensuring energy balance.The hourly resolution was used due to the limitation of the available data. Solar energy ispreferred as long as the minimum operating output or ramp limit seen in Table 5 for coaland LNG are satisfied. Since LNG might become a future bottleneck, LNG quota (in TWh)is used as a constraint in the simulation. LNG quota (LNGTWh
quota) is defined as the maximumtotal annual electricity generation used in the optimization with the maximum generationcapacity of 5.25 GW.
Using the recently published resource utilization data from KyEPCO [32], it wasdetermined that the company generated 8 TWh from LNG in 2019 through their 4.625 GWLNG plants. This generation represents 20% LF for the company. An independent powerproducer owns the other 0.625 GW LNG power plants in the region, which are composed ofmixed gas power generators. Assuming these IPP plants are running at a higher LF of 40%,it was determined that the LNG plants generated around 10 TWh in 2019. Using 10 TWhas the base case, the simulation gradually incremented the LNG quota by 20%, 60%, and100%, yielding 12, 16, 20 TWh LNG quota. A report from Japan’s Ministry of Economy,Trade, and Industry (METI) [33] showed that LNG is more economical than coal at LF <60%; thus, the scenario analysis also explored 28 TWh (60% LF). Preliminary explorationalso showed that increasing the quota further has a minor impact on the emission and costunless more LNG capacity is installed; thus, this was not explored any further. AdditionalLNG quota could also increase energy security risk given the LNG market situation.
A summary of the LNG quota scenarios is shown in Table 6. The scenarios (LNGTWhquota2–
LNGTWhquota4) reflects one way to reach each of the identified quota from the base case
(LNGTWhquota1). For the 12, 16, and 20 TWh scenarios, KyEPCO could increase their effi-
cient power plants’ LF. Increasing it further would require KyEPCO to increase their steamLNG plants’ LF plants and coordinate with the IPP to increase their production.
Table 6. LNG quota scenarios.
LNG Power Plant LNGTWhquota1 LNGTWh
quota2 LNGTWhquota3 LNGTWh
quota4 LNGTWhquota5
Category Cap LF Gen LF Gen LF Gen LF Gen LF Gen
KyEPCO Steam 1800 20 3.15 20 3.15 20 3.15 20 3.15 60 9.46KyEPCO CC 2825 20 4.95 27 6.68 44 10.89 60 14.85 62 15.34IPP 625 40 2.19 40 2.19 40 2.19 40 2.19 60 3.29
Total 5250 10.29 12.03 16.23 20.19 28.09
Capacity (Cap) in MW; load factor (LF) in %; generation (Gen) in TWh.
2.4. Annual Generation Cost and CO2 Emission Analysis
In 2015, Japan’s Ministry of Economy, Trade, and Industry (METI) [34] reported andmodeled the cost of electricity generation for 2014 and 2030. An Advisory Panel to theForeign Minister on Climate Change (MOFA) [35] citing BloombergNEF presented theirestimates on the cost of generation in 2018. Table 7 consolidates these reports along withthe values used for the annual cost calculations. Generally, the cost in 2014 was used in
113
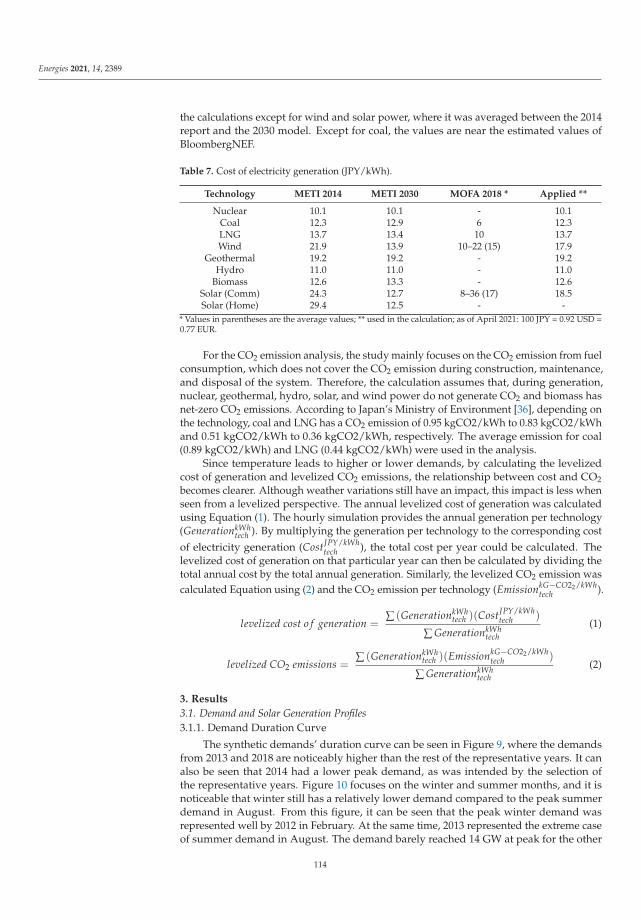
Energies 2021, 14, 2389
the calculations except for wind and solar power, where it was averaged between the 2014report and the 2030 model. Except for coal, the values are near the estimated values ofBloombergNEF.
Table 7. Cost of electricity generation (JPY/kWh).
Technology METI 2014 METI 2030 MOFA 2018 * Applied **
Nuclear 10.1 10.1 - 10.1Coal 12.3 12.9 6 12.3LNG 13.7 13.4 10 13.7Wind 21.9 13.9 10–22 (15) 17.9
Geothermal 19.2 19.2 - 19.2Hydro 11.0 11.0 - 11.0
Biomass 12.6 13.3 - 12.6Solar (Comm) 24.3 12.7 8–36 (17) 18.5Solar (Home) 29.4 12.5 - -
* Values in parentheses are the average values; ** used in the calculation; as of April 2021: 100 JPY = 0.92 USD =0.77 EUR.
For the CO2 emission analysis, the study mainly focuses on the CO2 emission from fuelconsumption, which does not cover the CO2 emission during construction, maintenance,and disposal of the system. Therefore, the calculation assumes that, during generation,nuclear, geothermal, hydro, solar, and wind power do not generate CO2 and biomass hasnet-zero CO2 emissions. According to Japan’s Ministry of Environment [36], depending onthe technology, coal and LNG has a CO2 emission of 0.95 kgCO2/kWh to 0.83 kgCO2/kWhand 0.51 kgCO2/kWh to 0.36 kgCO2/kWh, respectively. The average emission for coal(0.89 kgCO2/kWh) and LNG (0.44 kgCO2/kWh) were used in the analysis.
Since temperature leads to higher or lower demands, by calculating the levelizedcost of generation and levelized CO2 emissions, the relationship between cost and CO2becomes clearer. Although weather variations still have an impact, this impact is less whenseen from a levelized perspective. The annual levelized cost of generation was calculatedusing Equation (1). The hourly simulation provides the annual generation per technology(GenerationkWh
tech ). By multiplying the generation per technology to the corresponding costof electricity generation (CostJPY/kWh
tech ), the total cost per year could be calculated. Thelevelized cost of generation on that particular year can then be calculated by dividing thetotal annual cost by the total annual generation. Similarly, the levelized CO2 emission wascalculated Equation using (2) and the CO2 emission per technology (EmissionkG−CO22/kWh
tech ).
levelized cost o f generation =∑ (GenerationkWh
tech )(CostJPY/kWhtech )
∑ GenerationkWhtech
(1)
levelized CO2 emissions =∑ (GenerationkWh
tech )(EmissionkG−CO22/kWhtech )
∑ GenerationkWhtech
(2)
3. Results
3.1. Demand and Solar Generation Profiles3.1.1. Demand Duration Curve
The synthetic demands’ duration curve can be seen in Figure 9, where the demandsfrom 2013 and 2018 are noticeably higher than the rest of the representative years. It canalso be seen that 2014 had a lower peak demand, as was intended by the selection ofthe representative years. Figure 10 focuses on the winter and summer months, and it isnoticeable that winter still has a relatively lower demand compared to the peak summerdemand in August. From this figure, it can be seen that the peak winter demand wasrepresented well by 2012 in February. At the same time, 2013 represented the extreme caseof summer demand in August. The demand barely reached 14 GW at peak for the other
114

Energies 2021, 14, 2389
months, and most values were under 12 GW. This information is crucial in understandingthe limitation of reducing the coal capacity since the generation capacity must be able tohandle peak demands. For instance, although winter leads to higher demand, its impactis not as high as that of summer. Nonetheless, this does not translate to higher coalcapacity since the generation profile of the other energy sources, in particular solar, alsohas seasonal variations.
Figure 9. Duration curve of the synthetic demand.
Figure 10. Monthly duration curve of the synthetic demand.
3.1.2. Solar Load Factor
The solar load factor for each month can be seen in Table 8. Since 2016 and 2018 havehigher summer demand, August’s higher load factor will be helpful, but the relativelylower load factor for 2013 will be an issue since this year has higher demand. The lowerload factor in December could be a potential issue, but since the load factor increases byFebruary, this could accommodate the increase in demand during this peak winter period.
Table 8. Monthly solar power generation load factor (%) using the irradiance of the representative years.
Year JAN FEB MAR APR MAY JUN JUL AUG SEP OCT NOV DEC
2014 13.28 11.47 14.89 14.59 17.03 9.94 11.45 9.05 11.38 13.80 11.61 10.151991 12.09 12.44 11.89 12.49 11.14 8.73 11.18 13.33 12.40 12.28 14.62 10.412016 7.94 12.40 15.34 11.84 13.59 10.67 13.75 15.90 10.52 9.18 12.64 11.932018 11.55 13.95 15.69 16.99 13.45 12.26 14.00 15.33 10.07 14.19 14.60 9.192013 11.03 13.77 14.84 16.34 16.09 9.53 14.70 14.70 14.73 13.29 12.01 10.672012 11.02 9.56 13.31 17.01 14.53 8.84 10.30 12.15 12.10 15.20 11.11 7.20
Mean 11.15 12.27 14.33 14.88 14.31 9.99 12.56 13.41 11.87 12.99 12.77 9.93115
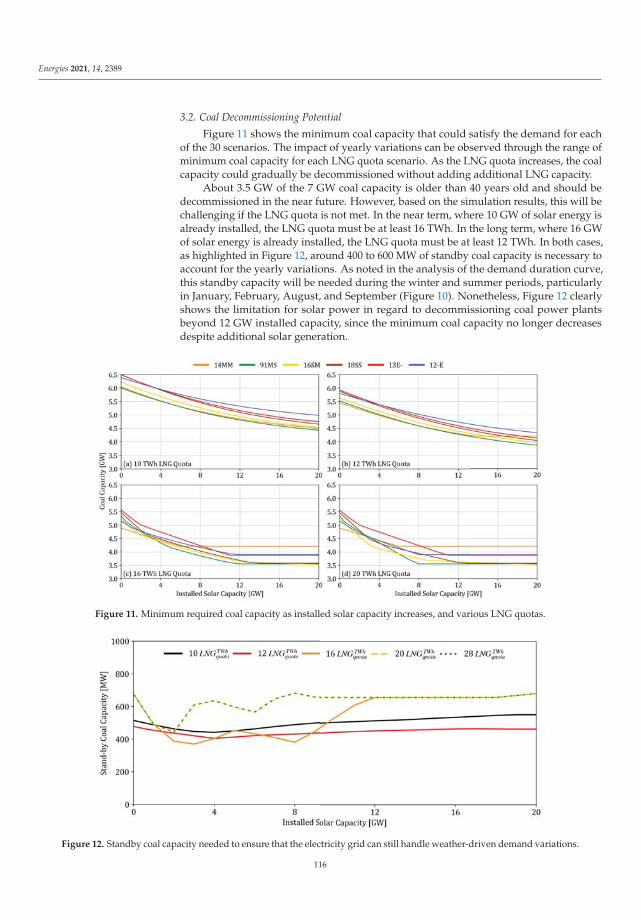
Energies 2021, 14, 2389
3.2. Coal Decommissioning Potential
Figure 11 shows the minimum coal capacity that could satisfy the demand for eachof the 30 scenarios. The impact of yearly variations can be observed through the range ofminimum coal capacity for each LNG quota scenario. As the LNG quota increases, the coalcapacity could gradually be decommissioned without adding additional LNG capacity.
About 3.5 GW of the 7 GW coal capacity is older than 40 years old and should bedecommissioned in the near future. However, based on the simulation results, this will bechallenging if the LNG quota is not met. In the near term, where 10 GW of solar energy isalready installed, the LNG quota must be at least 16 TWh. In the long term, where 16 GWof solar energy is already installed, the LNG quota must be at least 12 TWh. In both cases,as highlighted in Figure 12, around 400 to 600 MW of standby coal capacity is necessary toaccount for the yearly variations. As noted in the analysis of the demand duration curve,this standby capacity will be needed during the winter and summer periods, particularlyin January, February, August, and September (Figure 10). Nonetheless, Figure 12 clearlyshows the limitation for solar power in regard to decommissioning coal power plantsbeyond 12 GW installed capacity, since the minimum coal capacity no longer decreasesdespite additional solar generation.
Figure 11. Minimum required coal capacity as installed solar capacity increases, and various LNG quotas.
Figure 12. Standby coal capacity needed to ensure that the electricity grid can still handle weather-driven demand variations.
116

Energies 2021, 14, 2389
3.3. Coal Generation and Load Factor
Despite the floored impact of solar power on coal decommissioning, it can still reducethe coal generation and load factor. As seen in Figure 13, even beyond 12 GW, the coalgeneration is constantly decreasing in all LNG quota scenarios. Figure 14 further revealsthat the load factor decreases as more solar capacity is installed into the grid. It should benoted that the load factors were computed using the minimum coal capacity as presentedin Figure 11, which results in both a decrease in capacity and utilization rate.
Figure 13. The coal generation in different LNG quota scenarios.
Figure 14. The coal load factor in different LNG quota scenarios.
3.4. Impact on Solar Curtailment Rate
As a consequence of the optimization that reduced the coal capacity and complement-ing solar power with a more flexible generator in the form of LNG, the curtailment wasreduced to varying degrees. Figure 15 shows the range of curtailment rates based on theyearly variations and annual LNG quotas. Increasing the LNG quota from 12 TWh to24 TWh, which in turn decreases the coal capacity, could reduce curtailment from 14%down to 3% in the worst-case scenario for the 10 GW installed solar capacity. Beyond the28 TWh LNG quota, there are minor changes in the curtailment reduction. However, itcould also be noted that the 20 TWh LNG quota can reduce the curtailment from 14% downto 3%. The curtailment reduction becomes more evident as the solar capacity increases.
117
Energies 2021, 14, 2389
However, beyond 16 GW installed capacity, even with sufficient complementary LNG,solar curtailment will always be greater than 10% at best and 30% at worst.
Figure 15. Projected curtailment rates assuming the optimal coal capacity was followed, with the corresponding annualLNG quotas.
3.5. Impact on Annual Cost and CO2 Generation
Figure 16 shows the CO2 emissions generated due to the fuel consumed by coal andLNG generators.The combination of solar and LNG electricity generation could cut theCO2 emissions by half when comparing the “No solar + 10 TWh LNG” and “20 GW Solar +28 TWh LNG” scenarios. The impact of solar power is also readily seen by comparing thevalues in each LNG quota scenario, which should be attributed to its capability to reducecoal generation even beyond 12 GW.
Figure 16. Range of CO2 emissions for various scenarios in Kyushu.
As seen in Figure 17, since solar power has a higher generation cost than using LNG,its impact on the annual generation cost is more significant. The weather conditions greatlyinfluence the annual generation cost: 2014 and 2013 represented the lowest and highestcosts, respectively. The variations in the cost attributed to the LNG scenarios were moreevident in 2013 followed by 2018 and 2016 caused by higher coal production during theextreme and severe summers. In the least costly year, the cost ranged from 1.22 to 1.36trillion JPY (11.48% increase), and in the most costly year, the cost ranged from 1.26 to 1.41(12% increase) trillion JPY (April 2021: 100 JPY = 0.92 USD = 0.77 EUR).
118

Energies 2021, 14, 2389
Figure 17. Annual generation costs for various scenarios in Kyushu.
Using 2016 as the representative, Figure 18 shows the impact of the installed solarcapacity and the LNG quota on the levelized cost of generation and levelized CO2 emissions.Currently, the Kyushu region already has 10 GW of installed solar capacity and generatesaround 10 TWh from LNG. This reference scenario is annotated as scenario 0 (S0) inFigure 18 and values for the levelized cost and CO2 emissions for the various weatherconditions are shown in Table 9.
From this reference scenario, the company could further decrease their CO2 emissionsby having more LNG generation, adding more solar capacity, or both, but at the expenseof increasing their generation cost. Five potential scenarios are annotated as S1 to S5 inFigure 18 and the impacts are tabulated in Tables 10 and 11. Initially, the LNG generationcould be ramped up to 20 TWh to complement the solar capacity increase, as seen in S1.This increased the generation cost by an average of 0.63% and decreased the CO2 emissionsby an average of 12.80% to 0.3226 kgCO2/kWh. From S1, solar capacity could continuouslyincrease, as seen in S2 and S3, or LNG could increase further as seen in S3. The impact ofS2 and S4 in reducing CO2 emissions was the same, but the increase in cost was lower forS4. S5 represents the greenest yet feasible scenario that reduces the CO2 emissions by anaverage of 37.31% but increases the cost by 5.60%.
Table 9. Cost and CO2 emissions of the reference scenario.
14MM 91MS 16SM 18SS 13E- 12-E Mean
Levelized Cost (JPY/kWh) 12.5464 12.5266 12.5331 12.5819 12.5820 12.5160 12.5477Levelized CO2 (kgCO2/kWh) 0.3640 0.3683 0.3714 0.3679 0.3723 0.3764 0.3700
As of April 2021: 100 JPY = 0.92 USD = 0.77 EUR.
119

Energies 2021, 14, 2389
Figure 18. Levelized generation cost and CO2 emissions for the warmer year (16SM) scenario. The CO2 emissions (abscissa)are formatted in decreasing order to emphasize the trend. S0 reflects the current situation, and S1–S5 are the potentialfuture scenarios.
Table 10. Cost increase from the reference scenario.
Scenarios Increase in Cost per kWh (%)
No Name SolarGWcap LNGTWh
quota 14MM 91MS 16SM 18SS 13E- 12-E Mean
S1 Increase LNGTWhquota 1 10 20 0.56 0.53 0.60 0.74 0.75 0.59 0.63
S2 Increase SolarGWcap 1 16 20 3.34 3.38 3.35 3.46 3.61 3.17 3.39
S3 Increase SolarGWcap 2 20 20 4.61 4.75 4.71 4.75 4.93 4.40 4.69
S4 Increase LNGTWhquota 2 10 28 1.20 1.07 1.13 1.34 1.28 1.14 1.19
S5 Increase both 20 28 5.51 5.52 5.49 5.86 6.00 5.22 5.60
Table 11. CO2 emission decrease from the reference scenario.
Scenarios Decrease in CO2 Emission per kWh (%)
No Name SolarGWcap LNGTWh
quota 14MM 91MS 16SM 18SS 13E- 12-E Mean
S1 Increase LNGTWhquota 1 10 20 −13.50 −12.74 −12.55 −12.91 −12.94 −12.18 −12.80
S2 Increase SolarGWcap 1 16 20 −22.78 −22.53 −22.10 −22.66 −22.78 −21.02 −22.31
S3 Increase SolarGWcap 2 20 20 −27.05 −27.18 −26.62 −27.24 −27.29 −25.15 −26.75
S4 Increase LNGTWhquota 2 10 28 −23.77 −23.24 −22.93 −23.37 −23.09 −22.27 −23.11
S5 Increase both 20 28 −36.45 −38.32 −37.84 −37.97 −37.58 −35.70 −37.31
4. Discussion
4.1. Potential and Limitations of Solar PV in Coal Decommissioning
Although it cannot phase-out coal, the results show that solar energy has enoughpotential to be the driver for coal decommissioning with LNG’s help. It has also beenshown that the decommissioning potential is robust against yearly weather-driven demand,and standby-plants could be used for the colder and warmer periods of the year. Althoughsolar power has limitations in reducing coal capacity, it continually decreases the necessarycoal generation, thereby reducing the load factor of coal plants and the correspondingCO2 emissions.
In Kyushu’s case, given the 10 GW solar capacity along with a 16 TWh complementaryLNG quota, 3.5 GW of the 7 GW coal power plants could be decommissioned. Thisconfiguration is already achievable by increasing the LF of the combined-cycle plants ofKyEPCO from 20% to 44%. Beyond 12 GW installed solar capacity, solar power alone has no
120

Energies 2021, 14, 2389
impact on reducing the coal capacity, but it could still reduce coal generation. Compared tothe reference scenario, it was shown that CO2 emissions could be reduced by 27% through20 GW of solar power and a 20 TWh annual LNG quota. The reduction could reach 37% ifall the LNG plants in the region are utilized at 60% LF. As a related consequence, reducingcoal and introducing more LNG reduced solar curtailment. This potential and limitationsshow that energy planners should take the necessary precautions in adding solar energyto the grid since there is an appropriate balance. Solar can reduce coal capacity, but italone cannot phase-out coal. As was shown in Kyushu’s case, a thorough analysis of thesituation that includes complementary energy sources should be considered in evaluatingthe potential of solar power in coal decommissioning.
4.2. Implications of Solar PV in Coal Decommissioning
Solar has its drawbacks in the form of cost and dependence on complementary flexiblegenerators. The results show that in countries like Japan, where solar power remains to bemore expensive than conventional generators—solar power presents an additional cost. Itsdependence on flexible generators, which LNG currently fills, poses a threat to its ability tostand-alone. As the demand for LNG steadily increases, this will threaten its supply andprice. The cost of LNG could exacerbate the cost problems of solar.
In Kyushu’s case, increasing the solar capacity from 10 GW to 16 GW and 20 GWincreases the levelized cost of generation by 3.39% and 4.69%, respectively. Increasing theLNG quota has a minor impact at the moment since the current LNG price is only about12% higher than coal. In contrast, solar is still almost twice as expensive as coal. Solarprices around the world have been decreasing, and it might decrease in Japan in the future.The impact on CO2 and cost now becomes a policy decision, and the ratio between thesetwo factors presents several potential combinations between LNG quota and installed solarcapacity that could yield identical cost or the same CO2 targets as seen in S2 and S4. MoreLNG is necessary when cost is prioritized, but it will lead to more dependence on LNG.Alternatively, by investing more in solar capacity, it could lead the CO2 reduction effortsand local power generation. This scenario entails lower dependence on both coal andLNG, which are both imported fuels. As with the previous results, the impact of weatheron these values is evident, as seen in the variations in the levelized cost and levelizedCO2 emissions.
4.3. Potential Solutions beyond Solar PV
The supply and demand mismatch in winter and summer is one of the major road-blocks in the total phase-out of coal power plants through solar energy. Diurnal storagewill be enough to solve the mismatch during summer, but seasonal storage or seasonalgeneration will be necessary for winter. Since there is still enough excess energy duringpeak solar production in summer, storage is the straightforward solution once these optionsbecome economically feasible. However, since there is less solar energy in winter, there isnot enough excess solar energy for diurnal storage to work, which opens an opportunityfor seasonal technology. Seasonal storage in the form of power-to-gas (P2G) could storethe excess solar in autumn for winter. Combined heat and power (CHP) plants could beoperated at a higher capacity in winter if local water heating is established.
4.4. Impact of Weather on Energy Transition Plans
The stochastic nature of demand and renewable energy sources was the primarymotivation for developing the weather-driven approach since energy transition recommen-dations should consider scenarios that will test the limits of the planned energy mix. Thevariations are significant at 400 MW to 600 MW coal capacity, as seen from the results. InJapan’s case, this translates to 1–3 coal power plants, but for smaller nations with smallerplants, this could be composed of more than five plants that should be on standby in theevent of an extreme weather condition. Coordinating smaller plants will require moredialogue and agreements between the government and plant operators. Consequently, the
121
Energies 2021, 14, 2389
government could also run standby plants to ensure the reliability of the system. It hasalso been shown that weather influences the potential for CO2 reduction and the system’soverall annual generation cost. Beyond coal decommissioning, weather will remain anecessary variable in energy planning since it influences the demand, which is the primarysource of stochasticity in the analysis. As more VREs are added to the green energy tran-sition, weather becomes a crucial variable for both wind and solar. Rainfall data couldalso influence hydropower generation, which was not explored in this study. It could alsoinfluence the viability of PHES since this requires sufficient water reservoirs affected byrain and water evaporation. Little is known about wave energy’s potential, but the weatherwill also influence it since it depends on nature.
4.5. Importance and Limitation of the Proposed Approach
The proposed weather-driven scenario-based analysis revealed the importance of theLNG quota, demand variations, and solar generation through the annual hourly simulation.System reliability could be analyzed using the duration curve, but this does not show thehourly balance, which is greatly influenced by demand and solar generation’s stochasticity.Through careful selection of representative years, the range of potential scenarios wasidentified and analyzed to ensure robust results. However, the approach is dependenton the yearly assignment and is limited by the probabilistic matching of weekends andholidays to high irradiance days. The former is influenced by human behavior, while thelatter is non-deterministic. Thus, although the simulation considered the yearly variations,the probability of a low irradiance day being matched to a high-demand weekday wasnot covered by the approach. Nonetheless, the approach can be used to provide robustrecommendations for green energy transition since it covers the stochastic nature of demandand variable renewable energy. In this study, the approach was used to determine theminimum coal capacity that can ensure the system’s reliability, but it could also be usedfor energy storage assessments and capacity planning. This study only used a single-busnetwork, but it could be expanded to a national grid level by representing each region as abus. The approach can then be used for grid expansion planning.
5. Conclusions
Driven by the idea of transitioning to a green electricity grid, an hourly power flowanalysis was conducted to understand the potential, limitations, and implications of usingsolar energy as a driver for decommissioning coal power plants. The weather-drivenscenario analysis ensured the robustness of the results and recommendations. The analysisrevealed that solar power could reduce about half of Kyushu’s coal capacity with the aid ofLNG. Beyond 12 GW, solar power could not reduce the minimum coal capacity necessaryto ensure the system’s reliability, but it could still reduce the coal generation and the overallCO2 emissions. The reduction in coal capacity comes at a cost, since solar power is stillrelatively more expensive in Japan. By installing 20 GW of solar PV systems and having28 TWh of available LNG, the levelized CO2 emissions could be reduced by 37%, but thiswould increase the levelized cost of generation by 5.6%. Most of the price increase is owedto the price of solar electricity generation, which remains high in Japan. In Kyushu’s case,this change could be achieved without constructing additional power plants, since the LNGplants are operated at a low LF. However, additional planning is necessary to acquire moreLNG. Countries that use LNG plants as peak-load generators share the same potential,and the results show that a minor change in the system could have a significant impact onemission goals.
The results emphasized that solar power with the aid of LNG could partially replacecoal capacity, but it alone could not phase-out coal. For energy planners who are onlystarting to increase their solar capacity, insights from this work could help with under-standing the interactions between coal, solar, and LNG electricity generation. For plannersin countries with a considerable amount of solar power (>8%), the results from this studycould serve as a precaution by highlighting the risks of further increasing the solar power
122

Energies 2021, 14, 2389
penetration. Although solar power helped solve midday peak power, the problem remainsbecause it simply shifted to periods where there is no solar energy. Summer and winter arechallenging periods due to the increase in peak demand. Although it is counterintuitive,solar energy is not enough during summer, or, to be more precise, misaligned since theproblem occurs in the late afternoon. Diurnal storage can address the misalignment insummer, but winter presents a more intricate problem, since the solar energy is insufficient.Thus, exploring other technologies that could further complement solar energy is necessary.
The weather-driven approach revealed the importance of weather in the analysis, as itaffected the results to varying degrees. In addition, 400–600 MW of standby coal capacityis necessary due to the yearly fluctuations. Coal generation, coal load factor, curtailmentrate, and CO2 emissions vary by 7–18%, 8–27%, 0–5%, and 6–8%, respectively. Identifyingthe representative year is crucial since it should cover the worst case, best case, and thecases in between. Energy planners and policymakers should consider the weather whenanalyzing energy plans, as it could provide a range of values that can guide them in makingthe correct decisions. Since the approach can generate scenarios based on weather data,it could also be used for storage assessment and capacity planning. The approach couldalso be used for grid expansion planning by increasing the number of buses and modelingmultiple demands. These energy planning topics could also benefit from the range ofinsights generated through the weather-driven approach.
Author Contributions: Conceptualization, S.M.G.D. and K.N.I.; methodology, S.M.G.D.; software,S.M.G.D.; validation, S.M.G.D. and K.N.I.; formal analysis, S.M.G.D.; investigation, S.M.G.D.; re-sources, K.N.I.; data curation, S.M.G.D.; writing—original draft preparation, S.M.G.D.; writing—review and editing, K.N.I.; visualization, S.M.G.D.; supervision, K.N.I. All authors have read andagreed to the published version of the manuscript.
Funding: This research received no external funding.
Data Availability Statement: The data and code presented in this study are openly available on GitHubat https://github.com/smdumlao/demandfingerprint/tree/main/papers/coaldecommissioning (ac-cessed on 16 April 2021).
Acknowledgments: The authors are grateful for the financial support from the Ministry of Education,Culture, Sports, Science, and Technology of Japan for the doctoral studies of Samuel Matthew Dumlaoat Kyoto University. The authors are also grateful to the Ambitious Intelligence Dynamic Acceleration(AIDA) Program of Kyoto University for the financial support.
Conflicts of Interest: The authors declare no conflict of interest.
Abbreviations
The following abbreviations are used in this manuscript:
CC Combined CycleCHP Combined Heat and PowerDHI Diffuse Horizontal IrradianceDNI Direct-Normal IrradianceGEP Generation Expansion PlanningGHI Global Horizontal IrradianceIEA International Energy AgencyIPP Independent Power ProducerJMA Japan Meteorological AgencyKyEPCO Kyushu Electric Power CompanyLNG Liquefied Petroleum GasMETI Ministry of Economy, Trade, and IndustryMOFA Ministry of Foreign AffairsP2G Power-to-GasPHES Pump Hydro Energy StoragePV Solar Photovoltaicspvlib pvlib Python Library
123

Energies 2021, 14, 2389
PyPSA Python for Power System AnalysisVRE Variable Renewable Energy14MM 2014 Mild Summer Mild Winter (Weather Scenario)91MS 1991 Mild Summer Severe Winter (Weather Scenario)16SM 2016 Severe Summer Mild Winter (Weather Scenario)18SS 2018 Severe Summer Severe Winter (Weather Scenario)13E- 2013 Extreme Summer (Weather Scenario)12-E 2012 Extreme Winter (Weather Scenario)LNGTWh
quota LNG Availability (TWh)SolarGW
cap Solar Capacity (GW)GenerationkWh
tech Annual Generation (kWh)CostJPY/kWh
tech Cost of Electricity Generation (JPY/kWh)EmissionkG−CO22/kWh
tech CO2 Emission (kgCO2/kWh)
References
1. Martinot, E. Grid Integration of Renewable Energy. Annu. Rev. Environ. Resour. 2016, 223–254. [CrossRef]2. REN21. Renewables 2020 Global Status Report. 2020. Available online: https://www.ren21.net/gsr-2020/ (accessed on 8
October 2020).3. Japan Ministry of Economy, Trade, and Industry. Japan’s Fifth Strategic Energy Plan (Provisional Translation). 2018. Available
online: https://www.enecho.meti.go.jp/en/category/others/basic_plan/5th/pdf/strategic_energy_plan.pdf (accessed on 8October 2020).
4. Kyushu Electric Company. Supply and Demand Information (Japanese). 2019. Available online: http://www.kyuden.co.jp/wheeling_disclosure.html (accessed on 20 February 2021).
5. International Energy Agency. Status of Power System Transformation. 2019. Available online: https://www.iea.org/reports/status-of-power-system-transformation-2019 (accessed on 6 March 2021).
6. Deutscher Bundestag. Bundestag Passes the Coal Phase-Out Law. 2020. Available online: https://www.bundestag.de/dokumente/textarchiv/2020/kw27-de-kohleausstieg-701804 (accessed on 14 March 2021).
7. Europe Beyond Coal. Overview: National Coal Phase-Out Announcements in Europe. 2021. Available online:https://beyond-coal.eu/wp-content/uploads/2021/01/Overview-of-national-coal-phase-out-announcements-Europe-Beyond-Coal-January-2021.pdf (accessed on 14 March 2021).
8. Government of Canada. Coal Phase-Out: the Powering Past Coal Alliance. 2018. Available online: https://www.canada.ca/en/services/environment/weather/climatechange/canada-international-action/coal-phase-out.html (accessed on 14 March 2021).
9. Kumar, S.; Kwon, H.T.; Choi, K.H.; Cho, J.H.; Lim, W.; Moon, I. Current status and future projections of LNG demand andsupplies: A global prospective. Energy Policy 2011, 39, 4097–4104. [CrossRef]
10. Shell Corporation. LNG Outlook 2020. 2020. Available online: https://www.shell.com/energy-and-innovation/natural-gas/liquefied-natural-gas-lng/lng-outlook-2020.html (accessed on 16 March 2021).
11. Nikkei Asia. Severe Winter Forecast Sparks Recovery in Asia’s LNG Prices. 2020. Available online: https://asia.nikkei.com/Business/Markets/Commodities/Severe-winter-forecast-sparks-recovery-in-Asia-s-LNG-prices (accessed on 16 March 2021).
12. Dumlao, S.M.G.; Ishihara, K.N. Reproducing solar curtailment with Fourier analysis using Japan dataset. Energy Rep. 2020,6, 199–205. [CrossRef]
13. Bunodiere, A.; Lee, H.S. Renewable Energy Curtailment: Prediction Using a Logic-Based Forecasting Method and MitigationMeasures in Kyushu, Japan. Energies 2020, 13, 4703. [CrossRef]
14. Guittet, M.; Capezzali, M.; Gaudard, L.; Romerio, F.; Vuille, F.; Avellan, F. Study of the drivers and asset management ofpumped-storage power plants historical and geographical perspective. Energy 2016, 111, 560–579. [CrossRef]
15. Li, Y.; Gao, W.; Ruan, Y.; Ushifusa, Y. The performance investigation of increasing share of photovoltaic generation in the publicgrid with pump hydro storage dispatch system, a case study in Japan. Energy 2018, 164, 811–821. [CrossRef]
16. Koltsaklis, N.E.; Dagoumas, A.S. State-of-the-art generation expansion planning: A review. Appl. Energy 2018, 230, 563–589.[CrossRef]
17. Ioannou, A.; Angus, A.; Brennan, F. Risk-based methods for sustainable energy system planning: A review. Renew. Sustain.Energy Rev. 2017, 74, 602–615. [CrossRef]
18. Santos, M.J.; Ferreira, P.; Araújo, M. A methodology to incorporate risk and uncertainty in electricity power planning. Energy2016, 115, 1400–1411. [CrossRef]
19. Schaeffer, R.; Szklo, A.S.; de Lucena, A.F.P.; Borba, B.S.M.C.; Nogueira, L.P.P.; Fleming, F.P.; Troccoli, A.; Harrison, M.; Boulahya,M.S. Energy sector vulnerability to climate change: A review. Energy 2012, 38, 1–12. [CrossRef]
20. Bartók, B. Changes in solar energy availability for south-eastern Europe with respect to global warming. Phys. Chem. Earth PartsA/B/C 2010, 35, 63–69. [CrossRef]
21. Cutforth, H.; Judiesch, D. Long-term changes to incoming solar energy on the Canadian Prairie. Agric. For. Meteorol. 2007,145, 167–175. [CrossRef]
124

Energies 2021, 14, 2389
22. Dumlao, S.M.G.; Ishihara, K.N. Supplementary Materials: Weather-Driven Scenario Analysis for Decommissioning Coal PowerPlants in High PV Penetration Grid. 2021. Available online: https://github.com/smdumlao/demandfingerprint/tree/main/papers/coaldecommissioning (accessed on 16 April 2021).
23. Japan Meteorological Agency. Past Regional Weather Data. Available online: http://www.data.jma.go.jp/risk/obsdl/index.php(accessed on 8 January 2021).
24. Holmgren, W.F.; Hansen, C.W.; Mikofski, M.A. pvlib python: a python package for modeling solar energy systems. J. Open SourceSoftw. 2018, 3, 884. [CrossRef]
25. Brown, T.; Hörsch, J.; Schlachtberger, D. PyPSA: Python for Power System Analysis. J. Open Res. Softw. 2018, 6. [CrossRef]26. Knüpfer, K.; Dumlao, S.M.G.; Esteban, M.; Shibayama, T.; Ishihara, K.N. Analysis of PV Subsidy Schemes, Installed Capacity and
Their Electricity Generation in Japan. Energies 2021, 14, 2128. [CrossRef]27. Agency for Natural Resources and Energy. Electric Power Survey Statistical Data. Available online: https://www.enecho.meti.
go.jp/statistics/electric_power/ep002/results_archive.html (accessed on 8 January 2021).28. Holmgren, W.; Andrews, R. pvlib: TMY to Power Tutorial. Available online: https://nbviewer.jupyter.org/github/pvlib/pvlib-
python/blob/master/docs/tutorials/tmy_to_power.ipynb (accessed on 8 January 2021).29. Erbs, D.; Klein, S.; Duffie, J. Estimation of the diffuse radiation fraction for hourly, daily and monthly-average global radiation.
Sol. Energy 1982, 28, 293–302. [CrossRef]30. Ministry of Land, Infrastructure, Transport and Tourism. Japan Power Plant GIS Data. 2007. Available online: https:
//nlftp.mlit.go.jp/ksj/jpgis/datalist/KsjTmplt-P03.html (accessed on 8 June 2020).31. Japan Beyond Coal. Japan Coal Plant Database. 2020. Available online: https://beyond-coal.jp/map-and-data/ (accessed on 29
September 2020).32. Kyushu Electric Power Company. KYUDEN Group Environmental Data Book 2020. 2020. Available online: http://www.
kyuden.co.jp/var/rev0/0270/6338/env_data_2020.pdf (accessed on 18 March 2021).33. Ministry of Economy, Trade and Industry of Japan. Recent Situation of Thermal Power Generation. 2017. Available online:
https://www.meti.go.jp/shingikai/enecho/shoene_shinene/sho_energy/karyoku_hatsuden/pdf/h29_01_04_00.pdf (accessedon 18 March 2021).
34. Ministry of Economy, Trade and Industry of Japan. Report on Power Generation Costs. 2015. Available online: https://www.enecho.meti.go.jp/committee/council/basic_policy_subcommittee/mitoshi/cost_wg/006/pdf/006_05.pdf (accessed on10 March 2021).
35. Advisory Panel to the Foreign Minister on Climate Change. Promote New Diplomacy on Energy through Leading Global Effortsagainst Climate Change. 2018. Available online: https://www.mofa.go.jp/files/000337158.pdf (accessed on 10 March 2021).
36. Ministry of Environment of Japan. Evaluation of CO2 Emissions of Thermal Power Generation. 2016. Available online:https://www.env.go.jp/council/06earth/y0613-16/ref06-16.pdf (accessed on 10 March 2020).
125


energies
Article
The Energy Lock-In Effect of Solar Home Systems:A Case Study in Rural Nigeria
Olumide Hassan *, Stephen Morse and Matthew Leach
Centre for Environment and Sustainability, University of Surrey, Guildford GU2 7XH, UK;[email protected] (S.M.); [email protected] (M.L.)* Correspondence: [email protected]
Received: 23 November 2020; Accepted: 14 December 2020; Published: 17 December 2020
Abstract: Ongoing reductions in the costs of solar PV and battery technologies have contributedto an increased use of home energy systems in Sub-Saharan African regions without grid access.However, such systems can normally support only low-power end uses, and there has been littleresearch regarding the impact on households unable to transition to higher-wattage energy servicesin the continued absence of the grid. This paper examines the challenges facing rural energytransitions and whether households feel they are energy ‘locked in’. A mixed-methods approachusing questionnaire-based household energy surveys of rural solar home system (SHS) users wasused to collect qualitative and quantitative data. Thematic analysis and a mixture of descriptiveand inferential statistical analyses were applied. The results showed that a significant number ofhouseholds possessed appliances that could not be powered by their SHS and were willing to spendlarge sums to connect were a higher-capacity option available. This implied that a significant numberof the households were locked into a low-energy future. Swarm electrification technology and energyefficient, DC-powered plug-and-play appliances were suggested as means to move the households tohigher tiers of electricity access.
Keywords: solar home systems; rural households; energy transitions; energy access
1. Introduction
Energy plays a pivotal role in the social, economic and cultural development of any population [1].Energy from carriers (e.g., electricity) is converted via end-use technology (e.g., televisions, mobilephones, bulbs and mechanical fans) into useful household energy services (e.g., entertainment,communication, lighting and space cooling). Energy also supports income-generating activitiesincluding construction, agriculture and manufacturing. This is especially relevant for developingnations, who have been shown to exhibit a much larger increase in the Human Development Index (HDI)for a corresponding increase in energy consumption per capita, compared to developed nations [2].However, it is estimated that almost 800 million people lack any access to electricity, with approximately550 million of them living in Sub-Saharan Africa [3]. Transitioning these people from traditionalsources of energy (biomass and waste) to accessing modern energy such as that provided by electricityposes a major challenge. The importance of this challenge is encapsulated by the United Nation’s (UN)Sustainable Development Goal (SDG) 7, which calls for universal access to affordable, sustainable,reliable and modern energy by 2030. There has been significant progress towards the goals of SDG7 atthe country level in developing regions, with countries such as Kenya, Uganda and Sudan making themost progress, even though the current pace of global efforts has so far been insufficient [3].
While there is no single definition of energy poverty, it has been referred to as a lack of accessto modern energy services [4] and a deficiency in the consumption of energy required to meet basichuman needs [5–7]. Reddy [8] (p. 44) captures the multi-dimensional nature of energy poverty by
Energies 2020, 13, 6682; doi:10.3390/en13246682 www.mdpi.com/journal/energies127

Energies 2020, 13, 6682
defining it as “the absence of sufficient choice in accessing adequate, affordable, reliable, high-quality,safe and environmentally benign energy services to support economic and human development”.This recognition of the multi-dimensional nature of energy poverty (and therefore access) helpedshape development of the Multi-Tier Framework (MTF) formulated by the World Bank’s Energy SectorManagement Program (ESMAP) designed to provide a measurement framework for measuring energyaccess [9], although it does focus mainly on electricity. The MTF has been referred to as providingthe most sophisticated energy measurement metric [10], and measures seven attributes of capacity,availability, reliability, quality, affordability, legality, and health and safety, an approach that takes intoaccount the various factors that influence a household’s ability to access energy. It also recognizesthat energy access is not a binary ‘have or have-not’ condition, but rather that households can exist atvarying levels of access depending on socioeconomic factors and other circumstances dictated by theseven attributes listed earlier. The levels of energy (electricity) access described in the MTF are referredto as ‘tiers’ and vary from Tier 0 (no access) to the highest level of access, which is Tier 5. Moving upthese tiers can be seen as climbing up the so-called ‘energy ladder’. A visual representation of the MTF,showing the various tiers, is shown in Figure 1, a matrix for measuring access to household electricitysupply, and Figure 2, a matrix for measuring access to household electricity services.
For decades, rural electrification in developing regions has primarily been achieved via gridextension, and this is still integral to rural electrification policies in many parts of the developingworld [11–13]. However, grid extension has been much slower than anticipated in many regions [12,14],and a key barrier to it is that it is not profitable for utilities to invest the capital required to deliverelectricity to rural communities with relatively low patterns of consumption [15,16]. In the meantime,decentralized options such as solar home systems (SHSs) have proven to be popular for electrifyinghouseholds and other small users due to their falling prices and renewable power source; in Kenya,more than 30% of off-grid households have a solar PV product at home [17].
A typical SHS consists of a PV module typically placed on a rooftop to capture sunlight, a batteryfor storing energy, and end-use appliances which provide energy services. Capacities of SHS can rangefrom 10 to 200 W [18]. However, the typical SHSs used in rural Sub-Saharan Africa are in the 10–100range [19,20]. While the upfront costs of SHSs, at up to $400 for an 80 W system [21], can act as a barrierto entry for many of the poor rural households, the introduction of Pay-As-You-Go (PAYG) service hashelped improve its uptake. This is achieved by providing the SHS as a service, with the householdsmaking small, regular payments to access the service over an agreed time period, after which theyown the SHS [22,23]. Companies such as M-KOPA and Bboxx in Kenya have successfully integratedmobile payment technologies with their SHS services, providing their customers with the convenienceof making payments using their mobile phones, and increasing the flexibility of the amounts they payand the payment intervals [24,25].
Multiple studies have shown that households moving from Tier 0 (i.e., unelectrified) to using SHS(typically Tiers 1 and 2) have seen an improvement in their quality of life [26–28]. SHS use has beenlinked to health benefits, as it displaces household use of kerosene and candles which expose usersto a range of health risks including burns, child poisoning due to inadvertent consumption of fuels,and a variety of conditions linked to indoor air pollution from fine particulate matter, sulphur andnitric oxides. The most common use for SHSs is the improved lighting service it provides compared tokerosene or candles [29] with educational improvements for children who use the light to read and dohomework as a key outcome [26,30]. SHS use has also reduced the need for household members totravel long distances for charging their mobile phones [31].
128

Energies 2020, 13, 6682
Fig
ure
1.
Mul
ti-t
ier
mat
rix
for
mea
suri
ngac
cess
toho
useh
old
elec
tric
ity
supp
ly(s
ourc
e:[9
]).
129

Energies 2020, 13, 6682
Figure 2. Multi-tier matrix for measuring access to household electricity services (source: [9]).
Access to, and initial consumption of electricity has been shown to lead to increases in consumptionover time, as users purchase more appliances (if affordable) [32]. This is in line with the study byOpiyo [33], which demonstrated that rural households in Kenya, upon realising the socioeconomicbenefits of their basic electricity access from SHS, began to desire more high-powered appliances such astelevisions and cooling fans. However, some researchers, such as Lee et al. [34] and Stojanovski et al. [20],have observed that while rural households purchased these appliances to benefit from the servicesthey provide, they could not be accommodated by their SHSs due to their relatively small energycapacity, and hence these appliances were unusable. Hence, despite their broad appeal, there arequestions surrounding home solar products and the energy services they are able to provide to ruralhouseholds. There is a paucity of research designed to explore the nature of the energy serviceshome solar products provide to rural communities in the developing world and especially the viewsand aspirations of households regarding access to energy services. For example, do households feelthat they may become ‘trapped’ into what they see as an ‘inferior’ source of energy? In this paper,the results of a household energy survey conducted across two locations in Nigeria are used to providean empirically based analysis of SHS use in rural households and how those households view suchsystems vis-à-vis alternatives such as an extension of the grid supply. In particular, the research aimswere to:
1. Assess whether the SHS technologies taken up by these rural communities met their non-cookinghousehold energy service demands,
2. Whether households may feel ‘energy trapped’ by the inherent limited capacity of theSHS technology.
2. Methodology
2.1. Location of Research
Data collection for this research was carried out in rural communities across two states in Nigeria,a lower-middle-income country in West Africa [35]: Lagos State, located in the South West region,and the Federal Capital Territory (FCT), which is located in the geographical centre of the country.See Figure 3 for a map of Nigeria, including the locations used for data collection.
Nigeria is a multi-ethnic and culturally diverse country, with 36 states and the Federal CapitalTerritory [36]. Rural locations across the country differ in terms of wealth, culture and weather, all ofwhich can affect energy use. Hence, the locations were chosen in part to reflect a range of socioeconomicconditions. The selected communities were in what can be termed the ‘urban fringe’ of two majorcities in Nigeria–Lagos (Lagos State) and Abuja (FCT). Lagos used to be the Federal Capital of Nigeria,but that role has now been adopted by Abuja, and the communities selected for the research have beeninvolved in projects designed to increase energy provision via SHS. Indeed, the choice of communitieswas based on advice from Nigerian experts in rural electrification, including providers of SHS. A totalof 150 households (50 in Lagos State and 100 in FCT), the majority without any type of access to gridelectricity were surveyed face to face in six communities across both locations, and this was undertakenbetween May and June 2019. The households were selected using the following criteria:
130
Energies 2020, 13, 6682
• Community designation: All the households considered had to be rural. As described earlier,the communities were located on the ‘urban fringe’ of the cities of Lagos and Abuja.
• Location: All communities visited were to be in locations accessible with a car, and also could notbe located in regions designated as “advise against all but essential travel” or “advise againstall travel” on the UK Foreign and Commonwealth Office travel advice website, at the time ofthe research.
• Age/status: Head of households were preferred as respondents. In Nigeria, households aregenerally headed by men [37], who make most of the household decisions, including energypurchases. When they were not available, the next senior family member (usually a spouse orsibling) could be interviewed. Respondents under the age of 18 years were excluded, as age canbe a powerful symbol of inequality in many Nigerian cultures [38]. They were also excluded forethical concerns.
• Wattage: The SHSs used by the households were to be in the range of 10 to 100 Wp.• Duration of ownership of SHS: Households should have been using their SHS for no less than
6 months prior to the interviews. This is so they would have had time to have gotten familiarwith using the SHS.
Note that a few of the households surveyed had varying classifications of access to the grid. Some,particularly in Lagos State, lived ‘under the grid’, i.e., people who live in an area where electricity isavailable, but they are not able to access it for any number of reasons. Others had a connection, but theduration of electricity per day would not qualify them as having access under the MTF tiered system(see Figure 1).
The communities selected for the research are shown in Table 1. The sample for each location wasdrawn from three communities and while the intention was also to have 100 households for LagosState this was not possible due to logistical constraints.
2.2. Participant Selection, Data Collection and Analysis
The selected households had SHS products with ratings of 12 Watts-peak (Wp) in FCT, and 50 Wpin Lagos State, both of which possess 4 LED lighting points and providing lighting service for at least6 h a day. They also powered a small radio, charged mobile phones and LED torchlights, while thehigher capacity systems in Lagos State were connected to a DC-powered television with the abilityto pick up selected satellite broadcasts. At the time the interviews were held, the households hadowned their SHSs between 6 months and 4 years, with a median ownership period of 29 months.The households made monthly PAYG payments for accessing the SHS via an authorised agent.
Data collection was via face-to-face interviews and respondents (one per household, usually thehousehold head unless unavailable) were first asked basic demographic-type questions, and due to theseasonal nature of their occupation (mostly farmers and fishermen), they were not asked about theirincome; instead the researchers used the numbers of household members, size of the house, i.e., numberof rooms, and the amount spent on non-cooking energy purchases, as proxy indicators for wealth.Respondents were then asked about their non-cooking energy mix, including their current expenditurepatterns and willingness to pay for grid electricity. They were also asked about the electrical appliancesalready owned by the household, and the appliances they desired to own. The survey questionnaire isincluded in Appendix A.
131
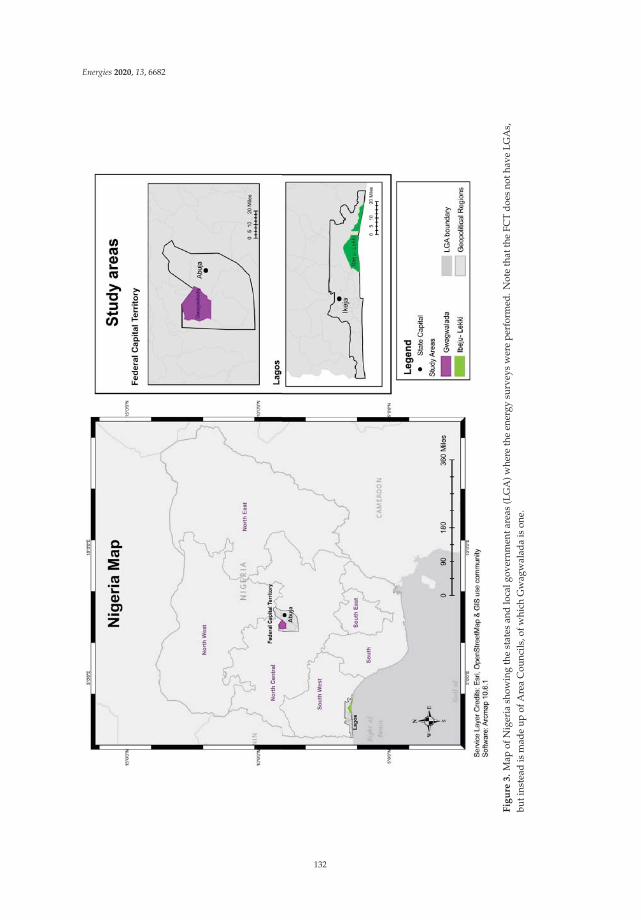
Energies 2020, 13, 6682
Fig
ure
3.
Map
ofN
iger
iash
owin
gth
est
ates
and
loca
lgov
ernm
enta
reas
(LG
A)w
here
the
ener
gysu
rvey
sw
ere
perf
orm
ed.N
ote
that
the
FCT
does
noth
ave
LGA
s,bu
tins
tead
ism
ade
upof
Are
aC
ounc
ils,o
fwhi
chG
wag
wal
ada
ison
e.
132
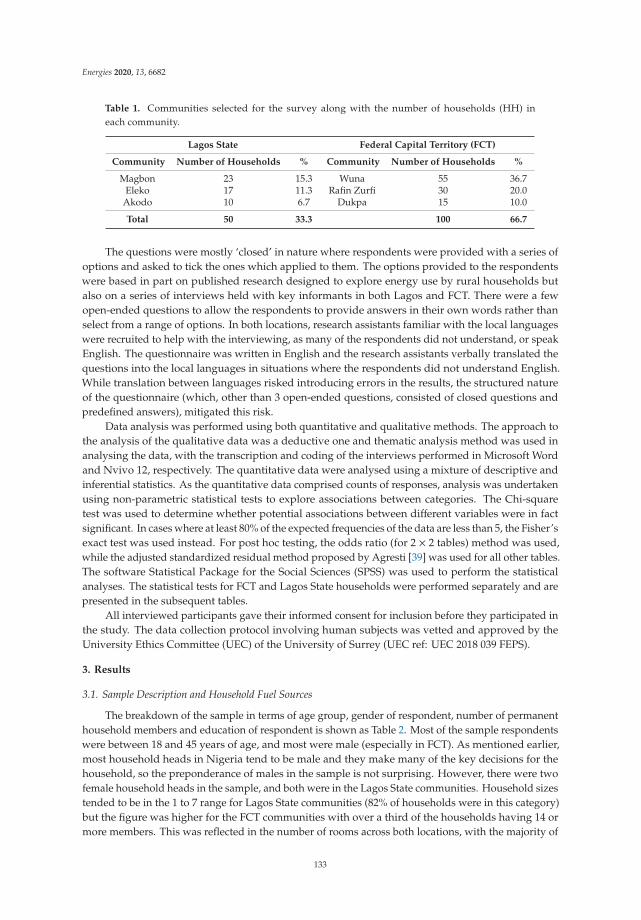
Energies 2020, 13, 6682
Table 1. Communities selected for the survey along with the number of households (HH) ineach community.
Lagos State Federal Capital Territory (FCT)
Community Number of Households % Community Number of Households %
Magbon 23 15.3 Wuna 55 36.7Eleko 17 11.3 Rafin Zurfi 30 20.0
Akodo 10 6.7 Dukpa 15 10.0
Total 50 33.3 100 66.7
The questions were mostly ‘closed’ in nature where respondents were provided with a series ofoptions and asked to tick the ones which applied to them. The options provided to the respondentswere based in part on published research designed to explore energy use by rural households butalso on a series of interviews held with key informants in both Lagos and FCT. There were a fewopen-ended questions to allow the respondents to provide answers in their own words rather thanselect from a range of options. In both locations, research assistants familiar with the local languageswere recruited to help with the interviewing, as many of the respondents did not understand, or speakEnglish. The questionnaire was written in English and the research assistants verbally translated thequestions into the local languages in situations where the respondents did not understand English.While translation between languages risked introducing errors in the results, the structured natureof the questionnaire (which, other than 3 open-ended questions, consisted of closed questions andpredefined answers), mitigated this risk.
Data analysis was performed using both quantitative and qualitative methods. The approach tothe analysis of the qualitative data was a deductive one and thematic analysis method was used inanalysing the data, with the transcription and coding of the interviews performed in Microsoft Wordand Nvivo 12, respectively. The quantitative data were analysed using a mixture of descriptive andinferential statistics. As the quantitative data comprised counts of responses, analysis was undertakenusing non-parametric statistical tests to explore associations between categories. The Chi-squaretest was used to determine whether potential associations between different variables were in factsignificant. In cases where at least 80% of the expected frequencies of the data are less than 5, the Fisher’sexact test was used instead. For post hoc testing, the odds ratio (for 2 × 2 tables) method was used,while the adjusted standardized residual method proposed by Agresti [39] was used for all other tables.The software Statistical Package for the Social Sciences (SPSS) was used to perform the statisticalanalyses. The statistical tests for FCT and Lagos State households were performed separately and arepresented in the subsequent tables.
All interviewed participants gave their informed consent for inclusion before they participated inthe study. The data collection protocol involving human subjects was vetted and approved by theUniversity Ethics Committee (UEC) of the University of Surrey (UEC ref: UEC 2018 039 FEPS).
3. Results
3.1. Sample Description and Household Fuel Sources
The breakdown of the sample in terms of age group, gender of respondent, number of permanenthousehold members and education of respondent is shown as Table 2. Most of the sample respondentswere between 18 and 45 years of age, and most were male (especially in FCT). As mentioned earlier,most household heads in Nigeria tend to be male and they make many of the key decisions for thehousehold, so the preponderance of males in the sample is not surprising. However, there were twofemale household heads in the sample, and both were in the Lagos State communities. Household sizestended to be in the 1 to 7 range for Lagos State communities (82% of households were in this category)but the figure was higher for the FCT communities with over a third of the households having 14 ormore members. This was reflected in the number of rooms across both locations, with the majority of
133
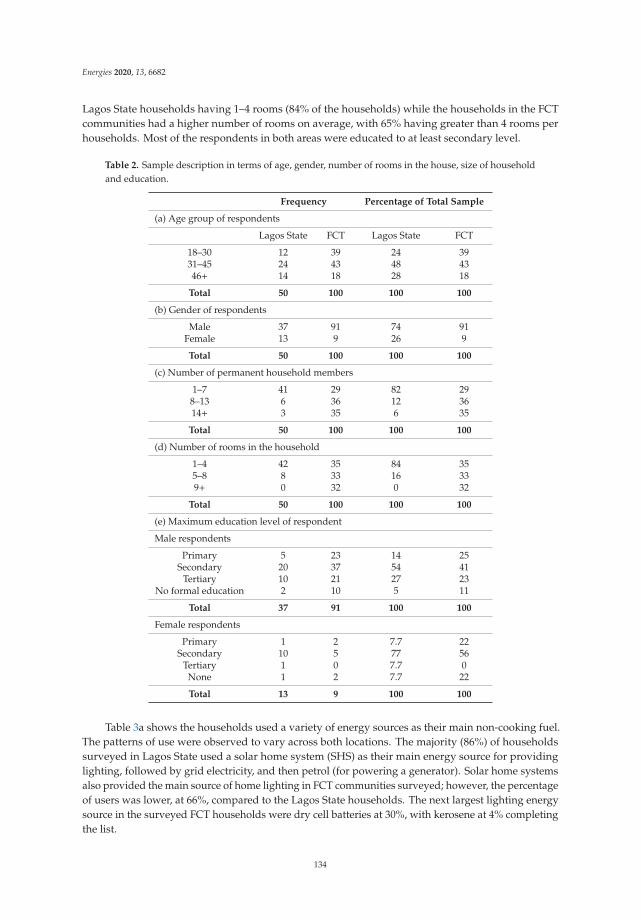
Energies 2020, 13, 6682
Lagos State households having 1–4 rooms (84% of the households) while the households in the FCTcommunities had a higher number of rooms on average, with 65% having greater than 4 rooms perhouseholds. Most of the respondents in both areas were educated to at least secondary level.
Table 2. Sample description in terms of age, gender, number of rooms in the house, size of householdand education.
Frequency Percentage of Total Sample
(a) Age group of respondents
Lagos State FCT Lagos State FCT
18–30 12 39 24 3931–45 24 43 48 4346+ 14 18 28 18
Total 50 100 100 100
(b) Gender of respondents
Male 37 91 74 91Female 13 9 26 9
Total 50 100 100 100
(c) Number of permanent household members
1–7 41 29 82 298–13 6 36 12 3614+ 3 35 6 35
Total 50 100 100 100
(d) Number of rooms in the household
1–4 42 35 84 355–8 8 33 16 339+ 0 32 0 32
Total 50 100 100 100
(e) Maximum education level of respondent
Male respondents
Primary 5 23 14 25Secondary 20 37 54 41
Tertiary 10 21 27 23No formal education 2 10 5 11
Total 37 91 100 100
Female respondents
Primary 1 2 7.7 22Secondary 10 5 77 56
Tertiary 1 0 7.7 0None 1 2 7.7 22
Total 13 9 100 100
Table 3a shows the households used a variety of energy sources as their main non-cooking fuel.The patterns of use were observed to vary across both locations. The majority (86%) of householdssurveyed in Lagos State used a solar home system (SHS) as their main energy source for providinglighting, followed by grid electricity, and then petrol (for powering a generator). Solar home systemsalso provided the main source of home lighting in FCT communities surveyed; however, the percentageof users was lower, at 66%, compared to the Lagos State households. The next largest lighting energysource in the surveyed FCT households were dry cell batteries at 30%, with kerosene at 4% completingthe list.
134

Energies 2020, 13, 6682
Table 3. Main energy source for non-cooking (mostly lighting) purposes and satisfaction with thecapacity of the main household non-cooking energy source.
Main Household Lighting Energy Source
Lagos State FCT
Frequency Percent Frequency Percent
(a) Main household non-cooking energy source
Electricity-SHS 43 86 66 66Petrol 3 6 0 0
Dry cell batteries 0 0 30 30Electricity grid 4 8 0 0
Kerosene 0 0 4 4
Total 50 100 100 100
(b) Household satisfaction with the capacity of the main household non-cooking energy source
Satisfied Not Satisfied Satisfied Not Satisfied
Electricity-SHS 0 43 0 66Petrol 1 2 0 0
Dry cell batteries 0 0 20 10Electricity grid 4 0 0 0
Kerosene 0 0 1 3
Total 5 45 21 79
Table 3b is a frequency table showing the satisfaction of the surveyed households with the energycapacity of their main non-cooking household energy sources. Across both locations, most respondents(90% in Lagos State and 79% in FCT) indicated not being satisfied with the capacity of their mainnon-cooking energy source. In the FCT, the only energy source mentioned by households as satisfactory,capacity wise, were dry cell batteries. In Lagos State, 2% of households were satisfied with the energycapacity of their petrol-powered generators, while 8% were satisfied with the capacity provided by thegrid. None of the households across both locations indicated being satisfied with the energy capacityof their SHS.
Table 4 is a frequency table showing the spending on non-cooking energy sources by the householdsacross both Lagos State and FCT. These data show that the surveyed Lagos State households spendmore money on non-cooking energy than the surveyed FCT households; 52% of Lagos State householdsmentioned spending at least $20 per month, while the figure for FCT households was 7%. The medianspending of both locations was calculated using SPSS, and the values were rounded to $20 for theLagos State households and $6 for the FCT households. The monthly spend on non-cooking energyvariable is used as a proxy for household wealth in the sections covering the inferential statisticalanalyses, and the calculated median spending for both locations are used as thresholds to indicate thewealthier and less wealthy households.
Table 4. Household monthly spend on non-cooking energy across both locations.
Monthly Spend on Non-Cooking Energy, USD ($)Lagos State FCT
Frequency Percent Frequency Percent
0–4.99 0 0 42 42.05.00–9.99 11 22.0 29 29.0
10.00–14.99 11 22.0 15 15.015.00–19.99 2 4.0 7 7.020.00–24.99 4 8.0 4 4.025.00–29.99 8 16.0 0 0
30+ 14 28.0 3 3.0
Total 50 100 100 100
135
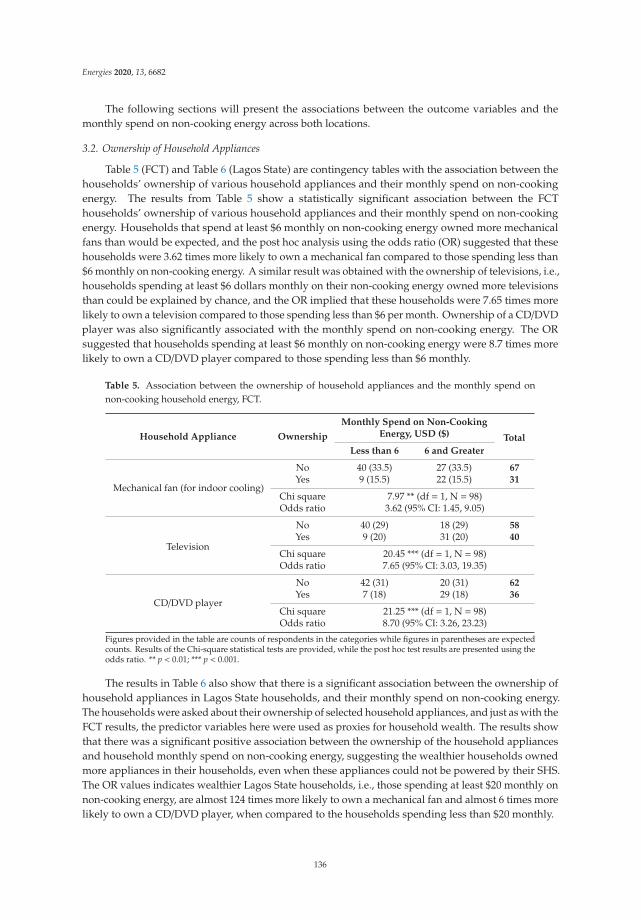
Energies 2020, 13, 6682
The following sections will present the associations between the outcome variables and themonthly spend on non-cooking energy across both locations.
3.2. Ownership of Household Appliances
Table 5 (FCT) and Table 6 (Lagos State) are contingency tables with the association between thehouseholds’ ownership of various household appliances and their monthly spend on non-cookingenergy. The results from Table 5 show a statistically significant association between the FCThouseholds’ ownership of various household appliances and their monthly spend on non-cookingenergy. Households that spend at least $6 monthly on non-cooking energy owned more mechanicalfans than would be expected, and the post hoc analysis using the odds ratio (OR) suggested that thesehouseholds were 3.62 times more likely to own a mechanical fan compared to those spending less than$6 monthly on non-cooking energy. A similar result was obtained with the ownership of televisions, i.e.,households spending at least $6 dollars monthly on their non-cooking energy owned more televisionsthan could be explained by chance, and the OR implied that these households were 7.65 times morelikely to own a television compared to those spending less than $6 per month. Ownership of a CD/DVDplayer was also significantly associated with the monthly spend on non-cooking energy. The ORsuggested that households spending at least $6 monthly on non-cooking energy were 8.7 times morelikely to own a CD/DVD player compared to those spending less than $6 monthly.
Table 5. Association between the ownership of household appliances and the monthly spend onnon-cooking household energy, FCT.
Household Appliance Ownership
Monthly Spend on Non-CookingEnergy, USD ($) Total
Less than 6 6 and Greater
Mechanical fan (for indoor cooling)
No 40 (33.5) 27 (33.5) 67Yes 9 (15.5) 22 (15.5) 31
Chi square 7.97 ** (df = 1, N = 98)Odds ratio 3.62 (95% CI: 1.45, 9.05)
Television
No 40 (29) 18 (29) 58Yes 9 (20) 31 (20) 40
Chi square 20.45 *** (df = 1, N = 98)Odds ratio 7.65 (95% CI: 3.03, 19.35)
CD/DVD player
No 42 (31) 20 (31) 62Yes 7 (18) 29 (18) 36
Chi square 21.25 *** (df = 1, N = 98)Odds ratio 8.70 (95% CI: 3.26, 23.23)
Figures provided in the table are counts of respondents in the categories while figures in parentheses are expectedcounts. Results of the Chi-square statistical tests are provided, while the post hoc test results are presented using theodds ratio. ** p < 0.01; *** p < 0.001.
The results in Table 6 also show that there is a significant association between the ownership ofhousehold appliances in Lagos State households, and their monthly spend on non-cooking energy.The households were asked about their ownership of selected household appliances, and just as with theFCT results, the predictor variables here were used as proxies for household wealth. The results showthat there was a significant positive association between the ownership of the household appliancesand household monthly spend on non-cooking energy, suggesting the wealthier households ownedmore appliances in their households, even when these appliances could not be powered by their SHS.The OR values indicates wealthier Lagos State households, i.e., those spending at least $20 monthly onnon-cooking energy, are almost 124 times more likely to own a mechanical fan and almost 6 times morelikely to own a CD/DVD player, when compared to the households spending less than $20 monthly.
136
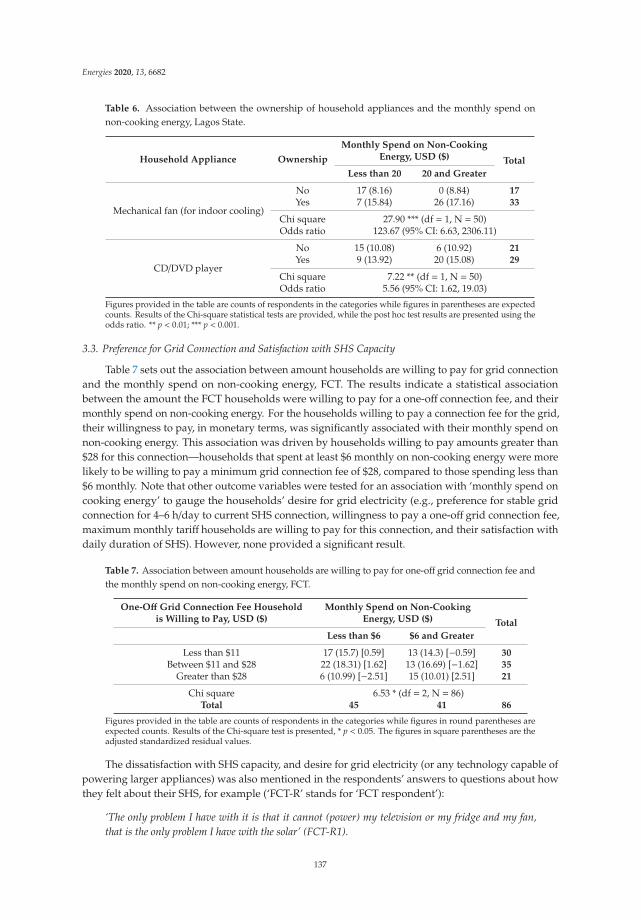
Energies 2020, 13, 6682
Table 6. Association between the ownership of household appliances and the monthly spend onnon-cooking energy, Lagos State.
Household Appliance Ownership
Monthly Spend on Non-CookingEnergy, USD ($) Total
Less than 20 20 and Greater
Mechanical fan (for indoor cooling)
No 17 (8.16) 0 (8.84) 17Yes 7 (15.84) 26 (17.16) 33
Chi square 27.90 *** (df = 1, N = 50)Odds ratio 123.67 (95% CI: 6.63, 2306.11)
CD/DVD player
No 15 (10.08) 6 (10.92) 21Yes 9 (13.92) 20 (15.08) 29
Chi square 7.22 ** (df = 1, N = 50)Odds ratio 5.56 (95% CI: 1.62, 19.03)
Figures provided in the table are counts of respondents in the categories while figures in parentheses are expectedcounts. Results of the Chi-square statistical tests are provided, while the post hoc test results are presented using theodds ratio. ** p < 0.01; *** p < 0.001.
3.3. Preference for Grid Connection and Satisfaction with SHS Capacity
Table 7 sets out the association between amount households are willing to pay for grid connectionand the monthly spend on non-cooking energy, FCT. The results indicate a statistical associationbetween the amount the FCT households were willing to pay for a one-off connection fee, and theirmonthly spend on non-cooking energy. For the households willing to pay a connection fee for the grid,their willingness to pay, in monetary terms, was significantly associated with their monthly spend onnon-cooking energy. This association was driven by households willing to pay amounts greater than$28 for this connection—households that spent at least $6 monthly on non-cooking energy were morelikely to be willing to pay a minimum grid connection fee of $28, compared to those spending less than$6 monthly. Note that other outcome variables were tested for an association with ‘monthly spend oncooking energy’ to gauge the households’ desire for grid electricity (e.g., preference for stable gridconnection for 4–6 h/day to current SHS connection, willingness to pay a one-off grid connection fee,maximum monthly tariff households are willing to pay for this connection, and their satisfaction withdaily duration of SHS). However, none provided a significant result.
Table 7. Association between amount households are willing to pay for one-off grid connection fee andthe monthly spend on non-cooking energy, FCT.
One-Off Grid Connection Fee Householdis Willing to Pay, USD ($)
Monthly Spend on Non-CookingEnergy, USD ($) Total
Less than $6 $6 and Greater
Less than $11 17 (15.7) [0.59] 13 (14.3) [−0.59] 30Between $11 and $28 22 (18.31) [1.62] 13 (16.69) [−1.62] 35
Greater than $28 6 (10.99) [−2.51] 15 (10.01) [2.51] 21
Chi square 6.53 * (df = 2, N = 86)Total 45 41 86
Figures provided in the table are counts of respondents in the categories while figures in round parentheses areexpected counts. Results of the Chi-square test is presented, * p < 0.05. The figures in square parentheses are theadjusted standardized residual values.
The dissatisfaction with SHS capacity, and desire for grid electricity (or any technology capable ofpowering larger appliances) was also mentioned in the respondents’ answers to questions about howthey felt about their SHS, for example (‘FCT-R’ stands for ‘FCT respondent’):
‘The only problem I have with it is that it cannot (power) my television or my fridge and my fan,that is the only problem I have with the solar’ (FCT-R1).
137

Energies 2020, 13, 6682
‘I would prefer a bigger one that can take a fridge and television’ (FCT-R4).
‘I really want NEPA, if it were available, I would pay for NEPA. But since there is no NEPA, that iswhy we went for solar’ (FCT-R7).
NEPA is an acronym for the National Electric Power Authority, a now defunct institution thatonce managed the electricity supply system in Nigeria and is commonly used as a metaphor for gridelectricity in Nigeria.
Table 8 shows that the preference of the Lagos State households to connect to the grid, and to paya one-off connection fee, was significantly associated with their monthly spend on non-cooking energy.The results suggested that wealthier households (spending more than $20 monthly on non-cookingenergy) were 13 times more likely to prefer a stable grid connection with 4–6 h of electricity access perday, and were 9 times more willing to pay a connection fee to access this stable grid, compared to theless wealthy households spending less than $20 monthly on non-cooking energy. Table 8 also showsthat the maximum amount these households were willing to spend as monthly tariffs for this connectionwas significantly associated with their monthly spend on non-cooking energy. The results impliedthat the wealthier households were more likely to pay higher sums (in excess of $40), as monthlytariffs for this stable connection to the grid compared to the less wealthy households, while the lesswealthy households were more likely to pay smaller sums (less than $30) as monthly tariffs for thestable grid electricity.
Table 8. Association between the preference for a stable grid connection to SHS, willingness to payfor one and the satisfaction with SHS duration, and monthly spend on non-cooking energy in LagosState households.
Preference for Grid over SHS,Willingness to Pay for Access to a Grid
Connection & Satisfaction withDuration of SHS
Monthly Spend on Non-CookingEnergy, USD ($) Total
20 and Greater Less than 20
Preference for stable grid connection for4–6 h/day to current SHS connection
Yes 22 (15.08) 7 (13.92) 29No 4 (10.92) 17 (10.08) 21
Chi square 15.57 *** (df = 1, N = 50)Odds ratio 13.36 (95% CI: 3.35, 53.20)
Willing to pay a connection fee to accessstable grid?
Yes 23 (17.68) 11 (16.32) 34No 3 (8.3) 13 (7.7) 16
Chi square 10.42 ** (df = 1, N = 50)Odds ratio 9.06 (95% CI: 2.13, 38.49)
Maximum regular monthly paymenthouseholds are willing to make for access
to stable grid electricity, USD ($)
$10–$29 3 (8.12) [−3.93] 9 (3.88) [3.93] 12$30–$40 7 (6.09) [−0.76] 2 (2.91) [0.76] 9$41–$83 13 (8.79) [−3.17] 0 (4.21) [3.17] 13
Fisher’s exact test 16.63 *** (N = 34)
Are you satisfied with the daily durationof your SHS?
Yes 16 (10.08) 5 (10.92) 21No 8 (13.92) 21 (15.08) 29
Chi square 11.53 *** (df = 1, N = 50)Odds ratio 8.40 (95% CI: 2.31, 30.60)
Figures provided are counts of respondents in the categories while figures in parentheses are expected counts.Results of the statistical tests are provided using the Chi-square and Fisher’s exact test. Post hoc tests are performedusing the odds ratio and adjusted standardized residuals, which are presented in square parentheses. ** p < 0.01;*** p < 0.001.
The preference for grid-based electricity was also suggested by the respondents’ answers toquestions about how they felt about their SHS, with responses such as the following (‘LG-R’ stands for‘Lagos State respondent’):
138
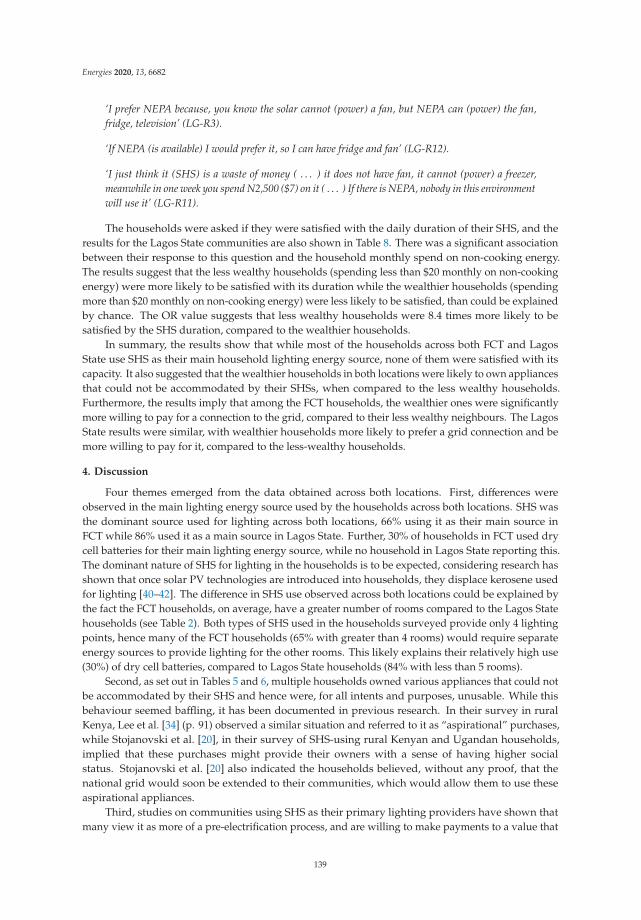
Energies 2020, 13, 6682
‘I prefer NEPA because, you know the solar cannot (power) a fan, but NEPA can (power) the fan,fridge, television’ (LG-R3).
‘If NEPA (is available) I would prefer it, so I can have fridge and fan’ (LG-R12).
‘I just think it (SHS) is a waste of money ( . . . ) it does not have fan, it cannot (power) a freezer,meanwhile in one week you spend N2,500 ($7) on it ( . . . ) If there is NEPA, nobody in this environmentwill use it’ (LG-R11).
The households were asked if they were satisfied with the daily duration of their SHS, and theresults for the Lagos State communities are also shown in Table 8. There was a significant associationbetween their response to this question and the household monthly spend on non-cooking energy.The results suggest that the less wealthy households (spending less than $20 monthly on non-cookingenergy) were more likely to be satisfied with its duration while the wealthier households (spendingmore than $20 monthly on non-cooking energy) were less likely to be satisfied, than could be explainedby chance. The OR value suggests that less wealthy households were 8.4 times more likely to besatisfied by the SHS duration, compared to the wealthier households.
In summary, the results show that while most of the households across both FCT and LagosState use SHS as their main household lighting energy source, none of them were satisfied with itscapacity. It also suggested that the wealthier households in both locations were likely to own appliancesthat could not be accommodated by their SHSs, when compared to the less wealthy households.Furthermore, the results imply that among the FCT households, the wealthier ones were significantlymore willing to pay for a connection to the grid, compared to their less wealthy neighbours. The LagosState results were similar, with wealthier households more likely to prefer a grid connection and bemore willing to pay for it, compared to the less-wealthy households.
4. Discussion
Four themes emerged from the data obtained across both locations. First, differences wereobserved in the main lighting energy source used by the households across both locations. SHS wasthe dominant source used for lighting across both locations, 66% using it as their main source inFCT while 86% used it as a main source in Lagos State. Further, 30% of households in FCT used drycell batteries for their main lighting energy source, while no household in Lagos State reporting this.The dominant nature of SHS for lighting in the households is to be expected, considering research hasshown that once solar PV technologies are introduced into households, they displace kerosene usedfor lighting [40–42]. The difference in SHS use observed across both locations could be explained bythe fact the FCT households, on average, have a greater number of rooms compared to the Lagos Statehouseholds (see Table 2). Both types of SHS used in the households surveyed provide only 4 lightingpoints, hence many of the FCT households (65% with greater than 4 rooms) would require separateenergy sources to provide lighting for the other rooms. This likely explains their relatively high use(30%) of dry cell batteries, compared to Lagos State households (84% with less than 5 rooms).
Second, as set out in Tables 5 and 6, multiple households owned various appliances that could notbe accommodated by their SHS and hence were, for all intents and purposes, unusable. While thisbehaviour seemed baffling, it has been documented in previous research. In their survey in ruralKenya, Lee et al. [34] (p. 91) observed a similar situation and referred to it as “aspirational” purchases,while Stojanovski et al. [20], in their survey of SHS-using rural Kenyan and Ugandan households,implied that these purchases might provide their owners with a sense of having higher socialstatus. Stojanovski et al. [20] also indicated the households believed, without any proof, that thenational grid would soon be extended to their communities, which would allow them to use theseaspirational appliances.
Third, studies on communities using SHS as their primary lighting providers have shown thatmany view it as more of a pre-electrification process, and are willing to make payments to a value that
139

Energies 2020, 13, 6682
would be economically sustainable for a grid-type utility [13,43]. This was observed in the results ofthis study as seen in Tables 7 and 8, with 86% of FCT households and 68% of Lagos State householdsstating a willingness to pay a one-off connection fee for access to grid electricity. This follows on fromthe earlier observation, i.e., a significant number of households purchase electrical appliances thatcannot be accommodated by their SHS, in the hope of getting a grid connection in the future andmake use of the energy services (space cooling, entertainment, etc.) these appliances provide. Finally,while the energy services afforded to the households by their SHSs differed across both locations(FCT households had lighting and mobile phone charging, while the Lagos State households’ SHSincluded a television) none of the households in either location indicated being satisfied with theenergy capacity of their SHS.
These themes show that while both locations had similar issues with their lack of electrification,there were some differences in the way households used energy sources, and their desire to connectto the grid. This suggests it might be pertinent for policy makers and private institutions involvedwith rural electrification to tailor their interventions as opposed to applying a blanket approach tothese rural communities. For example, the levels of subsidies or grants that might be offered for ruralelectrification projects could be made to be dependent on the relative wealth of the communitiesto be electrified, based on metrics that indicate their wealth and willingness to pay for electricityaccess. However, further research is required to determine whether these observed differences arestatistically significant.
SHSs are often seen as a means to get households onto the modern energy ladder [33,44,45].However, the results show that for many it was a less desirable substitute for a grid-based service.Their inability to connect as many appliances to the SHS as they would have liked seemingly led tothe statistically significant associations between the wealth of a household and (i) their ownership ofvarious household appliances with wattages too high for their SHS, and (ii) their desire to connect to,and pay for, a grid-type electricity supply. This confirms the intuition that wealthier households aremore likely to purchase these high wattage appliances and therefore will be more inclined to prefer agrid connection. The minimum wage of approximately $50 per month in Nigeria [46] at the time ofconducting the survey provides some context regarding the FCT households’ willingness to spend inexcess of $28 for a one-off grid connection fee, and the Lagos State households’ willingness to makemonthly $40-plus electricity tariff payments for ongoing access to the grid. However, it is important tonote that a household stating they are willing to pay for a grid connection does not necessarily equateto their ability to pay for said connection or indeed a decision to actually do it if the opportunity arises.Nonetheless, the findings demonstrate that a significant number of the households are unable to moveup the energy ladder (or in the case of the MTF, up the tier levels) regardless of their willingness orability to pay, as they do not have access to an electricity connection that can meet their demands.In this situation, the household can be referred to as being ‘energy locked in’.
There are other ways to get rural households up the energy ladder ahead of expansion of thenational grid, and ahead of alternative major infrastructure investments in mini-grids. One approachis so-called “swarm electrification”, to connect a number of SHS units across a community, which willact to smooth the total electricity demand through diversity effects and share the generation capacityfrom all individual systems [47], as a sort of ‘micro-grid’. This bottom-up approach to electrificationeliminates the typical oversizing in the design of mini-grids and grid extension projects while enablinghouseholds to transition to a higher energy access tier using their legacy SHS [44,47]. Another approachis the development of a diverse and competitive market for energy efficient, DC-powered plug-and-playappliances. As described by Narayan et al. [48], these consume a fraction of the energy required bytheir mainstream counterparts running on AC. Some SHS providers bundle these efficient applianceswith their service, and in the households surveyed for this research the SHS came with four energyefficient, DC-powered LED bulbs at 1 W each, a torchlight at 1.1 W, and (in Lagos State) a televisionat 10.8 W. Creating more energy efficient appliances, such as the Youmma refrigerator which has apower rating of 17.8 W [49] and having them come with a standardized, compatible plug-and-play
140
Energies 2020, 13, 6682
facility, can enable SHS-using households to move up the MTF tiers. However, in order for this energyefficient appliance market to grow, quality standards need to be created and adopted by countriesinvolved with SHS electrification programs. Further, traditional household electronics manufacturers,with the know-how of making these appliances, could be encouraged to get involved in the productionof energy-efficient DC-powered appliances. This would help provide a greater selection of appliances,and more competition in the market.
A natural progression of this research would be to expand the numbers of surveys to includecommunities using a wider variety of off-grid technologies, for example from simple solar lanterns tosolar mini-grids, and observe the changes, if any, to the results of this research. Further, expandingthe number of locations to include more remote rural communities that are a further distance frommajor cities/urban centres than in this research, might result in energy-use patterns that providedifferent results. It should also be noted that the choice of interviewing the heads of households led tothe majority of the respondents in the study being male. The traditional role women have with thecollection of cooking fuel, food preparation and cooking due to cultural gender norms [50–52] wouldlikely reduce the time they can spend using certain energy services provided by the SHS, for examplewatching a television. It is therefore possible women might have different opinions to men with regardsto their views and aspirations about their non-cooking energy service demands and the ability of aSHS to meet them, and the significance of these gender-based differences, if any, could be the subject offuture research.
5. Conclusions
Energy is a crucial input for socioeconomic development, and it follows that the ability to notonly access modern energy, but to transition to a wide range of energy services, is instrumental tothe development of any society. This research set out to examine energy transitions in rural Nigeria,with the following objectives:
• Examine if the SHS technologies distributed to these rural communities met their non-cookinghousehold energy services demand.
• Examine if energy lock-in effects occur in these rural households using SHS technologies.
The results showed that none of the households were satisfied with the energy capacity of theirSHS, and that the wealthier households were willing to pay relatively large sums to connect to the gridso they could use energy services unavailable to them with their SHS. However, they were unable todo so due to the unavailability of any electricity supply technology that would power their appliances.While the goal of SDG7 may have been achieved across these communities with the provision of SHS,many of the households clearly exhibited some frustration and dissatisfaction with the actual level ofenergy access, as they do not see a clear transition pathway up the energy ladder.
Two methods were suggested to help rural households in this situation move up the MTF energyaccess tiers: swarm electrification using the existing SHS technologies, and the provision of a greaterselection of energy efficient, plug-and-play DC-powered appliances. Public and private entitiesin Nigeria involved in rural electrification with SHS could use the findings shown here to betterunderstand the energy transition needs of rural households, and provide the interventions requiredto move them up the ladder. For example, they could provide funding into researching swarmelectrification technology in rural Nigeria.
Author Contributions: Conceptualisation, O.H., S.M., and M.L.; methodology, O.H., S.M., and M.L.; software,O.H.; validation, O.H., S.M., and M.L.; format analysis, O.H., investigation, O.H.; resources, O.H., S.M., and M.L.;data curation, O.H.; writing—original draft preparation, O.H.; writing—review and editing, O.H., S.M., and M.L.;visualisation, O.H.; supervision, S.M. and M.L. All authors have read and agreed to the published version ofthe manuscript.
Funding: This research received no external funding.
Acknowledgments: This work was supported by the Centre for Environment and Sustainability,University of Surrey.
141

Energies 2020, 13, 6682
Conflicts of Interest: The authors declare no conflict of interest.
Appendix A. Survey Questionnaire
SECTION 1: RESPONDENT DETAILS
1.1 Age of respondent � 18–21 (1) � 22–25 (2) � 26–30 (3) � 31–35 (4) � 36–40 (5)
� 41–45 (6) � 46–50 (7) � 51–55 (8) � 56–60 (9) � 61+ (10)
1.2 Gender of respondent � Female (2) �Male (1)
SECTION 2: HOUSEHOLD INFORMATION
2.1 What is the highest level of formal education by respondent? �Nursery (1) �Primary (2) � Secondary (3)
�Undergraduate (4) �Postgraduate (5)
�Other (please explain) (6) _____________________
�None of the above (7)
2.2 Is the respondent the head of the household ? �Yes (1) �No (2)
2.3 If (no) to 2.2, what is the relationship of respondent to head � Brother (1) � Sister (2) � Friend (3)
of household? � Husband (4) �Wife (5) � Father (6)
�Mother (7) � Child (8)
� Other (please explain) (9)
_______________________________
2.4 What is the main occupation of the respondent? � Store owner (1) � Farmer (2) � Street Hawker (3)
� Civil servant (4) �Factory worker (5) � Teacher (6)
� Trader (7) �Mechanic (8) � Hairdresser (9)
� Others (specify) (10) ____________________________________
2.5 What type of dwelling is the household? � separate house (1) � semi-detached house (2) � Hut (3)
� Tent (4) � Compound house (5) � Flat (6)
� Other (specify) (7) ______________________________________
2.6 What material is the roof mostly made of? __________________________________________________________
2.7 What material is the floor mostly made of? __________________________________________________________
2.8. What material are the walls mostly made of? __________________________________________________________
2.9 How many ‘family’ or living spaces does the home have? __________________________________________________
2.10 How many rooms are in the household? __________________________________________________________
2.11 Does the respondent keep any livestock? � Yes (1) � No (2)
If yes, please list all and the number of each
Type ____________________ Number ______________
Type ____________________ Number ______________
Type ____________________ Number ______________
Type ____________________ Number ______________
Type ____________________ Number ______________
2.12 Do you grow your own crops? � Yes (1) � No (2)
If yes, please list all and approximate area of total farmland (plot)
Type ____________________ Area of farm __________
Type ____________________
Type ____________________
Type ____________________
Type ____________________
142

Energies 2020, 13, 6682
2.13 What proportion of your income would you say you spend
on household energy (non-cooking)? ___________________________________________
2.14 How many people live in this household? ___________________________________________
2.15 Of the people in (2.14), how many live in the house at least
18 days or more per month? ___________________________________________
SECTION 3: HOUSEHOLD ENERGY MIX/CONSUMPTION
3.1 Which of these is your main household fuel for lighting only? Please select no more than one
� Candles (1) � Kerosene (2) � LPG (3) � firewood/biomass (4) � Car batteries (5) � Dry cell batteries (6)
� Electricity (grid) (7) � electricity (mini-grid) (8) � Electricity (SHS) (9) � Petrol (10) � Diesel (11)
� Other (please specify) (12) ____________________________
3.2 Reasons for using the above fuel?
� Familiar fuel (1) � No other fuel available (2) � Easy to use (3) � Easily available (4) � Cheap (5)
� Other fuels are not affordable (6) � Other (please explain) (7) _________________________
3.3 (a) Are you satisfied using this (main) fuel?
�Yes (1) � No (2)
(b) If No to (3.3), please give reason why. Select up to 3 reasons
� Not selected (0) � Not safe (1) � Expensive (2) � Health concerns (3) � Other (please explain) (4) ___________
3.4 What other fuel sources do you use at home for lighting? Please select at least one
� Candles (1) � Kerosene (2) � LPG (3) � firewood/biomass (4) � Car batteries (5) � Dry cell batteries (6)
� Electricity (grid) (7) � electricity (mini–grid) (8) � Electricity (SHS) (9) � Petrol (10) � Diesel (11)
�Mobile phone (12) � Other (please specify) (13) ______ � None (14) (if none, skip to question 3.6)
3.5 When do you use this other fuel source for lighting?
�Main fuel too expensive (1) �Main fuel not available (2) �Main fuel capacity inadequate (3)
� Other (please explain) (4) __________________________ � not applicable (5)
3.6 What other fuel source do you use at home for other non-lighting & non-cooking activities? (radio, television, fan,
fridge, etc.)
� Car batteries (1) � Dry cell batteries (2) � Electricity (grid) (3) � electricity (mini-grid) (4) � Electricity (SHS) (5)
� Petrol (6) � Diesel (7) � Other (please specify) (8) _____________ � None (9)
3.7 Other sources of fuel which are available for purchase (for any non-cooking purpose) that are not used, and why
(please tick if relevant):
Available
Fuel
Not Safe
(1)
Expensive
(2)Smoky (3)
Unreliable
(4)
Health
Concerns
(5)
Redundant
(6)
Not
Available
(7)
Candles
Kerosene
LPG
Electricity(grid)
Electricity(mini grid)
Electricity(SHS)
Petrol
Diesel
Other(specify)
3.8 Who determines the household choice of fuels (for non- � Head of household (1) � Other (please specify) (2)
cooking activities only, e.g., lighting, fan, fridge, etc.)? ______________________________
3.9 Energy Access Attributes: Make notes of the units used (per week, per month, kg, bag, etc. to allow for consistency).
If individual respondents prefer to use weekly or monthly basis, make a note of which one they used.
143

Energies 2020, 13, 6682
Ho
use
ho
ldC
on
sum
pti
on
Qu
est
ion
sC
an
dle
s(i
)K
ero
sen
e(i
i)L
PG
(iii
)E
lect
rici
ty(G
rid
)(i
v)
Ele
ctri
city
(Min
iG
rid
)(v
)
Ele
ctri
city
(SH
S)
(Ho
urs
)(v
i)
Pe
tro
l(L
itre
s)Q
(vii
)
Die
sel
(vii
i)
Ca
rB
att
eri
es
(ix
)
Dry
Ce
llB
att
eri
es
(x)
Oth
er
(xi)
(a).
How
muc
hdo
you
use,
onav
erag
e,on
aw
eekl
yba
sis
for
hous
ehol
dfu
el?
(b).
How
long
does
itta
keto
purc
hase
,or
how
far
doyo
uha
veto
trav
elto
purc
hase
?
(c).
*H
owof
ten
doyo
uch
arge
it,o
na
wee
kly
basi
s?
Not
es:F
or(a
),m
easu
ring
the
cons
umpt
ion
ofgr
idel
ectr
icity
mig
htbe
diffi
cult
toas
cert
ain.
Cal
cula
teba
sed
onho
wm
uch
they
are
char
ged
inth
eir
tariff
s.Fu
rthe
r,th
equ
estio
nsw
ith“*
”is
for
car
batt
erie
son
ly.
3.10 R
eli
ab
ilit
yQ
ue
stio
ns
Ca
nd
les
(i)
Ke
rose
ne
(ii)
LP
G(i
ii)
Ele
ctri
city
(Gri
d)
(iv
)
Ele
ctri
city
(Min
iG
rid
)(v
)
Ele
ctri
city
(SH
S)
(Ho
urs
)(v
i)
Pe
tro
l(L
itre
s)Q
(vii
)
Die
sel
(vii
i)
Ca
rB
att
eri
es
(ix
)
Dry
Ce
llB
att
eri
es
(x)
Oth
er
(xi)
(a).
Inth
epa
st1
mon
th,w
ould
you
say
you
have
expe
rien
cesh
orta
ges/
inte
rrup
tion
sw
ith
this
fuel
?
(b).
Inth
epa
st1
mon
th,h
owm
any
times
have
you
expe
rien
ced
shor
tage
s/in
terr
upti
ons
wit
hth
isfu
el?
Not
es:F
orth
eel
ectr
icity
fuel
s,nu
mbe
rof
shor
tage
sw
ould
bem
easu
red
byho
wm
any
hour
spe
rda
yth
ere
was
noel
ectr
icity
.For
othe
rfu
els,
they
wou
ldin
volv
enu
mbe
rof
times
thes
efu
els
have
notb
een
avai
labl
eto
purc
hase
inth
atm
onth
peri
od.
144

Energies 2020, 13, 6682
3.11 Aff
ord
ab
ilit
yQ
ue
stio
ns
Ca
nd
les
(i)
Ke
rose
ne
(ii)
LP
G(i
ii)
Ele
ctri
city
(Gri
d)
(iv
)
Ele
ctri
city
(Min
iG
rid
)(v
)
Ele
ctri
city
(SH
S)
(Ho
urs
)(v
i)
Pe
tro
l(L
itre
s)Q
(vii
)
Die
sel
(vii
i)
Ca
rB
att
eri
es
(ix
)
Dry
Ce
llB
att
eri
es
(x)
Oth
er
(xi)
(a).
Ove
rth
epa
st1
mon
th,h
owm
uch
onav
erag
e,pe
run
it,d
oyo
usp
end
onpu
rcha
sing
the
fuel
?
(b).
Wou
ldyo
usa
yth
atyo
uca
naff
ord
topu
rcha
seth
efu
el:
1.A
llth
eti
me
2.O
nly
som
eof
the
tim
e
3.C
anba
rely
orca
nnot
affor
dit
Not
es:P
erun
ithe
rem
eans
per
kg,p
erlit
re,p
erba
g,et
c.En
sure
the
“per
unit”
isde
fined
byth
ere
spon
dent
.Itd
oes
noth
ave
tobe
anex
actfi
gure
,but
anap
prox
imat
ion
ofsi
ze/q
uant
itysh
ould
beob
tain
ed.‘
Per
unit
’is
diff
eren
tfor
SHS
user
sas
they
wou
ldm
ostl
ikel
ybe
payi
nga
flatr
enta
lrat
epe
rw
eek/
mon
th,h
ence
thei
r‘u
nit’
wou
ldbe
ape
riod
ofti
me.
145

Energies 2020, 13, 6682
SECTION 4: HOUSEHOLD ELECTRIFICATION
4.1 (a) Is this household connected to the national grid supply for electricity? (only national provider should be
considered, i.e., PHCN)
� Yes (1) � No (2)
(b) If No, please say why you are not connected
� High cost of connection (1) � High cost of tariff/monthly payments (2) � not reliable (3) � not available (4)
� other (please explain) (5)
4.2 (a) Does this household receive electricity from the grid (defined as defined as 12+ hours of grid electricity per week)
� Yes (1) � No (2)
(b) If No, then how is electricity supplied to the household?
� PV solar panel (1) �Mini-grid (2) � Car battery (3) � Dry cell battery (4) �Personal generator (5)
� Communal generator (6) � Other (please specify) (7) � not applicable (8)
4.3 Do you own a solar home system (SHS)?
� Yes (1) � No (2) (if “no”, skip to question 4.19)
(if “yes”, skip questions 4.19 & 4.20)
4.4 (a) Did you purchase the SHS, or was it provided for free?
� Purchase (1) � Free (2) � Not applicable (3)
(b) If “free”, would you still have gotten the SHS if it was not free?
� Yes (1) � No (2) � Not applicable (3)
4.5 How long ago (in months) did the household first get the SHS?
____________ months
4.6 What is the capacity of your SHS (in Watts?) (If they do not know the answer to this, offer to check the unit)
____________ watts
4.7 Which of the following appliances do you want to own, already own, do not want/care to own, or cannot use?
(Tick as appropriate)
AppliancesWant to Own
(1)
Already Own
(2)
Do Not
Need/Want (3)
Own, But
Cannot Use (4)
Not
Applicable (5)
LED bulb
Mechanical fan
Radio
Television
Fridge/freezer
Water Pump
Mobile Charger
Rechargeable Torch
Electric Iron
CD/DVD Player
Air conditioning
Electric Cooker
Other (please specify)
146

Energies 2020, 13, 6682
4.8 If you ticked any appliance under “want to own”, why haven’t you purchased the equipment?
� Too expensive to purchase (1) � Not available to purchase (2) � capacity of power source not adequate (3)
� other (please explain) (4)
4.9 In the past 3 months, how many hours a day would you say you use the SHS system?
� <1 (1) � 1 (2) � 2 (3) � 3 (4) � 4 (5) � 5 (6) � 6 (7) �6+ (8) � n/a (12)
4.10 What is the duration, in hours/day, you would prefer to have the supply of electricity, as opposed to what you
have now?
a � From _______ to _________ (1) b � Happy with the current duration (2) c � n/a (3)
4.11 What has been the most important use of your SHS for your household? Please tick in descending order of importance,
with 4 being the most important and 1 the least important.
Entertainment
(television, radio) (a)
Security (as a
result of better
light outside) (b)
Using it for work
(mobile phone charging
business, etc.) (c)
For general
household
lighting (d)
4
3
2
1
n/a
4.12 In the past 1 month, has your SHS failed to provide electricity for more than half the time it did when you got it?
� Yes (1) � No (2) � n/a (3)
4.13. Do you feel the capacity of your SHS limits your ability to fully enjoy the benefits of electricity, i.e., would you enjoy
it more if it were able to power more electrical appliances?
� Yes (1) � No (2) � n/a (3)
4.14 (a) Do you prefer a mini-grid/national grid connection guaranteed for, say 4 to 6 h per day, (use NEPA or PHCN
acronym if it helps them understand) than the SHS for the whole day?
� Yes (1) � No (2) � n/a (3)
(b) If “Yes, what are your reasons?
_____________________________________________________________________________________________________________________________________________________________________________________________________________________________________
(c) If “No”, what are your reasons?
_____________________________________________________________________________________________________________________________________________________________________________________________________________________________________
4.15 (a) Would you be willing to pay a part of the connection/set up cost if it meant you would get connected to a
national/mini grid that promises to provide uninterrupted supply of electricity?
� Yes (1) � No (2) � n/a (3)
(b) If “yes”, how much would you be willing to pay? ____________
(c) If “yes”, what is the minimum number of hours per day of electricity you would expect from the grid to be worth
your payment?
Amount ___________
147

Energies 2020, 13, 6682
4.16 How much more compared to your SHS payments would you be willing to pay regularly on a monthly basis for
electricity, if you can upgrade to the national grid/mini grid? (If SHS use is free, then just ask how much they would bewilling to pay monthly to use the grid, as opposed to comparing to SHS payments)
Amount: __________
4.17 Has your SHS lived up to the expectations you had before you purchased it. Please explain
____________________________________________________________________________________________________________________________________________________
4.18 If the answer to 4.3 is “no”, why do you not own a SHS?
� High cost of connection (1) � High cost of tariff/monthly payments (2) � not reliable (3) � not available (4)
� Not needed (5) � other (please explain) (6) � n/a (7) � capacity too small (8)
4.19 (a) If the answer to 4.3 is “no”, have you previously owned a SHS?
� Yes (1) � No (2)
(b) If “yes”, why do you no longer have one? Please explain
_____________________________________________________________________________________________________________________________________________________________(c) If “yes”, what has been your experience since you have switched to using other fuel sources for your household?
Please explain __________________________________________________________________________________________________________________________________________________________________________________________________________________________________________________________________________________________________________
References
1. Oyedepo, S.O. Energy and sustainable development in Nigeria: The way forward. Energy Sustain. Soc. 2012,2, 1–17. [CrossRef]
2. Martínez, D.M.; Ebenhack, B.W. Understanding the role of energy consumption in human developmentthrough the use of saturation phenomena. Energy Policy 2008, 36, 1430–1435. [CrossRef]
3. IEA; United Nations Statistics Division; International Renewable Energy Agency; World Bank; World HealthOrganization. Tracking SDG 7: The Energy Progress Report 2020; Washington, DC, USA, 2020; Available online:https://www.iea.org/reports/tracking-sdg7-the-energy-progress-report-2020 (accessed on 4 November 2020).
4. Zubi, G.; Fracastoro, G.V.; Lujano-Rojas, J.; El Bakari, K.; Andrews, D. The unlocked potential of solar homesystems; an effective way to overcome domestic energy poverty in developing regions. Renew. Energy 2019,132, 1425–1435. [CrossRef]
5. Bednar, D.J.; Reames, T.G. Recognition of and response to energy poverty in the United States. Nat. Energy2020, 5, 432–439. [CrossRef]
6. González-Eguino, M. Energy poverty: An overview. Renew. Sustain. Energy Rev. 2015, 47, 377–385. [CrossRef]7. Jessel, S.; Sawyer, S.; Hernández, D. Energy, Poverty, and Health in Climate Change: A Comprehensive
Review of an Emerging Literature. Front. Public Health 2019, 7, 357. [CrossRef]8. Reddy, A.K.N. Energy and Social Issues. In World Energy Assessment: Energy and the Challenge of Sustainability,
1st ed.; Goldenberg, J., Ed.; UNDP: New York, NY, USA, 2000; pp. 39–61.9. Bhatia, M.; Angelou, N. Beyond Connections: Energy Access Redefined; The World Bank: Washington,
DC, USA, 2015.10. Culver, L.C. Energy Poverty: What You Measure Matters. In Proceedings of the Reducing Energy Poverty
with Natural Gas: Changing Political, Business and Technology Paradigms Symposium, Stanford, CA, USA,9–10 May 2017; pp. 1–25.
11. Bhattacharyya, S.C.; Palit, D. Introduction. In Mini-Grids for Rural Electrification of Developing Countries, 1st ed.;Bhattacharyya, S.C., Palit, D., Eds.; Springer International Publishing: Cham, Switzerland, 2014; pp. 1–10.
12. Palit, D.; Bandyopadhyay, K.R. Rural electricity access in South Asia: Is grid extension the remedy? A criticalreview. Renew. Sustain. Energy Rev. 2016, 60, 1505–1515. [CrossRef]
13. Palit, D.; Chaurey, A. Off-grid rural electrification experiences from South Asia: Status and best practices.Energy Sustain. Dev. 2011, 15, 266–276. [CrossRef]
14. Bos, K.; Chaplin, D.; Mamun, A. Benefits and challenges of expanding grid electricity in Africa: A reviewof rigorous evidence on household impacts in developing countries. Energy Sustain. Dev. 2018, 44, 64–77.[CrossRef]
148

Energies 2020, 13, 6682
15. Agenbroad, J.; Carlin, K.; Ernst, K.; Doig, S. Minigrids in the Money: Six Ways to Reduce Minigrid Costs by 60%for Rural Electrification; Rocky Mountain Institute: Boulder, CO, USA, 2018.
16. Deichmann, U.; Meisner, C.; Murray, S.; Wheeler, D. The economics of renewable energy expansion in ruralSub-Saharan Africa. Energy Policy 2011, 39, 215–227. [CrossRef]
17. Carr-Wilson, S.; Pai, S. Pay-As-You-Go: How a Business Model Is Helping Light Millions of Rural KenyanHomes with Solar. Case Stud. Environ. 2018, 2, 1–10. [CrossRef]
18. Sawin, J.L.; Sverrisson, F.; Rickerson, W. Renewables 2015 Gobal Status Report; REN21: Paris, France, 2015.19. Baurzhan, S.; Jenkins, G.P. Off-grid solar PV: Is it an affordable or appropriate solution for rural electrification
in Sub-Saharan African countries? Renew. Sustain. Energy Rev. 2016, 60, 1405–1418. [CrossRef]20. Stojanovski, O.; Thurber, M.; Wolak, F. Rural energy access through solar home systems: Use patterns and
opportunities for improvement. Energy Sustain. Dev. 2017, 37, 33–50. [CrossRef]21. Ashden. Mobisol/Electrifying East Africa. Available online: https://www.ashden.org/winners/mobisol#
continue (accessed on 10 January 2018).22. Barrie, J.; Cruickshank, H.J. Shedding light on the last mile: A study on the diffusion of Pay as You Go Solar
Home Systems in Central East Africa. Energy Policy 2017, 107, 425–436. [CrossRef]23. Adwek, G.; Boxiong, S.; Ndolo, P.O.; Siagi, Z.O.; Chepsaigutt, C.; Kemunto, C.M.; Arowo, M.; Shimmon, J.;
Simiyu, P.; Yabo, A.C. The solar energy access in Kenya: A review focusing on Pay-As-You-Go solar homesystem. Environ. Dev. Sustain. 2020, 22, 3897–3938. [CrossRef]
24. Bisaga, I.; Puzniak-Holford, N.; Grealish, A.; Baker-Brian, C.; Parikh, P. Scalable off-grid energy servicesenabled by IoT: A case study of BBOXX SMART Solar. Energy Policy 2017, 109, 199–207. [CrossRef]
25. IRENA. Pay-as-You-Go Models: Innovation Landscape Brief ; International Renewable Energy Agency:Abu Dhabi, UAE, 2020.
26. Azimoh, C.L.; Klintenberg, P.; Wallin, F.; Karlsson, B. Illuminated but not electrified: An assessment ofthe impact of Solar Home System on rural households in South Africa. Appl. Energy 2015, 155, 354–364.[CrossRef]
27. Mondal, A.H.; Klein, D. Impacts of solar home systems on social development in rural Bangladesh.Energy Sustain. Dev. 2011, 15, 17–20. [CrossRef]
28. Rahman, S.M.; Ahmad, M.M. Solar Home System (SHS) in rural Bangladesh: Ornamentation or fact ofdevelopment? Energy Policy 2013, 63, 348–354. [CrossRef]
29. Lemaire, X. Solar home systems and solar lanterns in rural areas of the Global South: What impact?Wiley Interdiscip. Rev. Energy Environ. 2018, 7, e301. [CrossRef]
30. Diallo, A.; Moussa, R.K. The effects of solar home system on welfare in off-grid areas: Evidence from Côted’Ivoire. Energy 2020, 194, 1–12. [CrossRef]
31. Opiyo, N.N. Impacts of neighbourhood influence on social acceptance of small solar home systems in ruralwestern Kenya. Energy Res. Soc. Sci. 2019, 52, 91–98. [CrossRef]
32. Gustavsson, M. Educational benefits from solar technology—Access to solar electric services and changesin children’s study routines, experiences from eastern province Zambia. Energy Policy 2007, 35, 1292–1299.[CrossRef]
33. Opiyo, N.N. How solar home systems temporally stimulate increasing power demands in rural householdsof Sub-Saharan Africa. Energy Transit. 2020, 1–13. [CrossRef]
34. Lee, K.; Miguel, E.; Wolfram, C. Appliance Ownership and Aspirations among Electric Grid and Home SolarHouseholds in Rural Kenya. Am. Econ. Rev. 2016, 106, 89–94. [CrossRef]
35. World Bank. Nigeria on the Move: A Journey to Inclusive Growth. Systematic Country Diagnostic; World Bank:Washington, DC, USA, 2020.
36. Adegbami, A.; Uche, C.I.N. Ethnicity and Ethnic Politics: An Impediment to Political Development inNigeria. Public Adm. Res. 2015, 4, 59–67. [CrossRef]
37. Oginni, A.; Ahonsi, B.; Ukwuije, F. Are female-headed households typically poorer than male-headedhouseholds in Nigeria? J. Socio Econ. 2013, 45, 132–137. [CrossRef]
38. Van Den Berghe, P.L. Power and Privilege at an African University, 1st ed.; Schenkman Publishing Company,Inc.: Cambridge, MA, USA, 1973.
39. Agresti, A. An Introduction to Categorical Data Analysis, 2nd ed.; John Wiley & Sons, Inc.: Hoboken,NJ, USA, 2007.
149

Energies 2020, 13, 6682
40. Chaurey, A.; Kandpal, T.C. Carbon abatement potential of solar home systems in India and their costreduction due to carbon finance. Energy Policy 2009, 37, 115–125. [CrossRef]
41. Rehman, I.H.; Malhotra, P.; Pal, R.C.; Singh, P.B. Availability of kerosene to rural households: A case studyfrom India. Energy Policy 2005, 33, 2165–2174. [CrossRef]
42. Sarker, S.A.; Wang, S.; Adnan, M.K.M.; Anser, M.K.; Ayoub, Z.; Ho, T.H.; Tama, R.A.Z.; Trunina, A.;Hoque, M.M. Economic Viability and Socio-Environmental Impacts of Solar Home Systems for Off-GridRural Electrification in Bangladesh. Energies 2020, 13, 679. [CrossRef]
43. Alam, M.; Bhattacharyya, S. Are the off-grid customers ready to pay for electricity from the decentralizedrenewable hybrid mini-grids? A study of willingness to pay in rural Bangladesh. Energy 2017, 139, 433–446.[CrossRef]
44. Narayan, N.; Chamseddine, A.; Vega-Garita, V.; Qin, Z.; Popovic-Gerber, J.; Bauer, P.; Zeman, M. Quantifyingthe Benefits of a Solar Home System-Based DC Microgrid for Rural Electrification. Energies 2019, 12, 938.[CrossRef]
45. Narayan, N.; Chamseddine, A.; Vega-Garita, V.; Qin, Z.; Popovic-Gerber, J.; Bauer, P.; Zeman, M. Exploringthe boundaries of Solar Home Systems (SHS) for off-grid electrification: Optimal SHS sizing for the multi-tierframework for household electricity access. Appl. Energy 2019, 240, 907–917. [CrossRef]
46. Nwanne, C. New Minimum Wage of N30,000 Takes Effect. Available online: https://search.proquest.com/docview/2330910722 (accessed on 28 December 2019).
47. Koepke, M.; Groh, S. Against the Odds: The Potential of Swarm Electrification for Small Island DevelopmentStates. Energy Procedia 2016, 103, 363–368. [CrossRef]
48. Narayan, N.; Qin, Z.; Popovic-Gerber, J.; Diehl, J.; Bauer, P.; Zeman, M. Stochastic load profile constructionfor the multi-tier framework for household electricity access using off-grid DC appliances. Energy Effic. 2020,13, 197–215. [CrossRef]
49. Youmma. Reinvent Access. Available online: https://www.yoummasolar.com/ (accessed on 4 November 2020).50. Atagher, P.; Clifford, M.; Jewitt, S.; Ray, C. What’s for dinner? Gendered decision-making and energy efficient
cookstoves in benue state, north central nigeria. WIT Trans. Ecol. Environ. 2017, 224, 101–111.51. Abdullahi, A.A. An Analysis of the Role of Women in Curbing Energy Poverty in Nigeria. J. Sustain.
Dev. Stud. 2017, 10, 45–60.52. Jewitt, S.; Atagher, P.; Clifford, M. “We cannot stop cooking”: Stove stacking, seasonality and the risky
practices of household cookstove transitions in Nigeria. Energy Res. Soc. Sci. 2020, 61, 101340. [CrossRef]
Publisher’s Note: MDPI stays neutral with regard to jurisdictional claims in published maps and institutionalaffiliations.
© 2020 by the authors. Licensee MDPI, Basel, Switzerland. This article is an open accessarticle distributed under the terms and conditions of the Creative Commons Attribution(CC BY) license (http://creativecommons.org/licenses/by/4.0/).
150

energies
Article
On Approaching Relevant Cost-Effective SustainableMaintenance of Mineral Oil-Filled Electrical Transformers
Ramsey Jadim 1,*, Mirka Kans 1, Jesko Schulte 2, Mohammed Alhattab 3, May Alhendi 3 and Ali Bushehry 3
���������������
Citation: Jadim, R.; Kans, M.;
Schulte, J.; Alhattab, M.; Alhendi, M.;
Bushehry, A. On Approaching
Relevant Cost-Effective Sustainable
Maintenance of Mineral Oil-Filled
Electrical Transformers. Energies 2021,
14, 3670. https://doi.org/10.3390/
en14123670
Academic Editors: T M Indra Mahlia
and Islam Md Rizwanul Fattah
Received: 20 May 2021
Accepted: 18 June 2021
Published: 20 June 2021
Publisher’s Note: MDPI stays neutral
with regard to jurisdictional claims in
published maps and institutional affil-
iations.
Copyright: © 2021 by the authors.
Licensee MDPI, Basel, Switzerland.
This article is an open access article
distributed under the terms and
conditions of the Creative Commons
Attribution (CC BY) license (https://
creativecommons.org/licenses/by/
4.0/).
1 Department of Mechanical Engineering, Faculty of Technology, Linnaeus University, 351 95 Växjö, Sweden;[email protected]
2 Department of Strategic Sustainable Development, Blekinge Institute of Technology,371 79 Karlskrona, Sweden; [email protected]
3 Primary Substation Maintenance Department, Ministry of Electricity and Water, Safat 13001, Kuwait;[email protected] (M.A.); [email protected] (M.A.); [email protected] (A.B.)
* Correspondence: [email protected]
Abstract: Fire and explosion accidents of oil-filled electrical transformers are leading to negativeimpacts, not only on the delivery of energy, but also on workplace health and safety as well asthe surrounding environment. Such accidents are still being reported, regardless of applying theregular maintenance strategy in the power plants. The purpose of this paper is to integrate asustainability perspective into the maintenance strategy. The problem addressed is: how can weapproach the relevant cost-effective sustainable maintenance for oil-filled electrical transformers?For this purpose, an empirical study in a power plant in Kuwait was introduced. The first stagewas to carry out a sustainability assessment using the ABCD procedure. In this procedure, gaps toapproach sustainability were identified and actions prioritized to close these gaps were demonstrated.Applying this procedure yielded an early fault diagnosis (EFD) model for achieving cost-effectivesustainable maintenance using a fault trend chart based on a novel numerical method. Implementingthis model resulted in an extension of the lifetime of transformers with suspected failure propagation,leading to a deferral of the replacement investment costs. The principal conclusion of this paper isthe importance of viewing the maintenance strategy of transformers from a strategic sustainabilityperspective, in order to approach relevant cost-effective sustainable maintenance.
Keywords: maintenance strategy; sustainable maintenance; ABCD procedure; strategic sustainabledevelopment; transformer failures
1. Introduction
The basic components of an oil-filled electrical transformer are copper windings andan iron core. The windings contain copper coil turns bundled together and wrapped withinsulating paper. These components are entirely immersed in a mineral insulating oilin the transformer tank [1]. Overheating of the insulating oil in-service can occur dueto increased current load, oxidation, and corrosion deposits on windings, or unexpectedelectrical and mechanical faults resulting in the formation of partial discharge (corona)and arcing phenomena, which in turn can generate flammable gases. The energy in thesephenomena can be very high and develop temperatures in hundreds of degrees, though fora short time, causing fire and explosion accidents [2–5]. The transformer fires that containseveral tons of mineral insulating oil can not only impact on the delivery of energy, but alsoon workplace health and the surrounding environment [6,7]. In [8], statistical data analysisof the failure rate of European substation transformers between 2000 and 2010 showedthat around 9.5% of the total failures caused fire accidents and 3.3% caused explosionaccidents. Another source of failure rates from 2015 [9] showed a significant increase in fireand explosion accidents in USA. These accidents occurred regardless of using the regularmaintenance strategy during the transformer’s useful life [2,10].
Energies 2021, 14, 3670. https://doi.org/10.3390/en14123670 https://www.mdpi.com/journal/energies
151

Energies 2021, 14, 3670
The common regular maintenance strategy used for high voltage substation powertransformers is condition-based maintenance (CBM) [3,11] which is defined according toEN 13306:2017 [12] as “preventive maintenance, which includes assessment of physicalconditions, analysis and the possible ensuing maintenance actions”. Oil analysis technologyis commonly used in the condition monitoring (CM) parameters to detect faults, such aspartial discharge, arcing, oxidation, and corrosion [2,13–15]. Fault detection is based onthe concentration value level of the measurable variables, such as hydrogen gas, acetylenegas, acidity, hydrogen sulfide gas, toluene, and more, related to the standard cautionlimit (the maximum value that indicates fault incidence). The corrective action is carriedout once the measured value of a measurable variable exceeds its caution limit [13–17].Onsite electrical testing technology is also used in the maintenance strategy to identify thetype and location of the fault. However, this technology is usually recommended at thetransformer shutdown time for scheduled maintenance or when a fault is suspected [3,18].Assessment of the transformer’s condition, based on CM parameters, is a crucial keyin the CBM. In this context, several mathematical models are utilized in modelling thedeterioration status in order to assess the overall condition of transformers [11,19,20]. Thedrawbacks of these models are modelling the deterioration with a single path withoutconsidering the complexity of the deterioration in transformers [21], and the assessment ofoverall condition without providing information about the root cause of the fault [20].
Sustainable maintenance of transformers is considered a new challenge that requiresan understanding of the process of sustainable development and the integration betweensocial and environmental aspects [11,22,23]. The vital objectives of sustainable mainte-nance are extending the lifetime of the transformers and reducing the negative impactsin a way that contributes to the organization’s own competitiveness [24]. Sustainablemaintenance is defined according to [22] as “proactive maintenance operations strivingfor providing balance in social, environmental, and financial dimensions”. Nowadays,investigations spotlight three technical methods for achieving sustainable maintenance.The first method [25], is selecting energy-efficient green transformers from manufacturersthat perform best with sustainability aspects. The concept of “green” according to [26]is related to a consideration of the environmental aspect as well as the economic benefit.An example of this method is provided by qualified raw resources such as amorphousmaterials used in the core design, yielding a core with higher hardness compared to cur-rent common iron core (silicon steel laminations), resulting in reduced energy loss andgreenhouse gas emissions [25]. The main shortcoming of this method is its availabilityonly for the newly manufactured transformers. The second method [27–29] is replacingthe mineral insulating oil with natural ester oil. The strength in using natural ester oil isthe excellent specifications, such as higher cooling efficiency, lower inflammation risk dueto high flash point value, and lower toxicity than mineral oil. The disadvantages of thisoil are the low electrical resistivity, which reduces the insulation capability of the oil, andthe high investment costs comparing with mineral oil [28]. The last method [30] is thewaste oil recycle process to remove the hazard contamination. One of the vital techniquesin this process is using the reduction procedure to remove the toxic chemical, such aspolychlorinated biphenyl (PCB) from oil waste, which has negative impacts on human andenvironmental health [31]. In general, the most critical challenge for achieving sustainablemaintenance is the investment costs of these available technical methods and the return oninvestment [25,27,30]. Therefore, it is crucial and necessary to establish a relevant sustain-able maintenance with regard to minimized costs, i.e., relevant cost-effective sustainablemaintenance. The purpose of this paper is to integrate sustainability perspective into themaintenance strategy.
Sustainability assessment in many organizations is still unclear for stakeholders [22,24].The main reason for this challenge is the complications of carrying out the assessmentdue to the lack of a well-organized procedure and lack of competence in the integrationof sustainability in the maintenance strategy. However, the sustainability assessment canbe addressed by utilizing ABCD procedure of the Framework for Strategic Sustainable
152

Energies 2021, 14, 3670
Development (FSSD) [32–34]. The outcome of applying this procedure in a power plant wascreating a model for early fault diagnosis to achieve the prioritized action for improvingthe maintenance strategy toward sustainability.
2. Methods and Materials
2.1. Methodological Approach
An empirical study was applied in this study to explore how a strategic sustainabilityperspective could be integrated into the maintenance strategy of transformers in order toapproach relevant cost-effective sustainable maintenance. According to [35], an empiricalstudy design should include five elements. The first element is the formulation of relevantquestions related to the problem, which can be used in the first interview with the organi-zation team. The second element is study propositions to be examined in the research. Thethird element is the identification of the problem to be studied. In this step, the problemshould be defined and bounded. These three elements can help in identifying the data tobe collected. The fourth element is linking the collected data to the study propositions. Thelast is establishing criteria for interpreting the findings. The last two elements elucidatethe suggested process after the data have been collected. These elements are handledin this empirical study by using the ABCD procedure structure to assess sustainability.Therefore, the ABCD procedure acts both as a structure for achieving the study design andas a theoretical framework to be tested for its applicability in the context of maintenancestrategy development.
2.2. The ABCD Procedure
A long-term strategic perspective is crucial when working with sustainability to ensurethat actions lead in the right direction towards full sustainability and contribute to theown organization’s competitiveness. In order to be strategic, it is necessary to know thedesired vision of success. This comes with the challenge of defining sustainability in a waythat is neither too broad, not providing any guidance in practice, nor too specific, makingit difficult for people to agree and risking becoming obsolete in the face of, for example,new technology advances. Within the Framework for Strategic Sustainable Development(FSSD), the following principle-based definition of sustainability is used: In a sustainablesociety, nature is not subject to systematically increasing (1) concentrations extracted fromthe Earth’s crust, (2) concentrations of substances produced by society, (3) degradation byphysical means; and people are not subject to structural obstacles to (4) health, (5) influence,(6) competence, (7) impartiality, and (8) meaning-making [33,34,36]. These eight principlesrepresent the root-causes of unsustainability, up-stream in cause-and-effect chains. Thereby,the myriad unsustainability-related impacts in social and ecological systems, such asclimate change, biodiversity loss, ozone depletion, discrimination, etc., can be related toa few comprehensive mechanisms of destruction. These eight principles can be used asboundary conditions for the re-design of socio-technical systems. They can be used tocreate that vision, which is necessary to be able to be strategic. This provides the basisfor backcasting, i.e., starting the planning process with the end in mind, asking what isnecessary to happen in order to reach the vision over time. Thereby, the direction of changecan be anticipated, enabling decision-making that makes sure to be on the right track andgiving benefits to the organization, e.g., by being ahead of legislation or meeting newcustomer demands [37]. The funnel metaphor of the FSSD can be used to understandthe sustainability challenge and the self-benefit of strategic sustainability thinking basedon backcasting from a vision framed by the eight sustainability principles [34,36,38] (seeFigure 1).
153

Energies 2021, 14, 3670
Figure 1. Funnel metaphor for transformers and the ABCD procedure for strategic sustainabledevelopment. The violations of the sustainability principles are represented here as red stars,which are hitting the funnel wall. These violations should be evaluated to identify the hotspots ofsustainability impact.
The decreasing cross-section of the funnel represents the systematic degradation ofthe social and ecological systems. Over time, a situation must be achieved where thisis no longer the case, and the funnel turns into a cylinder—this represents a sustainablestate. However, society is currently moving towards the funnel walls, which represents acollapse of the social and ecological systems. This unsustainable development comes withimportant dynamics from a business perspective. The closer society comes to the funnelwalls, the greater the need for sustainable solutions and to stop unsustainable practices.Therefore, there will be increasing business opportunities for companies that can contributetowards developing a sustainable path, while there will be increasing threats for companiesthat enforce unsustainable development. Such threats and opportunities, i.e., risks, can berelated to, for example, legislative change, brand and reputation, shifting customer needs,raw material and waste costs, the ability to attract and retain talented employees, andmore [37]. An organization must identify solutions that can work as flexible platforms onthe way towards the sustainable vision and that help to exploit business opportunities andavoid threats [39].
To operationalize this strategic sustainability thinking, the FSSD includes the ABCDprocedure. Step A includes setting up a shared understanding of the sustainability chal-lenge and defining the overall vision within the restrictions of the sustainability principles.In this step, the organization must take a long-term perspective and think of an idealsuccess vision. Besides the sustainability principles, there are no other constraints such asthe feasibility from today’s perspective. The vision created in this step provides the basisfor backcasting. In step B, an assessment of the organization’s current reality and activitiesare carried out and analyzed through the lens of the proposed vision. Thereby, hots-spotsof sustainability impact are identified, and a baseline is created. In step C, possible actionsare identified and listed to close the gaps between the vision defined in step A and thecurrent reality that was analyzed in the step B. In step D, strategic guidelines are applied toanalyze the possible actions in the step C and select the prioritized ones to be utilized in theorganization’s plan of moving to sustainability. According to the basic strategy guidelinesof the FSSD, the prioritized actions should be flexible platforms for future steps and achievea balance between the rate of improvement toward the sustainable vision and return oninvestment [33,34,36]. The organizations need to ensure that the return on investmentof applying the prioritized actions toward sustainability is satisfactory to continue the
154

Energies 2021, 14, 3670
process of moving toward sustainability. However, when the cost of actions is very high, itis recommended to wait for more studies and investigations in order to find appropriateeconomic solutions. The actions that can be easily implemented with a good return oninvestment should be started first to set up a concrete structure for the future process forthe other actions [33,34]. The ABCD procedure has been applied in various contexts tosupport strategic planning for sustainability, including in the context of sustainable productdevelopment [32].
2.3. Empirical Study Design
The ABCD procedure was applied in the Primary Substation Maintenance Department(PSMD) power plant, an organization of the Ministry of Electricity and Water in KuwaitState. The PSMD power plant is responsible for moving toward sustainability, primarily toprevent fire and explosion accidents of transformers, which recently increased. Accordingto statistical data from PSMD power plant, around 1.5% of 3950 transformers were reportedas out of service due to fire and explosion accidents during the last two decades, regardlessof applying the regular maintenance strategy. In addition, there is also a growing problem ofoil waste due to the replacement of many old and scraped transformers with new ones. ThePSMD power plant was selected among others in this study due to the availability of goodhistorical data of a massive quantity of transformers, and the appreciated cooperation of themaintenance team. Two online workshop meetings were organized by the first author withthe PSMD team from maintenance, safety, and economic departments. The first workshoptook around three hours, where relevant questions were addressed to the PSMD team. Themain questions discussed the vision, current condition monitoring practices, actions needfor sustainable maintenance, and current sustainability challenges. The problem of theincreasing rate of fire and explosion accidents was also discussed. The second workshoptook around two hours, where the problem was defined and bounded, and the propositionswere studied. Accordingly, the capability to implement the ABCD procedure to integratea strategic sustainability perspective in the current maintenance strategy was proposed.Besides, the need for the development of an effective diagnosis model for early faultdetection was also proposed. The PSMD team approved to provide access to oil analysisdata of 972 nominated oil-filled electrical transformers, with medium and large powerrates, from the laboratory’s application software in order to evaluate the transformers’condition and study the current activities from a sustainability perspective. The outcomeof the gathered data of the oil analysis was analyzed and categorized according to the faulttype (see Figure 2). The importance of the categorized data is identifying the fault typesand defining the category that can be utilized in the ABCD procedure.
Figure 2. Fault type mode analysis of 972 transformers of the PSMD power plant.
155
Energies 2021, 14, 3670
The category of “Arcing Fault” is at 6% of the fault mode. The arcing fault can beindicated by detecting a high concentration value above the caution limit of the two gases,hydrogen and acetylene. This arcing can generate extremely high temperatures over 700 ◦C,though for a short time, in the oil, leading to fire accidents [4,13,16]. The category “PartialDischarge Fault” is at 7% of the fault mode. Partial discharge can be indicated by detectinga high concentration value above the caution limit of the hydrogen gas in the oil. This faultcan occur at any temperature over 200 ◦C [4,13,16]. The category of “Oxidation DepositsFault” is at 10%, the most dominant fault mode. Oxidation products such as acidity mayconvert to ester and thereafter form sludge deposits on the transformers’ windings. Thisfault can be indicated by detecting a high concentration value above the caution limit ofthe acidity in the oil [5,15]. The category of “Corrosion Deposits Fault” is at 3% of thefault mode. The corrosion deposits are in the form of copper sulfide on the windingsof the transformers. This fault can be indicated by detecting a high concentration valueabove the caution limit of the hydrogen sulfide gas and toluene compound in the oil [2].The category “Starting Fault” is at 7% of the fault mode. This category represents thetransformers with suspected failure propagation, that have a fault in progress and needcorrective action. The investigation in this study focused on the “Starting Fault” categoryto apply a model of early fault diagnosis in order to follow up the fault before progressionto a risky level. The last category “Good Condition” represents the transformers whichhave not any fault’s indication.
3. Results
In this section, the results of applying the ABCD procedure on the transformers of thePSMD power plant are presented, as well as a model for early fault diagnosis, which wasidentified as a prioritized action.
3.1. ABCD Procedure for PSMD Power Plant
As seen from the fault type mode in Figure 2, the percentage of the total fault incidenceswas around 26% of the addressed transformers. These faults have already occurred andneed proper corrective actions to avoid further progress. However, the recommendedcorrective actions for these faults are demonstrated in the discussion section. The categorythat needs to be further investigated from a sustainability perspective is “Starting Fault”,to detect faults in the initial stage and find solutions to avoid transformer failures.
3.1.1. Step A: Building a Shared Understanding and Vision
The main vision of the PSMD power plant is to provide sustainable power for cus-tomers in the future with regard to minimized costs and implied integration betweenmaintenance and sustainability aspects; social, environmental, and economic. The othervisions are preventing transformers failures and catastrophic accidents, extending thelifetime of the transformers, and finding a solution to the hazardous oil waste.
3.1.2. Step B: Assessing the Current Reality
In this step, the current activities in the maintenance of transformers of the PSMDpower plant were investigated. Furthermore, the violations of the sustainability principleswere evaluated to identify hotspots of sustainability impact. In this study, oil analysistechnology is exclusively used in the condition monitoring (CM) parameters. The electricaltesting was excluded in this study due to the shortcoming in this technology to detect afault in the initial stage [3,18]. Measurable variables of oil analysis are demonstrated inTable 1.
156

Energies 2021, 14, 3670
Table 1. Measurable variables of oil analysis related to fault type used in the PSMD power plant.
Measurable Variable (Oil Analysis) Fault Type Standard Method
Hydrogen & Acetylene Gases Arcing IEC 60567 [40]Hydrogen Gas Partial Discharge IEC 60567 [40]
Acidity Oxidation Deposits IEC 62021-1 [41]Hydrogen Sulfide Gas & Toluene Copper Corrosion Deposits ASTM D5504 [42] & D5580 [43]
Three significant violations of the sustainability principles were recorded in the PSMDpower plant. The first hotspot is the usage of several tons of insulating oil in the transform-ers. That presents a violation of sustainability principles one and two, since it contributesto systematically increasing concentrations of substances from the Earth’s crust (fossil oil)and substances produced by society (chemical products in the oil, which can be persis-tent and bio-accumulating). The second hotspot is the existence of a huge quantity of oilwaste, which can include toxic chemicals used as additives or generated as by-products ofchemical reactions in the oil during the transformer’s useful life. That can be a violation ofsustainability principle two. The third hotspot is the possibility of exposing the workforceor people near the fire and explosion accidents to negative impacts. That can be a violationof sustainability principle four, since it can present a structural obstacle to health.
3.1.3. Step C: Brainstorming Actions to Close the Gaps
The main gap in the current maintenance strategy is the shortcoming in detectingfaults in the initial stage during the transformers’ useful life to prevent failures. In thiscontext, the interpretation and evaluation of the analysis results are currently based onthe standard guidelines that recommends corrective action when the measured valueof a measurable variable exceeds its caution limit. For example, standard guideline IEC60422 [15] recommends starting corrective action such as oil regeneration or oil replacementas soon as the acidity value, which is considered the indication key of oxidation depositson the windings, exceeds its caution limit. However, this corrective action can be nomore useful to solve the issue early because the deposits may have already, partially orentirely, formed. Another gap is the lack of the maintenance team’s competence in theimplementation of sustainable maintenance. Accordingly, a list of possible actions can beindicated to close most of the mentioned gaps. The suggested possible actions in order tocomply with the sustainability principles and to approach the vision are:
1. Improving the maintenance strategy for more effectiveness being able to detect earlyfaults and carry out corrective actions at the correct time. Hence, it is necessary todevelop an effective fault diagnosis model to provide information that can triggeran alarm for carrying out corrective action before fault incidence, on the other hand,before the measured value of a measurable variable exceeds its caution limit.
2. Providing sustainable maintenance training to enrich the maintenance team of thePSMD power plant with the knowledge of sustainability and improve the company’seffectiveness.
3. Recycling waste oil to reduce the impacts of toxic compounds on the environment.
3.1.4. Step D: Prioritization
One or more prioritized actions can be selected among the possible actions indicated instep C. Analyzing all these actions shows that the third action received a lower priority dueto the requirements of an economic plan to evaluate the return on investment of recyclingseveral tons of waste oils. The first and second actions are the highest priority to the PSMDpower plant in order to accomplish the sustainable vision, due to the following strategicguidelines:
• Possibility to apply in today’s scenario.• Flexible platforms for future development if required.• It can reduce the PSMD power plant misalignments with the sustainability principles.
157
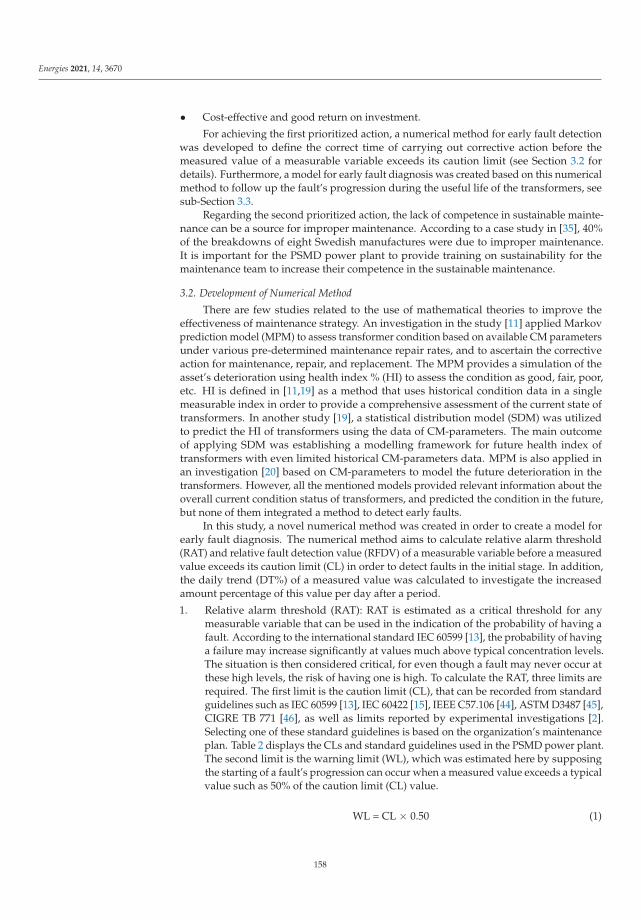
Energies 2021, 14, 3670
• Cost-effective and good return on investment.
For achieving the first prioritized action, a numerical method for early fault detectionwas developed to define the correct time of carrying out corrective action before themeasured value of a measurable variable exceeds its caution limit (see Section 3.2 fordetails). Furthermore, a model for early fault diagnosis was created based on this numericalmethod to follow up the fault’s progression during the useful life of the transformers, seesub-Section 3.3.
Regarding the second prioritized action, the lack of competence in sustainable mainte-nance can be a source for improper maintenance. According to a case study in [35], 40%of the breakdowns of eight Swedish manufactures were due to improper maintenance.It is important for the PSMD power plant to provide training on sustainability for themaintenance team to increase their competence in the sustainable maintenance.
3.2. Development of Numerical Method
There are few studies related to the use of mathematical theories to improve theeffectiveness of maintenance strategy. An investigation in the study [11] applied Markovprediction model (MPM) to assess transformer condition based on available CM parametersunder various pre-determined maintenance repair rates, and to ascertain the correctiveaction for maintenance, repair, and replacement. The MPM provides a simulation of theasset’s deterioration using health index % (HI) to assess the condition as good, fair, poor,etc. HI is defined in [11,19] as a method that uses historical condition data in a singlemeasurable index in order to provide a comprehensive assessment of the current state oftransformers. In another study [19], a statistical distribution model (SDM) was utilizedto predict the HI of transformers using the data of CM-parameters. The main outcomeof applying SDM was establishing a modelling framework for future health index oftransformers with even limited historical CM-parameters data. MPM is also applied inan investigation [20] based on CM-parameters to model the future deterioration in thetransformers. However, all the mentioned models provided relevant information about theoverall current condition status of transformers, and predicted the condition in the future,but none of them integrated a method to detect early faults.
In this study, a novel numerical method was created in order to create a model forearly fault diagnosis. The numerical method aims to calculate relative alarm threshold(RAT) and relative fault detection value (RFDV) of a measurable variable before a measuredvalue exceeds its caution limit (CL) in order to detect faults in the initial stage. In addition,the daily trend (DT%) of a measured value was calculated to investigate the increasedamount percentage of this value per day after a period.
1. Relative alarm threshold (RAT): RAT is estimated as a critical threshold for anymeasurable variable that can be used in the indication of the probability of having afault. According to the international standard IEC 60599 [13], the probability of havinga failure may increase significantly at values much above typical concentration levels.The situation is then considered critical, for even though a fault may never occur atthese high levels, the risk of having one is high. To calculate the RAT, three limits arerequired. The first limit is the caution limit (CL), that can be recorded from standardguidelines such as IEC 60599 [13], IEC 60422 [15], IEEE C57.106 [44], ASTM D3487 [45],CIGRE TB 771 [46], as well as limits reported by experimental investigations [2].Selecting one of these standard guidelines is based on the organization’s maintenanceplan. Table 2 displays the CLs and standard guidelines used in the PSMD power plant.The second limit is the warning limit (WL), which was estimated here by supposingthe starting of a fault’s progression can occur when a measured value exceeds a typicalvalue such as 50% of the caution limit (CL) value.
WL = CL × 0.50 (1)
158
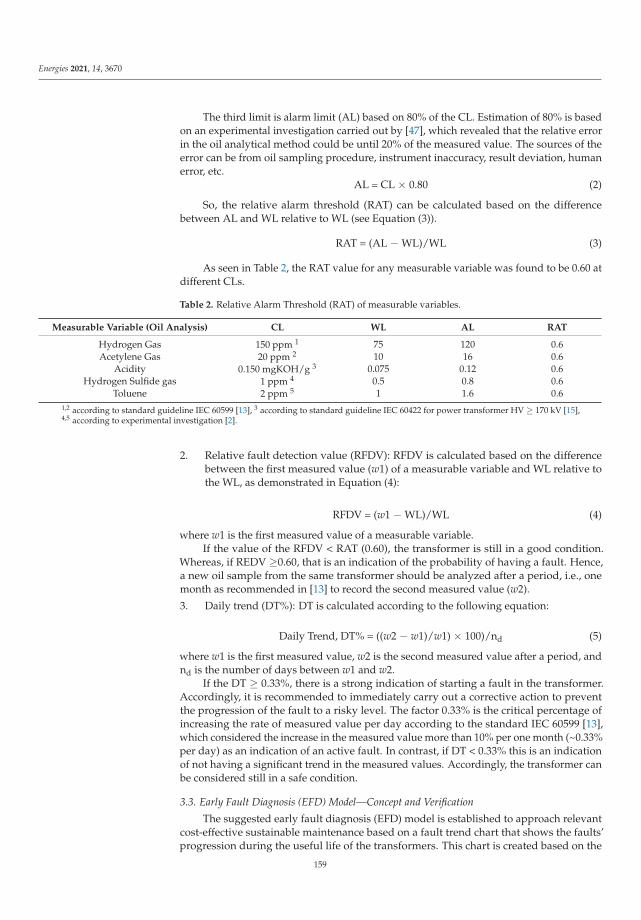
Energies 2021, 14, 3670
The third limit is alarm limit (AL) based on 80% of the CL. Estimation of 80% is basedon an experimental investigation carried out by [47], which revealed that the relative errorin the oil analytical method could be until 20% of the measured value. The sources of theerror can be from oil sampling procedure, instrument inaccuracy, result deviation, humanerror, etc.
AL = CL × 0.80 (2)
So, the relative alarm threshold (RAT) can be calculated based on the differencebetween AL and WL relative to WL (see Equation (3)).
RAT = (AL − WL)/WL (3)
As seen in Table 2, the RAT value for any measurable variable was found to be 0.60 atdifferent CLs.
Table 2. Relative Alarm Threshold (RAT) of measurable variables.
Measurable Variable (Oil Analysis) CL WL AL RAT
Hydrogen Gas 150 ppm 1 75 120 0.6Acetylene Gas 20 ppm 2 10 16 0.6
Acidity 0.150 mgKOH/g 3 0.075 0.12 0.6Hydrogen Sulfide gas 1 ppm 4 0.5 0.8 0.6
Toluene 2 ppm 5 1 1.6 0.61,2 according to standard guideline IEC 60599 [13], 3 according to standard guideline IEC 60422 for power transformer HV ≥ 170 kV [15],4,5 according to experimental investigation [2].
2. Relative fault detection value (RFDV): RFDV is calculated based on the differencebetween the first measured value (w1) of a measurable variable and WL relative tothe WL, as demonstrated in Equation (4):
RFDV = (w1 − WL)/WL (4)
where w1 is the first measured value of a measurable variable.If the value of the RFDV < RAT (0.60), the transformer is still in a good condition.
Whereas, if REDV ≥0.60, that is an indication of the probability of having a fault. Hence,a new oil sample from the same transformer should be analyzed after a period, i.e., onemonth as recommended in [13] to record the second measured value (w2).
3. Daily trend (DT%): DT is calculated according to the following equation:
Daily Trend, DT% = ((w2 − w1)/w1) × 100)/nd (5)
where w1 is the first measured value, w2 is the second measured value after a period, andnd is the number of days between w1 and w2.
If the DT ≥ 0.33%, there is a strong indication of starting a fault in the transformer.Accordingly, it is recommended to immediately carry out a corrective action to preventthe progression of the fault to a risky level. The factor 0.33% is the critical percentage ofincreasing the rate of measured value per day according to the standard IEC 60599 [13],which considered the increase in the measured value more than 10% per one month (~0.33%per day) as an indication of an active fault. In contrast, if DT < 0.33% this is an indicationof not having a significant trend in the measured values. Accordingly, the transformer canbe considered still in a safe condition.
3.3. Early Fault Diagnosis (EFD) Model—Concept and Verification
The suggested early fault diagnosis (EFD) model is established to approach relevantcost-effective sustainable maintenance based on a fault trend chart that shows the faults’progression during the useful life of the transformers. This chart is created based on the
159

Energies 2021, 14, 3670
outcome of the numerical method for early fault detection. In order to verify the outcomeof the numerical method throughout the fault trend chart, four transformers with suspectedfailure propagation, of the PSMD power plant from the category “Start Fault” were selectedbased on covering all fault types to follow up their progression. The measurable variablesthat used in this chart were hydrogen gas, acetylene gas, acidity, hydrogen sulfide gas,and toluene to detect anticipated arcing, partial discharge, oxidation, and corrosion faults.The standard methods used for analysis of these measurable variables are demonstratedin Table 1. The uncertainty (Uexp.) of five repeated measurements of each measurablevariable; hydrogen gas, acetylene gas, hydrogen sulfide gas, toluene, and acidity, was ±3.6of mean value 104.4 ppm, ±0.37 of mean value 10.1 ppm, ±0.035 of mean value 0.51 ppm,±0.063 of mean value 1.51 ppm, and ±0.031 of mean value 0.10 mgKOH/g, respectively.Furthermore, the relative standard deviation (RSD%) for same measurements was 3.2%,3.8%, 3.1%, 3.6% and 3,2%, respectively. The historical data of these four transformers hasbeen gathered since December 2018. Measured values for each transformer were recordedwith three months interval, in March, June, September, and middle of November andDecember 2019 (see Figure 3).
Figure 3. Fault trend chart of the four transformers with suspected failure propagation. CL= Caution Limit; WL= WarningLimit; w1 = First measured value; w2 = Second measured value. (a) Chart of “Arcing Fault” for the generation of the gaseshydrogen and acetylene in the first transformer registered serial number 107772 (Power rate = 20 MVA, HV = 33 kV);(b) Chart of “Partial Discharge Fault” for the generation of the hydrogen gas in the second transformer registered serialnumber 20081807 (30 MVA, 132 kV); (c) Chart of “Oxidation Deposits Fault” for the generation of the acidity in thethird transformer registered serial number 3247PG1548 (300 MVA, 275 kV); (d) Chart of “Corrosion Deposits Fault” forthe generation of the hydrogen sulfide gas and toluene compound in the fourth transformer registered serial number07MD970101 (30 MVA, 132 kV).
160

Energies 2021, 14, 3670
4. Discussion
The purpose of applying ABCD procedure in the PSMD power plant was to assess thesustainability level of the transformers and find the gaps to approach the vision of providingsustainable power with regard to minimized costs. The outcomes of this investigation canbe summarized as follows:
1. The suggested early fault diagnosis (EFD) model using the fault trend chart, whichshows the faults’ progression based on the novel numerical method, was provedas a relevant model for approaching cost-effective sustainable maintenance. Byutilizing this finding, the gaps to achieve the PSMD power plant vision were fulfilled,resulting in the extension of the lifetime of the four transformers with suspectedfailure propagation. A foremost challenge connected to this suggested model is theapplication on old transformers with insufficient historical data of oil analyses.
2. As seen in charts a–d of Figure 3, the measured values in March and June 2019were less than warning limit (WL), which indicates that the transformers were ingood condition. In September, the values exceeded the WL, but the calculated RFDVwas <0.60, which indicates that the transformers were still in good condition. InNovember, the measured values (w1) for all transformers were significantly increasedand accordingly the calculated RFDV was >0.60, which indicates the probability ofhaving a fault in the initial stage. Hence, the analysis of the second measured values(w2) was carried out one month later, December 2019, to calculate the daily trend% asfollows:
• Figure 3a represents the generation of hydrogen and acetylene gases beforeexceeding the caution limits (CLs) of 150 and 20 ppm, respectively. The dailytrend after one month was >0.33%, which indicates that the arcing fault is inprogress. Accordingly, carrying out arcing measurement was recommended tofind the source of overheating. In the arcing measurement, a high-frequencycurrent transducer clamping on the transformer’s grounding cable was used todetect the source and site of the arcing [48].
• Figure 3b represents the generation of hydrogen gas before exceeding the CLof 150 ppm. The daily trend after one month was <0.33%, which indicates thatthe partial discharge fault is not in progress. However, if there is an indicationof a partial discharge progression, the recommended corrective action could beto carry out a partial discharge test [49,50], utilizing infrared thermal imagingtechnology [51] to find the source of overheating and the site of the expectedflashpoint in the transformer.
• Figure 3c represents the formation of acidity before exceeding the CL of0.15 mgKOH/g. The daily trend after one month was >0.33%, which indi-cates that the oxidation fault is in progress. Accordingly, adding an antioxidantadditive in the insulating oil was recommended to suppress the oxidation reac-tion [52].
• Figure 3d represents the generation of hydrogen sulfide gas and toluene com-pound before exceeding the CLs of 1 and 2 ppm, respectively. The daily trendafter one month was <0.33%, which indicates that the corrosion fault is not inprogress. However, if there is an indication of a corrosion progression, the rec-ommended corrective action could be adding an anticorrosion additive in theinsulating oil to suppress the corrosion reaction [53].
3. An example of applying the numerical method is demonstrated here to elucidatethe calculation process. Suppose a maintenance team in a power plant observed avariation in the transformer performances when the measured value of hydrogen gas,a key indicator of partial discharge, was high. An oil sample from this transformerwas analyzed for the first measured value of hydrogen gas (w1) and was found125 ppm. The question: Is there any indication of partial discharge fault in progress?
161

Energies 2021, 14, 3670
As the measured value of the hydrogen was 125 ppm in the example, which is belowcaution limit (CL= 150 ppm) but above the alarm limit (AL= 120 ppm) (see Table 2), therelative fault detection value (RFDV) of hydrogen gas value should be calculated accordingto Equation (4),
RFDV = (w1 − WL)/WL = (125 − 75)/75 = 0.67
The REDV was >RAT (0.60), so it was recommended to take another oil sample afterone month (30 days) for analysis of the second measured value (w2). The value of w2 wasfound 138 ppm. Then the daily trend should be calculated according to Equation (5),
DT = ((w2 − w1)/w1) ∗ 100)/nd = ((138 − 125)/125) ∗ 100)/30 = 0.35%
As the DT of hydrogen gas value was >0.33%, there is a strong indication of starting apartial discharge fault. Accordingly, it is recommended to start an investigation to solve theproblem before fault’s progression to a risky level. This example shows that the correctiveaction could be carried out before a measured value exceeds its caution limit. The flowdiagram in Figure 4 elucidates the process steps of using the numerical method in themaintenance strategy.
Figure 4. Flow diagram of the numerical method. w1 = First measured value, w2 = Second measured value CL = CautionLimit, WL = Warning Limit, and RFDV = Relative Fault Detection Value.
162
Energies 2021, 14, 3670
The flow diagram starts with oil analysis of the first measured value (w1) representingany related measurable variable. There are three alternative evaluation outcomes for thew1. The first is w1 less than WL, which reveals good condition of the transformer, hencea new oil sample could be recommended annually according to [15] or according to theorganization maintenance plan. The second is w1 more than CL, which indicates a fault inprogress, i.e., fault has already occurred and may lead to fire and explosion accidents. Thelast is w1 more than WL and below CL, which reveals the probability of having a fault inthe initial stage. In this last alternative, the numerical method could be applied to assessthe fault level and carry out appropriate corrective action to prevent fault incidence. Ifthe fault is not in the risky level, the oil sample could be recommended for analysis withthree months interval according to [2], in order to gather sufficient data for an accurateevaluation of the fault’s progression. The generic procedure described in Figure 4 providesa structured process for CBM purposes using any measurable variable at any cautionlimit. The main advantage of applying the numerical method is the possibility of earlyfaults detection before progression to a risky level. The disadvantage is the requirement ofhistorical data to track the fault level.
4. By applying the fault trend chart using the numerical method, the faults were de-tected early before progression to a risky level, resulting in the extension of thelifetime of the transformers with suspected failure propagation. Hence, the gap in theimplementation of sustainable maintenance is fulfilled.
5. The outline of capabilities and shortcomings in the early fault diagnosis (EFD) modelcomparing with other technical methods of sustainable maintenance are demonstratedin a matrix schedule (see Table 3).
Table 3. Matrix of capabilities and shortcomings in the technical methods of sustainable maintenance.
Methods of Sustainable Maintenance Efficiency Cost Investment Ease of Apply Limitation
Energy-efficient green transformers Good High No Only for new transformersNatural ester oil Good High No Low electrical resistivityWaste oil recycle Good High No High investment cost
Early Diagnosis Method (EFD) Model Good Low Yes Needs historical data
6. For further verification and validation, the model will be applied for tracking thefault type “copper corrosion” on 84 transformers at the PSMD power plant. Forfuture work, the application of the EFD model can be extended to another field, suchas any asset containing oil in production manufacturing. Future work could alsoinvolve investigations to find a solution to the insufficient historical oil analysis dataof transformers to be used in the EFD model.
5. Conclusions
The principal conclusion of this paper is the importance of viewing the maintenancestrategy of transformers from a strategic sustainability perspective, in order to approachrelevant cost-effective sustainable maintenance. This was proven in the empirical study bydetecting the faults in the initial stage using the early fault diagnosis (EFD) model. Severalconclusions can also be highlighted as follows:
• The suitability of applying the ABCD procedure to assess the sustainability aspectsfor moving toward sustainable maintenance. Due to its intelligible guidance structureand its flexible process, the ABCD procedure is a useful and well-organized tool forintegrating sustainability into transformer maintenance, which was demonstrated bythe empirical study.
• The suggested EFD model for the empirical study has succeeded in filling the gap toapproach relevant cost-effective sustainable maintenance.
163

Energies 2021, 14, 3670
• The importance of defining the correct time of carrying out corrective actions beforethe measured value of a measurable variable exceeds its caution limit. This wasillustrated throughout tracking the faults in the fault trend chart.
• The benefits of integrating the EFD model in the CBM strategy compared with othermodels detecting faults in the initial stage, defining the correct time of correctiveactions, easily modelling any measurable variable in the fault trend chart at anycaution limit, and providing a transformer diagnosis at specific and overall faultparameters.
Author Contributions: Conceptualization, visualization, investigation, methodology, writing—original draft preparation, R.J.; supervision, reviewing and editing of the maintenance part, M.K.;reviewing and editing of the sustainability part, J.S.; providing data, participating in the workshops,and reviewing the outcome of the workshops, M.A. (Mohammed Alhattab), M.A. (May Alhendi),and A.B. All authors have read and agreed to the published version of the manuscript.
Funding: This research received no external funding.
Institutional Review Board Statement: Not applicable.
Informed Consent Statement: Not applicable.
Data Availability Statement: Not applicable.
Acknowledgments: Authors acknowledge the support of the PSMD-power plant, Kuwait Ministryof Electricity and Water, for providing the analysis data and resources. Authors also wish to ac-knowledge the support of SAECO laboratory of Saudi Arabian Engineering Company for analysisservice.
Conflicts of Interest: The authors declare no conflict of interest. The funders had no role in the designof the study; in the collection, analyses, or interpretation of data; in the writing of the manuscript, orin the decision to publish the results.
Abbreviations
AL Alarm LimitBTA Benzo TriazoleCBM Condition Based MaintenanceCCD Covered Conductor DepositionCL Caution LimitCM Condition MonitoringDBDS Dibenzyl disulfideDT Daily Trend %EFD Early Fault DiagnosisFSSD Framework for Strategic Sustainable DevelopmentHI Health Index %H2S Hydrogen sulfide gasIrgamet 39 Toluiltriazole-dialkylamineMPM Markov Prediction ModelPCB Polychlorinated biphenylPPM Part per millionPSMD Primary Substation Maintenance DepartmentRAT Relative Alarm ThresholdRFDV Relative Fault Detection ValueRSD Relative Standard Deviation %SDM Statistical Distribution ModelUexp Expanded uncertaintyWL Warning Limit
164

Energies 2021, 14, 3670
References
1. Kulkarni, S.; Khaparde, S. Transformer Engineering Design and Practice, 1st ed.; Marcel Dekker: New York, NY, USA, 2004.2. Jadim, R.; Kans, M.; Rehman, S.; Alhems, L.A. A relevant condition monitoring of corrosive sulphur deposition on the windings
of oil-filled electrical transformers. IEEE Trans. Dielectr. Electr. Insul. 2020, 27, 1736–1742. [CrossRef]3. Jadim, R.; Ingwald, A.; Al-Najjar, B. A Review Study of Condition Monitoring and Maintenance Approaches for Diagnosis
Corrosive Sulphur Deposition in Oil-Filled Electrical Transformers. In Proceedings of the New Paradigm of Industry 4.0, Studiesin Big Data 64, Bhubaneswar, India, 27 September 2018.
4. Akshatha, A.; Anjana, K.; Ravindra, D.; Vishwanath, G.; Rajan, J. Study of Copper Corrosion in Transformers due to Sulphurin Oil Using Chemical Methods. In Proceedings of the International Conference IEEE on Electrical Insulation and DielectricPhenomena (CEIDP), Montreal, QC, Canada, 14 October 2012.
5. Liland, K.; Kes, M.; Glomm, M.; Lundgaard, L.; Christensen, B. Study of oxidation and hydrolysis of oil impregnated paperinsulation for transformers using a microcalorimeter. IEEE Trans. Dielectr. Electr. Insul. 2011, 18, 2059–2068. [CrossRef]
6. El-Harbawi, M.; Al-Mubaddel, F. Risk of fire and explosion in electrical substations due to the formation of flammable mixtures.Sci. Rep. Nat. Res. 2020, 10, 6295. [CrossRef] [PubMed]
7. Allan, J. Fires and Explosions in Substations. In Proceedings of the International Conference and Exhibition IEEE/PES onTransmission and Distribution, Yokohama, Japan, 6 October 2002.
8. Vahidi, F.; Tenbohlen, S. Statistical Failure Analysis of European Substation Transformers. In Proceedings of the ConferenceETG-Fachbericht—Diagnostik Elektrischer Betriebsmittel, Berline, Germany, 25 November 2014.
9. Heinz-Peter, B.; Nicole, F. Reliability and vulnerability of transformers for electricity transmission and distribution. J. Pol. Saf.Reliab. 2015, 3, 15–23.
10. Amaro, P.S.; Facciotti, M.; Holt, A.F.; Pilgrim, J.A.; Lewin, P.L.; Brown, R.C.D.; Wilson, G.; Jarman, P. Tracking Copper SulfideFormation in Corrosive Transformer Oil. In Proceedings of the Annual Report Conference on Electrical Insulation and DielectricPhenomena: Proceedings of the IEEE Conference, Chenzhen, China, 20 October 2013.
11. Yahaya, M.S.; Azis, N.; Selva, A.M.; Ab Kadir, M.Z.A.; Jasni, J.; Hairi, M.H.; Ghazali, Y.Z.Y.; Talib, M.A. Effect of pre-determinedmaintenance repair rates on the health index state distribution and performance condition curve based on the Markov predictionmodel for sustainable transformers asset management strategies. Sustainability 2018, 10, 3399. [CrossRef]
12. EN 13306. Standard for Maintenance-Maintenance Terminology. Available online: https://infostore.saiglobal.com/en-gb/Standards/BS-EN-13306-2017-232245_SAIG_BSI_BSI_543804/ (accessed on 1 January 2017).
13. IEC 60599, Mineral Oil-Filled Electrical Equipment in Service—Guidance on the Interpretation of Dissolved and Free GasesAnalysis. In Proceedings of the International Electrotechnical Commission, Geneva, Switzerland, 16 September 2015.
14. Wada, J.; Ueta, G.; Okabe, S. Method to evaluate the degradation condition of transformer insulating oil—establishment of theevaluation method and application to field transformer oil. IEEE Trans. Dielectr. Electr. Insul. 2015, 22, 1266–1274. [CrossRef]
15. IEC 60422. Mineral Insulating Oils in Electrical Equipment—Supervision and Maintenance Guidance. In Proceedings of theInternational Electrotechnical Commission, Geneva, Switzerland, 10 January 2013.
16. Bustamante, S.; Manana, M.; Arroyo, A.; Castro, P.; Laso, A.; Martinez, R. Dissolved gas analysis equipment for online monitoringof transformer oil: A review. Sensors 2019, 19, 4057. [CrossRef]
17. Mharakurwa, E.T.; Nyakoe, G.N.; Akumu, A.O. Power transformer fault severity estimation based on dissolved gas analysis andenergy of fault formation technique. J. Electr. Comput. Eng. 2019, 2019, 1–10. [CrossRef]
18. Mendler, R.; Osborne, G.D.; Thevenet, T.; Janak, M. Electrical Equipment Maintenance 101. In Proceedings of the IEEE Petroleumand Chemical Industry Conference (PCIC), Toronto, ON, Canada, 19 September 2011.
19. Mohd Selva, A.; Azis, N.; Shariffudin, N.S.; Ab Kadir, M.Z.A.; Jasni, J.; Yahaya, M.S.; Talib, M.A. Application of statisticaldistribution models to predict health index for condition-based management of transformers. Appl. Sci. 2021, 11, 2728. [CrossRef]
20. Mohd Selva, A.; Azis, N.; Yahaya, M.S.; Ab Kadir, M.Z.A.; Jasni, J.; Yang Ghazali, Y.Z.; Talib, M.A. Application of Markov modelto estimate individual condition parameters for transformers. Energies 2018, 11, 2114. [CrossRef]
21. Liang, Z.; Parlikad, A. A Markovian model for power transformer maintenance. Electr. Power Energy Syst. 2018, 99, 175–182.[CrossRef]
22. Jasiulewicz-Kaczmarek, M. The Role and Contribution of Maintenance in Sustainable Manufacturing. In Proceedings ofthe International Conference 7th IFAC on Manufacturing Modelling, Management, and Control, International Federation ofAutomatic Control, Saint Petersburg, Russia, 19 June 2013.
23. Hjortha, P.; Bagheria, A. Navigating towards sustainable development: A system dynamics approach. Futures 2006, 38, 74–92.[CrossRef]
24. Vladimir, V.; Jasiulewicz-Kaczmarek, M. Maintenance in sustainable manufacturing. Sci. J. Logist. 2014, 10, 273–284.25. Yurekten, S.; Kara, A.; Mardikyan, K. Energy Efficient Green Transformer Manufacturing with Amorphous Cores. In Proceedings
of the International Conference on Renewable Energy Research and Applications, Madrid, Spain, 20 October 2013.26. Saettaa, S.; Caldarellia, V. Lean production as a tool for green production: The green foundry case Study. ScienceDirect 2020, 42,
498–502. [CrossRef]
165

Energies 2021, 14, 3670
27. Pompili, M.; Calcara, L.; Sturchio, A.; Catanzaro, F. Natural Esters Distribution Transformers: A Solution for Environmental andFire Risk Prevention. In Proceedings of the IEEE International Conference, Annual Conference (AEIT), Capri, Italy, 5 October 2016.
28. Perrier, C.; Ryadi, M.; Bertrand, Y.; Tran Du, C. Comparison between Mineral and Ester Oils. In Proceedings of the Cigre 10Conference, Paris, France, 22 August 2010.
29. Hernandez-Herrera, H.; Silva-Ortega, J.I.; Mejia-Taboada, M.; Jacome, A.D.; Torregroza-Rosas, M. Natural Ester Fluids Applica-tions in Transformers as a Sustainable Dielectric and Coolant. In Proceedings of the AIP Proceeding Conference 2123, Beirut,Lebanon, 10 April 2019.
30. Liu, Q.; Venkatasubramanian, R.; Matharage, S.; Wang, Z. Effect of oil regeneration on improving paper conditions in a distributiontransformer. Energy 2019, 12, 1665. [CrossRef]
31. Choi, H.; Veriansyah, B.; Kim, J.; Duck, K.J.; Lee, Y. Recycling of transformer oil contaminated by polychlorinated biphenyls(PCBs) using catalytic hydrodechlorination. J. Environ. Sci. Health Part A 2009, 44, 494–501. [CrossRef]
32. Schulte, J.; Hallstedt, S. Workshop Method for Early Sustainable Product Development. In Proceedings of the InternationalDesign Conference-DESIGN, Dubrovnik, Croatia, 21 May 2018.
33. Robèrt, K.; Broman, G.; Waldron, D.; Ny, H.; Hallstedt, S.; Cook, D.; Johansson, L.; Oldmark, J.; Basile, G.; Haraldsson, H.; et al.Planning and acting strategically towards sustainability. In Sustainability Handbook, 2nd ed.; Studentlitteratur AB: Lund, Sweden,2019.
34. Broman, G.; Robèrt, K. A framework for strategic sustainable development. J. Clean. Prod. 2017, 140, 17–31. [CrossRef]35. Yin, R.K. Case Study Research and Applications: Design and Methods, 6th ed.; SAGE Publications: Thousand Oaks, CA, USA, 2018.36. Filippis, C.; Maiber, I.; Vidler, H.; Wilbrink, T. Taking Care to Change Trajectory-Exploring an Integrated Process of Collective
Narrative Practices and Strategic Sustainable Development. Master’s Thesis, Blekinge Institute of Technology Karlskrona,Blekinge, Sweden, 2019.
37. Schulte, J.; Hallstedt, S. Company risk management in light of the sustainability transition. Sustainability 2018, 10, 4137. [CrossRef]38. Robert, K. Tools and concepts for sustainable development, how do they relate to a general framework for sustainable develop-
ment, and to each other? J. Clean. Prod. 2000, 8, 243–254. [CrossRef]39. Schulte, J.; Villamil, C.; Hallstedt, S.I. Strategic sustainability risk management in product development companies: Key aspects
and conceptual approach. Sustainability 2020, 12, 10531. [CrossRef]40. IEC 60567. Oil-Filled Electrical Equipment—Sampling of Gases and of Oil for Analysis of Free and Dissolved Gases—Guidance.
In Proceedings of the International Electrotechnical Commission, Geneva, Switzerland, 4 June 2013.41. IEC 62021-3. Insulating Liquids—Determination of Acidity—Part 3: Test Methods for Non-Mineral Insulating Oils. In Proceedings
of the International Electrotechnical Commission, Geneva, Switzerland, 19 March 2014.42. ASTM D5504. Standard Test Method for Determination of Sulfur Compounds in Natural Gas and Gaseous Fuels by Gas
Chromatography and Chemiluminescence. In Proceedings of the American Society for Testing and Materials, West Conshohocken,PA, USA, 1 November 2020.
43. ASTM D5580. Standard Test Method for Determination of Benzene, Toluene, Ethylbenzene, p/m-Xylene, o-Xylene, C9 andHeavier Aromatics, and Total Aromatics in Finished Gasoline by Gas Chromatography. In Proceedings of the American Societyfor Testing and Materials, West Conshohocken, PA, USA, 1 April 2021.
44. C57.106. IEEE Guide for Acceptance and Maintenance of Insulating Mineral Oil in Electrical Equipment; The Institute of Electrical andElectronics Engineers: New York, NY, USA, 5 December 2015.
45. ASTM D3487. Standard Specification for Mineral Insulating Oil Used in Electrical Apparatus; American Society for Testing andMaterials: West Conshohocken, PA, USA, 15 June 2016.
46. CIGRE TB 771. Advances in DGA Interpretation. Available online: https://e-cigre.org/publication/771-advances-in-dga-interpretation (accessed on 1 July 2019).
47. Arrhenius, K.; Fischer, A.; Buker, O.; Adrien, H.; El Masri, A.; Lestremaub, F.; Robinsonc, T. Analytical methods for thedetermination of oil carryover from CNG/biomethane refueling stations recovered in a solvent. R. Soc. Chem. 2020, 10,11907–11917. [CrossRef]
48. Seo, J.; Ma, H.; Saha, T. A Joint vibration and arcing measurement system for online condition monitoring of onload tap changerof the power transformer. IEEE Trans. Power Deliv. 2017, 32, 1031–1038. [CrossRef]
49. Stone, C. Partial discharge diagnostics and electrical equipment insulation condition assessment. IEEE J. Mag. 2005, 5, 891–904.[CrossRef]
50. IEC 60270. Consolidated Version High-Voltage Test Strategy—Partial Discharge Measurements. In Proceedings of the InternationalElectrotechnical Commission, Geneva, Switzerland, 27 November 2015.
51. Qingsong, C.; Yongxiang, L.; Zhixiang, L.; Zhenyu, Z.; Shen, Z.; Zhiyuan, W. Analysis of Transformer Abnormal Heating Basedon Infrared Thermal Imaging Technology. In Proceedings of the 2nd IEEE Conference on Energy Internet and Energy SystemIntegration, Beijing, China, 20 October 2018.
166

Energies 2021, 14, 3670
52. Yehye, W.; Abdul Rahman, N.; Ariffin, A.; Abd Hamid, S.B.; Alhadi, A.; Kadir, F.; Yaeghoobi, M. Understanding the chemistrybehind the antioxidant activities of butylated hydroxytoluene (BHT): A review. Eur. J. Med. Chem. 2015, 101, 295–312. [CrossRef][PubMed]
53. Rehman, S.; Alhems, L.; Jadim, R.; Al Faraj, B.; Balasubramanian, K.; Al Mutairi, K.; Al-Yemni, A.; Shinde, D.; Al-Hsaien, S.Maximum acceptable concentrations of dbds, sulphur mercaptan and optimal concentration of metal deactivators for safe andprolonged operation of power transformers. IEEE Trans. Dielectr. Electr. Insul. 2016, 4, 2438–2442. [CrossRef]
167

energies
Article
Case Study of Pollution with Particulate Matter in SelectedLocations of Polish Cities
Remigiusz Jasinski, Marta Galant-Gołebiewska, Mateusz Nowak, Monika Ginter, Paula Kurzawska,
Karolina Kurtyka * and Marta Maciejewska
���������������
Citation: Jasinski, R.;
Galant-Gołebiewska, M.; Nowak, M.;
Ginter, M.; Kurzawska, P.; Kurtyka,
K.; Maciejewska, M. Case Study of
Pollution with Particulate Matter in
Selected Locations of Polish Cities.
Energies 2021, 14, 2529. https://
doi.org/10.3390/en14092529
Academic Editor: T. M. Indra Mahlia
Received: 31 March 2021
Accepted: 25 April 2021
Published: 28 April 2021
Publisher’s Note: MDPI stays neutral
with regard to jurisdictional claims in
published maps and institutional affil-
iations.
Copyright: © 2021 by the authors.
Licensee MDPI, Basel, Switzerland.
This article is an open access article
distributed under the terms and
conditions of the Creative Commons
Attribution (CC BY) license (https://
creativecommons.org/licenses/by/
4.0/).
Faculty of Civil Engineering, Institute of Combustion Engines and Powertrains, Poznan University of Technology,Piotrowo 3 Str., 60965 Poznan, Poland; [email protected] (R.J.);[email protected] (M.G.-G.); [email protected] (M.N.);[email protected] (M.G.); [email protected] (P.K.);[email protected] (M.M.)* Correspondence: [email protected]
Abstract: Despite the introduction of increasingly restrictive regulations, the air quality in Poland isstill considered one of the worst in Europe. Two cities (Wroclaw and Cracow) were selected for thisstudy, so they represent a pair of Polish cities with poor air quality, and at the same time are academiccities, popular with tourists. The article focuses on the emission of particulate matter, which is oneof the most dangerous components of air pollution. The focus was on particles less than 10 μm indiameter which are most often neglected at measuring stations. We have identified the sources ofparticulate emissions in selected locations in Wroclaw and Cracow, and then measured particles interms of their mass and number distribution. It was noted that the PM10 emission values obtainedas a result of the measurements were different from the value specified by the Inspectorate of theEnvironmental Protection in Poland.
Keywords: urban air quality; PM2.5; PM10; particle emission sources
1. Introduction
The monitoring and evaluation of ambient air quality is the first important step incontrolling air pollution. Monitoring pollutant concentrations in air is pivotal to properlymanage air quality [1,2]. Air pollution can be defined as a phenomenon harmful to theecological system and the normal conditions of human existence and development whensome substances in the atmosphere exceed a certain concentration [3]. Air pollutioncomes from a wide variety of sources, which discharge of harmful substances into theatmosphere, causing adverse effects to humans and the environment. They can be naturalor anthropogenic [4]. One of harmful pollutants are particulate matters. Fine particulatematters of aerodynamic diameter lower than 2.5 μm (PM2.5) are considered to be oneof the most important environmental factors contributing to the global human diseaseburden [5]. As half of the world’s population (55%) lives in urban areas, the environmentaldegradation produced by cities threatens the health and quality of life of a fair share ofthe world’s population [6]. Many articles focus on explaining the connections betweenpollutants and their toxicological effects on the environment [7]. Outdoor air pollution ledto an estimated 4.2 million premature deaths worldwide and half a million in the EuropeanUnion (EU) in 2016 [8,9]. Exposure to ambient PM2.5 particulate matter has been found tobe associated with different negative health endpoints, from minor respiratory symptomsto premature mortality. This worldwide burden of disease includes 7–10 million prematuredeaths, mostly in developing countries [10]. Acute lower respiratory infections (ALRI),including pneumonia and bronchiolitis of bacterial and viral origin, are the largest singlecause of mortality among young children worldwide and thus account for a significantburden of disease worldwide [11]. Outdoor air pollution has been associated with increasedsymptoms and increased ALRI mortality.
Energies 2021, 14, 2529. https://doi.org/10.3390/en14092529 https://www.mdpi.com/journal/energies
169
Energies 2021, 14, 2529
Toxicologic evidence suggests that exposure to particulate air pollution can causepulmonary inflammation and affect host defenses against infection [12]. The World HealthOrganization (WHO) estimated, that in 2016, 91% of the world population was living inplaces where the WHO air quality guidelines levels were not met. According to WHO,about 440,000 people die every year due to air pollution in Europe. In Poland only, whichis at the forefront of European countries with the most polluted air, it is about 44,000people a year [8]. Based on the specificity of formation and the influence of particles onthe human body it can be stated that one of the basic issues in assessing air quality is theconcentration of particles. Particulate matter is a term generally used to describe a typeof air pollutant consisting of a complex of various mixtures of suspended particles thatvary in size, composition and place of formation [13]. The main sources of this type ofpollution are factories, power plants, incinerators, motor vehicles and many others. Thebasic division of particles is based on their aerodynamic diameter, which allows for thedetermination of two main groups: PM2.5 and PM10, i.e., particulate matter with diameterssmaller than 2.5 μm and 10 μm, respectively [14].
Air quality monitoring is carried out in Poland by the Environmental ProtectionInspectorate. On the basis of the reports and their analyses, it was concluded that the air inPoland is one of the most polluted in Europe. In 2018, the WHO published a list [15] of the50 most polluted cities in Europe. Unfortunately, Poland is at the top of this list. In terms ofPM2.5 as many as 36 of those cities are located in Poland. One of them is Cracow, which isthe subject of this article’s analysis. As mentioned, the assessment of air quality in Polandis carried out by the Inspectorate of Environmental Protection. Measurement stations andmeasurement methods are established in accordance with the relevant Regulations of theEnvironment Ministry.
On problem is the insufficient number of measuring stations in Poland and the factthat only a small part of them measures PM2.5 particles and none of them measuresparticles up to 1 micrometer in diameter (e.g., in the city of Poznan there are five measuringstations, and only three of them allow the measurement of both PM10 and PM2.5). Theambient air pollution is particularly noticeable in urban agglomerations, but unfortunatelyit is not limited to them. The deterioration of air quality is already observable in muchsmaller towns and even villages. In the case of the developing countries, the problem is moreserious due to overpopulation and uncontrolled urbanization along with the development ofindustrialization [16]. The author of [17] pointed out that in Poland the particularly negativeimpact on air quality is related to households and transport. The transport sector is beingdeveloped in the direction of electromobility, however, Polish roads are still dominated byvehicles equipped with conventional engines. Recent scientific studies [18–20], carried outin Poland, analyse the impact of particulate emissions from both road and air transport.The authors of [19] have made an analysis to classify the vehicles and also to identify theadvantages of the latest developments in conventional, hybrid and electric vehicles.
The aim of the article was the assessment of particulate air pollution in two selectedcities in Poland. Firstly, the particle emission sources were identified in selected locationsin two Polish cities (Wroclaw and Cracow), and then measurement of particles in terms oftheir mass distribution and numbers was performed.
2. Materials and Methods
2.1. Research Object
The choice of Wroclaw and Cracow as the study object was mainly based on theirexcessive emissions of air pollutants, but not only that. Cracow was chosen because it isthe most polluted city in Poland, which is mainly influenced by its geographical location.The unfavorable location of the city in the Vistula valley, surrounded (on three sides) byterrain elevations, means the polluted air hangs over the city instead of being removed.In addition, the buildings of air corridors, which so far allowed to remove some pollutantsfrom the city and introduce fresh air into it, and low emissions significantly affect thepollution distribution of this city. Wroclaw, on the other hand, due to its characteristic
170

Energies 2021, 14, 2529
dense buildings (mainly old tenement houses and estates of old single-family houses),also struggles with high air pollution, especially in the autumn and winter period. In thiscase, the first step (identification of sources) is understood as the determination of allfactors that create the possibility of an increase in the concentration of particles in the air.The distribution of emission sources should be adopted according to the modeling needs.For this reason, the emission can be divided into:
• point (emission from single sources, most often from high chimneys),• household (emission from many different sources, e.g., from inhabited areas),• transport (emissions from means of transport, mainly roads).
The research area was chosen based on data from documents such as the NationalAir Quality Program or Annual Air Quality Assessments for the Poland Voivodeships,performed by the Inspectorate of Environmental Protection in Poland. Based on the analysisof the maps prepared in those documents, the areas of increased emission were indicated,and its source was identified. The maps contained in the above-mentioned documentsconcern the distribution of the average annual concentration of PM10 in Wroclaw andCracow [21,22]. In Wroclaw, the highest average annual concentration of PM10 occurs inthe south of the agglomeration and in the eastern part of the city. In case of Cracow, thehighest average annual concentration is found in the central part of the agglomeration.The air quality is worst in the following districts: Kazimierz, Old Town, Pradnik Biały,Pradnik Czerwony.
The second step concerns air quality measurements. Air quality measurements weretaken in two popular tourist and academic cities in Poland—Wroclaw and Cracow—respectively. Both cities are known to their poor air quality. In 2018, Cracow appeared in8th place on the list of European cities with the worst air quality. The poor air quality inCracow is mainly due to the city’s location. According to [23], the inflow of air from thesurrounding areas results in a deterioration of the air quality in Cracow. Unfortunately, thecity is surrounded by communities where low-quality coal stoves are still the dominantmethod of heating houses [23]. Measurement locations were selected in the first step andthey represent each type of air pollution source.
Measurements were carried out in the following locations of Wroclaw:
• Przemkowska Street (point sources),• Slezna Street (transportation sources),• Ustronie Street (household sources).
Measurements were carried out in the following locations of Cracow:
• Ujastek Street (point sources),• Debnicki Bridge (transportation sources),• Zapolskiej Street (household sources).
It is worth noting that the locations of the measurement points do not coincide withthose used by Environmental Protection Inspectorate. Measurement points have beenselected to reflect the real problems of residents suffering from poor air quality. The mea-surements took place in two sessions: morning and afternoon. Each measurement lasted30 min. During this time the measuring device collected 186 samples (one sample/10 s).With those 12 measurements (six in Wroclaw and six in Cracow) a total of 2232 samples werecollected. Measurements were taken in early autumn, when the heating season was slowlybeginning. The ambient temperature was in the 14–20 ◦C range. The weather conditions dur-ing the measurements were not the same. Rainfall accompanied all morning measurementsonly in Wroclaw. Moreover, it intensified with each subsequent measurement.
2.2. Measuring Equipment
The study used an outdoor environmental air quality monitoring device in selectedcities (Wroclaw and Cracow). The number and mass distribution, and immissions ofparticulate matter were used as criteria for urban air quality. A TSI Optical Particle Sizer(OPS) 3330 was used to measure the number and mass of particulate matter (PM) in
171
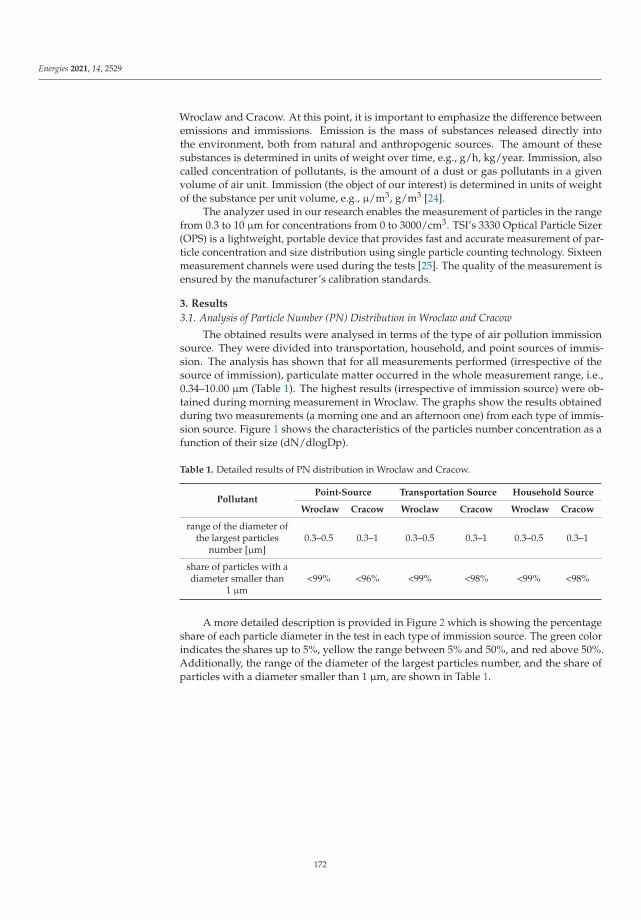
Energies 2021, 14, 2529
Wroclaw and Cracow. At this point, it is important to emphasize the difference betweenemissions and immissions. Emission is the mass of substances released directly intothe environment, both from natural and anthropogenic sources. The amount of thesesubstances is determined in units of weight over time, e.g., g/h, kg/year. Immission, alsocalled concentration of pollutants, is the amount of a dust or gas pollutants in a givenvolume of air unit. Immission (the object of our interest) is determined in units of weightof the substance per unit volume, e.g., μ/m3, g/m3 [24].
The analyzer used in our research enables the measurement of particles in the rangefrom 0.3 to 10 μm for concentrations from 0 to 3000/cm3. TSI’s 3330 Optical Particle Sizer(OPS) is a lightweight, portable device that provides fast and accurate measurement of par-ticle concentration and size distribution using single particle counting technology. Sixteenmeasurement channels were used during the tests [25]. The quality of the measurement isensured by the manufacturer’s calibration standards.
3. Results
3.1. Analysis of Particle Number (PN) Distribution in Wroclaw and Cracow
The obtained results were analysed in terms of the type of air pollution immissionsource. They were divided into transportation, household, and point sources of immis-sion. The analysis has shown that for all measurements performed (irrespective of thesource of immission), particulate matter occurred in the whole measurement range, i.e.,0.34–10.00 μm (Table 1). The highest results (irrespective of immission source) were ob-tained during morning measurement in Wroclaw. The graphs show the results obtainedduring two measurements (a morning one and an afternoon one) from each type of immis-sion source. Figure 1 shows the characteristics of the particles number concentration as afunction of their size (dN/dlogDp).
Table 1. Detailed results of PN distribution in Wroclaw and Cracow.
PollutantPoint-Source Transportation Source Household Source
Wroclaw Cracow Wroclaw Cracow Wroclaw Cracow
range of the diameter ofthe largest particles
number [μm]0.3–0.5 0.3–1 0.3–0.5 0.3–1 0.3–0.5 0.3–1
share of particles with adiameter smaller than
1 μm<99% <96% <99% <98% <99% <98%
A more detailed description is provided in Figure 2 which is showing the percentageshare of each particle diameter in the test in each type of immission source. The green colorindicates the shares up to 5%, yellow the range between 5% and 50%, and red above 50%.Additionally, the range of the diameter of the largest particles number, and the share ofparticles with a diameter smaller than 1 μm, are shown in Table 1.
172
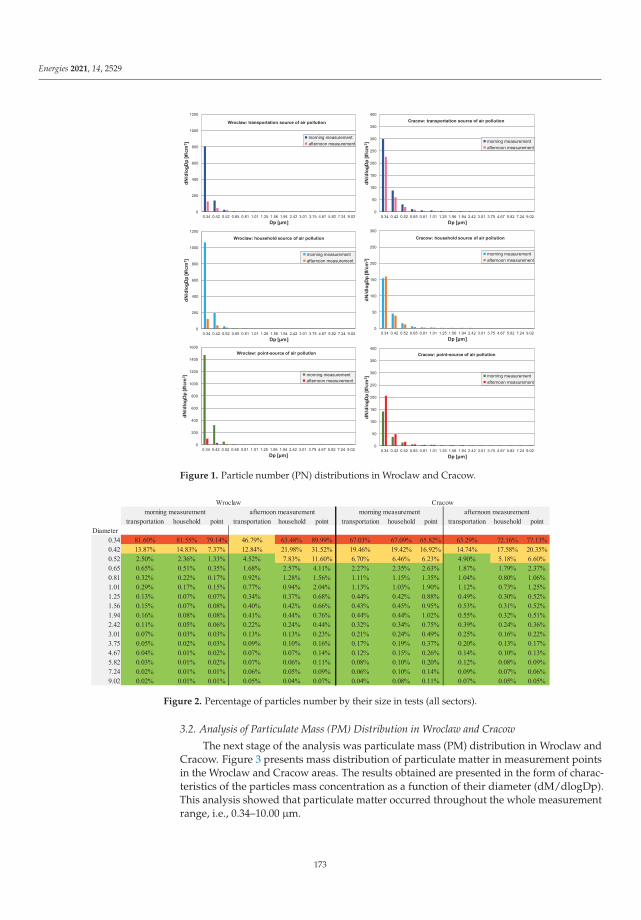
Energies 2021, 14, 2529
0
200
400
600
800
1000
1200
0.34 0.42 0.52 0.65 0.81 1.01 1.25 1.56 1.94 2.42 3.01 3.75 4.67 5.82 7.24 9.02
dN/d
logD
p [#
/cm
3 ]
Dp [ m]
morning measurementafternoon measurement
Wroclaw: transportation source of air pollution
0
50
100
150
200
250
300
350
400
0.34 0.42 0.52 0.65 0.81 1.01 1.25 1.56 1.94 2.42 3.01 3.75 4.67 5.82 7.24 9.02
dN/d
logD
p [#
/cm
3 ]
Dp [ m]
morning measurementafternoon measurement
Cracow: transportation source of air pollution
0
200
400
600
800
1000
1200
0.34 0.42 0.52 0.65 0.81 1.01 1.25 1.56 1.94 2.42 3.01 3.75 4.67 5.82 7.24 9.02
dN/d
logD
p [#
/cm
3 ]
Dp [ m]
morning measurementafternoon measurement
Wroclaw: household source of air pollution
0
50
100
150
200
250
300
0.34 0.42 0.52 0.65 0.81 1.01 1.25 1.56 1.94 2.42 3.01 3.75 4.67 5.82 7.24 9.02
dN/d
logD
p [#
/cm
3 ]
Dp [ m]
morning measurementafternoon measurement
Cracow: household source of air pollution
0
200
400
600
800
1000
1200
1400
1600
0.34 0.42 0.52 0.65 0.81 1.01 1.25 1.56 1.94 2.42 3.01 3.75 4.67 5.82 7.24 9.02
dN/d
logD
p [#
/cm
3 ]
Dp [ m]
morning measurementafternoon measurement
Wroclaw: point-source of air pollution
0
50
100
150
200
250
300
350
400
0.34 0.42 0.52 0.65 0.81 1.01 1.25 1.56 1.94 2.42 3.01 3.75 4.67 5.82 7.24 9.02
dN/d
logD
p [#
/cm
3 ]
Dp [ m]
morning measurementafternoon measurement
Cracow: point-source of air pollution
Figure 1. Particle number (PN) distributions in Wroclaw and Cracow.
transportation household point transportation household point transportation household point transportation household pointDiameter
0.34 81.60% 81.55% 79.14% 46.79% 63.48% 89.99% 67.03% 67.09% 65.82% 63.29% 72.16% 77.13%0.42 13.87% 14.83% 7.37% 12.84% 21.98% 31.52% 19.46% 19.42% 16.92% 14.74% 17.58% 20.35%0.52 2.50% 2.36% 1.33% 4.52% 7.83% 11.60% 6.70% 6.46% 6.23% 4.90% 5.18% 6.60%0.65 0.65% 0.51% 0.35% 1.68% 2.57% 4.11% 2.27% 2.35% 2.63% 1.87% 1.79% 2.37%0.81 0.32% 0.22% 0.17% 0.92% 1.28% 1.56% 1.11% 1.15% 1.35% 1.04% 0.80% 1.06%1.01 0.29% 0.17% 0.15% 0.77% 0.94% 2.04% 1.13% 1.03% 1.90% 1.12% 0.73% 1.25%1.25 0.13% 0.07% 0.07% 0.34% 0.37% 0.68% 0.44% 0.42% 0.88% 0.49% 0.30% 0.52%1.56 0.15% 0.07% 0.08% 0.40% 0.42% 0.66% 0.43% 0.45% 0.95% 0.53% 0.31% 0.52%1.94 0.16% 0.08% 0.08% 0.41% 0.44% 0.76% 0.44% 0.44% 1.02% 0.55% 0.32% 0.51%2.42 0.11% 0.05% 0.06% 0.22% 0.24% 0.44% 0.32% 0.34% 0.75% 0.39% 0.24% 0.36%3.01 0.07% 0.03% 0.03% 0.13% 0.13% 0.23% 0.21% 0.24% 0.49% 0.25% 0.16% 0.22%3.75 0.05% 0.02% 0.03% 0.09% 0.10% 0.16% 0.17% 0.19% 0.37% 0.20% 0.13% 0.17%4.67 0.04% 0.01% 0.02% 0.07% 0.07% 0.14% 0.12% 0.15% 0.26% 0.14% 0.10% 0.13%5.82 0.03% 0.01% 0.02% 0.07% 0.06% 0.11% 0.08% 0.10% 0.20% 0.12% 0.08% 0.09%7.24 0.02% 0.01% 0.01% 0.06% 0.05% 0.09% 0.06% 0.10% 0.14% 0.09% 0.07% 0.06%9.02 0.02% 0.01% 0.01% 0.05% 0.04% 0.07% 0.04% 0.08% 0.11% 0.07% 0.05% 0.05%
Wroclaw Cracowmorning measurement afternoon measurement morning measurement afternoon measurement
Figure 2. Percentage of particles number by their size in tests (all sectors).
3.2. Analysis of Particulate Mass (PM) Distribution in Wroclaw and Cracow
The next stage of the analysis was particulate mass (PM) distribution in Wroclaw andCracow. Figure 3 presents mass distribution of particulate matter in measurement pointsin the Wroclaw and Cracow areas. The results obtained are presented in the form of charac-teristics of the particles mass concentration as a function of their diameter (dM/dlogDp).This analysis showed that particulate matter occurred throughout the whole measurementrange, i.e., 0.34–10.00 μm.
173

Energies 2021, 14, 2529
0
10
20
30
40
50
60
70
0.34 0.42 0.52 0.65 0.81 1.01 1.25 1.56 1.94 2.42 3.01 3.75 4.67 5.82 7.24 9.02
dM/d
logD
p [μ
g/m
3 ]
Dp [ m]
morning measurementafternoon measurement
Wroclaw: transportation source of air pollution
0
10
20
30
40
50
60
70
0.34 0.42 0.52 0.65 0.81 1.01 1.25 1.56 1.94 2.42 3.01 3.75 4.67 5.82 7.24 9.02
dM/d
logD
p [μ
g/m
3 ]
Dp [ m]
morning measurementafternoon measurement
Cracow: transportation source of air pollution
0
10
20
30
40
50
60
70
80
0.34 0.42 0.52 0.65 0.81 1.01 1.25 1.56 1.94 2.42 3.01 3.75 4.67 5.82 7.24 9.02
dM/d
logD
p [μ
g/m
3 ]
Dp [ m]
morning measurementafternoon measurement
Wroclaw: household source of air pollution
0
10
20
30
40
50
60
70
80
0.34 0.42 0.52 0.65 0.81 1.01 1.25 1.56 1.94 2.42 3.01 3.75 4.67 5.82 7.24 9.02
dM/d
logD
p [μ
g/m
3 ]
Dp [ m]
morning measurementafternoon measurement
Cracow: household source of air pollution
0
10
20
30
40
50
60
70
80
90
100
0.34 0.42 0.52 0.65 0.81 1.01 1.25 1.56 1.94 2.42 3.01 3.75 4.67 5.82 7.24 9.02
dM/d
logD
p [μ
g/m
3 ]
Dp [ m]
morning measurementafternoon measurement
Wroclaw: point-source of air pollution
0
10
20
30
40
50
60
70
80
90
100
0.34 0.42 0.52 0.65 0.81 1.01 1.25 1.56 1.94 2.42 3.01 3.75 4.67 5.82 7.24 9.02
dM/d
logD
p [μ
g/m
3 ]
Dp [ m]
morning measurementafternoon measurement
Cracow: point-source of air pollution
Figure 3. Particulate mass (PM) distribution in Wroclaw and Cracow.
A more detailed description is provided in Figure 4 which shows the share percentageof each particle diameter in the test in each type of immission source. The green colorindicates the shares up to 5%, yellow the range between 5% and 50%. Additionally, therange of the diameter of the largest particles number, and the share of particles with adiameter smaller than 1 μm are shown in Table 2.
transporatation household point transporatation household point transporatation household point transporatation household pointDiameter
0.34 7.20% 14.74% 19.67% 2.09% 2.67% 1.76% 2.36% 1.58% 0.97% 2.39% 2.38% 1.50%0.42 2.36% 5.17% 8.23% 1.41% 1.78% 0.93% 1.32% 0.88% 0.48% 1.22% 1.12% 0.67%0.52 0.82% 1.59% 2.37% 1.00% 1.22% 0.63% 0.88% 0.56% 0.34% 0.76% 0.63% 0.43%0.65 0.41% 0.66% 0.85% 0.69% 0.77% 0.45% 0.57% 0.40% 0.28% 0.53% 0.42% 0.32%0.81 0.40% 0.56% 0.64% 0.50% 0.75% 0.48% 0.54% 0.38% 0.27% 0.45% 0.36% 0.34%1.01 0.69% 0.82% 1.04% 1.26% 1.06% 0.77% 1.06% 0.64% 0.74% 1.03% 0.64% 0.71%1.25 0.59% 0.64% 0.72% 0.81% 0.80% 0.67% 0.81% 0.51% 0.66% 0.83% 0.51% 0.59%1.56 1.32% 1.31% 1.62% 1.53% 1.75% 1.50% 1.51% 1.05% 1.38% 1.61% 1.00% 1.24%1.94 2.64% 2.75% 3.19% 3.40% 3.58% 2.95% 2.98% 1.98% 2.86% 3.03% 2.03% 2.52%2.42 3.49% 3.26% 3.95% 3.83% 3.69% 3.11% 4.15% 2.96% 4.06% 4.15% 2.94% 3.42%3.01 4.14% 3.67% 4.25% 3.75% 3.97% 3.42% 5.34% 4.01% 5.12% 4.94% 3.83% 4.26%3.75 6.07% 4.76% 5.25% 5.26% 5.62% 4.67% 8.05% 6.22% 7.43% 7.16% 5.95% 6.49%4.67 9.21% 6.29% 6.41% 8.53% 7.55% 7.15% 11.29% 9.41% 10.35% 10.41% 8.77% 8.98%5.82 12.98% 10.14% 9.68% 13.66% 12.66% 12.65% 14.83% 12.44% 15.41% 13.78% 14.00% 14.47%7.24 20.76% 14.88% 12.39% 19.92% 19.62% 21.00% 19.31% 23.16% 20.15% 19.45% 22.38% 20.86%9.02 26.94% 28.76% 19.74% 32.36% 32.49% 37.88% 25.01% 33.81% 29.50% 28.26% 33.04% 33.20%
afternoon measurement morning measurement afternoon measurementmorning measurementWroclaw Cracow
Figure 4. Percentage of particulate matter by their size in tests (all sectors).
174

Energies 2021, 14, 2529
Table 2. Detailed results of PM distribution in Wroclaw and Cracow.
PollutantPoint-Source Transportation Source Household Source
Wroclaw Cracow Wroclaw Cracow Wroclaw Cracow
range of the diameter of the largestparticulate matter [μm]
0.3–0.51.5–10 2–10 0.3–0.4
2–10 2–10 0.3–0.42–10 2–10
share of particulate matter with adiameter smaller than 1 μm <19% <4% <10% <7% <16% <5%
3.3. Total Average Number and Mass Concentrations of Particulate Matter in Wroclawand Cracow
The final stage of the analysis of the results of the studies carried out in Wroclaw andCracow consisted in creating the characteristics presenting the total average concentrationof particulate matter in terms of number and mass with a division into air pollution sources.The results obtained are shown in Figure 5a,b.
Figure 5. Total average concentration of particle number (a) and particulate mass (b) in each city (in red line marked alarmlevel for PM10 emission settled by Inspectorate of Environmental Protection).
Figure 5a presents an analysis of the total average number concentration (CPN) ofparticulate matter obtained during air quality measurements in Wroclaw and Cracow. Datawere divided according to the type of source of measured immission (transport, householdand point). The results obtained for individual sources were as follows:
• point immission sources 1000 cm−3 (in Wroclaw), 253 cm−3 (in Cracow),• household immission sources 750 cm−3 (in Wroclaw), 226 cm−3 (in Cracow),• transportation immission sources 596 cm−3 (Wroclaw), 386 cm−3 (Cracow).
Figure 5b presents an analysis of the total average mass concentration (CPM) of partic-ulate matter obtained during air quality measurements in Wroclaw and Cracow. Data weredivided according to the type of source of measured immission (point, household andtransport). The results obtained for individual sources were as follows:
• point immission sources 131 μg/m3 (in Wroclaw), 287 μg/m3 (in Cracow),• household immission sources 120 μg/m3 (in Wroclaw), 167 μg/m3 (in Cracow),• transportation immission sources 175 μg/m3 (Wroclaw), 224 μg/m3 (Cracow).
Figure 5b presents a total average mass concentration of particulate matter obtainedduring measurements at 1 September 2020 in Wroclaw and 3 September 2020 in Cracow.Equipment, which was used to measurements has range to 10.00 μm. This mean thatprepared graph shows concentration of particulate matter to 10.00 μm (PM10). The red linein Figure 5b indicates the limit above which the smog alarm is announced.
In order to compare, the results of measurements taken on the same day by the mea-suring station of the Environmental Protection Inspectorate were checked. The differences
175
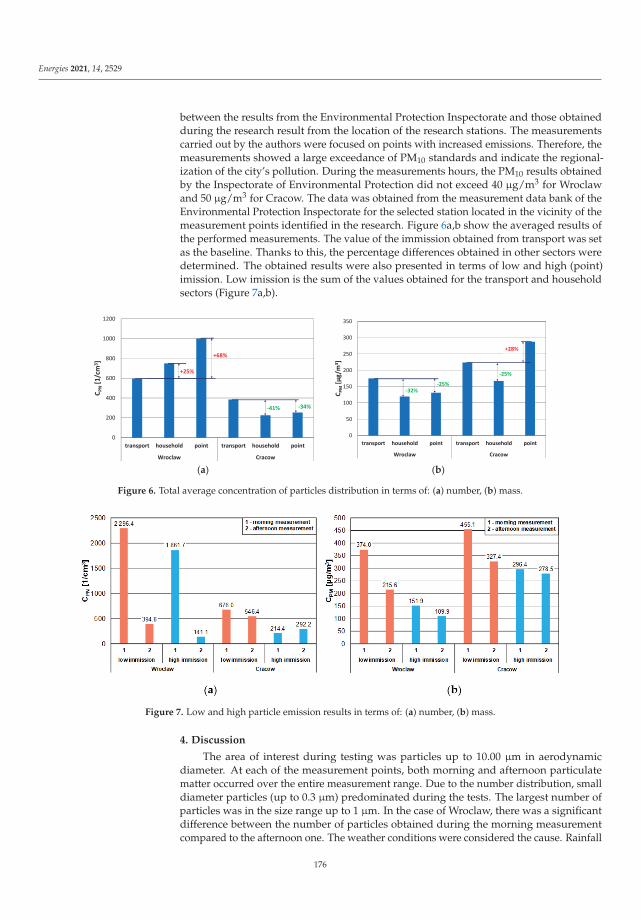
Energies 2021, 14, 2529
between the results from the Environmental Protection Inspectorate and those obtainedduring the research result from the location of the research stations. The measurementscarried out by the authors were focused on points with increased emissions. Therefore, themeasurements showed a large exceedance of PM10 standards and indicate the regional-ization of the city’s pollution. During the measurements hours, the PM10 results obtainedby the Inspectorate of Environmental Protection did not exceed 40 μg/m3 for Wroclawand 50 μg/m3 for Cracow. The data was obtained from the measurement data bank of theEnvironmental Protection Inspectorate for the selected station located in the vicinity of themeasurement points identified in the research. Figure 6a,b show the averaged results ofthe performed measurements. The value of the immission obtained from transport was setas the baseline. Thanks to this, the percentage differences obtained in other sectors weredetermined. The obtained results were also presented in terms of low and high (point)imission. Low imission is the sum of the values obtained for the transport and householdsectors (Figure 7a,b).
(a) (b)
0
200
400
600
800
1000
1200
transport household point transport household point
Wroclaw Cracow
C PN[1/cm
3 ]
+25%
+68%
41% 34%
0
50
100
150
200
250
300
350
transport household point transport household point
Wroclaw Cracow
C PM[μg/m
3 ]
32%25%
25%
+28%
Figure 6. Total average concentration of particles distribution in terms of: (a) number, (b) mass.
Figure 7. Low and high particle emission results in terms of: (a) number, (b) mass.
4. Discussion
The area of interest during testing was particles up to 10.00 μm in aerodynamicdiameter. At each of the measurement points, both morning and afternoon particulatematter occurred over the entire measurement range. Due to the number distribution, smalldiameter particles (up to 0.3 μm) predominated during the tests. The largest number ofparticles was in the size range up to 1 μm. In the case of Wroclaw, there was a significantdifference between the number of particles obtained during the morning measurementcompared to the afternoon one. The weather conditions were considered the cause. Rainfall
176

Energies 2021, 14, 2529
accompanied all morning measurements in Wroclaw. Moreover, it intensified with eachsubsequent measurement. A relation between the degree of rainfall intensity and theaccompanying wind with increased PM immission was noticed. During the rainfall, a verylarge number of solid particles were observed, in terms of mass and number. The authorsof the study [26,27] mention the influence of humidity on air quality. In effect, that morningrain was effective in reducing the particulate immission, i.e., cleaning the air. In Cracow,on the other hand, the values obtained during the morning and afternoon measurementswere similar.
The predominant share of particles with a diameter smaller than 1 μm (almost 100%)was observed during the measurements. This means that it is these smallest particlesthat are most abundant in the air. This effect is visible in both the Wroclaw and Cracowagglomerations. It is worth noting that the point-source measurement is also nearby ahighway as well as a nearby railway station where the emissions from the train and dieselengine locomotive are present not only household exhaust emissions. Wind and windturbulences which mix the particulate matter around the city and country also exist. Theconducted assessment of pollution with particles pays particular attention to the share ofthe smallest particle size (up to 1 micrometer) in the total emissions. It is these particlesthat are not filtered by the human body and go directly into the respiratory system.
In terms of mass distribution, particles with a diameter greater than 1.5 μm representedthe largest shares in the mass of particles. According to the obtained mass distributions ofparticulate matter within Wroclaw and Cracow agglomerations, the particles with a largerdiameter, i.e., about 5 μm, have the greatest impact on the particulate matter immissions.The share of particulate matter with a diameter smaller than 1 μm is significantly decreasedcompared to the numerical distribution. This means that both in Cracow and Wroclaw(from the perspective of mass distribution of particulate matter) particles with largerdiameters dominate.
The results in Figure 7 show that the transport sector is not at all the largest source ofthe measured particulate pollution immission in all cases. Due to the number of particles,it would be better to take a closer look at transport in Cracow. The obtained data show thatthe imission from households and the point imission are about 40% lower. On the otherhand, in Wroclaw the biggest problem (during the research) was the point imissions. Due tothe mass of particles, transport is the main source of air pollution with particles. It followsfrom the results obtained by us that the main source of PM pollution is low emission(surface and transport). Industrial chimneys, responsible mainly for point emission, arehigh, therefore the pollution is dispersed over a much larger area, far beyond the city limits.
Figure 5 presents the results of the particulate matters up to 10 μm. Accordingto the legislation, these are PM10. The results obtained during the measurements werecompared with the data from official sources of Environmental Protection Inspectorate.As expected, the obtained results not only significantly exceeded the values presented bythe Environmental Protection Inspectorate, but also the daily PM10 standards (in somecases, even by twice). This means that despite meeting the legal requirements, it would beworth considering a more precise location of the measuring stations.
The results obtained indicate that it is necessary to improve measurement methods,especially for the smallest particles, smaller than PM2.5. As mentioned in the Introductionthe number of measuring stations, not only in Wroclaw and Cracow but also across Poland,is insufficient. This also applies to the measurement of particles smaller than 2.5 μm.Our measurements were not made in accordance with the guidelines of EnvironmentalProtection Inspectorate, however indicated that it is necessary to extend the measurementsperformed by the smallest particles. The assessment thus carried out highlights the short-comings of air quality monitoring stations measuring these smallest particles. Perhaps theapplication of the method [28], but extended by the measurement of particulate matter,would help in determining better measuring station locations. The choice of the locationof the measurement points in our research was not accidental. Similarly to [6], we wereguided not only by the data from official reports, but also by taking into account subjective
177
Energies 2021, 14, 2529
factors that are not taken into account in the analyses of the Environmental ProtectionInspectorate. Unfortunately, both of these cities struggle with the problem of poor airquality and nuisance smog. It is related not only to the location of both cities, but also to thehabits of the inhabitants. Coal stoves are still used as the main source of heating in manyhomes. Fortunately, the situation is improving year by year. City authorities introducenew restrictions and activate programs aimed at achieving clean air such as replacement ofstoves, development of bicycle infrastructure, restrictions on vehicle entry to city centers.This applies both to subsidies encouraging residents to use green energy, and to changingthe city’s infrastructure.
5. Conclusions
Nowadays, air pollution is considered to be one of the biggest problems affectingsociety worldwide [29–32]. Specific attention is paid to one component of pollution,i.e., excessive particulate emissions. This is a crucial contaminant since it contains otherpollutants adsorbed on particle surfaces, such as heavy metals. Unfortunately, Poland isat the top of the European countries with the worst air quality. Particle immission testswere carried out in two Polish cities (Wroclaw and Cracow). A total of 12 tests were carriedout during the measurements (two for each type of immission source). Each measurementlocation represented one type of emission: transport, household and point. The conductedresearch shows that it is the low immission, i.e., from transport and households, that isthe largest source of air pollution in the locations selected by us. The results obtainedduring the measurements clearly indicate that the data are not consistent with thosepresented by the Environmental Protection Inspectorate. The data analyzed in this articleis much larger, and additionally significantly exceeds the daily PM10 standard. Despitethe fact that the Environmental Protection Inspectorate’s measuring stations are arrangedin accordance with legal requirements, they are still insufficiently precise. There are stillplaces, popular on the map of Wroclaw and Cracow, where excessive PM10 emissions occur,despite satisfactory data from official sources.
Moreover, the measurements performed by the Inspectorate of Environmental Protec-tion are not sufficient. It should be necessary to expand research to include monitoring ofparticulate matter PM1 and even smaller ones. The next step should be to perform further,more detailed research. On that basis, it will be possible to propose a new method forselecting the location of measurement points, especially in those places where excessiveparticulate emissions are a problem. Obviously, this will not directly improve air quality,but it will certainly enable better monitoring. This will enable local improvements to bemade, which in the long run will have a positive impact on air quality throughout the city.Additionally, in order to reduce the level of pollution in the studied cities, it is suggested todevelop social programs aimed at actively acting against air pollution. In addition, the cityauthorities in their environmental protection programs should focus on replacing furnaces,changing road infrastructure, expanding bicycle paths, or introducing various benefits forpeople using electric motor vehicles.
Author Contributions: Conceptualization, R.J. and M.G.-G.; methodology, R.J.; software, M.N.;validation, P.K., M.M., M.G. and K.K.; formal analysis, K.K.; investigation, P.K.; resources, M.M.; datacuration, M.N.; writing—original draft preparation, K.K. and M.M.; writing—review and editing,K.K. and M.M.; visualization, M.M., K.K. and P.K.; supervision, M.G.-G.; project administration, R.J.;funding acquisition, R.J. All authors have read and agreed to the published version of the manuscript.
Funding: This research and APC was funded by Interdisciplinary Rector’s Grant, grant number 559ERP/33/32/SIGR/0004.
Institutional Review Board Statement: Not applicable.
Informed Consent Statement: Not applicable.
178

Energies 2021, 14, 2529
Data Availability Statement: Data available on request due to restriction e.g., privacy or ethical. Thedata presented in this study are available on request from the corresponding author. The data are notpublicly available due to ongoing project.
Conflicts of Interest: The authors declare no conflict of interest.
References
1. Suman. Air Quality Indices: A Review of Methods to Interpret Air Quality Status, Materials Today: Proceedings, 2214-7853/2020; ElsevierLtd: Amsterdam, The Netherlands, 2020. [CrossRef]
2. Doval Minarro, M.; Banon, D.; Egea, J.A.; Costa-Gomez, I.; Baeza Caracena, A. A Multi-Pollutant Methodology to Locate a Single AirQuality Monitoring Station in Small and Medium-Size Urban Areas, Environmental Pollution, 0269-7491/2020; Elsevier Ltd: Amsterdam,The Netherlands, 2000. [CrossRef]
3. Bai, L.; Wang, J.Z.; Ma, X.J.; Lu, H.Y. Air Pollution Forecasts: An Overview. Int. J. Environ. Res. Public Health 2018, 15, 780.[CrossRef] [PubMed]
4. Khelfi, A. Sources of Air Pollution, Handbook of Research on Microbial Tools for Environmental Waste Management, Advances inEnvironmental Engineering and Green Technologies; IGI Global: Hershey, PA, USA, 2018. [CrossRef]
5. Fantke, P.; Jolliet, O.; Evans, J.S.; Apte, J.S.; Cohen, A.J.; Hänninen, O.O.; Hurley, F.; Jantunen, M.J.; Jerrett, M.; Levy, J.I.; et al.Health effects of fine particulate matter in life cycle impact assessment: Findings from the Basel Guidance Workshop. Int. J. LifeCycle Assess. 2015, 20, 276–288. [CrossRef]
6. Chiarini, B.; D’Agostino, A.; Marzano, E.; Regoli, A. Air quality in urban areas: Comparing objective and subjective indicators inEuropean countries. Ecol. Indic. 2021. [CrossRef]
7. Koolen, C.D.; Rothenberg, G. Air Pollution in Europe. ChemSusChem 2019, 12. [CrossRef] [PubMed]8. World Health Organization. Ambient (Outdoor) Air Pollution. 2018. Available online: https://www.who.int/news-room/fact-
sheets/detail/ambient-(outdoor)-air-quality-and-health (accessed on 22 February 2021).9. Sicard, P.; Agathokleous, E.; De Marco, A.; Paoletti, E.; Calatayud, V. Urban population exposure to air pollution in Europe over
the last decades. Environ. Sci. Eur. 2021, 33, 1–12. [CrossRef] [PubMed]10. Burnett, R.; Chen, H.; Szyszkowicz, M.; Fann, N.; Hubbell, B.; Pope, C.A.; Apte, J.S.; Brauer, M.; Cohen, A.; Weichenthal, S.; et al.
Global estimates of mortality associated with long-term exposure to outdoor fine particulate matter. Proc. Natl. Acad. Sci. USA2018, 115, 201803222. [CrossRef] [PubMed]
11. Cohen, A.J.; Anderson, H.R.; Ostro, B.; Pandey, K.D.; Krzyzanowski, M.; Künzli, N.; Gutschmidt, K.; Pope, C.A., III; Romieu, I.;Samet, J.M.; et al. Urban air pollution. In Comparative Quantification of Health Risks: Global and Regional Burden of Disease Attributableto Selected Major Risk Factors; LA Ezzati, M., Rodgers, A., Murray, C.J.L., Eds.; World Health Organization: Geneva, Switzerland,2004; Volume 2, pp. 1153–1433.
12. Mehta, S.; Shin, H.; Burnett, R.; North, T.; Cohen, A.J. Ambient particulate air pollution and acute lower respiratory infections:A systematic review and implications for estimating the global burden of disease. Air Qual. Atmos. Health 2013, 6, 69–83.[CrossRef] [PubMed]
13. Wielgosinski, G.; Czerwinska, J. Smog episodes in Poland. Atmosphere 2020, 11, 277. [CrossRef]14. Jasinski, R. Estimation of particles emissions from a jet engine in real flight. In E3S Web Conf, Proceedings of the 11th Conference
on Interdisciplinary Problems in Environmental Protection and Engineering EKO-DOK, Polanica Zdrój, Poland, 8–10 April 2019;EDP Sciences: Les Ulis, France, 2019; Volume 100, p. 00029.
15. EPA. What Is Particulate Matter? Available online: https://www3.epa.gov/region1/eco/uep/particulatematter.html (ac-cessed on 21 February 2021).
16. Manisalidis, I.; Stavropoulou, E.; Stavropoulos, A.; Bezirtzoglou, E. Environmental and health Impacts of air pollution: A review.Front. Public Health 2020, 8. [CrossRef] [PubMed]
17. Burchard-Dziubinska, M. Air pollution and health in Poland: Anti-smog movement in the most polluted Polish cities. Ekon. Sr.2019, 2, 76–90. [CrossRef]
18. Nowak, M.; Jasinski, R. Ecological Comparison of Domestic Travel by Air and Road Transport. SAE Tech. Paper 2020, 1, 2137.[CrossRef]
19. Pielecha, J.; Skobiej, K.; Kurtyka, K. Exhaust Emissions and Energy Consumption Analysis of Conventional, Hybrid, and ElectricVehicles in Real Driving Cycles. Energies 2020, 13, 6423. [CrossRef]
20. Pielecha, J.; Gis, M.; Skobiej, K.; Kurtyka, K. Measurements of particulate emissions from Euro 5/6 passenger cars in differentdrive settings. IOP Conf. Ser. Earth Environ. Sci. 2021. [CrossRef]
21. Annual Air Quality Assessment in the Dolnoslaskie Voivodeship; Voivodship Report for 2019; Inspectorate of Environmental Protection:Warshawa, Poland, 2019.
22. Inspectorate of Environmental Protection. Annual Air Quality Assessment in the Malopolskie Voivodeship. Voivodship Reportfor 2017; 2018. Available online: http://powietrze.gios.gov.pl/pjp/rwms/publications/card/1163 (accessed on 26 April 2021).
23. Traczyk, P.; Gruszewska-Kosowska, A. The Condition of Air Pollution in Kraków, Poland, in 2005–2020, with Health RiskAssessment. Int. J Environ. Res. Public Health. 2020, 17, 6063. [CrossRef] [PubMed]
24. LIFE-MAPPINGAIR/PL. What’s the Difference between Emission and Immission? Available online: https://mappingair.meteo.uni.wroc.pl/en/2020/04/whats-the-difference-between-emission-and-immission/ (accessed on 24 January 2021).
179

Energies 2021, 14, 2529
25. Optical Particle Sizer 3330. Available online: https://tsi.com/products/particle-sizers/particle-size-spectrometers/optical-particle-sizer-3330/ (accessed on 12 March 2021).
26. Ding, J.; Dai, Q.; Li, Y.; Han, S.; Zhang, Y.; Feng, Y. Impact of meteorological condition changes on air quality and particulatechemical composition during the COVID-19 lockdown. J. Environ. Sci. 2021, 109, 45–56. [CrossRef]
27. Kwak, H.Y.; Ko, J.; Lee, S.; Joh, C.H. Identifying the correlation between rainfall, traffic flow performance and air pollutionconcentration in Seoul using a path analysis. Transp. Res. Proc. 2017, 25, 3552–3563. [CrossRef]
28. Minarro, M.D.; Banon, D.; Egea, J.A.; Costa-Gomez, I.; Baeza Caracena, A. A multi-pollutant methodology to locate a single airquality monitoring station in small and medium-size urban areas. Environ. Pollut. 2020, 266, 115279. [CrossRef] [PubMed]
29. Nowak, M.; Galant, M.; Kardach, M.; Maciejewska, M. Using the simulation technique to improve efficiency in general aviation.AIP Conf. Proc. 2019, 2078, 020097.
30. Galant, M.; Nowak, M.; Jasinski, R. Implementation of the LTO cycle in flight conditions using FNTP II MCC simulator. IOP Conf.Ser. Mater. Sci. Eng. 2018, 421, 042060.
31. Jasinski, R. Mass and number analysis of particles emitted during aircraft landing. In Proceedings of the E3S Web Conference,10th Conference on Interdisciplinary Problems in Environmental Protection and Engineering EKO-DOK, Polanica-Zdrój, Poland,16–18 April 2018; Volume 44, p. 00057. [CrossRef]
32. Jasinski, R. Number and mass analysis of particles emitted by aircraft engine. In Proceedings of the MATEC Web Conference, VIIInternational Congress on Combustion Engines, Poznan, Poland, 27–29 June 2017; Volume 118, p. 0023.
180

energies
Article
Mathematical Modelling and Operational Analysisof Combined Vertical–Horizontal Heat Exchangerfor Shallow Geothermal Energy Applicationin Cooling Mode
Sarwo Edhy Sofyan 1, Eric Hu 2, Andrei Kotousov 2,*, Teuku Meurah Indra Riayatsyah 1 and
Razali Thaib 1
1 Department of Mechanical Engineering, Universitas Syiah Kuala, Banda Aceh 23111, Indonesia;[email protected] (S.E.S.); [email protected] (T.M.I.R.); [email protected] (R.T.)
2 School of Mechanical Engineering, The University of Adelaide, Adelaide, SA 5005, Australia;[email protected]
* Correspondence: [email protected]
Received: 27 October 2020; Accepted: 11 December 2020; Published: 14 December 2020
Abstract: Geothermal heat exchangers (GHEs) represent a buried pipe system, which can be utilisedto harness renewable thermal energy stored in the ground to improve the efficiency of heatingand cooling systems. Two basic arrangements of GHEs have been widely used: vertical andhorizontal. Vertical GHEs generally have a better performance in comparison with the horizontalarrangement, and these systems are particularly suitable for confined spaces. Nevertheless, the maintechnical challenge associated with GHEs, for either the vertical or the horizontal arrangement, isthe performance deterioration associated with an increase in the operation times during summeror winter seasons. In this paper, a combined horizontal-vertical GHE arrangement is proposed toaddress the current challenges. The combined GHE arrangement can be operated in five differentmodes, corresponding to different thermal loading conditions. These five operation modes of thecombined GHE are analysed based on the transient finite difference models previously developed forthe horizontal and vertical arrangements. The simulation results reveal that for the single operationmode (horizontal or vertical only), the vertical GHE performs better than the horizontal GHE due torelatively stable ground temperature deep down. While, for the combined operation mode, the seriesoperations (horizontal to vertical or vertical to horizontal) of the GHE are superior to the split mode.It is found that the effect of the fluid mass flow rate ratio is trivial on the heat dissipation of the splitmode GHE. The highest heat transfer rate in the split flow operational mode is rendered by the ratioof the mass flow rate of 40% horizontal and 60% vertical. In addition, the climate condition has moreeffect on GHE’s performance and the increase of the fluid flow rate it can enhance the amount ofenergy released by the GHE.
Keywords: geothermal heat exchangers; combined arrangement; operation analysis
1. Introduction
Increasing energy demands and crude oil depletion have forced the world to explore newenergy resources, those that are not only sustainable but also have a minor environmental footprint.Shallow geothermal energy is one of the sustainable energy resources that could be applied to improvethe efficiency of current and future heating and cooling systems. This renewable thermal energy isusually exploited in a geothermal heat exchanger (GHE); a system of pipes buried in the ground,in which the heat carrier fluid is circulated. GHEs are normally integrated with heat pumps and airconditioning systems. These systems use the ground as a heat source/sink during heating/cooling to
Energies 2020, 13, 6598; doi:10.3390/en13246598 www.mdpi.com/journal/energies181
Energies 2020, 13, 6598
provide the thermal comfort condition of buildings’ interiors in both winter and summer. Comparedwith the traditional air source heat pumps and air conditioning systems, the application of GHEs as athermal energy rejecter/absorber can reduce energy consumption by 30%–60%, since the ground has arelatively stable temperature [1].
There have been two basic arrangements of GHEs: vertical and horizontal. Vertical GHEs havebeen widely installed in confined areas such as an urban area or an area where the earth is rocky close tothe surface. The typical depth of vertical GHEs varies from 20 to 300 m [2]. Vertical GHEs have a betterefficiency since the ground temperature at the deeper depth below the surface remains relatively largelyconstant all year around. The drawback of vertical GHEs, however, is their installation cost, which ishigher than for the horizontal arrangement. In addition, the degradation in their thermal performanceis relatively hard to recover because of the poor soil thermal conductivity and relatively deep depth ofburring, which hinder the heat transfer rate to and from the atmosphere. Horizontal GHEs are mostlyinstalled where a land area is available at low cost. They are buried in a horizontal trench, with atypical depth up to 2 m below the surface. The continuous thermal interaction between the groundand the atmosphere could improve the GHE’s performance through an appropriate operation mode.The diverse mechanisms of the heat transfer occurring on the ground surface could also facilitate thethermal recovery in the case of a horizontal arrangement.
The technical challenges associated with GHEs are their performance degradation with an increasein the operation time, which often happens in heating or cooling seasons. This performance degradationis slow to restore, especially for vertical GHEs. Meanwhile, it can be minimised if the GHEs are runintermittently or with a smaller thermal load, which can be achieved with the proposed GHE system,which combines both vertical and horizontal arrangements. To address the degradation performanceproblem caused by an imbalance in the heating and cooling loads, a number of researchers haveproposed hybrid GHE systems and different operation strategies [3]. For example, hybrid GHE, solarenergy systems, and heat pump have been suggested by a number of researchers [4–8], to cope withperformance deterioration. Dai et al. [4] carried out an experimental study on a solar assisted groundsource heat pump system. In the parallel mode, the performance of the heat pump, under three differentflow rate ratios of working fluid inside both solar and shallow geothermal systems, is investigated.The outcomes of this study demonstrated that the hybrid systems could recover the degradation of soiltemperature much faster than happens during natural recovery. In addition, the effect of the flow rateratio in mode 4 has a significant impact on the electricity consumption. The electricity consumptiondecreases with the increase in the flow rate ratio of the solar heat storage water tank. Furthermore,mode 3 is recommended for use in the coldest months.
Kjellsson et al. [5] analysed different systems with a combination of a ground source heat pumpand a solar collector to provide heating for houses and domestic hot water systems. The outcomesdemonstrated that the system works in an optimal regime when the solar energy is utilised torecharge the borehole during winter time and to produce the domestic hot water during summer time.The performance of a solar assisted ground source heat pump, which is used for green house heating,was investigated by Ozgener et al. [6]. The archived exergetic efficiency of the overall system wasreported to be at 67.7%. Yang et al. [7] presented a theoretical and experimental study on a solar-groundsource heat pump system. The experimental coefficient of performances (COPs) of modes 2, 3, and 4were obtained 2.69, 2.65, and 2.59, respectively. While the theoretical COPs were found to be 3.67, 3.64,and 3.52, which are quite different from the theoretical values. In addition, research on small ammoniaheat pumps for space and hot tap water heater with a capacity of 8.4 kW to provide space heatingand hot water has been done by Aleksandrs Zajacs et al. [8]. In this study, equation calculations havebeen carried out using the engineering equation solver (EES) to estimate the heat pump performance.The results of the calculations are able to provide electrical energy savings of up to 75% comparedto using electric heating. The volume of the tank also affects the efficiency of the heat pump andcompressor usage. The optimal tank volume is 1000 L to cover 2–3 h of high electricity price peaks.
182

Energies 2020, 13, 6598
Studies on hybrid ground source heat pump systems with a cooling tower as a supplemental heatrejecter were presented by a number of researchers [9–13]. Park et al. [9] proposed a new parallel systemcomprising of a hybrid ground source heat pump-cooling tower. The new parallel system enables theGHE to be switched off during the recovery period of the soil thermal condition. The performance ofthe heat pump was investigated at different flow rates of the fluid in the primary flow loop (the heatpump), GHE, and cooling tower. The results indicated that the parallel system of the ground sourceheat pump-cooling tower generates 21% COP more than that produced by the conventional groundsource heat pump system. Man et al. [10] provided the technical and economic analysis of a hybridcooling tower-ground source heat pump, based on the hourly load of a two storey residential buildinglocated in Hong Kong. The hybrid system in this study not only solves the thermal degradationproblem, but also reduces the operation and capital costs of the air conditioning system. A study ofthe operation strategy of a hybrid cooling tower-ground source heat pump system was presented byWang et al. [11]. The operation strategy consists of a fixed cooling set point, outside air reset, wet bulbreset, and load reset. Fan et al. [13] presented a theoretical design of a hybrid cooling tower-groundsource heat pump, which takes into account the effect of borehole distance, borehole depth, and thermalproperties of the grout. In this study, a combined strategy of operation was introduced. The resultsshowed that the lowest energy consumption was obtained when the control strategies of the enteringwater temperature and wet-bulb temperature differences are combined.
Canelli et al. [14], presented an analysis of the energy, economic, and environmental performancesof three different hybrid ground source heat pump systems including (1) a hybrid boiler-chiller-groundsource heat pump, (2) a hybrid boiler-chiller-ground source heat pump and fuel cell, and (3) a hybridboiler-chiller-ground source heat pump and photovoltaic thermal system. The system was optimisedto meet the heating and cooling conditions of both residential and commercial buildings, which arein a sharing load. The results indicated that the hybrid system with the fuel cells and photovoltaicthermal system has a definite advantage in terms of energy savings, operational costs, and carbonemission reductions.
A detailed numerical study was conducted by Zhu et al. [15] to investigate the performance andeconomic characteristics of a combined vertical ground source heat pump and phase change materialcooling storage system. The optimal performance of the hybrid system was achieved by varyingthe ratio of the phase change material cooling storage system to the total cooling load of the system.The obtained optimal cooling storage ratio was close to 40%.
A hybrid system of the ground source electrical heat pump and ground source absorption heatpump was proposed by Wu et al. [16]. The motivation for this study was to combine the featuresof both heat pumps, as the ground source electrical heat pump has higher energy efficiency in thecooling mode. Conversely, the ground source absorption heat pump has higher energy efficiency inthe heating mode. This study also presented the effects of supply ratios on thermal imbalance ratios,annual primary energy efficiency, and cost-efficiency characteristics.
A theoretical study on a hybrid air source heat compensator-vertical ground source heat pumpsystem was conducted by You et al. [17], using a simulation tool, TRNSYS. Four operation strategieswere analysed including an air source heat compensator for direct heat compensation, a combined airsource heat compensator-ground source heat pump for heat compensation, a combined air source heatcompensator-ground source heat pump for space heating, and an air source heat compensator-groundsource heat pump for domestic hot water. The results showed that the hybrid air source heatcompensator-ground source heat pump reduces energy consumption by 23.86% compared withthe boiler-split air conditioner system. Additionally, the operational costs are reduced by 50%.Another study has done by Xianting Li et al. [18] by developing an energy-efficient heat pump systemusing the TRNSYS simulation tool in a combination of a hybrid source and three types of hybrid sourceheat pumps to calculate the efficiency of year-round operation. The results show that the hybrid heatpump system can maintain heat reliability during year-round operation including winter. This hybridsource heat pump system saves energy up to 15% and the payback period is approximately five years.
183

Energies 2020, 13, 6598
In addition, Gaoyang Hou et al. [19] also conducted a simulation using the TRNSYS tool to analyse thework system of heat pumps sourced from hybrid soil with optimal control strategies. His researchcombines a horizontal ground loop and a liquid dry cooler with a short and long term simulationprocess on TRNSYS to analyse soil thermal conditions and energy variations. Gaoyang Hou et al. alsoperformed a simulation using the TRNSYS tool to analyse the heat pump working system sourcedfrom hybrid soil with optimal control strategies. Their research combines a horizontal ground loopand a liquid dry cooler with a short and long term simulation process on TRNSYS to analyse soilthermal conditions and energy variations. The simulation results show that the overall performance inthe short-term simulation is influenced mainly by the temperature of the diverter heating set ratherthan by cooling. Diverter heating set was recommended about 8–10 ◦C in climatic zones similarto the Birmingham area by combining long-term coefficient of performance (COP) values and soilthermal variation.
A hybrid active air source regeneration-ground source heat pump system was studied byAllaerts et al. [20]. In this study, the borehole area is divided into two different regions, namely warmand cold regions. These two different regions were proposed to balance the extraction/rejection of heatduring heating and cooling periods. In addition, a supplementary dry cooler was used to captureheat/cold during summer/winter to recover the degradation of the soil thermal condition. According toAllaerts et al. the proposed hybrid system can significantly reduce the size of the borehole area by upto 47% in the cost-optimal configuration.
The brief review of the literature [1–22] above shows that most researchers proposed a hybridcooling tower-ground source heat pump for a cooling load dominated regime and a hybrid solarsystem-ground source heat pump for heating load dominated conditions. Some other studies proposeda combined system of a ground source heat pump with different additional heat rejecter/absorbersystems including a boiler, chiller, fuel cell, photovoltaic, and phase change material cooling storagesystems. Additionally, a ground source heat pump system with two different regions of BHEs includingwarm and cold was recently suggested and analysed. However, it seems a comprehensive study of acombined GHE arrangement with different operation modes has yet to be presented.
This paper is focused on the operational analysis of a combined horizontal-vertical GHE to addressvarious demands and thermal loading conditions. The performance of the combined GHE is studiedbased on the results of a transient finite difference model developed in this paper. The effects ofcontinuous and intermittent operation conditions, climate condition and fluid mass flow rate on theGHE’s performance are investigated with this new model. Based on the analysis of the outcomesof numerical simulations, the recommendations for the optimum operation of combined GHEs aresummarised in the conclusion.
2. Development of a Combined Horizontal–Vertical Geothermal Heat Exchanger Model
2.1. Physical Model
The physical model is described first including a number of simplifications, which are usuallyneeded for quantitative analysis of complex systems or phenomena. A horizontal GHE, as shownin Figure 1a, represents a multi-U-shaped pipe buried in a trench at a specific depth h close to theground surface. A horizontal GHE has a total length L, diameter d, wall thickness t, and pipe spacingLs. The heat transfer process at the horizontal GHE occurs when the fluid at a temperature Tfi entersthe GHE and exchanges the heat energy with the pipe’s inner surface by convection. The heat thenconducts through the pipe wall to the surrounding soil. The ground exchanges the heat at the groundsurface with the atmosphere through diverse heat transfer mechanisms including reflection, convection,radiation, and evaporation. A vertical GHE, as shown in Figure 1b, could be modelled as a singleU-shaped pipe, which is buried inside a borehole having a diameter Db and depth z. The pipe isdescribed by diameter d, length L, thickness t, and shank spacing Ls. The borehole is usually filledwith a material, which has a relatively higher thermal conductivity than the surrounding soil, in order
184
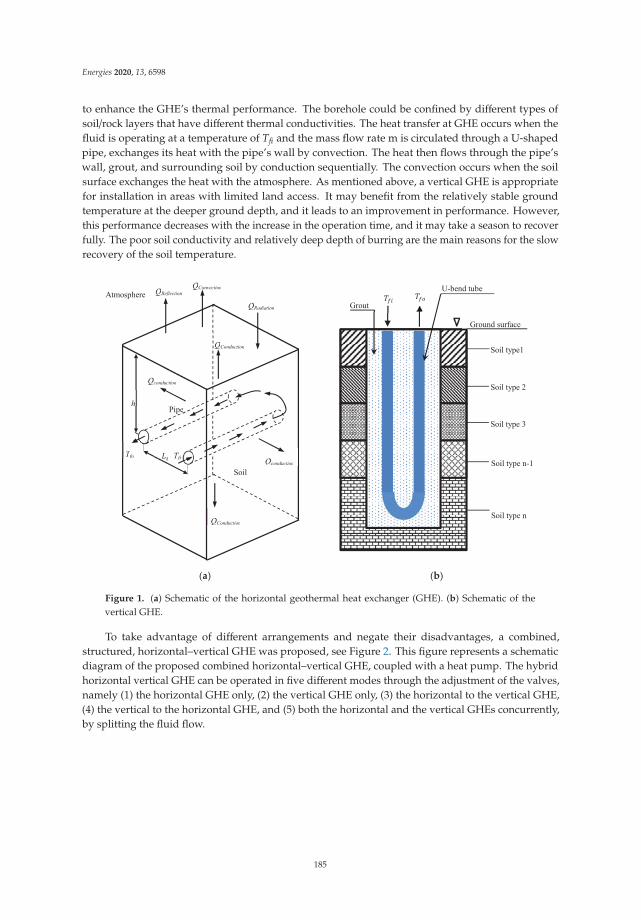
Energies 2020, 13, 6598
to enhance the GHE’s thermal performance. The borehole could be confined by different types ofsoil/rock layers that have different thermal conductivities. The heat transfer at GHE occurs when thefluid is operating at a temperature of Tfi and the mass flow rate m is circulated through a U-shapedpipe, exchanges its heat with the pipe’s wall by convection. The heat then flows through the pipe’swall, grout, and surrounding soil by conduction sequentially. The convection occurs when the soilsurface exchanges the heat with the atmosphere. As mentioned above, a vertical GHE is appropriatefor installation in areas with limited land access. It may benefit from the relatively stable groundtemperature at the deeper ground depth, and it leads to an improvement in performance. However,this performance decreases with the increase in the operation time, and it may take a season to recoverfully. The poor soil conductivity and relatively deep depth of burring are the main reasons for the slowrecovery of the soil temperature.
(a) (b)
Ground surface
𝑇 𝑇
Soil type1
Soil type 2
Soil type 3
Soil type n-1
Soil type n
U-bend tube
Grout
Pipe
Soil
Tfi Tfo
Atmosphere
QConduction
Qconduction
Qconduction
QConduction
QReflection QConvection
QRadiation
h
𝐿
Figure 1. (a) Schematic of the horizontal geothermal heat exchanger (GHE). (b) Schematic of thevertical GHE.
To take advantage of different arrangements and negate their disadvantages, a combined,structured, horizontal–vertical GHE was proposed, see Figure 2. This figure represents a schematicdiagram of the proposed combined horizontal–vertical GHE, coupled with a heat pump. The hybridhorizontal vertical GHE can be operated in five different modes through the adjustment of the valves,namely (1) the horizontal GHE only, (2) the vertical GHE only, (3) the horizontal to the vertical GHE,(4) the vertical to the horizontal GHE, and (5) both the horizontal and the vertical GHEs concurrently,by splitting the fluid flow.
185

Energies 2020, 13, 6598
Figure 2. Schematic of the hybrid horizontal vertical GHE.
2.2. Mathematical Model
The performance of the combined GHE was studied based on the previously developedmathematical models for the horizontal [21] and vertical [22] GHE, respectively. The key equations inthese models are briefly summarised below.
2.2.1. Governing Equation of the Soil
The thermal model of the soil domain around the horizontal GHE is developed based on theCartesian coordinates as it is easy to handle when applying the soil’s internal source term, in which thevalue varies with the increase in the soil depth. The governing equation of the soil domain around thehorizontal GHE is given as:
1αs
∂Ts
∂t=∂2Ts
∂x2 +∂2Ts
∂y2 +Hs
ks(1)
The thermal model of the soil domain around the vertical GHE is developed by considering thecylindrical coordinates. The cylindrical coordinates are selected because these represent the shapeof the borehole, thus the boundary conditions can be easily defined and prescribed. As a result, anaccurate result can be obtained. The governing equation of the soil domain around the vertical GHE isgiven as
1αs
∂Ts
∂t=∂2Ts
∂r2 +1r∂Ts
∂r+∂2Ts
∂z2 +Hs
ks(2)
An internal heat source term was used to take into account the effect of seasonal changes in soiltemperature [21,23], expressed by the following equation:
Hs = ρscsΔTs
Δt(3)
The direct measurement or analytical approach can be used to determine deviations in soiltemperature during the process of seasonal change. The experimental results are preferred as theyrepresent the actual soil temperature. However, it is sometimes hard to obtain the measurement
186

Energies 2020, 13, 6598
data, especially for a specific location and a certain depth. Thus, the analytical equation presented byBaggs [24] was used in this work:
T(x, t) = (Tm ± ΔTm) + 1.07kvAse(−0.00316x( 1α )
0.5)cos
[2π365
(t− t0 − 0.1834x
( 1α
)0.5)](4)
2.2.2. Governing Equation of the Temperature Exchange in the Grout for the Vertical GHE
The governing equation of the grout is given by a similar equation to the one above:
1αg
∂Tg
∂t=∂2Tg
∂r2 +1r∂Tg
∂r+∂2Tg
∂z2 (5)
2.2.3. Governing Equation of the Pipe
The energy balance equation for the pipe is
cpρpVp∂Tp
∂t= Ah f
(T f − Tp
)+
kgA0.5Δr
(Ts − Tp
)(6)
The area of the pipe for the vertical GHE was determined based on an equivalent pipe diameter,which is given later by Equation (8).
2.2.4. Governing Equation of the Fluid
For the working fluid, the energy balance equation states
c fρ f A∂T f
∂t= πdinh f
(Tp − T f
)− .
m f c f∂T f
∂z(7)
Equation (6) can be applied directly to the evaluation of performance of horizontal GHE. Whilefor the vertical GHE, the internal pipe diameter din was replaced with an equivalent pipe diameter Deq
since the single U shaped pipe is represented as a pipe, which has an equivalent diameter (refer toFigure 3). The equation to calculate the equivalent diameter has been developed and validated by Guand Oneal [25] as:
Deq =√
2DpLs (8)
Figure 3. Schematic of the vertical GHE with an equivalent diameter.
The equation is valid if Dp ≤ Ls ≤ rb
2.2.5. The Initial and Boundary Conditions
• The initial conditions are:Ts = T (x, t), t = 0 (9)
187

Energies 2020, 13, 6598
Tg = Ts, t = 0 (10)
• The boundary conditions of the computational domain of the horizontal GHE are:
∂Ts
∂x|x=0 = 0 (11)
∂Ts
∂x|x=xmax = 0 (12)
Qca, y = 0 (13)
∂Ts
∂y|y=ymax = 0 (14)
• The boundary conditions of the computational domain of the vertical GHE are:
Qc f , r = rin (15)
∂Ts
∂r|r=rmax = 0 (16)
Qca, z = 0 (17)
∂Ts
∂z|z=zmax = 0 (18)
The system of differential Equations (1), (2), and (4)–(6) were solved by using an explicit finitedifference scheme, which provided the accurate solution for the temperature distribution in the soil,grout, pipe, and fluid. As an example, Figure 4 shows the computational domain of the vertical GHE.The working fluid exchanges the heat energy with the pipe’s surface, which then flows through the pipewall in a 1D way. The heat is then transferred through the grout and surrounding soil in a 2D manner.Two different boundary conditions are applied at the boundary of the soil domain. The convectionheat transfer is considered at the ground surface, while the adiabatic conditions are applied at thebottom and lateral edges of soil domain boundaries.
Figure 4. Computational domain of the vertical GHE.
188

Energies 2020, 13, 6598
To achieve the stability of the explicit numerical calculations, the time step Δt must be within theCourant–Friedrichs–Lewy stability range [26], which is given by:
∣∣∣ψ∣∣∣ ≤ 1, Δt ≤ Δzv f
(19)
Total of heat exchange by the GHE was calculated in accordance with the following equation:
Q =.
mcp(T f i − T f o
)Δt (20)
For the split flow mode, the final temperature of mixed fluid from both the horizontal and thevertical GHE was found as:
T f mix =
( .m f h c f T f oh +
.m f v c f T f ov
)( .m f h c f +
.m f v c f
) (21)
The described GHE’s models were validated against the experimental data [21–23] and will beused to simulate the performance of a combined GHE.
3. A Hypothetical Case Study
In this study, each arrangement of the GHEs (horizontal or vertical) was set to have the sameparameters including the pipe length, pipe diameter, and fluid flow rates. The soil domain around theGHEs was assumed to be a single soil layer, which was homogeneous and isotropic. Table 1 presentsthe parameters of the reference case used in the simulation to be described next.
Table 1. The parameters of the reference case.
Parameters Value Unit Parameters Value Unit
Horizontal GHE - - Circulation fluid (water) - -
Total pipe length (L) 200 m Inlet water temperature (T f i) 50 ◦CBurial depth (h) 0.25 m Flow rate (
.m f ) 0.6 kg/s
Pipe internal diameter (din) 0.04 m Specific heat (c f ) 4188 J/kg K
Pipe outer diameter (dout) 0.044 m Density (ρ f ) 980 kg/m3
Centre distance betweenpipe (Ls)
0.28 m Soil type in Adelaide: layeredold dune sands [27] - -
Distance of soil domain in xdirection (z) 0.14 m Thermal conductivity (ks) 1.3 W/m K
Distance of soil domain in ydirection (z) 1.5 m Specific heat (cs) 1140 J/kg K
Vertical GHE - - Density (ρs) 1500 kg/m3
Total pipe length (L) 200 m Soil type in Brisbane: clay [28] - -
Borehole depth (h) 100 m Thermal conductivity (ks) 1.1 W/m K
Borehole diameter (Db) 0.15 m Specific heat (cs) 1500 J/kg K
Soil domain diameter (Ds) 4 m Density (ρs) 1300 kg/m3
Pipe internal diameter (din) 0.04 m Grout (vertical GHE)
Pipe outer diameter (dout) 0.044 m Thermal conductivity (kg) 2 W/m K
Centre distance betweenpipes (Ls)
0.07 m
Specific heat (cg) 1140 J/kg K
Density (ρg) 1500 kg/m3
Wind speed (Adelaide) 4.9 m/s
Wind speed (Brisbane) 3.8 m/s
The initial temperature of the ground was estimated using the analytical equation (4) suggestedby Baggs [24]. The Baggs’ equation was determined based on the input parameters of the climate
189
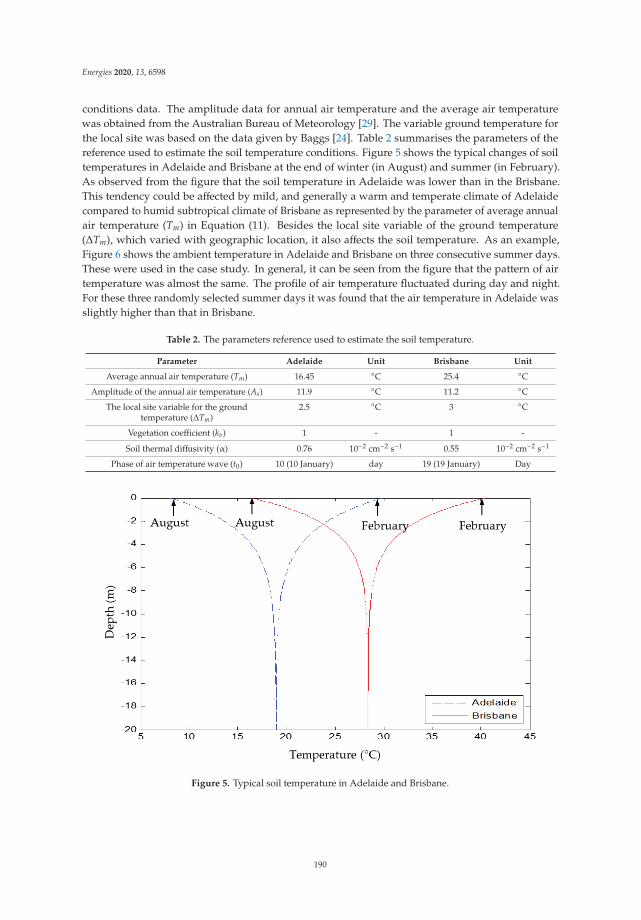
Energies 2020, 13, 6598
conditions data. The amplitude data for annual air temperature and the average air temperaturewas obtained from the Australian Bureau of Meteorology [29]. The variable ground temperature forthe local site was based on the data given by Baggs [24]. Table 2 summarises the parameters of thereference used to estimate the soil temperature conditions. Figure 5 shows the typical changes of soiltemperatures in Adelaide and Brisbane at the end of winter (in August) and summer (in February).As observed from the figure that the soil temperature in Adelaide was lower than in the Brisbane.This tendency could be affected by mild, and generally a warm and temperate climate of Adelaidecompared to humid subtropical climate of Brisbane as represented by the parameter of average annualair temperature (Tm) in Equation (11). Besides the local site variable of the ground temperature(ΔTm), which varied with geographic location, it also affects the soil temperature. As an example,Figure 6 shows the ambient temperature in Adelaide and Brisbane on three consecutive summer days.These were used in the case study. In general, it can be seen from the figure that the pattern of airtemperature was almost the same. The profile of air temperature fluctuated during day and night.For these three randomly selected summer days it was found that the air temperature in Adelaide wasslightly higher than that in Brisbane.
Table 2. The parameters reference used to estimate the soil temperature.
Parameter Adelaide Unit Brisbane Unit
Average annual air temperature (Tm) 16.45 ◦C 25.4 ◦CAmplitude of the annual air temperature (As) 11.9 ◦C 11.2 ◦C
The local site variable for the groundtemperature (ΔTm)
2.5 ◦C 3 ◦C
Vegetation coefficient (kv) 1 - 1 -
Soil thermal diffusivity (α) 0.76 10−2 cm−2 s−1 0.55 10−2 cm−2 s−1
Phase of air temperature wave (t0) 10 (10 January) day 19 (19 January) Day
Figure 5. Typical soil temperature in Adelaide and Brisbane.
190

Energies 2020, 13, 6598
Figure 6. An example of ambient temperature in Adelaide and Brisbane on 3 consecutive summer days.
The effect of seasonal changes on the soil temperature is modelled by incorporating the internalsource term concept into the GHE model [21]. The value of the internal source term varied with thesoil depths. It was higher in a shallow region and lower in a deeper zone. At a depth of 12 m belowthe ground surface, the value of the internal source term was assumed to be zero (this correspondedto the depth at which the effect of the ambient temperature on the soil temperature was negligible).Figure 7 shows the absolute value of the internal source term at various depths for two referencelocations, namely Adelaide and Brisbane. As is shown in Figure 7, at the upper layer (0–3.5 m depth),the internal source term of the soil in Brisbane was relatively higher than in Adelaide. However, at adeeper layer, the condition was in the opposite. This phenomenon could be affected by meteorological,terrain, and subsurface conditions. The value of the internal heat source was positive when theground temperature was warm (August to February) and conversely it was negative when the groundtemperature was cool (February to August), as is shown in Figure 5.
Figure 7. The absolute value of the internal heat source at various depths.
4. Results and Discussion
This section shows the simulation outcomes of the GHE subjected to five operational modes, asdescribed above. The analysis and discussion on continuous operation, intermittent operation, split
191
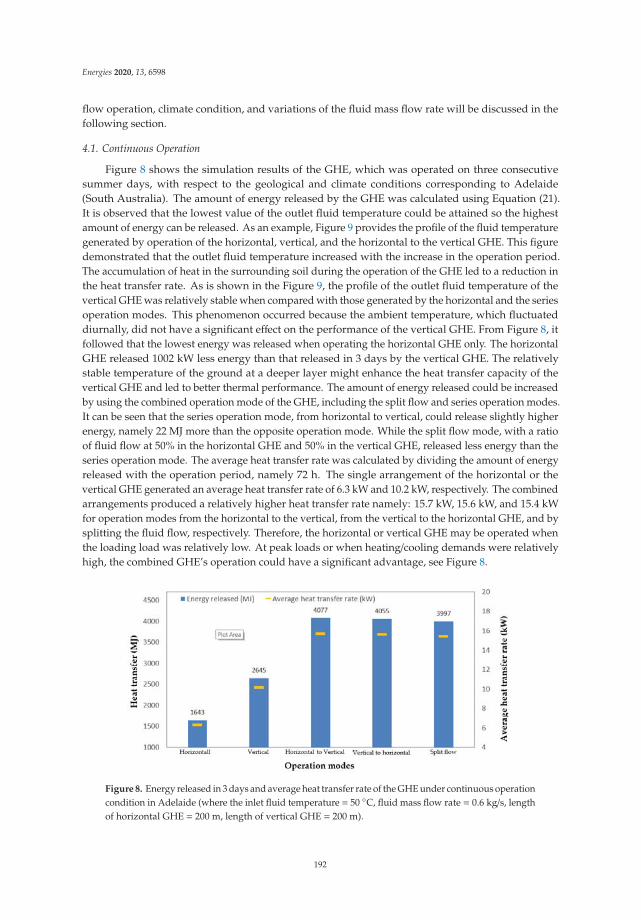
Energies 2020, 13, 6598
flow operation, climate condition, and variations of the fluid mass flow rate will be discussed in thefollowing section.
4.1. Continuous Operation
Figure 8 shows the simulation results of the GHE, which was operated on three consecutivesummer days, with respect to the geological and climate conditions corresponding to Adelaide(South Australia). The amount of energy released by the GHE was calculated using Equation (21).It is observed that the lowest value of the outlet fluid temperature could be attained so the highestamount of energy can be released. As an example, Figure 9 provides the profile of the fluid temperaturegenerated by operation of the horizontal, vertical, and the horizontal to the vertical GHE. This figuredemonstrated that the outlet fluid temperature increased with the increase in the operation period.The accumulation of heat in the surrounding soil during the operation of the GHE led to a reduction inthe heat transfer rate. As is shown in the Figure 9, the profile of the outlet fluid temperature of thevertical GHE was relatively stable when compared with those generated by the horizontal and the seriesoperation modes. This phenomenon occurred because the ambient temperature, which fluctuateddiurnally, did not have a significant effect on the performance of the vertical GHE. From Figure 8, itfollowed that the lowest energy was released when operating the horizontal GHE only. The horizontalGHE released 1002 kW less energy than that released in 3 days by the vertical GHE. The relativelystable temperature of the ground at a deeper layer might enhance the heat transfer capacity of thevertical GHE and led to better thermal performance. The amount of energy released could be increasedby using the combined operation mode of the GHE, including the split flow and series operation modes.It can be seen that the series operation mode, from horizontal to vertical, could release slightly higherenergy, namely 22 MJ more than the opposite operation mode. While the split flow mode, with a ratioof fluid flow at 50% in the horizontal GHE and 50% in the vertical GHE, released less energy than theseries operation mode. The average heat transfer rate was calculated by dividing the amount of energyreleased with the operation period, namely 72 h. The single arrangement of the horizontal or thevertical GHE generated an average heat transfer rate of 6.3 kW and 10.2 kW, respectively. The combinedarrangements produced a relatively higher heat transfer rate namely: 15.7 kW, 15.6 kW, and 15.4 kWfor operation modes from the horizontal to the vertical, from the vertical to the horizontal GHE, and bysplitting the fluid flow, respectively. Therefore, the horizontal or vertical GHE may be operated whenthe loading load was relatively low. At peak loads or when heating/cooling demands were relativelyhigh, the combined GHE’s operation could have a significant advantage, see Figure 8.
Figure 8. Energy released in 3 days and average heat transfer rate of the GHE under continuous operationcondition in Adelaide (where the inlet fluid temperature = 50 ◦C, fluid mass flow rate = 0.6 kg/s, lengthof horizontal GHE = 200 m, length of vertical GHE = 200 m).
192
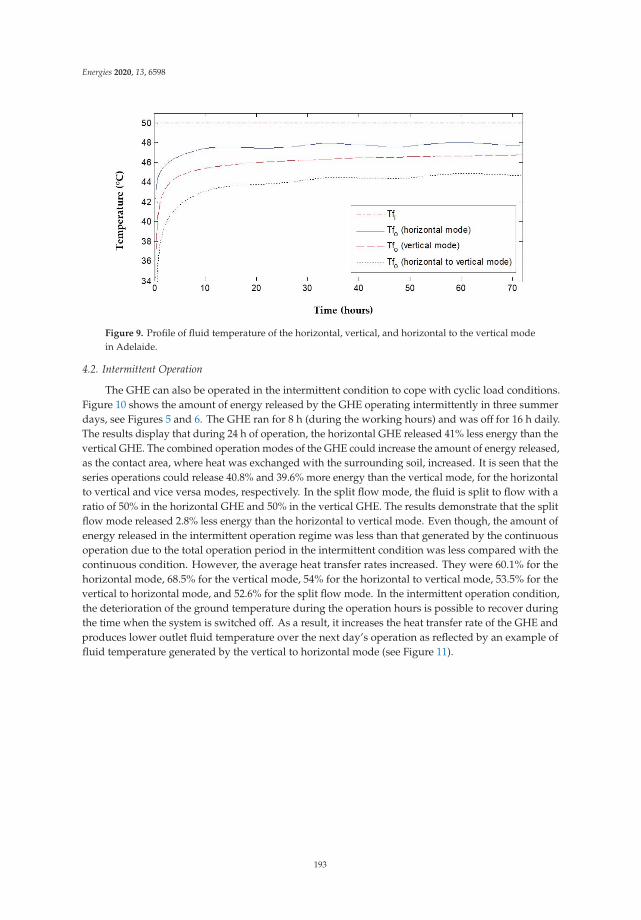
Energies 2020, 13, 6598
Figure 9. Profile of fluid temperature of the horizontal, vertical, and horizontal to the vertical modein Adelaide.
4.2. Intermittent Operation
The GHE can also be operated in the intermittent condition to cope with cyclic load conditions.Figure 10 shows the amount of energy released by the GHE operating intermittently in three summerdays, see Figures 5 and 6. The GHE ran for 8 h (during the working hours) and was off for 16 h daily.The results display that during 24 h of operation, the horizontal GHE released 41% less energy than thevertical GHE. The combined operation modes of the GHE could increase the amount of energy released,as the contact area, where heat was exchanged with the surrounding soil, increased. It is seen that theseries operations could release 40.8% and 39.6% more energy than the vertical mode, for the horizontalto vertical and vice versa modes, respectively. In the split flow mode, the fluid is split to flow with aratio of 50% in the horizontal GHE and 50% in the vertical GHE. The results demonstrate that the splitflow mode released 2.8% less energy than the horizontal to vertical mode. Even though, the amount ofenergy released in the intermittent operation regime was less than that generated by the continuousoperation due to the total operation period in the intermittent condition was less compared with thecontinuous condition. However, the average heat transfer rates increased. They were 60.1% for thehorizontal mode, 68.5% for the vertical mode, 54% for the horizontal to vertical mode, 53.5% for thevertical to horizontal mode, and 52.6% for the split flow mode. In the intermittent operation condition,the deterioration of the ground temperature during the operation hours is possible to recover duringthe time when the system is switched off. As a result, it increases the heat transfer rate of the GHE andproduces lower outlet fluid temperature over the next day’s operation as reflected by an example offluid temperature generated by the vertical to horizontal mode (see Figure 11).
193

Energies 2020, 13, 6598
Figure 10. Energy released in 3 days and average heat transfer rate of the GHE under intermittentoperation in Adelaide (where the inlet fluid temperature = 50 ◦C, fluid mass flow rate = 0.6 kg/s, lengthof horizontal GHE = 200 m, and length of vertical GHE = 200 m).
Figure 11. Profile of the fluid temperature of the horizontal to the vertical mode in Adelaide.
4.3. Split Flow Operation
In this section, the effect of the fluid mass flow rate ratio in the split flow operation mode wasinvestigated. The ratio of the fluid mass flow rate varied as follows: 30%:70%; 40%:60%; 50%:50%;60%:40%; and 70%:30% for the horizontal and the vertical GHE, respectively. From the currentnumerical simulations, it was found that the ratio of fluid mass flow rate in the split flow mode did notsignificantly affect the amount of energy released by the GHE, as shown in Figure 12. As an example,Figure 13, presents the outlet fluid temperature of the GHE at three different flow rate ratios, namely:30%:70%; 50%:50%; and 70%:30% for the horizontal and the vertical GHE, respectively. It is found thatthe difference in the outlet fluid temperature was relatively small. The highest fluid outlet temperaturewas yielded by the GHE with a flow rate ratio of 70%:30%. It can be seen that the GHE operated with aflow rate ratio of 70% horizontal and 30% vertical released the lowest amount of energy across threeconsecutive days of operation, namely, 3% less than the one with a flow rate ratio of 60% horizontal and40% vertical. The amount of energy released gradually increased with the increase of the ratio of thefluid mass flow rate in the vertical GHE and declined at the ratio of 30% horizontal and 70% vertical
194
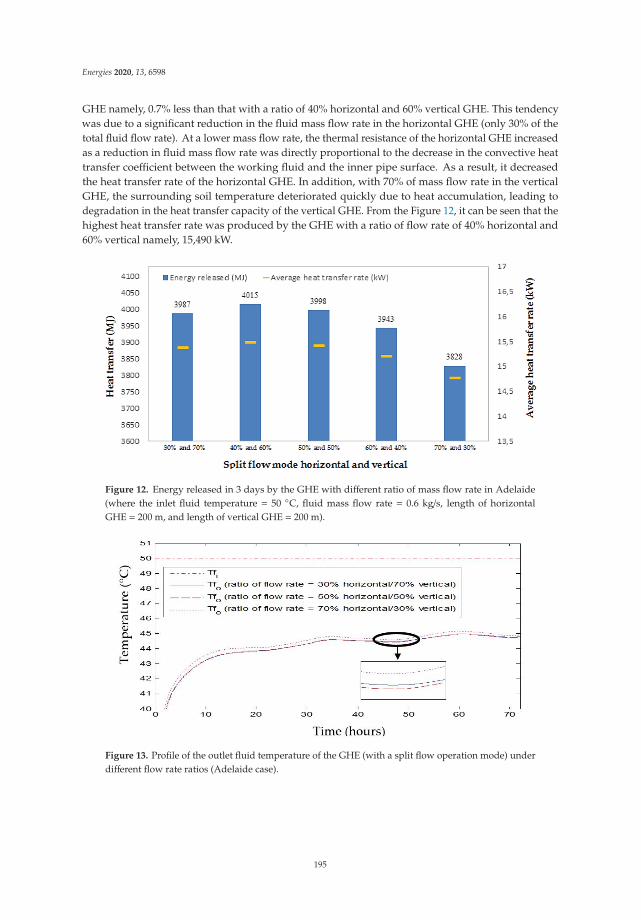
Energies 2020, 13, 6598
GHE namely, 0.7% less than that with a ratio of 40% horizontal and 60% vertical GHE. This tendencywas due to a significant reduction in the fluid mass flow rate in the horizontal GHE (only 30% of thetotal fluid flow rate). At a lower mass flow rate, the thermal resistance of the horizontal GHE increasedas a reduction in fluid mass flow rate was directly proportional to the decrease in the convective heattransfer coefficient between the working fluid and the inner pipe surface. As a result, it decreasedthe heat transfer rate of the horizontal GHE. In addition, with 70% of mass flow rate in the verticalGHE, the surrounding soil temperature deteriorated quickly due to heat accumulation, leading todegradation in the heat transfer capacity of the vertical GHE. From the Figure 12, it can be seen that thehighest heat transfer rate was produced by the GHE with a ratio of flow rate of 40% horizontal and60% vertical namely, 15,490 kW.
Figure 12. Energy released in 3 days by the GHE with different ratio of mass flow rate in Adelaide(where the inlet fluid temperature = 50 ◦C, fluid mass flow rate = 0.6 kg/s, length of horizontalGHE = 200 m, and length of vertical GHE = 200 m).
Figure 13. Profile of the outlet fluid temperature of the GHE (with a split flow operation mode) underdifferent flow rate ratios (Adelaide case).
195

Energies 2020, 13, 6598
4.4. Climate Condition
The performance of the GHE installed in a temperate climate corresponding to Adelaide wascompared with that installed in a subtropical climate, such as near Brisbane. Figure 14 summarisesthe performance of the GHE, which was installed in two different regions, with different climateconditions. It was found that during 72 h (3 days: 10–12 January) of the continuous operation, the GHEinstalled in Adelaide’s temperate climate could release 34.3% and 26.9% more energy compared withthat installed in Brisbane, for the horizontal and vertical mode, respectively. While for the combinedmodes including horizontal to vertical, vertical to horizontal, and split flow were 31.7%, 31.8%, and31% higher, respectively. It is observed that operating the vertical GHE only, in the temperate climate,Adelaide, could release an amount of energy that was almost the same as that released by the combinedoperation mode, in the subtropical climate. This tendency occurred because the climate conditioninfluenced the initial soil temperature in both regions. The initial soil temperature in Adelaide waslower than that in Brisbane, as seen in Figure 5. In addition, the difference in soil types in both locationscontributed to the heat transfer capacity of the GHE. As a result, the GHE installed in a temperateclimate, Adelaide, produced a lower outlet fluid temperature as demonstrated in Figure 15.
Figure 14. Energy released in 3 days by the GHE under different climate conditions (where the inletfluid temperature = 50 ◦C, fluid mass flow rate = 0.6 kg/s, length of horizontal GHE = 200 m, and lengthof vertical GHE = 200 m).
Figure 15. Profile of fluid temperatures of the horizontal, vertical, and the horizontal to vertical modesunder different climate conditions.
196
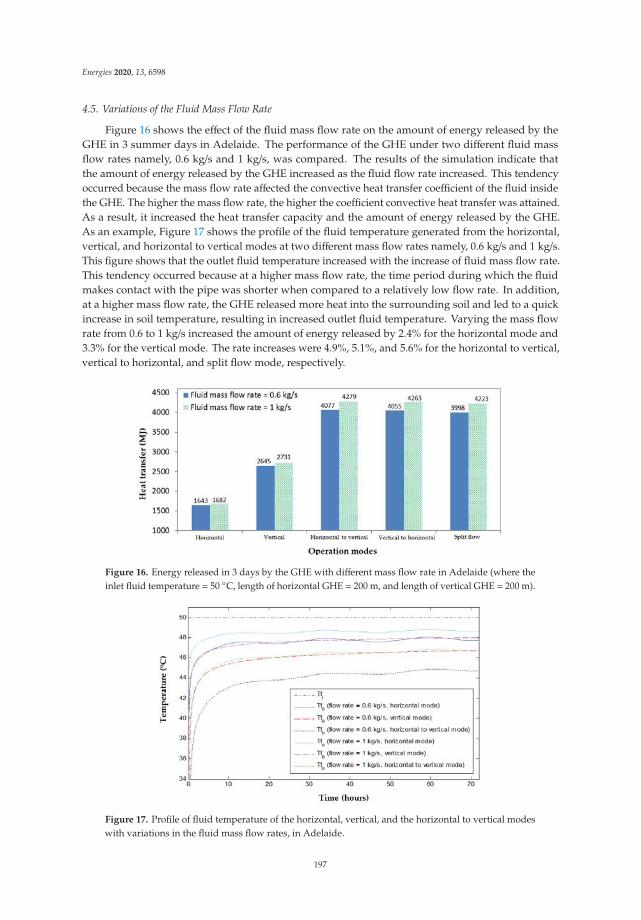
Energies 2020, 13, 6598
4.5. Variations of the Fluid Mass Flow Rate
Figure 16 shows the effect of the fluid mass flow rate on the amount of energy released by theGHE in 3 summer days in Adelaide. The performance of the GHE under two different fluid massflow rates namely, 0.6 kg/s and 1 kg/s, was compared. The results of the simulation indicate thatthe amount of energy released by the GHE increased as the fluid flow rate increased. This tendencyoccurred because the mass flow rate affected the convective heat transfer coefficient of the fluid insidethe GHE. The higher the mass flow rate, the higher the coefficient convective heat transfer was attained.As a result, it increased the heat transfer capacity and the amount of energy released by the GHE.As an example, Figure 17 shows the profile of the fluid temperature generated from the horizontal,vertical, and horizontal to vertical modes at two different mass flow rates namely, 0.6 kg/s and 1 kg/s.This figure shows that the outlet fluid temperature increased with the increase of fluid mass flow rate.This tendency occurred because at a higher mass flow rate, the time period during which the fluidmakes contact with the pipe was shorter when compared to a relatively low flow rate. In addition,at a higher mass flow rate, the GHE released more heat into the surrounding soil and led to a quickincrease in soil temperature, resulting in increased outlet fluid temperature. Varying the mass flowrate from 0.6 to 1 kg/s increased the amount of energy released by 2.4% for the horizontal mode and3.3% for the vertical mode. The rate increases were 4.9%, 5.1%, and 5.6% for the horizontal to vertical,vertical to horizontal, and split flow mode, respectively.
Figure 16. Energy released in 3 days by the GHE with different mass flow rate in Adelaide (where theinlet fluid temperature = 50 ◦C, length of horizontal GHE = 200 m, and length of vertical GHE = 200 m).
Figure 17. Profile of fluid temperature of the horizontal, vertical, and the horizontal to vertical modeswith variations in the fluid mass flow rates, in Adelaide.
197

Energies 2020, 13, 6598
5. Conclusions
In this paper, a combined GHE was proposed and its performance in five operational modes wasanalysed by using the validated models previously developed for horizontal and vertical arrangementsof GHEs. The main conclusions, which followed from the calculations, are summarised as follows:
1. With the same length of the pipe system, the vertical GHE could release more energy than thehorizontal GHE, as the initial soil temperature (in summer) at a deeper layer was lower than thatat a shallow region;
2. When the GHE operated in combined modes, the amount of energy released by the GHE wasincreased, as the contact area, where heat was exchanged with the surrounding soil, was increased;
3. The series operations (horizontal to vertical or vertical to horizontal) of the GHE could releasemore energy than could be done in the split mode. The difference in the fluid velocity in the splitflow and series modes contributed to the amount of energy released by the GHE;
4. The intermittent operation of the GHE might be conducted to cope with cyclic thermal loading.The intermittent operation could benefit the performance of the GHE as the degradation of theground temperature during the operation of the GHE was largely recovered during the systemshut down.
5. In the split flow mode, the ratio of the fluid mass flow rate did not significantly affect the amountof energy released by the GHE. The GHE with a ratio of mass flow rate of 40% horizontal and60% vertical releases the highest amount of energy in the split flow operational mode.
6. Climate conditions had a significant effect on the GHE’s performance. The GHE installed in atemperate climate, corresponding to Adelaide’s conditions, could release more energy than thesame installation located in a subtropical climate, such as Brisbane. This was due to the differencein the initial soil temperature.
7. Increasing the fluid mass flow rate could enhance the amount of energy released by the GHE asthe fluid mass flow rate affected the coefficient of the convective heat transfer of the working fluid.
Author Contributions: Conceptualization, methodology, and results and were initiated and wrote by S.E.S., E.H.and A.K.; S.E.S. contributed to the experiment and writing—original draft preparation; Writing—review andediting, T.M.I.R., R.T.; Supervision by E.H. and A.K. All authors have read and agreed to the published version ofthe manuscript.
Funding: This research received no external funding.
Acknowledgments: The authors graciously acknowledge the support provided by the School of MechanicalEngineering, the University of Adelaide.
Conflicts of Interest: The authors declare no conflict of interest.
Nomenclature
A area of the pipe (m2) Tg grout temperature (K)As amplitude of the annual air temperature (K) Tm average annual air temperature (◦C)c f fluid specific heat (J/kg K) Tp pipe temperature (K)cs soil specific heat (J/kg K) T(x, t) ground temperature at a given depth x on calendar day t
(◦C)cp pipe specific heat (J/kg K) T f i inlet fluid temperature (K)din internal pipe diameter (m) T f o outlet fluid temperatureDeq equivalent diameter of the pipe (m) T f mix final temperature of the mixed fluids (K)h f convective heat transfer coefficient of fluid (W/(m2 K)) Ts soil temperature (K)Hs soil heat source (W/m3) T f oh outlet temperature of the horizontal GHE (K)ks soil thermal conductivity (W/(m K)) T f ov outlet temperature of the vertical GHE (K)kg grout thermal conductivity (W/(m K)) v f velocity of the working fluid (m/s)
198

Energies 2020, 13, 6598
kv vegetation coefficient (kv = 1 for bare ground, kv = 0.22 foryear round full vegetation cover)
Vp volume of the pipe’s wall (m3)
Ls centre to centre distance between two legs of the U pipe x soil depth (cm).
m fluid mass flow rate (kg/s) z axial distance of grout domain (m).
m f fluid mass flow rate (kg/s) αs soil diffusivity (m2/s).
m f h fluid mass flow rate in the horizontal GHE (kg/s) αg grout diffusivity (m2/s).
m f v fluid mass flow rate in the vertical GHE (kg/s) ρ f fluid density (kg/m3)Q energy released by the GHE (J) ρp pipe density (kg/m3).
Qca Convective heat transfer on the ground surface (W) ρs soil density (kg/m3).
Qc f Convective heat transfer on the inner pipe surface (W) Δt time period (s)r radius of soil domain (m) ΔTm local site variable for the ground temperature (K)rb radius of the borehole ρ f fluid density (kg/m3)t time period (s) ΔTs soil temperature difference in summer and winter (K)t0 phase of air temperature wave (day) Δr radial increment (m)tc calendar day, where 1 January = 1 and so forth Δz distance in the direction parallel to the pipe (m)T f fluid temperature (K) ψ Courant number
References
1. Sliwa, T.; Gonet, A. Theoretical Model of Borehole Heat Exchanger. J. Energy Resour. Technol. 2004, 127,142–148. [CrossRef]
2. Florides, G.; Christodoulides, P.; Pouloupatis, P. Single and double U-tube ground heat exchangers inmultiple-layer substrates. Appl. Energy 2013, 102, 364–373. [CrossRef]
3. Zhai, X.; Qu, M.; Yu, X.; Yang, Y.; Wang, R. A review for the applications and integrated approaches ofground-coupled heat pump systems. Renew. Sustain. Energy Rev. 2011, 15, 3133–3140. [CrossRef]
4. Dai, L.; Li, S.; Duanmu, L.; Li, X.; Shang, Y.; Dong, M. Experimental performance analysis of a solar assistedground source heat pump system under different heating operation modes. Appl. Therm. Eng. 2015, 75,325–333. [CrossRef]
5. Kjellsson, E.; Hellström, G.; Perers, B. Optimization of systems with the combination of ground-source heatpump and solar collectors in dwellings. Energy 2010, 35, 2667–2673. [CrossRef]
6. Ozgener, O.; Hepbasli, A. Experimental performance analysis of a solar assisted ground-source heat pumpgreenhouse heating system. Energy Build. 2005, 37, 101–110. [CrossRef]
7. Yang, W.; Sun, L.; Chen, Y. Experimental investigations of the performance of a solar-ground source heatpump system operated in heating modes. Energy Build. 2015, 89, 97–111. [CrossRef]
8. Zajacs, A.; Lalovs, A.; Borodinecs, A.; Bogdanovics, R. Small ammonia heat pumps for space and hot tapwater heating. Energy Procedia 2017, 122, 74–79. [CrossRef]
9. Park, H.; Lee, J.S.; Kim, W.; Kim, Y. Performance optimization of a hybrid ground source heat pump with theparallel configuration of a ground heat exchanger and a supplemental heat rejecter in the cooling mode.Int. J. Refrig. 2012, 35, 1537–1546. [CrossRef]
10. Man, Y.; Yang, H.; Wang, J. Study on hybrid ground-coupled heat pump system for air-conditioning inhot-weather areas like Hong Kong. Appl. Energy 2010, 87, 2826–2833. [CrossRef]
11. Wang, S.; Liu, X.; Gates, S. Comparative study of control strategies for hybrid GSHP system in the coolingdominated climate. Energy Build. 2015, 89, 222–230. [CrossRef]
12. Sagia, Z.; Rakopoulos, C.D.; Kakaras, E. Cooling dominated Hybrid Ground Source Heat Pump Systemapplication. Appl. Energy 2012, 94, 41–47. [CrossRef]
13. Fan, R.; Gao, Y.; Hua, L.; Deng, X.; Shi, J. Thermal performance and operation strategy optimization for apractical hybrid ground-source heat-pump system. Energy Build. 2014, 78, 238–247. [CrossRef]
14. Canelli, M.; Entchev, E.; Sasso, M.; Yang, L.; Ghorab, M. Dynamic simulations of hybrid energy systems inload sharing application. Appl. Therm. Eng. 2015, 78, 315–325. [CrossRef]
15. Zhu, N.; Hu, P.; Lei, Y.; Jiang, Z.; Lei, F. Numerical study on ground source heat pump integrated with phasechange material cooling storage system in office building. Appl. Therm. Eng. 2015, 87, 615–623. [CrossRef]
16. Wu, W.; Li, X.; You, T.; Wang, B.; Shi, W. Combining ground source absorption heat pump with ground sourceelectrical heat pump for thermal balance, higher efficiency and better economy in cold regions. Renew. Energy2015, 84, 74–88. [CrossRef]
199

Energies 2020, 13, 6598
17. You, T.; Shi, W.; Wang, B.; Wu, W.; Li, X. A new ground-coupled heat pump system integrated with amulti-mode air-source heat compensator to eliminate thermal imbalance in cold regions. Energy Build. 2015,107, 103–112. [CrossRef]
18. Li, X.; Lyu, W.; Ran, S.; Wang, B.; Wu, W.; Yang, Z.; Jiang, S.; Cui, M.; Song, P.; You, T.; et al. Combinationprinciple of hybrid sources and three typical types of hybrid source heat pumps for year-round efficientoperation. Energy 2020, 193, 116772. [CrossRef]
19. Hou, G.; Taherian, H.; Li, L.; Fuse, J.; Moradi, L. System performance analysis of a hybrid ground sourceheat pump with optimal control strategies based on numerical simulations. Geothermics 2020, 86, 101849.[CrossRef]
20. Allaerts, K.; Coomans, M.; Salenbien, R. Hybrid ground-source heat pump system with active air sourceregeneration. Energy Convers. Manag. 2015, 90, 230–237. [CrossRef]
21. Sofyan, S.E.; Hu, E.; Kotousov, A.; Kotousov, A. A new approach to modelling of a horizontal geo-heatexchanger with an internal source term. Appl. Energy 2016, 164, 963–971. [CrossRef]
22. Sofyan, S.E.; Hu, E.; Kotousov, A.; Riayatsyah, T.M.I.; Khairil; Hamdani. A new approach to modellingof seasonal soil temperature fluctuations and their impact on the performance of a shallow borehole heatexchanger. Case Stud. Therm. Eng. 2020, 22, 100781. [CrossRef]
23. Sofyan, S.E.; Hu, E.; Kotousov, A. Modelling of a Horizontal Geo Heat Exchanger with an Internal SourceTerm Approach. Energy Procedia 2014, 61, 104–108. [CrossRef]
24. Baggs, S.A. Remote prediction of ground temperature in Australian soils and mapping its distribution.Sol. Energy 1983, 30, 351–366. [CrossRef]
25. Gu, Y.; O’Neal, D.L. Development of an equivalent diameter expression for vertical U-tube used inground-coupled heat pumps. ASHRAE Trans. 1998, 104, 347–355.
26. Zima, W.; Dziewa, P. Modelling of liquid flat-plate solar collector operation in transient states. Proc. Inst.Mech. Eng. Part A J. Power Energy 2011, 225, 53–62. [CrossRef]
27. Geoserver, S.A.R.I. Soil Association Map. Available online: https://sarigbasis.pir.sa.gov.au/WebtopEw/ws/plans/sarig1/image/DDD/200471-235 (accessed on 4 October 2020).
28. Prangnell, J.; McGowan, G. Soil temperature calculation for burial site analysis. Forensic Sci. Int. 2009, 191,104–109. [CrossRef]
29. Australian Government Bureau of Meteorology. Climate Data Online. Available online: http://www.bom.gov.au/climate/data/?ref=ftr (accessed on 4 October 2020).
Publisher’s Note: MDPI stays neutral with regard to jurisdictional claims in published maps and institutionalaffiliations.
© 2020 by the authors. Licensee MDPI, Basel, Switzerland. This article is an open accessarticle distributed under the terms and conditions of the Creative Commons Attribution(CC BY) license (http://creativecommons.org/licenses/by/4.0/).
200

energies
Article
Stakeholders’ Recount on the Dynamics of Indonesia’sRenewable Energy Sector
Satya Widya Yudha 1, Benny Tjahjono 2,* and Philip Longhurst 1
���������������
Citation: Yudha, S.W.; Tjahjono, B.;
Longhurst, P. Stakeholders’ Recount
on the Dynamics of Indonesia’s
Renewable Energy Sector. Energies
2021, 14, 2762. https://doi.org/
10.3390/en14102762
Academic Editors: David Borge-Diez
and Almas Heshmati
Received: 29 March 2021
Accepted: 8 May 2021
Published: 12 May 2021
Publisher’s Note: MDPI stays neutral
with regard to jurisdictional claims in
published maps and institutional affil-
iations.
Copyright: © 2021 by the authors.
Licensee MDPI, Basel, Switzerland.
This article is an open access article
distributed under the terms and
conditions of the Creative Commons
Attribution (CC BY) license (https://
creativecommons.org/licenses/by/
4.0/).
1 School of Water, Energy and Environment, Cranfield University, Cranfield, Bedford MK43 0AL, UK;[email protected] (S.W.Y.); [email protected] (P.L.)
2 Centre for Business in Society, Coventry University, Coventry CV1 5FB, UK* Correspondence: [email protected]
Abstract: The study described in this paper uses direct evidence from processes applied for thedeveloping economy of Indonesia, as it defines the trajectory for its future energy policy and energyresearch agenda. The paper addresses the research gap to make explicit the process undertakenby key stakeholders in assessing and determining the suitability, feasibility, and dynamics of therenewable energy sector. Barriers and enablers that are key in selecting the most suitable renewableenergy sources for developing economies for the renewable energy development have been identifiedfrom extensive analyses of research documents alongside qualitative data from the Focus GroupDiscussions (FGD). The selected FGD participants encompass the collective views that cut acrossthe political, economic, social, technological, legal, and environmental aspects of renewable energydevelopment in Indonesia. The information gained from the FGD gives insights into the outlookand challenges that are central to energy transition within the country, alongside the perceptions ofrenewable energy development from the influential stakeholders contributing to the process. It isnotable that the biggest barriers to transition are centred on planning and implementation aspects,as it is also evident that many in the community do not adhere to the same vision.
Keywords: focus group discussion; sustainability; renewable energy development; Indonesia;geothermal
1. Introduction
The development of alternative renewable energy sources in Indonesia is of paramountimportance not only to fulfil the ever-increasing energy demand in the country but also tocontribute to reducing the carbon emission, as well as combating the devastating effectsof climate change. During the Conference of Parties (COP) 21 in 2015, known as ParisAgreement, countries around the world committed to reducing carbon emissions by ratify-ing the agreement. All the countries who participated set the targets in regard to carbonreduction, according to their respective capabilities, known as Nationally DeterminedContributions (NDCs).
As one of the countries who participated in COP, Indonesia plans to reduce carbonemission by 29% with its own effort or 41% with international aid by 2030 [1]. Renewableenergy sector plays an important role to reduce the carbon emissions, and Indonesia iscurrently aiming to increase the share of renewable energy to become 23% by 2025 withinthe National Energy Mix [1]. Due to its unique geographical contour features, Indonesiahosts an enormous potential for renewable energy from various sources, such as geothermal,hydropower, solar energy, bioenergy, wind energy, and ocean energy. The country isundergoing a journey to seek the most suitable renewable energy sources to be developed.
By 2020, Indonesia has only reached halfway towards the 2025 renewable energytarget. The development of renewable energy in Indonesia is currently suffering frommany obstacles ranging from technical to policy aspects that have significantly hindered itsprogress. Exploiting renewable energy sources requires a careful appraisal of the potential
Energies 2021, 14, 2762. https://doi.org/10.3390/en14102762 https://www.mdpi.com/journal/energies
201

Energies 2021, 14, 2762
key predicaments and enablers of its development. Identifying and focusing on a specifictype of renewable energy source is therefore deemed essential to mitigate the risks of failure.Analysing the progress of existing development of renewable energy can be done usingvarious ways, for example, by pulling together insights from all relevant stakeholders,which in the case of Indonesia, broadly encompass both state and market players.
In order to acquire a more comprehensive and dynamic outlook, it is necessary tomove from the preliminary stakeholder analyses onto probing some crucial informationdirectly from the sources, i.e., the stakeholders. This paper therefore aims to obtain thestakeholder’s recount on the assessment and of the suitability, feasibility, and dynamicsof the renewable energy sector in Indonesia, that will ultimately pave a trajectory of ourfuture agenda of research. To ascertain a transparent, repeatable, and credible researchexecution, the following research questions have subsequently been set.
RQ1 According to the stakeholders’ recount and outlook, what are the main key challenges,barriers or problems associated with renewable energy development in Indonesia?
RQ2 What are the stakeholders’ views on the potential key enablers for the renewableenergy development in Indonesia?
RQ3 What is the most suitable renewable energy type to be developed in Indonesia?RQ4 Depending on the type of the renewable energy selected, what can be proposed to
support the development of that particular renewable energy in Indonesia?
Such information gathering can be done via interviews, surveys or focus groupdiscussions involving key stakeholders of the renewable energy in Indonesia, with anultimate goal to collate the previously disparate information, experience and decision-making processes.
This structure of this paper is as follows. Section 2 set out the foundation of this workby elaborating the various work not only pertinent but also relevant to this paper. In thisway, gaps in the existing literature that this work will address can be clearly identified.Section 3 details how the research will be conducted, including the data collection methodand analysis. Sections 4 and 5 discuss the findings and their implications to the body ofknowledge. Section 6 concludes the paper by showing the process of how a set of proposalsare defined that lay down a pathway for the development of renewable energy in Indonesia,a research gap and process that had not previously been evident.
2. Related Work
A successful transition of energy sources from fossil fuel to renewables requires carefulevaluation in terms of the planning system and renewable energy selection [1]. Evaluatingthe renewable energy system can be a complicated process. Such an evaluation processrequires appropriate tools that support the data analysis of the availability of the renewableenergy sources, selection criteria and methods used in the selection process [2].
2.1. Renewable Energy Selection and Decision Making
Many researchers have carried out the evaluation and selection of the most suitablerenewable energy in many countries and different scenarios. There are many decision-making methods that can be applied for renewable energy selection. In this section, wewill have a look at some of the previous research on renewable energy selection in differentcountries, using different research approaches.
One of the many popular methods that can be used for assessing the most suitablerenewable energy to develop is a mathematical modelling method. Gonçalves da Silva(2010) [3] used a conceptual framework and a set of mathematical models to evaluate theenergy balance of energy conversion technologies for renewable energy development inBrazil. The result showed that wind energy was the most favourable renewable energysource to develop in Brazil, while solar power was the least suitable for development.Another method that can be applied for evaluating and selecting renewable energy isMulti-Criteria Decision Making (MCDM) method. Emir (2014) [4] performed the selectionof renewable energy for small islands using the MCDM method, applicable for Malta,
202

Energies 2021, 14, 2762
Cyprus, Cuba, Jamaica, Dominican Republic, and Singapore. They considered cost analy-sis, technical issues, social issues, locations, and environmental issues as the criteria forevaluation. Solar energy was deemed the most suitable renewable energy to invest anddevelop in small islands.
Analytical Hierarchy Process remains the most popular method to use for selecting themost suitable renewable energy in many different countries. The research conducted withthis type of method typically employed a variety of criteria, such as technical performanceand efficiency, ecological integrity, economic expedience, sustainable development, sociallyresponsible operation, and technological innovativeness. Based on these criteria, differentcountries have different results in regard to the most suitable renewable energy [5–8].
2.2. Renewable Energy Selection in Indonesia
Indonesia is one of the countries with abundant potential for many different types ofrenewable energy development; therefore, selecting the most suitable type of renewableenergy to develop is very vital for the energy transition. Despite having quite a few choicesfor renewable energy with abundant potential, research that is specific to the selection ofthe most suitable renewable energy in Indonesia is still lacking.
Rumbayan and Nagasaka (2012) [9] used the Analytical Hierarchy Process (AHP)method to identify and rank the most suitable renewable energy in Indonesia, usingthe level of availability of renewable energies as the primary consideration. Three typesof renewable energy were analysed for this study, including solar energy, wind energy,and geothermal energy. The result shows from this study that geothermal is the bestcriteria, followed by solar and wind alternatives. Tasri and Susilawati (2014) [10] used theFuzzy Analytical Hierarchy Process (F-AHP) to determine the most appropriate type ofrenewable energy to develop in Indonesia. This research used several selection criteria,such as sustainability, economic, social, and technological point of view. They evaluatedrenewable energies for this research include solar energy, hydropower, geothermal energy,wind energy and biomass energy.
Based on the previous research, it is evident that the quantitative approach, especiallythe Analytical Hierarchy Process (AHP), remains the most popular method to use for renew-able energy selection. While the quantitative approach can provide tangible information bygenerating numerical data, which is beneficial for statistics, it also has certain limitations.A quantitative approach may not be able to provide a deep understanding and insightsthat explain the underlying reasons behind those numbers. Quantitative approaches aremost suitable for countries with a more mature system of renewable energy development,the abundance of data, and clear parameters. However, this method does not provide anexplanation that gives insights suitable for countries developing with limited resources.Use of a qualitative approach here provides an extended explanation and reasoning behindeach dataset. Collating a deep understanding and explanation of the decision-making pro-cess from qualitative analysis is thus important. In the case of renewable energy selection,this information can be used not only as an input for evaluating and selecting the bestrenewable energy for an area, but it can also provide the thoughts, opinions, and essentialinformation that can be useful for potential follow-up research, for example, research onpolicy development, which involves many parties and stakeholders. In addition to that,policymaking is often performed through a qualitative approach or science diplomacy.Therefore, for this research, the qualitative approach is preferable over the quantitativeapproach, and it is chosen to evaluate and to select the most appropriate renewable energytechnology in Indonesia. The research could be a reference for performing renewable energyselection in other countries with limited resources in terms of data abundance, parameters,a less mature system of renewable energy development. Moreover, Indonesia is dealingwith the power balance issue, where the stakeholders are mostly taken into account interms of regulatory aspects. Because of that, stakeholders’ recount plays an important rolein the early stage of policymaking. This paper can be applied to the countries or locationsthat have similar characteristics to Indonesia.
203
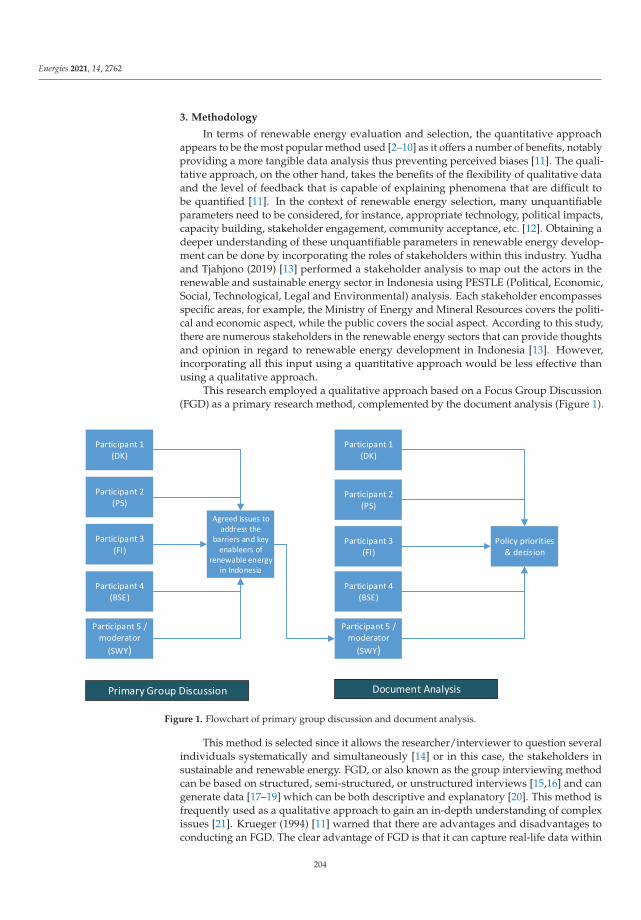
Energies 2021, 14, 2762
3. Methodology
In terms of renewable energy evaluation and selection, the quantitative approachappears to be the most popular method used [2–10] as it offers a number of benefits, notablyproviding a more tangible data analysis thus preventing perceived biases [11]. The quali-tative approach, on the other hand, takes the benefits of the flexibility of qualitative dataand the level of feedback that is capable of explaining phenomena that are difficult tobe quantified [11]. In the context of renewable energy selection, many unquantifiableparameters need to be considered, for instance, appropriate technology, political impacts,capacity building, stakeholder engagement, community acceptance, etc. [12]. Obtaining adeeper understanding of these unquantifiable parameters in renewable energy develop-ment can be done by incorporating the roles of stakeholders within this industry. Yudhaand Tjahjono (2019) [13] performed a stakeholder analysis to map out the actors in therenewable and sustainable energy sector in Indonesia using PESTLE (Political, Economic,Social, Technological, Legal and Environmental) analysis. Each stakeholder encompassesspecific areas, for example, the Ministry of Energy and Mineral Resources covers the politi-cal and economic aspect, while the public covers the social aspect. According to this study,there are numerous stakeholders in the renewable energy sectors that can provide thoughtsand opinion in regard to renewable energy development in Indonesia [13]. However,incorporating all this input using a quantitative approach would be less effective thanusing a qualitative approach.
This research employed a qualitative approach based on a Focus Group Discussion(FGD) as a primary research method, complemented by the document analysis (Figure 1).
Figure 1. Flowchart of primary group discussion and document analysis.
This method is selected since it allows the researcher/interviewer to question severalindividuals systematically and simultaneously [14] or in this case, the stakeholders insustainable and renewable energy. FGD, or also known as the group interviewing methodcan be based on structured, semi-structured, or unstructured interviews [15,16] and cangenerate data [17–19] which can be both descriptive and explanatory [20]. This method isfrequently used as a qualitative approach to gain an in-depth understanding of complexissues [21]. Krueger (1994) [11] warned that there are advantages and disadvantages toconducting an FGD. The clear advantage of FGD is that it can capture real-life data within
204
Energies 2021, 14, 2762
a social environment, and it has high flexibility, high face validity, and a speedy result,in addition to its low cost. However, when conducting FGDs, care must be taken whenmoderating it, as it can potentially be a problem when there are differences within thegroup, in which case it could lead to a great deal of difficulty in analysing the outcomes.Following the primary group discussion, document analysis was performed to corroboratethe points raised during the FGD and to formulate the policy priorities on Indonesia’srenewable energy. The process of policy development and confirmation in this FGD isshown in Figure 2.
Figure 2. FGD process of policy development and confirmation.
The group size can range from as few as four to as many as 12 people within a con-ducive environment to engage in a guided discussion of a certain topic or issue [19], in thiscase, prospects and challenges in Indonesia’s renewable energy development. The partici-pating subjects are selected on the basis of relevance to the topic under study. In additionto this, special consideration is given to the role of the researcher/interviewer, as themoderator in the focus group process. As Babbie (2010) [22] comments: “In a focus group
205
Energies 2021, 14, 2762
interview, much more than in any other type of interview, the interviewer has to develop the skills ofa moderator”, thus there is a need to control the dynamics within the group.
The FGD was conducted on 15 January 2020, incorporating four participants as thesample population, plus one of the researchers, who acted as the moderator. The partici-pants were chosen due to their expertise and experience in renewable energy developmentin Indonesia. Their representation encompasses the collective view of stakeholders identi-fied by Yudha and Tjahjono [13], cutting across the political, economic, social, technological,legal, and environmental (PESTLE) aspects of the renewable energy development in In-donesia (Table 1). The participants represent the government of the Republic of Indonesia,comprised of the Ministry of Energy and Mineral Resources (executory) and the SpecialTask Force for Upstream Oil and Gas Business Activities (SKK Migas; regulatory); industryactors, comprised of the renewable energy division of the Indonesian House of Commerce,as well as a business actor and observer (member of public).
Table 1. Summary of FGD participants and their representation in the renewable energy sector in Indonesia (modified fromYudha and Tjahjono (2019) [13]).
Participant Representing Political Economic Social Technology Legal Environment
DK Ministry of Energy andMineral Resources
√ √
PSSpecial Task Force forUpstream Oil and Gas
Business Activities
√ √ √
FI Indonesian Houseof Commerce
√ √ √
BSE Member of public√
SWY House of Representative,the Republic of Indonesia
√ √ √
Without necessarily reducing the essence of the perspective of PESTLE analysis,the numbers of the participants were purposely kept to a small number to keep the forumconducive. This purposive sampling of participants was ensured to cater for the rangeof expertise at hand, to enable the document analysis that was also used as a basis of theanalysis during the FGD.
The unit of analysis chosen, consistent to the previously applied PESTLE method ofanalysis, is the stakeholders’ outlooks and responses with regards to renewable energydevelopment in Indonesia. In this research, the FGD also served other purposes, such asdeveloping specific insight and practical knowledge, as well as obtaining the feedbacks andpropositions for renewable energy development, based on each stakeholder’s perspectives.
In addition, the FGD was also open to members of the press, including the Houseof Representative’s official press, covering the political, environment and legal aspect,to inquire and provide input to the participants during the questions and answer session.
4. Findings
The FGD began with an introductory opening by the moderator, who introducedthe participants and laid out the overall theme of the discussion. Each of the participantswas then given the time and the opportunity to share their recounts and outlooks on therenewable energy in Indonesia, including the challenges associated with renewable energydevelopment in Indonesia, and the propositions for moving forwards and overcomingthese challenges.
Following the discussion, all the participants proceeded to analyse each type ofrenewable energy in Indonesia, specifically wind, solar, ocean, biomass, hydropower,and geothermal. Using multiple secondary information and research documents as a basisof the analysis, the group then appraise these energy sources in terms of their potentials,current development, limitations, and opportunities for development. The main objective
206

Energies 2021, 14, 2762
was to map out the progress of each type of renewable energy development. Unlike theprevious session, in this session, every participant was encouraged to voluntarily give theiropinion and constructively rebut each other in an open discussion. The outcome of bothsessions will be used to pave the way forward to deciding the most suitable and feasiblerenewable energy type for further development in Indonesia.
4.1. A Snapshot of Renewable Energy Development in Indonesia
Following the introduction, the moderator described the precarious situation of In-donesia’s inevitably declining fossil energy supply and the urgent need for a transitionfrom fossil to renewable energy. Using this opening statement, the moderator then invitedthe FGD participants to voice out their views.
First to speak was DK, Secretary to the Director-General of New and RenewableEnergy of the Ministry of Energy and Mineral Resources, representing the Director-Generalof New and Renewable Energy, RM. In general, DK outlined the Indonesian government’sreadiness in developing Indonesia’s renewable energy sector, as well as provided the gov-ernment perspectives as to the current situation and challenges of the industry. For example,DK highlighted the imperative of developing renewable energy in Indonesia, not only fromthe aspect of promoting environmental consciousness but also as a crucial element in therealisation of Indonesia’s sorely needed and ambitious national electrification goal.
“Renewable energy is driven by its environmental aspect, given its environmentallyfriendly and clean nature. For us, aside from the environmental aspect (there is a presi-dential regulation already in effect concerning emissions), renewable energy contributesto reducing greenhouse gases”. (DK)
According to DK, what was deemed important from the point of view of energyand mineral resources was the ultimate goal of developing renewable energy is to helpaccelerate energy access for the large population of the nation who live in far-flung areasfrom the capital.
“In Java, Madura, or Bali, electricity is sufficiently supplied by PLN [State ElectricityCompany], but if we travel to the eastern regions and islands, there are still many of ourbrothers and sisters who have not yet benefited from electricity.” (DK)
Recent data indicated there are 12,500 villages in the eastern Indonesia regions havebeen electrified, but this figure is far from ideal as there are at least 2500 villages are stillwithout any access to electricity. Responding to the queries from the audience, he fur-ther stated:
“We will carry out our village electrification program until 2019. The Director-Generalof New and Renewable Energy has been tasked by the Minister of Energy and MineralResources to assist in the provision of access to electricity sources”. (DK)
Furthermore, he mentioned that it has been promulgated in Government RegulationNo. 79/2014, also known as the National Energy Policy, that renewable energy is targetedto comprise 23% of the primary energy mix by 2025. However, Indonesia currently hasonly 7% of renewable energy in its energy mix. To make up for the relatively significantdifference in renewable energy composition within the energy mix, DK highlighted keyrenewable energy potentials as well as several ongoing government strategies for renewableenergy development. These include, among others, Indonesia’s 11,000 hectares of oil palmplantation which can be used for biodiesel.
The second speaker was PS, Deputy of Finance and Monetisation at the SpecialTask Force for Upstream Oil and Gas Business Activities (SKK Migas). PS made severalkey observations, firstly concerning present obstacles in Indonesia’s oil and gas industrystemming from the global decline of oil prices. As a representative of the governmentregulatory body for oil and gas, PS also interestingly noted that
207

Energies 2021, 14, 2762
“... [the oil and gas] business has become over-regulated. Our oil and gas managementpractices are currently under scrutiny. Are our current regulations capable of providingincentives to bring results to our oil and gas resources?” (PS)
Concerning renewables, PS posed important statements from his observation:
“ . . . considering the fact that major corporate players in fossil-fuel energy have beenuniformly and consistently diversifying their portfolios into the renewable energy sector,is our capability in managing the fossil energy business transferrable to the renewableenergy business?” (PS)
This was subsequently responded by other participants proposing differing views.Nonetheless, they in the end reached a collective view, acknowledging that althoughthe technicalities differ, long-time corporate players have arguably brought along theirmanagerial and economic know-how of the fossil energy industry to leverage their businessactivities in renewables, particularly geothermal. It can therefore be concluded that learningfrom Indonesia’s experience in managing fossil fuel, the country is hopeful to use its wealthof experience and know-how to manage the renewable energy sector. Exactly how theseare going to be managed indeed needs further elaboration and thoughts.
Following PS, the third speaker was FI from the Renewable Energy Division of theIndonesian Chamber of Commerce (Kamar Dagang Indonesia or Kadin). FI expressed hisdisappointment with the present state of Indonesia’s renewable energy sector. He thenproceeded to identify the primary barrier of uptake from the private sector:
“Kadin is pushing forward in the renewable energy sector, but what is the obstacle?Regulation!” (FI)
Referring to tenurial disputes over several renewable energy projects, particularlygeothermal, FI also mentioned that the development of renewable energy in Indonesia isoften “... hampered by NGOs, indigenous communities, and others.”
FI also hit on the barriers to renewable energy development that cause the slow uptakeby investors, mentioning that
“ . . . feed-in-tariffs must also be fairer and involve stakeholders, not suddenly prescribed.This is indeed a problem in the renewable energy sector; as initial technologies areexorbitant, investors choose to wait and see.” (FI)
Lastly, FI sees the need for a strong local manufacturing and supply chain, so thatcomponents for renewable energy would be cheaper to produce domestically rather thanthat of an import.
The final speaker was BSE, an observer of the renewable energy industry. BSE openedby hypothesising that energy sustainability is linearly correlated with welfare and thewealth of a nation. BSE proceeded to outline his solutions:
“The question that follows is how to satisfy the large amount of energy needed by low-cost,clean energy sources? We cannot do business as usual. We must push for breakthroughs.”(BSE)
He asserted that electrification consists of three large components: power generation,transmission, and distribution. Therefore, it would be sensible to clearly split the respon-sibilities between those components. BSE argued that this was necessary to stimulate ahealthy competition and to foster the core competence.
“PLN [State Electricity Company] should only focus on transmission and distributionof electricity, giving an opportunity for other parties, including private sectors to ‘play’in the renewable energy generation arena, especially clean, large-scale power generation.There are only three options: hydro, geothermal, and nuclear.” (BSE)
The moderator concluded this first session with a summary of key findings andlessons learnt.
208
Energies 2021, 14, 2762
Finding 1: There remain problems in both planning and implementation stages of renew-able energy, mainly due to the [lack of] regulations, but this does not necessarily mean thatboth stages do not adhere to the same vision.
Finding 2: Lessons learnt from the oil and gas sector should later be transferred over forthe future development of renewable energy, so as not to fall into the same pitfalls thatimpede and create inefficiency in the oil and gas sector.
4.2. Renewable Energy Types in Indonesia
The second session of the FGD analysed in detail several documents, mainly gov-ernment policy analyses of various renewable energy sources. The moderator led thediscussion (following the method illustrated in Figure 1) and asked the participants of FGDto comment on the suitability of the six sources of renewable energy and come up with acollective decision on the most suitable renewable energy source that Indonesia shoulddevelop going forward.
In order to hit 23% of renewables in the primary energy mix by 2025 and 31% by2050, Indonesia has been attempting to achieve the targets [23]. Renewables accountedfor just 15.7% of the country’s primary energy mix by 2019, while fossil fuels accountedfor 87.6% by 2019 [23,24]. Indonesia is a host to a variety of renewable energy sources,namely, wind energy, solar energy, ocean energy, biomass energy, hydropower, and lastlygeothermal energy [25]. The development of each type of energy sources varied, and theFGD looked at each type of renewable energy, how they have been developed in Indonesia,and the challenges that each energy type encounters, with an expectation that the groupcame up with a collective view on the preferred renewable energy type.
4.2.1. Wind Energy
Wind energy is the type of energy that uses the conversion of wind speed into a usefulsource of power, and it can be used for multiple purposes, such as electricity generation,mechanical power wind turbines, water-driven wind turbines, or ship propellers [26].Wind energy is one of the renewable energy innovations, as it does not contribute to airpollution or greenhouse gases and has a slight impact on the climate.
The use of wind power as an energy source in Indonesia has great potential for furthergrowth, especially in coastal areas where the wind is quite abundant. According to theprevious research, Indonesia has an estimated total potential for onshore wind energyof 9.3 GW. With the range of wind speeds between 2 and 6 m per second, Indonesia issuitable for installing small-scale (10 kW) and medium-scale (10–100 kW) wind-drivengenerators [27]. Indonesia has installed five units of windmill generators across the countryeach with a capacity of 80 kW and seven other units with the same capacity have been estab-lished in four places, North Sulawesi, the Pacific Islands, Selayar Island, and Nusa Penidain Bali [28]. Several wind-based power plants, namely, Sidrap, Tanah Laut, and Jenepoto,have currently been under construction, while the ones in Sukabumi, Banten, and Bantulare currently being considered to be placed under construction planning [28].
Price is one of the biggest obstacles that Indonesia faces in installing wind energy.The initial cost of developing wind energy is very high, particularly with the use of offshorewind turbines. IRENA suggests that it costs about US$3–US$4 million per megawatt (MW)to install offshore wind turbines compared to geothermal power plants that cost aboutUS$2–US$3 million [29].
However, wind energy has some issues associated with the geographical locations thejeopardises the consistency of supply, as pointed out by a participant,
“ . . . indeed, we know that it [wind] is a promising form of energy in our country[Indonesia]. But its intermittent nature, makes it hard to provide electricity 24/7.It generates unstable and fluctuating electricity, and good source of wind power is onlyavailable in certain parts of our country [Indonesia]”. (FI)
209
Energies 2021, 14, 2762
Another difficulty is caused by the availability of other renewable energy sourcesavailable in Indonesia, such as geothermal, hydropower, biomass, and solar, which makesthe cost analysis method challenging to carry out [29].
4.2.2. Solar Energy
Solar energy is a source of renewable energy that uses the power of the sun to produceelectricity. Globally, solar energy has the fastest and highest growth compared to the rest ofrenewable energy types. It is currently considered as one of the most promising sources ofclean, renewable energy and has greater potential than any other energy source to solvethe world’s energy problems.
As Indonesia is a tropical country situated on the equator line, the country has anabundant capacity for solar energy. Many areas of Indonesia have very strong solarradiation with average daily radiation of approximately 4 kWh/m2 [27]. According to thereport from Directorate of New and Renewable Energy (Ditjen EBTKE) in 2018, Indonesiahas the potential to harness solar energy of up to 207.8 gigawatts peak (GWp) [30]. However,as of 2019, Indonesia has only installed 25.19 megawatts (MW), which is mainly used tomeet energy demand in rural areas, including lighting for public service areas and placesof worship [28]. The Institute for Energy Economics and Financial Analysis (IEEFA),an energy research institute, has reported that about 48 MW of solar power is currentlyunder construction and about 326 MW is under construction planning [31].
Indonesia is still far behind other ASEAN countries in solar power utilisation. Thailandhas 2.6 GW of installed solar capacity and the Philippines 868 MW of installed solarcapacity [32]. Vietnam is also working on an expansion of more than 3000 MW in solar andwind power capacity by 2019 and 2020, and Malaysia is targeting an additional 3000 MWin 2020 [33].
There are many obstacles to the implementation of solar energy in Indonesia. One ofthem being the high prices of the solar cell, including the solar panels, inverters, batteries,wiring, installation, and battery storage [33]. This situation not only impacts financial insti-tutions to provide resources to implement this program but also limits local communities’confidence and interests in using this system due to its exorbitant costs. Because of that,the implementation of this program is highly dependent on government funding. Despiteits huge potential, a solar panel is very dependent on sunlight to effectively capture solarenergy. Even though it can capture the energy during cloudy and rainy days, it can alsogive measurable technical effects on the energy system. Due to its intermittent nature, solarenergy might be more suitable for a household scale, but it might not be the best option fora larger scale energy system. This is emphasised by one of the participants:
“It’s fortunate that being in the equator, we [Indonesia] are blessed with warm climateall year round. We have the potential to develop solar energy. However, much like wind,it is intermittent and it [solar] will require storage systems to generate electricity afterdaylight”. (DK)
4.2.3. Ocean Energy
Ocean energy, or sometimes referred to as marine energy, is a type of energy that iscarried by ocean’s elements, such as ocean’s tide, wave, salinity, and temperature. Each oneof these elements can be exploited as different types of energy, namely, tidal energy,wave energy, salinity gradient energy, and ocean thermal energy conversion (OTEC).Wave energy converts the ocean waves to produce electricity, while tidal energy harveststhe power that was produced during high and low tides [34]. Salinity gradient energycan generate electricity due to the difference in salt concentration between freshwater andseawater [35]. OTEC converts the temperature difference between cold seawater and warmsurface seawater, typically at around 800 to 1000 m of depth, to produce electricity [36].
Indonesia is the world’s largest archipelago with 70% of its area is covered by ocean,thus it has the largest potential of ocean energy. According to the research from the In-donesian Ocean Energy Association (INOCEAN), the potential of ocean energy resource
210

Energies 2021, 14, 2762
that can be exploited is around 92.2 GW. The majority of its potential is coming fromOTEC, with 43 GW of resource potential, followed by tidal and wave energy with 4.8 and1.2 GW of resource potential, respectively. Despite its considerable amount of potential forharnessing ocean energy, the installed capacity for ocean energy is only 0.3 MW or 0.002%of the total energy use [24]. As of 2020, ocean energy is still under the stage of Research andDevelopment, and this type of renewable energy has yet to be commercially developed inIndonesia [28].
“ . . . unlike solar and wind, ocean energy can provide electricity throughout the entireday since it does not require the sun or the wind to harness electricity. Nevertheless,ocean energy is still rather far from the full commercialisation in Indonesia”. (DK)
4.2.4. Biomass
Biomass energy is one of the types of natural renewable energy that are generated fromorganisms, and it mostly comes from farm crops and residues, forest waste, farm foods,and animal waste [37]. Biomass is the only renewable energy that can be used to generatethree types of fuels: liquid, solid, and gas. A proper biomass energy development couldalso reduce not only energy issues but also waste management issues.
As an agricultural country, the potential of biomass resources in Indonesia is relativelyabundant. According to the report from Directorate of New and Renewable Energy in2018, Indonesia has a potential of harnessing 32.6 GW of biomass energy [24]. However,only 167.54 MW of biomass energy in Indonesia has now been properly exploited. Cur-rently, Indonesia’s estimated total biomass production is around 146.7 million tons, which isequivalent to 470 gigajoules per year (GJ/y) [38]. Most of the biomass energy source comesfrom the rice residue and rubberwood, which contributes to 150 GJ/y and 120 GJ/y, respec-tively [38]. These are followed by sugar residues (78 GJ/y), palm oil residues (67 GJ/y),and other types of residues (20 GJ/y) [38]. Such biomass sources can help supply both heatand electricity to rural households and sometimes small-scale industries.
Bioenergy, in general, has faced similar problems as other renewable energy sources.One of the primary issues is the high investment cost for bioenergy installations, as claimedby one participant:
“ . . . while Indonesia has an abundant amount of biomass energy that can be utilised togenerate liquid, solid, and gas, it is still expensive to invest in and the lack of supportfrom financial institutions has hindered its growth”. (DK)
Part of the reason is that bioenergy deployment feasibility studies are mostly notattractive for bank loans [39]. From the perspective of technology, the reliability andefficiency of the existing technology for biomass energy is still lower than those of fossilfuels [39], hence hindering bioenergy development.
4.2.5. Hydropower
Hydropower energy is a type of renewable energy source that extracts energy fromflowing water, to produce electricity. As a potential future source of energy, hydropowerhas become an increasingly attractive choice for small capacity of the renewable energy.This type of energy, as well as other renewable energy sources, are the clean energy sourcesas they emit a negligible amount of greenhouse gas.
Hydropower is one of Indonesia’s large-scale, commercially viable, renewable energysources. According to the report from the Nippon Koei, the hydropower capacity inIndonesia is projected at around 26,321 MW [40]. Currently, the installed capacity ofhydropower is 4938.64 MW from various hydropower plants all across the nation; the large-scale plants are operated by the state-owned electricity company (PLN), and many small-scale plants are owned by small enterprises. According to 2019–2028 Electricity SupplyBusiness Plan issued by PLN, it has been reported that 5956 MW of hydropower capacityis currently under construction scattered in many places, while the new 16,027 MW of
211

Energies 2021, 14, 2762
potential capacity has just been built as of 2018 and is considered for being placed underconstruction planning [24].
To date, the hydropower energy in Indonesia is still the most established and the mostutilised small-scale renewable energy source, particularly for the rural areas. Hydropowersystems provide unique operational versatility in that they can adapt to sudden fluctuatingdemand for electricity, which means that it can be tailored to satisfy market demand [41].Hydropower is also able to provide the supports for the development of other renewableenergy sources, for example, its storage capacity and flexibility can be the most cost-effective and efficient to support the utilisation of intermittent renewable energy sourcessuch as solar and wind energy. Hydropower can generate vast quantities of energy, and theprice is relatively stable, as it is less affected by market price fluctuations such as oil andgas, although the price advantage is proportional to the capacity of the plant, i.e., relativelysmall capacity. There is, however, a major drawback of hydropower development as it isheavily dependent on the geographical features (i.e., large rivers) to generate electricity.Therefore, large-scale utilisation of hydropower is only limited to certain places withspecific geographical features, making micro-hydropower-with a lower price advantage-amore viable option, as asserted by FI:
“ . . . no, the majority of them [sources] are only suitable for small-scale power plants.Only certain areas of Indonesia have the full capability to generate large scale electric-ity”. (FI)
4.2.6. Geothermal
Geothermal energy is the type of renewable energy that uses heat derived from thesub-surface of the Earth, which can be transmitted in the form of hot steam, hot water,or a mixture between both forms. Nowadays, it has been one of the most importantalternatives for energy sources with significant growth potential. It not only providesalternative energy but also helps to reduce the effects of global warming and the risks topublic health due to the use of conventional energy sources, as well as our dependence onfossil fuels. Geothermal energy may be used for district heating purposes or harnessed toproduce renewable electricity, depending on its characteristics. Lower enthalpy type ofgeothermal is mostly suitable for direct use (e.g., room heater, tourism, agriculture/agro-industry, and fisheries), while medium to high enthalpy type of geothermal can be used forgenerating electricity, which is typical for the regions with active tectonics [42]. Indonesiahas varying types of geothermal energy that can be utilised for both direct heating andgenerating electricity [43].
Indonesia is one of the countries in the world that falls on the “ring of fire”, whichtraversed around the edges of the Pacific Ocean and is responsible for most active volcanoesand earthquakes. Due to its tectonic setting, Indonesia is a host to most of these activevolcanoes, which accounted for 117 active volcanoes in total [44,45]. These active volcanoesare distributed in Sumatra, Java, Nusa Tenggara, Sulawesi, and Maluku. Consequently,Indonesia has a considerable amount of high heat flow, which makes it one of the countrieswith a large potential for geothermal energy.
According to studies, Indonesia has the world’s largest geothermal energy potential,accounting for about 40% of the world’s potential or approximately at 28,617 MW [42].Most of these potential energy resources and reserve are distributed in several regionsin Indonesia. Sumatra and Java have currently the highest total potential energy, whichaccounts for 12,760 and 9717 MW, respectively [42]. The rest of the potential are dis-tributed in many other regions, namely Bali, Nusa Tenggara, Sulawesi, Maluku, Kaliman-tan, and Papua [42,43].
According to FI, geothermal, when compared to other sources of renewable energyexcept nuclear, can guarantee the provision of electricity at a stable rate throughout theentire year without being affected by weather patterns and conditions. He further added:
“The cost of geothermal technology in the future will be increasingly competitive and isexpected to continue to fall. Thus, the optimisation of geothermal energy in Indonesia is
212

Energies 2021, 14, 2762
vital in helping the government achieve its renewable energy target and reduce greenhousegas emissions”. (FI)
Despite having a considerable amount of potential, geothermal energy utilisationin Indonesia, especially for the electricity generation, is not quite optimal. Currently,the geothermal energy in Indonesia that has been utilised for generating electricity is2130.6 MW [46], making it the second-largest country with installed geothermal capac-ity, putting Philippines in third place with 1868 MW of installed capacity and followingUnited States with 3639 MW of installed capacity [47]. Most of the installed geothermalcapacity in Indonesia comes from the geothermal power plant in Java, which accountsfor a total of 1253.8 MW of installed capacity, followed by Sumatra with 744.3 MW, Su-lawesi with 120 MW, and lastly, Nusa Tenggara with 12.5 MW of installed capacity [46,48].The development of geothermal energy is still yet to be done in many other regions inIndonesia.
Up until 2019, the utilisation of geothermal in Indonesia was only 2130.6 MW out of56,509.53 MW, or around 3.77% of the total energy utilisation [24]. This number is still verysmall compared to the Philippines that have already 44.5% of its energy use from geother-mal energy [28]. There are a few factors that have been the reason for Indonesia’s laggingdevelopment of geothermal energy utilisation. Exploration and resource commercialisationof geothermal utilisation is a costly process, in addition to a small market for the resource.Limited investment financing schemes for geothermal development has also contributedto the stagnation in this industry.
According to PS, Deputy of Finance and Monetisation at the Special Task Force forUpstream Oil and Gas Business Activities (SKK Migas),
“ . . . geothermal development has a very unique characteristic, since it includes theupstream phase, similar to that of oil and gas sector”. (PS)
He further underlined the transferability of management know-how from the fossilfuel economy to the geothermal business. In essence, the pitfalls of Indonesia’s oil andgas industry retrospectively provide lessons learnt for the management of geothermal.Although these two sectors quite different in terms of the nature of the commoditiesinvolved, PS believes that the technical management know-how from the oil and gasindustry should be transferred and refined.
There is a difference between the outcome of the renewable energy selection providedby several authors in their previous works and the renewable energy selection as a resultof the discussion between the stakeholders. For example, Tasri and Susilawati (2014) [10]evaluated that hydropower is more suitable than geothermal energy. On the other hand,earlier research on renewable energy, Rumbayan and Nagasaka (2012) [9], evaluatedthat geothermal, solar, and wind energy are the most suitable renewable energy. In thisresearch, having considered many factors from the stakeholders’ point of views, such asits availability; technology; and operational, financial, and market situation, geothermalenergy is the most suitable renewable energy in Indonesia. Therefore, future researchfocusing on the geothermal energy development would certainly enhance the renewableenergy development Indonesia. However, since the stakeholders contended that thelagging development of geothermal energy sources is mainly caused by the hefty initialcost, government intervention is needed, e.g., in the form of financing schemes.
Finding 3: Geothermal stood out during the FGD as the most promising renewable energysource that Indonesia should develop.
Finding 4: Exploration of geothermal utilisation needs an intervention from the govern-ment in the form of financing schemes, so as to alleviate the burden of upfront investment.
5. Discussion
Indonesia has a few choices when it comes to developing renewable energy sources.Having the capability to develop all types of renewable energy to a point where it cannot
213

Energies 2021, 14, 2762
only fulfil the whole country’s energy demand but also fully liberate the country out offossil fuel dependency would be an ideal case. Although achieving this would requirelong years of huge effort and costly processes, having this ideal scenario would lead usto significantly contributing to reducing carbon emission and increasing the economicgrowth of the country. Reflecting on the participants’ feedbacks reported during theFGD, we can glean from this dialogue that different stakeholders have alluded differinginherent interests and point of views based on their respective institutions. The differencesare mainly related to the key enablers and barriers of renewable energy developmentin general leading to selection of the most suitable renewable energy to focus on futuredevelopment.
5.1. Barriers and Key Enablers
Indonesia has tremendous renewable energy capacity which is still underutilisedby the Indonesian power sector. The long dependency on fossil fuels, particularly coal,has proved difficult to break as the image of coal as cheap energy while renewable sourcesremain as expensive technologies. Although some steps to enhance renewable energy havebeen placed since many years ago, the Indonesian renewables sector has yet to take off.
The development of renewable energy sources in Indonesia has not been withoutany barriers, as it has encountered quite a few challenges from the operational, financialregulatory challenges. The operational challenge is mostly related to the nature of eachtype of renewable energy sources, which includes the availability and reliability issues.Financial challenge is mostly related to the exorbitant initial cost of installation, and ithas been one of the major hurdles for the development of renewable energy, regardless ofthe type of renewable. Lastly, the regulatory challenge is viewed as the primary obstaclein the energy transition and renewable development, especially for the private sector,which hampers the development process, i.e., the regulation that define the conservationarea makes it impossible for the exploration of renewable energy in the area with highpotentials. Having analysed the barriers, the obstacles are quite evident in both theplanning and implementation stage of renewable energy development. However, this doesnot necessarily mean that both stages of development do not adhere to the same vision.Therefore, regulation and policy refinement are indeed necessary, thus becoming the mostimportant key enablers, as they allow us to tackle multiple present barriers effectively.
According to the stakeholders’ points of view, some of the important key enablersare classified as follows, so identifying these enablers is of paramount importance for thetransition to renewable and sustainable energy technologies.
1. The availability of an institutional framework of national targets and developmentplans that transcend organisational leadership is one of the most important initial keyenablers, as it reflects the government’s commitment to renewable energy endeavour.The imperative development of renewable energy in Indonesia needs to be viewednot only from the aspect of promoting environmental consciousness but also as acrucial element in the realisation of Indonesia’s sorely needed and ambitious nationalelectrification goal, as well as the national primary energy mix as a tangible target fornow, which is achieving 23% of renewables in the primary energy mix by 2025 and31% by 2050.
2. Focusing on the forward-thinking scheme of supply chain management for the manu-facturing of renewable energy is viewed as another significant key enabler. Such ascheme needs to consider how local industries can effectively source the materials andtechnology needed for Indonesian-made renewable energy supply and market. Espe-cially in the presently liberalised global economy, Indonesia needs to strengthen itslocal leverage in terms of competitiveness of goods and trade. The ultimate and obvi-ous aim of this endeavour is to make local renewable energy supplies and technologycheaper to produce domestically than to import.
3. Refining the regulation and policy is one of the most vital key enablers for the energytransition. The courage of institutions and organisations is essential to break down
214

Energies 2021, 14, 2762
outdated and inadequate regulations, as well as to design new regulations and policythat can accommodate the interests of all relevant stakeholders. Therefore, havinghigher regulations covering the renewable energy sector, such as Renewable EnergyBill, Presidential Regulation, and Governmental Regulation, would have strongerimpacts on renewable energy development.
4. Focusing on the clean, large scale types of renewable energy for power generation,for instance, hydropower and geothermal energy. Nuclear power as another newenergy source has also been considered and is still categorised as a viable option,considering all the relevant safety and technical concerns being put in place.
5.2. Selection of Renewable Energy Type for Development
Focusing on developing the most suitable type of renewable energy would be animportant first step towards better utilisation of renewable energy. Here, we will have alook at each type of renewable energy and use a comparative analysis to decide the mostsuitable renewable energy to focus on developing in Indonesia, considering the limitationand opportunity that each type of renewable energy has to offer, according to the expertise’inputs during the FGD.
Ocean energy is the least developed renewable energy in Indonesia. Despite having ahuge potential for developing ocean energy, no commercial-scale ocean power plants nowexist as it is now still under the research and development stage. According to 2019–2028Electricity Supply Business Plan issued by PLN, there has been no technology manufacturerfor ocean energy that has proven its reliability to operate commercially for at least 5 years.The development will be reconsidered once the technology is mature enough to generateelectricity on a commercial scale.
Wind and solar energy can provide not only alternative sources for renewable energybut they can also give us a number of environmental benefits, as they produce a negligibleamount of carbon footprints. However, the development of these renewable energy sourceshas major drawbacks. The initial deployment process of wind or solar energy can be quitecostly, and it hinders the investment due to its exorbitant costs. Even though both solar andwind energy should be seen as low-risk investments with potentially major returns, they arehefty investments nonetheless. Moreover, both wind and solar energy are intermittent bynature, as they are heavily dependent on the weather. Therefore, the electricity generated bythese renewables is most likely to be fluctuating, and it can potentially become a problem.Fluctuating supply of electricity is not a reliable power supply, as it is not best-suited forproviding base-load. Furthermore, fluctuating electricity, particularly in the solar panelsystem, may have measurable effects on the power instrument. Therefore, relying solelyonly on solar and wind energy may not be the best option for now, especially for a massivecommercial scale, but they may be suitable for smaller-scale development.
Biomass energy development is currently in a better state than previous sources ofrenewable energy now that the Minister of Energy and Mineral Resources Regulation(Permen ESDM) Number 50 of 2017 has been issued. Not only does it contribute to meetingthe energy demands, but proper biomass energy development also allows us to cope withbetter waste management. However, the expensive upfront cost to get the power plants upand running has been the most common issue in developing the renewables, which alsoapplies to biomass energy. In addition to the exorbitant upfront cost, biomass developmentwould require additional costs associated with the extraction, transport, and storage ofbiomass prior to the generation of electricity. Biomass energy plants also require quitea bit of space with constant supply for biomass resources, which might not be suitablefor big cities. Therefore, the development of biomass energy may be more suitable forunderdeveloped, isolated region in the country.
Hydropower is by far the most established and the most utilised renewable sourceof energy. Hydropower has been operating as a commercial-viable, massive scale. Due toits operational flexibility, hydropower can adapt to sudden fluctuating demand, and itcan be tailored to satisfy market demand, thus making it a very reliable source of energy.
215

Energies 2021, 14, 2762
Its development has been very steadily growing every year, with numerous ongoingprojects. However, being heavily dependent on the geographical features (i.e., large rivers)to generate electricity has been a major drawback of hydropower development. Large-scale utilisation of hydropower is only limited to certain places with specific geographicalfeatures. Therefore, focusing more on a different type of renewable with huge potential forgrowth and suitability that needs further development might be the best option and morenecessary in order to meet the 2025 national energy mix target.
Indonesia’s abundant geothermal potential is not questionable. Despite having aconsiderable amount of potential, its utilisation, especially for the electricity generation,is not quite optimal. By 2020, only 2130.6 MW out of 28,617 MW had been properly utilised.Unlike wind and solar energy, geothermal energy is not an intermittent source of energy,and it has very high-capacity factors; thus, it can be a reliable source of energy.
Geothermal energy utilisation has very unique attributes, which can be viewed asa promising opportunity when it comes to massive development. In contrast to otherrenewable energy projects, geothermal power projects must include upstream activitiesto verify the resource and to determine the most favourable location for development.This upstream phase is very similar to the upstream process of an oil and gas field orthat of a coal mine. Such a unique attribute may allow us to have a transferability ofmanagement know-how from the fossil fuel sector to the geothermal energy business.The knowledge transfer may be able to help us to reduce the hefty risk that can comeduring geothermal development, for instance, with the lesson from the oil and gas sector,the declining phase of production might be recognised earlier, giving us the time to work onthe operational and managerial solution to avoid the pitfall. The nature of the geothermaloperation and the availability of knowledge transfer can reflect on the managerial maturitythat the geothermal sector can offer, compared to the rest of the renewable energy sources,thus becoming its greatest opportunity. It is also implied that geothermal energy, far frombeing a simple market competitor, is internalised within the oil and gas industry as theinevitable way forward, hence the emphasis on transferability of knowledge.
The geothermal energy sector has a fair share of obstacles when it comes to its develop-ment. Similar to the other renewables, the hefty cost has been one of the biggest obstaclesthat Indonesia has faced in the development of geothermal energy. The exploration andresource commercialisations are both costly processes, which makes it very reliance onheavy investments. Regulations have also become one of the major challenges for thegeothermal sector, for instance, the land dispute caused by wavering regulations are mostlikely to hinder its development. There might have been many more underlying issueswith regard to geothermal energy development; therefore, a further investigation on thegeothermal supply chain trajectory is necessary to address the potential barriers in itsdevelopment. Furthermore, developing a set of policies also can be done to bridge thesepotential barriers and to ultimately enhance the pace and magnitude of geothermal energydevelopment [49]. Despite the obstacles, just as much as the other types of renewableenergy, the high potential, reliability, and opportunity that geothermal energy can offermake it the most suitable renewable energy source to develop.
6. Conclusions
The FGD has provided unique inputs to this research via a combination of subjectiveand institutional leanings and experiences, particularly in identifying key enablers andbarriers of renewable energy development. Throughout the course of FGD, the barrierswere actually expected as there is an evident contradiction between policy and business,particularly in the planning and implementation stages. However, this does not necessarilymean that both stages do not adhere to the same vision. In particular, the private sectorhighlighted the lack of representative regulations truly needed to boost private participationin renewable energy development. The key enablers include constructing the nationaltarget as a framework and renewable development plans, building a forward-thinking
216

Energies 2021, 14, 2762
scheme of supply chain management of renewable development, and regulation andpolicy refinement.
Regarding the renewable energy selection, geothermal energy has been considered asthe most suitable and feasible renewable energy source to focus on further developmentin Indonesia. Not only does it have a considerable amount of potential for generatingelectricity, but it also has the most unique characteristics out of all the other options ofrenewable energy. The FGD has identified that the geothermal energy projects must includea set of supply chain trajectories, which include the upstream, midstream, and downstream.The upstream phase in this supply chain trajectory is in fact similar to that of the oil and gassector. This allows us to perform the transferability of management know-how from thefossil fuel sector. The lessons learnt from the oil and gas sector should later be transferredover for the future development of geothermal energy, so as not to fall into the samepitfalls that impede and create inefficiency in the oil and gas sector. This implies a growingsense of corporate and institutional responsibility within the oil and gas sector, one that isvisionary and should be capitalised on. Despite the tensions and disagreements betweenstakeholders, all parties agreed that the development of renewable energy, particularly ingeothermal energy, should continue to be supported for the good of the public as well as themarket. In order to do this, further investigation on geothermal supply chain trajectoriesneeds to be done to identify the potential barriers and to design a set of policies thatcan bridge these barriers, thus enhancing the pace and magnitude of renewable energydevelopment, or more specifically, geothermal energy.
Aside from directly absorbing the bold aspirations from each stakeholder, ‘readingbetween the spoken lines’ has provided plenty of room for abstraction and further inquiry.Most importantly, the FGD has succeeded in answering the four research questions posed atthe beginning of this paper, meaning that we have acquired both (1) stakeholders’ recountand outlook of institutional and market challenges associated with renewable energydevelopment in Indonesia, as well as their (2) responses for overcoming the challenges,(3) their collective views on the most feasible renewable energy to develop in the nearfuture, and, lastly, (4) the propositions to support the development of that particularrenewable energy, i.e., geothermal, in Indonesia.
We recognise that, despite the benefits of FGDs, they have certain limitations, i.e., that itis possible that the participants may be hesitant to openly express their opinions when itis a sensitive topic or alternatively be dominant within the group about the topic beingdebated. Another limitation is that it may not be a true representation of the target group.Conscious of these limitations, we were diligent in selecting the participants plus followedspecific sensitive questions individually.
Author Contributions: Conceptualization, S.W.Y. and B.T.; methodology, S.W.Y., B.T., and P.L.;validation, S.W.Y., B.T., and P.L.; formal analysis, S.W.Y., B.T., and P.L.; investigation, S.W.Y.; writing,S.W.Y. and B.T.; writing—review and editing, B.T. and P.L.; supervision, B.T. and P.L.; projectadministration, S.W.Y. All authors have read and agreed to the published version of the manuscript.
Funding: This research received no external funding.
Institutional Review Board Statement: Not applicable.
Informed Consent Statement: Not applicable.
Data Availability Statement: Not applicable.
Acknowledgments: The authors thank the reviewers for their constructive comments in improvingthe quality of this paper.
Conflicts of Interest: The authors declare no conflict of interest.
References
1. Gielena, D.; Boshella, F.; Saygin, D.; Bazilian, M.D.; Wagnera, N.; Gorinia, R. The role of renewable energy in the global energytransformation. Energy Strategy Rev. 2019, 24, 38–50. [CrossRef]
217

Energies 2021, 14, 2762
2. Al Irsyad, M.I.; Halog, A.B.; Nepal, R.; Koesrindartoto, D.P. Selecting Tools for Renewable Energy Analysis in DevelopingCountries: An Expanded Review. Front. Energy Res. 2017, 5, 1–13. [CrossRef]
3. Da Silva, C.G. Renewable energies: Choosing the best options. Energy 2010, 35, 3179–3193. [CrossRef]4. Emir, F. Selecting Renewable Energy Sources for Small Islands Using Analytical Hierarchy Process (AHP). 2013. Available
online: https://www.researchgate.net/publication/312630832_Selecting_Renewable_Energy_Sources_for_Small_Islands_Using_Analytical_Hierarchy_Process_AHP (accessed on 7 January 2021).
5. Sliogeriene, J.; Turskis, Z.; Streimikiene, D. Analysis and Choice of Energy Generation Technologies: The Multiple CriteriaAssessment on the Case Study of Lithuania. Energy Procedia 2013, 32, 11–20. [CrossRef]
6. Ahmad, S.; Tahar, R.M. Selection of renewable energy sources for sustainable development of electricity generation system usinganalytic hierarchy process: A case of Malaysia. Renew. Energy 2014, 63, 458–466. [CrossRef]
7. Li-Bo, Z.; Tao, Y. The Evaluation and Selection of Renewable Energy Technologies in China. Energy Procedia 2014, 61, 2554–2557.[CrossRef]
8. Madhuri, S.; Yadav, A.; Hiwarkar, D. Selection of Appropriate Renewable Energy. Resources for Uttar Pradesh by using AnalyticalHierarchy Process (AHP). Int. J. Innov. Res. Sci. Eng. Technol. 2017, 6, 2580–2587.
9. Rumbayan, M.; Nagasaka, K. Prioritization decision for renewable energy development using analytic hierarchy process andgeographic information system. In Proceedings of the 2012 International Conference on Advanced Mechatronic Systems, Tokyo,Japan, 18–21 September 2012; pp. 36–41.
10. Tasri, A.; Susilawati, A. Selection among renewable energy alternatives based on a fuzzy analytic hierarchy process in Indonesia.Sustain. Energy Technol. Assessments 2014, 7, 34–44. [CrossRef]
11. Krueger, R.A.; Casey, M.A. Focus Groups: A Practical Guide for Applied Research; Sage Publications: Thousand Oaks, CA, USA, 1994.12. Sovacool, B.K. A qualitative factor analysis of renewable energy and Sustainable Energy for All (SE4ALL) in the Asia-Pacific.
Energy Policy 2013, 59, 393–403. [CrossRef]13. Yudha, S.W.; Tjahjono, B. Stakeholder Mapping and Analysis of the Renewable. Energy Industry in Indonesia. Energies 2019,
12, 602. [CrossRef]14. Glass, G.V. Primary, Secondary, and Meta-Analysis of Research. Educ. Res. 1976, 5, 3–8. [CrossRef]15. Rahman, M.S. The Advantages and Disadvantages of Using Qualitative and Quantitative Approaches and Methods in Language
“Testing and Assessment” Research: A Literature Review. J. Educ. Learn. 2017, 6, 102–112. [CrossRef]16. Kvale, S. Interviews: An Introduction to Qualitative Research Interviewing; Sage: Thousand Oaks, CA, USA, 1996.17. Carey, M.A. The group effect in focus groups: Planning, implementing, and interpreting focus group research. In Critical Issues in
Qualitative Research Methods; Morse, J.M., Ed.; Sage: Thousand Oaks, CA, USA, 1994; pp. 225–241.18. Stevens, P.E. Focus groups: Collecting aggregate-level data to understand community health phenomena. Public Health Nurs.
1996, 13, 170–176. [CrossRef] [PubMed]19. McDaniel, R.W.; Bach, C.A. Focus group research: The question of scientific rigor. Rehabil. Nurs. Res. 1996, 3, 53–59.20. Nyumba, T.O.; Wilson, K.; Derrick, C.J.; Mukher, N. The use of focus group discussion methodology: Insights from two decades
of application in conservation. In Methods in Ecology and Evolution; John Wiley & Sons Ltd.: Hoboken, NJ, USA, 2017.21. Miles, M.B.; Huberman, A.M. Qualitative Data Analysis: An Expanded Sourcebook; Sage: Thousand Oaks, CA, USA, 1994.22. Babbie, E.R. The Practice of Social Research; Wadsworth Cengage: Belmont, CA, USA, 2010.23. ESDM. General Plan for National Energy; Ministry of Energy and Mineral Resources (ESDM): Jakarta, Indonesia, 2017.24. PLN. Electricity Supply Business Plan from 2019 to 2028; State-owned Electricity Company (PLN): Jakarta, Indonesia, 2019.25. Simamora, P.; Mursanti, E.; Giwangkara, J.; Arinaldo, D.; Tampubolon, A.P.; Adiatma, J.C. Igniting A Rapid Deployment
of Renewable Energy in Indonesia: Lessons Learned from Three Countries, Institute for Essential Services Reform (IESR).2019. Available online: https://iesr.or.id/en/pustaka/igniting-a-rapid-deployment-of-renewables-in-indonesia (accessed on3 January 2021).
26. Holttinen, H. Design and operation of power system with large amounts of wind power. In Proceedings of the Global WindPower Conference, Adelaide, Australia, 18–21 September 2006.
27. Indonesia Energy Outlook & Statistic; Energy Reviewer; University of Indonesia: Depok, Indonesia, 2006.28. Hasan, M.H.; Mahlia, T.M.I.; Nur, H. A review on energy scenario and sustainable energy in Indonesia. Renew. Sustain. Energy
Rev. 2012, 16, 2316–2328. [CrossRef]29. IRENA. Renewable Energy and Jobs Annual Review 2019, International Renewable Energy Agency IRENA. 2019. Available online:
https://www.irena.org/publications/2019/Jun/Renewable-Energy-and-Jobs-Annual-Review-2019 (accessed on 8 March 2021).30. DEN. Indonesia Energy Outlook 2019; Secretariat General National Energy Council (Dewan Energi Nasional/DEN): Jakarta,
Indonesia, 2019.31. IEEFA Asia Pacific. Indonesia’s Solar Policies–designed to fail? Institute for Energy Economics and Financial Analysis
(IEEFA), 2019. Available online: https://ieefa.org/ieefa-report-indonesias-solar-policies-designed-to-fail/ (accessed on12 December 2020).
32. PwC. Renewable Energy Development: Large Potential of Solar Power Underoptimised, PricewaterhouseCoopers (PwC).2019. Available online: https://www.pwc.com/id/en/media-centre/infrastructure-news/march-2019/large-potential-of-solar-power-underoptimised.html (accessed on 12 November 2020).
218

Energies 2021, 14, 2762
33. Dang, M.Q. Potential of Solar Energy in Indonesia. 2017. Available online: https://www.researchgate.net/publication/324840611_Potential_of_Solar_Energy_in_Indonesia (accessed on 15 January 2021).
34. Purba, N.P.; Kelvin, J.; Annisaa, M.; Teliandi, D.; Ghalib, K.G.; Ayu, I.P.R.; Damanik, F.S. Preliminary Research of Using OceanCurrents and Wind Energy to Support Lighthouse in Small Island, Indonesia. Energy Procedia 2014, 47, 204–210. [CrossRef]
35. IRENA. Salinity Gradient Energy Technology Brief, International Renewable Energy Agency IRENA. 2014. Available online:https://www.irena.org/publications/2014/Jun/Salinity-Gradient (accessed on 3 January 2021).
36. Siahaya, Y.; Salam, L. Ocean Thermal Energy Conversion (OTEC) Power Plant and its Byproducts Yield for Small Islands inIndonesia Sea Water. In Proceedings of the ICCHT-5th International Conference on Cooling and Heating Technologies, Bandung,Indonesia, 9–11 December 2010.
37. Fungenzi, T. Biomass as an Opportunity to Solve Indonesia’s Energy Challenge. 2015. Available online: https://www.researchgate.net/publication/280075489_Biomass_as_an_opportunity_to_solve_Indonesia\T1\textquoterights_energy_challenge (accessed on 20 February 2021).
38. Abdullah, K. Biomass Energy Potentials and Utilization in Indonesia. 2006. Available online: https://www.researchgate.net/publication/228402035_Biomass_Energy_Potentials_And_Utilization_In_Indonesia (accessed on 26 January 2021).
39. Sapuan, D.; Aditya, W. Challenges and Policy for Biomass Energy in Indonesia. Int. J. Bus. Econ. Law 2018, 15, 41–47.40. Nippon Koei. Project for the Master Plan Study of Hydropower Development in Indonesia. 2011. Available online: https:
//openjicareport.jica.go.jp/pdf/12037610.pdf (accessed on 10 December 2020).41. Gokhale, P.; Date, A.; Akbarzadeh, A.; Bismantolo, P.; Suryono, A.F.; Mainil, A.K.; Nuramal, A. A review on micro hydropower in
Indonesia. Energy Procedia 2017, 110, 316–321.42. Nasruddin, N.; Alhamid, M.I.; Daud, Y.; Surachman, A.; Sugiyono, A.; Aditya, H.B.; Mahlia, T.M.I. Potential of geothermal energy
for electricity generation in Indonesia: A review. Renew. Sustain. Energy Rev. 2016, 53, 733–740. [CrossRef]43. Surya, D.; Harsoprayitno, S.; Setiawan, B.; Hadyanto; Sukhyar, R.; Soedibjo, A.W.; Ganefianto, N.; Stima, J. Geothermal Energy
Update: Geothermal Energy Development and Utilization in Indonesia. In Proceedings of the World Geothermal Congress 2010,Bali, Indonesia, 25–29 April 2010.
44. Hamilton, W.B. Tectonics of the Indonesian Region. US Govt. 1979. [CrossRef]45. Manalu, P. Geothermal development in Indonesia. Geothermics 1988, 17, 415–420. [CrossRef]46. PSDG. Kapasitas Terpasang Pembangkit Panas Bumi Indonesia, Pusat Sumber Daya Mineral Batubara dan Panas Bumi (PSDG).
2019. Available online: http://psdg.bgl.esdm.go.id/index.php?option=com_content&view=article&id=1306&Itemid=610 (ac-cessed on 16 December 2020).
47. ThinkGeoEnergy. The Top 10 Geothermal Countries 2019—Based on Installed Generation Capacity (MWe). 2019. Availableonline: https://www.thinkgeoenergy.com/the-top-10-geothermal-countries-2019-based-on-installed-generation-capacity-mwe/(accessed on 27 January 2021).
48. EBTKE ESDM. Annual Performance Report 2019; Direktorat Jenderal Energi Baru Terbarukan ESDM: Jakarta, Indonesia, 2019.49. Halldorsson, A.; Svanberg, M. Energy resources: Trajectories for supply chain management. Supply Chain Manag. Int. J. 2013, 18,
66–73. [CrossRef]
219


MDPISt. Alban-Anlage 66
4052 BaselSwitzerland
Tel. +41 61 683 77 34Fax +41 61 302 89 18
www.mdpi.com
Energies Editorial OfficeE-mail: [email protected]
www.mdpi.com/journal/energies


MDPI
St. Alban-Anlage 66
4052 Basel
Switzerland
Tel: +41 61 683 77 34
Fax: +41 61 302 89 18
www.mdpi.com ISBN 978-3-0365-2615-7