The future of renewable energy industries
20
Murray Silverman is professor of management at the School of Business of San Francisco State University. Dr. Silverman's present research emphasizes renewable energy industries. He holds a Ph.D. in business from Stanford University. Susan Worthman received her M.B.A. degree from San Francisco State and is engaged in research on business responses to environmental issues. The Future of Renewable Energy Industries Investment and innovation in renewable energy a key element of any long-term energy strategy will not occur unless developers and investors perceive the industry to be attractive over time. The tong-term attractiveness of renewable energy industries should be maintained, for the sake of jobs, energy security, the environment, and our international competitiveness. Murray Silverman and Susan Worthman D uring the past decade or so, economic, political and tech- nological forces have combined to alter the framework of the electric power industry. As a result of this change, a small but growing mar- ket for non-utility supplied en- ergy has emerged. This emerging independent electricity market has in turn spawned a variety of nascent electricity-generating in- dustries based on renewable en- ergy technology (RET). These in- dustries include biomass, geothermal, photovoltaics, high- temperature solar thermal, wind and non-utility hydro. Although the independent power market is relatively robust, the viability of the renewable en- ergy industries competing in this market seems uncertain. While there was significant growth in re- newables during the 1980s, fueled in large part by the political desire to reduce oil dependence and the social heat to reduce pollution, the growth is relative. Renewables have made few inroads in the overall energy mix of the U.S. In spite of the fact that lawmakers and activists have called for in- creasing the use of renewables na- tionwide, grid-connected renew- able electric capacity (if large scale hydro is factored out) is less than 3 percent of total U.S. capacity. 12 The Electricity Journal
-
Upload
independent -
Category
Documents
-
view
1 -
download
0
Transcript of The future of renewable energy industries

Murray Silverman is professor of management at the School of Business
of San Francisco State University. Dr. Silverman's present research
emphasizes renewable energy industries. He holds a Ph.D. in
business from Stanford University. S u s a n Worthman received her
M.B.A. degree from San Francisco State and is engaged in research on
business responses to environmental issues.
The Future of Renewable Energy Industries
Investment and innovation in renewable energy a key element of any long-term energy strategy will not occur unless developers and investors perceive the industry to be attractive over time. The tong-term attractiveness of renewable energy industries should be maintained, for the sake of jobs, energy security, the environment, and our international competitiveness.
Murray Silverman and Susan Worthman
D uring the past decade or so, economic, political and tech-
nological forces have combined to alter the framework of the electric power industry. As a result of this change, a small but growing mar- ket for non-utility supplied en- ergy has emerged. This emerging independent electricity market has in turn spawned a variety of nascent electricity-generating in- dustries based on renewable en- ergy technology (RET). These in- dustries include biomass, geothermal, photovoltaics, high- temperature solar thermal, wind and non-utility hydro.
Although the independent power market is relatively robust,
the viability of the renewable en- ergy industries competing in this market seems uncertain. While there was significant growth in re- newables during the 1980s, fueled in large part by the political desire to reduce oil dependence and the social heat to reduce pollution, the growth is relative. Renewables have made few inroads in the overall energy mix of the U.S. In spite of the fact that lawmakers and activists have called for in- creasing the use of renewables na- tionwide, grid-connected renew- able electric capacity (if large scale hydro is factored out) is less than 3 percent of total U.S. capacity.
12 The Electricity Journal

To some extent, technological
and economic factors account for the slow penetration of re-
newables. But competitive inequi- ties are also to blame. The nature and technology of renewables are markedly different from fossil fu- els, and their associated industries are similarly diverse in structure and strategy. Yet companies within these industries must com-
pete almost solely within the given structure of the electric
power industry--an industry dominated by the buying and lob- bying power of the utility compa- nies and large independent devel- opers. In this broader industry, the standards for competition are based on metrics geared for fossil fuels, which often do not account
for the economic and environ- mental benefits of renewable en- ergy
T he slow growth of re- newables may eventually
spell disaster for these industries. Some may assume that renewable energy technologies will automat- ically be around when called into service. But renewable electricity generating resources are only as viable as the industries that sus- tain them. A renewables technol- ogy is more likely to achieve its market potential if there is a ro- bust, competitive group of firms comprising the industry. This in- dustry would be characterized by: (1) greater investment and more creative approaches to product and manufacturing process re- search and development (leading to higher quality and lower costs); (2) sound market development strategies, which increase reve-
nues and establish secure, grow-
ing markets; (3) the development of long-term business strategies
which account for the issues and risks inherent in the industry envi- ronment; (4) enhanced global competitiveness; and (5) a flow of investment capital from the pri- vate sector. A snowballing occurs; as the industry firms and inves- tors see increases in size and prof- itability within a reasonable time, the industry becomes more attrac- tive, drawing in new players and
The boom and bust cycles of the past have caused industry to be reticent about embark- ing on a major investment program.
investment. Conversely, if there is no market in which to compete, no driver for technological and market innovation, then there is no basis for sustaining individual companies--and essentially no in-
dustry. Which is the reality for re-
newables? The Union of Con- cerned Scientists along with the Coalition for Energy Efficiency and Renewable Technologies have argued for "sustained or- derly development of renewable technologies," pointing out that while emerging wind and solar technologies are projected to be
cost competitive for large-scale de-
velopment by the year 2000, those industries must be able to sustain themselves and mature in the in- terim in order to meet that de- mand. 1 The implication is that RETs may be in trouble.
Events in the once-promising, high-temperature solar thermal in- dustry epitomize the concern. A recent DOE report pointed out that "the boom and bust cycles of the past have caused industry to be reticent about embarking on a major investment program with- out stronger signals from the mar- ketplace that there will be a stable expansion of the demand for solar electric technologies. "2 Luz, the last remaining competitor of real consequence, filed for bankruptcy
in 1992, undone mostly by incon- sistent government policies and the lack of strong signals of sup- port. According to Michael Lot- ker, Luz's former vice president of business development, the failure demonstrated "that a company and a technology must have room to grow if it is to survive, includ- ing a stable regulatory environ- ment, a marketplace that values solar technologies' mitigation of fuel price risk, and an overall tax structure that is both stable and equitable for all solar technolo- gies. ''3
Therefore, we must ask these questions:
• Are the renewable-industries healthy and capable of sustaining themselves?
• Is there another Luz on the ho- rizon?
• Even beyond the question of industry failure, will the indus-
March 1995 13
tries be healthy enough to make a significant contribution to our na- tion's energy future?
If RETs are to play a significant role in the nation's energy mix,
then we must know whether these industries are truly viable,
and then decide what-- i f any- -
corrective action to take. Below,
we look at the strengths and weaknesses of the various RET in-
dustries and explore what it may take to catalyze them. 4
I. I ndus t ry G r o w t h and Development
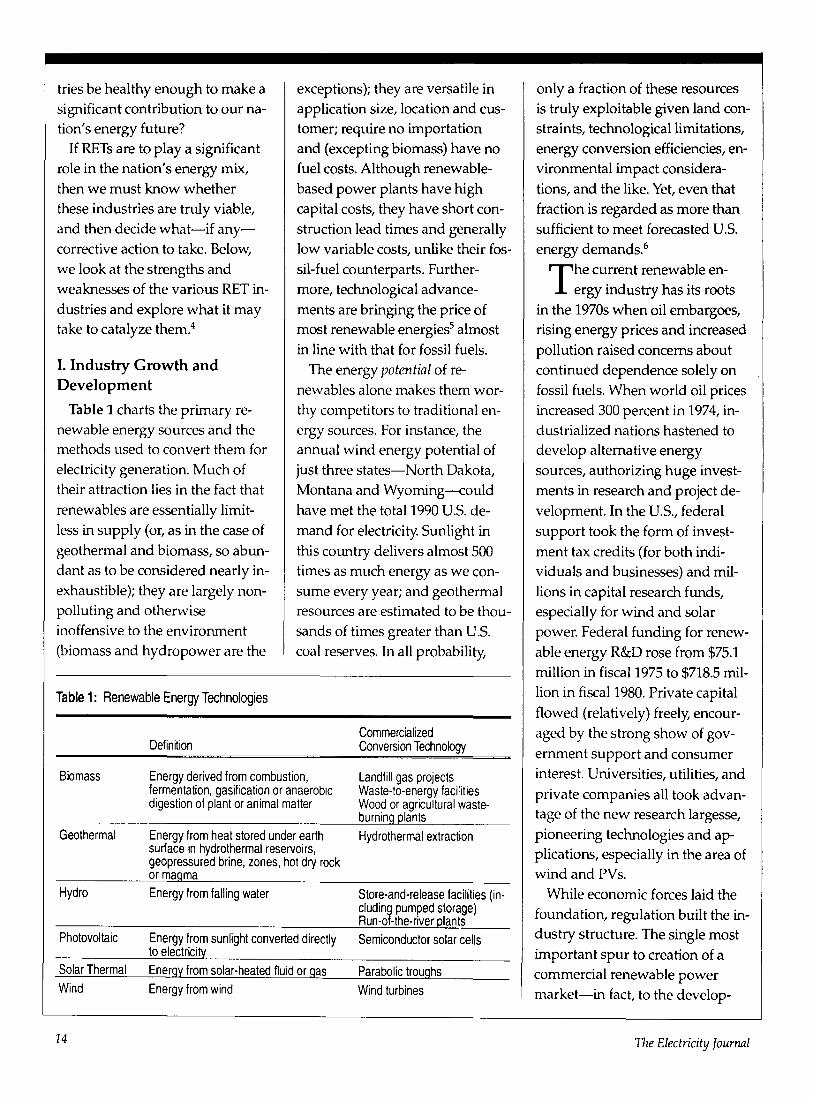
Table I charts the primary re-
newable energy sources and the methods used to convert them for
electricity generation. Much of
their attraction lies in the fact that
renewables are essentially limit-
less in supply (or, as in the case of
geothermal and biomass, so abun-
dant as to be considered nearly in-
exhaustible); they are largely non- polluting and otherwise
inoffensive to the environment
(biomass and hydropower are the
exceptions); they are versatile in
application size, location and cus- tomer; require no importation
and (excepting biomass) have no fuel costs. Although renewable-
based power plants have high
capital costs, they have short con-
struction lead times and generally
low variable costs, unlike their fos-
sil-fuel counterparts. Further-
more, technological advance-
ments are bringing the price of most renewable energies 5 almost
in line with that for fossil fuels.
The energy potential of re-
newables alone makes them wor-
thy competitors to traditional en-
ergy sources. For instance, the annual wind energy potential of
just three states--North Dakota,
Montana and Wyoming--could
have met the total 1990 U.S. de-
mand for electricity. Sunlight in
this country delivers almost 500
times as much energy as we con-
sume every year; and geothermal resources are estimated to be thou-
sands of times greater than U.S.
coal reserves. In all probability,
Table 1: Renewable Energy Technologies
Definition Commercialized Conversion Technology
Biomass Energy derived from combustion, fermentation, gasification or anaerobic digestion of plant or animal matter
Geothermal
Hydro
Energy from heat stored under earth surface in hydrothermal reservoirs, geopressured brine, zones, hot dry rock or magma Energy from falling water
Photovoltaic
Solar Thermal Wind
Energy from sunlight converted directly to electricity Energy from solar-heated fluid or gas Energy from wind
Landfill gas projects Waste-to-energy facilities Wood or agricultural waste- burning plants Hydrothermal extraction
Store-and-release facilities (in- cluding pumped storage) Run-of-the-river plants Semiconductor solar cells
Parabolic troughs Wind turbines
only a fraction of these resources
is truly exploitable given land con- straints, technological limitations,
energy conversion efficiencies, en- vironmental impact considera-
tions, and the like. Yet, even that
fraction is regarded as more than
sufficient to meet forecasted U.S. energy demands. 6
T he current renewable en-
ergy industry has its roots
in the 1970s when oil embargoes, rising energy prices and increased
pollution raised concerns about
continued dependence solely on
fossil fuels. When world oil prices increased 300 percent in 1974, in-
dustrialized nations hastened to develop alternative energy
sources, authorizing huge invest- ments in research and project de-
velopment. In the U.S., federal
support took the form of invest-
ment tax credits (for both indi- viduals and businesses) and mil-
lions in capital research funds, especially for wind and solar
power. Federal funding for renew-
able energy R&D rose from $75.1
million in fiscal 1975 to $718.5 mil-
lion in fiscal 1980. Private capital
flowed (relatively) freely, encour-
aged by the strong show of gov-
ernment support and consumer
interest. Universities, utilities, and
private companies all took advan- tage of the new research largesse,
pioneering technologies and ap- plications, especially in the area of wind and PVs.
While economic forces laid the
foundation, regulation built the in- dustry structure. The single most
important spur to creation of a commercial renewable power
market--in fact, to the develop-
I4 The Electricity Journal

ment of the whole independent
power industry--was undoubt- edly the passage in 1978 of the Public Utility Regulatory Policies Act. Under this law, designed to encourage small-scale electric power production, cogeneration and energy conservation, electric utilities are required to buy power from independent producers--de- fined by PURPA as "qualifying fa- cilities" (QFs)7--at a price deter- mined by the "aw~ided cost" of generation (i.e., the utility's mar- ginal electricity cost). The utilities
must also provide backup power as necessary.
I ronically, the environment that fostered the renewables
industry has largely eroded just when experience and technology have matured sufficiently to make most renewables a truly cost-com- petitive, reliable energy alterna- tive. g Emphasis on decreased en- ergy consumption, coupled with an abundance of inexpensive natural gas, have overshadowed the perceived need for alterna- tives to limited fossil fuels. Fed- eral support for renewables de- clined steadily throughout the 1980s, reaching a low of $140.7 million in fiscal 1989. By 1993, ap- propriations had crept back up,
reaching $327 million, still only a fraction of renewables budgets in the late 1970s. Private investment has languished, scared off by early project failures, overoptimis-
tic cost estimates and diminished govern- ment support. This lack of capital, either public or private, has se- verely hampered technological R&D, industry technology trans-
fer for commercial project testing, and market development activi- ties. 9 In addition, despite the great technological advances made by U.S. companies, foreign firms and governments have in some cases equaled or surpassed the U.S., raising questions as to which countries would dominate the global market as teclxnologies ma- tttre.l°
Changes in power regulation and purchase contracts have also upped the competitive ante. A re- cent survey fottnd that nearly all
states with identified needs for new generation capacity have
adopted or are in the process of developing competitive bidding schemes for supply sources, u In- dependent power producers as a whole renewables included-- will compete for the same share of
the pie. In addition, the 1992 En- ergy Policy Act encourages devel- opment of freer market entry for IPPs, with no restrictions on size
or fuel source, such as those im- posed by PURPA. Both changes are likely to put renewables at a competitive disadvantage.
Finall~¢ deregulation in the elec- tric utility industry poses major problems for renewables. New in-
dustry structures are being pro- posed that would provide end us- ers with much greater choice in
sourcing their power needs. And for most customers, especially
large buyers, a primary purchase criterion will be price. While re- newables are becoming more price competitive, many of their benefits are societal in nature, measured in terms of environ- mental considerations, diversifica- tion of our fuel source mix, etc. In- dividual buyers will have little interest in the benefits provided by electricity from renewables. Thus, renewables could suffer a major setback under such deregu- lation scenarios.
While there are many political, regulatory, economic and social forces that drive renewables in- dustries in general one way or an- other, each renewables industry is different and may be differently affected by these forces. There- fore, to assess each industry's vi- ability and outlook, we must ex- amine them ~parately.
A. The Wind-Power Industry
The wind-power industry is global, with a small number of players competing for a limited market. During the late 1980s the domestic industry was marked by major shakeouts in the wake of drops in federal funding, loss of tax credits and the suspension of California's Standard Offer 4 (SO4) contracts, which were long- term power purchase contracts from utilities at a fixed price per unit of output. The industry's reputation was damaged by inex- perienced and overzealous opera-
March 1995 15

tors who often oversold their products and couldn't deliver the capacity promised. Both the pub- lic and investors looked upon the wind industry with skepticism. Where once dozens of companies were competing, the number of U.S. developers and manufactur- ers has dropped to a handful. More recently; the Energy Policy Act of 1992 (EPAct) provided a 1.5c/kWh production credit for electricity produced from wind- - a substantial bonus for the indus- try.
T he industry is made up of turbine manufacturers, de-
velopers and component manu- facturers, with developers and tur- bine manufacturers forming the industry core. Four turbine manu- facturers account for over 90 per- cent of the current world market: Kenetech Windpower, Inc. (U.S.), 12 Vestas (Denmark), Micon (Denmark), and FloWind (U.S.). As for wind station operators/de- velopers, there are five leading companies; of these, Kenetech Windpower, SeaWest and Zond hold over a three-fourths share. (Kenetech Windpower alone ac- counts for nearly 25 percent mar- ket share).
As Table 2 indicates, industry growth has been relatively robust. Installed worldwide capacity ex- ceeds 4000 MW. The U.S. market has historically been the largest and fastest growing; California projects alone represented close to 75 percent of 1991 production. Technological improvements in turbines, led by U.S. firms, have brought wind prices down to about 5c/kWh, 13 making wind
virtually cost competitive with conventional fuels, even without the EPAct incentive. According to a widely cited Pacific Northwest Laboratories study done in 1990, there is enough wind potential in the U.S. to produce more than the total amount of electricity the na- tion currently uses.
Wind is an intermittent re- source, varying greatly in volume and quality depending upon loca- tion and time. Even in prime ar-
eas, wind speeds change season- ally and throughout the day, meaning that capacity is not con- stant. The trick in project develop- ment is to find a wind resource that tends to match a utility's peaking requirements. Most utili- ties do not have sufficiently de- tailed information on local wind resources to accurately predict load-carrying capability; and lack of site-specific resource data is a serious impediment to wind's wider acceptance.
Until recently, the only areas economically viable for wind- power development were those that had class 5-7 winds--16+ mph. Most of these are concen- trated on the Pacific Coast and the
Great Plains, but only in Califor- nia has there been any real com- mercial development. These sites are often remote, making trans- mission access a key concern. Moderate wind areas--averaging speeds of 14 mph--are much more widely distributed, but tur- bine technology could not make efficient use of them. A new gen- eration of turbines, most notably Kenetech Windpower's 33 M-VS, is likely to change that. The tur- bine uses a variable-speed gener- ator to produce electricity more ef- ficiently over a wider range of speeds than with previous tur- bines.
In addition to technological leadership, Kenetech Windpower has shown itself particularly adept in marketing and innova- tive financing arrangements, ac- counting for its industry leader- ship position. The only other U.S. manufacturer of significant conse- quence is FloWind Corporation, and its technology development is years behind Kenetech Wind- power. Zond has recently an- nounced a new wind-power ma- chine, but it is at the early stages of development. Thus, at this
Table 2: Installed Capacity and Relative Prices of Renewables Technologies in U.S. (1992)
Cure. Installed Current Delivered Impact of Tech. Technology Capacity (MW) Market Price (¢dkWh) Dev. On Price a
Biomass 7707 5-7 Low Geothermal 2557 5-7 Low
Photovoltaics 87.9 25-40 High Solar Thermal (High-Temp) 369 8-10 Medium
Wind 1676 5-8 Medium
a. Techrxt:cjy impact on price refers to the relative degree to which technological advancement will further reduce price.
16 The Electricity Journal

stage, the domestic industry's fu- ture hinges on the success of Kenetech's 33M-VS.
With these recent advances in turbine efficiency and reliability has come increased utility interest in wind power. Kenetech Wind- power has executed contracts or is in negotiation with utilities in the Pacific Northwest, the Mid- west and California, as well as Canada and Western Europe. These contracts total in the hun- dreds of megawatts.
B ut, ironically, early ad- vances by U.S. players fos-
tered worldwide techiaology de- velopment efforts that now far surpass domestic investments ~4- and pose a considerable competi- tive threat to U.S. companies. In- dustry analysts say that European countries will spend $150 million annually through the year 2000 for wind-power R&D and market incentives, creating a market total- ing $3.2 billion. 1~ European devel- opment will likely eclipse that of the U.S. throughout the 1990s, a by-product of EC-member nation policies encouraging renewable energy. By contrast, DOE funding in FY 1992 was $21.5 million--a
91 percent increase over 1991, but a far cry from the high of $60 mil-
lion in 1980. At stake for U.S. com- panies is not only the world wind market, but a substantial domes- tic market as well. 1~' To be sure, ex- pansion of European and other foreign markets does not necessar- ily mean that U.S. companies will lose market share, but they may face greater challenges when com- peting against foreign companies on those firms' own turf. Euro-
pean firms are also pursuing the U.S. market. A number of these European firms claim to be on par technologically with Kenetech Windpower. U.S. dominance of the wind market could be seri- ously compromised in the face of these developments.
Outlook and Viability: A few years ago, the outlook for the wind power industry in the United States was extremely tenu- ous. SO4 contracts were winding down and wind power contracts for new generating capacity were few and intermittent. Currentl}¢
the industry's long- and short- term outlooks, while vulnerable, seem extremely favorable.
Wind technology for grid appli- cation had already proven itself through established wind farms.
Significant groundwork had al- ready been laid in building rela- tionships with utilities through consortiums and joint ventures. But the primary reason for the im- proved industry outk×)k is Kenetech Windpower's introduc- tion of the new-generation 33M- VS variable speed turbine, which allows wind to effectively com- pete for new power contracts.
Kenetech has recently signed
numerous contracts for wind plants using its new variable speed turbine. FloWind has also been awarded new contracts. These contracts represent the lead- ing edge of a strong growth curve as the domestic wind industry moves out of its emergent stage.
However, there is still vulner- ability in the industry, as its future is dependent on the fortunes of Kenetech Windpower. Although no warning signs are apparent, a worst-case scenario would in- volve a sudden shutdown in mar- ket demand or problems with the new-generation turbines that could cause severe problems at Kenetech. This seems unlikel)¢ as Kenetech has already proven it- self adept in its financial skills and in preparing for such contingen- cies. Nevertheless, the domestic industry's dependence on one or two companies introduces a meas- ure of risk.
B. The Geothermal Industry
One word describes the U.S. geothermal industry: concentra-
tion. Of the more than 2500 MW of geothermal generating capacity currently in operation in the U.S., all but about 50 MW comes from projects in California and Ne- vada. Worth nearly $4 billion, these projects rest mostly in the hands of five large companies: Unocal, Calpine, OESI, California Energy (CEC), and Oxbow Geo- thermal) 7 Entry barriers are clearly high, due in part to the large capital requirements of geo- thermal projects and the limited supply of geothermal leaseholds.
March 1995 17

CEC alone controls over 550,000 acres of leaseholds in the West.
Geothermal has been an attrac- tive industry for utility diversifica- tion. The geothermal resource and the size and operation of geother- mal power plants are quite simi- lar to conventional fuels, making it easy to transfer utility experi- ence and skills. It's no wonder that the most recent industry en- trants are five major utility affili- ates: Mission Energy (Southern California Edison); Constellation Development (Baltimore Gas & Electric), Dominion Energy (Vir- ginia Electric Power Co.), Com- munity Energy Alternatives (Pub- lic Service Electric & Gas of New Jersey) and ESI (Florida Power & Light). Together these companies hold equity interests in 19 geother- mal QF plants. TM Utility affiliates in general are the largest source of financial capital for the industry, holding approximately two-thirds of geothermal QFs' debt and eq- uity financing.
U 'ntil the mid-1980s, the in- dustry was one of the fast-
est-growing alternative sources of power generation, and claimed many of the lucrative, high fixed- payment SO4 contracts awarded by California utilities. Federal tax credits of 15 percent for re- newables business investment also helped to fuel the growth. Geothermal project profitability has been generally high (due in no small part to the aforemen- tioned contracts) with typical net cash flows of approximately 44 percent. 19
Growth (currently estimated at less than 10 percent annually,
from a high of nearly 18 percent) has slowed considerably in the past five years, a function of both falling fuel prices and excess ca- pacity in the industry's major geo- graphic market, the West. Al- though capacity needs may increase in the future, they will be dampened by utility conservation efforts. Near-term geothermal growth rests heavily with re- served contract set-asides in Cali- fornia, Nevada and the North-
west, totaling less than 500 MW.
Overseas oppor- tunities for geothermal
may increase as more foreign countries move
toward power privatization.
Two small opportunities totaling 75 MW exist in Hawaii and the Aleutians. Long-term growth will likely be led by Nevada utilities, with expectations of a minimum 25-35 MW awarded to geother- mal companies annuall)t Hawaii also provides some hope, as load growth there is expected to in- crease 5-10 MW yearl)¢ and geo- thermal resources are an abun- dant, economic alternative in the state. At the same time, Hawaii's geothermal industry faces enor- mous public opposition.
Overseas opportunities may in- crease as more foreign countries
move toward power privatiza- tion. Latin American countries are particularly rich in geothermal re- serves, but U.S. companies would face stiff competition there from Mexican and European develop- ers. The Philippines recently awarded a number of contracts, and U.S. recipients included both Unocal and Magma.
The geothermal resource is an energy heavy-hitter, with the abil- ity to generate reliable, high-ca- pacity baseload power for be- tween 5c/kWh and 7c/kWh --very near conventional fuel costs. It is one of the most com- mercialized of all renewable tech- nologies. Utilities are virtually the industry's sole buyer. Supply is vast; hydrothermal reservoirs-- the only commercialized re- source represent but a small fraction of geothermal resource potential.
G eothermal is also one of the least modular and least
differentiated of resources. As a high-capacity, baseload generat-
ing resource, a hydrothermal res- ervoir lends itself almost exclu- sively to large-scale, utility-based applications. Geography also con- strains geothermal modularity. Hydrothermal reservoirs are gen- erally in remote locations: In the U.S., they are essentially limited to California, Nevada, Hawaii and Utah (in resource order).
Recent developments have raised concerns that many of the best reservoirs may be overex- tended. The majority of hydro- thermal plants currently in opera- tion draw upon dry-steam reservoirs--the easiest to utilize
18 The Electricity Journal
for electricity, but also the rarest.
Most of the world's known, acces-
sible dry-steam areas (about 10 in
all) have been fully exploited. At The Geysers--the largest dry-
steam reservoir, located in Califor- n ia - the re ' s been a sharp drop in
steam pressure over the past five years, cutting capacity by 25 per-
cent. More steam has been with-
drawn than is being replaced by
injection or natural recharge. Many observers see severe finan-
cial losses for investors if the trend continues. 2°
F for the long term, solutions seem to lie with improved
technology and the commerciali- zation of other geothermal re-
sources such as geopressured brine and hot dry rock. New,
more powerful turbines are avail- able which can add 30 percent
more generating power to hydro- thermal projects. Two California
companies recently signed a joint development agreement specifi-
cally for wet steam and brine pro-
jects. 2~ Even at that, some say com-
mercialization is at minimum 10
years away: ~ Brine extraction
technology has been proven and
is still being refined. But the com-
mercial barrier is being able to
predict a reservoir's productive
life with higher confidence. Unfor-
tunately, confirming the quantity and quality of any geothermal re-
source is difficult, expensive and
risky--more so than for most
other resources, according to in- dustry experts, z3
Hot dry rock (HDR), the only
geothermal resource that is widely dispersed, may hold
greater near-term commercial po-
tential--but U.S. development
has been hampered by cuts in
government spending. That in
turn may spell trouble for U.S. competitiveness. The U.S. in-
vented the extraction technology for HDR and has held dominance
in the field, but Japan, Russia and several European countries are in
active research and development.
The industry is characterized by:
• Dwindling project and risk capital. There are currently 26 geo-
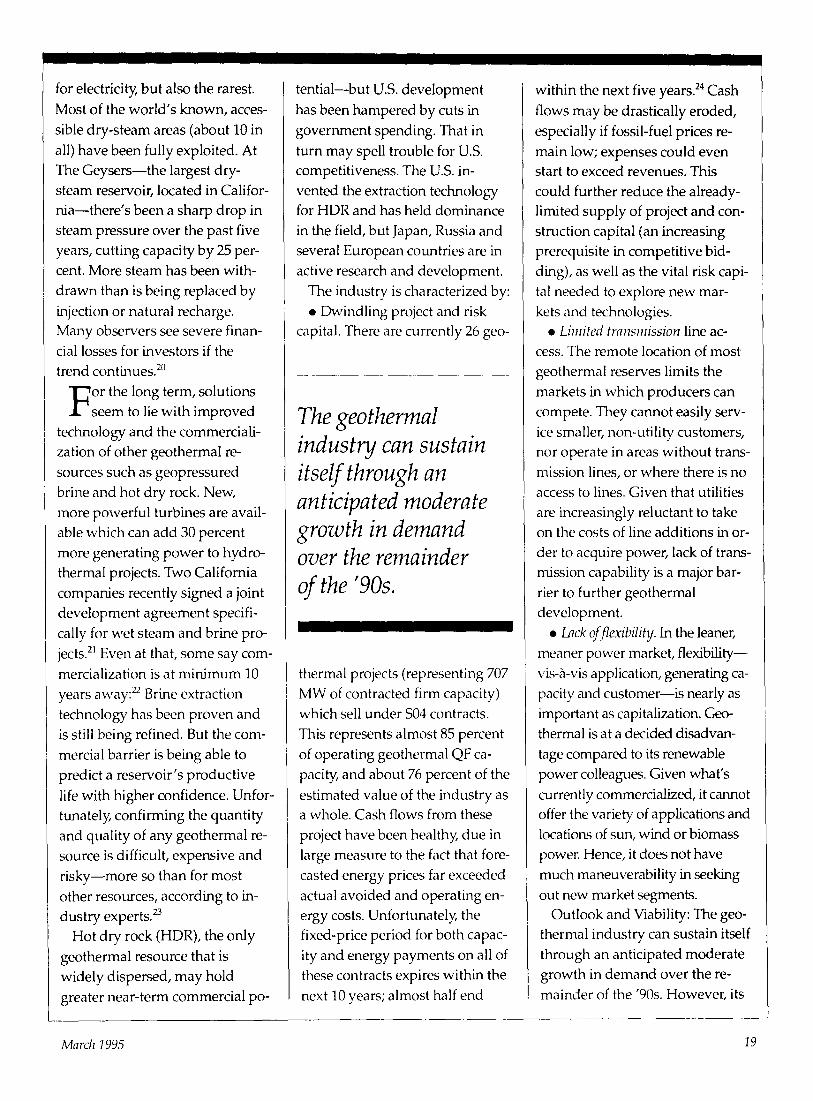
The geothermal industry can sustain itself through an anticipated moderate growth in demand over the remainder of the '90s.
thermal projects (representing 707
MW of contracted firm capacity)
which sell under S04 contracts.
This represents almost 85 percent
of operating geothermal QF ca-
pacity, and about 76 percent of the
estimated value of the industry as a whole. Cash flows from these
project have been healthy, due in large measure to the fact that fore-
casted energy prices far exceeded
actual avoided and operating en-
ergy costs. Unfortunate134 the fixed-price period for both capac-
ity and energy payments on all of these contracts expires within the
next 10 years; almost half end
I I
within the next five years. 24 Cash
flows may be drastically eroded,
especially if fossil-fuel prices re-
main low; expenses could even start to exceed revenues. This
could further reduce the already- limited supply of project and con-
struction capital (an increasing
prerequisite in competitive bid-
ding), as well as the vital risk capi-
tal needed to explore new mar-
kets and technologies. • Limited transmission line ac-
cess. The remote location of most geothermal reserves limits the
markets in which producers can compete. They cannot easily serv-
ice smaller, non-utility customers, nor operate in areas without trans-
mission lines, or where there is no access to lines. Given that utilities
are increasingly reluctant to take
on the costs of line additions in or-
der to acquire power, lack of trans- mission capability is a major bar-
rier to further geothermal development.
• Lack offleribility, in the leaner,
meaner power market, flexibility--
vis-A-vis application, generating ca- pacity and customer--is nearly as
important as capitalization. Geo-
thermal is at a decided disadvan-
tage compared to its renewable
power colleagues. Given what's
currently commercializcx:l, it cannot offer the variety of applications and
locations of sun, wind or biomass power. Hence, it does not have
much maneuverability in seeking
out new market segments. Outlook and Viability: The geo-
thermal industry can sustain itself
through an anticipated moderate
growth in demand over the re-
mainder of the '90s. However, its
March 1995 I9

long-term fu~re is clouded by sig- nificant uncertainty. In the short term, existing SO4 contracts, a number of smaller contracts that seem likely to be signed in Ne- vada, California, Hawaii and the Northwest, and continued utility involvement in the industry all provide stabilizing influences. Growth through 1999 is expected to average about five percent an- nually in the U.S. 2s Significant in- ternational opportunities will al- low some industry players to prosper.
I n the longer term, the cut-off of R&D funding for emerging
geothermal technologies seriously diminishes the prospect for geo- thermal to become a significant con- tributor to the nation's renewables mix. Without access to HDR and other geothermal resources, the in- dustry is constrained to the remain- ing liquid-dominated hydro-ther- mal reservoirs, which are limited both in size and geographic scope.
Even if the industry can remain vi- able by developing untapped hy-
drothermal fields, R&D is needed to create a bridge to significant new capacity Furthermore, a future based on only exploiting hydrother- mal resources has its pitfalls. The in- dustry is down to less than six play- ers from 10 in 1984. One positive consequence of the consolidation is that the remaining firms have a larger capital base, a boon for com- peting in foreign markets. A worst- case scenario would see little or intermittent growth due to geother- mal's inability to compete on a cost basis with other energy sources or due to its failure to attract financing for new geothermal fields.
C. The Photovoltaic Industry
PVs are a $500 million global in- dustry dominated by the U.S., Ja- pan and a few European coun- tries. 26 Large corporate giants like Texas Instruments, Siemens, Canon, Mobil, Amoco and many others are jockeying for position, not only with each other, but with a host of small, well-funded en- trepreneurial firms with strong R&D bases. Five manufacturers-- Siemens Solar (a U.S. subsidiary of German giant Siemens), So- larex (a privately held U.S. corn-
pany), Sanyo (Japan), Kyocera (Ja- pan) and Kaneka (Japan)--ac- counted for 55.3 MW in 1991, more than half of the world's ship- ments. In the U.S., Siemens Solar and Solarex accounted for 85 per- cent of U.S. shipments. Although output has doubled since 1985, and the annual growth rate is around 20 percent, all but a few firms are sustaining substantial losses. The reason for these losses is the enormous investment in R&D being made by firms in the industry coupled with intense price competition.
Technology and innovation is the most dynamic aspect of this
industry. Different technology tracks compete for dominance of the industr)¢ as new records for ef- ficiency and manufacturing costs are frequently set. Both product and process R&D are crucial to in- dustry development. The two pri-
mary technology paths are thin- film silicons and the more weU-
established crystalline and poly- crystalline silicons. The technol- ogy demands such intensive lev- els of R&D that players must commit to one, or at the most two, technologies. Despite this, over $2 billion has been invested by the private sector since the 1970s, a clear indicator that high returns are expected eventually to pay
back costs. In any case, companies must decide how to allocate re- sources between basic R&D and process technology development. The continuing challenge is how to finance both the expensive R&D and the capital-intensive plant and equipment needed to
stay competitive.
M 'odules are bought and
.sold based on their rated generating capacity, no matter what technology is used. With lit- tle quality differentiation, new market development and competi- tion among manufacturers is based primarily on price. This in- tense price competition, along with the large investments in R&D, has resulted in frequent con- solidation, exits, entrances and di- vestment as companies compete for niches, market share and tech- nological superiority
In Table 3 one can see that PVs enjoy wider market applications than other RETs. The three major
20 The Electricity Journal

segments are consumer products,
remote power and bulk power generation. Consumer applica- tions, growing at about five MW annuall3¢ covers everything from calculators and watches to larger systems, such as batteries and lighting. Remote power currently stands as the largest commercial segment. This market includes
stand-alone applications for tele- communications, water pumping, security systems, navigation aids, highway lighting and call boxes, and village power for vital refrig- eration, communication and light- ing in developing nations. Al- though fragmented, it holds enormous potential, with an esti- mated five million needy villages worldwide.
If the geothermal resource is the
"hulk" of the renewable industry, then surely photovoltaics are the "lean machines." Modular, light- weight, and portable, PVs lend themselves easily to both large- and small-scale (even minute) ap- plications. Unlike some RETs, they require no other fuel or water, and can eliminate the need for transmission lines27---a de-
cided competitive advantage. They have proven to be a reliable power source for numerous con- sumer, space and military uses. The downside is that PVs are still very expensive: about $0.25- 0.40/kWh.
In the industrialized world, the pot-of-gold market is bulk power. Utilities have taken a decided in-
terest in PVs' potential for on-and- off-grid applications to reduce heavy peak loads, avoiding the need for costly investment in new plant construction or transmis- sion line upgrades. This could en- tail small-system installations for residential and commercial build- ings, or end-of-the-line small power stations. The latter is the most likely entrance into the util- ity market for PVs.
The U.S. was once the undis- puted R&D and manufacturing leader of the industry, with enor- mous investments in crystalline silicon technolobD,. However, it has seen its market share slip from 65 percent to 33 percent in the past 10 years. Much of this slippage has been due to the lack
Table 3: Characteristics of U.S. Renewables Industries
Technology Operational Factors a Current Markets ~ Entry Barriers Concentration
Biomass • Municipalities Low • Commercial/Industrial • Utility • International
(Mostly equip/system sales)
Geothermal . High reliability • Utilities Med-High • Very limited location • Municipalities • Little to no modularity • Some environmental impact
Photovoltaics • Med-high reliability • Commercial/Industrial High (intermittent resource) • Utilities (remote/off-grid)
• Unlimited location • Residential • High modularity • Satellite
• International
• Med-high reliability • Unlimited location • Highly modular • Supply volume unpredictable
Many players (several major players, many viable smaller companies)
Highly concentrated (6 major players, 2 dominant)
Many players (a few major players, many viable smaller companies)
Solar Thermal • Meal-high reliability . Commercial/Industrial Med-High (High-Temp) (intermittent resource) . International
• Unlimited location • Meal-high modularity
Wind • Med-high reliability • Utilities Med (intermittent resource) • Local governmentJMunicipalities
• Somewhat limited location • International • Med-high modularity • Small-scale agric./Commercial
Industry in stasis (only major player is in Chapter 11; 1 or 2 small players remain)
Extremely concentrated (3 main players, 1 dominant)
a Supply Factors: In this table, reliability descri~es the degree to which the generating capacity of the resource is constant and assured. Winds, sunlight and water levels shift seasonally and with climatic changes. Location refers to the degree of geographic dispersion and rnodubrity refers to the degree of flexibir4ty in application size
b. Markets: Listings are given in very approximate uder of emphasis, and should not be construed as a "ranked" list. "Utilities" refers to investo¢ awned utilities; =municipalities" to non-investor- owned utilities. "Commercial,,industria~nstitutionar generally refers to off-grid, non-residential appications
March 1995 21
of domestic governmental sup- port given to the industry. Over the past 25 years, the U.S. govern- ment has invested close to $1 bil- lion in PV R&D and demonstra- tion projects. 28 Unfortunatel}¢ support for PVs has dropped by 75 percent since 1980, down to an annual average of $40 million. In notable contrast, both the Japa- nese and German governments have been aggressive in their en- couragement of domestic PV mar- kets. In the late 1980s, Germany's PV budget was 65 percent greater than that of the U.S., while Ja- pan's was 40 percent greater. Cur- rently, the U.S. shares the world- wide market almost equally with Japan and a few European firms. There is some fear in the domestic industry that government cut- backs in R&D funding, the for- eign acquisition of major U.S. players and a traditional empha- sis on short-term profitability could stem private investment, leaving the market wide open to foreign competitors.
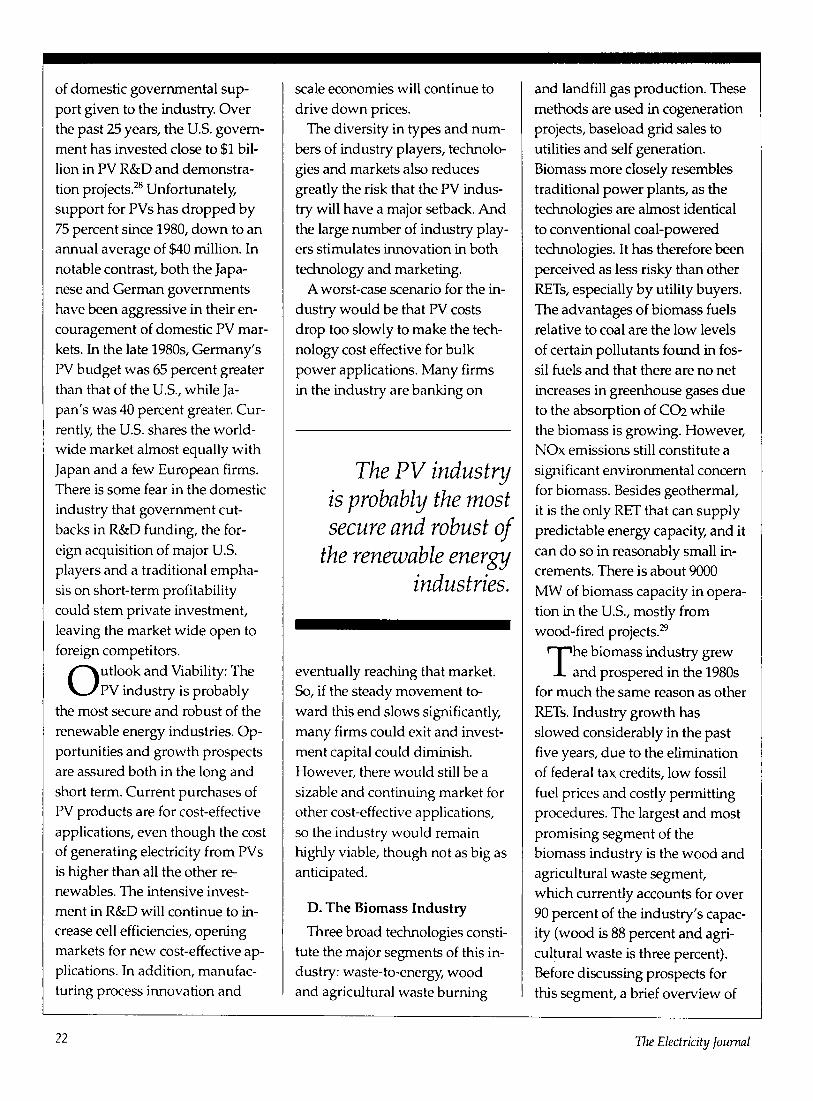
O utlook and Viability: The PV industry is probably
the most secure and robust of the renewable energy industries. Op- portunities and growth prospects are assured both in the long and short term. Current purchases of PV products are for cost-effective applications, even though the cost of generating electricity from PVs is higher than all the other re- newables. The intensive invest- ment in R&D will continue to in- crease cell efficiencies, opening markets for new cost-effective ap- plications. In addition, manufac- turing process innovation and
scale economies will continue to drive down prices.
The diversity in types and num- bers of industry players, technolo- gies and markets also reduces greatly the risk that the PV indus- try will have a major setback. And the large number of industry play- ers stimulates innovation in both technology and marketing.
A worst-case scenario for the in- dustry would be that PV costs drop too slowly to make the tech- nology cost effective for bulk power applications. Many firms in the industry are banking on
The PV industry is probably the most secure and robust of
the renewable energy industries.
eventually reaching that market. So, if the steady movement to- ward this end slows significantly, many firms could exit and invest- ment capital could diminish. However, there would still be a sizable and continuing market for other cost-effective applications, so the industry would remain highly viable, though not as big as anticipated.
D. The Biomass Industry
Three broad technologies consti- tute the major segments of this in- dustry: waste-to-energy, wood and agricultural waste burning
and landfill gas production. These methods are used in cogeneration projects, baseload grid sales to utilities and self generation. Biomass more closely resembles traditional power plants, as the technologies are almost identical to conventional coal-powered technologies. It has therefore been perceived as less risky than other RETs, especially by utility buyers. The advantages of biomass fuels relative to coal are the low levels of certain pollutants found in fos- sil fuels and that there are no net increases in greenhouse gases due to the absorption of CO2 while the biomass is growing. However, NOx emissions still constitute a significant environmental concern for biomass. Besides geothermal, it is the only RET that can supply predictable energy capaci~, and it can do so in reasonably small in- crements. There is about 9000 MW of biomass capacity in opera- tion in the U.S., mostly from wood-fired projects. 29
T he biomass industry grew
and prospered in the 1980s for much the same reason as other
RETs. Industry growth has slowed considerably in the past five years, due to the elimination of federal tax credits, low fossil fuel prices and costly permitting procedures. The largest and most promising segment of the biomass industry is the wood and agricultural waste segment, which currently accounts for over 90 percent of the industry's capac- ity (wood is 88 percent and agri- cultural waste is three percent). Before discussing prospects for this segment, a brief overview of
22 The Electricity Journal

the waste-to-energy and landfill gas segments is called for.
Waste-to-energy projects gener- ate electricity through the incin- eration of municipal solid waste (MSW) and refuse-derived fuel (RDF). A maturing industry, biomass was one of the fastest growing of the RETs, proving it- self a practical option in the face of diminishing landfill capacity. Most players operate as devel- oper/vendors. Competition in this segment is very high. A rela- tively small pool of municipal contracts is the chief source of business, garnered through stiff bidding and negotiation. How- ever, environmental concerns have put pressure on this seg- ment. Compliance with more stringent air and water quality standards has increased project costs. Citizen opposition to incin- eration plants is also high; the not- in-my-backyard syndrome has been effective in canceling or de- laying projects, mostly on environ- mental grounds.
W hile costs may be in a state of flux, supply is un-
certain as well. The current em- phasis on resource recycling and source reduction--with goals as high as 50 percent of the waste stream in some states--could re- duce fuel for waste-to-energy plants, or lessen the quality and hence the burning efficiency of the fuel. Most industry observers believe that even with recycling there will be more waste than can be handled by landfills.
Despite the seeming obstacles, growth will continue in the waste- to-energy segment, driven by the
mounting garbage crisis in the U.S. While this industry segment contributes to the renewables mix,
its size will always be limited by the pool of contracts and the size of the solid waste stream. The seg- ment's competitive advantage may in fact be that it can be both an electricity-generating alterna- tive and a waste-management al- ternative a benefit no other RET can claim. Existing players, espe- cially large companies, are likely to do well. The odds of survival will be increased if developers can integrate resource recycling into their projects, which may
Despite the seeming obstacles, growth will continue in the waste- to-energy segment.
lead to further consolidations and mergers or joint ventures.
Landfill gas is one of the most cost-effective RETs. It is relatively easy to site, since dumps already exist, and it has tremendous envi- ronmental advantages as a green- house gas control technology. The primary disadvantage is that pro- duction is significantly limited, based on the size and number of sites available. The landfill gas segment of the biomass industry is concentrated geographically and competitively. Of the over 200 MW of generating capacity, al- most half comes from projects in
California. There are about seven major players, with one dominant company: Waste Management. Most are engaged in some other segment of waste services.
Wood and agricultural waste is the largest segment of the biomass industry, comprised of approximately 1000 wood-fired plants, of which only a third offer electricity for sale. The remainder are owned and operated by the paper and wood products indus- try for self generation of electric- ity and process heat. Most of these installations are in the 5-20 MW range.
T he competitors in this indus- try, unlike the other renew-
able industries, are not dedicated solely to biomass. The IPPs, engi- neering and construction (E&C) firms and utilities that participate in this industry are primarily in the business of designing and building fossil-fueled generation plants. However, because of simi- larities in the power-generation technologies, these designs can be straightforwardly adapted to biomass. As a result, exit costs are low in the biomass segment, which may lessen the determina- tion and risk taking of the indus- try players compared to other re- newable industries.
A major problem limiting indus- try growth rates as well as its ulti- mate size is fuel supply uncer- tainty. The opportunities to develop long-term fuel contracts for project financing have been de- creasing as the best supply sources have already been locked in. As a result, the ultimate growth potential in biomass is
March 1995 23

considered to be the development of dedicated feedstock supply sys- tems (DFSS), wherein acreage near the plant would be dedicated to farming rapid growth feed- stocks to supply the facility. Dem- onstration of the DFSS approach is a major thrust of DOE's biomass program strategy. In ad- dition, EPAct offers a 1.5c/kWh tax credit for "closed loop" biomass, which increases the in- centive to develop DFSS. 3°
Other technological issues for the industry involve piggy-back- ing onto technology develop- ments in generation for coal and natural gas. This will require the development of technology to convert biomass materials into gas or liquid fuels. These techno- logical advances could increase ef- ficiency so significantly that twice as much electricity could be gener- ated from the same biomass fuel stream.
O utlook and Viability: The biomass industry is very
likely to grow significantly It is al- ready the largest of the renewable industries, and as a baseload sup- plier of electricity with a conven- tional, utility-accepted generation technology, it is extremely attrac- tive to utilities. Growth will be fu- eled by (1) biomass' ability to compete effectively in bidding situations, especially against other renewables; (2) expected signifi- cant increases in efficiency due to new generation technologies; and particularly (3) development of dedicated feedstock supply sys- tems. At the same time, environ- mental concerns may somewhat dampen growth prospects. A sig-
nificant number of firms (IPPs, utilities and E&C firms) with ex- perience in biomass are prepared to facilitate and take advantage of these opportunities. Ultimately, high rates of growth are depend- ent on the development of DFSS.
E. The Solar Thermal Industry
High temperature (HT) 31 solar
thermal concentrating systems-- parabolic troughs, central receiv- ers and parabolic dishes enjoy many of the advantages of other renewables. They have minimal impacts, few emissions and use a free fuel source that needs no
processing. Short construction lead times give them an addi- tional advantage over alterna- tives. Troughs and dishes are par- ticularly well suited to producing the high-level heat and electricity requirements of industrial applica- tions. However, troughs and cen- tral receivers require large sizes to achieve cost economies.
As of this writing, over 380 MW of capacity is in operation world- wide, almost all of it in California. The company responsible for de- veloping most of that capacity-- Luz International--has gone bankrupt. There is only one com- pany still actively involved as a
commercial developer: Industrial Solar Technologies. Unlike Luz, this small, privately held com- pany is focused on industrial heat applications rather than utility
grid applications. Most other play- ers have either exited totally or are involved with other projects, waiting to see if a viable market ever evolves.
T roughs are the only com- mercialized solar thermal
technology, and Luz was the only company building power plants to supply grid-connected electric- ity. Luz put nine plants into opera- tion over a period of less than five years. They account for over 95 percent of worldwide solar ther- mal power. Three factors contrib- uted to its success: tax credits, a quick move up the experience curve, and the ability to provide peak power. Twenty-five percent federal tax credits, matched by the state, allowed the company to se- cure both a market and financing for its admittedly high initial-cost projects. Yet with each successive
plant, Luz was able to reduce costs and improve performance significantly. Its first SEG plant had an installed cost of $5979/kW, compared with $3011 for SEG IX-- a drop of almost 50 percent. In ad- dition, by using natural gas to supplement 25 percent of generat-
ing capacity (the maximum al- lowed QFs under PURPA), the company was able to tailor plant output to meet utility peaking re- quirements, the time when needs are greatest and payment reve- nues the highest) z
That such a seemingly success- ful company as LUZ should go
24 Tile Electricity Journal

bankrupt, when it has a virtual
monopoly on the market, illus-
trates one of the chief barriers for
solar energy developers: a lack of tax equalization. Under most state
tax codes, solar plants face much heavier tax burdens than conven-
tional plants because their fuel
supply and sourcing are one and
the same. Under most state tax
codes, solar collectors are consid-
ered capital equipment with the solar field representing real prop-
erty. The plant thus incurs both a recurring property-tax liability,
and sales taxes on the purchase of equipment for plant construction.
In contrast, as conventional fuel
plants buy their fuel directly, and
own no equipment to create the
plant's fuel, there are neither prop-
erty taxes nor sales taxes at the
time a plant is built. The effect of
this inequity can be staggering: "Solar plants can pay out more
than four times the level of taxes
paid by a comparably sized gas-
fired plant," according to Dave
Menicucci of Sandia National Labs.3 ,~
L uz relied heavily on tax
credits and property-tax
exemptions to reduce upfront
costs and to attract capital. In
1989, when Luz was about to be-
gin construction on its ninth plant, Congress extended tax cred-
its for just nine months rather
than imposing the annual expira-
tions that had been the norm
since 1985. Luz, granted a con- struction permit in February 1990,
shortened its planned construc-
tion period to seven months in or-
der to meet the deadline. The cost
of doing this consumed the re-
maining net worth of the com-
pany, putting it in severe financial
shape by 1991. Delays in state
property-tax exemptions, along with further declines in energy
prices and a soft energy invest- ment equity market, added to con-
stmction risk for its planned tenth
plant. Faced with higher costs, a
weak financial state, and the un-
certainty of continued tax credits,
Luz was unable to secure con- struction funding. Investors with-
drew, and the company went bankrupt soon after. 34
While the solar plants built by
Luz are still operating, learning
i i
and innovation due to industry in-
itiatives and experimentation has come to a virtual standstill in so-
lar thermal troughs. The only ex-
ception is that Industrial Solar
Technologies has managed to de-
velop a fairly steady business sup-
plying trough systems to prisons and hospitals.
There is, however, significant RD&D activity in both dish and
central receiver technologies. Dishes in conjunction with Stir- ling engines have high efficien-
cies, excellent modularity and sit-
ing flexibility. These dish/Stirling
systems have potential to pene-
trate off-grid niche markets do-
mestically and especially in inter-
national markets. Cummins
Power Generation is cost sharing
RD&D associated with 5 kW dish/Stifling systems with the
U.S. Office of Solar Energy Con- version (OSEC). This is a long-
term effort that could lead to com-
mercialization of dish/Stirling
systems.
C entral receivers have poten-
tial in large-scale utility ap- plications. Through a project
called Solar II (essentially a retro- fit of Solar I, a project plant that
was closed in 1988), researchers
expect to overcome earlier effi-
ciency and capacity problems. In
addition, Solar II will use molten
salt to store the thermal energy in
order to provide a high degree of
dispatchability. The $50 million project is led by a consortium of
utilities (each of which paid $100,000 to participate) and the
federal government. At $50 mil- lion (or $5000 per kW) the price
tag is still too steep for commer-
cialization. Until further R&D is
completed, it is difficult to gauge where new commercial opportu-
nities will emerge. The OSEC is
targeting construction of one com-
mercial size 100 MW central re-
ceiver plant per year beginning in
1998, following successful opera- tion of the smaller-scale (10 MW)
Solar II demonstration project. Outlook and Viability: The near-
term forecast for this industry is
bleak. Entrance barriers are exces- sive; high capital costs and the ab-
sence of markets provide little in-
centive for private investment or
entry. What little commercial op-
portunity exists for medium-high
March 1995 25
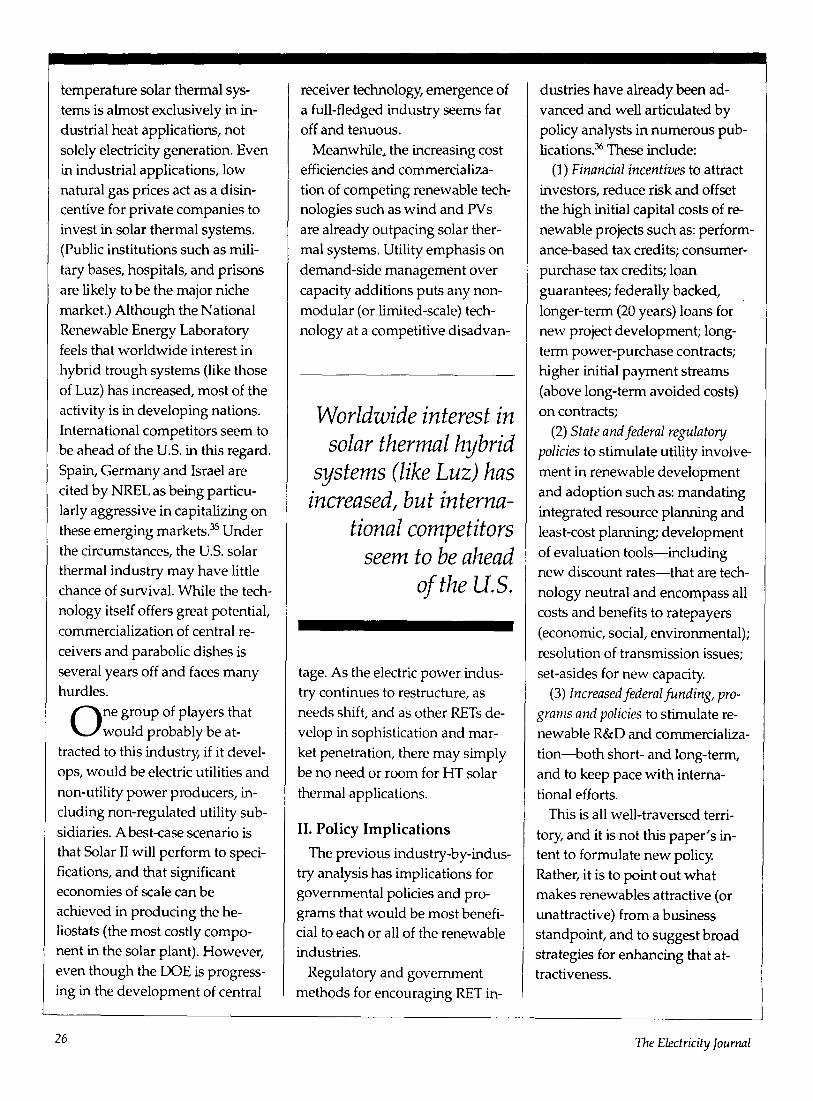
temperature solar thermal sys- tems is almost exclusively in in- dustrial heat applications, not solely electricity generation. Even in industrial applications, low natural gas prices act as a disin- centive for private companies to invest in solar thermal systems. (Public institutions such as mili- tary bases, hospitals, and prisons are likely to be the major niche market.) Although the National Renewable Energy Laboratory feels that worldwide interest in hybrid trough systems (like those of Luz) has increased, most of the activity is in developing nations. International competitors seem to be ahead of the U.S. in this regard. Spain, Germany and Israel are cited by NREL as being particu- larly aggressive in capitalizing on these emerging markets. 3s Under the circumstances, the U.S. solar thermal industry may have little chance of survival. While the tech- nology itself offers great potential, commercialization of central re- ceivers and parabolic dishes is several years off and faces many hurdles.
O ne group of players that would probably be at-
tracted to this industr)~ if it devel- ops, would be electric utilities and non-utility power producers, in- cluding non-regulated utility sub- sidiaries. A best-case scenario is that Solar II will perform to speci- fications, and that significant economies of scale can be achieved in producing the he- liostats (the most costly compo- nent in the solar plant). However, even though the DOE is progress- ing in the development of central
receiver technology, emergence of a full-fledged industry seems far off and tenuous.
Meanwhile, the increasing cost efficiencies and commercializa- tion of competing renewable tech- nologies such as wind and PVs are already outpacing solar ther- mal systems. Utility emphasis on demand-side management over capacity additions puts any non- modular (or limited-scale) tech- nology at a competitive disadvan-
Worldwide interest in solar thermal hybrid
systems (like Luz) has increased, but interna-
tional competitors seem to be ahead
of the U.S.
tage. As the electric power indus- try continues to restructure, as needs shift, and as other RETs de- velop in sophistication and mar- ket penetration, there may simply be no need or room for HT solar thermal applications.
II. Policy Impl ica t ions
The previous industry-by-indus- try analysis has implications for governmental policies and pro- grams that would be most benefi- cial to each or all of the renewable industries.
Regulatory and government methods for encouraging RET in-
dustries have already been ad- vanced and well articulated by policy analysts in numerous pub- lications. 36 These include:
(1) Financial incentives to attract investors, reduce risk and offset the high initial capital costs of re- newable projects such as: perform- ance-based tax credits; consumer- purchase tax credits; loan guarantees; federally backed, longer-term (20 years) loans for new project development; long- term power-purchase contracts; higher initial payment streams (above long-term avoided costs) on contracts;
(2) State and federal regulatory policies to stimulate utility involve- ment in renewable development and adoption such as: mandating integrated resource planning and least-cost planning; development of evaluation tools--including new discount rates--that are tech- nology neutral and encompass all costs and benefits to ratepayers (economic, social, environmental); resolution of transmission issues; set-asides for new capacity.
(3) Increased federal funding, pro- grams and policies to stimulate re- newable R&D and commercializa- t i on -bo th short- and long-term, and to keep pace with interna- tional efforts.
This is all well-traversed terri- tory, and it is not this paper's in- tent to formulate new policy. Rather, it is to point out what makes renewables attractive (or unattractive) from a business standpoint, and to suggest broad strategies for enhancing that at- tractiveness.
26 The Electricity Journal

One final caveat, however, has to do with distinguishing be- tween policy initiatives charac- terized as "technology push" as opposed to "market pull." Tech- nology push initiatives are in- tended to speed up the research, development and demonstration of technologies as their cost and performance effectiveness in- creases. Market pull initiatives are designed to create market incen- tives (reducing buyers' costs and barriers) to induce customers and energy suppliers to select re- newables. 37 During the 1970s and
1980s, the government empha- sized technology push. In the 1990s we are witnessing an in- crease in emphasis on market pull. This new direction in policy emphasis is consistent with the conclusions reached below. While there are still significant gains to be made through technok)gy de-
plicit recognition of externalities would add 4-8c/kWh to the cost of electricity generated by fossil fuels.BSIf his estimates are valid, many renewables would not only be competitive with fossil fuels, they would be the low-cost gen- eration option.
Externalities are only one of a host of factors that create an in- equitable situation for renewables. These factors have all been cov- ered extensively in other litera- ture. Hamrin and Rader's work,
Policy and regulatory alternatives to pure market forces are necessary until the ptayingdqetd can be
tralized generation in a distrib- uted utility system, the reduction of pollutants from the existing generation base, considerations of risk associated with changes in en- vironmental regulation, and so on. 4° As a result, we need policies
that encourage or require states to (1) adopt integrated resource plan- ning approaches (which give ex- plicit consideration to a wide range of benefits associated with each generation technology) and (2) modify resource acquisition procedures (such as contract fea- tures) that will treat renewables equitably.
In the absence of a level playing field, subsidies, set-asides, tax and production incentives, etc. can be used to acknowledge the value of renewables. These policy and regulatory alternatives to pure market forces are necessary until the playing field can be leveled.
velopment, the renewables indus- tries are also in need of initiatives outside the technology arena, that will sustain and enhance their vi-
leveled. The problem is that they create the impression that renewables are not capable of standing on their own two feet, driving away
abilit): Federal and state programs and
regulations that create a level
playing field relative to fossil fu- els will benefit all renewables in- dustries.
The pricing of fossil fuels does not currently recognize the envi- ronmental costs absorbed by soci- ety in the form of air pollution, greenhouse gases, acid rain, etc. Failure to explicitly acknowledge these external costs deprives re- newables of any advantage attrib- utable to their relatively benign environmental impacts. Hohmeyer has estimated that ex-
especiall~ provides an in-depth analysis of these issues. 39 For ex-
ample, institutional resistance within the utility planning and de- cision-making process fails to value renewables fairly; there are organizational and cultural biases that favor fossil fuels due to deci- sion makers' familiarity with tech- nologies and established relation- ships with their associated industries. Even the planning tools that are used to evaluate the relative benefits of various genera- tion resources are biased toward fossil fuels, because they often fail to recognize the benefits of decen-
investors and increasing risk for industry players. This points to an important consideration in the de- sign of these regulatory and pol- icy actions. They need to do more than create short-term opportuni- ties for the industries: They must be designed to ensure long-term benefits to mitigate risks for finan- cial institutions, investors and firms in the industry.
Locational constraints imply that certain states can play a critical role in the development of specific renewable industries.
Geothermal's potential is pri- marily in a half-dozen western
MaKh1995 27
states. Wind has potential in many states, but some are signifi- cantly more endowed with wind resources than others. DFSS has greater potential in certain agricul- tural states economically suitable for growing dedicated biomass crops. When and if these states have needs for capacity additions, they can pay particular attention to the long-term benefits of those renewable resources to ensure they receive an equitable opportu- nity to compete for those capacity additions. The federal govern- ment can tailor its programs in the form of joint ventures, demon- stration projects, etc., to facilitate development in those states.
The federal government can sup- port and catalyze the exporting of renewables and the development of inter~la tionat markets.
U.S. international competitive- ness is at stake in many re- newables industries. As can be seen in Table 3, all of the renew- able industries have international market opportunities. Interna- tional competitiveness provides additional sources of revenues and profits for renewables firms, moving firms up the experience curve while potentially enhancing scale economies. International markets also diversify market risk. These factors contribute to in- creasing industry viability, as well as creating jobs domestically and favorably impacting the balance of payments.
Renewables industries are in- creasingly facing global competi- tors. Photovoltaics and wind are already global industries. Geother- mal and biomass are becoming in-
temational in scope. The global players in these industries are looking to U.S. markets for oppor- tunities. U.S. firms may have to develop global strategies to de- fend themselves and remain vi- able. In some cases, such as PV and parabolic dishes, niche mar- kets need to be developed. In oth- ers, such as wind, biomass and geothermal, large contracts for grid-connected power are at stake. Each industry has specific export strategy needs that must be taken into account. 41
~ . k ,'c,
.': i~'~.; ,~ i
DOE has recognized the impor- tance of international markets for
renewables. The Export Council for Renewable Energy, jointly funded by DOE and the Agency for International Development, represents all of the domestic re- newables industries in attempting to open up international markets in developing countries. Also, DOE has been supporting Project FINESSE (Financing Energy Serv- ices for Small Scale Energy Uses), which has catalyzed activities in support of accelerating adoption of renewables and energy effi- ciency in the developing world. However, the proportion of DOE funds going to international pro-
jects is very small. 42 These types of programs would benefit from significant increases in support.
To increase the likelihood that each renewable industry will play an important role in the nation's energy mix, one objective should be to tailor each renewable indus- try's policies to enhance its long- term attractiveness.
All the renewables industries have the potential to be attractive in the long term. However, we have seen that there are signifi- cant differences in attractiveness across the renewables industries, and the viability of a few of the re- newables industries is at risk. In- dustries deemed unattractive will not be ready to assume a signifi- cant role in our nation's energy fu- ture. Therefore, policy initiatives must be tailored to fit each indus- try. A discussion of specific policy implications for each renewable energy industry follows.
III. Remedia l Act ion
A. Wind
Wind can now compete head to head with natural gas in many
bidding situations. Many new contracts for wind have already been signed and others are in the works. Because of technology gains in wind, along with Energy Policy Act production credits for wind, the wind industry is well situated. Long-term attractiveness can be accelerated by increasing the extent to which states explic-
itly acknowledge the environ- mental benefits of wind and by fostering set-asides that ensure that the flow of contracts remains
28 The Electricity Journal

steady over time. In states where
set-asides are currently unlikely, initiatives that foster demonstra- tion projects would be a precursor to utility adoption. The rate of adoption and the growth of wind power can be expected to acceler- ate as a wider base of users gains experience with the technology.
Also, in order to reduce the risk associated with the industry be- ing dependent on one major firm, the federal government should continue to fund and perhaps in- crease its R&D support for other wind firms.
B. Geothermal
Keeping a strong base of indus- try players will require a steady flow of new contracts. The indus- try will continue to need tax subsi- dies (e.g., energy tax credits, de- preciation adjustments) to lower its capital costs. Support for re- source validation and assistance in resolving siting issues will also be helpful. However, in the short term, the key to maintaining in- dustry attractiveness will be through set-asides favorable to or specifically for geothermal. While geothermal firms probably will be able to garner a number of con- tracts through competitive bid- ding over the next five to seven years, these additional set-asides are necessary to level out and as- sure a steady flow of contracts.
If geothermal is to play a major role in the domestic renewables mix, the federal government may have to review its decision to cut back support of HDR research.
C. Photovoltaic
The primary role the govern- ment can play in the PV industry is to stimulate its markets. On the technology side, the federal gov- ernment has been extremely sup- portive of basic R&D. It has also recognized the importance of funding programs to improve manufacturing process efficiency, through its PVMAT (Photovol- taics Manufacturing Technology Initiative) program. The major log- jam for the industry, however, has
been on the market development side. There are an enormous num-
ber of cost effective applications for PVs in which buyers are not fully aware of the PV option or are reluctant adopters. These op- portunities are both domestic and international. The federal govern-
ment has begun, over the past few years, to address this issue through more intensive market conditioning programs. The role of DOE's Office of Solar Energy Conversion's (OSEC) is "to serve as a facilitator in breaking down barriers and bringing together producers and users in order to accelerate market penetration of solar electric technologies ''4~ (PV,
biomass and solar thermal). OSEC explicitly recognizes that the success of the U.S. solar indus- try depends on the private sec- tor's ability to compete with global competition. Also, through its support of PVUSA (Photovol- taics for Utility Scale Application), the DOE is fostering PV penetra- tion of the utility market. At the state level, utility regulators can encourage and provide incentives to their respective utilities to be- gin to use small- scale, cost-effec- tive PV applications within their systems.
Because the DOE has a strategy for PVs that seems to address the industry's needs, the only recom- mendation comes in terms of the level of support being provided to both R&D and market stimula- tion. The U.S. is falling behind
Germany's and Japan's funding levels at a time when firms are es- tablishing global strategic posi- tions and dominance. If the U.S. industry is to remain internation- ally competitive, and if PVs are to reach the point where they can play a significant role in the bulk
power market in a reasonable pe- riod of time, increased govern- ment funding seems critical to keep pace with foreign competi- tors.
D. Biomass
The biomass industry's attrac- tiveness will increase dramatically if the DFSS concept can be effec- tively demonstrated. Fuel-supply and fuel-cost risks would be sig- nificantly reduced, opening the potential for high rates of growth. Effective demonstration of DFSS
March 1995 29
might also bring in more commit-
ted players who are willing to in-
tegrate backward into fuel supply.
The DFSS program will be
spurred by the EPAct's 1 .5c/kWh
tax credit for "closed-loop"
biomass power systems. In addi-
tion, the DOE's Biomass Power
Program has developed a focused
effort to accelerate the develop-
ment of DFSS, working closely
with the financing communi t~ de-
velopers, utilities and the agricul-
tural industries. DOE efforts and
federal legislation in support of
DFSS seem appropriately targeted
to enhance the attractiveness of
the biomass industry. Support for R&D to facilitate
technology transfer from new fos-
sil-fuel generating technologies
and the concomitant develop-
ment of gas/ l iquid biomass fuels
will also improve industry attrac- tiveness if efficiencies can increase
to the extent projected.
E. Solar Thermal
Increasing the attractiveness of
the HT solar thermal industry is a
long-term and uncertain under-
taking. One avenue is through
programs that hasten the develop-
ment of the niche market for
dish/Stirling units in interna-
tional markets. As this technology
becomes a cost-effective alterna-
tive to gas and diesel generators, growth will occur. However, this
is a relatively small opportuni ty
and it would do little to enhance
the use of solar thermal for elec-
tricity generation in the U.S.
The other possibility for recreat-
ing the industry is the commer-
cialization of central receivers.
DOE has an appropriate program
plan in this arena, but there are major quest.ions regarding its out-
come. Solar II must first prove
that the technology is feasible at
projected cost levels. Secondly,
production must be commercial-
ized and proven to be cost effec-
tive: In particular, anticipated
economies of scale in heliostats
will have to be realized.
IV. C o n c l u s i o n
By rights, renewable energy in-
dustries in this country should be
'/
on their last legs. After 12 years of
having renewables program
budgets cut by the administra-
tions of Presidents Reagan and
Bush, with low oil and gas prices
and a general lack of interest by
most utilities in the benefits of re-
newables, how could these indus-
tries survive? Well, except for one
short-term casualty, these indus- tries have developed relatively re-
silient and adaptive industry
structures that are testimony to
the entrepreneurship and vi-
brancy of our competitive system.
However, their adaptability
serves only to maintain them in a
marginal survival mode.
Industry players and potential
investors will not aggressively in- novate and invest unless they per-
ceive the industry to be attractive
over a reasonable period of time.
Without this entrepreneurial
thrust, in the absence of a level
playing field and with the contin-
ued institutional barriers, the driv-
ing force behind the industry will
stagnate or be lost. We cannot af-
ford to let this happen. Jobs, en- ergy security, our natural environ-
ment, and our international
competitiveness are all at stake.
Appropriate interventions must
be made to enhance the long-term
attractiveness of each of these re- newable energy industries. •
Endnotes:
1. See Donald W. Aitkin, Sustained Or- derly Development of the Solar Electric Technologies, SOLAR TODAY, May/June 1992, at 20 and J. HAMRIN AND N. RADER, INVESTING IN THE FUTURE, A REGULATORS"
GUIDE TO RENEWABLES 104 (Nat'l Ass'n of Reg. Utility Comm'rs, Feb. 1993).
2. OFFICE OF SOLAR ENERGY CONVERSION,
SOLAR 2000: A COLLABORATIVE STRATEGY,
Vol. I, at 14 (U.S. Department of En- ergy, Feb. 1992).
3. Michael Lotker, Barriers to Commer- cialization of Large-Scale Electricity: Lessons Learned from the Luz Experi- ence, Sandia National Laboratory, Nov. 1991.
4. Because of space limitations, the hy- dro industry is not addressed in this paper. As a mature technology, well ac- cepted by the utility industry, there is a willing and capable hydro industry. However, the industry's viability hinges primarily on domestic environ- mental regulatory policy, which has imposed significant constraints on growth. It seems unlikely that these constraints will diminish, ultimately limiting the additional contribution made by hydro to the domestic energy
30 The Electricity Journal
mix. Note also that this article focuses solely on renewable energy as it per- tains to electricity generation.
5. Photovoltaics are still much higher.
6. M. BROWER, COOl, ENERGY (MIT Press, 1992).
7. Under Federal Energy Regulatory Commission rules, a QF has a maxi- mum rated capacity of 30 MW, (80 MW for geothermal), derives at least 75 percent of its fuel from renewable sources, and has a maximum of 50 per- cent utility ownership.
8. The erosion of support for re- newables is discussed further in Blair Swezey, The Current Status of Renew- able Electric Generation in the U.S.: Deployment, Economics and Policies (Sept. 13-16,1992) (paper presented at NARUC-DOE Fourth National Inte- grated Resource Planning Conference).
9. A major criticism of DOE funding during the 1980s was that the majority of funds were earmarked for basic re- search rather than for commercial- scale demonstrat ion projects and market development. More recently, commercialization programs are being funded more aggressively.
10. SUSAN WII.I.IAMS AND KE'VIN PORTER,
POWF, R PLAYS: PROFILES OF AMERICA'S IN-
DEPENDENT RENEWABLE 1-21.ECTRICITY DE-
VE1,OPERS (Investor Responsibility Res. Center, Wash., D.C., 1989).
11. Seetaram Motupalli, Electric Utility Strategies amt the Emerging Industry Structure, ELEC. ]., Nov. 1991, at 26-29.
12. Kenetech does not sell its turbines to independent operators. Kenetech Windpower was known as U.S. Wind- power until 1994. The company went public in 1993.
13. Paul Gipe, The Shift in Windpower, INDEPt::NDENT ENERGY, Sept. 1992, at 99.
14. Nat'l Renewable Energy Labora- tory, The Potential of Renewable En- ergy (March 1990)(interlaboratory white paper).
15. Julie Ann Phillips, Wind Power's Coming of Age, ELEC. 1., April 1992, at 22-32.
16. ld.
17. William 1-4 Short, III, Geothermal Status Report, INDEI'ENDENT ENERGY, Oct. 1992, at 68-71.
18. ld.
19. Domenic J. Falcone and William P. Short, III, Living on the CLIFF: The Geo- therntal Industry Faces the End of the S04 Fixed Price Period, GEOTI.tERMA1. RE- SOURCES COUNCIL BULL.EI'IN, N o v . 1 9 9 2 ,
325-28.
20. Brower, supra, note 6.
21. Calipine and Biphase Sign Agreement for Joint Geothermal Development, INDE-
PENDENT POWER MARKETS Q . , 3d Q. 1992, at 9.
22. Brower, supra, note 6.
23. NORTHWEST ENERGY NEWS,
March/Apri l 1992.
24. Falcone and Short, supra note 19.
25. U.S. Department of Commerce, U.S. Industrial Outlook (1993).
26. Murray Silverman, The U.S. Photo- w~ltaic Industry (case study), to appear in A. T| tOMPSON AND A. STRICKLAND,
STI~,ATEGIC MANAGEMt-NT (7th ed., Sept., 1994).
27. John Thornton and Linda Brown, l~hotovoltaics: The Present Presages the Future, t-LEC. I., April 1992, at 34.
28. Silverman, supra note 26.
29. Donald L. Klass, The U.S. Biofuels Industry, Institute of Gas Technology, 1988.
30. The DOE projects the addition of 6000 MW of biomass capacity by 2000 and an additional 50,000 MW by 2010, which would mean that biomass could account for almost 10 percent of the U.S. electricity needs!
31. "High-temperature" is 600-1200 de- grees Fahrenheit.
32. Lotker, supra note 3.
33. D. Menicucci, The Economic Im- pact of Equalizing the Tax Burden on Today's Solar Thermal Energy Sys- tems (Oct. 6, 1992) (letter to New Mex- ico Conservation and Renewable Energy Task Force).
34. Lotker, supra note 3.
35. NREL, supra note 14.
36. Hamrin and Rader, supra note 1; Swezey, supra note 8; and op. cit. and Swezey, B., "The Current Status of Re- newable Electric Generation in the U.S.: Deployment, Economics and Poli- cies," NARUC-DOE Fourth National Inte- grated Resource Planning Conference, September 13-16, 1992, and B. SWEZEY AND K. SINCLAIR, STATUS REPORT ON RE-
NEWABI.E ENERGY IN THE STATES, (Nat'l Renewable Energy Laboratory, Dec. 1992).
37. NREL, supra note 14.
38. O. Hohmeyer, Renewables and the Full Costs of Energy, ENERGY POLICY, April, 1992.
39. See t-tamrin and Rader, supra note 1; T. Jackson, Renewable Energy: Sum- mary Paper for the Renewable Series, EN- FRGY POLICY, Sept., 1992, and E. Palola, Emerging Externalities, INDEPENDENT EN- IRGY, Feb. 1993.
40. Hamrin and Rader, supra note 1.
41. D. Rowland and M. Silverman, Analysis of Export Markets and Strate- ,gies for Photovoltmc Products: A U.S. Perspective, SF. STATE UNIVERSITY SCI1OOL OF BUSINESS JOURNAL, VOI. 5, n o .
1, 1994.
42. OFFICE OF SOLAR ENERGY CONVER-
SION, SOLAR 2000: A COLLABORATIVE STRAT-
EC;Y (u.s. DOt-, Feb., 1992).
43. Id.
March 1995 31