The Forensic Analysis of Adult Temporary Tattoos
89
City University of New York (CUNY) City University of New York (CUNY) CUNY Academic Works CUNY Academic Works Student Theses John Jay College of Criminal Justice Spring 6-2019 The Forensic Analysis of Adult Temporary Tattoos The Forensic Analysis of Adult Temporary Tattoos Paige Cooper CUNY John Jay College, [email protected] How does access to this work benefit you? Let us know! More information about this work at: https://academicworks.cuny.edu/jj_etds/112 Discover additional works at: https://academicworks.cuny.edu This work is made publicly available by the City University of New York (CUNY). Contact: [email protected]
-
Upload
khangminh22 -
Category
Documents
-
view
0 -
download
0
Transcript of The Forensic Analysis of Adult Temporary Tattoos

City University of New York (CUNY) City University of New York (CUNY)
CUNY Academic Works CUNY Academic Works
Student Theses John Jay College of Criminal Justice
Spring 6-2019
The Forensic Analysis of Adult Temporary Tattoos The Forensic Analysis of Adult Temporary Tattoos
Paige Cooper CUNY John Jay College, [email protected]
How does access to this work benefit you? Let us know!
More information about this work at: https://academicworks.cuny.edu/jj_etds/112
Discover additional works at: https://academicworks.cuny.edu
This work is made publicly available by the City University of New York (CUNY). Contact: [email protected]

The Forensic Analysis of Adult Temporary Tattoos
A Thesis Presented in Partial Fulfillment of the Requirements for the Degree of
Master of Science in Forensic Science
John Jay College of Criminal Justice
City University of New York
Paige Cooper
May 2019

The Forensic Analysis of Adult Temporary Tattoos
Paige Cooper
This thesis has been presented to and accepted by the office of Graduate Studies, John Jay College of
Criminal Justice in partial fulfillment of the requirements for the degree of Master of Science in
Forensic Science.
Thesis Committee
Thesis Advisor: Dr. Thomas A. Kubic
Second Reader: Dr. Michelle D. Miranda
Third Reader: Dr. John Lombardi

i
Abstract
Adult temporary tattoos have become more popular, yet there is very little research on
them, especially regarding their use in forensics. This poses a problem because forensic
investigators may not be able to distinguish a temporary tattoo from a real tattoo, possibly
hindering their investigation. In this study, various types of adult temporary tattoos were examined
and analyzed in attempts to identify and distinguish them, both from each other and from
permanent tattoos. Infrared spectroscopy, specifically attenuated total reflection (ATR), proved to
be more useful than ultra-violet visible light spectroscopy in terms of analyzing the samples. The
natural adult temporary tattoo samples, henna and jagua, were easily distinguished from each other
based on their ATR spectra. When analyzing the transferrable picture tattoo samples, it became
evident that the adhesives overwhelmed the sample, and that different brands used different
adhesives. The transferrable picture tattoos may also be distinguished from permanent tattoos
based on the presence of a printing pattern, which can be visualized with microscopy. This study
contributes to the field by yielding knowledge of adult temporary tattoos not previously known,
so that perhaps in the future the knowledge may be used to aid in casework.

ii
Acknowledgements
Dr. Miranda – Thank you for approaching me with this project and teaching me how to properly
conduct a research project. The lessons I have learned from the triumphs and (many) struggles
experienced due to this project will surely stick with me in the years to come.
Dr. Kubic – Thank you for always offering new insight and materials to put towards this research
every time I met with you, and for being patient even when I gave you good reasons to not be.
Dr. Reffner – Thank you for sharing your knowledge with me, and for trusting me to use your
instruments for my research.
Dr. Lombardi – Thank you for finding the time to review my work.
Dr. Prinz – Thank you for teaching me the proper thesis-writing techniques, and for being so
flexible and helpful.
Tiffany Millett, Argeliz Pomales, and Elliot Quinteros – Thank you for letting me run amok in
your labs, and for always helping me get any materials I needed.
To my friends, family, and boyfriend – Thank you for offering support when I wanted it, and for
shutting up when I told you not to ask about my progress.
To my colleagues, most notably Erika Bravo – Thank you for helping me come up with new
strategies and letting me pick your brain. I would not have graduated on time without you.
iii
Table of Contents
Abstract………………………………………………………………………………. i
Acknowledgements………………………………………………………………….. ii
Introduction………………………………………………………………………….. 1-8
Materials and Methods………………………………………………………………. 9-25
Results and Discussion ……………………………………………………………… 26-78
Conclusions………………………………………………………………………….. 79-80
References…………………………………………………………………………… 81-84

1
Introduction
Tattoos have long been a way for people to express themselves by marking their bodies
with images or words with ink that are meaningful to those people. Usually tattooing is permanent,
with the ink being injected into the second layer of skin called the dermis, and has only been
successfully removed by a laser breaking up the pigment. The inks used have ranged from
“carbonaceous materials and natural organic and inorganic pigments originating from vegetable
and mineral sources to synthetic organic pigments and colorants,” (Miranda, 2012, p. 16). The
permanence of tattoos is a concerning factor for many people, with tattooed individuals often
regretting their decision and possibly having to pay for multiple costly removal procedures.
Recently, individuals have been turning to temporary tattoos that can either be washed off or fade
away in a relatively short amount of time. Reasons for this may include wanting to test out a tattoo
design before getting the permanent version, wanting the temporary tattoo for a special occasion
like a music festival or party, or just because the individual does not want the full commitment of
a real tattoo. These ‘adult’ temporary tattoos have seen increased use in recent years, and are
available as pre-designed tattoos applied with transfer paper, or in the form of an ink bottle so the
design can be drawn on free-handedly.
The inks used for temporary tattoos may be either organic or inorganic. Popular examples
of organic tattoo inks include henna and jagua. Henna has been applied to skin for centuries, often
for religious ceremonies or special occasions in areas like Pakistan, India, Africa, and the Middle
East, but has recently become popular in Western culture due to it being temporary and able to be
hand-drawn on (Bhuiyan et al., 2017). Powdered leaves from the Lawsonia inermis plant contain
a molecule called lawsone, also known as 2-hydroxy-1, 4-naphthoquinone, the active ingredient

2
in henna. Once this molecule becomes oxidized, it exhibits the characteristic red-brown color of
henna dye. The transition from lawsone to its oxidized stage is seen in Figure 1.
Figure 1. Chemical structure of lawsone (Adapted from Bhuiyan et al., 2017).
Ensuring that the ingredients in temporary tattoos are safe is important because there have
been reported cases where the temporary tattoos have caused a severe allergic reaction. Natural
henna tattoos appear brownish-orange, but para-phenylenediamine (PPD) is a chemical used to
darken henna, making it appear black. PPD is a known toxin, and is in fact banned in Germany,
France, and Sweden (Chong et al., 2016). PPD begins as a white crystal, but then is oxidized to
red, brown, and finally black, and “has a strong protein binding capacity,” effectively binding it to
keratin in the skin (Chong et al., 2016, p. 1).
Figure 2. Chemical structure of para-phenylenediamine (Adapted from Chong et al., 2016)
One such case of an allergic reaction to toxic PPD involved a child who received a “natural
black henna tattoo” from a street vendor and developed contact dermatitis (Sonnen, 2007). PPD is

3
a common allergen, and untreated contact dermatitis can lead to scarring, as seen in Figure 3.
Sonnen found that a 10% solution of PPD caused a reaction in 100% of the test subjects – and the
concentration of PPD in black henna is usually between 15-30%. The FDA has not approved PPD
for use on the skin, only in hair dyes (Sonnen, 2007).
Figure 3. Example of contact dermatitis from PPD, 17 days after application of a black henna tattoo
(Adapted from Sonnen, 2007).
While some may prefer the red-brown color of henna, many may wish for a safe plain black
alternative – such as jagua gel used by the company InkboxTM. Jagua is the fruit of the Genipa
Americana tree in South America, with the relevant component being geniposide (Park et al.,
2002). Geniposide is simply the genipin molecule with a glucose molecule attached, but an enzyme
is introduced to breakdown the glucose, leaving the genipin dye. The difference between the
geniposide and genipin molecules is shown in Figure 4. As with henna, the jagua paste is used to
stain a hand-drawn design onto the skin.
Figure 4. Geniposide and genipin molecule (Adapted from Park et al., 2002).

4
Inorganic temporary tattoos, which previously were used mainly by children, are now
being marketed towards adults. These come in the form of transferrable picture tattoos, which are
comprised of five layers (Moore, G. & Bordelon, J., U.S. Patent No. 6074721A, 1997). The bottom
layer is the base that provides support, and the slip layer above serves to easily separate the paper
backing from the rest of the tattoo when it gets wet. The slip layer is also where the image of the
tattoo is printed. The product then receives a spot coating which prevents the adhesive from going
through the tattoo to the surface of the skin. After that is the adhesive layer, and then a removable
sheet to protect the product.
Figure 5. Layers of transferrable picture tattoo (Adapted from US Patent No. 6074721A).
5
The primary research on temporary tattoos was conducted by Rastogi and Johansen in
2005, focused on children’s temporary tattoos. Rastogi and Johansen analyzed children’s
transferrable picture temporary tattoos to identify the organic dyes within them and evaluate if the
dyes were known to cause allergic reactions. Rastogi and Johansen’s method of extracting the dyes
from the tattoos was to add 5 mL of “an aqueous buffer containing 1.4 g citric acid, 6.0 g
tetrabutylammonium hydroxide per litre and pH 9.0/acetonitrile/tetrahydrofuran in the ratio 75 :
12.5 : 12.5,” then ultrasonicate the sample for 15 minutes (Rastogi and Johansen, 2005). The
colored part was scraped into the solvent and the backing paper was removed, and the liquid was
filtered. Then, 2 mL tetrahydrofuran was used to further extract the undissolved portion. Both
extracts were subject to high performance liquid chromatography (HPLC), and the extracts’
retention times as well as ultraviolet-visible light spectroscopy (UV/Vis) spectra in the range of
275-750 nm were compared to Rastogi and Johansen’s library of organic dyes. Most, but not all
dyes in the samples were identified, and Rastogi and Johansen found that “only a limited number
of colourants were used in the formation of these products,” with only 11 of the dyes in their library
present in the 36 temporary tattoo samples (Rastogi and Johansen, 2005).
Studies on temporary tattoos have been limited in their amount and scope, but dyes in other
products have been analyzed. One such study involved the isolation of organic dyes in cosmetics
and used HPLC retention times and UV/Vis to identify the dyes (Rastogi et al., 1997). A spectral
library was developed for 130 organic cosmetic dyes. An assortment of 139 cosmetics were
purchased for the study, including lipsticks, nail polishes, eye-shadows, shampoos, and lotions,
and a method was developed for each product to best extract the dyes. Not all dyes were able to
be analyzed, with possible reasons being that either the dyes irreversibly bound to the HPLC
column, or the dyes could not be dissolved in any of the various solvents used. Another problem

6
Rastogi et al. came across was that some pairs of dyes had identical UV/Vis spectra and similar
retention times, making it impossible to distinguish the dye pairs based on this data alone.
Concentration of the dye was also crucial, because if it did not meet the signal threshold, the spectra
was not recorded at all. Out of the original 130 dyes in the library, Rastogi et al. could only find
30 of these dyes within the 139 cosmetic samples tested, 4 of which were described as “non-
permitted” by the EU Cosmetic Directive (Rastogi et al., 1997).
Another study used attenuated total reflection Fourier transform infrared spectroscopy
(ATR-FTIR) to analyze 40 inorganic dyes found in paints (Vahur et al., 2009). The spectral range
of 550-230 cm-1 was chosen because this range does not contain interference from the absorbance
of the binding materials. The authors reported that it was possible to view such low wavelengths
because of the use of CsI optics and a diamond micro-ATR accessory in the instrument. For ATR-
FTIR to work properly, the refractive index of the sample must be lower than the crystal, so to
decrease the refractive indices of the samples, the samples were mixed with linseed oil. The
spectral range from 550-230 cm-1 was also chosen over the more commonly used mid-IR range
from about 4000-500 cm-1 because many of the dyes do not have characteristic absorbance in the
mid-IR range. Vahur et al. listed the dyes analyzed, as well as the wavenumbers of the
characteristic bands in the dyes’ infrared spectra. While the studies by Rastogi et al. in 1997 and
Vahur et al. in 2009 do not involve temporary tattoos, the research provides a good starting point
for how to analyze dyes in general.
Visually examining a tattoo in terms of color, design, and location is the initial step in the
analysis of a tattoo for forensic investigations. The visual examination of a tattoo may reveal a
printing pattern, which would indicate that the tattoo is a transferrable picture tattoo and not a
permanent tattoo. One study distinguished patterns obtained from inkjet, laser, and dot-matrix

7
printers shown in Figure 6, and explains the printing mechanisms (Noronha et al., 2017). The
authors explain that an inkjet printer sprays the liquid ink onto the moving paper, and is described
as being used for “pictures that require more accuracy in color” (Noronha et al., 2017). Laser
printers work by placing toner made from powdered plastic on the paper in the form of the image,
then heating the paper so the ink is permanently fused to it, and are described as having a very low
cost per copy. Dot-matrix printing uses a needle and an ink ribbon, and are no longer commonly
used anymore. The relevant result of this study is that it is possible to distinguish different printing
methods based on the printing patterns, which may prove useful in distinguishing adult temporary
tattoo brands.
(a) (b) (c)
Figure 6. Printing patterns differing by printer type. (a) HP Inkjet (b) Canon Laser (c) Dot matrix (Adapted
from Noronha et al., 2017).
As mentioned, inkjet printers use liquid ink and laser printers use powdered plastic toner.
Donnelley et al. (2010) conducted an experiment employing laser desorption mass spectrometry
to analyze different inkjet inks, one called DuraBrite and the other DuraBrite Ultra, both from
brand Epson. Both types were CMYK inks, or cyan, magenta, yellow, and black. The authors
found the two cyan inks contained copper phthalocyanine, with one containing a hydrogen group
and another containing a sulfonated group. One of the magenta inks contained Violet 19, while the
other used Red 122. One of the yellow inks contained just Yellow 74, while the other contained
Yellow 74 and something else which the authors could not pinpoint, but they hypothesized that it
could be either Direct Yellow 132, Acid Yellow 23, or Direct Yellow 86. Both black inks contained

8
carbon black. The research by Donnely et al. indicates that even within one brand, Epson, the
composition of the inkjet inks may vary. Conversely, much of the research conducted on laser
printer toner focuses on black toner rather than colored. Tanase et al. (2009) was able to classify
54 samples of black toner into groups: polyester, styrene acrylic copolymer, methyl methacrylate,
and epoxy.
Research into the various types of adult temporary tattoos may make it possible for
examiners to distinguish them from permanent tattoos, thus aiding in the identification of victims.
There are many factors to consider when analyzing temporary tattoos. Optical characteristics may
be analyzed microscopically to observe the colors and printing patterns used in the transferrable
picture tattoos. Chemical characteristics may be analyzed instrumentally via infrared spectroscopy
to identify the components of the adult temporary tattoos.

9
Materials and Methods
Visual analysis was conducted on the adult temporary tattoos using stereomicroscopy and
plane polarized light. Microscopy aided in the analysis the printing pattern in the transferrable
picture tattoos.
(a) (b)
Figure 7. Microscopes used for visual analysis. (a) Olympus SZH-ILLK100 Stereomicroscope (b) Olympus
BH-2 Polarized Light Microscope
The samples were also subjected to an alternate light source known as the CrimeScope,
which is capable of emitting light in a range of wavelengths to see if the samples fluoresce at any
of these wavelengths. Fluorescence occurs when a substance absorbs a specific wavelength of
light, moving the electrons to an excited state, and then the electrons release energy in the form of
fluorescent light as the electrons go back to the ground state (Skoog et al., 2007). Red, orange,
yellow, and colorless filters were used to maximize the contrast between the fluorescent areas (if
any) and emission from the CrimeScope, as well as the background. Fluorescence of an adult
temporary tattoo can be a useful discriminatory factor, and may also be able to locate an adult
temporary tattoo that is not visible with the naked eye.

10
Figure 8. CrimeScope, with filters and protective goggles (https://spexforensics.com/products/item/crimescope-cs-
16-500w).
One of the first steps in the chemical analysis was the extraction of the dyes from the
adhesive matrix in the adult temporary tattoos. Groves et al. (2016) conducted thorough literature
research and compiled a list of the most promising solvents for extraction of dyes from textile
fibers, some of which will be utilized in this research.
Acetic acid DMF and chloroform Nitrobenzene
Acetic acid and chlorobenzene DMF and formic acid N-methyl-2-pyrrolidone (aq.)
Acetone and water DMF and water Oxalic acid and pyridine and water
Alcohol DMSO Pyridine and water
Alcoholic ammonia Ethylenediamine Sodium carbonate
Ammonia Formamid Sodium carbonate and sodium sulfide
Aniline Formic acid Sodium dithionite
Caprolactam and ether and water Formic acid and DMSO Sodium hydroxide
Cellulase Formosul G and Developer O Sodium hydroxide and ammonium chloride
Chlorobenzene Hydrochloric acid Sodium hydroxide and sodium dithionite
Chloroform Methyl acetate and water Sulfuric acid and ammonia
DMF Methylene chloride Toluene
Table 1. List of solvents used by Grove et al. (2016) for separating dyes from a substrate.
Groves et al. ultimately selected a pyridine and water 4:3 v/v solvent system for their survey
of 195 fiber samples, a decision “based upon the literature survey which suggests that this system
is the most widely applicable and practical (for many forensic applications)” (Groves et al., 2016).
The authors found that after 60 minutes in the 4:3 pyridine and water mixture, 159 fiber samples
(about 82%) yielded what they considered to be between a moderate and complete extraction

11
(Groves et al., 2016). Although the research of Groves et al. focused on extracting dyes from fibers
for analysis with thin layer chromatography, a similar method can be used to extracts dyes from
adult temporary tattoos for analysis with UV/Vis.
Figure 9. Shimadzu UV-2450 Ultraviolet-Visible Light Spectrophotometer.
After extraction, samples can be analyzed using UV/Vis. Two cuvettes are needed to
measure the absorbance of the sample – one is the reference cuvette that contains just the solvent
used, and the other is the sample cuvette that contains the solvent and the dye. UV/Vis can be used
to determine the color of a sample based on the wavelength of maximum absorbance.
Fourier transform infrared spectrometry, or more specifically attenuated total reflection
(FTIR-ATR) is considered an efficient method of analysis as it requires little sample preparation.
Infrared spectroscopy works by observing how infrared radiation causes a molecule’s vibrational
amplitude to change. Sample preparation is not necessary with this method because it works by
placing the solid or liquid sample against a crystal with high refractive index such as a diamond,
then the beam of infrared radiation internally reflects between the sample and the diamond one or

12
multiple times, with absorption taking place at each reflection (Skoog et al., 2007). FTIR-ATR is
also a quick and easy way to analyze samples with little to no sample preparation.
Figure 10. Thermo Scientific Nicolet iS10 FTIR instrument with ATR attachment.
The IlluminatIR™ instrument is also capable of FTIR-ATR analysis due to an objective
with a diamond micro-ATR element, but it can also allow for reflection-absorption (RA) spectra
by using a normal microscope objective and infrared-reflecting microscope slides. While FTIR-
ATR is a technique for analyzing the surface of a material, RA allows for analysis through the
whole sample.
(a) (b)
Figure 11. (a) Smith’s IlluminatIR™ instrument (b) ATR objective for the IlluminatIR™

13
Natural and artificial freehand dyes and transferrable picture tattoos were collected for this
research. All samples were received in their original packaging, and product details (when
available) were documented. InkboxTM was one of the first samples chosen, as it has recently
emerged as an extremely popular temporary tattoo brand. Other freehand ink brands chosen were
Jacquard, which produces natural henna and genipin freehand inks, and Tattoo Junkee, which
produces artificial freehand inks. Material Safety Data Sheets (MSDS) were obtained for all
freehand ink samples. Multiple henna samples were acquired, one from American brand Jacquard,
and others acquired directly from India. The transferrable picture tattoo samples selected were
those that had a wide variety of colors present. Three popular brands were selected (Momentary
Ink, Tainted Tats™, and Tattapic®), with multiple different tattoos from each brand, to ascertain
inter- and intra-brand differences. Adhesive sheets meant for creating do-it-yourself temporary
tattoos were also purchased as standards for the transferrable picture tattoos. A summary of
samples studied in this research is provided in Table 2.
Sample
ID
Brand Design
Description
Ingredients from
Package
Supplemental
Information
Transferrable Picture Tattoos
T1 Momentary
Ink
#takepride No information Rejected MSDS
request
T2 Momentary
Ink
Elephant Joy No information Rejected MSDS
request
T3 Momentary
Ink
Chromatic
Bird
No information Rejected MSDS
request
T4 Momentary
Ink
Watercolor
Rose
No information Rejected MSDS
request
T5 Momentary
Ink
Whale of a
Time
No information Rejected MSDS
request
T6 Momentary
Ink
Odorous
Plant
No information Rejected MSDS
request
T7 Tainted
Tats™
True Colors Vinyl acrylate copolymer.
May contain: Titanium
Dioxide (CI 77891),
Yellow 5 (CI 19140), Iron
Oxides (CI 77499), Blue 1
No MSDS or website
information available

14
(CI 42090), Red 7 (CI
15850)
T8 Tainted
Tats™
Lucky in
Love
Vinyl acrylate copolymer.
May contain: Titanium
Dioxide (CI 77891),
Yellow 5 (CI 19140), Iron
Oxides (CI 77499), Blue 1
(CI 42090), Red 7 (CI
15850)
No MSDS or website
information available
T9 Tainted
Tats™
Equality
Symbol
Vinyl acrylate copolymer.
May contain: Titanium
Dioxide (CI 77891),
Yellow 5 (CI 19140), Iron
Oxides (CI 77499), Blue 1
(CI 42090), Red 7 (CI
15850)
No MSDS or website
information available
T10 Tattapic® Geometric
Rainbow
Rose
No information No MSDS or website
information available
T11 Tattapic® Rainbow
Heart
No information No MSDS or website
information available
T12 Tattapic® Rainbow
American
Flag Heart
No information No MSDS or website
information available
Freehand Ink
F1 Inkbox™ Freehand ink Aqua, Ethyl Alcohol,
Vegetable Oil, Xantham
Gum, Genipa Plant
Extract, L-Arginine,
Ultramarine Blue
Website ingredients
do not include: L-
Arginine, Ultramarine
Blue
MSDS available
online
F2 Inkbox™ Shading ink Aqua, Ethyl Alcohol,
Vegetable Oil, Xantham
Gum, Genipa Plant
Extract, L-Arginine,
Ultramarine Blue
(Same box as above,
but with “shading
ink” sticker)
Website ingredients
do not include: L-
Arginine, Ultramarine
Blue
F3 Jacquard Jagua powder Jagua powder Website ingredients:
Jagua powder
(dehydrated jagua
juice (Genipa
americana), cane

15
sugar, xanthan gum,
citric acid)
MSDS ingredients:
Evaporated fruit juice
of Genipa americana
(Jagua powder
MSDS, 2018)
F4 Tattoo
Junkee
Matte Black Water, Polyacrylic Acid,
Calcium Carbonate, PVP
(polyvinylpyrrolidone),
Glycerin, Butylene
Glycol, Silica,
Phenoxyethanol,
Methylparaben,
Ethylparaben,
Butylparaben,
Isobutylparaben,
Propylparaben, Iron
Oxides, Yellow 5 Lake,
Blue 1 Lake
MSDS ingredients:
Polyacrylic Acid,
Calcium Carbonate,
Polyvinylpyrrolidone,
Glycerin, Silica
(Tattoo Junkee Matte
Tattoo Kits MSDS,
2017)
F5 Tattoo
Junkee
White Lace Water, Polyacrylic Acid,
Calcium Carbonate, PVP
(polyvinylpyrrolidone),
Glycerin, Butylene
Glycol, Silica,
Phenoxyethanol,
Hydrogenated Castor Oil,
Ceteth-40,
Methylparaben,
Polysorbate 60,
Ethylparaben,
Butylparaben, Sucrose
Laurate, Isobutylparaben,
Propylparaben, Sodium
Dehydroacetate, Titanium
Dioxide, Yellow 6 Lake,
Iron Oxides, Red 7, Ferric
Ferrocyanide
MSDS ingredients:
Polyacrylic Acid,
Calcium Carbonate,
Polyvinylpyrrolidone,
Glycerin, Silica,
Titanium dioxide,
Ferric Ferrocyanide.
(Tattoo Junkee Matte
Tattoo Kits MSDS,
2017)
Henna
H1 Jacquard Mehndi
Henna
Henna powder MSDS ingredients:
Henna powder,
lawsonia inermis leaf.
(Henna powder
MSDS, 2017)

16
H2 Bride Henna No information (in
English)
Powder. In Hindi
H3 Shenaz Henna No information Powder. Advertised
for hair
H4 Ayur Henna No information Powder. Advertised
for hair
H5 Nupur Henna 100% natural henna and
herbs
Powder. Advertised
for hair
H6 Noori Henna 100% natural henna Pre-mixed liquid.
H7 Popular Henna, herbal
based
No information Pre-mixed liquid.
Contains allergy
warning
H8 Popular Henna, Gold
Arebian
No information Pre-mixed liquid.
Contains allergy
warning
H9 Golecha Henna,
red/brown
No information Pre-mixed liquid.
“Does not contain
ammonia, PPD, or
any harmful
chemicals”
H10 Golecha Henna, black No information Pre-mixed liquid.
“Does not contain
ammonia, PPD, or
any harmful
chemicals”
Adhesives
A1 Rolurious
(laser)
Adhesive
sheet
No information Attached to yellow
sheet, says “water
paper” on paper
A2 Rolurious
(inkjet)
Adhesive
sheet
No information Attached to yellow
sheet, says “water
paper” on paper
A3 RoryTory Adhesive
sheet
No information Attached to yellow
sheet, says “water
paper” on paper
A4 Sangi Adhesive
sheet
No information Attached to yellow
sheet, says “water
paper” on paper
A5 Silhouette Adhesive
sheet
No information Attached to green
sheet
A6 Sunnyscopa Adhesive
sheet
No information Attached to white
sheet, says “inkjet
tattoo paper printing
paper” on paper
A7 Tailor® Adhesive
sheet
No information “warning – can
expose you to

17
antimony trioxide” on
package
A8 Tattify Adhesive
sheet
No information Attached to white
sheet, says “inkjet
tattoo paper printing
paper” on paper
A9 VViViD
vinyls
Adhesive
sheet
No information Attached to yellow
sheet, says “water
paper” on paper Table 2. Information about all samples used in this research.
Sample
ID
Brand Design
Description
Tattoo Image Color
Details
Transferrable Picture Tattoos
T1 Momentary
Ink
#takepride
Blending
of red
orange,
yellow,
green,
blue,
indigo,
violet.
Non-
uniform.
T2 Momentary
Ink
Elephant
Joy
Watercolor
of pink,
orange,
yellow,
blue. Non-
uniform.
T3 Momentary
Ink
Chromatic
Bird
Watercolor
of pink,
blue,
purple.
Non-
uniform.

18
T4 Momentary
Ink
Watercolor
Rose
Watercolor
of red,
green.
Non-
uniform.
T5 Momentary
Ink
Whale of a
Time
Watercolor
of pink,
blue,
green.
Non-
uniform.
T6 Momentary
Ink
Odorous
Plant
Watercolor
areas of
pink,
orange,
yellow,
blue. Non-
uniform.
T7 Tainted
Tats™
True Colors
Separated
areas of
red,
orange,
yellow,
green,
blue,
purple.
Uniform.

19
T8 Tainted
Tats™
Lucky in
Love
Blended
areas of
red,
orange,
yellow,
green,
blue,
purple.
Non-
uniform.
T9 Tainted
Tats™
Equality
Symbol
Separated
areas of
red,
orange,
yellow,
green,
blue,
purple.
Uniform.
T10 Tattapic® Geometric
Rainbow
Rose
Separated
areas of
red,
orange,
yellow,
green,
blue,
purple,
pink.
Uniform.
T11 Tattapic® Rainbow
Heart
Separated
areas of
red,
orange,
yellow,
green,
blue,
purple.
Uniform.

20
T12 Tattapic® Rainbow
American
Flag Heart
Separated
areas of
different
shades of
red,
orange,
yellow,
green,
blue,
purple.
Non-
uniform. Table 3. Information about transferrable picture tattoo samples used in this research.
Initial preparation involved making microscope slides and observing samples
stereomicroscopically. The pre-mixed liquid freehand ink samples (F1, F2, F4, F5, H6, H7, H8,
H9, and H10) were placed on microscope slides and allowed to dry at room temperature.
All transferrable picture tattoo, freehand ink, and henna samples were first observed using
an Olympus SZX-ILLK100 stereomicroscope. An Olympus BH-2 polarized light microscope was
then used for imaging of the transferrable picture tattoos. The image quality increased when using
transmitted light rather than reflected.
All tattoo samples, whether still on the paper backing or mounted on slides, were also
subject to multiple wavelengths of light using the CrimeScope to see if the samples fluoresced.
The following wavelengths (in nanometers) were used: 415, 430, 445, 455, 475, 495, 540, 515,
535, 555, 575, 600, 635, 670. Red, orange, yellow, and clear filters were also used. Photographs
were taken only of samples that exhibited fluorescence, and only at the optimal combination of
wavelength and filter. The samples were also observed with short-wave (254 nm) and long-wave
(365 nm) ultraviolet light.

21
Sample T9 was chosen for the first attempts at extracting dyes from transferrable picture
tattoos for analysis with UV/vis, as sample T9 contained a wide range of colors within it (red,
orange, yellow, green, blue, and purple) with a uniform distribution of color. An array of test tubes
was set up, with the columns containing different colors, and the rows containing different
solvents. A hole-punch was used to isolate small portions of the different colors present in sample
T9. The following solvents were used: deionized water, 10% glacial acetic acid, 10% sodium
hydroxide, 10% sulfuric acid, 200 proof ethanol, acetone, dimethylsulfoxide, and pyridine. The
chemical structures of these solvents can be seen below in Table 4. Two to three drops of solvent
were placed in each test tube containing a tattoo punch-out, then Parafilm® was placed over each
test tube. The test tubes were left alone for a week. At this point, the paper backing was able to be
removed from each sample except those with ethanol and acetone as the solvent. The ethanol and
acetone evaporated, so more solvent was added, and the paper removed three days later.
Name of solvent Chemical structure
Acetone
Dimethylformamide

22
Dimethylsulfoxide
Ethanol
Ether
Ethylene glycol
Glacial acetic acid
Methyl ethyl ketone
M-xylene
O-xylene

23
P-xylene
Pyridine
Sodium hydroxide
Sulfuric acid
Table 4. Chemical structures of solvents used in this research.
The samples that appeared to be best extracted were analyzed using the Shimadzu UV-
2450 UV/Vis spectrometer, at the following parameters: scan speed medium, 360-800 nm. One-
cm path length silica cuvettes were used initially, but when it was decided that a higher
concentration was needed which was accomplished by reducing the volume and using 50 µL
cuvettes. The freehand and henna samples were also analyzed using the same UV/Vis parameters
as above and with pyridine as the solvent.
Dry powdered samples (F3, H1, H2, H3, H4, H5), dried liquid samples scraped from the
prepared microscope slides (F1, F2, F4, F5, H6, H7, H8, H9, and H10), and the adhesive transfer
papers were analyzed with the FTIR-ATR at a resolution of 4 cm-1 and 256 scans.

24
Sample T9 was chosen for the first attempts at analyzing the transferrable picture tattoos
using FTIR-ATR, because according to information gained from the stereomicroscope, the red,
yellow, and blue areas were completely solid colors. The FTIR-ATR instrument parameters were
a resolution of 4 cm-1 and 256 scans. Several techniques were implemented to try and remove the
adhesive so the dye layer was exposed. First, the tattoo was placed on the instrument right from
the packaging. Then, a small portion of the tattoo was soaked in water and heated gently to dryness.
Next, a small portion of the tattoo was soaked in acetone and gently scraped to remove colored
pieces to place on the instrument. Finally, an acetone-soaked cotton swab was rubbed on the tattoo
until color was lifted, then that area was placed on the instrument. Another method used was to
place a small portion of the tattoo on multiple microscope slides, then use different solvents (ether,
o-xylene, p-xylene, m-xylene, ethylene glycol, methyl ethyl ketone, Nujol®, Fluorolube®,
turpentine, dimethylforamide) on each, and view under a microscope to see if the adhesive
appeared to separate from the dyes before attempting FTIR-ATR. This method did not work, and
the dyes did not fully separate from the matrix under these conditions.
Transferrable picture tattoos were analyzed with the IlluminatIR™, which can obtain both
FTIR-ATR and RA spectra. The instrument parameters were set to a resolution of 4 cm-1 and 256
scans. These samples were cut and mounted on low-emissivity infrared-reflecting microscope
slides. When the RA spectra were seen to have somewhat high absorbances, measures were taken
to try and reduce them by thinning out the samples. This included dissolving with acetone,
dissolving with water, and using tape to press down on the sample and remove thin layers.
However, these methods did not work, and the absorbances remained high.
The do-it-yourself temporary tattoo kits were also analyzed. First, the adhesive sheets
were subjected to FTIR-ATR analysis at a resolution of 4 cm-1 and 256 scans. Then, a rainbow
25
image was printed on one inkjet kit and one laser kit to observe differences in the patterns
produced by the printer types.
Lastly, the FTIR-ATR spectra were entered into Bio-Rad’s KnowItAll® software, which
contains a spectral reference database composed of multiple libraries maintained by Bio-Rad.
The database was used as a guide to search for what the samples could contain, given the limited
knowledge provided about their composition.

26
Results and Discussion
Visual Examination
Not all of the adult temporary tattoo packages listed ingredients. Out of the three brands of
transferrable picture tattoos, only the Tainted Tats™ brand listed ingredients. It is worth noting
that the Tainted Tats™ packaging says “May contain” which implies that the company prints out
a general ingredients list on the back of each tattoo, and all of those ingredients may not actually
be present in a specific tattoo. See Figure 12 below for the actual image.
Figure 12. Backside of Tainted Tats™ packaging, listing the ingredients that the product “may contain.”
Regarding the freehand adult temporary tattoo Inkbox™, the ingredients listed on the
package and website differ. The package lists two ingredients, L-Arginine and Ultramarine Blue,
which are not included on the website’s list of ingredients. MSDS for the artificial freehand
samples from Tattoo Junkee are available online, but not all of the ingredients listed on the

27
packaging are mentioned on the MSDS. Below in Table 5 is a list of the chemical structures of all
ingredients provided about adult temporary tattoo sample used in this research.
Name of ingredient Chemical structure
Blue 1
Butylene glycol
Butylparaben
Calcium carbonate
CAS # 471-34-1
(Tattoo Junkee Matte
Tattoo Kits MSDS,
2017)
Ceteth-40
Ethyl alcohol

28
Ethylparaben
Ferric ferrocyanide
CAS # 25869-00-5
(Tattoo Junkee Matte
Tattoo Kits MSDS,
2017)
Glycerin
CAS # 56-81-5
(Tattoo Junkee Matte
Tattoo Kits MSDS,
2017)
Iron oxides
or or
Isobutylparaben

29
L-Arginine
Methylparaben
Phenoxyethanol
Polyacrylic acid
CAS # 9003-01-4
(Tattoo Junkee Matte
Tattoo Kits MSDS,
2017)
Polysorbate 60
Polyvinylpyrrolidone
CAS # 9003-39-8
(Tattoo Junkee Matte
Tattoo Kits MSDS,
2017)

30
Propylparaben
Red 7
Silica
CAS # 112945-52-5
(Tattoo Junkee Matte
Tattoo Kits MSDS,
2017)
Sucrose laurate
Sodium dehydroacetate

31
Titanium dioxide
CAS # 13463-67-7
(Tattoo Junkee Matte
Tattoo Kits MSDS,
2017)
Ultramarine blue
Xanthan gum
Yellow 5
Table 5. List of ingredients provided among all adult temporary tattoo samples used in this research.
Because there are discrepancies between lists of ingredients for the same products, and
many samples do not have an ingredients list provided at all, there is little information to go on
when trying to identify the components of every adult temporary tattoo sample.

32
Brightfield Microscopy – Comparing Printing Patterns of Transferrable Picture Tattoos
Brightfield microscopy was used to view colorful section of the transferrable picture
tattoos. Intra- and inter-brand characteristics were observed.
Samples T1 and T6 both have a printing pattern consisting of lines of varying color and
thickness, as seen in Table 6. The color and thickness of the lines determines the overall color. For
example, the violet in T1 is darker than that of T6, thus T1 incorporates cyan lines alternating with
the magenta lines to get the darker shade. Meanwhile, in T6, there are no cyan lines present.
T1
T6
Red area
Orange
area

33
Yellow
area
Green
area
Blue
area
Violet
area
Table 6. Photographs of colored sections (red, orange, yellow, green, blue, violet) from samples T1 and T6 from
brand Momentary Ink.
Samples T8 and T9 both have a printing pattern consisting of either dots or solid colors, as
seen in Table 7. The red and yellow areas of both tattoos are solid colors, and the blue in sample
T9 is solid while it is made up of dots in sample T8. Similarly to Momentary Ink, different shades
of color are achieved by adjusting the pattern of colors. For example, the darker shade of purple in
sample T9 is achieved by having a mostly dark background with magenta dots interspersed, while
the lighter shade of purple in T8 shows the opposite, a light background with small dark dots.

34
T8
T9
Red area
Orange
area
Yellow
area
Green area

35
Blue area
Purple
area
Table 7. Photographs of colored sections (red, orange, yellow, green, blue, purple) from samples T8 and T9 from
brand Tainted Tats™.
Samples T11 and T12 both have a printing pattern consisting of mostly lines with some
dots, as seen in Table 8. Aside from shade differences, there are few intra-brand differences with
these two samples. The lines and dots do appear to be less sharp than the previous two brands.
T11
T12
Red area

36
Orange
area
Yellow
area
Green area
Blue area
Purple
area
Table 8. Photographs of colored sections (red, orange, yellow, green, blue, purple) from samples T11 and T12 from
brand Tattapic®.
The main inter-brand difference is the printing patterns, either lines, dots, or a combination
of the two. While only three brands were analyzed in this research, looking at transferrable picture

37
tattoos from additional brands may reveal which printing patterns are the most common. An inter-
brand similarity is the way the colors are mixed to produce other colors, which is likely because
only four base colors are available: cyan, magenta, yellow, and black.
Brightfield Microscopy – Determining Printer Type Used for Transferrable Picture Tattoos
To determine what type of printer was likely used for the transferrable picture tattoos, the
do-it-yourself temporary tattoo kits were used to print a rainbow image, one with a laser printer
and the other with an inkjet printer. The different colors were observed with brightfield
microscopy. Below are the results for the Rolurius laser and Rolurious inkjet kits, Table 9.
Rolurious Laser Rolurious Inkjet
Red area
Orange
area
Yellow
area

38
Green area
Blue area
Purple
area
Table 9. Photographs of colored sections (red, orange, yellow, green, blue, purple) from Rolurious laser and inkjet
samples.
No printing pattern can be discerned from the inkjet-printed sample, while in the laser-
printed sample, lines and dots can be seen. Despite the limited availability of knowledge of these
products, based on this examination it is hypothesized that these adult transferrable picture tattoos
were printed with a laser printer.

39
Fluorescence
All adult temporary tattoo samples were laid out, and the CrimeScope light source was
passed over the samples while in a dark room, cycling through the selected wavelengths of light.
Photographs of the weakly fluorescing tattoos can be seen in Figure 13, with optimal conditions
found with the combination of a red filter and a wavelength of light of 555 nm.
(a) (b)
(c) (d)
(e) (f)
Figure 13. Photographs of transferrable pictures tattoos, taken with a red filter and 555 nm wavelength of light
provided by the CrimeScope. (a) Sample T2, (b) Sample T3, (c) Sample T4, (d) Sample T5, (e) Sample T6, (f)
Sample T7.

40
Photographs were taken with a shutter speed of 1/10 second (except Sample T7, at ¼
seconds), F# 5.6, and ISO 400. It is likely that there is some dye commonly used by the brand
Momentary Ink (Samples T2, T3, T4, T5, T6) that fluoresces. Sample T7 from brand Tainted
Tats™ had one area that fluoresced, but other tattoo samples from that brand exhibited no
fluorescence. The samples were also subjected to shortwave (254 nm) and longwave (365 nm)
ultraviolet radiation. No samples fluoresced with the shortwave radiation, and only Sample F5
(White Lace) fluoresced weakly with longwave radiation.
Ultraviolet-Visible Light Spectroscopy
Punch-outs from different colored sections of Sample T9 soaked in pyridine were analyzed
using UV/Vis. The pyridine-dye mixture in the cuvettes did appear very dilute, which could
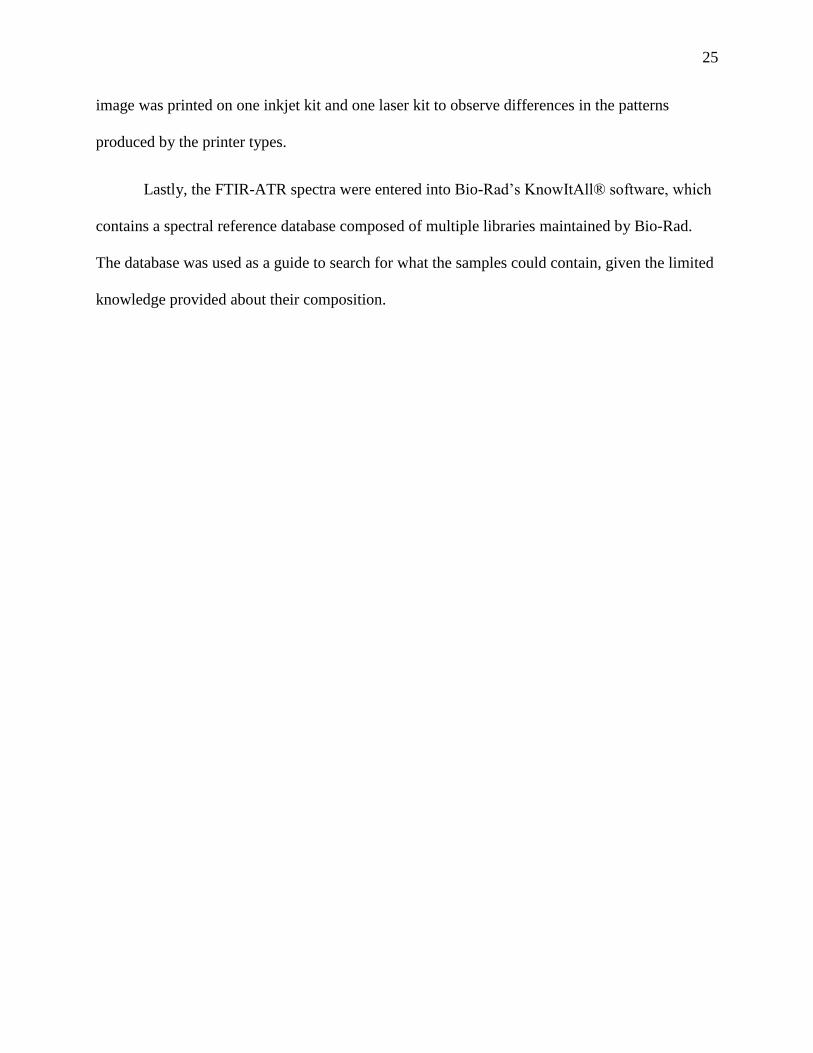
explain why the absorbances were low. Peaks of maximum absorbance can be seen in Figure 14.
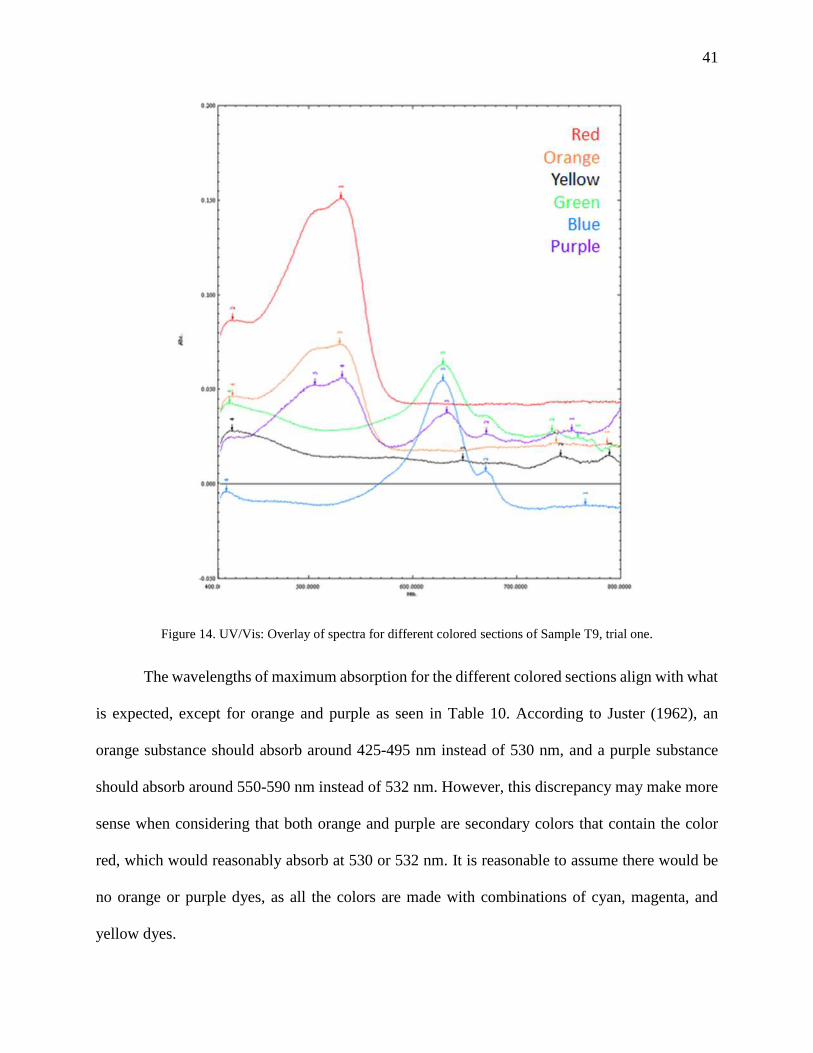
41
Figure 14. UV/Vis: Overlay of spectra for different colored sections of Sample T9, trial one.
The wavelengths of maximum absorption for the different colored sections align with what
is expected, except for orange and purple as seen in Table 10. According to Juster (1962), an
orange substance should absorb around 425-495 nm instead of 530 nm, and a purple substance
should absorb around 550-590 nm instead of 532 nm. However, this discrepancy may make more
sense when considering that both orange and purple are secondary colors that contain the color
red, which would reasonably absorb at 530 or 532 nm. It is reasonable to assume there would be
no orange or purple dyes, as all the colors are made with combinations of cyan, magenta, and
yellow dyes.

42
Tattoo Color Observed Experimental Wavelength
(nm) of Maximum Absorption
Theoretical Wavelength (nm)
of Maximum Absorption
(based on Juster, 1962)
Red 531 490-550
Orange 530 425-490
Yellow 426 400-425
Green 629 640-730
Blue 629 590-640
Purple 532 550-590 Table 10. Wavelengths of maximum absorption for colored sections of Sample T9, with expected wavelengths of
maximum absorption of those colors for comparison.
The experiment above was attempted again, but this time using adhesive soaked in pyridine
as the reference rather than just pure pyridine, and the volume of solvent used was reduced to
increase the concentration. The white and colorless portion of the tattoo was also included in this
trial. Below is an overlay of the spectra from that trial, Figure 15.
Figure 15. UV/Vis: Overlay of spectra for different colored sections of Sample T9, trial two.

43
Again, the wavelengths of maximum absorption mostly align with what would be expected,
with the exception of orange and purple. See Table 11 below. Yellow also falls a bit out of the
expected range, but as seen in Figure 15, the spectrum for the yellow section may not be reliable
as its absorbance slowly trails upwards over about 500 nm. The white and colorless section do not
absorb in the range of visible light wavelengths.
Tattoo Color Observed Experimental Wavelength
(nm) of Maximum Absorption
Theoretical Wavelength (nm)
of Maximum Absorption
(based on Juster, 1962)
Red 528 490-550
Orange 522 425-490
Yellow 453 400-425
Green 631 640-730
Blue 630 590-640
Purple 517 550-590 Table 11. Wavelengths of maximum absorption for colored sections of Sample T9, with expected wavelengths of
maximum absorption of those colors for comparison.
The other types of adult temporary tattoos, freehand (F1-5) and henna (H1-10), were also
analyzed using UV/Vis with pyridine as the solvent. Figure 16 shows an overlay of the freehand
samples. Since none of these samples contained color (F1-3 were light gray, F4 is black, and F5 is
white) it is expected that there would not be much activity within the visible spectrum.
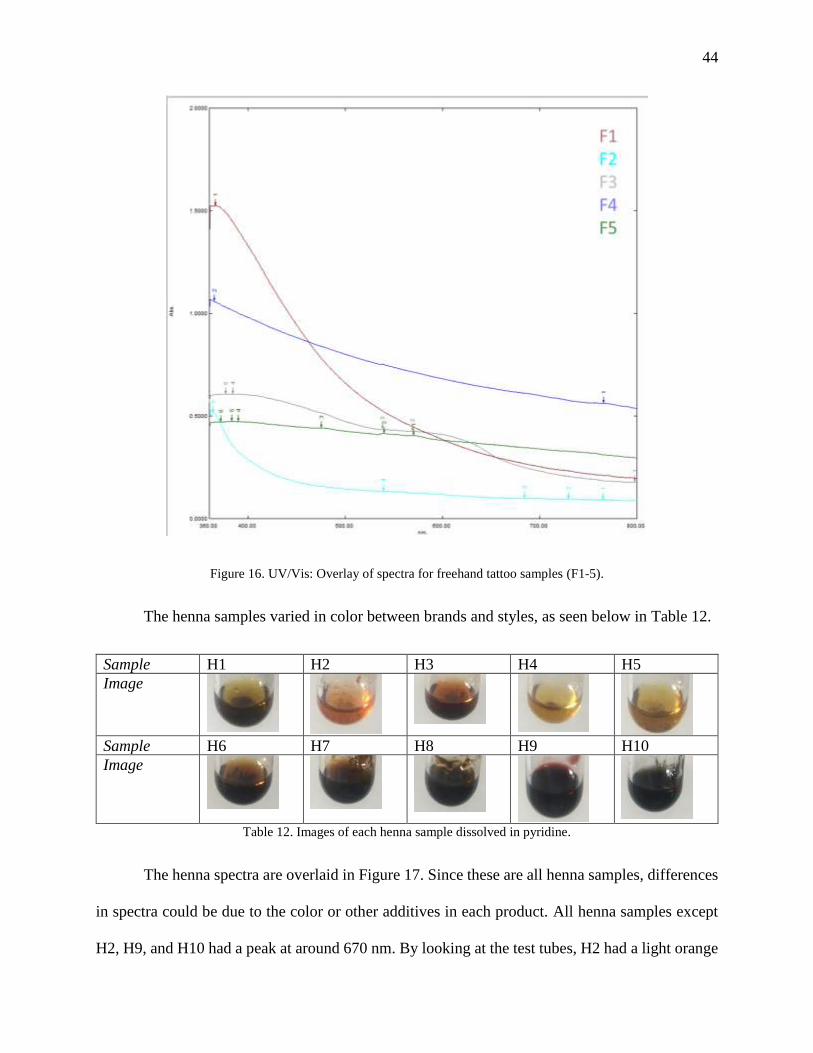
44
Figure 16. UV/Vis: Overlay of spectra for freehand tattoo samples (F1-5).
The henna samples varied in color between brands and styles, as seen below in Table 12.
Sample H1 H2 H3 H4 H5
Image
Sample H6 H7 H8 H9 H10
Image
Table 12. Images of each henna sample dissolved in pyridine.
The henna spectra are overlaid in Figure 17. Since these are all henna samples, differences
in spectra could be due to the color or other additives in each product. All henna samples except
H2, H9, and H10 had a peak at around 670 nm. By looking at the test tubes, H2 had a light orange

45
tint, H9 appeared dark red, and H10 appeared black. The other samples had a greenish brown color,
which could explain a peak at around 670 nm where green would be observed.
Figure 17. UV/Vis: Overlay of spectra for henna tattoo samples (H1-10).
UV/vis can be used to analyze adult temporary tattoos, but its effectiveness depends on the
type and color of tattoo. It is possible to determine and observe the colors in the transferrable
picture tattoos, but sample preparation is required. The method is not recommended for colorless
freehand temporary tattoos, as little information is revealed, and the samples cannot be
distinguished. The UV/Vis spectra of henna samples seem to vary based on the color, but a
database of various henna samples could improve the ability to identify a sample as henna.

46
FTIR-ATR – Dry-Powdered and Liquid-Freehand Tattoos
It is reasonable to expect that the two Inkbox™ jagua samples and one other jagua dye
sample would have similar spectra, since they contain the main ingredient genipin. The similarities
can be seen in Figure 18. The main visible difference is that the spectrum of Sample F3 does not
have very distinct peaks like F1 and F2. This could be because of the differences of the samples
themselves – F1 and F2 were both liquid samples that had been dried then placed on the instrument,
while F3 was a powdered substance.
Figure 18. FTIR-ATR: Stacked spectra of genipin samples (Samples F1, F2, F3).
Knowing the structure of the genipin molecule, it is possible to pick out the relevant areas
of the spectra of F1, F2, and F3 and correlate them to the known functional groups, as seen in
Figure 19.

47
Figure 19. FTIR-ATR: Picking out functional groups present in jagua dye Samples F1, F2, F3.
Spectra from the two Tattoo Junkee samples, F4 and F5, are seen below in Figure 20.
Figure 20. FTIR-ATR: Stacked spectra of artificial freehand tattoos (Samples F4, F5).
Visually the samples are different, F4 being black and F5 being white, but the two appear
to share a similar composition as the spectra share many of the same peaks, with a notable
exception being the peak at 1045 cm-1 in Sample F5. The packaging of these tattoos reveal they

48
share many ingredients, hence the similar spectra, with the main differences likely caused by
ingredients that contribute to the different colors.
All henna samples should contain the molecule lawsone, so it is hypothesized that different
henna samples will still have similar spectra. The similarities can be seen in Figure 21 below. The
two spectra with peaks of low intensity, H9 and H10, are from the same brand.

49
Figure 21. FTIR-ATR: Stacked spectra of all henna samples (Samples H1-10).

50
Knowing the structure of the lawsone molecule, it is possible to pick out the relevant areas
of the spectra of the henna samples and correlate them to the functional groups present in lawsone.
See Figure 22 below.
Figure 22. FTIR-ATR: Picking out functional groups present in henna Samples H1-10.
The natural jagua dye samples (F1-3) all share very similar spectra, both within brand
Inkbox™ with samples F1 and F2, and between brands with Inkbox™ samples F1 and F2 and
Jacquard sample F3. Analysis of the spectra of the ten natural henna samples also reveals they are
highly consistent with each other. Figure 23 below shows the stacked spectra of one jagua sample
and one henna sample. The spectra are different enough that it would be possible to distinguish
between a jaguar and henna sample based on FTIR-ATR data.

51
Figure 23. FTIR-ATR: Stacked spectra from one jaguar and one henna tattoo sample.
The artificial freehand temporary tattoos are both from the same brand, and the packages
list many of the same ingredients, which could explain why the spectra share similarities. More
freehand temporary tattoos from different brands would have to be analyzed before making any
other conclusions about artificial freehand temporary tattoos.
FTIR-ATR – Attempts at Removing Adhesive Layer from Transferrable Picture Tattoos
An original hypothesis of this research was that swiping the transferrable picture tattoo
samples with a cotton swab soaked in acetone until color appeared on the swab would be suitable
to remove the adhesive layer. However, as seen in Figure 24, the spectra for each different colored
section looked very similar after using this method.

52
Figure 24. FTIR-ATR: Stacked spectra from different colored section of Sample T9, after being swiped with an
acetone-soaked cotton swab.
The goal was to analyze the dyes in the transferrable picture tattoos, but other layers in the
tattoo prevented analysis of just the dye layer, as seen in Figure 25, even after attempting other
methods of adhesive removal.
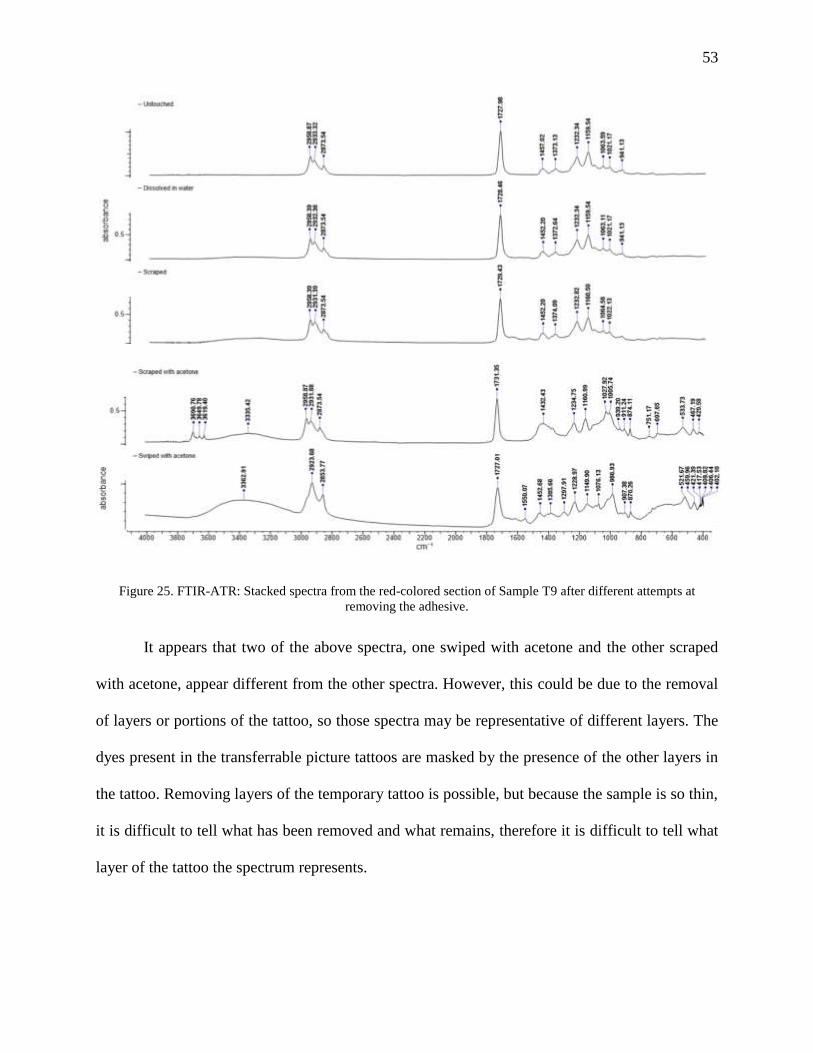
53
Figure 25. FTIR-ATR: Stacked spectra from the red-colored section of Sample T9 after different attempts at
removing the adhesive.
It appears that two of the above spectra, one swiped with acetone and the other scraped
with acetone, appear different from the other spectra. However, this could be due to the removal
of layers or portions of the tattoo, so those spectra may be representative of different layers. The
dyes present in the transferrable picture tattoos are masked by the presence of the other layers in
the tattoo. Removing layers of the temporary tattoo is possible, but because the sample is so thin,
it is difficult to tell what has been removed and what remains, therefore it is difficult to tell what
layer of the tattoo the spectrum represents.

54
FTIR-ATR Spectra of Transferrable Picture Tattoos
The transferrable pictures tattoos were mounted on microscope slides. Each different
colored section in the transferrable picture tattoos were analyzed with the FTIR-ATR attachment
for the IlluminatIR™. First, different colored sections of Sample T1 were analyzed by FTIR-ATR.
As seen in Figure 26, the colorless section has a much different spectrum than the colored sections,
while the different colored sections look very similar to each other.

55
Figure 26. FTIR-ATR: Stacked spectra from different colored sections of Sample T1.
A similar situation happens with T5 as it did with T1, which could be because the tattoos
are from the same brand, Momentary Ink. Figure 27 shows the different sections of T5. The red
and green sections look Highly similar. The blue section looks similar to the red and green except
around 1017 cm-1 where the intensities of the peak vary. Most notably, the colorless section looks
different, suggesting there are less layers present in the colorless section.

56
Figure 27. FTIR-ATR: Stacked spectra from different colored sections of Sample T5.
Since it appears that the colorless section is different from the colored sections with brand
Momentary Ink, a comparison of the colorless sections for each of the Momentary Ink brands was
done, as seen below in Figure 28.

57
Figure 28. FTIR-ATR: Stacked spectra of colorless sections of Samples T1-6.
Not all samples from Momentary Ink have the same colors, but five out of six have blue,
so those sections were compared to see if the blue sections are consistent, as seen below in Figure
29. There does not appear to be major differences.

58
Figure 29. FTIR-ATR: Stacked spectra of blue sections from Samples T1,2,3,5,6.
Again, since not all tattoos from this brand have the same colors, to compare the colored
sections from T1-6, a random colored section from each was chosen and stacked against each
other, as seen in Figure 30. The spectra are consistent with the exception of the peak heights. Since
the spectra for these different colored sections are similar, the dye layer is likely not being detected.

59
Figure 30. FTIR-ATR: Stacked spectra of varied colored sections from Samples T1-6.
The next two samples are from the brand Tainted Tats™ and are interestingly distinct from
the previous brand. The spectra of different colored sections of Sample T7 seen below in Figure
31 appear identical no matter what section, even in the colorless section.

60
Figure 31. FTIR-ATR: Stacked spectra from different colored sections of Sample T7.
Sample T9, also from brand Tainted Tats™, shows again that the spectra from each section
are highly similar as seen in Figure 32 below. This indicates that the dye layer is not being detected.
Comparing the overall spectra from T7 to T9, they appear to be the same, which makes sense
considering they are from the same brand and are likely to share a similar composition, mostly
adhesive.

61
Figure 32. FTIR-ATR: Stacked spectra from different colored sections of Sample T9.
After analyzing the spectra within tattoos, spectra between tattoos of the brand Tainted
Tats™ were analyzed. Figure 33 displays the spectra from T7, T8, and T9 colorless sections and
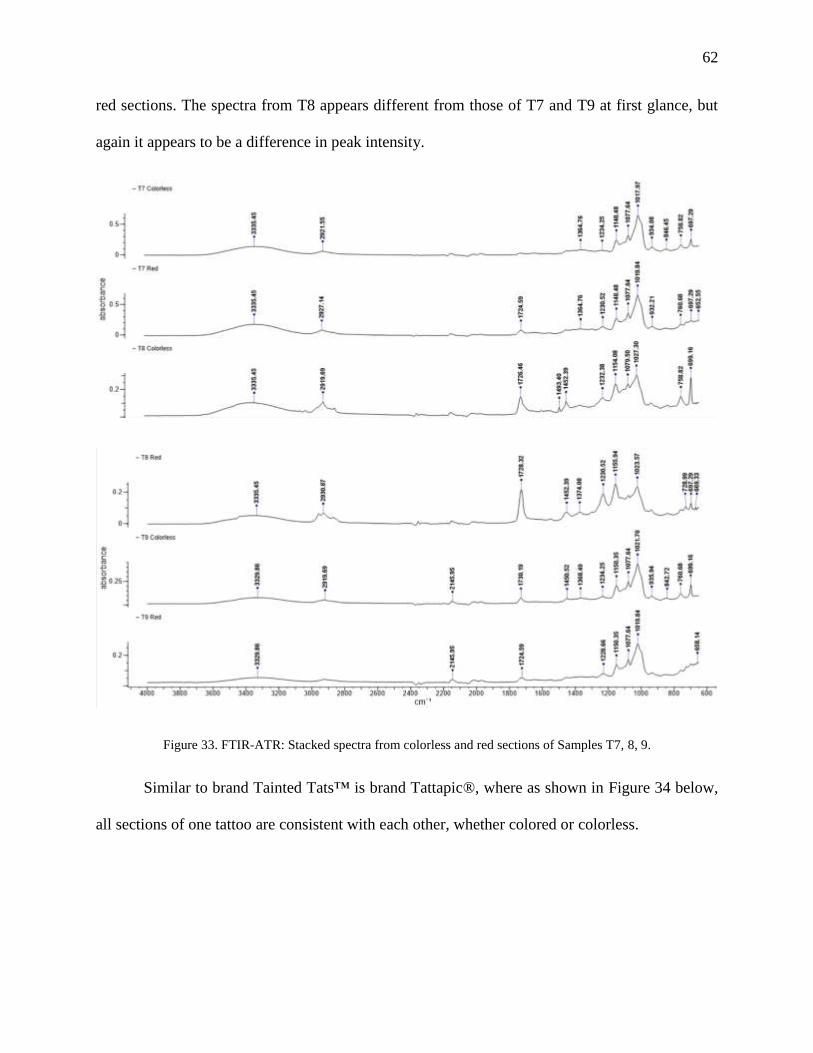
62
red sections. The spectra from T8 appears different from those of T7 and T9 at first glance, but
again it appears to be a difference in peak intensity.
Figure 33. FTIR-ATR: Stacked spectra from colorless and red sections of Samples T7, 8, 9.
Similar to brand Tainted Tats™ is brand Tattapic®, where as shown in Figure 34 below,
all sections of one tattoo are consistent with each other, whether colored or colorless.

63
Figure 34. FTIR-ATR: Stacked spectra from different colored sections of Sample T11.
The same trend is seen again below in Figure 35, showing the different sections of T12.

64
Figure 35. FTIR-ATR: Stacked spectra from different colored sections of Sample T12.
To compare the three tattoos from brand Tattapic® to each other, below in Figure 36 is the
stacked spectra of the colorless and red sections from T10, T11, and T12. It is evident that the dye
layer is being overwhelmed by the other layers of the tattoo.

65
Figure 36. FTIR-ATR: Stacked spectra from colorless and red sections of Samples T10,11,12.
The FTIR-ATR data from the transferrable picture tattoos indicates that both within and
between brands, the dye layer is not being analyzed, and instead the spectra represents the adhesive
layer. There are few intra-brand differences seen in the spectra. Figure 37 below shows a stack of
spectra from one tattoo from each of the different brands.

66
Figure 37. FTIR-ATR: Stacked spectra from colorless sections of one transferrable picture tattoo from each of the
three brands (T1 Momentary Ink, T7 Tainted Tats™, T10 Tattapic®).
As mentioned, there are few intra-brand differences, but there are inter-brand differences
which indicates that the different brands use different adhesives.
Reflectance-Absorbance Spectra of Transferrable Picture Tattoos
Each different colored section in all transferrable picture tattoo samples were also analyzed
by Reflection-Absorption spectroscopy (RA) using the IlluminatIR™. Spectra of samples T1, T7,
and T11 are shown in Figures 38, 39, and 40 respectively, representing the three different brands.
With RA, the infrared radiation passes through the entire sample twice, unlike FTIR-ATR which
only contacts the surface. However, RA also did not aid in the analysis of the dye layer, likely
because the percentage of dye compared to the adhesive was too small to be detected.

67
Figure 38. RA: Stacked spectra from different colored sections of Sample T1.

68
Figure 39. RA: Stacked spectra from different colored sections of Sample T7.

69
Figure 40. RA: Stacked spectra from different colored sections of Sample T11.
Similar to the FTIR-ATR data, there seem to be little intra-brand differences, but noticeable
inter-brand differences in the spectra. The lack of intra-brand differences is explained by the dye
layer not being detected, as it is masked by the adhesive layer. The presence of inter-brand
differences is explained by the different brands likely using different adhesives.
70
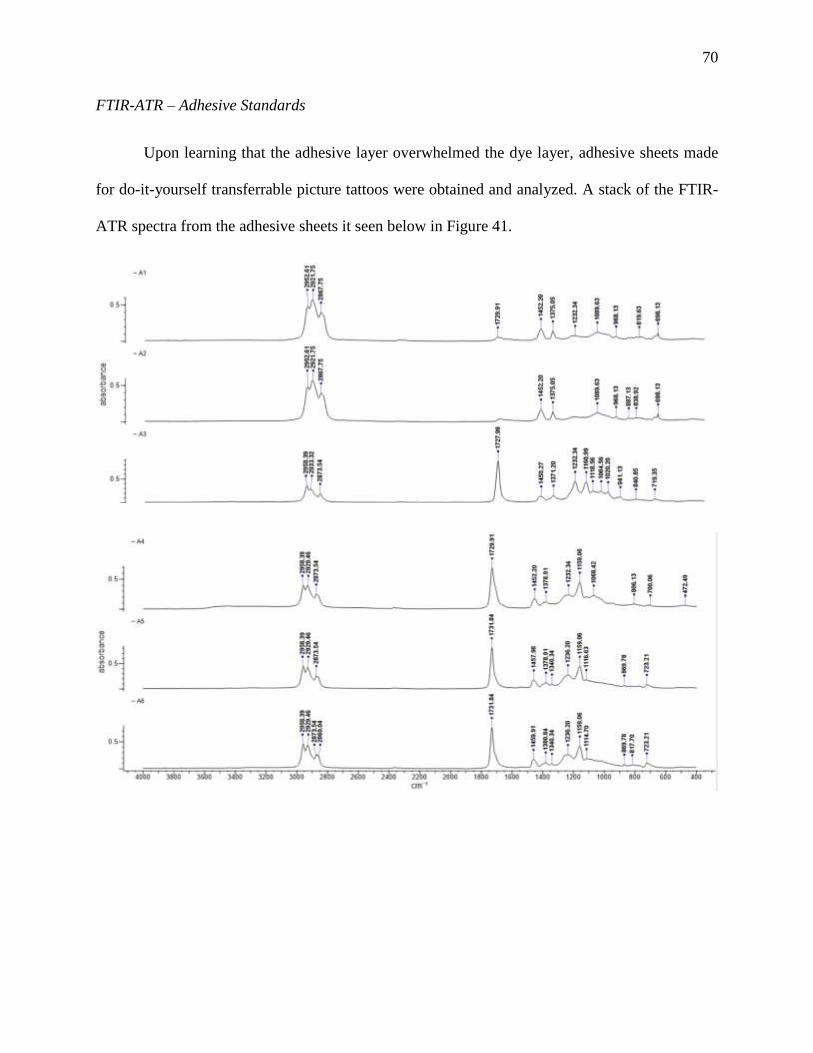
FTIR-ATR – Adhesive Standards
Upon learning that the adhesive layer overwhelmed the dye layer, adhesive sheets made
for do-it-yourself transferrable picture tattoos were obtained and analyzed. A stack of the FTIR-
ATR spectra from the adhesive sheets it seen below in Figure 41.
71
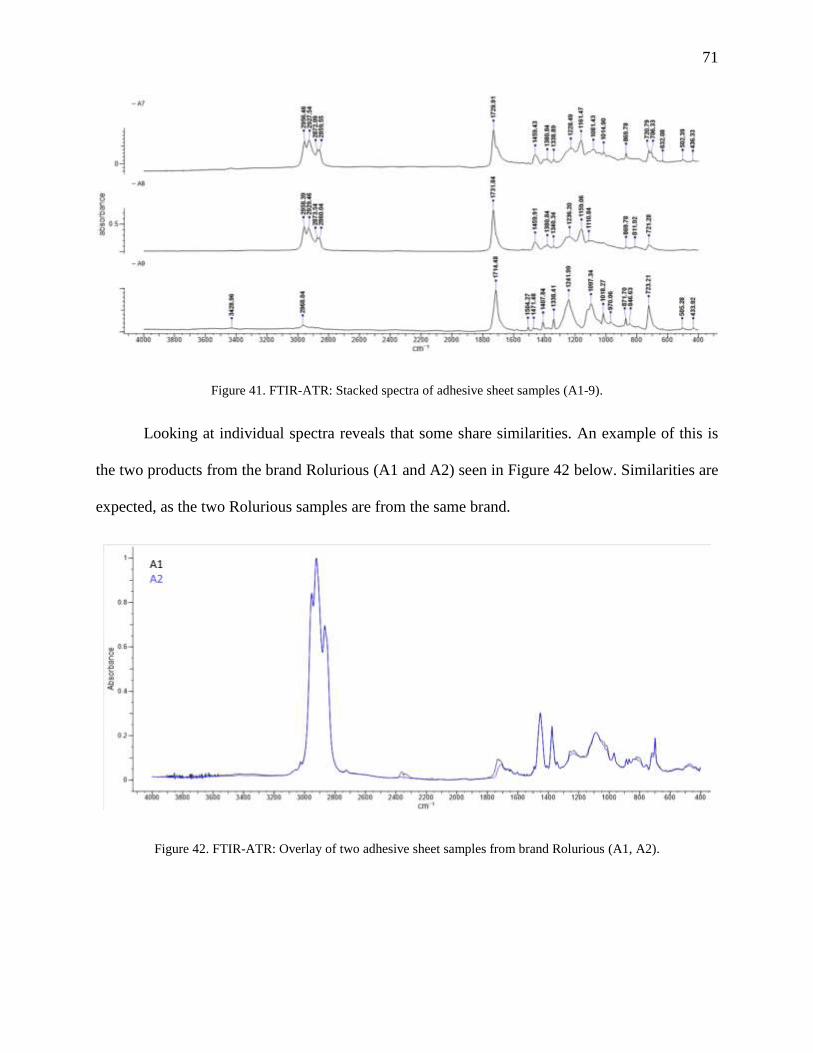
Figure 41. FTIR-ATR: Stacked spectra of adhesive sheet samples (A1-9).
Looking at individual spectra reveals that some share similarities. An example of this is
the two products from the brand Rolurious (A1 and A2) seen in Figure 42 below. Similarities are
expected, as the two Rolurious samples are from the same brand.
Figure 42. FTIR-ATR: Overlay of two adhesive sheet samples from brand Rolurious (A1, A2).

72
Several other samples from different brands were also found to have identical spectra to
each other, as seen in Figure 43 below. These brands were Silhouette (A5), SunnyScopa (A6), and
Tattify (A8).
Figure 43: FTIR-ATR: Overlay of spectra from adhesive sheet Samples A5, A6, A8.
The adhesive sheets from the remaining brands, RoryTory (A3), Sangi (A4), Tailor® (A7),
and VViViD (A9) had spectra that did not appear similar to any other samples. Thus, with these
nine adhesive standards, six different types were observed (A1 and A2 being similar, A5 A6 and
A7 being similar, and A3 A4 A7 and A9 being unique). As seen with the transferrable picture
tattoo samples, it is likely that many companies will use their own unique adhesive for their
products.

73
Searching Obtained Spectra Using Bio-Rad Database
The FTIR-ATR spectra files were uploaded to Bio-Rad’s “ID Expert” program, which
allows the spectra to be searched against Bio-Rad’s library. Below are images comparing the
experimental sample spectra to the single-component top result of each search, along with any
information provided by Bio-Rad about their sample.
The FTIR-ATR spectrum of sample H1, representative of the henna sample, was compared
against the library as seen in Figure 44. The top result was Devil’s Claw Yucca capsule, with a
score of 98.99. The spectrum was obtained from Bio-Rad’s ATR-IR Nutraceuticals database, and
the sample was obtained from Solaray Nutritional Supplements, Nutraceutical International
Corporation. Devil’s Claw is the popular name for the root of the Harpagophytum procumbens
plant, a medicinal plant native to South Africa which is used to reduce appetite (Torres-Fuentes et
al., 2014). While both samples are not from the same plant, the fact that both henna and Devil’s
Claw are plant extracts could explain the similar spectra.
Figure 44. FTIR-ATR: Spectra of Sample H1 and the top result in Bio-Rad’s library.
The FTIR-ATR spectrum of the top layer of Sample T9, obtained by placing it directly on
the instrument rather than mounting on a slide, was compared against the library as seen in Figure
45. The top result was Acrylic multipolymer emulsion, with a score of 98.02. The spectrum was

74
obtained from Bio-Rad’s IR – Polymers & Monomers (Comprehensive) database, and the sample
was obtained from Monsanto Company, Polymer Products Division. Emulsions of acrylic
polymers are what make up adhesives, specifically water-based pressure sensitive adhesives
(Houtman et al., 2007). The polymers are synthesized from vinyl acrylic monomers, with different
monomers chosen to give the product different characteristics such as strength. The result supports
the hypothesis that the adhesive in the transferrable picture tattoos overwhelms the other
components.
Figure 45. FTIR-ATR: Spectra of the top layer of Sample T9 and the top result in Bio-Rad’s library.
The FTIR-ATR spectrum of the colorless section of T1 from brand Momentary Ink was
compared against the library as seen in Figure 46. The top result was Terpolymer butyl acrylate-
co-glycidyl methacrylate-co-HEMA, with a score of 98.81. The spectrum was obtained from Bio-
Rad’s IR – Polymers & Monomers (Basic) 3 database. It is classified as a (meth)acrylic copolymer,
which according to Houtman et al. (2007) is a component in pressure sensitive adhesives. For
example, the authors report that methacrylic acid is a functional monomer which can “provide
charge to the adhesive polymer and a functional group by which it can be cross-linked” (Houtman
et al., 2007). This supports the hypothesis that the colorless sections of the Momentary Ink brand

75
transferrable picture tattoos consist of an adhesive which inhibits the detection of the tattoo’s other
components.
Figure 46. FTIR-ATR: Spectra of the colorless section of Sample T1 and the top result in Bio-Rad’s
The FTIR-ATR spectrum of the colorless section of T7 from brand Tainted Tats™ was
compared against the library as seen in Figure 47. The top result was Grip-Fix™, with a score of
98.81. The spectrum was obtained from Bio-Rad’s IR – Adhesives and Sealants database.
According to their website, Grip-Fix™ is a “water-soluble, solvent-free adhesive” (Grip-Fix™
(n.d.). The product’s MSDS describes it as an Aqueous solution composed of modified
polysaccharides, a release agent, stabilizers, frost protection, and a preservative agent” (Grip-Fix™
MSDS). This result implies colorless sections of Tainted Tats™ brand transferrable picture tattoos
consist of an adhesive which inhibits the detection of the tattoo’s other components.
Figure 47. FTIR-ATR: Spectra of the colorless section of Sample T7 and the top result in Bio-Rad’s library.

76
The FTIR-ATR spectrum of the adhesive standard Sample A1 (which is consistent with
A2) was compared against the library as seen in Figure 48. The top result was the adhesive side of
a clear polyethylene film tape, with a score of 98.88. The spectrum was obtained from Bio-Rad’s
IR – Adhesives and Sealants database, and the sample was obtained from International Tape
Company.
Figure 48. FTIR-ATR: Spectra of Sample A1 and the top result in Bio-Rad’s library.
The FTIR-ATR spectrum of the adhesive standard Sample A5 (which is also consistent
with A6 and A8) was compared against the library as seen in Figure 49. The top result was
pressure-sensitive adhesive, with a score of 98.96. The spectrum was obtained from Bio-Rad’s IR
– Adhesives and Sealants database, and the sample was obtained from Adhesives Research Inc.,
Glen Rock, Pennsylvania.
Figure 49. FTIR-ATR: Spectra of Sample A5 and the top result in Bio-Rad’s library.

77
The FTIR-ATR spectrum of the adhesive standard Sample A3 was compared against the
library as seen in Figure 50. The top result was pressure-sensitive adhesive, with a score of 97.55.
The spectrum was obtained from Bio-Rad’s IR – Adhesives and Sealants database, and the sample
was obtained from Adhesives Research Inc., Glen Rock, Pennsylvania.
Figure 50. FTIR-ATR: Spectra of Sample A3 and the top result in Bio-Rad’s library.
The FTIR-ATR spectrum of the adhesive standard Sample A4 was compared against the
library as seen in Figure 51. The top result was water-soluble acrylic polymer, with a score of
97.72. Houtman et al., 2007 found that acrylic polymers were a major component of adhesives.
The spectrum was obtained from Bio-Rad’s IR – Polymers & Monomers (Comprehensive)
database, and the sample was obtained from Mohawk Industries, Inc. The second and third highest-
scoring results were both tape adhesives, scoring 97.15 and 96.94.
Figure 51. FTIR-ATR: Spectra of Sample A4 and the top result in Bio-Rad’s library.

78
The FTIR-ATR spectrum of the adhesive standard Sample A9 was compared against the
library as seen in Figure 52. The top result was a translucent polyester film, with a score of 99.34.
The spectrum was obtained from Bio-Rad’s ATR – IR Polymers database, and the sample was
obtained from ICI Americas, Inc., Films Division. None of the top results were adhesives, which
is plausible because this particular sample was not sticky as an adhesive should be.
Figure 52. FTIR-ATR: Spectra of Sample A9 and the top result in Bio-Rad’s library.
The searches against the library show that it is possible to determine that the spectra belong
to an adhesive, and in some cases more information is available about the type of adhesive. A
library could be built of adhesives typically used in adult temporary tattoos specifically, which
would expedite the process of identifying a sample as an adult temporary tattoo.

79
Conclusions
New information about the various types of adult temporary tattoos has been gained. Not
all adult temporary tattoos fluoresce, but some do, which could be a discriminating factor in their
identification. Transferrable picture tattoos show evidence of different printing patterns which
could lead to their identification. Within a brand, looking at the various colors can show similarities
and differences with how the colors are produced, by altering the thickness of printed lines, or
adding dots of different colors. Between brands, it is seen that while colors may seem the same by
the naked eye, when magnified the different brands are printed with different patterns, for example
one may primarily use lines while another may primarily use dots. Printing patterns of inkjet vs
laser printers can be examined to determine which was used to print a transferrable picture tattoo
design.
Regarding ultraviolet-visible light spectroscopy, pyridine was found to be an effective
solvent. To increase the concentration of the sample, use a microcuvette to reduce the amount of
solvent needed. This type of analysis worked well for the transferrable picture tattoos because
these tattoos are colored, with wavelengths of maximum absorption correlating to the wavelengths
in visible light spectrum. Most of the henna samples had some similar peaks, but the different
samples showed variations, likely due to the slightly different color of each sample. The other
freehand samples did not absorb well in the visible light range, likely because they are not colored
at all, being gray, black, and white.
FTIR-ATR revealed the most information about the adult temporary tattoos. All of the
jagua dye samples had similar spectra to each other, and all of the henna samples also had similar
spectra to each other. For the transferrable picture tattoos, while it may seem useful to try and
remove layers before analysis, it is extremely difficult to tell what layers have been removed and

80
what layer is being analyzed because the sample itself is so thin, with multiple layers compressed
together. Mounting the transferrable picture tattoo on a microscope slide before analysis is
preferred over analyzing it right out of the packaging because by mounting the tattoo, the side
facing up is the same side that would be exposed if it were applied to the skin. The thickness of
each layer, as well as the amount that the layers blend together, is likely to vary among different
brands. While it was thought that reflection-absorption spectra would be more useful as it would
represent the entire sample rather than just the surface, there were no obvious differences among
the different colored sections of the tattoos, indicating that the individual dyes were not able to be
reached or identified with this method. The spectra of the many samples analyzed with FTIR-ATR
were compared against Bio-Rad’s library, and searches returned results consistent with what was
expected.
Future studies in this line of research could include making a spectral library dedicated to
the various types of adult temporary tattoos. Adult temporary tattoos could also be applied to
pigskin to conduct persistence studies, observing how long the tattoos would remain on skin under
various circumstances. Persistence studies could be performed to see if fluorescence can be
observed on skin that once had a temporary tattoo. Methods to remove the adult temporary tattoos
from the skin for analysis could be developed. Comparisons should be done on samples removed
from skin versus fresh unused samples analyzed in this research. Increased knowledge about adult
temporary tattoos may lead to an improvement of victim identification.

81
References
Bhuiyan, M. A. R., Islam, A., Ali, A., & Islam, M. N. (2017). Color and chemical constitution of
natural dye henna (lawsonia inermis L) and its application in the coloration of textiles.
Journal of Cleaner Production, 167, 14-22. doi:10.1016/j.jclepro.2017.08.142
Chong, H., Reena, K., Ng, K., Koh, R., Ng, C., & Chye, S. (2016). Para-Phenylenediamine
Containing Hair Dye: An Overview of Mutagenicity, Carcinogenicity and Toxicity. Journal
of Environmental & Analytical Toxicology, 6(5). doi:10.4172/2161-0525.1000403
Donnelly, S., Marrero, J. E., Cornell, T., Fowler, K., & Allison, J. (2010). Analysis of Pigmented
Inkjet Printer Inks and Printed Documents by Laser Desorption/Mass Spectrometry. Journal
of Forensic Sciences, 55(1), 129-135. doi:10.1111/j.1556-4029.2009.01244.x
Grip-Fix™ MSDS; H. Rand GmbH: Neuhofen, Germany. (2016, June 22).
Grip-Fix™ (n.d.). Palletizing Adhesives. Retrieved from http://gripfix.com/what-is-grip-fix/
Groves, E., Palenik, C.S., & Palenik, S. (2016). A survey of extraction solvents in the forensic
analysis of textile dyes. Forensic Science International, 268, 139-144.
Henna powder MSDS; Jacquard: Healdsburg, CA. (2017, January 18). Retrieved from
https://www.jacquardproducts.com/sds-sheets.
Houtman, C. J., Severtson, S. J., Guo, J., Xu, H., & Gwin, L. (2007). Properties of water-based
acrylic pressure sensitive adhesive films in aqueous environments. In Proceedings of the 8th

82
TAPPI research forum on recycling, 2007 September 23-26, Niagara Falls, Ontario, Canada.
Atlanta, GA: TAPPI Press, 2007.
Jagua powder MSDS; Jacquard: Healdsburg, CA. (2018, March 5). Retrieved from
https://www.jacquardproducts.com/sds-sheets
Juster, N.J. (1962). Color and chemical constitution, Journal of Chemical Education, 39(11),
596-601.
Miranda, M. (2012). The Chemical Analysis of Modern Tattoo Inks (Doctoral dissertation).
Available from ProQuest Dissertations and Theses database. (UMI No. 3499305)
Moore, G. & Bordelon, J. (1997). U.S. Patent No. 6074721A. Washington, DC. Patent and
Trademark Office.
Noronha, S. J., Basheer, S. Z., Vijay, M. N., Alnajjar, A., Sharma, B. K., & Singh, N. (2017). A
Comparative Study of Different Printed Documents to Estimate the Type of Printer Used.
Journal of Forensic Research and Crime Studies, 2(101). doi:10.17303/jfrcs.2017.2.101
Park, J., Lee, J., Kim, H., Hahn, T., & Paik, Y. (2002). Isolation and characterization of water
soluble intermediates of blue pigments transformed from geniposide of gardenia
jasminoides. Journal of Agricultural and Food Chemistry, 50(22), 6511.
doi:10.1021/jf020499b
Rastogi, S., Barwick, V., & Carter, S. (1997). Identification of organic colourants in cosmetics
by HPLC-diode array detection. Chromatographia, 45(1), 215-228.
doi:10.1007/BF02505563

83
Rastogi, S. C., & Johansen, J. D. (2005). Colourants in transferable picture tattoos for the skin.
Contact Dermatitis, 53(4), 207-210. doi:10.1111/j.0105-1873.2005.00697.x
Skoog, D. A., Holler, F. J., & Crouch, S. R. (2007). Principles of Instrumental Analysis (6th ed.).
Belmont, CA: Thomson Higher Education.
Sonnen, G. (2007). Type IV hypersensitivity reaction to a temporary tattoo. Baylor University
Medical Center Proceedings, 20(1), 36.
Tănase, I. G., Udriştioiu, E. G., Bunaciu, A. A., & Aboul-Enein, H. Y. (2009). Infrared
Spectroscopy in Qualitative Analysis of Laser Printer and Photocopy Toner on Questioned
Documents. Instrumentation Science & Technology, 37(1), 30-39.
doi:10.1080/10739140802584715
Tattoo Junkee Matte Tattoo Kits MSDS; Tattoo Junkee: Santa Monica, CA. (2017, October 3).
Torres-Fuentes, C., Theeuwes, W. F., Mcmullen, M. K., Mcmullen, A. K., Dinan, T. G., Cryan,
J. F., & Schellekens, H. (2014). Devils Claw to Suppress Appetite—Ghrelin Receptor
Modulation Potential of a Harpagophytum procumbens Root Extract. PLoS ONE, 9(7).
doi:10.1371/journal.pone.0103118
Vahur, S., Teearu, A., & Leito, I. (2010). ATR-FT-IR spectroscopy in the region of 550–230
cm−1 for identification of inorganic pigments. Spectrochimica Acta Part A: Molecular and
Biomolecular Spectroscopy, 75(3), 1061-1072. doi:10.1016/j.saa.2009.12.056