
The Financial Landscape of European Football
99
The Financial Landscape of European Football
-
Upload
khangminh22 -
Category
Documents
-
view
3 -
download
0
Transcript of The Financial Landscape of European Football
The Financial Landscapeof European Football

Foreword

The Financial Landscape of European Football
Foreword (1/2)
3
Introduction
The essence of exciting professional football competitions is having sporting merit
and sporting ability as the deciding factor in winning or losing. This leads to
competitions filled with matches where unpredictable outcomes are possible and
where the excitement and passion for the fans lies in the possibility their side could
triumph.
The objective of the European Leagues (EL), as representative of the domestic
league organisers, is to enhance and protect competitive balance within
domestic football competitions.
At the end of 2019, the EL decided to make a study to better understand the
financial landscape of European professional football and its impact on
polarisation and ultimately sporting competitive balance.
COVID-19
The world at the beginning of this year looked very different. The COVID-19
pandemic surprised societies and the impact was and is still enormous for many,
including the entire football industry. All competitions were stopped, and football
showed a great level of adaptability and flexibility to allow many leagues to
resume their competitions, first with matches to be played behind closed doors
and then, where possible, with the gradual return of fans to the stadiums.
The sporting, financial and social impact is immense in the short term, while the
mid and long-term effects are still very uncertain because of the unpredictable
development of the virus. However, it is already clear that the pandemic will lead
to billions of lost revenue for football, with the consequence that hundreds of
professional clubs of all sizes, playing in many different domestic competitions,
face serious negative financial (cash) issues.
The fight against the pandemic and the battle to safeguard our industry still needs
our full attention. If the logical consequence was to push back this study, the topic
and insights revealed by this work did not become any less relevant.
The Financial Landscape of European Football > Foreword
The Financial Landscape of European Football
Foreword (2/2)
4
The financial landscape of European football
KPMG was commissioned to provide data and analysis for the report which
provides clear insights on the financial developments over recent years. All
available data used in the report is related to the pre-COVID-19 era, as well as all
conclusions made from the report. The report mainly focuses on the financial
landscape from a domestic top-tier league perspective.
The analysis does not solely reflect the 36 professional football leagues (29 top-tier
divisions) and associations of clubs from 29 countries which are members of the EL,
but all 55 UEFA members. Given the fundamental (financial) differences between
the biggest and smallest leagues, a cluster approach was developed and
implemented to facilitate the analysis.
The findings of the report will further help to define the direction and goals of our
Association and its Members. In these times of uncertainty, it is essential to blend
the values of European football – such as our meritocratic promotion and
relegation structure and the distribution of solidarity payments – with the forces of
change to ensure the game is healthy at all levels of the pyramid. More even
distribution of UEFA Club Competitions (UCC) revenue, enhanced
professionalisation of leagues and clubs, closer cooperation between all
stakeholders, and the sensible deployment of club budgets will be central to a
healthy future for European football.
The cooperation between all football stakeholders to overcome the COVID-19
crisis has proven that it is possible to put individual interests aside and to find
solutions for the benefit of professional football as a whole. Let this be the spirit
and the motivation for collectively tackling and overcoming our future
challenges.
The report is the result of the boundless efforts of many people, for which we owe
them all gratitude and appreciation. Hopefully, you will study it with great interest.
Nyon, November 2020
Lars-Christer Olsson Jacco Swart
President Managing Director
The Financial Landscape of European Football > Foreword

Executive Summary
The Financial Landscape of European Football
Introduction
6
The Biggest Market in the Greatest Game
Football is the world’s most popular sport and Europe is its largest market.
Featuring more professional leagues and clubs than anywhere else on earth and
four in every 10 of the world’s professional players.
Created by the Football Community
For more than a hundred years, this success has been the result of the choices
and actions of the whole football community – from players and fans, to coaches
and administrators. Together they have developed a European professional
football ecosystem that has generated mass appeal through its competitive
balance – with opportunities for any single team to beat another, and for clubs to
rise through the football pyramid to trophy-lifting glory.
The Appeal of Competitive Balance
This competitive balance, throughout the whole competition, has stimulated the
highest aggregate attendance figures in the world, with approximately 103 million
football fans filling stadiums during the 2017/18 season across approximately
12,000 European league games played largely at weekends. With a further 10
million fans attending 735 UEFA Club Competitions (UCC) mid-week matches. TV
and media audiences are just as significant, with Ampere Analysis estimating that
approximately a quarter of all expenditure on broadcast content in Europe is
allocated to football.
Growing Pains
Over the past two decades, the growth at domestic and international level has
been particularly rapid, leading to the expansion of club finances.
The three revenue streams driving this growth for clubs have been central league
revenue (from TV and league sponsorship), individual club commercial income
(sponsorship and merchandising) and UCC distributions.
But this rapid commercial expansion has brought some growing pains with it.
Specifically, on-pitch performances and off-field financial records indicate that
the gap is widening between clubs, which has brought concerns about
polarisation and competitive balance to the forefront of discussions between
football stakeholders.
Understanding Polarisation
A degree of polarisation has always existed between and within leagues due to
local market and socioeconomic conditions, the heritage and longevity of
leagues, and individual club popularity, but it has increased recently due to
the diverging scale of media markets in different countries, the unequal impact of
the forces of globalisation, and the changing model for UCC revenue distribution.
The Financial Landscape of European Football > Executive Summary > Introduction
The Financial Landscape of European Football
Financial development of European football (1/4)
7
In general, the findings indicate that European football has continued to grow its
revenues; however, the financial gaps both between and within leagues are
increasing.
An overarching theme is that there is a growing concentration of financial
resources in the top clubs throughout the leagues in Europe. While the
phenomenon of having financial and sporting disparities between clubs is not
new, the growth rate of this inequality is increasing and represents a worrying
trend.
Unlike other industries, the football industry thrives on, and needs, healthy levels of
competition between its participants, whether in terms of a title race, a relegation
battle or qualification for UCC. When financial disparities become too large, this
becomes increasingly difficult to achieve.
Overview
Over the recent 10-year period, centralised revenues (league broadcasting,
UCC) and individual club (commercial) revenues have driven top-tier European
club football financial growth. In relation to the transfer market, growing transfer
spending at the top continues to support the financial ecosystem further down
and it is now playing a more important role in club financial operations.
Although European football was becoming more profitable in recent years, nearly
half of all the clubs still operate with deficits.
A consistent increase of players wages (almost doubling during the past decade)
is the main cost driver for clubs, resulting in persistent unsustainable business
models.
The variance in revenues between leagues is largely explained by domestic
socio-economic and cultural realities. However, professional league/club
structures as well as league and club appeal are also fundamental to financial
development, especially in relation to non-domestically generated revenues.
The Financial Landscape of European Football > Executive Summary > Financial development of European football
The Financial Landscape of European Football
Financial development of European football (2/4)
8
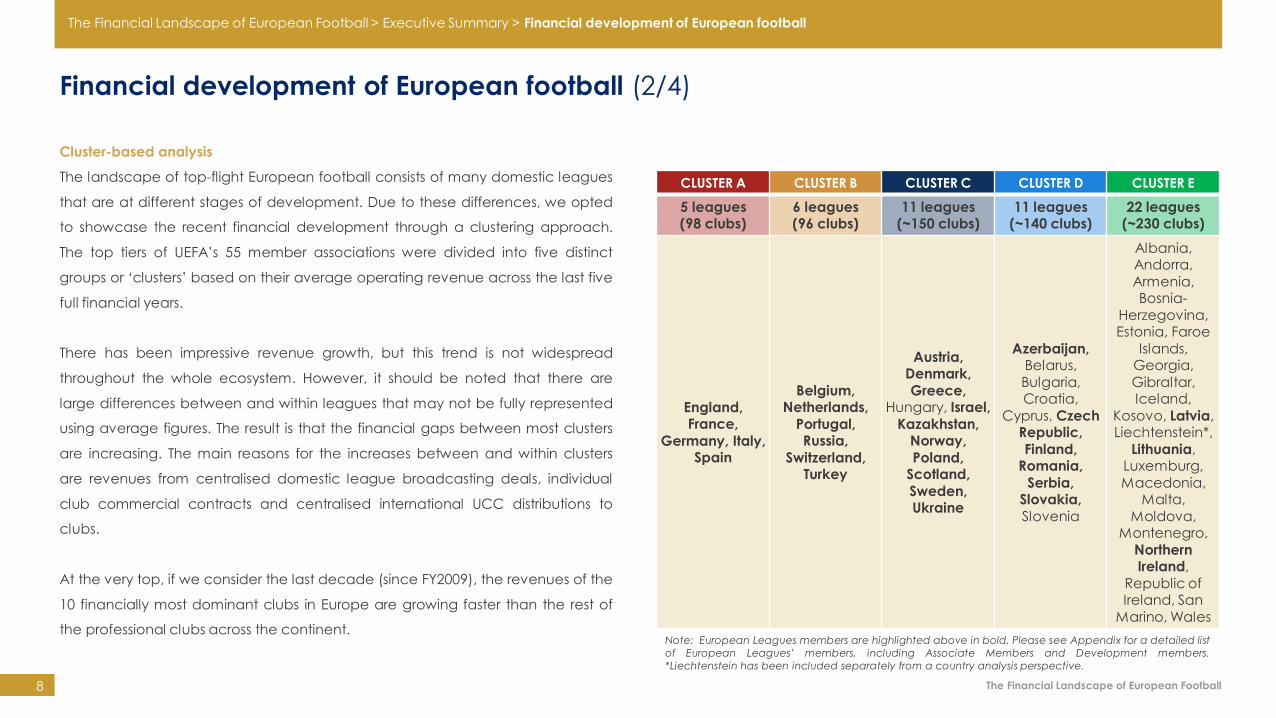
Cluster-based analysis
The landscape of top-flight European football consists of many domestic leagues
that are at different stages of development. Due to these differences, we opted
to showcase the recent financial development through a clustering approach.
The top tiers of UEFA’s 55 member associations were divided into five distinct
groups or ‘clusters’ based on their average operating revenue across the last five
full financial years.
There has been impressive revenue growth, but this trend is not widespread
throughout the whole ecosystem. However, it should be noted that there are
large differences between and within leagues that may not be fully represented
using average figures. The result is that the financial gaps between most clusters
are increasing. The main reasons for the increases between and within clusters
are revenues from centralised domestic league broadcasting deals, individual
club commercial contracts and centralised international UCC distributions to
clubs.
At the very top, if we consider the last decade (since FY2009), the revenues of the
10 financially most dominant clubs in Europe are growing faster than the rest of
the professional clubs across the continent.
CLUSTER A CLUSTER B CLUSTER C CLUSTER D CLUSTER E
5 leagues(98 clubs)
6 leagues(96 clubs)
11 leagues(~150 clubs)
11 leagues(~140 clubs)
22 leagues(~230 clubs)
England, France,
Germany, Italy, Spain
Belgium, Netherlands,
Portugal, Russia,
Switzerland, Turkey
Austria, Denmark,
Greece, Hungary, Israel,
Kazakhstan, Norway,
Poland, Scotland,
Sweden, Ukraine
Azerbaijan, Belarus,
Bulgaria, Croatia,
Cyprus, Czech Republic,
Finland, Romania,
Serbia, Slovakia,
Slovenia
Albania, Andorra,
Armenia, Bosnia-
Herzegovina, Estonia, Faroe
Islands, Georgia,
Gibraltar, Iceland,
Kosovo, Latvia, Liechtenstein*,
Lithuania, Luxemburg,
Macedonia, Malta,
Moldova, Montenegro,
Northern Ireland,
Republic of Ireland, San
Marino, Wales
Note: European Leagues members are highlighted above in bold. Please see Appendix for a detailed list
of European Leagues’ members, including Associate Members and Development members.
*Liechtenstein has been included separately from a country analysis perspective.
The Financial Landscape of European Football > Executive Summary > Financial development of European football
The Financial Landscape of European Football9
Centralised and individual club revenue streams, wages and profitability:
Centralised revenues: League broadcasting
• The value of league broadcasting rights is driven by different socio-economic
and cultural factors, including the popularity of football, domestic market size,
league and club appeal, professionalisation of leagues, media market
competition and international interest. These drivers have mostly benefited the
top leagues. The uneven growth of broadcasting revenues has resulted in
significant differences between and within leagues. This is evident when
analysing league turnover and the mounting share broadcasting is playing in
league revenues, especially in the bigger countries that have also invested
strategically for the medium and long term. Leagues, in general, aim to
distribute broadcasting revenues to foster increased competitive balance in
their competitions.
Centralised revenues: UEFA Club Competitions (UCC)
• Over the past 10 years, UCC revenues have been growing the fastest. As a
consequence, UCC distributions to clubs - driven by the evolution of the UCC
distribution models and access list - are increasingly impacting all levels of the
ecosystem. As from the current 2018-21 UCC cycle, UEFA Champions League
(UCL) revenues have grown much more than UEL, while solidarity payments
have fallen behind and remain small.
• The importance of UCC revenues as part of the total league revenues has
grown significantly and impact all leagues. In addition, it was found that during
the previous 2015-18 UCC cycle, in each league, the top three clubs received
(on average) 85% of all UCC revenues distributed in the same country. These
factors contribute to further increase financial differences between and
imbalances within leagues. Qualifying round payments to clubs have the same
distortive effect in smaller leagues as UCL and UEL payments have in bigger
domestic leagues.
Individual club revenues: Commercial
• Clubs from top leagues and very small leagues have registered growth in their
commercial revenues but it is noticeable that such growth is more evident
among clubs from the top leagues. Although the share of club commercial
income at a cluster level has fallen, it remains a key source of differentiation
within all leagues, especially for top clubs, where individual club differences
drive premium values.
Financial development of European football (3/4)
The Financial Landscape of European Football > Executive Summary > Financial development of European football
The Financial Landscape of European Football
Financial development of European football (4/4)
10
Individual club revenues: Matchday
• Although its relative percentage share has remained flat, matchday revenues
remain fundamental for financial and non-financial (i.e. fan appeal) reasons for
all clubs in all clusters. For leagues with lower centralised broadcasting
revenues, matchday revenues can represent an even more important income
stream for their member clubs.
Individual club revenues: Transfers
• The growth and net spending on the transfer market is driven by those clubs
belonging to the top leagues. The redistribution of transfer fees continues to
support the wider ecosystem with clubs in the top leagues acting as ‘net
spenders’. At the same time, clubs from other leagues remain ‘net sellers’ and
the transfer market has increasingly become an important source of income in
medium and small leagues.
Wages and Profitability
• Profitability remains a challenge for the industry, as clubs carry high fixed
player wage costs compared to revenues that can fluctuate significantly
season to season. On aggregate, player wages have been continuously
increasing and have almost doubled during the past 10 years. Wages are
pushed upwards by clubs’ pursuit of domestic and, increasingly, UCC-focused
success. This has resulted in the wage-to-revenue ratio, in general, rising over
the period analysed.
• Financial regulations, both domestic and at UEFA level, have guided clubs to
more sustainable models but considerable differences exist between and
within clusters. Out of 54 leagues, only 17 have managed to generate an
average positive net profit over the 5-year period FY2014 – FY2018. The
presence of outlier clubs, in particular in medium and small leagues, can drag
down figures.
• With 37 leagues across the whole of European football with negative
profitability, the issue is not league-specific but club-specific and industry-wide.
A combination of factors impact club profitability; however, the level of
professionalism in league/club structures and management are a key
determinant.
The Financial Landscape of European Football > Executive Summary > Financial development of European football
The Financial Landscape of European Football11
Financial differences impact competitive balance in professional club
competitions and can undermine competitiveness. The report, based on data and
analysis from the International Centre for Sports Studies (CIES) and 21st Club, looks
at both title races and differences in team quality to analyse competitive balance
within the leagues and the relationship between financial strength and sporting
performance.
The analysis reconfirms that financial performance impacts and is impacted by
sporting performance with on-pitch success more likely when clubs have more
revenue to invest in their playing squads.
In addition, it was identified that domestic leagues with less revenue have a
bigger difference in the on-pitch quality between any two consecutively ranked
teams within their competitions.
The key findings indicate a greater dominance by a fewer number of clubs in
many domestic leagues and the sporting advantage these top clubs have from
regular participation in UCC competitions.
These indicators are:
Finance and Sporting Performance
• A sharp decline in the number of different domestic champions.
• Teams crowned domestic champions achieved a record
number of points per game.
• The percentage of domestic league games remaining at the
point of title win increased.
• The points gap between the champions and runner-up teams
also increased.
• The advantage clubs have in domestic competitions from
playing regularly in UCC.
The Financial Landscape of European Football > Executive Summary > Finance and Sporting Performance
The Financial Landscape of European Football
Future outlook will depend on tackling challenges collectively
12
The Financial Landscape of European Football highlighted many positive aspects
that professional club football in Europe can and should be proud of. However,
there are important and difficult challenges to consider as we plan for the future.
A collective approach from all stakeholders will be necessary to overcome these
challenges:
• Protecting competitive balance: Match unpredictability and competitiveness
throughout the competition are fundamental to ensuring long-term success of
club competitions and the interest of fans. The trend points to greater
dominance by a fewer number of clubs in many competitions.
• Growing revenue gap between top clubs and others: The financial polarisation
between clubs competing domestically and internationally is increasing and
accelerating.
• Distortive impact of UCC payments: Club distributions from UCC are having a
greater distortive effect in domestic leagues due to the increased size and
concentration of these payments to a small number of top clubs in each
league.
• Wage growth: The escalation of wages to levels that in some cases exceed
club revenues creates an unsustainable long-term business model which poses
systemic risks.
• Overarching challenge of virtuous/vicious cycle: Supporting and maintaining
virtuous cycles in European football while negating the emergence and
growth of vicious cycles.
The unprecedented shock of COVID-19 has magnified these issues, but the
extraordinary levels of cooperation amongst all stakeholders in the emergency
response to the pandemic should give us all hope for the future.
Now, the challenge for these stakeholders is to come together and plot a
sustainable path forward for European football at a time of paradigm-shifting
digitisation, rapidly changing audience behaviour and extreme economic
uncertainty. It will depend upon the ability of the footballing stakeholders to take
bold and potentially difficult decisions that are genuinely in the interests of the
game. Not individual interests but collective interests. Not for the short term but for
the long term. Not as owners but as custodians.
The Financial Landscape of European Football > Executive Summary > Outlook
Content
The Financial Landscape of European Football
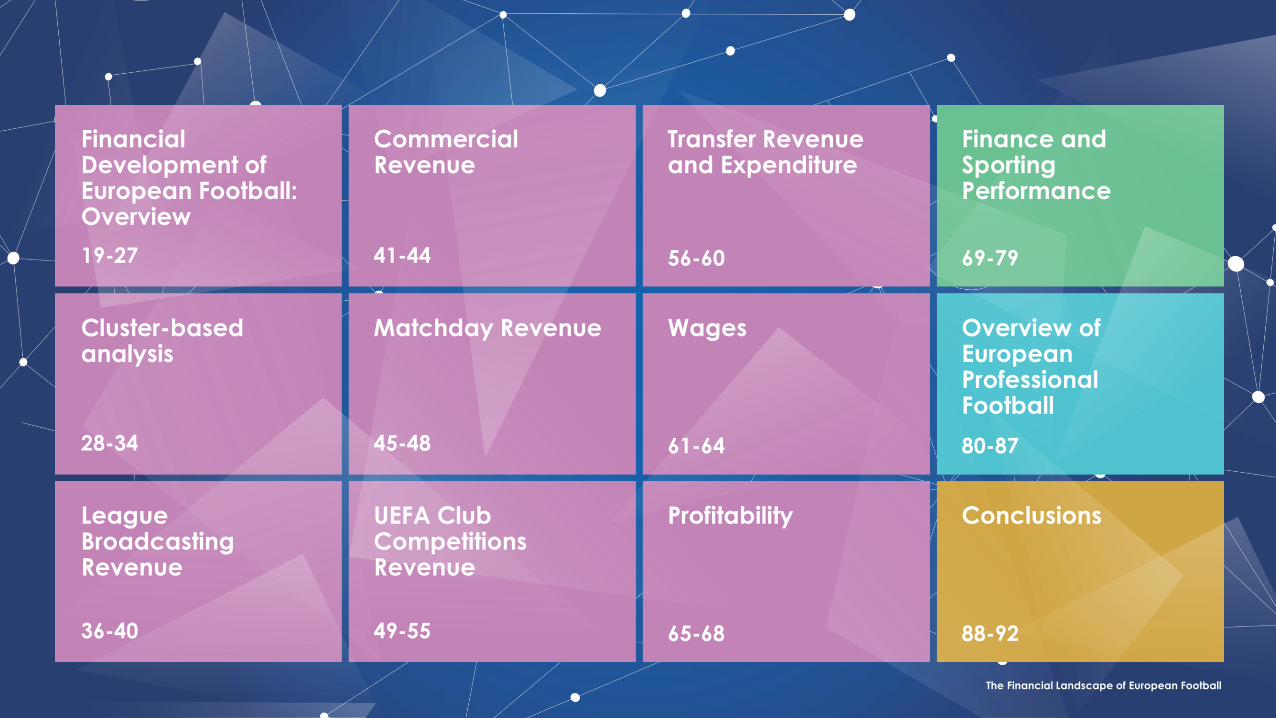
Financial Development of European Football:Overview
Commercial Revenue
Transfer Revenue and Expenditure
Finance and Sporting Performance
Cluster-based analysis
Matchday Revenue Wages Overview of European Professional Football
League Broadcasting Revenue
UEFA Club Competitions Revenue
Profitability Conclusions
19-27
28-34
36-40
41-44
45-48
49-55
56-60
61-64
65-68
69-79
80-87
88-92
The Financial Landscape of European Football15
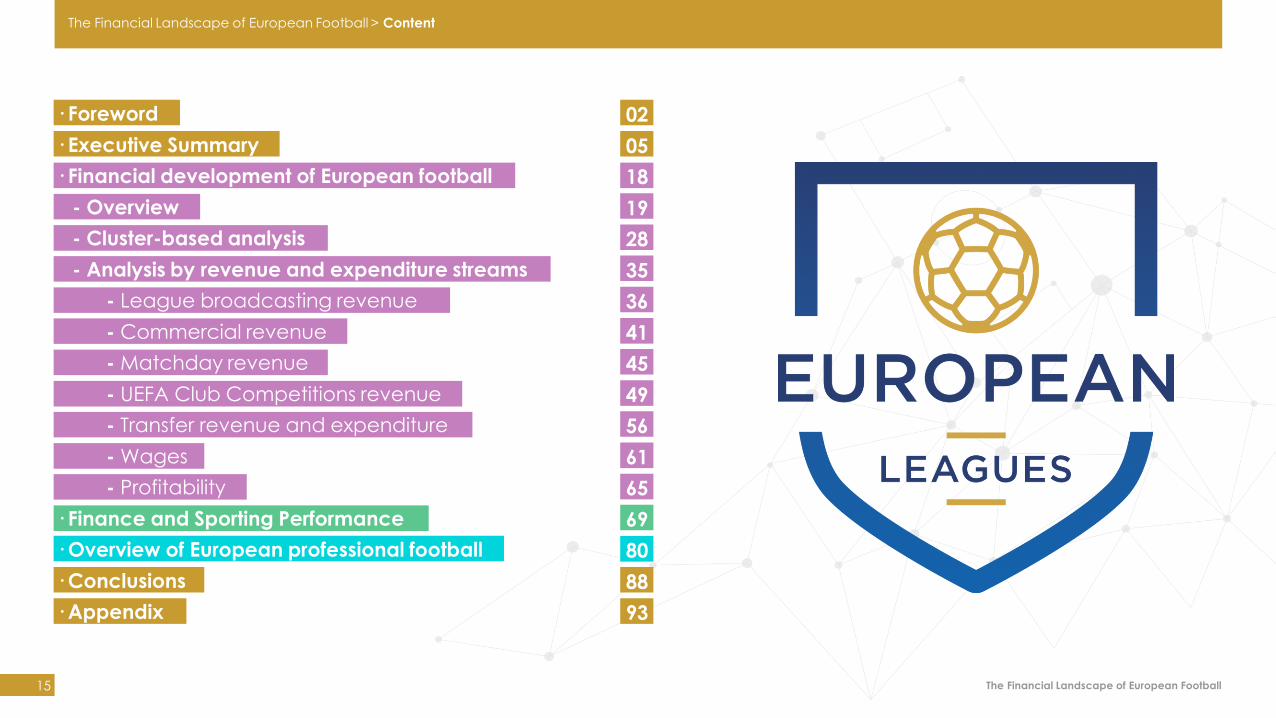
· Foreword
· Executive Summary
· Financial development of European football
- Overview
- Cluster-based analysis
- Analysis by revenue and expenditure streams
- League broadcasting revenue
- Commercial revenue
- Matchday revenue
- UEFA Club Competitions revenue- Transfer revenue and expenditure
- Wages
- Profitability
· Finance and Sporting Performance
· Overview of European professional football
· Conclusions
· Appendix
02
05
18
19
28
35
36
41
45
49
56
61
65
69
80
88
93
34
The Financial Landscape of European Football > Content
The Financial Landscape of European Football
Structure of the Report
16
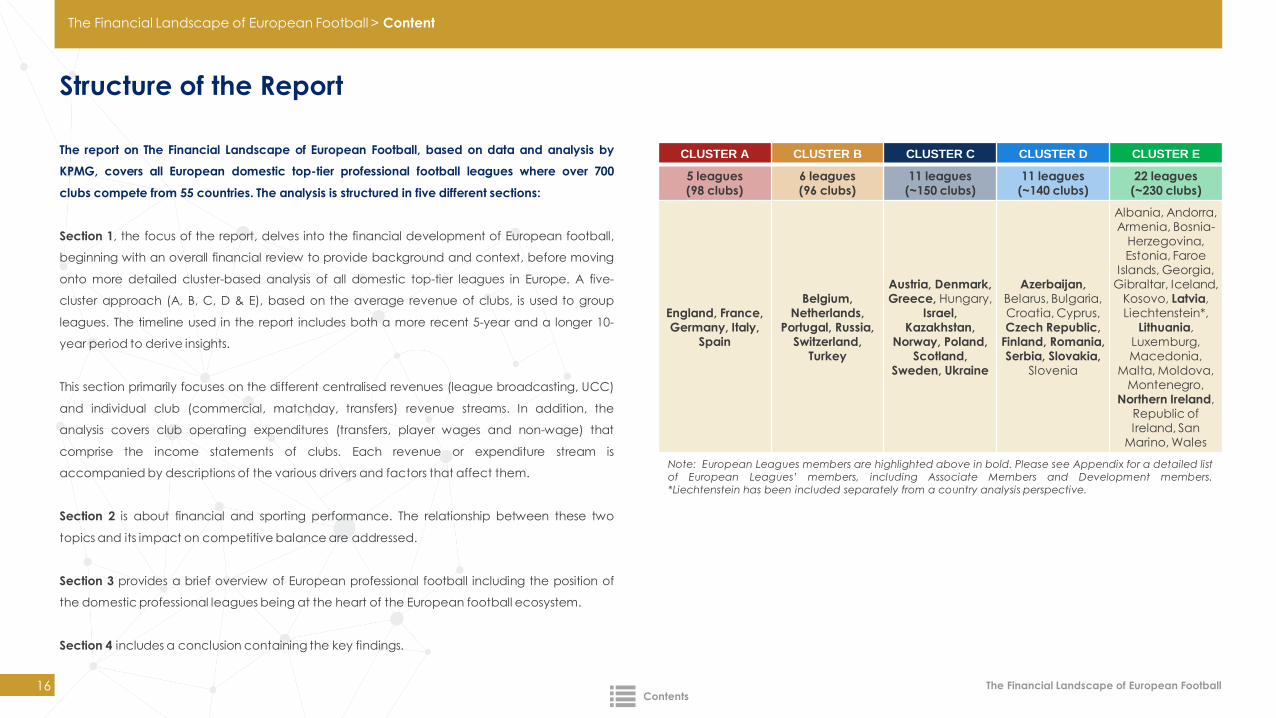
The report on The Financial Landscape of European Football, based on data and analysis by
KPMG, covers all European domestic top-tier professional football leagues where over 700
clubs compete from 55 countries. The analysis is structured in five different sections:
Section 1, the focus of the report, delves into the financial development of European football,
beginning with an overall financial review to provide background and context, before moving
onto more detailed cluster-based analysis of all domestic top-tier leagues in Europe. A five-
cluster approach (A, B, C, D & E), based on the average revenue of clubs, is used to group
leagues. The timeline used in the report includes both a more recent 5-year and a longer 10-
year period to derive insights.
This section primarily focuses on the different centralised revenues (league broadcasting, UCC)
and individual club (commercial, matchday, transfers) revenue streams. In addition, the
analysis covers club operating expenditures (transfers, player wages and non-wage) that
comprise the income statements of clubs. Each revenue or expenditure stream is
accompanied by descriptions of the various drivers and factors that affect them.
Section 2 is about financial and sporting performance. The relationship between these two
topics and its impact on competitive balance are addressed.
Section 3 provides a brief overview of European professional football including the position of
the domestic professional leagues being at the heart of the European football ecosystem.
Section 4 includes a conclusion containing the key findings.
CLUSTER A CLUSTER B CLUSTER C CLUSTER D CLUSTER E
5 leagues(98 clubs)
6 leagues(96 clubs)
11 leagues(~150 clubs)
11 leagues(~140 clubs)
22 leagues(~230 clubs)
England, France, Germany, Italy,
Spain
Belgium, Netherlands,
Portugal, Russia, Switzerland,
Turkey
Austria, Denmark, Greece, Hungary,
Israel, Kazakhstan,
Norway, Poland, Scotland,
Sweden, Ukraine
Azerbaijan, Belarus, Bulgaria, Croatia, Cyprus, Czech Republic,
Finland, Romania, Serbia, Slovakia,
Slovenia
Albania, Andorra, Armenia, Bosnia-
Herzegovina, Estonia, Faroe
Islands, Georgia, Gibraltar, Iceland,
Kosovo, Latvia, Liechtenstein*,
Lithuania, Luxemburg, Macedonia,
Malta, Moldova, Montenegro,
Northern Ireland, Republic of Ireland, San
Marino, Wales
Note: European Leagues members are highlighted above in bold. Please see Appendix for a detailed list
of European Leagues’ members, including Associate Members and Development members.
*Liechtenstein has been included separately from a country analysis perspective.
The Financial Landscape of European Football > Content
Contents
The Financial Landscape of European Football
Glossary of terms
17
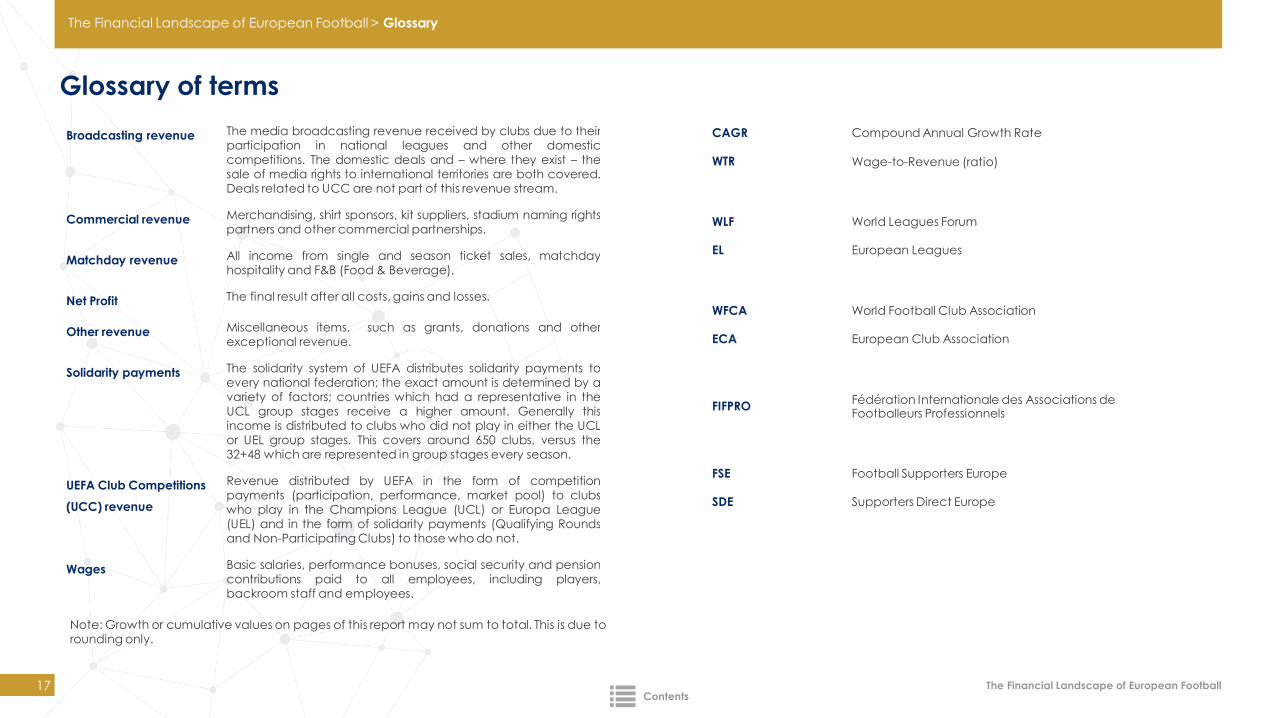
Broadcasting revenue The media broadcasting revenue received by clubs due to theirparticipation in national leagues and other domesticcompetitions. The domestic deals and – where they exist – thesale of media rights to international territories are both covered.Deals related to UCC are not part of this revenue stream.
Commercial revenue Merchandising, shirt sponsors, kit suppliers, stadium naming rightspartners and other commercial partnerships.
Matchday revenue All income from single and season ticket sales, matchdayhospitality and F&B (Food & Beverage).
Net Profit The final result after all costs, gains and losses.
Other revenue Miscellaneous items, such as grants, donations and otherexceptional revenue.
Solidarity payments The solidarity system of UEFA distributes solidarity payments toevery national federation; the exact amount is determined by avariety of factors; countries which had a representative in theUCL group stages receive a higher amount. Generally thisincome is distributed to clubs who did not play in either the UCLor UEL group stages. This covers around 650 clubs, versus the32+48 which are represented in group stages every season.
UEFA Club Competitions
(UCC) revenue
Revenue distributed by UEFA in the form of competitionpayments (participation, performance, market pool) to clubswho play in the Champions League (UCL) or Europa League(UEL) and in the form of solidarity payments (Qualifying Roundsand Non-Participating Clubs) to those who do not.
Wages Basic salaries, performance bonuses, social security and pensioncontributions paid to all employees, including players,backroom staff and employees.
Note: Growth or cumulative values on pages of this report may not sum to total. This is due to rounding only.
The Financial Landscape of European Football > Glossary
CAGR Compound Annual Growth Rate
WTR Wage-to-Revenue (ratio)
WLF World Leagues Forum
EL European Leagues
WFCA World Football Club Association
ECA European Club Association
FIFPROFédération Internationale des Associations de Footballeurs Professionnels
FSE Football Supporters Europe
SDE Supporters Direct Europe
Contents
Financial development of European football

Overview
The Financial Landscape of European Football
Overall financial analysis framework
20
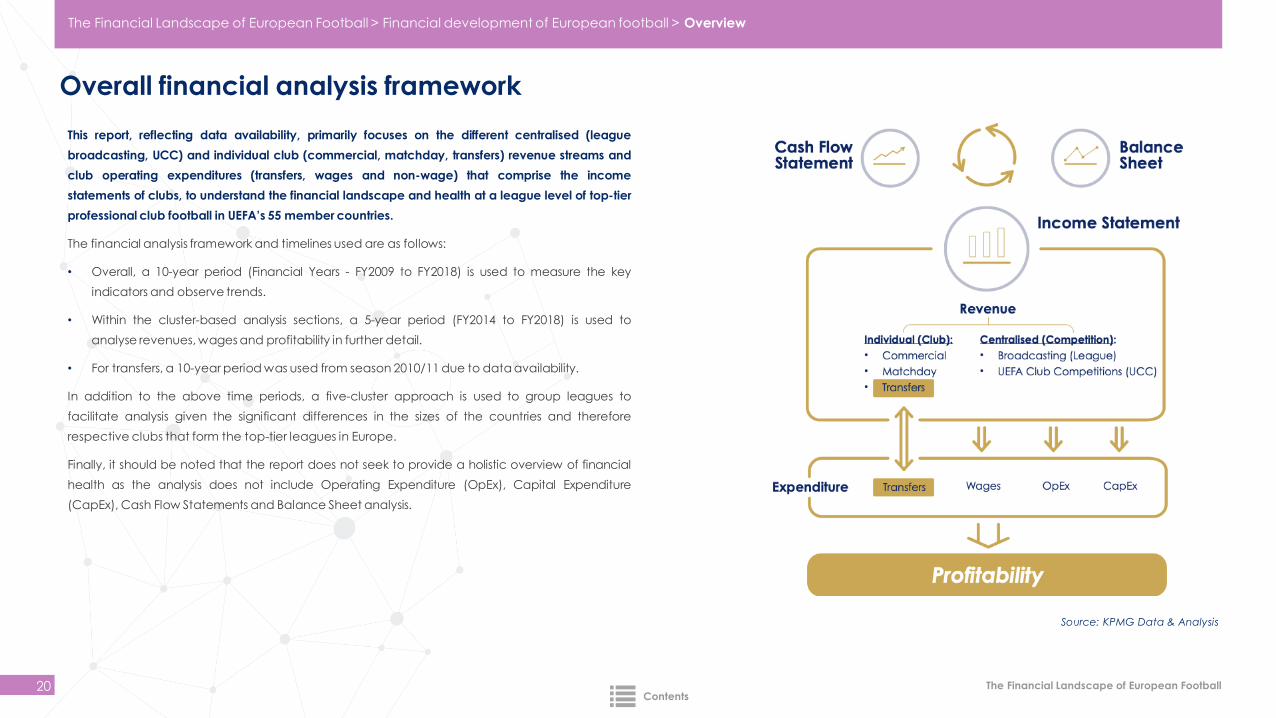
This report, reflecting data availability, primarily focuses on the different centralised (league
broadcasting, UCC) and individual club (commercial, matchday, transfers) revenue streams and
club operating expenditures (transfers, wages and non-wage) that comprise the income
statements of clubs, to understand the financial landscape and health at a league level of top-tier
professional club football in UEFA’s 55 member countries.
The financial analysis framework and timelines used are as follows:
• Overall, a 10-year period (Financial Years - FY2009 to FY2018) is used to measure the key
indicators and observe trends.
• Within the cluster-based analysis sections, a 5-year period (FY2014 to FY2018) is used to
analyse revenues, wages and profitability in further detail.
• For transfers, a 10-year period was used from season 2010/11 due to data availability.
In addition to the above time periods, a five-cluster approach is used to group leagues to
facilitate analysis given the significant differences in the sizes of the countries and therefore
respective clubs that form the top-tier leagues in Europe.
Finally, it should be noted that the report does not seek to provide a holistic overview of financial
health as the analysis does not include Operating Expenditure (OpEx), Capital Expenditure
(CapEx), Cash Flow Statements and Balance Sheet analysis.
Source: KPMG Data & Analysis
The Financial Landscape of European Football > Financial development of European football > Overview
Contents
The Financial Landscape of European Football
Centralised (league broadcasting, UCC) and individual (club commercial) revenues drive top-tier European club football revenue growth
21
4.372 7.965
4.076
7.890
2.481
3.138
692
2.092
-
5.000
10.000
15.000
20.000
FY2009 FY2014 FY2015 FY2016 FY2017 FY2018
€ m
illio
n
Evolution of revenue categories
Commercial and other Broadcasting Matchday UCC
11,719
15,76416,865
18,46620,102
21,083
38% 38%
35% 37%
21%15%
6% 10%
0%
10%
20%
30%
40%
50%
60%
70%
80%
90%
100%
FY2009 FY2014 FY2015 FY2016 FY2017 FY2018
Share of revenue categories from total
Commercial and other Broadcasting Matchday UCC
………..…..
……….…..
* European club football = 55 UEFA top tiers within the scope of this study
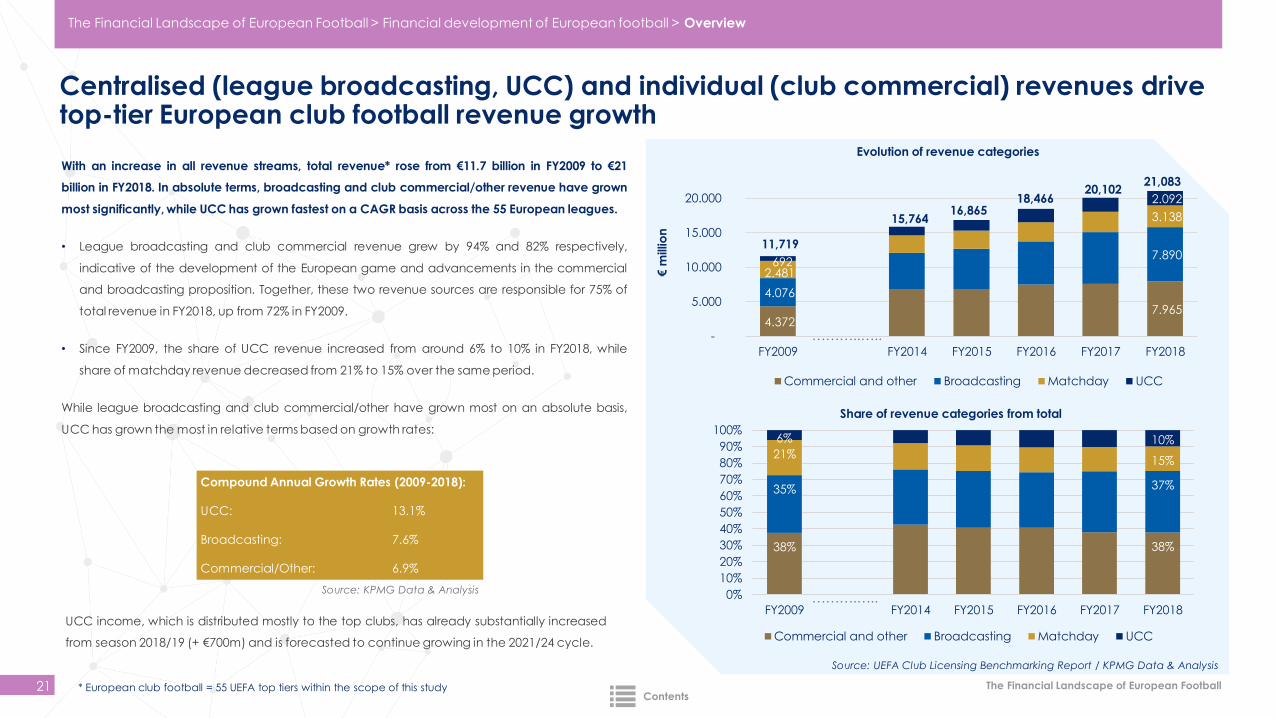
UCC income, which is distributed mostly to the top clubs, has already substantially increased
from season 2018/19 (+ €700m) and is forecasted to continue growing in the 2021/24 cycle.
With an increase in all revenue streams, total revenue* rose from €11.7 billion in FY2009 to €21
billion in FY2018. In absolute terms, broadcasting and club commercial/other revenue have grown
most significantly, while UCC has grown fastest on a CAGR basis across the 55 European leagues.
• League broadcasting and club commercial revenue grew by 94% and 82% respectively,
indicative of the development of the European game and advancements in the commercial
and broadcasting proposition. Together, these two revenue sources are responsible for 75% of
total revenue in FY2018, up from 72% in FY2009.
• Since FY2009, the share of UCC revenue increased from around 6% to 10% in FY2018, while
share of matchday revenue decreased from 21% to 15% over the same period.
While league broadcasting and club commercial/other have grown most on an absolute basis,
UCC has grown the most in relative terms based on growth rates:
Compound Annual Growth Rates (2009-2018):
UCC: 13.1%
Broadcasting: 7.6%
Commercial/Other: 6.9%
Source: UEFA Club Licensing Benchmarking Report / KPMG Data & Analysis
Source: KPMG Data & Analysis
The Financial Landscape of European Football > Financial development of European football > Overview
Contents
The Financial Landscape of European Football
Growing transfer spending continues to financially support ecosystem, and plays a more fundamental role in club finances
22
2.542
6.037
2.996
8.017
-454
-1.980
-4.000
-2.000
-
2.000
4.000
6.000
8.000
FY2009 FY2010 FY2011 FY2012 FY2013 FY2014 FY2015 FY2016 FY2017 FY2018
€ m
illio
n
Transfer revenue, spending and overall balance
Transfer revenue Transfer spend Transfer balance (revenue-spend)
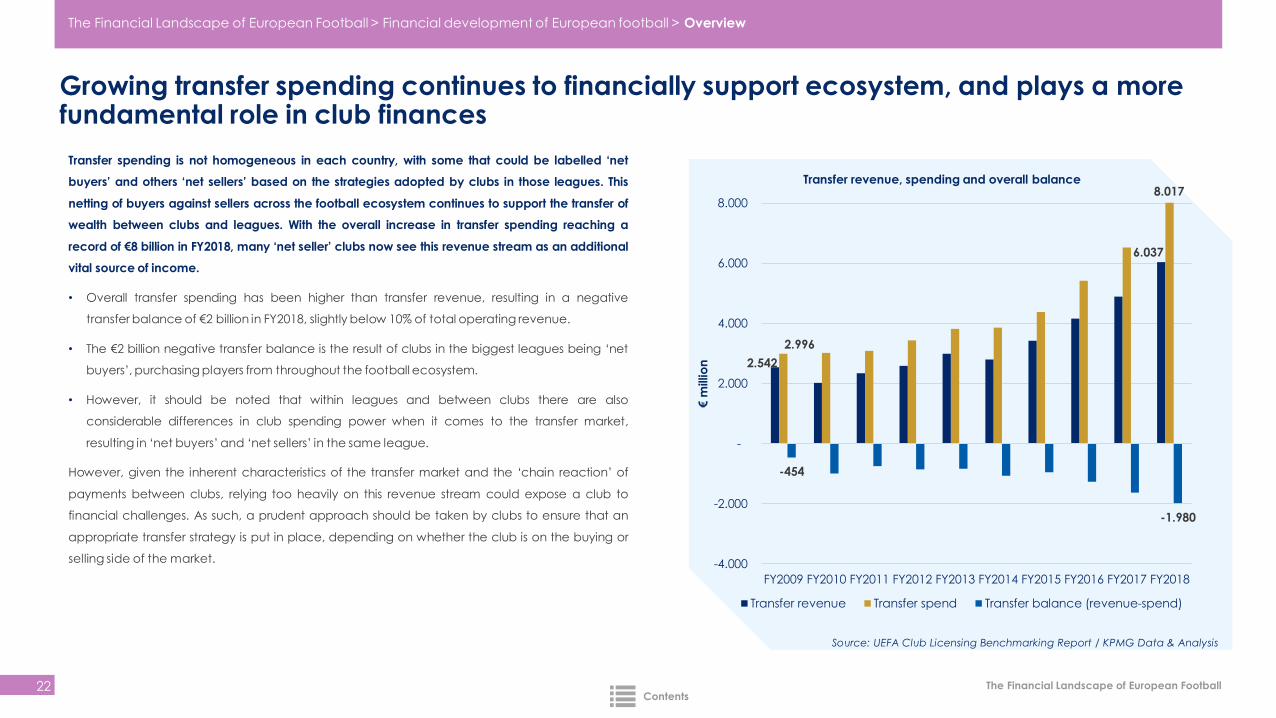
Transfer spending is not homogeneous in each country, with some that could be labelled ‘net
buyers’ and others ‘net sellers’ based on the strategies adopted by clubs in those leagues. This
netting of buyers against sellers across the football ecosystem continues to support the transfer of
wealth between clubs and leagues. With the overall increase in transfer spending reaching a
record of €8 billion in FY2018, many ‘net seller’ clubs now see this revenue stream as an additional
vital source of income.
• Overall transfer spending has been higher than transfer revenue, resulting in a negative
transfer balance of €2 billion in FY2018, slightly below 10% of total operating revenue.
• The €2 billion negative transfer balance is the result of clubs in the biggest leagues being ‘net
buyers’, purchasing players from throughout the football ecosystem.
• However, it should be noted that within leagues and between clubs there are also
considerable differences in club spending power when it comes to the transfer market,
resulting in ‘net buyers’ and ‘net sellers’ in the same league.
However, given the inherent characteristics of the transfer market and the ‘chain reaction’ of
payments between clubs, relying too heavily on this revenue stream could expose a club to
financial challenges. As such, a prudent approach should be taken by clubs to ensure that an
appropriate transfer strategy is put in place, depending on whether the club is on the buying or
selling side of the market.
Source: UEFA Club Licensing Benchmarking Report / KPMG Data & Analysis
The Financial Landscape of European Football > Financial development of European football > Overview
Contents
The Financial Landscape of European Football
Operating costs rose by 70% with near doubling of wages being main driver
23
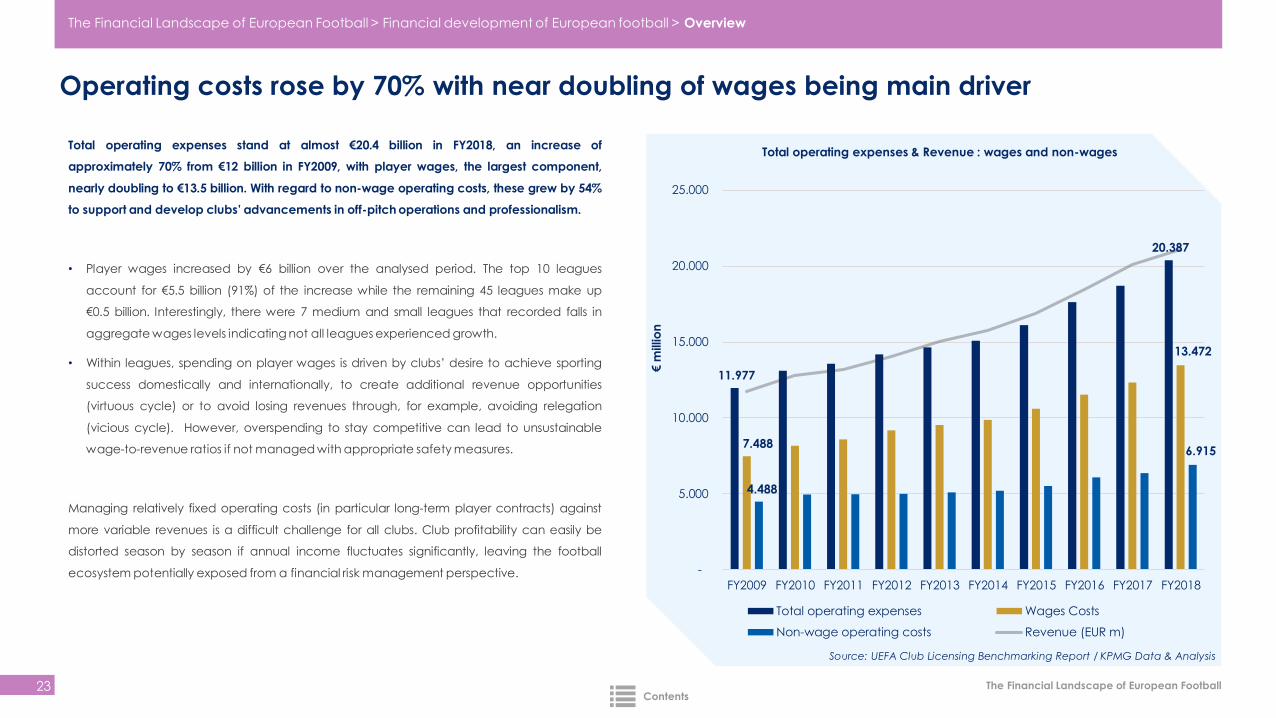
Total operating expenses stand at almost €20.4 billion in FY2018, an increase of
approximately 70% from €12 billion in FY2009, with player wages, the largest component,
nearly doubling to €13.5 billion. With regard to non-wage operating costs, these grew by 54%
to support and develop clubs’ advancements in off-pitch operations and professionalism.
• Player wages increased by €6 billion over the analysed period. The top 10 leagues
account for €5.5 billion (91%) of the increase while the remaining 45 leagues make up
€0.5 billion. Interestingly, there were 7 medium and small leagues that recorded falls in
aggregate wages levels indicating not all leagues experienced growth.
• Within leagues, spending on player wages is driven by clubs’ desire to achieve sporting
success domestically and internationally, to create additional revenue opportunities
(virtuous cycle) or to avoid losing revenues through, for example, avoiding relegation
(vicious cycle). However, overspending to stay competitive can lead to unsustainable
wage-to-revenue ratios if not managed with appropriate safety measures.
Managing relatively fixed operating costs (in particular long-term player contracts) against
more variable revenues is a difficult challenge for all clubs. Club profitability can easily be
distorted season by season if annual income fluctuates significantly, leaving the football
ecosystem potentially exposed from a financial risk management perspective.
Source: UEFA Club Licensing Benchmarking Report / KPMG Data & Analysis
11.977
20.387
7.488
13.472
4.488
6.915
-
5.000
10.000
15.000
20.000
25.000
FY2009 FY2010 FY2011 FY2012 FY2013 FY2014 FY2015 FY2016 FY2017 FY2018
Total operating expenses & Revenue : wages and non-wages
Total operating expenses Wages Costs
Non-wage operating costs Revenue (EUR m)
The Financial Landscape of European Football > Financial development of European football > Overview
€ m
illio
n
Contents
The Financial Landscape of European Football
Although European club football has turned profitable in recent years, half of top-tier clubs still operate with deficits
24
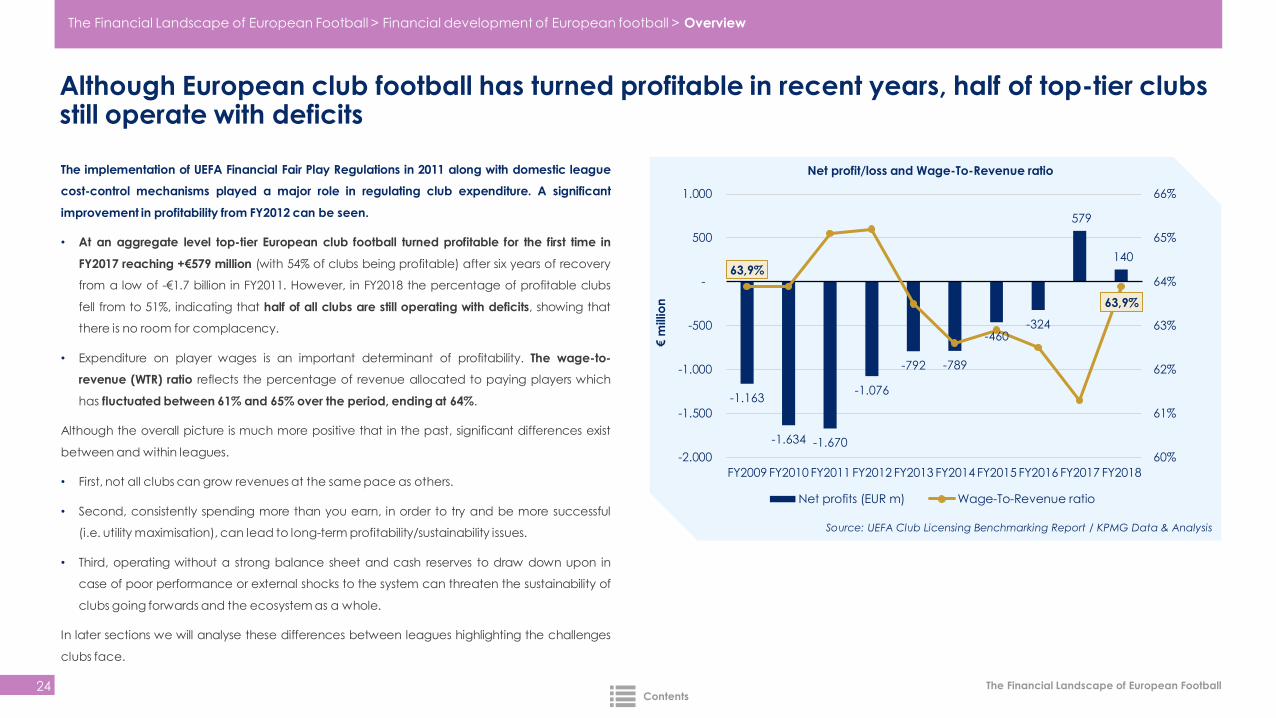
The implementation of UEFA Financial Fair Play Regulations in 2011 along with domestic league
cost-control mechanisms played a major role in regulating club expenditure. A significant
improvement in profitability from FY2012 can be seen.
• At an aggregate level top-tier European club football turned profitable for the first time in
FY2017 reaching +€579 million (with 54% of clubs being profitable) after six years of recovery
from a low of -€1.7 billion in FY2011. However, in FY2018 the percentage of profitable clubs
fell from to 51%, indicating that half of all clubs are still operating with deficits, showing that
there is no room for complacency.
• Expenditure on player wages is an important determinant of profitability. The wage-to-
revenue (WTR) ratio reflects the percentage of revenue allocated to paying players which
has fluctuated between 61% and 65% over the period, ending at 64%.
Although the overall picture is much more positive that in the past, significant differences exist
between and within leagues.
• First, not all clubs can grow revenues at the same pace as others.
• Second, consistently spending more than you earn, in order to try and be more successful
(i.e. utility maximisation), can lead to long-term profitability/sustainability issues.
• Third, operating without a strong balance sheet and cash reserves to draw down upon in
case of poor performance or external shocks to the system can threaten the sustainability of
clubs going forwards and the ecosystem as a whole.
In later sections we will analyse these differences between leagues highlighting the challenges
clubs face.
-1.163
-1.634 -1.670
-1.076
-792 -789
-460 -324
579
140 63,9%
63,9%
60%
61%
62%
63%
64%
65%
66%
-2.000
-1.500
-1.000
-500
-
500
1.000
FY2009 FY2010 FY2011 FY2012 FY2013 FY2014 FY2015 FY2016 FY2017 FY2018
€ m
illio
n
Net profit/loss and Wage-To-Revenue ratio
Net profits (EUR m) Wage-To-Revenue ratio
Source: UEFA Club Licensing Benchmarking Report / KPMG Data & Analysis
The Financial Landscape of European Football > Financial development of European football > Overview
Contents
The Financial Landscape of European Football
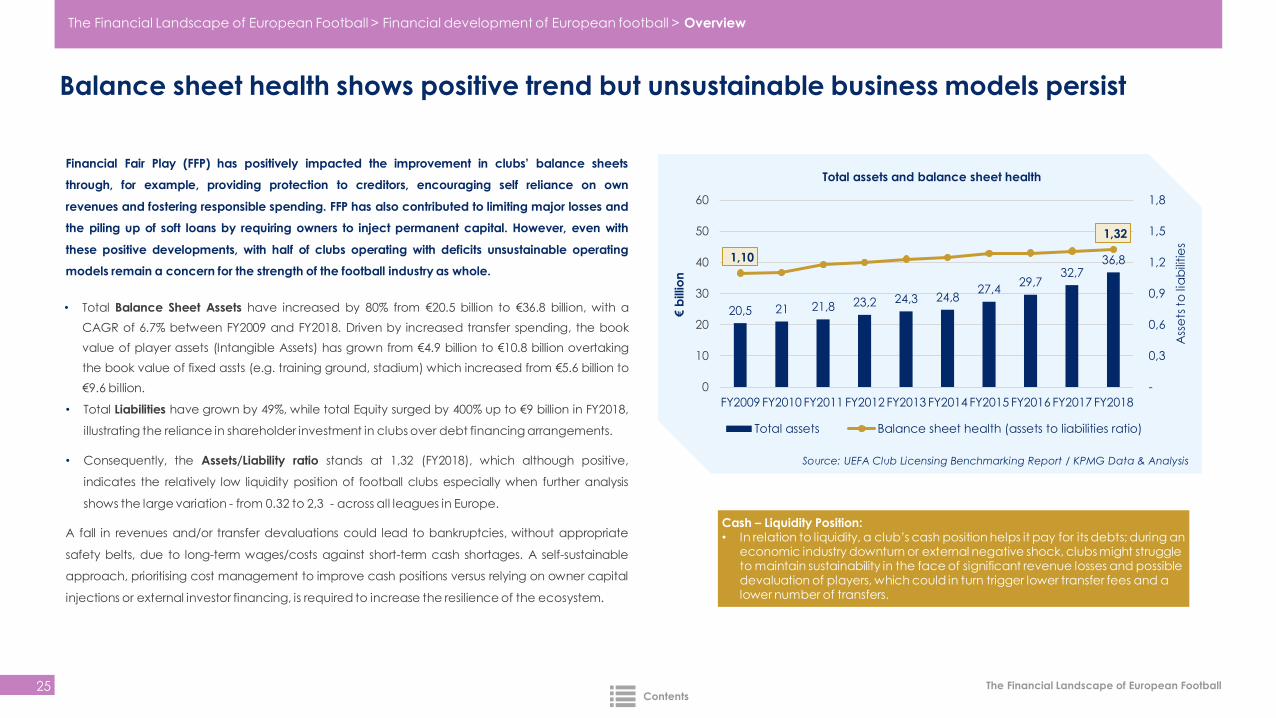
Balance sheet health shows positive trend but unsustainable business models persist
25
20,5 21 21,8 23,2 24,3 24,827,4
29,732,7
36,81,10
1,32
-
0,3
0,6
0,9
1,2
1,5
1,8
0
10
20
30
40
50
60
FY2009 FY2010 FY2011 FY2012 FY2013 FY2014 FY2015 FY2016 FY2017 FY2018
Ass
ets
to
lia
bili
tie
s
€ b
illio
n
Total assets and balance sheet health
Total assets Balance sheet health (assets to liabilities ratio)
Financial Fair Play (FFP) has positively impacted the improvement in clubs’ balance sheets
through, for example, providing protection to creditors, encouraging self reliance on own
revenues and fostering responsible spending. FFP has also contributed to limiting major losses and
the piling up of soft loans by requiring owners to inject permanent capital. However, even with
these positive developments, with half of clubs operating with deficits unsustainable operating
models remain a concern for the strength of the football industry as whole.
• Total Balance Sheet Assets have increased by 80% from €20.5 billion to €36.8 billion, with a
CAGR of 6.7% between FY2009 and FY2018. Driven by increased transfer spending, the book
value of player assets (Intangible Assets) has grown from €4.9 billion to €10.8 billion overtaking
the book value of fixed assts (e.g. training ground, stadium) which increased from €5.6 billion to
€9.6 billion.
• Total Liabilities have grown by 49%, while total Equity surged by 400% up to €9 billion in FY2018,
illustrating the reliance in shareholder investment in clubs over debt financing arrangements.
• Consequently, the Assets/Liability ratio stands at 1,32 (FY2018), which although positive,
indicates the relatively low liquidity position of football clubs especially when further analysis
shows the large variation - from 0.32 to 2,3 - across all leagues in Europe.
A fall in revenues and/or transfer devaluations could lead to bankruptcies, without appropriate
safety belts, due to long-term wages/costs against short-term cash shortages. A self-sustainable
approach, prioritising cost management to improve cash positions versus relying on owner capital
injections or external investor financing, is required to increase the resilience of the ecosystem.
Cash – Liquidity Position:• In relation to liquidity, a club’s cash position helps it pay for its debts; during an
economic industry downturn or external negative shock, clubs might struggle to maintain sustainability in the face of significant revenue losses and possible devaluation of players, which could in turn trigger lower transfer fees and a lower number of transfers.
Source: UEFA Club Licensing Benchmarking Report / KPMG Data & Analysis
The Financial Landscape of European Football > Financial development of European football > Overview
Contents
The Financial Landscape of European Football
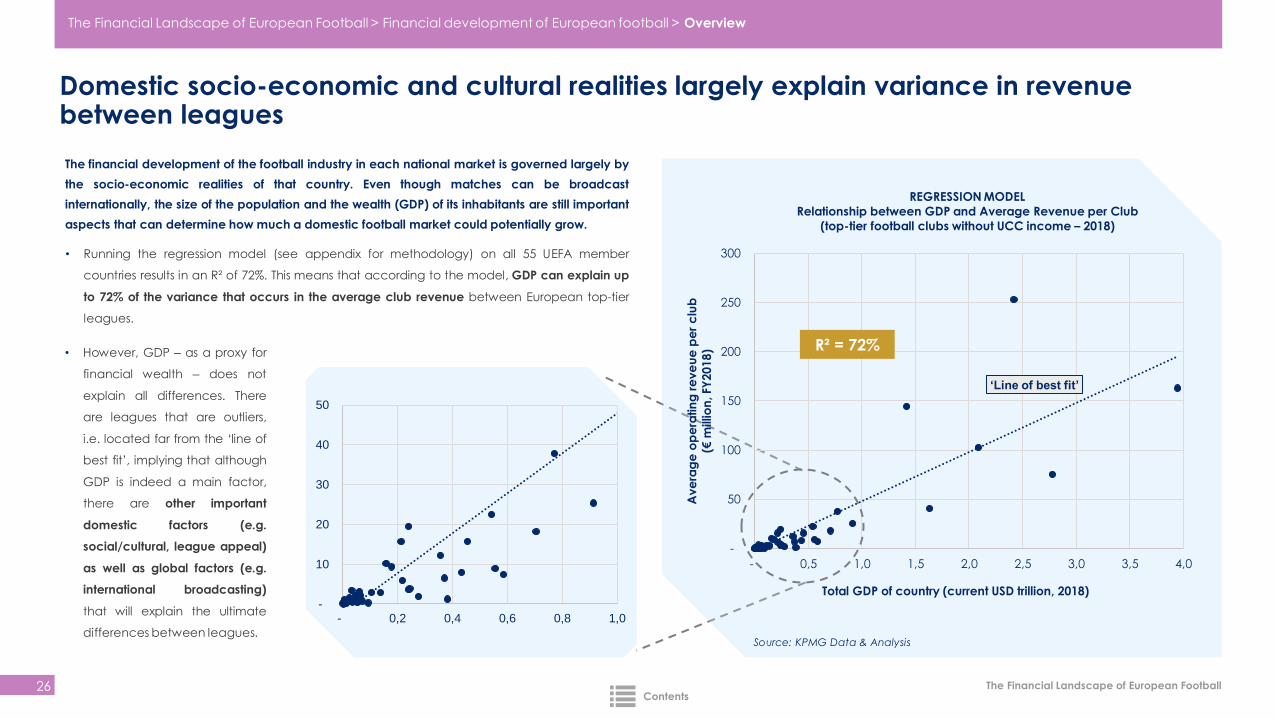
Domestic socio-economic and cultural realities largely explain variance in revenue between leagues
26
The financial development of the football industry in each national market is governed largely by
the socio-economic realities of that country. Even though matches can be broadcast
internationally, the size of the population and the wealth (GDP) of its inhabitants are still important
aspects that can determine how much a domestic football market could potentially grow.
• Running the regression model (see appendix for methodology) on all 55 UEFA member
countries results in an R² of 72%. This means that according to the model, GDP can explain up
to 72% of the variance that occurs in the average club revenue between European top-tier
leagues.
Source: KPMG Data & Analysis
‘Line of best fit’
-
50
100
150
200
250
300
- 0,5 1,0 1,5 2,0 2,5 3,0 3,5 4,0
Ave
rag
eo
pe
ratin
gre
ve
ue
pe
r c
lub
(€ m
illio
n, FY
2018)
Total GDP of country (current USD trillion, 2018)
REGRESSION MODEL
Relationship between GDP and Average Revenue per Club
(top-tier football clubs without UCC income – 2018)
R² = 72%
-
10
20
30
40
50
- 0,2 0,4 0,6 0,8 1,0
• However, GDP – as a proxy for
financial wealth – does not
explain all differences. There
are leagues that are outliers,
i.e. located far from the ‘line of
best fit’, implying that although
GDP is indeed a main factor,
there are other important
domestic factors (e.g.
social/cultural, league appeal)
as well as global factors (e.g.
international broadcasting)
that will explain the ultimate
differences between leagues.
The Financial Landscape of European Football > Financial development of European football > Overview
Contents

The Financial Landscape of European Football
Professional league and club structures underpin financial development
27
The degree of professionalisation of league and club structures also influences the ability to generate and grow revenue, and contributes to explaining some of the variation between leagues. The
table below highlights some of the key areas from a league and club perspective.
Leagues and clubs must continue to improve and innovate to keep up with new trends in the media and technology landscape, as well as longer-term societal changes, such as demographic
and cultural shifts, which will impact its relationship with its fans and thereby, also, its financial development.
Source: European Leagues
LEAGUE AND CLUB STRUCTURES: Degree of Professionalisation
CLUBLEAGUE
GOVERNANCE Governance structure
Member representation
Expertise committees
Decision-making
INTERNAL BUSINESS SETUP
Divisions/Departments/
Workforce
(inhouse vs. external
expertise)
Value Chain
(inhouse vs. external
expertise)
VALUE PROPOSITION
B2B
EXTERNAL BUSINESS SETUP
Leverage / Accelerator
IN
TE
RD
EP
EN
DE
NT
B2C
Legal form; organigram; organs; leadership; management; controls Legal form; shareholders; organs; organigram; leadership; mgmt.; controls
Fan/shareholder representationClub representation
League commissions; club working groups
Committees; authorities; quorum
Strategic vs. operational working groups
Committees; authorities; quorum
Sport: Football; Youth; Club Licensing; Fan; Certification
Business: Legal; Finance; Business Intel.; Stakeholder Affairs; Communication; HR
Commercial: Audio-visual; Production; Distribution; Marketing; Sales; Events; Intl.
Sporting: Regulatory; Competition organisation
Commercial/Media (league rights): Sells broadcasting rights on behalf of
participating clubs. Sells sponsorship and other league-related IP rights
Sport: Football; Youth; Fan Affairs; Medical; Science(Nutrition); Analysts; Scouting
Business: Legal; Finance; Business Intel.; Stakeholder Affairs; Communication; HR
Commercial: Marketing; Merchandise; Sponsoring; Content; Internationalisation
Sporting: Player recruitment; development; sporting/business ROI
Commercial (club rights): Sells brand and other marketing IP, including
sponsorship IP rights
Commercial rights and audience: Unique opportunity to reach target audiences
and local/global exposure to boost sales and brand awareness utilising various
assets, data sources and touchpoints provided by the club
Community: Connect people who share the same passion and values with the
sense of belonging to an exclusive community
Content and merchandise: Access to content and merchandise to boost fan
engagement and strengthen the connection and loyality of the fans
Content: Centrally-managed rights offer exclusivity to high-quaility sports
content, business intelligence data
Commercial rights and audience: Unique opportunity to reach target audiences
and local/global exposure to boost sales and brand awareness
Opportunities for diversification and digitalisation
Content and merchandise: Access to content and merchandise to boost fan
engagement and strengthen connection with and loyality of fans
Reliability: Organize the league and matches with integrity and safety standards
Strategic approach; assets; target market/ groups; stakeholder/consumer
management; monetisation
Strategic approach; assets; target market/ groups; stakeholder/consumer
management; monetisation
The Financial Landscape of European Football > Financial development of European football > Overview
Contents
Cluster-based analysis
The Financial Landscape of European Football
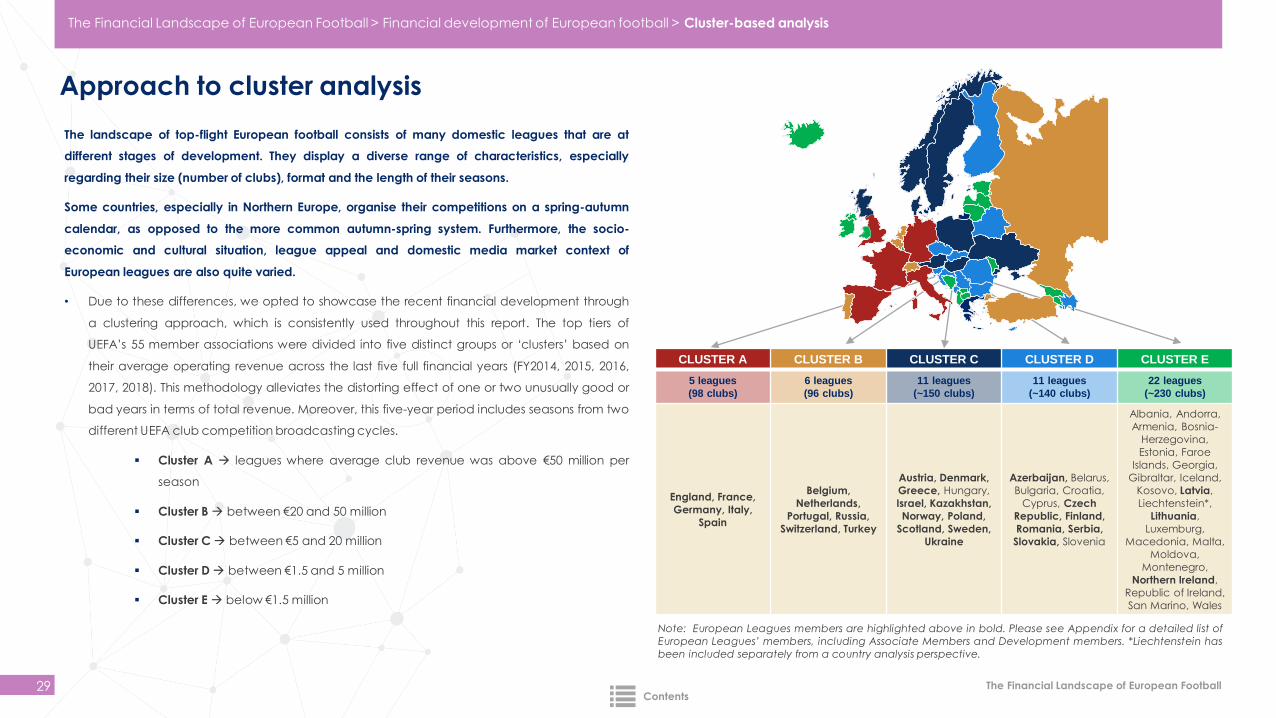
Approach to cluster analysis
29
The landscape of top-flight European football consists of many domestic leagues that are at
different stages of development. They display a diverse range of characteristics, especially
regarding their size (number of clubs), format and the length of their seasons.
Some countries, especially in Northern Europe, organise their competitions on a spring-autumn
calendar, as opposed to the more common autumn-spring system. Furthermore, the socio-
economic and cultural situation, league appeal and domestic media market context of
European leagues are also quite varied.
• Due to these differences, we opted to showcase the recent financial development through
a clustering approach, which is consistently used throughout this report. The top tiers of
UEFA’s 55 member associations were divided into five distinct groups or ‘clusters’ based on
their average operating revenue across the last five full financial years (FY2014, 2015, 2016,
2017, 2018). This methodology alleviates the distorting effect of one or two unusually good or
bad years in terms of total revenue. Moreover, this five-year period includes seasons from two
different UEFA club competition broadcasting cycles.
▪ Cluster A → leagues where average club revenue was above €50 million per
season
▪ Cluster B → between €20 and 50 million
▪ Cluster C → between €5 and 20 million
▪ Cluster D → between €1.5 and 5 million
▪ Cluster E → below €1.5 million
CLUSTER A CLUSTER B CLUSTER C CLUSTER D CLUSTER E
5 leagues
(98 clubs)
6 leagues
(96 clubs)
11 leagues
(~150 clubs)
11 leagues
(~140 clubs)
22 leagues
(~230 clubs)
England, France,
Germany, Italy,
Spain
Belgium,
Netherlands,
Portugal, Russia,
Switzerland, Turkey
Austria, Denmark,
Greece, Hungary,
Israel, Kazakhstan,
Norway, Poland,
Scotland, Sweden,
Ukraine
Azerbaijan, Belarus,
Bulgaria, Croatia,
Cyprus, Czech
Republic, Finland,
Romania, Serbia,
Slovakia, Slovenia
Albania, Andorra,
Armenia, Bosnia-
Herzegovina,
Estonia, Faroe
Islands, Georgia,
Gibraltar, Iceland,
Kosovo, Latvia,
Liechtenstein*,
Lithuania,
Luxemburg,
Macedonia, Malta,
Moldova,
Montenegro,
Northern Ireland,
Republic of Ireland,
San Marino, Wales
Note: European Leagues members are highlighted above in bold. Please see Appendix for a detailed list of
European Leagues’ members, including Associate Members and Development members. *Liechtenstein has
been included separately from a country analysis perspective.
The Financial Landscape of European Football > Financial development of European football > Cluster-based analysis
Contents
The Financial Landscape of European Football
0%
10%
20%
30%
40%
50%
60%
70%
80%
90%
100%
FY2014 FY2015 FY2016 FY2017 FY2018
Cluster C
Large differences in revenue stream mix between clusters
30
Revenue mix evolution by cluster
0%
10%
20%
30%
40%
50%
60%
70%
80%
90%
100%
FY2014 FY2015 FY2016 FY2017 FY2018
Cluster A
0%
10%
20%
30%
40%
50%
60%
70%
80%
90%
100%
FY2014 FY2015 FY2016 FY2017 FY2018
Cluster B
0%
10%
20%
30%
40%
50%
60%
70%
80%
90%
100%
FY2014 FY2015 FY2016 FY2017 FY2018
Cluster D
0%
10%
20%
30%
40%
50%
60%
70%
80%
90%
100%
FY2014 FY2015 FY2016 FY2017 FY2018
Cluster E
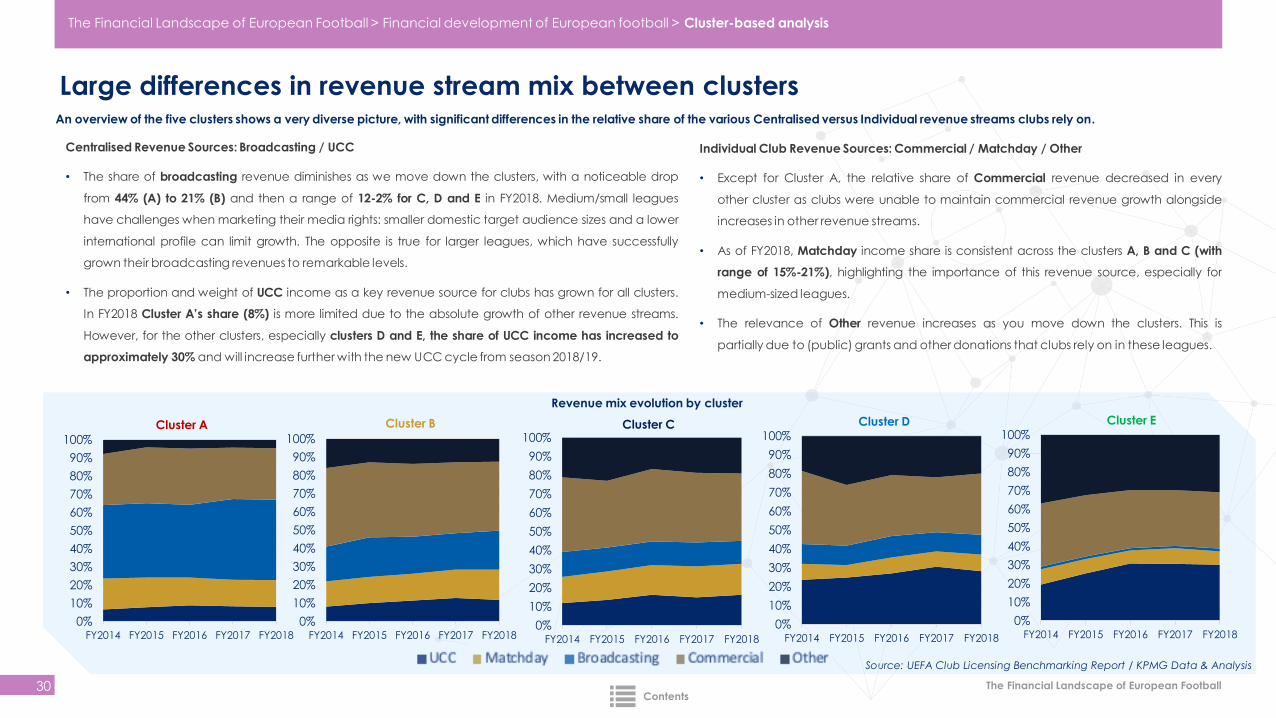
Individual Club Revenue Sources: Commercial / Matchday / Other
• Except for Cluster A, the relative share of Commercial revenue decreased in every
other cluster as clubs were unable to maintain commercial revenue growth alongside
increases in other revenue streams.
• As of FY2018, Matchday income share is consistent across the clusters A, B and C (with
range of 15%-21%), highlighting the importance of this revenue source, especially for
medium-sized leagues.
• The relevance of Other revenue increases as you move down the clusters. This is
partially due to (public) grants and other donations that clubs rely on in these leagues.
Centralised Revenue Sources: Broadcasting / UCC
• The share of broadcasting revenue diminishes as we move down the clusters, with a noticeable drop
from 44% (A) to 21% (B) and then a range of 12-2% for C, D and E in FY2018. Medium/small leagues
have challenges when marketing their media rights: smaller domestic target audience sizes and a lower
international profile can limit growth. The opposite is true for larger leagues, which have successfully
grown their broadcasting revenues to remarkable levels.
• The proportion and weight of UCC income as a key revenue source for clubs has grown for all clusters.
In FY2018 Cluster A’s share (8%) is more limited due to the absolute growth of other revenue streams.
However, for the other clusters, especially clusters D and E, the share of UCC income has increased to
approximately 30% and will increase further with the new UCC cycle from season 2018/19.
An overview of the five clusters shows a very diverse picture, with significant differences in the relative share of the various Centralised versus Individual revenue streams clubs rely on.
Source: UEFA Club Licensing Benchmarking Report / KPMG Data & Analysis
The Financial Landscape of European Football > Financial development of European football > Cluster-based analysis
Contents
The Financial Landscape of European Football
Impressive average club revenue growth but not throughout the ecosystem
31
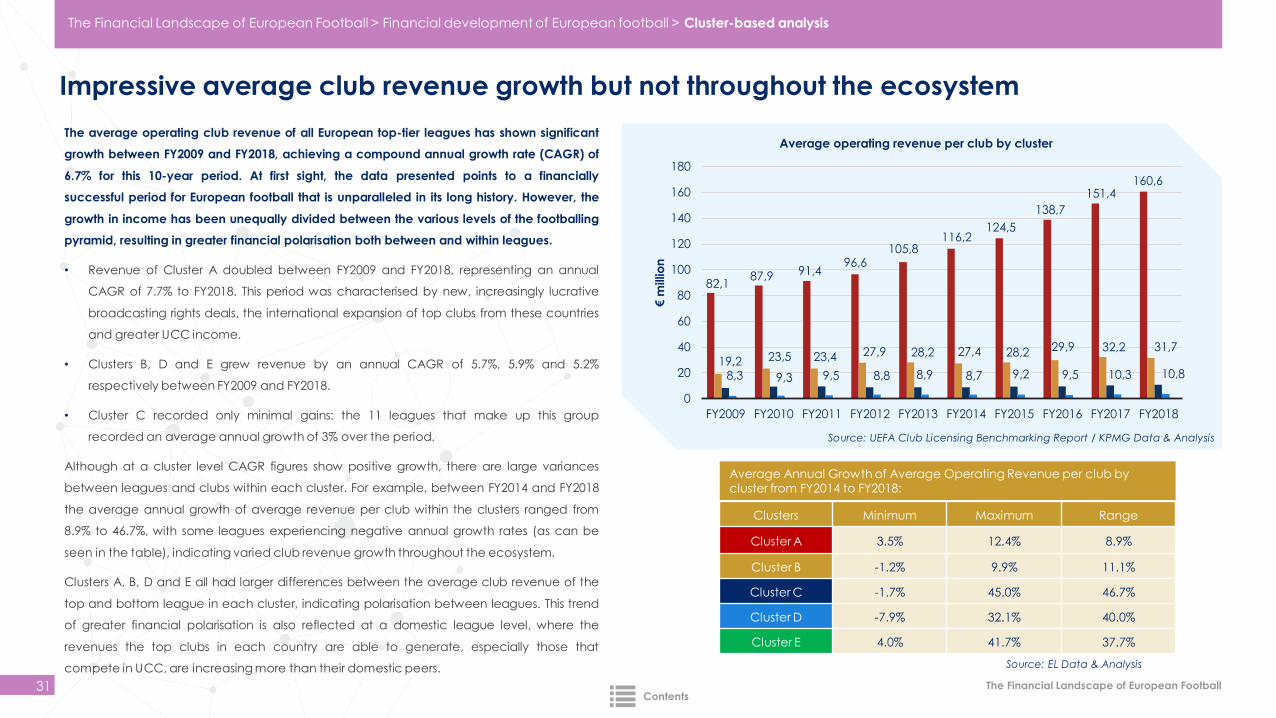
The average operating club revenue of all European top-tier leagues has shown significant
growth between FY2009 and FY2018, achieving a compound annual growth rate (CAGR) of
6.7% for this 10-year period. At first sight, the data presented points to a financially
successful period for European football that is unparalleled in its long history. However, the
growth in income has been unequally divided between the various levels of the footballing
pyramid, resulting in greater financial polarisation both between and within leagues.
• Revenue of Cluster A doubled between FY2009 and FY2018, representing an annual
CAGR of 7.7% to FY2018. This period was characterised by new, increasingly lucrative
broadcasting rights deals, the international expansion of top clubs from these countries
and greater UCC income.
• Clusters B, D and E grew revenue by an annual CAGR of 5.7%, 5.9% and 5.2%
respectively between FY2009 and FY2018.
• Cluster C recorded only minimal gains: the 11 leagues that make up this group
recorded an average annual growth of 3% over the period.
Although at a cluster level CAGR figures show positive growth, there are large variances
between leagues and clubs within each cluster. For example, between FY2014 and FY2018
the average annual growth of average revenue per club within the clusters ranged from
8.9% to 46.7%, with some leagues experiencing negative annual growth rates (as can be
seen in the table), indicating varied club revenue growth throughout the ecosystem.
Clusters A, B, D and E all had larger differences between the average club revenue of the
top and bottom league in each cluster, indicating polarisation between leagues. This trend
of greater financial polarisation is also reflected at a domestic league level, where the
revenues the top clubs in each country are able to generate, especially those that
compete in UCC, are increasing more than their domestic peers.
82,1 87,9 91,4
96,6 105,8
116,2 124,5
138,7
151,4 160,6
19,2 23,5 23,4 27,9 28,2 27,4 28,2 29,9 32,2 31,7
8,3 9,3 9,5 8,8 8,9 8,7 9,2 9,5 10,3 10,8
0
20
40
60
80
100
120
140
160
180
FY2009 FY2010 FY2011 FY2012 FY2013 FY2014 FY2015 FY2016 FY2017 FY2018
€ m
illio
n
Average operating revenue per club by cluster
Source: UEFA Club Licensing Benchmarking Report / KPMG Data & Analysis
The Financial Landscape of European Football > Financial development of European football > Cluster-based analysis
Clusters Minimum Maximum Range
Cluster A 3.5% 12.4% 8.9%
Cluster B -1.2% 9.9% 11.1%
Cluster C -1.7% 45.0% 46.7%
Cluster D -7.9% 32.1% 40.0%
Cluster E 4.0% 41.7% 37.7%
Source: EL Data & Analysis
Average Annual Growth of Average Operating Revenue per club by cluster from FY2014 to FY2018:
Contents
The Financial Landscape of European Football
Financial gaps, especially between top three clusters, have accelerated from 2011-2012
32
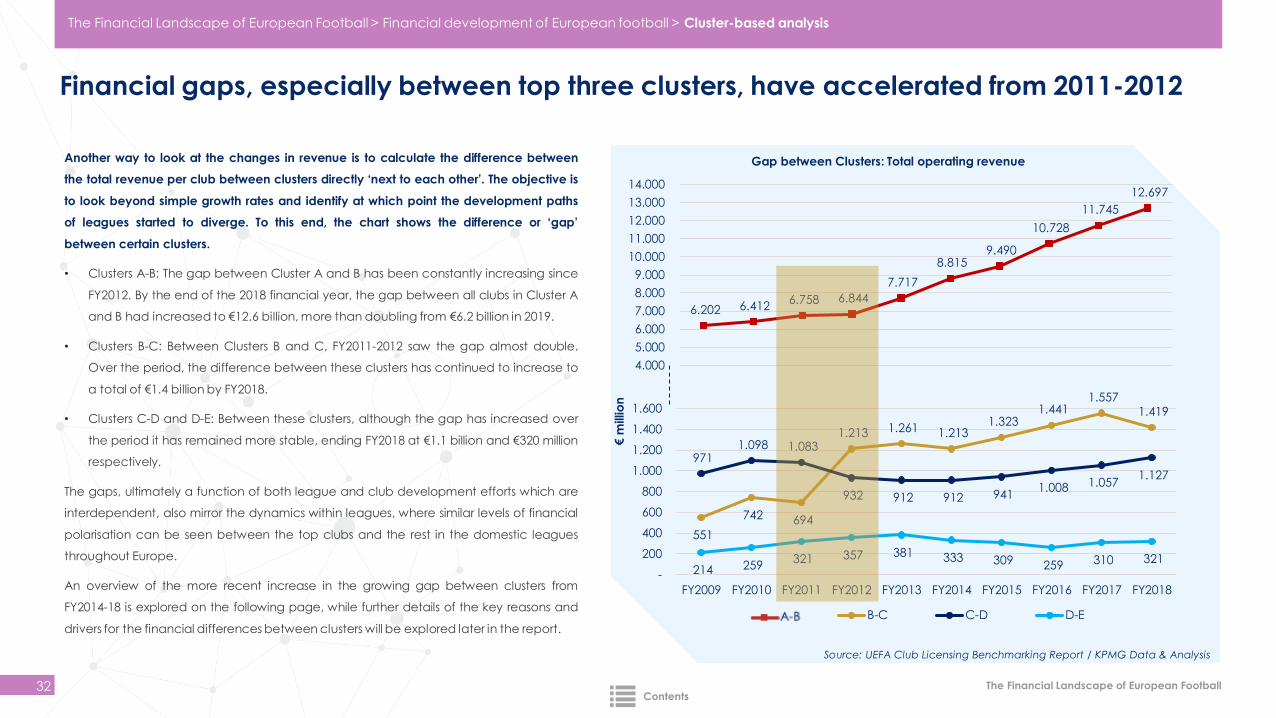
Another way to look at the changes in revenue is to calculate the difference between
the total revenue per club between clusters directly ‘next to each other’. The objective is
to look beyond simple growth rates and identify at which point the development paths
of leagues started to diverge. To this end, the chart shows the difference or ‘gap’
between certain clusters.
• Clusters A-B: The gap between Cluster A and B has been constantly increasing since
FY2012. By the end of the 2018 financial year, the gap between all clubs in Cluster A
and B had increased to €12.6 billion, more than doubling from €6.2 billion in 2019.
• Clusters B-C: Between Clusters B and C, FY2011-2012 saw the gap almost double.
Over the period, the difference between these clusters has continued to increase to
a total of €1.4 billion by FY2018.
• Clusters C-D and D-E: Between these clusters, although the gap has increased over
the period it has remained more stable, ending FY2018 at €1.1 billion and €320 million
respectively.
The gaps, ultimately a function of both league and club development efforts which are
interdependent, also mirror the dynamics within leagues, where similar levels of financial
polarisation can be seen between the top clubs and the rest in the domestic leagues
throughout Europe.
An overview of the more recent increase in the growing gap between clusters from
FY2014-18 is explored on the following page, while further details of the key reasons and
drivers for the financial differences between clusters will be explored later in the report.
6.202 6.412 6.758 6.844
7.717
8.815 9.490
10.728
11.745
12.697
4.000
5.000
6.000
7.000
8.000
9.000
10.000
11.000
12.000
13.000
14.000
Gap between Clusters: Total operating revenue
551
742 694
1.213 1.261 1.213 1.323
1.441 1.557
1.419
971 1.098 1.083
932 912 912 941 1.008 1.057
1.127
214 259 321 357 381 333 309 259 310 321
-
200
400
600
800
1.000
1.200
1.400
1.600
FY2009 FY2010 FY2011 FY2012 FY2013 FY2014 FY2015 FY2016 FY2017 FY2018
€ m
illio
nB-C C-D D-E
Source: UEFA Club Licensing Benchmarking Report / KPMG Data & Analysis
The Financial Landscape of European Football > Financial development of European football > Cluster-based analysis
Contents
The Financial Landscape of European Football
Broadcasting, commercial and UCC driving increase of financial gaps
33
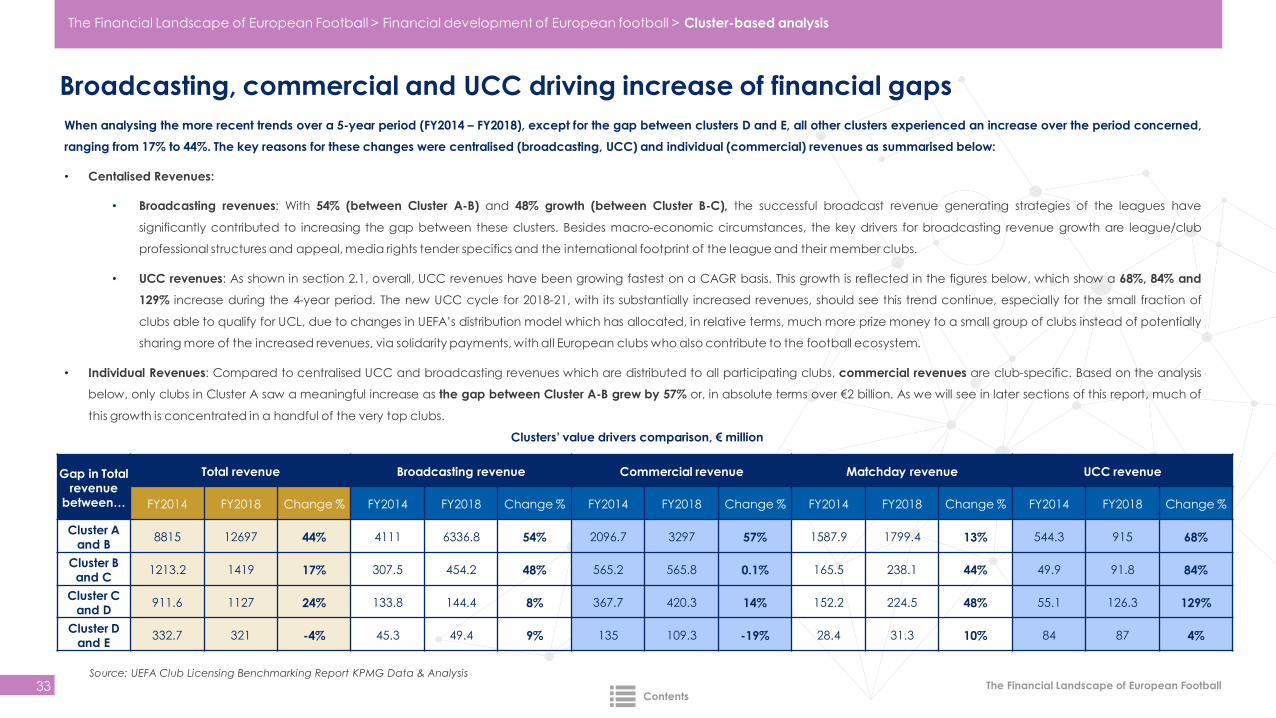
When analysing the more recent trends over a 5-year period (FY2014 – FY2018), except for the gap between clusters D and E, all other clusters experienced an increase over the period concerned,
ranging from 17% to 44%. The key reasons for these changes were centralised (broadcasting, UCC) and individual (commercial) revenues as summarised below:
• Centalised Revenues:
• Broadcasting revenues: With 54% (between Cluster A-B) and 48% growth (between Cluster B-C), the successful broadcast revenue generating strategies of the leagues have
significantly contributed to increasing the gap between these clusters. Besides macro-economic circumstances, the key drivers for broadcasting revenue growth are league/club
professional structures and appeal, media rights tender specifics and the international footprint of the league and their member clubs.
• UCC revenues: As shown in section 2.1, overall, UCC revenues have been growing fastest on a CAGR basis. This growth is reflected in the figures below, which show a 68%, 84% and
129% increase during the 4-year period. The new UCC cycle for 2018-21, with its substantially increased revenues, should see this trend continue, especially for the small fraction of
clubs able to qualify for UCL, due to changes in UEFA’s distribution model which has allocated, in relative terms, much more prize money to a small group of clubs instead of potentially
sharing more of the increased revenues, via solidarity payments, with all European clubs who also contribute to the football ecosystem.
• Individual Revenues: Compared to centralised UCC and broadcasting revenues which are distributed to all participating clubs, commercial revenues are club-specific. Based on the analysis
below, only clubs in Cluster A saw a meaningful increase as the gap between Cluster A-B grew by 57% or, in absolute terms over €2 billion. As we will see in later sections of this report, much of
this growth is concentrated in a handful of the very top clubs.
Clusters’ value drivers comparison, € million
Source: UEFA Club Licensing Benchmarking Report KPMG Data & Analysis
Gap in Total revenue
between…
Total revenue Broadcasting revenue Commercial revenue Matchday revenue UCC revenue
FY2014 FY2018 Change % FY2014 FY2018 Change % FY2014 FY2018 Change % FY2014 FY2018 Change % FY2014 FY2018 Change %
Cluster A and B
8815 12697 44% 4111 6336.8 54% 2096.7 3297 57% 1587.9 1799.4 13% 544.3 915 68%
Cluster B and C
1213.2 1419 17% 307.5 454.2 48% 565.2 565.8 0.1% 165.5 238.1 44% 49.9 91.8 84%
Cluster C and D
911.6 1127 24% 133.8 144.4 8% 367.7 420.3 14% 152.2 224.5 48% 55.1 126.3 129%
Cluster D and E
332.7 321 -4% 45.3 49.4 9% 135 109.3 -19% 28.4 31.3 10% 84 87 4%
The Financial Landscape of European Football > Financial development of European football > Cluster-based analysis
Contents

The Financial Landscape of European Football
Top clubs’ revenues growing faster than all other clubs
34
Even though socio-economic realities, as measured by GDP, can largely explain the variance in club revenues across clusters, top clubs – compared at a domestic level as well as internationally –
are experiencing the fastest growth. Driven by regular participation in international competitions versus their counterparts, who primarily only compete in national competitions, the top clubs – in all
leagues – are able to generate surplus revenues from sizable UCC distributions, whether this be from group stage onwards or qualifying round payments. Participation in UCC not only provides direct
additional benefits (i.e. receiving prize money) but also provides indirect benefits via additional matchday and commercial revenue growth opportunities, if capitalised on, through exposure on the
international stage. While the club data below relates to the top 10 wealthiest clubs, the analysis can be seen as a proxy for similar differences within individual domestic leagues where the top
clubs continue to pull away financially, especially those that have strategically (re)invested surplus financial resources into strengthening their commercial capabilities.
• Bottom Right Chart: Following a relatively stable period between FY2009 and FY2013, the
combined revenue of the 10 wealthiest clubs caught up and overtook – for the first time
in FY2016 - the total aggregate revenues of all 600 clubs in the four other clusters (B, C, D
and E) combined.
• Bottom Left Chart: The top 10 wealthiest clubs have grown revenues faster (212%) than the
rest of all 88 clubs in Cluster A (187%) and also the 600+ clubs in Clusters B, C, D and E
combined (150%).
Evolution of revenue of top 10 wealthiest clubs, rest of clubs inCluster A and the combined revenue of all clubs in Clusters B-E
158
172
193198
212
100
133141
157
178
187
126131
136
148 150
100
110
120
130
140
150
160
170
180
190
200
210
220
230
FY2009 FY2010 FY2011 FY2012 FY2013 FY2014 FY2015 FY2016 FY2017 FY2018
Top 10 Rest of Cluster A Clusters B,C,D & E
Revenue growth (%) of top 10 wealthiest clubs, rest of clubs in Cluster A and the combined revenue of all clubs in Clusters B-E
2.702 2.972
3.695
5.228 5.734
3.573
4.2304.633
4.8745.344
5.346
5.986
6.677
8.368
10.008
900
1.800
2.700
3.600
4.500
5.400
6.300
7.200
8.100
9.000
9.900
10.800
FY2009 FY2010 FY2011 FY2012 FY2013 FY2014 FY2015 FY2016 FY2017 FY2018
Top 10 Cluster B, C, D & E Rest of Cluster A€ m
illio
nSource: UEFA Club Licensing Benchmarking Report / KPMG Data & Analysis
Source: UEFA Club Licensing Benchmarking Report / KPMG Data & Analysis
The Financial Landscape of European Football > Financial development of European football > Cluster-based analysis
Pe
rce
nta
ge
Contents

Analysis by revenue and expenditure streams

League broadcasting revenue
The Financial Landscape of European Football
Uneven growth of broadcasting revenues
37
FY2014 FY2015 FY2016 FY2017 FY2018
A 46,93 51,01 55,65 67,45 71,30
B 5,19 6,14 6,09 6,43 6,78
C 1,16 1,18 1,21 1,32 1,31
D 0,33 0,33 0,34 0,34 0,37
E 0,01 0,01 0,01 0,01 0,01
0
10
20
30
40
50
60
70
80
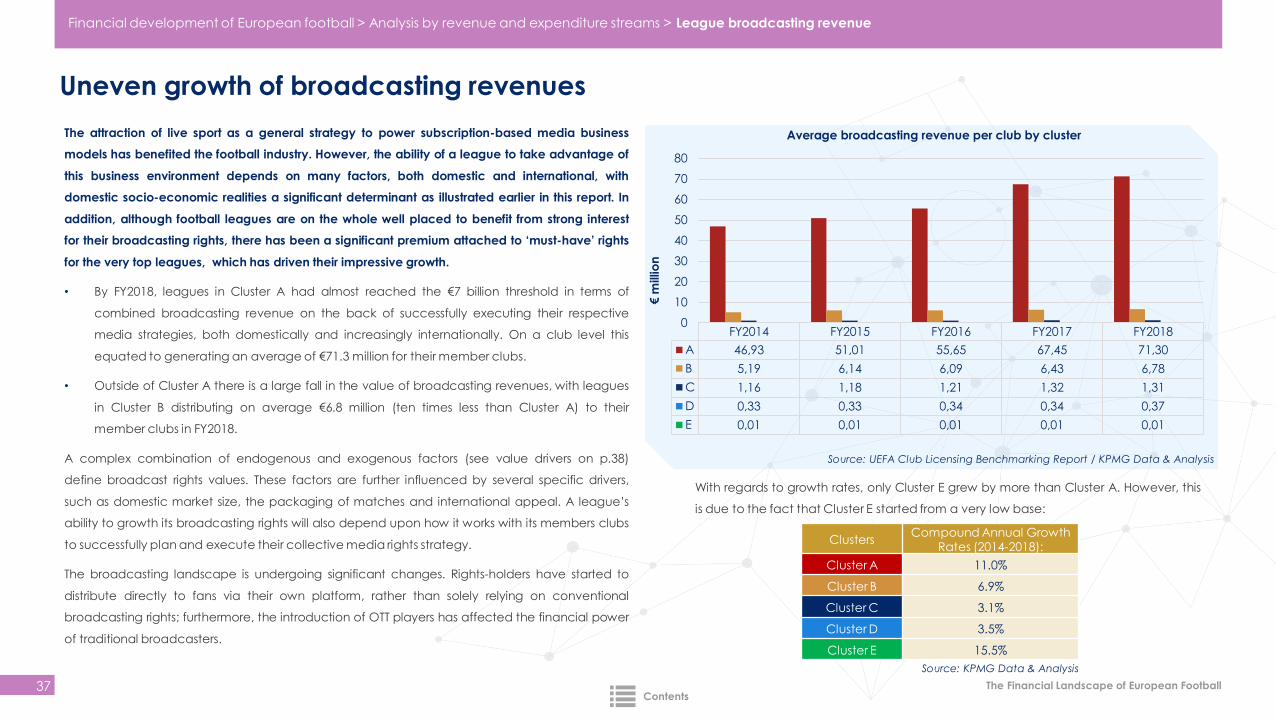
Average broadcasting revenue per club by clusterThe attraction of live sport as a general strategy to power subscription-based media business
models has benefited the football industry. However, the ability of a league to take advantage of
this business environment depends on many factors, both domestic and international, with
domestic socio-economic realities a significant determinant as illustrated earlier in this report. In
addition, although football leagues are on the whole well placed to benefit from strong interest
for their broadcasting rights, there has been a significant premium attached to ‘must-have’ rights
for the very top leagues, which has driven their impressive growth.
• By FY2018, leagues in Cluster A had almost reached the €7 billion threshold in terms of
combined broadcasting revenue on the back of successfully executing their respective
media strategies, both domestically and increasingly internationally. On a club level this
equated to generating an average of €71.3 million for their member clubs.
• Outside of Cluster A there is a large fall in the value of broadcasting revenues, with leagues
in Cluster B distributing on average €6.8 million (ten times less than Cluster A) to their
member clubs in FY2018.
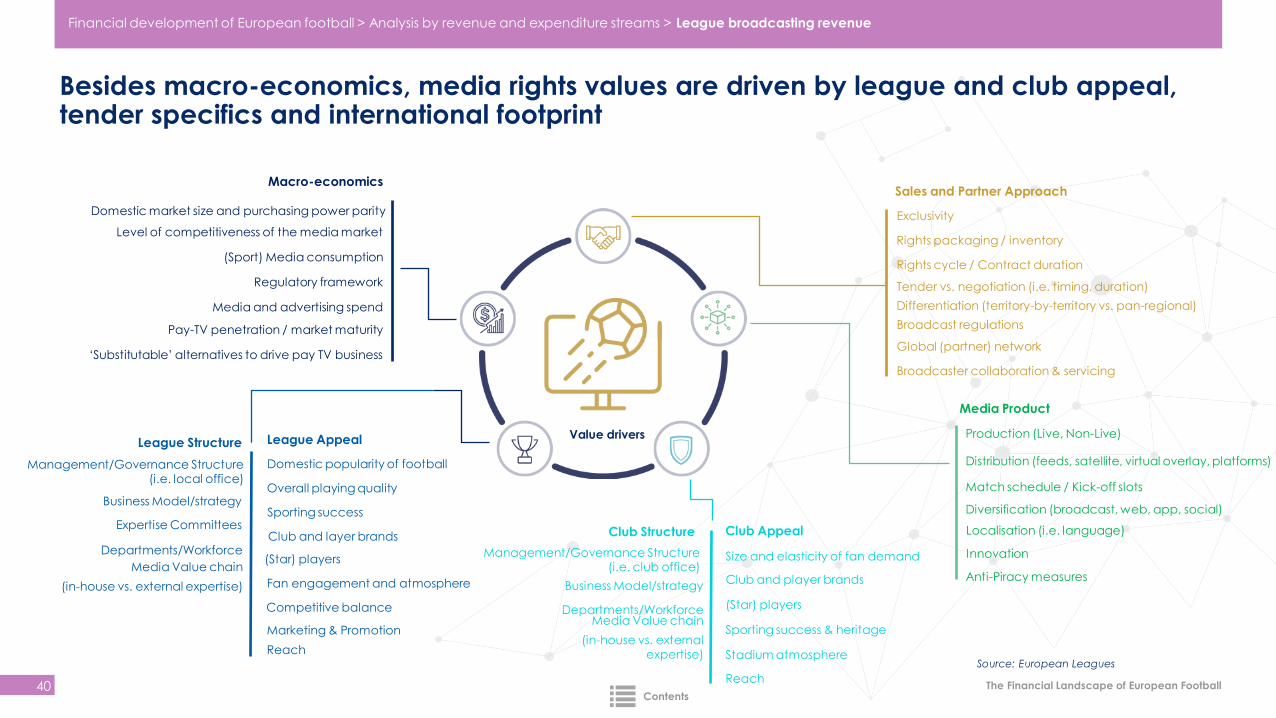
A complex combination of endogenous and exogenous factors (see value drivers on p.38)
define broadcast rights values. These factors are further influenced by several specific drivers,
such as domestic market size, the packaging of matches and international appeal. A league’s
ability to growth its broadcasting rights will also depend upon how it works with its members clubs
to successfully plan and execute their collective media rights strategy.
The broadcasting landscape is undergoing significant changes. Rights-holders have started to
distribute directly to fans via their own platform, rather than solely relying on conventional
broadcasting rights; furthermore, the introduction of OTT players has affected the financial power
of traditional broadcasters.
ClustersCompound Annual Growth
Rates (2014-2018):
Cluster A 11.0%
Cluster B 6.9%
Cluster C 3.1%
Cluster D 3.5%
Cluster E 15.5%
Source: KPMG Data & Analysis
With regards to growth rates, only Cluster E grew by more than Cluster A. However, this
is due to the fact that Cluster E started from a very low base:
€ m
illio
n
Source: UEFA Club Licensing Benchmarking Report / KPMG Data & Analysis
Financial development of European football > Analysis by revenue and expenditure streams > League broadcasting revenue
Contents
The Financial Landscape of European Football
Broadcasting share of total revenues varies significantly within leagues
38
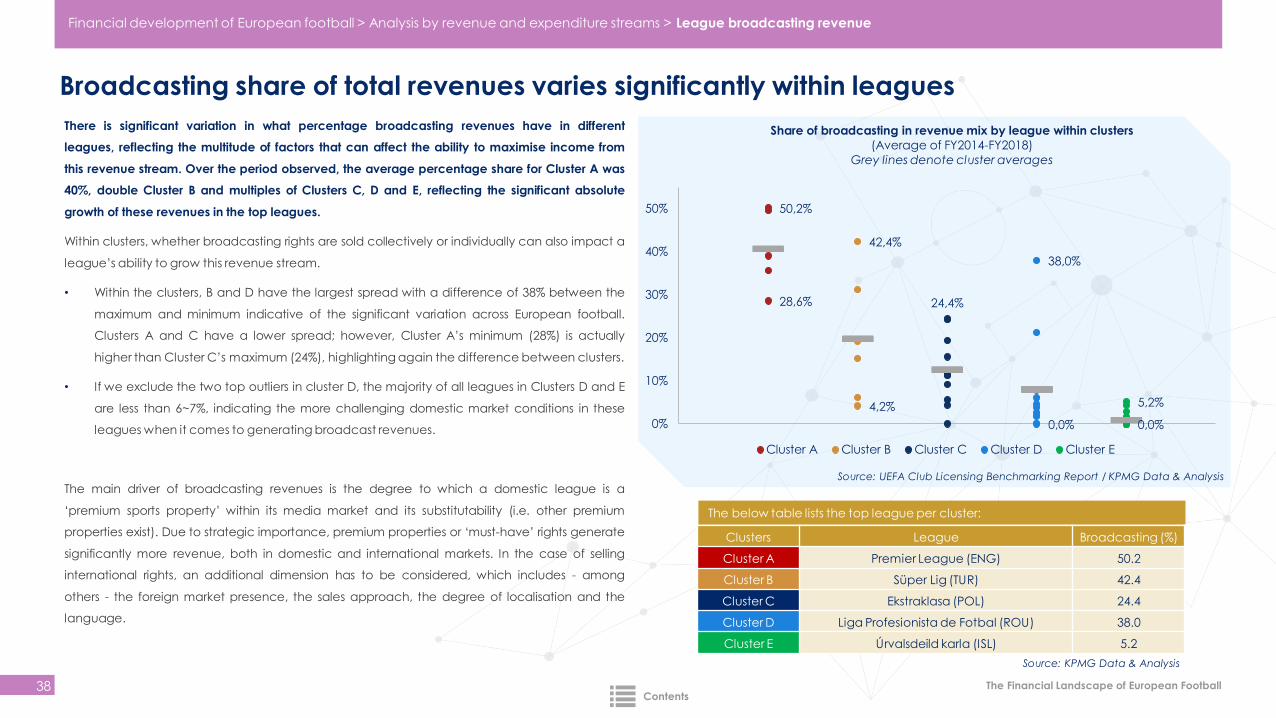
There is significant variation in what percentage broadcasting revenues have in different
leagues, reflecting the multitude of factors that can affect the ability to maximise income from
this revenue stream. Over the period observed, the average percentage share for Cluster A was
40%, double Cluster B and multiples of Clusters C, D and E, reflecting the significant absolute
growth of these revenues in the top leagues.
Within clusters, whether broadcasting rights are sold collectively or individually can also impact a
league’s ability to grow this revenue stream.
• Within the clusters, B and D have the largest spread with a difference of 38% between the
maximum and minimum indicative of the significant variation across European football.
Clusters A and C have a lower spread; however, Cluster A’s minimum (28%) is actually
higher than Cluster C’s maximum (24%), highlighting again the difference between clusters.
• If we exclude the two top outliers in cluster D, the majority of all leagues in Clusters D and E
are less than 6~7%, indicating the more challenging domestic market conditions in these
leagues when it comes to generating broadcast revenues.
The main driver of broadcasting revenues is the degree to which a domestic league is a
‘premium sports property’ within its media market and its substitutability (i.e. other premium
properties exist). Due to strategic importance, premium properties or ‘must-have’ rights generate
significantly more revenue, both in domestic and international markets. In the case of selling
international rights, an additional dimension has to be considered, which includes - among
others - the foreign market presence, the sales approach, the degree of localisation and the
language.
50,2%
28,6%
4,2%
42,4%
24,4%
0,0%
38,0%
0,0%
5,2%
0%
10%
20%
30%
40%
50%
Share of broadcasting in revenue mix by league within clusters
(Average of FY2014-FY2018)
Grey lines denote cluster averages
Cluster A Cluster B Cluster C Cluster D Cluster E
The below table lists the top league per cluster:
Clusters League Broadcasting (%)
Cluster A Premier League (ENG) 50.2
Cluster B Süper Lig (TUR) 42.4
Cluster C Ekstraklasa (POL) 24.4
Cluster D Liga Profesionista de Fotbal (ROU) 38.0
Cluster E Úrvalsdeild karla (ISL) 5.2
Source: KPMG Data & Analysis
Source: UEFA Club Licensing Benchmarking Report / KPMG Data & Analysis
Financial development of European football > Analysis by revenue and expenditure streams > League broadcasting revenue
Contents
The Financial Landscape of European Football
Broadcasting revenue distributed to foster increased competitive balance
39
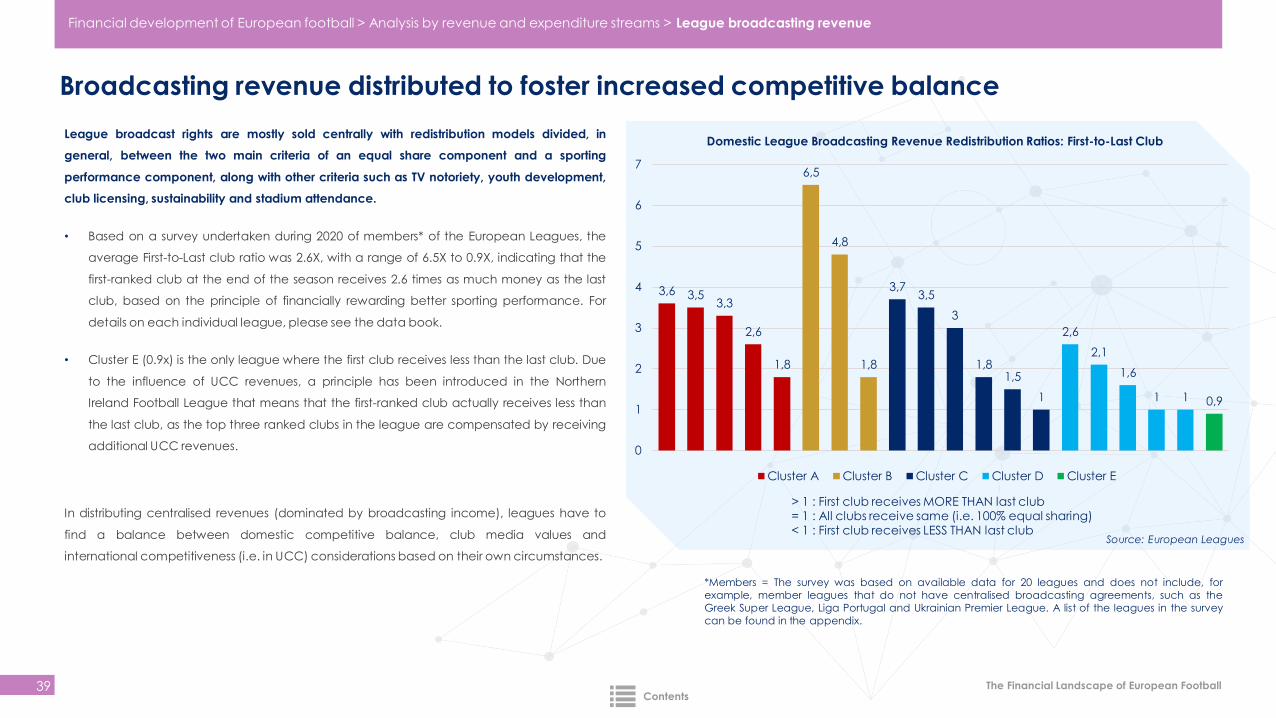
League broadcast rights are mostly sold centrally with redistribution models divided, in
general, between the two main criteria of an equal share component and a sporting
performance component, along with other criteria such as TV notoriety, youth development,
club licensing, sustainability and stadium attendance.
• Based on a survey undertaken during 2020 of members* of the European Leagues, the
average First-to-Last club ratio was 2.6X, with a range of 6.5X to 0.9X, indicating that the
first-ranked club at the end of the season receives 2.6 times as much money as the last
club, based on the principle of financially rewarding better sporting performance. For
details on each individual league, please see the data book.
• Cluster E (0.9x) is the only league where the first club receives less than the last club. Due
to the influence of UCC revenues, a principle has been introduced in the Northern
Ireland Football League that means that the first-ranked club actually receives less than
the last club, as the top three ranked clubs in the league are compensated by receiving
additional UCC revenues.
In distributing centralised revenues (dominated by broadcasting income), leagues have to
find a balance between domestic competitive balance, club media values and
international competitiveness (i.e. in UCC) considerations based on their own circumstances.
> 1 : First club receives MORE THAN last club= 1 : All clubs receive same (i.e. 100% equal sharing)< 1 : First club receives LESS THAN last club
Source: European Leagues
*Members = The survey was based on available data for 20 leagues and does not include, for
example, member leagues that do not have centralised broadcasting agreements, such as the
Greek Super League, Liga Portugal and Ukrainian Premier League. A list of the leagues in the survey
can be found in the appendix.
3,6 3,53,3
2,6
1,8
6,5
4,8
1,8
3,73,5
3
1,81,5
1
2,6
2,1
1,6
1 1 0,9
0
1
2
3
4
5
6
7
Domestic League Broadcasting Revenue Redistribution Ratios: First-to-Last Club
Cluster A Cluster B Cluster C Cluster D Cluster E
Financial development of European football > Analysis by revenue and expenditure streams > League broadcasting revenue
Contents
The Financial Landscape of European Football
Besides macro-economics, media rights values are driven by league and club appeal, tender specifics and international footprint
40
Source: European Leagues
Macro-economics
Level of competitiveness of the media market
Regulatory framework
(Sport) Media consumption
Media and advertising spend
Domestic market size and purchasing power parity
Pay-TV penetration / market maturity
‘Substitutable’ alternatives to drive pay TV business
League Appeal
Fan engagement and atmosphere
Overall playing quality
Competitive balance
Domestic popularity of football
Sporting success
Club and layer brands
Marketing & Promotion
Reach
(Star) players
Media Product
Innovation
Match schedule / Kick-off slots
Anti-Piracy measures
Distribution (feeds, satellite, virtual overlay, platforms)
Diversification (broadcast, web, app, social)
Production (Live, Non-Live)
Localisation (i.e. language)
Rights packaging / inventory
Sales and Partner Approach
Global (partner) network
Exclusivity
Rights cycle / Contract duration
Tender vs. negotiation (i.e. timing, duration)
Broadcaster collaboration & servicing
Broadcast regulations
Differentiation (territory-by-territory vs. pan-regional)
League Structure
Media Value chain
(in-house vs. external expertise)
Expertise Committees
Management/Governance Structure (i.e. local office)
Departments/Workforce
Business Model/strategy
Club Appeal
Sporting success & heritage
(Star) players
Size and elasticity of fan demand
Stadium atmosphere
Reach
Club and player brands
Club Structure
Departments/Workforce
Management/Governance Structure (i.e. club office)
Business Model/strategy
Media Value chain
(in-house vs. external expertise)
Value drivers
Financial development of European football > Analysis by revenue and expenditure streams > League broadcasting revenue
Contents
Commercial revenue
The Financial Landscape of European Football
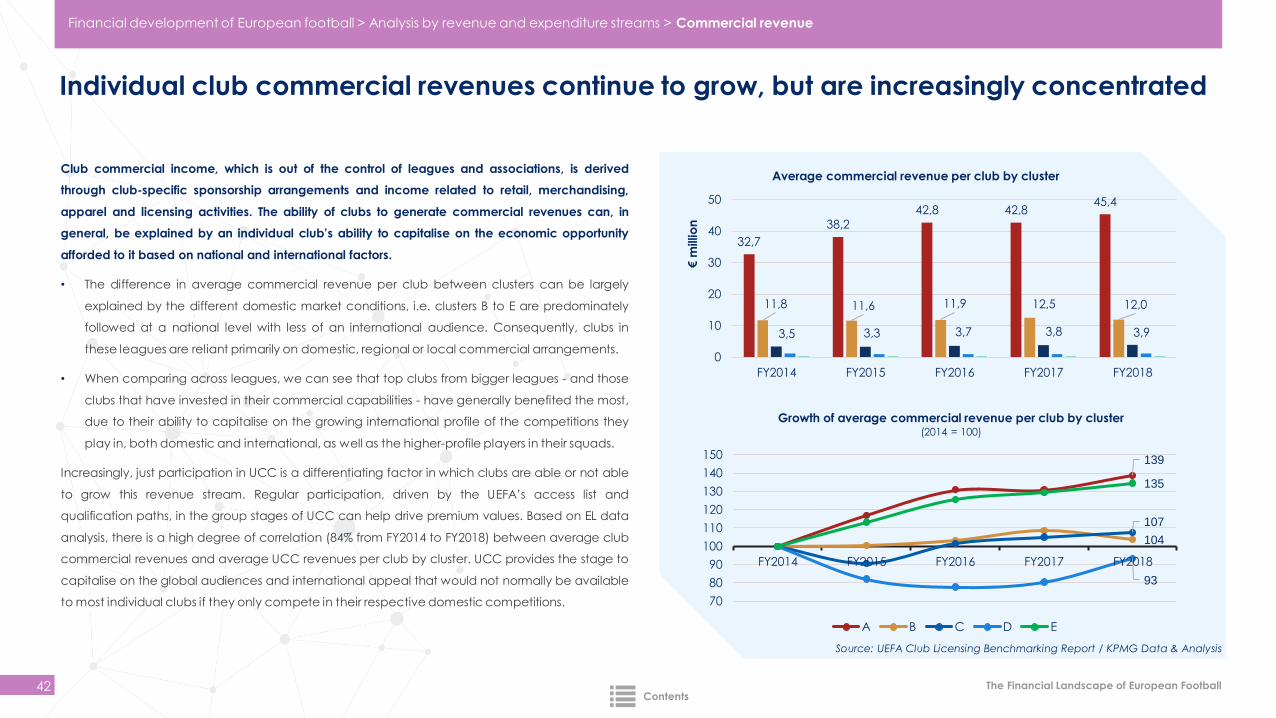
Individual club commercial revenues continue to grow, but are increasingly concentrated
42
139
104
107
93
135
70
80
90
100
110
120
130
140
150
FY2014 FY2015 FY2016 FY2017 FY2018
Growth of average commercial revenue per club by cluster (2014 = 100)
A B C D E
Club commercial income, which is out of the control of leagues and associations, is derived
through club-specific sponsorship arrangements and income related to retail, merchandising,
apparel and licensing activities. The ability of clubs to generate commercial revenues can, in
general, be explained by an individual club’s ability to capitalise on the economic opportunity
afforded to it based on national and international factors.
• The difference in average commercial revenue per club between clusters can be largely
explained by the different domestic market conditions, i.e. clusters B to E are predominately
followed at a national level with less of an international audience. Consequently, clubs in
these leagues are reliant primarily on domestic, regional or local commercial arrangements.
• When comparing across leagues, we can see that top clubs from bigger leagues - and those
clubs that have invested in their commercial capabilities - have generally benefited the most,
due to their ability to capitalise on the growing international profile of the competitions they
play in, both domestic and international, as well as the higher-profile players in their squads.
Increasingly, just participation in UCC is a differentiating factor in which clubs are able or not able
to grow this revenue stream. Regular participation, driven by the UEFA’s access list and
qualification paths, in the group stages of UCC can help drive premium values. Based on EL data
analysis, there is a high degree of correlation (84% from FY2014 to FY2018) between average club
commercial revenues and average UCC revenues per club by cluster. UCC provides the stage to
capitalise on the global audiences and international appeal that would not normally be available
to most individual clubs if they only compete in their respective domestic competitions.
32,7
38,242,8 42,8
45,4
11,8 11,6 11,9 12,5 12,0
3,5 3,3 3,7 3,8 3,9
0
10
20
30
40
50
FY2014 FY2015 FY2016 FY2017 FY2018
€m
illio
n
Average commercial revenue per club by cluster
Source: UEFA Club Licensing Benchmarking Report / KPMG Data & Analysis
Financial development of European football > Analysis by revenue and expenditure streams > Commercial revenue
Contents
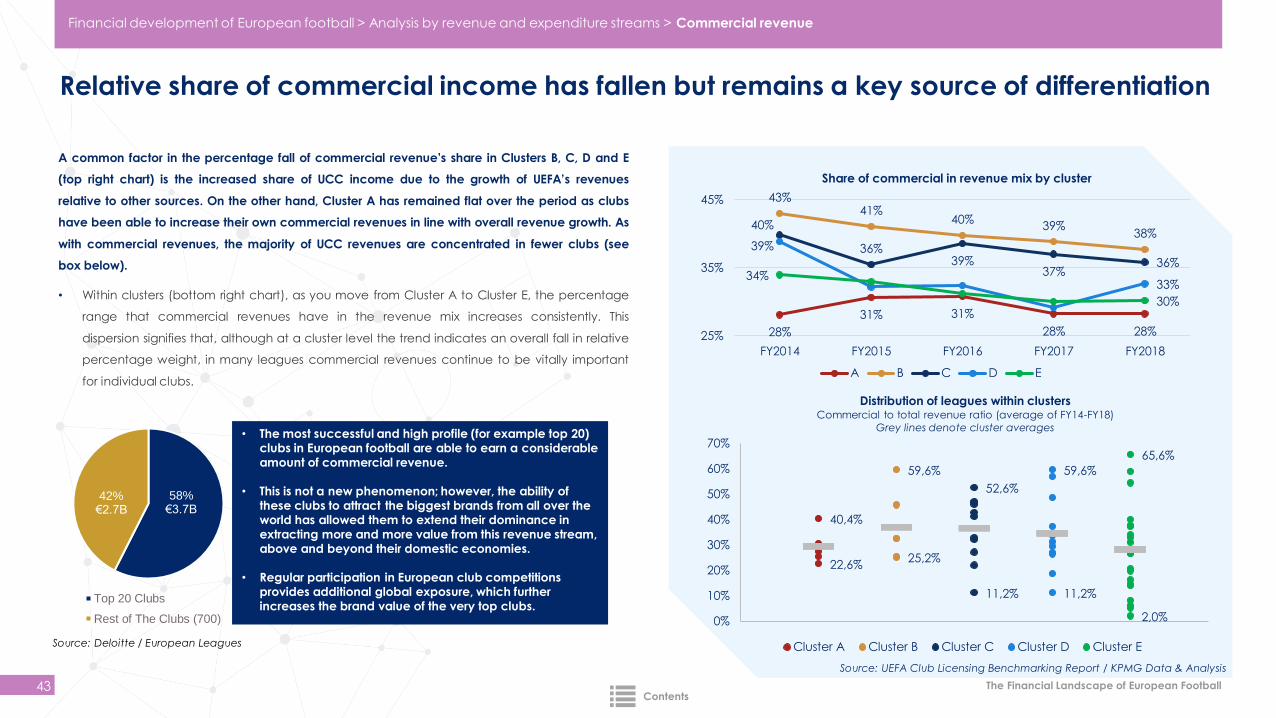
The Financial Landscape of European Football
Relative share of commercial income has fallen but remains a key source of differentiation
43
• The most successful and high profile (for example top 20) clubs in European football are able to earn a considerable amount of commercial revenue.
• This is not a new phenomenon; however, the ability of these clubs to attract the biggest brands from all over the world has allowed them to extend their dominance in extracting more and more value from this revenue stream,above and beyond their domestic economies.
• Regular participation in European club competitions provides additional global exposure, which further increases the brand value of the very top clubs.
28%
31% 31%
28% 28%
43%41%
40%39%
38%40%
36%39%
37%36%
39%
33%34%
30%
25%
35%
45%
FY2014 FY2015 FY2016 FY2017 FY2018
Share of commercial in revenue mix by cluster
A B C D E
A common factor in the percentage fall of commercial revenue’s share in Clusters B, C, D and E
(top right chart) is the increased share of UCC income due to the growth of UEFA’s revenues
relative to other sources. On the other hand, Cluster A has remained flat over the period as clubs
have been able to increase their own commercial revenues in line with overall revenue growth. As
with commercial revenues, the majority of UCC revenues are concentrated in fewer clubs (see
box below).
• Within clusters (bottom right chart), as you move from Cluster A to Cluster E, the percentage
range that commercial revenues have in the revenue mix increases consistently. This
dispersion signifies that, although at a cluster level the trend indicates an overall fall in relative
percentage weight, in many leagues commercial revenues continue to be vitally important
for individual clubs.
58%€3.7B
42%€2.7B
Top 20 Clubs
Rest of The Clubs (700)
40,4%
22,6%25,2%
59,6%
52,6%
11,2% 11,2%
59,6%
65,6%
2,0%0%
10%
20%
30%
40%
50%
60%
70%
Distribution of leagues within clustersCommercial to total revenue ratio (average of FY14-FY18)
Grey lines denote cluster averages
Cluster A Cluster B Cluster C Cluster D Cluster ESource: Deloitte / European Leagues
Source: UEFA Club Licensing Benchmarking Report / KPMG Data & Analysis
Financial development of European football > Analysis by revenue and expenditure streams > Commercial revenue
Contents
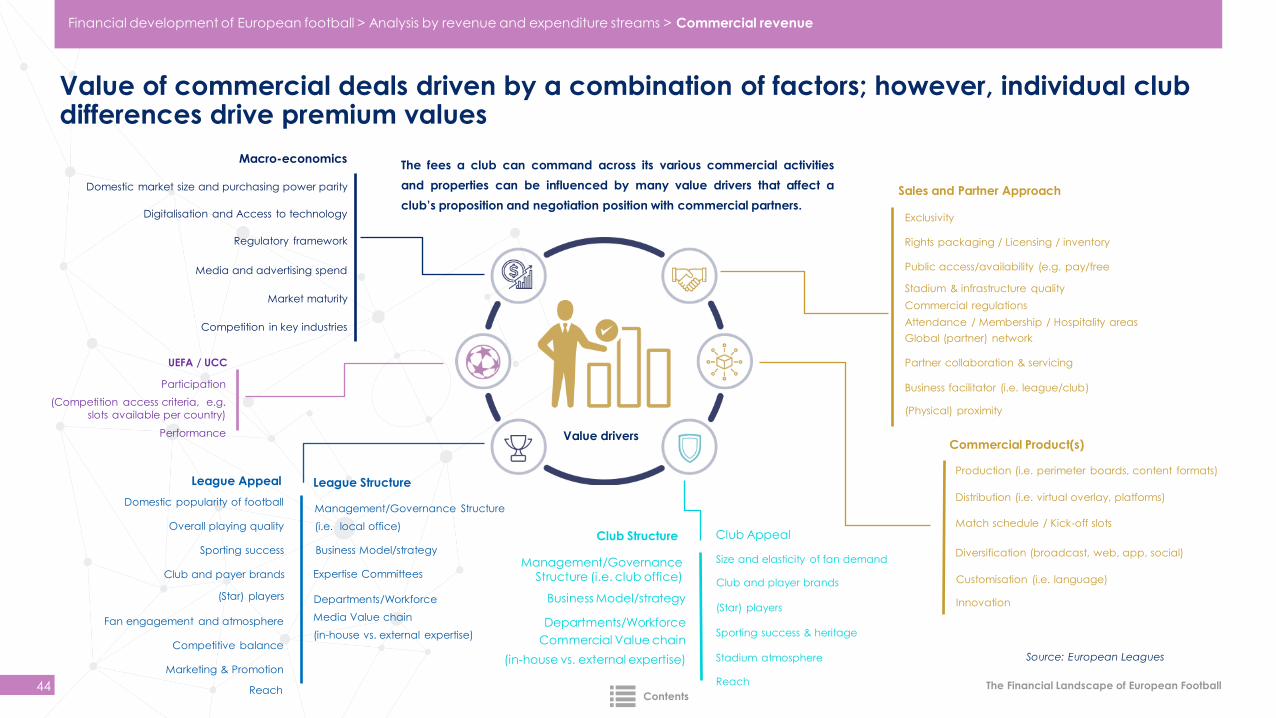
The Financial Landscape of European Football
Macro-economics
Regulatory framework
Digitalisation and Access to technology
Media and advertising spend
Domestic market size and purchasing power parity
Market maturity
Competition in key industries
Value of commercial deals driven by a combination of factors; however, individual club differences drive premium values
44
Source: European Leagues
League Appeal
Fan engagement and atmosphere
Overall playing quality
Competitive balance
Domestic popularity of football
Sporting success
Club and payer brands
Marketing & Promotion
Reach
(Star) players
Rights packaging / Licensing / inventory
Sales and Partner Approach
Global (partner) network
Exclusivity
Public access/availability (e.g. pay/free
Stadium & infrastructure quality
Partner collaboration & servicing
Commercial regulations
Business facilitator (i.e. league/club)
(Physical) proximity
Attendance / Membership / Hospitality areas
Commercial Product(s)
Innovation
Match schedule / Kick-off slots
Distribution (i.e. virtual overlay, platforms)
Diversification (broadcast, web, app, social)
Production (i.e. perimeter boards, content formats)
Customisation (i.e. language)
League Structure
Media Value chain
(in-house vs. external expertise)
Expertise Committees
Management/Governance Structure
(i.e. local office)
Departments/Workforce
Business Model/strategy
Club Appeal
Sporting success & heritage
(Star) players
Size and elasticity of fan demand
Stadium atmosphere
Reach
Club and player brands
Club Structure
Departments/Workforce
Management/Governance Structure (i.e. club office)
Business Model/strategy
Commercial Value chain
(in-house vs. external expertise)
The fees a club can command across its various commercial activities
and properties can be influenced by many value drivers that affect a
club’s proposition and negotiation position with commercial partners.
UEFA / UCC
Participation
(Competition access criteria, e.g.
slots available per country)
Performance Value drivers
Financial development of European football > Analysis by revenue and expenditure streams > Commercial revenue
Contents

Matchday revenue
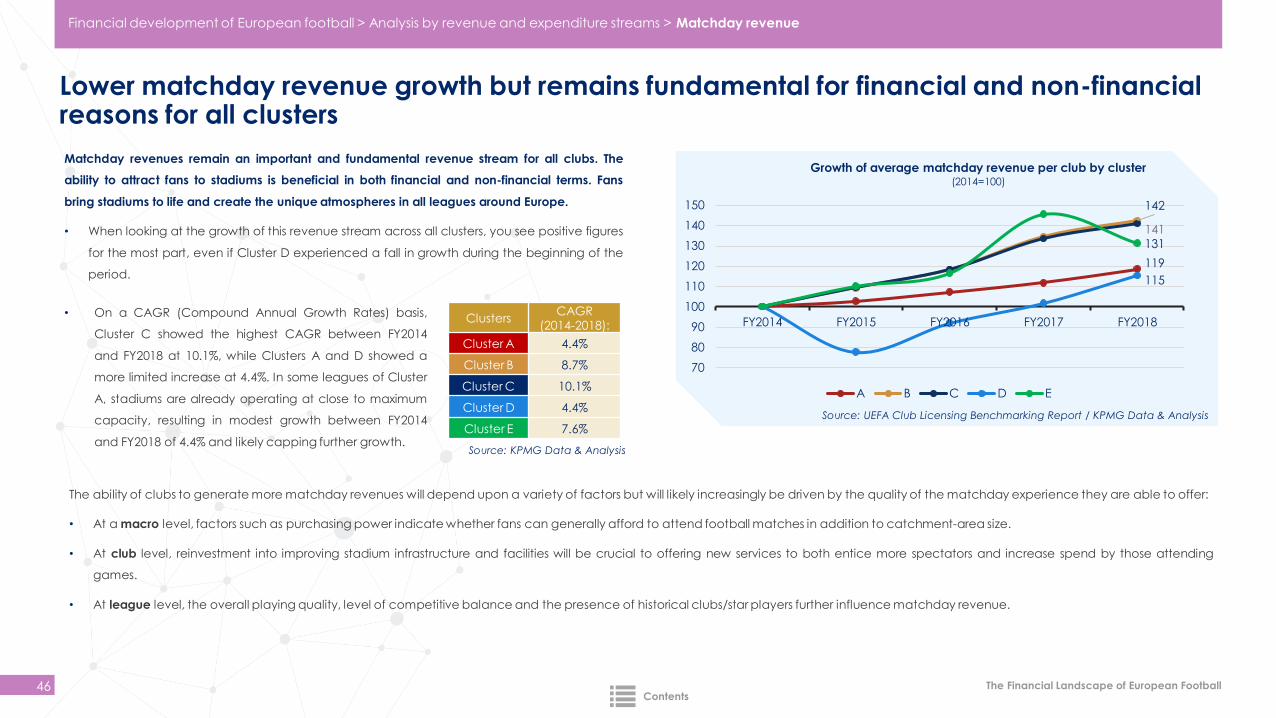
The Financial Landscape of European Football
Lower matchday revenue growth but remains fundamental for financial and non-financial reasons for all clusters
46
Matchday revenues remain an important and fundamental revenue stream for all clubs. The
ability to attract fans to stadiums is beneficial in both financial and non-financial terms. Fans
bring stadiums to life and create the unique atmospheres in all leagues around Europe.
• When looking at the growth of this revenue stream across all clusters, you see positive figures
for the most part, even if Cluster D experienced a fall in growth during the beginning of the
period.119
142
141
115
131
70
80
90
100
110
120
130
140
150
FY2014 FY2015 FY2016 FY2017 FY2018
Growth of average matchday revenue per club by cluster(2014=100)
A B C D E
Source: KPMG Data & Analysis
ClustersCAGR
(2014-2018):
Cluster A 4.4%
Cluster B 8.7%
Cluster C 10.1%
Cluster D 4.4%
Cluster E 7.6%
The ability of clubs to generate more matchday revenues will depend upon a variety of factors but will likely increasingly be driven by the quality of the matchday experience they are able to offer:
• At a macro level, factors such as purchasing power indicate whether fans can generally afford to attend football matches in addition to catchment-area size.
• At club level, reinvestment into improving stadium infrastructure and facilities will be crucial to offering new services to both entice more spectators and increase spend by those attending
games.
• At league level, the overall playing quality, level of competitive balance and the presence of historical clubs/star players further influence matchday revenue.
• On a CAGR (Compound Annual Growth Rates) basis,
Cluster C showed the highest CAGR between FY2014
and FY2018 at 10.1%, while Clusters A and D showed a
more limited increase at 4.4%. In some leagues of Cluster
A, stadiums are already operating at close to maximum
capacity, resulting in modest growth between FY2014
and FY2018 of 4.4% and likely capping further growth.
Source: UEFA Club Licensing Benchmarking Report / KPMG Data & Analysis
Financial development of European football > Analysis by revenue and expenditure streams > Matchday revenue
Contents
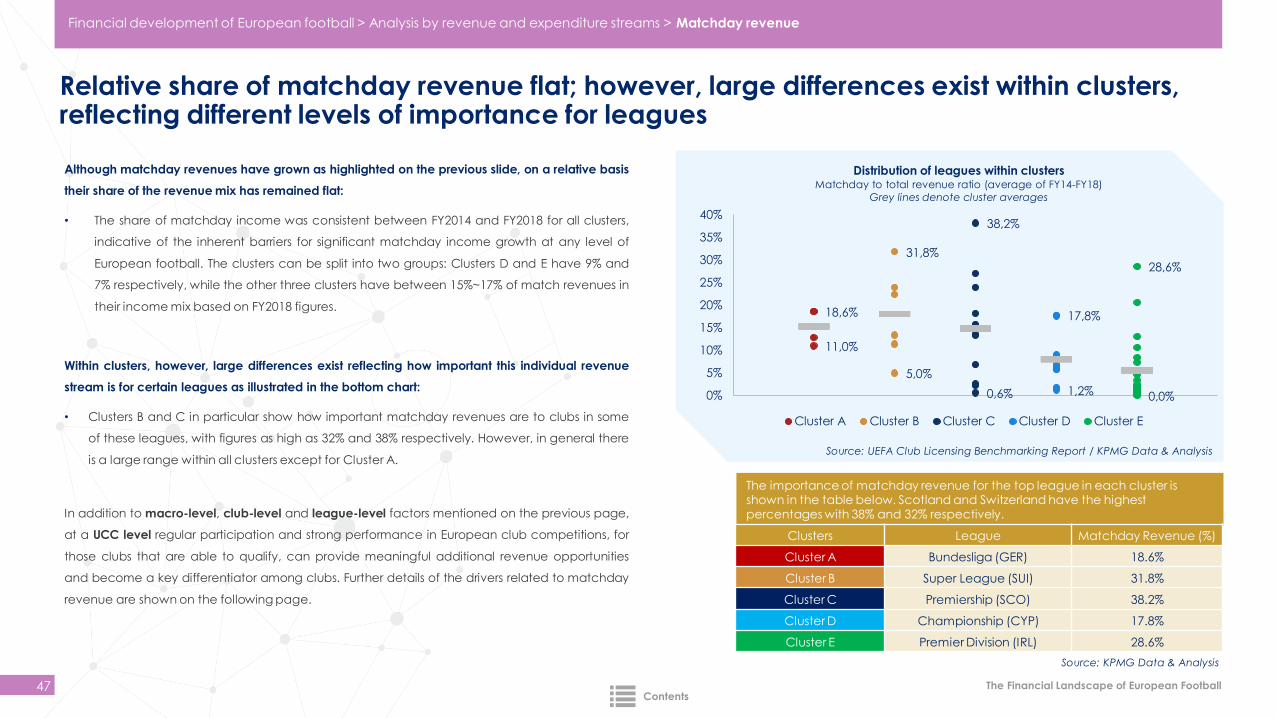
The Financial Landscape of European Football
Relative share of matchday revenue flat; however, large differences exist within clusters, reflecting different levels of importance for leagues
47
Although matchday revenues have grown as highlighted on the previous slide, on a relative basis
their share of the revenue mix has remained flat:
• The share of matchday income was consistent between FY2014 and FY2018 for all clusters,
indicative of the inherent barriers for significant matchday income growth at any level of
European football. The clusters can be split into two groups: Clusters D and E have 9% and
7% respectively, while the other three clusters have between 15%~17% of match revenues in
their income mix based on FY2018 figures.
Within clusters, however, large differences exist reflecting how important this individual revenue
stream is for certain leagues as illustrated in the bottom chart:
• Clusters B and C in particular show how important matchday revenues are to clubs in some
of these leagues, with figures as high as 32% and 38% respectively. However, in general there
is a large range within all clusters except for Cluster A.
The importance of matchday revenue for the top league in each cluster is shown in the table below. Scotland and Switzerland have the highest percentages with 38% and 32% respectively.
18,6%
11,0%
5,0%
31,8%
0,6%
38,2%
1,2%
17,8%
28,6%
0,0%0%
5%
10%
15%
20%
25%
30%
35%
40%
Distribution of leagues within clustersMatchday to total revenue ratio (average of FY14-FY18)
Grey lines denote cluster averages
Cluster A Cluster B Cluster C Cluster D Cluster E
Clusters League Matchday Revenue (%)
Cluster A Bundesliga (GER) 18.6%
Cluster B Super League (SUI) 31.8%
Cluster C Premiership (SCO) 38.2%
Cluster D Championship (CYP) 17.8%
Cluster E Premier Division (IRL) 28.6%
Source: KPMG Data & Analysis
In addition to macro-level, club-level and league-level factors mentioned on the previous page,
at a UCC level regular participation and strong performance in European club competitions, for
those clubs that are able to qualify, can provide meaningful additional revenue opportunities
and become a key differentiator among clubs. Further details of the drivers related to matchday
revenue are shown on the following page.
Source: UEFA Club Licensing Benchmarking Report / KPMG Data & Analysis
Financial development of European football > Analysis by revenue and expenditure streams > Matchday revenue
Contents
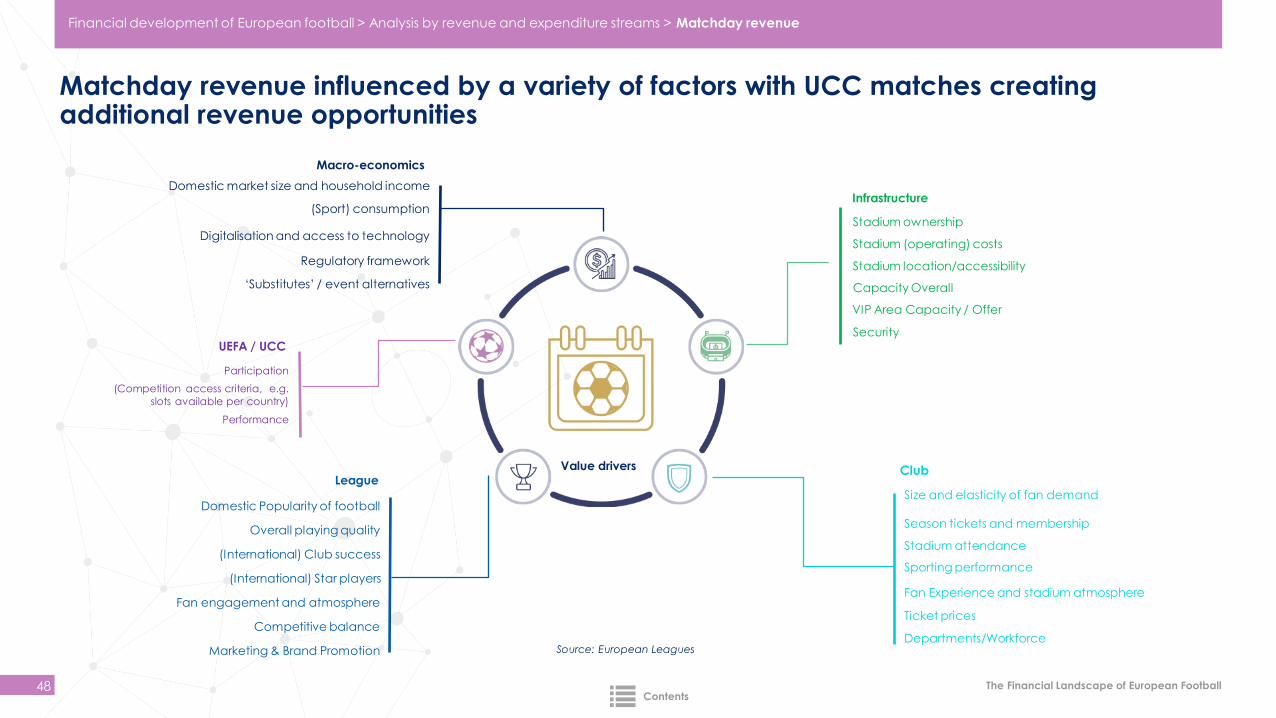
The Financial Landscape of European Football
Matchday revenue influenced by a variety of factors with UCC matches creating additional revenue opportunities
48
League
Macro-economics
(Sport) consumption
Regulatory framework
Digitalisation and access to technology
Domestic market size and household income
‘Substitutes’ / event alternatives
Infrastructure
Stadium ownership
Stadium (operating) costs
Stadium location/accessibility
Capacity Overall
VIP Area Capacity / Offer
Security
Fan engagement and atmosphere
Overall playing quality
Competitive balance
Domestic Popularity of football
(International) Club success
(International) Star players
Marketing & Brand Promotion
Club
Departments/Workforce
Size and elasticity of fan demand
Season tickets and membership
Stadium attendance
Sporting performance
Fan Experience and stadium atmosphere
Ticket prices
UEFA / UCC
Source: European Leagues
Participation
(Competition access criteria, e.g.
slots available per country)
Performance
Value drivers
Financial development of European football > Analysis by revenue and expenditure streams > Matchday revenue
Contents
UEFA Club Competitions revenue

The Financial Landscape of European Football
Significant growth of UCC revenue distributions to clubs increasingly impacting all levels of the ecosystem
50
The successful commercial strategy of UCC has led to a significant period of revenue growth,
which is having a much greater impact on the entire football ecosystem. Historically, UCC
revenues have represented a smaller share of club revenues but the combination of being the
fastest growing revenue stream, on a percentage basis, along with the significant increases in
absolute terms now means UCC revenues have a greater impact.
At a cluster level we can observe the following trends:
• UCC distributions per club have experienced strong growth in all clusters between 2009/10
and 2018/19, ranging from 8.4% (Cluster C) to 13.6% (Cluster B):
129
252 163
523 665
1.768
0
500
1.000
1.500
2.000
2.500
3.000
2009/10 2010/11 2011/12 2012/13 2013/14 2014/15 2015/16 2016/17 2017/18 2018/19
€m
illio
n
Evolution of UCC revenue by clusters
E D C B A
ClustersCompound Annual Growth
Rates (2009/10-2018/19):
Cluster A 11.5%
Cluster B 13.6%
Cluster C 8.4%
Cluster D 11.9%
Cluster E 9.8%
Source: KPMG Data & Analysis
• Cluster B clubs display the highest increase in UCC revenues from €163m to €523m (221%)
over the 10-year period. In absolute terms, however, Cluster A clubs received €1.1 billion
more from 2009/10 to 2018/19.
• Cluster A clubs consistently received the vast majority of total annual UCC distributions
between 2009/10 and 2018/19 due to a combination of the structure of the access list (i.e.
qualification process), their comparative on-field success, the size of the media markets they
play in and changes to the financial distribution model which benefitted clubs playing in UCL
the most.
Source: UEFA Club Licensing Benchmarking Report / KPMG Data & Analysis
Financial development of European football > Analysis by revenue and expenditure streams > UEFA Club Competitions revenue
Contents
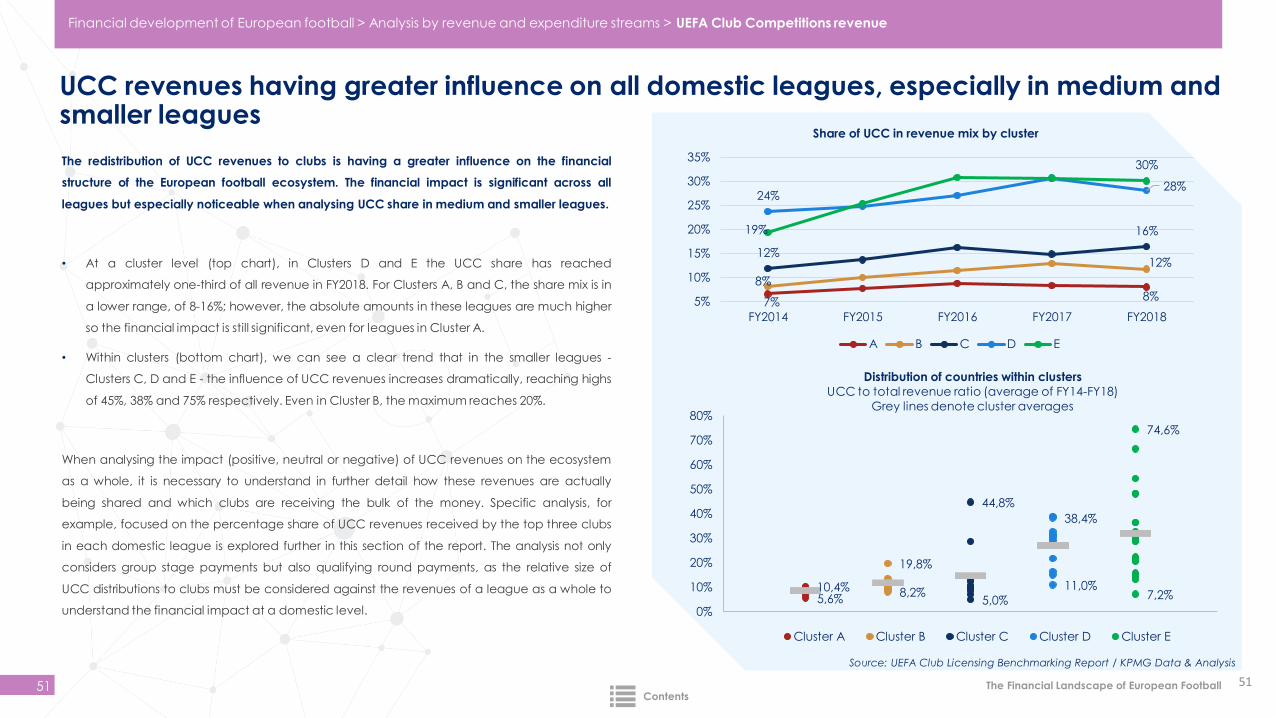
The Financial Landscape of European Football
UCC revenues having greater influence on all domestic leagues, especially in medium and smaller leagues
51 51
The redistribution of UCC revenues to clubs is having a greater influence on the financial
structure of the European football ecosystem. The financial impact is significant across all
leagues but especially noticeable when analysing UCC share in medium and smaller leagues.
• At a cluster level (top chart), in Clusters D and E the UCC share has reached
approximately one-third of all revenue in FY2018. For Clusters A, B and C, the share mix is in
a lower range, of 8-16%; however, the absolute amounts in these leagues are much higher
so the financial impact is still significant, even for leagues in Cluster A.
• Within clusters (bottom chart), we can see a clear trend that in the smaller leagues -
Clusters C, D and E - the influence of UCC revenues increases dramatically, reaching highs
of 45%, 38% and 75% respectively. Even in Cluster B, the maximum reaches 20%.
When analysing the impact (positive, neutral or negative) of UCC revenues on the ecosystem
as a whole, it is necessary to understand in further detail how these revenues are actually
being shared and which clubs are receiving the bulk of the money. Specific analysis, for
example, focused on the percentage share of UCC revenues received by the top three clubs
in each domestic league is explored further in this section of the report. The analysis not only
considers group stage payments but also qualifying round payments, as the relative size of
UCC distributions to clubs must be considered against the revenues of a league as a whole to
understand the financial impact at a domestic level.
7%8%
8%
12%12%
16%
24%28%
19%
30%
5%
10%
15%
20%
25%
30%
35%
FY2014 FY2015 FY2016 FY2017 FY2018
Share of UCC in revenue mix by cluster
A B C D E
5,6%10,4%
19,8%
8,2%5,0%
44,8%
11,0%
38,4%
74,6%
7,2%
0%
10%
20%
30%
40%
50%
60%
70%
80%
Distribution of countries within clusters
UCC to total revenue ratio (average of FY14-FY18)
Grey lines denote cluster averages
Cluster A Cluster B Cluster C Cluster D Cluster E
Source: UEFA Club Licensing Benchmarking Report / KPMG Data & Analysis
Financial development of European football > Analysis by revenue and expenditure streams > UEFA Club Competitions revenue
Contents

The Financial Landscape of European Football
Individual club distributions (UCL, UEL and Qualifying Rounds payments) impact all clusters
52 52
When it comes to UCC club distributions (from cycle 2018-21), 93% is
shared between clubs participating in UCL and UEL (80 clubs), with
UCL’s 32 clubs being by far the most dominant beneficiary. The
remaining 7% is split between 4% for Qualifying Round payments
(approx. 180 clubs) and 3% for Non-Participating solidarity payments
(over 600 clubs).
• Clusters A and B: UCL and UEL participation are the most
important sources of revenue from UCC. Both clusters do
receive Non-Participating solidarity payments, while Qualifying
Round payments are insignificant.
• Clusters C and D: UCL and UEL participation are also the most
important sources of revenue; however, income from Qualifying
Round and Non-Participating solidarity payments start to play a
larger role.
• For Cluster E, the situation is reversed with Qualifying Round and
Non-Participating solidarity payments representing the only
consistent source of UCC income, as opportunities for further
participation in the competition are limited. The rare occasions
when clubs from Cluster E reached the UCL or UEL group stages
are clearly visible in the chart. However, this revenue category
only contributed a very small portion of overall UCC income.
-
500
1.000
1.500
€m
illio
n
Cluster A
-
100
200
300
400
500
600
€m
illio
n
Cluster B
-
50
100
150
200
250
300
€m
illio
n
Cluster C
-
50
100
150
200
€m
illio
n
Cluster D
-
10
20
30
40
50
60
70
€m
illio
n
Cluster E
Source: UEFA distribution to clubs
Financial development of European football > Analysis by revenue and expenditure streams > UEFA Club Competitions revenue
Contents
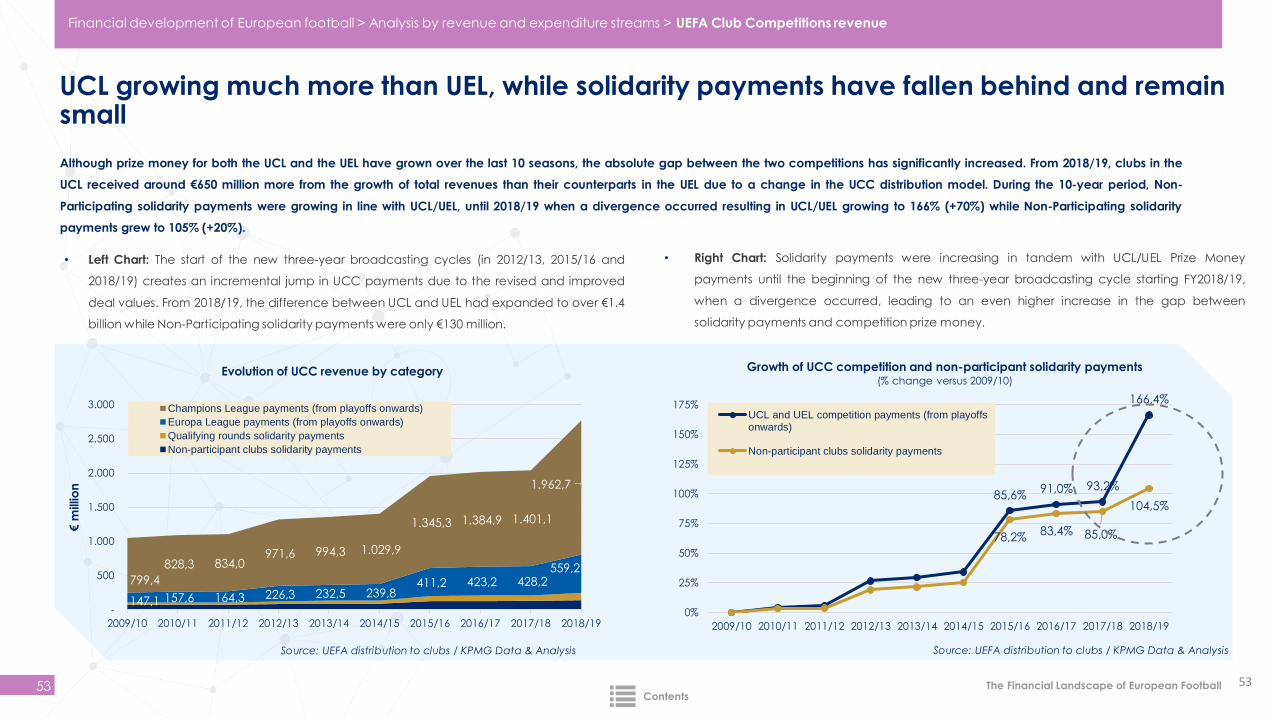
The Financial Landscape of European Football
UCL growing much more than UEL, while solidarity payments have fallen behind and remain small
53 53
Although prize money for both the UCL and the UEL have grown over the last 10 seasons, the absolute gap between the two competitions has significantly increased. From 2018/19, clubs in the
UCL received around €650 million more from the growth of total revenues than their counterparts in the UEL due to a change in the UCC distribution model. During the 10-year period, Non-
Participating solidarity payments were growing in line with UCL/UEL, until 2018/19 when a divergence occurred resulting in UCL/UEL growing to 166% (+70%) while Non-Participating solidarity
payments grew to 105% (+20%).
147,1 157,6 164,3 226,3 232,5 239,8 411,2 423,2 428,2
559,2 799,4
828,3 834,0 971,6 994,3 1.029,9
1.345,3 1.384,9 1.401,1
1.962,7
-
500
1.000
1.500
2.000
2.500
3.000
2009/10 2010/11 2011/12 2012/13 2013/14 2014/15 2015/16 2016/17 2017/18 2018/19
€m
illio
n
Evolution of UCC revenue by category
Champions League payments (from playoffs onwards)
Europa League payments (from playoffs onwards)
Qualifying rounds solidarity payments
Non-participant clubs solidarity payments
85,6%91,0% 93,2%
166,4%
78,2%83,4% 85,0%
104,5%
0%
25%
50%
75%
100%
125%
150%
175%
2009/10 2010/11 2011/12 2012/13 2013/14 2014/15 2015/16 2016/17 2017/18 2018/19
Growth of UCC competition and non-participant solidarity payments(% change versus 2009/10)
UCL and UEL competition payments (from playoffsonwards)
Non-participant clubs solidarity payments
Source: UEFA distribution to clubs / KPMG Data & Analysis
• Left Chart: The start of the new three-year broadcasting cycles (in 2012/13, 2015/16 and
2018/19) creates an incremental jump in UCC payments due to the revised and improved
deal values. From 2018/19, the difference between UCL and UEL had expanded to over €1.4
billion while Non-Participating solidarity payments were only €130 million.
• Right Chart: Solidarity payments were increasing in tandem with UCL/UEL Prize Money
payments until the beginning of the new three-year broadcasting cycle starting FY2018/19,
when a divergence occurred, leading to an even higher increase in the gap between
solidarity payments and competition prize money.
Source: UEFA distribution to clubs / KPMG Data & Analysis
Financial development of European football > Analysis by revenue and expenditure streams > UEFA Club Competitions revenue
Contents
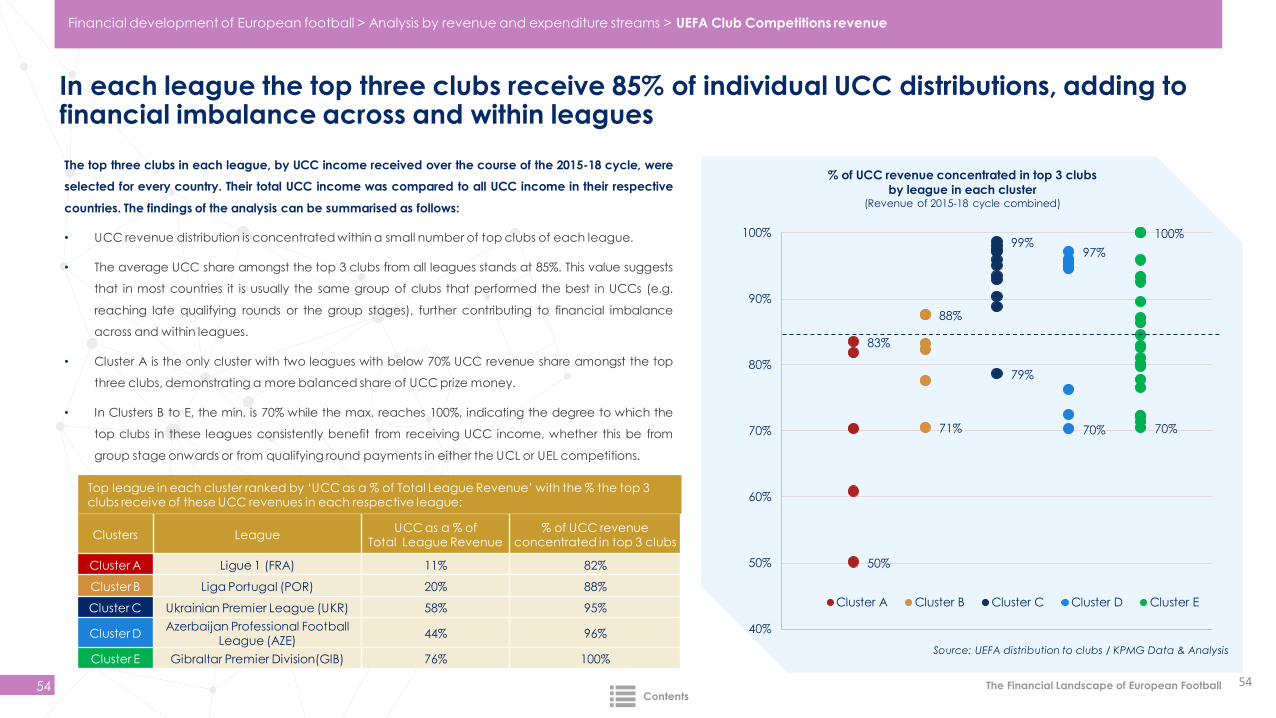
The Financial Landscape of European Football
In each league the top three clubs receive 85% of individual UCC distributions, adding to financial imbalance across and within leagues
54 54
The top three clubs in each league, by UCC income received over the course of the 2015-18 cycle, were
selected for every country. Their total UCC income was compared to all UCC income in their respective
countries. The findings of the analysis can be summarised as follows:
• UCC revenue distribution is concentrated within a small number of top clubs of each league.
• The average UCC share amongst the top 3 clubs from all leagues stands at 85%. This value suggests
that in most countries it is usually the same group of clubs that performed the best in UCCs (e.g.
reaching late qualifying rounds or the group stages), further contributing to financial imbalance
across and within leagues.
• Cluster A is the only cluster with two leagues with below 70% UCC revenue share amongst the top
three clubs, demonstrating a more balanced share of UCC prize money.
• In Clusters B to E, the min. is 70% while the max. reaches 100%, indicating the degree to which the
top clubs in these leagues consistently benefit from receiving UCC income, whether this be from
group stage onwards or from qualifying round payments in either the UCL or UEL competitions.
83%
50%
88%
71%
99%
79%
97%
70%
100%
70%
40%
50%
60%
70%
80%
90%
100%
% of UCC revenue concentrated in top 3 clubs
by league in each cluster(Revenue of 2015-18 cycle combined)
Cluster A Cluster B Cluster C Cluster D Cluster E
Clusters LeagueUCC as a % of
Total League Revenue% of UCC revenue
concentrated in top 3 clubs
Cluster A Ligue 1 (FRA) 11% 82%
Cluster B Liga Portugal (POR) 20% 88%
Cluster C Ukrainian Premier League (UKR) 58% 95%
Cluster DAzerbaijan Professional Football
League (AZE)44% 96%
Cluster E Gibraltar Premier Division(GIB) 76% 100%
Top league in each cluster ranked by ‘UCC as a % of Total League Revenue’ with the % the top 3 clubs receive of these UCC revenues in each respective league:
Financial development of European football > Analysis by revenue and expenditure streams > UEFA Club Competitions revenue
Source: UEFA distribution to clubs / KPMG Data & Analysis
Contents
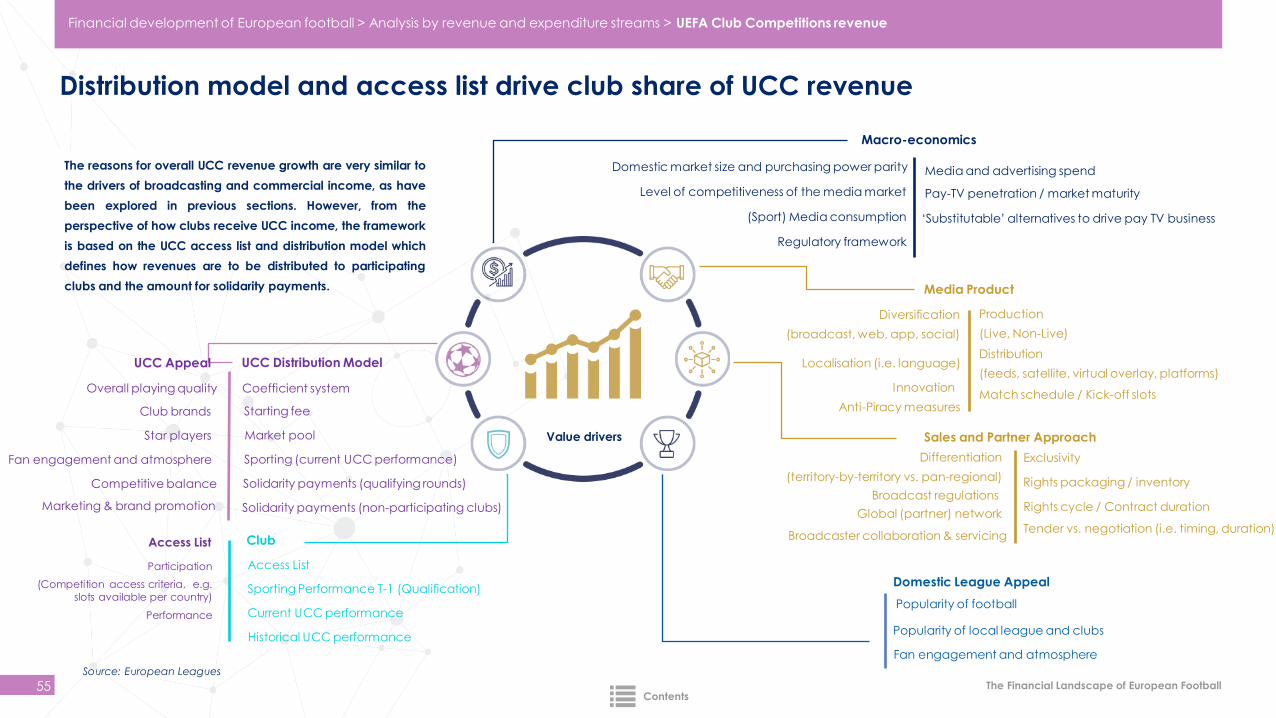
The Financial Landscape of European Football
Distribution model and access list drive club share of UCC revenue
55
Macro-economics
Level of competitiveness of the media market
Regulatory framework
(Sport) Media consumption
Media and advertising spendDomestic market size and purchasing power parity
Pay-TV penetration / market maturity
‘Substitutable’ alternatives to drive pay TV business
Domestic League Appeal
Popularity of local league and clubs
Popularity of football
Fan engagement and atmosphere
UCC Distribution Model
Solidarity payments (qualifying rounds)
Starting fee
Solidarity payments (non-participating clubs)
Coefficient system
Market pool
Sporting (current UCC performance)
Club
Current UCC performance
Sporting Performance T-1 (Qualification)
Historical UCC performance
Access List
UCC Appeal
Competitive balance
Club brands
Marketing & brand promotion
Overall playing quality
Star players
Fan engagement and atmosphere
Media Product
InnovationMatch schedule / Kick-off slots
Anti-Piracy measures
Distribution
(feeds, satellite, virtual overlay, platforms)
Diversification
(broadcast, web, app, social)
Production
(Live, Non-Live)
Localisation (i.e. language)
Rights packaging / inventory
Sales and Partner Approach
Global (partner) network
Exclusivity
Rights cycle / Contract duration
Tender vs. negotiation (i.e. timing, duration) Broadcaster collaboration & servicing
Broadcast regulations
Differentiation
(territory-by-territory vs. pan-regional)
The reasons for overall UCC revenue growth are very similar to
the drivers of broadcasting and commercial income, as have
been explored in previous sections. However, from the
perspective of how clubs receive UCC income, the framework
is based on the UCC access list and distribution model which
defines how revenues are to be distributed to participating
clubs and the amount for solidarity payments.
Source: European Leagues
Participation
(Competition access criteria, e.g.
slots available per country)
Performance
Access List
Value drivers
Financial development of European football > Analysis by revenue and expenditure streams > UEFA Club Competitions revenue
Contents
Transfer revenue and expenditure
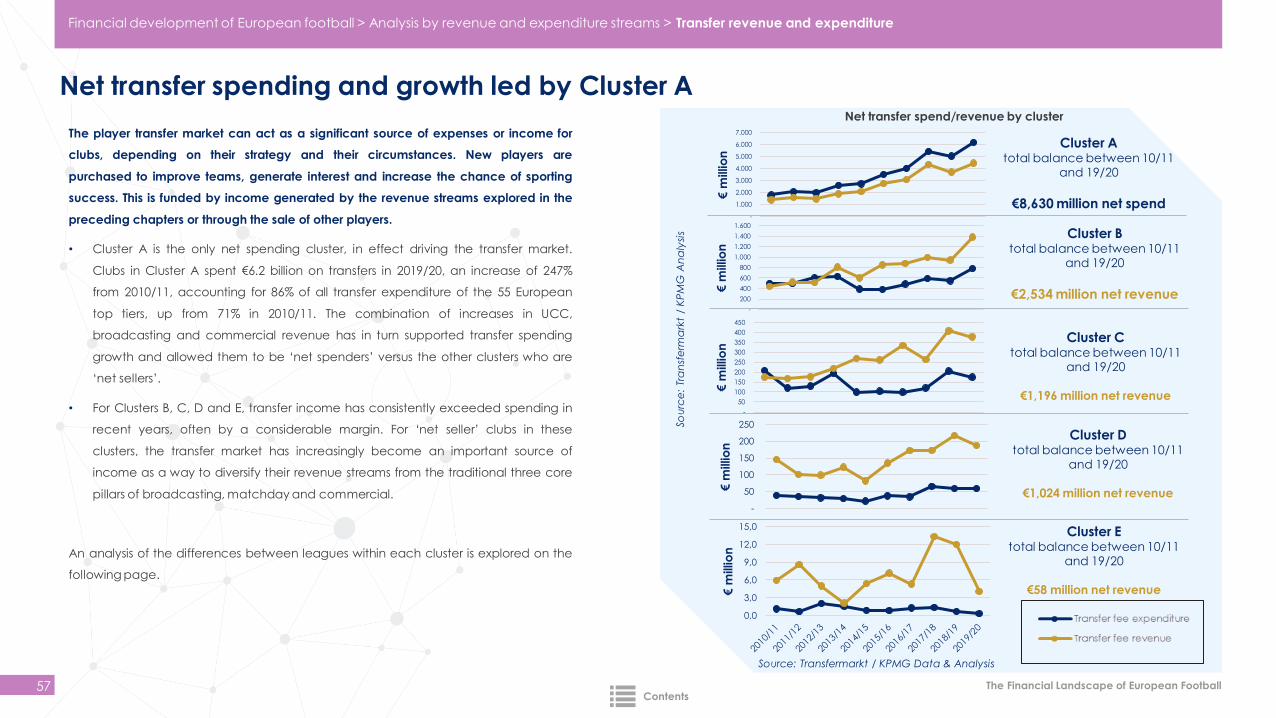
The Financial Landscape of European Football
Net transfer spending and growth led by Cluster A
57
The player transfer market can act as a significant source of expenses or income for
clubs, depending on their strategy and their circumstances. New players are
purchased to improve teams, generate interest and increase the chance of sporting
success. This is funded by income generated by the revenue streams explored in the
preceding chapters or through the sale of other players.
• Cluster A is the only net spending cluster, in effect driving the transfer market.
Clubs in Cluster A spent €6.2 billion on transfers in 2019/20, an increase of 247%
from 2010/11, accounting for 86% of all transfer expenditure of the 55 European
top tiers, up from 71% in 2010/11. The combination of increases in UCC,
broadcasting and commercial revenue has in turn supported transfer spending
growth and allowed them to be ‘net spenders’ versus the other clusters who are
‘net sellers’.
• For Clusters B, C, D and E, transfer income has consistently exceeded spending in
recent years, often by a considerable margin. For ‘net seller’ clubs in these
clusters, the transfer market has increasingly become an important source of
income as a way to diversify their revenue streams from the traditional three core
pillars of broadcasting, matchday and commercial.
An analysis of the differences between leagues within each cluster is explored on the
following page.
-
1.000
2.000
3.000
4.000
5.000
6.000
7.000
€ m
illio
n
-
200
400
600
800
1.000
1.200
1.400
1.600
€ m
illio
n
-
50
100
150
200
250
300
350
400
450
€ m
illio
n
-
50
100
150
200
250
€ m
illio
n
0,0
3,0
6,0
9,0
12,0
15,0
€ m
illio
n
Cluster Atotal balance between 10/11
and 19/20
€8,630 million net spend
Cluster Btotal balance between 10/11
and 19/20
€2,534 million net revenue
Cluster C total balance between 10/11
and 19/20
€1,196 million net revenue
Cluster D total balance between 10/11
and 19/20
€1,024 million net revenue
Cluster Etotal balance between 10/11
and 19/20
€58 million net revenue
Net transfer spend/revenue by cluster
So
urc
e:
Tra
nsf
erm
ark
t/
KP
MG
An
aly
sis
Source: Transfermarkt / KPMG Data & Analysis
Financial development of European football > Analysis by revenue and expenditure streams > Transfer revenue and expenditure
Contents
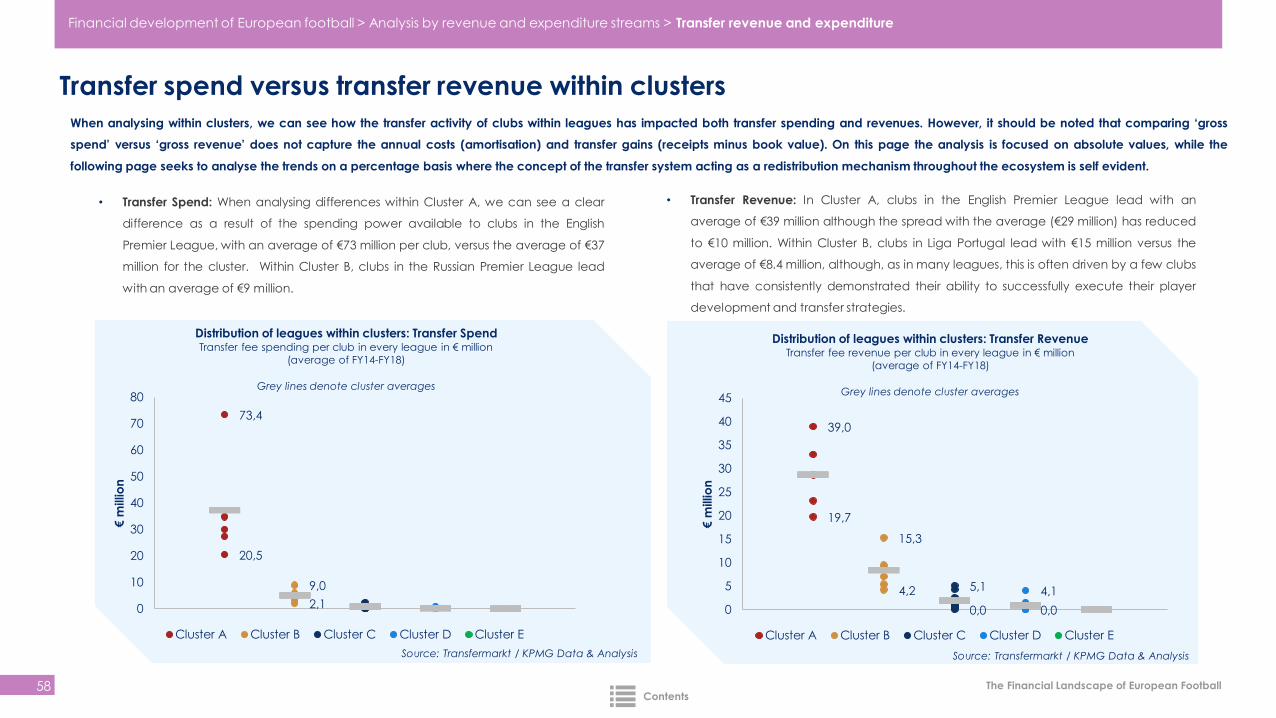
The Financial Landscape of European Football
Transfer spend versus transfer revenue within clusters
58
39,0
19,7
15,3
4,2
0,0
5,1
0,0
4,1
0
5
10
15
20
25
30
35
40
45
€ m
illio
n
Distribution of leagues within clusters: Transfer RevenueTransfer fee revenue per club in every league in € million
(average of FY14-FY18)
Grey lines denote cluster averages
Cluster A Cluster B Cluster C Cluster D Cluster E
73,4
20,5
9,0
2,1 0
10
20
30
40
50
60
70
80
€ m
illio
n
Distribution of leagues within clusters: Transfer SpendTransfer fee spending per club in every league in € million
(average of FY14-FY18)
Grey lines denote cluster averages
Cluster A Cluster B Cluster C Cluster D Cluster E
When analysing within clusters, we can see how the transfer activity of clubs within leagues has impacted both transfer spending and revenues. However, it should be noted that comparing ‘gross
spend’ versus ‘gross revenue’ does not capture the annual costs (amortisation) and transfer gains (receipts minus book value). On this page the analysis is focused on absolute values, while the
following page seeks to analyse the trends on a percentage basis where the concept of the transfer system acting as a redistribution mechanism throughout the ecosystem is self evident.
• Transfer Spend: When analysing differences within Cluster A, we can see a clear
difference as a result of the spending power available to clubs in the English
Premier League, with an average of €73 million per club, versus the average of €37
million for the cluster. Within Cluster B, clubs in the Russian Premier League lead
with an average of €9 million.
• Transfer Revenue: In Cluster A, clubs in the English Premier League lead with an
average of €39 million although the spread with the average (€29 million) has reduced
to €10 million. Within Cluster B, clubs in Liga Portugal lead with €15 million versus the
average of €8.4 million, although, as in many leagues, this is often driven by a few clubs
that have consistently demonstrated their ability to successfully execute their player
development and transfer strategies.
Source: Transfermarkt / KPMG Data & Analysis Source: Transfermarkt / KPMG Data & Analysis
Financial development of European football > Analysis by revenue and expenditure streams > Transfer revenue and expenditure
Contents
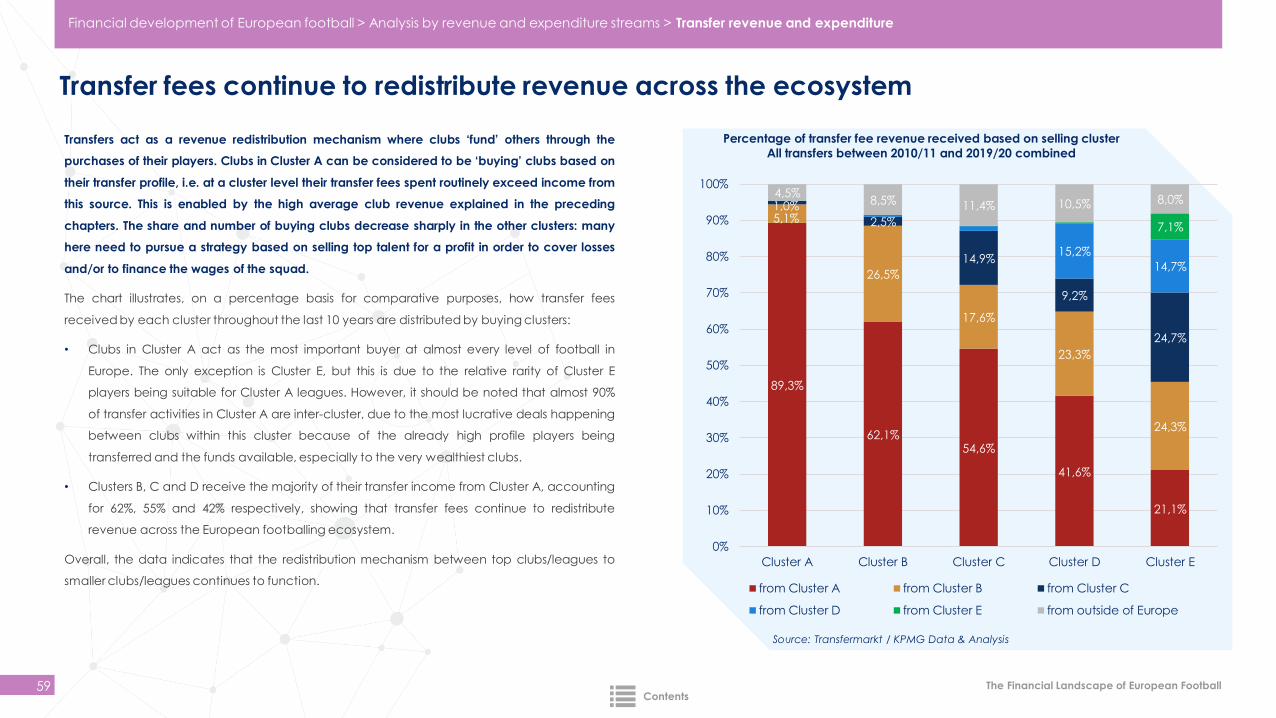
The Financial Landscape of European Football
Transfer fees continue to redistribute revenue across the ecosystem
59
Transfers act as a revenue redistribution mechanism where clubs ‘fund’ others through the
purchases of their players. Clubs in Cluster A can be considered to be ‘buying’ clubs based on
their transfer profile, i.e. at a cluster level their transfer fees spent routinely exceed income from
this source. This is enabled by the high average club revenue explained in the preceding
chapters. The share and number of buying clubs decrease sharply in the other clusters: many
here need to pursue a strategy based on selling top talent for a profit in order to cover losses
and/or to finance the wages of the squad.
The chart illustrates, on a percentage basis for comparative purposes, how transfer fees
received by each cluster throughout the last 10 years are distributed by buying clusters:
• Clubs in Cluster A act as the most important buyer at almost every level of football in
Europe. The only exception is Cluster E, but this is due to the relative rarity of Cluster E
players being suitable for Cluster A leagues. However, it should be noted that almost 90%
of transfer activities in Cluster A are inter-cluster, due to the most lucrative deals happening
between clubs within this cluster because of the already high profile players being
transferred and the funds available, especially to the very wealthiest clubs.
• Clusters B, C and D receive the majority of their transfer income from Cluster A, accounting
for 62%, 55% and 42% respectively, showing that transfer fees continue to redistribute
revenue across the European footballing ecosystem.
Overall, the data indicates that the redistribution mechanism between top clubs/leagues to
smaller clubs/leagues continues to function.
89,3%
62,1%54,6%
41,6%
21,1%
5,1%
26,5%
17,6%
23,3%
24,3%
1,0%
2,5%
14,9%
9,2%
24,7%
15,2%
14,7%
7,1%
4,5%8,5% 11,4% 10,5% 8,0%
0%
10%
20%
30%
40%
50%
60%
70%
80%
90%
100%
Cluster A Cluster B Cluster C Cluster D Cluster E
Percentage of transfer fee revenue received based on selling cluster
All transfers between 2010/11 and 2019/20 combined
from Cluster A from Cluster B from Cluster C
from Cluster D from Cluster E from outside of Europe
Source: Transfermarkt / KPMG Data & Analysis
Financial development of European football > Analysis by revenue and expenditure streams > Transfer revenue and expenditure
Contents
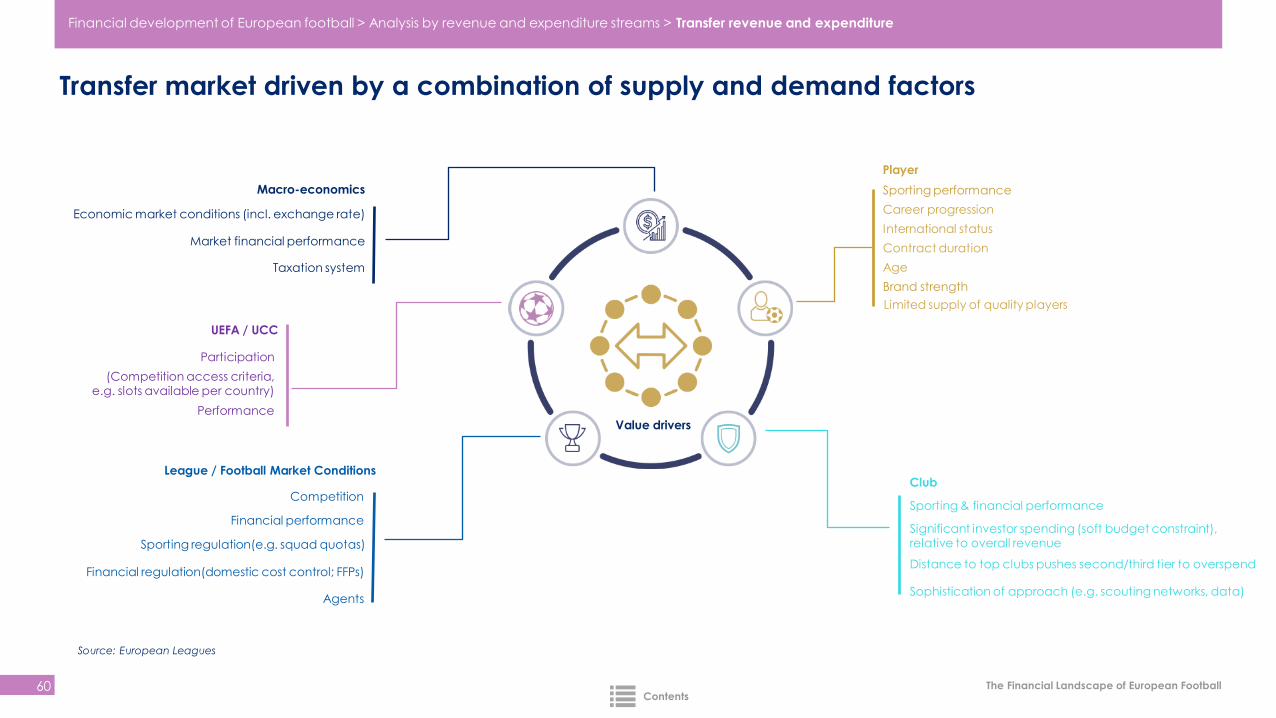
The Financial Landscape of European Football
Transfer market driven by a combination of supply and demand factors
60
Player
Macro-economics
League / Football Market Conditions
Financial performance
Contract duration
Sporting performance
Career progression
International status
Age
Club
Sporting & financial performance
Significant investor spending (soft budget constraint), relative to overall revenue
Distance to top clubs pushes second/third tier to overspend
Sophistication of approach (e.g. scouting networks, data)
Brand strength
Limited supply of quality players
Market financial performance
Taxation system
Economic market conditions (incl. exchange rate)
Sporting regulation(e.g. squad quotas)
Financial regulation(domestic cost control; FFPs)
Agents
Competition
UEFA / UCC
Participation
(Competition access criteria, e.g. slots available per country)
PerformanceValue drivers
Source: European Leagues
Financial development of European football > Analysis by revenue and expenditure streams > Transfer revenue and expenditure
Contents
Wages
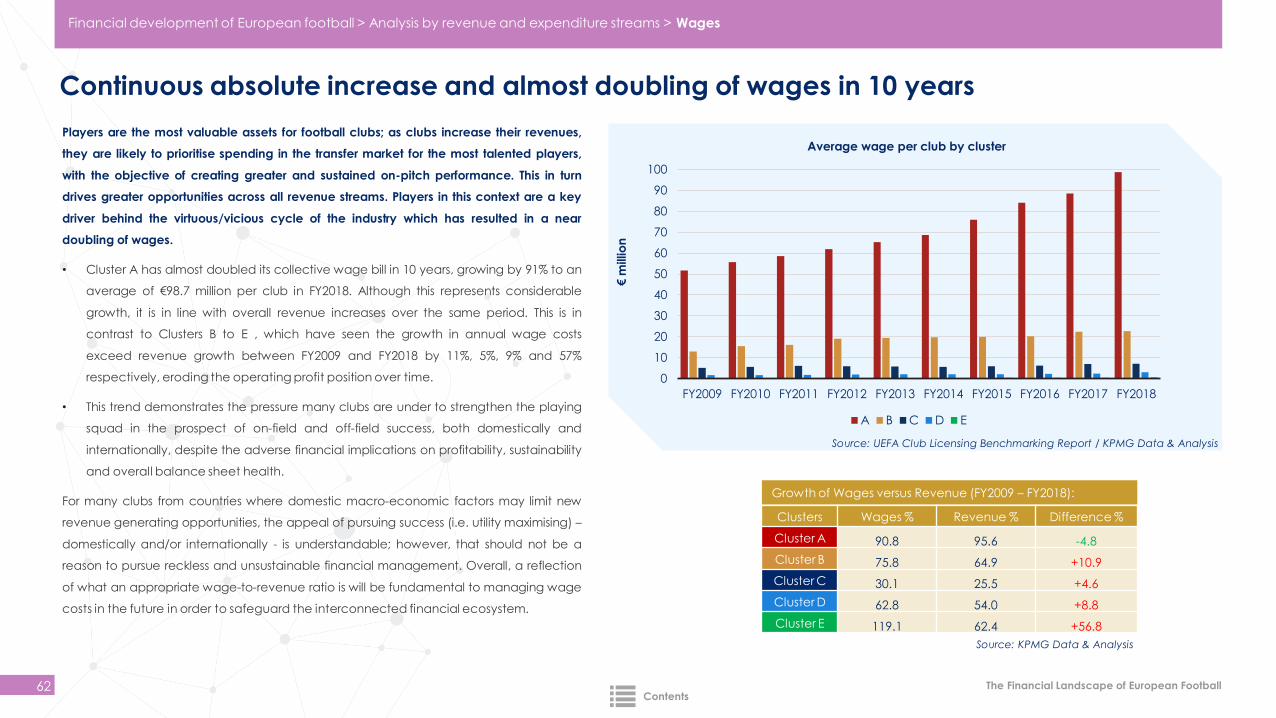
The Financial Landscape of European Football
Continuous absolute increase and almost doubling of wages in 10 years
62
0
10
20
30
40
50
60
70
80
90
100
FY2009 FY2010 FY2011 FY2012 FY2013 FY2014 FY2015 FY2016 FY2017 FY2018
Average wage per club by cluster
A B C D E
Players are the most valuable assets for football clubs; as clubs increase their revenues,
they are likely to prioritise spending in the transfer market for the most talented players,
with the objective of creating greater and sustained on-pitch performance. This in turn
drives greater opportunities across all revenue streams. Players in this context are a key
driver behind the virtuous/vicious cycle of the industry which has resulted in a near
doubling of wages.
• Cluster A has almost doubled its collective wage bill in 10 years, growing by 91% to an
average of €98.7 million per club in FY2018. Although this represents considerable
growth, it is in line with overall revenue increases over the same period. This is in
contrast to Clusters B to E , which have seen the growth in annual wage costs
exceed revenue growth between FY2009 and FY2018 by 11%, 5%, 9% and 57%
respectively, eroding the operating profit position over time.
• This trend demonstrates the pressure many clubs are under to strengthen the playing
squad in the prospect of on-field and off-field success, both domestically and
internationally, despite the adverse financial implications on profitability, sustainability
and overall balance sheet health.
For many clubs from countries where domestic macro-economic factors may limit new
revenue generating opportunities, the appeal of pursuing success (i.e. utility maximising) –
domestically and/or internationally - is understandable; however, that should not be a
reason to pursue reckless and unsustainable financial management. Overall, a reflection
of what an appropriate wage-to-revenue ratio is will be fundamental to managing wage
costs in the future in order to safeguard the interconnected financial ecosystem.
Growth of Wages versus Revenue (FY2009 – FY2018):
Clusters Wages % Revenue % Difference %
Cluster A 90.8 95.6 -4.8
Cluster B 75.8 64.9 +10.9
Cluster C 30.1 25.5 +4.6
Cluster D 62.8 54.0 +8.8
Cluster E 119.1 62.4 +56.8
Source: UEFA Club Licensing Benchmarking Report / KPMG Data & Analysis
Financial development of European football > Analysis by revenue and expenditure streams > Wages
€ m
illio
n
Source: KPMG Data & Analysis
Contents
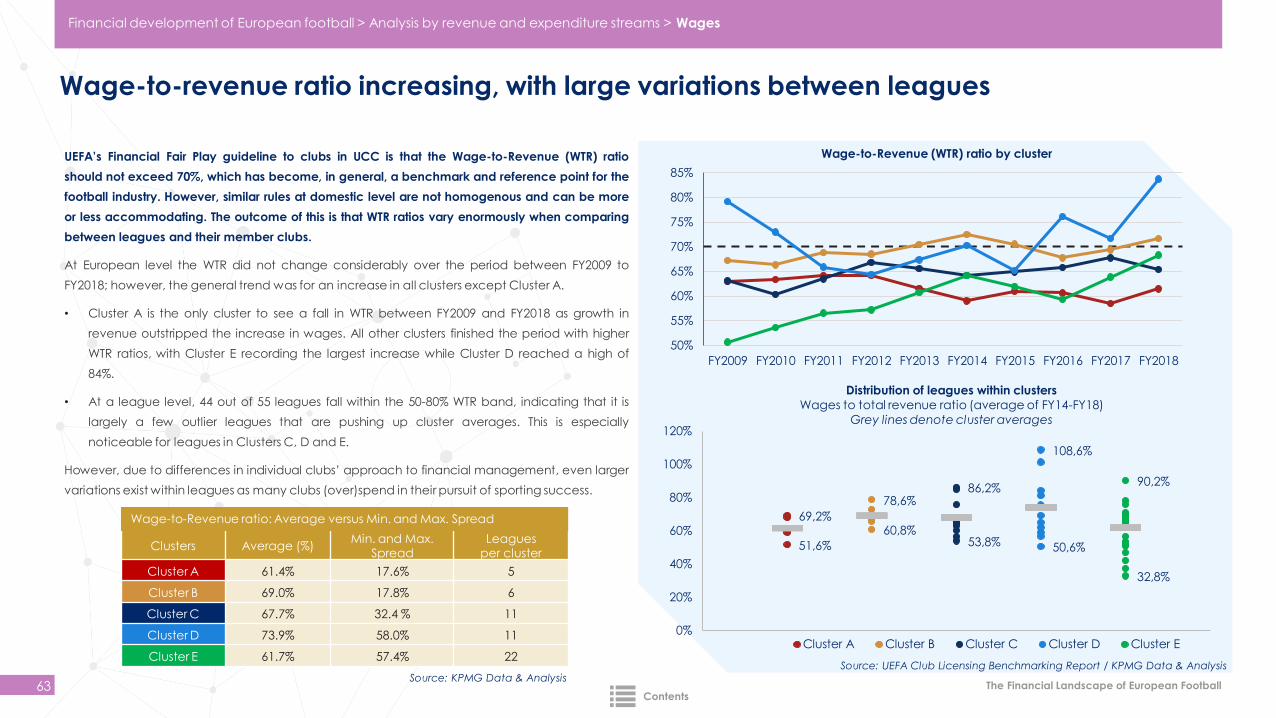
The Financial Landscape of European Football
Wage-to-revenue ratio increasing, with large variations between leagues
63
UEFA’s Financial Fair Play guideline to clubs in UCC is that the Wage-to-Revenue (WTR) ratio
should not exceed 70%, which has become, in general, a benchmark and reference point for the
football industry. However, similar rules at domestic level are not homogenous and can be more
or less accommodating. The outcome of this is that WTR ratios vary enormously when comparing
between leagues and their member clubs.
At European level the WTR did not change considerably over the period between FY2009 to
FY2018; however, the general trend was for an increase in all clusters except Cluster A.
• Cluster A is the only cluster to see a fall in WTR between FY2009 and FY2018 as growth in
revenue outstripped the increase in wages. All other clusters finished the period with higher
WTR ratios, with Cluster E recording the largest increase while Cluster D reached a high of
84%.
• At a league level, 44 out of 55 leagues fall within the 50-80% WTR band, indicating that it is
largely a few outlier leagues that are pushing up cluster averages. This is especially
noticeable for leagues in Clusters C, D and E.
However, due to differences in individual clubs’ approach to financial management, even larger
variations exist within leagues as many clubs (over)spend in their pursuit of sporting success.
50%
55%
60%
65%
70%
75%
80%
85%
FY2009 FY2010 FY2011 FY2012 FY2013 FY2014 FY2015 FY2016 FY2017 FY2018
Wage-to-Revenue (WTR) ratio by cluster
69,2%
51,6%
60,8%
78,6%
53,8%
86,2%
50,6%
108,6%
32,8%
90,2%
0%
20%
40%
60%
80%
100%
120%
Distribution of leagues within clusters
Wages to total revenue ratio (average of FY14-FY18)
Grey lines denote cluster averages
Cluster A Cluster B Cluster C Cluster D Cluster E
Clusters Average (%)Min. and Max.
Spread Leagues
per cluster
Cluster A 61.4% 17.6% 5
Cluster B 69.0% 17.8% 6
Cluster C 67.7% 32.4 % 11
Cluster D 73.9% 58.0% 11
Cluster E 61.7% 57.4% 22
Wage-to-Revenue ratio: Average versus Min. and Max. Spread
Source: UEFA Club Licensing Benchmarking Report / KPMG Data & Analysis
Financial development of European football > Analysis by revenue and expenditure streams > Wages
Source: KPMG Data & Analysis
Contents
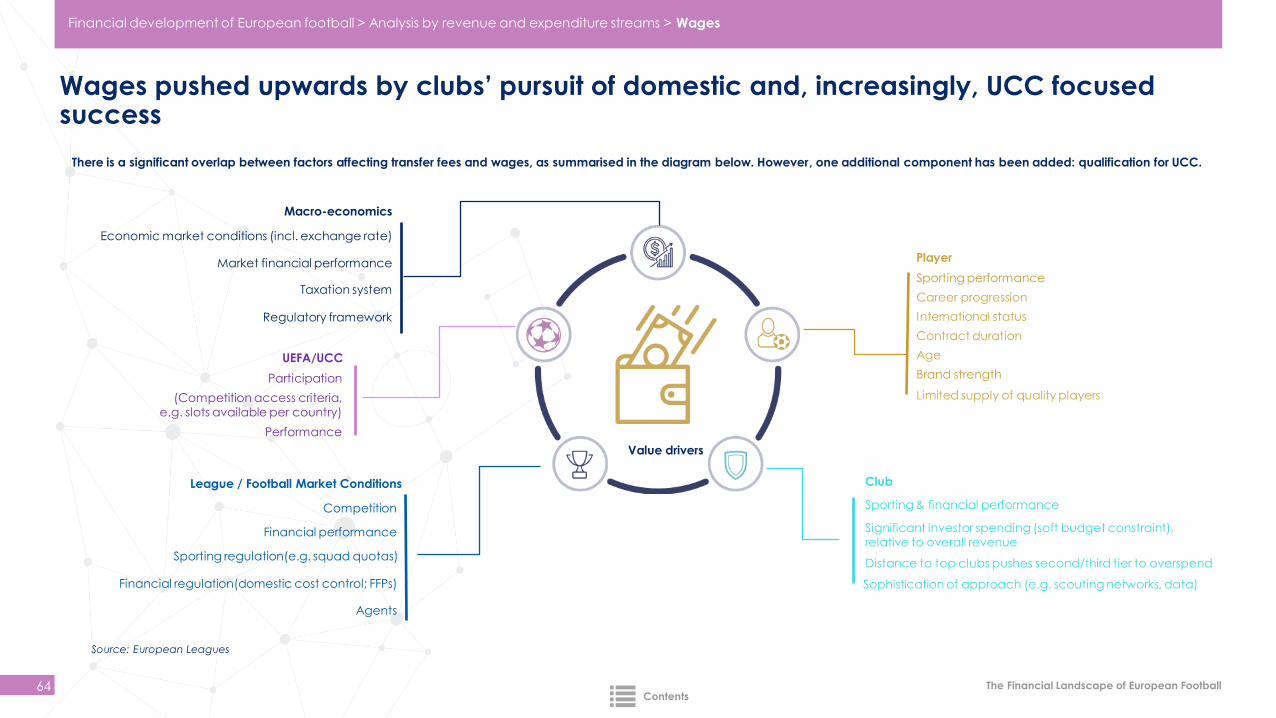
The Financial Landscape of European Football
Wages pushed upwards by clubs’ pursuit of domestic and, increasingly, UCC focused success
64
Source: European Leagues
Player
Macro-economics
League / Football Market Conditions
Financial performance
Contract duration
Sporting performance
Career progression
International status
Age
Club
Sporting & financial performance
Significant investor spending (soft budget constraint), relative to overall revenue
Distance to top clubs pushes second/third tier to overspend
Sophistication of approach (e.g. scouting networks, data)
Brand strength
Limited supply of quality players
UEFA/UCC
Market financial performance
Taxation system
Economic market conditions (incl. exchange rate)
Regulatory framework
Sporting regulation(e.g. squad quotas)
Financial regulation(domestic cost control; FFPs)
Agents
Competition
There is a significant overlap between factors affecting transfer fees and wages, as summarised in the diagram below. However, one additional component has been added: qualification for UCC.
Participation
(Competition access criteria, e.g. slots available per country)
Performance
Value drivers
Financial development of European football > Analysis by revenue and expenditure streams > Wages
Contents

Profitability
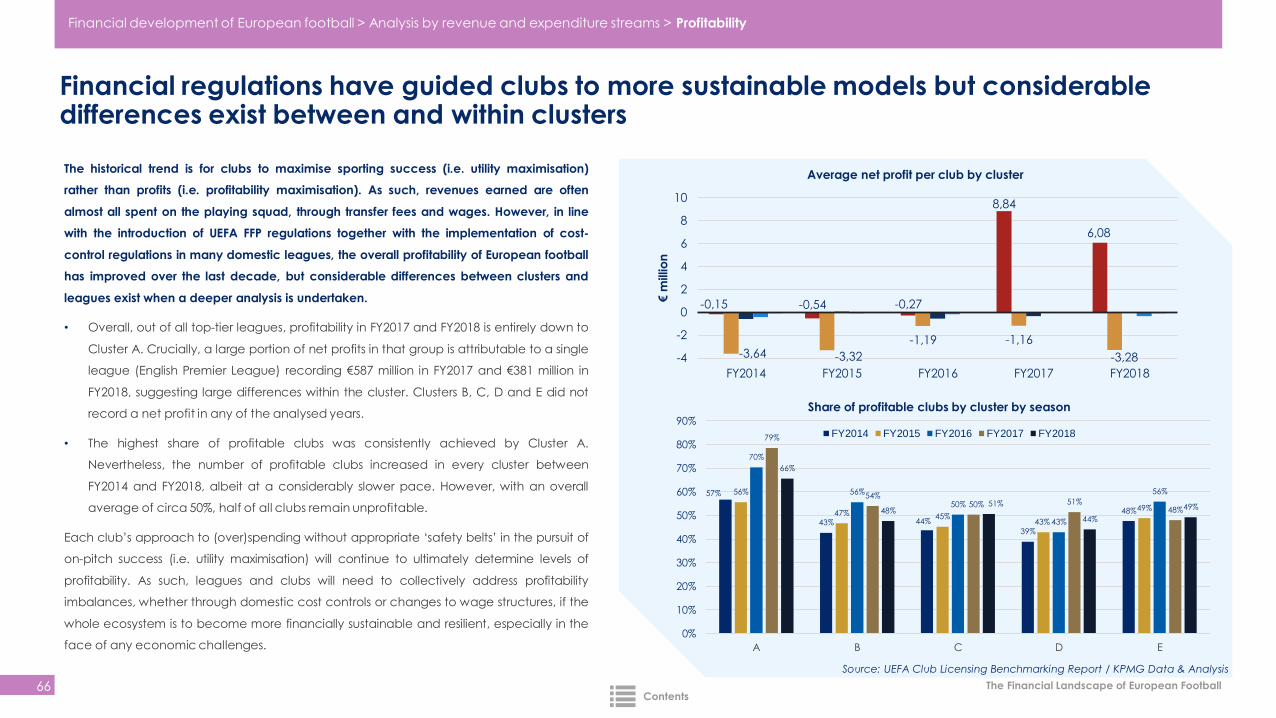
The Financial Landscape of European Football
Financial regulations have guided clubs to more sustainable models but considerable differences exist between and within clusters
66
-0,15 -0,54 -0,27
8,84
6,08
-3,64 -3,32
-1,19 -1,16
-3,28-4
-2
0
2
4
6
8
10
FY2014 FY2015 FY2016 FY2017 FY2018
€m
illio
n
Average net profit per club by cluster
57%
43% 44%
39%
48%
56%
47% 45%43%
49%
70%
56%
50%
43%
56%
79%
54%50% 51%
48%
66%
48%51%
44%
49%
0%
10%
20%
30%
40%
50%
60%
70%
80%
90%
A B C D E
Share of profitable clubs by cluster by season
FY2014 FY2015 FY2016 FY2017 FY2018
The historical trend is for clubs to maximise sporting success (i.e. utility maximisation)
rather than profits (i.e. profitability maximisation). As such, revenues earned are often
almost all spent on the playing squad, through transfer fees and wages. However, in line
with the introduction of UEFA FFP regulations together with the implementation of cost-
control regulations in many domestic leagues, the overall profitability of European football
has improved over the last decade, but considerable differences between clusters and
leagues exist when a deeper analysis is undertaken.
• Overall, out of all top-tier leagues, profitability in FY2017 and FY2018 is entirely down to
Cluster A. Crucially, a large portion of net profits in that group is attributable to a single
league (English Premier League) recording €587 million in FY2017 and €381 million in
FY2018, suggesting large differences within the cluster. Clusters B, C, D and E did not
record a net profit in any of the analysed years.
• The highest share of profitable clubs was consistently achieved by Cluster A.
Nevertheless, the number of profitable clubs increased in every cluster between
FY2014 and FY2018, albeit at a considerably slower pace. However, with an overall
average of circa 50%, half of all clubs remain unprofitable.
Each club’s approach to (over)spending without appropriate ‘safety belts’ in the pursuit of
on-pitch success (i.e. utility maximisation) will continue to ultimately determine levels of
profitability. As such, leagues and clubs will need to collectively address profitability
imbalances, whether through domestic cost controls or changes to wage structures, if the
whole ecosystem is to become more financially sustainable and resilient, especially in the
face of any economic challenges.
Source: UEFA Club Licensing Benchmarking Report / KPMG Data & Analysis
Financial development of European football > Analysis by revenue and expenditure streams > Profitability
Contents
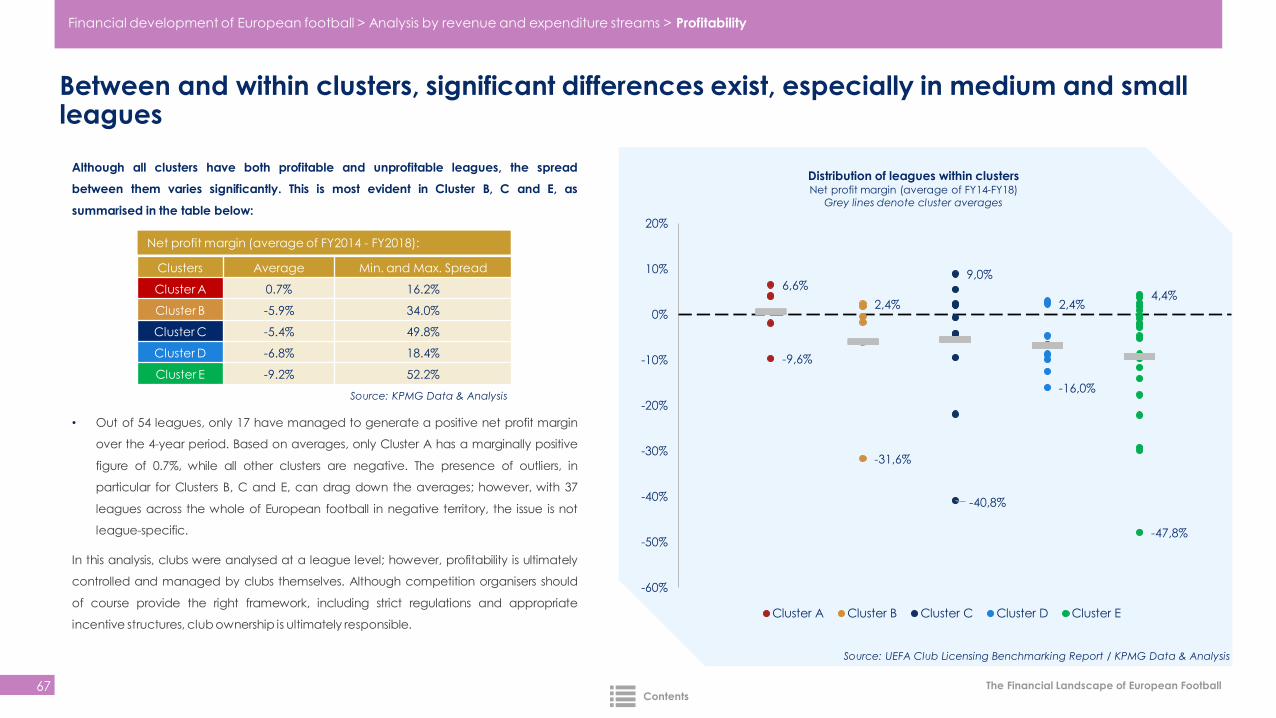
The Financial Landscape of European Football
Between and within clusters, significant differences exist, especially in medium and small leagues
67
-9,6%
6,6%
2,4%
-31,6%
-40,8%
9,0%
2,4%
-16,0%
-47,8%
4,4%
-60%
-50%
-40%
-30%
-20%
-10%
0%
10%
20%
Distribution of leagues within clustersNet profit margin (average of FY14-FY18)
Grey lines denote cluster averages
Cluster A Cluster B Cluster C Cluster D Cluster E
Although all clusters have both profitable and unprofitable leagues, the spread
between them varies significantly. This is most evident in Cluster B, C and E, as
summarised in the table below:
Net profit margin (average of FY2014 - FY2018):
Clusters Average Min. and Max. Spread
Cluster A 0.7% 16.2%
Cluster B -5.9% 34.0%
Cluster C -5.4% 49.8%
Cluster D -6.8% 18.4%
Cluster E -9.2% 52.2%
• Out of 54 leagues, only 17 have managed to generate a positive net profit margin
over the 4-year period. Based on averages, only Cluster A has a marginally positive
figure of 0.7%, while all other clusters are negative. The presence of outliers, in
particular for Clusters B, C and E, can drag down the averages; however, with 37
leagues across the whole of European football in negative territory, the issue is not
league-specific.
In this analysis, clubs were analysed at a league level; however, profitability is ultimately
controlled and managed by clubs themselves. Although competition organisers should
of course provide the right framework, including strict regulations and appropriate
incentive structures, club ownership is ultimately responsible.
Source: UEFA Club Licensing Benchmarking Report / KPMG Data & Analysis
Financial development of European football > Analysis by revenue and expenditure streams > Profitability
Source: KPMG Data & Analysis
Contents
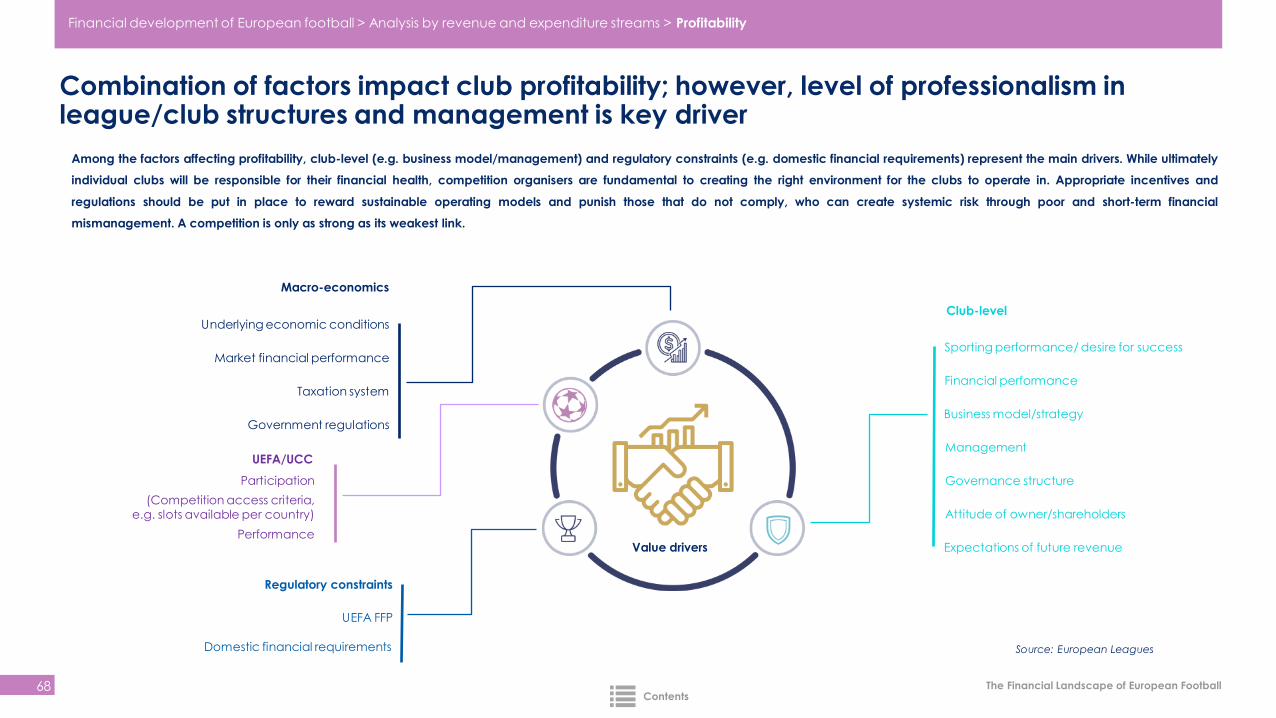
The Financial Landscape of European Football
Combination of factors impact club profitability; however, level of professionalism in league/club structures and management is key driver
68
Government regulations
Regulatory constraints
Macro-economics
Domestic financial requirements
UEFA FFP
Market financial performance
Taxation system
Underlying economic conditionsClub-level
Sporting performance/ desire for success
Financial performance
Business model/strategy
Management
Governance structure
Attitude of owner/shareholders
Expectations of future revenue
Among the factors affecting profitability, club-level (e.g. business model/management) and regulatory constraints (e.g. domestic financial requirements) represent the main drivers. While ultimately
individual clubs will be responsible for their financial health, competition organisers are fundamental to creating the right environment for the clubs to operate in. Appropriate incentives and
regulations should be put in place to reward sustainable operating models and punish those that do not comply, who can create systemic risk through poor and short-term financial
mismanagement. A competition is only as strong as its weakest link.
Source: European Leagues
UEFA/UCC
Participation
(Competition access criteria, e.g. slots available per country)
PerformanceValue drivers
Financial development of European football > Analysis by revenue and expenditure streams > Profitability
Contents
Finance and sporting performance

The Financial Landscape of European Football
Financial performance impacts and is impacted by on-field sporting performance
70
Financial performance is both an input and an output, causing long-term impacts – vicious and virtuous. How centralised revenues are shared impacts competitive balance. In this section, we
assess competitive balance in domestic European leagues and the correlation between revenues and on-field sporting performance.
The virtuous cycle of football
Stronger financial performance
More talented playing squad
Better sporting performance
Highercommercial and
media appeal
Professionalisation of leagues/clubs
1
23
4
External and macro-economic conditions
Source: European Leagues
The vicious cycle of football
Weaker financial performance
Less talented playing squad
Worse sporting performance
Lowercommercial and
media appeal
Professionalisation of leagues/clubs
1
2 3
4
External and macro-economic conditions
Source: European Leagues
The Financial Landscape of European Football > Finance and sporting performance
Contents
Squad and sporting performance
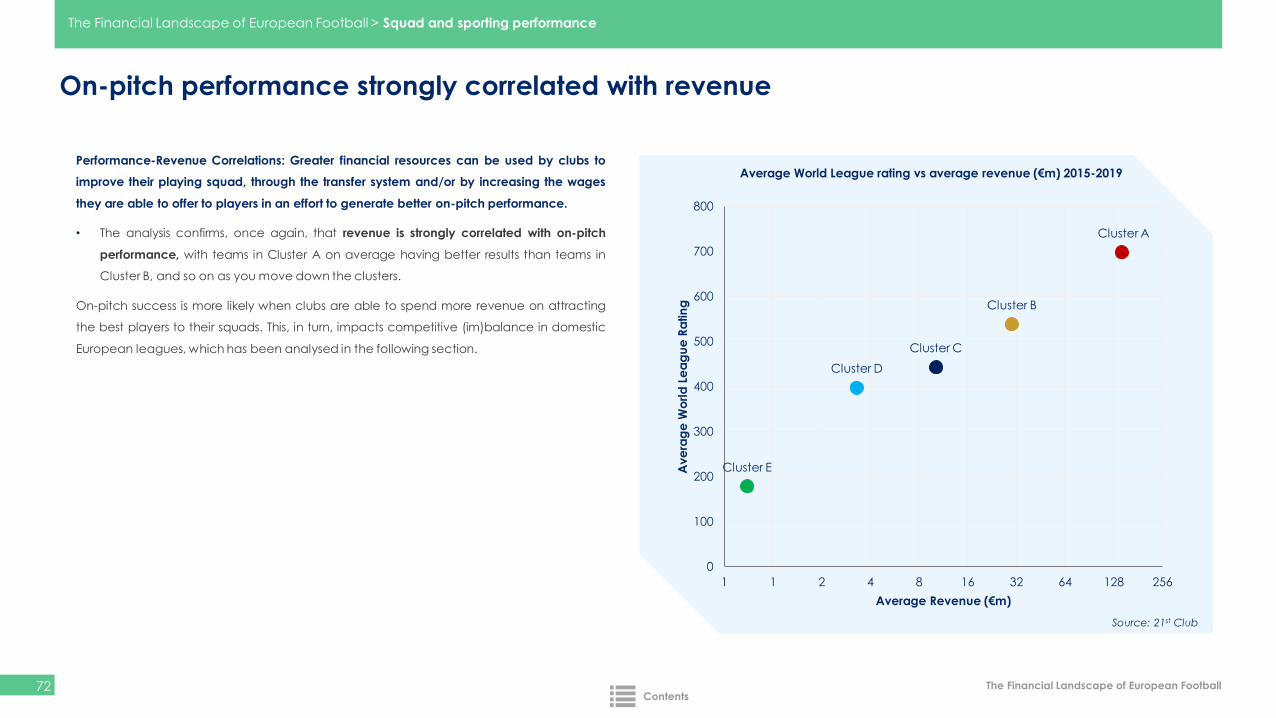
The Financial Landscape of European Football
On-pitch performance strongly correlated with revenue
72
Performance-Revenue Correlations: Greater financial resources can be used by clubs to
improve their playing squad, through the transfer system and/or by increasing the wages
they are able to offer to players in an effort to generate better on-pitch performance.
• The analysis confirms, once again, that revenue is strongly correlated with on-pitch
performance, with teams in Cluster A on average having better results than teams in
Cluster B, and so on as you move down the clusters.
On-pitch success is more likely when clubs are able to spend more revenue on attracting
the best players to their squads. This, in turn, impacts competitive (im)balance in domestic
European leagues, which has been analysed in the following section.
Source: 21st Club
Cluster A
Cluster B
Cluster C
Cluster D
Cluster E
0
100
200
300
400
500
600
700
800
1 1 2 4 8 16 32 64 128 256
Ave
rag
e W
orld
Le
ag
ue
Ra
tin
g
Average Revenue (€m)
Average World League rating vs average revenue (€m) 2015-2019
The Financial Landscape of European Football > Squad and sporting performance
Contents

Competitive (Im)Balance

The Financial Landscape of European Football
Competitive balance is a function of the differing financial performance of clubs within leagues
74
Competitive balance as a construct can be viewed in a number of ways. A virtuous/vicious cycle exists at a club and league level – what’s good for one may not be what’s good for the
other in the long term; there is a need to find balance. Why do clubs have different experiences of the virtuous/vicious circle? How can competitive balance play out within domestic
leagues? In order to explore these questions we commissioned two reports with different approaches to measure trends in competitive balance, primarily focused on title races, in European
domestic leagues:
Non cluster-based analysis - CIES: This study covers 31 top-tier European leagues and 25 years: from 1993/94, the season after the introduction of the Champions League, to 2017/18. The
analysis covers, for example:
• The number of different champions
• Average points per match of champions
• Percentage of games remaining at title win
• Points per match gap between champions and runners-up
Cluster-based analysis - 21st Club: This analysis covers all top-tier European leagues, from 2014/15 to 2018/19 and incorporates the Cluster A to E approach used through this report. The
analysis looks at range and variation in team performance, match odds and expected outcomes through the lens of a team strength model, using a machine-learning-based algorithm. The
world league model ranks over 4,000 teams in one ‘league table’, enabling team comparisons across countries on a like-for-like basis. The benefits of using this approach to assess
competitive balance are as follows:
• Allows assessment of competitive balance in the context of quality, as the model identifies differences in strengths across leagues
• Allows one to compare leagues and clusters consistently, as every team is rated on the same system
• Allows one to look across a league as a whole on a consistent basis (which may not be possible using points per game when there are split seasons)
• Utilises an understanding of the underlying strength of teams, and therefore the level of uncertainty before matches
The Financial Landscape of European Football > Competitive (Im)Balance
Contents
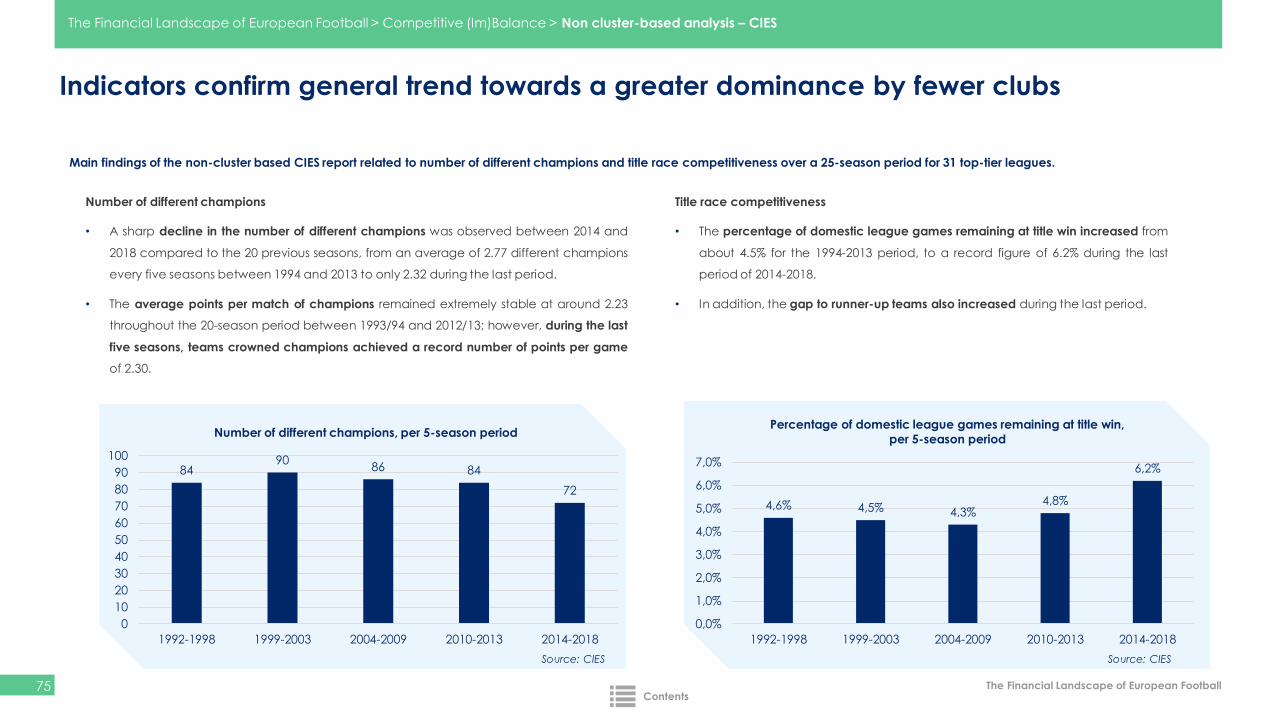
The Financial Landscape of European Football
Indicators confirm general trend towards a greater dominance by fewer clubs
75
Number of different champions
• A sharp decline in the number of different champions was observed between 2014 and
2018 compared to the 20 previous seasons, from an average of 2.77 different champions
every five seasons between 1994 and 2013 to only 2.32 during the last period.
• The average points per match of champions remained extremely stable at around 2.23
throughout the 20-season period between 1993/94 and 2012/13; however, during the last
five seasons, teams crowned champions achieved a record number of points per game
of 2.30.
Title race competitiveness
• The percentage of domestic league games remaining at title win increased from
about 4.5% for the 1994-2013 period, to a record figure of 6.2% during the last
period of 2014-2018.
• In addition, the gap to runner-up teams also increased during the last period.
Source: CIES
Main findings of the non-cluster based CIES report related to number of different champions and title race competitiveness over a 25-season period for 31 top-tier leagues.
Source: CIES
8490
86 84
72
0
10
20
30
40
50
60
70
80
90
100
1992-1998 1999-2003 2004-2009 2010-2013 2014-2018
Number of different champions, per 5-season period
4,6% 4,5% 4,3%4,8%
6,2%
0,0%
1,0%
2,0%
3,0%
4,0%
5,0%
6,0%
7,0%
1992-1998 1999-2003 2004-2009 2010-2013 2014-2018
Percentage of domestic league games remaining at title win,
per 5-season period
The Financial Landscape of European Football > Competitive (Im)Balance > Non cluster-based analysis – CIES
Contents
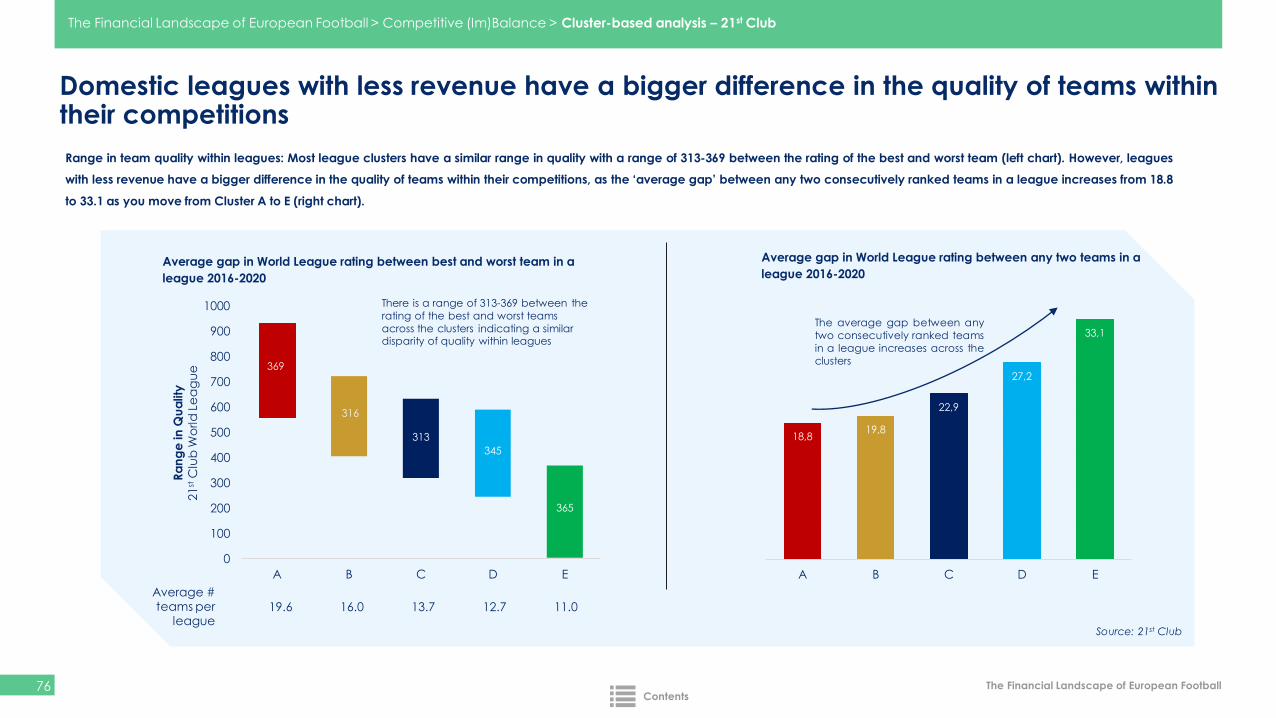
The Financial Landscape of European Football
Domestic leagues with less revenue have a bigger difference in the quality of teams within their competitions
76
Range in team quality within leagues: Most league clusters have a similar range in quality with a range of 313-369 between the rating of the best and worst team (left chart). However, leagues
with less revenue have a bigger difference in the quality of teams within their competitions, as the ‘average gap’ between any two consecutively ranked teams in a league increases from 18.8
to 33.1 as you move from Cluster A to E (right chart).
Source: 21st Club
18,819,8
22,9
27,2
33,1
A B C D E
369
316
313
345
365
0
100
200
300
400
500
600
700
800
900
1000
A B C D E
Ra
ng
e in
Qu
alit
y
21
stC
lub
Wo
rld
Le
ag
ue
Average gap in World League rating between best and worst team in a
league 2016-2020
19.6 16.0 13.7 12.7 11.0
Average gap in World League rating between any two teams in a
league 2016-2020
The average gap between any
two consecutively ranked teams
in a league increases across the
clusters
There is a range of 313-369 between the
rating of the best and worst teams
across the clusters indicating a similar disparity of quality within leagues
Average # teams per
league
The Financial Landscape of European Football > Competitive (Im)Balance > Cluster-based analysis – 21st Club
Contents
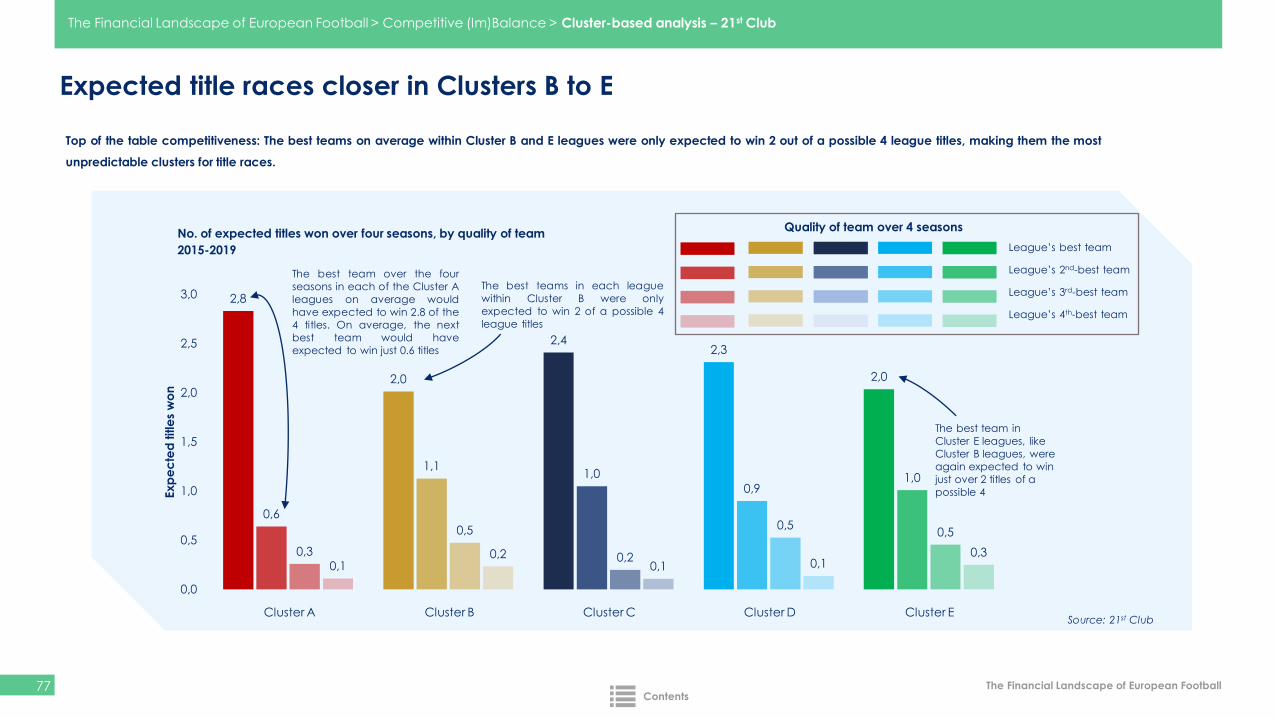
The Financial Landscape of European Football
Expected title races closer in Clusters B to E
77
Source: 21st Club
Top of the table competitiveness: The best teams on average within Cluster B and E leagues were only expected to win 2 out of a possible 4 league titles, making them the most
unpredictable clusters for title races.
2,8
2,0
2,42,3
2,0
0,6
1,11,0
0,91,0
0,3
0,5
0,2
0,50,5
0,10,2
0,1 0,10,3
0,0
0,5
1,0
1,5
2,0
2,5
3,0
Exp
ec
ted
title
s w
on
No. of expected titles won over four seasons, by quality of team
2015-2019
The best team over the four
seasons in each of the Cluster A
leagues on average would
have expected to win 2.8 of the
4 titles. On average, the next
best team would have
expected to win just 0.6 titles
The best teams in each league
within Cluster B were only
expected to win 2 of a possible 4
league titles
Cluster A Cluster B Cluster C Cluster D Cluster E
The best team in
Cluster E leagues, like
Cluster B leagues, were
again expected to win
just over 2 titles of a
possible 4
Quality of team over 4 seasons
League’s best team
League’s 2nd-best team
League’s 3rd-best team
League’s 4th-best team
The Financial Landscape of European Football > Competitive (Im)Balance > Cluster-based analysis – 21st Club
Contents
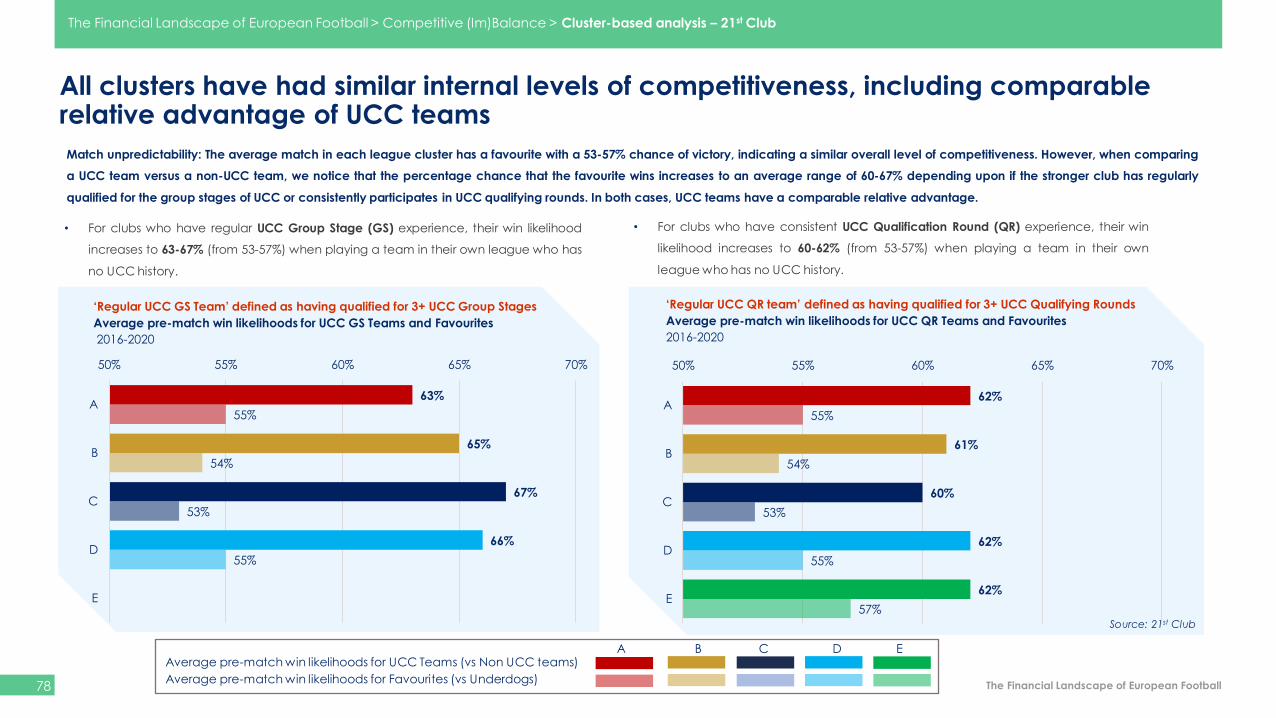
The Financial Landscape of European Football
62%
61%
60%
62%
62%
55%
54%
53%
55%
57%
50% 55% 60% 65% 70%
A
B
C
D
E
All clusters have had similar internal levels of competitiveness, including comparable relative advantage of UCC teams
78
Match unpredictability: The average match in each league cluster has a favourite with a 53-57% chance of victory, indicating a similar overall level of competitiveness. However, when comparing
a UCC team versus a non-UCC team, we notice that the percentage chance that the favourite wins increases to an average range of 60-67% depending upon if the stronger club has regularly
qualified for the group stages of UCC or consistently participates in UCC qualifying rounds. In both cases, UCC teams have a comparable relative advantage.
• For clubs who have regular UCC Group Stage (GS) experience, their win likelihood
increases to 63-67% (from 53-57%) when playing a team in their own league who has
no UCC history.
• For clubs who have consistent UCC Qualification Round (QR) experience, their win
likelihood increases to 60-62% (from 53-57%) when playing a team in their own
league who has no UCC history.
‘Regular UCC GS Team’ defined as having qualified for 3+ UCC Group Stages
Average pre-match win likelihoods for UCC GS Teams and Favourites
2016-2020
63%
65%
67%
66%
55%
54%
53%
55%
50% 55% 60% 65% 70%
A
B
C
D
E
‘Regular UCC QR team’ defined as having qualified for 3+ UCC Qualifying Rounds
Average pre-match win likelihoods for UCC QR Teams and Favourites
2016-2020
Source: 21st Club
The Financial Landscape of European Football > Competitive (Im)Balance > Cluster-based analysis – 21st Club
A B C D EAverage pre-match win likelihoods for UCC Teams (vs Non UCC teams)
Average pre-match win likelihoods for Favourites (vs Underdogs)
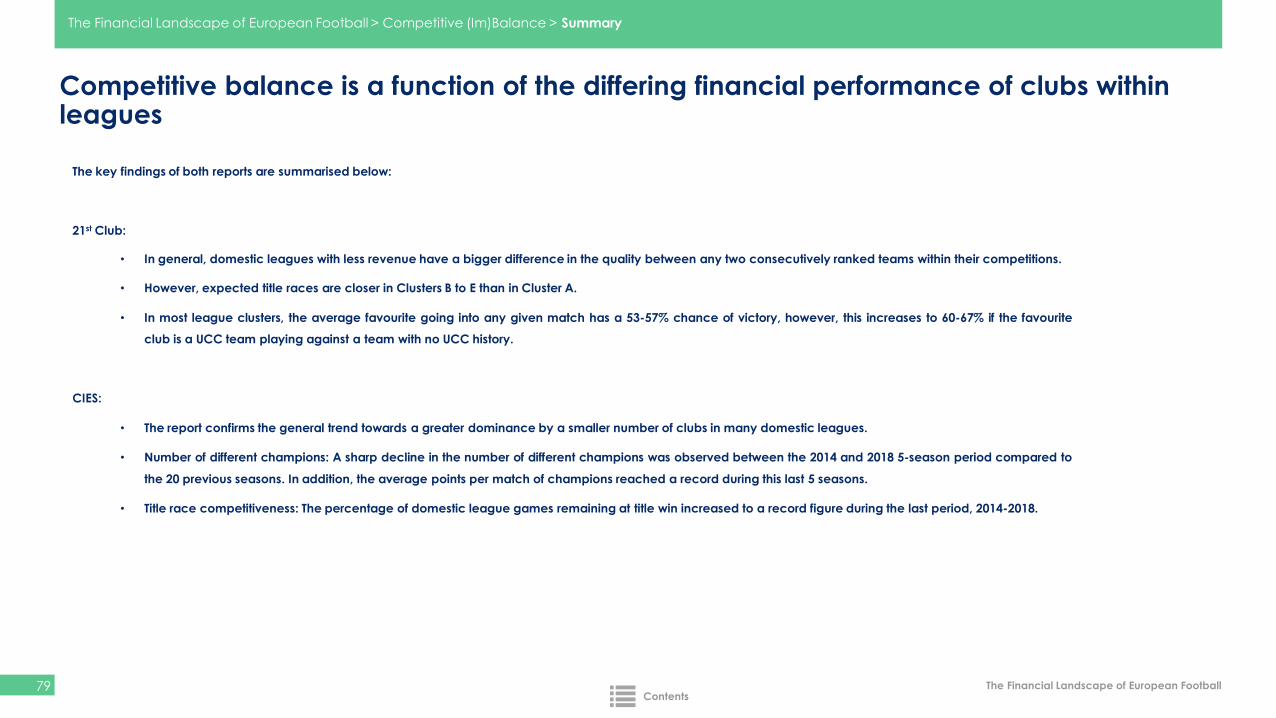
The Financial Landscape of European Football
Competitive balance is a function of the differing financial performance of clubs within leagues
79
The key findings of both reports are summarised below:
21st Club:
• In general, domestic leagues with less revenue have a bigger difference in the quality between any two consecutively ranked teams within their competitions.
• However, expected title races are closer in Clusters B to E than in Cluster A.
• In most league clusters, the average favourite going into any given match has a 53-57% chance of victory, however, this increases to 60-67% if the favourite
club is a UCC team playing against a team with no UCC history.
CIES:
• The report confirms the general trend towards a greater dominance by a smaller number of clubs in many domestic leagues.
• Number of different champions: A sharp decline in the number of different champions was observed between the 2014 and 2018 5-season period compared to
the 20 previous seasons. In addition, the average points per match of champions reached a record during this last 5 seasons.
• Title race competitiveness: The percentage of domestic league games remaining at title win increased to a record figure during the last period, 2014-2018.
The Financial Landscape of European Football > Competitive (Im)Balance > Summary
Contents
Overview of European professional football
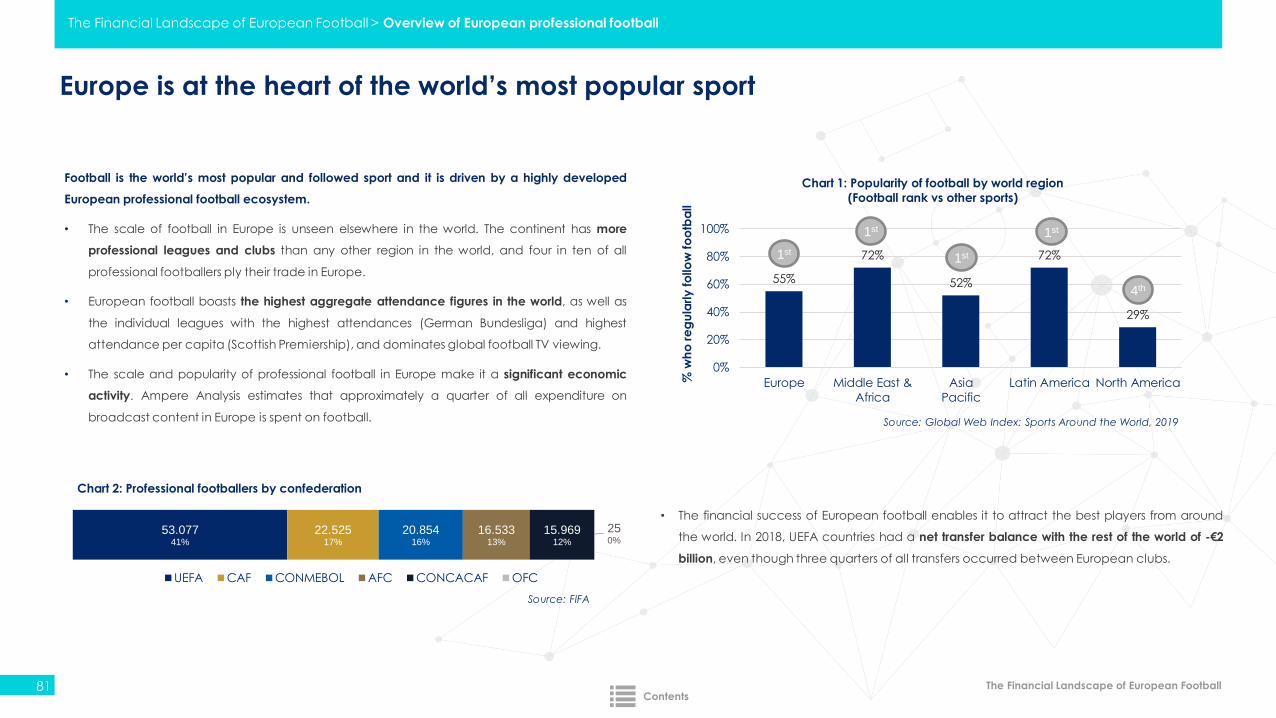
The Financial Landscape of European Football
Europe is at the heart of the world’s most popular sport
81
Football is the world’s most popular and followed sport and it is driven by a highly developed
European professional football ecosystem.
• The scale of football in Europe is unseen elsewhere in the world. The continent has more
professional leagues and clubs than any other region in the world, and four in ten of all
professional footballers ply their trade in Europe.
• European football boasts the highest aggregate attendance figures in the world, as well as
the individual leagues with the highest attendances (German Bundesliga) and highest
attendance per capita (Scottish Premiership), and dominates global football TV viewing.
• The scale and popularity of professional football in Europe make it a significant economic
activity. Ampere Analysis estimates that approximately a quarter of all expenditure on
broadcast content in Europe is spent on football. Source: Global Web Index: Sports Around the World, 2019
55%
72%
52%
72%
29%
0%
20%
40%
60%
80%
100%
Europe Middle East &
Africa
Asia
Pacific
Latin America North America% w
ho
re
gu
larly
fo
llow
fo
otb
all
Chart 1: Popularity of football by world region
(Football rank vs other sports)
4th
1st
1st1st
1st
53.07741%
22.52517%
20.85416%
16.53313%
15.96912%
250%
Chart 2: Professional footballers by confederation
UEFA CAF CONMEBOL AFC CONCACAF OFC
Source: FIFA
• The financial success of European football enables it to attract the best players from around
the world. In 2018, UEFA countries had a net transfer balance with the rest of the world of -€2
billion, even though three quarters of all transfers occurred between European clubs.
The Financial Landscape of European Football > Overview of European professional football
Contents
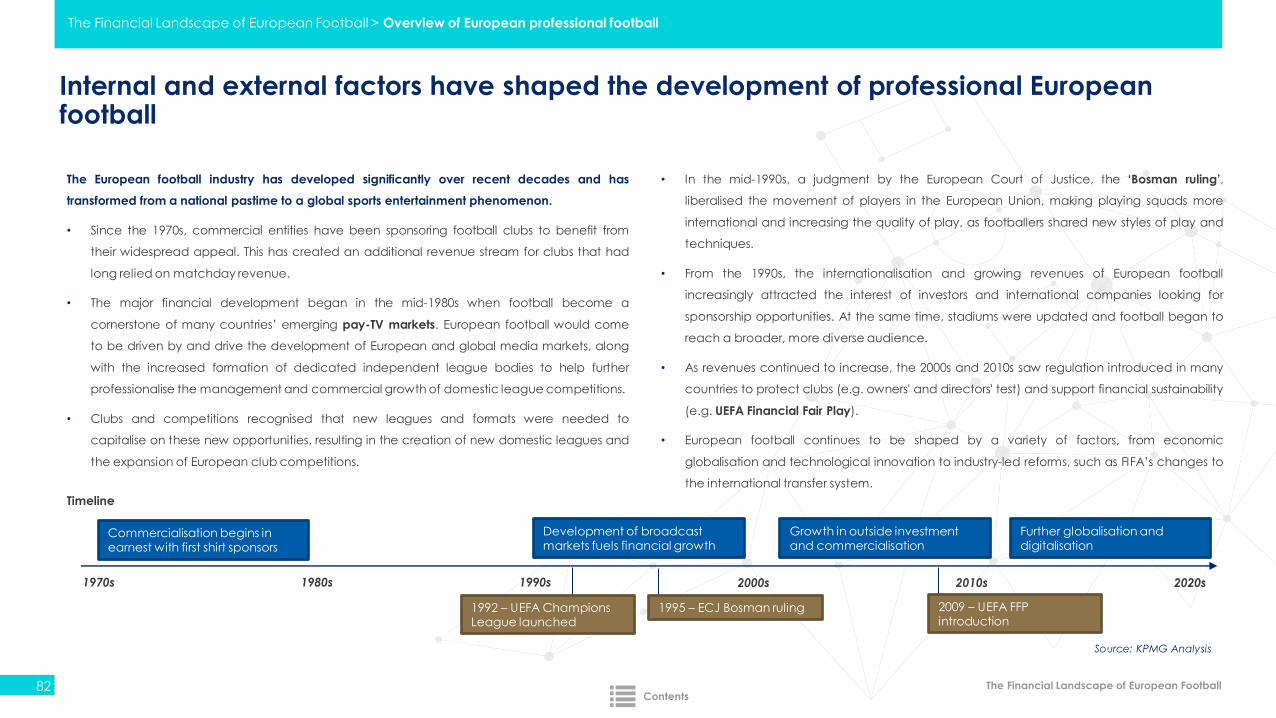
The Financial Landscape of European Football
Internal and external factors have shaped the development of professional European football
82
The European football industry has developed significantly over recent decades and has
transformed from a national pastime to a global sports entertainment phenomenon.
• Since the 1970s, commercial entities have been sponsoring football clubs to benefit from
their widespread appeal. This has created an additional revenue stream for clubs that had
long relied on matchday revenue.
• The major financial development began in the mid-1980s when football become a
cornerstone of many countries’ emerging pay-TV markets. European football would come
to be driven by and drive the development of European and global media markets, along
with the increased formation of dedicated independent league bodies to help further
professionalise the management and commercial growth of domestic league competitions.
• Clubs and competitions recognised that new leagues and formats were needed to
capitalise on these new opportunities, resulting in the creation of new domestic leagues and
the expansion of European club competitions.
1970s 1980s 1990s 2000s 2010s 2020s
Commercialisation begins in earnest with first shirt sponsors
Development of broadcast markets fuels financial growth
Growth in outside investment and commercialisation
Further globalisation and digitalisation
1992 – UEFA Champions League launched
1995 – ECJ Bosman ruling 2009 – UEFA FFP introduction
Timeline
• In the mid-1990s, a judgment by the European Court of Justice, the ‘Bosman ruling’,
liberalised the movement of players in the European Union, making playing squads more
international and increasing the quality of play, as footballers shared new styles of play and
techniques.
• From the 1990s, the internationalisation and growing revenues of European football
increasingly attracted the interest of investors and international companies looking for
sponsorship opportunities. At the same time, stadiums were updated and football began to
reach a broader, more diverse audience.
• As revenues continued to increase, the 2000s and 2010s saw regulation introduced in many
countries to protect clubs (e.g. owners' and directors' test) and support financial sustainability
(e.g. UEFA Financial Fair Play).
• European football continues to be shaped by a variety of factors, from economic
globalisation and technological innovation to industry-led reforms, such as FIFA’s changes to
the international transfer system.
Source: KPMG Analysis
The Financial Landscape of European Football > Overview of European professional football
Contents
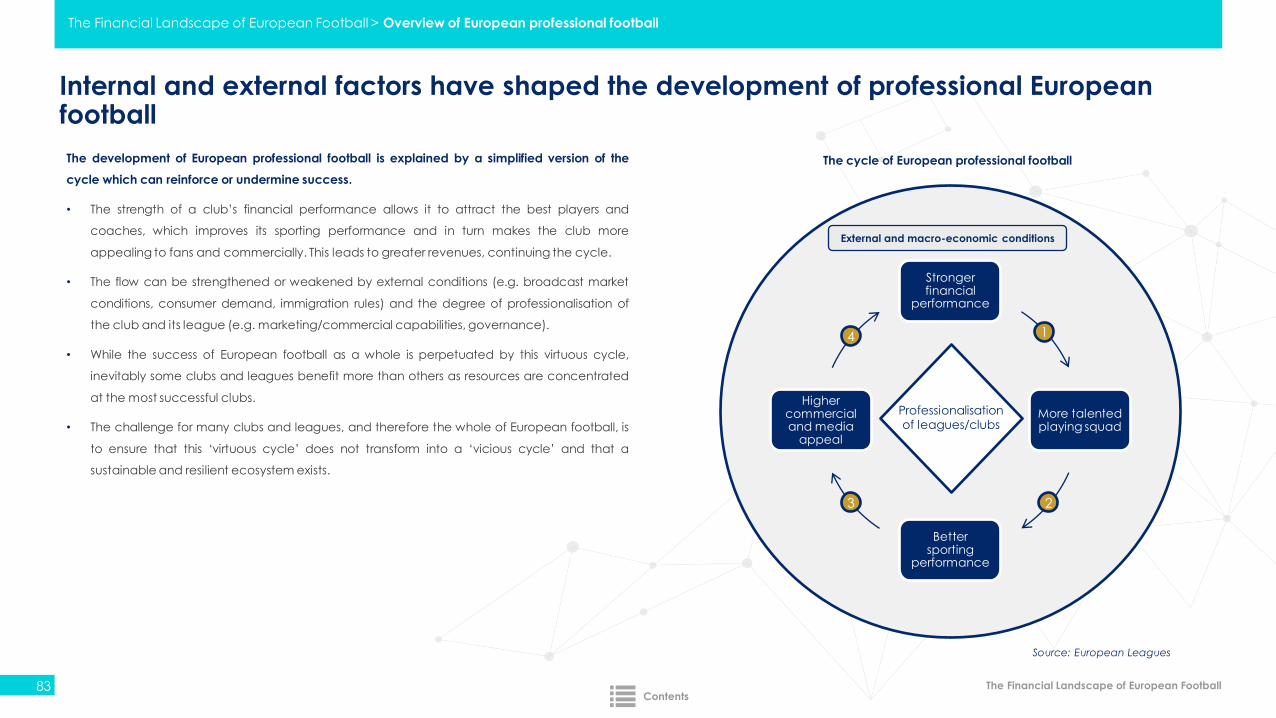
The Financial Landscape of European Football
Internal and external factors have shaped the development of professional European football
83
Source: European Leagues
The cycle of European professional football
Stronger financial
performance
More talented playing squad
Better sporting
performance
Higher commercial and media
appeal
Professionalisation of leagues/clubs
1
23
4
External and macro-economic conditions
The development of European professional football is explained by a simplified version of the
cycle which can reinforce or undermine success.
• The strength of a club’s financial performance allows it to attract the best players and
coaches, which improves its sporting performance and in turn makes the club more
appealing to fans and commercially. This leads to greater revenues, continuing the cycle.
• The flow can be strengthened or weakened by external conditions (e.g. broadcast market
conditions, consumer demand, immigration rules) and the degree of professionalisation of
the club and its league (e.g. marketing/commercial capabilities, governance).
• While the success of European football as a whole is perpetuated by this virtuous cycle,
inevitably some clubs and leagues benefit more than others as resources are concentrated
at the most successful clubs.
• The challenge for many clubs and leagues, and therefore the whole of European football, is
to ensure that this ‘virtuous cycle’ does not transform into a ‘vicious cycle’ and that a
sustainable and resilient ecosystem exists.
The Financial Landscape of European Football > Overview of European professional football
Contents
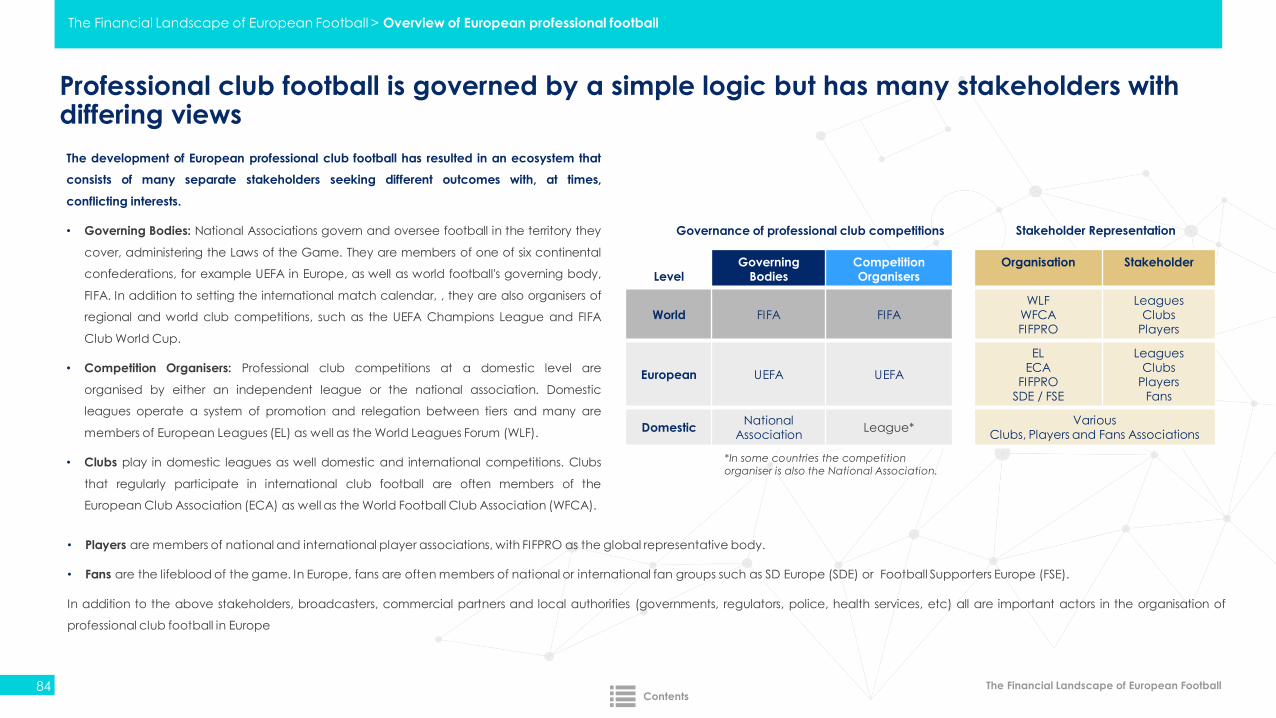
The Financial Landscape of European Football
Professional club football is governed by a simple logic but has many stakeholders with differing views
84
The development of European professional club football has resulted in an ecosystem that
consists of many separate stakeholders seeking different outcomes with, at times,
conflicting interests.
• Governing Bodies: National Associations govern and oversee football in the territory they
cover, administering the Laws of the Game. They are members of one of six continental
confederations, for example UEFA in Europe, as well as world football's governing body,
FIFA. In addition to setting the international match calendar, , they are also organisers of
regional and world club competitions, such as the UEFA Champions League and FIFA
Club World Cup.
• Competition Organisers: Professional club competitions at a domestic level are
organised by either an independent league or the national association. Domestic
leagues operate a system of promotion and relegation between tiers and many are
members of European Leagues (EL) as well as the World Leagues Forum (WLF).
• Clubs play in domestic leagues as well domestic and international competitions. Clubs
that regularly participate in international club football are often members of the
European Club Association (ECA) as well as the World Football Club Association (WFCA).
Governance of professional club competitions
LevelGoverning
BodiesCompetition Organisers
Organisation Stakeholder
World FIFA FIFAWLF
WFCAFIFPRO
LeaguesClubs
Players
European UEFA UEFA
ELECA
FIFPROSDE / FSE
LeaguesClubs
PlayersFans
DomesticNational
AssociationLeague*
Various Clubs, Players and Fans Associations
Stakeholder Representation
*In some countries the competition
organiser is also the National Association.
• Players are members of national and international player associations, with FIFPRO as the global representative body.
• Fans are the lifeblood of the game. In Europe, fans are often members of national or international fan groups such as SD Europe (SDE) or Football Supporters Europe (FSE).
In addition to the above stakeholders, broadcasters, commercial partners and local authorities (governments, regulators, police, health services, etc) all are important actors in the organisation of
professional club football in Europe
The Financial Landscape of European Football > Overview of European professional football
Contents
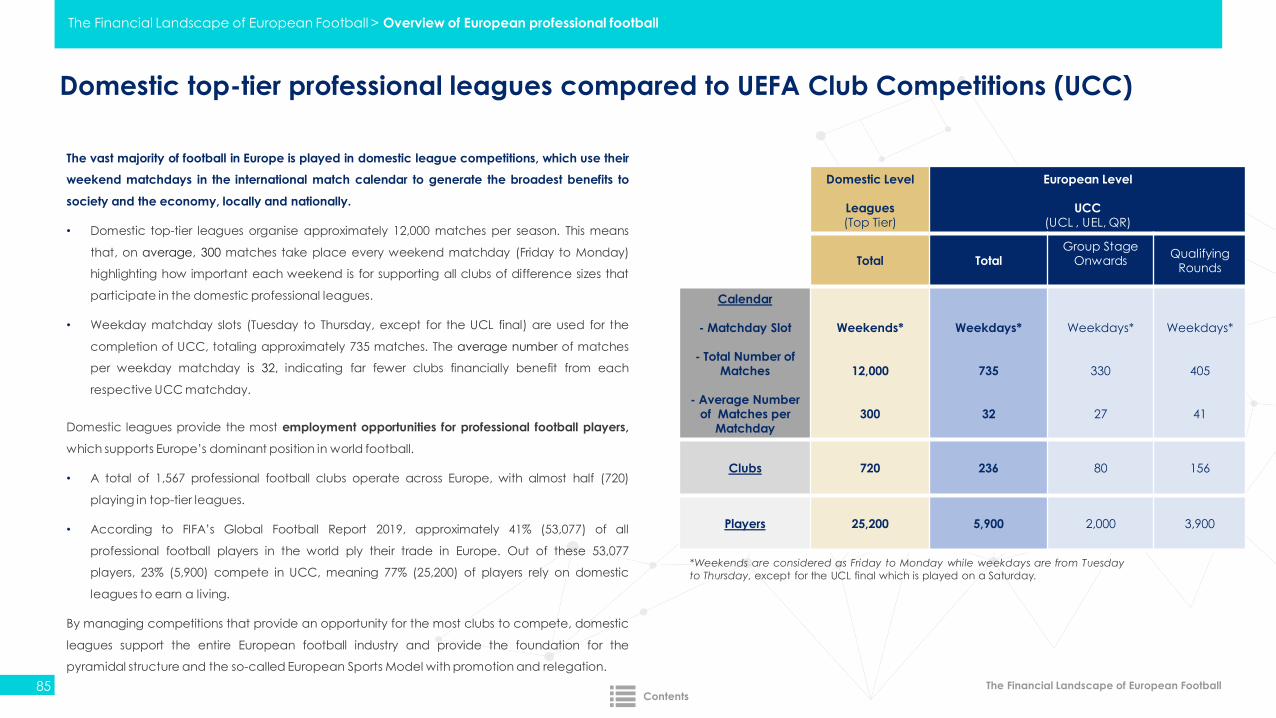
The Financial Landscape of European Football
Domestic top-tier professional leagues compared to UEFA Club Competitions (UCC)
85
The vast majority of football in Europe is played in domestic league competitions, which use their
weekend matchdays in the international match calendar to generate the broadest benefits to
society and the economy, locally and nationally.
• Domestic top-tier leagues organise approximately 12,000 matches per season. This means
that, on average, 300 matches take place every weekend matchday (Friday to Monday)
highlighting how important each weekend is for supporting all clubs of difference sizes that
participate in the domestic professional leagues.
• Weekday matchday slots (Tuesday to Thursday, except for the UCL final) are used for the
completion of UCC, totaling approximately 735 matches. The average number of matches
per weekday matchday is 32, indicating far fewer clubs financially benefit from each
respective UCC matchday.
Domestic leagues provide the most employment opportunities for professional football players,
which supports Europe’s dominant position in world football.
• A total of 1,567 professional football clubs operate across Europe, with almost half (720)
playing in top-tier leagues.
• According to FIFA’s Global Football Report 2019, approximately 41% (53,077) of all
professional football players in the world ply their trade in Europe. Out of these 53,077
players, 23% (5,900) compete in UCC, meaning 77% (25,200) of players rely on domestic
leagues to earn a living.
By managing competitions that provide an opportunity for the most clubs to compete, domestic
leagues support the entire European football industry and provide the foundation for the
pyramidal structure and the so-called European Sports Model with promotion and relegation.
Domestic Level
Leagues(Top Tier)
European Level
UCC(UCL , UEL, QR)
Total TotalGroup Stage
OnwardsQualifying
Rounds
Calendar
- Matchday Slot
- Total Number of Matches
- Average Number of Matches per
Matchday
Weekends*
12,000
300
Weekdays*
735
32
Weekdays*
330
27
Weekdays*
405
41
Clubs 720 236 80 156
Players 25,200 5,900 2,000 3,900
97% Domestic Leagues (22,000 Matches)
*Weekends are considered as Friday to Monday while weekdays are from Tuesday
to Thursday, except for the UCL final which is played on a Saturday.
The Financial Landscape of European Football > Overview of European professional football
Contents
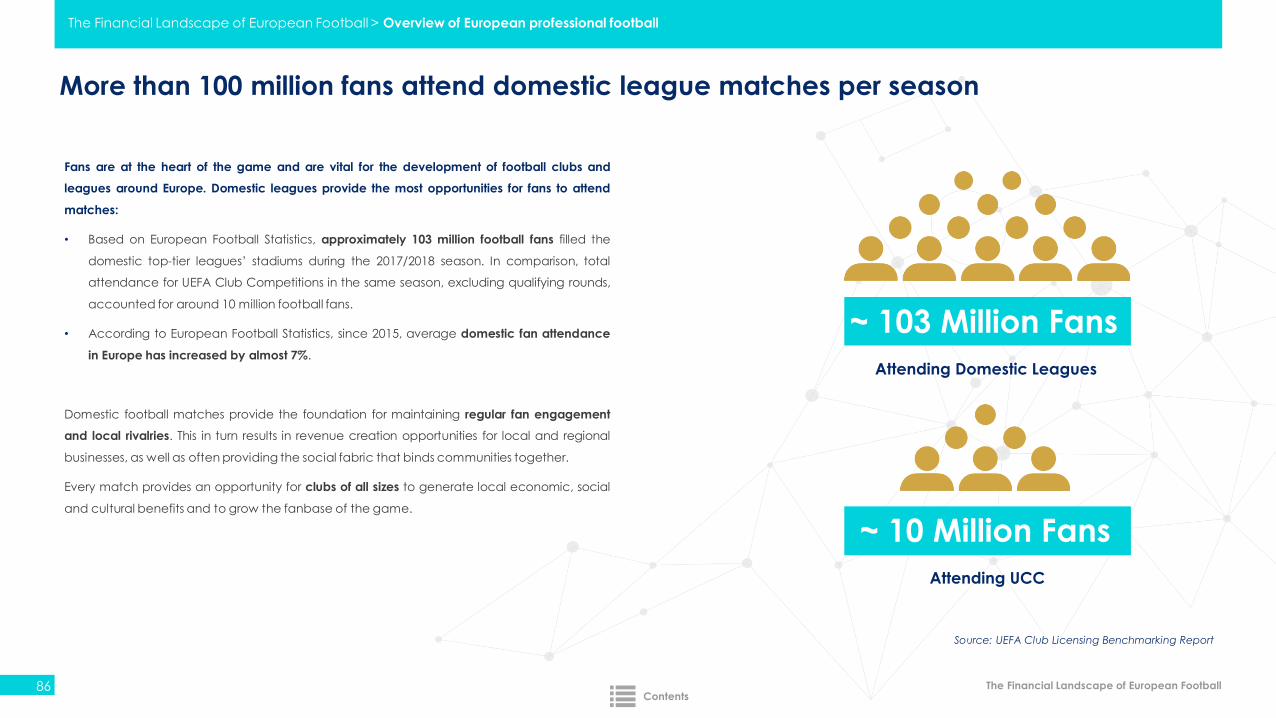
The Financial Landscape of European Football
More than 100 million fans attend domestic league matches per season
86
Fans are at the heart of the game and are vital for the development of football clubs and
leagues around Europe. Domestic leagues provide the most opportunities for fans to attend
matches:
• Based on European Football Statistics, approximately 103 million football fans filled the
domestic top-tier leagues’ stadiums during the 2017/2018 season. In comparison, total
attendance for UEFA Club Competitions in the same season, excluding qualifying rounds,
accounted for around 10 million football fans.
• According to European Football Statistics, since 2015, average domestic fan attendance
in Europe has increased by almost 7%.
Domestic football matches provide the foundation for maintaining regular fan engagement
and local rivalries. This in turn results in revenue creation opportunities for local and regional
businesses, as well as often providing the social fabric that binds communities together.
Every match provides an opportunity for clubs of all sizes to generate local economic, social
and cultural benefits and to grow the fanbase of the game.
~ 103 Million Fans
Attending Domestic Leagues
~ 10 Million Fans
Attending UCC
The Financial Landscape of European Football > Overview of European professional football
Source: UEFA Club Licensing Benchmarking Report
Contents
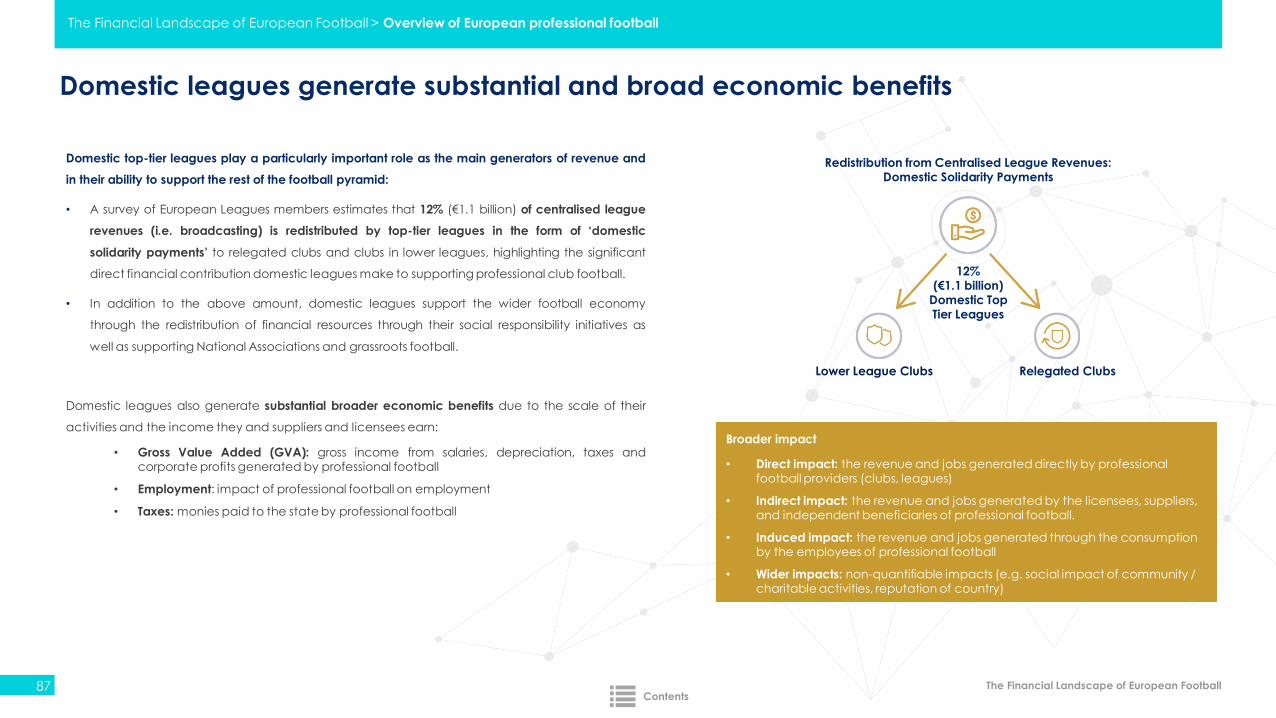
The Financial Landscape of European Football
Domestic leagues generate substantial and broad economic benefits
87
Domestic top-tier leagues play a particularly important role as the main generators of revenue and
in their ability to support the rest of the football pyramid:
• A survey of European Leagues members estimates that 12% (€1.1 billion) of centralised league
revenues (i.e. broadcasting) is redistributed by top-tier leagues in the form of ‘domestic
solidarity payments’ to relegated clubs and clubs in lower leagues, highlighting the significant
direct financial contribution domestic leagues make to supporting professional club football.
• In addition to the above amount, domestic leagues support the wider football economy
through the redistribution of financial resources through their social responsibility initiatives as
well as supporting National Associations and grassroots football.
Domestic leagues also generate substantial broader economic benefits due to the scale of their
activities and the income they and suppliers and licensees earn:
• Gross Value Added (GVA): gross income from salaries, depreciation, taxes andcorporate profits generated by professional football
• Employment: impact of professional football on employment
• Taxes: monies paid to the state by professional football
Broader impact
• Direct impact: the revenue and jobs generated directly by professional football providers (clubs, leagues)
• Indirect impact: the revenue and jobs generated by the licensees, suppliers, and independent beneficiaries of professional football.
• Induced impact: the revenue and jobs generated through the consumption by the employees of professional football
• Wider impacts: non-quantifiable impacts (e.g. social impact of community / charitable activities, reputation of country)
Redistribution from Centralised League Revenues: Domestic Solidarity Payments
12%(€1.1 billion)
Domestic TopTier Leagues
Lower League Clubs Relegated Clubs
The Financial Landscape of European Football > Overview of European professional football
Contents
Conclusions
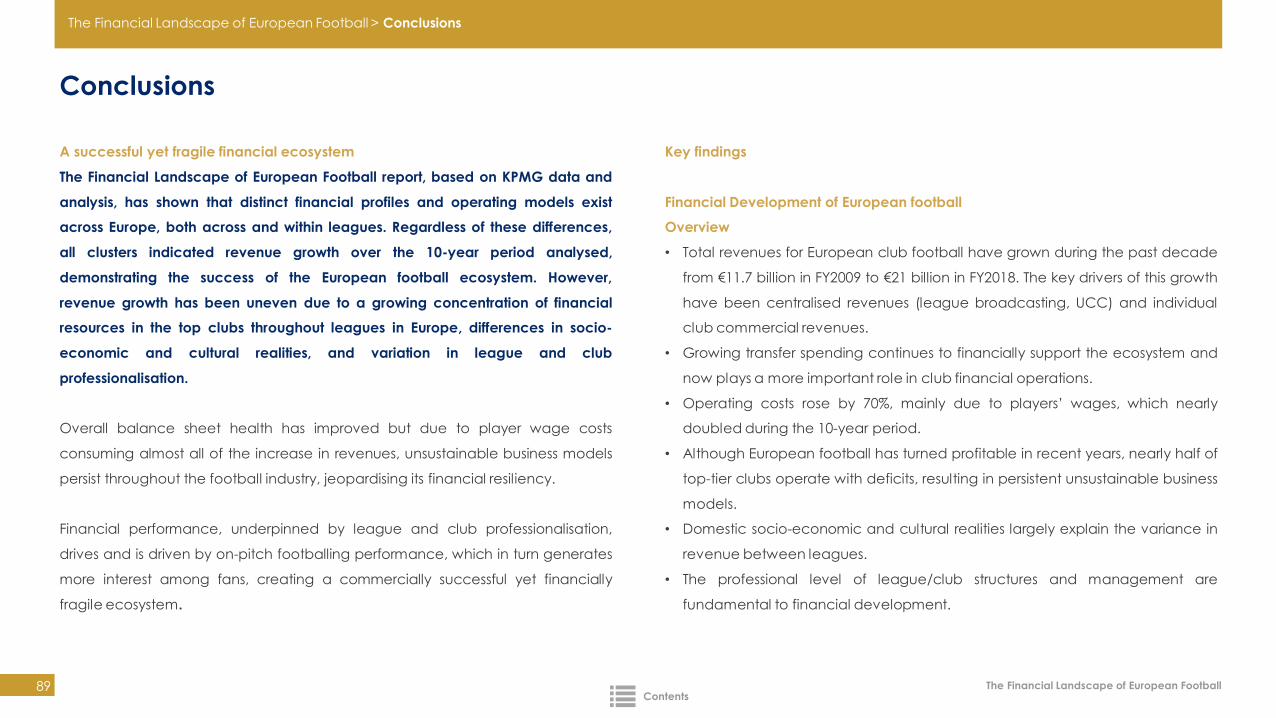
The Financial Landscape of European Football
Conclusions
89
A successful yet fragile financial ecosystem
The Financial Landscape of European Football report, based on KPMG data and
analysis, has shown that distinct financial profiles and operating models exist
across Europe, both across and within leagues. Regardless of these differences,
all clusters indicated revenue growth over the 10-year period analysed,
demonstrating the success of the European football ecosystem. However,
revenue growth has been uneven due to a growing concentration of financial
resources in the top clubs throughout leagues in Europe, differences in socio-
economic and cultural realities, and variation in league and club
professionalisation.
Overall balance sheet health has improved but due to player wage costs
consuming almost all of the increase in revenues, unsustainable business models
persist throughout the football industry, jeopardising its financial resiliency.
Financial performance, underpinned by league and club professionalisation,
drives and is driven by on-pitch footballing performance, which in turn generates
more interest among fans, creating a commercially successful yet financially
fragile ecosystem.
Key findings
Financial Development of European football
Overview
• Total revenues for European club football have grown during the past decade
from €11.7 billion in FY2009 to €21 billion in FY2018. The key drivers of this growth
have been centralised revenues (league broadcasting, UCC) and individual
club commercial revenues.
• Growing transfer spending continues to financially support the ecosystem and
now plays a more important role in club financial operations.
• Operating costs rose by 70%, mainly due to players’ wages, which nearly
doubled during the 10-year period.
• Although European football has turned profitable in recent years, nearly half of
top-tier clubs operate with deficits, resulting in persistent unsustainable business
models.
• Domestic socio-economic and cultural realities largely explain the variance in
revenue between leagues.
• The professional level of league/club structures and management are
fundamental to financial development.
The Financial Landscape of European Football > Conclusions
Contents
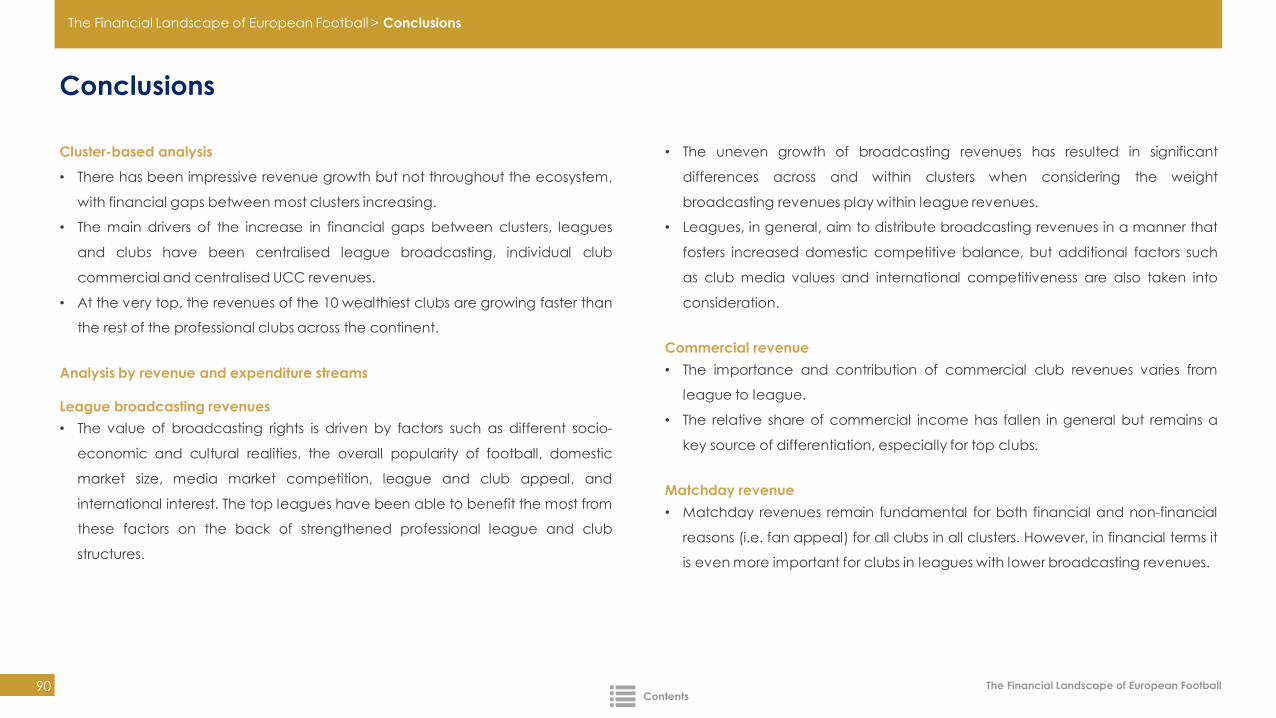
The Financial Landscape of European Football
Conclusions
90
Cluster-based analysis
• There has been impressive revenue growth but not throughout the ecosystem,
with financial gaps between most clusters increasing.
• The main drivers of the increase in financial gaps between clusters, leagues
and clubs have been centralised league broadcasting, individual club
commercial and centralised UCC revenues.
• At the very top, the revenues of the 10 wealthiest clubs are growing faster than
the rest of the professional clubs across the continent.
Analysis by revenue and expenditure streams
League broadcasting revenues
• The value of broadcasting rights is driven by factors such as different socio-
economic and cultural realities, the overall popularity of football, domestic
market size, media market competition, league and club appeal, and
international interest. The top leagues have been able to benefit the most from
these factors on the back of strengthened professional league and club
structures.
• The uneven growth of broadcasting revenues has resulted in significant
differences across and within clusters when considering the weight
broadcasting revenues play within league revenues.
• Leagues, in general, aim to distribute broadcasting revenues in a manner that
fosters increased domestic competitive balance, but additional factors such
as club media values and international competitiveness are also taken into
consideration.
Commercial revenue
• The importance and contribution of commercial club revenues varies from
league to league.
• The relative share of commercial income has fallen in general but remains a
key source of differentiation, especially for top clubs.
Matchday revenue
• Matchday revenues remain fundamental for both financial and non-financial
reasons (i.e. fan appeal) for all clubs in all clusters. However, in financial terms it
is even more important for clubs in leagues with lower broadcasting revenues.
The Financial Landscape of European Football > Conclusions
Contents
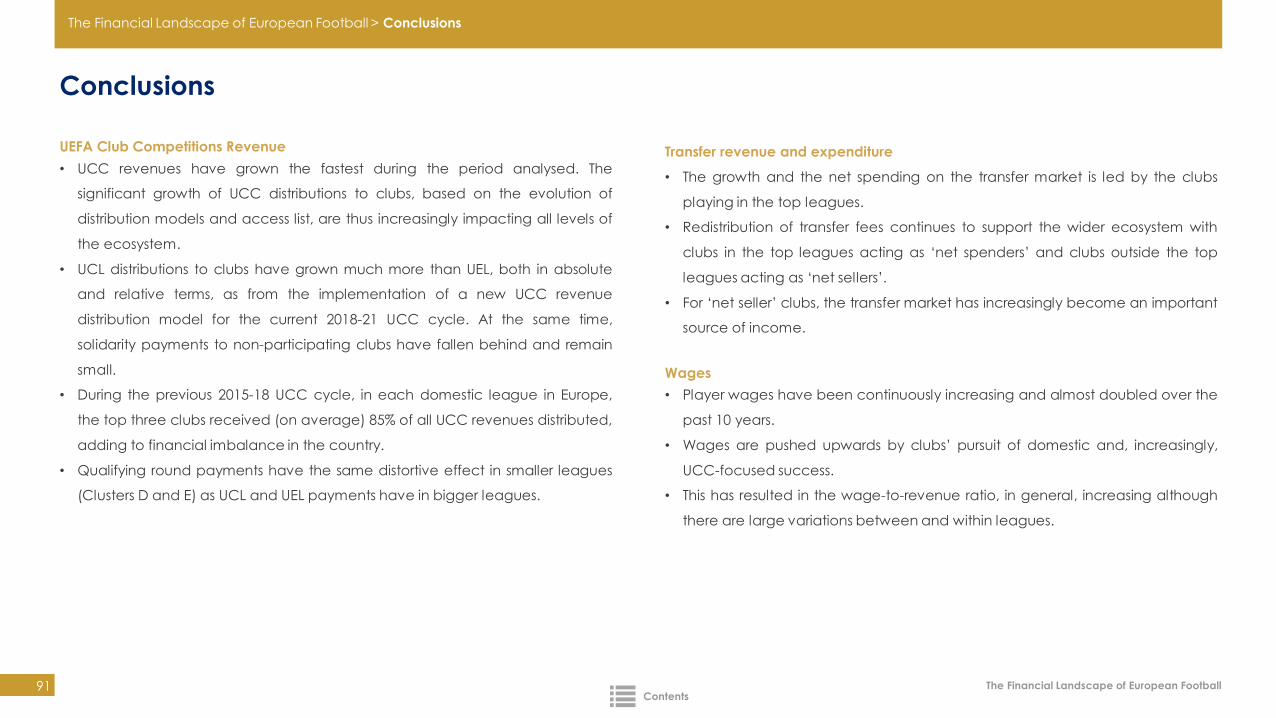
The Financial Landscape of European Football
Conclusions
91
UEFA Club Competitions Revenue
• UCC revenues have grown the fastest during the period analysed. The
significant growth of UCC distributions to clubs, based on the evolution of
distribution models and access list, are thus increasingly impacting all levels of
the ecosystem.
• UCL distributions to clubs have grown much more than UEL, both in absolute
and relative terms, as from the implementation of a new UCC revenue
distribution model for the current 2018-21 UCC cycle. At the same time,
solidarity payments to non-participating clubs have fallen behind and remain
small.
• During the previous 2015-18 UCC cycle, in each domestic league in Europe,
the top three clubs received (on average) 85% of all UCC revenues distributed,
adding to financial imbalance in the country.
• Qualifying round payments have the same distortive effect in smaller leagues
(Clusters D and E) as UCL and UEL payments have in bigger leagues.
Transfer revenue and expenditure
• The growth and the net spending on the transfer market is led by the clubs
playing in the top leagues.
• Redistribution of transfer fees continues to support the wider ecosystem with
clubs in the top leagues acting as ‘net spenders’ and clubs outside the top
leagues acting as ‘net sellers’.
• For ‘net seller’ clubs, the transfer market has increasingly become an important
source of income.
Wages
• Player wages have been continuously increasing and almost doubled over the
past 10 years.
• Wages are pushed upwards by clubs’ pursuit of domestic and, increasingly,
UCC-focused success.
• This has resulted in the wage-to-revenue ratio, in general, increasing although
there are large variations between and within leagues.
The Financial Landscape of European Football > Conclusions
Contents
The Financial Landscape of European Football
Conclusions
92
Profitability
• Financial regulations have guided clubs to more sustainable models than in
the past, but considerable differences exist between and within clusters,
especially in medium and small leagues.
• Out of 54 leagues, only 17 have managed to generate an average positive
net profit margin over the 5-year period FY2014 – FY2018.
• The level of professionalism in league/club structures and management is a
key factor in club profitability.
Finance and Sporting Performance
• The analysis reconfirms that financial performance impacts and is impacted by
sporting performance, with on-pitch success more likely to happen when clubs
have more revenue to invest in their playing squads.
• The key findings indicate a greater dominance by a smaller number of clubs
and the advantage these top clubs have as a result of playing regularly in
UCC, with a sharp decline in the number of different domestic champions.
Overview of European professional football
• European football continues to be the most successful football ecosystem
globally.
• The development of European professional club football has resulted in an
ecosystem that consists of many stakeholders seeking different outcomes with,
at times, conflicting interests.
• Domestic professional leagues deliver broad benefits to the football industry by
using their matchdays in the international match calendar to organise
competitions that support the most clubs, players, fans and local communities.
• Domestic leagues also generate substantial broader economic impact, both
directly and indirectly, in their own respective countries due to the scale of
their activities.
The Financial Landscape of European Football > Conclusions
Contents
Appendix
The Financial Landscape of European Football
Member Leagues, Associate Members and Development Members of European Leagues
94
Member Leagues
• Österreichische Fußball Bundesliga (Austria)
• Azerbaijan Professional Football League (Azerbaijan)
• Pro League (Belgium)
• Ligová Fotbalová Asociace (Czech Republic)
• Divisionsforeningen (Denmark)
• Premier League (England)
• English Football League (England)
• LaLiga | Liga de Fútbol Profesional (Spain)
• The Finnish Football League Association Veikkausliiga (Finland)
• Ligue de Football Professionnel (France)
• DFL Deutsche Fußball Liga GmbH (Germany)
• Super League Greece (Greece)
• Israeli Professional Football Leagues (Israel)
• Lega Serie A (Italy)
• Lega Serie B (Italy)
• Professional Football League of Kazakhstan
(Kazakhstan)
• Eredivisie CV (Netherlands)
• Norsk Toppfotball (Norway)
• Polish Professional Football League Ekstraklasa (Poland)
• Liga Portugal (Portugal)
• Liga Profesionista de Fotbal (Romania)
• Russian Football Premier League (Russia)
• Scottish Professional Football League (Scotland)
• Serbian Super Liga (Serbia)
• Swiss Football League (Switzerland)
• Föreningen Svensk Elitfotboll (Sweden)
• Ukrainian Premier League (Ukraine)
Associate Members
• Union des Clubs Professionnels de Football (France)
• Lega Pro (Italy)
• Federatie van Betaald Voetbal Organisaties (Netherlands)
• Football National League (Russia)
• Association Professional Football League (Russia)
• Turkish Union of Clubs (Turkey)
Development Members
• Futbola Virslīga (Latvia)
• Lithuanian Football Clubs Association A lyga (Lithuania)
• Northern Ireland Football League (Northern Ireland)
Source: European Leagues
The Financial Landscape of European Football > Appendix
Contents
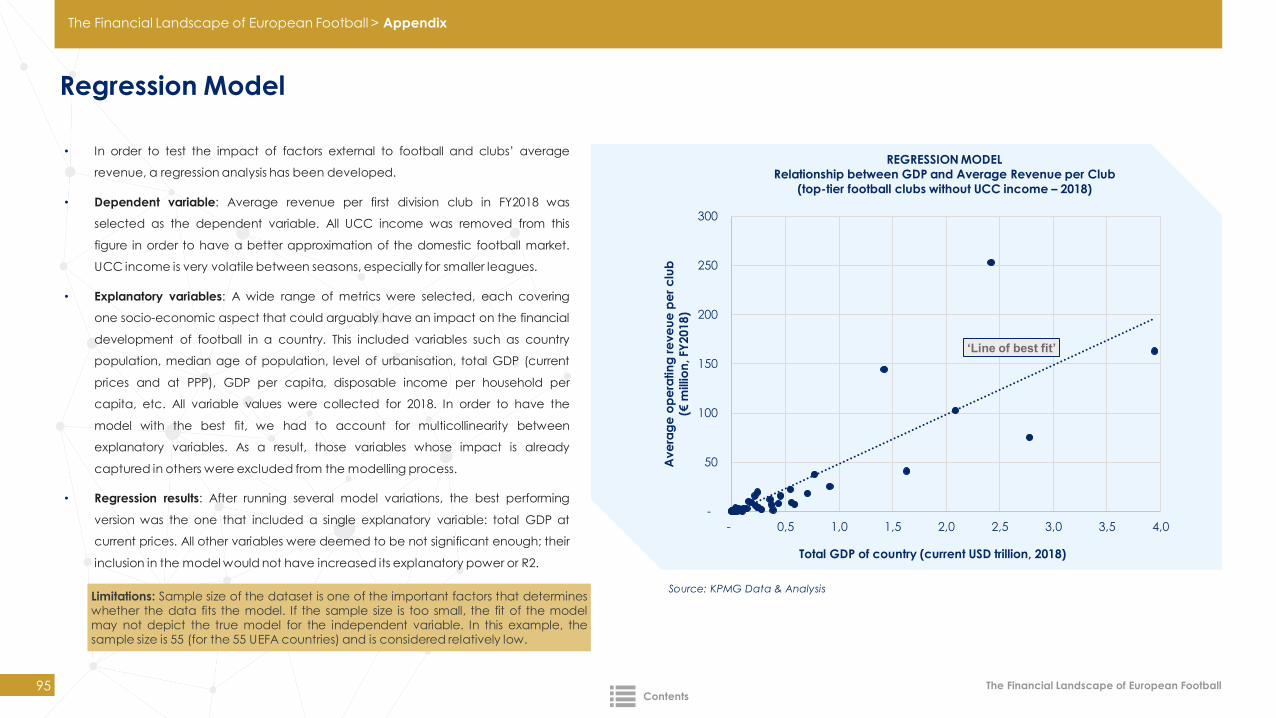
The Financial Landscape of European Football
Regression Model
95
• In order to test the impact of factors external to football and clubs’ average
revenue, a regression analysis has been developed.
• Dependent variable: Average revenue per first division club in FY2018 was
selected as the dependent variable. All UCC income was removed from this
figure in order to have a better approximation of the domestic football market.
UCC income is very volatile between seasons, especially for smaller leagues.
• Explanatory variables: A wide range of metrics were selected, each covering
one socio-economic aspect that could arguably have an impact on the financial
development of football in a country. This included variables such as country
population, median age of population, level of urbanisation, total GDP (current
prices and at PPP), GDP per capita, disposable income per household per
capita, etc. All variable values were collected for 2018. In order to have the
model with the best fit, we had to account for multicollinearity between
explanatory variables. As a result, those variables whose impact is already
captured in others were excluded from the modelling process.
• Regression results: After running several model variations, the best performing
version was the one that included a single explanatory variable: total GDP at
current prices. All other variables were deemed to be not significant enough; their
inclusion in the model would not have increased its explanatory power or R2.
Source: KPMG Data & Analysis
‘Line of best fit’
-
50
100
150
200
250
300
- 0,5 1,0 1,5 2,0 2,5 3,0 3,5 4,0
Ave
rag
eo
pe
ratin
gre
ve
ue
pe
r c
lub
(€ m
illio
n, FY
2018)
Total GDP of country (current USD trillion, 2018)
REGRESSION MODEL
Relationship between GDP and Average Revenue per Club
(top-tier football clubs without UCC income – 2018)
Limitations: Sample size of the dataset is one of the important factors that determineswhether the data fits the model. If the sample size is too small, the fit of the modelmay not depict the true model for the independent variable. In this example, thesample size is 55 (for the 55 UEFA countries) and is considered relatively low.
The Financial Landscape of European Football > Appendix
Contents
The Financial Landscape of European Football
21st club - Glossary
96
League cluster
Leagues have been placed into five groups, A to E, based on their revenue. The analysis compares these clusters, taking an average of the leagues within each cluster
World League (WSL)
21st Club’s team and league rating system (see appendix for more detail)
UCC team
A UCC team is one that has played in qualifying or group stage rounds in at least three of the four seasons analysed, or one that has played in 3+ UCC group stages (defined on
individual slides)
Non-UCC team
A non-UCC team is one that does not meet the criteria above
Top 25%, Middle 50%, and Bottom 25% of teams
Each league is divided into three divisional ‘sub-groups’, taking the top 25%, middle 50%, and bottom 25% of teams. These cut-offs loosely represent teams who are competing for
the title and European qualification, teams in mid-table that are either looking up or down, and teams who are threatened by relegation, and is applied consistently across all
leagues
Expected titles won
Using the World Super League ratings for team strength, each league season is re-simulated to understand the range of possible outcomes that could have occurred based on
underlying team performance. These simulations give us a sense of the number of different possible and realistic title winners that could have happened over the last four seasons
The Financial Landscape of European Football > Appendix
Contents
The Financial Landscape of European Football
21st Club - World League model explanation
97
The 21st Club WSL model ranks over 4,000 teams in one ‘league table’, enabling us to compare teams across countries on a like-for-like basis
The benefits of using this approach over points or goal difference to assess competitive balance are as follows:
• Allows us to assess competitive balance in the context of quality, as the model identifies differences in strengths across leagues
• Allows us to compare leagues and clusters consistently, as every team is rated on the same system
• Allows us to look across a league as a whole on a consistent basis (which may not be possible using points per game when there are split seasons)
• Utilises an understanding of the underlying strength of teams, and therefore the level of uncertainty we feel before matches
The 21st Club WSL model uses a machine-learning algorithm to rank teams based on recent results
The model considers the following factors to rate teams:
• Recent results are weighted much higher than older results. A recent run of poor results would mean that the team’s rating is downgraded
• Scorelines are taken into consideration. A team that has won 4-0 in three consecutive games will be rated higher than a team that has won 1-0 in
three consecutive games, all else being equal, despite both teams having the same number of points
• Home advantage is taken into consideration. A win away from home is worth more than an win with the same scoreline at home
• Strength of opposition is taken into consideration. A team won’t be downgraded due to poor results if those results were expected given the level
of opposition
• The nature of victories is taken into consideration. A team that wins 2-0 having scored twice in the first ten minutes is rated higher than a team that
wins 2-0 with two late goals, as the former tends to reflect a better team. The model also accounts for red cards, as teams with 11 players are more
likely to win when playing against 10 (or fewer) players
After accounting for all these factors, teams are awarded a rating, which updates after any match is played.
The Financial Landscape of European Football > Appendix
Contents
The Financial Landscape of European Football
21st Club - Match unpredictability explanation
98
We use the WSL ratings to provide predictions for individual matches
For any given match, we use the ratings at the time of the two teams to generate three probabilities:
1. Home win probability
2. Draw probability
3. Away win probability
•For example, for Levante vs Granada on 8th March 2020, the WSL model produced the following prediction, based on the strength of the teams at the time:
1. Levante win 46% chance
2. Draw 29% chance
3. Granada win 25% chance
As such, we can say that the favourite had a 46% chance of winning, and the underdog a 25% chance of winning. Matches where the favourite has a lower
chance of winning reflects greater uncertainty, as the two teams are more evenly matched than when there is a heavy favourite.
The Financial Landscape of European Football > Appendix
Contents