THE FATIGUE BEHAVIOR OF SMALL CRACKS IN AIRCRAFT ...
258
THE FATIGUE BEHAVIOR OF SMALL CRACKS IN AIRCRAFT TURBINE DISK ALLOYS by Glenn R. Romanoski, Jr. B.S. University of Cincinnati, 1979 M.S. University of Cincinnati, 1981 SUBMIITED IN PARTIAL FULFILLMENT OF THE REQUIREMENTS FOR THE DEGREE OF DOCTOR OF PHILOSOPHY at the MASSACHUSETTS INSTITUTE OF TECHNOLOGY February 1990 © Massachusetts Institute of Technology 1990 All rights reserved Signature of Author ...-...... .....-. ...... .... Department of Materilgcience and Engineering January 12, 1990 Certified Accepted by ........ ..... .. ...................................................................... Prof. Regis M. Pelloux Thesis Supervisor by ......... .-. . . . . . ...... Prof. Chn W. Hobbs MASSACHUSE TS INSTITUTE Chaian OFTECHNnil OGY Department Graduate Committee AiAR 0 8 1990 UBRARIE6 ARCHIVES
-
Upload
khangminh22 -
Category
Documents
-
view
3 -
download
0
Transcript of THE FATIGUE BEHAVIOR OF SMALL CRACKS IN AIRCRAFT ...
THE FATIGUE BEHAVIOR OF SMALL CRACKSIN
AIRCRAFT TURBINE DISK ALLOYS
byGlenn R. Romanoski, Jr.
B.S. University of Cincinnati, 1979M.S. University of Cincinnati, 1981
SUBMIITED IN PARTIAL FULFILLMENTOF THE REQUIREMENTS FOR THE
DEGREE OF
DOCTOR OF PHILOSOPHY
at the
MASSACHUSETTS INSTITUTE OF TECHNOLOGYFebruary 1990
© Massachusetts Institute of Technology 1990All rights reserved
Signature of Author ...-...... .....-. ...... ....Department of Materilgcienceand EngineeringJanuary 12, 1990
Certified
Accepted
by ........ ..... .. ......................................................................Prof. Regis M. PellouxThesis Supervisor
by ......... .-. . . . . . ......Prof. Chn W. Hobbs
MASSACHUSE TS INSTITUTE ChaianOF TECHNnil OGY Department Graduate Committee
AiAR 0 8 1990
UBRARIE6
ARCHIVES

The Fatigue Behavior of Small Cracks in Aircraft Turbine Disk Alloys
by
Glenn R. Romanoski, Jr.
Submitted to the Department of Materials Science and Engineeringon January 12, 1990 in partial fulfillment of the
requirements for the Degree of Doctor of Philosophy in Metallurgy
ABSTRACT
The fatigue behavior of small cracks was investigated in three aircraft turbine diskalloys at elevated temperatures. The alloys and test temperatures were: Waspaloy (427C),Inconel 718 (427C) and powder metallurgy Gatorized®IN100 (649C). Cracks were initiatedat laser defects or at intrinsic micropores. Fatigue crack growth rates were measured by theplastic replication technique over the crack length regime from 100 mrn to 1 mm. Tests wereperformed in load control for Waspaloy and Inconel 718 under high stress (max < 0 .9ays)elastic fatigue conditions with -1 < Ra < 0.5 and frequency = 20 cpm. Tests were performedfor Gatorized® IN100 in load control under high stress (max < 0.9 ays) elastic fatigueconditions with -1 < Ro < 0.1 and frequency = 10 cpm. Strain control tests were performedunder elastic-plastic fatigue conditions with Act = 0.6% to 1.2%, RE = 0, and frequency = 10cpm.
Under elastic fatigue conditions, the LEFM stress intensity factor range correlatedsmall crack (100 grm < a < 1 mm) with long crack growth rates and consolidated small crackgrowth rates at different stress levels. Small crack growth rates at different Re-ratios wereconsolidated using the Walker-modified stress intensity factor range. The results for theelastic tests are discussed in terms of the validity of employing LEFM at high stress levels andsmall crack sizes.
Small crack growth rates under elastic-plastic fatigue conditions in powder metallurgyGatorized® IN100 were consolidated using EPFM parameters including: the pseudostressintensity factor (PK), the equivalent stress intensity factor (AKq) and the cyclic J-integral(aJ). Consolidation of small crack growth rates was achieved only when the total stressrange or total strain range was used in calculating APK, AKcq and AJ. The relationshipbetween these parameters was established. A linear relationship between At and Aceff wasfound using Newman's crack closure model. The role of the compressive stress-strainexcursion in promoting higher crack growth rates is discussed. Anomalous crack growthbehavior was not observed for small Mode I cracks under the conditions considered here.
Thesis Supervisor: Professor Regis M. PellouxDepartment of Materials Science and Engineering
2

Table of Contents
Page
ABSTRACT .......................................
TABLE OF CONTENTS ................................................. 3
LIST OF FIGURES ....................................................................... 6
LIST OF TABLES .............................................. 14
ACKNOWLEDGEMENTS ............................................................. 15
DEDICATION .......................................................... 16
I. INTRODUCTION ....................................... 17
1.1 The Aircraft Turbine Disk .............................................. 19
1.2 Turbine Disk Operating Conditions ...................................... 19
2. LITERATURE REVIEW ........................................ ................... 25
2.1 Defect Tolerant Design and Life Management ................... ....... 25* Safe-Life Approach* Defect Tolerant Approach
2.2 The Small Crack Problem in Fatigue .................................... 30* Historical Perspective* Threshold Stress and Stress Intensity* Crack Growth Rates* Definition of Short and Small Fatigue Cracks
2.3 Linear Elastic Fracture Mechanics ....................................... 39* Basic Concepts* Crack Closure and AKeff* Applicability of LEFM to Small Cracks* Similitude Requirements
2.4 Elastic-Plastic Fracture Mechanics ............... ........................ 53* Empirical Approach* Strain Intensity and Equivalent Stress Intensity* The J-integral* The Cyclic J-integral Range
2.5 Modeling of Small Crack Behavior ...................................... 67* Intrinsic Crack Length* Constant Plastic Zone Size Criterion* Shear Displacement Criterion* Blocked Slip Band (BSB) Model
3

* Fracture Surface Roughness and Crack Closure Model
2.6 Fatigue Behavior of Small Cracks in Aircraft TurbineDisk Alloys ....................................................... 7...... 79* Turbine Disk Alloys at Room Temperature* Turbine Disk Alloys at Elevated Temperature
3. EXPERIMENTAL PROCEDURES ................................................. 88
3.1 Materials ......................................................... 88* Waspaloy* Inconel 718* Powder Metallurgy Gatorized® IN100
3.2 Test Specimen .............................................................. 98* Specimen Geometry* Specimen Preparation* Initiation of Small Cracks* Precracking
3.3 Crack Length Measurement by Plastic Replication ................... 100(X)
3.4 Crack Length Measurement by A.C. Potential Drop ................. 101
3.5 Small Crack Growth Testing at Elevated Temperature ............... 102· Load Controlled Testing· Strain Controlled Testing
3.6 Data Analysis .............................................................. 108* Computation of Crack Growth Rates* Stress Intensity Factor Calculations
4. RESULTS AND DISCUSSION .................................................. 114
4. 1 The Fatigue Behavior of Small Cracks in Waspaloy at 427C ....... 114* Effect of Maximum Stress* Applicability of LEFM* Similitude Requirements* Crack Growth Rate versus Plastic Zone Size* Effect of R-ratio* Empirical Approaches to Consolidating R-ratio Data· Crack Closure Concepts Applied to Consolidating R-ratio Data
Effect of Temperature
4.2 The Fatigue Behavior of Small Cracks in Inconel 718 at 427C ..... 136· Small versus Long Crack Growth Behavior* Effect of Maximum Stress* Effect of R-ratio* Applicability of LEFM
4.3 The Fatigue Behavior of Small Cracks in Powder MetallurgyGatorized® IN100 at 649C; Elastic Tests .............................. 144* Effect of Maximum Stress
4

* Effect of R-ratio* Empirical Consolidation of R-ratio Data
4.4 Stress-Strain Response of Powder MetallurgyGatorized® IN 100 at 649C .............................................. 155· Monotonic Stress-Strain Response· Cyclic Stress-Strain Response
4.5 The Fatigue Behavior of Small Cracks in Powder MetallurgyGatorized® IN 100 at 649C; Elastic-Plastic Tests ................. 162* Stress Intensity Factor Range* Comparison of Elastic-Plastic Tests in Terms of the Stress
Intensity Factor Range* Pseudostress Intensity Factor Range* Equivalent Stress Intensity Factor Range* The Cyclic J-integral Range
4.6 Appendant Studies for Gatorized® IN 100 at 649C ................ 185* Continuous Cycling* Strain Hold Test* Crack Growth from Intrinsic Microporosity
4.7 Fractography ......................................... .................. 190* Waspaloy, 427C; Elastic Fatigue Conditions* Inconel 718, 427C; Elastic Fatigue Conditions* IN 00 (PM), 649C; Elastic-Fatigue Conditions* IN100 (PM), 649C; Elastic-Plastic Fatigue Conditions
5. GENERAL DISCUSSION ................... ..................... 210
5.1 The Effect of Negative R-ratio on Fatigue Crack Growth Rates .... 213
5.2 Crack Opening and Closure Measurements ............................ 217· Crack Opening-Closure under Elastic Fatigue Conditions· Crack Opening-Closure under Elastic-Plastic Fatigue Conditions
5.3 Models for Predicting Crack Opening and Closure ................... 224
5.4 Newman's Model Applied to Gatorized® IN100 at 649C ........... 228· Elastic Tests· Elastic-Plastic Tests· Reconciliation; At ot with AMeff
5.5 Fatigue Crack Growth and Crack Tip Strain Reversals .............. 237
6. CONCLUSIONS ............................................ 242
7. RECOMMENDATIONS FOR FUTURE RESEARCH ......................... 244
REFERENCES .......................................... 245
5

List of Figures
Figure 1.1 Aircraft turbine disk: (a) overview, (b) cross-section [Ref.1.91.
Figure 1.2 Turbine disk fir-tree attachment with corner crack.
Figure 1.3 Typical transport flight cycle.
Figure 1.4 Hypothetical notch/net section response in a turbine diskfir-tree for a transport flight cycle.
Figure 2.1 Total fatigue life segmented into stages of crack growth.The variation in equivalent initial flaw size (EIFS) andsmall crack behavior dominates total fatigue life.
Figure 2.2 Distribution of fatigue life in a population of turbine disks[Ref. 2.3].
Figure 2.3 Defect tolerant life extension involves inspection andreturn-to-service until a quantifiable defect is found,resulting in disk retirement [Ref. 2.3].
Figure 2.4
Figure 2.5
Figure 2.6
Schematic showing the two stages of subcritical fatiguecrack growth first proposed by Forsyth [Refs. 2.4, 2.5].
Log stress versus log crack length illustrating the thresholdstress between propagating and nonpropagating cracks.
Apparent threshold stress intensity factor range versuscrack length illustrating the two regimes of propagating andnonpropagating cracks.
Figure 2.7 Crack growth rates versus aK or a; comparison of longcrack behavior with anomalous small crack behavior.
Figure 2.8 Crack in an infinite plate subjected to a remotely appliedstress [Ref. 2.12'].
..... 21
..... 22
..... 23
..... 24
..... 28
...... 29
......29
35
..... 36
..... 36
.....37
..... 47
Figure 2.9
Figure 2.10
Figure 2.11
Elastic crack tip stress field [Ref. 2.12'].
Crack tip plastic zones: (a) Assumed elastic stressdistribution, (b) Approximate stress distribution afteryielding is accounted for [Ref. 2.12'].
Fatigue crack growth rate versus stress intensity factorrange for a typical long crack exhibiting three distinctregimes of behavior.
6
.....47
..... 48
.....49

Figure 2.12
Figure 2.13
Figure 2.14
Figure 2.15
Figure 2.16
Figure 2.17
Figure 2.18
Figure 2.19
Figure 2.20
Figure 2.21
Figure 2.22
Figure 2.23
Figure 2.24
Figure 2.25
Figure 2.26
(a) Schematic of crack opening and closure in a singlefatigue cycle. (b) Identification of crack opening andclosure level from the load versus displacement plot.
Schematic comparison of the various crack closuremechanisms [Ref. 2.151.
Schematic of (a) global and (b) local application of fracturemechanics [Ref. 2.25].
Definition of the pseuidostress range according to Solomon[Ref. 2.52].
Definition of the equivalent stress range according toStarkey and Skelton [Ref. 2.54].
The J-integral of Rice [Ref. 2.55].
Stress-strain hysteresis loops plotted on shifted axes [Ref.2.611.
Estimation of small crack aJt from stress-strain hysteresisloops [Ref. 2.61].
Effect of crack length on the threshold stress range forfatigue crack growth in G40. 11 steel [Ref. 2.71].
Effect of R-ratio and environment on the threshold stressamplitude and endurance limit (5 x 10⁷ cycles) for 13 Crcast steel with micro-shrinkage cavities [Ref. 2.74].
Small crack embedded in the elastic-plastic field of a notch[Ref. 2.75].
Schematic illustration of the elastic-plastic and linear elasticcharacterization of crack growth rate for a small crackpropagating from a notch [Ref. 2.75].
Schematic illustration of the BSB model [Ref. 2.78]. (a)Crack-tip slip band blocked by a grain boundary and (b)Coplanar slip band emanating from the tip of an isolatedcrack.
Illustration of roughness induced crack closure at anaverage distance Xo behind the crack tip. [Ref. 2.83]
Crack mouth opening displacement (at zero load) versussurface crack length for a 6Al-2Sn-4Zn-6Mo titanium alloy[Ref. 2.83].
7
..... 50
..... 52
..... 62
....63..... 64
..... 65
..... 66
.....74
..... 74
..... 75
..... 76
..... 77
..... 78
..... 78

Figure 2.27 Crack growth rates versus AK for small cracks in fine-grained (5 m) and coarse-grained (50 m) Astroloy andequivalent single crystal material IRef. 2.96].
Figure 3.1 Typical microstructure ofinvestigation; (a) duplex grainsizes of 7 Am and 200 m,spheroidal morphology.
Figure 3.2
Figure 3.3
Waspaloy used in thisstructure with average grain(b) matrix y' exhibiting a
Typical microstructure of Inconel 718 used in thisinvestigation; average grain size is 32 im.
Typical microstructure of powder metallurgy GatorizedgIN100 with an average grain size of 3-5 im. (a) Opticalmicrograph, (b) SEM micrograph exhibiting a duplex structure.
Figure 3.4 Specimen geometry used in this investigation; cylindricalgage section.
Figure 3.5 Modification to cylindrical gage section of specimen shownin Figure 3.4.
Figure 3.6 Typical laser defects.
Figure 3.7 High temperature testing system.
Figure 3.8 Semi-elliptical surface crack in a finite elastic body.
Figure 4.1 Crack depth versus cycle number for Waspaloy tested at427C under nominally elastic fatigue conditions; stressrange was varied at R=-1, Freq.=20 cpm.
Figure 4.2
Figure 4.3
Figure 4.4
Figure 4.5
Summary of crack growth rates versus stress intensityfactor range for Waspaloy tested at 427C under nominallyelastic fatigue conditions; stress r7nge was varied at R=-1,Freq.=20 cpm.
Crack depth versus cycle number for Waspaloy tested at427C under nominally elastic fatigue conditions; R-ratiowas varied, Freq.=20 cpm.
Summary of crack growth rates versus stress intensityfactor range for Waspaloy tested at 427C under nominallyelastic fatigue conditions; R-ratio was varied, Freq.=20cpm.
Effect of R-ratio on relative crack growth rates forWaspaloy tested at 427C under nominally elastic fatigueconditions. Crack growth rates are compared at aK=20MPa'm and normalized with respect to da/dN(R--).
..... 87
..... 91
.....94
..... 97
....104
.... 105
.... 106
.... 107
....113
.... 128
.... 129
....130
....131
.... 132
8

Figure 4.6 Summary of crack growth rates versus the Walkermodified stress intensity factor range (a=0.5) forWaspaloy tested at 427C under nominally elastic fatigueconditions, R-ratio varied, Freq.=20 cpm.
Figure 4.7 Comparison of crack growth rates versus stress intensityfactor range for Waspaloy tested at 25C and 427C, R=- 1.
Figure 4.8 Comparison of crack growth rates versus stress intensityfactor range for Waspaloy tested at 25C and 427C, R=O.
....133
....134
.... 135
Figure 4.9
Figure 4.10
Figure 4.11
Figure 4.12
Fi.gure 4.13
Figure 4.14
Figure 4.15
Figure 4.16
Crack depth versus cycle number for Inconel 718 tested at427C under nominally elastic fatigue conditions; Freq =20 cpm.
Crack growth rates versus stress intensity factor range forInconel 718 tested at 427C under nominally elastic fatigueconditions; small crack versus long crack, R=0.05 andFreq = 20 cpm.
Summary of crack growth rates versus stress intensityfactor range for Inconel 718 tested at 427C undernominally elastic fatigue conditions. Stress range wasvaried at R=- 1, Freq. = 20 cpm.
Summary of crack growth rates versus stress intensityfactor range for Inconel 718 tested at 427C undernominally elastic fatigue conditions; R-ratio varied at Max.Stress = 758 MPa, Freq. = 20 cpnm.
Crack depth versus cycle number for IN10O(PM) tested at649C under nominally elastic fatigue conditions; stressrange was varied at R=0. 1, Freq. = 10 cpm.
Summary of crack growth rates versus stress intensityfactor range for INlOO(PM) tested at 649C undernominally elastic fatigue conditions; stress range wasvaried at R--=0.1, Freq.=10 cpm. Two cracks are shownarrested at A' and B'.
Crack depth versus cycle number for IN100(PM) tested at649C under nominally elastic fatigue conditions; R-ratiowas varied at a maximum stress of 965 MPa, Freq.=10cpm.
Summary of crack growth rates versus stress intensityfactor range for IN100(PM) tested at 649C undernominally elastic fatigue conditions; R-ratio was varied at amaximum stress of 965 MPa, Freq.=10 cpm.
9
.... 140
.... 141
.... 142
.... 143
.... 150
.... 151
.... 152
.... 153

Figure 4 17
Figure 4. 18
Figure 4.19
Figure 4.20a
Figure 4.20b
Figure 4.21
Figure 4.22
Figure 4.23
Figure 4.24
Figure 4.25
Figure 4.26
Figure 4.27
Summary of crack growth rates versus the Walker-modified stress intensity factor range (c=0.5) forIN100(PM) tested at 649C under nominally elastic fatigueconditions; R-ratio was varied at a maximum stress of 965MPa, Freq.=10 cpm.
Monotonic and cyclic stress-strain response forIN1OO(PM) at 649C. Strain rate was -0.3%/sec in themonotonic test and Freq.=10 cpm in the cyclic tests.
Total stress range versus plastic strain range forIN100(PM) at 649C. Test Freq.=10 cpm.
Monotonic stress versus plastic strain for IN100(PM) at649C. Strain rate was -0.3%/sec.
Cyclic total stress range versus plastic strain range forIN100(PM) at 649C. Freq. = 10 cpm.
Total strain range versus cycles to a 5% stress range dropfor IN1OO(PM) tested at 649C under continuous cyclingand tensile strain dwell conditions, Ref [4.23].
Crack growth rates versus stress intensity factor range forIN1OO(PM) tested at 649C under elastic-plastic fatigueconditions; total strain range was varied, Freq. = 10 cpm.
Crack growth rates versus stress intensity factor range forIN100(PM) tested at 649C under elastic and elastic-plasticfatigue conditions; Ra = -0.5 in both cases, Freq. = 10cpm.
Crack growth rates versus stress intensity factor range forN100O(PM) tested at 649C under elastic and elastic-plastic
fatigue conditions; R- -0.75 in both cases, Freq. = 10cpm.
Crack growth rates versus stress intensity factor range forIN100(PM) tested at 649C under elastic and elastic-plasticfatigue conditions; R = -1.0 in both cases, Freq. = 10cpm.
Crack growth rates versus the pseudostress intensity factorrange for IN100(PM) tested at 649C under elastic-plasticfatigue conditions; total strain range was varied, Freq. = 10cpm.
Crack growth rates versus the pseudostress intensity factorrange for IN 100O(PM) tested at 649C under elastic fatigueconditions; total stress range was varied, Freq. = 10 cpm.
10
....154
.... 159
.... 160
....161
....161
.... 171
....172
....173
....174
.... 175
.... 176
.... 177

Figure 4.28
Figure 4.29
Figure 4.30
Figure 4.31
Figure 4.32
Figure 4.33
Figure 4.34
Figure 4.35
Figure 4.36
Figure 4.37
Figure 4.38
Figure 4.39
Summary of crack growth rates versus the pseudostressintensity factor range for IN100O(PM) tested at 649C underelastic and elastic-plastic fatigue conditions; Freq. = 10cpm.
Crack growth rates versus the equivalent stress intensityfactor range for IN100(PM) tested at 649C under elastic-plastic fatigue conditions; total strain range was varied,Freq. = 10 cpm.
Crack growth rates versus the cyclic J-integral range forIN100(PM) tested at 649C under elastic-plastic fatigueconditions; total strain range was varied, Freq. = 10 cpm.
Crack growth rates versus the cyclic J-integral range forIN 100(PM) tested at 649C under elastic fatigue conditions;total stress range was varied, Freq. = 10 cpm.
Summary of crack growth rates versus the cyclic J-integralrange for IN1OO(PM) tested at 649C under elastic andelastic-plastic fatigue conditions; Freq. = 10 cpm.
Crack growth rates versus the positive J-integral range forIN100(PM) tested at 649C under elastic-plastic fatigueconditions; only aCapOS was used to calculate AJ, Freq. =10 cpm.
Crack growth rates versus aK for two elastic-plastic testsat Aet = 0 to 0.8%. Crack growth rates were determinedby both the secant and 7-point polynomial technique.
Crack growth rates versus AK for elastic-plastic tests at At= 0 to 0.8%. Comparison of continuous cycling data (10cpm) with 60 sec hold at maximum strain data.
Crack growth rates versus AK for elastic-plastic tests at At= 0 to 0.8%. Comparison of crack growth behavior frompores to that from laser defects.
Crack front profiles as evidenced by the presence ofoxidation on the fracture surfaces of Waspaloy specimenstested at 427C under elastic fatigue conditions.
Fractographs of Waspaloy tested at 427C under nominallyelastic fatigue conditions; (a) laser defect surrounded by theprecrack region, (b) typical transgranular fracture surfacefeatures.
Typical crack front profiles as evidenced by the presence ofoxidation on the fracture surfaces of Inconel 718specimens tested at 427C under elastic fatigue conditions.
11
.... 178
....179
....180
....181
....182
....183
.... 187
.... 188
....189
....192
....193
.... 195

Figure 4.40
Figure 4.41
Figure 4.42
Figure 4.43
Figure 4.44
Figure 4.45
Figure 4.46
Figure 4.47
Figure 4.48
Figure 4.49
Optical micrographs of a typical surface crack trace inInconel 718 tested at 427C under elastic fatigue conditions;(a) small crack propagating from laser defect, (b) crack tipextending parallel and perpendicular to persistent slipbands.
Typical transgranular fracture surface features for Inconel718 tested at 427C under elastic fatigue conditions.
Typical crack front profiles as evidenced by the presence ofoxidation on the fracture surfaces of IN 100(PM)specimens tested at 649C under elastic fatigue conditions.
Typical fracture surface features for IN 100(PM) tested at649C under elastic fatigue conditions; (a) room temperatureprecracked region exhibiting a transgranular fracture path,(b) high temperature fatigue crack region exhibiting anintergranular fracture path.
Metallographic section through a fatigue crack inIN 100(PM) tested at 649C under elastic fatigue conditions;Max stress = 965 MPa and R = 0.1. Fracture path ispredominantly intergranular.
Cracktested= 965crack.
initiation at slightly subsurface pores in IN100(PM)at 649C under elastic fatigue conditions; Max. stressMPa and R = 0. 1; (a) dominant crack, (b) noncritical
Typical fracture surface features for IN00(PM) tested at649C under elastic-plastic fatigue conditions, (a)intergranular fracture path for aet= 0 to 0.82% ( =0.015%), (b) intergranular fracture path for AEt = Sto1.23% (Asp = 0. 13%).
Crack initiation at pores in IN100(PM) tested at 649Cunder elastic-plastic fatigue conditions; (a) surfaceintersected pore and (b) slightly subsurface pore.
Transition from transgranular to intergranuiar fracture pathwith increasing crack length for IN100(PM) tested at 649Cunder elastic-plastic fatigue conditions.
Schematic representing crack initiation at surface andsubsurface pores.
Figure 5.1 General variation in crack growth rate versus R-ratio for avariety of engineering alloys.
Figure 5.2 Surface crack trace open at zero load in an IN100(PM)specimen after testing at 649C in strain control (AEt = 0 to0.8%).
....196
.... 197
....200
.... 201
.... 202
... 203
....206
.... 207
... 208
....209
....216
.... 222
12

Figure 5.3 Comparison of experimental results with Newman'sanalysis for normalized crack opening stress versusmaximum stress for a 1026 steel, R = -1. From Ref.[5.22].
Figure 5.4 Crack surface displacement and stress distribution alongthe crack line for Newman's modification to the Dugdalestrip yield model. From Ref. [5.311.
Figure 5.5
Figure 5.6
Normalized crack opening stress level (calculated fromNewman's model) versus R-ratio for IN 10O(PM) tested at649C under elastic fatigue conditions: max. stress = 965MPa.
Crack growth rates versus the effective stress intensityfactor range (calculated using Aaeff from Newman'smodel) for INlOO(PM) tested at 649C under elastic fatigueconditions: R-ratio was varied at max. stress = 965 MPa,Freq. = 10 cpm.
Figure 5.7 Crack growth rates versus the effective J-integral range,(calculated using Aaeff from Newman's model) forIN100(PM) tested at 649C and under elastic-plastic fatigueconditions; total strain range was varied, Freq. = 10 cpm.
....223
.... 227
... 232
.... 233
.... 234
Figure 5.8
Figure 5.9
Figure 5. 10a
Figure 5.10Ob
Figure 5.1 la
Figure 5.11 lb
Summary of crack growth rates versus the effective J-integral range, (calculated using Aceff from Newman'smodel) for INlOO(PM) tested under elastic and elastic-plastic fatigue conditions; Freq = 10 cpm.
Effective stress range (calculated from Newman's model)versus total stress range for INOO(PM) tested underelastic and elastic-plastic fatigue conditions, Freq. = 10cpm.
Crack tip stress fields and crack wake residual stresses forR = 0 loading; max. stress = 0.72ys, crack length =0.6.(notch radius). From Ref. [5.36].
Crack tip stress fields and crack wake residual stresses forR = -1 loading; max. stress = 0.72 ays, crack length =0.6.(notch radius). From Ref. [5.36].
Crack tip monotonic and reversed plastic zones for R = 0loading; max. stress = 0.72ays, crack length = 0.6(notchradius). From Ref. [5.36].
Crack tip monotonic and reversed plastic zones for R = -1:oading; max. stress = 0.72ays, crack length = 0.6-(notchradius). From Ref. [5.36].
13
.... 235
.... 236
....240
.... 240
.... 241
....241

List of TablesPag
Table 2.1 Classes of Small Fatigue Cracks ..... 38
Table 3.1 Alloy and Test Temperature ..... 88
Table 3.2 Waspaloy ..... 90* Chemical Composition* Heat Treatment* Mechanical Properties
Table 3.3 Inconel 718 ..... 93* Chemical Composition* Heat Treatment* Mechanical Properties
Table 3.4 Powder Metallurgy Gatorized® IN100 ..... 96* Chemical Composition* Heat Treatment* Mechanical Properties
Table 4.1 Test Conditions for Waspaloy .... 127
Table 4.2 Test Conditions for Inconel 718 at 427C .... 139
Table 4.3 Tests Conditions for Powder Metallurgy Gatorized®IN100 at 649C .... 149
Table 4.4 Components of Strain Range and J-integral Rangefor IN 100(PM) at 649C .... 184
14

Acknowledgements
This investigation was performed under sponsorship of the Air Force Office of
Scientific Research under Grant # AFOSR-84-0075. Dr. A. Rosenstein was grant monitor.
I would like to thank: M. Blackburn, J. Hill and V. Moreno of Pratt and Whitney
Aircraft; D. Backman, R. H. Van Stone, M. Henry and D. Krueger of General Electric; and
K. Bain of Allison Gas Turbine Division of General Motors for material support and valuable
discussions.
Special thanks go to my thesis advisor, Professor Regis Pelloux, for his patience and
guidance throughout the course of my studies and research at MIT. I also wish to thank my
other thesis committee members: Professor Owen, Professor Ballinger and Professor
Russell.
I would like to express my deep appreciation to a special group of friends: my close
colleagues, the staff of our fatigue and fracture research group, and the staff of the
Department of Material Science and Engineering for their technical assistance and
encouragement.
I would like to thank the members of my family, especially my parents for their
financial and emotional support throughout my lengthy graduate career. And finally, and
most prominently, I would like to thank Libby Reyes for her dedication to my personal well
being, as well as her time and skill in transforming my hieroglyphics into the document you
see before you. Her assistance was invaluable.
15

To my family
16

1. Introduction
Turbine disks are regarded as the most critical flight safety components of high
performance jet engines. Traditionally, turbine disks have been designed on the basis of a
low-cycle-fatigue (LCF) life limitation criterion. This "safe life" design philosophy considers
the useful life to be exhausted after a crack initiation phase results in the development of a
small fatigue crack of 0.79 mm (1/32 in) in length in 0.1% of the disks. Due to the
conservative nature of the "safe life" approach, there is considerable economic incentive to
extend service lives by combining crack initiation and crack propagation criteria in life
prediction.
The United States Air Force (USAF) has developed a Retirement for Cause (RFC)
program [1.1-1.3] in which service lives for components may be extended until crack
initiation is detected during inspection. Implementation of RFC requires a "damage tolerant"
approach which employs fracture mechanics to assure adequate fatigue crack propagation
lives between inspections. The initial crack size is taken to be the maximum size which may
just escape detection.
Some materials are subject to premature fatigue crack initiation due to handling,
machining damage, fretting or intrinsic defects such as porosity and inclusions usually found
in powder metallurgy (PM) alloys. Assuming that premature cracking is present, it is
necessary to employ a "damage tolerant" design approach to assure adequate crack
propagation lives from small initial defects and/or cracks. The USAF has initiated the Engine
Structural Integrity Program (ENSIP) [1.4-1.6] which establishes guidelines for damage
tolerant design of engine components.
To achieve either of the two goals described above, extending lives of LCF damaged
disks (RFC) or assuring safe lives for defect-containing disks (ENSIP), requires the
17

application of linear elastic fracture mechanics (LEFM) to very small cracks ( 1 mm) and
high stress ranges approaching the yield strength of the material. The fracture mechanics
database employed in damage tolerant analysis was generated using conventional LEFM test
specimens with long cracks (> 1 mm). In recent years it has been demonstrated that the
fatigue behavior of small cracks in many alloys exhibit anomalous behavior when compared
to data obtained on long cracks [1.7-1.8]. Small cracks were observed to propagate below
the threshold stress intensity factor range, AKTH, and grow at rates exceeding long crack
growth rates at the same nominal value of AK. This behavior has been termed the "short
crack" effect and it poses a serious concern that damage tolerant analysis using long crack
LEFM could potentially be nonconservative.
The objective of this research is to determine the fatigue crack growth behavior of
small cracks (0tm < a < mm) in aircraft turbine disk alloys at elevated temperature under
conditions of high cyclic stress and to determine the suitability of LEFM for correlating crack
growth rates under these conditions. Since most fatigue crack initiation in turbine disks is
associated with notch configurations, such as bolt holes and blade attachments, the fatigue
behavior of small cracks subjected to elastic-plastic cyclic conditions was also investigated. A
number of elastic-plastic fracture mechanics (EPFM) parameters was considered to
consolidate crack growth rates. The materials and test temperatures were: Waspaloy (427C),
Inconel 718 (427C) and powder metallurgy Gatorized® IN100 (649C). Stress ratios
((Ymin/Comax) ranged from -1 to 0.5 in elastic tests. In elastic-plastic tests, min/rJmax = 0. Test
frequencies were 20 cpm for Waspaloy and Inconel 718, and 10 cpm for powder metallurgy
Gatorized® IN100.
18

1.1 The Aircraft Turbine Disk
A modern aircraft turbine disk is shown in Figure 1.1. The alloy property
requirements vary with location and specific structural detail and reflect the temperature and
stress levels present under service conditions [1.9]. The bore of the disk experiences the
highest net section stresses and requires high yield and ultimate tensile strengths. The bore
may be life limited by the growth of fatigue cracks from small intrinsic or processing defects.
The rim operates under lower stresses but at higher temperatures and requires
adequate creep resistance. The rim is slotted to hold turbine blades in a unique serrated
geometry often called a "fir-tree" attachment. A typical blade attachment geometry is shown
in Figure 1.2. Here, the disk material requires adequate notch stress rupture and creep-
fatigue resistance. A variety of geometrical discontinuities such as rim-slot cooling holes and
bolt holes are susceptible to low-cycle fatigue failure.
1.2 Turbine Disk Operating Conditions
Under normal operation, aircraft turbine disks are nominally elastic bodies with the
exception of notch configurations where the disk material experiences cyclic stresses and
strains greater than the elastic limit. The definition of a single cycle can be put in its simplest
terms for a transport type of application as the stress and temperature history from take-off to
landing as shown in Figure 1.3. Net section stresses may approach a significant fraction of
the materials' yield strength. Temperatures shown are for the rim of the disk. Military flight
cycles include significant subcycles per flight making turbine disk life assessment more
complex.
Consider the turbine blade attachment slot shown in Figure 1.2. At the root of
notches, the local stresses and strains exceed the elastic limit while the net section stress in the
disk fir-tree remains nominally elastic. Figure 1.4 shows the hypothetical notch/net section
19

response for the root of a typical fir tree operating at a maximum temperature around 650C.
Note that R = 0 (where Rc = Emin/Emax) and that stress relaxation occurs after take-off and
throughout cruise. The stress relaxation is a result of creep strain accumulating in the notch
as well as in the net section. The magnitude of the inelastic strain is exaggerated in Figure
1.4. The maximum total strain range experienced at the notch root is estimated to be on the
order of 0.8%.
It is not the objective of this thesis to assess the fatigue endurance of any specific
turbine disk structural feature but to assess the suitability of LEFM and EPFM parameters to
correlate crack growth rates for small cracks under elastic and elastic-plastic fatigue
conditions. Alloys, test temperatures and stress-strain ranges were chosen to approach
relevant turbine disk conditions. Stress-strain-time cycles were simplified with respect to
actual turbine disk operation (Figure 1.4) to facilitate testing. A detailed discussion of turbine
disk cyclic life prediction may be found in the literature [1.10-1.14].
20

(b)*.v***.*.'~::::';i'.'''~'. :'~ .:.!.... ....z~~~nt ~ ~ ~ ~ ;·;·~~~..f... ............ a:: .
A~ ·······''·,.· rim
bore
Figure 1.1 Aircraft turbine disk: (a) overview, (b) cross-section [Ref. 1.9].
21
(a)
.�� �-�-E��ri�ir�.:�'''Z"·
�������4�fI�5
��·�sss�s
�i�
·�·· i'·�·Z;'·'c�r·�·�··;t'·�'�'�':;�'·'·';:;�;:·�:.r. :·�;:·:·:�:·:�:·�;:·:·:5
�s�zz. ��.�;ft·I·�rT�I�·I·�·�.r·r�·.·; -.r;;;·- · ···;·;
·.. I ·- ._ .; ""A "

Turbine disk fir-tree attachment with corner crack.
22
Figure 1.2

Begin T.O.
Idle
6C
-1 min End704C
14 min
End Climb
ruise
I elluler4ltuiIe
Typical transport flight cycle.
23
Onet
Figure 1.3

T.O.
T.O.; Cruise
End Cruise
Notch
Net Section
Descent
Hypothetical notch/net section response inflight cycle.
a turbine disk fir-tree for a transport
24
Recoveryat Off
Figure 1.4

2. Literature Review
The subject of the fatigue behavior of small cracks in commercial alloys has recently
been reviewed by a number of authors [ 1.7-1.8]. The objectives of this literature review are
threefold:
1) To establish the engineering relevance of this investigation to the design and life
management of aircraft turbine disks.
2) To give a general overview of fracture mechanics theory and fatigue
methodologies which have been applied to the fatigue crack growth of small
cracks. Here the depth of treatment often yields to a desire to discuss the many
factors which have been shown to influence this problem. A more detailed review
will be made of approaches later used to evaluate the results of this investigation.
3) To make a comprehensive review of published results on small crack behavior in
turbine disk alloys. Specific references to other commercial alloy systems will be
made only when it illustrates some relevant behavior. Some pertinent references
may have been regretfully overlooked due to time constraints.
2.1 Defect Tolerant Design and Life Management
The development of fatigue cracks in gas turbine disk alloys can be viewed as
progressing in four stages:
Crack initiation may occur at physical discontinuities or at susceptible microstructural
features. The duration of the crack initiation period exhibits considerable scatter and is the
principal source of variability in total fatigue life. The number of cycles or time required for
crack initiation varies with the nature, size, shape orientation and location of defects. The
effect of defect size distribution on crack initiation and total fatigue life is illustrated in Figure
25

2.1. The values and distribution of equivalent initial flaw sizes (EIFS) are shown [2. 1]. The
EIFS is a fictitious crack length which can be substituted for intrinsic defects of equivalent
size to integrate total fatigue life. Also depicted is the nondestructive evaluation (NDE) limit
which is the minimum size which can be detected by nondestructive inspection.
The second stage of crack development is microcrack growth. Cracks in this size
regime are termed "short cracks" if crack growth rates exceed the predictions of LEFM. The
third stage is subcritical small crack growth where crack growth rates can be described by
LEFM and correlated with much longer cracks. The final stage is rapid unstable crack
extension as the fracture toughness of the alloy is approached and exceeded.
Safe-Life Approach
Historically turbine disks have been designed and retired on the basis of a safe life
philosophy. A low-cycle fatigue life limitation criterion was employed. The useful life is
considered to be exhausted after a crack initiation phase results in the development of a small
fatigue crack of 0.79 mm (1/32 inch) in length. Due to variability in material quality and
inherent scatter in fatigue properties, the LCF life is taken to be the lower bound performance
where 1 in 1000 disks would be expected to have initiated a small crack. This corresponds to
a -3 sigma lower bound. At the lower bound life, all 1000 disks would be retired from
service. Figure 2.2 illustrates the distribution of available life in a population of disks. As
can be seen, a large fraction of the retired disks have considerable residual life.
Defect Tolerant Approach
The defect tolerant design approach assumes that defects are present at fabrication and
that useful life represents crack propagation from these defects to a subcritical size. This
concept is the basis for the USAF Airframe Structural Integrity Program (ASIP) [2.2] and
Engine Structural Integrity Program (ENSIP) [1.4-1.5].
26
A defect tolerant approach may also be used as a means for extending lives of disks
until a crack of quantifiable size is detected upon inspection and the disk is "retired for cause"
(RFC). The retirement for cause approach to life management may be employed regardless of
the philosophy used in disk design.
Figure 2.3 illustrates the defect tolerant approach. After nondestructive inspection of
the disk, cracks must be assumed to exist at the most failure critical locations and of a size
equivalent to the maximum crack size which will just escape detection. The eddy current
technology presently used for nondestructive inspection of disks has the sensitivity to detect
semicircular surface cracks of 125 jpm depth (250 Atm surface length). In practice, surface
cracks of 250 m depth can be reliably detected. The disk may be returned to service
provided that fracture mechanics analysis guarantees crack growth will not exceed some
subcritical size before the next inspection interval. Figure 2.3 illustrates several inspection
and return to service intervals before the disk is finally retired.
27

aul!&ad z33a au!IJ 3 -S............. . ................ _ 01-
C -:
0
>-o >
-Y Q
OU
2 o'
2:>3.)
o- -
X C)
r, LQ E
o > C
E. o
C 'zV .-
on
,g =
_k _
Q C:
.M s s_O rD
L
28
m

eM._
a06Q
E
z
Fatigue Life (Time or Cycles)
Distribution of fatigue life in a population of turbine disks [Ref. 2.3].
Fracture -
/' / // _/ /
/ / /
I* I* *
/
//
/
P- - .0 _. . Retire Disk
NOE Limit 0
rJ.=.. - Safe Return-to-Service Intervals
.~~~~~~~~~~~~~~~~~~~~~~ --rTime or Cycles
Defect tolerant life extension involves inspection and return-to-service until aquantifiable defect is found, resulting in disk retirement [Ref. 2.3].
29
Figure 2.2
eWMo
.WCejM
t.
C.
Figure 2.3
.,. ._ ..
I
2.2 The Small Crack Problem in Fatigue
Historical Perspective
It would be remiss to suggest that the earliest investigators of the fatigue phenomenon
did not recognize that the initiation and propagation of microscopic cracks dominated the
fatigue life of highly stressed components and laboratory specimens. Hence, the "short
crack" problem is not a new issue in fatigue.
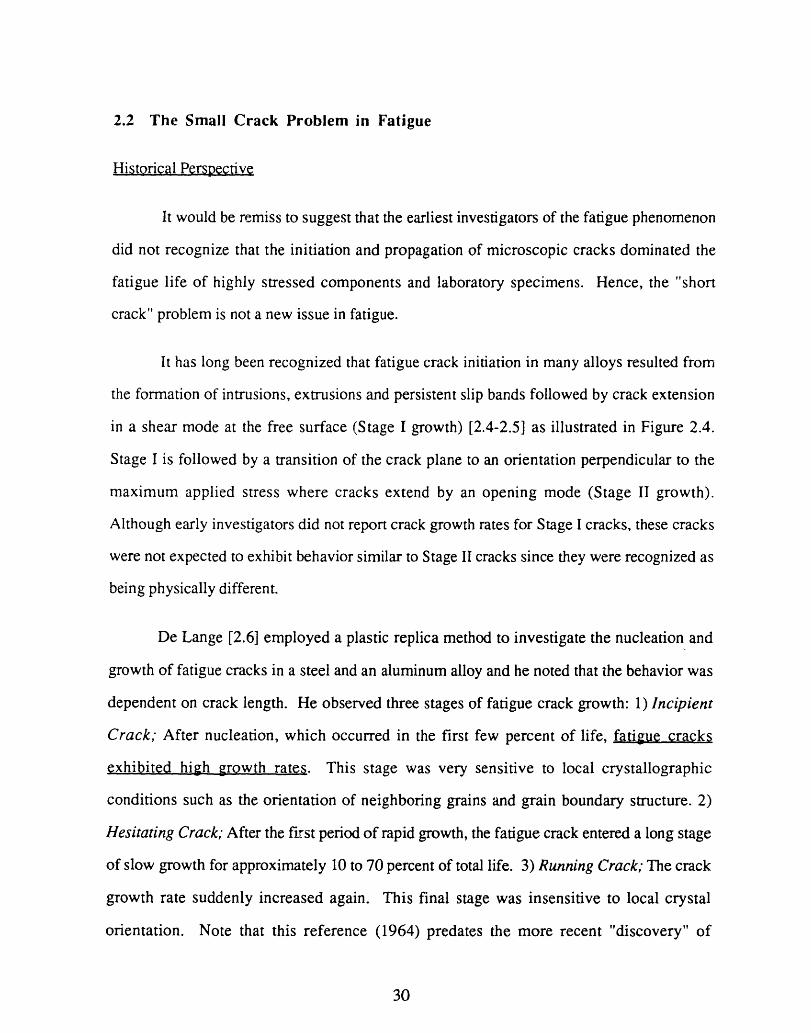
It has long been recognized that fatigue crack initiation in many alloys resulted from
the formation of intrusions, extrusions and persistent slip bands followed by crack extension
in a shear mode at the free surface (Stage I growth) [2.4-2.5] as illustrated in Figure 2.4.
Stage I is followed by a transition of the crack plane to an orientation perpendicular to the
maximum applied stress where cracks extend by an opening mode (Stage II growth).
Although early investigators did not report crack growth rates for Stage I cracks, these cracks
were not expected to exhibit behavior similar to Stage II cracks since they were recognized as
being physically different.
De Lange [2.6] employed a plastic replica method to investigate the nucleation and
growth of fatigue cracks in a steel and an aluminum alloy and he noted that the behavior was
dependent on crack length. He observed three stages of fatigue crack growth: 1) Incipient
Crack; After nucleation, which occurred in the first few percent of life, fatigue cracks
exhibited high growth rates. This stage was very sensitive to local crystallographic
conditions such as the orientation of neighboring grains and grain boundary structure. 2)
Hesitating Crack; After the first period of rapid growth, the fatigue crack entered a long stage
of slow growth for approximately 10 to 70 percent of total life. 3) Running Crack; The crack
growth rate suddenly increased again. This final stage was insensitive to local crystal
orientation. Note that this reference (1964) predates the more recent "discovery" of
30

anomalous "short crack" behavior by more than ten years, yet describes the observation of
high fatigue crack growth rates for small cracks (the Incipient Crack) in a manner quite
familiar in the more recent literature.
Threshold Stress and Stress Intensity
The unique behavior of small cracks with respect to the threshold stress for
nonpropagation was first recognized by Frost [2.7] who reported a minimum crack length, on
the order of the grain size, where the propagation stress no longer varied with crack length
but converged to te fatigue limit.
Kitagawa and Takahashi [2.8] reported similar results for small surface cracks in a
mild steel and presented their results in terms of a log stress versus log initial crack length plot
similar to that shown in Figure 2.5. This presentation establishes quite clearly a deviation
from LEFM behavior at small crack sizes.
The LEFM threshold stress intensity factor range, AKTH, defines a regime of crack
sizes and applied stress ranges for which fatigue crack growth does not occur. For the case
of a semicircular surface crack of depth a, this regime is defined by
YMA posh _< AKTH (2.1)
where ACpos is the remote applied tensile stress range and Y is a geometric correction factor.
For a given mean stress, environment and frequency, AKTH is assumed to be a constant for
long cracks. As the crack size to which Equation 2.1 is applied becomes smaller, a larger
applied stress is required to maintain a constant AKTH. If, however, this stress exceeds the
smooth bar endurance limit, Ace, crack growth may occur. These two limiting conditions are
illustrated in Figure 2.5 by the Kitagawa-Takahashi plot. The fatigue threshold stress for
very small cracks is controlled by the endurance limit causing an apparent decrease in the
31

threshold stress intensity factor (Figure 2.6) if calculated in the usual manner. These trends
have been observed for numerous alloys.
The minimum crack length, ao, for which LEFM applies (upper limit of the short
crack) varies with different materials and specimen geometries. For an edge crack ao =
(1/x)(AKTH/Aye)2, which for a mild steel gives aO - 260 gm, while for a high strength steel
ao = 50 pm. This example demonstrates a basic difference between low strength and higher
strength materials in defining the short crack regime. In general, LEFM is applicable to much
smaller crack sizes in high strength alloys than in low strength alloys due to generally low
values of AKTH and high values of A(ve. This fact will later be explained through
considerations of continuum mechanics restrictions.
Crack Growth Rates
The fatigue crack growth behavior of small cracks has been characterized as
anomalous when compared to longer cracks in the context of LEFM where
AK = Y "pos%/a (2.2)
is taken as the parameter which uniquely defines the mechanical driving force for crack
growth. The anomalous behavior of so called "short cracks" is illustrated in Figure 2.7.
Short cracks have been observed to propagate below the long crack AKTH and grow at rates
exceeding long cracks at the same nominal value of AK. It is characteristic for short cracks
to exhibit a temporary or permanent arrest usually as a result of interactions with grain
boundaries. There are numerous examples in the literature of small fatigue cracks exhibiting
anomalous behavior under nominally elastic cycling for a variety of commercial alloys.
Specific references will be made in subsequent sections to illustrate factors affecting small
crack behavior in turbine disk alloys.
32
Some of the earliest investigations in which small crack growth rates were measured
and reported in terms of LEFM are notable. Pearson [2.91 examined the initiation and
subsequent growth of small cracks (6 Am < a < 250 gm) in two aluminum alloys. He found
microcrack growth rates to exceed rates for long (a > 250 gm) through-section cracks when
compared at nominally similar values of AK.
Similar results were found by El Haddad et al. [2.10j on a CSA G40.1 1 steel at R =
-1 using sheet specimens containing small edge cracks. These results were compared with
long crack data on the same material, and again the data show small crack growth rates to be
faster.
Other investigators have measured crack growth rates for small cracks in specimens
which were plastically strained, and therefore elastic-plastic fracture mechanics analysis was
required to interpret the results. Apart from providing a means of correlating small crack
data, elastic-plastic methods are significant in that they are relevant to the important problem
of the behavior of small cracks in notches. EPFM will be considered in much more detail in a
subsequent section.
Definition of Short and Small Fatigue Cracks
Throughout much of the literature it is obvious that the term "short crack" is
operationally defined. By definition a short crack is a physical discontinuity in a material
which exhibits anomalous crack growth behavior compared to long cracks when both are
analyzed using LEFM. The upper limit of the short crack is naturally that minimum length for
which long crack LEFM parameters adequately describe behavior. The lower limit of the
short crack will be that length for which the initiation event (or process) is considered
complete. The actual range of lengths which characterize the short crack regime will likely be
a function of material (grain size, mechanical properties, precipitate spacing, etc.),
33

temperature, environment and loading conditions. Short crack behavior is typically observed
for crack lengths < 1 mm.
In this investigation, the term "small crack" will be used to describe all cracks which
are small in size, i.e., less than 2 mm. This awkward issue of semantics concerning the use
of the terms "short crack" or "small crack" has been spread throughout the literature and the
possibility of adopting a standard is likely too late. The term "small crack" as defined here is
more general and preferred. "Small cracks" may or may not exhibit anomalous fatigue
behavior. The term "short crack" will be used only when citing the work of others where it is
used to describe anomalous fatigue behavior at small crack sizes.
Ritchie and Lankford [2.1 11 have taken an alternative approach by classifying small
cracks according to the factors responsible for the deviation from long crack behavior as
shown in Table 2.1. They have defined a small crack under the following categories: 1)
Mechanically small cracks have lengths comparable to the scale of local plasticity, e.g., a
small crack embedded in the plastic zone of a notch or a crack with length comparable with its
own crack tip plastic zone. This definition implies an LEFM limitation. 2) Microstructurallv
small cracks have lengths comparable to the scale of the microstructure, i.e., ao < grain size.
This definition implies a continuum mechanics limitation. 3) Physically small cracks are
simply small, ao < 1 mm. This may result in less crack flank closure than occurs for long
cracks. 4) Chemically small cracks are small with respect to the local crack tip environment.
The bulk environment dominates the crack tip environment. In long cracks, the crack tip
environment may differ dramatically from the bulk chemical solution due to restricted fluid
transport to the crack tip between the crack flanks.
34

CoG
A A A AA A A A A A A AA A A A A A A
r
GO
Figure 2.4 Schematic showing the two stages of subcritical fatigue crack growth firstproposed by Forsyth [Refs. 2.4, 2.5].
35

0.1 1.0 10
Crack Length, a (mm)
Figure 2.5 Log stress versus log crack length illustrating the threshold stress betweenpropagating and nonpropagating cracks.
0.1 1.0 10
Crack Length, a (mm)
Apparent threshold stress intensity factor range versus crack length illustratingthe two regimes of propagating and nonpropagating cracks.
36
Ea
4i
u.I=4"
E
OtbCA4
4"CAW,
0.01
-
4_
caL.040.0.
..I
0.01
Figure 2.6

dadN
AK or a
Crack growth rates versus AK or a; comparison of long crack behavior withanomalous small crack behavior.
37
Figure 2.7

Classes ofTable 2.1Small Fatigue
Type of Small Crack Dimension Responsible Potential SolutionMechanism
Mechanically small a < rp excessive (active) use of AJ, AS,plasticity CTOD
Microstructurally a dg crack tip shielding*, probabilisticsmall 2c c 5-10 dg enhanced p, approach
crack shape
Physically small a 1 mm crack tip shielding* use of AKeff(crack closure)
Chemically small * up to 10 mm local crack tip ?environment
rp is the plastic zone size or plastic field of notch
dg is critical microstructural dimension, e.g., grain size, a is the crack depth and 2c thesurface length
tcritical size is a function of frequency and reaction kinetics
*Crack tip shielding refers to the mechanical closure of the crack above zero load whichprevents the crack tip from experiencing the full range of stress and strain as defined byAKapplied ·
38
Cracks

2.3 Linear Elastic Fracture Mechanics
Basic Concepts
Linear Elastic Fracture Mechanics is based on a mathematical description of the near
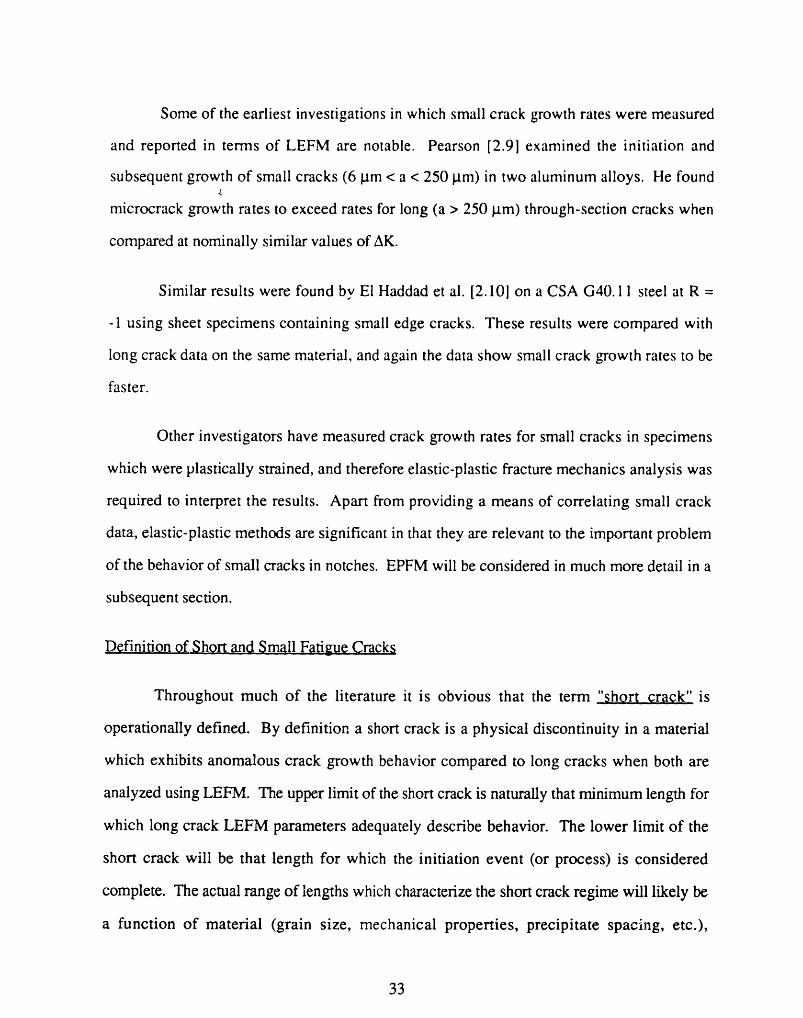
crack tip stress field developed by Irwin [2.121. Consider a crack in an infinite plate shown
in Figure 2.8 with crack length 2a and a remotely applied tensile stress acting perpendicular to
the crack plane (Mode 1). Irwin expressed the near crack tip stress field as a series solution:
K I
a (r,) - KI f (0) + O(r )+ (2.3)
where Ki = o- c -'a and r,0 are the cylindrical polar coordinates of a point with respect to the
crack tip. In the near crack tip region (r -, 0) the first term of the series solution serves as an
adequate approximation to the elastic stress field
a j(r,) -= V fj() j() (2.4)
KI is the Mode I stress intensity factor which serves as a scalar multiplier of the crack tip
stress field.
The variation of the stress y as a function of r at 0 = 0 is illustrated in Figure 2.9.
For large values of r, y approaches zero, while it should go to of. As r approaches zero at
the crack tip, ay approaches infinity, while it should not exceed BUTS. Hence, it is clear that
Eq. 2.4 is valid only for a limited region around the crack tip and is more accurate for low
values of (of.
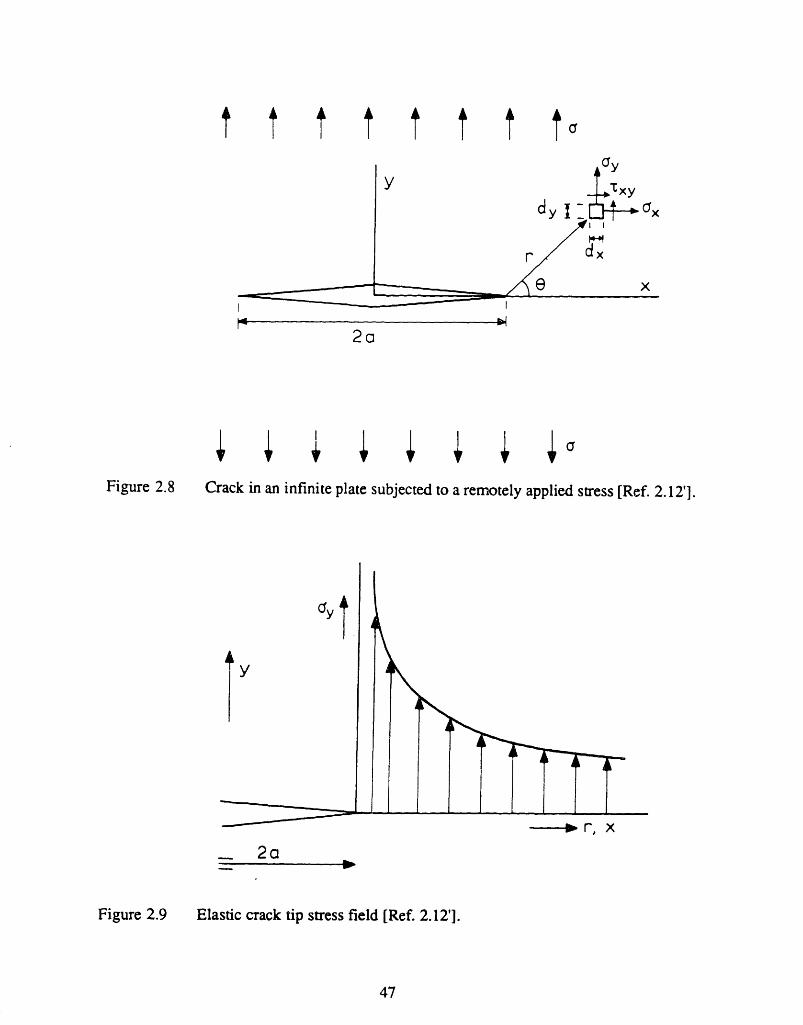
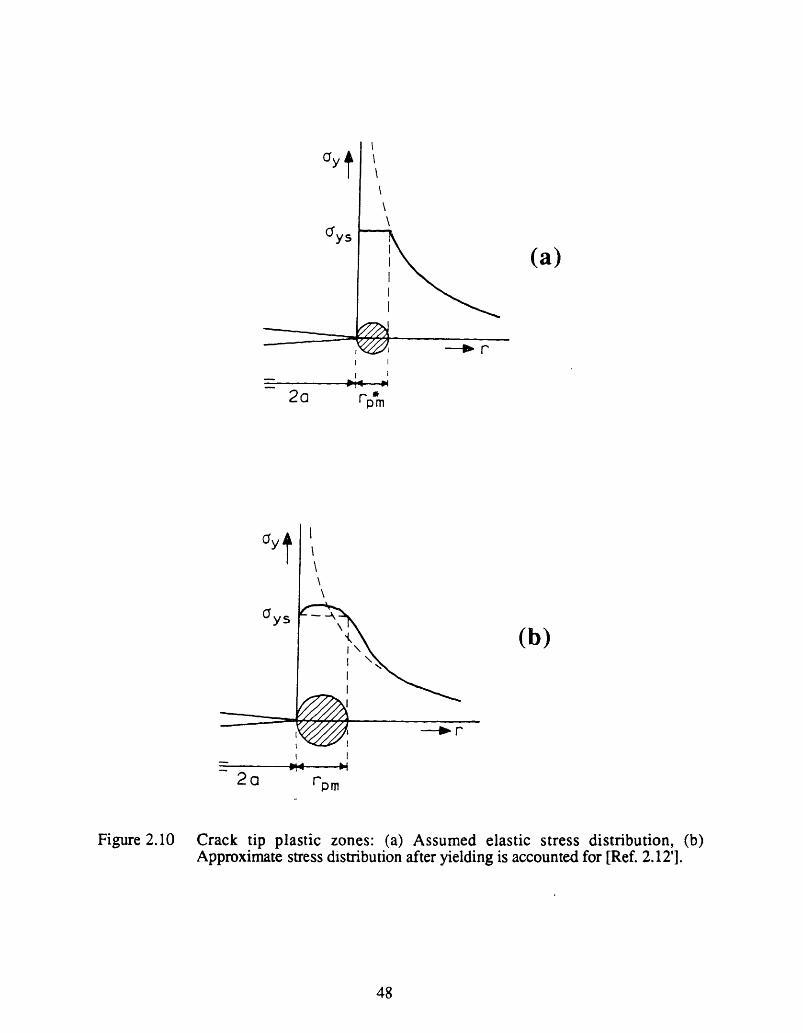
Rather then bearing an infinite stress at the crack tip, yielding occurs resulting in a
volume of plastically deformed material along the crack front called the plastic zone as shown
39

in Figure 2.10a. The size of the plastic zone under a monotonic tensile stress can be
approximated by substituting a = ys into Eq. 2.4 for the horizontal plane, 0 = 0
*,m = 21 I (2.5)rpm 2 Tys
In reality, the stress above the plastic zone exceeding ys is redistributed giving a somewhat
larger monotonic plastic zone as shown in Figure 2.10b. Hence, for monotonic loading,
under conditions of small scale yielding, the crack driving force may be expressed in terms of
Kmax = Yermax 'YJa.
Paris and Erdogan [2.13] extended the use of LEFM and K to correlating fatigue
crack growth rates under conditions of cyclic loading. The tensile range of the stress intensity
factor is used to express the crack driving force according to:
AK K max - K min (2.6)
for all Kmin > 0. The principal variables are Kmax and R-ratio (Kmin/Kmax or omin/(Ymax).
Crack growth rate data for long cracks is usually considered in terms of a plot of log
da/dN versus log AK as shown in Figure 2.11. Three regimes of behavior are generally
observed:
I) a threshold regime in which crack growth rates tend to zero and are asymptotic
to the threshold value, AKTH. This regime is sensitive to microstructure, load
ratio and environment.
II) a linear regime in which subcritical crack growth rates obey the Paris-Erdogan
relation:
da =CAKmdN (2.7)
40

where C and m are constants.
III) a regime of accelerating crack growth rates which becomes asymptotic to the
fracture toughness, KIC.
The extent of the cyclic plastic zone size rpc is approximately a quarter of the size of
the monotonic zone and is given by:
r _ 27t{ 2AK) (2.8)
where cyc is the cyclic yield stress.
Crack Closure and AKff
Crack growth rates are often observed to vary significantly at the same nominal value
of AK ( = Y Aopos a ) for different values of R-ratio. Elber [2.14] was the first to explain
this observation in terms of the crack closure phenomenon. He determined, by measuring
specimen compliance, that fatigue cracks open and close at the crack tip at positive values of
stress due to contact between crack surfaces behind the crack tip. Figure 2.12a illustrates a
typical elastic fatigue cycle for which Ra > 0. The crack opens and closes at positive values
of load, P, and AK on loading and unloading. For elastic fatigue conditions it is generally
found that Pop = Pcl and Kop = KcI.
Experimentally, the closure level is determined by measuring the crack mouth opening
displacement, 5, during a fatigue cycle and plotting P versus 6 as shown in Figure 2.12b. A
distinct deviation from a linear relationship on loading and unloading indicates the point of
crack opening and closure. The linear region at higher loads has a slope C = 6/aP which
defines the compliance of the cracked body.
41

The effective stress range was defined by Elber as:
Aueff max a- op (2.9)
Correspondingly, the effective stress intensity factor range, AKeff, may be expressed as
AK eff = Y(umax - aop) (2.10)
According to Elber, crack closure occurs as a consequence of crack tip plasticity. The
growing fatigue crack generates monotonic plastic zones ahead of the crack tip. As the crack
advances, there is residual plastic deformation consisting of monotonically stretched material
behind the crack tip due to prior plastic zones. This stretched material does not fit in the
surrounding elastic body, therefore, the crack flanks make physical contact at a high positive
value of load on unloading. A high positive load is also required to open the crack. Under
elastic fatigue conditions crack opening and closure occur at approximately the same value of
load. This mechanism of crack closure is generally referred to as plasticity induced closure
and is shown schematically in Figure 2.13. Also illustrated are the physical mechanisms of
roughness induced closure and oxide induced closure.
Roughness (or asperity) induced crack closure [2.15 - 2.19] is caused by fracture
surface asperities making contact at positive loads on unloading. The crack opening load is
also positive. This mechanism of closure depends on fracture surface morphology (therefore
microstructure) and results in fracture surface mismatch.
Oxide induced crack closure [2.20 - 2.21] is a result of oxides or corrosion products
forming behind the crack tip causing mechanical contact at positive values of load. This
closure mechanism is sometimes referred to as "nonclosure" because the fracture surfaces are
prevented from making direct physical contact.
42

In addition to the R-ratio effect, crack closure has been used to explain: anomalous
small crack behavior, load interactions under spectrum loading, and the influence of residual
stresses, microstructure and environment on fatigue crack growth rate. Closure is more
important in plane stress than plane strain regardless of the closure mechanism.
Banerjee[2.22] has recently reviewed the subject of fatigue crack closure.
Applicability of LEFM to Small Cracks
The failure of LEFM to correlate crack growth behavior of small cracks with that of
long cracks under nominally elastic conditions may be attributed to a breakdown of the
underlying continuum mechanics assumptions. The basic assumptions of fracture mechanics
are: 1) that the material behaves as a linear elastic isotropic continuum and 2) the the crack tip
plastic zone size is small with respect to all other dimensions (small scale yielding). Here we
consider the limitations of using the term AK = YAcrpos\-/a to describe the mechanical
driving force for fatigue crack extension of small cracks at high values of cyclic stress.
The stress intensity factor is a first term approximation to a series solution for the near
crack tip elastic stress field. The accuracy of this approximation decreases with distance from
the crack tip. Evans and Luxmoore [2.23] compared the approximation given by K/~2 to
the full equations of the Westergaard stress function for a central crack in an infinite plate and
found errors on the order of 10% in the local stress components when the near crack tip field
was limited to a/10. Wilson [2.24] found errors in local stress components to exceed 10% at
the a/10 boundary when typical fracture mechanics specimens were considered.
Consequently, K serves as a good parameter to estimate the near crack tip elastic field when
its extent is limited to a10.
Smith [2.25] reasoned that for a global application of fracture mechanics (Figure
2.14a) where al represents the stress applied to a structure or laboratory specimen, the near
43

crack tip field (a/10) should be at least the size of the largest structural feature, that is, the
grain size. Therefore, the crack length must be ten times the grain size if KI is to accurately
represent stresses in the crack tip field.
On the other hand, if 02 represents the boundary stress applied to a single grain
(Figure 2.14b), the crack length would be half a grain size and the near crack tip field would
extend over a distance of 0. x(grain size/2), which is many orders of magnitude greater than
the lattice spacing. However, for this localized application of fracture mechanics, the local
material behavior is no longer an isotropic continuum.
In metals, plastic deformation occurs at the crack tip, yielding a plastic zone.
Smith[2.25] has argued that the elastic stress intensity factor is adequate to describe the crack
tip field condition if the plastic zone is limited in size compared with the near crack tip field,
which is then assumed to dominate the crack tip plastic response. He suggested that the
plastic zone be 1/5 of the size of the near crack tip elastic field (a/10). This limitation is in
accordance with the generally accepted limitation on the maximum size of the plastic zone
allowed in a valid fracture toughness test [2.26,2.27]. For the case of fatigue crack
propagation, the minimum crack size for which continuum considerations hold should be at
least 50 x (rpc).
Smith [2.25] and Lankford [2.28] have also suggested that the minimum fatigue crack
size for which continuum considerations hold should be at least 50 times that of the minimum
fatigue microstructural element, i.e. a subgrain slip band. A value of 0.5 gm was suggested
as a representative minimum crack tip subcell size based on TEM measurements [2.29-2.3 1],
resulting in a minimum crack size of 25 gm.
44

Similitude Requirement
The utility of AK or any EPFM parameter to describe the mechanical driving force for
fatigue crack growth is based on the ability of that parameter to characterize the stress-strain
conditions at the crack tip in a manner which accounts for a variety of crack lengths,
component geometries and loading conditions. Equal values of AK should correspond to
equal crack tip stress-strain conditions and, consequently, to identical fatigue crack growth
rates. In such a case we have mechanical similitude. Mechanical similitude implies
equivalent crack tip plastic zones and equivalent elastic stress fields. Fracture mechanics is
based on the formulation of parameters which express crack tip similitude.
Leis et al. [2.32] have recently reviewed similitude requirements for the application of
LEFM to fatigue crack growth. Mechanical similitude as discussed above requires: ) a
small plastic zone size with respect to all length dimensions, including crack front length, 2) a
small plastic zone size with respect to the distance over which the first term of the stress field
solution is dominant, 3) equivalent Kmax and AK, 4) equivalent constraint, i.e., plane stress
or plane strain, and 5) equivalent crack closure fields.
In addition, metallurgical similitude requires that the crack tip be embedded in a
metallurgically similar material. The material should be equivalent in terms of phase, crystal
orientation, precipitate size and distribution, dislocation density, etc. This condition is
satisfied when the crack front is long with respect to metallurgical features, particularly the
grain size, and therefore encounters an average metallurgical condition.
It is obvious that sufficiently small cracks will violate one or more similitude
requirements listed above. Therefore, it is not surprising that LEFM fails to consolidate small
crack data with long crack data in some cases. The various factors which influence small
crack behavior (i.e. which influence similitude) will be discussed further and illustrated with
45

examples from the literature in a later section. In spite of the potential which small cracks
have for violating similitude conditions, the need to describe small crack growth rates in terms
of fracture mechanics remains a requirement of defect tolerant design and life management.
46
ttt 4 4t t 4 tat..
F-2a2a
* * * * * * *C Ca
Crack in an infinite plate subjected to a remotely applied stress [Ref. 2.12'].
Hj
-- Iao* r, x
Elastic crack tip stress field [Ref. 2.12'].
47
Figure 2.8
IL
Y
N
A
2a
Figure 2.9
i . . . .. I_.
JC-
JI
I
I
"tt�
bcys
(a)
--- r
2a rPpm
2a
Figure 2.10
(b)
/////,,/ -- r
mlrppm
Crack tip plastic zones: (a) Assumed elastic stress distribution, (b)Approximate stress distribution after yielding is accounted for [Ref. 2.12'].
48
........
Il
I
I
IIII
(ONII
i

0
.)
e3O
.- C.oD
L iO
*:nXt 4B1)
X de U
r -E
i
X s:
SEX
-C'L
9
I t;
. -
-4
al;p/tUu 'NP/P
49
eq

II
0
)I J.o d
~I ~ ~I ~~
~I :OI
Lu
aa
EUI
-0 z. 0.u >
a) E
4o-U=C. -moQ
cn Mt >
G-
a2 CC:0
C Cd
._
oO
oo00) _0 0
E :, ; YI C 0 0
(N- Q-6 U
cq
Li-O
50
II
LIC.Qs
m,
E
1,,, , ,·
A
iII
II

0
Cu
S
II
r4.-4.
rA
em.= Q 6
c No Cron
cw
Z , 3
Z w Leel ) ::
;n = V)eBOOVoV OEN
-XQ
w
Ad
z
It.)CN(44
I0U
0l6
0
C)
1:4U
S
cnCw
o8
a
4.E
CC
o&o
M
Ea;0u
ACn
C
S
IIxmlE.
51
e
'-
tooLL,

tttt A
a,
Global
K1 = Yi1a ai
Structure
Single Grain
(b)(a)
r
Local
K2 = Y2y 2 Ira2
Figure 2.14 Schematic of (a' global and (b) local2.25].
application of fracture mechanics [Ref.
52
-~~~
-�I--1�1- --
I1~3

2.4 Elastic-Plastic Fracture Mechanics
Elastic-plastic fracture mechanics was developed in response to the small scale
yielding (confined plastic flow) limitations imposed on the validity of LEFM testing and
applications. The standards of the American Society of Testing and Materials (ASTM) for a
valid KIC test [2.27] requires, for a compact tension specimen, that all characteristic
dimensions, i.e., the crack length, the uncracked ligament and the specimen thickness be
greater than 25 rpm. These conditions are easily met for high strength alloys.
The validity of LEFM is questionable for applications and testing involving low and
intermediate strength metals. For an intermediate strength steel used in pressure vessels, rpm
at fracture initiation under monotonic loads can be as large as 1 cm. A valid KIC test would
therefore require a test specimen of considerable size. Fracture toughness testing provided
ample motivation for the development of nonlinear fracture mechanics.
Empirical Approach
Skelton [2.33] has recently reviewed the subject of high strain fatigue crack growth.
Many studies have led to the characterization of fatigue crack growth rates with empirical
relationships [2.34-2.35]. A frequently used form that appears to have broad application is
idN C(AEp) a (2.11)
where a is the crack length, ACp is the bulk plastic strain range and C, a, and Q are constants
that depend on the material and test geometry. The value of Q is >1 and generally thought to
be related to the mechanism of crack extension. Tomkins [2.49] proposed that Q = 1 when
crack advance per cycle occurs by irreversible shear decohesion at the crack tip. This micro-
plasticity mechanism leads to ductile fatigue striation formation [2.34,2.46,2.50]. Most of
the published data which show good correlation using Eq. 2.11 is limited to crack lengths
53
greater than 250 rgm. One conclusion to be drawn from a review of the published work is
that there is not a universally applicable empirical relationship which adequately describes
high strain fatigue crack growth.
Strain Intensity and Equivalent Stress Intensity
Numerous parameters which employ cyclic strain values (Aep, ACe and Act) have been
proposed to correlate crack growth rates under elastic-plastic fatigue conditions. One of these
parameters is identified as the strain intensity factor range, AKE, which combines strain and
crack length in a manner analogous to the more familiar elastic stress intensity factor. The
strain intensity factor can be transformed into an equivalent stress intensity factor range,
AKeq, simply by multiplication by the elastic modulus.
Boettner et al. [2.51] combined the plastic strain range and crack length to correlate
high strain (Ap = 2% to 5%) fatigue crack growth rates for copper at room temperature.
Crack growth rates were described by
da 2 2da °'heApa { {Aaei} (2.12)
where a is the crack length.
This expression can be seen as a particular case of Eq. 2.11 which was considered to
be purely empirical. In either case, the basic implication is that crack tip conditions are
dominated by the bulk plastic strain range. This is likely a good assumption since most of the
conditions considered involve high values of Aep.
The shortcomings of ignoring elastic strains in Equations 2.11 and 2.12 are: (i)
service relevant fatigue conditions (resulting in adequate fatigue lives) are associated with
much lower values of Aep where Aep << Ae, (ii) since small cracks usually propagate out of
high strain elastic-plastic fields into elastic fields, approaches which combine both elastic and
54

plastic parameters are required to correlate relevant data and define crack propagation behavior
through this transition.
Solomon [2.52] employed a pseudostress intensity factor to correlate crack growth
rates in 1018 steel at room temperature under elastic-plastic fatigue conditions (AEp = 0.1% to
5%). He calculated the pseudostress range as E-Act (see Figure 2.15). The pseudostress
intensity factor range was defined as
APK = E A-V tf (2.13)
and the corresponding crack growth rate given as
da (2.14)dN ° [EAEt/a]h oc [E(A£e + A£p)Ta]h
The correlation of da/dN with APK, for all values of AEp, was far superior to that
achieved with AK calculated using the positive elastic stress range. Divergence in the data
was greatest at low values of Aep. It should be noted that APK makes use of the full range of
elastic and plastic strains, i.e., the tensile and compressive parts of hysteresis loops. This
approach ignores the role of crack closure.
Haigh and Skelton [2.53] employed an electrical potential technique to determine the
stress-strain point of opening and closure of a small crack in 316 stainless steel at 625C under
elastic-plastic fatigue conditions (Aep = 0.1%). They observed crack opening and closure to
occur near zero load. In this case, the crack was open for all of the plastic strain range and
half of the elastic strain range, A-p + 0.5Aee, which was denoted the "equivalent elastic strain
range". This was used to express the strain intensity factor range as
AKE (Ap + 0.5Ae) /i (2.15)
The above approach was made more general by Starkey and Skelton [2.54] by
expressing the damaging strain range as AEp + qoAce, where qO is the fraction of the stress
55

range over which the crack was open (usually 0.5 < qo < 1). Multiplying this strain range by
E yields an equivalent stress range, AGeq, as shown in Figure 2.16. The equivalent stress
range can be used to calculate the "equivalent stress intensity factor range" as
AKeq = Y E(AEp + qoAEe)Vt/a (2.16)
where Y is the geometric correction factor.
Under purely elastic fatigue conditions, Ap = 0, Equation 2.16 becomes the more
familiar "effective stress intensity factor range" over which the crack is considered open
Keff = Y qoVA = Y( max - y op) - (2.17)
Hence, AKeq expresses the crack driving force in a manner which is applicable under both
elastic and elastic-plastic fatigue conditions and exhibits a smooth transition between the two
regimes, i.e., at low values of Ap. Soiomon's data on 1018 steel [2.53] at room temperature
was analyzed in terms of AKeq and exhibited less divergence in correlating crack growth
rates, especially at low values of Aep. They further employed AKeq to correlate crack growth
rates in Cr-Mo-V steels under elastic and elastic-plastic (AEp = 0.02% to 0.4%) fatigue
conditions at 550 C. The elastic-plastic (small crack) data fell between the upper bound
LEFM (long crack) data at R = -1 and lower bound LEFM (long crack) data at R > 0.
56
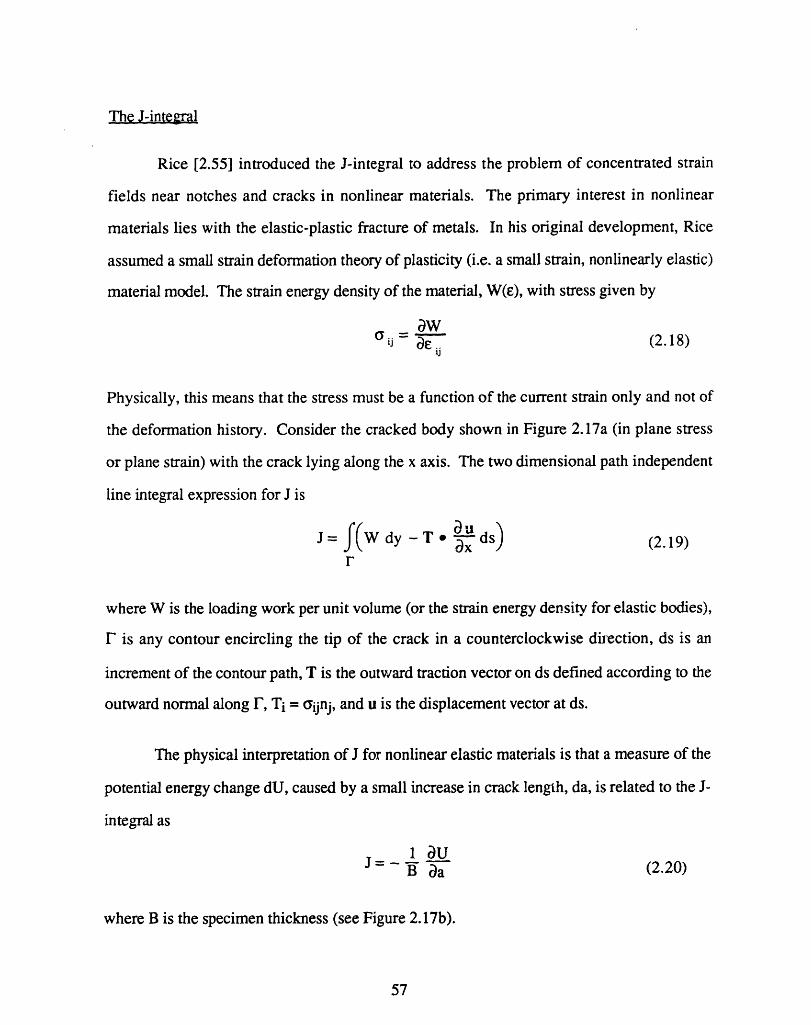
The J-integral
Rice [2.55] introduced the J-integral to address the problem of concentrated strain
fields near notches and cracks in nonlinear materials. The primary interest in nonlinear
materials lies with the elastic-plastic fracture of metals. In his original development, Rice
assumed a small strain deformation theory of plasticity (i.e. a small strain, nonlinearly elastic)
material model. The strain energy density of the material, W(E), with stress given by
'j ae.. (2.18)1$
Physically, this means that the stress must be a function of the current strain only and not of
the deformation history. Consider the cracked body shown in Figure 2.17a (in plane stress
or plane strain) with the crack lying along the x axis. The two dimensional path independent
line integral expression for J is
= JW dy - T x a ds (2.19)f( ax "(2.19)
where W is the loading work per unit volume (or the strain energy density for elastic bodies),
F is any contour encircling the tip of the crack in a counterclockwise direction, ds is an
increment of the contour path, T is the outward traction vector on ds defined according to the
outward normal along F, Ti = oijnj, and u is the displacement vector at ds.
The physical interpretation of J for nonlinear elastic materials is that a measure of the
potential energy change dU, caused by a small increase in crack length, da, is related to the J-
integral as
1 auJ =-B a (2.20)
where B is the specimen thickness (see Figure 2.17b).
57

For linear elastic conditions, J reduces to the strain energy release rate, G. In Mode I
the rate of decrease of the potential energy of the system per unit crack extension per unit
thickness is
2
J = G = (1 - 2)-Ke= G = (1 E (plane strain ) (2.21)
K2Je = G = E (plane stress) (2.22)
where E is Young's modulus and v is Poissons ratio.
For elastic-plastic materials, the quantity U in Eq. 2.20 cannot be interpreted as the
potential energy. More appropriately, it is the elastic-plastic work required to deform the
specimen. J retains its physical significance as a measure of the intensity of crack-tip strain
field [2.56]. This interpretation of J is similar to the stress intensity concept which gives the
intensity of the stress field surrounding the cracks tip. J has been extensively employed as a
criterion for monotonic fracture of ductile metals [2.57 - 2.59].
The Cyclic J-integral Range
Dowling and Begley [2.601 first proposed the use of the cyclic J-integral range as a
parameter to correlate crack growth rates in 25 mm thick compact tension specimens of
A533B steel subjected to bulk cyclic plastic deformations. These tests were conducted under
displacement control. Values of AJ were estimated from areas under load versus deflection
curves during rising load. Since macroscopic crack closure occurred, the point at which the
crack opened was estimated and AJ was calculated from the area above this point. Excellent
correlation was obtained between AJ and fatigue crack growth rates for these tests. The
results were also found to be in agreement with LEFM data on the same material.
58

Dowling [2.61] expanded the use of the cyclic J-integral range as a parameter to
correlate the crack growth rates of small surface cracks in smooth axial specimens subjected
to fully plastic cycling in A533B steel. In making the estimation of AJ for small semi-circular
surface cracks, cycled under elastic-plastic conditions, Dowling developed expressions for
the linear elastic and power law hardening cases separately and then combined the two for the
more generalized elastic-plastic type of stress-strain behavior. The following general
approach was employed with specific reference to Dowling's computations for A533B steel.
For the elastic case, the stress intensity may be expressed as follows:
AK = Y Aa~V c (2.23)
where Y is the combined flaw shape and boundary correction factor. Using Eq. 2.22 for the
elastic component of the J-integral
AJe y 2 a = y22r: AWea (2.24)
For semicircular surface cracks Dowling computed he as
e(2x 1. 12) 2A 2na= ( 1 x 1.12) =a 3 e.2W a (2.25)eX E 3.2AW e
For the plastic case, the material model for the cyclic stress-strain curve may be expressed as:
AOt= k(Ae£) (2.26)
where n is the cyclic strain hardening exponent. Here, the stabilized stress-strain hysteresis
loops were shifted so that the compressive tips coincided at a new origin as shown in Figure
2.18. To a close approximation, the stress range depends only on the strain range and is
nearly independent of the deformation path. Following an estimate made by Shih and
Hutchinson [2.56], the plastic component of the J-integral range is
59
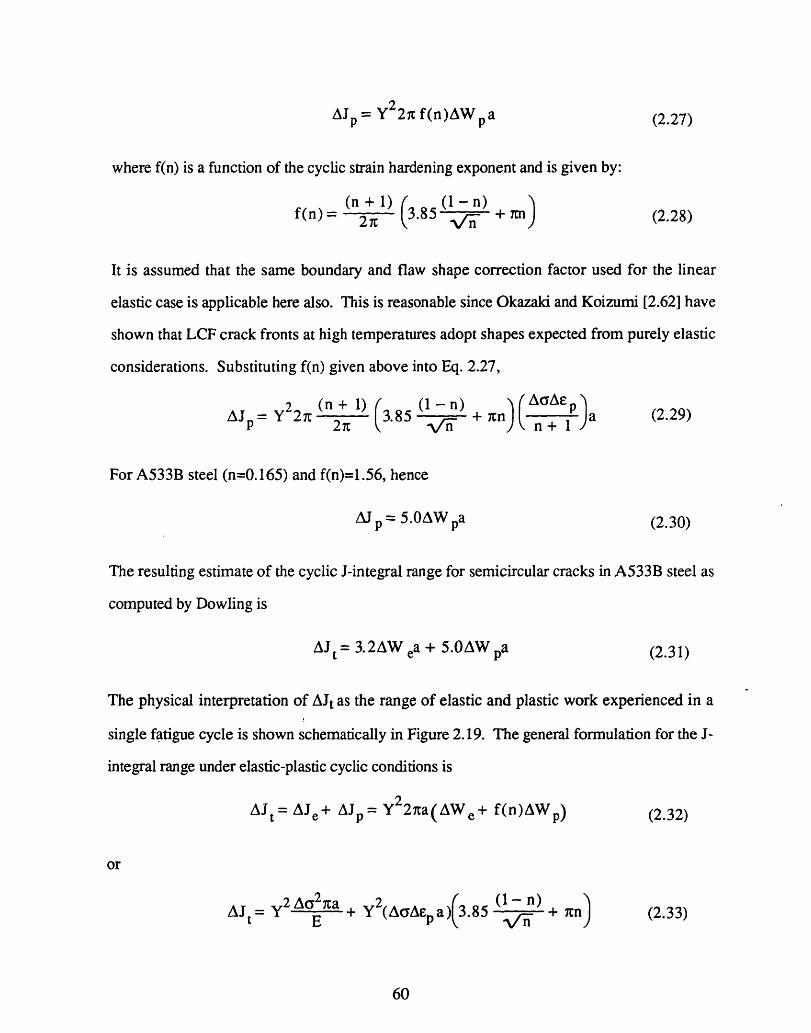
AJ = Y22i f(n)AWpa (2.27)
where f(n) is a function of the cyclic strain hardening exponent and is given by:
f( (n)= ) (3.85( 4) +n) (2.28)
It is assumed that the same boundary and flaw shape correction factor used for the linear
elastic case is applicable here also. This is reasonable since Okazaki and Koizumi [2.62] have
shown that LCF crack fronts at high temperatures adopt shapes expected from purely elastic
considerations. Substituting f(n) given above into Eq. 2.27,
AJp= Y22 (n + 1) (3-8 5 ( +n) a )a (2.29)p,- 3.8 -n )\ n+l For A533B steel (n=0.165) and f(n)=1.56, hence
Ap= 5.0AW a (2.30)
The resulting estimate of the cyclic J-integral range for semicircular cracks in A533B steel as
computed by Dowling is
AJt= 3.2AW ea + 5.0AW pa (2.31)
The physical interpretation of AJt as the range of elastic and plastic work experienced in a
single fatigue cycle is shown schematically in Figure 2.19. The general formulation for the J-
integral range under elastic-plastic cyclic conditions is
AJt= AJe+ AJp= Y2 2a(AWe+ f(n)AWp) (2.32)
or
AJ = ~Y2A2n1a + Y 2(Ac a)(3.85 (1- + n) (2.33)Lt E n
60

The mathematical developments leading to the J-integral concept imply, for elastic-
plastic materials, that the J-integral is valid where the deformation theory of plasticity is valid.
Since the deformation theory of plasticity cannot directly account for plasticity effects
observed on unloading, there is some question concerning the applicabililty of the J-integral
concept to cyclic loading. Starkey and Skelton [2.63] suggest that theoretical objections may
be countered by noting that in high strain fatigue that AJ is always calculated from the same
point (the common origin of Figure 2.18) in the tension-going direction during the steady
cyclic state by ignoring the details of the arrival path.
Dowling [2.61] used the entire stress range in estimating AJt from hysteresis loops.
Using the above procedures, Dowling found excellent correlation between crack growth rates
and AJt for fully plastic cycling at crack depths greater than 180 gm. It was concluded that
the lack of correlation for smaller cracks was due to a physical size effect.
There is general disagreement over using the full stress range or some fraction of the
stress range over which cracks are assumed to be open in calculating AJt. Rger et al. [2.64 -
2.65] assume that the positive stress range is operative. Following Dowling's lead many
investigators have employed the full stress range [2.62,2.66,2.67].
Huang and Pelloux [2.67] investigated the crack propagation behavior of Hastelloy-
X, at 25C and 760C in the fully plastic low cycle fatigue regime, Re = -1. They employed
the entire range of stress and strain to calculate AJt. The crack growth rate data for different
strain levels correlated with A t. There was also general agreement with linear elastic tests.
61

Tension
/ I
E / // I
EAet
C
cuco
r.C
c
11.
IT
o
CL
Compressior
APK = YEA£ t
Figure 2.15 Definition of the pseudostress range according to Solomon [Ref. 2.52].
62
m_ _-
i
- -1

Tension
E /
/I- -a
fII
I
I1
aoP __.. pOop ,l
Compression
qoAe
= YE(Aep + qoAee)vn' '
Figure 2.16 Definition of the equivalent stress range according to Starkey and Skelton[Ref. 2.54].
63
Aa, eq = E(Ap + qoe)
- ,4
CrackX Closure
Region
I
I
l
c

= JW dyr
- T. a- dsax
E
W = fi dei0
a) Energy Line Integral
1 auB aa
B = Thickness+ da
b) Potential Energy Difference
Figure 2.17 The J-integral of Rice [Ref. 2.55].
64
T iT
P-dU
IIIIIIIIIIIIIIII

,_- " Cy* gmy""OOS "M c turve
£co
Figure 2.18 Strss-strain hysteresisloops plotted on Shifted axes [Ref. 2.611.
65
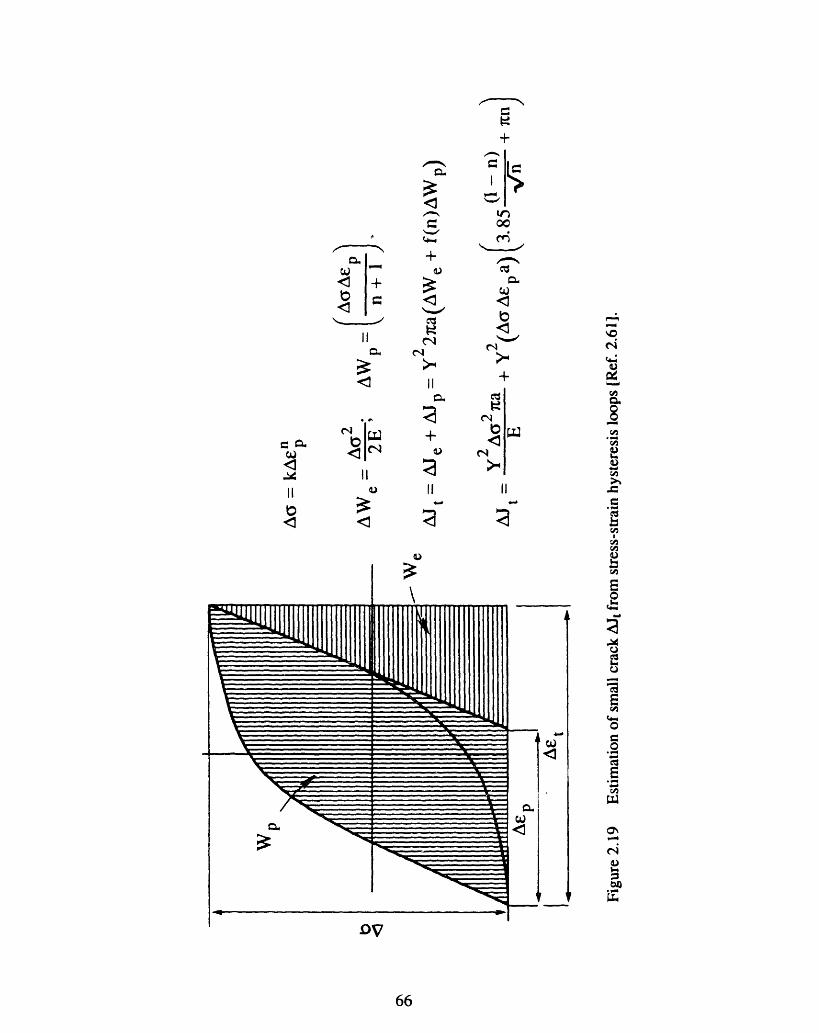
I -Cll 5r)
Clo
t ~ji Cd)a) a)
~~~3c~~~~~~~d ~ cd~~~~~~~~~~~~~~~~~~~~~~~~~~~~~~~~~~~~
<1N a.)c~
3~ mII U) X s E~~~ HI _3 + d d 11 _
II II II ~
t3 3 4- U
a.) a a )I-
1v
aoEU)
a
ErS4mc;0C.)Ce04
l ANa)i
66
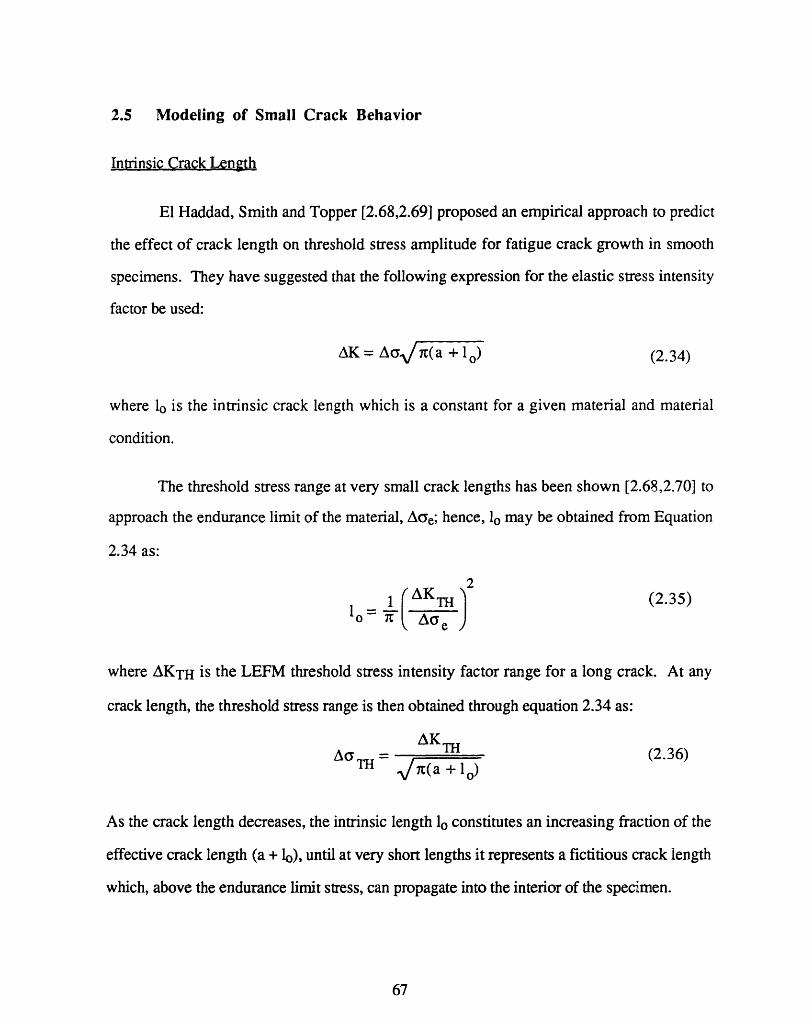
2.5 Modeling of Small Crack Behavior
Intrinsic Crack Length
El Haddad, Smith and Topper [2.68,2.69] proposed an empirical approach to predict
the effect of crack length on threshold stress amplitude for fatigue crack growth in smooth
specimens. They have suggested that the following expression for the elastic stress intensity
factor be used:
AK = A xn(a + 1o) (2.34)
where lo is the intrinsic crack length which is a constant for a given material and material
condition.
The threshold stress range at very small crack lengths has been shown [2.68,2.70] to
approach the endurance limit of the material, AOe; hence, lo may be obtained from Equation
2.34 as:
2
1 1 (TH ) (2.35)0 X Aue
where AKTH is the LEFM threshold stress intensity factor range for a long crack. At any
crack length, the threshold stress range is then obtained through equation 2.34 as:
A KTH (2.36)TH t(a + 1)
As the crack length decreases, the intrinsic length lo constitutes an increasing fraction of the
effective crack length (a + lo), until at very short lengths it represents a fictitious crack length
which, above the endurance limit stress, can propagate into the interior of the specimen.
67

A series of experiments were performed on CSA G40-11 steel to examine the
accuracy of Eq. 2.36 in correlating experimental threshold and small crack results [2.71].
Figure 2.20 presents these experimental results and the prediction of Eq. 2.36. Agreement
between the predictions of Eq. 2.36 and the test data is excellent, indicating that the equation
adequately describes the crack size effect on the threshold stress intensity. Figure 2.20 also
indicates that, for crack lengths less than 1 mm, the term lo constitutes an important fraction
of the effective crack length, resulting in the threshold stress range deviating from the more
usual prediction of Eq. 2.36 with lo = 0.
The principal criticism of this model is that no physical justification has been given for
the term o1 and it appears to act as a mathematical operator forcing the truncation of the
threshold stress at the endurance limit.
Constant Plastic Zone Size Criterion
Ohuchida, Usami and Nishioka [2.72,2.73] introduced a criterion for threshold stress
and stress intensity. They assume that, at the threshold, the cyclic plastic zone size at the
crack tip is a material constant. Using the Dugdale model for cyclic plastic zone size, the
criterion for the endurance limit of a cracked material may be expressed as follows:
rPc(w) = e 4= const .; R O (2.37)
r( ) - ae[c (2(2yc/arnx + R) 1 const ; R (2.38)
where rpc(w) is the cyclic plastic zone size at threshold, Aaw is the stress range at the
endurance limit, ma,w is the maximum stress at the endurance limit, cyc is the cyclic yield
stress, ae is the effective crack length, i.e.,
a (1 AK ) (2.39)e i A.
68

By knowing the cyclic plastic zone size at threshold for long cracks, estimates can be made of
the threshold stress Acw and the corresponding threshold stress intensity for very small crack
lengths in the same material.
This criterion has been shown to predict the effects of crack length and stress ratio
[2.74]. Agreement between calculated and experimental values is reasonably good, as can be
seen in Figure 2.21.
Shear Displacement Criterion
Hammouda and Miller [2.75,2.76], in modeling the behavior of small cracks growing
in the elastic-plastic strain fields of notches, have suggested that the driving force for crack
extension is the total shear displacement at a crack tip.
t=0p+q e (2.40)
where Ot is the total, qp the plastic and e the elastic displacement at the crack tip. Cracks
were considered small relative to the extent of the plastic field of the notch as illustrated in
Figure 2.22. When the crack is very long t - Oe and LEFM controls crack growth. W;,hen
the crack is very small, AK is small, he is negligible, and t = Sp. Calculations of Ot for a
range of crack lengths predicts behavior such as that depicted in Figure 2.23.
Lankford extended this treatment to small crack behavior in smooth specimens [2.77].
He argued that, for smooth specimens cycled near the fatigue limit, bulk plasticity is provided
by preferential microplasticity in certain grains. Microcracks may initiate and propagate in
such grains, but as they approach the first subsurface grain boundary, a decrease in da/dN is
observed due to a lower contribution of %p to t.
After the crack encounters the first grain boundary, two things may happen. If the
second grain does not contribute significant microplasticity to t, and if this value of t
69

corresponds to a AK below the LEFM threshold stress intensity, the crack will become
nonpropagating. On the other hand, if the next grain penetrated by the crack is sufficiently
microplastic, da/dN will increase rapidly, and the crack will continue to grow faster than
would be expected on the basis of LEFM. Once the crack becomes long enough for its
intrinsic LEFM crack tip plastic zone to supersede the maximum grain size, t will be
approximately Oe, resulting in the small crack and the long crack data merging.
There is excellent agreement between the predictions based on the above arguments
(depicted in Figure 2.23) and anomalous small crack behavior.
Blocked Slip Band (BSB) Model
Another criterion for threshold stress or stress intensity for small cracks has been
proposed by Tanaka and co-workers [2.78 - 2.81]. They suggested that the condition for no
crack growth occurs when the slip band emanating from the tip of an isolated crack is blocked
by a grain boundary. This situation is illustrated in Figure 2.24a. The density of pile-up
dislocations at the tip of the slip band is infinite, and the elastic stress field near its tip is
similar to the singular stress field near a Mode II elastic crack tip. The intensity of this field is
characterized by a microscopic stress intensity factor. The analysis of this criterion was
carried out for the case of the slip band coplanar to the crack plane in a two-dimensional field,
as shown in Figure 2.24b. The threshold stress is given by:
m
c 2 ,+ a I s 1 (2.41)G CT Oa _TH 7 fr COS b)
where Kcm is the critical value of microscopic stress intensity factor, coo is the slip band
process zone, b = a + oo and ofr is a uniform frictional stress which acts against climbing
motion of dislocations in the slip bands. If the threshold condition is expressed in terms of
the stress intensity factor:
70

KTH = H = K c + 2 fcos -(2.42)
For long cracks, the threshold stress intensity factor, AKo, is obtained by taking the limit of
AKTH as oo becomes smaller than a,
AK = AK + 2 +2 r / (2.43)
and the fatigue limit of smooth specimens, o,, can be derived by substituting a = 0 in Eq.
2.41:
ma =a* c (2.44)
The application of the BSB model to fatigue crack growth thresholds is based on the
assumption that some process zone with a certain crack length, coo, is required ahead of the
crack tip for the crack to grow. For purposes of determining the threshold values of stress or
stress intensity for small cracks under cyclic stress, the experimental values needed are two of
three parameters: o, AKo and ao.
Morris, James and Buck [2.82] have proposed a modification to the BSB model.
They have shown that the closure stress developed at the surface tips of microcracks is a
function of the distance of the crack tip from a grain boundary. They suggested that closure
stress, resulting from unreversed tensile strain at a crack tip, has to be exceeded before a
crack tip experiences any effective opening which might result in crack advance. Therefore,
the stress intensity factor becomes:
AKeff = (amax - <c)V (2.45)
where AKeff is the effective stress intensity range, omax is the maximum cyclic stress and ac
is the crack closure stress.
71

The model proposed by Morris et al. combines the BSB model and crack closure
phenomenon. The underlying assumptions are that slip responsible for early propagation
does not extend in significant amounts beyond the next grain boundary in the direction of
crack propagation (BSB model) and that retardation of crack growth by a crack closure stress
can be calculated from the location of a crack tip relative to the grain boundary. In theory,
this model explains the anomalous behavior of small cracks as observed in many alloys where
the crack size is less than the grain size.
Fracture Surface Roughness and Crack Closure Model
Morris et al. [2.83] have proposed a model which relates the threshold stress intensity
to the crack closure stress arising from fracture surface roughness. Their model successfully
predicts the variation in AKTH with crack length for small surface cracks in Ti-6AI-2Sn-4Zn-6
Mo alloy, based on measured values of crack opening displacement arising from roughness.
The basic physical mechanism is shown in Figure 2.25. Fracture surface asperities
make contact a short distance behind the crack tip and prop open the crack, resulting in a
measurable crack opening displacement [2.84]. Based on an expression derived by Green
and Sneddon [2.85], the opening displacement can be related to the distance from the crack
tip and the applied stress. For small displacements
U(X)= ~E: (2.46)where U(X) is the crack opening displacement, a is the applied stress, c is the half length of a
surface crack, and X is the distance from crack tip to point of contact of opposing fracture
surfaces. It is surmised that the average distance Xo and the effective height Uo of the
discontinuities are constant if the crack tip is of sufficient length resulting in AKTH
approaching AKo (asymptotic value of AKTH for long cracks).
72

Alternatively, AKTH will be a function of crack length if the effectiveness of
roughness in propping open a crack varies with crack length. Crack opening displacement
data, Umin = f(2c), for a Ti 6A-2Sn-4Zr-6Mo alloy is shown in Figure 2.26. For this alloy,
the opening increases with crack length approaching an asymptotic value Uo at 2c - 150 jgm.
A model to predict the contribution to AKTH arising from fracture surface roughness (AKTH)
was derived. The resulting expression for the threshold stress intensity is:
AK TH =AK OR U + (2.47)
where AKOR is the contribution to AKo arising from fracture surface roughness, Umin(2 c) is
the value of U(2c) at minimum load, Uo is the asymptotic value of Umin for long cracks, c is
the half length of surface cracks and is the parameter which includes the contribution to
AKTH from all mechanisms in addition to roughness.
Included in the parameter P are possible contributions to threshold from residual
plasticity, surface oxide, residual stress in the plastic zone, a criterion for the onset of
microplasticity, and mechanisms particularly important to small crack growth such as an
elastic-plastic correction to the cyclic stress intensity [2.86,2.87], grain boundary blocking of
crack growth [2.88] and a plastic zone size determined by non-continuum constraints [2.89].
Several of these mechanisms may also be dependent on crack length. Although this model
attempts to be general, the inclusion of the term [B can be viewed as a very nonspecific "fudge
factor".
73
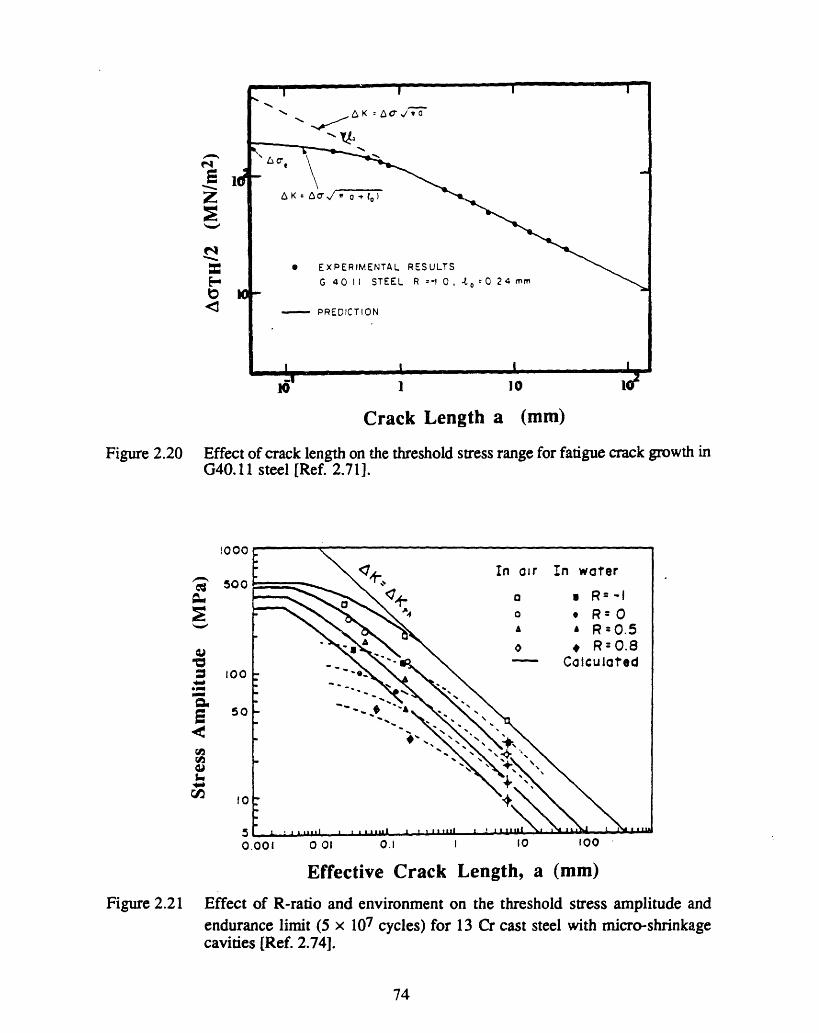
Crack Length a (mm)
Figure 2.20 Effect of crack length on the threshold stress range for fatigue crack growth inG40.11 steel [Ref. 2.71].
Figure 2.21
I000
500
,
cm
5-(A~
100
50
10
0.001 0 01 0.1 10 100
Length, a (mm)
Effect of R-ratio and environment on the threshold stress amplitude and
endurance limit (5 x 10⁷cavities [Ref. 2.74].
cycles) for 13 Cr cast steel with micro-shrinkage
74
Effective Crack
5
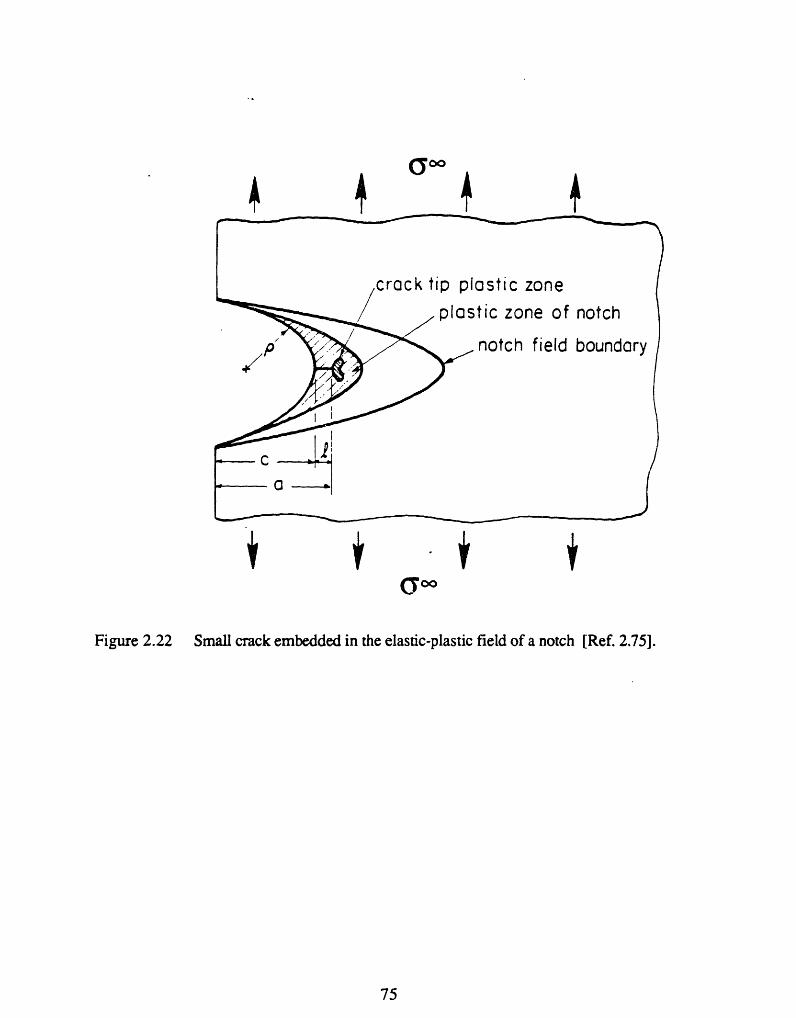
t(oo
4 * *
Figure 2.22 Small crack embedded in the elastic-plastic field of a notch [Ref. 2.75].
75

CRACK
STRESS
Figure 2.23
LENGTH, a
INTENSITY RANGE,
Schematic illustration of the elastic-plastic and linear elastic characterization ofcrack growth rate for a small crack propagating from a notch [Ref. 2.75].
76
Z
LL
Zo!.
(D0
LuJ..aZ

Slip
(a)
Crack tip
Grain boundary
(b)
6° c
Figure 2.24 Schematic illustration of the BSB model [Ref. 2.78]. (a) Crack-tip slip bandblocked by a grain boundary and (b) Coplanar slip band emanating from thetip of an isolated crack.
77
OV 0in

essation of Displacementong Cracks
X = Xo
U = Uo
CC CC U/%2CX OC
AKTH -- Cycc 2
AKTH = Ko
Asperity
Figure 2.25
0.3
0.2
0.1
E
am
cw
-
e._
l.4U'.wocuem
VW
Illustration of roughness induced crack closure at an average distance Xobehind the crack tip. [Ref. 2.83]
0 100 200 300 400 500
Crack Length 2c (gm)
Figure 2.26 Crack mouth opening displacement (at zero load) versus surface crack lengthfor a 6Al-2Sn-4Zn-6Mo titanium alloy [Ref. 2.83].
78

2.6 Fatigue Behavior of Small Cracks in Aircraft Turbine Disk Alloys
A review of the fatigue behavior of small cracks in commercial alloys will be limited
to aircraft turbine disk alloys. Fatigue crack growth behavior for long cracks in turbine disk
alloys have been reported extensively in the open literature. Several excellent reviews can be
found in References 2.90 - 2.94. Reporting of small crack growth behavior is scarce in the
open literature and elevated temperature data even more so due to the difficulty associated
with experimentation and the proprietary nature of the results.
Turbine Disk Alloys at Room Temperature
Hicks, Brown and King [2.95 - 2.97] investigated the effect of microstructure on the
long and small fatigue crack growth behavior in Astroloy. Tests were performed at room
temperature on specimens loaded in three point bending. Crack lengths were measured by d.
c. potential drop. Their results are shown in Figure 2.27 for fine-grained (5 gm), coarse
grained (50 gm) and single crystal microstructures. Crack growth rates for small cracks
(within a single grain) exceeded that for long cracks in the polycrystalline microstructures at
low values of AK with small cracks propagating below the long crack AKTH. Small crack
growth rates merged with long crack growth rates as rpc approached the grain size. There
was little difference between small crack and long crack behavior in single crystal Astroloy.
In contrast to long crack behavior, fine grained Astroloy exhibited better short crack
propagation resistance than the coarse grained form. Changes in the y' morphology in the
coarse grained microstructure did not affect small crack growth rates. Waspaloy with a 50
gm grain size tested under the same conditions exhibited identical small crack growth rate
behavior as the 50 gm grain size Astroloy. It was concluded that defect tolerant life
predictions based on long crack behavior would be nonconservative for this alloy at room
temperature.
79
Newman and Beevers [2.98, 2.99] investigated crack initiation and propagation from
pores in powder metallurgy Astroloy at room temperature under nominally elastic fatigue
conditions. A two stage replica technique was employed which permitted crack growth rates
and crack opening behavior to be determined. The specimens were loaded in three-point
bending under nominally elastic conditions; amax = 0.6oys and R = 0.1. Surface intersected
pores dominated as crack initiation sites with initial crack extension occuring along { 111 }
planes as determined by an electron channelling technique. Crack growth rates were
measured over the range: 10 glm < 2c < 250 ptm. Small crack growth rates within a single
grain exceeded that for long cracks and exhibited considerably lower values of AKTH.
Cracks existing within a single grain grew at initially high rates until encountering the first
grain boundary where retardation or arrest occurred.
Small cracks encountering many grains in powder metallurgy Astroloy exhibited crack
growth rates similar to that for long crack AKeff data. Threshold stress intensities were also
similar to that for long cracks. The crack opening mode at all small crack lengths (2c < 250
gm) was predominantly Mode I with no evidence of crack closure.
Newman and Beevers [2.98,2.99] also investigated small crack (12 gm to 200 pgm)
growth behavior in cast and wrought Nimonic 901 with grain sizes in the 160 gm to 300 lgm
range. Crack growth rates for small cracks within individual grains exceeded long crack
AKeff behavior and exhibited a lack of threshold behavior. Individual cracks showed no
significant arrest or retardation when the first grain boundary was encountered. These results
are similar to that observed by Feng [2.100]. It was concluded that small cracks within a
single grain exhibit a lower intrinsic resistance to growth than multigrained small cracks.
Soniak and R6my [2.101] measured crack growth rates in H.I.P. plus forged,
powder metallurgy Astroloy for long and small through cracks (a > 200 m). The
microstructure consisted of a necklace structure of coarse 50 pm grains surrounded by fine
80
grains of -2 gm diameter. Long crack tests were performed at R-ratios of: 0. 1, 0.5, 0.7 and
0.9. Crack growth rates for these long crack tests were consolidated using AKeff calculated
from crack closure measurements. Fatigue crack growth rates were measured for small
cracks at R = 0.1. Small cracks were able to propagate below the long crack AKTH and grow
at rates thirty times that of long cracks. However, when considered in terms of AKeff, long
and small crack data were consolidated. This behavior was attributed to less closure for small
cracks. The values of Kop for small cracks increased from zero for 200 .tm < a < 500 gm
and merged with long crack Kop values for a = 2 mm. Using AKeff resulted in conservative
predictions of crack propagation life. Note that in this investigation, the minimum crack size
was 200 ptm (4 x g.s.); significantly greater than that considered by Hicks et al.
Vecchio and Hertzberg [2.102] investigated fatigue crack growth rates for long and
small cracks at room temperature in powder metallurgy Astroloy with grain sizes of 5 ptm and
26 m. Long crack tests were performed on compact tension specimens at R-ratios of 0.1
and 0.5. Small crack (a > 300 pum) tests were performed on four point bending specimens
with through thickness cracks at the same R-ratios. It was concluded that small crack data
only "appeared" anomalous when plotted in terms of AK. When the strain energy density,
AS, was employed as the mechanical driving force parameter, long and small crack growth
rates were consolidated.
McCarver and Ritchie [2.103] measured fatigue thresholds for long and small (10 gum
-> 200 gm) cracks in cast and wrought Rend 95. The microstructure consisted of a necklace
structure of warm-worked y grains (g.s. - 90 lm) surrounded by recrystallized y grains (g.s.
10 -> 20 gm). Tests were performed at room temperature at R-ratios of 0.1 and 0.8. The
long crack AKTH for R = 0.1 loading was 60% greater than the short crack AKTH at the same
R-ratio. The long crack AKTH for R = 0.8 loading was approximately the same as the small
crack AKTH for R = 0.1 loading. The results were rationalized in terms of roughness
81

induced crack closure. It was concluded that defect-tolerant fatigue lifetime predictions based
on long crack data at low R-ratios would be nonconservative for this alloy.
Lankford, Cook, Sheldon and Jones [2.104, 2.105] investigated small crack behavior
in powder metallurgy Gatorized® IN100 at room temperature under nominally elastic
conditions. Small cracks were produced artificially by machining away a large crack to yield
a remnant small crack ( a = 75 ginm) at one acute corner of a specimen with a parallelogram
cross section. Crack growth rates for small cracks were initially greater than that for long
cracks but dropped through a minimum below the long crack rates before merging at higher
values of AK. The initially high crack growth rates for small cracks was attributed to a
specimen geometry artifact. The subsequent region of crack growth, in which the small crack
data lie below that for long cracks was caused by the greater influence of grain boundaries on
small cracks. Grain boundary retardation was fully overcome only when the cyclic plastic
zone size exceeded the average grain diameter, consequently, short and long crack data
merged. Small and large cracks exhibited identical fracture paths at the same stress intensities
with a transition from crystallographic transgranular to striated growth with increasing AK.
As will be seen later, the fatigue fracture path at disk rim temperatures (-650C) is
intergranular for powder metallurgy Gatorized® IN 100.
It should be noted that, in this study, the crack length regime over which small crack
growth rates exceeded long cracks was not extensive and would not result in a significantly
nonconservative prediction of a small crack propagation life using the long crack data. The
crack length regime over which small crack growth rates were less than that for long cracks
was more significant.
A study of crack tip deformation fields [2.105] showed that the reversed plastic zone
sizes were the same at equivalent values of AK for both large and small crack tested under the
82

conditions described above. Hence, mechanical similitude requirements were met at all crack
sizes. Metallurgical similitude requirements were met as crack lengths became longer.
Turbine Disk Alloys at Elevated Temperatures
Hudak et al. [2.106] investigated small crack growth rates in fine grained (12 m) and
coarse grained (30 ptm) powder metallurgy Astroloy and in coarse grained (42 gm) cast and
wrought Waspaloy at temperatures of 25C, 200C and 600C. Small cracks initiated in
persistent slip bands and propagated on { 111 }ll planes or at pores in fine grained Astroloy.
Crack growth rates for small cracks exceeded that for long cracks when compared on
the basis of AK in all cases except that of fine grained Astroloy at 600C. Small crack growth
rates were found to be similar for coarse grain Astroloy and Waspaloy at room temperature
and 600C. However, at 600C small cracks in fine grained Astroloy did not exhibit
anomalously high growth rates and were found to grow significantly slower than small cracks
in coarse grained Astroloy.
The fracture surface morphology of small and long cracks exhibited the same
dependence on temperature and stress level indicating that the crack propagation mechanism
was the same in both cases. Consequently, differences in crack growth rates were attributed
to differences in mechanical driving force. An SEM stereoimaging technique was employed
to quantify local crack tip displacements, strain fields and closure levels. Crack tip strain
fields and the nature and magnitude of crack closure varied significantly for small and long
cracks. Local crack tip measurements were used to define and elastic-plastic crack driving
force based on the relationship between ACTOD and AJ. Crack growth rates for small and
long cracks were consolidated using AKeq derived from AJ.
Using data from long cracks resulted in overprediction of fatigue crack propagation
lives. The overprediction was associated with the occurrence of AKTH for long cracks. It
83

was concluded that AKTH (long crack) and near-threshold growth rate data are not applicable
to material selection, design and damage tolerant analysis of turbine disks.
Leis et al. [2.107] investigated small crack growth behavior in Inconel 718 (g.s. = 10
gim) at room temperature and at 643C (4 tests out of 33 were performed at elevated
temperature). Specimens were machined from 2.3 mm thick sheet. Small fatigue cracks
were propagated from center-hole-notch specime;ns (dia. = 1.27 cm) and EDM surface flaw
specimens (dia. = 350 m). Crack lengths were recorded by an automated photographic
system.
At room temperature and under elastic fatigue conditions, long and small crack growth
rates could be consolidated using LEFM. In the elastic-plastic field of notches and at elevated
temperatures higher crack growth rates were observed. Fracture surfaces for 643C testing
were smooth compared to the 20C counterparts. Consequently, the decrease in surface
roughness (and therefore closure level) at higher temperatures accounts for higher values of
AKeff at the same AKapp and R-ratio. Anomalous crack growth behavior was not observed in
these experiments.
Cook et al. [2.108] investigated the fatigue behavior of powder metallurgy
Gatorized® IN100 at room temperature and at 650C. Fatigue crack initiation was often
associated with pores. At 650C under continuous cycling elastic fatigue conditions, small
and long crack growth rates were consolidated using LEFM. The fatigue fracture path was
intergranular. At 650C, one minute dwell small crack growth rates were five times slower
than long crack growth rates. This behavior was attributed to increased time dependent
plastic deformation at the surface slowing the fatigue crack growth rates.
Van Stone and Henry [2.109] investigated fatigue crack initiation and early growth in
numerous processing and microstructural variants of powder metallurgy Ren6 95 at 538C to
establish a correlation with defect tolerance. The five processing conditions of Ren6 95
84

included: two hot isostatic press (HIP) conditions of -400 mesh (< 37 gm) PM Ren5 95,
thermally mechanically processed (TMP) HIP-compacted PM Rend 95, large grained cast
and wrought Rend 95, and shot peened PM Rend 95. In addition, fatigue failure mode and
deformation mode characteristics were studied for eight selected conditions of HIP-compacted
Rene 95.
HIP compacted Rena 95 was intentionally doped with 250 gm diameter alumina
contaminants. Crack initiation and growth from these defects were studied by replication of
surfaces of polished fatigue specimens. Fatigue crack initiation occurred in less than 1% of
total fatigue life. Since EDM defects were shown to result in the same fatigue lives as
naturally occuring surface defects of similar dimension; a d.c. potential drop technique was
used to monitor fatigue crack initiation and growth from EDM defects providing a quantitative
measure of cyclic defect tolerance and fatigue crack growth rates. Using the above two
approaches, the microstructural conditions which resulted in improved defect tolerance and
higher fatigue capability were identified.
Of all the conditions evaluated, large grained cast and wrought Rer,6 95 exhibited the
lowest crack growth rates, presumably due to the grain size which was fowu' times greater than
the largest powder metallurgy condition (the strength was 25% lower) For the eight
processing variants of HIP-compacted PM Rend 95, increasing defect tolerance correlated
with increased amounts of secondary deformation band cracking. A reduction in small crack
growth rates also correlated with a transition from fine-wavy to coarse-planar slip. In this
study of Ren6 95, it is obvious that microstructure can strongly influence defect tolerance.
Differences in small crack growth rates can be attributed to a lack of metallurgical similitude.
To summarize this review of the fatigue behavior of small crack in aircraft turbine disk
alloys, the following issues dominate:
85

Metallurgical Similitude
* Anomalous crack growth behavior was generally attributed to a lack of
metallurgical similitude (usually related to grain size) due to the anisotropic nature
of the material structure at this size level. Anomalous behavior was generally
observed when crack sizes were less than the grain size.
* Convergence of small and long crack growth rates generally occurred when rpc -
grain size.
Mechanical Similitude
* Differences in crack closure levels for small and long cracks is responsible for the
higher range of mechanical driving force experienced by small cracks in some
cases.
* The lack of three dimensional constraint (plane stress) at specimen and component
surfaces exerts a greater influence at small crack sizes. Defect tolerance
calculations indicate that, under high cyclic stresses, a large portion of usable
fatigue life is limited to the small crack regime.
86

Fine
_ Long
Coarse Singlegrained grained crystal
* * 4
Short o 0
U
O V 013COo~ o00 * 01 Oc 0
O OE3 no 0 0o .c, DD 00ooto."3~em
O~ ~~ U'-r~,,
0 S
S0
0
S
I a I I II I I
4 5 6 7 8 9 10
m
m
iU
U
I
-I I
15 20 26 30
Figure 2.27 Crack growth rates versus aK for small cracks in fine-grained (5 jim) andcoarse-grained (50 gm) Astroloy and equivalent single crystal material [Ref.2.96].
87
10-j
10- 4
WaU
EE
-o
'a
10-5
10-6
10 o-7
10-8
I _ _
_I _ _ -- ___ -
- -
0;
I
AK (MPa.,/m-)

3. Experimental Procedures
3.1 Materials
The alloys selected for this investigation are three nickel-base superalloys currently
being used for aircraft turbine disks. They include conventional cast and wrought alloys and
a powder metallurgy processed alloy. The alloys are listed in Table 3.1 with the test
temperatures.
Table 3.1
Alloy Test Temperature '
Waspaloy 25C and 427C
Inconel 718 427C
Gatorized® IN 100(PM) 649C
The chemical composition, heat treatments and mechanical properties are given for
each alloy in Tables 3.2, 3.3 and 3.4.
Waspaloy
Waspaloy is a conventionally processed nickel-base superalloy currently used for
aircraft turbine disks. The microstructure consists of a nickel-rich austenite matrix, y,
strengthened by Al, Cr, Mo and Co in solid solution and by coherent Y precipitates. Cr
provides oxidation resistance at elevated temperatures. The precipitation of Y is based on the
ordered Ni3(Al,Ti) intermetallic phase having an L12 structure. The compatibility of the Y
and y crystal structures (-O to 1% mismatch) allows for homogeneous nucleation of y
88

throughout the matrix with low surface energy and long time stability. Fully heat treated
Waspaloy consists of -30 volume percent y having a spheroidal morphology [3.1].
Extensive reviews of te microstructural aspects of superalloys can be found in the
literature [3.2-3.4].
The Waspaloy used in this investigation was received as hot rolled plate and given the
heat treatment described in Table 3.2. The typical microstructure of the heat treated alloy is
shown in Figure 3.1. The microstructure is comprised of a duplex grain structure with
average grain sizes of 7 pm and 200 gm. The large grains give good creep properties to the
detriment of low temperature tensile strength. The matrix y' exhibits a spheroidal
morphology. The same lot of Waspaloy was used for small crack growth testing at room
temperature and at 427C.
89

0
00
.
u u\Q
L-
I-u -
U) U
00 o
0
8 .* D '
CT CK
C9.
O
cnO C) O tn O N OI I000'f 00i a '00aC)rt r- N 0 a , I * * . * . . 6
a t:t00Cle.oC-00- -
0n tt- 4 0 ) 0 = 2 0· ~ -000U000-00w-.-=0 0 0 C 0 06 6 o -C)-- ote oe- 66Ci 6Cl'-4
- -
,. I-
CA E
0 0 u 3= r-= .0 s . - :2t, 9. L ,g a KacF 54 la 2 C MUu 2 -A= ZS 0 ACl 60d2 -- E
90
ult
u
tf)Cl4
CaCw
C
-ILf;
EI.
m)C:
00 c
O o N lCI O.cr(4 \ I
cv Y
Cd I0 c I.-
CC
6 3
C
Cv1
C
VIm
C4)8.E
0uCL
M
E-iE-4
C
0
CCCCC
E
ctCL
.E
.C
.
III
- |- I I I II
V
IIII

* · ·~ ;' ' s..
* 'I~~~~~~~~
*.L /- r
); -; a , 1
8 * p; A ;. *js ~ ~ C ' . ';
Figure 3.1 Typical microstructure of Waspaloy used in this investigation; (a) duplex grainstructure with average grain sizes of 7 m and 200 gm, (b) matrix y'exhibiting a spheroidal morphology.
91
· t' . o'
'.t . ' .'f 'p'pk :
." ,,S
''^, ; + r¢^ '·r .. t
. . -:
(a)
Ib)(
As.I

Inconel 718
Inconel 718 is a conventionally processed nickel-iron based superalloy currently used
for aircraft turbine disks. The microstructure consists of a nickel rich austenite matrix, y,
strengthened by elements in solid solution and by coherent y and y" precipitates. Solid
solution strengthening is provided by Cr and Mo. Cr also provides oxidation resistance at
elevated temperatures.
The y precipitates in Inconel 718 generally have a spheroidal morphology and
contribute little to the precipitate strengthening. The major strengthening is attributed to the "'
precipitates. y' is a metastable, coherent precipitate having a body centered tetragonal crystal
structure with a Ni3 (Nb, Al, Ti) stoichiometry. The c/a ratio of 2.04 causes significant
distortion and large coherency strains. The y' precipitates have a disk shaped morphology.
Oblak et al. [3.5] proposed that the strengthening mechanism in Alloy 718 is due to
coherency strains arising from the y" lattice distortion and not antiphase boundary or order
strengthening normally associated with the y' phase. In the fully aged condition, y'
constitutes approximately 25% of the total Y + y' precipitate formed. The total amount of Y
+ y' precipitate in Alloy 718 is -19 volume percent [3.5].
The material used in this investigation was received in the form of hot rolled bars of
22.2 mm diameter from Huntington Alloys. The material was given the conventional solution
plus 2-step ageing heat treatment as described in Table 3.3. The typical microstructure of the
heat treated Inconel 718 is shown in Figure 3.2. The microstructure is uniform with an
average grain diameter of 32 gm.
92

Q\-ctr)
0
u u
- 00 00
arn 00tf) Cl Co) r- \
o ~ Lc
Q
u0 8
EU=4 . !:3
u u
93
QeN4
cuoc
C-
ICcC
u
cUctcc
EE-I1vdx
B m NoT Io : 5R
-4-4 N- '-
- -n
, '== r_Ocu *s , E
w 9
oc
t--
.6CC4).i0
Isu0
UUU
Cum
[,.
0c
C
C.
C
CI-
:,
C
IL
ILx;
eq Cq CeN 0 e N t 0 oo ~O Oeo - e-Ho
m l m. .m m . . . .
. z roo 1 moU~~~~~~~~~~~~~~~~~ ,

Typical microstructure of Inconel 718 used in this investigation; average grainsize is 32 m.
94
Figure 3.2

Powder Metallurgy Gatorized® IN100
IN100(PM) is a high strength nickel-base superalloy which is processed by the
powder metallurgy route and is currently used for advanced aircraft turbine disks.
Strengthening is based on a high volume fraction of Y precipitates (-60 volume percent)
which are coherent with the matrix. Solid solution strengthening elements play the same role
in this alloy as in those described above. The high solute content is required to achieve the
high volume fraction of Y present in this alloy. The rapid solidification rates provided by
inert gas atomization of the powders prevents gross elemental segregation which would
otherwise occur during conventional processing. After initial powder consolidation, the
extruded billet is superplastically forged by Pratt and Whitney's Gatorizing® process [3.6].
The material used in this investigation was supplied by Pratt and Whitney Aircraft as
specimens machined from a Gatorized® disk. The heat treatment employed is described in
Table 3.4. The typical microstructure of IN100(PM) is shown in Figure 3.3. The average
grain diameter is 3-5 gm. Large blocky Y precipitates reside at grain boundaries and much
finer cuboidal y' reside within the y matrix. Pores resulting from gas entrapped during
atomization are uniformly present throughout the microstructure with sizes ranging from 10 to
30 gm in diameter.
95

8 V: 0(1 m C1(N
- -
h
m j
v O~~u " 0~LV
,W "e 0
--C0000w)0 0 0\ 0 \O kn -6 6 i Co ; 4 tv;1- -4
00 c0l C
O O O, o -o- ,I, , - -- o 000
1- -4
00oo t, O O c) 0O O O
I II II I
NO0000d OOw
__ __ __ __~ ~ ~ ~ ~~
.0j ' ' i
.~~ .~a,~o O oI.OA ScOb0 a ~~~ o
96
U-;
- Qv
- tcr \<
U C)_4 o
01., ·- .,,,
'~I' '0Chl
Q
U
_2 _
u 0r
_e
zI
8- I
CuV
I-
4U
'F~E
Qc)
.
CuNC.etl
c
UCuQM.
etj
C.
Q
C-=0 gCY
0<0
o .
O S
O°6 c
I--
o .CiQ.
o000006 6 6
U
N
Cu
Q.o0._0
U(
Q).9
I I |- I I I
II I _ _ I I I
- l - __ I
- J I Ill I
I I I
u
Zsmt
a)
ITefi
I
I IJ

(a)
(b)
Figure 3.3 Typical microstructure of powder metallurgy Gatorized® IN100 with anaverage grain size of 3-5 pum. (a) Optical micrograph, (b) SEM micrographexhibiting a duplex ¥ structure.
97

3.2 Test Specimen
Specimen Geometry
The specimen geometry used in this investigation of the fatigue crack growth behavior
of small cracks in turbine disk alloys at elevated temperature is shown in Figure 3.4. The
specimen is essentially an axisymmetric button-head low-cycle fatigue specimen with a 6.35
mm diameter gage section. It was chosen to be suitable for both elastic and elastic-plastic
loading conditions. A modified low-cycle fatigue specimen with flats on opposite faces of the
gage section, Figure 3.5, was adopted when it was found that the curvature of the cylindrical
specimen surface may have contributed to a deflection of the crack when the surface crack
length exceeded about 800 4m. This problem will be discussed later.
Specimen Preparation
All specimens used in this investigation were machined by low stress grinding or by
electro-chemical machining. After low stress grinding, there exists a disturbed layer of about
50 to 100 ptm in depth which contains residual stresses [3.7]. This residual stress layer was
removed to avoid interference with the fatigue propagation behavior of small cracks.
Removal of the residual stress layer was accomplished by the following procedures.
Flat segments and round segments of specimen gage sections were hand ground with
successively finer grades of SiC paper; 240, 320, 400 and 600 grit sizes. Gage section
surfaces were ground in the longitudinal and transverse (circumferential) directions. Sharp
comers were rounded to prevent crack initiation. In the final steps of hand grinding, 6 Ltm
diamond paste was used. Finally, the reduced section of each specimen was electropolished
with a solution of 45% butyl-cellusolve, 45% acetic acid and 10% perchloric acid, at 40-50
volts for 30 seconds at a temperature of - 0 to 5° C. Approximately 100 pim of surface layer
98

was removed by the procedure described above. When artificially introduced surface defects
were used as crack initiation sites, they were processed at this time.
Thermocouples were spot welded to precise locations below the gauge section to
control the temperature using the set point technique in elevated temperature tests.
Initiation of Small Cracks
Tw :Important and practical considerations dictated the use of an artificial means to
initiate small fatigue cracks: 1) Due to the statistical nature of intrinsic defects, the probability
of having a characteristically maximum size defect intersecting the surface of the gage section
of a laboratory test specimen is small. 2) The measurement of small crack lengths is
experimentally difficult, however, this task can be greatly facilitated by knowing their exact
location.
The desired defect geometry is that which is conducive to crack initiation at the
smallest possible defect size. Such a pseudo-crack should have a sharp defect tip radius and
be oriented normal to the principal applied stress. The process employed to produce defects
must not induce significant residual stresses or large scale microstructural damage.
A pulsed laser was employed to introduce surface defects in fatigue test specimens to
serve as initiation sites for small cracks. The principal advantage of this technique is that
small sizes are obtainable (-10 gm). The laser used was a Quanta Ray, ND-YAG laser
operating in the Q-switched mode with a wavelength of 532 nm. The incident beam diameter
was -3 mm with an output energy of around 10-3 joules/pulse and a pulse duration of 0.2 gI
sec. The incident beam was focused by a series of two cylindrical lenses which generated an
elliptical defect in the specimen surface as shown in Figure 3.6. From 100 to 500 pulses
were used for each defect. The depth of each defect is determined by the number of pulses
and the intensity of radiation in the incident beam. Similar defects were also made using a
99
spherical lens and translating the specimen with respect to the focal point to achieve the
desired surface length. The disadvantage of the laser technique was the difficulty encountered
in controlling the depth of the defect. This was due to the nonuniform spatial distribution of
intensity in the incident beam and changes in the beam characteristics between each use of the
laser.
Precracking
In nearly all experiments where artificial defects were used, cracks were initiated by
precracking at R = -I and a stress range of approximately + 520 MPa. Precracking required
from 20 K to 50 K cycles to achieve an initial crack depth of 100 jim. Precracking w'as found
to be necessary because:
1) Negative R-ratios promote crack initiation.
2) It was necessary to initiate and propagate cracks at least 10-20 jim greater than the
defect size to grow out of the local influence of the defect geometry.
3) It was necessary that cracks assume a stable crack front geometry before surface
crack length measurements would correlate with crack depth. This was confirmed
in subsequent experiments.
3.3 Crack Length Measurement by Plastic Replication
The plastic replication technique was used to measure crack lengths. This technique
has a resolution of about 1 4m in crack length. In addition, it serves as a valuable record
which can later be used to correlate crack growth rates with crack tip-microstructural
interactions. Acetyl cellulose tape of 125 tm thickness was used as the replicating material
and acetone or methyl acetate as the solvent.
The replicating procedure was as follows:
100

1) Cyclic loading was stopped at zero load after a preset number of cycles.
2) Induction heating was automatically turned off in elevated temperature tests.
3) The specimen was loaded in tension to 50-80% of the peak cyclic load. This static
load was decreased as the cracks became longer.
4) The softened side (with a few drops of solvent) of a piece of replicating film was
applied to the specimen surface under a light pressure for about 15 seconds.
5) The film was allowed to dry, for 10 minutes.
6) The film was peeled off and taped to a glass microscope slide with the replica
facing up.
7) The replica was then viewed under a reflected light microscope at magnifications
ranging from SOx to 500x.
8) Crack lengths were measured using a calibrated eyepiece micrometer.
3.4 Crack Length Measurement by A. C. Potential Drop
Due to the considerable labor involved in monitoring crack length by replication,
especially at elevated temperature, a program was undertaken to develop an A. C. Potential
Drop system for the continuous and automated measurement of crack length [3.8]. A
resolution of - 2 Am in crack length was achieved. Unfortunately, a significant problem was
encountered in the long term stability of the system. Consequently, work proceeded using
the plastic replication technique for measuring crack length.
101

3.5 Small Crack Growth Testing at Elevated Temperature
Test specimens were prepared in the manner described in previous sections. Three
defects were introduced at orthogonal positions in the midplane of the round gage section
specimens. Two defects were introduced on opposite faces of cylindrical-with-flats gage
section specimens. Testing was performed on a closed-loop, servo-hydraulic testing
machine. Water cooled grips were aligned on axis to within + 15 4m before every test. This
tolerance is less than the lateral play in the actuator.
Specimens were heated by a 2.5 kilowatt - 400 kilohertz induction heating unit using
an eight-turn, axisymmetric induction coil. The temperature in the plane of the crack was
maintained at the desired test temperature within ±+ C. The temperature gradient along the
gauge length was less than + 5C as determined by a system calibration. Photographs of the
high temperature testing system are shown in Figure 3.7.
Load Controlled Testing
Load controlled tests were performed at 20 cpm or 10 cpm using a sinusoidal
waveform. The test frequency was chosen to match the available long crack data. Cycling
was stopped at zero load and induction heating turned off automatically at preset cycle
intervals. After the specimen cooled to room temperature, crack lengths were measured by
replication. Tests were terminated when the largest surface crack length was in the 2-3 mm
range. Specimens were separated along the crack plane by continuing to cycle at room
temperature and a positive stress ratio.
The principal test variables were maximum stress and R-ratio (minimum
stress/maximum stress). The stress was calculated as the engineering stress, P/Ao.
102

Strain Controlled Testing
Strain (displacement) controlled tests were performed at 10 cpm using a sawtooth
waveform. Longitudinal displacement was measured on specimen gauge sections to achieve
total strain control. The effective gage length between extensometer probes was 14.4 mm.
Extensometer probes contacted the specimen surface 90' from the small crack sites. Total
strain, Et, was measured and controlled to a precision of + 0.01%.
At the end of each cycle interval; cycling was automatically stopped at zero strain,
hydraulic pressure turned off returning to zero load along an elastic path and the induction
heating turned off. After the specimen cooled to room temperature, the extensometer was
removed and crack lengths were measured by replication. When elastic-plastic cycling
occurred, care was taken to return the extensometer and the strain-load value to the
appropriate position on the hysteresis loop. Tests were tei-minated in the same manner
employed in load controlled tests.
103

o)
0t"4)C)o,'3
-E._
cl
104
E E
b; ~~e0\ r":c

I(r-
Irl
-E
'rI
As
E I~~~~~~~~~~~~~~l I ,
h i
_ _- 6-4
- LI I4 ~~~~~~~~~~~~~~~~~~~~~~~~~~~~~~~~~~ ~~~~~~~~I
E-
II
II
aw
105
z
...
.QImeP
Lf-iQ
30
._
0c"',CU
2o
e-CZK;n
Oc5on0MO
t-
1;
.2
c04._
-Ur_011:Q
'SI3
V:)C-;U
LD.
III
I!I
r,
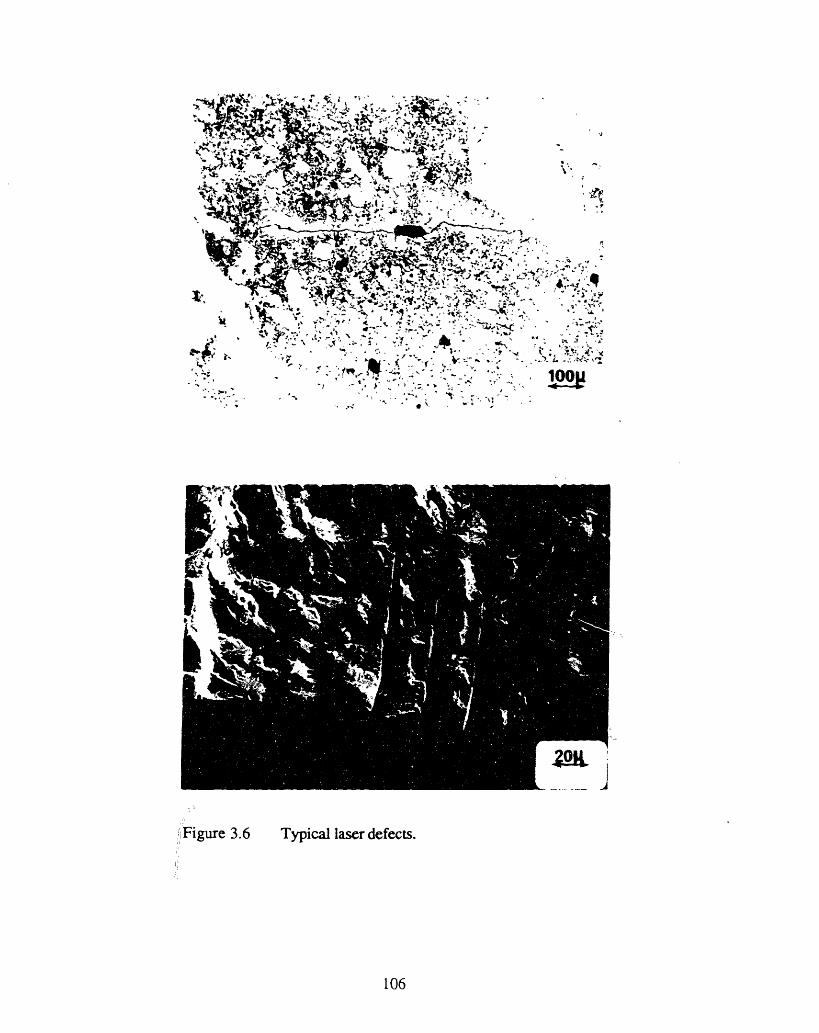
Figure 3.6 Typical laser defects.
106
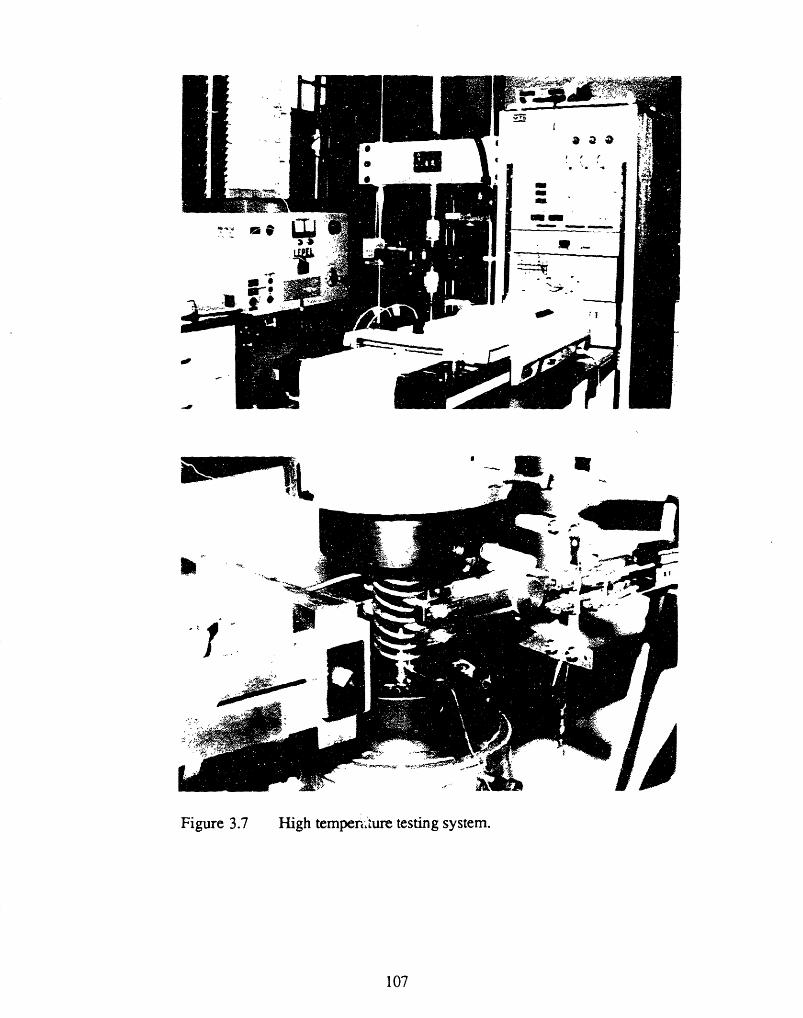
~~~6q~Irlm-
Figure 3.7 High temper;iure testing system.
107
S &
i

3.6 Data Analysis
The raw data taken from each fatigue experiment was surface crack length, 2c, versus
cycle number, N. The desired presentation of the data is crack depth, a, versus N and crack
growth rate. da/dN, versus an appropriate fracture mechanics parameter. This requires a
determination of crack size and shape.
The shape of the cracks at the termination of high temperature testing was evident on
fracture surfaces as a result of heat tinting. Figures 4.38, 4.40 and 4.43 show typical fracture
surfaces with crack front profiles readily distinguished by the presence of oxidation. Cracks
of different sizes were present in the same specimen due to the variability in the number of
cycles required for initiation from the laser defects. In some cases, one or more cracks may
have arrested. Careful measurements of surface crack length and crack depth were made. A
c/a ratio of -1 was the predominant value over the full range of crack sizes considered and for
the variety of testing conditions employed. Any variation from c/a = 1 could not be related to
testing conditions. Hence, all subsequent data reduction will be performed by first taking the
crack depth, a, to be equal to half the surface length 2c.
Each fatigue experiment yielded from 7 to - 30 data points. These Ni, ai, pairs were
tabulated and first plotted as ai vs. Ni. The data was edited for potential measurement errors.
If a data point appeared to fall erroneously out of place, the replica was measured again.
Values of a were compared to artificial defect size and shape on the fracture surface. Data
pairs were considered to be valid only after the crack assumed a semicircular shape
encompassing the defect. For this reason some of the first Ni, ai pairs may have been
rejected.
108

Computation of Crack Growth Rates
The determination of da/dN from a versus N was accomplished using two well
established data processing techniques: the secant method and the incremental polynomial
technique.
In some a versus N curves, it was obvious that considerable variability existed in
crack growth rate. This was usually attributed to the interaction of short cracks with variable
resistance in the microstructure. The secant or point-to-point technique was employed when
depicting this variability. The secant method is simply a calculation of the slope of a straight
line which connects two adjacent data points on the a versus N curve. The crack growth rate
may be calculate as:
da ai+l -a.dN -N (3. 1)
i+1 1
The stress intensity factor range associated with this crack growth rate was calculated using
the average crack length where am = ( ai+l + ai)/2. The principal disadvantage of the secant
method is that the variability calculated for da/dN often obscures trends in the data.
The bulk of the crack growth rate data was processed using the 7 point-incremental
polynomial technique. This technique "smooths out" the crack growth rate curve and
minimizes the influence of measurement error on da/dN by fitting the a versus N curve locally
in increments. This technique involves fitting a parabola to successive 7-point subsets of the
data using a "least squares" procedure. To determine da/dN at point i, the equation of a
parabola was determined for data points Ni-3, ai-3 through Ni+3, ai+3. The slope at point i
is simply the first derivative of the equation of the parabola. In view of the limited number of
data points for each experiment, the slope at the first and last three points was determined
using the first and last fitted parabolas [3.9].
109

Stress Intensity Factor Calculations
The essence of the "short crack" problem in fatigue is the inability of the stress
intensity factor, K, based on linear elastic fracture mechanics, to consolidate crack growth
rate data at very small crack sizes in some materials. The anomalous behavior of small cracks
is generally characterized in terms of da/dN versus AK. The breakdown of LEFM for short
cracks is attributed to a lack of similitude between short and long cracks. In some cases, the
apparent deviation from long crack behavior may be attributed to an inappropriate
determination of the effective stress intensity factor range, AKeff. This may be due to an
inaccurate characterization of crack geometry, failure to account for crack closure, or an
incorrect assessment of the stress intensity factor.
The stress intensity factor solution employed in this investigation was that for a semi-
elliptical surface crack. Irwin [3. 10] developed an expression for the Mode I stress intensity
factor around an elliptical crack embedded in an infinite elastic solid subjected to uniform
tension. The most general formulation is given by:
K=c' sin20 + -cos20) (3.2)
where 1 is an elliptical integral of the second kind and is given by
/2 / (3.3)
= { 1 - 2 -a 2 sin 201 dO
The geometric variables a, c and 0 are defined in Figure 3.8. As discussed in a previous
section, the c/a ratio was found to be approximately one and constant over the full range of
110

crack sizes considered. By substituting c = a, the above expression for stress intensity
simplifies to
K = - ~cV = 0.637 o(xa (3.4)
This expression was first developed by Sneddon [3.1 11 and is valid for all values of 0 when
c = a, that is for a circular internal crack of radius a (penny-shaped crack) embedded in an
infinite solid.
The stress intensity factor for surface cracks in finite elastic bodies (laboratory
specimens) may be expressed in terms of a boundary correction factor modification to the
stress intensity factor for cracks in infinite bodies. The most general formulation is given by
K = > ( sin 2 + a C 2 F a a c (35)
where F is the boundary correction factor. The geometric variables are defined in Figure 3.8.
Newman [3.12] has reviewed a significant number of boundary correction factors for
surface cracks. For the case of the semicircular surface crack (a/c = 1) and a/t < 0.2, the
maximum value of F occurs at or near the intersection of the crack with the specimen surface
(0 = 0) where F - 1.15. Hence, the maximum value of the Mode I stress intensity factor for
small semicircular surface cracks may be approximated by
K = 1.15 2 - a = 0.73 oia (3.6)
The specimen geometry employed in the Waspaloy tests, shown in Figure 3.4, has a
cylindrical gage section. Nisitani and Chen [3.13] have calculated stress intensity factors for
semi-elliptical surface cracks in cylindrical rods by modifying the solution for elliptical
111
surface cracks in finite plates, Eq. 3.6. They have calculated this correction factor to be equal
one when c/a = 1 and (a / specimen radius) is less than 0.2 which is approximately true for all
crack lengths considered in this investigation.
Raju and Newman [3.14] calculated stress intensity factors for semi-elliptical flaws in
cylindrical rods using a three dimensional finite element method. The results were presented
in terms of K/(a\R(xa/Q) ) versus 0. When c/a =1, Q = (/2) 2 and a/D < 0.2, therefore,
K/(ora/Q ) = 1.15 which is the boundary correction factor for small surface cracks in the
cylindrical specimen. Note that this is the same value found for small semicircular surface
cracks in rectangular cross sections, Eq. 3.6.
The stress intensity factor range was calculated using only the positive portion of the
loading cycle. The tests were not instrumented for the measurement of crack opening-closure
stresses, therefore, the stress range, Ao, was taken as Gmax when amin < 0 and as (ma -
Jmin) when cJmin > 0. Cracks grew nominally perpendicular to the applied stress. Crack
lengths were taken as their projected lengths on a plane perpendicular to te loading axis.
Hence, for the specimen and crack geometries considered in this investigation, the nominal
stress intensity factor range was calculated according to
AK = 0.73 Acpos (3.7)
Since identical specimen and crack geometries were considered for the elastic-plastic tests, the
same flaw shape and boundary correction factor (Y = 0.73) was used to calculate elastic-
plastic fracture mechanics parameters.
112
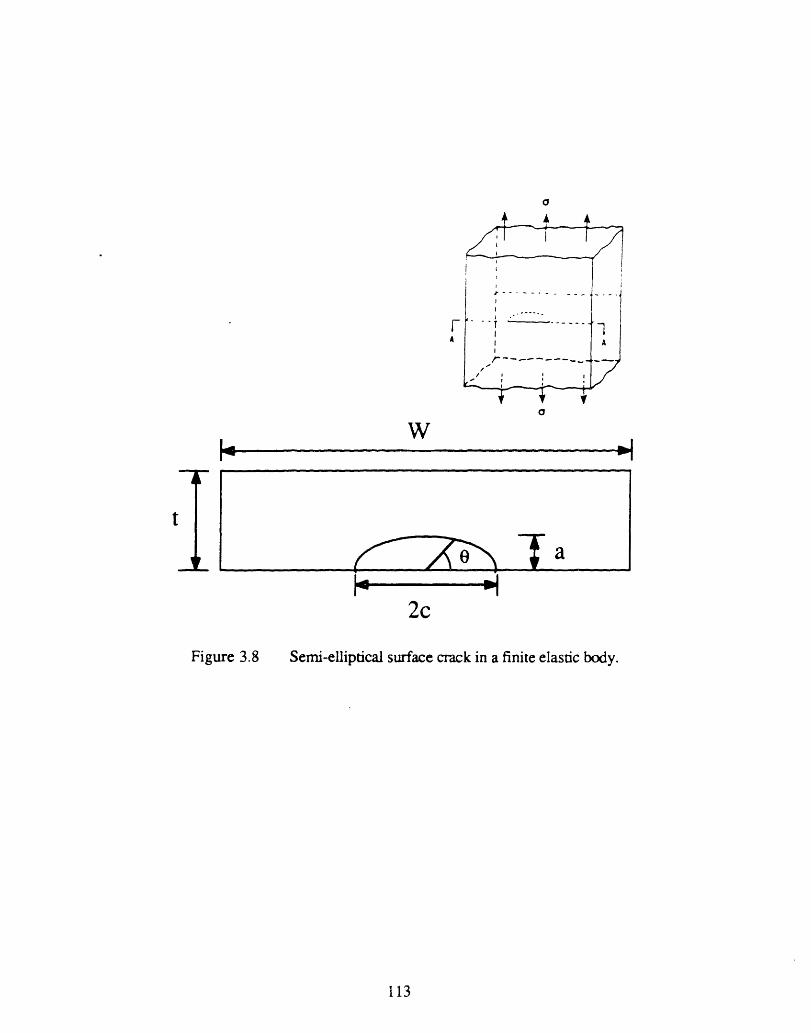
a
FA
~W~~~a
tw
'---- -2c
Figure 3.8 Semi-elliptical surface crack in a finite elastic body.
113

4. Results and Discussion
The fatigue behavior of small cracks was investigated in Waspaloy, Inconel 718 and
powder metallurgy Gatorized® IN100 at elevated temperatures. Small cracks were initiated at
laser defects and crack lengths measured by surface replication. Surface crack length, 2c,
was converted to crack depth, a, since crack front profiles were determined to be nearly
semicircular (c/a = 1) for all values of crack depth. Cracks propagated in a self-similar
fashion after assuming a semicircular crack front around the initiation defect. Crack growth
behavior was generally measured over the range 100 tm < a < 1 mm. Data is presented here
as crack depth versus cycle number and crack growth rate versus a parameter expressing the
crack driving force. Crack growth rates were determined using the seven point incremental
polynomial method unless otherwise specified.
4.1 The Fatigue Behavior of Small Cracks in Waspaloy at 427C
The fatigue behavior of small cracks was investigated in Waspaloy at 427C (800F)
under nominally elastic conditions. All tests were performed in load control on specimens
with cylindrical gage sections (Figure 3.4). The principal test variables were maximum stress
and R-ratio. Test conditions for Waspaloy are shown in Table 4.1. This alloy possessed a
duplex grain size with mean grain sizes of 200 4m and 7 gm.
Effect of Maximum Stress
The effect of maximum stress on small crack growth behavior at R=-1 is shown in
Figures 4.1 and 4.2. Values of maximum stress employed were 504 MPa (0.60ys ), 621
MPa (0.74ays) and 754 MPa (0.90ys). The values in parenthesis represent the fraction of
the 0.2% offset yield strength (841 MPa) for Waspaloy at this temperature.
Crack depth versus cycle number shown in Figure 4.1 exhibits the expected behavior.
The variation in crack growth rates noted at a maximum stress of 504 MPa may be attributed
114
to microstructural interactions. The influence of microstructure on crack growth rates was
more prominent at lower stress ranges. Crack growth rates were calculated as the slope of the
fitted curve at various crack depths as discussed in a previous section.
The stress intensity factor range was calculated as
AK = 0.73 A(pos' (4.1)
where 0.73 is the flaw shape and boundary correction factor for a semicircular surface crack,
Aapos is the positive stress range and a is the crack depth.
Crack growth rates versus AK for different stress ranges at R=- 1 are shown in Figure
4.2. The solid line represents crack grov th behavior reported by Larsen et al. [4.1] on longer
cracks (a > 1 mm) at lower stress amplitudes in through thickness center crack specimens.
These long crack data represent an upper bound to crack growth rates for small cracks (100
Am < a < 1 mm) measured in this investigation. This result is likely due to the lack of
metallurgical similitude between these small cracks tests and conventional long crack tests. In
long crack tests, the resistance to crack extension offered by grain boundaries and variously
oriented grains at the crack tip is averaged over a long crack front and many grains. An
average crack growth rate results. For the small cracks considered in this investigation, the
crack front encounters fewer grains and grain boundaries. The resistance to crack extension
offered by unfavorably oriented grains will dominate and lead to lower crack growth rates.
Also, since both fracture surfaces exhibit similar crystallographic features, out-of-plane
deflections cause a more significant decrease in average Mode I conditions at the crack tip for
small cracks and further reduce crack growth rates. The upper bound of crack growth rates
may be expressed in terms of AK by the Paris-Erdogan relationship:
da 3. 50 x10- 1 1 (AK) 2.73dN (4.2)
where da/dN is in nm/cycle and AK is in MPa4i.
115

The ability of AK to consolidate crack growth rates within a factor of two for a range
of net section stresses approaching 90% of the yield stress supports a contention that AK
expresses crack tip similitude under these conditions for R=-1. This is a particularly
interesting outcome when one considers that the stress intensity factor best defines the near
crack tip elastic stress field for small or/y s ratios. The tendency for small crack-high stress
data to fall slightly below long crack data was also observed by Larsen et al. [4.1] for
Waspaloy at 649C where net section stresses exceeded 80% of the monotonic yield stress.
Applicability of LEFM
Although AK correlates the fatigue crack growth rates for small cracks and long
cracks as shown in Figure 4.2, the validity of employing LEFM for such small cracks (100
im < a < 1 mm) and high stresses (max - 0.9 0ys) should be evaluated more explicitly.
The basic assumptions of linear elastic fracture mechanics are: 1) the material behaves as a
linear elastic isotropic continuum, 2) the crack tip plastic zone size is small with respect to
all other dimensions (small scale yielding), and 3) the crack length is small compared to
component or specimen dimensions.
The requirement for linear elastic behavior is met on a global scale since the
macroscopic yield stress is not exceeded in any of these tests. On a microscopic scale, i.e.
within a single grain, elastic-plastic behavior may be expected since micro-yielding can occur
at -1/3 of the macroscopic yield stress.
Waspaloy used in this investigation may be considered an isotropic continuum when
the size scale considered exceeds the grain size. When the size scale is on the order of the
grain size, the continuum response is anisotropic. Since this Waspaloy has a duplex
microstructure with a small average grain size of 7 gm and a few grains as large as -300
116
tAm, the requirement for isotropic behavior may be violated locally as small cracks and their
crack tip zones encounter large grains.
The second basic assumption for valid application of LEFM requires that the crack tip
plastic zone size be small with respect to all other dimensions. Lankford et al. [4.2] have
reviewed both theoretical calculations and experimental measurements of fatigue crack tip
plastic zone sizes. The solution to this problem depends on the simplifying assumptions
made in the calculation. The simplest estimate, proposed by Rice [4.3] and confirmed by
Broek [4.4], is based on the elastic solution of the stresses at the tip of a sharp crack
accounting for load redistribution caused by crack tip yielding. Accordingly, the monotonic
plastic zone size, rpm, under plane stress conditions may be estimated as
K 2 2
rpm = 0.3 =03 ) (4.3)
substituting the stress intensity factor for a semicircular surface crack
2
rpm -053( y)a (4.4)
Since max ranged from 60% to 90% of ays, rpm ranged from 0.19a to 0.43a. In
view of this estimate, can rpm = 0.19a to 0.43a be considered small with respec- to crack
length? According to Smith [4.5], the answer is no, because he argued that rpm must be less
than 0.02a if the near crack tip elastic field is to dominate the crack tip plastic response.
Over the range of stress and crack length considered here, rpm ranges from 19 flm to
430 Lm which is reasonably small with respect to the minimum specimen dimensions of 6.4
mm.
Now we shall consider the above requirements for the validity of LEFM in terms of
the reversed crack tip plastic zone size, rpc. Rice [4.3] estimated rpc by using a reverse flow
117

stress of 2crys. Therefore, rpc is 1/4 of the monotonic plastic zone size under plane stress
conditions. According to Eq. 4.3:
rl - (AK s 0.08 AK 2r 14j 2% ,j) - K \(4.5)Lankford et al. [4.2] found that these theoretical estimates of monotonic and reversed plastic
zone sizes significantly exceed the experimental values obtained by different measurement
techniques. It was generally found that rpc = rpm/10 . Therefore, in terms of rpc, the
requirement for small scale yielding places less stringent limitations on'crack length. For the
Waspaloy experiments considered here, small scale yielding may be approximately satisfied,
since rpc = 0.019a to 0.043a using the experimental findings on rpc.
It has been further reasoned that for a global application of fracture mechanics, the
near crack tip elastic field dimension (a/10) should be at least the size of the largest structural
feature, that is, the grain size. Therefore, the crack length must be ten times the grain size if
K is to accurately represent the elastic stresses in the crack tip field. In the case of these
Waspaloy tests, crack length varied from 100 gm to 1000 gum and grain size varied from a
few gim's to -200 gm. In most cases, crack depth, a, and crack front length, ita, were
generally greater than 10 x grain size.
The validity of using K to define the intensification of stress in the near crack tip field
when the remote stress approaches 90% of the yield stress in a material with a low hardening
rate (n = 0.15 for Waspaloy) is also a matter for concern. The expression:
K f(0)ij - (4.6)
is only a first term approximation to a series solution for the near crack tip elastic stress field
which ignores higher order terms. At 0=0 the stress perpendicular to the crack plane
becomes:
118
aO V i '/ 2r (4.7)
The local stress falls to co" at r 2 a/2, i.e., at r > 5 times the near crack tip elastic field
dimension of a/10. This estimate ignores stress redistribution. Therefore, K does define a
significant extent of stress intensification in the near-crack-tip region.
Perhaps one explanation for the good correlation of crack growth rates versus AK for
these high a'/csys values lies in the constraint which may begin to develop for elements ahead
of the crack front even for cracks as small as those investigated here (100 gm < a < 1 mm).
Triaxial constraint can result in a significant hydrostatic stress directly ahead of the crack tip.
For a nonhardening material satisfying the von Mises yield criterion, this can result in stresses
which are three times the uniaxial yield stress ahead of the crack front [4.2]. A strain
hardening material results in even higher stresses. Full plane strain conditions would not be
expected in such small specimens, however, the constraint resulting from stress free material
above and below the crack certainly results in a lower ratio of oFa(ys(effective)-
Similitude Requirements
If we compare the crack tip conditions between a long fatigue crack propagating at a
low stress range and a small fatigue crack (100 gm < a < 1 mm) propagating at a high stress
range in Waspaloy at 427C, there is a lack of mechanical similitude as discussed above in
terms of having:
1) a small rae.otonic plastic zone size with respect to all length dimensions.
2) a small monotonic plastic zone size with respect to the distance over which the firstterm of the stress field solution is dominant.
3) an equivalent constraint; highly stressed specimens exhibit greater surface yieldingsince the yield criterion is exceeded to a greater depth and, therefore, encompassing agreater fraction of the crack front length for small cracks.
119

Mechanical similitude is satisfied in terms of equivalent KmX and AK. Experimental
measurements of crack closure were not made. Metallurgical similitude is approximately
satisfied in these tests since crack depth is generally greater than 10x grain size.
Although conditions of perfect similitude may not exist between long and small cracks
for Waspaloy at 427C, the correlation of crack growth in terms of AK as shown in Figure 4.2
suggests that similitude is sufficiently satisfied.
The good correlation of crack growth rates observed for small crack-high stress data
at different stress ranges suggests a high degree of crack tip similitude between these tests.
Crack Growth Rate versus Plastic Zone Size
The crack extension which occurs in one cycle may be expressed by the Paris-
Erdogan relationship
Aa = CAKm (4.8)
Since fatigue crack extension is generally agreed to be related to the reversed crack tip plastic
strain range, it is interesting to compare Aa to rpc. Taking the conservative estimate of Rice
and assuming plane stress, we have:
a -2
rAa 4tC(a )2AKm 2 (4.9)
For the Waspaloy data generated in this investigation we can substitute values from Eq. 4.2
into Eq. 4.9 which becomes:
Aa 3x10⁻⁴K a 73r-p 3xIO AK 3 (4.10)
Since AK ranged from 10 MPaVm to 40 MPaxi in these tests, Aa/rpc ranged from
-2x 10⁻³ to -4x10 -3. As can be seen, crack advance in a single cycle remained less than 1%
120

of the reversed plastic zone size, while da/dN varied over two orders of magnitude. Even
using the smaller experimental determinations for rpc, Aa per cycle remains less than -2.0%
of rpc for all conditions.
At this juncture, it seems that crack growth rate may be more strongly dependent on
the maximum crack tip strain range than the reversed plastic zone size, although AeptP and rpc
are most likely related. This issue will be addressed in a later section.
Effect of R-ratio
The effect of R-ratio on small crack growth rates is shown in Figure 4.3 and 4.4.
Values of stress ratio employed were: R=-l, R=0, R=0.3 and R=0.5. The maximum stress
was nominally 766 MPa in all tests except the R=0.5 test where the maximum stress was
necessarily increased to 903 MPa.
Crack growth rates versus AK are shown in Figure 4.4 for these four tests with the
expected results. The tendency for da/dN (R=0.3) to decrease and then increase can be
attributed to a slight perturbation in crack extension as seen in Figure 4.3 and is likely due to
interactions with large grains and/or grain boundaries in the Waspaloy microstructure. The
ordering of crack growth rates with respect to R-ratio is illustrated in Figure 4.5 where
relative crack growth rates are compared at AKapp = 20 MPam. For positive R-ratios, the
ordering of crack growth rates from high to low corresponds to R-values of 0.5, 0.3 and 0,
respectively. This trend is also observed for long cracks. Crack growth rates at R=-1 are
nearly equivalent to that at R=0.5. Long crack data is generally not available at negative R-
ratios since conventional compact tension specimens cannot be loaded in compression.
Empirical Approaches to Consolidating R-ratio Data
Under nominally elastic conditions, the two mechanical variables in any fatigue
loading situation are max and min. These are interrelated through R=cmin/Omax and,
121
correspondingly, R=Kmin/Kmax. The tendency for crack growth rates to increase with
increasing R-ratio (for R>O) has been addressed in a number of ways. The first are through
empirical relationships which attempt to collapse da/dN versus AK curves. Brock and
Schijve [4.6], McMillan and Pelloux [4.7], and Erdogan [4.81 have concluded that the
general equation relating stress and crack length to crack growth rate is of the form:
da = f[y( ¥-)c(AV~\-) b]dN lymax ai v (4.11)
It is fair to state that the inclusion of umax and Au in this crack growth expression was
based on an assessment of crack growth mechanisms and therefore is not purely empirical.
Following the above approach, Walker [4.9] rewrote Equation (4.11) as
da = f[(yol -QA xt/ r) ] (4.12)dN max
where 1-ac = c/(c+b), ca = b/(c+b) and f3 = c+b. Since the product of the two stress terms has
the dimensions of stress, an effective stress, a( was defined as
(a-= A'1- a = amax (1- R)a (4.13)
Therefore, an effective stress intensity factor range can be defined as:
AK = Y max (1- R) a (4.14)
Walker consolidated crack growth rates for 2024-T3 and 7075-T6 aluminum alloys using AK
for R=0.059 to R=0.655. Values of a used in computing AKwere 0.5 for 2024-T3
aluminum and 0.425 for 7075-T6 aluminum. The possible use of AK to consolidate crack
growth rates at R<0O was not considered in Walker's original work. For the Waspaloy tests
considered here, the Walker formulation for AK may be calculated according to
AK = 0.73 max (1 - R)(cf- = (1- R)aK max (4.15)
122

When oa=0.5, crack growth rates versus AK can be nearly collapsed to a single line as shown
in Figure 4.6. It is notable that R=-1 data is also consolidated in this plot. Values of a
ranging from 0.4 to 0.6 were employed in Eq. 4.15 and resulted in significantly poorer
consolidation of crack growth rates.
It is interesting to consider the inclusion of the two stress terms (Smax0 .5ACo-5) in AK
to achieve the high level of correlation between crack growth rates depicted in Figure 4.6. If
we employ the terms individually in calculating AK, we have: AK=Kmax when using only
Gmax1. 0 and AK=APK when using only At1- 0 (APK will be explored in a later section).
Correlation of crack growth rates with Kmax or APK is poor for these Waspaloy tests (-
1<R<0.5).
Forman et al. [4.10] proposed a modification to the Paris-Erdogan equation which
would account for unstable crack growth as Kmax approached KIC by introducing the
singularity ((1-R)KIC - AK) into the denominator. The following are equivalent expressions
of the Forman relationship:
da CAKm CAKm CAK Kmax (4.16)dN (1- R)KI- AK (1 - R)(KI Kmax) KIC - Kmax
Forman found a high level of correlation for crack growth rates in 7075-T6 and 2024-T3
aluminum alloys. In addition to predicting the theoretical asymptote at KIC, the relationship
correlated data at different R-ratios including R=- 1.
The Forman equation was applied to Waspaloy tests at 427C. KIC was estimated to
be -100 MPaxim. Since crack growth rate cannot be correlated with a single parameter on the
right hand side of the Forman equation, relative crack growth rates were calculated at AK=20
MPa-m. As seen in Figure 4.5, the Forman equation predicts crack growth rates for R-ratios
123

> 0. At R=- 1, the prediction is poor, perhaps due to the inability of equation 4.16 to account
for the contribution of the negative stress excursion in effecting crack tip strain reversals.
rack Closure Concepts Applied to Consolidating R-ratio Data
Elber [4. 11 proposed that only a fraction of the positive loading cycle was effective
in propagating cracks. He determined that a fatigue crack opens and closes at some positive
value of stress (op=rcl) due to contact between crack surfaces behind the crack tip (plasticity
induced closure). Elber made direct measurement of crack opening and closure in 2024-T3
aluminum alloy with stress intensity varying over the range 13<AK<40 MPa-m and the
stress ratio varying over the range -0.1 <R<0.7. Crack length, 2a, was greater than 30 mm in
all cases.
The effective stress range was defined as:
Ac eff = max - op (4.17)
where Cop is the crack opening stress. The effective stress range was then defined as the
fraction of the stress range for which the crack is open:
(amax - op)U = ) (4.18)
max -min
Consequently, the form of the crack growth rate expression becomes:
da = C (Ke )m CUAK)(4.19)dN eff (4.19)
Elber performed constant amplitude tests to establish the relationship between U and the three
variables: AK, a and R. He found only the R-ratio to be the significant variable affecting the
crack opening stress. The relationship between U and R was found to be linear and
expressed as:
124

U = 0.5 + 0.4R
for the 2024 aluminum alloy. Long crack growth rates were expressed as:
da =C[(0.5 + 0.4R) AK]m (4.21)
Other investigators have found different relationships for U such as:
U = 0.68 + 0.91R Ref. [4.12]
and
U = 0.707 + 0.408 R Ref. [4.13]
It is apparent that there is not a single value of Kop operative for all R-ratios and,
therefore, Kop=fl(R) or U=f2(R) must be determined experimentally.
For the Waspaloy tests considered here, the following question arises. Can the effect
of R-ratio on crack growth rates be attributed to crack closure when op and xcl were not
measured during testing? The possibility can be approached in a semi-empirical manner. The
first approach was to attempt to find a single value of op which would consolidate the crack
growth rate data of Figure 4.4 in terms of AKeff. When op was chosen to merge the
extremes of crack growth rate curves, greater differences resulted at other R-ratios. Hence if
crack closure is responsible for differences in da/dN(R) for Waspaloy at 427C, then op must
be a function of R.
The second approach taken to consolidate the crack growth rate data of Figure 4.4
was to assume that the effective stress intensity was of the form proposed by Elber
AKeff = (A + BR) AK (4.22)
125
(4.20)

Using crack growth rate data for only positive R-ratios, a solution for A and B was
attempted. A unique solution could not be found. The relationship was obviously nonlinear,
perhaps due to the higher <max in the R=0.5 tests.
Effect of Temperature
The effect of temperature (427C versus 25C) on the crack growth rates of small
cracks in Waspaloy can be seen in Figure 4.7 and 4.8 for R = -1 and R = 0, respectively.
The room temperature tests were performed by Feng [4.14]. In both cases, crack growth
rates were higher in the elevated temperature tests. This could be a result of a deleterious
environmental interaction or a decrease in the crack closure stress experienced at 427C. The
elevated temperature tests exhibited less crystallographic faceting on fracture surfaces as
determined by stereographic observations. This could result in less roughness induced crack
closure and, therefore, higher values of AKeff.
For R = -1 test results shown in Figure 4.7, crack growth rates at 427C serve as an
upper bound to crack growth rates at 25C.
For R = 0 test results shown in Figure 4.8, crack growth at lower values of AK
(apparently subthreshold) in room temperature tests may be a result of a true "short crack"
effect in these tests. Crack lengths were << 100 pim in many room temperature tests where
Stage I - shear mode crack extension was often measured. There is a breakdown in
mechanical and metallurgical similitude between these crystallographic cracks and the
nominally Mode I cracks (a>100 pgm) investigated at 427C.
126

Table 4.1Test Conditions for Waspaloy
Test# Temp R Gmin Gmax Comments°C MPa MPa
-1
-1
-1
00.050.300.50
-504-621-754
031
229451
-1 -483-1 -621-1 -7580 0
504621754766621765903
483621758758
2 cracks3 cracks3 cracks1 crack
2 cracks2 cracks3 cracks
10 cracks7 cracks
10 cracks10 cracks
* Room temperature tests were performed by Jun Feng.
127
427427427427427427427
GRIGR4GR2GR3GROGR5GR6
JF7*JF10*JF8*JF9*
25252525

S
ar Si aS S
a S
* a
a S
W e
a
S.
0 e
0
564e
Sc
S +
* _
* ," Ya m m
5 5S S
S SS
lbS S a
4 * Ui * * ,
4 **^* *^*...I..IJ I - I -. .
to
VIm
wMI
Unn
.-
n
U) UeU0 r1x ·
_)Q
. _
LaO o
m~~_ _IC3 -
-E-
m.
Z tL·
W "
U as,>- -) o
UI -I 1CX9 scs8 Lt
m! 6J to 1 tD 19 1 6 ' 9 9 to Q w IN uw L r V cm -
128
Se
U,
U,IT
E0.U
NI
L
SI
mL-xcc
NNv-
>0
L3CZU)
0
L4i
xar1:
- -
w
U9
4
i
I
I
W
( Lu) 'R 'H.Lcl~a >ou3

1 =- I -I - -I- - I- - I -- - -
NWRSPRLOY
Mix Streos - VRIED
LEGENDMax Strem
e 504MP&(7-621MPma(5
* 754MPa( l
427C(800F)R--1 Freq-20cpm
*
If
long crack C
I4
a
AK = Y A pos/ -
I I I I I I I
5I I I I I I I
10
DELT K (MPa Jir)I
Summary of crack growth rates versus stress intensity factor range forWaspaloy tested at 427C under nominally elastic fatigue conditions; stressrange was varied at R=-1, Freq.=20 cpm.
129
Elirm
\
U
-o
-OCf
_0
-i
-7
10'
10'
hi
Wp- .me
I3U,
UC{
U
l te
Figure 4.2
In100
_ _
-- --� - -� - I -- --- ·I---C- -- -
10 I I I I I I I I I I I I I 1:
10 S
-

+
+
+
4.
x4.
+
+
+
04-
x x
X X
0 X X
0 X X+
%x X
+
* a
L II IL (* .L O
X Ua ID s a)
I I!
w-J * o x +
**
X.
XX 0
* +* * 0XO
* * XO* * +o
· . . .. I . ..awpiO
Iin
VI
w W~~~~~~~~.
Q) Sw
O oU)VC C
I>3
_ ,..r ONZ
_ ~~cn dI
-~~~>;m¢) ..,~W Co
mn z" U~~"(.,)~I~~ >m .-n~~~'
...z,;xw
' to I% t Ut} - tc
( un ) ' ' Hldc3EI N 3
130
0
0
E0.U
NII..L
Li
L.
0U
O
cJ
a:3f
*Ix
a-4
LI&.
0
.-
w_ L __ __-
- __- -_ --- -_ 1 u N-1
R
M A
. . .

I I I I I I I I I I I I I
WRSPRLOY 427C ( 800F)R-r at o VARIED Freq-20cpm
LEGENDMax Stress
* R--1 (754MP%)O R-0 (766MP%)X R-0. 3 (765MP)+ R-0.5(903MPa)
.9.+* XX
# X
**
**
*X*
x o0** X 0
O0
00
OO
0
0+
4.
0
AK Y A pos
I I I I I I I
5I I I I I I I
18 100
DELT K, ( MPa 4-)
Summary of crack growth rates versus stress intensity factor range forWaspaloy tested at 427C under nominally elastic fatigue conditions; R-ratiowas varied, Freq.=20 cpm.
131
a sOf5l10
a,
E%..
-410
z
Lap-
an -810I
0
1 0-
Ua:U
10
Figure 4.4
1 1 I-r i � -- 7- r -- - - -----r--
I e_ I
I
I

a,"I-
I
N
o Measured Values: Walker Equation+ Forman Equation
-0.8 -0.4R-ratio
0.0 0.4 0.8
Effect of R-ratio on relative crack growth rates for Waspaloy tested at 427Cunder nominally elastic fatigue conditions. Crack growth rates are comparedat aK=20 MPaq4 and normalized with respect to da/dN(R=O).
132
3.0
2.5
2.0
I =
MebZ
1.5
1.0
0.5
Ani
+- LIV.U
-1.2
Figure 4.5
-r r ·- , -i- . - -II. I
II
-

5 10
DELTR K,
100
(MPa 4fi)
Summary of crack growth rates versus the Walker modified stress intensityfactor range (a--=0.5) for Waspaloy tested at 427C under nominally elasticfatigue conditions, R-ratio varied, Freq.=20 cpm.
133
A
0)
U
Le>,
U
1
I
I
11
Figure 4.6
I a - s

5 10
DELTR K I
Comparison of crack growth rates versus stress intensity factor range forWaspaloy tested at 25C and 427C, R=- .
134
Qd
U
U
E
%-
La
I
-F- Xo
(.JU
U
10
10
18
Figure 4.7
lE
(MP a 4-m

1 t
-S
0i
;~lm
5 10
DELTt K
100
I (MPa i-)
Comparison of crack growth rates versus stress intensity factor range forWaspaloy tested at 25C and 427C, R=O.
135
o
-o
rdlU
rl
II2:I30
Y 11
a:
Figure 4.8
- S
O-i
mmf

4.2 The Fatigue Behavior of Small Cracks in Inconel 718 at 427C
The fatigue behavior of small cracks in Inconel 718 was investigated at 427C (800F)
under nominally elastic conditions. All tests were performed in load control on specimens
with cylindrical gage sections plus two flats as shown in Figure 3.5. Unfortunately, this
drawing was not strictly followed in the machining of six Inconel 718 specimens. The radii-
to-flats were made smaller at 6.35 mm rather than the designated 12.7 mm. Consequently,
three tests failed prematurely at this location. The principal test variables were maximum
stress and R-ratio. Test conditions for Inconel 718 are shown in Table 4.2.
A composite plot of crack depth versus cycle number is shown in Figure 4.9.
Small versus Long Crack Growth Behavior
The fatigue crack growth behavior of small cracks (100 gtm < a < 1 mm) is compared
to long cracks in Figure 4.10 at R=0.05. The stress intensity factor range was calculated
according to Eq. 4.1. The long crack data was taken from the work of Krueger [4.15] where
a single edge notch specimen was used (a > 1 mm). The general trend for small crack growth
rates agrees with the long crack data and can be described by the Paris-Erdogan relationship:
da = 7.92 x10- 12AK (4.23)dN (4.23)
where da/dN is in m/cycle and AK is in MPa-m.
The tendency for one crack to exhibit a regime of nearly constant crack growth rate
(-2 x 10⁻⁸ m/cycle) can also be seen in Figure 4.9 where the a versus N curve is linear over
the range 100 gm < a < 300 gim. A regime of decreasing crack growth for one small crack at
the R--0.05 condition is also observed.
136

Effect of Maximum Stress
The effect of maximum stress on small crack growth rates at R=-1 can be seen in
Figure 4.11. Values of maximum stress were 758 MPa (0.69ays) and 621 MPa (0.56ays).
The values in parenthesis represent the fraction of the 0.2% offset yield strength (1100 MPa)
for Inconel 718 at 427C. The stress intensity factor range consolidates crack growth rates for
these two stress levels. There is a tendency for nearly constant crack growth rates at low
values of AK, i.e., 100 gm < a < 300 Am. This behavior is more clearly evident in the a
versus N curves for these tests shown in Figure 4.9.
Effect of R-ratio
The effect of R-ratio on small crack growth rates is shown in Figure 4.12 where the
maximum stress was 758 MPa in both tests and the stress ratios were R=-1 and R=0.05.
Similar to the Waspaloy results, the general trend for higher crack growth rates at R=-1
versus positive R-ratios is also observed in these Inconel 718 results. This again confirms
the role of the compressive stress range in promoting faster crack growth rates at the same
nominal value of AK. Presumably, the compressive component of the stress range increases
the magnitude and extent of the reversed crack tip plastic strain range.
Applicability of LEFM
The arguments for and against applying LEFM to correlating crack growth rates of
small cracks in Inconel 718 at 427C are similar to those given in the previous section for
Waspaloy at 427C since yield strengths, stress ranges and crack length regimes are nearly
equivalent in both cases. It will suffice here to give a brief summary of those arguments as
they apply to small crack behavior in Inconel 718 used in this investigation.
137

The requirement for linear elastic behavior is met on a global scale since the
macroscopic yield stress is not exceeded in any of these tests. On a microscopic scale, i.e.
within a single grain, plastic behavior may be expected since micro-yielding can occur at -1/3
the macroscopic yield. The requirement for isotropic behavior may be violated locally as
small cracks and their crack tip zones encounter large grains. Since max ranged from 56% to
69% of Yys, rpm ranged from 0.17a to 0.25a and, therefore, did not satisfy the small scale
yielding requirement that rpm < 0.02a if the near crack tip elastic field is to dominate the crack
tip response. However, if we contend that rpc defines the limitation on small scale yielding
and use the experimental estimate that rpc = rpm/10, then rpc ranged from 0.017a to 0.025a
and therefore satisfied the small scale yielding requirement.
As stated previously, the crack length must be ten times the grain size if K is to
accurately represent stresses in the crack tip elastic field. Since the crack length ranged from
100 gpm to 1 mm and the average grain size was 32 pim, this requirement was met at most
crack lengths.
Mechanical similitude between small cracks and long cracks in this heat of Inconel
718, although not strictly satisfied, is approximated sufficiently to give the correlation shown
in Figure 4.10. Mechanical similitude between small cracks of equivalent size was also
demonstrated in these tests.
138

Table 4.2Test Conditions for Inconel 718 at 427C
Test # R (Gmin Omax CommentsMPa MPa
GR7
GR8
GR9
-1
0.05
-1
-758
38
-621
758
758
621
2 cracks
2 cracks
2 cracks
139

00
00
o
0 0X
0 O
0 0
XX 00x X>4 00
* >K * 00* X*
* O
ec s1.~~~~~~~~~~~~W01
U1LU1
t _ Qdm' uUo t
O cq
t coNI-~
ru n z6m L
-Z m
o E
,u .L
62 6D 61) 6s to 19m W
9 , o C4 N tD Ut 1 ' P
(wn) 'e 'Hd3! >iDodD
140
im.
3cm
Ucu(M
o0
oo
o
X
o0
o
X X0
0V-
N
-JLJz0UzZ
x X
· I
L I aar Utn
ID - -
W I Ck
XX
QzW
W0 $ X
- - ~ ~ ~ ~ ~ ~ ~ ~ _
_·I- 1 I- - -CL - I
fm
I
I

5 10
DELTA
Figure 4. 10
K, (MPa 4ii)
Crack growth rates versus stress intensity factor range for Inconel 718 testedat 427C under nominally elastic fatigue conditions; small crack versus longcrack, R--.05 and Freq = 20 cpm.
141
, .- S
O(3
z-O
C
p-
10II-
U,
1
Uc
1
100
L 19
1s
a

5 18
DELTA
Figure 4.11
K, (MPa 41i)
Summary of crack growth rates versus stress intensity factor range for Inconel718 tested at 427C under nominally elastic fatigue conditions. Stress rangewas varied at R=-1, Freq. = 20 cpm.
142
O--
U
E
z-O
0
U
3
Wf
IU
I
I
I
1
I18800
a

I I I I I I
INCONEL 718Max Stress - 758MPa
LEGEND
0 R-0. 85
* n00
AK = Y ApoOSV-a
I I I I I I I
. oO
O0
0 0
0 °
0
I I I
S 10
DELT K
Figure 4.12
( MPa ,M)
Summary of crack growth rates versus stress intensity factor range for Inconel718 tested at 427C under nominally elastic fatigue conditions; R-ratio varied atMax. Stress = 758 MPa, Freq. = 20 cpm.
143
f I - I I I I I 4
427C(BOO8F)
R-VARIED Freq-20cpm
U,
XU
E
z-o
"0
(rL3W
-
0TU
L9
U
U
10
10
10
10
-I
-7
-I
-9
10 I
100
_I II
I I___ __ I
I eI2 -5I 4i
V

4.3 The Fatigue Behavior of Small Cracks in Powder Metallurgy Gatorized®INI00 at 649C ; Elastic Tests
The fatigue behavior of small cracks was investigated in powder metallurgy Gatorized
IN100 at 649C (1200F) under nominally elastic conditions. All tests were performed in load
control on specimens with cylindrical gage sections plus two flats as shown in Figure 3.5.
Small cracks were initiated by laser defects and precracked to a depth of 100 gm. Crack
growth behavior was measured over the range 100 gm < a < 1 mm. Test conditions are
given in Table 4.3. The principal test variables were maximum stress and R-ratio.
Effect of Maximum Stress
The effect of maximum stress on small crack growth behavior at R=0. 1 is shown in
Figures 4.13 and 4.14. Values of maximum stress were 758 MPa (0.72co) and 965 MPa
(0.9200). The values in parenthesis represent the fraction of the elastic limit stress (1050
MPa) for IN100 (PM) at 649C. Crack depths versus cycle number shown in Figure 4.13
exhibit the expected behavior. The stress intensity factor range was calculated as
AK = 0.73 AposV- (4.1)
where 0.73 is the flaw shape and boundary correction factor for a semicircular surface crack,
Apos is the positive stress range and a is the crack depth.
As seen in Figure 4.14, AK consolidates crack growth rates of small cracks for the
two stress ranges at R=0. 1. There is a break towards threshold behavior at AK=12MPalm
for both cracks. Two small cracks indicated by the arrows at B' and A' remained arrested at
9.4 MPai-m and 10.3 MPaxim, respectively, throughout testing (Np > 3000 cycles). During
precracking these cracks did not achieve sufficient length to exceed AKTH during subsequent
testing. It is unlikely that these two small cracks of a = 70 gm (at 965 MPa) and a = 135 gm
(at 758 MPa) could remain arrested for an infinite number of cycles under such high cyclic
144

stresses well above the high cycle endurance limit. However, this apparent threshold
behavior at a significant number of cycles with respect to turbine disk life expectancy does
indicate significant defect tolerance for this material under nominally elastic fatigue conditions
at R=0.1.
The fatigue crack growth behavior of small cracks, shown in Figure 4.14 may be
expressed in terms of AK by the Paris-Erdogan relationship in the Stage regime by:
da . 10-12AK 396dN (4.24)
where da/dN is in m/cycle and AK is in MPa-i.
The small crack data (100 gtm < a < 1 mm) obtained in this investigation merges with
long crack data (a > 20 mm) at high values of AK. The long crack data was taken from the
work of Larsen et al. [4.1] where compact tension specimens were used. There is, however,
a divergence in slopes between these two data sets. The long crack data may be better
represented by the following equation:
da -10 2.61=da - 2.28 x 10 AK (4.25)
dN (4.25)
where da/dN is in m/cycle and AK is in MPam.
Effect of R-ratio
The effect of R-ratio on small crack growth rates is shown in Figures 4.15 and 4.16.
Values of stress ratio employed were: R=0.1, R=-0.5, R=-0.75 and R=-1. The maximum
stress was constant at 965 MPa in all tests. R-ratios were chosen to match stress ratios
observed in strain control tests, to be discussed in a later section (see Table 4.3). The
objective of these tests was to assess the role of the compressive stress range in contributing
to the mechanical driving force for crack growth.
145

Crack growth rates versus AK are shown in Figure 4.16 for these four tests. Crack
growth rates increase with decreasing R-ratio. This trend can also be seen in the a versus N
curves of Figure 4.15. Crack growth rates differ by a factor of -4 in the Paris regime.
The potential for nonconservative errors in calculating an integrated crack propagation
life at negative R-ratios when using R=0.1 data is illustrated rather dramatically in the a
versus N curves of Figure 4.13 and Figure 4.15. To be more critical of this visual estimate,
we must realize that AK (a=constant) is 10% lower in the R=0. 1 tests and, furthermore, that
R=0.1 data exhibited considerable near threshold behavior which was absent from the
negative R-ratio data.
A conservative calculation of crack propagation life may be based on the linear regime
alone. The upper bound of crack growth rates for the R=-1 test condition may be expressed
by the Paris-Erdogan relationship:
da =6.55 x 10 10 A K 2 48
dN (4.26)
where da/dN is in m/cycle and AK is in MPaI-. Integrating the above equation for R=-1
data and Eq. 4.24 for R=0.1 data between a=100 ptm and a=l mm, the crack propagation
lives are 512 cycles and 2033 cycles, respectively.
These tests demonstrate that the compressive stress range plays an important role in
accelerating crack growth rates and must be accounted for in defect tolerant approaches to life
extension.
Empirical Consolidation of R-ratio Data
Given the success of the Walker equation in consolidating crack growth rates for
Waspaloy (-1<R<0.5) in Section 4.1, it was applied to the INl00(PM) results (-I<R<0.1).
The Walker equation was used in the form given by Eq. 4.15 with ca=0.5. The results are
146
shown in Figure 4.17 where crack growth rates are nearly collapsed into a single line by the
Walker-modified stress intensity factor range. The spread in the data at high AK's can be
attributed to experimental scatter; for example, the two cracks for the R=-0.5 test condition
(points "E") are at the two extremes of the scatter band.
The inclusion of Ac in the effective stress term of AK, i.e., =(Gmax)l 1 A(ia,
demonstrates the importance of including the compressive stress range in the mechanical
driving force for crack growth. Several physical arguments may be made to explain the
increasing crack growth rates observed for decreasing R-ratios; in this case corresponding to
a larger stress range since the maximum stress was constant at 965 MPa in all tests.
1) It may be argued that the crack opening-closure stress decreases with larger compressive
stress excursions, causing fracture surface asperities to deform plastically. Therefore,
AKeff=Kmax-Kop increases with decreasing R-ratio. This argument seems plausible,
however, Elber and others found experimentally for aluminum alloys and long cracks that
crack opening-closure occurs at positive stresses and that AKeff=(A+BR)AKapplied increases
with increasing R-ratios. There is an apparent inconsistency in using crack closure arguments
to explain the full range of the R-ratio effect on crack growth rates.
2) A second argument is that the compressive stress excursion serves to resharpen the crack
tip resulting in faster crack growth rates in R<O tests. Although this explanation may be valid
where fatigue cracks propagate by a ductile striation mechanism, it is unlikely to apply to
powder metallurgy IN100 at 649C where crack extension occurred along an intergranular
fracture path with the crack tip remaining sharp and nearly closed at high values of tensile
stress. This fact was established by observations on plastic replicas of surface crack traces
which were made at -80% of the maximum cyclic tensile stress.
147

3) A physically plausible explanation for the effect of R-ratio on crack growth rates observed
here is that crack extension in a given fatigue cycle is caused by the reversal of crack tip
plastic strains. In positive R-ratio tests, the tensile plastic strain which develops ahead of the
crack at Kmax is reversed upon unloading. If crack closure occurs at some positive value of
load, the extent of crack tip strain reversal is reduced. In terms of LEFM, AKeffKmax-
Kclosure controls the crack tip strain range under nominally elastic conditions.
These small crack tests are unique in that the magnitude of the nominal stress range is
a significant fraction of the yield stress (92% in the case presently being considered).
Consequently, the crack tip strain reversal, which occured by elastic unloading is further
extended by the high magnitude of imposed bulk compressive stress. Crack closure may
occur but will be less effective in shielding the crack tip from strain reversal. Therefore,
AKeff has limits to its applicability in describing crack tip conditions, that is AKeff=Kmax-O
since the Mode I stress intensity factor is not defined for negative stresses.
Hence, by using the empirical modification of AK by the Walker equation which
explicitly includes Autot, we can account for the contribution of the negative stress range in
fatigue crack growth. This approach is in agreement with the basic concept of crack closure,
but it further recognizes that high compressive stresses may override full crack tip shielding.
148

E E E1 .I..I--
c CA c nc
, ' ,y' ,y O i!u u ) _ _< C1 _ C1 C,
000000000\3 - tnC, C CN M MO .1 o o o~
,. t _-4I Nt , o
"o U: U tn*-1- CN cq- N0 C CC)a C~cl . . .6 6666
-mooN r- CO
O N O 0C . .o o o o
\.C N C ) \ NC
I I I a I
CN 00 0 \C M 0:900c o00 C N o
00tn \NC c \Cvn \NC c r- -CO \ O O\
C x t~ O\ o \C tn w N+ + +
4 -- M M -
vcn A w
000000C 0 C 0W Ccq N C C C,,
0000cn cCN N
0000-00o m tn o o o u:ooo6o,_oo o~ o o oI oe o
tn oo 00 r rl-
- C ir 00 ~ 00M 00000l, M "
ClU00 00o0 o 0 C l 00oo6-oo
00
i
C1-4 -4
O I O\ 00 \C
NC0-4 CA
C o e M C C 0
t N 00 ~ U: vr os o o- I I
i i i I I i i
1 0 W ri U: C~ Ui
149
Z
z
Nr
0[-
- -Sm
Q
I..
·r
00 " r)0
00000O O C
0000oo O O0000 O
i 0 o00 oo00W0 M 00 0r r o o
_-~ N N_--4 C l_-, ' - ri-,- -4 - -4-4 -4 -4 -
C4
0
Q
sw
C.u
gtz9
I I I I
0 r r
E
ol.
0
0**
I
I
, ~ ~ ~ ~ .
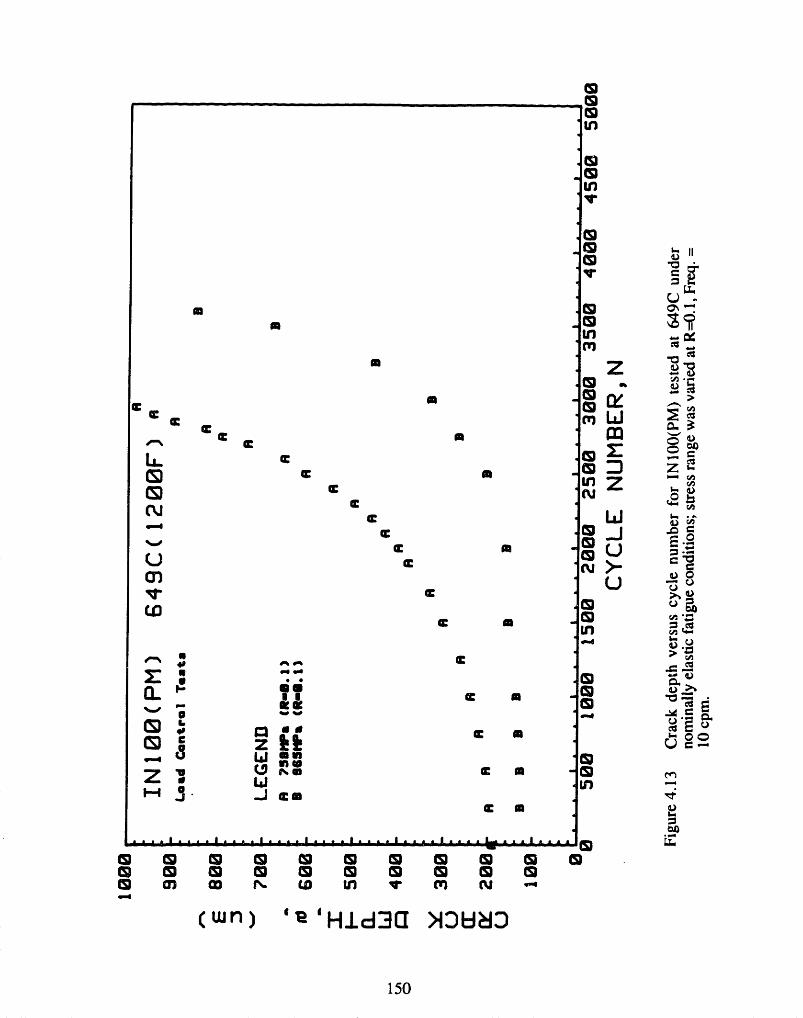
I
m
C
a
C m
C C m
-.. L- .L E I . .A
U')I
X 11rfl
I.
in(T)
zS
midU ^X ~Ya
Z s
u~~~~~C
g dXru '5-
83~~s 00ur Z -QW oEU1 c a ~~~ Y
m0 1oxu 8°in~P. ·
iiI-
oT.,
t I w n u' ' N -
150
ma
m
a
a
C
I-
O
CD0C
_ :
.4. .P
(S) c
3.
a
mr mC.oN a
IL-
-j
I .... .a
Y=
II I I ll I I I I,, �
¢
a
( Lu) ' 'Hid~a

I I I I I I I
IN100 (PM)
Load Control Tesat
649C ( 1I I / I I
200F)
a
LEGENDnax Stromef 7?S0IP3 965IPa
R=0.1
Long Crack 4.13
AeRB
B
3
A
A
,,,n, I
AK = Y AcYpos
IL _ I I I I I I
5
DELT K
Figure 4.14
(MPa )I
Summary of crack growth rates versus stress intensity factor range forIN100(PM) tested at 649C under nominally elastic fatigue conditions; stressrange was varied at R=O.1, Freq.=10 cpm. Two cracks are shown arrested atA' and B'.
151
LI
l)
c-
U
0
E
'L
-
I03U
10
10-
10-SUC1:ItU
100
_ __ _ _ _ __ __ ___ __ _ _ _
_ C ___ __
I e2a S
I
.-s
,alai
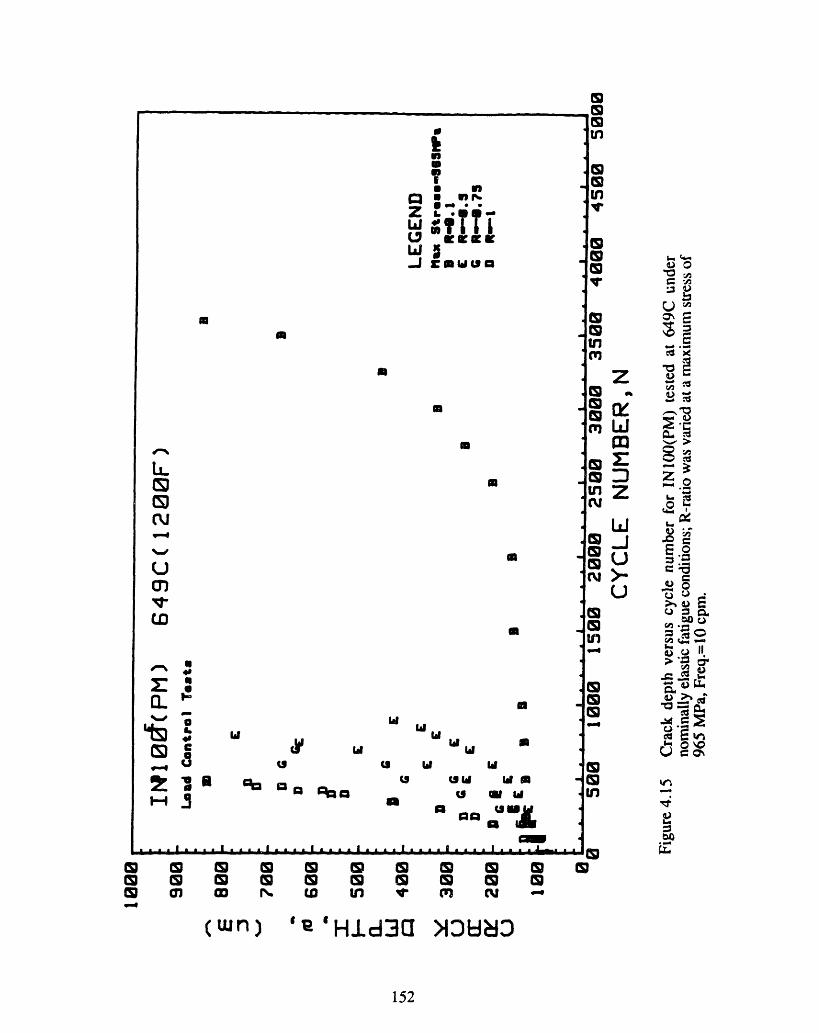
itaI
* ,
J gowan
Ua
a
U
U
U
U
U
I
WW
a
W Wi
W W
U w
a
wa OW w B
a 'S U cm a O W id
a
o -)b
inU,,1 Zo
m
'-.'
r~-I I. 2dUC
1
I-._
ua
to to LO to lb CD to to(W tHo c o H d a t
01 a r u In t v {m
(wn) ' ' Hd3t >I3::
152
IL
wa)Ni
(J
to
,LCL~
W9
a0
160
laif
a a
__ IY~~~~~~~M-- -
_J s - I LZ I __ _
I
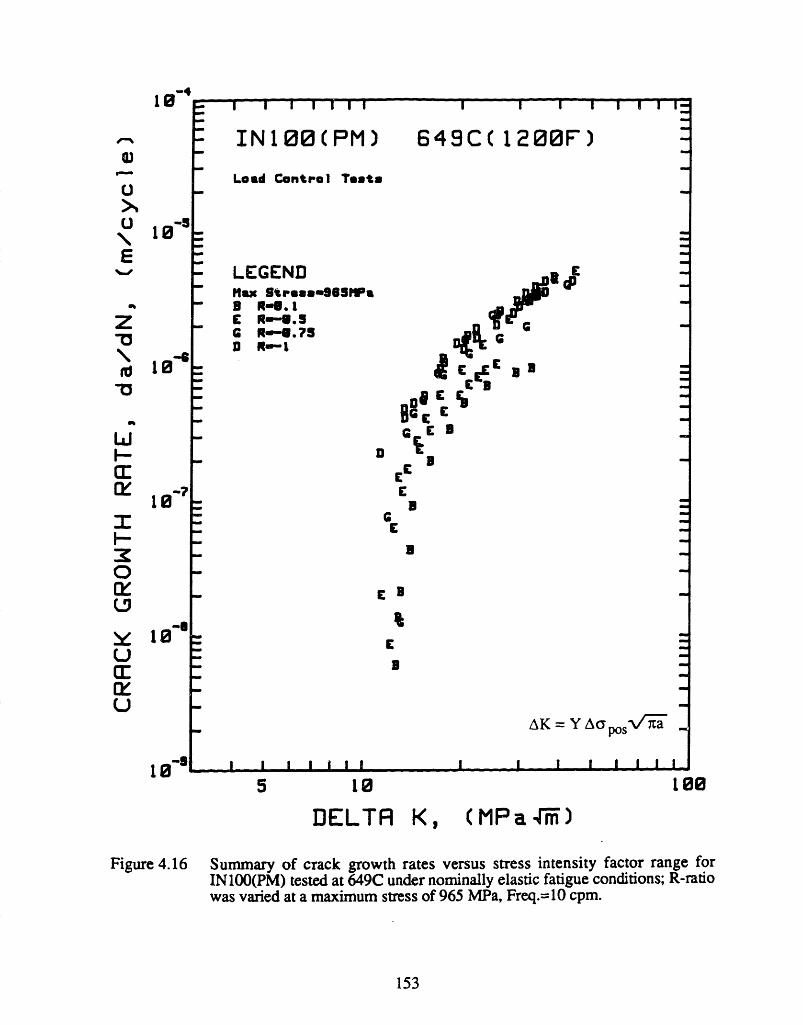
I I I I I I
IN100(PM) 649C( 1
I I I I I I I-
2 00F)
Load ControI Teats
LEGENDuax Strooog-9Se1p- 3 f-.
R, 1
C Rt-0.75D R-I GG a
!! C CDI
C.C 8
E
C
3
C
U
AK = Y aoposM /a
I I I I II
5 10
I I I I I I I
100
DELTA
Figure 4.16
K, (MPa ii)
Summary of crack growth rates versus stress intensity factor range forIN100(PM) tested at 649C under nominally elastic fatigue conditions; R-ratiowas varied at a maximum stress of 965 MPa, Freq.=10 cpm.
153
10'
-s
U
E
-z
0J
CrW1
-rI
0C:.
Ua:U
10
10'
10 '
10'
_
C · � -r ·- P - C L · _ ·
- 410 I
-5
I

·-. 4I I' 5 5 III I I I
IN100(PM) 649C (1200F)Load Control Texts
LEGENDMax Stremas965MPaB R-0. E R--8. G R--0. 75D R--I
E·D tED C
G
E B
a4'
BG
E
Bi
B
E
B
AK = Ya'l AaaVmaxI
r- a7ra= YKmax( - R)I I I I I I
DELTA
Figure 4.17
(MPa -')
Summary of crack growth rates versus the Walker- modified stress intensityfactor range (a=O.5) for IN 100(PM) tested at 649C under nominally elasticfatigue conditions; R-ratio was varied at a maximum stress of 965 MPa,Freq.=10 cpm.
154
10
U,
-
-(
-
a:OW
I0U
U:X
U
-710'
19'
1 0-95 1B 190
_ __
I - , _ - I _ - - -- -
Ila I I I I I I I I I I I I I
_
-a
10-
o
I I I I I I V
K,

4.4 Stress-Strain Response of Powder Metallurgy Gatorized® IN100 at649C
The elastic-plastic test conditions used in this investigation are given in Table 4.3
along with the bulk stress-strain response. It is the objective of this section to define and
discuss the stress-strain response of IN100(PM) at 649C subjected to fatigue cycling between
total strain limits at Rf = 0. This analysis is essential to representing the mechanical driving
force for fatigue crack growth under elastic-plastic conditions.
Monotonic Stress-Strain Response
The monotonic stress-strain response is shown in Figure 4.18. This test was
performed in strain control using the same specimen geometry and servo-hydraulic test
system employed for the fatigue tests. The strain rate was also similar to that used in the
fatigue tests (-0.3%/sec). The following measurements were made from the monotonic
stress-strain curve:
* Elastic modulus, E=210 GPa
* Elastic limit strain, Eo=0.5% (for £p C 0.01%)
* Elastic limit stress, cro=1050 MPa
* The 0.2% yield stress, ays=l 150 MPa
After the onset of yielding, the stress may be related to the plastic strain by the empirical
relationship generally attributed to Holloman [4.16], Ramberg [4.17] and Osgood [4.17,
4.18]:
a - 1432 P 3 6 (4.27)
155
where a is the true stress in MPa and ep is the true plastic strain (R2 =0.996). The monotonic
strain hardening exponent is 0.036. Also shown in Figure 4.18 on the elastic loading curve
are the maximum stress and strain ranges (indicated by arrows) imposed in the elastic fatigue
tests discussed in the previous section. The maximum stress range in the elastic tests was
+0.92ao.
Cyclic Stress-Strain Response
The cyclic stress-strain response of powder metallurgy IN100 at 649C is also shown
in Figure 4.18 where typical stabilized hysteresis loops are superimposed on the monotonic
response. These tests were performed in strain control with Re=O to approximate the strain
range ahead of a notch. A few salient features of the cyclic stress-strain response should be
pointed out: i) A total strain range of 0 to -0.6% is required to produce a minimum
measurable plastic strain range of 0.01%. This occurs after a monotonic plastic strain of
0.10%. It is often stated that the material near a notch may be treated as essentially elastic
after yielding and strain hardening on the initial uploading half-cycle. It is then considered
that similar bulk stress excursions should produce only elastic notch strains during
subsequent cycling and, presumably, LEFM could be used to predict fatigue crack growth
behavior. The results shown in Figure 4.18 illustrate that the validity of this approach is
limited to a total tensile strain range somewhat less than 0 to 0.6% for IN100(PM) at 649C,
ii) Also notable is the positive mean stress which occurs in the low total strain range
hysteresis loops. This mean stress tends to zero in high strain range tests.
Quantitative representation of the cyclic stress-strain response is required for
consideration of FCP under bulk elastic-plastic conditions. This can be achieved through
analysis of hysteresis loops such as those shown in Figure 4.18. Since these tests were
performed between limits of total strain, the simple continuous cycling loop can be broken
down into elastic and plastic components of strain range.
156

A£t= Age+ AEP= E + AEp (4.28)
where Act represents the total stress range of the hysteresis loops. In cyclic stress-strain
analysis it is customary to relate the total stress range to the plastic strain range. Total stress
range versus plastic strain range is shown in Figure 4.19 for a multiple step test and the
elastic-plastic FCP tests performed in this investigation. There is excellent agreement in the
stress response for these tests. If we compare the total stress range imposed in elastic FCP
tests to the total stress range response in elastic-plastic FCP tests, we find AGt in the elastic
tests (never yielded, A£p=O) is greater than the Ac t response in the low A£t elastic-plastic
tests where 0 < Ap < 0.03%. This regime is particularly important to notch relevant strain-
life behavior. The reduced flow stress, or Bauschinger effect [4.19, 4.20], is due to the back
stress which develops during yielding; it assists deformation in the reverse direction.
Consequently, the purely elastic strain range (Asp=O) available in the pre-yielded state is -1%
(i.e., ±0.5%), whereas in the post yielded state, the purely elastic strain range (A£p=O)
available is somewhat less than 0.6% (see for example test #GR20). Figure 4.19 is also
evidence that IN100(PM) at 649C obeys a combined isotropic plus kinematic hardening rule
such that the yield surface expands in stress space with increasing AEt and translates in the
direction of yielding with a reversal of the direction of straining [4.21, 4.22].
In terms of the total strain range, the stress-strain behavior may be expressed in terms
of the Ramberg-Osgood relation [4.17, 4.18]:
1
'£t= ~ Et+ (Atn (4.29)
where A and n are constants. Substituting for Act from Eq. 4.28 we have the more
frequently used form of this relation:
157

A( (= A A£p
where A is the cyclic strength coefficient and n is the cyclic strain hardening exponent. This
relation is the same as that used for the monotonic stress-strain behavior, Eq. 4.27. A
logarithmic plot of a (Aao) versus ep (AEp) yields a straight line as shown in Figure 4.20 for
both the monotonic and cyclic stress-strain response of IN100(PM) at 649C. The cyclic
stress-strain behavior may be represented by the following relation:
Aat= 6357 A a 14 9 (4.31)
where Act is the true stress range in MPa, Atp is the true plastic strain range and 0.149 is the
cyclic strain hardening exponent (R2=0.983). The drop from the general trend line of Figure
4.20b at very low values of A£p (-0.01%) is generally observed for RE=O tests [4.23].
158
(4.30)

W20.0o0
cq
Gn4
4'
U
vCLPl
C"
U
00c0OOO:
414
UW4 4
a ,-e c X4'~ .&K r, CDCal d_ _2: M Og
co 40410' - %
x M
XX
4.
;1
I ci
159
4'L.
4
cU~
-
a-
a. 0
0.
e.)0
8 8 8s,I i i
(eRd) saJJS

IN100(PM) 649 C (1200 F)
0 0
A
O
*
* Multiple Step Test
& Elastic-plastic FCP Tests
0 Elastic FCP Tests
0.15Strain Range
0.20(%)
Figure 4.19 Total stress rangeFreq.=10 cpm.
versus plastic strain range for IN100(PM) at 649C. Test
160
3000 -
2500-
2000
15001
1000-
cm
CD
u0
EaC
500
. -]
0.00 0.05 0.10Plastic
0.25 0.30
_ ___ _
I
sex I· ·_ I . . . . . .

IN100 (PM)
10 -3
Plastic Strain
Figure 4.20a Monotonic stress versus plastic strain for IN100(PM) at 649C.was -0.3%/sec.
Figure 4.20b
IN100 (PM) 649 C (1200 F)
* Multiple Step Test
A Elastic-plastic FCP Tests
.-, S1 _ ̂10 -3
10 310 -5
Plastic Strain Range
Cyclic total stress range versus plastic strain range for IN100(PM) at 649C.Freq. = 10 cpm.
161
649 C (1200 F)10000(
cl
u,
ru
1000
10-2 10 -1
Strain rate
10000
m
co
Cu
-,
1000
lI
I - -------- _ _ _ ___ ____ - __ ------ _ -- _ -- C ----
�
rl --- --- � - - -e -� -- �-------
--------- "-�
10 -4 10 -2

4.5 The Fatigue Behavior of Small Cracks in Powder Metallurgy Gatorized®IN100 at 649C; Elastic-Plastic Tests
As shown in the previous section, crack growth rates of small cracks (100 gm<a<l
mm) correlated with long cracks using LEFM and exhibited threshold behavior when the
maximum cyclic stresses were less than the elastic limit. AK and the Walker-modified AK
consolidated small crack growth rates for a variety of stress ranges and R-ratios. Anomalous
behavior was not observed under elastic fatigue conditions.
At this juncture, the focus of this thesis turns to the fatigue crack growth behavior of
small cracks in IN100(PM) under elastic-plastic conditions. Fatigue critical regions of turbine
disks are often associated with notch configurations, such as bolt holes and blade
attachments, where cracks initiate and propagate under elastic-plastic cyclic conditions. The
defect tolerant approach to turbine disk life extension must consider crack growth under these
conditions. The elastic-plastic test conditions used in this investigation are given in Table 4.3
along with the bulk stress-strain response. Since the notch configurations in fir-tree
attachments may experience strain ranges on the order of 0.8%, the strain ranges employed in
these tests were targeted around this value. In these tests AEt ranged from 0.6% to 1.2% and
Aep ranged from 0.01% to 0.13%. All tests were performed with RE = £min/Emax = 0 to
approximate the conditions shown in Figure 1.4.
Before exploring crack growth rates under these conditions, we should first consider
the strain-life behavior of smooth specimens of INlOO(PM) tested in total strain control at
649C. Total strain range versus cycles to a 5% stress range drop is shown in Figure 4.21 for
continuous cycling tests (20 cpm) and 900 sec. tensile strain dwell tests [4.23]. The
continuous cycling tests resulted in a 10,000 cycle life at the target strain range of 0 to 0.8%,
whereas a 900 sec. tensile strain dwell reduced life to 4,000 cycles. The tensile strain dwell
tests are more relevant to turbine disk operating conditions (see Figure 1.4). Due to the
162

necessity of limiting the scope of this investigation, only one strain dwell test was performed.
It should be recognized that cyclic life presented in Figure 4.21 represents both crack
initiation and crack propagation.
It is the objective of this section to analyze crack propagation rates for small cracks in
IN100(PM) at 649C under elastic-plastic continuous cycling conditions and to attempt
correlation of crack propagation rates using EPFM parameters. Since EPFM may also be
applied to the elastic tests, their crack growth rates will be compared to the elastic-plastic
tests. First we will look at using LEFM to attempt a correlation of the elastic-plastic data.
Stress Intensity Factor Range
The stress intensity factor range based on LEFM is obviously not valid for correlating
fatigue crack growth rates when bulk plastic deformation occurs in each cycle. However, it
serves as an interesting demonstration to view the results of crack growth rates versus the
stress intensity factor range as shown in Figure 4.22, where AK is calculated according to:
AK = 0.73 Apos = 0.73 maxV (4.32)
Crack growth rates vary by a factor of -25 at constant "AK". It is not surprising that a
parameter based on the maximum stress is not a sensitive representation of the mechanical
driving force for crack extension under elastic-plastic conditions. Although the total strain
range varied by a factor of two and the plastic strain range by a factor of 13, the maximum
stress varied by only 8%. This can be explained by the low monotonic strain hardening rate
as illustrated in Figure 4.18. Uploading to the maximum strain limit on the first fatigue cycle
follows the monotonic stress-strain curve and the hysteresis loop which develops on
subsequent strain reversals maintains nearly the same maximum stress throughout testing
since IN100(PM) is cyclically stable at this temperature.
163

Comparison of Elastic and Elastic-Plastic Tests in Terms of the Stress Intensity Factor Range
It was suggested that the tendency for crack growth rates to increase with increasing
total strain range in Re=0 elastic-plastic tests may be attributed, in part, to the increasing
component of compressive stress range experienced in these tests [4.24]. To explore this
possibility, a number of elastic tests were performed in load control with cmax=0.9 2 ao and
Ro-ratios approximately equivalent to the stress ratios observed in the strain control tests. As
discussed in Section 4.3, these elastic tests exhibited increasing crack growth rates with
decreasing R-ratios. The increase in crack growth rates were unambiguously attributed to the
increasing compressive stress range in the elastic tests.
In Figure 4.23 through Figure 4.25, crack growth rates versus AK for elastic-plastic
tests performed in strain control are compared to elastic tests performed in load control where
the stress ratios were approximately the same in each case. Surprisingly, there is excellent
agreement in crack growth rates in spite of the fact that AK is not theoretically applicable to
elastic-plastic conditions where Aep is non-zero. We may speculate that the observed
correlations may be attributed to the dominant role that the compressive stress-strain
excursions play in promoting faster fatigue crack growth rates. Values of plastic strain range
in the elastic-plastic tests shown in Figures 4.23, 4.24 and 4.25 are 0.015%, 0.06% and
0.07%, respectively. Although these are significant plastic strain ranges, the elastic strain
ranges are dominant and represent greater than 94% of the total strain range in every case (see
Table 4.3). It is not possible to give a definitive justification for the observations made in
Figures 4.23 through 4.25 from the current experimental base.
The Walker-modified stress intensity factor range could not consolidate fatigue crack
growth rates for IN100(PM) under elastic-plastic conditions.
164

Pseudostress Intensity Factor Range
As discussed in Section 2.4, Solomon [2.52] successfully employed a pseudostress
intensity factor range to correlate fatigue crack growth rates under elastic-plastic conditions.
The pseudostress intensity factor range was defined as:
APK= YEAtVfa = YE(Ae+ A p)V- (4.33)
where EAEt is the pseudostress (see Figure 2.15). APK is in fact a strain intensity parameter.
Note that it includes the total strain range. Multiplication by the elastic modulus simply
results in units of stress5. Calculation of APK for IN1OO(PM) at 649C was carried out
using the following expression for elastic-plastic tests:
APK = 0.73 (210000 MPa )Ae V£ti (4.34)
where APK is in MPa-mi and a is in meters.
A summary of crack growth rates versus APK is shown in Figure 4.26 for the elastic-
plastic tests. The consolidation of the data in terms of APK is excellent, particularly for the
data where A£t<l.1% (A-p<0.07%). Crack growth rates for the A£t1=.2 % (A£p=0.13%)
test condition are somewhat higher by a factor of -2. The excellent correlation may be
attributed to the inclusion of ACt in APK. As with the Walker - AK parameter, the inclusion
of a total strain range factor accounts for the role of the compressive stress-strain excursion in
each cycle.
As will be shown in a later section, fractographic evidence suggests that the
mechanism of crack advance is similar under elastic and elastic-plastic fatigue conditions.
Therefore, it is reasonable to postulate that the bulk compressive stress-strain excursion
increased crack growth rates in manner similar to that observed for the elastic tests.
165

The test condition A£t=1.2% (A£p=0.13%) may represent strain range conditions
where the bulk plastic strain range is beginning to dominate the crack tip conditions. If we
look back to the strain-life curve of Figure 4.21, we see that A£t=1.2% represents a
continuous cycling life of -1000 cycles and 900 sec. tensile strain dwell life of -250 cycles.
This total strain range exceeds that which would be permissible in design of a disk notch
configuration.
The pseudostress intensity factor range may also be applied to the elastic tests
discussed in the previous section. Since Act = Ave, APK may be calculated as:
APK = 0.73Aa Vt (4.35)
A summary of crack growth rates versus APK is shown in Figure 4.27 for the elastic tests.
Crack growth rates for Ra < 0 tests agree within a factor of two. A higher crack growth rate
is observed for R = 0.1 tests at low values of APK (<20 MPa4Im). The explanation for this
behavior is not obvious. Physically, crack tip plastic strain reversal occurs in Rc > 0 tests
only by elastic unloading of the specimen. The extent of crack tip strain reversal is limited by
crack closure. In Ra < 0 tests, crack closure is overriden by the bulk stress-strain excursion
causing greater crack tip strain reversal.
A summary of crack growth rates versus APK is shown il. Figure 4.28 for both
elastic and elastic-plastic tests. There is excellent agreement between the elastic. plastic tests
and negative Rr-ratio elastic tests. The pseudostress intensity factor range is potentially an
appropriate parameter for defining the mechanical driving force for crack growth from a
notch. A small fatigue crack initiates and grows from the elastic-plastic field of the notch into
a decaying strain range which is nominally elastic. APK can correlate crack growth rates
under both conditions since the AEp component of AEt simply diminishes. There is no need
166

for using one parameter for elastic-plastic fatigue conditions and another for elastic fatigue
conditions.
Equivalent Stress Intensity Factor Range
Starkey and Skelton [2.54] proposed expressing the damaging strain range in an
elastic-plastic fatigue cycle as Ap + qoAe, where qO is the fraction of the stress range over
which the crack was open (usually 0.5<qo<l). Multiplying this strain range by E yields an
equivalent stress range, Aaeq (see Figure 2.16). The equivalent stress range can be used to
calculate an equivalent stress intensity factor range as:
AKeq = YE (A p + q oA%)e) (4.36)
where AKeq is in MPa4-T and a is in meters. AKeq is, in fact, a strain intensity parameter.
Multiplication by E simply converts the units to MPa4-i. If we compare AKeq to APK, we
find both parameters include Aep, but AKeq includes only a fraction of the elastic strain range.
Calculation of AKeq for IN100(PM) tests at 649C was carried out using the following
expression for both load and strain control tests.
AK = (0.73){(21 0OOOMPa )A£p + A }pos}7 (4.37)
where AKeq is in MPam and a is in m. In the above equation, the positive stress range,
Apos, is substituted for EqoAe which follows from the assumption that crack opening
occurs at zero load. Here Aapos is used because Ae was not symmetrical about zero load in
these experiments.
A summary of crack growth rates versus AKeq is shown in Figure 4.29 for elastic-
plastic tests performed in strain control. The consolidation of the data is poor with crack
growth rates differing by a factor of 20 at constant values of AKeq. This is a good indication
that ignoring the compressive component of Ace in calculating the mechanical driving force
167
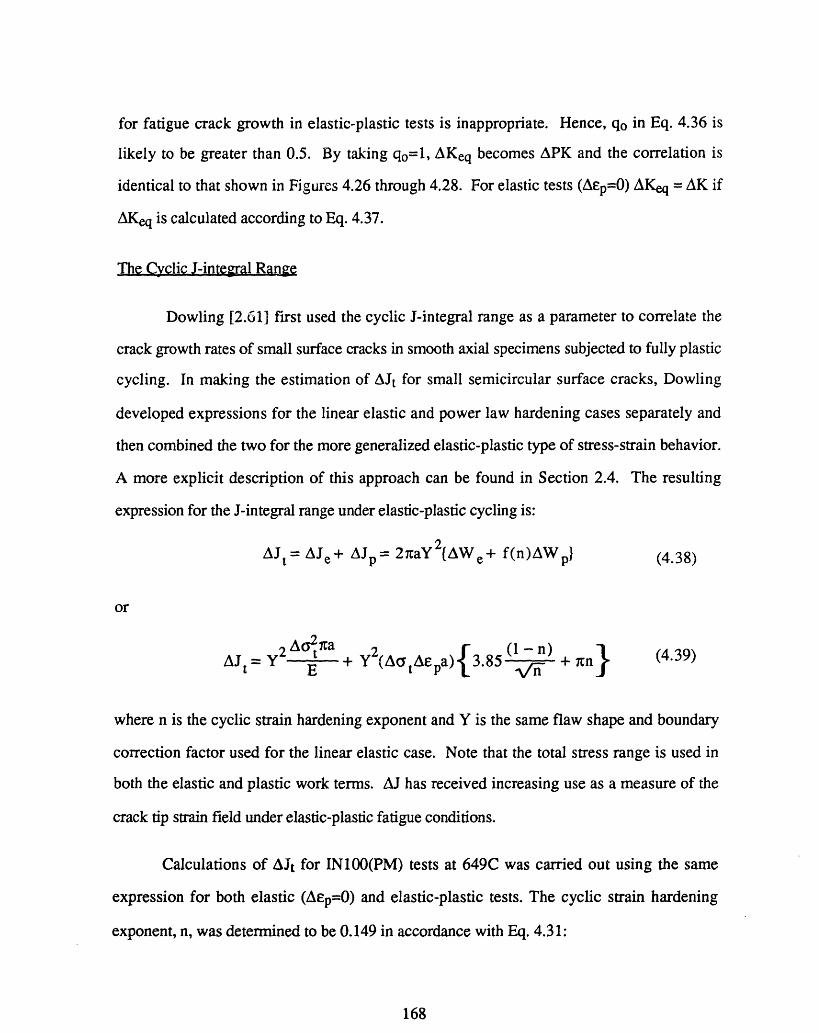
for fatigue crack growth in elastic-plastic tests is inappropriate. Hence, qO in Eq. 4.36 is
likely to be greater than 0.5. By taking q0=1, AKeq becomes APK and the correlation is
identical to that shown in Figures 4.26 through 4.28. For elastic tests (Aep=O) AKeq = AK if
AKeq is calculated according to Eq. 4.37.
The Cyclic J-integral Range
Dowling [2.61] first used the cyclic J-integral range as a parameter to correlate the
crack growth rates of small surface cracks in smooth axial specimens subjected to fully plastic
cycling. In making the estimation of AJt for small semicircular surface cracks, Dowling
developed expressions for the linear elastic and power law hardening cases separately and
then combined the two for the more generalized elastic-plastic type of stress-strain behavior.
A more explicit description of this approach can be found in Section 2.4. The resulting
expression for the J-integral range under elastic-plastic cycling is:
AJt= AJe+ AJp= 2iaY 2 AWe + f(n)AWp} (4.38)
or
AJ = y 2 (A t, a) 3.85 + n} (4.39)
where n is the cyclic strain hardening exponent and Y is the same flaw shape and boundary
correction factor used for the linear elastic case. Note that the total stress range is used in
both the elastic and plastic work terms. AJ has received increasing use as a measure of the
crack tip strain field under elastic-plastic fatigue conditions.
Calculations of AJt for IN1OO(PM) tests at 649C was carried out using the same
expression for both elastic (Aep=O) and elastic-plastic tests. The cyclic strain hardening
exponent, n, was determined to be 0.149 in accordance with Eq. 4.31:
168

AJt= 7.972 x 10- 3 A2a + 47.72'( AtAe£pa) (4.40)
where the units are: Act in MPa, a in meters, Aep in % and the resulting AJt in kPa-m.
Crack growth rates versus AJt are shown in Figure 4.30, 4.31 and 4.32. The
consolidation of crack growth rates with AJt is excellent for both elastic and elastic-plastic
fatigue conditions. Note that AJt includes the total stress range and thus accounts for the
compressive stress-strain excursion as did APK. In fact, the consolidation of crack growth
rates with AJt is nearly the same as that seen for APK in Figures 4.26, 4.27 and 4.28.
Additionally, there is an equivalent correlation in terms of AKeq when qo=l, that is when
AKeq=APK.
Starkey and Skelton [2.54] have shown that Tt can be related to AKeq b)
2AKeq (4.41)
AJtC- E
and when q=l
AKeq = APK = YE Ae t/ (4.42)
Substituting Eq. 4.42 into Eq. 4.41 and rearranging
AJ ta-= r (4.43)
AE2
The ratio, r, was calculated and found to be nearly constant for all tests as shown in Table
4.4. For the elastic tests, r is constant and is equal to 35 from the definition of AJe. For the
elastic-plastic tests, r ranged from 35.61 (A£t-=0.63%) to 37.85 (Aet=1.23%) and is nearly
equivalent to the r-value in the elastic tests. If we compare the columns Aep/A£t to AJp/AJt in
Table 4.4, we find that the plastic component of APK ranges from 1.6% (AEt=0.63%) to
169

10.6% (A£t=1.23%) and that the plastic component of AJt ranges from 4.4% (At--=0.63%) to
25.1% (A£t=1.23%). The fractional plastic component of AJt is -2.5 times greater than that
for APK in every case. The plastic component of the crack driving force is seen to increase in
its contribution to the total as tAp becomes larger. In the disk relevant strain-life regime,
where AEp must be very small, the success of AJt and APK in correlating crack growth may
lie, not so much in the ability to account for the inelastic strain range, but in the ability to
account for both the tensile and compressive components of the total strain range. This
postulate has been discussed in previous sections with respect to AK - Walker and APK.
The importance of including the total stress-strain range in the calculation of AJ can
also be demonstrated. Based on the assumption that only the positive portion of the
hysteresis loop contributes to crack growth, R6ger et al. [2.64, 2.65] substituted the positive
stress range for the total stress range in calculating AJ*. The resulting J-integral range may be
expressed as:
Aj, = y2 Aposna ' { (1-n) (4.44)AJ* = 2Y 7 + Y2(ApOsA£pa) 3.85 } (444)
Crack growth rates versus AJ* are shown in Figure 4.33 for the elastic-plastic tests. The
consolidation of crack growth rates is poor compared to that obtained using the total stress
range as shown in Figure 4.30. This further corroborates the theme that the total stress-strain
range must be used to express the mechanical driving force for crack growth under elastic-
plastic conditions.
170

INI00(PM) 649C (1200F)
03 N-
L1J1 I IIIJI102
L 1 11111
103 104
Strain control, Re=0O Continuous cycling (20 cpm)O Tensile strain dwell (900 sec)
105
Cycles to 5% Stress Range Drop
Figure 4.21 Total strain range versus cycles to a 5% stress range drop for IN100(PM)tested at 649C under continuous cycling and tensile strain dwell conditions,Ref [4.23].
171
2.2
1.8
1.4
1.0
0.6
C:
I._
-
0.2
106
r C- I II
\ -L I
I
I -I I I- I I ---- L-1 I I I I I I

5 U I I IIII I II I
IN100 (PM) 649C( 1200F)Strain Control Tt
LEGEND0 to .6X*- to .8XX a to .OXZ to 1.2XP -. 552X to .S5X
It
,X
r
I
00
o o00
0
0
0
AK = Y Aposa
I I I I III
5I I I I I I I
18 0088
DELT K,
Figure 4.22
(Mpa ir)
Crack growth rates versus stress intensity factor range for IN100(PM) testedat 649C under elastic-plastic fatigue conditions; total strain range was varied,Freq. = 10 cpm.
172
O-
UE
%V.
-5180 z
_ zz2z-kx
#xxCo*0
Zb
IV
i¢~
or
I.-
0W>
(.9
UUU~
18- 8
10-'
III ........
I ___-_ ___ -___ _- I
I I I I I I I I I I I I I I'
-
.
)
.-7
I

I I I I I II
IN100(PM)I I I I I
649C (1200F)Straln v Lod Control
LEGENDSWRSIN CTROL
Tot.l (e LtitAt)* a to O.IX (I,.ISX
LOR CTROL£C iS3IP (R-. 5)
c
e ,w
E C,
£ .e £
EE CEE
E
E£
C-
t
t
£
C
E
AK = Y O p s
- I I I I I
5 18
DELTR K
Figure 4.23 Crack growth rates versus stress intensity factor range for IN100(PM) testedat 649C under elastic and elastic-plastic fatigue conditions; R = -0.5 in bothcases, Freq. = 10 cpm.
173
-410
0,
0
U
E%_0
-5
z
-0
FL
a3U
1 0-U
U
IB"1 I
I
1800
_ __ ___ _ ____ __ ________
_ __ I
I I.
I I I I L t_ I _
( MP a -TM-)

I - I I I T
IN100(PM)I I I I I I
649C( 1200F)
Strain v Lod Control
LEGENDsr RIN CONTROL. Total A (Pt ot IcA£)X to 1.X (.X)
LORD CONTROLG S65IPa (R-3. 75)
X G
x%
xxX XXG
pI
X
G
C
C
AK = Y Q spos
I L I I I I I
5I I I I I I I I
18 100
DELTR K
Figure 4.24
(MPa 4-i )I
Crack growth rates versus stress intensity factor range for IN100(PM) testedat 649C under elastic and elastic-plastic fatigue conditions; R- -0.75 in bothcases, Freq. = 10 cpm.
174
I - _4IV
-510
I-
f.
U)
0
0>mU
E
-a
fd-0
-
LU
H
IH
030U/UC:[Y:U
10'
10-?
10- 8
10 'e
.....~__~~ ~ ~ ~ ~~~~~~~~~~~~~~~~~~~~~ _ _ _
u _ _ L I __ s_ R WL- -
_ _ _II _
I
m

I I I_ lii I_ I_ I _ 1 1
IN100 (PM) 649C ( 1200F)Strmln v Laod Control
LEGENDnTRIZN CONTROL
Total Ae Pl atI cAe)P -. 5S to .52 (t. lX)
LORD CONTROL985Pa (RR-I.8)
PP
DP
P
DO
pIP (
lb%
AK Y AVipos
I I I I III
5
I I I I I I I
100
DELT K
Figure 4.25
(MPa 4i)I
Crack growth rates versus stress intensity factor range for IN100(PM) testedat 649C under elastic and elastic-plastic fatigue conditions; Ra = -1.0 in bothcases, Freq. = 10 cpm.
175
1 0 '
-6
03
0
U
E
-
c:HI0
U
U
10'
10-7
10 '8
10' s _ ,· _J · _· ' ,,
I I I I I I I I I I I
m

5 10
DELTA PK,
Figure 4.26
(MPa 4iE)
Crack growth rates versus the pseudostress intensity factor range forIN100(PM) tested at 649C under elastic-plastic fatigue conditions; total strainrange was varied, Freq. = 10 cpm.
176
-z
I
I
1
1
1
1
100

5 Ba10
DELTR PK
Figure 4.27
(MPa thm )I
Crack growth rates versus the pseudostress intensity factor range forIN 100(PM) tested at 649C under elastic fatigue conditions; total stress rangewas varied, Freq. = 10 cpm.
177
m
0
IX
!:
Ua:O
OU
1
1
1I
II
II e00
.

I I I I I I I
- IN100(PM)I I I I I I I-
649C( 1200F)Strain v Lod Control
X-
X -LEGENDIrTfIN CONTIROL. Totml AE (Pli aticO a to I.6X (l.l2X)* a to . OX (.8t15X)X a to .eX C.9s6X)2 a to 1.2X (8.3X)P -,.SSX to U.5SX (.1
LOAD CONTROLR 7356e9 (Rm. 1)3 56519. (R1. 1)-C 7Snu (R-I)D 9JSp65 (R-0 )
E SSNPs (R-i. S G 865uW (RI-8.75)
C
;Op*
C
Rue r'R O 000
:
3 c
E
3
APK= Y E Aeti
I I I I I I I
5 10I I I I I I I
18800
DELTR PK
Figure 4.28
(MPa 4FJ)
Summary of crack growth rates versus the pseudostress intensity factor rangefor IN100(PM) tested at 649C under elastic and elastic-plastic fatigueconditions; Freq. = 10 cpm.
178
a)
U
U
E_s.
108-
z-o
'U
-o
¢fU:H_
I3:0
U
UW1
10'
! 0
108'
C __ - _ - II _ ___ __,_r_
J I ·r ·I· · · r'-I.L _ -- - --
77 Z -
I
r
-7
-
-I
In

I I I I I II I I I I I I Il
IN100(PM) 649C( 1200F )Strain Control Tests
zz- LEGEND
. Total A£ (PlasticAei- 0 to S.AX (.81 )
* a to B.8X C.l81X) X a to 1.Ox (M.MX) P_ o _ .~ _ u_ ._s Z to I.xX . 13XJ - XP -. sX to ,.sSX C.,'PI ,X,
- P
.1*P #,5
0 mik *0O
00
O0 80
00
0
xxX *0*
X
w
0
AKeq = YE(A£p + qA£E
I I I I I II
S
I I I I I I
10818
Figure 4.29
DELTR Keq, (MP a 47i)
Crack growth rates versus the equivalent stress intensity factor range forIN100(PM) tested at 649C under elastic-plastic fatigue conditions; total strainrange was varied, Freq. = 10 cpm.
179
-410
10'
10
_
)s
aUU
6%Ez~0
to
I-
Wa:WixIH0U
U
-I
-
10.-
1 a-"
10
- r -T -C -- - -�r C -· -- J I_ C ',
C I · �' -a-L
_o
-
I I

I I I I I II
IN100(PM)I I I I 1 I l I
649C ( 1200F)Straln Control Tests
LI
xz
Pw
-
8-
EGENDTotal A£ (P1 asticE)* to .6X CI.t16)O to .1X (9.813X)8 to 1.OX C(.IgX)8 to 1.2X (8O.13)
-6.35X to .SSX (C.7?X)
ZZ Z
- 2Zz XX
OP
AJt =Y2 Ao2 a +
I I I I I 1111
1
y2 (A Aepa) 3.85 +
I I I I I I I II
L0
DELTR J,Figure 4.30
(KPa x m)
Crack growth rates versus the cyclic J-integral range for IN100(PM) tested at649C under elastic-plastic fatigue conditions; total strain range was varied,Freq. = 10 cpm.
180
.la
a)
U
U
E
I I I-
-s10
z-oId
'0
O:
W11
J~P
* o*0 0a
00
l 0- eUCc
U
0.1
}
I I I
5a
I_ _ __ _ ____ _ _ ___ __ __
-1 ------ ---C - I -- --- --- --- --- -- ----
2 4
mu
l 0_

A
DELTR J,
Figure 4.31 Crack growth rates versus the cyclic J-integral range for IN100(PM) tested at649C under elastic fatigue conditions; total stress range was varied, Freq. =10 cpm.
181
a OM-4
U)
U
E
-0
Li
a:
I3:I-
oU
L)
1e
10'
leaw. .I
(KPa x m)
Jto
l l
I

C-
Ca 1 '-\ 10E
zU
M 1 aIv --
Li
a:
0r
10U
I m ' 5
'C
I I I.
IN100(PM) 649C(1200F) :Straln v Load Control
LEGEND_-- , ~~~~~~~~z .- TIrN CONTROL. TotleE (tPla tICE)
-0 to .6X (B.IX)I a to .X c(.ISx)
X I to l.OX (MO.X)Z 8 to 1.2X ¢.13X)P -. as ka o. Rsk t. t7k]
LORD CONTROL-R 73UFWS CRm. I ]B 6SPa (R-. 1)C 76W1P (Rr-I)
_ a D9SI11 (R-I)G 951u9 (R-. 7,- 91 SIWU (R-GI
R O % c
o0
~ 0s =0
_ps CiiB
LJ t =Y Ea + Y (ai pa) {.3.85 ( nI I I I I I I 1 11 11 I I I. !
0.1 n 1 l0 50
DELTR J, (KPa x m)
Figure 4.32 Summary of crack growth rates versus the cyclic J-integral range forIN100(PM) tested at 649C under elastic and elastic-plastic fatigue conditions;Freq. = 10 cpm.
182
........ _ _ _ _ _ _ I ! I I __ C_ __- I I I I I I I I - r - I 11 r t 117 I
.,

P"4- S I * .. * .1.1. I * I -. *
IN100 (PM)
Strain Control Tests
EGENDTotal A£ (Pl tlcAe)a to .g~ (U.13X)a to .AX MU.OMl)a to .OX (O.UX)a to .2X (.133X)
-. sSX to .SVX (.7
M. £FX
P
0 ## t0 0
0
o I8 °00
0 OO
AJ* = y2 posaE +
I I I I I I III
1
O
0
2 42
I:z ix1it*
X
0
0
0
Y2 (Aos£pa ) {3.85 (1 -n)I I I aI I I 11
l0DELTR
Figure 4.33 Crack growth rates versus the positive J-integral range for IN100(PM) testedat 649C under elastic-plastic fatigue conditions; only Aapos was used tocalculate aJ, Freq. = 10 cpm.
183
oi
U
Ev
649C( 1200F)
10 - s LI
_o_ 0
x- Z
P
X
2
Xx
mefezZ
-
IT-
0LD
l8' 8U
U
L0_'0.1J.
+ in}I I
50
(KPa x m)
_ I I r_ s I r eI I I I II . - .
1Ll I I I I I I I I I I I I I I I
-
I

,- t ' - 0 -C-00--0ttit i t4; v i n' t
0000000
N 0\6 C)r 0o 00 £l wi cr cr i0N N r ,... ¢.q
0000000
-" -- C O tn - t
cl W C 0 \6 Xci0\0Lr-N
0000000
0000000n t - _ m O £oN- N a o m t % ON t-\0o O
6 66 . . . .O 0 0 C
eN 0 O O r o X o M M .t oN00 C TT \0
I- I_ _4 _*41-
\,o M 0% o N m1: 91: P4 9 q^ ^^~'0000%0%'r .CP3 P tY 3 Xa X3 Cc--- -- ~
oO n ON ~o i O "\8 \8 O c w oo O
i r; tl v6 m mm mmm m b M C
000
600 O
00 -4 (yI k , 00
) O 6
r-£ o _N N 4O -. . .O r tel 14
c 0 00 %,sO N c C m " t_ _
6 ~'. ti4r,
'I 00 ) 00 CA
C .
C 4 CCY) 00 00 --4t c r cClf t C) C4
=0 N £c m r N 00 O~ eer ~~\0'f 00 00 N ~n e, 0o oo oo6 66 _ in _ \ O M e0000-006666666
M CO O Of CC O Pto m tn ocow
\'000000_0 o000(= oo66664466M oN o o 6 * . .~ . .4 6
"It O W) crO CN t) l -
Cf '.0 o C41-4 0 %4 C4 C
-00 \m Vo
N - 4
0- tt8 G ' ·c e&! 23 C3 04 Wc00c00
184
uON
z
Cuv4-
Ce
Po
z;Lo
Cu(M
0
0
"t ;0;Qu
6-a
c,Y _
W70:ca
E0u
C
,b
0
)~
)I
LI
I
cI:(A.0
4
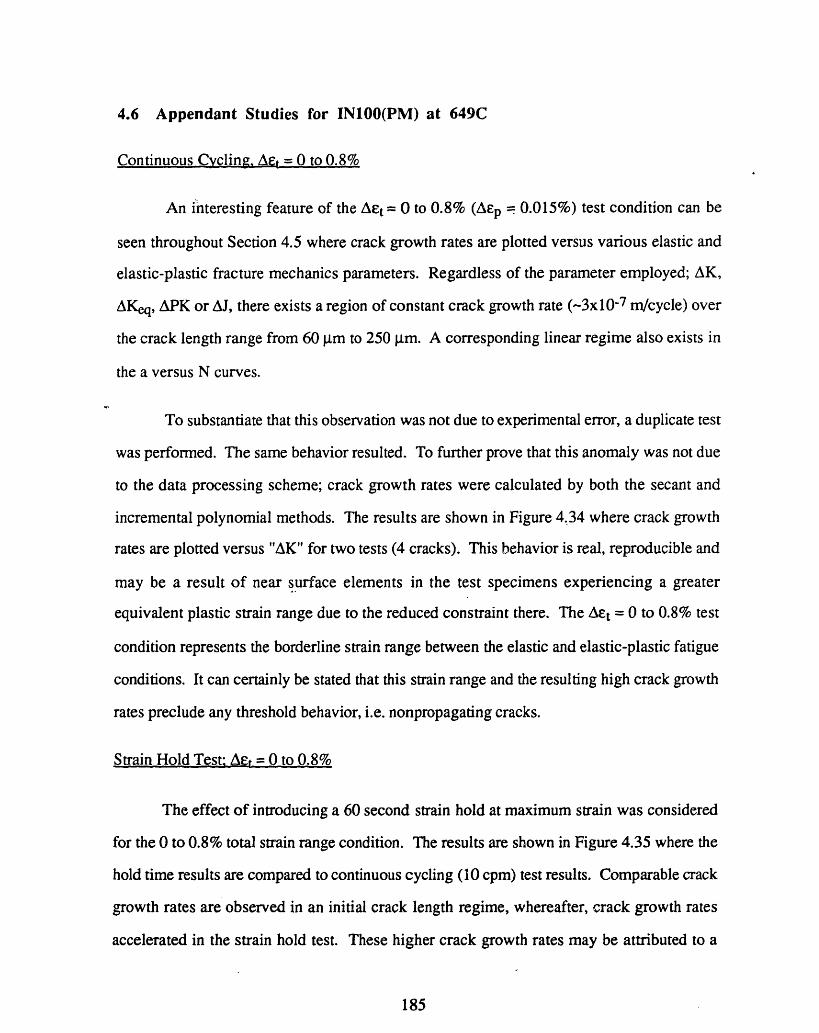
4.6 Appendant Studies for IN1OO(PM) at 649C
Continuous Cycling, Aet- 0 to 0.8%
An interesting feature of the Act = 0 to 0.8% (AEp 0.015%) test condition can be
seen throughout Section 4.5 where crack growth rates are plotted versus various elastic and
elastic-plastic fracture mechanics parameters. Regardless of the parameter employed; AK,
AKeq, APK or AJ, there exists a region of constant crack growth rate (-3x10 -7 mn/cycle) over
the crack length range from 60 gm to 250 gm. A corresponding linear regime also exists in
the a versus N curves.
To substantiate that this observation was not due to experimental error, a duplicate test
was performed. The same behavior resulted. To further prove that this anomaly was not due
to the data processing scheme; crack growth rates were calculated by both the secant and
incremental polynomial methods. The results are shown in Figure 4.34 where crack growth
rates are plotted versus "AK" for two tests (4 cracks). This behavior is real, reproducible and
may be a result of near surface elements in the test specimens experiencing a greater
equivalent plastic strain range due to the reduced constraint there. The Act = 0 to 0.8% test
condition represents the borderline strain range between the elastic and elastic-plastic fatigue
conditions. It can certainly be stated that this strain range and the resulting high crack growth
rates preclude any threshold behavior, i.e. nonpropagating cracks.
Strain Hold Test: Aet = 0 to 0.8%
The effect of introducing a 60 second strain hold at maximum strain was considered
for the 0 to 0.8% total strain range condition. The results are shown in Figure 4.35 where the
hold time results are compared to continuous cycling (10 cpm) test results. Comparable crack
growth rates are observed in an initial crack length regime, whereafter, crack growth rates
accelerated in the strain hold test. These higher crack growth rates may be attributed to a
185

greater environmental degradation occuring in the longer cycle period (66 seconds versus 6
seconds).
Alternatively, the higher crack growth rates may have resulted from the higher value
of plastic strain range (0.025% versus 0.015%) due to stress relaxation in the strain hold test.
Higher values of crack growth rates were observed for higher values of tAp when results
were evaluated in terms of AK as shown in Figure 4.22. Even reater environmental
degradation and stress relaxation would be expected in actual turbine disk service.
Crack Growth from Intrinsic Microporosity
Crack initiation was observed at intrinsic pores, particularly when the elastic limit (o
= 0.5%, ao = 1050 MPa) was exceeded. A typical pore initiation site is shown in Figure 5.2.
Crack growth rates were measured from surface and near surface pores in a number of
smooth test specimens.
Typical results are shown in Figure 4.36 where crack growth rates for Aet = 0 to
0.8% test condition are plotted versus AK for both crack initiation at pores (aO = 10 gm) and
laser defects (aO = 60 gim). The maximum strain exceeded Eo by 60% and the peak tensile
stress exceeded ao by 9%. Here again, there is an absence of threshold behavior in the
presence of very small values of cyclic plastic strain. This is in contrast to the apparent
threshold behavior depicted in Figure 4.14 for cyclic stress ranges as high as 92% of ao.
Crack growth rates from pores merge with results from laser defects as cracks become larger.
186

· ."4
I)
U>U
E
to
O:0
ML
t9
5 10
DELTRA
Figure 4.34
K, (MPa 4i)
Crack growth rates versus AK for two elastic-plastic tests at t = 0 to 0.8%.Crack growth rates were determined by both the secant and 7-pointpolynomial technique.
187
100

- I I I I I I I -- -I I I I I
IN100(PM)
LEGEND
* GN? H Of se held
649C( 1200F )
H (1_H 1 dIPNW)
HH H .._
H0*oap* *
H 4
00
q)
H
AK = Y A pospos
I I I I I I I
5I I I I I I I I
10
DELT K
Figure 4.35
(MPa 47)I
Crack growth rates versus aK for elastic-plastic tests at aEt = 0 to 0.8%.Comparison of continuous cycling data (10 cpm) with 60 sec hold atmaximum strain data.
188
i I-4& W
a3
UU
>S
ftz
ILi
C-0U
108
10-
lo-|
1C '
100
CI F _
- -s I I--- -Is
1 .w w w
m

: IN10O(PM) 649C ( I -I IT I I i
26F)
ltraln lefln g toe .O
LEGEND* Lasero Pere
m
I
00
e ,
0
0
a0
t
8
1 I I I I I
5 IsI I I I I I I I
100
DELTF K
Figure 4.36
(MP a 4)
Crack growth rates versus K for elastic-plastic tests at aEt = 0 to 0.8%.Comparison of crack growth behavior from pores to that from laser defects.
189
10'IG
-
U
U
I-
:k:
1 a-4
18-7
1 49
I(31-yU
a 'l
� �· -r-- �-- -- rI E · · ·E . . . . . ... . ..
- · m · I · I
�- I- -- --- lr -- -- �I
-
I

4.7 Fractography
Waspalov at 427C: Elastic Fatieue Conditions
Small crack fatigue tests were performed on Waspaloy at 427C under elastic
conditions using the specimen geometry shown in Figure 3.4 (cylindrical gage section).
Macroscopic fracture surface features are shown in Figure 4.37. The shape of cracks at the
termination of high temperature testing was evident on fracture surfaces as a result of heat
tinting. Cracks of different sizes were present in the same specimen due to the variability in
the number of cycles required for initiation from the laser defects. In some cases, one or
more cracks may have arrested. Careful measurements of surface crack length and depth
indicate that the crack shape was approximately semicircular (c/a 1) and independent of
crack depth. The fracture path is nominally perpendicular to the specimen axis with the
exception of near-surface regions beyond a surface crack length of -800 gm where the crack
deflects out of plane. This was suspected to be related to the curvature of the specimen
surface. Consequently, the specimen geometry was modified (Figure 3.5) to include two
flats from which cracks were initiated. This solved the crack deflection problem. The crack
deflection is believed to have caused slight deviation from c/a = 1. Although accounting for
this slight change in crack geometry is tractable, it did not manifest itself in the crack growth
behavior. Therefore, data reduction was carried out in the manner described in Chapter 3.
Typical fracture surface features can be seen in Figure 4.38. In Figure 4.38a the laser
defect is shown surrounded by the precrack region which has assumed a semicircular crack
front prior to high temperature testing. Figure 4.38b shows typical fracture surface features
which were observed to be independent of crack length, stress range and R-ratio for the test
conditions considered. The fracture path is transgranular and similar to that observed for
room temperature tests. However, fatigue fracture paths in room temperature tests exhibited
190

greater deviation from the nominal fracture plane than was observed in 427C tests,
particularly at low values of AK. This was established by stereographic observations.
191

t'·''"l~ pA'P~ ,'t .4*· -I
.4 .- A, -I';. 7 '"'f'( ~*a t.ts . ,w*~~~~~ 'a'
"""". '? R'* �$�,� r · · · '�·liJ.
�_I��_�I· -�d��' :a*L�pR·26*,,'2"·:�::�:1 * �l�:bib/ 3 · �r· ^*�� V"' �·p� t:,e�I,� ,, .. ,�, c,x� �`x;�k�l.�:�:*:;3�xff'·.�^ .-��' '''��;�;' �'�s; x� �a� RIm s,,
st: I�·i·tr''· ·,
I V.5 A, 1 +4 aI
1 ,
>, I ,
.4 46:~~
5> K;
4 'r ,>'w 4 tA1.9I " ~ ~ "
'4
8~ ', "· 4""(
r · ~"-;' -i
.~~~~i" 4,*k
Figure 4.37 Crack front profiles as evidenced by the presence of oxidation on the fracturesurfaces of Waspaloy specimens tested at 427C under elastic fatigueconditions.
192

(a)
JUp
(b)
Figure 4.38 Fractographs of Waspaloy tested at 427Cconditions; (a) laser defect surrounded bytransgranular fracture surface features.
under nominally elastic fatiguethe precrack region, (b) typical
193
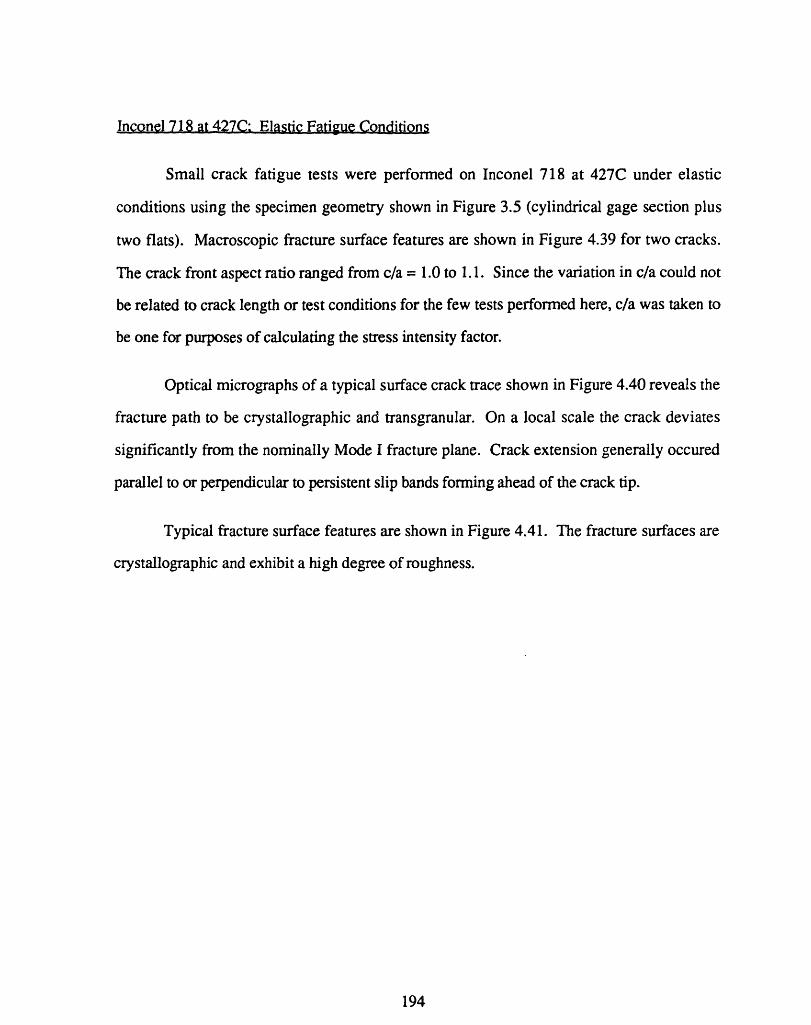
Incornel 718 at 427C: Elastic Fatigue Conditions
Small crack fatigue tests were performed on Inconel 718 at 427C under elastic
conditions using the specimen geometry shown in Figure 3.5 (cylindrical gage section plus
two flats). Macroscopic fracture surface features are shown in Figure 4.39 for two cracks.
The crack front aspect ratio ranged from c/a = 1.0 to 1.1. Since the variation in c/a could not
be related to crack length or test conditions for the few tests performed here, c/a was taken to
be one for purposes of calculating the stress intensity factor.
Optical micrographs of a typical surface crack trace shown in Figure 4.40 reveals the
fracture path to be crystallographic and transgranular. On a local scale the crack deviates
significantly from the nominally Mode I fracture plane. Crack extension generally occured
parallel to or perpendicular to persistent slip bands forming ahead of the crack tip.
Typical fracture surface features are shown in Figure 4.41. The fracture surfaces are
crystallographic and exhibit a high degree of roughness.
194

Figure 4.39 Typical crack front profiles as evidenced by the presence of oxidation on the
fracture surfaces of Inconel 718 specimens tested at 427C under elastic fatigue
conditions.
195

* *Z ·*4
b
.tK*
* l b
-
e\ _
l r·s o s
.·'' *
(a)d
-k·
it"I14.i
tI sJ
I
(b)
' 0-'.44
Figure 4.40 Optical micrographs of a typical surface crack trace in Inconel 718 tested at427C under elastic fatigue conditions; (a) small crack propagating from laserdefect, (b) crack tip extending parallel and perpendicular to persistent slipbands.
196
N~~~~~~~~l~1Y ·N. \~~~-M~~~~~~~~~~~d-'
, , A
20p_4 i
. . ,
f

Figure 4.41 Typical transgranular fracture surface features for Inconel 718 tested at 427Cunder elastic fatigue conditions.
197

IN 100(PM) at 649C; Elastic Fatigue Conditions
Small crack fatigue tests were performed on INOO(PM) at 649C under elastic
conditions using the specimen geometry shown in Figure 3.5 (cylindrical gage section plus
two flats). Macroscopic fracture surface features are shown in Figure 4.42 for two small
cracks initiated from laser defects. The crack front aspect ratio ranged from c/a = 0.95 to
1.05. Since this small variation in c/a could not be related to crack length or test conditions,
c/a was taken to be equal to one for calculating the stress intensity factor.
Typical fracture surface features are shown in Figure 4.43. Figure 4.43a was taken in
the precracked region and exhibits a transgranular fracture path. Recall that precracking was
performed at room temperature. The same transgranular fracture surface appearance was also
observed beyond the high temperature crack front since specimens were separated by fatigue
cycling at room temperature.
Figure 4.43b was taken in the high temperature fatigue crack region and exhibits an
intergranular fracture path with some secondary cracking perpendicular to the nominal
fracture plane. This fracture surface appearance was the same for all crack lengths and elastic
fatigue conditions considered in this investigation. The propensity for intergranular fracture
in IN 10O(PM) at 649C may be attributed to the environmental degradation of grain boundary
cohesive strength ahead of the crack tip. Intergranular fracture has been observed for many
nickel-based superalloys at elevated temperatures.
Figure 4.44 shows a metallographic section through a fatigue crack in the specimen
from test GR23 (max = 965 MPa and R = 0.1). The fatigue fracture path is predominantly
intergranular for the primary crack as well as the secondary cracks. Much of the fracture path
follows the interface between the large blocky ¥ phase and the surrounding matrix. The large
Y' reside primarily at grain boundaries.
198

A second type of defect, intrinsic microporosity, was also observed to be an effective
initiation site in high stress elastic fatigue tests. Figure 4.45 shows fatigue cracks which
initiated at two different pores in test GR23 (max = 965 MPa and R = 0.1). The initial
fatigue crack extension from the pores (light areas) resulted from precracking at ± 780 MPa.
The darker region beyond the precrack resulted from fatigue crack growth at 649C. The
crack shown in Figure 4.45a was the dominant crack in this test with an initial precrack length
of 2c = 280 pim compared to 2c = 252 pim for the dominant laser defect. Consequently,
specimen separation occured along the plane containing the two pores. The fatigue crack
shown in Figure 4.45b represents crack growth from ao = 90 4m to af = 450 Ium in 3600
cycles. This is twice the number of cycles that would be predicted by integrating Eq. 4.24.
therefore indicating either some degree of near threshold behavior or a period of crack arrest.
199

I I,4~~~~~~~~~~'
,
* - t
. lmm
Figure 4.42 Typical crack front profiles as evidenced by the presence of oxidation on thefracture surfaces of IN 100(PM) specimens tested at 649C under elastic fatigueconditions.
200
ci~~l;-, *. - q 1~, ,, ·
L; Z A-- And Ja 'a v%1k · : · 'I~i-1
- ---- -
I. f lw

(a)
(b)
Figure 4.43 Typical fracture surface features for IN 100(PM) tested at 649C under elasticfatigue conditions; (a) room temperature precracked region exhibiting atransgranular fracture path, (b) high temperature fatigue crack regionexhibiting an intergranular fracture path.
201
*' 42~"cL.i
2 10 ". l n'. -~ --

- IL r
0-O r
o -o c
c -:
4) \
A : a
~j C.-4.) .ri- - Lr - o
"c
>\
a) Q) - '
S on
o --
CL ; s b-
4
j-
202
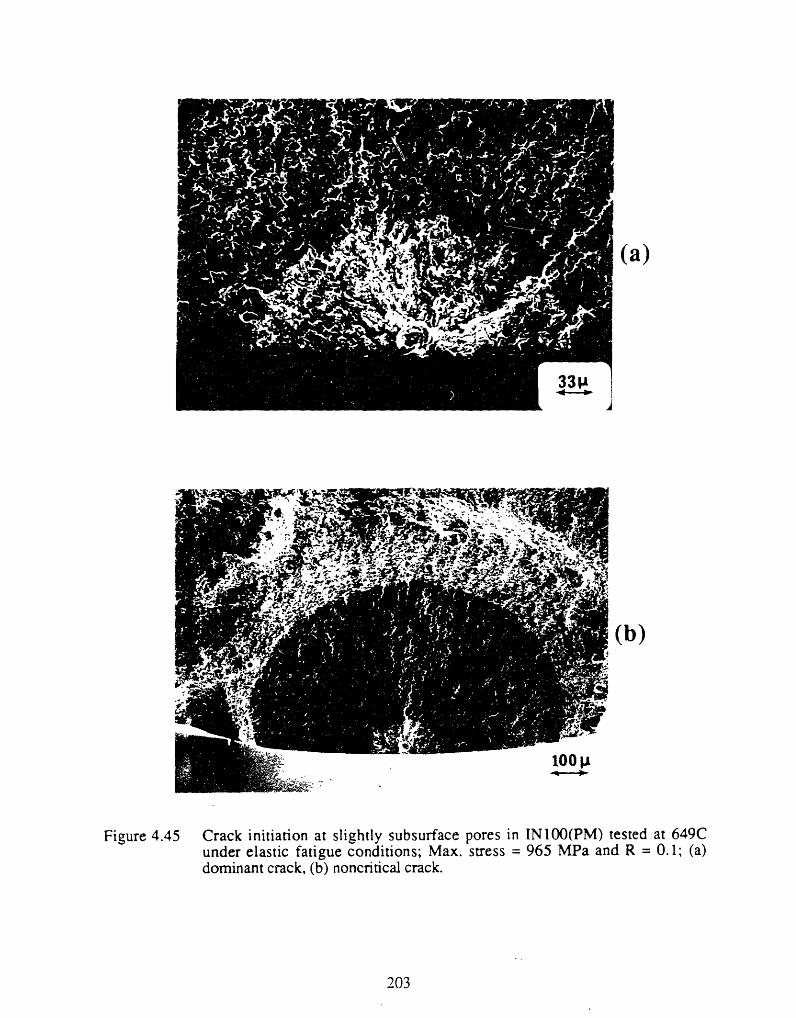
(a)
(b)
Figure 4.45 Crack initiation at slightly subsurface pores in INIOO(PM) tested at 649Cunder elastic fatigue conditions; Max. stress = 965 MPa and R = 0.1; (a)dominant crack, (b) noncritical crack.
203

IN 100(PM) at 649C Elastic-Plastic Fatigue Conditions
Small crack fatigue tests were performed on IN100(PM) at 649C under elastic-plastic
fatigue conditions using the specimen geometry shown in Figure 3.5 (cylindrical gage section
plus two flats). Macroscopic fracture surface features were identical to that observed for
elastic fatigue conditions (see Figure 4.42). The crack front aspect ratio ranged from c/a =
0.95 to 1.05 and was taken to be equal to one for calculating fracture mechanics parameters.
Typical fracture surface features are shown in Figure 4.46 for two elastic-plastic tests.
Figure 4.46a was taken from test GR21 where Act = 0 to 0.8% (AEp = 0.015%) and exhibits
an intergranular fracture path with secondary cracking perpendicular to the nominal fracture
plane similar to that observed for elastic tests. Figure 4.46b was taken from test GR34 where
Act = 0 to 1.2% (AEp = 0. 13%) and exhibits an intergranular fracture path nearly identical to
that observed for the elastic tests and lower strain range elastic-plastic tests.
Crack initiation from surface and slightly subsurface pores was prevalent in the
elastic-plastic tests. Figure 4.47 gives typical examples of these two variations of pore
initiation site. Figure 4.47a shows a surface-pore initiation site with a somewhat
transgranular fracture path at very small crack lengths and a transition to an intergranular
fracture path with increasing crack length. The dark phase is the large blocky y present at
grain boundaries. In Figure 4.48, the transition from a transgranular to an intergranular
fracture path is evident on the fracture surface.
A review of the replica record for smooth specimens (no laser defects) tested under
elastic-plastic conditions indicates that most small cracks initiate at pores intersected by the
specimen surface. However, the dominant crack may suddenly emerge from a subsurface
initiating site with a surface crack length exceeding all others. The rapid fatigue crack growth
from slightly subsurface pores can be explained with the aid of Figure 4.49. For a surface
204
intersected pore, initiation may or may not occur depending on the orientation of the
surrounding microstructure. If initiation occurs, it does so at the intersection of the pore with
the specimen surface and the crack front quickly assumes a semicircular geometry with crack
depth - 1/2(pore diameter). If the crack initiates at a slightly subsurface pore, the narrow
ligament between the free surface and the pore soon fails due to the lack of constraint on both
sides and the resulting high equivalent plastic strain range. Once a crack has formed, it
rapidly propagates through the region having a "chevron notch" geometry and around the
pore until it has assumed a semicircular crack front with crack depth = (pore diameter + t)
where t is the thickness of the ligament between the pore and the specimen surface.
Consequently, the slightly subsurface pore is a more potent crack initiation site. This was
also shown in Figure 4.45.
Given an initial defect size, be it a pore or an inclusion, the lower limit of crack
propagation life will be more likely associated with slightly subsurface defects than surface
connected defects. The crack propagation life from deeply subsurface defects must be
considered in the total life limit of a turbine disk, because a critical defect size could be
reached before detection by nondestructive evaluation. Subsurface cracks will propagate in a
vacuum. The appropriate database should be used to predict crack propagation lives under
these conditions.
205

(a)
(b)
Figure 4.46 Typical fracture surface features for IN100(PM) tested at 649C under elastic-plastic fatigue conditions, (a) intergranular fracture path for AFt = 0 to 0.82%(AFe = 0.015%), (b) intergranular fracture path for Act = 0 to 1.23% (sep =0. I 13%).
206

(a)
(b)
Figure 4.47 Crack initiation at pores in IN100(PM) tested at 649C under elastic-plasticfatigue conditions; (a) surface intersected pore and (b) slightly subsurfacepore.
207

Figure 4.48 Transition from transgranular to intergranular fracture path with increasingcrack length for IN100(P'M) tested at 649C under elastic-plastic fatigueconditions.
208

pore at subsurface location
pore at free surface
"chevron notch"
pore at near surface location
Figure 4.49 Schematic representing crack initiation at surface and subsurface pores.
209
= - - -C s -

5. General Discussion
As demonstrated in previous chapters, the study of the fatigue crack propagation
behavior of small cracks in aircraft turbine disk alloys entails not only small crack sizes but
also very high stresses and strains, often exceeding the elastic limit. One of the principal
objectives at the outset of this investigation was to define the lower limit of crack size and
upper limit of stress for which LEFM is applicable under elastic fatigue conditions. Although
some of the requirements for valid application of LEFM were violated, particularly with
respect to plastic zone size, the stress intensity factor range still served as a useful parameter
to correlate small crack (100 gtm < a < 1 mm) with long crack growth rates and consolidated
crack growth rates at different stress levels. The R-ratio effect was accounted for by the
Walker-modified AK. Values of maximum stress employed were as high as 92% of the
elastic limit stress and yet Mode I cracks as small as 100 gm in depth still exhibited threshold
behavior. Reducing the initial crack size further under elastic fatigue conditions meant
monitoring the progress of arrested cracks; not a fruitful endeavor. With Gmax at 92% of the
elastic limit in many of these experiments, the utility of LEFM was also demonstrated over
nearly the full elastic range. Anomalous fatigue crack growth behavior was not observed
under elastic fatigue conditions in the turbine disk alloys studied here for crack lengths greater
than 100 Aim.
The study of the fatigue behavior of very small cracks is unique in that subcritical
fatigue crack growth rates can be measured at very high stress ranges and under elastic-plastic
conditions which is relevant to turbine disk operating conditions. Such high stress and strain
ranges are not possible in the study of the fatigue behavior of long cracks since the material's
fracture toughness would be exceeded. Miller [5.1] has stated that fatigue crack propagation
of long cracks under low net section stresses represents an anomalous engineering condition.
This is particularly true for aircraft turbine disks.
210

It was found that EPFM parameters such as APK and AJt consolidated crack growth
rates under elastic-plastic fatigue conditions and correlated elastic with elastic-plastic fatigue
crack growth behavior.
Perhaps the single most interesting conclusion to emerge from these small crack
fatigue tests is that the compressive component of stress and strain served to increase crack
growth rates. Furthermore, empirical correlation of crack growth rates with LEFM or EPFM
parameters required explicitly accounting for the total stress-strain range in the mechanical
driving force. This finding appears to run counter to the conventional wisdom which holds
that crack advance (or damage) occurs only when the crack tip is experiencing tensile stress
and strain. In fact the Mode I stress intensity factor, AKI, is defined only for positive
stresses. The effect of stress ratio is generally studied for positive stress ranges and the
reduction in AK to AKeff is attributed to crack closure at positive values of stress.
The objective of this chapter is to explore the role of the compressive stress-strain
excursion under elastic and elastic-plastic fatigue conditions. The approach will be basically
an interrogation of the literature to seek an explanation for this behavior. The following path
will be followed:
1) A review of published data to find other examples of the effect of negative stress-
strain excursion (R < O0) on crack growth rates.
2) Since the effective range of the mechanical driving force is generally attributed to
crack opening-closure, examples of direct physical measurement of crack opening
and closure under Ra < 0 conditions will be reviewed.
3) Analytical and numerical models of crack closure will be reviewed for insight into
the role of the compressive stress-strain excursion.
211

4) Finally an attempt will be made to reconcile measurements, mechanisms and
models with global fracture mechanics parameters which consolidate fatigue crack
growth rates.
212

5.1 The Effect of Negative R-ratio on Fatigue Crack Growth Rates
The number of investigations in which the effect of R-ratio on fatigue crack growth
rates was studied is too numerous to mention. However, the majority of these studies
involved only positive R-ratios and elastic fatigue conditions. The specimen geometries
employed usually prohibited compressive loading. In general, crack growth rates were
observed to increase with increasing positive R-ratios. This behavior was usually attributed
to the crack closure phenomenon and an increase in the effective range of AK with increasing
R-ratio.
Only a few investigations have explored the effect of negative R-ratios on fatigue
crack growth rates. For valid comparisons, it is important that AK be calculated using only
the positive stress range since KI is not defined for compressive loading. Unfortunately
many studies reported in the literature appear to use AcGto t when R < 0 without stating this
explicitly. In some cases, it is not clear how AK was calculated. In the examples given
below, the effect of negative R-ratios on crack growth rate is considered using only the
positive stress range in calculating AK.
Maddox [5.2] reviewed the effect of R-ratio on fatigue crack growth rates in steels
and aluminum alloys under nominally elastic conditions. For a variety of steels it was found
that the number of cycles to crack initiation decreased and crack growth rates increased as R-
ratios decreased in the R < 0 regime [5.3-5.5]. It was concluded that at least part of the
compressive stress range was damaging. The same conclusion was made for 2024-T3 and
7075-T6 aluminum alloys.
Maddox proposed that the compressive stress excursion was damaging only if it was
part of a tension-compression fatigue cycle. He suggested that the damaging effect of the
compressive portion of a Ra < 0 applied stress cycle could be explained in terms of a greater
213

effective tensile stress at the crack tip. He proposed two possible explanations, both of which
may be true: 1) The compressive part of the cycle may contribute to a reduction in the tensile
residual stress field at the crack tip and therefore the residual compressive stress acting on the
crack surfaces. This would reduce the crack closure stress and lead to an increase in crack
growth rates. 2) Compressive applied stresses causing crack closure would then cause
plastic deformation on the crack surface which would force the crack closure stress down,
thus making a greater part o'f the stress range damaging.
Musuva and Radon [5.6] investigated the influence of R-ratio on fatigue crack growth
rates in BS 4360-50C steel at room temperature. R-ratios varied from -0.7 to 0.7. The
results were analyzed using linear elastic fracture mechanics and showed that an increase in
both positive and negative R-ratios caused increased crack growth rates. It was concluded
that the compressive portion of the load cycle at R < 0 contributed to the driving force for
crack growth.
Gamble and Paris [5.7] used LEFM analysis to predict allowable thermal fatigue crack
growth rates in the blade attachment slot of Alloy A286 turbine disks. Start-stop operation
imposed severe cyclic compressive and tensile stresses in this location. Laboratory fatigue
crack growth rate data was obtained at 482C (900F) with R = 0 and R = -1. Crack growth
rates for the R = -1 condition was approximately three times greater than the R = 0 condition
at any given AK. Differences in crack growth rates at room temperature were less significant.
Larsen et al. [5.8] investigated the effect of maximum stress (0.6(Tys and 0.9 Ocys) and
R-ratio on crack growth rates and crack closure in titanium-aluminum alloys. Crack growth
rates at 0.9Cys were found to increase with increasing tension or compression cycling such
that da/dN (R = 0.5 and R = -1) was greater than da/dN (R = 0.1).
Njus and Stephens [5.9] investigated the influence of negative R-ratio on both
constant amplitude fatigue crack growth rates and on delay following a single tensile overload
214

for three different yield strengths of AISI 4140 alloy steel (758 MPa, 1138 MPa and 1413
MPa). R-ratios of 0, -0.5 and -1 were employed. Crack growth rates at constant amplitude
increased with decreasing R-ratio but were more dependent on yield strength. More
dramatically, the delay following a single tensile overload was significantly reduced when
subsequent fatigue cycles were carried out at R = -1 compared to R = 0, particularly for the
lower yield strength steel. The reduction in delay was attributed to cyclic relaxation of crack
tip residual stresses and a reduction in the closure stress.
Stephens, McBurney and Oliphant [5.10] also reported similar behavior for 2024-T3
and 7075-T6 aluminum alloys where the R-ratios following tensile and/or compressive
overloads were: 0, -0.5, -0.75, -1 or -2. As the R-ratio decreased, the beneficial effects of
the tensile overload was reduced. The above two examples illustrate that the compressive
stress excursions play a significant role in fatigue crack growth under spectrum loading
conditions.
Dan and Wertman [5.11] studied the effects of crack closure on fatigue crack growth
rate in a 7050 Al alloy and found that the compressive stress, either in cyclic loading or
applied in a single spike can significantly increase crack growth rate. This behavior was
attributed to a decrease in closure stress with decreasing R-ratio.
The above examples empirically corroborate the findings of this investigation on gas
turbine disk alloys. It can be stated as generally true that compressive stress-strain excursions
result in higher crack growth rates compared to tension only cycling under elastic fatigue
conditions. The general variation of crack growth rate as a function of R-ratio is shown in
Figure 5.1 for a variety of engineering alloys.
The role of stress ratio (mean stress) on fatigue crack growth rates under elastic-
plastic conditions have not been systematically studied. The following sections will focus on
physical explanations for the negative R-ratio effect.
215

da/dN
R-ratio
-1.0 -0.5 0.0 0.5 1.0
Figure 5.1 General variation in crack growth rate versus R-ratio for a variety ofengineering alloys.
216

5.2 Crack Opening and Closure Measurements
The phenomenon of crack closure has been used by many investigators to explain R-
ratio effects on crack growth rate and anomalous small crack behavior. The basic
mechanisms responsible for crack closure: plasticity, fracture surface roughness and oxide
wedging were introduced in the literature review. Under elastic fatigue conditions, crack
closure above zero load serves to reduce the effective driving force such that
AKff = Kmax Kop = Y((ax - op)v a - (5.1)
It is generally assumed that c c = (op. The basic premise behind using AKeff is that the crack
will extend only when the crack tip is fully open. The objective of this section is to review
the literature for examples of crack closure measurements under conditions of negative R-
ratio.
Crack Opening-Closure under Elastic Fatigue Conditions
Crack closure under elastic fatigue conditions has been measured by a variety of
techniques, all of which define closure as the load at which there is a distinct change in
specimen compliance on unloading. This is generally accomplished by measuring the crack
opening displacement as a function of the applied load. Measurement techniques employed
for large cracks determine bulk closure conditions and are not suitable for small crack studies.
In most of the examples given below, the determination of crack opening compliance and
closure of small cracks was accomplished using a unique laser interferometric displacement
gage (IDG) originally developed by Sharpe [5.12-5.14]. This system has a resolution
capability of 0.01 Am.
Jira et al. [5.15] measured crack closure during fatigue crack growth experiments on
surface flaws (50 gm < a < 8 mm) in a high strength titanium alloy. Stress ratios of 0.5, 0.1
217
and -1.0 and net section stress levels from 0.2ays to 0.9Cys were used. Crack lengths and
closure loads were determined from load displacement data obtained with the laser IDG.
After the crack had propagated away from the starter notch, the crack closure load for the R =
-1 test condition remained essentially constant at a small positive value. The measured
closure loads for the R = 0.1 test condition were essentially identical to the R = -1 condition.
Consequently, crack growth rates could be consolidated using the applied AK.
James and Sharpe [5.16] measured crack growth rates and CMOD using the laser
IDG system for small cracks in A533B steel. A coarse and fine grained microstructure was
investigated at R-ratios of 0.1 and -1. Values of Pop/Pmax ranged from -0.25 to 0 for the R =
-1 condition over the crack length range 50 .m < a < 250 Am for the coarse grained
microstructure. Values of Pop/Pmax were nearly constant and positive for both R = 0.1
conditions and for the fine grained R = -1 condition. Crack growth rates were generally
higher in the fine grained condition compared with the coarse grained condition. Crack
growth rates were also higher for the R = -1 test condition.
Lee and Sharpe [5.17] measured crack closure for small cracks (35 .m < a < 500 .m)
in notched specimens of 2024-T3 aluminum under elastic fatigue conditions at R-ratios of
0.5, 0, -1.0, and -2.0. The laser IDG system was used to measure crack closure. Crack
closure occured at positive loads for all R-ratios except the R = -2.0 condition where
PopPmax was as low as -0.38 but generally on the order of -0.10. The scatter in the data was
greater at negative R-ratios.
Sehitoglu [5.18] investigated crack opening and closure levels in a 1070 steel using a
two stage replication technique. Double edge notched specimens were tested at R-ratios of
0.33, 0, -0.33, -1 or -3 and circular notched specimens were tested at R-ratios of 0 and -1.
Crack lengths varied from 40 .m to 5 mm. Results indicated that crack opening and closure
level may be different from one another depending on R-ratio and crack length. The stress
218

level at crack closure and crack opening was in the tensile region for long cracks in double
edge notch specimens even for R = -3. The crack opening level was negative (Pop/Pmax = -
0.1) for small cracks (-100 tm) growing from a circular notch under R = -1 loading
conditions.
Some investigators [5.19, 5.20] have demonstrated that the crack closure level
depends on the location of measurement. Ashbaugh [5.19] studied crack closure in Reni 95
using three specimen geometries and three displacement measurement techniques (clip gage,
back face strain gage and the laser IDG). With the very sensitive IDG technique, the closure
level determined 80 Atm behind the crack tip could not be determined 2.5 mm behind the tip.
He concluded that the contact along the fracture surface near the tip was confined to a region
at the surface of the specimen and deformation of the bulk of the specimen masked the closure
occuring in the near crack tip region. It should be pointed out that the IDG technique
measures crack mouth opening displacement (CMOD). However close the crack tip this may
be in the case of small surface cracks, it is not a direct measurement of crack tip opening
displacement (CTOD). The bulk closure load is defined at the change in bulk compliance.
Crack tip closure may have occured at a higher load.
A common misinterpretation of closure is often made by viewing the surface crack
trace on an unloaded specimen such as that shown in Figure 5.2 for IN100(PM). By noting
that the crack is open at the surface at zero load, some investigators conclude that the closure
load must be compressive. However, according to the definition of plasticity or roughness
induced closure, the crack is mechanically closed without fracture path mating at the specimen
surface.
In summary, the above examples indicate that, for elastic fatigue conditions and
negative R-ratios, crack opening occurs at either low positive values of Pop/Pmax or slightly
negative values of Pop/Pmax. Crack closure was found to be dependent on specimen
219
geometry, crack length, loading history, yield stress, microstructure, crack closure
mechanism as well as the unique 3-dimensional geometry of individual small cracks.
Consequently, it may be stated that small fatigue crack tips are mechanically closed for most
of the compressive stress-strain excursion. The compressive stress-strain excursion may
serve to decrease the crack opening stress, although some examples indicate little effect of R-
ratio on crack opening stress level.
Crack Opening-Closure under Elastic-Plastic Fatigue Conditions
Iyyer and Dowling [5.211 measured crack mouth opening and closure in 4340 steel
cycled under elastic to high strain elastic-plastic conditions (AEt = 0.48% to 2.5%; RE = -1)
CMOD was measured from the plastic replica record made on small surface cracks at different
stress-strain locations around the hysteresis loop. The applied stress needed to open a small
crack was found to be less for the nominally elastic condition. For increasing values of AEt,
the relative crack opening level, op/max, was observed to decrease and approached the
value of Ra = -1. Full crack mouth closure occured only at the minimum stress, but crack
mouth opening occured at a higher stress level, although Ccp was significantly negative.' In
this study one must realize that full crack mouth closure at the specimen surface may not
correspond to crack closure as defined by fracture surface contact and the resulting change in
specimen compliance observed in elastic tests. Therefore, crack mouth opening-closure may
not coincide with crack tip opening-closure. The bulk strain range on the uncracked specimen
ligament appears to dominate crack mouth opening and closure in this case.
McClung and Sehitoglu [5.22] measured crack tip opening and closure of small
cracks (100 m < a < 1.5 mm) in SAE1026 steel cycled under elastic and elastic-plastic
conditions using the two stage replication technique on edge notched specimens. Test
conditions were R = -1 and A t = 0.2% to 1.4% (Aep = 0.001% to 0.52%). The results are
shown in:Figure 5.3. The circles represent the averaged measured value of aop for each
220

strain amplitude. At low strain ranges, the crack tip remained closed at significant tensile
stresses. At high strain ranges, the crack opened under a low compressive stress, aop/CTmax =
0.1. Crack closure levels also decreased with increasing strain amplitude, and closure levels
were significantly lower than opening levels at high strains. Correlations of constant
amplitude crack growth rates based on /AJ or ACTOD were more successful when the
effective stress range (ma - op) was used.
The obvious disagreement between small crack opening levels under high strain
elastic-plastic conditions for the two examples given above is most likely attributable to the
experimental approach rather than other factors. Iyyer and Dowling measured CMOD at the
specimen surface for semicircular surface cracks, whereas McClung and Sehitoglu measured
CTOD on the side surface of SEN specimens. It appears that the results of McClung better
represents the crack tip condition.
With regard to this investigation of small crack growth rates in aircraft turbine disk
alloys, it seems reasonable to assume that crack tip opening occured at lower tensile stress
levels or perhaps slightly compressive levels (op/amax = -0.1) when the bulk Rt-ratio was
negative and particularly when the crack length was small.
221

4 At
f~~~~~
or
4Q-1ov z V
Ir -iO PI
Surface crack trace open at zero load in an [N 100(PM) specimen after testingat 649C in strain control (Et = 0 to 0.8%).
Figure 5.2
222
A

t Experimental Data
Modei of '! e,,.,-rn-n(Plane Stress)
1026 Stee
0.2 0.4 0.6 0
Comparison of experimental results with Newman's analysis for normalizedcrack opening stress versus maximum stress for a 1026 steel. R = -1. FromRef. [5.22].
223
Eb
02
0b-0.2
-0.2
Figure 5.3
0c-, 1 /2 (-;, -t c-, )

5.3 Models for Predicting Crack Opening and Closure
Since crack opening and closure were not measured in this investigation, we now turn
to existing crack closure models to explain the role of the compressive stress-strain excursion
on the mechanical driving force for fatigue crack growth. Most of these models attempt to
describe the effects of crack closure by the plasticity mechanism. Attempts to model crack
closure generally fall into two categories: finite element simulations and simple analytical
models.
Newman [5.23] developed a two-dimensional elastic-plastic finite element program to
analyze plasticity induced closure and crack growth for long cracks in center-cracked panel
specimens under cyclic loading. Spring elements were introduced along the crack plane to
account for closure. Crack opening stresses were found to be significantly lower than crack
closure stresses in all cases. Simulations were run for R = 0 and R = -1. During the
compressive loading (R = -1), all nodes along the crack surfaces closed. The applied
compressive stress caused the crack surface near the crack tip to yield in compression,
thereby lowering the subsequent crack opening stress. The crack opening stress for R = -1
was lower than the opening stress obtained for the R = 0 case. Based on the effective stress
concept, fatigue crack growth rates for R = -1 were predicted to be two times faster than for R
= 0. This prediction was corroborated by results obtained by Hudson [5.24] who found
approximately the same difference in crack growth rates for a 2024-T3 aluminum alloy at R =
0 and R = -1.
Other investigators [5.25-5.28] have used the finite element method to model fatigue
crack closure and crack propagation. Their results, as with the case cited above, serve to
support the findings of the current investigation. However, lacking the resources to simulate
the material and test conditions of this investigation, finite element results cannot be used in a
quantitative manner to analyze the role of compressive stress-strain excursions in this study.
224
A number of physically based analytical models have been developed [5.29 - 5.311 to
predict the crack opening stress. The model most adaptable to this investigation is that
developed by Newman [5.311 which is based on the Dugdale strip-yield model [5.32],
modified to leave plastically deformed material in the wake of the advancing crack tip. The
model was developed for center cracked tension specimens at various applied stress levels
and R-ratios.
Figure 5.4 shows a schematic of the Newman model [5.31] at maximum and
minimum applied stress. The model consists of a linear elastic body containing a fictitious
crack of half length c+p, a crack tip plastic region of length p, and a residual plastic
deformation region along the crack surfaces. The physical crack is of half length c. The
fictitious crack is composed of rigid-perfectly plastic bar elements with a flow stress o*
which is taken as the average between the yield strength and the ultimate tensile strength. At
any applied stress level, the bar elements are either intact (in the crack tip plastic zone) or
broken (residual plastic deformation in the crack wake). The broken elements can only carry
compressive loads, and only when they are in contact. Yielding of the elements in
compression occurs when the contact stress reaches -*. Those elements that are not in
contact do not affect the calculation of crack surface displacements. An effective flow stress,
act*, was used to evaluate yielding of the intact elements in the plastic zone, with C = 1 and 3
under simulated plane stress and plane strain conditions, respectively.
The results of Newman's analysis indicate that ,op is a function of R-ratio and stress
level, omax/*. Some salient features of his analysis are as follows:
* At constant Gmax, Cop/amax increases with increasing R-ratio. At R < 0,
aop/amax is a linear function of R-ratio. At R > 0 oop/Cmax rapidly approaches
the value of R.
* At any given R-ratio and amax, aop/omax is higher for lower values of a.
225

· For plane strain (a = 3), cop/amax is nearly independent of amax/a*.
* For plane stress (a = 1), 'op/umax decreases with increasing max/(5* This
effect is rather dramatic for R < 0.
This model was used to correlate crack growth rates under constant amplitude loading and to
predict crack growth under spectrum loading on 2219-T851 aluminum alloy plate material.
In his initial analysis, Newman presented results in graphical form [5.31]. He later
developed simple expressions for the crack opening stress in terms of R-ratio and stress level
[5.33]. The relations are as follows:
Cop/max =Ao + A1R + A R2 + A R32 3
Cop /max = A + A 1 R for - 1 < R < 0(5.3)
when (op aGmin. The coefficients are:
(5.4)
(5.5)
(5.6)
(5.7)
These equations will be used to calculate cop for the IN 100(PM) tested in this investigation.
Nakamura and Kobayashi [5.34, 5.35] have also demonstrated the validity of the
Newman model to define the crack opening stress levels when fatigue crack closure is caused
by fracture surface asperities (roughness).
226
and
for R 2 0 (5.2)
Ao = (0.825 - 0.34a + 0.05 a 2)[os (nmax/2o*)] I/a
A1 = (0.415 - 0.07la)amax/Cop
A2 = 1- Ao - A1 - A3
A3=2A+ Al - 1

ann,- J n
x
' C
X
a) Maximum stress
(a) Maximum stress
Figure 5.4
O*
G a *
(b) Minimum stress
Crack surface displacement and stress distribution along the crack line forNewman's modification to the Dugdale strip yield model. From Ref. [5.31].
227
> * . ~ ~ ~ lr
a,CI G*
I11
Ii
I
-- - -- -7 r
!L,
5.4 Newman's Model Applied to INI00(PM) at 649C
Using the above equations representing Newman's crack opening model, the effective
stress range (Seff = aCmax - Cop) can be calculated for the fatigue crack propagation results of
this investigation. Since ap was not measured directly in these tests, this is the only option.
Elastic Tests
First consider the series of IN100(PM) tests conducted under elastic fatigue
conditions. The maximum stress was constant at 965 MPa and R-ratios included: -1, -.75, -
.5 and 0.1. The value of o* is estimated as: (1380 + 1050)/2 = 1215 MPa. Assuming plane
stress conditions (a=l1) due to the high maximum stress and small crack size, the expressions
for normalized crack opening stress become:
op 2max = 0.170 + 0.273R + 0.944 R - 0.387 R3 for R (5.8)max
and
CT 0. 170+0.273R for - 1 <R < (59)max
These two expressions are shown graphically in Figure 5.5. The general trend for opt/(max
to decrease with decreasing R-ratio was observed in other experimental investigations cited in
a previous section. Furthermore, measured values of C5op/max were approximately -0.1
when R = -1 in many cases involving high strength materials. Using calculated values of
cop, the effective stress intensity factor range may be expressed as:
AKef = 0.73(965 - Op) V/a (5.10)
where AKeff is in MPami and a is in meters. Crack growth rates versus AKeff are plotted in
Figure 5.6 for the IN100(PM) tests performed under elastic fatigue conditions. The
228

consolidation of crack growth rates is excellent and within experimental scatter; see for
example points "E" which represent two cracks tested under identical conditions. The
consolidation of crack growth rates achieved with AKeff is identical to that achieved with the
Walker modified AK shown in Figure 4.17.
Elastic-Plastic Tests
Newman's model for normalized crack opening stress level was originally developed
for elastic fatigue conditions, however, McClung and Sehitoglu [5.22] extended its
application to elastic-plastic fatigue conditions. They measured crack tip opening stress levels
for small cracks (100 .im to 1.5 mm) in SAE1026 steel subjected to high strain fatigue
conditions; AEt = 0.2% to 1.4% (ArEp = 0.001% to 0.52%) and RE = -1. Measured values of
the normalized crack opening stress level op/omax agreed with that predicted by Newman's
model for tmax/* ranging from 0.4 to 0.75. The stress ratio was not a variable in these tests
since RE = -1 and the resulting Rc = -1, assuming nearly balanced hysteresis loops. Better
correlations of crack growth rates were achieved using estimates of AJ and ACTOD based on
the effective stress range.
Given the success of the Newman crack opening model in the case cited above, it was
employed to calculate crack opening levels for IN 100(PM) tested under elastic-plastic fatigue
conditions for this investigation. Since Ra < 0 in all these elastic-plastic tests, Eqs. 5.3 - 5.5
were used to calculate aop/amax. In this case Umax and Ra vary from test to test and the
normalized crack opening stress is strongly dependent on both. The value of Ao varies
considerably (see Eq. 5.4) with small changes in amax. The correlation which will be
demonstrated does not follow from the apparent simplicity of Eq. 5.3. It is not linear when
amax is not constant.
229

Values of oop calculated using Newman's model were used to estimate Aceff. This
effective stress range was used to calculate AJeff for elastic-plastic and elastic tests. Crack
growth rates versus AJeff are shown in Figure 5.7 for elastic-plastic tests and in Figure 5.8
for both elastic and elastic-plastic tests. Consolidation of crack growth rates is comparable to
that achieved using ACtot to calculate Jtot and is again far superior to consolidation of crack
growth rates achieved using Aapos to calculate AJ* (see Figure 4.33).
Reconciliation: Atot with Ageff
In Chapter 4 we demonstrated that the compressive stress-strain excursion under
elastic and elastic-plastic fatigue conditions contributed to the mechanical driving force for
crack growth in aircraft turbine disk alloys. Higher crack growth rates resulted from
decreasing Ra. Consolidation of crack growth rates was achieved only when the total stress
or total strain range was included in calculating the mechanical driving force.
In Chapter 5 we interrogated the literature to find:
* Other examples where crack growth rates were found to increase with decreasingRa. Thus the findings of this investigation appear to be generally true.
* Direct measurements have shown the crack opening stress to decrease withdecreasing Ra.
* A model developed by Newman was found to predict normalized crack openingstress levels under elastic and elastic-plastic fatigue conditions.
Newman's model was employed to calculate Aaeff for IN100(PM) at 649C subjected
to elastic and elastic-plastic fatigue conditions. It was found that AcTeff could be used to
correlate crack growth rates as well as Aatot under both conditions. The question arises; how
is Aaeff related to Aotot? Since Aaeff was calculated as (max - aop) using Eq. 5.3 and ACtot
was measured in each test, Aaeff is plotted versus Atot in Figure 5.9. As can be seen the
relationship is linear. Therefore, an increase or decrease in Aatot results in a proportional
increase or decrease in Aaeff. For the elastic tests:
230

Acreff =523 + 0.28 A tot ; R = 1.00 (5.11)
and for the elastic-plastic tests (RE = 0):
2Aa =531 + 0.47Ayto t ;R = 1.00 (5.12)
For a given ZAlto t and Ra-ratio, the elastic-plastic tests exhibit a higher Aceff due to higher
values of amax/G*. It is interesting to note that the single elastic plastic test where RE = -1
does not correlate with the other elastic-plastic tests.
The above demonstrates that the use of Aeff or Ato t in calculating the mechanical
driving force will result in an equivalent empirical consolidation of crack growth rates for the
conditions studied here. The generality of these findings cannot be established with the
limited data available in the literature on fatigue crack growth rates of small cracks under
elastic and elastic-plastic conditions.
231

Q
~ A
.)
m - n
Z>=3
3 _
_ .,
_ _'3
- W_
n
~ _
> r
_
'I -cG-: a
0.. _·v
- _n
O
An} > r:
232
,

I I I I III
IN100(PM)
'...oad ontr 1 Tet3
LEGENDMax Stress-96SMP%B R-0. E R--. .5G R--.?750 -- I
. §Dt
B~ "E:~~ D EED G
(Z E E E 9
GE 3 E
~!9B
EBGE
9
B G
a
AK ef = YMA eff '
I I I I I II
5 10I I I I I I I I
100
DELTA Keff,(MPa4;iT)
Crack growth rates versus the effective stress intensity factor range (calculatedusing aeff from Newman's model) for IN100(PM) tested at 649C underelastic fatigue conditions; R-ratio was varied at max. stress = 965 MPa, Freq.= 10 cpm.
233
-4I - I
649C(1200F)
-S
-610
O-
(-
z
Lai
30(-
U
U
10
1 0
10s
Figure 5.6
__ _ _ _ _ I
I · , 1 · � · � _· r 1 r, · �· I,
I I

.r -- 1 ' I I -m mI __ . IIIN100( PM)
LEGENDTot1Ae CPtot I cA-)
- o mto .ix ce.mil})0 6 to 0.8x (3.81S3)
X a to 1.O2X (l.3l)2 U to 1.2X (1.13X)P -6.5S5 to 3.55* (O3. X)
F
P 0
_ ~ NI #~~ ~~
00
8
00O
2 ra
- zleff = E +
I L I I I I111
I
0
649CC1200F)
Pex
xX*
Z
ZZz x
z zz z x XK X f *
0
0
y2(Aaeff a){3.85 (l-n)I I I I I11t
10
+ }I I I
50
DELTA Jeff, (KPa x m)
Crack growth rates versus the effective J-integral range, (calculated usingAaeff from Newman's model) for IN100(PM) tested at 649C and underelastic-plastic fatigue conditions; total strain range was varied, Freq. = 10cpm.
234
U
U
E
z
-0-c
l s
,'4.
a:
I30
10UCZ
Ue
I -.9
0.1
Figure 5.7
,,= ,,, .... -- ........... _ __ __ __-
~C -----
I I I I I j I I I I I I I I I I I I I
-

I I I I I I I II I I I I I 1
IN100(PM) 649C( 1200F)Striln vs Load Control
LEGENDr5ItN CONtROL. Total AE. (PlatlcAE)
= 0 a to .6X (l.l13)-* to .6X c(8.1SX)X a to .3X (I.3X)
- 2 a to 1.2X (1.13X"_ aa R a *M .*R 3to7TIr
- LOD CONTROLa ?SIFPa (.CR-I.)I 591SIs C(l-. 1)
= C ?SSIFs C(R-t)
- C sisiP, (R-. S)"G 3lSPs (R-1. 7 )
_il
E °
B 0CB_ 0 5G 0
00
0
zZZZ
-A,_ x xr. X x *
x
* ,¥#-_
*
00
0
B G
B
+ Y (Aoe Aep a)I I I I I I II
3.85(1- n)
I I I I 1 II II
1 10
+ rn}I I I
5o
DELTA Jeff, (KPa x m)
Summary of crack growth rates versus the effective J-integral range,(calculated using aeff from Newman's model) for INIOO(PM) tested underelastic and elastic-plastic fatigue conditions; Freq = 10 cpm.
235
--4I I jI-
l
e_%
(-3
0
\_s
%-
z
a)
LJ
r
IC9
l0U'r~zcu
U_ =, z Y2 eff
effY E
l 0_'0.1
Figure 5.8
_ _ ______ _C_ __
_ __ _ _ _ ___I_ __1 I __
.-6

IN10O(PMI) 645 OC (1200F)
}
0 elastic tests, max stress = 965 MPa
O elastic-plastic tests, Re = 0
* elastic-plastic tests, R£ = -1
1500
1500 2000 2500 3000
Effective stress range (calculated from Newman's model) versus total stressrange for IN100(PM) tested under elastic and elastic-plastic fatigue conditions,Freq. = I0 cpm.
2000
1500-
1000
a
A
cn;-:D
J!;4xr
500500
10001000
Figure 5.9
Total Stress Range (MPa)
236
- --_ � _ _ _ � _ _ � _..,_�-,.-_��--,._--. _ ,--,,

5.5 Fatigue Crack Growth and Crack Tip Strain Reversals
The problem of fatigue crack growth consists of both a mechanical driving force and a
material response to that driving force. Under elastic fatigue conditions, the mechanical
driving force is best defined in terms of linear elastic fracture mechanics. Under high strain
fatigue conditions (A£p > 0), the mechanical driving force can be defined in terms of various
elastic-plastic fracture mechanics parameters. The mechanical driving force defines the crack
tip stress-strain field. It is generally agreed that the range of crack tip strain (or ACTOD) in
the plastic zone is responsible for the increment of crack extension occuring in each cycle.
In the previous section it was demonstrated that the effective range of the mechanical
driving force is often limited by the crack closure phenomenon. The effective stress-strain
range is usually taken as the range over which the crack tip is open. A review of
measurements and models indicate that the role of the compressive stress-strain excursion in
R < 0 cycling is to lower the crack opening stress level, therefore increasing the effective
range of the mechanical driving force. By demonstrating that Aeff was linearly related to
Aato t, crack opening arguments appear to be a plausible explanation for the success of
fracture mechanics parameters which include Aetot or ACtot in correlating crack growth rates.
It can therefore be stated that the role of the compressive strain excursions is to override, to
some extent, the mechanical crack closure which generally occurs at positive stresses on
unloading from the maximum stress.
The forgoing explanation is physically sound. However, one may ask, if K defines
the crack tip stress-strain condition and AK defines the crack tip stress-strain range, then what
role does the compressive-going stress-strain excursion play in creating damage in the crack
tip plastic zone? The answer to this question, of course, depends on the mechanism of crack
advance per cycle, (striation mechanism, ductility exhaustion, grain boundary decohesion,
etc.) which in turn depends on: material, environment, frequency, stress-strain range, etc.
237

The compressive-going stress-strain excursion presumably reverses the tension going
strain. It is reasonable to assume that the forward going crack tip strain would be of such a
magnitude to accommodate the crack tip opening displacement. The maximum value would
be limited by the fracture strain (accounting for state of stress) and further limited by the
elastic-plastic envelope surrounding the crack tip which represents the material's intrinsic
resistance to crack growth. Intrinsic resistance to crack growth incorporates macroscopic
material properties (yield strength, ductility, strain hardening behavior, etc.) as well as
microscopic properties (grain size, slip character, cohesive strength, etc.)
The reversal of crack tip strain is limited by the magnitude of the forward going strain
and crack flank closure behind the crack tip. The unique feature of the small crack
experiments in this investigation is that the bulk stress and strains are sufficiently high to
override crack closure during the compressive excursion. Furthermore, the requirements for
strain compatibility at the elastic-plastic boundary will cause crack tip strains to be reversed to
nearly the same extent as the bulk strain range in elastic-plastic tests. Hence, it is reasonable
to postulate that the compressive stress-strain excursion increases the magnitude and extent of
the reversed crack tip strain range. This physical argument is not easily corroborated by
direct physical measurements, particularly for fatigue crack growth in turbine disk alloys at
elevated temperatures.
These arguments are supported by the results of Lalor and Sehitoglu [5.36] who
modeled crack closure and crack tip plastic zones for small cracks propagating from circular
notches using a two dimensional finite element method. The test variables considered were:
stress range, stress state, hardening behavior, crack length, plastic wake with respect to total
crack length, and R-ratio.
Here we will look at their results only with respect to comparing the two R-ratios (R =
0 and R = -1) and the two stress states (plane stress and plane strain). Crack tip conditions
238
are considered at a crack length = 0.6.(notch radius) which was considered a sufficient length
to relieve the stress field of the notch over the open crack. The maximum stress was 0.72SyS.
The material properties were selected to fit a 1070 wheel steel.
Figures 5. 10a and 5. 10b show the stress fields at maximum and minimum load (plane
stress and plane strain) for R = 0 and R = -1, respectively. In the R = 0 case, the
compressive stress field surrounding the crack tip and crack flank at minimum load is only the
residual stress caused by elastic unloading outside the plastic zone. The magnitude of this
compressive stress is sufficient to cause only a limited extent of plastic strain reversal at the
crack tip and no plastic strain reversal along the crack flank.
In the R = -1 case, the compressive stress field surrounding the crack tip and crack
flank at minimum load is caused by elastic unloading plus the applied compressive load.. The
magnitude of the compressive stress is sufficient to cause extensive plastic strain reversal at
the crack tip and along the crack flank.
The size of the maximum (or monotonic) and reversed plastic zones are shown in
Figure 5.1 la and 5.1 lb for the four cases described above. The size of the monotonic plastic
zones are similar because they depend primarily on Kmax which was the same in all cases.
The effect of the state of stress is somewhat less than expected. The size of the reversed
plastic zone at minimum load is far more extensive in the R = -1 case than the R = 0 case.
The increasing plastic zone size which occurs with decreasing R-ratio may contribute
to the increasing crack growth rates observed in this investigation. This argument is
physically sound and supported by the above analysis. It is plausible that both a decreasing
crack opening stress and increasing reversed plastic zone size contribute to the increase in
crack growth rates which are generally observed as Rs decreases.
239

RxO S/,,,,a/ 72 4H/E 0.07 e/E Co002
/c: 0.6
--- -Plane Stress 3SO,/S,, : 0.42
.----.- Plane StrainSo,,e /S.,e 030 2
b
).6 -0.4 -02
I S
' Notch Surface
Figure 5.10a Crack tip stress fields and crack wake residual stresses for R = 0 loading;max. stress - 0.72ays, crack length = 0.6.(notch radius). From Ref. [5.36].
R--l S/a, 7 2
H/E =Q07, a,/E a 0002I/c =0.6
Plane Stress
So /S,. 0-. - Plane Strain
So. / Soe :0.142 %x Max Lood
NR··
b
Min. Lood
-21
Figure 5.10Ob Crack tip stress fields and crack wake residual stresses for R = -1 loading;max. stress = 0.72ays, crack length = 0.6(notch radius). From Ref. [5.36].
240
I
1
-
1-0

R .0 S 6,/o, - 72H/E C0o7, /c 0.6a-o/E 0.002
(a)
Plane Stress
Reversed
/
Contct Zone at Min Load
Figure 5.11a Crack tip monotonic and reversed plastic zones for R - 0 losding;, max. stress= 0. 72 oys, crack length = 0.6.(notch radius). From Ref. [5.36].
Plane Strain
NoCh / ReversecSurface \ Pastic
Zone(Min.
C/ \ Load)
Cacnl a Crack rio -I Zone at Min Load
(a)R--i, S.,. /0 0.72H/E: 0.07, /c 6r /E 0002
0.2 mm
0.2 mmScale
Plane Stress
ROerxOil P¢ t- Zone (Mir
rv -)' .*,..
C*11,0~~
I-CoaXt, Crack rioZone at Min Load
Figure 5.1lb Crack tip monotonic and reversed plastic zones for R = -I loading; max. stress= 0.72ays, crack length = 0.6.(notch radius). From Ref. [5.36].
241
Ox.
rneax.oad)
- .
0.2 mm
0.2 rnmScale
Maxastt:ZoneMax..oad).4e
Max/Plstic
Zone(Max.Load)
1;---
-
r\
-
6. Conclusions
The fatigue crack growth behavior of small cracks in three aircraft turbine disk alloys
was investigated at elevated temperatures under elastic and elastic-plastic conditions over the
crack length regime from 100 pgm to 1 mm. The following conclusions can be drawn from
the crack growth rate data.
1) Anomalous crack growth behavior was not observed for small Mode I cracks under
high stress elastic fatigue conditions. The LEFM stress intensity factor range correlated
small crack with long crack growth rates and consolidated small crack growth rates at
different stress levels for the same Re-ratio. Apparent threshold behavior for small
cracks coincided with that for long cracks.
2) Under high stress elastic fatigue conditions, small crack growth rates at different Ra-
ratios were consolidated using the Walker-modified stress intensity factor range.
3) The pseudostress intensity factor range and the cyclic J-integral range, calculated using
Aet and Aa t, respectively, consolidated small crack growth rates under elastic and
elastic-plastic fatigue conditions.
4) Values of Aeeff estimated from Newman's crack closure model were used to achieve
excellent consolidation of small crack growth rates with AKeff and AJeff under elastic
and elastic-plastic fatigue conditions, respectively. A linear relationship between Ato t
and Areff gives a physical justification for the consolidation of small crack growth rates
with LEFM and EPFM parameters based on A!, and Act.
5) Under all conditions, the compressive component of the fatigue cycle contributed to
higher crack growth rates than tension-tension cycling. The compressive component
242

must be accounted for in expressing the mechanical driving force in terms of LEFM or
EPFM parameters.
243
7. Recommendations for Future Research
1) A review of the open literature revealed that the majority of investigations of small crack
behavior in aircraft turbine disk alloys were performed at room temperature. Such
results are likely to be of little relevance for fine grained powder metallurgy alloy
applications since room temperature fatigue fracture paths are usually transgranular,
whereas, elevated temperature (-650C) fatigue fracture paths are intergranular.
Consequently, in powder metallurgy alloys, future fatigue crack growth studies should
be performed at disk relevant temperatures.
2) Additional small crack testing should be performed under notch relevant conditions,
including strain hold tests. Small crack growth rates should also be measured in notch
configurations.
3) An investigation of crack opening-closure should be conducted for small cracks in disk
alloys at elevated temperatures to resolve the issue of crack opening stress levels under
elastic-plastic fatigue conditions. The laser IDG technique appears to be suitable for this
type of investigation.
4) Understanding the role of compressive stress-strain excursions in overriding crack
closure should be considered as an objective of future work. Is closure more important
with respect to the stress level at which crack flanks make contact or is strain reversal
ahead of the crack tip more important? Is the size of the reversed plastic zone as
important as the maximum strain therein? How are the two related to alloy mechanical
properties and crack tip driving force?
244

References[1.1] J.A. Harris, Jr.,Engine Component Retirement for Cause, AFWAL-TR-87-
4069, Vol. 1, Wright-Patterson AFB, OH, 1987.
[1.2] J.M. Hyzak, W.H. Reimann and J.E. Allison, The Development of QuantitativeNDI for Retirement-for-Cause, Air Force Materials Laboratory, Report AFML-TR-78-198, Wright-Patterson AFB, OH, 1979.
[1.3] C.G. Annis Jr., J.S. Cargill, J.A. Harris Jr., and M.C. Van Wanderham,"Engine Component Retirement-for-Cause: A Nondestructive Evaluation (NDE)and Fracture Mechanics-Based Maintenance Concept", Journal of Metals, 1981,pp. 24-28.
[1.4] W.D. Cowie, "Turbine Engine Structural Integrity Program (ENSIP)", Journal ofAircraft, Vol. 12, 1975, pp. 366-369.
[1.5] United States Air Force, "Engine Structural Integrity Program", Military Standard1783, Aeronautical Systems Division, Wright-Patterson Air Force Base, OH,1984.
[ 1.6] T.T. King, W.D. Cowie and W.H. Reimann, "Damage Tolerant Design Conceptsfor Military Engines", AGARD Conference Proceedings.
[1.7] B.N. Leis, M.F. Kanninen, A.T. Hopper, J. Ahmad and D. Broek, A criticalReview of the Short Crack Problem in Fatigue, AFWAL-TR-83-4019, 1983.
[1.8] S. Suresh and R.O. Ritchie, "Propagation of Short Fatigue Cracks," InternationalMetals Reviews, Vol. 29, No. 6, 1984.
[1.9] M.J. Blackburn and R.A. Sprague, "Production of Components by Hot IsostaticPressing of Nickel-Base Superalloy Powders," Metals Technology, August 1977,pp. 388-395.
[1.10] S.A. Sattar and C.V. Sundt, "Gas Turbine Engine Disk Cyclic Life Prediction",Journal of Aircraft, Vol. 12, No. 4, 1975, pp. 360-365.
[1.11] S. Majumdar, "Low-Cycle Fatigue and Creep Analysis of Gas Turbine EngineComponents", Journal of Aircraft, Vol. 12, No. 4, 1975, pp. 376-382.
[1.12] T.A. Cruse, "Residual Life Prediction of Surface Cracks in Complex StructuralDetails", Journal of Aircraft, Vol. 12, No. 4, 1975, pp. 369-375.
[1.13] A. Coles, "Material Considerations for Gas Turbine Engines", ICM3, Vol. 1,1979, pp. 3-11.
[1.14] R.H. Van Stone, "Residual Life Prediction Methods for Gas TurbineComponents" in Mechanics and Physics of Crack Growth, Materials Science andEngineering, Vol. A103, No. 1, 1988, pp. 49-61.
245

[2.11 ] R. Wanhill, "Short Cracks in Aerospace Structures" in Behavior of Short FatigueCracks, K.J. Miller and E.R. del los Rios, ed., Mechanical EngineeringPublications, London, 1986, pp. 27-36.
[2.2] Military Standard, Aircraft Structural Integrity Program, Airplane Requirements,Mil-STD-1530 (USAF}, Sept. 1972.
[2.3] J. Harris Jr., Engine Component Retirement for Cause, AFWAL-TR-87-4069,AirForce Wright Aeronautical Laboratories, 1980.
[2.4] P. Forsyth, Proc. Roy, Soc. (London), Ser A, 1957, Vol. 242, p. 198.
[2.5] P. Forsyth, "A Two Stage Process of Fatigue Crack Growth", Proc. CrackPropagation Symp., Canfield, 1961, Vol. 1, p. 76.
[2.6] R.G. de Lange, "Plastic Replica Methods Applied to the Study of Fatigue CrackPropagation in Steel 35 CD 4 and 26 St Aluminum Alloy", Transactions of theMetallurgical Society of AIME, Vol. 230, 1964, pp. 644-648.
[2.7] N.E. Frost, "A Relation between the Critical Alternating Propagation Stress andCrack Length for Mild Steel", Proc. Inst. Mechanical Engrs, Vol. 173, 1959, pp.811-827.
[2.8] H. Kitagawa and S. Takahashi, "Applicability of Fracture Mechanics to VerySmall Cracks or Cracks in the Early Stage", Proc. of the Second InternationalConference on the Mechanical Behavior of Materials, Boston, 1976, pp. 627-631.
[2.8'] J. Lankford and D.L. Davidson, "The Role of Metallurgical Factors in Controllingthe Growth of Small Fatigue Cracks", Small Fatigue Cracks, R.O. Ritchie and J.Lankford, eds., The Metallurgical Society of AIME, 1986, p. 53.
[2.9] S. Pearson, "Initiation of Fatigue Cracks in Commercial Aluminum Alloys and theSubsequent Propagation of Very Short Cracks", Engineering Fracture Mechanics,Vol. 7, 1976, pp. 235-247.
[2.10] M.H. El Haddad, K.N. Smith and T.H. Topper, "Fatigue Crack Propagation ofShort Cracks", ASME - CSME Joint Conference on Pressure Vessels and Piping,Nuclear Energy and Materials, Montreal, 1978.
[2.11] R.O. Ritchie and J. Lankford, "Overview of the Small Crack Problem", in SmallFatigue Cracks, R.O. Ritchie and J. Lankford, eds., The Metallurgical Society ofAIME, 1986, pp. 1-5.
[2.12] G.R. Irwin, Journal of Applied Mechanics, Trans. ASME, Vol. 24, 1957.
[2.12'] D. Broek, Elementary Engineering Fracture Mechanics, 3rd Revised Edition,Martinus Nijhoff Publishers, 1982.
[2.13] P.C. Paris and F. Erdogan, "A Critical Analysis of Crack Propagation Laws",Journal of Basic Engineering, Trans. ASME, Vol. 85, 1963, p. 528-534.
246

[2.14] W. Elber, "The Significance of Fatigue Crack Closure", Damage Tolerance inAircraft Structures, ASTM STP 486, 1971, pp. 230-242.
[2.151 S. SureshJand R.O. Ritchie, "A Geometric Model for Fatigue Crack ClosureInduced by Fracture Surface Morphology", Metallurgical Transactions, 13A,1982, pp. 1627-1631.
[2.16] N. Walker and C.J. Beevers, "A Fatigue Crack Closure Mechanism in Titanium",Fatigue of Engineering Materials and Structures, Vol. 1, 1979, pp. 135-148.
[2.17] C.J. Beevers, R.L. Carlson, K. Bell and E.A. Starke, "A Model for FatigueCrack Closure", Engineering Fracture Mechanics.
[2.18] K. Minakawa and A.J. McEvily, "Our Crack Closure in Near-Threshold Region",Scripta Metallurgica, Vol. 15, 1981, pp. 633-636.
[2.19] R.O. Ritchie and S. Suresh, "Some Consideration on Fatigue Crack ClosureInduced by Fracture Surface Morphology", Metallurgical Transactions, Vol. 13A,1982, pp. 937-940.
[2.20] R.O. Ritchie, S. Suresh and C.M. Moss, "Near-Threshold Fatigue Crack Growthin 2 1/2 Cr-Mo Pressure Vessel Steel in Air and Hydrogen", Journal ofEngineering and Materials Technology, Trans. ASME, Series H, Vol. 102, 1980,pp. 293-299.
[2.21] S. Suresh, G.F. Zamiski and R.O. Ritchie, "Oxidation and Crack Closure, anExplanation for Near Threshold Corrosion Fatigue Crack Growth Behavior",Metallurgical Transactions, Vol. 12A, 1981, pp. 1435-1443.
[2.22] S. Banerjee, A Review of Crack Closure, AFWAL-TR-84-4031, Air ForceWright Aeronautical Laboratories, Dayton, OH, 1984.
[2.23] W.T. Evans and A.R. Luxmoore, Journal of Strain Analysis, Vol. 11, 1976, pp.177-185.
[2.24] W.K. Wilson, "Plane Strain Crack Toughness Testing of High Strength MetallicMaterials", ASTM STP 410, American Society for Testing and Materials,Philadelphia, 1966, pp. 75-76.
[2.25] R.A. Smith, "On the Short Crack Limitations of Fracture Mechanics",International Journal of Fracture, Vol. 13, 1977, pp. 717-720.
[2.26] W.F. Brown and J.E. Srawley, "Plane Strain Crack Toughness Testing of HighStrength Metallic Materials", ASTM STP 410, American Society for Testing andMaterials, Philadelphia, 1966, pp. 1-65.
[2.27] Plane Strain Fracture Toughness of Metallic Materials, 1982 Annual Book ofASTM Standards, Part 10, Standard No. E399.
[2.28] J. Lankford, "On the Small Crack Fracture Mechanics Problem", InternationalJournal of Fracture, Vol. 16, 1980, pp. R7-R9.
247

[2.29] D.L. Davidson and J. Lankford, Fracture 1977, University of Waterloo, Vol. 2,1977, pp. 897-904.
[2.30] M.A. Wilkins and G.C. Smith, Acta Metallurgica, Vol. 18, 1970, pp. 1035-1043.
(2.31] M. Klesnil and P. Lukas, Fracture, Chapman and Hall, 1969, pp. 725-730.
[2.32] B.N. Leis, M.F. Kanninen, A.T. Hopper, J. Ahmad and D. Broek, A CriticalReview of the Short Crack Problem in Fatigue, AFWAL-TR-83-4019, Air ForceWright Aeronautical Laboratories, Dayton, OH, 1983.
[2.33] R.P. Skelton in Low-Cycle Fatigue and Life Prediction, ASTM STP 770,American Society for Testing and Materials, Philadelphia, 1982, pp. 337-381.
[2.34] A.T. Price and W.J. Elder, Journal of the Iron and Steel Institute, Vol. 204,1966, pp. 594-598.
[2.35] H.D. Solomon and L.F. Coffin in Fatigue at Elevated Temperatures, ASTM STP520, American Society for Testing and Materials, Philadelphia, 1973, pp. 112-122.
[2.36] P.S. Maiya, Scripta Metallurgica, Vol. 9, 1975, pp. 1277-1282.
[2.37] H.D. Solomon, Metallurgical Transactions A, Vol. 4, 1973, pp. 341-347.
[2.38] P.S. Maiya and D.E. Busch, Metallurgical Transactions A, Vol. 6A, 1975, pp.1761-1766.
[2.39] J. Wareing, Metallurgical Transactions A, Vol. 6A, 1975, pp. 1367-1377.
[2.40] G. Baudry and A. Pineau, Materials Science and Engineering, Vol. 28, 1977, pp.229-242.
[2.41] R.P. Skelton, Materials Science and Engineering, Vol. 19, 1975, pp. 193-200.
[2.42] R.P. Skelton, Materials Science and Engineering, Vol. 32, 1978, pp. 211-219.
[2.43] R.P. Skelton, Materials Science and Engineering, Vol. 35, 1978, pp. 287-298.
[2.44] J. Reuchet and L. Remy, Fatigue of Engineering Materials and Structures, Vol. 2,1979, pp. 51-62.
[2.45] R.P. Skelton, Fatigue of Engineering Materials and Structures, Vol. 2, 1979, pp.305-318.
[2.46] K. Yamaguchi and K. Kanazawa, Metallurgical Transactions A, Vol. 10A, 1979,pp. 1445-1451.
[2.47] G. Chalant and L. Remy, Acta Metallurgica, Vol. 28, 1980, pp. 75-88.
[2.48] J. Huang, R.M. Pelloux and J. Runkle, Metallurgical Transactions A, Vol. 11,1980, pp. 899-904.
248

[2.49] B. Tomkins, Philosophical Magazine, Vol. 18, 1968, pp. 1041-1066.
[2.501 K. Yamaguchi, K. Kanazawa and S. Yoshida, Materials Science andEngineering, Vol. 33, 1978, pp. 175-181.
[2.51] R.C. Boettner, C. Laird and A.J. McEvily Jr. "Crack Nucleation and Growth inHigh Strain-Low Cycle Fatigue", Transactions of the Metallurgical Society ofAIME, Vol. 233, February 1965, pp. 379-387.
[2.52] H.D. Solomon, "Low Cycle Fatigue Crack Propagation in 1018 Steel", Journal ofMaterials, JMLSA, Vol. 7, No. 3, 1972, pp. 299-306.
[2.53] J.R. Haigh and R.P. Skelton, "A Strain Intensity Approach to High TemperatureFatigue Crack Growth and Failure", Materials Science and Engineering, Vol. 36,1978, pp. 133-137.
[2.54] M.S. Starkey and R.P. Skelton, "A Comparison of the Strain Intensity and CyclicJ Approaches to Crack Growth", Fatigue of Engineering Materials and Structures,Vol. 5, No. 4, 1982, pp. 329-341.
[2.55] J.R. Rice, Journal of Applied Mechanics, Trans. ASME, Vol. 35, June 1968, pp.379-386.
[2.56] C.F. Shih and J.W. Hutchinson, "Fully Plastic Solutions and Large ScaleYielding Estimates for Plane Stress Crack Problems", Journal of EngineeringMaterials and Technology, Oct. 1976, pp. 289-295.
[2.57] J.E. Srawley and W.F. Brown in Fracture Toughness Testing Methods, ASTMSTP 381, 1965, pp. 133-196.
[2.58] J.A. Begley and J.D. Landes in Fracture Toughness, Proceedings of the 1971National Symposium on Fracture Mechanics, Part II, ASTM STP 514, AmericanSociety for Testing and Materials, 1972, pp. 1-20.
[2.59] J.R. Rice, P.C. Paris and J.G. Merkle in Progress in Flaw Growth and FractureToughness Testing, ASTM STP 536, American Society for Testing and Materials,1973, pp. 231-245.
[2.60] N.E. Dowling and J.A. Begley, "Fatigue Crack Growth during Gross Plasticityand the J-integral", Mechanics of Crack Growth, ASTM STP 590, AmericanSociety for Testing and Materials, 1976, pp. 82-103.
[2.61] N.E. Dowling, "Crack Growth during Low-Cycle Fatigue of Smooth AxialSpecimens", Cyclic Stress-Strain and Plastic Deformation Aspects of FatigueCrack Growth, ASTM STP 637, American Society for Testing and Materials,1977, pp. 97-121.
[2.62] M. Okazaki and T. Koizumi, "Crack Propagation of Steels during Low-CycleThermal-Mechanical and Isothermal Fatigue at Elevated Temperatures",Metallurgical Transactions, Vol. 14A, 1983, pp. 1641-1648.
249

[2.63] M.S. Starkey and R.P. Skelton "A Comparison of the Strain Intensity and theCyclic J Approaches to Crack Growth", Fatigue of Engineering Materials andStructures, Vol. 5, No. 4, 1982, pp. 329-341.
[2.64] M. R6ger and L. Remy in Fracture and the Role of Microstructure, Proceedings ofthe 4th European Conference on Fracture, Engineering Materials AdvisoryServices Ltd, Cradley Heath, U.K., Vol. 2, 1982, pp. 531-538.
[2.65] M. R6ger, F. Soniak and L. Remy in International Conference on Fatigue andFatigue Thresholds, C.J. Beevers, eds., Engineering Materials Advisory ServicesLtd, Cradley Heath, U.K., 1984, pp. 797-806.
[2.66] M. Okazaki, I. Hattori, F. Shiraiwa and T. Koizumi, "Effect of Strain WaveShape on Low Cycle Fatigue Crack Propagation of SUS 304 Stainless Steel atElevated Temperatures", Metallurgical Transactions, Vol. 14A, 1983, pp. 1649-1659.
[2.67] J.S. Huang and R.M. Pelloux, "Low Cycle Fatigue Crack Propagation inHastelloy-X at 25C and 760C", Metallurgical Transactions, Vol. 11A, 1980, pp.899-904.
[2.68] M.H. El. Haddad, K.N. Smith and T.H. Topper, "Fatigue Crack Propagation ofShort Cracks", ASME, CSME Joint Conference on Pressure Vessels and Piping,Nulcear Energy and Materials, Montreal, June 25-29, 1978.
[2.69] M.H. El Hadda, K.N. Smith and T.H. Topper, Journal of Engineering MaterialsTechnology, Vol. 101, 1979, pp. 42-46.
[2.70] H. Kitagawa, S. Takahasi, "Applicability of Fracture Mechanics to Very SmallCracks", Second International Conference on Mechanical Behavior of Materials,Boston, MA, Aug. 1976, pp. 627-631.
[2.71] M.H. El Haddad, N.E. Dowling, T.H. Topper, and K.N. Smith, "J-IntegralApplications for Short Fatigue Cracks at Notches", International Journal ofFracture, Vol. 16, No. 1, February 1980.
[2.72] H. Ohuchida, S. Usami and A. Nishioka, "Elastic-Plastic Approach to FatigueCrack Propagation and Fatigue Limit of Materials with Cracks", Preprint of the3rd International Conference on Fracture, Munchen, 1973, V-442/A.
[2.73] H. Ohuchida, S. Usami and A. Nishioka, "Fatigue Limit of Steel with Cracks",Japanese Society of Mechanical Engineers, Vol. 18, No. 125, Nov. 1975, p.1185.
[2.741 S. Usami and S. Shida, "Elastic-Plastic Analysis of the Fatigue Limit for AMaterial with Small Flaws", Fatigue of Engineering Materials and Structures, Vol.1, 1979, pp. 471-481.
[2.75] M.M. Hammouda, R.A. Smith and K.J. Miller, "Elastic-Plastic FractureMechanics for Initiation and Propagation of Notch Fatigue Cracks", Fatigue ofEngineering Materials and Structures, Vol. 2, 1979, pp. 139-154.
250

[2.76] M.M. Hammounda and K.J. Miller, "Elastic-Plastic Fracture Mechanics Analysesof Notches", Elastic-Plastic Fracture, ASTM STP 668, J.D. Landes, J.A. Begleyand G.A. Clarke, eds., American Society for Testing and Materials, Philadephia,PA, 1979, pp. 703-719.
[2.77] J. Lankford, "The Growth of Small Cracks in 7075-76 Aluminum", Fatigue ofEngineering Materials and Structures, Vol. 5, 1982, pp. 233-248.
[2.78] K. Tanaka, Y. Nakai and M. Yamashita, "Fatigue Growth Threshold of SmallCracks", International Journal of Fracture.
[2.79] S. Taira, K. Tanaka and Y. Nakai, "A Model of Crack Tip Slip Band Blocked byGrain Boundary", Mechanics Research Communication, Vol. 5, No. 6, 1978, p.375.
[2.80] Y. Nakai and K. Tanaka, "Grain Size Effect on Growth Threshold for SmallSurface Cracks and Long Through Cracks under Cyclic Loading", Proceedings of23rd Japan Congress on Materials Research, 1980.
[2.81] S. Taira, K. Tanaka and M. Hoshina, "Grain Size Effect on Crack Nucleation andGrowth in Long-Life Fatigue of Low Carbon Steel", Fatigue Mechanisms, ASTMSTP 675, 1979, p. 135.
[2.82] W.L. Morris, M.R. James and 0. Buck, "Growth Rate Models for Short SurfaceCracks in Al 2219-T851", Metallurgical Transactions, Vol. 12A, January 1981,pp. 57-64.
[2.83] W.L. Morris and M.R. James, "A Simple Model of Stress Intensity RangeThreshold and Crack Closure Stress", Engineering Fracture Mechanics, Vol. 18,No. 4, 1983, pp. 871-877.
[2.84] W.L. Morris, Metallurgical Transactions, Vol 8A, 1977, p. 589.
[2.85] A.E. Green and I.N. Sneddon, Proc. Cambridge Phil. Soc., Vol. 46, 1950, p.159.
[2.86] R.A. Smith, International Journal of Fracture, Vol. 13, 1977, p. 717.
[2.87] C.Y. Yang and H.W. Liu, Scripta Metallurgica, Vol. 14, 1980, p. 785.
[2.88] W.L. Morris, M.R. James and 0. Buck, Metallurgical Transactions, Vol. 12A,1981, p. 57.
[2.89] W.L. Morris, Metallurgical Transactions, Vol. 11A, 1980, p. 1117.
[2.90] V. Shahani and H.G. Popp, Evaluation of Cyclic Behavior of Aircraft TurbineDisk Alloys, General Electric Aircraft Engine Group, NASA-CR-159433, 1978.
[2.91] B.A. Cowles, D.L. Sims and J.R. Warren, Evaluation of the Cyclic Behavior ofAircraft Turbine Disk Alloys, Pratt and Whitney Aircraft Group, NASA-CR-159409, 1978.
251

[2.92] B.A. Cowles, D.L. Sims and J.R. Warren, Evaluation of the Cyclic Behavior ofAircraft Turbine Disk Alloys, Part 11, Pratt and Whitney Aircraft Group, NASA-CR-165123, 1980.
[2.93] B.A. Cowles, D.L. Sims, J.R. Warren and R.V. Miner, Jr., "Cyclic Behavior ofTurbine Disk Alloys at 650C", Journal of Engineering Materials and Technology,Vol. 102, 1980, pp. 356-363.
[2.94] J.E. King, "Fatigue Crack Propagation in Nickel-base Superalloys - Effects ofMicrostructure, Load Ratio and Temperature", Materials Science and Technology,Vol. 3, 1987, pp. 751-764.
[2.95] M.A. Hicks and C.W. Brown, "A Comparison of Short Crack Growth Behaviorin Engineering Alloys", Fatigue '84, C.J. Beevers, ed., Engineering MaterialsAdvisory Services Ltd., Cradley Heath, UK, 1984, pp. 1337-1347.
[2.96] C.W. Brown, J.E. King and M.A. Hicks, "Effects of Microstructure on Longand Short Crack Growth in Nickel Base Superalloys", Metal Science, Vol. 18,1984, pp. 374-380.
[2.97] C.W. Brown and J.E. King, "The Relevance of Microstructural Influences in theSort Crack Regime to Overall Fatigue Resistance", Small Fatigue Cracks, R.O.Ritchie and J. Lankford, eds., The Metallurgical Society of AIME, 1986, pp. 73-95.
[2.98] P.T. Newman and C.J. Beevers, "The Initiation and Growth of Microcracks inNickel-Base Superalloys", Fatigue '84, C.J. Beevers, ed., EMAS, Birmingham,1984, pp. 785-797.
[2.99] P. Newman and C.J. Beevers, "Growth of Short Fatigue Cracks in High StrengthNi-Base Superalloys", in Small Fatigue Cracks, R.O. Ritchie and J. Lankford,eds., The Metallurgical Society of AIME, 1986, pp. 97-116.
[2.100] J. Feng, Ph.D. Thesis, MIT, 1987.
[2.101] F. Soniak and L. Remy, "Fatigue Growth of Long and Short Cracks in a PowderMetallurgy Nickel-Base Superalloy", EGF Pub. 1, K.J. Miller and E.R. de losRios, eds., Mechanical Engineering Publications, London, 1986, pp. 133-142.
[2.102] R.S. Vecchio and R.W. Hertzberg, "A Rationale for the 'Apparent Anomalous'Growth Behavior of Short Fatigue Cracks", Engineering Fracture Mechanics,Vol. 22, No. 6, 1985, 1049-1060.
[2.103] J.F. McCarver and R.O. Ritchie, "Fatigue Crack Propagation Threshold for Longand Short Cracks in Ren6 95 Nickel-base Superalloy", Materials Science andEngineering, Vol. 55, 1982, pp. 63-67.
[2.104] J. Lankford, T.S. Cook and G.P. Sheldon, "Fatigue Microcrack Growth in aNickel-Base Superalloy", International Journal of Fracture, Vol. 17, 1981, pp.143-155.
252
[2.105] G.P. Sheldon, T.S. Cook, J.W.Jones and J. Lankford, "Some Observations onSmall Fatigue Cracks in a Superalloy", Fatigue of Engineering Materials andStructures, Vol. 3, 1981, pp. 219-228.
[2.106] S.J. Hudak Jr., D.L. Davidson, K.S. Chan, A.C. Howland and M.J. Walsch,Growth of Small Cracks in Aeroengine Disk Materials, AFWAL-TR-88-4090, AirForce Wright Aeronautical Laboratories, 1988.
[2.107] B.N. Leis, D.P. Goetz, J. Ahmad, A.T. Hopper and M.F. Kanninen, MechanicsAspects of Microcrack Growth in Inconel 718 - Implications for EngineRetirement for Cause Analysis, AFWAL-TR-84-4041, Air Force WrightAeronautical Laboratories, 1984.
[2.108] T.S. Cook, J. Lankford and G.P. Sheldon, Research on Growth of Microcracksin Nickel-Base Superalloys, AFML-TR-78-133, Air Force Wright AeronauticalLaboratories, 1978.
[2.109] R.H. Van Stone and M.F. Henry, Processing Effects on Microstructure andFatigue Properties of Nickel-Base Superalloys, NADC-80124-60, Naval AirDevelopment Center, 1982.
[3.1] F. Schubert, "Temperature and Time Dependent Transformation: Application toHeat Treatment of High Temperature Alloys", Phase Stability in HighTemperature Alloys, Applied Science Publishers, 1980, pp. 119-149.
[3.2] C. Sims and W. Hagel, eds., The Superalloys, John Wiley and Sons, 1972.
t3.3] R.F. Decker, "Strengthening Mechanisms in Nickel-Base Superalloys", SteelStrengthening Mechanisms Symposium, Zurich, Switzerland, May 1969.
[3.4] M. Donachie, Jr., ed., Superalloys Source Book, American Society for Metals,1984.
[3.5] J.M. Oblak, D.F. Paulonis and D.S. Duval, "Coherency Strengthening in Ni-Base Alloys Hardened by D022", Journal of Metals, October 1969, pp. 34-38.
[3.6] U.S. Patent 3519503, July 7, 1970.
[3.7] G. Bellows, Low Stress Grinding, Machinability Data Center, Pub. No. MDC,78-103, 1978.
[3.8] R. Pelloux, J. Feng and G. Romanoski, A Study of the Fatigue Behavior ofSmall Cracks in Nickel-Base Superalloys, Final Report, Grant #AFOSR-84-0075, 1988.
[3.9] S.J. Hudak, Jr., A. Saxena, R.J. Bucci and R.C. Malcolm, Development ofStandard Methods of Testing and Analyzing Fatigue Crack Growth Rate Data,Technical Report AFML-TR-78-40, 1978.
[3.10] G.R. Irwin, Journal of Applied Mechanics, Trans. ASME, V. 29, No. 4, 1962,pp. 651-654.
253
[3.11] I.N. Sneddon, "The Distribution of Stress in the Neighborhood of a Crack in anElastic Solid", Proc. Roy. Soc. London, A187, 1946, pp. 229-260.
[3.12] J.C. Newman, Jr., "A Review and Assessment of the Stress Intensity Factors forSurface Cracks", Part-Through Crack Fatigue Life Prediction, ASTM STP 687,J.B. Chang, ed., American Society for Testing and Materials, 1979, pp. 16-42.
[3.13] H. Nisitani and D.H. Chen, "Stress Intensity Factor for a Semi-Elliptical SurfaceCrack in a Shaft under Tension", Trans. Japan Soc. Mech. Engrs., Vol. 50, No.453, 1984, pp. 1077-1082.
[3.14] I.S. Raju and J.C. Newman, Jr., Stress Intensity Factors for CircumferentialSurface Cracks in Pipes and Rods under Tension and Bending Loads, NASATechnical Memorandum 87594, 1985.
[4.1] J.M. Larsen, B.J. Schwartz, C.G. Annis Jr., Cumulative Damage FractureMechanics under Engine Spectra, Pratt and Whitney Aircraft Group, AFML-TR-79-4159, 1980.
[4.2] J. Lankford, D.L. Davidson and T.S. Cook, "Fatigue Crack Tip Plasticity",Cyclic Stress-Strain and Plastic Deformation Aspects of Fatigue Crack Growth,ASTM STP 637, 1977, pp. 36-55.
[4.3] J.R. Rice, "Mechanics of Crack Tip Deformation and Extension by Fatigue",Fatigue Crack Propagation, ASTM STP 415, 1967, pp. 247-311.
[4.4] D. Broek, Elementary Engineering Fracture Mechanics, Noordhoff InternationalPublishing, The Netherlands, 1974.
[4.5] R.A. Smith, "On the Short Crack Limitations of Fracture Mechanics",International Journal of Fracture, Vol. 13, 1977, pp. 717-720.
[4.6] D. Brock and J. Schijve, The Influence of the Mean Stress on the Propagation ofFatigue Cracks in Aluminum Alloy Sheet, NLR-TR M.2111, National Lucht-enRuimtevaart/Aboratorium, January 1963.
[4.7] J.C. McMillan and R.M. Pelloux, "Fatigue Crack Propagation under Program andRandom Loads", Fatigue Crack Propagation, ASTM STP 415, 1967, pp. 505-535.
[4.8] F. Erdogan, Crack Propagation Theories, NASA CR901, National Aeronauticsand Space Administration, October 1967.
[4.9] K. Walker, "The Effect of Stress Ratio during Crack Propagation and Fatigue for2024-T3 and 7075-T6 Aluminum", Effects of Environment and Complex LoadHistory on Fatigue Life, ASTM STP 462, 1970, pp. 1-14.
[4.10] R.G. Forman, V.E. Kearney and R.M. Engle, "Numerical Analysis of CrackPropagation in Cyclic-Loaded Structures", Journal of Basic Engineering,September 1967, pp. 459-464.
[4.11] W. Elber, "The Significance of Fatigue Crack Closure", Damage Tolerance inAircraft Structures, ASTM STP 486, 1971, pp. 230-242.
254

[4.12] M. Jolles, "Constraint Effects on the Prediction of Fatigue Life of SurfaceFlaws", Journal of Engineering Materials and Technology, Vol. 105, 1983, pp.215-218.
[4.13] M. Katchner and M. Kaplani, "Effect of R-Factor and Crack Closure on FatigueCrack Growth Rate for Aluminum and Titanium Alloys", Fracture Toughness andSlow Stable Cracking, ASTM STP 559, 1974, pp. 264-282.
[4.14] J. Feng, The Fatigue Behavior of Small Cracks in Nickle-Base Superalloys,Ph.D. Thesis, Massachusetts Institute of Technology, 1987.
[4.15] D. Kreuger, Effects of Grain Size and Precipitate Size on the Fatigue CrackGrowth Behavior of Alloy 718 at 427C, M.S. Thesis, University of Cincinnati,1985. Also: G.E. Aircraft Engine Group Report #R85AEB 133.
[4.16] J.H. Hollomon, Trans. AIME, 162, 1945,p. 268.
[4.17] W. Ramberg and W.R. Osgood, Description of Stress-Strain Curves by ThreeParameters, NACA Tech. Note No. 902, 1943.
[4.18] W.R. Osgood, "Stress-Strain Formulas", Proc. J. Aeronaut. Sci., Vol. 13,1946, pp. 45-48.
[4.19] J. Bauschinger, Zivilingur, Vol. 27, 1881, pp. 289-347.
[4.20] R.E. Stolz and R.M. Pelloux, "The Bauschinger Effect, Monotonic and CyclicHardening in Precipitation-Strengthening Aluminum Alloys", Work Hardening inTension and Fatigue, The Metallurgical Society of AIME, A.W. Thomson, ed.,1975, pp. 224-239.
[4.21] B. Hunsaker Jr., D.K. Vaugham and J.A. Stricklin, "A Comparison of theCapability of Four Hardening Rules to Predict a Materials Plastic Behavior",Journal of Pressure Vessel Technology, Trans. AIME, Feb. 1976, pp. 66-74.
[4.22] R.P. Skelton, "Cyclic Stress-Strain Properties during High Strain Fatigue", HighTemperature Fatigue, Elsevier Applied Science, 1987, pp. 27-112.
[4.23] Evaluation of the Cyclic Behavior of Aircraft Turbine Disk Alloys, Pratt andWhitney Aircraft Group, NASA-CR-165123, 1980.
[4.24] J. Hill, private communication, Pratt and Whitney Aircraft Group.
[5.1] K.J. Miller in The Behavior of Short Fatigue Cracks, K.J. Miller and E.R. de losRios, eds., University Press, Cambridge, 1986.
[5.2] S.J. Maddox, "The Effect of Mean Stress on Fatigue Crack Propagation, ALiterature Review", International Journal of Fracture, Vol. 11, No. 3, 1975, pp.389-408.
[5.3] T.R. Gurney, "The Effect of Mean Stress and Material Yield Stress on FatigueCrack Propagation in Steels", Metal Constr., Vol. 1, No. 2, 1969, p. 91.
255

[5.4] T.W. Crooker and E.A. Lange, Fatigue Crack Propagation in a High StrengthSteel under Constant Cyclic Load with Various Mean Loads, NRL Report No.6805, Nov. 1968.
[5.5] T.W. Crooker, Effect of Tension Compression Cycling on Fatigue Crack Growthin High Strength Alloys, NRL Report No. 7220, January 1971.
[5.6] J.K. Musuva and J.C. Radon, "The Effect of Stress Ratio and Frequency onFatigue Crack Growth", Fatigue of Engineering Materials and Structures, Vol. 1,1979, pp. 457-470.
[5.7] R.M. Gamble and P.C. Paris, "Cyclic Crack Growth Analysis for NotchedStructures at Elevated Temperatures", Mechanics of Crack Growth, ASTM STP590, American Society for Testing and Materials, 1976, pp. 345-367.
[5.8] J.M. Larsen, J.C. Williams and A.W. Thompson, "Crack Closure Effects on theGrowth of Small Surface Cracks in Titanium-Aluminum Alloys", Mechanics ofFatigue Crack Closure, ASTM STP 982, J.C. Newman Jr. and W. Elber, eds.,American Society for Testing and Materials, Philadephia, 1988, pp. 149-167.
[5.9] G.O. Njus and R.I. Stephens, "The Influence of Yield Strength and NegativeStress Ratio on Fatigue Crack Growth Delay in 4140 Steel", International Journalof Fracture, Vol. 13, No. 4, 1977, pp. 455-466.
[5.10] R.I. Stephens, G.W. McBurney and L.J. Oliphant, "Fatigue Crack Growth withNegative R-ratio Following Tensile Overloads", International Journal of Fracture,Vol. 10, 1974, pp. 587-589.
[5.11] D. Gan and J. Weertman, "Crack Closure and Crack Propagation Rates in 7050Aluminum", Engineering Fracture Mechanics, Vol. 15, No. 1-2, 1981, pp. 87-106.
[5.12] W.N. Sharpe Jr., "Interferometric Surface Strain Measurement", InternationalJournal of Nondestructive Testing, Vol. 3, 1971, pp. 59-76.
[5.13] W.N. Sharpe Jr. and D.R. Martin, An Optical Gage for StrainlDisplacementMeasurements at High Temperature Near Fatigue Crack Tips, Air Force MaterialsLaboratory Report AFML-TR-77-153, Wright Patterson Air Force Base, OH,1977.
[5.14] W.N. Sharpe Jr. and M. Ward, "Benchmark Cyclic Plastic Notch StrainMeasurements", Journal of Engineering Materials and Technology, Trans.ASME, Vol. 105, 1983, pp. 235-241.
[5.15] J.R. Jira, T. Weerasooria, T. Nicholas and J.M. Larsen, "Effects of Closure onthe Fatigue Crack Growth of Small Surface Cracks in a High Strength TitaniumAlloy", Mechanics of Crack Closure, ASTM STP 982, J.C. Newman Jr. and W.Elber, eds., American Society for Testing and Materials, Philadelphia, 1988, pp.617-635.
[5.16] M.N. James and W.N. Sharpe Jr., "Closure Development and Crack OpeningDisplacement in the Short Crack Regime for Fine and Coarse Grained A533B
256
Steel", Fatigue and Fracture of Engineering Materials and Structures, Vol. 12,No. 4, 1989, pp. 347-361.
[5.17] J.J. Lee and W.N. Sharpe Jr., "Closure Measurements on Short Fatigue Cracks",Mechanics of Fatigue Crack Closure, ASTM STP 982, J.C. Newman Jr. and W.Elber, eds., American Society for Testing and Materials, Philadelphia, 1988, pp.270-278.
[5.18] H. Sehitoglu, "Crack Opening and Closure in Fatigue", Engineering FractureMechanics, Vol. 21, No. 2, 1985, pp. 329-339.
[5.19] N.E. Ashbaugh, "Effects of Load History and Specimen Geometry on FatigueCrack Closure Measurements", Mechanics of Fatigue Crack Closure, ASTM STP982, J.C. Newman Jr. and W. Elber, eds., American Society for Testing andMaterials., Philadelphia, 1988, pp. 186-196.
[5.20] D.E. Macha, D.M. Corbly and J.W. Jones, "On the Variation of Fatigue CrackOpening Load with Measurement Location", Experimental Mechanics, Vol. 19,1979, pp. 207-213.
[5.21] N.S. Iyyer and N.E. Dowling, "Opening and Closing of Cracks at High CyclicStrains", Proceedings of the Second Engineering Foundations Conference /Workshop on Small Fatigue Cracks, The Metallurgical Society, Inc., 1986, pp.213-233.
[5.22] R. McClung and H. Sehitoglu, "Closure Behavior of Small Cracks under HighStrain Fatigue Histories", Mechanics of Fatigue Crack Closure, ASTM STP 982,J.C. Newman Jr. and W. Elber, eds., American Society for Testing andMaterials, Philadephia, 1988. pp. 279-299.
[5.23] J.C. Newman Jr., "A Finite Element Analysis of Fatigue Crack Closure",Mechanics of Crack Growth, ASTM STP 590, American Society for Testing andMaterials, 1976, pp. 281-301.
[5.24] C.M. Hudson, Effect of Stress Ratio on Fatigue Crack Growth in 7075-T6 and2024-T3 Aluminum Allcy Specimens, NASA TN D-5390, National Aeronauticsand Space Administration, Washington, D.C., 1969.
[5.25] J.C. Newman Jr. and H. Armen Jr., "Elastic-Plastic Analysis of a PropagatingCrack under Cyclic Loading", AIAA Journal, Vol. 13, No. 8, 1975, pp. 1019-1023.
[5.26] K. Ohji, K. Ogura and Y. Ohkubo, "Cyclic Analysis of a Propagating Crack andits Correlation with Fatigue Crack Growth", Engineering Fracture Mechanics,Vol. 7, No. 3, 1975, pp. 457-464.
[5.27] M. Nakagaki and S.N. Atluri, "Elastic-Plastic Analysis of Fatigue Crack Closurein Modes I and II", AIAA Journal, Vol. 18, 1980, pp. 1110-1117.
[5.28] T. Nicholas, A.N. Pulazotto and E. Bednarz, "An Analytical Investigation ofPlasticity Induced Closure Involving Short Cracks", Mechanics of Fatigue CrackClosure, ASTM STP 982, J.C. Newman Jr. and W. Elber, eds., AmericanSociety for Testing and Materials, 1988, pp. 361-377.
257

[5.29] B. Budiansky and J.W. Hutchinson, "Analysis of Closure in Fatigue CrackGrowth", Journal of Applied Mechanics, Trans. ASME, Vol. 45, 1978, pp. 267-276.
[5.30] M. Kanninen and Atkinson, "Application of an Inclined-Strip-Yield Crack-TipPlasticity Model to Predict Constant Amplitude Fatigue Crack Growth",International Journal of Fracture, Vol. 16, 1980, pp. 53-69.
[5.31] J.C. Newman Jr., "A Crack-Closure Model for Predicting Fatigue Crack Growthunder Aircraft Spectrum Loading", Methods and Models for Predicting FatigueCrack Growth under Random Loading, ASTM STP 748, J.B. Chang and C.M.Hudson, eds., American Society for Testing and Materials, 1981, pp. 53-64.
[5.32] D.S. Dugdale, "Yielding of Steel Sheets Containing Slits", Journal of Mechanicsand Physics of Solids, Vol. 8, 1960, pp. 100-104.
[5.33] J.C. Newman Jr., "A Crack Opening Stress Equation for Fatigue Crack Growth",International Journal of Fracture, Vol. 24, pp. R131-R 135, 1984.
[5.34] H. Nakamura and H. Kobayashi, "Analysis of Fatigue Crack Closure Caused byAsperities Using the Modified Dugdale Model", Mechanics of Fatigue CrackClosure, ASTM STP 982, J.C. Newman Jr. and W. Elber, eds., AmericanSociety for Testing and Materials, Philadelphia, 1988, pp. 459-474.
[5.35] H. Nakamura, H. Kobayashi, S. Yanase and H. Nakazawa, Transactions of theJapan Society of Mechanical Engineers, Vol. 51A, 1985, pp. 148-151 (inJapanese).
[5.36] P.L. Lalor and H. Sehitoglu, "Fatigue Crack Closure Outside a Small ScaleYielding Regime" in Mechanics of Fatigue Crack Closure, ASTM STP982, J.C.Newman Jr. and W. Elber, eds., American Society for Testing and Materials,Philadelphia, 1987, pp. 342-360.
258