Multipole electrostatics in hydration free energy calculations
Journal of Archaeological Science (1999) 26, 735–752Article No. jasc.1988.0342, available online at http://www.idealibrary.com on
The Failure of Obsidian Hydration Dating: Sources,Implications, and New Directions
Lawrence M. Anovitz
Chemical and Analytical Sciences Division, MS 6110, P.O. Box 2008, Building 4500S, Oak Ridge NationalLaboratory, Oak Ridge, Tennessee 37831–6110, U.S.A.
J. Michael Elam
Department of Anthropology, University of Tennessee, Knoxville, Tennessee 37996, U.S.A.
Lee R. Riciputi
Chemical and Analytical Sciences Division, MS 6365, P.O. Box 2008, Building 5510B, Oak Ridge NationalLaboratory, Oak Ridge, Tennessee 37831–6365, U.S.A.
David R. Cole
Chemical and Analytical Sciences Division, MS 6110, P.O. Box 2008, Building 4500S, Oak Ridge NationalLaboratory, Oak Ridge, Tennessee 37831–6110, U.S.A.
(Received 6 January 1998, revised and accepted 20 August 1998)
Obsidian hydration dating (OHD) originally promised to be a rapid, inexpensive, simple and reliable method for datingobsidian artefacts. The perceived elegance of OHD resulted in rapid acceptance and widespread application despitequestions concerning its theoretical rigor. With increased usage it has become evident that, while economical, simpleand fast, OHD is unreliable. Here results of a secondary ion mass spectrometry (SIMS) study of obsidian and syntheticglass artefacts are presented that explain why OHD has not lived up to expectations. The results suggest that thestandard OHD equations are inappropriate and that traditional optical measurements are inherently flawed. Althoughsignificant refinement will be needed, the results suggest that both chronological and palaeoclimatic data might beobtained from glass hydration rims through an improved analytical methodology and more rigorous treatment of thedata. ? 1999 Academic Press
Keywords: OBSIDIAN, SECONDARY ION MASS SPECTROMETRY, SIMS, DIFFUSION, HYDRATIONDATING, GLASS, BECKE LINE, ANISOTROPY, FINITE DIFFERENCE MODELLING, CHALCO,COPAN, XALTOCAN, MESOAMERICA, MATANO INTERFACE.
‘‘Nor can they follow the atoms one by oneTo see the law that governs all events’’
LucretiusDe Rerum Natura, Book II
Introduction
R idings (1996), in a review of obsidian hydrationdating (OHD), raised the pointed question,‘‘Where in the world does obsidian hydration
dating work?’’ This statement reflects the frustration of
7350305–4403/99/070735+18 $30.00/0
many archaeologists and geologists over a datingtechnique that has been long on promise but shorton results. This report demonstrates that the prob-lems with OHD are due, in part, to use of bothinappropriate analytical techniques and an impropermodel of the hydration process. The implications affectnot only archaeological and geological applicationsof OHD, but also modelling of the decomposition ofnuclear waste storage glasses. Our results suggest,however, that refinement of the OHD technique ispossible in a manner which will both improve itsaccuracy and precision, and potentially expand its
? 1999 Academic Press
736 L. M. Anovitz et al.
utility by generating palaeoenvironmental as well aschronological data.
The potential of obsidian as a chronometer was firstrecognized by Friedman & Smith (1960). They notedthat the exposed surfaces of ancient obsidian artefactshad absorbed water, that this hydration rim wasvisible under high-power magnification, and that itswidth was dependent on time, chemical composition(obsidian source), and temperature. Later workshowed that dates could be obtained by two methods.In ‘‘empirical rate dating’’ (Meighan, Foote &Aiello, 1968; Kimberlin, 1976; Meighan, 1976;Findlow & Bennett, 1978), rim widths are cor-related to independent chronometric data (e.g., radio-carbon). In ‘‘intrinsic rate dating’’, dates are producedby ratioing rim widths to laboratory-determinedhydration rates, eliminating the need for indepen-dent chronometry (Friedman, Smith & Long, 1966;Ambrose, 1976; Friedman & Long, 1976; Michels,Tsong & Smith, 1983; Michels, Tsong & Nelson, 1983).
Intrinsic rate dating was received with greatenthusiasm because it not only offered a means ofdirectly dating obsidian artefacts, but was simple,rapid, inexpensive, and allowed a large number ofchronometric determinations to be obtained from asingle site. This meant that problems of chronologycould be addressed from a statistical perspective, some-thing rarely possible with other approaches. Despitethis great promise, consistently reliable results have notbeen achieved.
Here, we present an overview of the theoretical basisof OHD, discuss reasons for its failure as currentlyapplied, and provide possible solutions using newanalytical and modelling approaches. We use concen-tration versus depth-profiles of hydrogen and otherelements in obsidian rims, obtained using secondaryion mass spectrometry (SIMS), to show that the shapeof the water profile is inconsistent with that predictedusing current OHD equations, indicating that thetheoretical basis for OHD is flawed. Furthermore, wepresent evidence that, from sample to sample, theposition of the optically-measured depth used in tra-ditional OHD varies relative to the actual water profiledetermined by SIMS, indicating that optical determi-nation of hydration depth is, at best, uncertain. Wedemonstrate that the optically observed sharp front ispartially an artefact of the optical properties of visiblelight, and that these uncertainties place severe limi-tation on the precision obtainable using opticalmethods. Thus, it is unlikely that optical measurementswill ever provide a useful means of obtaining quanti-tative dates from hydrated obsidian. Finally, wepresent preliminary results of finite-difference model-ling of water depth-profiles obtained by SIMS. Thesemodels take into account the concentration-dependentrate of water diffusion in obsidian, and demonstratethat the measured water profile can be preciselymodelled. The results suggest, not only that it may bepossible to obtain quantitative dates from hydrated
obsidians, but also that it may be possible to derivevaluable palaeoclimatic information from thehydration profiles.
Archaeological BackgroundBecause of its perceived advantages, intrinsic-rateOHD has been employed to address chronologicalproblems in a number of regions throughout the worldwhere obsidian was readily available for use as tools(see Ridings, 1996, for a review). Its principal appli-cation, however, has been in Mesoamerica and thewestern portion of the United States. Although OHDhas produced reasonable results in some instances (e.g.,Stevenson, Carpenter & Scheetz, 1989; Stevenson,Sheppard & Sutton, 1996), it has more often provenunreliable even when the archaeological contexts havebeen well-controlled. In some cases, dates obtainedby OHD are so different from previous data thatsignificant controversies have arisen.
Nowhere has OHD been more controversial thanin Mesoamerica, particularly in the Mayan area. AtCopan, Honduras, a comprehensive programme ofOHD was undertaken in order to test the widely heldinterpretation that Copan was abandoned suddenly(Webster & Freter, 1990). This project dated nearly2000 obsidian artefacts by the intrinsic-rate method.The distribution of the resulting dates suggested thatthe Coner phase, or the terminal period of the city,extended into the 13th century ; a result whichsuggests that the collapse of Copan occurred slowlyover some 300–400 years. In contrast, monumentsinscribed with long count dates, as well as the appear-ance of a new ceramic tradition, indicate that Copancollapsed catastrophically (cf. Manahan, 1996). Thecontroversy that has ensued from these conflicting linesof evidence has led to considerable debate over thenature of the collapse of Classic Mayan civilizationand the validity of OHD (Braswell, 1992; Freter, 1992;Webster, Freter & Rue, 1993; Manahan, 1996; Cowgill& Kintigh, 1997).
Recently, Braswell, Glascock & Neff, (1996)attempted to use an alternative method of intrinsic-rateOHD, based on measurement of hydrated fissuresalong the surfaces of obsidian artefacts recovered fromCopan, in an attempt to eliminate possible error dueto surface dissolution (Ambrose, 1994). Using thismethod, in combination with new in situ measurementsof site temperature and humidity, which produced arate constant nearly twice that employed in the originalstudy, they calculated dates for six artefacts. Paradoxi-cally, the distribution of the dates was similar to thatobtained originally. This result strongly suggests thatthere must be a fundamental problem with the OHDmethod which, we show, lies in the use of an inappro-priate model of the hydration process, and the inherentinaccuracy of the optical measurements.
In other areas of Mesoamerica, OHD has also failedto produce meaningful results. In the Valley of Oaxaca,
Failure of Obsidian Hydration Dating 737
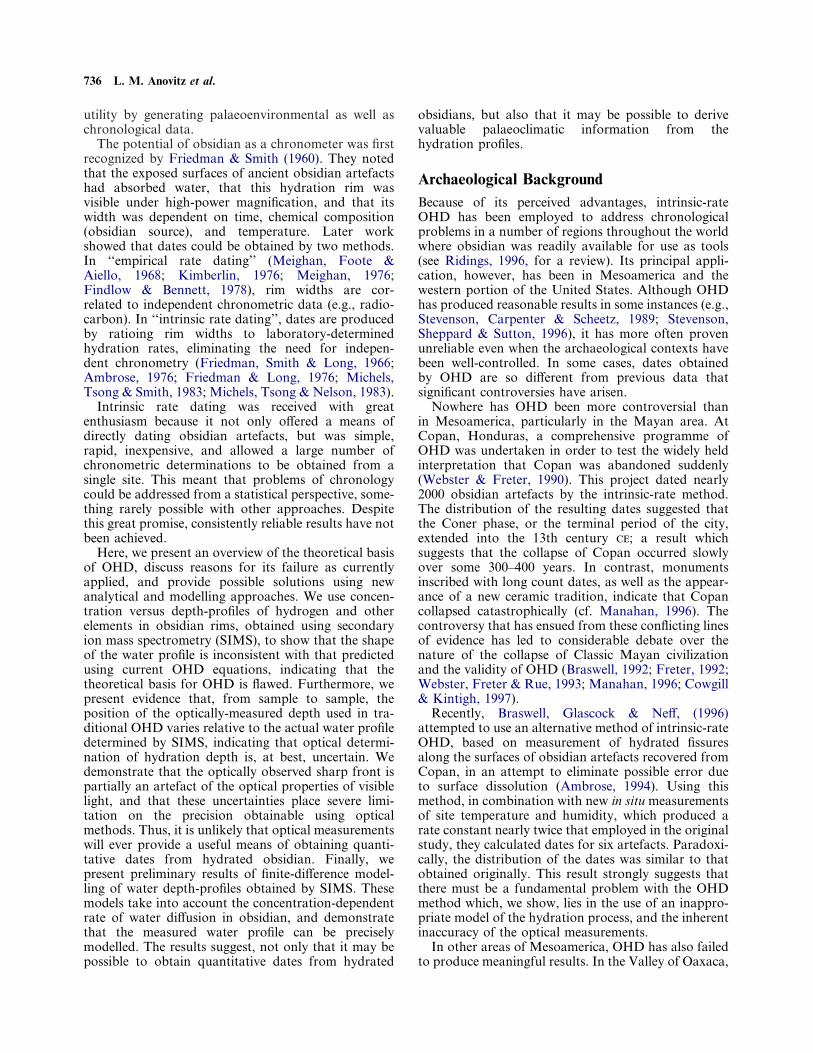
Mexico, the centre of ancient Zapotec civilization,more than 500 obsidian artefacts were dated toclarify demographic patterns and refine ambiguitiesin the Oaxacan ceramic seriation (Elam, 1993; Elam,Glascock & Neff, 1994). Despite use of a comprehen-sive dating protocol, which included both intrinsic andempirical approaches, the results so contradicted otherchronological data that they failed to provide definitiveconclusions. Another study at Chalco, Mexico, animportant Aztec city-state, dated 120 obsidian arte-facts to refine the site’s settlement history (Elam,unpubl.). The results, however, agree poorly withradiocarbon dates directly associated with the datedartefacts (Figure 1). The discrepancy is so large that itcannot be attributed to faulty environmental monitor-ing or stratigraphic complexity, but again suggests theexistence of a fundamental problem with the OHDmethod itself. Elam (1993) concluded that, whileuncertainties in temperature and relative humidityundoubtedly contributed to the uncertainty of theresults, the chief obstacle probably lay in the difficultyof modelling the hydration process in the naturalenvironment.
Analysis of obsidian artefacts at the site of Otumba,Mexico, an important craft centre during Aztec times,also failed to produce easily interpretable results(Nichols & Charlton, 1996). This work was aimed atclarifying the Aztec period chronology of the site, butlittle insight was gained from the OHD data, whichshowed a great deal of scatter, and did not correspondwell with associated radiocarbon dates. Carefulexcavation eliminated the possibility of error due tostratigraphic mixing, and the authors suggested that,again, the OHD method itself was at fault.
Two other studies in the Basin of Mexico, atCihuatecpan and Teotihuacan, produced results thatwere only slightly better than those obtained at Chalcoand Otumba (Evans & Freter, 1996; Manzanilla,Lopez & Freter, 1996). In addition, Cowgill (1996)
noted that the conclusions of the study of Evans &Freter (1996) were flawed by insufficient statisticalanalysis. Cowgill found that many of the conclusionscould be explained as the result of simple statisticaluncertainty. While both Evans & Freter (1996) andManzanilla, Lopez & Freter (1996) claim that thelimitations of their results merely reflects the nascentnature of the technique, it is clear from their results, aswell as from those previously mentioned, that despitenearly 40 years of effort, OHD still cannot be reliedupon to yield reasonable results in most cases. Evenin those cases where it is successful, the availabilityof corroborating evidence from a second, morereliable technique is essential before the results can beaccepted.
Similarly, OHD has not proven reliable, or particu-larly helpful, in other regions of the world where it hasbeen employed. At the Borax Lake site in California,standard OHD techniques yielded dates as old as48,000 years, although other data point to an agecloser to 12,000 years. Interestingly, assumption of alinear hydration rate generated much more reasonableresults (Meighan & Haynes, 1970). At other sites in theAmerican west, results have also been mixed and thegreatest success of OHD has been in relative dating ofsurface assemblages (Jones & Beck, 1990). AlthoughOHD has been more sparsely applied in other areas ofthe world, the results have been equally unreliable.Attempts to date obsidian recovered from Pleistoceneand Lower Holocene contexts at the Prospect Farmssite in Kenya produced mixed results, often in pooragreement with other independent evidence (Michels,Tsong & Smith, 1983). In the south-eastern Pacific,several studies have attempted to date obsidian at anumber of archaeological sites. Ambrose (1994) usedan internal fissure technique to date obsidian fromthe Pamwak site in Papua New Guinea. In someinstances, the dates accorded well with associatedradiocarbon dates; in others the agreement was poor.While attempts to date obsidian from late prehistoricand early historic sites in New Zealand were moresuccessful, none of the sites were more than 700 yearsold (Stevenson, Sheppard & Sutton, 1996).
All of these examples illustrate that OHD commonlyproduces poor results and, as in the case of Copan,these can directly contradict well-established epi-graphic and ceramic data. OHD data also commonlycontradict radiocarbon ages as well as results fromother more reliable chronometric techniques. This sug-gests that, at best, OHD as it currently exists is aninconsistent and unpredictable dating method; atworst, it is entirely unreliable.
2000
1800
200
Radiocarbon dates (uncalibrated years BP)
Hyd
rati
on d
ates
(ye
ars
BP)
1400
1000
600
500 1000 15000
2σ = 540 yearsr2 = 0.008
Figure 1. Comparison of hydration ages with associated radio-carbon ages from Mound 65 at the Chalco site, Basin of Mexico.Each hydration date is a weighted mean of a series of dates on six tonine samples from each dated stratum.
Theoretical Basis of Obsidian HydrationDatingIf OHD is to become a reliable chronometric tool, thehydration process needs to be properly understood and
738 L. M. Anovitz et al.
0.8
10
Wei
ght
%
8
6
4
2
0.2 0.4 0.60
A C
B
x = (DT) = 0.1265
4.847
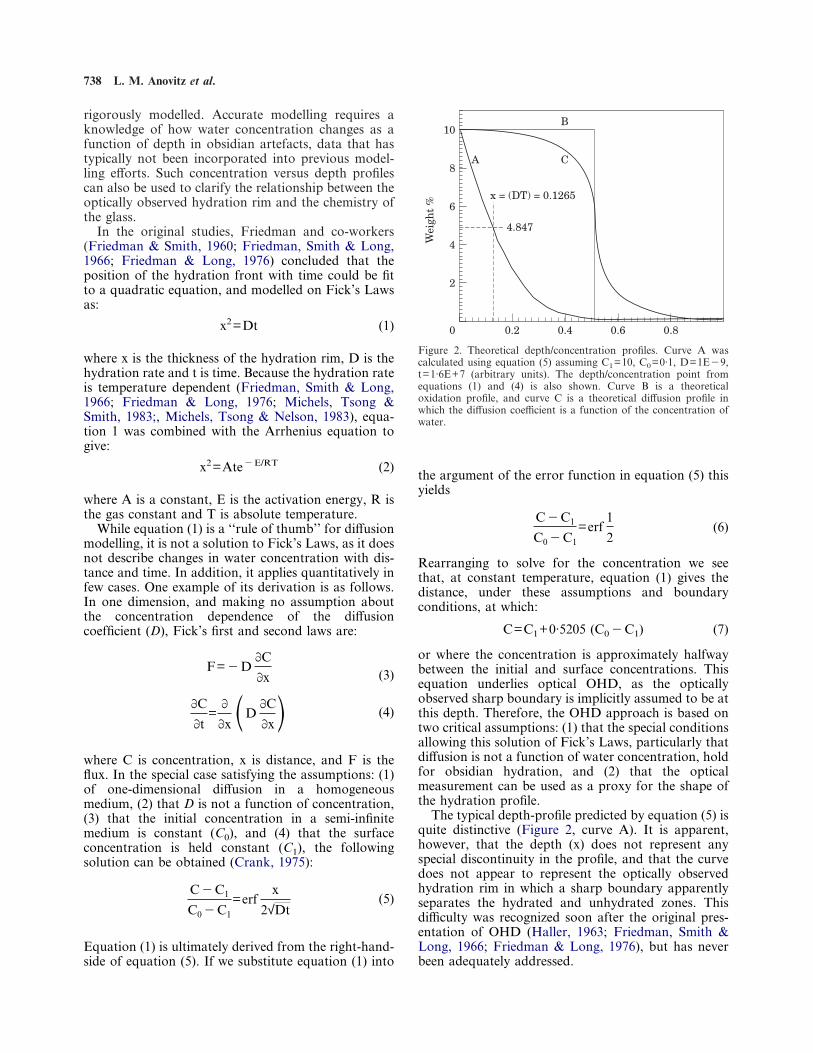
Figure 2. Theoretical depth/concentration profiles. Curve A wascalculated using equation (5) assuming C1=10, C0=0·1, D=1E"9,t=1·6E+7 (arbitrary units). The depth/concentration point fromequations (1) and (4) is also shown. Curve B is a theoreticaloxidation profile, and curve C is a theoretical diffusion profile inwhich the diffusion coefficient is a function of the concentration ofwater.
rigorously modelled. Accurate modelling requires aknowledge of how water concentration changes as afunction of depth in obsidian artefacts, data that hastypically not been incorporated into previous model-ling efforts. Such concentration versus depth profilescan also be used to clarify the relationship between theoptically observed hydration rim and the chemistry ofthe glass.
In the original studies, Friedman and co-workers(Friedman & Smith, 1960; Friedman, Smith & Long,1966; Friedman & Long, 1976) concluded that theposition of the hydration front with time could be fitto a quadratic equation, and modelled on Fick’s Lawsas:
x2=Dt (1)
where x is the thickness of the hydration rim, D is thehydration rate and t is time. Because the hydration rateis temperature dependent (Friedman, Smith & Long,1966; Friedman & Long, 1976; Michels, Tsong &Smith, 1983;, Michels, Tsong & Nelson, 1983), equa-tion 1 was combined with the Arrhenius equation togive:
x2=Ate"E/RT (2)
where A is a constant, E is the activation energy, R isthe gas constant and T is absolute temperature.
While equation (1) is a ‘‘rule of thumb’’ for diffusionmodelling, it is not a solution to Fick’s Laws, as it doesnot describe changes in water concentration with dis-tance and time. In addition, it applies quantitatively infew cases. One example of its derivation is as follows.In one dimension, and making no assumption aboutthe concentration dependence of the diffusioncoefficient (D), Fick’s first and second laws are:
F="D)C
)x
)C
)t=)
)xSD )C
)xD
where C is concentration, x is distance, and F is the
(3)
(4)
flux. In the special case satisfying the assumptions: (1)of one-dimensional diffusion in a homogeneousmedium, (2) that D is not a function of concentration,(3) that the initial concentration in a semi-infinitemedium is constant (C0), and (4) that the surfaceconcentration is held constant (C1), the followingsolution can be obtained (Crank, 1975):
C"C1
C0"C1
=erfx
2√Dt
Equation (1) is ultimately derived from the right-hand-
(5)
side of equation (5). If we substitute equation (1) into
the argument of the error function in equation (5) thisyields
C"C1
C0"C1
=erf1
2
Rearranging to solve for the concentration we see
(6)
that, at constant temperature, equation (1) gives thedistance, under these assumptions and boundaryconditions, at which:
C=C1+0·5205 (C0"C1) (7)
or where the concentration is approximately halfwaybetween the initial and surface concentrations. Thisequation underlies optical OHD, as the opticallyobserved sharp boundary is implicitly assumed to be atthis depth. Therefore, the OHD approach is based ontwo critical assumptions: (1) that the special conditionsallowing this solution of Fick’s Laws, particularly thatdiffusion is not a function of water concentration, holdfor obsidian hydration, and (2) that the opticalmeasurement can be used as a proxy for the shape ofthe hydration profile.
The typical depth-profile predicted by equation (5) isquite distinctive (Figure 2, curve A). It is apparent,however, that the depth (x) does not represent anyspecial discontinuity in the profile, and that the curvedoes not appear to represent the optically observedhydration rim in which a sharp boundary apparentlyseparates the hydrated and unhydrated zones. Thisdifficulty was recognized soon after the original pres-entation of OHD (Haller, 1963; Friedman, Smith &Long, 1966; Friedman & Long, 1976), but has neverbeen adequately addressed.
Failure of Obsidian Hydration Dating 739
A number of factors can complicate the simpleprofiles predicted by equation (5). The sharp frontcommonly observed optically is better approximatedby curve B in Figure 2. Such a profile is typical of theparabolic growth of an oxide layer on a metal sub-strate. While the advance of this front can be modelledby an equation similar to equation (1), such behaviouris seldom observed in real materials (Kirkaldy &Young, 1987). Such oxidation layers commonly con-tain fast diffusion paths, whose concentration maychange with time. Other complicating factors, whichcan generate more complex profiles, include situationsin which the diffusion coefficient D is a function of theconcentration of the diffusing substance (Figure 2,curve C), surface dissolution or reaction during cor-rosion, the effects of diffusion-induced stress and vol-ume changes, reaction of the diffusing species with thematrix, and cross terms in the diffusion matrix formulti-component diffusion. In almost all of these casesequations (1) and (2) are not appropriate. Nonetheless,it remains possible that, with appropriate callibrationsand analytical techniques, a power of t equation maybe usable for dating purposes.
Previously Available DataEvidence suggesting that equations (1) and (2) are poormodels of obsidian hydration has been availablefor some time. Haller (1963) noted that, in general,deviation from error-function solutions to Fick’s Lawis a function of the degree of structural change pro-duced by the migrating species. As water is a networkmodifier in glass, and lowers its viscosity, the diffusioncoefficient of water in glass should increase withincreasing water concentration. This was also noted byFriedman, Smith & Long (1966), who suggested thatwater concentration profiles in hydrated obsidianshould approximate curve B or C (Figure 2), butfailed to recognize the implications of such profiles fordating. In fact, it is well known that diffusion in silicatemelts and many silicate glasses is concentrationdependent. While this work has mostly been doneat temperatures significantly higher than conditionsassociated with the hydration of obsidian artefacts (cf.Zhang, Stolper & Wasserburg, 1991a, b; Behrens &Nowak, 1997; Nowak & Behrens, 1997), the generalprinciples are applicable to obsidian hydration.
Previous analyses of water concentration as a func-tion of depth in hydrated obsidians (Lee et al., 1974;Lanford, 1977, 1978; Laursen & Lanford, 1978; Tsonget al., 1978, 1981) also fail to support the standardmodel. For obsidians, such profiles have beenmeasured using secondary ion mass spectrometry(SIMS), Rutherford backscattering spectroscopy(RBS), and 19F nuclear resonance. In most cases,S-shaped profiles are the norm. Once very near surfacedepths are exceeded, water concentrations are initiallyflat or decrease slowly. This is followed by a region in
which water concentration decreases rapidly, then along ‘‘tail’’ over which water concentration decreasesslowly to background. Such profiles are diagnosticof concentration-dependent diffusion (Crank, 1975).Although the implications were not fully appreciated,the limited depth-profiles available for hydrated syn-thetic glasses, carried out in conjunction with corrosionstudies of proposed nuclear waste forms, producedS-shaped concentration versus depth profiles for water(Lee et al., 1974; Lanford, 1978; Laursen & Lanford,1978; Tsong et al., 1981; Michels, Tsong & Smith,1983; Lodding, 1992; Oversby & Phinney, 1992; Wicks,1992; Clark et al., 1993; Van Iseghem, 1993; Lodding& Van Iseghem, 1995; Salem et al., 1996). Only afew reports, analysing man-made glasses (Moulson& Roberts, 1961; Drury & Roberts, 1963; Roberts &Roberts, 1966; Cockram, Haider & Roberts, 1969;Burns & Roberts, 1970; Lanford, 1977; Nogami &Tomozawa, 1984; Wakabayashi & Tomazawa, 1989;Oversby & Phinney, 1992; Clark et al., 1993), clearlyshow error function-like profiles (similar to Figure 2,curve A), and several of these studies noted thatdiffusion was indeed dependent on water concen-tration, despite the profile shapes. These studies in-clude two (Oversby & Phinney, 1992; Clark et al.,1993) in which the nuclear waste glass SRL-165 washydrated under ambient conditions. Significantly,when this glass was hydrated at higher temperaturesthe resultant profiles were again S-shaped.
The implications of the available depth versus con-centration data were noted by Doremus (1975, 1979,1994) and Garcia-Barcena (1989). Doremus (1975,1979, 1994) developed an approximate mathematicalmodel for glass hydration assuming strict interdiffusionof hydrogen and alkalis. He noted that the break up ofthe silicate network of the glass by water increases therate of water diffusion through the hydrated portionsof the glass. This significantly increases the hydrationrate. He also showed that the flux of water into or outof the glass may show t1/2 behaviour initially, but willtrend towards linear behaviour with increasing time.Thus, experimental studies which do not cover asufficient time scale may yield deceptive results.Garcia-Barcena (1989) reviewed the available obsidiandepth-profiles and suggested that the standard OHDmodel was oversimplified and that more complexconcentration-dependent or reaction–oxidation modelswere needed. He concluded that at least some obsidianshydrate linearly with time, rather than at the t1/2 rate ofthe standard OHD model. Similar conclusions havealso been drawn from some experimental studies,where analyses of high-temperature run productsshowed that a variety of functions fit the data as well orbetter than the standard OHD model (Findlow et al.,1975; McGrail et al., 1988). Unfortunately, thesestudies have largely been ignored.
Additional evidence is also available from empiri-cal OHD studies, which have often shown that thebest fit to externally calibrated hydration data is
740 L. M. Anovitz et al.
non-quadratic (Meighan, Foote & Aiello, 1968;Findlow et al., 1975; Kimberlin, 1976; Meighan, 1976;Findlow & Bennett, 1978). In some instances a linearfunction produced a better fit, while in others a powerfunction with an exponent other than 2 was preferred.In one case several different power functions each fitthe data as well as a quadratic function (Findlow et al.,1975).
The possibility of surface dissolution has also beenrecognized as a potential problem for OHD. This wasfirst noted by Friedman & Smith (1960) who felt that itwould be a problem only in rare instances. Stevenson,Carpenter & Scheetz (1989) identified surface dissolu-tion as a source of error in experimentally-derivedhydration rates, but failed to recognize that it couldoccur naturally at ambient temperatures (Ambrose,1994). Efforts to correct for surface dissolution inarchaeological samples have been limited to measuringhydration rinds in fissures located along the surfaces ofartefacts (Ambrose, 1994; Braswell, Glascock & Neff,1996), and even this approach has not resulted insignificantly better dates.
All of these data lead to one basic conclusion—thatequations (1) and (2) are not appropriate models forOHD. Both analytical results and theoretical consid-erations suggest that diffusion of water in obsidian isconcentration-dependent, and that other basic assump-tions may also be erroneous. Therefore, use of thestandard equations is undoubtedly a principal sourceof inaccuracy in hydration dating.
SIMS Analysis of Obsidian HydrationIn a review of weathering phenomena in archaeologicalmaterials, Purdy & Clark (1987) noted that theobsidian hydration process needed to be properlyunderstood before OHD could be reliably employed,and described the importance of data obtained fromsurface-analytical techniques for gaining such anunderstanding. For analysis of diffusion rates andprocesses in any material of interest, data on theconcentration of a given element with depth areessential (Crank, 1975; Doremus, 1975, 1979, 1994;Lasaga, 1983; Kirkaldy & Young, 1987; Chakraborty& Ganguly, 1991; Morioka & Nasagawa, 1991). Thebest constraints on diffusional processes are obtainedby fitting such profiles. Thus, in order to test ourassertion that equation 2 is inappropriate, we haveused SIMS to examine the hydration rims on a varietyof natural and man-made glasses. This enables us tobetter characterize chemical changes as a function ofdepth in the hydration rim on a range of glasses, and todetermine something of the real complexity involved inglass hydration and OHD.
SIMS provides an excellent method of obtainingdetailed, high precision information on the concen-tration of water as a function of depth, and therefore isan ideal technique to use to investigate the process of
obsidian hydration. When utilized in depth-profilingmode, and fully optimized, SIMS can resolve concen-tration variations occurring over a few nanometres fora wide variety of elements, over depths ranging fromtens of nanometres to several microns (see variouspapers in Gillen et al., 1998). SIMS is the preferredmethod of obtaining depth-profile information in thesemi-conductor industry, and is also widely applied ingeochemistry for trace element and isotopic analysis(e.g., papers in Gillen et al., 1998; McKibben &Riciputi, 1998; Valley et al., 1998; Larocque & Cabri,1998). The method is based on analysis of ions ejectedfrom a sample during bombardment by a focusedbeam of primary ions accelerated at 2–20 keV. Thecomposition of these secondary ions is representativeof the composition of the sputtered surface, so that amass spectrometric analysis of the secondary ions canprovide a quantitative elemental or isotopic analysis ofthe sputtered volume. SIMS analysis can be comparedto peeling an onion one layer at a time; as secondaryions are only removed from the upper few atom layersof the material, it is possible to obtain highly resolveddepth-profiles by taking repeated measurements of theelement(s) of interest while steadily sputtering intothe sample. The depth resolution for each analysis canbe varied considerably by controlling primary beamcharacteristics. In our preliminary work, the typicaldepth resolution for obsidian analyses is in the 0·02–0·04 ìm range, although the instrument can be ad-justed to obtain much finer resolution for shallowprofiles.
Depth-profiles were obtained using a modifiedCameca 4 f ion microprobe (doubly-focusing magneticsector mass spectrometer) at Oak Ridge NationalLaboratory. Samples were sputtered using a mass-filtered, focused 16O" primary beam, with beam cur-rents of 5–80 nA. The primary beam was rastered overa 150#150 ìm square on the samples. Positive second-ary ions with 80&20 eV excess energy were extractedinto the secondary mass spectrometer; a 33µm diam-eter field aperture was used to limit analysed ions to thecentral part of the flat-bottomed sputter crater, en-suring that depth resolution was maximized. Depthresolution varied from 0·01 to 0·04 ìm, depending onthe expected depth of the profile; deeper profiles wererun at a higher sputter rate to reduce analysis time.Selected elements were analysed by sequentially peakjumping the secondary ion magnet among the massesof interest. Secondary ion signals were monitored usingan electron multiplier, with count times of 1–3 s perelement of interest. Typically, eight to 12 elements wereanalysed. A total of 100–1200 individual magneticcycles (low to high mass) comprise each depth-profile,requiring from 30 min to 6 h of analysis time. Thepresence of sample charging during the analysis wasmonitored by scanning the sample accelerating voltagewhile monitoring the 30Si peak, and accelerating volt-age was automatically adjusted to maintain 80 eVexcess energy.
Failure of Obsidian Hydration Dating 741
Samples were mounted in epoxy in 2·5-cm diameteraluminium blocks with a relatively flat hydrated sur-face exposed. A thin gold-coat was applied to providea conductive surface and minimize the potential forsample charging. To minimize hydrogen background(due to adsorbed water), samples were baked for 24 hat 50)C, and then inserted into the ion microprobesample chamber (0·5–1#10"9 torr) overnight beforeanalysis. Previous work in this laboratory suggests thatthis reduces the background to <0·05 weight % H2O.The depth of the profile was determined by measur-ing the crater depth with a profilometer; the precisionof this depth measurement is estimated to be betterthan 5%.
Absolute ion yields in SIMS are sensitive to thechemical composition of the matrix. Therefore, toperform quantitative analyses, the ion yields of theelements of interest must be calibrated using standardsof known composition to generate a series of sensitivityfactors. In addition, to normalize the ion yields, oneelement with an independently determined concen-tration, the reference species, must be measured duringthe SIMS analysis. In our analyses we used a set ofsynthetic glasses from NIST and glasses fused fromUSGS standards to calibrate ion yields to determinethe sensitivity factors. Ion yields on the unknownswere converted into known concentrations using theequation
[M]=KM(M+/Si+)[Si] (8)
where [M] and [Si] are the concentrations of theelement of interest M and Si, M+ and Si+ the second-ary ion intensities of the element of interest M and Si,and KM is the relative sensitivity factor for element Mdetermined by calibration to the set of glass standards.As the exact SiO2 content of the individual specimenswas not known, the SiO2 content of the unknownsamples was assumed to be 75 weight %, a reasonableapproximation for natural rhyolitic obsidians. Naturalvariations in the composition of obsidian could intro-duce a relative error of up to 10% in the actualconcentrations, but for more precise modelling pur-poses this uncertainty can be removed by analysing theSiO2 content of the glass by electron microprobe orother appropriate techniques. The relative variationsin concentration shown in the profiles, however, areindependent of silica concentration. The overallanalytical precision is estimated to be 1–5% of theamount present for the various elements. Apart fromthe first few data cycles during sputter equilibration,the Si count rate remained relatively constant in allprofiles (varying by <5% from start to end), indicatingthat the Si concentration was essentially uniformthrough the entire profile.
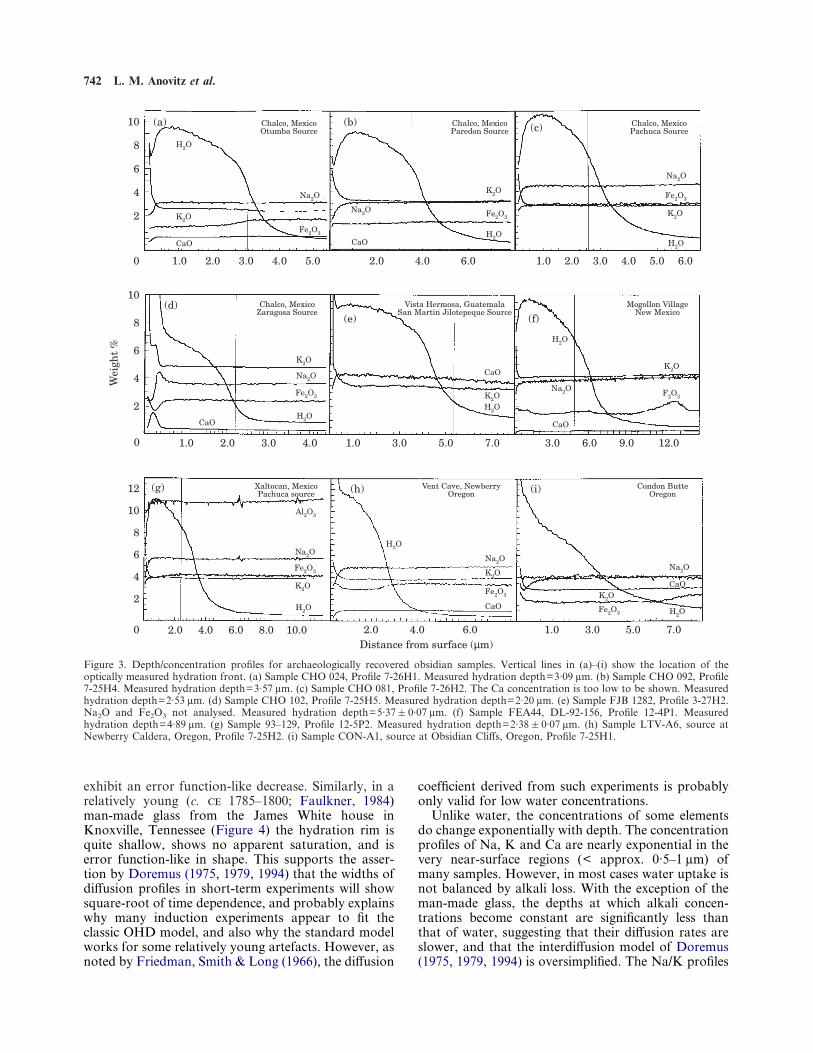
The results for 11 of our samples are shown inFigures 3 & 4. Nine of these (Figure 3) are fromobsidians and two (Figure 4) are from man-madeglasses, all recovered from archaeological sites. Theanalysed obsidians were chosen to provide samples
hydrated under a variety of environmental conditionsand from a variety of obsidian sources (hydrated underthe same conditions) to allow us to determine ifenvironmental or compositional parameters exert acontrolling influence on the nature of the hydrationprofile. The natural samples all show constant orslightly decreasing water (hydrogen) concentrations asa function of depth near the surface. This is followedby a region in which water concentration dropsrapidly, then an asymptotic approach to baseline. Ingeneral, this is the same S-shaped profile observedin many of the previous depth-profiling studies. Asthe curves do not have the shape predicted by standardOHD equations (Figure 2, curve A), these dataclearly show that equations (1) and (2) are notappropriate descriptions of the hydration process forany of our obsidians, and they should not be assumedcorrect for any glass without direct evidence of theirapplicability.
Discussion of SIMS ResultsThe physical explanation for the consistent signatureobserved in all of the measured obsidians, despite thefact that they were recovered from a wide range ofenvironments, remains uncertain. The water concen-tration in obsidian apparently peaks near 10 weight%.This seems reasonable, as the solubility of water insilica glass due solely to silanol formation reaches 2–3weight% (Roberts & Roberts, 1964), and solubility inmore complex glasses due to molecular water andalkali exchange is known to exceed 20 weight%(Bartholomew, 1982). The consistency suggests thatobsidian may saturate at this composition, or thatmore water-rich compositions exfoliate as perlite.However, the maximum does not appear to be limitedby crystallization. Despite examination by transmis-sion and scanning electron microscopy and reflectioninfra-red spectroscopy, we have been unable to findevidence of crystallization in the hydrated layer ofobsidians.
In general, the effect of increased water content willbe to increase the diffusion rate. If the water in this‘‘saturated zone’’ is mobile, then the growth rate of thehydration rim will be significantly enhanced, as un-hydrated glass is directly exposed to a fast diffusingwater source. If not, the effects of lowered glass vis-cosity, hydrolytic weakening, and the possible for-mation of fast diffusion paths will also increase thediffusion coefficient as a function of concentration, andthus the rate of rim growth. This is consistent with theobservation that the hydration rate is a function of theinitial (intrinsic) water content of the glass (Stevenson,Carpenter & Scheetz, 1989).
The shape of the profile beyond the saturation zonemay explain the apparent fit of simple diffusion modelsto short-term experimental data. In this region thechange of water concentration with depth appears to
742 L. M. Anovitz et al.
10.0
12
Distance from surface (µm)
Wei
ght
%
2
10
8
6
4
2.0 4.0 6.0 8.00
(g) Xaltocan, MexicoPachuca source
K2O
H2O
Fe2O3
Na2O
Al2O3
6.02.0 4.0
(h) Vent Cave, NewberryOregon
K2O
Fe2O3
Na2O
CaO
H2O
5.01.0 7.0
(i) Condon ButteOregon
K2O
Fe2O3
Na2O
CaO
H2O
3.0
4.0
10
0
2
8
6
4
1.0 2.0 3.0
(d) Chalco, MexicoZaragosa Source
K2O
H2O
Fe2O3
Na2O
CaO
5.0
10
0
2
8
6
4
1.0 2.0 3.0 4.0
(a) Chalco, MexicoOtumba Source
K2O
H2O
Fe2O3
Na2O
CaO
7.01.0 3.0 5.0
(e)Vista Hermosa, Guatemala
San Martin Jilotepeque Source
K2OH2O
CaO
12.03.0 9.0
(f)Mogollon Village
New Mexico
K2O
H2O
CaO
Na2O F2O3
6.02.0 4.0
(b) Chalco, MexicoParedon Source
K2O
H2O
Fe2O3Na2O
CaO
(c) Chalco, MexicoPachuca Source
K2O
H2O
Fe2O3
Na2O
6.01.0 2.0 3.0 4.0 5.0
6.0
Figure 3. Depth/concentration profiles for archaeologically recovered obsidian samples. Vertical lines in (a)–(i) show the location of theoptically measured hydration front. (a) Sample CHO 024, Profile 7-26H1. Measured hydration depth=3·09 ìm. (b) Sample CHO 092, Profile7-25H4. Measured hydration depth=3·57 ìm. (c) Sample CHO 081, Profile 7-26H2. The Ca concentration is too low to be shown. Measuredhydration depth=2·53 ìm. (d) Sample CHO 102, Profile 7-25H5. Measured hydration depth=2·20 ìm. (e) Sample FJB 1282, Profile 3-27H2.Na2O and Fe2O3 not analysed. Measured hydration depth=5·37&0·07 ìm. (f) Sample FEA44, DL-92-156, Profile 12-4P1. Measuredhydration depth=4·89 ìm. (g) Sample 93–129, Profile 12-5P2. Measured hydration depth=2·38&0·07 ìm. (h) Sample LTV-A6, source atNewberry Caldera, Oregon, Profile 7-25H2. (i) Sample CON-A1, source at Obsidian Cliffs, Oregon, Profile 7-25H1.
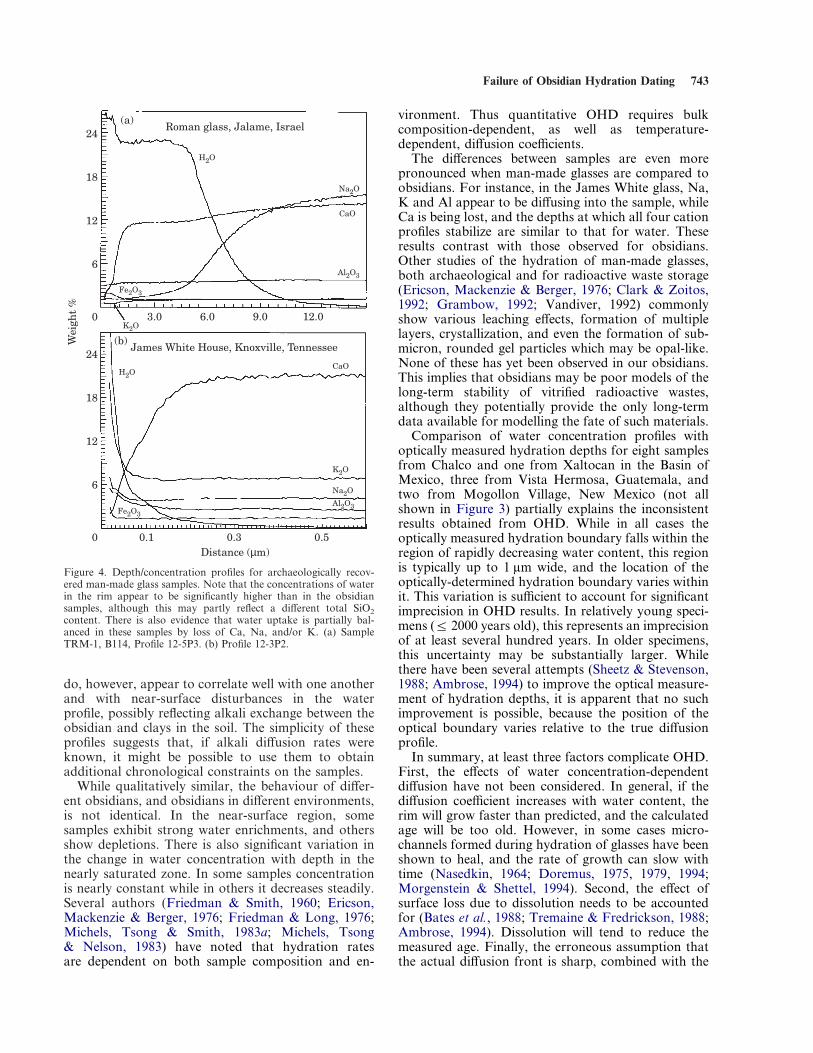
exhibit an error function-like decrease. Similarly, in arelatively young (c. 1785–1800; Faulkner, 1984)man-made glass from the James White house inKnoxville, Tennessee (Figure 4) the hydration rim isquite shallow, shows no apparent saturation, and iserror function-like in shape. This supports the asser-tion by Doremus (1975, 1979, 1994) that the widths ofdiffusion profiles in short-term experiments will showsquare-root of time dependence, and probably explainswhy many induction experiments appear to fit theclassic OHD model, and also why the standard modelworks for some relatively young artefacts. However, asnoted by Friedman, Smith & Long (1966), the diffusion
coefficient derived from such experiments is probablyonly valid for low water concentrations.
Unlike water, the concentrations of some elementsdo change exponentially with depth. The concentrationprofiles of Na, K and Ca are nearly exponential in thevery near-surface regions (< approx. 0·5–1 ìm) ofmany samples. However, in most cases water uptake isnot balanced by alkali loss. With the exception of theman-made glass, the depths at which alkali concen-trations become constant are significantly less thanthat of water, suggesting that their diffusion rates areslower, and that the interdiffusion model of Doremus(1975, 1979, 1994) is oversimplified. The Na/K profiles
Failure of Obsidian Hydration Dating 743
0.5
24
0 0.1Distance (µm)
Wei
ght
%
18
12
6
0.3
James White House, Knoxville, Tennessee(b)
H2O
Fe2O3
Al2O3
K2O
Na2O
CaO
12.0
24
3.0
18
12
6
Roman glass, Jalame, Israel(a)
H2O
Fe2O3
Al2O3
K2O
Na2O
CaO
6.0 9.00
Figure 4. Depth/concentration profiles for archaeologically recov-ered man-made glass samples. Note that the concentrations of waterin the rim appear to be significantly higher than in the obsidiansamples, although this may partly reflect a different total SiO2
content. There is also evidence that water uptake is partially bal-anced in these samples by loss of Ca, Na, and/or K. (a) SampleTRM-1, B114, Profile 12-5P3. (b) Profile 12-3P2.
do, however, appear to correlate well with one anotherand with near-surface disturbances in the waterprofile, possibly reflecting alkali exchange between theobsidian and clays in the soil. The simplicity of theseprofiles suggests that, if alkali diffusion rates wereknown, it might be possible to use them to obtainadditional chronological constraints on the samples.
While qualitatively similar, the behaviour of differ-ent obsidians, and obsidians in different environments,is not identical. In the near-surface region, somesamples exhibit strong water enrichments, and othersshow depletions. There is also significant variation inthe change in water concentration with depth in thenearly saturated zone. In some samples concentrationis nearly constant while in others it decreases steadily.Several authors (Friedman & Smith, 1960; Ericson,Mackenzie & Berger, 1976; Friedman & Long, 1976;Michels, Tsong & Smith, 1983a; Michels, Tsong& Nelson, 1983) have noted that hydration ratesare dependent on both sample composition and en-
vironment. Thus quantitative OHD requires bulkcomposition-dependent, as well as temperature-dependent, diffusion coefficients.
The differences between samples are even morepronounced when man-made glasses are compared toobsidians. For instance, in the James White glass, Na,K and Al appear to be diffusing into the sample, whileCa is being lost, and the depths at which all four cationprofiles stabilize are similar to that for water. Theseresults contrast with those observed for obsidians.Other studies of the hydration of man-made glasses,both archaeological and for radioactive waste storage(Ericson, Mackenzie & Berger, 1976; Clark & Zoitos,1992; Grambow, 1992; Vandiver, 1992) commonlyshow various leaching effects, formation of multiplelayers, crystallization, and even the formation of sub-micron, rounded gel particles which may be opal-like.None of these has yet been observed in our obsidians.This implies that obsidians may be poor models of thelong-term stability of vitrified radioactive wastes,although they potentially provide the only long-termdata available for modelling the fate of such materials.
Comparison of water concentration profiles withoptically measured hydration depths for eight samplesfrom Chalco and one from Xaltocan in the Basin ofMexico, three from Vista Hermosa, Guatemala, andtwo from Mogollon Village, New Mexico (not allshown in Figure 3) partially explains the inconsistentresults obtained from OHD. While in all cases theoptically measured hydration boundary falls within theregion of rapidly decreasing water content, this regionis typically up to 1 ìm wide, and the location of theoptically-determined hydration boundary varies withinit. This variation is sufficient to account for significantimprecision in OHD results. In relatively young speci-mens (¦ 2000 years old), this represents an imprecisionof at least several hundred years. In older specimens,this uncertainty may be substantially larger. Whilethere have been several attempts (Sheetz & Stevenson,1988; Ambrose, 1994) to improve the optical measure-ment of hydration depths, it is apparent that no suchimprovement is possible, because the position of theoptical boundary varies relative to the true diffusionprofile.
In summary, at least three factors complicate OHD.First, the effects of water concentration-dependentdiffusion have not been considered. In general, if thediffusion coefficient increases with water content, therim will grow faster than predicted, and the calculatedage will be too old. However, in some cases micro-channels formed during hydration of glasses have beenshown to heal, and the rate of growth can slow withtime (Nasedkin, 1964; Doremus, 1975, 1979, 1994;Morgenstein & Shettel, 1994). Second, the effect ofsurface loss due to dissolution needs to be accountedfor (Bates et al., 1988; Tremaine & Fredrickson, 1988;Ambrose, 1994). Dissolution will tend to reduce themeasured age. Finally, the erroneous assumption thatthe actual diffusion front is sharp, combined with the
744 L. M. Anovitz et al.
variable position of the optical front within the realprofile, adds scatter to the derived date. This is trueirrespective of the hydration model employed. Theseresults clearly show that intrinsic-rate OHD is almostcertainly unusable in its current form.
While this conclusion may seem pessimistic, we arenot proposing that OHD be abandoned. The regularityin the SIMS data suggest that improved analytical andmathematical approaches may permit more accurateand precise hydration dates, and possibly palaeo-climatic data (see below), to be obtained. To achievethese goals, high precision diffusion modelling isneeded. Such calculations first require that the concen-tration of the elements of interest be well known as afunction of depth. At present, the best way to obtainthese data is using SIMS, the data from which are farmore detailed than those obtainable by RBS or 19Fnuclear resonance (Lee et al., 1974; Lanford, 1977,1978; Laursen & Lanford, 1978; Tsong et al., 1978,1981). The variable relationship between optical andSIMS data shows that it is unlikely that opticalmeasurements will prove useful.
Origin of the Optical Front
While our SIMS data have clearly shown that thesharp front observed optically is not a precise represen-tation of the hydration front, the origin of the opticalfront remains to be understood. Two factors probablyexplain both its origin and the uncertainties associatedwith it: the inherent imprecision in any measurementdone using visible light, and the formation of Beckelines.
Any physical observation is subject to an inherentlimitation. The minimum size of the observable detailis limited by the wavelength of the radiation usedto make the observation. For optical microscopicobservations, this is known as the Rayleigh criterion(Robertson, 1941; Rochow & Tucker, 1994), whichstates that the resolution—i.e. the minimum separationdistance between two points at which the two can bediscerned as separate—is given by:
R=ë/(2NAeff) (9)
where R is the resolution, ë is the wavelength of thelight being used for the observation, and NAeff is theeffective numerical aperture, the average of the numeri-cal apertures of the objective lens and substage con-denser. The effect of this limit on OHD was consideredby Sheetz & Stevenson (1988). They concluded that,even with a very good optical system, the best possibleresolution is about&0·25 ìm. This will affect not onlythe measurement of an individual artefact, but theexperiments used to determine the hydration rate aswell. Considering these effects, Sheetz & Stevenson(1988) calculated possible errors, from this factoralone, of "70 to +33%, far too large to be used for
accurate chronology (see Braswell, 1992; and Elam,1993, for discussions of the effects of this errorrange).
Regardless of the uncertainties in the opticalmeasurement, however, the origin of the apparentsharp boundary remains to be explained. Our obser-vations suggest that it is, in fact, a Becke line. This is abright line which occurs in thin sections at the bound-ary between two materials with different refractiveindices (cf. Bloss, 1961; Stoiber & Morse, 1981). Snell’sLaw relates the refractive indices of two materials tothe path of a light ray passing between them as:
ç1sinè1=ç2sinè2 (10)
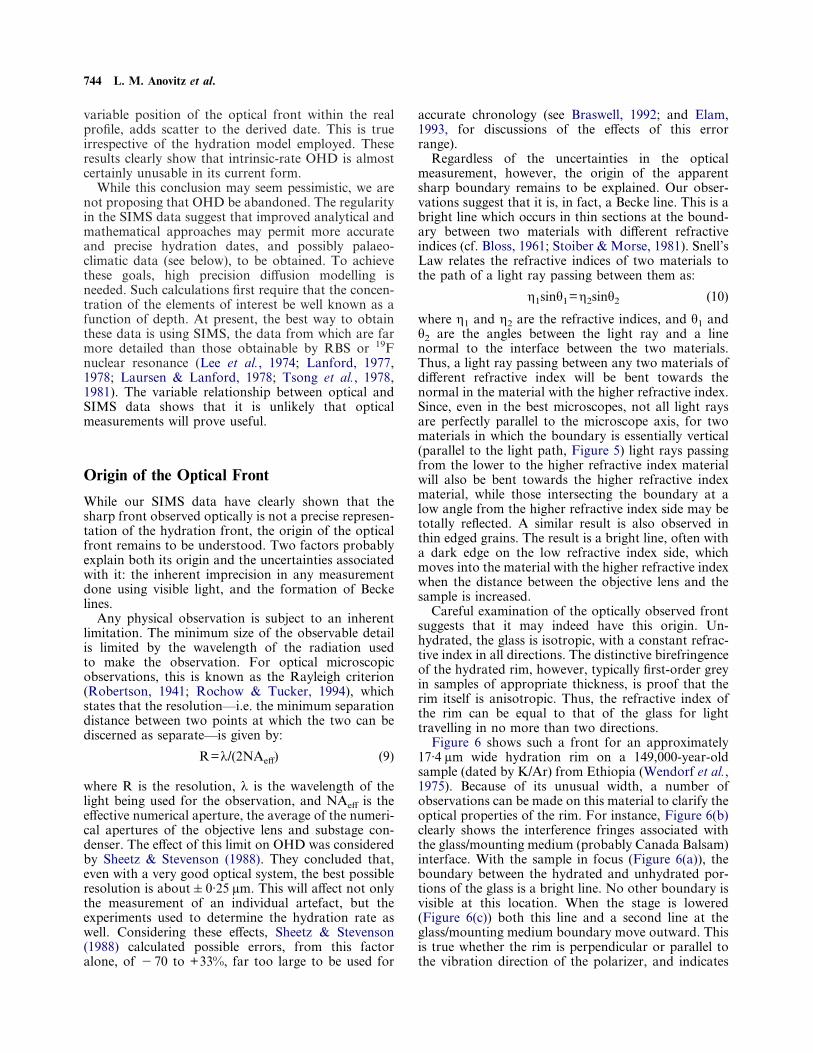
where ç1 and ç2 are the refractive indices, and è1 andè2 are the angles between the light ray and a linenormal to the interface between the two materials.Thus, a light ray passing between any two materials ofdifferent refractive index will be bent towards thenormal in the material with the higher refractive index.Since, even in the best microscopes, not all light raysare perfectly parallel to the microscope axis, for twomaterials in which the boundary is essentially vertical(parallel to the light path, Figure 5) light rays passingfrom the lower to the higher refractive index materialwill also be bent towards the higher refractive indexmaterial, while those intersecting the boundary at alow angle from the higher refractive index side may betotally reflected. A similar result is also observed inthin edged grains. The result is a bright line, often witha dark edge on the low refractive index side, whichmoves into the material with the higher refractive indexwhen the distance between the objective lens and thesample is increased.
Careful examination of the optically observed frontsuggests that it may indeed have this origin. Un-hydrated, the glass is isotropic, with a constant refrac-tive index in all directions. The distinctive birefringenceof the hydrated rim, however, typically first-order greyin samples of appropriate thickness, is proof that therim itself is anisotropic. Thus, the refractive index ofthe rim can be equal to that of the glass for lighttravelling in no more than two directions.
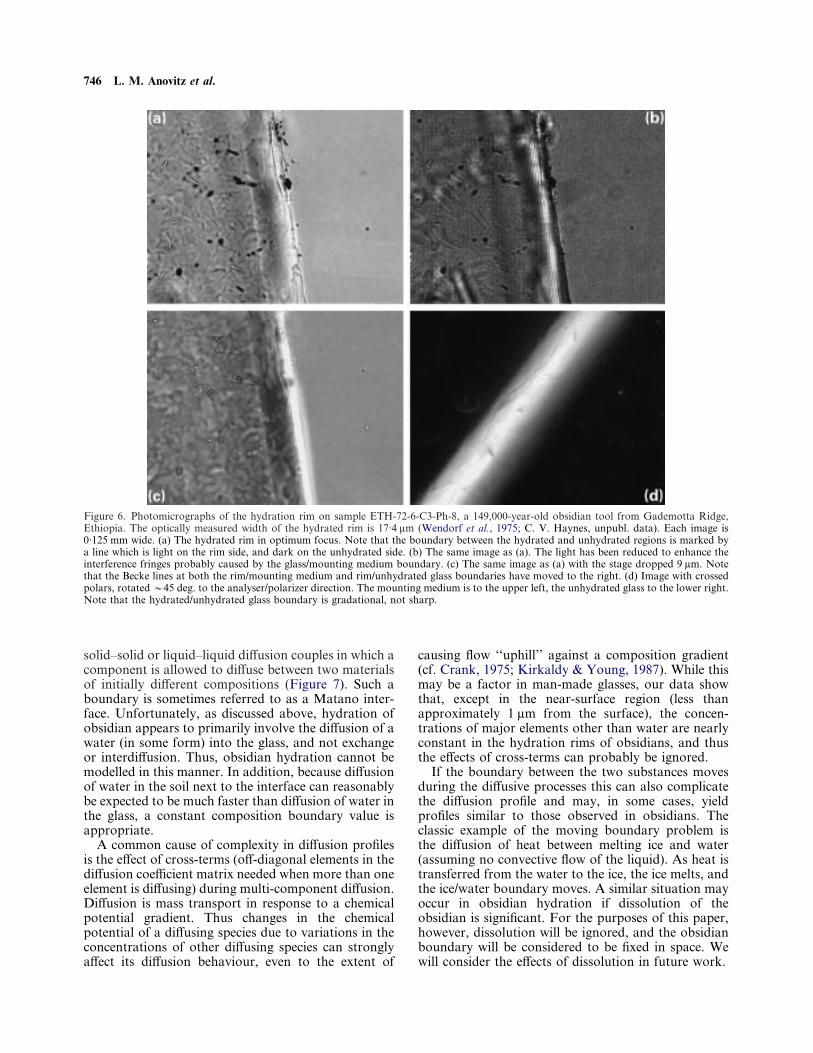
Figure 6 shows such a front for an approximately17·4 ìm wide hydration rim on a 149,000-year-oldsample (dated by K/Ar) from Ethiopia (Wendorf et al.,1975). Because of its unusual width, a number ofobservations can be made on this material to clarify theoptical properties of the rim. For instance, Figure 6(b)clearly shows the interference fringes associated withthe glass/mounting medium (probably Canada Balsam)interface. With the sample in focus (Figure 6(a)), theboundary between the hydrated and unhydrated por-tions of the glass is a bright line. No other boundary isvisible at this location. When the stage is lowered(Figure 6(c)) both this line and a second line at theglass/mounting medium boundary move outward. Thisis true whether the rim is perpendicular or parallel tothe vibration direction of the polarizer, and indicates
Failure of Obsidian Hydration Dating 745
that, in both vibration directions the refractive index ofthe mounting medium is higher than that of thehydrated rim, and the refractive index of the rim ishigher than that of the unhydrated glass. In addition,insertion of a gypsum accessory plate shows that therim is length fast, and the interference figure observedon the rim is a flash figure.
Optical anisotropy in glass is typically caused by thepresence of unrelieved stress. In hydrated obsidian, thisis probably caused by an increase in molar volumeduring hydration. This can only be accommodated in adirection perpendicular to the glass/mounting mediuminterface. Expansion parallel to the interface can onlybe partially relieved to the extent the glass is compress-ible. The resultant unrelieved stress field should there-fore have a principal axis perpendicular to the glass/mounting medium interface, and be similar in
magnitude in all directions perpendicular to that inter-face. Therefore, the optical indicatrix should havesimilar properties, suggesting a nearly uniaxial systemwith the optic axis in the perpendicular direction.While not proven, the observation of a flash figure inthis section is consistent with this hypothesis. If thisis the case, we can conclude further that, for thissample, the hydrated material is uniaxial positive, asthe rim is length fast (light vibrating parallel to theglass/mounting medium interface moves faster, thushas a lower refractive index, than light vibratingperpendicular to that interface).
Finally, while the Becke line observed in planepolarized light suggests that the interface is sharp,when the analyser is in place the boundary betweenthe isotropic glass and the anisotropic rim is clearlygradational (Figure 6(d)). This has been observedexperimentally as well. Sheetz & Stevenson (1988)noted that hydration rims developed in excess of 180)Coften exhibit ‘‘fuzzy’’ edges, or cannot be opticallydefined. Both observations are in good agreement withthe water concentration depth-profiles measured in thisstudy using SIMS.
It remains to be seen whether the observationsdescribed here are universal for hydrated obsidianrims. For instance, optical examination of a numberof hydrated obsidian artefacts shows that some havean additional dark line near the isotropic/anisotropictransition. Accumulated stress may cause the for-mation of a grain boundary within the glass in somesamples which, eventually, may cause the exterior sur-face to exfoliate. The extent of this effect, and itsrelationship to the optical measurement, however, re-mains uncertain. Where it is a Becke line which is beingobserved, however, its deleterious effect on the poten-tial accuracy of the measurement is significant. Becausethe Becke line moves with the focus position, the resultdepends on the subjective choice of where the image isin focus. The SIMS method is especially advantageousin comparison, as this uncertainty is completely re-moved. These observations clearly suggest that thelimitations of optical observation are so great, andthe relationship between what is being observed and theactual hydration process so variable, that optical obser-vation is unlikely to ever be an accurate method ofcharacterizing obsidian hydration and, therefore, to bean accurate source of hydration dates.
(b) Thin edged grain Outgoing Light Ray
Incoming Light Ray
Higher Refractive Index Material
1 2
12 21
12
(a) High angle grain edge
Higher Refractive Index Material
Figure 5. Origin of Becke lines. (a) Becke line formation at ahigh-angle grain boundary for a material with a higher refractiveindex than its surroundings. Light rays encountering the grainboundary from the low refractive index side are bent inwards, thoseencountering the boundary at a low angle from the high refractiveindex side are totally reflected. (b) Becke line formation for athin-edged grain. An initially axis-parallel light ray is bent towardsthe centre of the higher refractive index material at both the upperand lower surfaces.
Modelling
The data presented above demonstrate that SIMSprovides a method of measuring the depth versusconcentration profile for water in hydrated glasses. Inorder to use these data to date obsidian and other glassartefacts effectively it is next necessary to develop amathematical model of the processes involved.
Examination of the general shape of the diffusionprofile shows that it resembles profiles obtained from
746 L. M. Anovitz et al.
Figure 6. Photomicrographs of the hydration rim on sample ETH-72-6-C3-Ph-8, a 149,000-year-old obsidian tool from Gademotta Ridge,Ethiopia. The optically measured width of the hydrated rim is 17·4 ìm (Wendorf et al., 1975; C. V. Haynes, unpubl. data). Each image is0·125 mm wide. (a) The hydrated rim in optimum focus. Note that the boundary between the hydrated and unhydrated regions is marked bya line which is light on the rim side, and dark on the unhydrated side. (b) The same image as (a). The light has been reduced to enhance theinterference fringes probably caused by the glass/mounting medium boundary. (c) The same image as (a) with the stage dropped 9 ìm. Notethat the Becke lines at both the rim/mounting medium and rim/unhydrated glass boundaries have moved to the right. (d) Image with crossedpolars, rotated 245 deg. to the analyser/polarizer direction. The mounting medium is to the upper left, the unhydrated glass to the lower right.Note that the hydrated/unhydrated glass boundary is gradational, not sharp.
solid–solid or liquid–liquid diffusion couples in which acomponent is allowed to diffuse between two materialsof initially different compositions (Figure 7). Such aboundary is sometimes referred to as a Matano inter-face. Unfortunately, as discussed above, hydration ofobsidian appears to primarily involve the diffusion of awater (in some form) into the glass, and not exchangeor interdiffusion. Thus, obsidian hydration cannot bemodelled in this manner. In addition, because diffusionof water in the soil next to the interface can reasonablybe expected to be much faster than diffusion of water inthe glass, a constant composition boundary value isappropriate.
A common cause of complexity in diffusion profilesis the effect of cross-terms (off-diagonal elements in thediffusion coefficient matrix needed when more than oneelement is diffusing) during multi-component diffusion.Diffusion is mass transport in response to a chemicalpotential gradient. Thus changes in the chemicalpotential of a diffusing species due to variations in theconcentrations of other diffusing species can stronglyaffect its diffusion behaviour, even to the extent of
causing flow ‘‘uphill’’ against a composition gradient(cf. Crank, 1975; Kirkaldy & Young, 1987). While thismay be a factor in man-made glasses, our data showthat, except in the near-surface region (less thanapproximately 1 ìm from the surface), the concen-trations of major elements other than water are nearlyconstant in the hydration rims of obsidians, and thusthe effects of cross-terms can probably be ignored.
If the boundary between the two substances movesduring the diffusive processes this can also complicatethe diffusion profile and may, in some cases, yieldprofiles similar to those observed in obsidians. Theclassic example of the moving boundary problem isthe diffusion of heat between melting ice and water(assuming no convective flow of the liquid). As heat istransferred from the water to the ice, the ice melts, andthe ice/water boundary moves. A similar situation mayoccur in obsidian hydration if dissolution of theobsidian is significant. For the purposes of this paper,however, dissolution will be ignored, and the obsidianboundary will be considered to be fixed in space. Wewill consider the effects of dissolution in future work.

Failure of Obsidian Hydration Dating 747
2
0.9
0–2
Distance
Con
cen
trat
ion
0.7
0.5
0.3
0.1
–1 0 1
Phase A
Phase B
Figure 7. Typical Matano interface for exchange of a single com-pound between two phases (or materials which form a single phaseafter the diffusion couple is formed) with initially different, con-stant compositions. The dashed lines show the initial compositions ineach material. The vertical line is the initial boundary between thetwo phases, and the curve was calculated assuming D=1E"9,t=1·28E+8 (arbitrary units).
The three factors most likely to explain the observedconcentration versus depth profiles are: (1) changes inthe diffusion coefficient due to changes in the waterconcentration (compositionally-dependent diffusion);(2) the effect of unrelieved stress due to volume changescaused by water uptake (non-Fickian diffusion) and;(3) reaction of water with the glass. The effects of theseprocesses can correlate with one another, as they are alldependent on water concentration, and it may there-fore be difficult to deconvolute them in naturalsamples.
Compositionally-dependent diffusion is probably theleast complex of these phenomena. Water initiallyentering dry, silica-rich glass reacts to form silanols(Si–O–Si bonds break, forming Si–O–H H–O–Si pairs,cf. Scholze, 1959; Ernsberger, 1977; Bartholomewet al., 1980; Stolper, 1982; Yanagisawa et al., 1997). Asthis disrupts the silicate framework, the viscosity of theglass is lowered. In liquid systems, the viscosity ofthe matrix can be related to the diffusion coefficient bythe Stokes–Einstein equation:
D12=kT )lna1
6ðÃ2r1 )lnm1
where k is the Boltzmann constant, T is absolute
(11)
temperature, r is the radius of the diffusing substance,Ã is the viscosity, a is the thermodynamic activity, m isthe molar concentration, subscript 1 refers to thediffusing substance, and subscript 2 to the solute
(Kirkaldy & Young, 1987). This equation strictly refersto a large molecule diffusing in a low molecular weightsolvent, and it has been shown that the viscosity mustoften be raised to a power other than 1 (Davies et al.,1967; Hiss & Cussler, 1973; Reid et al., 1977; Evanset al., 1981; Kirkaldy & Young, 1987). Nonetheless,equation (11) shows qualitatively that the diffusioncoefficient should be an inverse function of viscosityand change with the water content of the glass. There-fore, a model of water diffusion in obsidian based ona compositionally-dependent diffusion coefficient istheoretically justifiable.
An alternative, or perhaps additional, approach is totreat water diffusion as diffusion with reaction due tothe formation of silanols. In this case, a sink term(describing a portion of the diffusing species which,after reaction, becomes immobile) is added to Fick’sLaw as:
)C
)t=)
)xSD )C
)xD")S
)t
where S is the concentration of the diffusing substance
(12)
immobilized. This has been shown to generate curvessimilar to those we have observed for water diffusingin obsidian (cf. Crank, 1975; Doremus, 1995). Thisapproach should be related to that using acompositionally-dependent diffusion coefficient be-cause the reaction forming the silanol is also the likelycause of the change in the diffusion coefficient. Acombination of the two approaches may thereforeprove useful.
Finally, the possibility of non-Fickian diffusion maybe considered. The fact that the hydrated rim is notcrystallized, yet is optically anisotropic indicates thatthe rim contains significant unrelieved stress. Crank(1975) notes that if the rate of stress relief is significantrelative to the rate of diffusion this can significantlyaffect the diffusive process. This has been observed inglassy polymers, where optical fronts are commonlyobserved, and the rate of movement of these fronts hasbeen shown to be a variable power function of time.The appearance of an optical front which moves as avariable power function of time has also been observedfor obsidians (Findlow et al., 1975; McGrail et al.,1988), and thus the possibility that diffusion in obsid-ian, and possibly other glasses, is non-Fickian shouldbe considered.
The most recent models for diffusion of water inhigh temperature (400–1200)C) glasses and melts (cf.Zhang, Stopler & Wasserburg, 1991a, b; Behrens &Nowak, 1997; Nowak & Behrens, 1997) are based ontransport of both OH" and molecular water, which inturn requires that concentration of each be measuredas a function of depth. Such models are difficult toapply to obsidian hydration, however, as typicalhydration rims are too narrow to allow accuratemeasurement of speciation profiles using commonlyemployed techniques. Infra-red spectroscopy, for
748 L. M. Anovitz et al.
6
12
Distance (µm)
Wei
ght
% H
2O
1
10
8
6
4
2
2 3 4 50
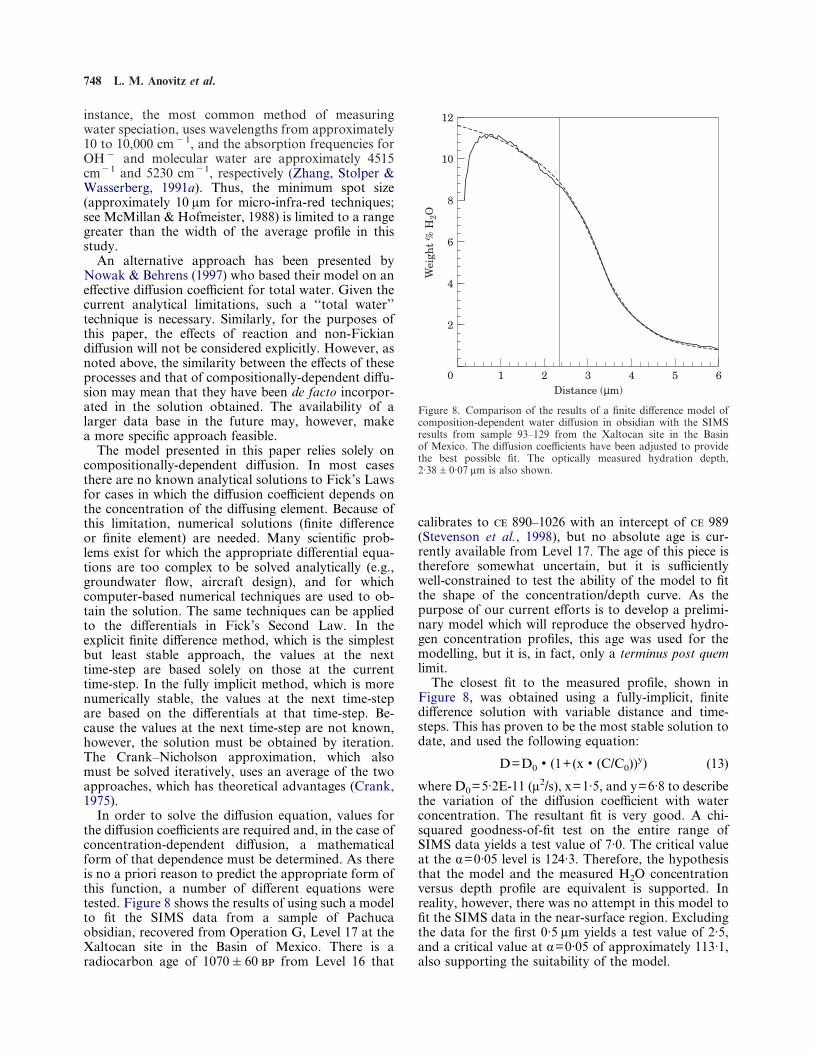
Figure 8. Comparison of the results of a finite difference model ofcomposition-dependent water diffusion in obsidian with the SIMSresults from sample 93–129 from the Xaltocan site in the Basinof Mexico. The diffusion coefficients have been adjusted to providethe best possible fit. The optically measured hydration depth,2·38&0·07 ìm is also shown.
instance, the most common method of measuringwater speciation, uses wavelengths from approximately10 to 10,000 cm"1, and the absorption frequencies forOH" and molecular water are approximately 4515cm"1 and 5230 cm"1, respectively (Zhang, Stolper &Wasserberg, 1991a). Thus, the minimum spot size(approximately 10 ìm for micro-infra-red techniques;see McMillan & Hofmeister, 1988) is limited to a rangegreater than the width of the average profile in thisstudy.
An alternative approach has been presented byNowak & Behrens (1997) who based their model on aneffective diffusion coefficient for total water. Given thecurrent analytical limitations, such a ‘‘total water’’technique is necessary. Similarly, for the purposes ofthis paper, the effects of reaction and non-Fickiandiffusion will not be considered explicitly. However, asnoted above, the similarity between the effects of theseprocesses and that of compositionally-dependent diffu-sion may mean that they have been de facto incorpor-ated in the solution obtained. The availability of alarger data base in the future may, however, makea more specific approach feasible.
The model presented in this paper relies solely oncompositionally-dependent diffusion. In most casesthere are no known analytical solutions to Fick’s Lawsfor cases in which the diffusion coefficient depends onthe concentration of the diffusing element. Because ofthis limitation, numerical solutions (finite differenceor finite element) are needed. Many scientific prob-lems exist for which the appropriate differential equa-tions are too complex to be solved analytically (e.g.,groundwater flow, aircraft design), and for whichcomputer-based numerical techniques are used to ob-tain the solution. The same techniques can be appliedto the differentials in Fick’s Second Law. In theexplicit finite difference method, which is the simplestbut least stable approach, the values at the nexttime-step are based solely on those at the currenttime-step. In the fully implicit method, which is morenumerically stable, the values at the next time-stepare based on the differentials at that time-step. Be-cause the values at the next time-step are not known,however, the solution must be obtained by iteration.The Crank–Nicholson approximation, which alsomust be solved iteratively, uses an average of the twoapproaches, which has theoretical advantages (Crank,1975).
In order to solve the diffusion equation, values forthe diffusion coefficients are required and, in the case ofconcentration-dependent diffusion, a mathematicalform of that dependence must be determined. As thereis no a priori reason to predict the appropriate form ofthis function, a number of different equations weretested. Figure 8 shows the results of using such a modelto fit the SIMS data from a sample of Pachucaobsidian, recovered from Operation G, Level 17 at theXaltocan site in the Basin of Mexico. There is aradiocarbon age of 1070&60 from Level 16 that
calibrates to 890–1026 with an intercept of 989(Stevenson et al., 1998), but no absolute age is cur-rently available from Level 17. The age of this piece istherefore somewhat uncertain, but it is sufficientlywell-constrained to test the ability of the model to fitthe shape of the concentration/depth curve. As thepurpose of our current efforts is to develop a prelimi-nary model which will reproduce the observed hydro-gen concentration profiles, this age was used for themodelling, but it is, in fact, only a terminus post quemlimit.
The closest fit to the measured profile, shown inFigure 8, was obtained using a fully-implicit, finitedifference solution with variable distance and time-steps. This has proven to be the most stable solution todate, and used the following equation:
D=D0 v (1+(x v (C/C0))y) (13)
where D0=5·2E-11 (ì2/s), x=1·5, and y=6·8 to describethe variation of the diffusion coefficient with waterconcentration. The resultant fit is very good. A chi-squared goodness-of-fit test on the entire range ofSIMS data yields a test value of 7·0. The critical valueat the á=0·05 level is 124·3. Therefore, the hypothesisthat the model and the measured H2O concentrationversus depth profile are equivalent is supported. Inreality, however, there was no attempt in this model tofit the SIMS data in the near-surface region. Excludingthe data for the first 0·5 ìm yields a test value of 2·5,and a critical value at á=0·05 of approximately 113·1,also supporting the suitability of the model.

Failure of Obsidian Hydration Dating 749
While this form of the concentration-dependenceequation fits the data for this sample, and reproducesthe shape of other profiles, it has not been calibrated toexperimental or time series data, and the effects ofregional environmental variations have not been takeninto account. Therefore, it should not be used fordating applications until refined. The effect of thenear-surface changes in water concentration, not con-sidered in this model, may also strongly effect the finalresult.
Despite these current limitations, our initial effortsshow that, by allowing the diffusion coefficient to varywith the water concentration, a good fit to the data canbe achieved. Although this preliminary model is notyet capable of reproducing the near-surface changescorrelated with Na/K diffusion, the success of themodel clearly demonstrates the potential of suchmodelling to reproduce the real concentration/depth data and thereby to produce more accuratechronometric results.
ConclusionsThe results of our work to date have shown that thereare serious difficulties with the current methodologyused for obsidian hydration dating. Until these arecorrected, it is unlikely that OHD will become areliable chronometric tool. We have shown that theoptical technique employed for standard OHDmeasurements is unsuited to providing data with theneeded precision, and that the theoretical basis onwhich these data have been evaluated is incorrect.Together, these effects probably account for much ofthe unreliability of OHD analyses. Our work hassuggested further, however, that these limitationsmay not be unavoidable, and with suitable changes inboth the measurement and modelling procedures it ispossible that obsidian hydration may be useful forchronometric purposes.
In addition, preliminary results suggest that analysisof the hydration rims on obsidian artefacts may havemore than chronometric potential. Available datahave shown that diffusion of water in obsidian is afunction of time, temperature, and relative humidity.For archaeological and geological samples, each profileprovides data on changes in water and Na/K contentwith depth. Preliminary data also suggest that it maybe possible to measure changes in the deuterium/hydrogen ratio as a function of depth by SIMS.Simultaneous solution, using these data to constrain allthree variables, therefore, may provide palaeoclimatic,as well as chronological data. In cases where radio-carbon ages, or other independent chronometric dataare available, forward modelling of water profiles mayalso provide such constraints. This possibility hasalready been foreshadowed by Garcia-Barcena (1976)who proposed using independently dated obsidian ar-tefacts to extract an integrated temperature by solving
equation (2) for T, and by the work of Friedman,Gleason & Warden (1993) and Friedman et al. (1993)who investigated the possibility of using deuterium/hydrogen ratios in volcanic ash to monitor the isotopicconcentrations of ancient waters for palaeo-climaticreconstructions. If successful in obsidians, such model-ling would greatly enhance the utility and importanceof glass hydration analysis. First, however, similaranalyses of well-designed experimental and well-datedarchaeological samples are needed to constrain thedependence of the diffusion coefficient on water con-centration for individual glasses, and regional studiesare needed to ascertain the extent to which amodel, calibrated in one location, may be applied inanother.
The utility of OHD as a model of the degradation ofnuclear waste glasses also needs to be re-evaluated.Following intrinsic-rate OHD protocols, waste glassstudies have employed elevated temperature, shortduration experiments to rapidly hydrate and degrademan-made glasses, and have used the standard OHDequations (equations (1) and (2)) to model theresults and to make predictions concerning waste-glassdegradation (Bates, Jardine & Steindler, 1982; Byers,Jercinovic & Ewing, 1987; Abrajano, Bates & Mazer,1989; Mazer et al., 1992). Our results indicate that thisapproach may, in fact, not be adequate. Short durationexperiments may not realistically model long-term pro-cesses even if simple diffusion can describe the initialprocess. Therefore, some revision of the conclusions ofthese studies may be necessary.
Despite the difficulties described above, this studysuggests that OHD can be made more reliable byplacing it on a more analytically and theoreticallyrigorous footing. The recognized potential of OHD forarchaeology, especially in key loci of early civilization(e.g., Mesoamerica and the Middle East) make suchan effort worthwhile. Although it may never be theinexpensive, simple method envisioned by early re-searchers, the hydration process may be understoodand generalized to natural and some man-madeglasses, and OHD may yet become a reliable chrono-metric tool. The possibility that obsidian hydrationand exchange data may yield important palaeoclimaticdata further illustrates the importance of continuedrefinement of the method.
In order for obsidian hydration dating to becomereliable, several avenues of research need to be pur-sued. To begin with, the evolution of an obsidianhydration rim with time needs to be understood. Thisis best done by combining analysis of short-term,high-temperature experiments with similar obser-vations on archaeological specimens, all from the sameobsidian source, from a variety of ages and environ-ments. A similar approach can be used to quantify theeffect of obsidian chemistry and environmental vari-ables, particularly temperature and relative humidity.In addition, the effects of the various processesoutlined above (e.g., dissolution, compositionally-
750 L. M. Anovitz et al.
dependent diffusion, reaction, non-Fickian diffusion)need to be considered in more detail and the sources ofthe observed near-surface perturbations understood.Finally, the possibilities of using either temperature–humidity–time variations or stable isotopic measure-ments to constrain paleoclimates needs to be fullyexplored. Such a multi-focus approach is necessary ifthe potential of hydrated obsidian to provide high-precision chronometric and/or palaeoclimatic data is tobe realized.
AcknowledgementsThe authors would like to acknowledge the followingindividuals for contributions of samples or data or forreviewing an earlier draft of this report: ChristopherM. Stevenson, Archaeological Research Consultants,Inc. Columbus, OH; Michael D. Glascock and HectorNeff, Missouri University Research Reactor,Columbia, MO; Kathleen Slane and Jane Biers,Museum of Art History and Archaeology, Universityof Missouri, Columbia, MO; C. Vance Haynes,University of Arizona, Tucson, AZ; Craig E. Skinner,Northwest Research Obsidian Studies Laboratory,Corvallis, OR; Charles Faulkner, Lyle Konigsberg andJan F. Simek, University of Tennessee, Knoxville, TN;Susan Frankenberg, McClung Museum, University ofTennessee, Knoxville, TN; James S. Bogard, CarlosBamberger, Charles Forsberg and Ted Nolan, OakRidge National Laboratory, Oak Ridge, TN; TomChacko, University of Alberta; Robert H. Doremus,Rensselaer Polytechnic University, NY; RosannaRidings, Washington University, St. Louis, MO; andthey especially thank the late Mary Hodge, Universityof Houston-Clear Lake, Houston, TX for her contri-bution of the Chalco, Mexico samples. Research spon-sored by the Division of Engineering and Geosciences,and the Division of Chemical Sciences, Office of BasicEnergy Sciences, and the Geothermal TechnologyProgram, Office of Energy Efficiency and RenewableEnergy, U.S. Department of Energy under contractDE-AC05-96OR22464 with Oak Ridge NationalLaboratory, managed by Lockheed Martin EnergyResearch Corporation., and by National ScienceFoundation grant SBR-98-04350 to the University ofTennessee.
ReferencesAbrajano, T. A., Bates, J. K. & Mazer, J. J. (1989). Aqueous
corrosion of natural and nuclear waste glasses. Journal of Non-Crystalline Solids 108, 269–288.
Ambrose, W. R. (1976). Intrinsic hydration rate dating of obsidian.In (R. E. Taylor, Ed.) Advances in Obsidian Glass Studies. NewJersey: Noyes Press, pp. 81–105.
Ambrose, W. R. (1994). Obsidian hydration dating of a PleistoceneAge site from the Manus Islands, Papua New Guinea. QuaternaryGeochronology (Quaternary Science Reviews) 13, 137–142.
Bartholomew, R. F. (1982). Water in glass. In (M. Tomozawa &R. H. Doremus, Eds) Treatise on Materials Science and Tech-nology No. 22. San Diego, CA: Academic Press, pp. 75–127.
Bartholomew, R. F., Butler, B. L., Hoover, H. L. & We, C. K. (1980)Infrared spectra of a water-containing glass. J. Amer. Ceram. Soc.63, 481–485.
Bates, J. K., Jardine, L. J. & Steindler, M. J. (1982). The HydrationProcess of Nuclear Waste Glass: An Interim Report. Argonne:ANL-82–11.
Bates, J. K., Abrajano, T. A., Ebert, W. L., Mazer, J. J. & Gerding,T. J. (1988). Experimental hydration studies of natural andsynthetic glasses. Materials Research Society Symposium Proceed-ings 123, 237–244.
Behrens, H. & Nowak, M. (1997). The mechanisms of water diffu-sion in polymerized silicate melts. Contributions to Mineralologyand Petrology 126, 377–385.
Bloss, F. D. (1961). An Introduction to the Methods of OpticalCrystallography. New York: Holt, Rinehart and Winston.
Braswell, G. (1992). Obsidian hydration dating, the Coner phaseand revisionist chronology at Copan, Honduras. Latin AmericanAntiquity 3, 130–147.
Braswell, G. E., Glascock, M. D. & Neff, H. (1996). The obsidianartefacts of Group 10L-2, Copan: production, exchange andchronology. Paper Presented at the 61st Annual Meeting of theSociety for American Archaeology, New Orleans, LA, April 1996.
Burns, L. & Roberts, J. P. (1970). Influence of hydroxyl content onthe diffusion of water in silica glass. Physics and Chemistry ofGlasses 11, 106–114.
Byers, C. D., Jercinovic, M. J. & Ewing, R. C. (1987). A Study ofNatural Glass Analogues as Applied to Alteration of Nuclear WasteGlass. Argonne: ANL, pp. 86–46.
Chakraborty, S. & Ganguly, J. (1991). Compositional zoning andcation diffusion in garnets. In (J. Ganguly, Ed.) Diffusion, AtomicOrdering and Mass Transport. Advances in Physical Geochemistry8. New York: Springer Verlag, pp. 176–197.
Clark, D. E. & Zoitos, B. K. (1992). Corrosion testing and charac-terization. In (D. E. Clark & B. K. Zoitos, Eds) Corrosion ofGlass, Ceramics and Ceramic Superconductors. New Jersey: NoyesPublications, pp. 51–102.
Clark, D. E., Schult, R. L., Wicks, G. G. & Lodding, A. R. (1993).Waste glass alteration processes, surface layer evolution and ratelimiting steps. Materials Research Society Symposium Proceedings333, 107–122.
Cockram, D. R., Haider, Z. & Roberts, G. J. (1969). The diffusion of‘water’ in soda-lime glass within and near the transformationrange. Physics and Chemistry of Glasses 10, 18–22.
Cowgill, G. L. (1996). Discussion. Ancient Mesoamerica 7, 325–331.Cowgill, G. L. & Kintigh, K. W. (1997). How random error in dates
increase apparent lengths of intervals. Paper Presented at the62nd Annual Meeting of the Society for American Archaeology,Nashville, TN, April 1997.
Crank, J. (1975). The Mathematics of Diffusion. Oxford: OxfordUniversity Press.
Davies, G. A., Ponter, A. B. & Craine, K. (1967). The diffusion ofcarbon dioxide in organic liquids. Can. J. Chem. Eng. 45, 372–376.
Drury, T. & Roberts, J. P. (1963). Diffusion in silica glass followingreaction with tritiated water vapour. Physics and Chemistry ofGlasses 4, 79–90.
Doremus, R. H. (1975). Interdiffusion of hydrogen and alkali ions ina glass surface. Journal of Non-Crystalline Solids 19, 137–144.
Doremus, R. H. (1979). Chemical durability of glass. In (M.Tomozawa & R. H. Doremus, Eds) Treatise on Materials Scienceand Technology Vol. 17. New York: Academic Press, pp. 41–69.
Doreumus, R. H. (1994). Glass Science. New York: John Wiley andSons, Inc.
Doreumus, R. H. (1995). Diffusion of water in glass. Journal ofMaterials Research 10, 2379–2389.
Elam, J. M. (1993). Obsidian exchange in the Valley of Oaxaca,Mexico 2500–500 BP. Ph.D. Thesis. University of Missouri-Columbia, Columbia, MO.
Elam, J. M., Glascock, M. D. & Neff, H. (1994). Obsidian artefactsfrom Oaxaca, Mexico: source identification and hydration dating.
Failure of Obsidian Hydration Dating 751
In (D. A. Scott & P. Meyers, Eds) Archaeometry of Pre-ColumbianSites and Artifacts. Los Angeles, CA: Getty ConservationInstitute, pp. 135–160.
Ericson, J. E. & Berger, R. (1976). Physics and chemistry of thehydration process in obsidians II: experiments and measurements.In (R. E. Taylor, Ed.) Advances in Obsidian Glass Studies. NewJersey: Noyes Press, pp. 46–62.
Ericson, J. E., MacKenzie, J. D. & Berger, R. (1976). Physics andchemistry of the hydration process in Obsidians I: theoreticalimplications. In (R. E. Taylor, Ed.) Advances in Obsidian GlassStudies. New Jersey: Noyes Press, pp. 25–45.
Ernsberger, F. M. (1977). Molecular water in glass. J. Amer. Ceram.Soc. 60, 91–92.
Evans, S. T. & Freter, A. (1996). Teotihuacan Valley Mexico,postclassic chronology. Ancient Mesoamerica 7, 267–280.
Evans, D. F., Tominaga, T. & Davis, H. T. (1981). Tracer diffusionin polyatomic liquids. J. Chem. Phys. 74, 1298–1305.
Faulkner, C. H. (1984). An Archaeological and Historical Study of theJames White Second Home Site. Knoxville, TN: University ofTennessee, Department of Anthropology, Report of InvestigationsNo. 28.
Findlow, F. J. & Bennett, V. C. (1978). A note on the West Mexicanobsidian hydration rate. In (C. W. Meighan & P. I. Vanderhoeven,Eds) Obsidian Dates II. Los Angeles, CA: UCLA Institute ofArchaeology Monograph VI, pp. 127–164.
Findlow, F. J., Bennett, V. C., Ericson, J. E. & De Atley, S. P.(1975). A new obsidian hydration rate for certain obsidians in theAmerican southwest. American Antiquity 40, 344–348.
Freter, A. (1992). Chronological research at Copan. AncientMesoamerica 3, 117–133.
Friedman, I. & Long, W. (1976). Hydration rate of obsidian. Science191, 347–352.
Friedman, I. & Smith, R. (1960). A new dating method usingobsidian: Part I, the development of the method. AmericanAntiquity 25, 476–522.
Friedman, I., Smith, R. L. & Long, W. D. (1966). Hydration ofnatural glass and formation of perlite. Geological Society ofAmerica Bulletin 77, 323–327.
Friedman, I., Gleason, J. & Warden, A. (1993). Ancient climate fromdeuterium content of water in volcanic glass. In (P. K. Swart,K. C., Lohmann, J. McKenzie & S. Savin, Eds) Climate Changein Continental Isotopic Records. Geophysical Monograph 78,American Geophysical Union, pp. 309–319.
Friedman, I., Gleason, J., Sheppard, R. A. & Gude, A. J. (1993).Deuterium fractionation as water diffuses into silicic volcanic ash.In (P. K. Swart, K. C. Lohmann, J. McKenzie & S. Savin, Eds)Climate Change in Continental Isotopic Records. GeophysicalMonograph 78, American Geophysical Union, pp. 321–323.
Garcia-Barcena, J. (1976). Paleotemperaturas e Hidratacion de laObsidiana. Boletin del INAH II 17, 19–24.
Garcia-Barcena, J. (1989). Las Ecuaciones de Hidratacion de laObsidiana. In (G. M. Gaxiola and J. E. Clark, Eds) La Obsidianaen Mesoamerica. Mexico: Coleccion Cientifica, Serie Arqueologia,Instituto Nacional de Antropologia e Historia, pp. 59–68.
Gillen, G., Lareau, R., Bennett, J. & Stevie, F. (1998). SecondaryIon Mass Spectrometry: SIMS XI. New York: J. Wiley & Sons,pp. 1118.
Grambow, B. (1992). Geochemical approach to glass dissolution. In(D. E. Clark & B. K. Zoitos, Eds) Corrosion of Glass, Ceramicsand Ceramic Superconductors. New Jersey: Noyes Publications,pp. 124–152.
Haller, W. (1963). Concentration-dependent diffusion coefficient ofwater in glass. Physics and Chemistry of Glasses 4, 217–220.
Hiss, T. G. & Cussler, E. L. (1973) Diffusion in high viscosity liquids.AIChE Journal 19, 693–703.
Jones, G. T. & Beck, C. (1990). An obsidian hydration chronologyof Late Pleistocene–Early Holocene surface assemblages ButteValley, Nevada. Journal of California and Great Basin Archaeology12, 84–100.
Kimberlin, J. (1976). Obsidian hydration rate determinations onchemically characterized samples. In (R. E. Taylor, Ed.) Advancesin Obsidian Glass Studies. New Jersey: Noyes Press, pp. 63–79.
Kirkaldy, J. S. & Young, D. J. (1987). Diffusion in the CondensedState. London: The Institute of Metals.
Lanford, W. A. (1977). Glass hydration: a method of dating glassobjects. Science 196, 975–976.
Lanford, W. A. (1978). 15N hydrogen profiling: scientific appli-cations. Nuclear Instruments and Methods 149, 1–8.
Larocque, A. C. L. & Cabri, L. J. (in press). Ion-microprobequantification of precious metals in sulfide minerals. In (M. A.McKibben, P. Shanks & W. I. Ridley, Eds) Applications ofMicroanalytical Techniques to Understanding Mineralizing Pro-cesses. Reviews in Economic Geology 7, 155–167.
Lasaga, A. C. (1983). Geospeedometry: an extension of geo-thermometry. In (S. K. Saxena, Ed.) Kinetics and Equilibrium inMineral Reactions. Advances in Physical Geochemistry 3. NewYork: Springer Verlag, pp. 61–80.
Laursen, T. & Lanford, W. A. (1978). Hydration of obsidian. Nature276, 153–156.
Lee, R. R., Leich, D. A., Tombrello, T. A., Ericson, J. E. &Friedman, I. (1974). Obsidian hydration profile measurementsusing a nuclear reaction technique. Nature 250, 44–47.
Lodding, A. R. (1992). Characterization of corroded ceramics bySIMS. In (D. E. Clark & B. K. Zoitos Eds) Corrosion of Glass,Ceramics and Ceramic Superconductors. New Jersey: NoyesPublications, pp. 103–121.
Lodding, A. R. & Van Iseghem, P. (1995). Corrosion of waste glassesin boom clay: studies of element concentration by SIMS. MaterialsResearch Society Symposium Proceedings 412, 229–238.
Manahan, K. (1996). The nature of the Classic Maya collapseat Copan: new insight from a domestic perspective. Paper Pre-sented at the 61st Annual Meeting of the Society for AmericanArchaeology, New Orleans, LA, April 1996.
Manzanilla, L., Lopez, C. & Freter, A. C. (1996). Dating resultsfrom excavations in quarry tunnels behind the pyramid of the Sunat Teotihuacan. Ancient Mesoamerica 7, 245–266.
Mazer, J. J., Bates, J. K., Bradley, C. R. & Stevenson, C. M. (1992).Water diffusion in tektites: an example of natural analogues inevaluating the long-term reaction of glass in water. Journal ofNuclear Materials 190, 277–284.
McGrail, B. P., Pederson, L. R., Strachan, D. M. & Ewing, R. C.(1988). Obsidian hydration dating—field, laboratory, and model-ling results. Materials Research Society Symposium Proceedings123, 263–269.
McKibben, M. A. & Riciputi, L. R. (1998). Sulfur isotope analysisby ion microprobe. In (M. A. McKibben, P. Shanks & W. I.Ridley, Eds) Applications of Microanalytical Techniques to Under-standing Mineralizing Processes. Reviews in Economic Geology 7,121–140.
McMillen, P. F. & Hofmeister, A. M. (1988). Infrared and Ramanspectroscopy. In (F. C. Hawthorne, Ed.) Spectroscopic Methodsin Mineralogy and Geology. Mineralogical Society of AmericaReviews in Mineralogy 18, 99–159.
Meighan, C. W. (1976). Empirical determination of obsidian hydra-tion rates from archaeological evidence. In (R. E. Taylor, Ed.)Advances in Obsidian Glass Studies. New Jersey: Noyes Press,pp. 106–119.
Meighan, C. W. & Haynes, C. V. (1970). The Borax Lake siterevisited. Science 167, 1213–1221.
Meighan, C. W., Foote, L. J. & Aiello, P. V. (1968). Obsidian datingin West Mexican archeology. Science 160, 1069–1075.
Michels, J. W., Tsong, I. S. T. & Smith, G. A. (1983). Experimentallyderived hydration rates in obsidian dating. Archaeometry 25,107–117.
Michels, J. W., Tsong, I. S. T. & Nelson, C. M. (1983). Obsidiandating and east african archaeology. Science 219, 361–366.
Moulson, J. & Roberts, J. P. (1961). Water in silica glass. Trans-actions of the Faraday Society 57, 1208–1216.
Morgenstein, M. E. & Shettel, D. L. (1994). Volcanic glass as anatural analogue for borosilicate waste glass. Materials ResearchSociety Symposium Proceedings 333, 605–615.
Morioka, M. & Nagasawa, H. (1991). Ionic diffusion in olivine. In(J. Ganguly, Ed.) Diffusion, Atomic Ordering and Mass Transport.

752 L. M. Anovitz et al.
Advances in Physical Geochemistry 8. New Yorker: SpringerVerlag, pp. 176–197.
Nichols, D. L. & Charlton, T. H. (1996). The postclassic occupationat Otumba. Ancient Mesoamerica 7, 231–244.
Nasedkin, V. V. (1964). Volatile components of volcanic glasses.Geochemistry International 2, 317–330.
Nogami, M. & Tomozawa, M. (1984). Diffusion of water in highsilica glasses at low temperature. Physics and Chemistry of Glasses25, 82–85.
Nowak, M. & Behrens, H. (1997). An experimental investigationof diffusion of water in haplogranitic melts. Contributions toMineralogy and Petrology 126, 365–376.
Oversby, V. M. & Phinney, D. L. (1992). The development of surfacealteration layers on SRL-165 nuclear waste glasses. Journal ofNuclear Materials 190, 247–268.
Purdy, B. A. & Clark, D. E. (1987). Weathering of inorganicmaterials: dating and other applications. In (M. B. Schiffer, Ed.)Advances in Archaeological Method and Theory, Vol. 11. London:Academic Press, pp. 211–253.
Reid, R. C., Prauznitz, J. M. & Sherwood, T. K. (1977). TheProperties of Liquids and Gases. 3rd Edn. New York: McGraw-Hill.
Ridings, R. (1996). Where in the world does obsidian hydrationdating work? American Antiquity 61, 136–148.
Roberts, G. J. & Roberts, J. P. (1964). Influence of thermal historyon the solubility and diffusion of ‘‘water’’ in silica glass. Physicsand Chemistry of Glasses 5, 26–31.
Roberts, G. J. & Roberts, J. P. (1966). An oxygen tracer investi-gation of the diffusion of water in silica glass. Physics andChemistry of Glasses 7, 82–89.
Robertson, J. K. (1941). Introduction to Physical Optics. New York:D. Van Rostrand Co., Inc.
Rochow, T. G. & Tucker, P. A. (1994). Introduction to Microscopyby Means of Light, Electrons, X-rays or Acoustics. New York:Plenum Press,
Salem, A. A., Stingeder, G., Grassbauer, M., Shreiner, M., Giessler,K. H. & Rauch, F. (1996). SIMS and RBS analysis of leachedglass: Reliability of RSF method for SIMS quantification. Journalof Materials Science: Materials in Electronics 7, 373–379.
Scheetz, B. E. & Stevenson, C. M. (1988). The role of resolution andsample preparation in hydration rim measurement: implicationsfor experimentally determined hydration rates. American Antiquity53, 110–117.
Scholze, H. (1959). Water content of glasses. I. Influence of waterdissolved in glass on the infrared spectrum and the quantitativeinfrared-spectroscopic determination of water in glasses. Glastech.Ber. 32, 81–89.
Stevenson, C. M., Carpenter, J. & Scheetz, B. E. (1989). Obsidiandating: recent advances in the experimental determination andapplication of hydration rates. Archaeometry 31, 193–206.
Stevenson, C. M., Sheppard, P. J. & Sutton, D. G. (1996). Advancesin the hydration dating of New Zealand obsidian. Journal ofArchaeological Science 23, 233–242.
Stevenson, C. M., Mazer, J. J. & Scheetz, B. E. (1998). Laboratoryobsidian hydration rates: theory, method and application. In (S.Shackley, Ed.) Method and Theory in Volcanic Glass Studies,London: Plenum Press.
Stoiber, R. E. & Morse, S. A. (1981). Microscopic Identification ofCrystals. New York: Robert E. Krieger Publishing Co.
Stolper, E. M. (1982). Water in silicate glasses: an infrared spectro-scopic study. Contrib. Mineral. Petrol. 81, 1–17.
Tremaine, K. J. & Fredrickson, D. A. (1988). Induced obsidianhydration experiments: an investigation in relative dating.Materials Research Society Symposium Proceedings 123, 271–278.
Tsong, I. S. T., Houser, C. A., Yusef, N. A., Messier, R. F., White,W. B. & Michels, J. W. (1978). Obsidian hydration profilesmeasured by sputter induced optical emission. Science 201,339–341.
Tsong, I. S. T., Smith, G. A., Michels, J. W., Wintenberg, A. L.,Miller, P. D. & Moak, C. D. (1981). Dating of obsidian artefactsby depth-profiling of artificially hydrated surface layers. NuclearInstruments and Methods 191, 403–407.
Valley, J. W., Graham, C. M., Harte, B., Eiler, J.M. & Kinny, P. D.(1998). Ion microprobe analysis of oxygen, carbon, and hydrogenisotope ratios. In (M. A. McKibben, P. Shanks & W. I. Ridley,Eds) Applications of Microanalytical Techniques to UnderstandingMineralizing Processes. Reviews in Economic Geology 7, 73–98.
Vandiver, P. (1992). Corrosion and conservation of ancient glassand ceramics. In (D. E. Clark & B. K. Zoitos, Eds) Corrosion ofGlass, Ceramics and Ceramic Superconductors. New Jersey: NoyesPublications, pp. 393–431.
Van Iseghem, P. (1993). In situ testing of waste glass in clay.Materials Research Society Symposium Proceedings 333, 133–144.
Wakabayashi, H. & Tomozawa, M. (1989). Diffusion of water intosilica glass at low temperature. Journal of the American CeramicSociety 72, 1850–1855.
Webster, D. & Freter, A. (1990). Settlement history and the classiccollapse at Copan: a redefined chronological perspective. LatinAmerican Antiquity 1, 66–85.
Webster, D., Freter, A. & Rue, D. (1993). The obsidian hydrationdating project at Copan: a regional approach and why it works.Latin American Antiquity 4, 303–324.
Wendorf, F., Laury, R. L., Albritton, C. C., Schild, R., Haynes,C. V., Damon, P. E., Shafiqullah, M. & Scarborough, R. (1975).Dates for the Middle Stone Age of East Africa. Science 187,740–742.
Wicks, G. G. (1992). Nuclear waste glasses: corrosion behaviorand field tests. In (D. E. Clark & B. K. Zoitos, Eds) Corrosion ofGlass, Ceramics and Ceramic Superconductors. New Jersey: NoyesPublications, pp. 218–288.
Yanagisawa, N., Fujimoto, K., Nakashima, S., Kurata, Y. &Sanada, N. (1997) Micro FT-IR study of the hydration-layerduring dissolution of silica glass. Geochim. Cosmochim. Acta 61,1165–1170.
Zhang, Y., Stolper, E. M. & Wasserberg. G. J. (1991a). Diffusion ofwater in rhyolitic glasses. Geochimica et Cosmochimica Acta 55,441–456.
Zhang, Y., Stolper, E. M. & Wasserburg, G. J. (1991b). Diffusion ofa multi-species and its role in oxygen and water transport insilicates. Earth and Planetary Science Letters 103, 228–240.
Copyright © 2022 FDOKUMEN