The exploration & forensic analysis of computer usage data in the elderly
9
The Exploration & Forensic Analysis of Computer Usage Data in the Elderly William J. Hatt, Department of Medical Informatics and Clinical Epidemiology, Oregon Health and Science University, Portland, OR 97239-3098 USA Edward A. VanBaak, Department of Medical Informatics and Clinical Epidemiology, Oregon Health and Science University, Portland, OR 97239-3098 USA Holly B. Jimison [Member IEEE], Department of Medical Informatics and Clinical Epidemiology, Oregon Health and Science University, Portland, OR 97239-3098 USA Stuart Hagler, Division of Biomedical Engineering, Oregon Health and Science University, Portland, OR 97239-3098 USA Tamara L. Hayes [Member IEEE], Division of Biomedical Engineering, Oregon Health and Science University, Portland, OR 97239-3098 USA Misha Pavel [Member IEEE], and Division of Biomedical Engineering, Oregon Health and Science University, Portland, OR 97239-3098 USA Jeffery Kaye [Member IEEE] William J. Hatt: [email protected]; Edward A. VanBaak: [email protected]; Holly B. Jimison: [email protected]; Stuart Hagler: [email protected]; Tamara L. Hayes: [email protected]; Misha Pavel: [email protected] Abstract Unobtrusive in-home computer monitoring could one day be used to deliver cost-effective diagnostic information about the cognitive abilities of the elderly. This could allow for early detection of cognitive impairment and would additionally be coupled with the cost advantages that are associated with a semi-automated system. Before using the computer usage data to draw conclusions about the participants, we first needed to investigate the nature of the data that was collected. This paper represents a forensics style analysis of the computer usage data that is being collected as part of a larger study of cognitive decline, and focuses on the isolation and removal of non user-generated activities that were recorded by our computer monitoring software (CMS). I. INTRODUCTION With the growing elderly population in the United States and around the world 1 there will be an increased need for preventative care for the aging population. This need stems both from our duty to provide them with increased quality of life 2 , and the financial realities that we will face when caring for a rapidly growing population. 3, 4 Previous studies 5–7 have shown the importance of early recognition of cognitive decline, but current tests are expensive, time consuming, and are administered infrequently. NIH Public Access Author Manuscript Conf Proc IEEE Eng Med Biol Soc. Author manuscript; available in PMC 2010 March 29. Published in final edited form as: Conf Proc IEEE Eng Med Biol Soc. 2009 ; 2009: 1216–1219. doi:10.1109/IEMBS.2009.5333084. NIH-PA Author Manuscript NIH-PA Author Manuscript NIH-PA Author Manuscript
Transcript of The exploration & forensic analysis of computer usage data in the elderly

The Exploration & Forensic Analysis of Computer Usage Data inthe Elderly
William J. Hatt,Department of Medical Informatics and Clinical Epidemiology, Oregon Health and ScienceUniversity, Portland, OR 97239-3098 USA
Edward A. VanBaak,Department of Medical Informatics and Clinical Epidemiology, Oregon Health and ScienceUniversity, Portland, OR 97239-3098 USA
Holly B. Jimison [Member IEEE],Department of Medical Informatics and Clinical Epidemiology, Oregon Health and ScienceUniversity, Portland, OR 97239-3098 USA
Stuart Hagler,Division of Biomedical Engineering, Oregon Health and Science University, Portland, OR97239-3098 USA
Tamara L. Hayes [Member IEEE],Division of Biomedical Engineering, Oregon Health and Science University, Portland, OR97239-3098 USA
Misha Pavel [Member IEEE], andDivision of Biomedical Engineering, Oregon Health and Science University, Portland, OR97239-3098 USA
Jeffery Kaye [Member IEEE]William J. Hatt: [email protected]; Edward A. VanBaak: [email protected]; Holly B. Jimison: [email protected]; StuartHagler: [email protected]; Tamara L. Hayes: [email protected]; Misha Pavel: [email protected]
AbstractUnobtrusive in-home computer monitoring could one day be used to deliver cost-effective diagnosticinformation about the cognitive abilities of the elderly. This could allow for early detection ofcognitive impairment and would additionally be coupled with the cost advantages that are associatedwith a semi-automated system. Before using the computer usage data to draw conclusions about theparticipants, we first needed to investigate the nature of the data that was collected. This paperrepresents a forensics style analysis of the computer usage data that is being collected as part of alarger study of cognitive decline, and focuses on the isolation and removal of non user-generatedactivities that were recorded by our computer monitoring software (CMS).
I. INTRODUCTIONWith the growing elderly population in the United States and around the world1 there will bean increased need for preventative care for the aging population. This need stems both fromour duty to provide them with increased quality of life2, and the financial realities that we willface when caring for a rapidly growing population.3, 4 Previous studies5–7 have shown theimportance of early recognition of cognitive decline, but current tests are expensive, timeconsuming, and are administered infrequently.
NIH Public AccessAuthor ManuscriptConf Proc IEEE Eng Med Biol Soc. Author manuscript; available in PMC 2010 March 29.
Published in final edited form as:Conf Proc IEEE Eng Med Biol Soc. 2009 ; 2009: 1216–1219. doi:10.1109/IEMBS.2009.5333084.
NIH
-PA Author Manuscript
NIH
-PA Author Manuscript
NIH
-PA Author Manuscript

The Biomedical Research Partnership (BRP) is a NIA funded longitudinal research studyinvolving over 230 elderly participants. The study focuses on continuous and unobtrusive in-home assessment of physical activity and computer usage.8 One of the aims of the study is todetermine whether the unobtrusive monitoring of general activity in the home can be used todetect changes in motor and cognitive function, thereby allowing for early intervention and anincreased quality of life. Physical activity is being monitored through motion sensors, andcomputer usage is being monitored through a program that is installed on participant’s personalcomputers.
The benefit of the approach used in the BRP study, compared to traditional methods, is thatthe monitoring is continuous. The cost of the testing also drops as specially trained individualsare not required at the home in order to administer tests or monitor the situation.
Of the more than 230 participants in the study 189 of them have Internet connected computersthat are monitored as a part of the study. While the scale of the project promises to offer largequantities of useful information that can be used for later research it also poses a challenge toour ability to carefully manage and process the computer usage information. Additionally, weneeded to control for several types of computer events that could lead to a misinterpretation ofvalid computer activity. This was due to the necessary but often unpredictable nature of theinteractions taking place between the systems involved, the users, the operating system, andthe other applications running on the computer. We found that a computer forensics perspectiveshould be taken with the computer usage data in order to ensure its quality and accuracy. Theterm computer forensics is meant to convey that before looking at the data in order to drawconclusions about the participants we first needed to investigate the nature of the computerdata that was collected. This paper represents a analysis of the computer collection techniquesthat are being used in the BRP computer usage study.
II. METHODSAssessment Setup
The Computer Monitoring Software (CMS) that was used in the study was designed at OHSU’sDivision of Biomedical Engineering (BME). The software functions in two ways. Before theuser logs onto the computer, the CMS prompts the users to enter a user name and passwordgiven to them at the start of the study. This prompt screen is actually a locked screensaver thatacts as a replacement for the standard windows login screen. During and after the entry of auser name / password combination, the CMS monitors the activity of the user.
Five types of events were recorded from the participants’ computers (Trigrams of generaltyping data, Login events, Login Passwords – a.k.a. KeyData, Application focus change events,and Mouse events). Because of storage constraints each type of data has to be stored separately,and then later pooled in a single location so that each type of event could be viewed in relationto the others and ordered by date. Several graphing techniques were adapted for use in orderto explore the data and look for errors.
The host computers were uniformly equipped with Microsoft Windows XP, though hardwareand peripherals such as mouse input devices were not as uniform. A primary concern of thisinvestigation was to discover and resolve and unexpected behavior that may occur betweenthe operating system and the peripheral hardware. This was done to ensure that the informationbeing gathered from the study participants could later be correctly interpreted.
The login event is stored, as well as all of the keystrokes that were used to generate thepassword, and recorded with millisecond precision. Once the user has logged in, the programalso monitored various types of mouse input, such as movement and mouse click events. We
Hatt et al. Page 2
Conf Proc IEEE Eng Med Biol Soc. Author manuscript; available in PMC 2010 March 29.
NIH
-PA Author Manuscript
NIH
-PA Author Manuscript
NIH
-PA Author Manuscript

also monitored application activity and recorded the path and time at which an applicationwindow gained focus on the user’s screen.
Although keyboard typing activity is recorded, this information is restricted and obfuscatedover concerns for the patient’s privacy. Rather than recording actual keystrokes in the orderthey were entered, the keyboard data is recorded in the form of trigrams. Trigrams consist ofthe last 3 key codes that the user has entered, and the amount of time that has elapsed betweenthe 3 key press events. The trigrams are also time stamped with a limited 1 hour resolution,which allows later researcher to have information about the approximate time the keyinformation and how fast it was entered without the ability to recreate what was actually typed.Furthermore, key activity is only recorded when the participant is using a web browser or typingan e-mail in Microsoft Outlook.
The information that was collected by the CMS was forwarded to a special purpose computerstored at the participant’s house. Once a day all of this information is bundled and forwardedover a broadband Internet connection to a secure MySQL database server that is run at OHSU’sDivision of Biomedical Engineering (BME). Due to the quantity of data that is generated andthe fact that much of the data will be used for longitudinal investigations, the design of theback end system that we used is subject to a complex set of requirements. Each data type isstored in its own table, with the exception of the mouse data which because of its size is storedin a separate SQL server at BME. Although this allowed us to work with very large data sets,and it scales well as the number of study participants increases, it also presents a computationalchallenge. Our current investigations, and undoubtedly later analyses, will require that all ofthe information for a specific user be collated into a format for easy and efficient access.
We used TheMathWorks™ MatLab 2008b software to process the user’s computer activitydata. This was accomplished by connecting MatLab to the MySQL database and pooling thedata into a single set of files for each user. The sheer volume of data that is collected for eachuser made it necessary to store user data into separate files, where each file contained data froma single month. Multiple months can be loaded into memory as long as enough RAM isavailable. This approach satisfies the memory limitations that we faced, while allowinginvestigators to choose the quantity and duration of the information needed. Changes in MatLab2008b include a greater focus on object oriented programming which allowed for rapidalgorithm development. The graphing functions in particular were a valuable tool that was usedin our investigation of the data that was being collected.
Confounding FactorsDuring initial analysis it became apparent that memory management was a major road blockstanding in our way of processing the data. While our aim is to compare data from distant timesin the study, we were limited by our ability to load all of the information into memory or insome cases even on to a single computer. The SQL databases were queried from MatLab andprepared for processing by storing the collated user data in a separate file for each month. Onceprepared in this fashion the data was loaded into memory in discrete chunks and we were ableprocess one or several months of data at a time. This allowed for old data to be archived asready for processing, and for the new data from continuous monitoring to be updated as needed.
Continuous monitoring coupled with a longitudinal study meant that there were large volumesof data that needed to be stored and processed. The mouse data in particular has generated over8GiB for two years of data for a single user. Multiplying that storage demand for all 196 users,and the number of years left in the study and it becomes apparent that the growing size of theSQL database presents a challenge to both our ability to store and process all of the data.
Hatt et al. Page 3
Conf Proc IEEE Eng Med Biol Soc. Author manuscript; available in PMC 2010 March 29.
NIH
-PA Author Manuscript
NIH
-PA Author Manuscript
NIH
-PA Author Manuscript

Collation of the data sources that were recorded (Trigrams, Login Events, Passwords,Applications, Mouse Events) within MatLab allowed for each type of information to be viewedin relation to the other types and ordered by date. Because of memory limitations, only the typeof event and the time it occurred are stored in memory. Additional information about the event,such as mouse cursor position for mouse events, or application paths for application changeevents are loaded on a need-to-know basis from the SQL server in order to save memory.Several graphing techniques were adapted for use with our computer usage data set.
III. RESULTSWe used polar plots of computer events to visually explore user activity throughout the day.Examples of polar plots are shown in Figure 1 and Figure 3. The polar plots show activity ofthe user by time of day represented by the angle of the polar plot, with each successive ringaround the circle representing another day. Viewing the data in this fashion became a valuablediagnostic tool that was used to help ensure the validity of the data that was being collected.
Mouse Data Noise ReductionOne trend the polar plot was able to reveal was that not all of the mouse data was generatedby the user. We found that the CMS generated mouse movement data in a “heartbeat” fashion,approximately every 30 minutes. This happened because the monitoring software was designedto empty its memory at regular intervals in order to prevent buffer overflow and data corruption.The problem was that not all of the mouse data was actually removed from memory and thisresulted in a single time-stamp of mouse activity occurring approximately every 30 minutes(See Figure 1) and it needed to be filtered out before other teams began analyzing the mousedata.
The short streaks/lines in Figure 1 represent actual computer use and are a mix severalcategories of data. They are not actually lines, but tightly packed with many individual datapoints. In contrast the lone mouse data points represent the heartbeat pattern that was generatedby the CMS. Filtering of the mouse data was possible because of the density of the mouse datapoints. During normal use, the mouse generated a new time stamp every 15–300ms dependingon how far or fast the mouse was moved. In contrast, the noise generated, by our CMS occurredapproximately once every half hour and generated only a single data point. In practice the usercould not generate a single time stamp by moving the mouse, because even a small mousemovement by the user would trigger the computer to record several data points.
Due to the high density of data that was collected from the participants’ computers (particularlythe mouse data) we were able to develop an alternative and more sensitive approach fordetermining the amount of time the users were spending on the computer. Rather thandepending solely on the login and logout events (which may artificially increase apparentcomputer usage) we estimated computer usage by looking for large gaps in the timestampsbetween data points and removing them from our usage calculation. The remaining gapsrepresent the actual amount of time that was spent on the computer.
Application Data AnalysisCounting the number of unique applications that were used by all participants (see Figure 2)shows that some applications are used quite often, but most applications are used quiteinfrequently. Of the 3401 unique application paths that have been recorded, 24 of them accountfor more than 90% of all the applications change events. The top 282 programs account for99% of the application usage, while the other 3119 applications account for less than 1% ofthe total. The exponential decay of the application usage made it a worthwhile approach to binand sort the applications in order to better understand the computing habits of the participants.
Hatt et al. Page 4
Conf Proc IEEE Eng Med Biol Soc. Author manuscript; available in PMC 2010 March 29.
NIH
-PA Author Manuscript
NIH
-PA Author Manuscript
NIH
-PA Author Manuscript

When application change events were recorded in the database (see Figure 3) there wasundoubtedly activity on the computer, but the caveat is that possibly not all of the activity wasinitiated by the user. Automatically updating programs such as antivirus software, WindowsUpdate, and Windows Defender can present false positives for computer activity and decreasethe accuracy of any estimates that are made concerning the amount of time participants areusing their computer. Separating this kind of program activity from normal computer use canbe difficult, because even though the programs are somewhat predictable because they autoupdate at regular intervals they can also be manually started by the user. Removing all instancesof an auto executing program from our calculations is thus not an option, because it would alsoremove valid user activity. This kind of noise can, however, be corrected for by searching forall unique program paths are executed at nearly the exact same time each day and then toremove them from the data set. This is an advantageous approach as it does not depend onidentifying new software or maintaining a list of software that runs on a regular basis.
IV. DISCUSSION AND CONCLUSIONThe primary purpose of the data collection in the longitudinal BRP Project is the assessmentof potential behavioral markers of cognitive and neuropsychological state of the participants.This objective requires a high degree of data integrity and interpretability. With the eventualgoal of using the computer data in conjunction with non computer measures of activity andperformance, we needed to remove obvious artifacts that were left from automatic systemprocesses. We were able to clean the dataset so that it better represented human usage only,and thereby demonstrated the feasibility of monitoring the computer usage of elders in theirhome environment.
Had we not carried out this initial step of analysis, our computer usage calculations would havebeen faulty through our assumption that all of the activity being recorded on the computer wasactually user generated. The noise that was present in the mouse data was later confirmed tohave come from the CMS package through a review of the source code, and team memberswere made aware of the situation. Through this process we have discovered the importance ofa careful interpretation of the data before it is summarized.
AcknowledgmentsThis work was supported by the following National Institute on Aging (NIA) Grants; Oregon Roybal Center for Agingand Technology P30AG024978 – (for use of ORCATECH pilot grants, living laboratory, and/or administrative coresupport); Oregon Alzheimer’s Disease Center (OADC) P30AG08017 – (for use of BRP/ORCATECH clinical data);Bioengineering Research Partnership, Oregon Roybal Center for Aging and Technology R01AG024059 – (for use ofBRP data)
Foremost we would like to thank all of the elderly participants in our study. Without their cooperation andunderstanding none of this would be possible. Additionally we would like to thank all of the technical teams at OHSU’sDivision of Biomedical Engineering (BME), and the Oregon Center for Aging and Technology (ORCATECH) fordesigning and assembling the systems that were used in generating the dataset that this paper analyzes.
REFERENCES1. Centers for Disease Control and Prevention. Trends in Aging — United States and Worldwide. MMWR
2003;52:102–106.2. Maciosek MV, Edwards NM, Coffield AB, Flottemesch TJ, Nelson WW, Goodman MJ, Rickey DA,
Butani AB, Solberg LI. Priorities among effective clinical preventive services: methods. Am J PrevMed 2006;31(1):90–96. [PubMed: 16777547]
3. National Commission on Prevention Priorities. Preventive Care: A National Profile on Use, Disparities,and Health Benefits. Partnership for Prevention. 2007 August;
Hatt et al. Page 5
Conf Proc IEEE Eng Med Biol Soc. Author manuscript; available in PMC 2010 March 29.
NIH
-PA Author Manuscript
NIH
-PA Author Manuscript
NIH
-PA Author Manuscript

4. National Commission on Prevention Priorities. Data Needed to Assess Use of High-Value PreventiveCare: A Brief Report from the National Commission on Prevention Priorities. Partnership forPrevention. 2007 August;
5. Erickson, P.; Wilson, R.; Shannon, I. Years of Healthy Life. Hyattsville, MD: National Center forHealth Statistics; 1995. Statistical Notes, no. 7
6. Boise L, Morgan DL, Kaye J, Camicioli R. Delays in the diagnosis of dementia: Perspectives of familycaregivers. Amer. J. Alzheimer’s Disease 1999;vol. 14(no 1):20–26.
7. Glascock P, Kutzik DM. Behavioral telemedicine: A new approach to the continuous nonintrusivemonitoring of activities of daily living. Telemedicine 2000;vol. 6(no 1):33–44.
8. Kaye, J.; Hayes, T.; Zitzelberger, T.; Yeargers, J.; Pavel, M.; Jimison, H.; Larimer, N.; Payne-Murphy,J.; Earl, E.; Wild, K.; Boise, L.; Williams, D.; Lundell, J.; Dishman, E. Deploying wide-scale inhomeassessment technology. In: Mihailidis, A.; Boger, J.; Kautz, H.; Normie, L., editors. Technology andAging: Selected papers from the 2007 International Conference on Technology and Aging; TheNetherlands: IOS Press: Amsterdam; 2008. p. 19-26.
Hatt et al. Page 6
Conf Proc IEEE Eng Med Biol Soc. Author manuscript; available in PMC 2010 March 29.
NIH
-PA Author Manuscript
NIH
-PA Author Manuscript
NIH
-PA Author Manuscript

Figure 1.Categorical data plot and mouse filter: Spokes radiating from the center indicate the time ofday. Each successive ring away from center represents a different day, and the number of datapoints for each type is listed to the left of the name in the legend. Left Side: Before the mousenoise filter; Right Side: After the mouse noise filter. *View of graph is zoomed in; not all datapoints are shown.
Hatt et al. Page 7
Conf Proc IEEE Eng Med Biol Soc. Author manuscript; available in PMC 2010 March 29.
NIH
-PA Author Manuscript
NIH
-PA Author Manuscript
NIH
-PA Author Manuscript

Figure 2.Application usage for all CMS users: The Y axis indicates the number of times an applicationwas executed. X axis indicates the relative rank-number of each application *E.g. The #1 mostused application was executed 386,642 times, while the least used (application numbers 2331through 3401) were only executed once.
Hatt et al. Page 8
Conf Proc IEEE Eng Med Biol Soc. Author manuscript; available in PMC 2010 March 29.
NIH
-PA Author Manuscript
NIH
-PA Author Manuscript
NIH
-PA Author Manuscript
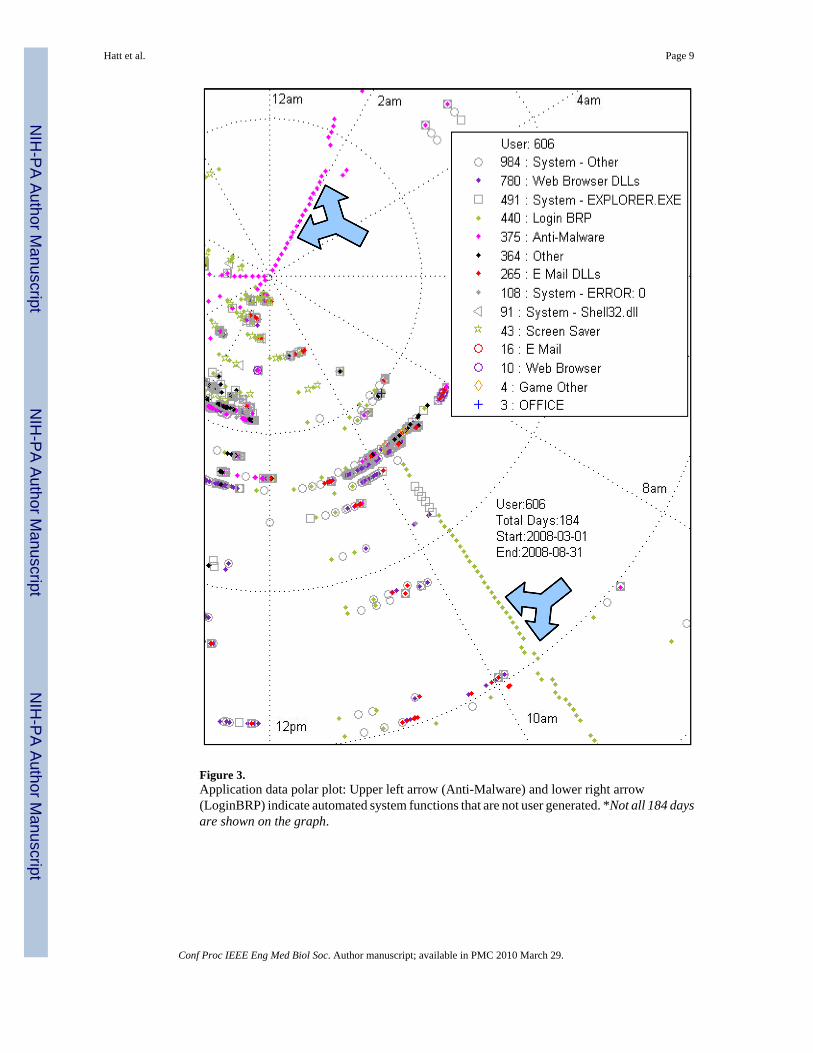
Figure 3.Application data polar plot: Upper left arrow (Anti-Malware) and lower right arrow(LoginBRP) indicate automated system functions that are not user generated. *Not all 184 daysare shown on the graph.
Hatt et al. Page 9
Conf Proc IEEE Eng Med Biol Soc. Author manuscript; available in PMC 2010 March 29.
NIH
-PA Author Manuscript
NIH
-PA Author Manuscript
NIH
-PA Author Manuscript