the Example of the Punjab Education Foundation Roy Carr-Hill
12
1 Assessing Possibilities of Corruption: the Example of the Punjab Education Foundation Roy Carr-Hill 1 and Ali Murtaza 2 for UKFIET International Conference on Education and Development – Education & Development Post 2015: Reflecting, Reviewing, Revisioning. Sub-Theme: Futures of Development Assistance Oxford, 10 – 12 September 1. Professor Roy Carr-Hill, Institute of Education, 20 Bedford Way, LONDON, WC1H 0AL; [email protected] ; tel: +44(0)1904 426388 2. Ali Murtaza, Independent Consultant, Lahore, Pakistan. Abstract Corruption in education, widely interpreted to include inappropriate behaviour, is difficult to discuss in print because of legal implications, but also because monitoring is weak. This paper proposes a way of identifying possibilities of corruption based on an analysis of the activities and processes involved, illustrated through an analysis of the Education Voucher Scheme implemented by the Punjab Education Foundation in Pakistan. Analysis of documents and a bespoke household and school survey showed there were several activities and decision points where there were opportunities for inappropriate behaviour: in particular, there were high risks of the very poor and vulnerable children being left out because of the way areas are selected, poor attendance rates because of lack of parental motivation, fees being charged for absent students, and poor educational outcomes because of poor quality teaching. The design almost certainly means that the very poor are excluded; that half of the teachers – most of them women – were being paid less than a dollar a day; freedom of choice has not led to schools being more accountable to parents, and competition hardly exists because the failure rate is less than 1%. The equity, productive efficiency objectives are not being met.
-
Upload
khangminh22 -
Category
Documents
-
view
1 -
download
0
Transcript of the Example of the Punjab Education Foundation Roy Carr-Hill

1
Assessing Possibilities of Corruption:
the Example of the Punjab Education Foundation
Roy Carr-Hill1 and Ali Murtaza2
for
UKFIET International Conference on Education and Development –
Education & Development Post 2015: Reflecting, Reviewing,
Revisioning.
Sub-Theme: Futures of Development Assistance
Oxford, 10 – 12 September
1. Professor Roy Carr-Hill, Institute of Education, 20 Bedford Way, LONDON, WC1H 0AL;
[email protected]; tel: +44(0)1904 426388
2. Ali Murtaza, Independent Consultant, Lahore, Pakistan.
Abstract
Corruption in education, widely interpreted to include inappropriate behaviour, is difficult
to discuss in print because of legal implications, but also because monitoring is weak. This
paper proposes a way of identifying possibilities of corruption based on an analysis of the
activities and processes involved, illustrated through an analysis of the Education Voucher
Scheme implemented by the Punjab Education Foundation in Pakistan.
Analysis of documents and a bespoke household and school survey showed there were
several activities and decision points where there were opportunities for inappropriate
behaviour: in particular, there were high risks of the very poor and vulnerable children being
left out because of the way areas are selected, poor attendance rates because of lack of
parental motivation, fees being charged for absent students, and poor educational
outcomes because of poor quality teaching.
The design almost certainly means that the very poor are excluded; that half of the teachers
– most of them women – were being paid less than a dollar a day; freedom of choice has not
led to schools being more accountable to parents, and competition hardly exists because
the failure rate is less than 1%. The equity, productive efficiency objectives are not being
met.

1
Assessing Possibilities of Corruption: the Example of the Punjab Education Foundation1
Introduction
Corruption in Education
There has been a growing literature on corruption in education (Andvig et al. 2000, Hallak and Poisson 2009):
they make it clear that because education is about more than just financial transactions, it is important to
identify not only the possibilities of discretion2 in distributing or handling financial resources but also the
potential for inappropriate behaviour of all types and at all levels. At system level, inappropriate behaviour
includes actions which are not in accord with the stated objectives or goals of an organization or grant.
Administrators can embezzle funds allocated for building, transgress rules and procedures for handing finance,
by-pass criteria for selecting schools, appointing teachers or the award of vouchers3 through favouritism or
nepotism; teachers and parents can bribe to get a voucher for their child or exchange vouchers for cash.
Where there is any substantial support for construction, maintenance and repair or distribution of equipment,
furniture and materials, then there can be: fraud in public tendering, collusion among suppliers or pressure on
parents to buy only from ‘approved’ (higher priced) suppliers, manipulation of data used to decide upon target
areas, ghost deliveries, purchase of unnecessary equipment. If the support includes funds for the appointment
of new teachers, then their management, payment and training then fraud in appointment and deployment,
discrimination, falsification of credentials, bypass of criteria, delay in payment salaries sometimes with
unauthorised deductions may involve corruption,
Although the theoretical possibilities of corruption at various levels in the education sector have therefore
been detailed although only in a piecemeal way without taking into account the inter-linkages between goals,
administration, maintenance and repair, mechanisms of targeting and training, there is only very limited
evidence about the existence of corruption partly of course because of the possibility of being sued without
cast-iron evidence. Equally in Pakistan, although there is an extensive literature on corruption in Pakistan and
several allusions to corruption in Pakistan’s education system, there is no concrete evidence on the extent of
different practices.
This paper proposes a different approach which can be used more generally based on process mapping
supplemented by a ‘quantitative’ survey to identify possibilities of corruption in the field.
The approach is illustrated through an analysis of inappropriate behaviour (and therefore wider than monetary
corruption) in the public private partnership schemes designed and administered by the Punjab Education
Foundation (PEF) in Pakistan. In case of PEF and/or PEF schemes, inappropriate behaviour possibilities include
non-adherence to goals, non-compliance with conditions of financial grants, application of funds for purposes
not supported by PEF or the provincial government, and/or embezzlement or misapplication of funds. It is
important to emphasise that the purpose is not to demonstrate that discretion has been inappropriately
exercised so many times or that there has been impropriety in a specific number of instances, but on
identifying the possibilities – not the probabilities - for discretion or inappropriate behaviour. The corruption
risks assessed are:
Lack of clarity in specification of standards/criteria
Quality of standards/entry thresholds
1 DFID intends to up-scale its support to PEF in order to reach more out of school children more effectively. They wanted to
be sure that PEF systems and programmes (especially Education Vouchers Scheme) were corruption free; this article is based on the work done to make that assessment. 2 Discretion here is understood as the exercise of choice by a bureaucrat or official about the delivery or granting of a
service to an individual or a household 3 A voucher is a credit note given to a parent for using on a specific school; similar to vouchers given by supermarkets for
spend on a specific class of goods.

2
Non-implementation of policies/criteria for any reason
Level of discretion available to different levels of decision makers and the need for such discretion
Absence/presence of monitoring and financial systems
Robustness/effectiveness of systems]]
In the remainder of the introduction, we provide a little context of primary education in Pakistan
Education System in Pakistan: Public-Private divide and Out-of-School children in the Punjab
Public and Private Schools
Pakistan inherited the English system of state and public (meaning elite private) schools and, although this
continues to this day, there are many other distinctive features. First, although teaching is no longer a
respected occupation, within the state system, the employment security makes it virtually impossible to sack
teachers even when they do not turn up for work and the pension rights are highly valued; the combination
makes the state system simultaneously expensive, inefficient and ineffective, Second, also within the state
system and especially at the secondary level, there are prestigious elite schools which are seen as better than
the best private schools, where entrance is determined - mostly - by competitive examination. Thirdly – and
mainly because most of the state system is seen as providing low quality education, there has been a steady
growth in ‘low-cost’ private schools. Private sector schools account for 30% of the total enrolment in Pakistan
at the primary level. In Punjab, the share is higher than other provinces, 37% as per DFID’s supported DFID-
Nielsen survey (2012). The growth of private sector involvement in providing education increases the
likelihood and possibilities of corruption.
Out-of-School Children
In Punjab, the Nielsen surveys suggest that, currently, overall 21.5% of children are out of school (19.0% of
boys and 24.2% of girls) with wide variation between 13.6% in urban areas (with only 1% difference in boys
and girls) and 23.9% in rural areas (20.9% of boys and 27.7% of girls). According to the Nielsen survey, the
percentages out-of-school of school-going age (13% of boys and 17% of girls) in Punjab are lower than the
national figures; and the percentages in urban areas are even lower at 7% and 8%. In Lahore, the overall
percentages are lower again at 5% and 9% respectively. There have been a number of schemes in Pakistan to
get more girls enrolled in school (REFS) where the choice of school is left to the parent or guardian. Of course,
in societies like Pakistan where ‘corruption’ is endemic – the inverted commas is used here because the
‘corruption’ is often simply the use of family relations to bypass bureaucratic procedures - these vouchers are
often misused e.g. for another child.
Organisation of Paper
In the following section, we describe the institutional background before setting out the conceptual
framework and methodological approach in the third section. The results of our field work and interviews are
presented in the fourth and fifth sections; and, in the concluding sections, we discuss design issues in the
seventh section.
Institutional background: description of PEF, PEF Schemes and third parties Involved
Description of PEF (based on in-house documents and interviews except where cited)
The Punjab Education Foundation (PEF) is a government foundation originally established under the Punjab
Foundation Act, 1991 and subsequently re-established under the Punjab Education Foundation Act, 2004. The
Foundation’s mission is “the promotion of quality education through Public-Private Partnership, encouraging

3
and supporting the efforts of private sector through technical and financial assistance, innovating and
developing new instruments to champion wider educational opportunities at affordable cost to the poor.” (PEF
website).
Currently, PEF receives 6 billion rupees and accounts for 4 percent of the provincial education budget. The
Foundation is an autonomous organization attached to the Punjab School Education Department. It is
supervised by a Board of Directors and administered by a Managing Director. PEF has three major public-
private partnership education schemes – the Education Voucher Scheme (EVS), the Foundation Assisted
Schools (FAS) and the New School Program (NSP). Separate directorates within the PEF management structure
administer these schemes. An independent monitoring and evaluation directorate performs M&E work for
these three schemes. In total, PEF is supporting 1.4 million kids. We focus in this paper on the EVS scheme.
PEF manages and administers its public –private partnership schemes directly except administration of
external financial audits, conduct of quality assurance tests and third party system evaluations. Third parties
involved in testing work are the National Testing Service (NTS) and the University of Management and
Technology (UMT). Financial audits and system analysis/validation of controls is performed by statutory
auditors like the Auditor General of Pakistan and private parties like Grant and Thornton.
Education Voucher Scheme (EVS)
The Education Voucher Scheme provides vouchers to parents of children, who cannot afford to pay for their
education in specially selected private schools called EVS schools. The scheme’s stated focus is on children
aged 4-17 years belonging to less affluent and underprivileged areas, who cannot get education due to
financial and social constraints. The aim of the EVS is to ensure equity, productive efficiency, social cohesion
and freedom of choice.
Parents can get children enrolled in EVS schools of their own choice. In FY 2011-12 around 100,000 children
were using vouchers under the EVS. Most of these children were not out-of-school children but students who
were deemed likely to drop out (see Figure 1). Nine phases of enrolment have been completed. From July 1,
2012 vouchers have been paid as follows: PKR 400 for class 1-8, PKR 450 for Matric (Arts) students, PKR 550 for
Matric (science) and Higher Secondary (Arts) students and PKR 750 for Higher Secondary (science) students.
The Scheme entails selection of both children and schools. Children are selected on the basis of in-house
surveys; schools are selected on the basis of applications. The main monitoring tool is a Quality Assurance Test
(QAT), which tests students’ learning outcomes thereby ensuring that students have attended school and/or
received tuition. The test clearance bar is however low – only half of the students are required to obtain 40%
marks. There is widespread demand from schools for being partners in the EVS; given the high profits
potentially generated by these schools, this is not unexpected. EVS schools are however not a competitor to
public schools because most EVS children are ostensible drop outs due to poverty, and poor children would
theoretically not drop out from public schools because the latter do not charge fees (although there are
hidden costs such as uniforms and transport as government schools are more dispersed especially in rural
areas).
Third parties involved
Several third parties are involved in the operational activities of PEF; and in particular in the administration of
the Quality Assurance Test. These include the National Testing Service (NTS) for administration of the test;
and the Aga Kahn University for marking. The Standard Operating Procedures (SOPs) of the NTS are clearly
very detailed and precise; we did not, however, have the opportunity to observe how or where they were
implemented.

4
Conceptual framework and methodological approach
Conceptual framework
The literature on corruption tends to focus on the incentives on public agencies to defraud, embezzle or accept
payments (bribes) for appointments or procurement (Andvig et al 2000). We shall, of course, identify the
possibilities for bribes, embezzlement and fraud but, as many of the corruption risks in the operation of EVS
are based on the exercise of discretion, we shall focus on the circumstances in which discretion arises, the
factors influencing the level of discretion and the possible consequences of that disercretion being exercised.
Approach to assessment
We undertook a mapping exercise of existing processes and practices including review of existing standards
and criteria which regulate and guide decision-making in PEF. It became obvious that these had not been
defined and consequently the level of discretion available to decision makers was high. The mapping exercise
relied on review of PEF documents including Minutes of the Board meetings and program committee, PEF
guidelines/notifications/SOPs, interviews with departmental heads and staff, field visits to 7 EVS schools
selected by the corresponding department (these were not intended to be random representative samples –
see below). The appropriateness of standards was determined on the basis of stated and perceived objectives
of PEF generally and the EV programme specifically, and solicited views of leading economists currently
working in the education sector in the Punjab. The impact of the programs and target populations were doubly
checked through beneficiary surveys conducted in the schools and selected households serving these schools.
Rationale and content of beneficiary surveys
The ultimate beneficiaries are those children who had been out of school and their households. Students in
PEF scheme schools of grades 5 and above were interviewed asking about their previous school history and
specifically whether or not they had been out—of-school for any period and if so for how long; the restriction
to grades 5 and above was to facilitate the interviewing process. Households with EVS students in any grade in
the immediate area of the school were interviewed to obtain similar information. There has been no attempt
to carry out a random representative sample survey across the whole district because the purpose of our
fieldwork was diagnostic, searching for possibilities not probabilities.
Therefore, although percentages are presented, they are not intended as point estimates or as demonstrating
statistically significant differences but only indicative of possible patterns in the different schemes.
Survey of students in schools and selected households in the vicinity of those schools
The hypothesis is that the students who are in EVS schools are not the ‘most deserving’. The focus of this
question was the EVS scheme and the comparison between the earlier and expansion phases. The question of
whether schools bribe parents to stay in school4 is a central to an assessment of corruption; we found the
answer to that question by identifying students who had had a long school career but a short gap before
joining a new EVS school for the first time, and carrying out a supplementary survey among them.
At each school, all students 5th
grade and above were brought together so that they could self-complete the
questionnaire when guided by a facilitator. With the help of EVS staff, our researchers also interviewed
households near the school whose children were beneficiaries of EVS. The rationale here was to check the
selection of households to be beneficiaries of EVS, comparing them to their characteristics to those of the
Poverty and Living Standards Measurement Survey (PLSM various years) for urban Lahore.
4 There are clear advantages in being a partner school, as demonstrated by the numbers of schools applying to be included
in the scheme (PEF documents).

5
In order to assess ‘wealth of household’, the current preferred approach is to ask about assets. For
comparison, we made the questions similar to those of the EVS Household Survey form which asks about
electricity, gas, telephone and transport; and we also asked about number of rooms.
Other Surveys
The principal of each school and 6 teachers were also interviewed: the former to understand the advantages
of being in EVS, the latter to find out their salaries because previous studies of private schools in rural areas
had shown that they depended on very poorly paid (mostly female) teachers (Andrabi, 2006a and 2006b).
Results of surveys
Achieved samples and their ‘validity’
Data has been collected from 323 students in grades 5 upwards in 3 EVS schools in earlier phase and 4 EVS
schools in the expansion phase. Households with EVS students in any grade in the immediate area of the
school were interviewed (N=137). There has been no attempt to carry out a random representative sample
survey across the whole province because: the purpose of our fieldwork was diagnostic, searching for
possibilities not probabilities. Therefore, although percentages are presented, they are not intended as point
estimates or as demonstrating statistically significant differences but only indicative of possible patterns.
Students in EVS schools
Education level of parents
The percentages of parents with primary or above can be compared approximately to the Poverty and Living
Standards Measurement Survey. The comparison is only approximate because the PLSM presents figures for
the percentage of population over the age of 10; and clearly with the rapid expansion of educational provision,
younger age groups are much more likely to have completed primary but they will not yet be parents. Overall
28% of mothers and 44% of fathers for EVS students, and 40% of mothers and 58% fathers of non-EVS
students in the survey have at least primary: this compares with 70% of females over 10 and 74% of males
over 10 in urban Lahore (and 39% of females over 10 and 60% of males over 10 in rural Lahore).
Comparing students in EVS schools in the earlier and expansion phases, the gap between the proportion of
mothers of EVS and non-EVS students with primary in the earlier phase (34% and 67% respectively) is wider
than overall; but, in the expansion phase, although there is a similar gap between the proportion of fathers
with primary, there is a much smaller gap between the proportion of mothers with primary (21% and 24%
respectively). The percentages for fathers hardly change between earlier and expansion phases.
Within EVS schools, the percentages with higher education are higher for those not in the scheme (19% and
26% respectively) compared to those in the EVS scheme (10% and 23% respectively). But when we compare
the earlier and expansion phases, the gap was much larger in the earlier phase (26 ppt difference for mothers
and 19 ppt difference for fathers); whilst in the expansion phase, EVS students were from households with
better educated parents than non-EVS students, although the differences are relatively small.
Surveys of households with EVS students
Educational level of mothers and fathers
If the responses of households are compared with the responses of the students in the corresponding schools,
the proportions of fathers and mothers reported to having completed at least primary in the earlier phases are
very similar, whilst the proportion of father and mothers reported to having completed primary in the

6
expansion phase are lower than the proportions reported by the EVS students (but not substantially). Very few
of the households reported anyone with higher education so that comparison is not included here.
Did their children need EVS?
Several of the parents reported quite long schooling careers of their children: of those reporting a child with 6
or more years schooling (n = 33), 26 (79%) of those had spent more than 3 years in school without EVS; of
those who had spent 2 to 5 years in school (n = 49), 29 (59%) had spent more than 2 years in school without
EVS. This seemed odd; and so we decided to investigate this by interviewing students in ‘new’ EVS schools who
had reported long school careers. Out of 43 students interviewed, the average gap since their previous
schools was 5.7 months with smaller gaps for those who were in grades 6, 7 and 8; gaps were slightly longer
for girls (5.7 months) than for boys (4.7 months); and nine of the students had been in the same school. In
most cases, the student reported that her/his parents had not been able to pay fees for the last few months,
despite having been in school for several years. Given that these were all ‘new’ EVS schools – which had of
course been functioning as private schools beforehand –these short gaps are rather too coincidental to believe
they represent a sudden inability to pay fees after several years of paying fees.
Surveys of teachers
Of the 51 teachers, 44 were female and 7 were male. The average monthly salary of teachers is 3,550/-,
ranging from 1,500/- to 10,000/- depending on qualifications: the salaries of those with Matric averaging
2,070/- but those with a Higher qualification averaging 6,920/-. Exactly half of the 44 teachers had a salary of
3,000/- or less.
Conclusions
Compared to the average for Lahore urban the parents of students in EVS schools overall have lower education
levels. Among the students in EVS schools, in the earlier phase there was a marked difference between EVS
and non EVS students with the former having less educated parents, but this difference was reduced
considerably – and sometimes reversed -in the expansion phase. The expansion phase has been less targeted.
The special additional survey showed that there were many paying students who had left school – sometimes
the same school - for a few months because ‘they could not pay the fees’, it is also not clear that many of the
students ‘needed’ the EVS.
Activities and processes
The schemes involve a number of key activities and processes. These processes and activities are mapped in
order to document standards and criteria regulating decision- making and possibility and/or instances of
deviant behaviour.
Process matrix
Evidence has been compiled on decision points from selection of an area/ household for grant of vouchers,
recruitment/ selection of schools, requirements for the correct use of vouchers, PEF inputs, administering the
QAT, Learning Outcomes and Discontinuation of the partnership, ensuring schools adhere to the terms and
conditions of the partnerships. Each activity or process named in the first column is described in detail in the
second column, based on analysis of PEF and other documents and, where appropriate, the results of the
surveys discussed ;above and the risk assessment is made in the third column. The full tables can be seen in
the original report; the example of the selection of an area/ household for the grant of vouchers is given
below:

7
Extract from Full Process Matrix for the Education Voucher Scheme
Selection of an area/households for grant of vouchers
Selection of an area/sub areas within a district
Districts are selected on basis of poverty maps e.g. from PLSM; Sub areas within the district are selected on the basis of information from Government offices and key personnel
5; A survey of 30 households is conducted to
ensure that the area is less affluent and/or under privileged.
There is moderate risk of poor areas being left out (Areas with sewerage problems and law and order issues seem to be avoided by surveyors). Due to high demand for EVS schools there is high risk of discretionary choices by PEF staff regarding poor areas.
Selection of households
Households for purposes of voucher registration are selected on the basis of the EVS Voucher Registration Data Collection Form. The form includes information about income and about children who had never been or were no longer at school. The survey is stopped when the number 5,000 is achieved and restarted where it had ended.
There is a high risk of very poor households not being accessed and hence not getting selected. This may happen because of absence of fixed address, the whole family out working, the lack of National Identity Cards, child labour, etc.
Selection of children
Criteria for selection of children are established. There are some post checks but information is based on replies of parents/guardians/care givers. Principals can propose children for registration. Break down of various categories of children (100,000) in EVS during 2011-12 is as follows:
Category % No
Out of School Children 22.8 22,800
Orphans 1.9 1,900
Children of divorcees 0.24 240
Children of parent with special needs 11.4 11400
Children at risk of drop out6 63.59 63,590
Total 99.93
Clearly the Program has been unable to attract many of the out–of–school children. Children deemed at risk of drop out are very high when they are apparently the lowest priority. Nomination of out-of-school children by principals carries a high risk of inappropriate selection. This should be replaced by an opportunity to apply to PEF for registration outside of the Voucher Registration campaigns. There is risk of incorrect entries being made in MS Excel, which is used for data entry, from Eligible Children Identification Forms (Ernst & Young, 2011, 10).
Summary of high risks of corruption in the EVS scheme
Risk area Risk group High risk of …
Selection of areas Poorest of the poor and vulnerable children being left out
Attendance of children Parents/Children with low motivation levels poor attendance rates/fee charging for absent students
Quality of tuition Children in schools with poor quality
teachers
poor educational outcomes
Quality of QAT Poor performing children the lowest percentile of students not studying/attending
Design issues Objective: PEF-EVS will ensure equity, productive efficiency, freedom of choice and social cohesion.
Equity: targeting in the EVS
District areas are chosen on the basis of the PLSM but the sub-areas are based on advice from key informants
rather than on objective criteria; and this is still the case despite the recommendation by Ernst & Young (2011,
p.5). Areas judged to be dangerous (possibly including those most needing education!) are not covered by the
EVS census.
5 Guidelines for EVS Area Assessment; Grant and Thornton Report, p 39
6 Assessed through the following questions in EVS VRDCF: ‘Have ever sent to school?’; ‘If yes was it Govt./ Pvt./
Madrasah?’; ‘Want to send to school again?’; These questions do not provide any information about likelihood of dropping out of school which is apparently determined through ‘discussion’.
8
Nearly two thirds (64%) of children are registered because they are ‘at risk of dropping out’ assessed not
through specific questions but through discussion with the interviewer (possibly an intern) which gives her or
him a large amount of discretion and is likely to lead to the selection of the ‘nicer’ poor.
The registration process is based on a sequential house-to-house survey: the 2010-11 exercise which
registered 100,000 children from 41,000 households, children from about 47,000 households were not
registered because the household did not meet any of the above criteria, and children from a further 12,000
households were excluded because they were deemed non-responsive (including 6,000 where the relevant
children were in government schools); an unknown number of households were ignored because they were
empty or because the doors are locked, etc.
The omission of dangerous areas and perhaps other areas that key informants do not like, and the discretion
afforded the interviewer because of the lack of specific questions about ‘drop-out’ means that the very poor
are almost certainly excluded7, although children of the poorest of the poor are not an explicit target of EVS
8.
But the proportion of out-of-school children identified in the voucher registration process is almost exactly the
same as the proportion out-of-school estimated by the PLSM survey in urban Lahore of 21% of boys and 25%
of girls9 which suggests that the EVS is not targeting at all.
The numbers of vouchers distributed to each area is based on numbers of out-of-school, number of schools,
etc. but such factors are not formally considered by assigning proper ratings to each factor (Ernst and Young,
2011, p.6).
Productive efficiency
Half of teacher salaries in our sample – most of them women – are less than a dollar a day; given the urban
bias in our sample, this is likely to be an underestimate of the proportion of very low paid teachers. Low paid
women teachers provide a negative role model for girl students and their parents10
? Yet DFID’s own policies
include: “We want to see girls and women, who so often hold the key to development, becoming empowered
members of their communities. We will work to strengthen women’s voice and engagement in decision
making.” DID Business Plan 2011-15 Vision Statement.
DfID has also signed up to ILO’s Decent Work programme in which “Decent work involves opportunities for
work that is productive and delivers a fair income ...”(ILO ) The exploitation of labour is never efficient
because total welfare (consumer + producer surplus) decreases. EVS and NSP schools are a monopsony
purchaser of labour because there is no other job choice. Essentially this is an exploitative exercise of non-
competitive (monopsony) market power. UNESCO/ USAID (2008) commented that “Contract teachers hired as
educators with pay between 4,500 and 6,500 per month; and they have been complaining” (p.19)
The promotion of low cost private schools as a short term measure in the context of high cost public schooling
because of high teacher salaries, and until public schooling can be reformed, is probably sensible but not at the
7 This may well also be a problem with the PLSM and the Nielsen Survey, implying that they almost certainly underestimate
the percentages out-of-school. 8 This is despite a widespread impression outside PEF that EVS does target the poorest of the poor: Salman (2008), having
spent some time interacting with PEF staff over 2 years, states in his Executive Summary that “The EVS has been designed to extend maximum benefits to the poorest households” (p.xix). Four years later, during a visit to EVS schools in Rawalpindi, a “DfID team shown keen interest in PEF model of education which has ensured quality education for the poorest of the poor”, The Hope 14, p.9. 9 The Nielsen survey restricted to those aged 5-9 gives much lower – and rather unbelievable - estimates (5% of boys and
9% of girls) of the percentages out-of school in urban Lahore; and that should be reconciled with the PLSMS estimates. 10
It is also ironic that one of the expected outcomes of the EVS scheme is women’s empowerment.
9
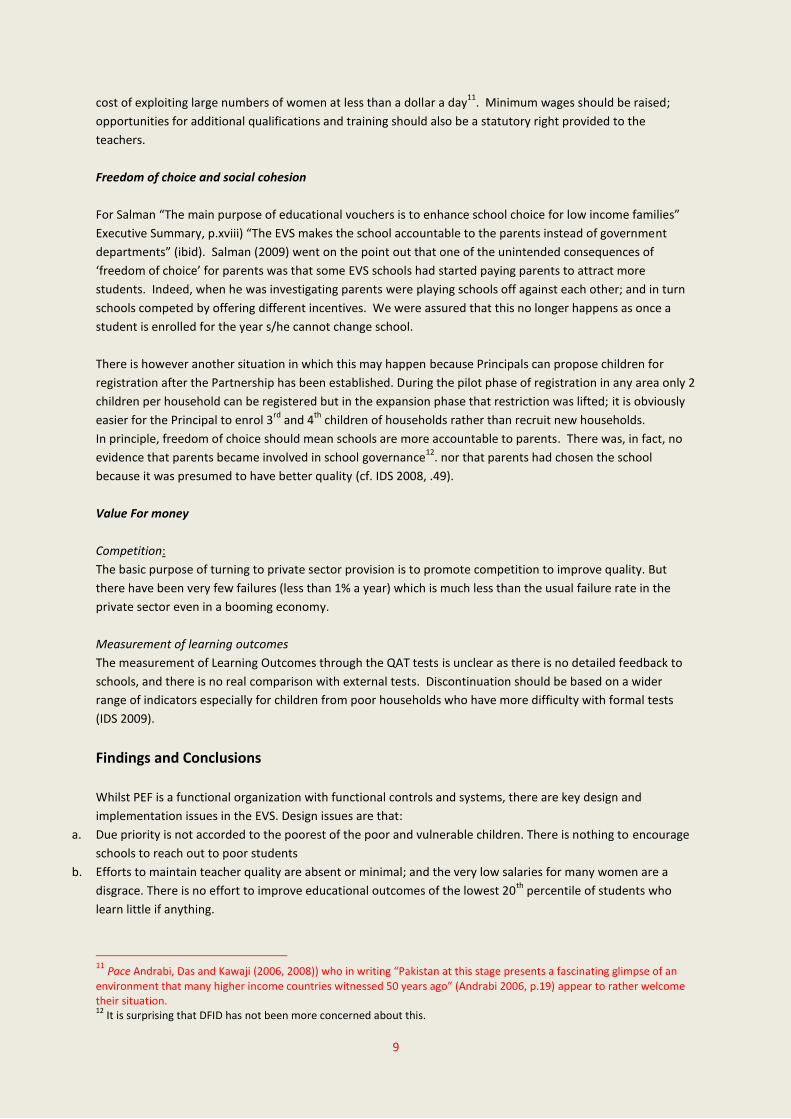
cost of exploiting large numbers of women at less than a dollar a day11
. Minimum wages should be raised;
opportunities for additional qualifications and training should also be a statutory right provided to the
teachers.
Freedom of choice and social cohesion
For Salman “The main purpose of educational vouchers is to enhance school choice for low income families”
Executive Summary, p.xviii) “The EVS makes the school accountable to the parents instead of government
departments” (ibid). Salman (2009) went on the point out that one of the unintended consequences of
‘freedom of choice’ for parents was that some EVS schools had started paying parents to attract more
students. Indeed, when he was investigating parents were playing schools off against each other; and in turn
schools competed by offering different incentives. We were assured that this no longer happens as once a
student is enrolled for the year s/he cannot change school.
There is however another situation in which this may happen because Principals can propose children for
registration after the Partnership has been established. During the pilot phase of registration in any area only 2
children per household can be registered but in the expansion phase that restriction was lifted; it is obviously
easier for the Principal to enrol 3rd
and 4th
children of households rather than recruit new households.
In principle, freedom of choice should mean schools are more accountable to parents. There was, in fact, no
evidence that parents became involved in school governance12
. nor that parents had chosen the school
because it was presumed to have better quality (cf. IDS 2008, .49).
Value For money
Competition:
The basic purpose of turning to private sector provision is to promote competition to improve quality. But
there have been very few failures (less than 1% a year) which is much less than the usual failure rate in the
private sector even in a booming economy.
Measurement of learning outcomes
The measurement of Learning Outcomes through the QAT tests is unclear as there is no detailed feedback to
schools, and there is no real comparison with external tests. Discontinuation should be based on a wider
range of indicators especially for children from poor households who have more difficulty with formal tests
(IDS 2009).
Findings and Conclusions
Whilst PEF is a functional organization with functional controls and systems, there are key design and
implementation issues in the EVS. Design issues are that:
a. Due priority is not accorded to the poorest of the poor and vulnerable children. There is nothing to encourage
schools to reach out to poor students
b. Efforts to maintain teacher quality are absent or minimal; and the very low salaries for many women are a
disgrace. There is no effort to improve educational outcomes of the lowest 20th
percentile of students who
learn little if anything.
11
Pace Andrabi, Das and Kawaji (2006, 2008)) who in writing “Pakistan at this stage presents a fascinating glimpse of an
environment that many higher income countries witnessed 50 years ago” (Andrabi 2006, p.19) appear to rather welcome their situation. 12
It is surprising that DFID has not been more concerned about this.

10
c. The threshold to clear the QAT is low, which affects the usefulness of QAT as an anti-corruption tool; and,
along with several other commentators, we recommend that the QAT should be aligned with PEC or NAES in
order to be able to assess learning outcomes comparatively.
d. Freedom of choice has not led to schools being more accountable to parents and competition hardly exists
because the failure rate is less than 1%.
e. There is no programme of external evaluation of the scheme.
Implementation issues are that:
a. There is a lack of focused efforts to reach out to the poorest of the poor and vulnerable children like children
engaged in labor. This issue is closely linked with the design of the three schemes.
b. PEF depends on school records to check attendance. However schools frequently fake records and PEF can
only monitor attendance through surprise checks, which cannot check the widespread incidence of this
practice. Due to the low clearance threshold of QAT, Schools have no reason to push all students to attend and
do well.
c. Students are forced to take private tuition and/or buy help books etc. Private tuition means that while PEF
pays for students they do not get requisite inputs and they have to pay to obtain some or all of them. This
practice also reduces the value of QAT as an anti-corruption or measurement tool regarding PEF inputs
d. The work of the M&E is hampered by its staff being borrowed by other departments and by the lack of
seriousness with which its reports of possible irregularities are treated by senior management (long delays and
lack of any serious penalties).
The proliferation of public-private partnerships means that extra care has to be taken about formulating
contracts in order to minimise corruption. We have shown how corruption possibilities can be identified
through analysis of documents, interviews and purposive surveys of local providers and service users. This can
then be the basis of more appropriate contracts. In this particular case, a floor of 3,000PKR should be brought
in immediately to teachers’ salaries and then they should be raised progressively, quality auditors – not the
‘Big Six’ - should be brought is to monitor what is happening and in particular, the rates of return available to
aspiring entrepreneurs and the probability that PEF is substituting for parents who are already paying should
be thoroughly investigated.

11
References
Andrabi T., J. Das, A. I. Khwaja, T. Vishwanath, T. Zajonc and the LEAPS Team. 2006a. Learning and Educational
Achievements in Punjab Schools (LEAPS): Insights to Inform the Education Policy Debate. Washington, D.C.: The
World Bank.
Andrabi, T., J.Das, A. Khwaja. 2006b. A Dime a Day: The Possibilities and Limits of Private Schooling in Pakistan.
WPS4606, DECRG, World Bank, [later published in Comparative Education Review, 52 (3), 2008.]
Andrabi, T., A. Khwaja and J. Das. 2008. Students Today, Teachers Tomorrow? Identifying Constraints on the
Provision of Education, Harvard University, Working Paper 2008, revised version 2010.
Andvig, J-C., O-H. Fjeldstad, I. Amundsen, T. Sissener and T. Søreide. 2000. Research on Corruption: A policy
oriented survey, Commissioned for NORAD. Bergen/Oslo, Norway: Chr. Michelsen Institute (CMI) & Norwegian
Institute of International Affairs (NUPI). Available at www..icgg.org/downloads/contribution07_andvig.pdf.
Ansari, A. 2012. Educational Voucher Scheme in Lahore: Serving the Underserved. National Center for the Study
of Privatisation in Lahore, Occasional Paper 23.
Carr-Hill R.A. and Murtaza A. (2012). Developing an Anti-Corruption Tool and Plan for the Punjab Education
Foundation, Oxford Policy Management, Health and Education Advice and Resource Team
Ernst & Young, Feb 2011. Key Observation of EYFRSH (Internal Auditors) on System Review and Gap Analysis,
Annexure A. Lahore: Ernst & Young.
Ernst and Young (several dates), Quarterly Reports following up on Gap Analysis. Lahore: Ernst & Young.
Government Auditors. 2011. Commercial Audit. Lahore: Government of Punjab.
Grant Thornton. January 2012. Report on Validation of Controls of New School Program (NSP) and Education
Voucher Scheme (EVS). Lahore: Grant Thornton.
Hallak, J. and M. Poisson. 2007. Corrupt Schools, Corrupt Universities; What can be done?, Paris: International
institute of Education.
IDS (Innovative Development Strategies). 2009. Third Party Evaluation of Punjab Education Foundation
Assisted Schools (PEF-FAS Program). Lahore: Innovative Development Strategies.
KPMG 2011. Auditors Report for June 2011. Lahore: KPMG.
Malik, A.B. 2010. Public Private Partnerships in Education: Lessons Learned from the Punjab Education
Foundation, Manila: Asian Development Bank.
Pakistan Bureau of Statistics. (various years). Poverty and Standard of Living Measurement Survey. Islamabad:
Pakistan Bureau of Statistics.
Punjab Education Foundation. (various dates)/ Newsletters 1-14. www.pef.ed.pk. Lahore: Punjab Education
Foundation.
Punjab Education Foundation. (various dates). Minutes of Meetings. www.pef.ed.pk. Lahore: Punjab Education
Foundation.
PEC (Punjab Examination Commission). www.pec.edu.pk. Lahore: Punjab Education Commission.
Salman, A. 2009. Liberate to Learn: A Study of the Educational voucher Scheme in Lahore . Lahore: Alternate
Solutions Institute.
UNESCO/USAID and ITA Lahore. 1998. Status of Teachers in Pakistan, ‘gfhjyutillrdesr567kitdretyu,kuhygjkl
UNESCO/USAID. Islamabad: UNESCO.
World Bank. http://siteresources.worldbank.org/SOUTHASIAEXT/Resources/223546-
1174426445479/annex28.pdf.


![Capitulo1 HILL[1]](https://static.fdokumen.com/doc/165x107/6316ac67d16b3722ff0cffbf/capitulo1-hill1.jpg)