THE EVOLUTION OF SOFTWARE INDUSTRY: THE NEW BIG CHALLENGES OPEN SOURCE SOFTWARE & CLOUD COMPUTING
27
Republic of Turkey Ministry of Development RESEARCH PAPER THE EVOLUTION OF SOFTWARE INDUSTRY: THE NEW BIG CHALLENGES OPEN SOURCE SOFTWARE & CLOUD COMPUTING UNPUBLISHED STUDY October 2011 KAM İ L TA Ş CI Director Monitoring, Evaluation and Analysis Department Ministry of Development, Turkey MPA-Science and Technology Policy/Cornell University [email protected]
Transcript of THE EVOLUTION OF SOFTWARE INDUSTRY: THE NEW BIG CHALLENGES OPEN SOURCE SOFTWARE & CLOUD COMPUTING

Republic of Turkey
Ministry of Development
RESEARCH PAPER T H E E V O L U T I O N O F S O F T W A R E I N D U S T R Y :
T H E N E W B I G C H A L L E N G E S
O P E N S O U R C E S O F T W A R E & C L O U D C O M P U T I N G
UNPUBLISHED STUDY
O c t o b e r 2 0 1 1
K A M İ L T A Ş C I
D i r e c t o r
M o n i t o r i n g , E v a l u a t i o n a n d A n a l y s i s D e p a r t m e n t
M i n i s t r y o f D e v e l o p m e n t , T u r k e y
M P A - S c i e n c e a n d T e c h n o l o g y P o l i c y / C o r n e l l U n i v e r s i t y
k a m i l . t a s c i @ k a l k i n m a . g o v . t r

2

C o n t e n t s
Introduction ............................................................................................................... 1
Theoretical Framework ............................................................................................... 2
Software Value Chain: Firm Level .......................................................................... 2
Competitive Structure of the Software Industry in terms of Ecosystem Perspective ... 3
The Evolution of Global Software Industry ................................................................. 5
1950s - 1980’s: A New Industry Emerging in the US ............................................... 5
1980’s: Software Industry Became Global that pushed by PC-Revolution ................. 6
1990’s: We had two new babies: Internet & Penguin ................................................ 7
Early 2000’s: Software Business Transformation from Products to Service ............... 9
Analyzing Competitive Landscape of OSS and Cloud Computing .............................. 16
Open Source Software........................................................................................... 17
Cloud Computing: Software as a Service ............................................................... 21
References ............................................................................................................... 23
T a b l e s
Table 1 : Recent Developments in Software Industry based on Software 500 data ...... 10
Table 2 : R&D % Shares and Software Growth Ratios for 5-largest Indian firms ........ 11
Table 3 : Some facts about Satyam ............................................................................ 11
Table 4 : Software and Services Growth Rate (Category) among Software 500 ........... 12
Table 5 : Some facts about Borland ........................................................................... 13
Table 6 : Some Facts about EDS ............................................................................... 15
Table 7 : Some Software as a Service Companies in Software 500 ............................ 15
Table 8 : Some facts about Manhattan ....................................................................... 16
Table 9 : Some facts about RedHat ........................................................................... 18
Table 10 : Five Forces for OSS ................................................................................. 20
Table 11 : Five Forces for Cloud Computing: Software as a Service .......................... 21
1
I n t r o d u c t i o n
We have considered the Software Industry perspective itself instead of a specific technology
area that may have influence the industry in different ways. Why? We are afraid that if we
examine the industry using a narrow framework, we would have missed the crucial and
indispensible points in the whole picture. Therefore, we researched a lot and created original
data and tables that would be helpful to indicate real trend in this industry in order to better
tackle with question and answer it.
We know the major expectation from this paper is to analyze competitive landscape that could
be changed because of a new emerging technology using Porter’s Five Forces and SWOT analysis
tools. However, since the business environment in the software may have different
characteristics than traditional industries (Porter was examining the Italian Shoe Industry in a
cluster structure in his famous study), we favored to explain the dynamics and competitive
structure of software industry benefitting from “Ecosystem Approach” instead of not using only
“Porter’s value-chain” one. Therefore, we added a short (3-page) theoretical framework section
in order to create a base. When we analyze the five-forces for OSS adopted business strategy for
a software firm, we will benefit from these new concepts.
In the following section, we analyzed the evolution of software industry from its birth (1950s) to
today as clarifying major developments in historical perspective in this period.
The last section, we would focus on analyzing changing and or potential competitive landscape
of software industry because of open sources software and recent cloud computing: software as
a service business model. The sections will be supported by firm level data.
Regarding the developments in 2000s, we collected firm level data from Software Magazine so
that we would better monitor the recent developments in the industry and check whether Open
Source Software and Cloud Computing developments could become more important. The data
that belong to the top 500 software companies cover 7-year period (2002-2008). We also
derived a panel data that would be used in a statistical model in order to confirm the major
trends in the industry.
Basically, we may conclude that both OSS and cloud computing have been changing the
competitive structure of global software industry and their great potential can emerge new
giants that are not appearing now.

2
T h e o r e t i c a l F r a m e w o r k
Although there are many different software value chain models in the literature and software-
sector specific studies, we may categorize them into there as product level, firm level and
sector level. In this study, since we have argued that software industry should be examined in
ecosystem approach and have compared with Porter’s value chain model, we have only
explained the firm level one.
S o f t w a r e Va l u e C h a i n : F i r m L e v e l
Software can be a final product and service supplied for the market or a part of solution that
is offered by a company. Software value chain in general consists of three main parts. These
are: I- Production/Programming ii- Marketing/Sales and iii- Services. Value chain has
different orders for product and service oriented products. The figure given below shows a
value chain for product oriented software (from product to solution).
Source: Berlecon Research (2002), http://banners.noticiasdot.com/termometro/boletines/docs/consultoras/floss/2002/FLOSS_Grundlagen.pdf

3
It is possible to see value chains with their components given above are placed in different
orders. The latter chain is an example of value chain of service oriented software demanded
by a customer or developed as a sub-contractor.
In line with value chain explained above, software companies operate in two main fields,
package software and software service. However, not all of the companies in this industry
operate in all areas of the value chain explained above. A company should operate at least
in one component of this value chain to be considered as a software company. In this
regard, there are software companies which only provide consultancy or operate in training
or programming fields. For instance Lockheed Martin Co, a defense and aviation company, is
contained in software companies in Software 500 List because it obtained $10.2 billion
dollars of revenue from software and related services in 2008.
In general, value chains of companies contain a flow from R&D activities to final
users/customers. Relations in business ecosystems take place between value chains of
companies. Companies establish strategic partnerships by allocating wide resources, provide
efforts for enabling widespread use of their product and their products to become a
standard, and aim to ensure their products or services to become successful in the market by
building cooperation with producers of products having complementarities for their
products in their value chain1. Each company has an ecosystem with value creation focus,
consisting customers, suppliers, partners and internal operations 2. While the value chain
approach of Porter focuses on internal sides of business activities, ecosystem approach
contains an objective of internalization of external factors to the extent possible with a
strategic point of view.
C o m p e t i t i v e S t r u c t u r e o f t h e S o f t w a r e I n d u s t r y i n t e r m s o f
E c o s y s t e m P e r s p e c t i v e
Ecosystem is a concept developed with an inspiration from biology which covers
interrelations of various living species in their specific life spans and which analyses a
different species and their relations under the system approach. The structure of software
industry can be best explained with ecosystem approach. Briefly, business ecosystem is ‘an
1 Clarke (2003: p27) 2 Hurd and Nyberg (2004)
4
economic system made up of value chains of each economic value creating institutional or
individual units and their stakeholders, their business environments, competition and
cooperation relations among them and factors influencing them’. Leader institutions in a
business ecosystem (Microsoft, Oracle, Google etc.) contrary to other companies focus on
improving their internal capabilities which are necessary to sustain their authority in the
ecosystem in the following period. There are three fundamental measures for sustainability
of a business ecosystem 3:
(I) Productivity: productivity of a business ecosystem is the capability of an innovation to
provide products with higher added values and lower input costs. This is the most important
principle in software technologies and software quality models.
(II) Robustness: this is the reaction of ecosystem for unforeseen environmental and
technological changes that can affect ecosystem. Since it is a general purpose technology
and a driving force of technological change and since it is penetrated in each part of the life
gradually, software sector is a highly sound sector.
(III) Niche and/or keystone Product Creating (Innovation): It is the capability to provide
sustainable innovative products. Niche product has the potential of creating a sub-
ecosystem; keystone product can form an ecosystem although it is difficult.
Objective of a company in ecosystem should be one of the following: developing keystone
products, attaining physical market domination or developing niche product. Company
should focus on niche product if it operates in a business environment within rapid and
constant change and if the influences of other companies taking place in its value chain are
high. If the company is operating at the center of a complex business network, then it
should adopt a strategy of developing fundamental/basic/keystone product. If that company
is functioning in an underdeveloped industry and if it operates under external effect of a
complex business ecosystem then it should better choose the way of attaining physical
market domination4. For instance, Indian software companies like TCS, InfoSys, WiPro and
Satyam, which are leading outsourcing companies with more than billion dollars of annual
3 Lansiti and Levien (2004:p72) 4 Lansiti and Levien (2004:p74)
5
revenues, choose to focus on niche fields by becoming a part of ecosystems of major global
players like Microsoft and Oracle, instead of competing with these companies directly. 5.
Path dependency is the dependency of a company on a keystone technology of the
ecosystem it belongs to in developing its products and services. The concepts of path
dependency and compatibility are closely related to network externalities. It is necessary to
meet technical standards used in ecosystems for benefiting from added value and positive
externalities of whole network6. For example, Windows operating system is a general
purpose technology compared to other package software and it is chosen by a high number
of users, it benefits from a network effect which at the end enable this system to become
dominant in the software industry ecosystem. Because, in any kind of computer containing
software needed by a general user, for operation of software, like database management
system, internet browser, e-mail program, word processor, excel table, power point
software, anti-virus programs, multimedia (video, mp3, mp4 etc) programs that are
compatible with Windows operating system. Microsoft provides opportunities for
companies to produce programs compatible with Windows operating systems with software
development tools and technologies it supports. Companies which produce business
applications or produce entertainment products need to take into account the compatibility
on the complementary products side. This necessity at the end puts a positive effect for
both their products and Microsoft products.
Increasing returns for software sector means that revenues of keystone technology
producer companies increase with the expansion of scale. Companies which have the
potential of obtaining the highest increasing returns in ecosystem are active, dynamic and
innovative companies whose niche and keystone production capacity is developed.
T h e E v o l u t i o n o f G l o b a l S o f t w a r e I n d u s t r y
1 9 5 0 s - 1 9 8 0 ’ s : A N e w I n d u s t r y E m e r g i n g i n t h e U S
Cause : 1st Electronic Computer created, and commercialized Effect : 1st Software Companies Founded – Silicon Valley Actors : Microsoft , IBM and Lotus Target Customers: High Scale Businesses, Universities & Government & Research Institutions,
5 Kumar (2006:p838) 6 Messerschmitt and Szyperski (2003)
6
The beginning of world software industry is accepted as the entering into the market of
UNIVAC, which is an advanced version of ENIAC, the first digital computer, developed for
business worlds in 19537. After this new technology was begun to be used in business world
in 1950s, use of computer has become expanded, the number of computers in the world
reached to 246 in 1955. 240 of these computers were in the US. In 1960 this amount rose to
5.500 and in 1970 it reached to 79.000 with a rapid increase.
As the semiconductor and related technologies has advanced, computers have become
smaller and its scope of use has become wider, so the need for software products and
software developers has increased. Number of software companies which had been started
up with a few people in the second half of 1950s became higher than 100 in the beginnings
of 1960s. After a while, engineers working in these big companies have left these firms and
started up their own businesses with the help of risk capital opportunities8. For instance,
Computer Sciences Corporation (CSC), which was among the companies established with a
small start up capital in 1950s, achieved an 15,2 billion dollars of annual revenue and 72,000
person of employees in 2005, and it became the #4 software company in the world9.
Programming services came to the forth in 1960s. Companies producing package software
products for the business world have begun to operate in 1970s. Diversification took place
in sub-segments of software products. For instance, initial examples of Computer Assisted
Design (CAD) programs began to emerge in this period. At the end of 1970s the size of
global software market which was mainly under the control of the USA reached to 2 billion
dollars10.
1 9 8 0 ’ s : S o f t w a r e I n d u s t r y B e c a m e G l o b a l t h a t p u s h e d b y P C -R e v o l u t i o n
Cause : PC-Revolution Effect : Software Industry became Global. Actors : Microsoft , IBM and Lotus
In 1980s, personnel computers have begun to take place in the business world in an
increased fashion, especially in Japan and the Western Europe. In 1982 the size of world
software market was 14.7 billion dollars, 10.3 billion dollars of this market, which is 70%,
7 Fay (1996) 8 Campbell-Kelly (2003:pp50-52, p90) 9 “Software 500 Ranking”, Software Magazine, http://www.softwaremagazine.com 10 Campbell-Kelly (2003:pp99-119)

7
was under the control of the US. Japan was holding 1.2 billion dollars, France 1.3 billion
dollars and the United Kingdom was holding 0.7 billion dollars of software market11. In
1980s companies like Microsoft, Oracle, and SAP begun to emerge and develop.
In 1980s CP/M, DOS and Macintosh operating systems programs were in competition.
Operating system software has shown the feature of increasing returns. If an operating
system software begins to become dominant in the market then software developers and
hardware producers accepting that operating systems as a platform put heir supports for
the system to become more dominant in the market. Although CP/M and Macintosh
emerged in 1979, Microsoft entered the market in 1980, has taken the leadership by
reaching the critical mass when IBM had chosen the DOS in PC based systems as operating
system. Lock-in effect12 of IBM/DOS has contributed Lotus, business software producer, to
increase its sales and Microsoft infrastructure provide to grow 13.
A Intellectual Property Rights (IPR) Entailed an “International Agreement”
As computers were dispersing all segments of businesses in global scale, protecting
Intellectual Property Rights became a destructive threat for US Software Companies.
Countries developed individual legislation in this field between early 1980s and mid-1990s,
however, sometimes international problems begun to emerge due to conflicting
applications in different countries. In order to build a coherent international application
regarding protection of IPs WTO developed Trade Related Intellectual Property Rights
Agreement (TRIPs) laying down principles and basic standards in this field.
1 9 9 0 ’ s : W e h a d t w o n e w b a b i e s : I n t e r n e t & P e n g u i n
Cause : Computer Networks were expanding from Local to Company, Country and Global Effect : Sub segments emerged in Global Software Industry. Computers were everywhere and required better operating systems, databases, networks . Actors : Microsoft Windows NT Family (based on Netbui , then adopted TCP/IP) and Office Tools, ORACLE – Large Scale Databases & PL/SQL Language, Sun Microsystems – Sun Solaris, Novell – Netware
11 Campbell-Kelly (2003:p23) 12 Lock-In Effect: “In economics, vendor lock-in, also known as proprietary lock-in, or customer lock-in, makes a customer dependent on a vendor for products and services, unable to use another vendor without substantial switching costs. Lock-in costs which create barriers to market entry may result in antitrust action against a monopoly.” Source: http://en.wikipedia.org/wiki/Vendor_lock-in 13 Arthur (1996:pp3-9)

8
In 1990 the world software market achieved a market size of 110 billion dollars with a rapid
increase. However the share of the US in this global market has reduced to 57% during that
time. In this period the software market size in Japan was 14.3 billion dollars, in France 8.8
billion dollars, in Germany 7.7 billion dollars and in United Kingdom 6.6 billion dollars14.
Software industry faced with emergence of many new sub-segments with the expansion of
computer networks and internet and increase in the use of personnel computers at homes.
Emergence of Internet
According to Campbell-Kelly and Garcia-Swartz (2007), the emergence of the Internet
connected all the components and relations of the software industry ecosystem and
significantly decreased the entry costs of being part of a global network15. Second and
crucial effect of internet on software industry is that the better integration process between
ecosystem members started and it led to the transformation process into service and
solution oriented business approach from product one. The process also introduced and
made the open source based and new service oriented business models possible.
Linux Led the Open Source Software Wind
Many important software operating systems and internet have been developed in Berkeley
and MIT laboratories during 1960s and 1970s. Emergence of OSC approach can be based on
C programming language on UNIT operating system that was developed in 1969. Because,
UNIT operating system have been created in university laboratories and it had been
developed until its 7th version with OS approach (through communication achieved over
usenet). However two different approaches have emerged when AT&T attained IPRs of UNIT
operating system idea in 1982. While AT&T chose the way of commercialization by closing
SCs, the second approach headed by Richard Stallman tried to continue the original
approach by opening the SCs of 6th version of UNIX that was developed by efforts of
thousands of people until its 7th version.
Under the leadership of Stallman, Free Software Foundation, established in 1983, declared
the license type called as ‘Copyleft’ with a slogan of ‘GNU’s Not UNIX (GNU)’. In some circles
14 Campbell-Kelly (2003:23) 15 Campbell-Kelly, Martin and Garcia-Swartz, Daniel D. ,From Products to Services: The Software Industry in the Internet Era(May 2007). Available at SSRN: http://ssrn.com/abstract=984451

9
the beginning of OSC software is accepted as establishment of Free Software Foundation in
1983. License title of GNU software is called as GPL (GNU Public License) or ‘Copyleft’. This
license grants rights to the user to obtain software over GNU software for price or for free,
to make modifications on it and to redistribute it.
One of the most important steps of OSS in 1990s is that Linus Torvold, a university student
at Helsinki University, decided to write his own operating system because he was not
satisfied with UNIX operating system in building a network between his school and home
and then he declared the 0.1 version of Minux operating system in 1991. After a while, with
the contribution of thousands of volunteers Minux system was developed and called as
Linux and its first version 1.0, made up of 1,5 million codes, was released in 1993.
Following year in 1990s, OSS’s had increased its usage fields for mostly back-office
applications––web servers, email operations, and the like. At the end of the 1990s, a
significant amount of web (apache), application, database and e-mail servers had significant
share of the internet backbone. The process attracted the interests of Global IT giants such
as IBM, Sun, and Novell.
E a r l y 2 0 0 0 ’ s : S o f t w a r e B u s i n e s s T r a n s f o r m a t i o n f r o m P r o d u c t s t o S e r v i c e
The leader country in software development and export in 2000s was still the USA16.
However, many developing countries begun to emerge as prominent software developer
countries with higher than 1 billion dollars of market size with acceleration of the
transformation toward knowledge based economy in the world. From 2000 the software
industry begun to have a services and solution focused structure instead of product oriented
structure17. In this period, it is seen that big software companies have improved and
expanded their fields of activity. These companies have begun to build their business
strategy not on the basis of providing only products and services but on comprehensive and
integrated solutions18.
In the second half of the 2000’s, more and more companies have continuously changed
their business strategies from products to services and solutions. High bandwidth rates of
16 Correa (1990:p9) 17 OECD (2006:p52) 18 Deutsche Bank (2005)

10
internet and developing technology in hardware area opened new opportunities to software
firms. Before explaining major developments in the industry, we would mention about some
facts regarding the industry comparing large 111 ones with others.
Table 1 : Recent Developments in Software Industry based on Software 500 data
Observations 2004 2005 2006 2007 2008
Mean Added Value (Software &
Services)
(490-493) $172.1 $184.8 $188.7 $174.7 $180.9
Top 111 (111 obs)
$196.5 $207.4 $215.1 $211.7 $222.4
Mean Total Software & Services
Revenue
(497-500 obs) $661,429 $768,029 $761,510 $787,869 $903,682
Top 111 (111 obs)
$2,326,021 $2,532,706 $2,732,172 $2,959,747 $3,392,218
R&D Ratio (256-405 obs) 23.8% 21.1% 19.1% 18.2% 16.3%
Top 111 (58-105 obs)
18.2% 17.1% 15.1% 13.5% 13.2%
Employee (484-500 obs) 4,781 5,381 4,585 6,071 5,906
Top 111 (111 obs)
13,890 14,897 16,239 18,377 20,043
Source: Data collected from Software Magazine 500 Lists (2004-2008)
We calculated Added Value by using general Q/I formula, therefore, we used Total
Revenue/Employee formula in given year. As seen from the above table, added values of the
software companies fluctuated. But, for top 111 companies, the value has perpetually
increased since 2004. Another interesting point is that the top 500 software companies have
been reducing their R&D % ratios. As for 500 companies mean the ratio was 23% in 2004,
the ratio descended to %16 level by the 2008. The same situation is valid for top 111
companies. It can be concluded that top 500 companies are spending 4% less on R&D in
2008, comparing with that of 2004. For instance, IBM, attaining 75% of its revenues from
software and related services, is ranked #1 among world’s software companies. IBM spent
6.1 billion dollars, 6% of its total revenues, for R&D activities. Microsoft, #2 in the rank,
spent 6.2 billion dollars, 14% of its company revenues, for R&D activities in 2008. In the
following table, it is given R&D % ratio data that belongs to the 5-largest Indian software
companies.

11
Table 2 : R&D % Shares and Software Growth Ratios for 5-largest Indian firms
Company R&D Share in Total Revenue Software Revenue Growth
2007 2008 2007 2008
Infosys 1.0% 1.0% 35.0% 44.0%
WiPro 0.2% 0.2% 29.0% 127.0%
Satyam 0.1% 0.1% 38.0% 33.0%
Tata 0.2% 0.2% - 54.0%
HCL 4.5% 4.5% 28.0% 47.0%
As seen the above table, although Indian software services companies’ annual revenue
dramatically increase, their R&D % spending share in total revenue are still too low. All these
companies have been operating service oriented businesses, and adopted OSS included
business models. Infosys, WiPro, HCL and Satyam are aggressive about “software as a
service” model and they announced SaaS plans/solutions recently.
The trend can be regarded as a natural result of services and solution oriented
transformation in the industry since service based business models are entailed less R&D
budgets. We think that Open source software may have an effect on this process because
increasingly the number of software companies have adopted open source software their
business models.
Ingres & Satyam Case
Recently, the US based database company, Ingres has announced that the company will create a
strategic collaboration with Satyam, India based software & services company. Ingres lost out to
Oracle in the database wars of the 1990s but has come back as an open source company. Its new
leaders are focusing right now on shoring up their installed base and eventually hope to take a
chunk out of Oracle’s database business. Satyam, is also working on a hookup with Redhat
Software, the leading distributor of Linux. Satyam is a really well run company, but until now has
offered about the same portfolio of services as the other top Indian services outfits. Open source
offers it a chance to distinguish itself.
Table 3 : Some facts about Satyam
2005 2006 2007 2008
Software 500 Ranking 83 66 54 48
Softtware & Services Revenue (Million) $566 $794 $1,096 $1,461
SS Revenue Growth % 23.3% 40.0% 38.0% 33.3%
Employee 20,000 20,690 28,624 39,018
Added Value $28,320 $38,357 $38,300 $37,455
12
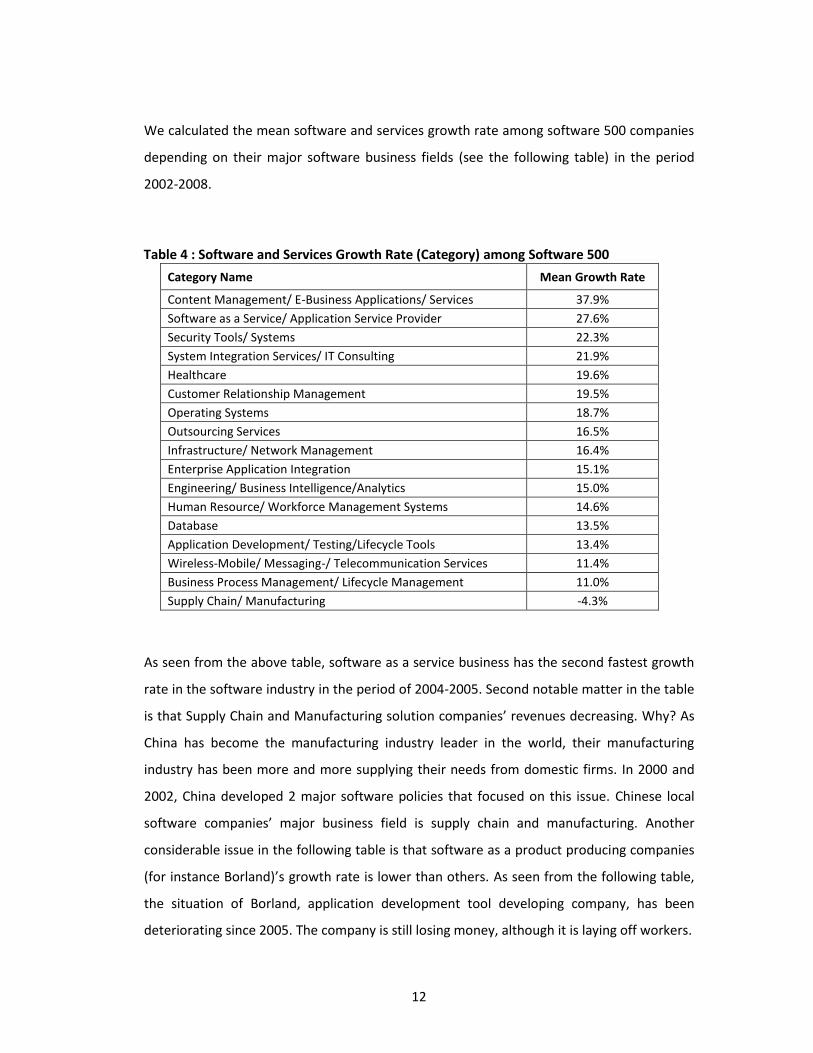
We calculated the mean software and services growth rate among software 500 companies
depending on their major software business fields (see the following table) in the period
2002-2008.
Table 4 : Software and Services Growth Rate (Category) among Software 500
Category Name Mean Growth Rate
Content Management/ E-Business Applications/ Services 37.9%
Software as a Service/ Application Service Provider 27.6%
Security Tools/ Systems 22.3%
System Integration Services/ IT Consulting 21.9%
Healthcare 19.6%
Customer Relationship Management 19.5%
Operating Systems 18.7%
Outsourcing Services 16.5%
Infrastructure/ Network Management 16.4%
Enterprise Application Integration 15.1%
Engineering/ Business Intelligence/Analytics 15.0%
Human Resource/ Workforce Management Systems 14.6%
Database 13.5%
Application Development/ Testing/Lifecycle Tools 13.4%
Wireless-Mobile/ Messaging-/ Telecommunication Services 11.4%
Business Process Management/ Lifecycle Management 11.0%
Supply Chain/ Manufacturing -4.3%
As seen from the above table, software as a service business has the second fastest growth
rate in the software industry in the period of 2004-2005. Second notable matter in the table
is that Supply Chain and Manufacturing solution companies’ revenues decreasing. Why? As
China has become the manufacturing industry leader in the world, their manufacturing
industry has been more and more supplying their needs from domestic firms. In 2000 and
2002, China developed 2 major software policies that focused on this issue. Chinese local
software companies’ major business field is supply chain and manufacturing. Another
considerable issue in the following table is that software as a product producing companies
(for instance Borland)’s growth rate is lower than others. As seen from the following table,
the situation of Borland, application development tool developing company, has been
deteriorating since 2005. The company is still losing money, although it is laying off workers.

13
Table 5 : Some facts about Borland
2005 2006 2007 2008
Software 500 Ranking 114 119 111 130
Softtware & Services Revenue (Million) $310 $277 $305 $269
SS Revenue Growth % 4.8% -11.0% 10.0% -11.8%
Employee 1,300 1,300 1,168 1,119
Added Value $238,077 $212,846 $260,873 $240,214
Why Borland losing?
There can be three reasons of this process. (i) open source software: application software
development tool field such as we based free available programming tools PHP, phyton etc.
(ii) internet : in coherently with 1st reason, moving business applications from stand-alone
domestic servers to internet based ones thanks to increasing high speed bandwidth
capacity. The process indicates “software as a service” trend also. (iii) 1st and 2nd reasons can
be together.
Open Source Software
Nowadays OSS applications are first, second or third-rung products in terms of market share
in several markets, including web servers, server operating systems, desktop operating
systems, web browsers, databases, e-mail and other ICT infrastructure systems. In terms of
representation of OSS developers, OSS software is still written mainly by software skilled
individuals; firms contribute about 15% and other institutions another 20%.19. So it remains
strongest in applications used primarily by software developers, or at least by technically
intelligent people, although some attempt of entering into front-office programs has been
made. Applications that required user-friendly interface are not typically found in open-
source, which is one of the main reasons why proprietary software continues to dominate in
software sector.
Nevertheless the OSS industry is growing with the notional value of investment in OSS
software today only in Europe more than Euro 22 billion. OSS market share is often higher in
Europe than in the US, followed by Asia. These markets shares have seen considerable
growth in the past five years. The tendency can be explained by highly developed
proprietary software industry in US compare to Europe and Asia and intention of developing
19 Ghosh (2006)
14
countries to catch up with US through promotion of less costly technology. OSS market
penetration is also high – 81% of the Fortune 500 admit to using OSS in production20 , and
it's highly likely that Global 1000 adoption rates are much higher in data centers and
infrastructure projects. Even large systems integration firms like IBM and Hewlett-Packard
rely on OSS to deliver solutions for their customers, and they pay thousands of skilled
developers to work on OSS projects. Although the affect of growing OSS industry and its
impact on software industry as a whole was remarkable during last years the existing
business model of the sector raise a lot of questions about sustainability and further
expansion of the sector.
Cloud Computing: Software as a Service Model
In the second half of the 2000s, another technology field that has huge potential to
influence on Global Software Industry is Cloud computing.
In recent years, software industry faced a dramatic transformation in terms of computing,
storage capacity and high-speed bandwidth. Disk storage costs decreased 7,500 times in the
last two decades and larger amounts of data are able to be transferred online with a
decreasing speed. Software as a service (SaaS) model enables software companies to sell
their software products as an online service by means of the large cloud computing systems
rather than buying a software package (often with a maintenance contract) from a
traditional vendor.
SaaS can be observed under two categories; business applications and development tools.
Business application industry supports business firms to carry out their tasks quickly and
efficiently. Microsoft Azure, Accenture (ACN), and Electronic Data Systems (EDS) are global
leaders in business applications. Development tools consist of software that is used
primarily for product development and management. Companies concentrate on a certain
type of product in this type. 21
20 CIO Insight (2006) 21 Software as a Service, http://www.wikinvest.com/concept/Software_as_a_Service

15
Table 6 : Some Facts about EDS
2004 2005 2006 2007 2008
Software 500 Ranking 3 3 3 3 3
Softtware & Services Revenue (x Million)
$20,000 $20,669 $19,757 $21,268 $22,134
SS Revenue Growth % -0.072 0.5% -4.0% 8.0% 4.1%
Employee 120,000 117,000 117,000 118,500 139,500
Added Value 166666.7 $176,658 $168,863 $179,477 $158,667
As seen from above table, EDS has selected “cloud computing” business as rescuer in order
to reverse its bad course.
Microsoft Azure is a cloud computing platform hosted in Microsoft Data Center. The system
offers a broad range of functionalities either to build new applications or extend the existing
ones. Google AppEngine serves for 12 million users who can write their application code and
upload it to the provider. Then, the application is scaled, secured and maintenance is carried
out by AppEngine.
It is estimated that 10 percent of software market will be grasped by SaaS model in 2009.
SaaS system is a growing priority for CIOs and venture capital investors. Revenues of
companies whose main area is to deliver SaaS increased from $295 million in 2002 to $485
million in 2005.22 Moreover, 14 percent of small and medium sized businesses and 15
percent of large enterprises adopted software as a service in 2007.23
The following table shows that the software 500 companies that focus on software as a
service are one of the fastest growing companies in software industry.
Table 7 : Some Software as a Service Companies in Software 500
2004 2005 2006 2007 2008
SalesForce.com
Revenue 51.00 176.00 309.90 309.90 497.10
Growth Rate 127.5% 83.3% 76.0% 76.0% 60.4%
Staff 500 767 1,304 1,304 2,070
Omniture Revenue $9 $21 $43 $80 $143
Growth Rate 132.4% 137.7% 108.0% 87.0% 79.5%
Staff 75 170 330 353 713
Vocus Revenue $15 $20 $28 $40 $58
Growth Rate 33.9% 31.4% 38.0% 44.0% 44.0%
Staff 107 170 220 276 341
22 McKinsey (2007: p2) 23 New SAAS Provider Strata Scale Redefines On Demand, http://www.channelinsider.com/

16
Except from the above companies, other middle and large scale companies have been
starting cloud computing and/or software as a service businesses. For example, BEA Systems
has detailed Project Genesis as a software-as-a-service-enabled application. According to
the Gartner report, “BEA now has the opportunity to offer the industry's first standard Java
Platform, Enterprise.”24
Manhattan’s Subscription based SaaS Model
Lockheed Martin selects Manhattan Manhattan's subscription-based Software-as-a-Service
(SaaS) TLM offering will initially manage transportation for Lockheed Martin divisions
domestically, with international locations to follow. Lockheed Martin will deploy Manhattan's
solution to dynamically optimize logistics and execute shipments across its multi-national, multi-
modal, multi-leg transportation network. TLM will optimize inbound and outbound
transportation moves through a single user interface, and provide a holistic view of Lockheed
Martin's transportation network. The system will enable Lockheed Martin to avoid events that
cause delays and precisely orchestrate deliveries, all while reducing costs. As a result, Lockheed
Martin will be able to anticipate workflow, optimize equipment and labor, plan more effectively,
and guarantee improved customer satisfaction25
.
Table 8 : Some facts about Manhattan
2005 2006 2007 2008
Software 500 Ranking 138 154 136 124
Softtware & Services Revenue (Million) 172.50 191.40 223.20 261.10
SS Revenue Growth % 14.50% 10.90% 17.00% 17.00%
Employee 1,117 1,400 1,400 1,965
Analysts and industry experts are considering SaaS as the future delivery model26.
SaaS Revenue Market is expected to grow to $15.5 billion by 2010
SaaS and related services like SaaS enablement, consulting, SaaS Application Development, Implementation and Integration, and BPU are expected to grow to $55.5 billion by 2010
Over 40% of companies and over 60% CIOs are considering SaaS as their future engagements
Over 80% of SAAS users are satisfied, are considering to plan, renew or/and expand deployment and are referring others to adopt SAAS
By 2010, at least 65% of businesses will have deployed at least one SaaS application – with the US achieving an even higher penetration in excess of 75%
24 Gartner (2007) 25 Reuters, “Lockheed Martin Selects Manhattan Associates to Optimize Complex Transportation Network” , April 23, 2008 26 HCL Infosystems, http://www.hcltech.com/SaaS/industry-insights/
17
SaaS usage within mid-size and large enterprise will more than double by 2010, averaging more than 7 SaaS solutions in production
"One third of all new software will be delivered on-demand by 2010" - Gartner
A n a l y z i n g C o m p e t i t i v e L a n d s c a p e o f O S S a n d
C l o u d C o m p u t i n g
O p e n S o u r c e S o f t w a r e
Since we think that open source is not itself a business model or business tactic, we may
conclude that there is not single market for open source software. As we mentioned in the
prior sections, since open source is a software development or distribution model, we will
focus on its overall effects on the software industry giving some specific company cases.
However, we would like to start with Porter’s five forces for a company that may want to
inject open source development model into its business model.
It is very hard to evaluate the impact of OSS on software business as a simple analogy with
other products and services does not work. Software market is unique in the sense that the
marginal costs are essentially negligible making the number of the software copies that can
be produced almost unlimited. From traditional business perspective it is absolutely unclear
how one can successfully demand a price for something similar which is being given away
freely. At the same time it does not appear to be sustainable to make open-source products
freely available.
The business solution of this dilemma for a OSS company can be found in complementary
areas. The open-source code, even if it is freely distributed, can provide revenue
opportunities in selling services, such as software customization, training and support.
Another source of revenue for company operates in OSS sector comes from sales of
complementary proprietary programs that run with or on the open-source program. For
example, the company can provide Linux operating system for free, but charge fee for
proprietary applications that run under Linux OS. The company can make profit providing
services that are directly associated with operation system. As you seen the following table,
RedHat that is an OSS operating system company has increased its revenues, employee and
added value substantially since 2004 as growing annually more than % 48.

18
Table 9 : Some facts about RedHat
2004 2005 2006 2007 2008
Software 500 Ranking 155 152 147 116 104
Revenue (million) $126 $124 $197 $278 $401
Revenue Growth % 38.7% 57.5% 58.0% 42.0% 43.9%
Employee 681 940 940 1100 1800
Added Value $185,169 $131,596 $209,043 $253,000 $222,556
Although there are obvious cost-saving advantages of OSS, two possible reasons for
choosing a more expensive option of same quality are; uncertainty regarding the underlying
quality and unawareness of the product’s existence. Based on this underlying economics ICT
experts believe that pure open-source software production cannot generate sustainable
profits. However there are some evidences that further development of OSS industry can be
facilitated by governments that consider use of OSS as a tool for local economic
development.
From the point of view of a government whose mission is to take care of nation welfare,
there are two areas where OSS can bring benefits to local economic development:
Since open-source requires so little in the way of initial investments OSS model is
beneficial for resource constrained developing nations seeking for cost reduction in
technology and computing expenses.
Open-source programs can be an important aspect of national economic
development as they can help in creating a local software industry.
Developing countries have high potential of benefiting from open sources since software
sector has not maturated yet. Open source coded software products are listed among user
driven innovation type27. Open source philosophy led to emergence of a number of new
products like Linux and apache. The fact that previous version of open source coded
software from platform side is zero is an indicator that open source coded platform provides
opportunities for high level of innovation. Multinational companies producing software
(Microsoft, IBM, HP, Novell, Sun etc.) have changed their strategies in software field and
moved towards open source coded software products under a new economic approach.
27 Lerner and Tirole (2000)

19
Governments have a dual role to play in terms of defining a local software industry. They
define the policy which influences industry players and they can also consume software
product making significant orders for software companies. In recent years, a number of
governments have combined these two roles by introducing policies defining government
software use. For example, several cities in Brazil have dictated that all municipal
government offices must use open-source software instead of proprietary software. The
reason for these sanctions is that OSS can be customized by local programmers and
consequently can faster react to local customer needs. In fact, several countries have taken
this route by starting with existing OSS and adapting it to local language and customs. In
that sense the OSS industry is even more service oriented and customer focused than
traditional proprietary software industry. At the same time if local open-source companies
were to grow into innovative (as opposed to adaptive) firms, if they continued to follow the
open-source model then their innovations would be freely copied by numerous global
competitors. Hence, the local OSS companies will be discouraged from developing
innovative software solution as they will not be able to charge fee for it or to serve local
clients in different parts of the world for providing complementary services. In that sense
the development of local OSS industry can be limited by pure adaptive or customizing
function of the sector. In that case further growth of local software industry needs the
development of traditional software businesses or sponsorship from the government.
To sum up the chapter we would like to emphasize that the impact of OSS expansion on
software industry was significant during the last several year encourage following changes in
the industry:
The development of OSS industry facilitates further shift of software companies
towards service oriented and customer focus business model;
OSS sector increases competition in the software industry due to the emergence of
local software industry in developing countries thanks to lowering entry barrier for
local software firms.
However while interest in open-source is understandable, given its low investment costs
and the overall appeal of software, the open-source model on its own does not appear to
provide a solid foundation for profitable business operations as it can hardly provide
innovative software solutions and has growth limitation for local software firms in

20
developing countries. So the next challenge for the software industry will be pursuit of
balance between traditional and open-source business models.
Regarding to the above explanations, the summarized Porter’s five-forces table is presented
as follows. We argue that OSS can be a component of our total service or solution.
Table 10 : Five Forces for OSS
Forces Explanation
Rivalry Among Existing Firms
It depends on the follows:
- What is your position in your business ecosystem?
- What is your value proposition for your customers?
The number of competitors increases. Relative size of competitors is also high. For example, IBM is the largest competitor due to being major supporter of OSS and having potential the ecosystem’s future leader in OSS field. However, the industry’s growth rate is more than 23% in the recent 5 years. The major fixed costs are hardware costs. Variable costs are employee costs. Buyers’ switching cost can change depending on our service/solution business. There can be exit costs to buyers.
Threat of New Entrants
Barries to entry is relatively low in the software service field. Economies of scale can be possible if the company can create a huge experience database and manage well it. If you do not offer unique value proposition to your customers, your business model can be easily copied by others.
Threat of Substitute Products
Since you offer service instead of just product, the threat of substitute would not be more important. The price of your service would change depending on our customer group and value proposition.
Determinants of Supplier Power
For software services, there is no supplier. We should develop our service model in-house. But, if our service/solution model includes hardware or external component, our suppliers would be hardware-makers. If hardware has not considerable effect on our business, there will not be problem for us.
Determinants of Buyer Power
There can be switching costs to buyers. Because long term service business agreements may lead to path dependency. The number of buyers is relatively too high to sellers. But, it can change depending on our segment. For example, if we operate in car industry, the buyer may have more powerful. In this situation, our positioning should be more niches and have more path-dependency effects. It does not seem possible the buyer can use multiple sellers in business service software field.
All things considered, we may conclude that the competitive structure will be determined by
the service quality of vertical industries in OSS included business models. Cloud computing
trend also would be considered as the potential quality increasing factor for this field.

21
C l o u d C o m p u t i n g : S o f t w a r e a s a S e r v i c e
The cloud computing system increased the importance of centralized data storage since
processing power of online services dominated desktop solutions. This reduced the
dependency of users to the personal computers since they have the opportunity to access
data via internet. Thus, flexibility and accessibility increased for data processing that
dramatically changed the competitive structure of software industry, as well.
Cloud computing model has three advantages over traditional software products; more
better upgrading process, less total cost of ownership (mostly hardware), and high quality
service. As software industry develops, new software products require more processing and
storage capacity, the new method would propose new-extra value proposition for
customers since total ownership cost would be reduced.
Moreover, SaaS model on the fast cloud computing platform will reduce the entry learning
barrier for new users. They will have opportunity to learn from an unlimited full version.
Another important advantage is that the robustness of software products can be well-
maintained since customers will be made use of as testers and be a part of product
development and innovation process. Hence, software industry will face reduced R&D costs,
which positively affects bottom-line of companies.
SaaS model would encourage unlicensed users to purchase software services online with
affordable costs because they will take full service without having long-term contracts for
updates and maintenance for hardware and software system requirements. Thus, software
piracy, learning and test costs will be minimized.
Regarding to the above explanations, the summarized Porter’s five-forces table is presented
as follows. We argue that cloud computing can be considered as cost effective solution for
service based software businesses.
Table 11 : Five Forces for Cloud Computing: Software as a Service
Forces Explanation
Rivalry Among Existing Firms
The competition has just started. The market is not enough mature. Sometimes, your competitors would not be local ones, or software companies, but telecommunication companies. Fixed cost is high but variable cost is too low. You should guarantee the availability of your system 7/24 at minimum level error time.

22
Threat of New Entrants
Barriers to entry are as follows: Economies of scale (reaching as soon as possible critical mass), product differentiation (your service has to be enough fast and high quality), capital requirement (1
st installation cost is huge amount), other
cost advantages (you should establish your system near by a dam and main telecommunication station if you want to reduce costs)
Threat of Substitute Products
There is a threat of substitute of products that can be offered by large scale other company. The relative price of substitutes can be determinant of competition. But, the major competition would be on “speed and availability”. We may define it as “relative quality of substitute”
Determinants of Supplier Power
You suppliers would be hardware-makers such as Intel, high-performance computer producing companies, telecommunication and electricity provider companies. Your business ecosystem is more vulnerable than prior one. You have to create dynamic risk analyses.
Determinants of Buyer Power
Governments can be considered as the major buyers. E-Government process would contribute cloud computing trend. If governments have become customers, they will have strong power undoubtedly. After destructive financial crisis, governments have had right to intervene to larger financial companies. So, even if your customers are private sector companies, you have to convince governments avoiding information security concerns. Since the software industry is the most global industry, buyers can find another seller from any part of the world. At first, switching costs of buyers is not high. When you have critical customer mass, you would be more profitable with long-term customers. After a while, customers will not want to change you because you have their large amount of data and software to which customers are used to use.

23
R e f e r e n c e s
Arthur, W. Brain (1996) “Increasing Returns and New World of Business”, Harvard Business Review July-August, 1996
Campbell-Kelly, Martin (2003), From Airline Reservations to Sonic the Hedgehog - A History of the Software Industry, ISBN 0-262-03303-8, MIT Press, Massachusetts, 2003
Campbell-Kelly, Martin and Daniel D. Garcia-Swartz (2007) ,From Products to Services: The Software Industry in the Internet Era(May 2007). Available at SSRN: http://ssrn.com/abstract=984451
Chesbrough, Henry, Open Innovation: The New Imperative for Creating and Profiting from Technology, Harvard Business School Press, 2003
Clarke, Matthew (2003), e-Development? Development and New Economy, World Institute for Development Economics Research (WIDER) – Policy Brief No.7, United Nations University, ISBN 92-9190-573-9, Helsinki, 2003
Correa, Carlos Maria (1990), “The Legal Protection of Software: Implications for Latecomer Strategies in Newly Industrialising Economies(NIES) and Middle-Income Economies (MIES)”, OECD Development Centre, Working Paper No.26, October 1990http://econpapers.repec.org/paper/oecdevaaa/26-en.htm
Deutsche Bank (2005), “Software Houses: Changing from Product Vendors into Solution Providers ”, ISSN İnternet: 1619-3253, Economics Digital Economy and Structural Change Vol. 50, Deutsche Bank Research, 22 April 2005, (çevrimiçi) http://www.dbresearch.com/prod/dbr_internet_de-prod/prod0000000000186720.pdf
Fay , Francis (1996), “Birthplace of the First Business Computer”, October 25, 1996, (çevrimiçi) http://www.rowayton.org/rhs/Computers/hstbirthhour.htm
Gartner (2007), Genesis Marks BEA's Strategic Turn to 'Cloud Computing , http://www.gartner.com/
Ghosh , Rishab Aiyer (2006), “Economic impact of open source software on innovation and the competitiveness of the Information and Communication Technologies (ICT) sector in the EU”, UNU-MERIT, the Netherlands, September 26, 2006
Hurd, Mark and Lars Nyberg (2004), The Value Factor: How Global Leaders Use Information for Growth and Competitive Advantage, ISBN:1-576-6015-79, Bloomberg, 2004
Kumar, Sameer (2006), “A Comparative Analysis of Key Information Technology Players”, Technovation, Volume 26, 2006, pp. 836-846
Lansiti, Marco and Roy Levien, “Strategy as Ecology”, Harvard Business Review Vol.82-3, March 2004
Lerner, Josh and Jean Tirole (2000), “The Simple Economics of Open Source”, National Bureau of Economic Research NBER, Working Papers, Mart 2000, http://www.nber.org/papers/w7600
24
McKinsey (2007), The McKinsey Quarterly, Delivering Software As a Service, May 2007, pg. 2
Messerschmitt, David G. and Clemens Szyperski (2003), Software Ecosystem-Understanding an Indispensable Technology and Industry, ISBN 0-262-1343-22, MIT Press, Cambridge, Massachusetts 2003
Messerschmitt, David G. and Clemens Szyperski (2004), “Marketplace Issues in Software Planning and Design”, ISBN 0-740-7459, IEEE Software, 2004, http://www.eecs.berkeley.edu/~messer/PAPERS/03/Mkt-issues-sftwr.pdf
MITCHELL, William J., Alan S. INOUYE and Marjory S. BLUMENTHAL, (editors), Beyond Productivity, Information Technology, Innovation and Creativity, ISBN 0-309-0886-82, The National Academies Press, Washington DC, June 2003
OECD, Information Technology Outlook 2006, ISBN 92-64-02643-6, Paris, 2006
Reuters, “Lockheed Martin Selects Manhattan Associates to Optimize Complex Transportation Network” , April 23, 2008, http://www.reuters.com/article/pressRelease/idUS146742+23-Apr-2008+BW20080423
Software Magazine, “Software 500 List”, (online) http://www.softwaremagazine.com/