
A Software Framework for Building Biomedical Machine Learning Classifiers through Grid Computing...
13
ORIGINAL PAPER A Software Framework for Building Biomedical Machine Learning Classifiers through Grid Computing Resources Raúl Ramos-Pollán & Miguel Ángel Guevara-López & Eugénio Oliveira Received: 14 December 2010 / Accepted: 28 March 2011 # Springer Science+Business Media, LLC 2011 Abstract This paper describes the BiomedTK software framework, created to perform massive explorations of machine learning classifiers configurations for biomedical data analysis over distributed Grid computing resources. BiomedTK integrates ROC analysis throughout the complete classifier construction process and enables explorations of large parameter sweeps for training third party classifiers such as artificial neural networks and support vector machines, offering the capability to harness the vast amount of computing power serviced by Grid infrastructures. In addition, it includes classifiers modified by the authors for ROC optimization and functionality to build ensemble classifiers and manipulate datasets (import/export, extract and transform data, etc.). BiomedTK was experimentally validated by training thousands of classifier configurations for representative biomedical UCI datasets reaching in little time classifi- cation levels comparable to those reported in existing literature. The comprehensive method herewith presented represents an improvement to biomedical data analysis in both methodology and potential reach of machine learning based experimentation. Keywords Machine learning classifiers . Biomedical data analysis . ROC analysis . Grid infrastructures Introduction The integration of biomedical information has become an essential task for biology, biotechnology and health care professionals. Current progress in Information Technolo- gies allows for affordable huge data storages and powerful computational possibilities; thus, they have become quite common. Researchers are gradually be- coming aware of the importance of keeping together diverse data pertaining to a specific medical entity and successful attempts to create and maintain such databases are becoming known to the scientific community [1–4]. Data models specified by standards are often included in databases, without taking into account inherent limitations posed by the procedure of acquiring original data. Integration is therefore much more than a plain collection of digital biomedical data. Homogenization of data description and storage, followed by normalization across the various experimental conditions would be a prerequi- site for facilitating procedures of knowledge extraction and analysis [2]. Machine learning classifiers (MLC) are able to learn from experience (observed examples) with respect to some class of tasks and a performance measure. Due to this, they R. Ramos-Pollán (*) CETA-CIEMAT Centro Extremeño de Tecnologías Avanzadas, Calle Sola 1, 10200 Trujillo, Spain e-mail: [email protected] M. Á. Guevara-López INEGI-Faculdade de Engenharia, Universidade do Porto, Rua Roberto Frias 400, 4200–465 Porto, Portugal e-mail: [email protected] E. Oliveira LIACC-DEI-Faculdade de Engenharia, Universidade do Porto, Rua Roberto Frias s/n, 4200–465 Porto, Portugal e-mail: [email protected] J Med Syst DOI 10.1007/s10916-011-9692-3
Transcript of A Software Framework for Building Biomedical Machine Learning Classifiers through Grid Computing...
ORIGINAL PAPER
A Software Framework for Building Biomedical MachineLearning Classifiers through Grid Computing Resources
Raúl Ramos-Pollán & Miguel Ángel Guevara-López &
Eugénio Oliveira
Received: 14 December 2010 /Accepted: 28 March 2011# Springer Science+Business Media, LLC 2011
Abstract This paper describes the BiomedTK softwareframework, created to perform massive explorations ofmachine learning classifiers configurations for biomedicaldata analysis over distributed Grid computing resources.BiomedTK integrates ROC analysis throughout thecomplete classifier construction process and enablesexplorations of large parameter sweeps for training thirdparty classifiers such as artificial neural networks andsupport vector machines, offering the capability toharness the vast amount of computing power servicedby Grid infrastructures. In addition, it includes classifiersmodified by the authors for ROC optimization andfunctionality to build ensemble classifiers and manipulatedatasets (import/export, extract and transform data, etc.).BiomedTK was experimentally validated by trainingthousands of classifier configurations for representative
biomedical UCI datasets reaching in little time classifi-cation levels comparable to those reported in existingliterature. The comprehensive method herewith presentedrepresents an improvement to biomedical data analysis inboth methodology and potential reach of machinelearning based experimentation.
Keywords Machine learning classifiers . Biomedical dataanalysis . ROC analysis . Grid infrastructures
Introduction
The integration of biomedical information has become anessential task for biology, biotechnology and health careprofessionals. Current progress in Information Technolo-gies allows for affordable huge data storages andpowerful computational possibilities; thus, they havebecome quite common. Researchers are gradually be-coming aware of the importance of keeping togetherdiverse data pertaining to a specific medical entity andsuccessful attempts to create and maintain such databasesare becoming known to the scientific community [1–4].Data models specified by standards are often included indatabases, without taking into account inherent limitationsposed by the procedure of acquiring original data.Integration is therefore much more than a plain collectionof digital biomedical data. Homogenization of datadescription and storage, followed by normalization acrossthe various experimental conditions would be a prerequi-site for facilitating procedures of knowledge extractionand analysis [2].
Machine learning classifiers (MLC) are able to learnfrom experience (observed examples) with respect to someclass of tasks and a performance measure. Due to this, they
R. Ramos-Pollán (*)CETA-CIEMAT Centro Extremeñode Tecnologías Avanzadas,Calle Sola 1,10200 Trujillo, Spaine-mail: [email protected]
M. Á. Guevara-LópezINEGI-Faculdade de Engenharia,Universidade do Porto,Rua Roberto Frias 400,4200–465 Porto, Portugale-mail: [email protected]
E. OliveiraLIACC-DEI-Faculdade de Engenharia,Universidade do Porto,Rua Roberto Frias s/n,4200–465 Porto, Portugale-mail: [email protected]
J Med SystDOI 10.1007/s10916-011-9692-3

are suitable for biomedical data classification, based onlearning algorithms’ ability to construct classifiers that canexplain complex relationships in the data. MLC constitutethe backbone of biomedical data analysis on high dimen-sional quantitative data provided by the state-of-the-artmedical imaging and high-throughput biology technologies.The general strategy relies on expert-curated ground truthdatasets providing the categorical associations of allavailable data samples. Ground truth datasets are then usedas the basis for statistical learning to construct classifiersusing one of a host of methods such as support vectormachines (SVM), artificial neural networks (ANN), nearestneighbor classifiers, discriminant functions and so on [5].Machine learning techniques have been successfully ap-plied in various biomedical domains, for example thedetection of tumors, the diagnosis and prognosis of cancersand other complex diseases [6–8].
From a computational point of view MLC are expensiveto train, and seamless access to computing power is key toundertake successfully any comprehensive MLC based dataanalysis endeavor. Grid infrastructures federate distributedcomputing resources owned by different institutions to offerone large computing and storage facility, bringing togetherresources scattered throughout different data centersthrough a middleware layer (such as Globus [9] or gLite[10]) providing a homogeneous view and access model tothe final users. In the last years there has been great publicinvestment to build transnational Grid facilities providinggeneralized access to large amounts of computingresources for scientific communities to perform theirresearch (eScience). The European Grid Initiative (EGI,[11]) is the major public European effort aggregating thenational Grids of virtually every EU country to conform apan-European federation of approximately 330 datacenters and 70,000 CPU cores [12]. However, in spite ofhaving been around for the last 10 years, Grids are still farfrom achieving the initial expectations of penetration anddissemination throughout scientific disciplines and busi-ness domains, remaining mostly within specific academicareas. Among others, one of the reasons behind this is thedifficulty of usage of the middleware, constituting a steeplearning curve and cost barrier for new communities nothaving the tradition nor the resources to work with Grids[13–16]. In fact, the lifecycle through which newapplications are adapted to use existing middleware islong and slow and this has caused even the moreprivileged scientific communities (such as High EnergyPhysics, focused at CERN, the European Laboratory forParticle Physics) to develop their own particular tools andmethods to reduce usage costs and facilitate their users’research, such as, among others, DIRAC [17] and AliEn[18] used respectively by the CERN LHCb and ALICEexperiments.
In our previous works we proposed some approachesrelated with the usage of distributed Grid infrastructures tosupport large repositories of medical images (mostlymammography) and preliminary explorations of machinelearning classifiers for breast cancer computer-aided diag-nosis (CAD) [1, 3, 19–21]. Now, we set forth to takeadvantage of Grid power in a systematic manner to discoverwell performing machine learning classifiers for biomedicaldata mining, aiming at reducing the cost and simplifyingdevelopment lifecycles of using Grid infrastructures forbiomedical applications. In particular, we are interested inbreast cancer diagnosis (CADx) applications, and test themwith the breast cancer digital repository currently beinggathered at Hospital São João - Faculty of Medicine ofPorto University, in Portugal, in the context of the currentcollaboration project between our institutions.
This paper is structured as follows. Section 2 describesthe BiomedTK software framework and the MLC explora-tion methods it supports. BiomedTK was developed toharness Grid computing power for biomedical data analy-sis. It also describes the experimental set up through whichthe method was validated with different biomedical datasetsof the UCI machine learning repository [22, 23]. Section 3shows the results obtained by the experiments carried out,which are finally discussed in Section 4.
Materials and methods
Biomedical data analysis toolkit (BiomedTK)
BiomedTK is a Java software tool that uses distributed Gridcomputing power to exploit third party libraries for dataanalysis augmenting them with methods and metricscommonly used in the biomedical field. It provides themeans to massively search, explore and combine differentconfigurations of machine learning classifiers provided byunderlying libraries to build robust biomedical data analysistools. BiomedTK trains Artificial Neural Networks (ANN)and Support Vector Machines (SVM) based binary andmulticlass classifiers with many different configurations,searches for best ensemble classifiers, generates differenttypes of ROC (Receiver Operating Characteristic) curveanalysis, etc. In addition, it is possible to manipulatedatasets, including export/import to/from data formats ofcommonly used applications, allowing users to feedBiomedTK with datasets preprocessed by other tools to,for instance, filter, or transform the data, normalize it,reduce its dimensionality, etc. For researchers, it offers acommand line interface to access its functionality (managedatasets, launch MLC explorations, analyze results, etc.).For programmers, it offers a simple API (ApplicationProgramming Interface) so that new data analysis engines
J Med Syst

can be integrated in a modular manner with reasonableeffort.
Currently, BiomedTK integrates engines from the Encogtoolkit [24] (for ANNs), the libsvm toolkit [25] (for SVMs)and the ANN Encog engines modified by the authors forROC optimization [23]. Table 1 lists the engines currentlyintegrated in BiomedTK along with the parameters eachone accepts. Particular values of those parameters for aspecific engine constitute a classifier configuration forthat engine. For a given data analysis task in hand,classifier design amounts to finding configurations yield-ing acceptable performance results and, therefore, theresearcher is often confronted with the need to explore andevaluate several classifier configurations. As mentioned,MLC are usually computationally expensive to train andso are, in a higher degree, explorations of MLC config-urations. For any engine, BiomedTK allows the evaluationof binary classifiers through plotting ROC curves andcomputing their area under the curve (ROC Az) [26, 27],offering the bi-normal distribution method as provided byJLABROC4 [28] and the Mann–Whitney statistic provid-ed by WEKA [29]. It also includes the Encog ANNengines modified by the authors [23], allowing optimiza-tion of the ROC Az complementing the classical optimi-zation tasks aimed at reducing some Root Mean SquaredError measure to increase accuracy (percentage of datasetelements correctly classified). Accuracy and ROC Azmeasures are related, but it is known that optimization ofaccuracy does not necessarily yield optimization of ROCAz [30], fact that is specially relevant for biomedical dataanalysis. The following summarizes the basic elements ofBiomedTK:
Dataset or training set Contains the data to analyze. Adataset is made of a set of elements (or instances), each onecontaining a set of features used as input values forclassifiers and, optionally, an ideal class to which it belongs
for supervised training (expected classifier output).Depending on validation strategies, elements of a datasetare usually split into two subsets, one for training and onefor testing. The training subset is used in training classifiersbuilt to distinguish automatically the classes to which eachelement belongs. The test subset is used to measure thegeneralization capabilities of classifiers when applied tounseen data.
Binary dataset A dataset whose elements belong to onlytwo classes. As opposed to a Multiclass Dataset, whoseelements may belong to several (more than two) classes.BiomedTK provides the tools to create multiple binarytraining sets for a given multi-class training set, each one tobuild a classifier specific for each class.
Engine Engines encapsulate third party classifiers (such asANNs from Encog or SVMs from libsvm). Each engineaccepts a different set of parameters for training (ANNspecification, learning parameters, etc.)
Engine or classifier configuration An engine configurationspecifies the parameters with which a particular engine isused to train given a dataset. For instance, a configurationof an ANN feedforward backpropagation engine mightspecify an ANN with 3 layers having 10 neurons each,using the sigmoid activation function, with 0.1 as learningrate and 0.5 as momentum over 10,000 iterations.
Exploration An exploration over a dataset defines a set ofengine configurations to train in batch mode in order to findthe one (s) that best classify the dataset, or to later use themto build ensemble classifiers.
Jobs Each exploration is split into a number of user definedjobs. Each job will train a subset of the engine config-urations defined in a given exploration. Jobs can be then
Table 1 Currently available engines in BiomedTK
engine name description accepted parameters source
ffbp feed forward ANN trained with backpropagation ANN structure, learn rate, momentum encog
ffbproc ffbp modified for ROC optimization ANN structure, learn rate, momentum modified encog
ffrp feed forward ANN trained with resilient propagation ANN structure (no more params) encog
ffrproc ffrp modified for ROC optimization ANN structure (no more params) modified encog
ffsa feed forward ANN trained with simulated annealing ANN structure, start temp, end temp, cycles encog
ffsaroc ffsa modified for ROC optimization ANN structure, start temp, end temp, cycles modified encog
ffga feed forward ANN trained with genetic algorithms ANN structure, population size, mating size, survival rate encog
ffgaroc ffga modified for ROC optimization ANN structure, population size, mating size, survival rate modified encog
csvc cost based Support Vector Machine kernel, cost, degree, gamma, coef0, weight,shrink, probestimates
libsvm
nusvc v Support Vector Machine kernel, nu, degree, gamma, coef0, shrink, probestimates libsvm
J Med Syst

executed in sequentially over the same computer or inparallel over a distributed computing infrastructure.
BiomedTK interfaces seamlessly with distributedcomputing resources serviced by gLite Grid infrastruc-tures (such as EGI) to train classifier configurations asdescribed in section 2.2. It offers researchers thecapability to exploit Grid computing power in an agilemanner, allowing them to gradually gain understandingon what engine configurations better classify theirbiomedical data. This constitutes the basis of theexploration method described below.
Finally, it also offers different validation methodswhen using any of the available engine configurations.These are: fixed test/train dataset split, cross-validationwith user definable number of folds, bootstrapping [31,32] and leave-one-out validation [33], referred to as one-to-all in BiomedTK. One-to-all validation is in generalseldom used since it requires one full classifier trainingprocess for each dataset element and engine configurationwhich makes it extremely demanding computationally.With BiomedTK one-to-all becomes a feasible andmanageable alternative provided the required computingresources are available in the underlying Grid serviceused.
Software architecture
Figure 1 shows the different components of the BiomedTKarchitecture. The BiomedTK Engine coordinates all func-tionality invoking the Exploration Generator to processexplorations and the JobSet Generator to effectivelyexecute the explorations. The JobSet Generator handlesjobs to a Local Job Launcher (on the user computer) or to agLite Job Launcher according to the user command.Datasets and exploration results are stored in a commondatabase. Jobs, whether launched locally or over gLite, feedthe BiomedTK database with results so that they can belater inspected through standard SQL tools. Any JDBCcompliant database can be used and, for convenience,BiomedTK embeds the H2 database engine [34] which usesthe local file system for storage, so there is no need toinstall another third party database if it is not desired.
An Engine API allows the integration into BiomedTK ofnew classifier engines. Java classifier engines must delivertheir implementation as a jar file containing the interfaceclasses implementing the BiomedTK Engine API and theirown classes (the actual engine). The following shows anexcerpt of the its main interface that each classifier enginemust implement:
It is a straight forward Java interface requiring mostlyimplementations of methods to train and classify datasets,to generate parameters sweeps from an exploration defini-tion and create and restore a trained engine to/from a Stringbased representation, which allows BiomedTK to store andreconstruct any third party trained engine. BiomedTK alsosupports native implementations of classifier engines. Inthis case, classifier engines must deliver a set of precom-piled binaries for different hardware platforms so thatBiomedTK can find the required specific binary program
whenever needed and it will be able to use engines for asmany hardware platforms as precompiled binaries areprovided. This is the case of the already integrated libsvm Clibrary, for which binaries for Windows XP/7, MacOS anddifferent Ubuntu and Scientific Linux kernels were generated.This allows researchers, for instance, to start using BiomedTKto classify a given dataset on their desktop MacOS orWindows machine and then send larger explorations to agLite Grid service, usually running on Scientific Linuxmachines, in a completely transparent manner.
J Med Syst

As mentioned in section 1, Grid infrastructures aredifficult to use in an agile manner as required by thediversity and complexity of biomedical datasets andexplorations of MLC configurations. BiomedTK compen-sates this by hiding middleware complexities from the finaluser and by using a fast communication mechanism withgLite computing resources through a Job Agents basedmechanism (such as in [17] and [18]), providing the meansto make classifier explorations, analyze their results, definefiner grain explorations, etc. in an efficient way adapted tothe processes of analyzing biomedical data. In total,BiomedTK is approximately made of 18,000 lines of codeand 200 Java classes.
A method to explore classifier configurations
The classifier exploration method based on BiomedTK andherewith described, is aimed at addressing two issues: 1)the need to manage, in a simple and unified way, manyclassifier configurations integrating third party engineimplementations of different nature (implementing differentMLC models such as ANNs, SVMs, etc. on differentprogramming languages such as C, Java, etc.) and 2) theneed to efficiently exploit distributed resources required toevaluate such a diversity of classifier configurations. In thissense, efficiency denotes both an economy in the research-er’s effort to setup and run experiments and a rational usage
of available computing resources. BiomedTK supports thismethod through a series of configuration artifacts and toolsthat jointly constitute the material means through whichresearchers can efficiently use Grid computing resources toperform complex MLC explorations.
Explorations of classifier configurations are the keyelement of this method. Through them, researchers cangradually build understanding on the search space ofpossible classifiers (engine configurations) for a givendataset. With BiomedTK explorations are defined in textfiles with a specific format. Figure 2 shows an exampleexploration file producing configurations to train classifiersfor two datasets derived from the original BREAST-TISSUE one from the UCI repository [22] with the engineusing ffrp, ffsaroc, ffga and nusvc (see Table 1). For ANNbased engines, this exploration will generate configurationswith ANNs having three hidden layers with 18 or 36neurons in the first hidden layer, 9 or 18 in the second one,different neuron activation functions, etc. It also containsclassifier specific parameter sweeps. For instance thisexploration generates ffsaroc configurations with thestarttemp parameter set to 10 and 15, the endtempparameter set to 2 and 4, nusvc configurations with radialbasis and polynomial kernel functions, etc. This explorationgenerates, for each dataset, 32 ANN based configurationsfor the ffrp engine (it is an engine with no parameters, 32 isthe number of combinations of ANNs generated with the
gLite Computing resources
BiomedTK
BIOMEDTK ENGINE
EXPLORATIONGENERATOR
JOBSETGENERATOR
LOCAL JOB LAUNCHER
gLITEJOBLAUNCHER
ENCOGENGINES
BIOMEDTK ENGINE API
DB DATASETS and
EXPLORATION RESULTS LIBSVM
ENGINES
OTHER 3rd PARTY
ENGINES
DATASET HANDLING
EXPLORATION DEFINITION
DATASET cvs, weka,
…
gLite computing server
BIOMEDTK component
third party classifier engineBiomedTK
JOB AGENT
Fig. 1 BiomedTK architecture
J Med Syst

specified layers, neurons and activation functions perlayer), 64 configurations for the ffga engine, 128 forffsaroc and 24 for nusvm (which does not use ANNs). Intotal this exploration generates 496 engine configurations(248 for each dataset) split into 50 jobs as specified in thesame exploration file. This way, 49 jobs will train 10engine configurations, and one job that will train 6configurations.
Exploration jobs are sent to computing resources fortraining the MLC configurations they contain. Explorationscan be made as large or small as desired, depending theirfeasibility on the capacity of the available computingresources. Training times for different classifier enginesvary greatly depending on dataset size, parameters, ANNcomplexities, etc. When confronted to a new dataset forwhich one wants to explore classifier configurations, ourmethod proposes the following steps:
1. Start with small explorations launched locally to get asense on the computing times needed by each differentclassifier and their initial performance.
2. Perform increasingly larger explorations, first locallyand then over a larger computing infrastructure, tounderstand what classifier parameters might workbetter with each classifier.
3. Devise very large explorations (either by number ofconfigurations and/or by computing time each config-uration takes) and send them to a large computinginfrastructure.
For this method to be effective, an agile and fastinteraction between the researcher and the computinginfrastructure becomes essential, so that, if computingresources are available, multiple explorations can be testedin reasonable time. It is fundamentally this agile interactionthat allows researchers to efficiently build exploration
strategies and gain understanding on what classifiers suitbetter a certain problem in hand.
This method is supported by BiomedTK which, forperforming explorations, offers the researcher two options:(1) launch the jobs sequentially over his local machine, or(2) submit them to a gLite Grid infrastructure to use inparallel available distributed computing resources. Results(accuracy and ROC Az measures for test and train data) ofeach trained engine configuration are stored in a databasethat can be later inspected through standard SQL sentences.A command line tool exposes BiomedTK functionality toresearchers. There are commands to import and manipulatedatasets, to create a job set from an exploration file, tolaunch locally and exploration, to launch and monitorexplorations to a gLite Grid service, to inspect and testexploration results, to build ensemble classifiers, etc. Inpractice, when faced with the task of exploring MLCconfigurations for a given dataset, BiomedTK enablesresearchers to carry out the method above by cyclingthrough the following steps
1. make initial exploration issuing BiomedTK commandsjobset + launch (local launch)
2. inspect database for results3. refine and enlarge initial exploration by issuing
commands jobset + glite.prepare + glite.submit4. inspect database for results5. repeat from step 1 or step 3
Initially confronted with a large availability of Gridresources, but suffering large job latency times hinderingour capability to cycle through these steps, we faced theneed to have an efficient cycle through which understand-ing about explorations and classifiers was to be gained for aparticular dataset. Otherwise, available Grid resourcesbecome very hard to be used with agility. This is what
Fig. 2 Sample BiomedTKexploration file
J Med Syst

motivated the inclusion within BiomedTK of a Job Agentsmechanism as described previously.
Figure 3 shows a typical BiomedTK session, importing adataset and launching an exploration locally. This methodand its supporting tool are focused on providing the meansto exploit Grid resources for exploring MLC configura-tions, regardless the sources and previous manipulations ofdata. For this purpose, BiomedTK provides basic function-ality for data normalization and tools for importing andexporting data to commonly used formats (CSV, WEKAarff, etc.), so that researchers can use their usual tools fordata preprocessing before feeding datasets to BiomedTK.
A method to build ensemble classifiers
Ensemble methods in machine learning [35] combineexisting classifiers as an attempt to improve the perfor-mance of single classifiers either by compensating witheach other in cases where a single classifier outperformsother, or by combining redundancy classification offered byseveral single classifiers.
For their simplicity and generality we are interested inError Correcting Output Codes, a technique developed inthe context of digital signal processing theory [36, 37]
providing redundancy in communications to compensatefor noise and applied in machine learning since [38]. Inshort, for a given multiclass classification problem with nclasses, an Error Correcting Output Code (ECOC) isdefined by a matrix of size m×n describing, for each ofthe n possible final classes, how the m available binaryclassifiers are combined. This matrix is referred to as thecodematrix, and Fig. 4 shows an example where 7 binaryclassifiers are used to produce a 6 class ensemble classifier.Each class is assigned a codeword that represents theparticipation of each binary classifier in that class. When aninput vector is fed into each one of the 7 classifiers, abinary codeword is produced combining the output of allthe binary classifiers. Then, a distance measure betweencodewords is defined and the class with the closestcodeword to the one produced by the binary classifiers isselected to be the one assigned to the initial input vector.ECOCs are being used frequently in machine learning [39–41] and also in biomedical contexts [42].
BiomedTK supports the ECOC based method forbuilding ensemble classifiers. This includes (1) the defini-tion of code matrices for a certain multiclass dataset, (2) thegeneration of binary datasets for each column in the codematrix and (3) assembling previously trained binary
command to import dataset
csv file being imported
dataset summary
command to prepare exploration
# of combinations generateddistributed into jobs
command to start training combinations locally
first combination to train
training progress
first combination result
Fig. 3 Sample BiomedTK session
J Med Syst

classifiers for each column into ensemble classifiers.Figure 4 represents an actual codematrix definition file asaccepted by BiomedTK, where BREAST-TISSUE is a six-class dataset (from the UCI repository, dataset withelectrical impedance measurements of freshly excised tissuesamples from the breast) and the codematrix specifies sevenbinary classifiers (columns). The first six columns would beused to train classifiers distinguishing each class from the rest.The norm column will be used to train classifiers distinguish-ing elements tagged as car (for carcinoma), fad (fibro-adenoma) or mas (mastopathy) from the rest (representingnormal tissue tagged as glandular, connective or adipose).
The following summarizes the method supported byBiomedTK for building ensemble MLC:
1. Start with a multiclass dataset with n classes and a codematrix specification with n rows and m columns, suchas the one in Fig. 4. Then, create for each column in thecode matrix a new binary dataset according to thecolumn specification (for column c, each element islabeled as “c” or “non-C” according to whether its ideal
class in the original dataset is marked as 1 or 0 incolumn c). This generates m binary datasets.
2. Explore MLC configurations for each newly createdbinary dataset. In fact, Fig. 2 shows an exploration fileto search binary classifier configurations for the car andnorm derived binary datasets as created in the previousstep starting from the code matrix shown in Fig. 4. Thisgenerates, for each column, a set of MLC. BiomedTKsupports this step through the exploration methodexplained in section 2.1.
3. Choose, one MLC for each column and ensemble themthrough the ECOC method. This is done through theensembles command, which takes MLCs for eachcolumn, ensembles them and measures the performanceon the ensemble classifier.
Observe that, for each column in a code matrix, onemight have generated several binary classifiers in step 2above; hence, the researcher needs to decide which specificclassifier to use. BiomedTK supports this by interpretingthe ensemble.classifiers.select line in the codematrix in
ensemble.trainingset = BREAST-TISSUE
ensemble.classifiers.validation = cvfolds 10ensemble.classifiers.select = bestPct any bestAz 4035 bestPct bestPct any ensemble.classifiers.names = car fad gla mas con adi normensemble.codematrix.car = 1 0 0 0 0 0 0ensemble.codematrix.fad = 0 1 0 0 0 0 0ensemble.codematrix.gla = 0 0 1 0 0 0 1ensemble.codematrix.mas = 0 0 0 1 0 0 0ensemble.codematrix.con = 0 0 0 0 1 0 1ensemble.codematrix.adi = 0 0 0 0 0 1 1
Fig. 4 Sample BiomedTK clas-sifier ensemble configurationfile
Table 2 Selected UCI datasets
dataset description number of elements number ofinput features
bcw Cell-based metrics for breast cancer 699 9
bcwd Diagnostic breast cancer Wisconsin database 569 30
btcat Carcinoma in breast tissue 106 9
echocard Data for classifying if patients will survive for at least one year after a heart attack 131 8
haber Survival of patients who had undergone surgery for breast cancer 306 3
heartsl Patient indicators for presence of heart disease 270 13
hepat Patient indicators for presence of hepatitis 155 19
liver BUPA Medical Research Ltd. database on liver desease 345 6
mmass Benign/malignant mammographic masses based on BI-RADS attributesand the patient’s age
961 5
park Oxford Parkinson’s Disease Detection Dataset 195 22
pgene E. Coli promoter gene sequences (DNA) with partial domain theory 106 57
pimadiab Patient indicators for presence of diabetes 768 8
spambase Classifying email as spam or not spam 4601 57
spectf Data on cardiac Single Proton Emission Computed Tomography (SPECT) images 267 44
tictac Binary classification task on possible configurations of tic-tac-toe game 958 9
J Med Syst
Tab
le3
Exp
loratio
nsummaryperengine
anddataset
engine
bcw
bcwd
btcat
echo
card
haber
heartsl
hepat
liver
mmass
park
pgene
pimadiab
spam
spectf
tictac
ffbp
configs
3220
7296
128
4816
4896
4818
6016
1236
CPU
hours
77.82
102.04
95.96
64.42
36.92
123.30
50.80
46.13
180.65
213.00
164.17
192.80
305.38
64.22
149.01
bestpct
86.59%
95.00%
74.40%
68.30%
69.82%
89.52%
88.63%
71.33%
83.73%
93.47%
89.09%
70.50%
78.76%
57.95%
81.10%
bestaz
0.86
00.94
30.72
90.68
00.71
70.90
80.88
40.69
50.84
90.94
20.88
90.68
20.77
90.59
80.79
9
ffbp
roc
configs
3220
7296
128
4816
4896
4818
6016
1236
CPU
hours
118.55
171.54
128.33
118.53
57.13
211.50
83.97
65.74
293.50
363.29
333.84
313.40
433.12
104.67
241.50
bestpct
90.17%
95.06%
80.40%
77.33%
73.93%
91.41%
89.11%
80.85%
91.74%
98.28%
93.38%
74.24%
82.90%
67.18%
88.06%
bestaz
0.88
90.95
80.81
90.74
40.71
80.93
20.87
30.81
70.91
30.99
10.91
80.71
50.82
30.64
60.87
5
ffrp
configs
44
44
44
44
44
42
24
4
CPU
hours
8.81
17.78
4.86
2.81
1.13
9.47
9.85
3.48
5.95
15.09
36.49
4.94
30.64
19.13
18.45
bestpct
81.41%
95.09%
80.07%
63.80%
62.72%
93.08%
92.33%
75.71%
88.43%
98.29%
94.36%
79.90%
83.63%
90.80%
88.64%
bestaz
0.80
40.96
60.78
60.61
40.63
40.90
70.93
90.77
20.89
00.97
00.92
10.81
30.80
90.88
50.89
9
ffrproc
configs
44
44
44
44
44
42
24
4
CPU
hours
13.70
31.10
7.04
4.57
1.84
12.78
15.25
4.64
11.60
23.57
65.80
7.93
57.74
34.45
24.60
bestpct
88.10%
96.47%
82.29%
81.06%
92.34%
93.12%
93.59%
80.02%
94.96%
98.19%
96.14%
81.73%
85.86%
93.74%
94.09%
bestaz
0.89
20.93
80.80
40.82
20.90
20.93
10.94
30.81
30.93
80.95
70.93
20.81
80.85
60.93
30.92
6
ffsa
configs
3218
6048
5436
1636
4836
1648
1624
32
CPU
hours
116.76
150.39
124.15
51.69
25.50
131.22
68.97
45.26
141.41
247.85
296.47
249.00
430.88
243.26
246.76
bestpct
97.14%
92.70%
90.56%
75.93%
82.17%
90.03%
94.69%
80.78%
95.23%
97.32%
88.50%
83.12%
80.42%
90.30%
84.91%
bestaz
0.93
30.90
10.82
20.77
00.82
20.90
10.93
70.81
80.93
90.96
70.89
00.80
90.79
30.91
00.86
7
ffsaroc
configs
3218
6048
5436
3236
4836
1648
1624
32
CPU
hours
131.53
147.65
148.70
71.76
35.25
166.53
197.77
55.38
195.51
328.29
289.83
328.65
599.21
259.80
259.39
bestpct
92.75%
95.04%
90.56%
85.90%
84.65%
96.30%
95.33%
81.62%
90.83%
98.03%
87.74%
82.41%
90.81%
90.83%
94.85%
bestaz
0.92
30.96
90.90
10.86
30.85
20.95
80.95
50.82
20.92
50.99
60.88
30.81
50.90
20.92
20.92
5
ffga
configs
2424
3632
2936
1624
3624
1236
612
24
CPU
hours
104.84
270.42
90.20
52.04
15.94
197.31
103.45
46.91
148.84
233.33
270.20
261.35
249.07
179.40
226.25
bestpct
82.26%
92.41%
77.94%
80.55%
82.01%
96.30%
87.63%
67.05%
88.50%
94.40%
73.37%
81.23%
68.69%
85.67%
72.57%
bestaz
0.86
50.93
60.77
00.80
80.80
70.99
40.87
70.68
70.87
00.96
00.75
10.80
10.69
80.84
50.74
ffgaroc
configs
2424
3632
2936
1624
3624
1236
612
24
CPU
hours
121.58
323.06
114.30
55.01
21.01
218.34
113.09
48.85
187.89
252.11
320.13
278.42
281.44
207.38
271.21
bestpct
86.77%
96.89%
80.21%
82.57%
81.74%
92.91%
87.19%
76.04%
92.98%
96.52%
80.27%
83.35%
78.68%
86.86%
80.49%
bestaz
0.85
40.95
50.78
60.83
50.82
60.94
40.87
50.77
00.90
00.97
70.78
00.80
80.76
60.85
40.82
2
c-svc
configs
4848
256
256
256
160
128
256
4825
625
619
248
256
256
CPU
hours
0.92
0.86
0.67
0.83
1.98
1.23
0.53
2.11
1.17
1.54
0.68
3.59
5.01
1.70
7.37
bestpct
97.14%
97.65%
90.33%
86.60%
93.75%
94.71%
95.25%
80.26%
92.34%
97.67%
93.16%
82.25%
91.93%
93.38%
95.71%
J Med Syst

which, for each column, the researcher specifies whatcriteria to follow to select binary classifiers. With bestPct,the binary classifier for that column with best classificationrate for test data is used. With bestAz, the one with best areaunder the ROC curve measure for test data is chosen. Anumber (such as in the mas column) refers to the ID of aspecific binary classifier present in the database that theresearcher wants to use. With any, we instruct BiomedTKto try all binary classifiers available for that column.
Experimental setup
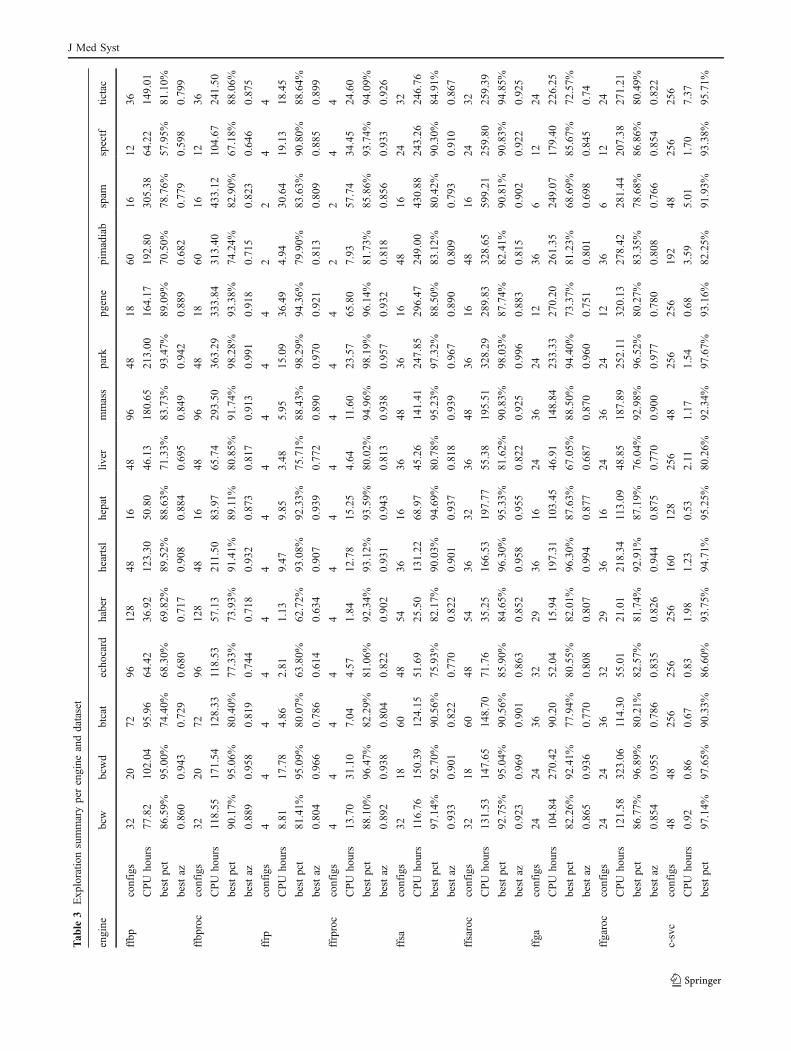
A set of experiments was setup in order to show thecontribution of the proposed method to researchers’efficiency and experimental reach. Our aim was todemonstrate how (1) complex experiments consisting ofseveral datasets, engines and classifier configuration can bemanaged with relative simplicity and (2) the Grid resourcesrequired to execute the proposed experiments (about 16,000CPU hours) could be exploited in an efficient manner.Therefore, we set forth to use BiomedTK to find classifiersto selected biomedical datasets from the UCI machinelearning repository [22] by exploiting Grid computingresources, and aiming at reaching, in reasonable time,accuracy levels comparable to the ones found in differentliterature sources for the given datasets. By being able toobtain efficiently these results, we are then positioned topursue research in a timely manner using the methodsherewith described. We selected the UCI datasets shown inTable 2 and defined increasingly larger explorations foreach dataset including all engines supported by BiomedTK(see Table 1). The Area under the ROC Curve (ROC Az)measures the capability of a binary classifier to correctlydistinguish positive from negative instances, even if theirscores are away from the ideal ones. BiomedTK allowsevaluating classifier ROC Az and we use it to test ourown modifications to existing classifiers by allowingthem to optimize ROC Az and not only accuracy. This isthe reason behind choosing all datasets binary (with onlytwo classes). Explorations for each dataset includedmany classifier configurations (see Table 3), eachconfiguration using different classifier parameters, ANNlayers, neurons per layer, etc. Each exploration was tunedfor each dataset to account for their different character-istics. For instance, the input layer of any ANN must haveas many neurons as dataset features, datasets harder toclassify might require exploring more configurations,larger datasets require more training time so explorationscannot be as large, etc.
The selected UCI datasets were imported from a CSVformatted file and basic data normalization was performedby BiomedTK before the explorations. This consisted inmapping each input feature to the [0,1] interval in theT
able
3(con
tinued)
engine
bcw
bcwd
btcat
echo
card
haber
heartsl
hepat
liver
mmass
park
pgene
pimadiab
spam
spectf
tictac
bestaz
0.93
00.97
70.81
50.86
40.94
00.93
10.95
10.80
40.93
90.95
30.95
20.81
00.91
90.93
50.93
1
nu-svc
configs
4848
256
256
256
160
128
256
4825
625
619
248
256
256
CPU
hours
0.86
0.83
0.64
2.00
2.18
1.02
0.49
2.57
1.11
1.18
0.73
4.35
4.49
1.95
6.02
bestpct
96.91%
96.64%
89.40%
84.70%
93.75%
95.47%
96.44%
81.01%
95.83%
96.94%
95.62%
81.14%
88.55%
93.20%
96.24%
bestaz
0.92
40.96
20.81
20.85
70.93
10.94
40.95
70.81
40.96
50.96
20.94
60.80
90.89
40.94
70.94
7
total
configs
280
228
856
872
942
568
376
736
464
736
612
676
176
616
704
total
CPU
hours
695.38
1215
.67
714.87
423.65
198.89
1072
.72
644.16
321.06
1167
.61
1679
.26
1778
.35
1644
.43
2396
.98
1115
.97
1450
.55
bestaz
overall
0.93
30.97
70.90
10.86
40.94
00.99
40.95
70.82
20.96
50.99
60.95
20.81
80.91
90.94
70.94
7
bestpct
overall
97.14%
97.65%
90.56%
86.60%
93.75%
96.30%
96.44%
81.62%
95.83%
98.29%
96.14%
83.35%
91.93%
93.74%
96.24%
bestpct
inliterature
98.94%
82.33%
86%
90.9%
80.48%
89.5%
93.51%
72.5%
0.89
095
.8%
91.5%
81.83%
93.88%
82.8%
90.9%
J Med Syst

following way: for each element of a dataset the value vi offeature i was normalized to v
0i ¼ vi
Maxi�Miniwhere Mini and
Maxi are the minimum and maximum values of feature i inall elements of the dataset.
The gLite infrastructure at CETA-CIEMAT with 200CPU cores was used for this experiment. For each dataset, afew explorations were made on a local machine beforesending larger explorations to gLite. This was done toacquire a sense on how much computing time eachclassifier configuration would take, what results could beexpected and how large explorations would need to be. Forinstance, a dataset whose instances are easily separable(such as the BCW dataset) would start giving goodclassification results even with simple classifier configu-rations and one would expect minor improvements from alarger exploration.
Our results were compared mostly with those foundin [43–57]. We did not aim to make an exhaustiveliterature review, but to sample referenced works andreach comparable results to demonstrate the utility of theMLC exploration method and its underlying tool (Bio-medTK). Experimental conditions change betweenauthors in validation methods used, how results aresummarized, etc. so comparisons must be carefullyinterpreted. To be as coherent as possible with thedifferent setups, we used 10-fold cross validation.Furthermore, in some works it is not clear what specificclassifier configuration or validation method was used,which somehow also constitutes a challenge in ourexploration endeavor.
Results
A total of about 16,000 CPU hours were consumed to train8,842 different classifier configurations over 15 datasets.Table 3 shows, for each dataset and engine: (1) how manyconfigurations were trained, (2) how many CPU hours tookto train them, (3) the best percentage of elements correctlyclassified on the test part of the dataset (accuracy), and (4)the best ROC Az obtained on the test part of the dataset.Finally, the bottom lines in Table 3 show the best resultsobtained overall in our exploration (accuracy and ROC Az)and those found in our literature review (accuracy in alldatasets, except the mmass dataset, where reference [54]gave their results in ROC Az). Figure 5 shows the twoROC curves generated by BiomedTK for one classifierconfiguration over the BCW dataset. The curve on the leftcorresponds to the Mann–Whitney statistic and the curve onthe right is its smoothed version using the bi-normaldistribution method from JLABROC.
Note that for some datasets we made a larger explorationthan for others, as we had to make more explorationrefinement cycles until we found satisfactory results. A keyfactor was acquiring a notion on the requirements ofcomputing time for each classifier and dataset so thatexplorations can be adjusted to the available computingresources. Observe in this sense how datasets with largernumber of elements or input features take longer time totrain with ANN engines and, were not for the possibility toharness Grid computing resources, exploring even a fewclassifier configurations for them would simply be impos-
Fig. 5 Binormal smoothed and Mann–Whitney ROC Curves as produced by BiomedTK for the ANN-genetic algorithm classifier configurationwith best ROC Az over the BCW dataset
J Med Syst

sible. Without an appropriate supporting tool, following themethod herewith proposed requiring such large explorations,would imply, on one side, providing the logistics to managedifferent output formats for the different underlying engines,organize binaries for gLite infrastructure, etc. Then, it wouldrequire preparing gLite jobs for each dataset and engine type,monitor their execution, keeping accounting of failed jobs andresubmitting them, gather different outputs for each job andconsolidate them in a single file or database, etc. It is thereduction of the effort cost of taking care of all these logisticsthat makes it possible to efficiently harness Grid resources formachine learning in a systematic way.
In practical terms, for each dataset a single explorationconfiguration file was defined, containing the specificationfor all configurations for each engine used (very similar tothe one showed in Fig. 2). Each exploration file was firstused to make a few explorations in our desktop machines,then parameters sets were fine tuned and enlarged and,finally, sent to the Grid. From a researcher point of view, inaddition to the large amount of CPU hours managed withreasonable effort, the proposed method is easily reproduc-ible rendering classifier exploration requiring large com-puting resources a systematic task. This allows researchersto focus on their core research, devising explorationstrategies, evaluating dataset preprocessing algorithms,new classification methods, etc. instead of sorting out thelogistics of access methods to Grid infrastructures, prepar-ing datasets differently for each third party engine, etc. Infact, this method has enabled the authors to validate themodifications made to the Encog engines for ROCoptimization with satisfactory results [23].
Discussion
This paper described a method to efficiently harnesscomputing power serviced by different Grid infrastructuresfor building biomedical machine learning classifiers, alongwith its supporting tool, BiomedTK. Together, theydemonstrated be robust and efficient for exploring searchspaces of possible configurations of machine learningclassifiers provided by arbitrary third party toolkits, usingGrid computing resources in an agile manner. With thismethod, exploring large sets of configurations of machinelearning classifiers with different data sources and thirdparty classifier toolkits becomes a task that can beaccomplished in reasonable and predictable time, openingthe way to systematic experimentation on many of theissues around machine learning for biomedical data analysis(classifier and algorithm design, data analysis, preprocess-ing, etc.) In this sense, it has served the authors to validatethe introduction of ROC based optimization in existingalgorithms.
At present our work is centered in two aspects. First, wewant to use the BiomedTK framework to find goodperforming classifiers in a real hospital environment wherea digital repository for breast cancer is currently beinggathered at Hospital São João - Faculty of Medicine ofPorto University, in Portugal, in the context of the currentcollaboration between INEGI and CETA-CIEMAT throughwhich CAD methods are being built to assist on breastcancer diagnosis [3, 21]. Second, tuning classifier param-eters is mostly a heuristic task, not existing rules providingknowledge about what parameters to choose when traininga classifier. Through BiomedTK we are gathering dataabout performance of many classifiers, trained each onewith different parameters, ANNs, SVM, etc. This by itselfconstitutes a dataset that can be data mined to understandwhat set of parameters yield better classifiers for givensituations or even generally. Therefore, we intend to useBiomedTK on this bulk of classifier data to gain insight onclassifier parameter tuning.
Acknowledgements This work is part of the GRIDMED researchcollaboration project between INEGI (Portugal) and CETA-CIEMAT(Spain). Prof. Guevara acknowledges POPH - QREN-Tipologia 4.2–Promotion of scientific employment funded by the ESF and MCTES,Portugal. CETA-CIEMAT acknowledges the support of the EuropeanRegional Development Fund
References
1. Ramos-Pollan, R., et al., “Exploiting eInfrastructures for medicalimage storage and analysis: A Grid application for mammographyCAD,” in The Seventh IASTED International Conference onBiomedical Engineering. Austria: Innsbruck, 2010.
2. Drakos, J., et al., A perspective for biomedical data integration:Design of databases for flow cytometry. BMC Bioinform. 9:99,2008.
3. Ramos-Pollan, R., et al., “Grid computing for breast cancer CAD.A pilot experience in a medical environment,” in 4th Iberian GridInfrastructure Conference. Portugal: Minho, pp. 307–318, 2010.
4. Blanquer Espert, I., et al., Content-based organisation of virtualrepositories of DICOM objects. Future Generation Comput. Syst.25:627–37, 2009.
5. KaraçalI, B., Quasi-supervised learning for biomedical dataanalysis. Pattern Recognit. 43:3674–82, 2010.
6. Peng, Y., et al., A novel feature selection approach for biomedicaldata classification. J. Biomed. Inform. 43:15–23, 2010.
7. López, Y., et al., “Breast Cancer Diagnosis Based on a SuitableCombination of Deformable Models and Artificial NeuralNetworks Techniques.” in Progress is Pattern Recognition, ImageAnalysis and Applications. Lect. Notes Comput. Sci. 4756/2007:803–811, 2007.
8. López, Y., et al., “Computer aided diagnosis system to detectbreast cancer pathological lesions,” in Progress in PatternRecognition, Image Analysis and Applications. Volume 5197/2008, ed. Berlin, Heidelberg: Springer, pp. 453–460, 2008.
9. The Globus Alliance and Middleware. Available: http://www.globus.org/
10. The gLite middleware. Available: http://glite.web.cern.ch11. The European Grid Initiative (EGI). Available: http://www.egi.eu
J Med Syst

12. EGI Availability/Reliability results for October 2010. Available:https://documents.egi.eu/public/ShowDocument?docid=238
13. Halling-Brown, M., et al., A computational Grid framework forimmunological applications. Philos. Transact. Series A Math.Phys. Eng. Sci. 367:2705–16, 2009.
14. Kacsuk, P., “Extending the services and sites of production gridsby the support of advanced portals” in Proceedings of HighPerformance Computing for Computational Science - VECPAR2006. Rio de Janeiro, Brazil: pp. 644–655, 2007.
15. Schwiegelshohn, U., et al., “Perspectives on grid computing,” inDagstuhl Seminar Proceedings. Leibniz: 2009.
16. Grid Computing: A Vertical Market Perspective 2006–2011.Available: http://www.insight-corp.com/reports/grid06.asp
17. The DIRAC project. Available: http://lhcbweb.pic.es/DIRAC/18. Bagnasco, S., et al., AliEn: ALICE environment on the GRID. J.
Phys. Conf. Ser. 119:062012, 2008.19. Ramos-Pollan, R., et al., “Grid-based architecture to host multiple
repositories: A mammography image analysis use case,” in 3rdIberian Grid Infrastructure Conference Proceedings. Valencia,Spain: pp. 327–338, 2009.
20. Ramos-Pollan, R., et al., “Building medical image repositoriesand CAD systems on grid infrastructures: A Mammograms Case,”in 15th edition of the Portuguese Conference on PatternRecognition. Aveiro, Portugal: University of Aveiro, 2009.
21. Ramos-Pollan, R., and Guevara, M., “Grid infrastructures fordeveloping mammography CAD systems” in 32nd AnnualInternational Conference of the IEEE Engineering in Medicineand Biology Society. Argentina: Buenos Aires, 2010.
22. Frank, A., and Asuncion, A., UCI Machine Learning Repositoryhttp://archive.ics.uci.edu/ml. Irvine, CA: University of California,School of Information and Computer Science, 2010.
23. Ramos Pollan,R., et al., “Introducing ROC curves as errormeasure functions. A new approach to train ANN-based biomed-ical data classifiers,” in 15th Iberoamerican Congress on PatternRecognition. Sao Paolo, Brasil: 2010.
24. Heaton, J., “Programming neural networks with encog 2 in Java,”ed.: Heaton Research, Inc, 2010.
25. Chang, C.-C., and Lin, C.-J., LIBSVM: a library for support vectormachines. Available: http://www.csie.ntu.edu.tw/~cjlin/libsvm, 2001.
26. Yoon, H. J., et al., Evaluating computer-aided detection algo-rithms. Med. Phys. 34:2024–38, 2007.
27. Fawcett, T., An introduction to ROC analysis. Pattern Recognit.Lett. 27:861–74, 2006.
28. John Eng, M. D., ROC analysis: web-based calculator for ROCcurves. Available: http://www.jrocfit.org, 2006.
29. Mark Hall, et al., “The WEKA data mining software: An update,”SIGKDD Explorations, vol. 11: 2009.
30. Cortes, C., and Mohri, M., AUC optimization vs. error rateminimization. Adv. Neural Inf. Process. Syst. 16:313–20, 2004.
31. Kim, J.-H., Estimating classification error rate: Repeated cross-validation, repeated hold-out and bootstrap. Comput. Stat. DataAnal. 53:3735–45, 2009.
32. Efron, B., and Gong, G., A leisurely look at the bootstrap, thejackknife, and cross-validation. Am. Stat. 37:36–48, 1983.
33. Efron, B., Estimating the error rate of a prediction rule:Improvement on cross-validation. J. Am. Stat. Assoc. 78:316–31,1983.
34. The H2 Database Engine. Available: http://www.h2database.com35. Dietterich, T. G., “Ensemble methods in machine learning,”
presented at the Proceedings of the First International Workshopon Multiple Classifier Systems. 2000.
36. Bose, R., and Ray-Chaudhuri, “On a class of error-correcting binarygroup codes,” Information Control. vol. 3: pp. 68–79, 1960.
37. Hocquenghen, A., Codes correcteurs d’erreurs. Chiffres 2:147–56,1959.
38. Dietterich, T., and Bakiri, G., “Error-correcting output codes: Ageneral method for improving multiclass inductive learning pro-grams,” in Proceedings of the Ninth National Conference onArtificial Intelligence (AAAI-91). Anaheim, CA: pp. 572–577, 1991.
39. Passerini, A., et al., New results on error correcting output codesof kernel machines. IEEE Trans. Neural Net. 15:45–54, 2004.
40. Escalera, S., et al., Subclass problem-dependent design for error-correcting output codes. IEEE Trans. Patt. Anal. Mach. Intell.30:1041–54, 2008.
41. Huiqun, D., et al., “Error-correcting output coding for theconvolutional neural network for optical character recognition,”in Document Analysis and Recognition, 2009. ICDAR’09 10thInternational Conference on 2009. pp. 581–585, 2009.
42. Escalera, S., et al., “Coronary damage classification of patientswith the Chagas disease with error-correcting output codes,” inIntelligent Systems, 2008. IS’08. 4th International IEEE Confer-ence. pp. 12-17-12-22, 2008.
43. Urbanowicz, R. J., and Moore, J. H., Learning classifier systems:a complete introduction, review, and roadmap. J. Artif. Evol. App.2009:1–25, 2009.
44. Kotsiantis, S., et al., Machine learning: a review of classificationand combining techniques. Artif. Intell. Rev. 26:159–90, 2006.
45. Lorena, A. C., et al., A review on the combination of binaryclassifiers in multiclass problems. Artif. Intell. Rev. 30:19–37, 2008.
46. Soares, C., “Is the UCI repository useful for data mining?” inProgress in Artificial Intelligence. vol. 2902, ed. Berlin, Heidel-berg: Springer, pp. 209–223, 2003.
47. Estrela da Silva, J., et al., Classification of breast tissue byelectrical impedance spectroscopy. Med. Biol. Eng. Comput.38:26–30, 2000.
48. Sebban, M., et al., Stopping criterion for boosting based datareduction techniques: From binary to multiclass problem. J. Mach.Learn. Res. 3:863–85, 2003.
49. Wilson, D. R., and Martinez, T. R., “Improved center pointselection for probabilistic neural networks,” in Proceedings of theInternational Conference on Artificial Neural Networks andGenetic Algorithms, (ICANNGA’97). pp. 514–517, 1997.
50. Jiang, Y., and Zhou, Z.-H., Editing training data for knn classifierswith neural network ensemble. Lect. Notes Comput. Sci.3173:356–61, 2004.
51. Fung,G., et al., “A fast iterative algorithm for fisher discriminantusing heterogeneous kernels,” in Proceedings of the twenty-firstinternational conference on Machine learning. Alberta, Canada:Banff, p. 40, 2004.
52. Vlachos,M., et al., “Non-linear dimensionality reduction techniquesfor classification and visualization,” in Proceedings of the eighthACM SIGKDD international conference on Knowledge discoveryand data mining. Edmonton, Alberta, Canada, pp. 645–651, 2002.
53. Esmeir, S., and Markovitch, S.,“Lookahead-based algorithms foranytime induction of decision trees,” in Proceedings of the twenty-first international conference on Machine learning. Alberta,Canada: Banff, p. 33, 2004.
54. Elter, M., et al., The prediction of breast cancer biopsy outcomesusing two CAD approaches that both emphasize an intelligibledecision process. Med. Phys. 34(11):4164–72, 2007.
55. Little, M. A., et al., Suitability of dysphonia measurements fortelemonitoring of Parkinson’s disease. IEEE Trans. Biomed. Eng.56:1015–22, 2009.
56. Li, J., and Wong, L., “Using rules to analyse bio-medical data: Acomparison between C4.5 and PCL,” in Advances in Web-AgeInformation Management. vol. 2762, ed. Berlin, Heidelberg:Springer, pp. 254–265, 2003.
57. Domeniconi, C., and Yan, B., “Nearest neighbor ensemble,” inProceedings of the Pattern Recognition, 17th International Confer-ence on (ICPR’04) Volume 1 - Volume 01. pp. 228–231, 2004.
J Med Syst