The Evolution of 8260
61
The Evolution of 8260
-
Upload
khangminh22 -
Category
Documents
-
view
3 -
download
0
Transcript of The Evolution of 8260

The Evolution of 8260
1 O ve r v i e w o f 8 2 6 0
2 A u t o m a t e d S a m p l i n g a n d P u r g e / Tr a p A d va n c e m e n t s
3 G C / M S A d va n c e m e n t s
4 U t i l i z i n g A d va n c e m e n t s f o r I n d u s t r y N e e d s
A G E N D A

QUICK OVERVIEW OF EPA METHOD 8260
Volatile Organic Compounds (VOCs) by Gas Chromatography-Mass Spectrometry
-- Applicable to nearly all types of samples regardless of water content
-- Able to analyze over 100 different compounds
-- Various techniques for sample introduction
• Direct Injection• Cryofocusing• Headspace• Purge/Trap* (EPA Method 5030 for water and 5035 for soils)
*Will focus on Purge and Trap technique for this presentation

Overview of 8260 continued Definition of Purge/Trap:
• An inert gas is bubbled through a portion of the aqueous sample at ambient temperature and the volatile components are efficiently transferred from the aqueous phase to the vapor phase. The vapor is swept through a sorbent column (trap) where the volatile components are adsorbed. After purging is completed, the sorbent column is heated and backflushed with inert gas to desorb the components onto a gas chromatographic column.
• For soils: An aliquot of the extract prepared in Method 5035 is combined with organic free reagent water in the purging chamber. It is then analyzed by purge-and-trap GC or GC/MS following the normal aqueous method.
--Simple schematic of Purge and Trap
• An analytical technique designed to efficiently extract VOCs from a matrix and concentrate them for transfer onto a GC analytical column without sacrificing peak shape, recovery, or accuracy.
How is that extraction done?
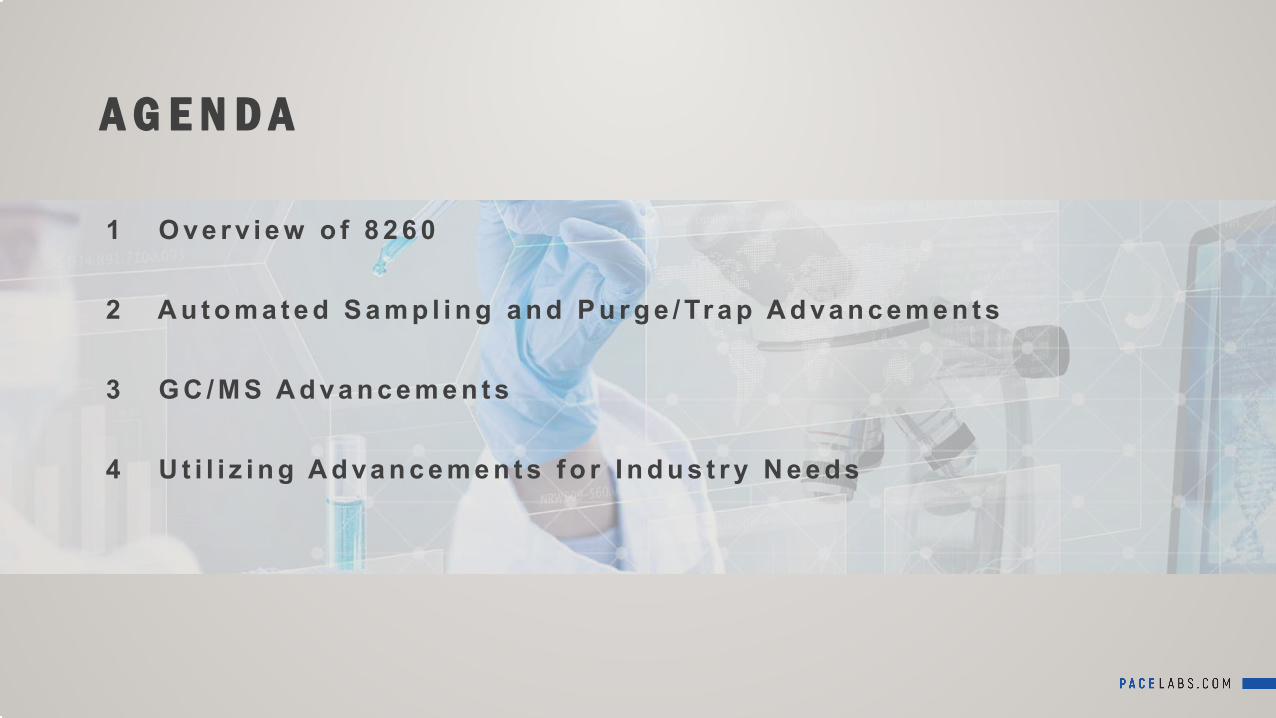
Overview of 8260 Continued
Issues with 8260 by Purge and Trap:• Water
• Poor performers/Problem compounds
• Inert Gas
• Time

HOW DO WE OVERCOME MANY OF THE ISSUES THAT HAVE PLAGUED METHOD 8260?

L o o k i n g a t I m p r o v e m e n t s i n c h e m i c a l t e s t i n g e q u i p m e n t T e c h n o l o g y

A u t o m a t e d S a m p l i n g a n d P u r g e / T r a p A d v a n c e m e n t s

Automated Sampling has come a long way…
Tekmar ALS 2016 Varian/OI Archon Tekmar SolaTEK 72 Tekmar Aquatek 70
Tekmar Aquatek 100 Tekmar Atomx EST Centurion Tekmar Aquatek LVA

Automated Sampling Advancements
• No longer have to hand load samples into sparge tubes• In-line “Ink Jet” style Internal Standard and Surrogate addition • Sample capacity has increased. • Dual sample type automated samplers can run water or soil
samples (purge in vial).• In-line sample dilution capabilities. • In-line sample pH recording• Time saved on sample transfer with latest software that easily
communicates between sampler and GC/MS• More efficiently engineered automated samplers• Can use nitrogen as a carrier gas. • Scheduling and keeping track of sample runs has been made
easier

Tekmar 3000 Tekmar 3100 Tekmar Stratum Tekmar Lumin
OI Eclipse 4550 OI Eclipse 4650 OI Eclipse 4750 EST Encon EST Evolution EST Evolution 2
From the Sampler to the Concentrator…

Sample Concentrator Advancements
• Moisture Management Removing water from the sampling process is one of the biggest keys to getting good chromatography. --Concentrator moisture trapping systems have evolved over time to increase water removal during the desorbing process that sends the sample to the GC.
--Sorbent trap material has also become better at retaining problem compounds and keeping samples moisture free.
--Heated zone control has become more advanced with upgraded software capable for controlling and monitoring all areas of the concentrator that require high temps to keep moisture out of the concentrating process.--Bake program capabilities that allow time and bake flows to be set to help reduce carryover and keep the system moisture free.

Sample Concentrator Advancements
• FLOW CONTROL AND THE USE OF NITROGEN AS A PURGE GAS --Flow control is no longer manual and is controlled electronically, allowing for leak checking and trouble shooting through software that monitors flow. --Concentrators have settings to use Nitrogen as a purging/carrier gas. This allows labs to save on Helium usage. --Flow control has allowed for quicker more efficient purge times. Higher purge flow equals lesser purge time. Decreases run time and increases sample capacity. Studies have shown that increasing flow and reducing purge time has minimal effect on compound recoveries.
https://nemc.us/docs/2018/presentations/pdf/Friday-Topics%20in%20Drinking%20Water-28.4-Jurek.pdf https://nemc.us/docs/2018/presentations/pdf/Friday-Topics%20in%20Drinking%20Water-28.4-Jurek.pdf

Sample Concentrator Advancements • Updated Software
EST concentrator software

Other upgrades
Sample Concentrator Advancements
Heated Purge --Allows sample to remain same temperature regardless of room temperature. Temperature fluctuations during purge step can affect recovery of compounds.
Foam Detection --A sensor in the sparge tube will detect if a sample begins to foam and fill the sparge tube which can be detrimental to a concentrator. Once detected, it shuts the concentrator and autosampler down.
Hot Water Rinse --Concentrators are now capable of rinsing the sparge tube with hot water from a reservoir that is included on the concentrator. This helps reduce carry over and keep the sparge tube clean.
Smaller and better engineered designs --Newer concentrators are smaller, which takes up less bench space, and even stackable (Lumin). Sample pathways have also been reduced, making troubleshooting and maintenance much easier.

G C / M S A D V A N C E M E N T S
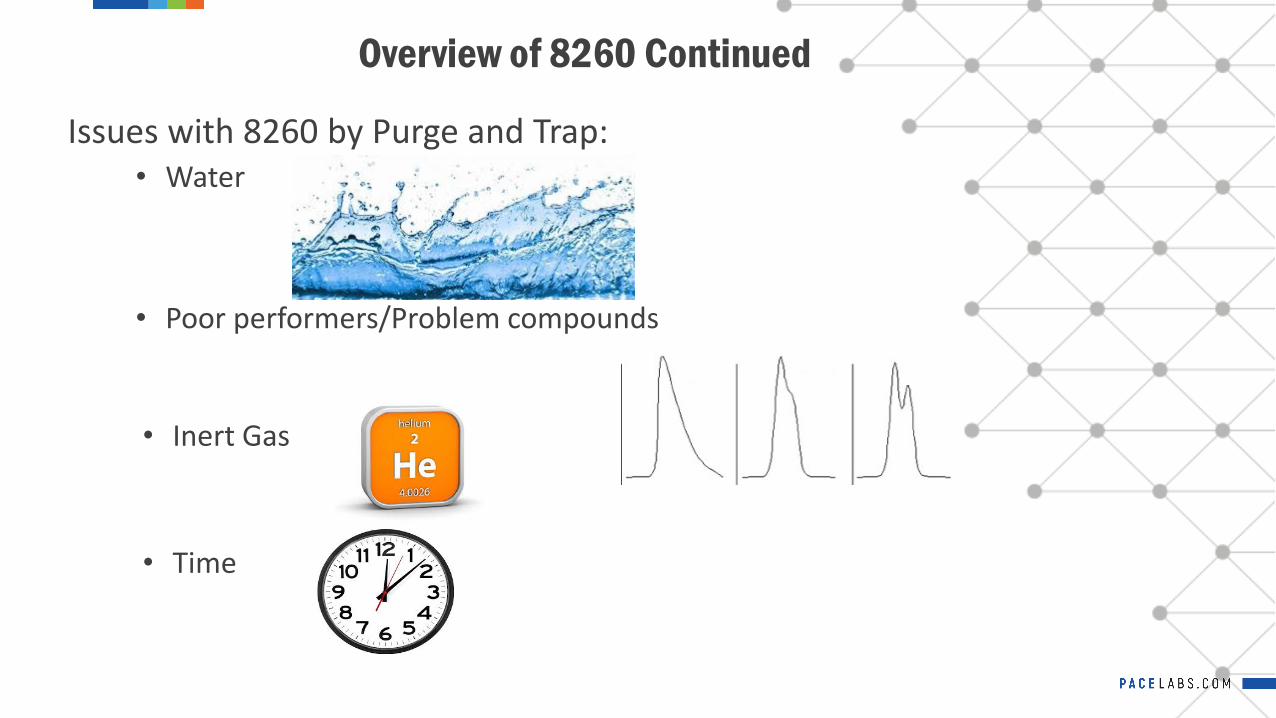
Desorbed to the GC…
HP/Agilent 4890 HP/Agilent 5890 HP/Agilent 6820
Agilent 6850 Agilent 6890 Agilent 7890
Desorbed to the GC….

Agilent Intuvo 9000 Agilent 8890
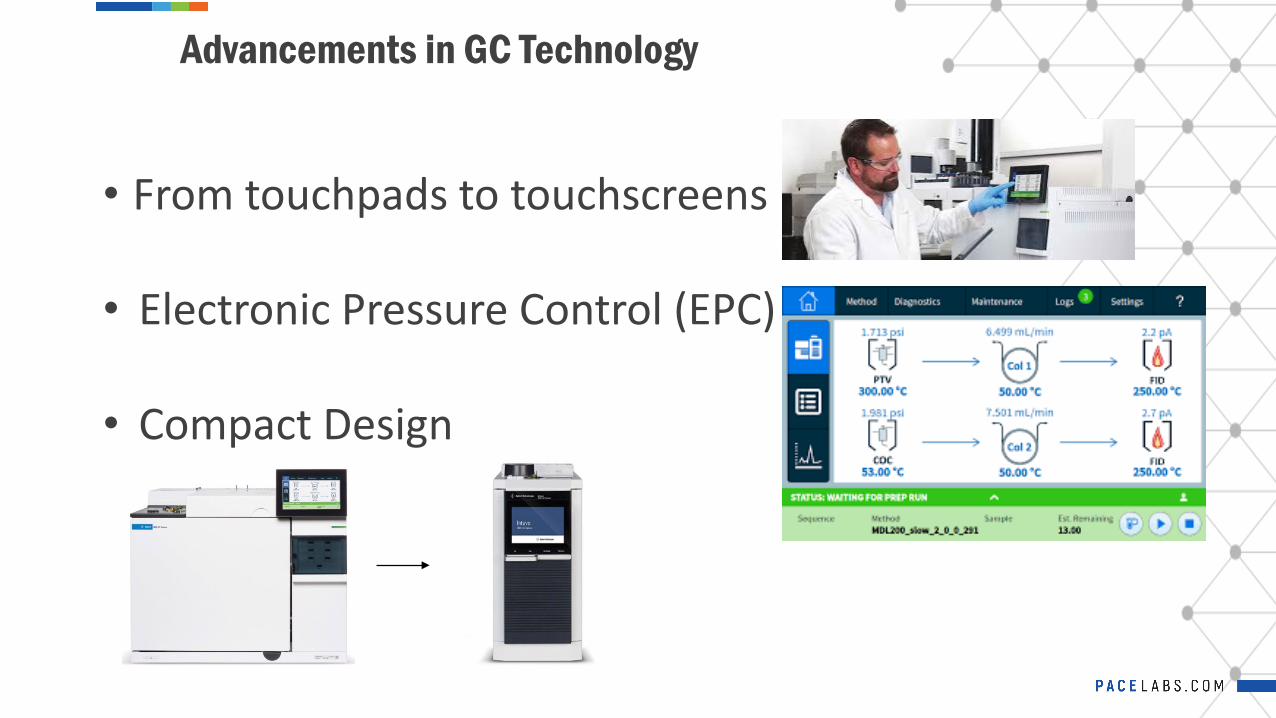
Advancements in GC Technology
• From touchpads to touchscreens
• Electronic Pressure Control (EPC)
• Compact Design

Advancements in GC technology
• Networking Capabilities
• Software upgrades
• Injection port design

Advancements in GC Consumables
Injection Port Liners
--Liners have become more inert and proprietary coatings have
helped with compound recovery and chromatography
Columns
--Advancements in column production have allowed for micro capillary
sizes and widths. Capillary column coatings have also been optimized
specifically for method 8260.
--Shorter length columns have decreased GC run times.
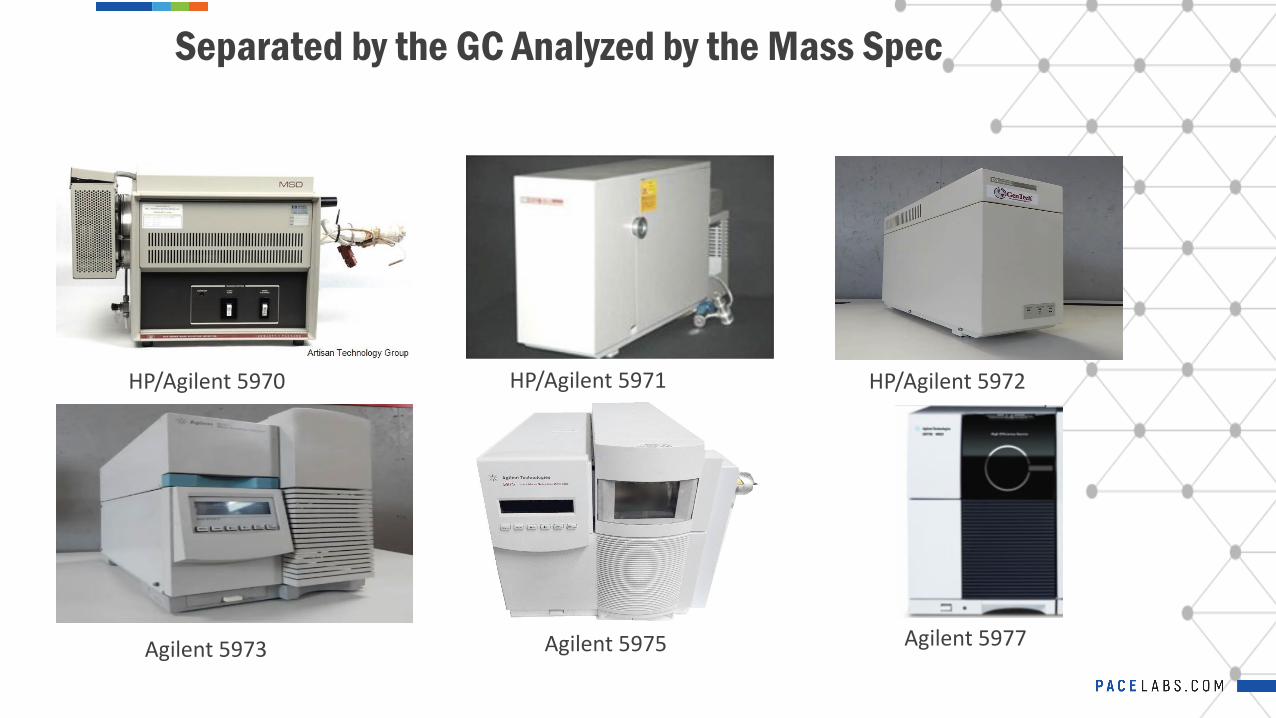
Separated by the GC Analyzed by the Mass Spec
HP/Agilent 5970 HP/Agilent 5971 HP/Agilent 5972
Agilent 5973 Agilent 5975 Agilent 5977

Advancements in Single Quadrupole Mass Spec Technology
In the last few decades, improvements in mass spectrometry (MS) have continued to improve drastically. Changes in quantitative accuracy, MS resolution, and data processing abilities have helped push the environmental testing industry to new heights.

Advancements in Single Quadrupole Mass Spec Technology
o Stainless Steel --Source will work for method 8260, but advancement in source types have had great effects in testing efficiency for the method.
o Inert Ion Source --For high sensitivity and accurate quantitation the sample path must be highly inert including the detector surfaces. This source offers added inertness.
o Extractor EI Source --Has an extractor lens in place of a draw out plate made of inert material, providing enhanced response for active compounds and late eluters, and maximum, ultra-trace level sensitivity.
Source Improvements
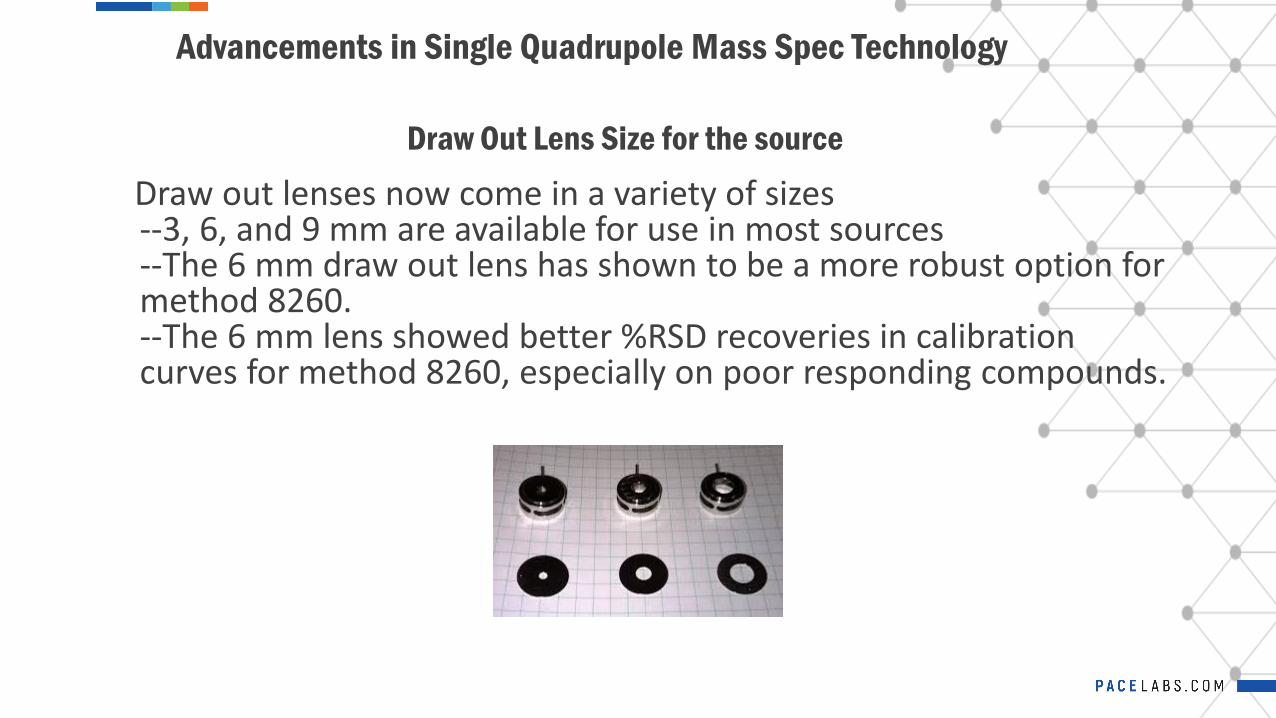
Draw Out Lens Size for the sourceDraw out lenses now come in a variety of sizes--3, 6, and 9 mm are available for use in most sources--The 6 mm draw out lens has shown to be a more robust option for method 8260. --The 6 mm lens showed better %RSD recoveries in calibration curves for method 8260, especially on poor responding compounds.
Advancements in Single Quadrupole Mass Spec Technology

Draw out lens size study results
Advancements in Single Quadrupole Mass Spec Technology
Method Optimization App Note.docx; 24-Mar-09 Teledyne Tekmar

Advancements in Single Quadrupole Mass Spec Technology
• Triple Axis Detector Electron Multiplier --At a given operating gain, the new detector provides higher signal intensity by collecting more ions emerging from the quadrupole.--Although signal is enhanced, neutral noise is substantially reduced through the off-axis design.--Detector lifetime is also increased under proper operation.
• Provides many benefits during analysis --Enhanced detection limits--Increases in compound relative response ratios--Calibration curves with greater slopes --Lower tuning voltages, increasing lifetime of multiplier
Electron Multiplier Advancements

Advancements in Single Quadrupole Mass Spec Technology
Electron Multiplier Advancements
Electron Multiplier Triple Axis Detector Electron Multiplier
Signal to noise difference with Triple Axis Detector (dark black line)
Other Upgrades
Advancements in Single Quadrupole Mass Spec Technology
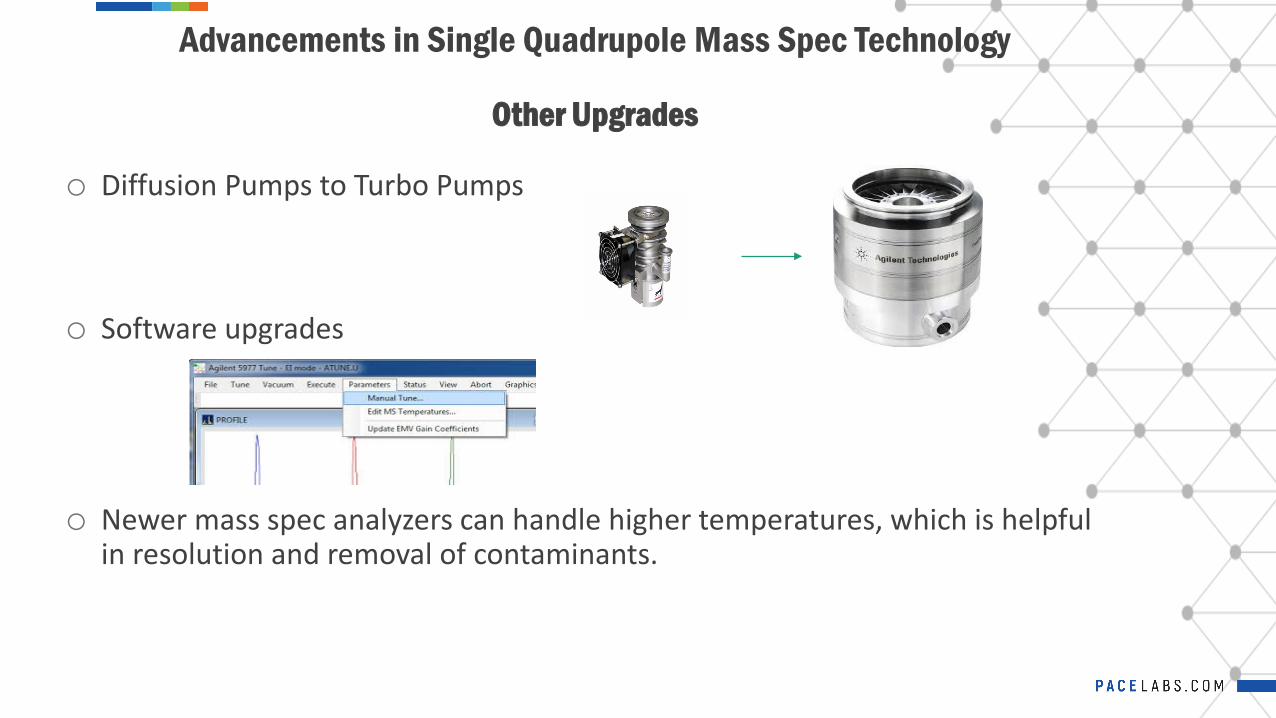
o Diffusion Pumps to Turbo Pumps
o Software upgrades
o Newer mass spec analyzers can handle higher temperatures, which is helpful in resolution and removal of contaminants.

Other upgrades
Advancements in Single Quadrupole Mass Spec Technology
GC/MS transfer line
Source cleaning procedures and materials
Magnetic Rough Pumps
Mass production

WHAT DO ALL THESE TECHNOLOGICAL ADVANCEMENTS
MEAN FOR METHOD 8260?

Utilizing Advancements for Industry Needs
• Improvements in automated sampling, sample concentrators, and GC/MS throughout
the years has led regulators to lower reporting limits on a number compounds. --Most labs now calibrate at sub part per billion (ppb) levels for all compounds.

Utilizing Advancements for Industry Needs
Optimizing run times by using all advancements in technology
• Taking advantage of software to make sure sampler and concentrator are operating in sync, decreasing time between sampling
• Shortening purge times by optimizing purge flow
• Decreasing desorb time to minimize the amount of moisture going into the GC
• Using advancements in consumables to optimize recovery and continually keep system free of contaminants
• Exploiting column advancements to decrease run times and optimize compound separation

• Average run time throughout network between 14-20 minutes per sample for 8260 analysis. Ideally 80-100 samples per instrument per day.
Utilizing Advancements for Industry Needs
Optimizing run times by using all advancements in technology
Image of concurrent sequence runs showing a 14-minute sample to sample time.

Utilizing Advancements for Industry Needs
Helium Gas Usage ReductionApplying automated sampler and concentrator Nitrogen gas
options for carrier and purge gas use Optimizing methods to reduce flow of Helium during sample runsEmploying the Gas Saver option on sample runs to reduce Helium
usageUpdated EPC’s reduce Helium loss, optimize flows and help keep
instrumentation clean from contamination.

Utilizing Advancements for Industry Needs
• By leveraging the technical advancements now available for chemical testing equipment specific to method 8260 Pace Analytical has created a method to eliminate running low level soils that directly purge in vial.
• Why is this significant? --Increases productivity, both in the lab and in the field
--Reduces turn around time (hold time from 2 days to 14 days)--Improve data quality
--Reduces overall carbon footprint
Pace Analytical offers “EZ Soil”
ConclusionEvolution of 8260
Using the advances made in testing equipment, instrumentation and consumables we have been able to enhance method 8260 to be more efficient, provide better data, and reduce our footprint. As the industry pushes towards more production and lower compound report limits, we have been able to leverage the progress made on testing equipment to increase sample loads and look lower than we ever have before. The evolution of 8260 has been a direct response of increasingly changing technology and the environmental testing world’s needs.
Questions? Comments?

US EPA Method 524.2: Measurement of Purgeable Organic Compounds in Drinking Water by Agilent 8860/5977B GC/MSD
Bruce D. Quimby, Ph.D.Senior GC/MS Applications ScientistAgilent TechnologiesWilmington, Delaware
1 DE.44140.5720486111

2
EPA 524.2 requires the use of purge and trapPurge and Trap vs. Headspace Analysis for VOCs
DE.44140.5720486111

EPA method 524.2 provides procedures and requirements for the quantitationof VOCs in surface water, ground water, and drinking water by GC/MS
Four specific groups of VOCs• Trihalomethanes (THMs)
• Gases
• Aromatics
• Products of dehydrohalogenation
Dichlorodifluoromethane Methyl acrylate Toluene 1,4-Dichlorobut-2-ene
Chloromethane Bromochloromethane trans-1,3-Dichloropropene PropylbenzeneChloroethene Methylacrylonitrile Ethyl methacrylate 2-Chlorotoluene
Bromomethane Tetrahydrofuran 1,1,2-Trichloroethane Mesitylene (1,3,5-Trimethylbenzene)
Ethyl chloride Trichloromethane Tetrachloroethylene tert-ButylbenzeneTrichloromonofluoromethane 1,1,1-Trichloroethane 1,3-Dichloropropane 1,2,4-Trimethylbenzene
Ethyl ether 1-Chlorobutane 2-Hexanone 1-Methylpropyl benzene
1,1-Dichloroethene Carbon Tetrachloride Dibromochloromethane 1,3-DichlorobenzeneAcetone 1,1-Dichloropropene 1,2-Dibromoethane p-Cymene (4-Isopropyltoluene)
Iodomethane Benzene Chlorobenzene 1,4-DichlorobenzeneCarbon disulfide 1,2-Dichloroethane 1,1,1,2-Tetrachloroethane 1,2-Dichlorobenzene-d4 (SURR)
Allyl chloride Fluorobenzene (ISTD) Ethylbenzene 1,2-DichlorobenzeneMethylene chloride Trichloroethylene m+p-Xylene n-Butylbenzene
Acrylonitrile 1,2-Dichloropropane o-Xylene Hexachloroethanetrans-1,2-Dichloroethylene Dibromomethane Styrene 1,2-Dibromo-3-chloropropane
Methyl tert-butyl ether Methyl methacrylate Tribromomethane Nitrobenzene1,1-Dichloroethane Bromodichloromethane Isopropylbenzene 1,2,4-Trichlorobenzene
2,2-Dichloropropane 2-Nitropropane p-Bromofluorobenzene(SURR)
1,1,2,3,4,4-Hexachlorobuta-1,3-diene
cis-1,2-Dichloroethylene cis-1,3-Dichloropropene Bromobenzene Naphthalene2-Butanone 2,2-Dimethoxybutane 1,1,2,2-Tetrachloroethane 1,2,3-Trichlorobenzene
Propanenitrile Methyl Isobutyl Ketone (MIBK) 1,2,3-Trichloropropane
US EPA Method 524.2VOCs in Water
80 target compounds
3 DE.44140.5720486111

Summary of the Parameters for GC, MSD, and P&TNecessary for SuccessApplication note 5991-0029EN
• Provided a detailed summary on advances and key parameters for successfully performingEPA 524.2 and EPA 8260with a 7890/5975C and P&T
• Introduced BFB Autotune thatenabled meeting the EPA criteria for spectral correspondence andimproved sensitivity and stability
4 DE.44140.5720486111

EPA Method 524.2 with Agilent 8860/5977B
Application note 5994-0833EN• Demonstrated applicability of an Agilent
8860/5977B GC/MSD system (a cost-effective mid-range solution) coupled witha Teledyne Tekmar Lumin purge and trap (P&T) concentrator, and an AQUATek LVA (liquid vial autosampler) ICAL range 0.25–50 µg/L
• MDLs in ppt levels
• Deconvoluted spectra for compound identification
• Several VOCs were identified and quantified in real-world drinking water samples
5 DE.44140.5720486111
x 0.18 mm
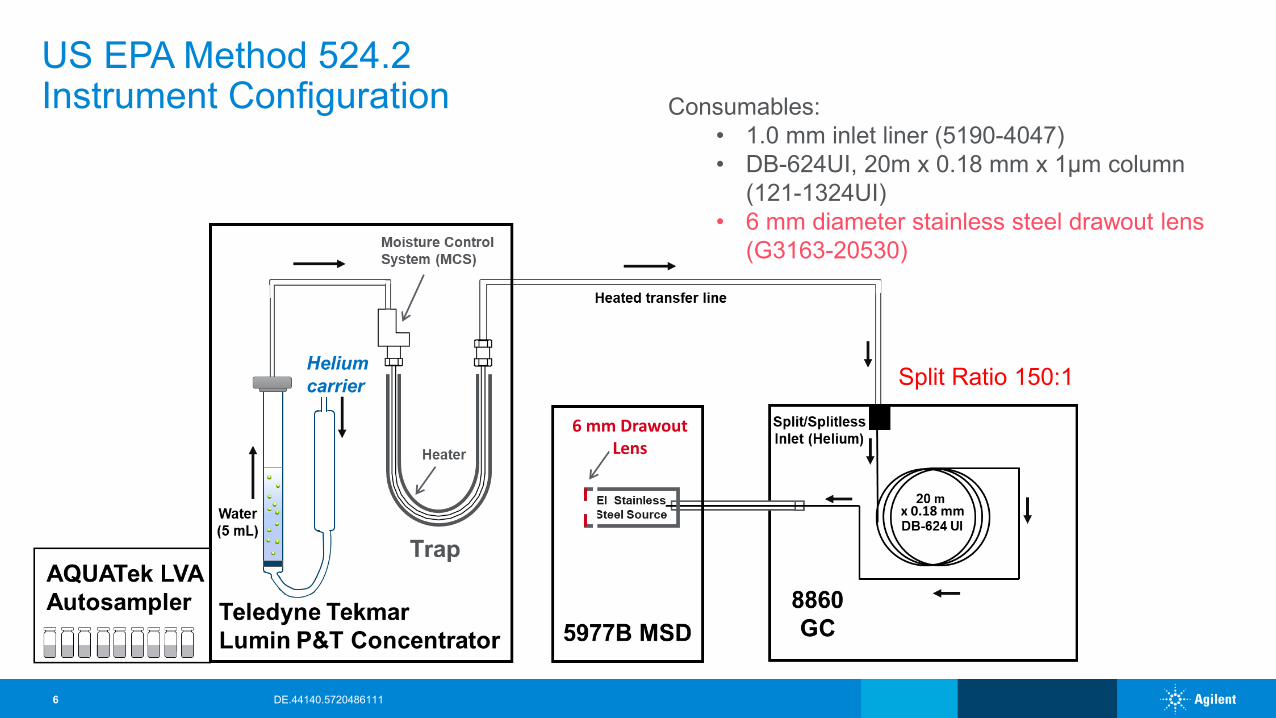
US EPA Method 524.2Instrument Configuration Consumables:
• 1.0 mm inlet liner (5190-4047)• DB-624UI, 20m x 0.18 mm x 1μm column
(121-1324UI)• 6 mm diameter stainless steel drawout lens
(G3163-20530)
6
6 mm Drawout Lens
Split Ratio 150:1
DE.44140.5720486111

MassHunter Quantitative Analysis in Environmental Quant Mode(EnviroQuant)
A stand-alone Tune Evaluation app(installed automatically with MassHunter Quantitative Analysis)
7
Tune Evaluation: Meeting BFB Tune Check Criteria
For more information: Agilent application note 5991-0029EN
EPA 524.2 requires that the spectrometer must produce a mass spectrum that meets all criteria in Table 3 when 25 ng or less of 4-bromofluorobenzene (BFB) is introduced into the GC.
BFB
DE.44140.5720486111

x106
Acquisition Time (min)2 3 4 5 6 7 8 9 10 11 12 13 14
6
543
2
1
12
711 13
14
8
9 10
15 1617
18
19
2021 22
23
24
2527
26
2829
30 31
32
33
34
3536
3738
39
40
41
42
43
4445
46
47
48
49
5051
52
53
54
55
56
57
58
59
60
62
61
63
67
66
64
6568
69
70
71
72
73
74
7576
77
78 79
8081
8283
Res
pons
es
8
Total Ion Chromatogram of Method 524.2 50 µg/L Standard,ISTD and Surrogates (5 µg/L)
80 target compounds2 surrogates1 ISTD
GC column DB-624 UIPN 121-1324UI20 m x 0.18 mm x 1 µm
DE.44140.5720486111

Setting up EPA 524.2 Analysis with MassHunter
1. Analyze a standard to create a spectral library with retention timesusing MassHunter Unknowns Analysis
2. Export deconvoluted spectra to MassHunter Library Editor
3. Create quantitative analysis method in MassHunter Quantitative Analysis using acquired scan data with library search
Add targeted deconvolution to quantitative analysis if desired
Create calibration levels from the analyzed calibration standards
Analyze real-world samples
9 DE.44140.5720486111

10
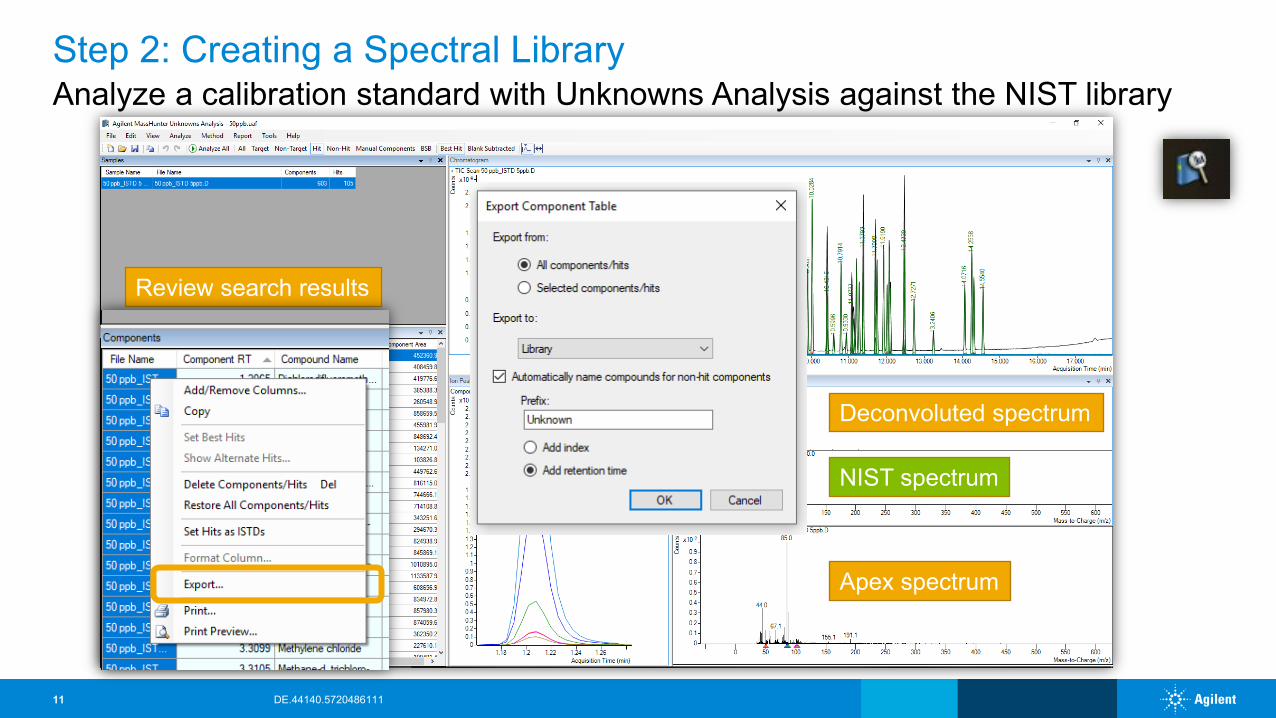
Analyze a calibration standard with Unknowns Analysis against the NIST libraryStep 1: Analyzing a Standard
Sample
Library search against NIST
DE.44140.5720486111
11
Analyze a calibration standard with Unknowns Analysis against the NIST libraryStep 2: Creating a Spectral Library
Review search results
Deconvoluted spectrum
NIST spectrum
Apex spectrum
DE.44140.5720486111

12
Export deconvoluted spectra to the Library Editor and reviewStep 2: Creating a Spectral Library
DE.44140.5720486111

13
New method from acquired scan data with library searchStep 3: Creating Quantitative Analysis Method
DE.44140.5720486111

14
Define ISTD and surrogatesStep 3: Creating Quantitative Analysis Method
DE.44140.5720486111

15
Add target deconvolution (optionally)Step 3: Creating Quantitative Analysis Method
DE.44140.5720486111

ICAL Review in MassHunter Quantitative Analysis 10.1
16
Calibration table
Quantifier Qualifiers
Deconvolutedspectrum
Libraryspectrum
Calibration curve
DE.44140.5720486111

79 compounds out of 80 met the EPA criteria of less than 20% RSD with linear calibrationA quadratic fit with R2 of 0.9963 was used for iodomethane The %RSDs for the internal standard and surrogate compounds introduced by the AQUATek LVA were <5% RSD
17
0.25–50 µg/L for 68 compounds (85%)0.50–50 µg/L for 74 compounds (93%)
Initial Calibration (ICAL)
DE.44140.5720486111

8 trials at 0.25 µg/L for 66 compoundsFor the compounds with higher reporting limits – 8 trials at 0.5 and 1 µg/L
MDLs in pg level
18
Method Detection Limits (MDLs)<0.10 µg/L for 58 compounds (73%)<0.15 µg/L for 66 compounds (83%)
DE.44140.5720486111
19
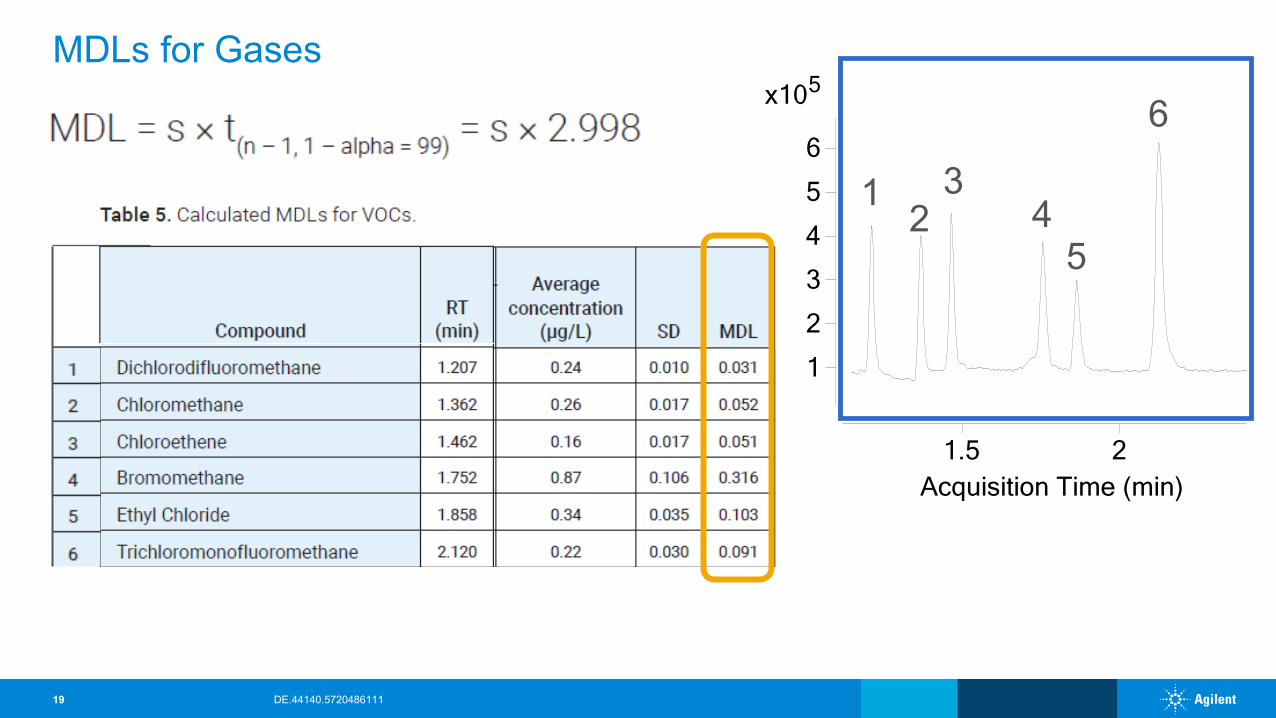
MDLs for Gases
1
5x10
1
2
3
4
5
6
Acquisition Time (min)1.5 2
12
34
5
6
DE.44140.5720486111

20
Tested tap water sample from Eastern Pennsylvania: MassHunter Quantitative AnalysisUS EPA Method 524.2: Real World Samples
Identified compounds sorted by the library match score Concentration
Trichloromonofluoromethane- component
Total ion chromatogram (TIC)
DE.44140.5720486111

VOCs found:
21
Tested tap water sample from Eastern Pennsylvania: MassHunter Unknowns Analysis
TIC
US EPA Method 524.2: Real World Samples
DE.44140.5720486111

Trichloromonofluoromethane Found in a Tap Water Sample from Eastern Pennsylvania: Review in Unknowns Analysis
22
Apex spectrum
Deconvoluted spectrum
Library spectrum
DE.44140.5720486111

23
VOCs found in a tap water sample from four sources in PennsylvaniaUS EPA Method 524.2: Real World Samples
DE.44140.5720486111

Summary
The 8860/5977B GC/MSD system equipped with a 6 mm diameter drawout lens, coupled with a Teledyne Tekmar Lumin P&T concentrator, and an AQUATek LVA is suitable for analyzing VOCs with an ICAL range of 0.25 to 50 μg/L
BFB Autotune provides high sensitivity and stability, while maintaining the required ion abundance ratios in the BFB spectrum
Several VOCs were identified and quantified in real world tap water samples at concentrations varying over the range of 0.3 to 14.1 μg/ L, in many cases much lower than current EPA 524.2 MCLs
24 DE.44140.5720486111