The employment effects of an income redistribution in developing countries
11
World Development, Vol. 21, No. 5, pp. 817-827, 1993. 0305-750X/93 $6.00 + 0.00 Printed in Great Britain. 0 1993 Pergamon Press Ltd The Employment Effects of an Income Redistribution in Developing Countries Tilburg JEFFREY JAMES University, The Netherlands and HAIDER A. KHAN* University of Denver Summary. - During the 1970s a host of macroeconomic studies led to the conclusion that a redistribution of income in favor of the poor would produce only a very minor increase in employment. This paper contends that the existing research systematically tends to underesti- mate the true employment effect of an income redistribution, partly because it is conducted at too high a level of aggregation and partly because it neglects a variety of important macroeconomic relationships. We find that these underestimates can be corrected on the basis of a disaggregated Social Accounting Matrix (SAM) for Indonesia. 1. INTRODUCTION The 1970 International Labor Office (ILO) Mission Report to Colombia first proposed the notion that since the poor tend to consume a more labor-intensive basket of commodities than the rich, a redistribution of income in their favour will tend to increase employment. This proposal gave rise to a host of attempts in the 197Os, to demonstrate its empirical validity in a number of developing countries. The results, however, provided only a very limited degree of support to the IL0 hypothesis. Indeed, by 1978 “the clear conclusion of the general equilibrium macroeconomic models” was that “income redis- tribution would have only a tiny effect on employment.“’ Our goal here is to challenge this well- established conclusion, which, we believe, is based on a methodology that is inadequate in several important respects. To redress these methodological deficiencies, we advocate a framework that employs a highly disaggregated social accounting matrix (SAM) and on the basis of the empirical results that are derived there- from, we suggest that the received view of the relationship between income redistribution and employment may contain a systematic under- statement of the true effect. 2. A CRITIQUE OF THE RECEIVED METHODOLOGY The methodology that was commonly used to estimate the employment effects of an income redistribution during the 197Os, has been lucidly summarized by Morawetz in the following terms. Models designed to examine the impact of income redistribution on aggregate employment generally begin by assuming a specific pattern of income redistribution, based on targets for the lowest group, on social objectives, or on taxation possibili- ties. The impact of the redistribution on savings and total investment is calculated from aggregate con- sumption functions for each group, plus assump- tions as to external capital flows. The total con- sumption of each income group is then broken down into its component parts, using Engel curves or some other kind of demand function. and the new levels of total consumption for each commodity *We are greatly indebted to Wim van Veen of the Centre for World Food Studies at the Free University, Amsterdam, for generously making his data available to us. We are grateful also to Steven Keuning for his help and advice. Khan’s participation was made possible in part by a grant from the National Science Foundation of the Netherlands (NWO). Final revision accepted October 6, 1992. 817
-
Upload
independent -
Category
Documents
-
view
0 -
download
0
Transcript of The employment effects of an income redistribution in developing countries

World Development, Vol. 21, No. 5, pp. 817-827, 1993. 0305-750X/93 $6.00 + 0.00 Printed in Great Britain. 0 1993 Pergamon Press Ltd
The Employment Effects of an Income
Redistribution in Developing Countries
Tilburg JEFFREY JAMES University, The Netherlands
and
HAIDER A. KHAN* University of Denver
Summary. - During the 1970s a host of macroeconomic studies led to the conclusion that a redistribution of income in favor of the poor would produce only a very minor increase in employment. This paper contends that the existing research systematically tends to underesti- mate the true employment effect of an income redistribution, partly because it is conducted at too high a level of aggregation and partly because it neglects a variety of important macroeconomic relationships. We find that these underestimates can be corrected on the basis of a disaggregated Social Accounting Matrix (SAM) for Indonesia.
1. INTRODUCTION
The 1970 International Labor Office (ILO) Mission Report to Colombia first proposed the
notion that since the poor tend to consume a more labor-intensive basket of commodities than the rich, a redistribution of income in their favour will tend to increase employment. This proposal gave rise to a host of attempts in the 197Os, to demonstrate its empirical validity in a number of developing countries. The results, however, provided only a very limited degree of support to the IL0 hypothesis. Indeed, by 1978 “the clear conclusion of the general equilibrium macroeconomic models” was that “income redis- tribution would have only a tiny effect on employment.“’
Our goal here is to challenge this well- established conclusion, which, we believe, is based on a methodology that is inadequate in several important respects. To redress these methodological deficiencies, we advocate a framework that employs a highly disaggregated social accounting matrix (SAM) and on the basis of the empirical results that are derived there- from, we suggest that the received view of the relationship between income redistribution and employment may contain a systematic under- statement of the true effect.
2. A CRITIQUE OF THE RECEIVED METHODOLOGY
The methodology that was commonly used to estimate the employment effects of an income redistribution during the 197Os, has been lucidly summarized by Morawetz in the following terms.
Models designed to examine the impact of income redistribution on aggregate employment generally begin by assuming a specific pattern of income redistribution, based on targets for the lowest group, on social objectives, or on taxation possibili- ties. The impact of the redistribution on savings and total investment is calculated from aggregate con- sumption functions for each group, plus assump- tions as to external capital flows. The total con- sumption of each income group is then broken down into its component parts, using Engel curves or some other kind of demand function. and the new levels of total consumption for each commodity
*We are greatly indebted to Wim van Veen of the Centre for World Food Studies at the Free University, Amsterdam, for generously making his data available to us. We are grateful also to Steven Keuning for his help and advice. Khan’s participation was made possible in part by a grant from the National Science Foundation of the Netherlands (NWO). Final revision accepted October 6, 1992.
817

818 WORLD DEVELOPMENT
arc fed into an input-output system in order to determine direct and indirect changes in produc- tion. imports, employment, and income dlstribu- tion. Finally, on the basis of these changes. the more complete models iterate hack through the system. Production. imports. and employment can now be compared to projections of their magnitudes assuming that there was no initial income redistrihu- tion. (Morawetz. 1974. p. 504).
Though one can point to a number of weak-
nesses in this approach (as does Morawetz himself), we focus on two areas in particular. which. in combination. are shown to give rise to the need for an alternative approach. The first area is concerned with the level of aggregation at which the research during the lY70s was typically conducted.
(a) Why thr level of‘aggregation matters
Aggregation takes many different forms in economics: industries, sectors, households and firms, for example, are commonly added together for various purposes, such as the con- struction of an aggregated production or con- sumption function. It is intuitively clear that aggregation is not likely to matter much if the units being added are alike in relevant respects - if, for instance, “the firms that are being added arc very much alike - in their output (they may all produce one inch pins. for example). their inputs and their techniques of production.“’ But when instead the units to be added together are highly heterogeneous there is a correspondingly greater degree of scope for some form of aggre- gation bias.
In the context of the highly dualistic structures of production and consumption that are charac- teristic of most developing countries, it is easy enough to argue that heterogeneity rather than homogeneity will be the more prevalent. Moreover, it is just as easy on these grounds to be critical of the methodology employed in the 1970s. which relied on models that were not only highly aggregated in terms of the factors of production. but also in terms of output which typically was classified according to two-digits of the SITC (thus effectively assuming that products within the broad categories. such as clothing and transport. were highly similar).” What is more difficult to contend. however, is that the hetero- geneity which this methodology overlooks. gives rise to an aggregation bias of a systematic kind (as opposed, for example. to errors in offsetting directions). This proposition requires some systematic pattern of association between the (heterogeneous) variables that would not be
apparent at an aggregative level of analysis.’ Our view that some such association does
indeed exist, has as its point of departure the recognition that developing countries are charac- terized by the coexistence of forms of production and consumption which originate in very diffe- rent historical periods.5 For one thing, much of the production structure of these economies contains modes of production which belong to the period of “precapitalist economic forma- tions.” In this period. as Marx (1046, p. 377) put it. “the greater part of the products are produced for the satisfaction of the immediate needs of the community not as commodities.” in contrast to the later capitalist mode of production which turns *‘the commodities formerly produced as immediate use-values into exchange values” (Marx, 1963, p. 116). At a later stage there may be simple as opposed to expanded commodity production. In such a situation the scale of operation is small and the technology used is mostly indigenous. The origin of the historical relationship between products. technologies and incomes can thus be said to reside in communities where the mode of production exists essentially to provide for the subsistence needs of the community. That these earlier modes of produc- tion continue to survive in developing countries largely reflects the fact that (especially in Africa and parts of Asia) vast numbers still live at subsistence levels of income and thus demand the type of commodity which is appropriate to the earlier historical period. For the most part. following Lancaster’s theorv of demand that views commodities in terms <if the characteristics they embody.’ this means commodities contain- ing a high proportion of essential characteristics. that are produced by self-employed and other small-scale producers, in and for impoverished groups of households typically in rural areas.
The organized or formal sector of the develop- ing economy on the other hand, operates mostly on the basis of imported processes of production developed in and for the incomes and product requirements of advanced economies. These requirements are generally such that product designs come to acquire an increasingly high proportion of “high-income” (including labor- and time-saving) characteristics; partly as a consequence, the techniques required to produce them become increasingly capital-intensive and large scale. One important dimension of product quality, for instance, is based on the need for “close tolerances” and this is often very difficult to achieve without relatively sophisticated capital equipment.’ What evolves consequently is a generally close relationship over time between products (defined as above in terms of embodied

INCOME REDISTRIBUTION 819
characteristics) and the nature of production processes with both being related to changes in the level of income per head.
Broadly speaking, therefore, the relationships between products, processes and incomes that can currently be observed in a developing coun- try - that is, cross-sectionally - are in fact the reflection of what has occurred historically, ranging all the way from precapitalistic economic formations to the most modern products and processes, that, frequently, are associated with the activities of multinationals from the advanced countries. More specifically, what is suggested by this historical approach is a more or less systema- tic association between product characteristics, the factor intensity of technologies and house- hold incomes that would not be discernible in the macro models of the 1970s and which would cause these models to understate the extent to which an income redistribution in favor of the poor is likely to promote employment.
Underlying this historically based tendency, as we see it, is the important notion of a technologi- cal system. What this notion seeks essentially to convey is the idea that “There are technological linkages between different parts of the system which mean that much of technology comes as a package”.x This package includes not only the relationships between products, techniques and incomes that were suggested above, but also between these and other variables such as infras- tructural requirements, the nature and quality of inputs, the legal and administrative system. culture and so on.
In highly traditional communities, for exam- ple, the technology system has a strong geo- graphical component; that is to say, production and consumption activities tend to be closely related in a particular (and often isolated) rural locality, which relies relatively heavily on un- skilled labor and self-employment as a mode of production and which exhibits relatively few links to external technological systems (or, put more technically, which has minimal leakages out of the system, as occurs, for example, through imported inputs of various kinds). Such a system, moreover, is likely to use (local) labor and other inputs relatively intensively: that is, with a high ratio of inputs per unit of output (reflecting, among other things, the lack of modern, produc- tive technologies and advanced technological capabilities).
In the modern sector of the typical developing country, in contrast, the technological system tends to approximate closely what is found in the developed world: in particular, techniques that
produce high-income products. require high levels
of investible resources per employee, high levels of education and skills, be of a large scale and require sophisticated management techniques. be associ- ated with high levels of labour productivity, and be linked, through inputs and outputs, with the rest of the advanced technology system.’
If this system is to be used efficiently in the developing country setting, it needs, as Stewart (1977) has emphasized, to be reproduced and this in turn often gives rise to a heavy dependence on imported inputs of labor and other resources.
In contrasting traditional and advanced tech- nological systems in this way, it is not our intention to suggest that these (and other inter- mediate) systems never interact or that they can always be so clearly distinguished from one another. What we wish to emphasize is rather that much of technology comes as a package and that the relationships between the components of this package need to be understood from a historical perspective.
In fact, there is already quite a lot of evidence to support (some aspects of) this way of looking at technological issues in developing countries. A number of micro case studies, for example, reveal the relationship between consumption patterns of different income groups and the factor intensity of production that one would expect on historical grounds, namely, for the “poor” to purchase relatively “low-income” and labor-intensive products and for the “rich” to acquire “high-income” and capital-intensive commodities.“’ Indeed, in some of these studies something like a continuum seemed to exist - with rising incomes consumers could be viewed as passing through the product and process characteristics of the earliest precapitalist forma- tions to those of successively later periods.” In other, less “pure” cases, the same relationships, though less clear, were nevertheless discernible.
Such studies as these however cast only limited doubt on the received view of the employment effect of an income redistribution in favor of the poor.” The reason is that whereas this view is based on macro or economy-wide models, the studies we have just cited deal only with the direct (or partial equilibrium) effects of alterna- tive technological choices. Moreover, especially since the direct effects are likely in general to comprise a relatively small proportion of the total (that is, direct and indirect) effect, they cannot readily be used as a proxy for the latter. What is needed instead therefore, if the received view is to be challenged, is a framework which incorpo- rates both direct and indirect employment effects and it is to the choice of this framework that we now turn.

820 WORLD DEVELOPMENT
(b) Input-output versus a sociul accounting matrix (SAM) approuch
As already noted, the economy-wide models of the 1970s were based on an input-output frame- work for estimating the employment effect of an income redistribution. While there is little doubt that this framework provides some indication of the total effect, by no means can it be said to capture all the relevant economic relationships.‘3
In particular, whereas the input-output metho- dology shows how a change in final demand affects output in all other supplying sectors. it does not take into account
the further consequences of increased sectoral outputs on the employment of labour and other factors of production which generates a stream of income received by these factors. In turn, this value added ends up ~ assuming no supply constraints (i.e. excess capacity) - as income to the various socioeconomic households and other institutions in the economy allowing the latter to spend more on consumption of the various commodities produced by the production activities thcrehy generating additional production. By excluding the link be- tween increased output. the factorial and household income distribution and increased consumption the I/O approach short circuits the circular flow in the economy and therehy accounts for only a part of the indirect production in any of the production activities. ”
Fortunately, an alternative framework, known as a social accounting matrix (SAM), is available which redresses these deficiencies of the input- output approach.” How this is achieved can be briefly illustrated with the aid of Table 1. which shows a simplified schematic social accounting
matrix. As with any SAM, it consists of as many rows as columns. Expenditures are recorded by the latter and receipts by the former. With these conventions a SAM can be used as an economy- wide accounting framework. As such a SAM is a consistent set of accounts since row totals (re- ceipts) must equal column totals (expenditures). At the same time a second use of a SAM is in economic modeling. The descriptive, accounting framework can be transformed to a basis for modeling by selecting some accounts as endoge- nous so that these can be determined within the model by the exogenous accounts or variables. Table 1 assumes that three accounts are endoge-
nously determined. namely. factors, institutions (households and companies) and production activities. while all other accounts are assumed to be exogenous (that is. governments, capital and the rest of the world).
Thus, for example. ‘I‘,, is the matrix which allocates the value added generated by the various produc- tion activities into income accruing to the various factors of production and TT3 shows the intermedi- ate input requirements (i.c.. the input-output trans- actions). while T?, reflects the expenditure pattern of the various institutions including the different household groups for the commodities (production activities) which they consume.‘”
As such, therefore, the input-output (or back- ward) linkages comprise only part of a much wider set of macroeconomic relationships in the SAM.
Under conditions of excess capacity that per- mit prices to remain constant. the framework shown in Table 1 can be employed to estimate the effects of exogenous changes (such as in
Table 1. Simplifid .schematic sociul accotmiing mutri.u
Expenditures
Endogenous accounts Exog.
‘” Sum of
z Production other
8 Factors Households activities accounts ‘Totals % 1 2 3 4 5
“; 0 5 Factors 1 0 0 J-13 XI YI
bD -5 Households 2 I 0
5 _ ‘2, TZ x: YZ
s Production activities 3 0 TV T33 X1 Yi
!3 Sum of other accounts 4 I; ‘5 13 t YX Totals 5 YI Y1 Y1 YX
Source: Defourny and Thorhecke (1984)

INCOME REDISTRIBUTION 821
government expenditure or exports) on the entire system. The logic underlying any such exercise is that exogenous changes (x in Table 1) determine via the SAM matrix, the incomes of factors (the vector yi); of households and com- panies (y2); and of production activities (~3). Conversion of the transaction matrix produces the corresponding matrix of average expenditure propensities. These are obtainable simply by division of a particular element in any of the endogenous accounts by the total expenditure for the column account in which the element appears.
More formally, if A, is the square matrix of average expenditure propensities for the endoge- nous accounts in Table 1, endogenous incomes yn (i.e. factor incomes yi; institutional incomes y2; and production activities incomes y3 in that table) are equal to A,y, + x. Therefore,
yn = (I - A,)-‘x. = MaX
(1)
Thus, endogenous incomes can be derived by multiplying injection x by a multiplier matrix M,, which is referred to as an accounting multiplier matrix. One limitation of this matrix, as derived in equation (1) is its implication of unitary expenditure elasticities (that is, that the average expenditure propensities in A,, are assumed to apply to any injection). It is more realistic to specify a matrix of marginal expenditure propen- sities (C, below), which corresponds to the observed income and expenditure elasticities of the various agents, assuming that prices remain fixed. Formally, expressing the changes in in- comes dy, resulting from changes in injections dx, one derives
dy, = C,dy, + dx = (I - CJ’ dx = McdX (2)
McdX is referred to as a fixed price multiplier matrix and the significant role that it plays in our empirical analysis will become apparent below. At this point, however, it bears emphasizing that - as the term “fixed price multipliers” indicates - the initial redistribution leaves prices un- affected under the condition of excess capacity in productive activities. A more general approach which allows prices to be flexible is to be found in the literature on computable general equilibrium (CGE) models. Such models, however, have also been criticized for arbitrary choices of functional forms and parameter values. The approach taken in this paper is intended to be a first approxima- tion, contrasting the general equilibrium (or
disequilibrium) approach with the partial (equilibrium) methodology we criticize.
(c) SAM-TECH Indonesia as a disaggregated framework for estimating the employment effect
of an income redistribution
So far, in criticizing the received methodology, we have emphasized that estimation of the employment effect of an income redistribution needs to be conducted on a disaggregated basis and that it should incorporate a wider variety of macroeconomic relationships than are contained in an input-output approach. Both these require- ments are met in a modified SAM framework for Indonesia that Khan and Thorbecke (1988, 1989) refer to as SAM-TECH.
What is novel about SAM-TECH is its attempt to disaggregate technologies and products in six sectors which exhibit technological dualism- sectors, that is, in which production takes place both in traditional, highly labor-intensive units as well as in more modern, capital-intensive enter- prises. The distinction between the traditional and modern methods of production in each of these sectors (hand-pounded vs. milled rice; farm vs. plant processed tea; dried and salted vs. canned fish; brown vs. refined sugar; canning and preserving of fruits and vegetables in small vs. medium and large firms; and clove vs. white cigarettes), meant that in total 12 new production activities were grafted on to the 1975 SAM for Indonesia, which was constructed by the Central Bureau of Statistics. (Together these dualistic activities accounted for some 50% of manufac- turing sector output in 1975).17
Apart from the specific (and substantial) attempt at disaggregation that this represents, it is important to emphasize that the 1975 SAM for Indonesia is itself very detailed. In particular, it contains 78 columns and rows, which include sixteen different labour groups (that are classi- fied by sector of employment, paid vs. unpaid and rural vs. urban) and 10 socioeconomic household groups. In short, therefore, SAM- TECH provides an unusually comprehensive framework for assessing the employment effect of an income redistribution and for analyzing the role that disaggregation plays in this relationship. We examine next how various redistributive schemes were simulated within this framework and we report on the results that were obtained.
3. THE SIMULATIONS: METHODOLOGY AND RESULTS
The procedure that was adopted can be descri-
822 WORLD DEVELOPMENT
bed in terms of the following five stages. First, from population census and household
budget survey data, we were able to obtain figures for the total number of households and total household income.” This enabled us to derive the income of each of the ten household groups classified in SAM-TECH.
Second we devised three different redistribu- tion schemes to transfer income from richer to poorer households, both rural and urban. The first scheme transfers 100,000 rupees from farm size 2 (representing farms owning 0.51-1.00 Ha) to farm size 1 (representing farmers owning up to 0.5 Ha). The second scheme transfers 100,000 rupees from “rural higher” households to “rural lower” households. The last scheme transfers 100,000 rupees from “urban middle” and “urban higher” to “urban lower” households.“’
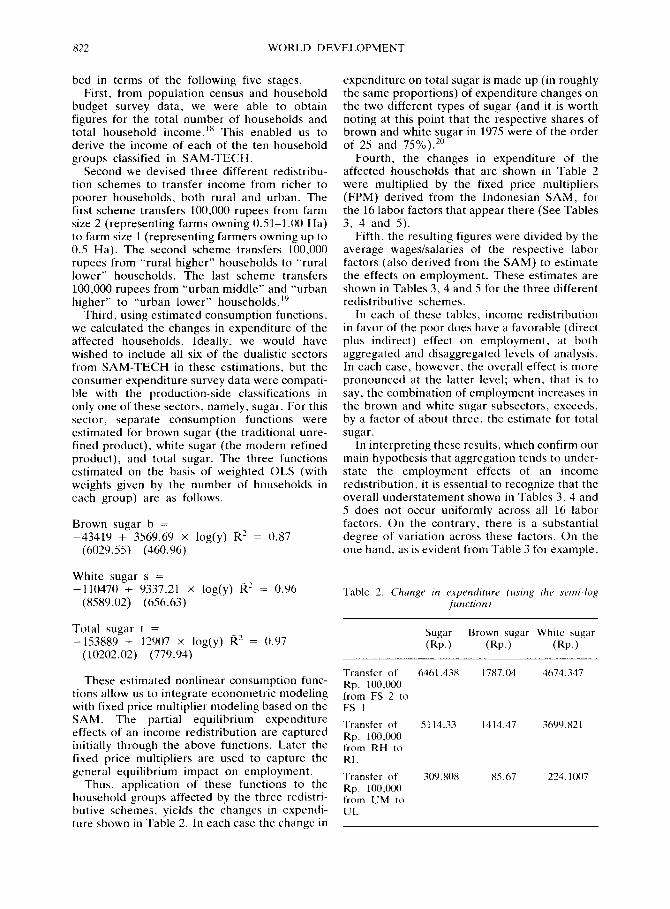
Third, using estimated consumption functions. we calculated the changes in expenditure of the affected households. Ideally. we would have wished to include all six of the dualistic sectors from SAM-TECH in these estimations, but the consumer expenditure survey data were compati- ble with the production-side classifications in only one of these sectors, namely, sugar. For this sector, separate consumption functions were estimated for brown sugar (the traditional unre- fined product), white sugar (the modern refined product), and total sugar. The three functions estimated on the basis of weighted OLS (with weights given by the number of households in each group) are as follows.
Brown sugar b = -43410 + 3569.69 x log(y) l?* = 0.87
(6029.55) (460.96)
White sugar s = -110470 + 9337.21 x log(y) R’ = 0.96
(8589.02) (656.63)
Total sugar t = -153889 + 12907 x log(y) l?’ = 0.97
(10202.02) (779.94)
These estimated nonlinear consumption func- tions allow us to integrate econometric modeling with fixed price multiplier modeling based on the SAM. The partial equilibrium expenditure effects of an income redistribution are captured initially through the above functions. Later the fixed price multipliers are used to capture the general equilibrium impact on employment.
Thus, application of these functions to the household groups affected by the three redistri- butive schemes, yields the changes in expendi- ture shown in Table 2. In each case the change in
expenditure on total sugar is made up (in roughly the same proportions) of expenditure changes on the two different types of sugar (and it is worth noting at this point that the respective shares of brown and white sugar in 1975 were of the order of 25 and 75%).2”
Fourth, the changes in expenditure of the affected households that are shown in Table 2 were multiplied by the fixed price multipliers (FPM) derived from the Indonesian SAM, for the 16 labor factors that appear there (See Tables 3, 4 and 5).
Fifth, the resulting figures were divided by the average wages/salaries of the respective labor factors (also derived from the SAM) to estimate the effects on employment. These estimates are shown in Tables 3, 4 and 5 for the three different redistributive schemes.
In each of these tables, income redistribution in favor of the poor does have a favorable (direct plus indirect) effect on employment, at both aggregated and disaggregated levels of analysis. In each case, however, the overall effect is more pronounced at the latter level; when. that is to say, the combination of employment increases in the brown and white sugar subsectors, exceeds, by a factor of about three. the estimate for total sugar.
In interpreting these results, which confirm our main hypothesis that aggregation tends to under- state the employment effects of an income redistribution, it is essential to recognize that the overall understatement shown in Tables 3, 4 and 5 does not occur uniformly across all 16 labor factors. On the contrary. there is a substantial degree of variation across these factors. On the one hand, as is evident from Table 3 for example,
‘l’able 2. Chunge in rxpmdilurr (usw~g ihc srmi-log Junction)
Sugar Brown sugar White sugar (RP.) (RP.) (RP.)
Transfer of 6461.4% 1787.04 4674.347 Rp 100,000 from FS 2 to FS 1
Transfer of 5114.33 1414.47 3lXN.821 Rp. 100,000 from RH to RL
Transfer of 309. X08 85.67 224.1007 Rp. 100,000 from UM to UL

INCOME REDISTRIBUTION 823
Table 3. Changes in employment - Redistribution scheme I
Labor Categories Aggregated SAM Disaggregated SAM
Sugar Brown sugar White sugar
Ag. paid rural Ag. paid urban Ag. unpaid rural Ag. unpaid urban Prod. paid rural Prod. paid urban Prod. unpaid rural Prod. unpaid urban clerical paid rural clerical paid urban clerical unpaid rural clerical unpaid urban Prof. paid rural Prof. paid urban Prof. unpaid rural Prof. unpaid urban
Total
1.033 1.098 1.227 I.227 0.839 1.292 0.904 1.292 0.839 1.227 0.904 1.292 0.904 1.227 0.904 1.292
3.131 4.865 0.090 0.142 5.471 9.322 0.179 0.313 1.669 3.589 0.461 1.700 1.925 3.021 0.189 0.525 0.720 1.465 0.005 1.386 1.891 3.609 0.698 1.389 0.230 0.46X 0.183 0.428 0.123 0.277 0.089 0.200
17.501 17.053 32.709
Table 4. Changes in employment - Redistribution scheme 2
Labor Categories Aggregated SAM Disaggregated SAM
Sugar Brown sugar White sugar
Ag. paid rural 0.818 2.478 8.725 Ag. paid urban 0.869 0.071 0.112 Ag. unpaid rural 0.971 4.330 7.378 Ag. unpaid urban 0.971 0.142 0.248 Prod. paid rural 0.664 1.321 2.841 Prod. paid urban 1.022 0.365 1.345 Prod. unpaid rural 0.716 1.523 2.391 Prod. unpaid urban 1.022 0.150 0.416 clerical paid rural 0.664 0.570 1.160 clerical paid urban 0.971 0.434 1.097 clerical unpaid rural 0.716 1.497 2.856 clerical unpaid urban 1.022 0.552 1.100 Prof. paid rural 0.716 0.182 0.370 Prof. paid urban 0.971 0.144 0.339 Prof. unpaid rural 0.716 0.098 2.417 Prof. unpaid urban 1.022 0.070 0.158
Total 13.851 13.927 32.953
in seven of the labor categories (agricultural paid urban, agricultural unpaid urban, production unpaid urban and the last four professional categories), the aggregated estimate (for total sugar) exceeds the sum of the two disaggregated estimates (so that there is over rather than understatement). On the other hand, much of the overall understatement is concentrated in four labor categories: agricultural paid rural,
agricultural unpaid rural, production paid rural and production unpaid rural. These, unlike most of the seven cases of overstatement that have just been mentioned, are labor categories drawn from the rural (rather than the urban) areas and they contain a relatively high pr;yortion of unskilled (and low-income) workers.
Underlying these contrasting patterns are in part the relevant fixed price multipliers shown in

WORLD DEVELOPMENT
Table 5. Changes in employnwn~ - Redlstritmtion scheme .1
Labor Categories Aggregated SAM
Sugar Diaaggrcgated SAM
Brown sugar White sugar
Ag. paid rural 0.049 0. 150 0.233 Ag. paid urban 0.052 0.004 0.006 Ag. unpaid rural 0.0% 0.262 0.446 Ag. unpaid urban 0.0% 0.008 0.015 Prod. paid rural 0.040 0.0x0 0.172 Prod. paid urban 0.061 0.022 O.tJXI Prod. unpaid rural 0.043 0.092 0.144 Prod. unpaid urban 0.061 O.OOY 0.025 clerical paid rural 0.040 0.034 0.070 clerical paid urban 0.0% 0.026 0.066 clerical unpaid rural 0.043 0.090 0.173 clerical unpaid urban 0.061 0.033 0.066 Prof. paid rural 0.043 0.01 I 0.022 Prof. paid urban 0.05x o.tJtJx 0.020 Prof. unpaid rural 0.043 0.00.5 0.013 Prof. unpaid urban 0.061 tJ.004 0.009
Total 0.x2’) 0.x3x I.561
Table h. Disaggrqured fixed prim multipliers
Labor Categories Aggregated
Sugar Disaggregated
Brown sugar White sugar
Ag. paid rural 0.012 Ag. paid urban 0.016 Ag. unpaid rural 0.013 Ag. unpaid urban 0.016 Prod. paid rural 0.016 Prod. paid urban 0.038 Prod. unpaid rural 0.014 Prod. unpaid urban 0.032 clerical paid rural O.Ol4 clerical paid urban 0.03x clerical unpaid rural 0.01 1 clerical unpaid urban 0.024 Prof. paid rural 0.049 Prof. paid urhan 0. IO6 Prof. unpaid rural O.Cl14 Prof. unpaid urban 0.084
0. I33 0.00s 0.21x 0.009 0. I IX 0.04’) 0. I IO 0.017 0.04s 0.061 1J.085 0.046 0.04s 0.057 0.007 0.021
0.07’) 0.003 0. I42 0.006 0.097 0.060 0.066 0.01x 0.035 0.059 0.062 0.035 0.03s 0.05 I O.OOh 0.01x
Table 6 (as well, of course, as the particular patterns of consumption that are induced by the income redistribution).
These provide, in the first place. part of the reason why understatement of the employment increase at the aggregate level is concentrated in the four rural labor categories noted above in relation to Table 3. In fact. the fixed price multipliers for brown sugar are highest in preci- sely these categories and much the same is also true for white sugar. Evidently, it is in these labor
categories that the aggregate SAM most sharply underestimates the total linkages. Correspond- ingly, when these groups are the beneficiaries of an income redistribution (as in our first two simulations), the employment effect will tend to be large in comparison to cases where (as in our third simulation) it is urban households who are favorably affected.
The disaggregated multipliers in Table 6 also lend some degree of support to our view that historically determined relationships among pro-

INCOME REDISTRIBUTION 825
ducts, technologies and incomes in distinct “sys- tems,” give rise to aggregation bias of the sort found here. The table reveals uniformly higher fixed price multipliers for brown than for white sugar. In addition, the former are especially high among the rural labor groups whose consumption patterns, we suggested earlier, would be relative- ly intensive in labor and other local inputs and which would exhibit relatively few outside leak- ages.
One can in fact get a rather better sense of the differential linkages that underlie these dissagre- gated fixed price multipliers, by means of a relatively new technique known as “structural path analysis,” which, in effect, decomposes the multipliers into a series of constituent influences. Khan and Thorbecke show that when this techni- que is applied to SAM-TECH it is capable of capturing “the entire network of paths through which the impact of a change in demand for the output in any production activity is transmitted throughout the Indonesian economy”. (Khan and Thorbecke, 1989, p. 147). Sugar is one of the sectors they use to illustrate how these paths actually operate and more specifically, how the effects of a change in the output of brown and white sugar ultimately get translated into higher incomes for the household group headed by small farmers. What Khan and Thorbecke conclude from this exercise is that although both types of sugar
“affect the economic system through the same set of paths”, the major difference between them consisted of the “considerably smaller backward linkages to sugar cane . of the modern technological alternative (refined sugar) compared to the tradit- ional one (brown sugar) which is made out of palm sugar” (1989, p. 1.55).
4. CONCLUSIONS
During the 1970s a host of studies attempted to examine the employment effects of an income redistribution in favor of the poor in developing countries. These studies, however, provided little or no support for the proposition that since the
poor tend to consume a more labor-intensive basket of commodities than the rich, a redistribu- tion in their favor will tend to increase employ- ment.
We have argued that the methodology under- lying these results is flawed in two (related) ways; the first being the use of a level of aggregation that disguises a historically based pattern of associations between product characteristics, technologies and incomes. Neglect of these relationships - which tend to manifest them- selves in terms of distinct “technological systems” - imparts a tendency for the aggregative approach to underestimate the true employment effects of an income redistribution. In addition, based as they generally are on an input-output approach, the models used during the 1970s neglect a variety of relevant macroeconomic relationships. In particular, the input-output approach excludes the link between increased output, the factorial and household income distribution and increased consumption.
To redress these methodological deficiencies, we advocate an alternative analytical framework based on a disaggregated SAM for Indonesia. This framework is highly disaggregated not only in terms of products and technologies for six dualistic manufacturing sectors, but also in terms of labor factors and households. On the basis of this framework a number of income redistribu- tions from rich to poor was simulated, using consumption functions estimated for one dualis- tic sector, sugar, at both aggregative and dis- aggregative levels of analysis. Though employ- ment was found to increase at both levels, the effect is far more pronounced in the disaggrega- tive case. Analysis of the sources of this discre- pancy suggest that they were partly the result of a tendency for aggregation to most heavily understate linkage effects among relatively un- skilled rural labor categories. To at least some extent this tendency seems to be explicable with reference to our theoretical framework which emphasizes the historical origins of the highly dualistic patterns of production and consumption in the manufacturing sector of most developing countries.
NOTES
1. White (1978), p. 46. Morawetz (1974) comes to tioned whether any such association exists. Cline the same conclusion. (1975), for example, argues that there are no theoreti-
cal reasons to expect systematic factor combination 2. Walters (1968), p. 308. differences between basic and luxury goods at a more
disaggregated level. Recently, Cooper (1990) has 3. Morawetz (1974). expressed a similar degree of scepticism.
4. Some writers on this topic have explicitly ques- 5. This argument is based on James (1976).

X26 WORLD DEVELOPMENT
6. Lancaster (lY66).
7. Forsyth. McBain and Solomon (1982).
8. Stewart (1977). p. 6, emphasis added. The follow- ing discussion of a “technology system” is based largely on this reference.
9. Stewart (1981). p. Y4.
10. See van Ginneken and Baron (1984); James and Stewart (1981); Stewart (lY77). Chapters 9 and 10 and James (1980).
11. James (1076).
12. For the sugar-processing industry in India, James (19X0) shows that a 50% understatement of the employment effect of an income redistribution can be attributed to aggregation bias i.e. the bias that results from failing to decompose the demand for sweeteners into its constituent parts.
13. This section very closely follows the text in Khan and Thorbecke (1988. 19X9).
14. Khan and Thorbecke (19X8), p. 2.
15. Already in the lY70s. several “first generation” models had directly addressed the link between income distribution and employment within a general equilib-
rium framework. (Thorbecke and Sengupta. lY72 and Pyatt rr al., lY72). Both models were prepared under the auspices of the World Employment Programme of the IL0 and they were both influential in the opening up of the SAM and CGE approaches. These two models are discussed in Pyatt and Round (1YXS).
16. Khan and Thorbecke (1989). p. 137.
17. Khan and Thorbecke (19X8).
IX. Our consumption data are taken from the Indone- sian 1980 Household Budget Survey (called SUSE- NAS). while the numbers of households are those reported in Keuning (1988).
19. In principle each of these redistributive schemes could bc brought about by some combination of taxes from and subsidies to. the groups which the SAM indentified. In practice, however. any such measures are likely to encounter not only administrative but also political problems with regard to the question of political will. which will influence the feasibility of redistribution even in the relatively mild changes that we have simulated. For a detailed discussion of these issues see Frank and Webb (1977).
20. Khan and Thorbecke (19Xx).
21. Khan and Thorbecke (108X).
REFERENCES
Cline. William R.. “Distribution and development: a survey of literature,” Journal of Development Econo- mics. Vol. 1 (1975).
Cooper. Charles. “Notes on income distrihutton. growth and demand. ” in F. Stewart, H. Thomas and 7‘. de Wilde (Eds.), The Other Policy (London: IT Publications. 1990).
Defourny, J.. and E. Thorbecke. “Structural path analysis and multiplier decomposition within a social accounting matrix framework,” Economic Journul. Vol. 94 (March 1984).
Forsyth, D.. N. McBain and R. Solomon, “Technical rigidity and appropriate technology in less developed countries,” in F. Stewart and J. James (Eds.). The Economics of New Technology in Developing C’ourz- tries (London: Frances Pinter. 1982).
Frank C.. and R. Webb (Ed%). Income Distribution and Growth in the Less-Developed Countries (Washington, DC: The Brookinas Institution, 1977).
Van Ginneuken. W., and C. Baron-(Eds.), Appropriate Products, Employment und Technology (London: Macmillan, 1984).
James, J. “The employment effects of an income redistribution: A test for aggregation bias in the Indian sugar processing industry,” Journul of De- velopment Economics. Vol. 7 (1980).
James. J.. “Products, processes and incomes: cotton clothing in India.” World Development. Vol. 4. No. 2 (February lY76).
James. J.. and F. Stewart, “New products: A discussion of the welfare effects of the introduction of new products in developing countries,” Oxford Economic Papers. Vol. 33, No. 1 (1081).
Keuning. S. J.. “Comparing a system of socio- economic accounts for Indonesia for 1975 and 1980: documentation of the compilation of the data, part 1.” Statistical Analysis Capability Programme, Working Paper Series No. I (The Hague: Institute of Social Studies, 198X).
Khan. H., and E. Thorbecke. “Macroeconomic effects of technology choice: Multiplier and structural path analysis within a SAM framework.” Journul ofPo/ic_v Model&, Vol. 11. No. 1 (1989).
Khan. H., and E. Thorbecke, Macroeconomic Effects and Difjusion of Alternative Technologies Within a Social Accounting Matrix Framework (Aldershot: Gower. 198X).
Lancaster, K., “A new approach to consumer theory.” Journal of Political Economy. Vol. LXXIV (April lYh6).
Marx, K.. “Pre-capitalist economic formations,” in E. J. Hobsbawm (Ed.), Pre-Capitalist Economic Formafions (London: Lawrence and Wishart. lYh4).
Marx. K. Capital (London: Allen and Unwin, 1946). Morawetz, D., “Employment implications of indust-
rialisation in developing countries: A survey,” Eco- nomic Journal. Vol. X4 (September 1974).
Pyatt. G., and J. Round (Eds.). Sociul Accounting

INCOME REDISTRIBUTION 827
Matrices: A Basis for Planning (Washington. DC: The World Bank, 1985).
Pyatt, G. et al., Employment and Income Policies for Iran (Geneva: ILO. 1972).
Stewart, F., “International technology transfer: Issues and policy options,” in P. Streeten and R. Jolly (Eds.), Recent Issues in World Development (Oxford: Pergamon, 1981).
Stewart, F., Technology and Underdevelopment (London: Macmillan, 1977).
Thorbecke, E.. and J. Sengupta, “A consistency
framework for employment, output and income distribution projections applied . to Colombia.” Mimeo (Washington. DC: The World Bank De- velopment Research Center, 1972).
Walters, A. A., An Introduction to Econometrics (London: Macmillan, 1968).
White, L., “The evidence on appropriate factor pro- portions in less developed countries: A survey”, Economic Development and Cultural Change, Vol. 27 (1978).