
The Efficiency Evaluation of Mutual Fund Managers based on
23
1 The Efficiency Evaluation of Mutual Fund Managers based on DARA, CARA, IARA Abstract This study provides an attempt to evaluate the efficiency of mutual fund managers of 20 different classes of management styles to identify the most efficient strategies and to propose an optimal pattern in selecting the funds for different kinds of investor. It collects monthly data of 17,686 U.S. mutual funds for a five-year period 2005-2010 to minimize the impact of survivorship bias and utilizes Data Envelopment Analysis (DEA) model to evaluate the mutual fund performance and to select best-practice benchmarking, which endogenously identifies a dominating benchmark portfolio for each evaluated mutual fund. The set of considered inputs comprised “variance”, representing the mutual fund risk, and “turnover, expense ratio and loads indicators”, reflecting the mutual fund costs and fees. Two kinds of outputs are taken into account by our DEA model, “portfolio return” and “stochastic dominance indicators”. As a unique contribution, this study states the benefits of the DEA approach in the DARA, CARA, and IARA framework, and evaluates the efficiency of mutual funds based on fund strategies as well as the performance of best mutual funds among their group. The evidence shows that the efficiency scores of technical, management, and scale are respectively 0.81, 0.921, and 0.874 for the DARA model, while the efficiency scores of two models of CARA and IARA are negligible. Also, we rank each management strategy in any model based on two methods – the number of referencing and the weighted value, so that the managers of inefficient strategies must pattern the managers’ ability of reference (efficient) strategies to improve their efficiency on the fund market in future. However, the results of this study can be directly considered as an optimal and appropriate pattern to make decisions by investors and portfolio managers who are seeking the possibility of participating in the different portfolios through American mutual funds. Keywords Mutual Fund, Data Envelopment Analysis (DEA), Stochastic Dominance, DARA, CARA, IARA. 1. Introduction Mutual funds have enjoyed sizable growth as one of the largest industries over the last two decades, climbing from $7 to $14 trillion and growing under management. Although there are various reasons for this success, the most important one is the obvious ability of mutual funds’ to reveal superior performance. Proponents of mutual funds believe that the superior performance is possible due to the remarkable willingness of investors to invest in these diversified funds (i.e., Equity funds, money market funds and bond funds) as well as the fund manager’s efficiency in earning the higher level of return with respect to lower resources (i.e., risk, management fee, turnover cost, etc.). Mutual fund performance can be evaluated by either the parametric approach or non-parametric approach. The first approach has been frequently studied in the literature associated with parametric models, while the second approach has been poorly considered in the performance evaluation models until now. Earlier studies of fund performance evaluation started with the performance evaluation models based on Jensen’s alpha (i.e., Treynor 1965, Sharpe 1966, Jensen 1968), and were then extended by adding more variables as explanatory factors (i.e., Fama, French 1993, Carhart 1997) to improve the evaluation model. Most models were grounded on parametric models, in which they require a strong theoretical model and a benchmark to compute the outcome. In addition, they only evaluate the funds performance in terms of the relationship between risk premium and return, without realizing the fundamental fact of the amount of resources (i.e., management fee, turnover cost, etc.) that has been spent. Data envelopment analysis is a non-parametric method used to evaluate the relative efficiency of decision-making units (DMU), which was first introduced by Charnes et al. (1978). DEA is employed for relative efficiency appraisal of DMU (in our study management style of mutual funds are considered as DMU). The efficiency evaluation of mutual fund managers in the DEA non-parametric model framework provides several advantages. First, unlike the parametric
-
Upload
independent -
Category
Documents
-
view
0 -
download
0
Transcript of The Efficiency Evaluation of Mutual Fund Managers based on

1
The Efficiency Evaluation of Mutual Fund Managers based on DARA, CARA, IARA
Abstract
This study provides an attempt to evaluate the efficiency of mutual fund managers of 20 different classes of management styles to identify the most efficient strategies and to propose an optimal pattern in selecting the funds for different kinds of investor. It collects monthly data of 17,686 U.S. mutual funds for a five-year period 2005-2010 to minimize the impact of survivorship bias and utilizes Data Envelopment Analysis (DEA) model to evaluate the mutual fund performance and to select best-practice benchmarking, which endogenously identifies a dominating benchmark portfolio for each evaluated mutual fund. The set of considered inputs comprised “variance”, representing the mutual fund risk, and “turnover, expense ratio and loads indicators”, reflecting the mutual fund costs and fees. Two kinds of outputs are taken into account by our DEA model, “portfolio return” and “stochastic dominance indicators”. As a unique contribution, this study states the benefits of the DEA approach in the DARA, CARA, and IARA framework, and evaluates the efficiency of mutual funds based on fund strategies as well as the performance of best mutual funds among their group.
The evidence shows that the efficiency scores of technical, management, and scale are respectively 0.81, 0.921, and 0.874 for the DARA model, while the efficiency scores of two models of CARA and IARA are negligible. Also, we rank each management strategy in any model based on two methods – the number of referencing and the weighted value, so that the managers of inefficient strategies must pattern the managers’ ability of reference (efficient) strategies to improve their efficiency on the fund market in future. However, the results of this study can be directly considered as an optimal and appropriate pattern to make decisions by investors and portfolio managers who are seeking the possibility of participating in the different portfolios through American mutual funds.
Keywords Mutual Fund, Data Envelopment Analysis (DEA), Stochastic Dominance, DARA, CARA, IARA.
1. Introduction
Mutual funds have enjoyed sizable growth as one of the largest industries over the last two decades, climbing from $7 to $14 trillion and growing under management. Although there are various reasons for this success, the most important one is the obvious ability of mutual funds’ to reveal superior performance. Proponents of mutual funds believe that the superior performance is possible due to the remarkable willingness of investors to invest in these diversified funds (i.e., Equity funds, money market funds and bond funds) as well as the fund manager’s efficiency in earning the higher level of return with respect to lower resources (i.e., risk, management fee, turnover cost, etc.). Mutual fund performance can be evaluated by either the parametric approach or non-parametric approach. The first approach has been frequently studied in the literature associated with parametric models, while the second approach has been poorly considered in the performance evaluation models until now.
Earlier studies of fund performance evaluation started with the performance evaluation models based on Jensen’s alpha (i.e., Treynor 1965, Sharpe 1966, Jensen 1968), and were then extended by adding more variables as explanatory factors (i.e., Fama, French 1993, Carhart 1997) to improve the evaluation model. Most models were grounded on parametric models, in which they require a strong theoretical model and a benchmark to compute the outcome. In addition, they only evaluate the funds performance in terms of the relationship between risk premium and return, without realizing the fundamental fact of the amount of resources (i.e., management fee, turnover cost, etc.) that has been spent.
Data envelopment analysis is a non-parametric method used to evaluate the relative efficiency of decision-making units (DMU), which was first introduced by Charnes et al. (1978). DEA is employed for relative efficiency appraisal of DMU (in our study management style of mutual funds are considered as DMU). The efficiency evaluation of mutual fund managers in the DEA non-parametric model framework provides several advantages. First, unlike the parametric

2
models, there is no necessity to run a theoretical model in the non-parametric approaches. Second, since the DEA model evaluates the relative performance of funds, there is no need to assign a benchmark as well. Third, DEA does not require the assumptions of function forms relating inputs to outputs, which can be helpful if the relationship is unknown or not specified by rational theory. Finally, DEA can incorporate factors needed into the model. These factors can be costs and fees (such as expense ratio and load), and asset size or minimum initial investment. Banker and Maindiratta (1986) explain that, “our integral outcome of the DEA analysis is a set of inefficiency measure that identified the source of the inefficiency and indicates the extent to which the various inputs need to be reduced or outputs need to be increased for making the inefficient DMUs efficient”. The marginal share of each input or output can be clarified by this information. This information can analyze how fund performance will be affected by input or output creations, which can be a benefit for managers in assessing optimal resource allocation.
Since research on the efficiency evaluation of mutual funds is scarce and only a few studies focused on this field (i.e., Basso, Funari 2001, 2003; Murthi et al., 1997), this study fills several gaps in the literature. First, this study evaluates the full universe of more than 17,000 mutual funds in the Bloomberg database over the period 2005 to 2010. This large sample provides the possibility of overcoming the small-sample problems that plagued prior studies concerning the efficiency evaluation of mutual fund. Second, unlike earlier studies, this study evaluates the mutual funds managers’ efficiency in terms of management style. Third, this study proposes an optimal choice pattern to make decisions in selecting the funds by different kinds of investor; in addition, this study prioritizes efficient managers in terms of their own efficiency scores. Fourth, unlike earlier studies that only evaluated the funds in terms of relative (technical) efficiency, this research calculates two other efficiency measures, namely, management and scale efficiency. Fifth, this research proposes three models of DEA in the Decreasing Absolute Risk Aversion (DARA), Constant Absolute Risk Aversion (CARA), and Increasing Absolute Risk Aversion (IARA) framework to identify the best model in evaluating the efficiency of mutual fund managers. 2. Background
2.1. Fund performance measurement
Investors and managers always use many techniques to determine how mutual funds would perform. Risk and performance measures enable investors to distinguish mutual funds in terms of their performance. Although there are some performance measures available, none of them can accurately predict the mutual fund performance. The existing methods are simplistic and based on two variables, rate of return and risk of mutual funds. Risk and return only provide a historical perspective on a mutual fund and cannot ensure the future performance of a fund. These measures often do not consider market timing, management expenses, other affecting factors on mutual fund performances, and, especially, they disregard the amount of resource consumption for increasing one unit of return. Due to the fact that researchers are trying to propose a top model for the comprehensive evaluation of the performance of mutual funds, they have extended the models in the framework of two parametric and non-parametric approaches.
After introducing the Jensen’s alpha measure by Jensen (1968), who described the relationship between risk and return, Fama and French (1993), and then Carhart (1997) extended the initial models using the parametric approach. Consequently, many studies empirically concentrated on a narrow area of mutual funds, especially management style. A management style is a set of activities addressing the management predetermined objectives. Mutual Fund can be classified by their management styles or investment objectives. Regardless of various management styles that exist among mutual funds, many authors have sought to assess whether these styles lead to any differences in mutual fund performance. One of the earliest papers in this category was studied by Grinblatt and Titman (1993). They used a database containing 279

3
mutual funds over the period 1974-1984 to assess the probable existence of any persistence in the mutual funds performance. The funds were grouped into one of twelve portfolio strategies, and the risk adjusted performance measure was employed to compare returns using parametric performance evaluation models. Then, the studies of Witkowski (1994), and Kim, Shukla, and Tomas (1995) showed that the performance of a management style index can be evaluated using parametric models like Jensen’s alpha. Christopherson (1995), and subsequently Brown and Goetzman (1995) evaluated the investment style of mutual funds using Jensen’s alpha and its relevant multi factor models. Similarly, other studies by Detzel and Weigand (1998), Siggelkow (2003), and then Khorana, Servaes and Wedge (2007) focused on the performance evaluation of mutual funds in the parametric models. Prather, Bertin, and Henker (2004) examined the performance of mutual funds using parametric models based on investment objectives, such as Aggressive growth, Growth, Growth and income, Equity and income, Small Company, Foreign, and Global. Recently, Khorana, Tufano and Wedge (2007) applied the parametric models by a cross-section of fund boards to examine fund boards’ decisions over the period 1999 to 2001. Renneboog, Ter Horst, and Zhang (2008) investigated the SRI fund performance to the performance of traditional funds in each country based on parametric models and then examined whether SRI fund investors pay a price for the ethical, corporate governance, social and environmental policies. Ferris and Yan (2009) investigated the impact of mutual fund management companies’ organizational forms on the level of agency costs for the period 1992–2004. Babalos, Kostakis, and Philippas (2009) evaluated the performance of Greek equity-based funds based on parametric models to realize whether expense ratio policy affects the performance of funds. Bertin and Prather (2009) investigated the fund of funds’ (FOF) characteristics and performance rather than traditional equity-based mutual funds using parametric approaches. Karagiannidis (2010) examined the relationship between performance and portfolio management team structure of open-end mutual funds over the period 1997 to 2004. Generally, all the aforementioned studies divided funds into three fundamental groups – equity funds (stocks), money-market funds, and fixed-income funds (bonds).
In this research, these three fundamental classes are categorized into 20 kinds, of which 13 out of 20 belong to the Equity funds, 3 are parts of money-market funds and 2 are fixed-income funds. The remaining two classes are a combination of major groups. As a fundamental contribution, this study evaluates the performance of 20 different types of mutual fund in the non-parametric models with the focus on their management styles. This study enables investors to compare various mutual funds to each other in terms of level of efficiency and management style.
2.2. Non-parametric approach and its evidence on funds The non-parametric approach is a technique based on mathematical programming. It does not
need any function and does not have any problem for efficiency evaluation, and, if surveying units have multiple outputs, it does not have any problem for efficiency evaluation. DEA can be introduced as non-parametric methods.
Non-parametric performance appraisal approaches try to assess the efficacy of decision-making units (DMU) with multiple input and output. DEA is one of the non-parametric methods that can be used to evaluate a relative efficiency of DMUs (Charnes et al., 1978). It enables one to evaluate the relative efficiency of units as well as being able to overcome certain shortcomings of parametric approaches for performance evaluation. However, while several authors have empirically studied the efficiency evaluation of funds, they have entirely excluded the efficiency evaluation of funds in terms of management and scale efficiency. The first study that used the DEA methodology in measuring fund performances is related to Murthi et al. (1997). They evaluated the relative efficiency of mutual funds based on seven different groups of the investment objectives of mutual funds, and then compared them with other parametric
4
performance measures such as Morningstar rating, Sharpe ratio, Jensen’s alpha and beta measures. Consequently, McMullen and Strong (1998) investigated the effect of costs and risk on investor decision making. They considered costs (including sales charges, expenses and initial minimums) and risk (return standard deviation) as inputs and excess return of mutual funds as output of the DEA model. They assessed mutual fund performances excluding the minimum investment requirement to show advantages of using DEA for adjusting the performance evaluation model with investor interests.
Morey and Morey (1999) first explained how DEA using the standard Sharpe ratio of the Markowitz model can find a solution for the portfolio selection problem. Second, they investigated whether DEA is able to process simultaneously at the same time or can appraise mutual funds successively, if a priority ordering is exogenously given. Basso and Funari (2001) considered two cost components (including subscription and redemption fees) and two risk components (including the portfolio beta and the standard deviation of portfolio returns) as DEA inputs. They evaluated the performance of 48 mutual funds in three separate groups with the input-oriented DEA model supposing the constant return to scale and analyzed the funds with and without a stochastic dominance index. Their sample considered three groups, twenty-four stock funds (an exchange index), nine balanced funds, and fifteen bond funds (a treasury bill for the riskless investment).
Choi and Murthi (2001) clustered mutual funds to seven classifications and evaluated their relative efficiency using a DEA model. They found a high correlation with Sharpe and Jensen measures and even higher correlation, when the DEA scores are computed with only return as output and risk as input. Wilkens and Zhu (2001) in their studies proposed other characteristics of the returns' distribution as output. Along with returns, they added skewness and minimum return to more accurately assess mutual fund performance. They extended the Sharpe ratio/Markowitz model by adding variables representing other characteristics of the returns' distribution, not other factors of production or stakeholders in the fund’s performance. Similarly, Joro and Na (2002) extended this line of research by employing the DEA to reduce some of the defects of the Markowitz (1952) model, which is based on mean-variance theory. According to the weakness of the symmetry assumption in this distribution, they added distribution’s third moment as output in their DEA model. They showed the necessity of existing skewness by previous empirical studies and by a theoretical development. The third order approximation based on a Taylor’s series' expansion of a generalized utility function around the mean of the portfolio returns exhibits three desirable properties for utility functions, as proposed by Arrow and Pratt, namely, (i) positive marginal utility for wealth, i.e., non-satiety with respect to wealth, (ii) decreasing marginal utility for wealth, i.e., risk aversion, and (iii) non-increasing absolute risk aversion, i.e., risky assets that are not inferior goods. Then Joro and Na (2002) investigated the impact of expense ratio and loads as the input of the DEA model on mutual fund performance. They utilized some other distributional characterizations as output. They compared their outcome obtained by DEA method with the two parametric approaches. Then, Joro and Na (2006) extended their previous study to examine the results of mutual fund performance extracted by employing standard mean-variance formulations with the results of mutual fund performance derived by applying several DEA formulations. They arrived at two conclusions. Their first conclusion is that the scores of relative efficiency cannot decline when the models extend in variables. In fact, scores can only improve or remain unchanged. Second, they concluded that, the “true” mean-variance-skewness or mean-variance efficiency scores are always less than the DEA results (unless when both are efficient). In a subsequent research, Haslem and Scheraga (2003) suggested a DEA model and applied it to evaluate the performance of 84 large-cap funds. They proposed six variables to measure cost precisely, and entered them as inputs. These variables are achieved based on a production theoretic analysis. These variables (inputs) were cash, expense ratio, stocks, price/earnings ratio, price/book ratio, and fund total assets. They assigned the Sharpe index as an output variable. Therefore, the DEA outcomes show how the input cost variables contribute to the Sharpe ratio.
5
Basso and Funari (2003; 2005) employed the multi-criteria capability of DEA to measure the ethical mutual funds' performance. They considered the ethical component, subscription, redemption fees and risk as DEA inputs, and also the expected return of mutual funds as output. In an interesting study, Lozano and Gutierrez (2008) asserted that most models of performance evaluation estimate risk (which is related to the endogenous index mutual portfolio) greater than it actually is, as in conventional models (such as DEA) the risk of mutual funds is calculated as a linear combination of mutual fund assets. In other words, the effect of diversification is neglected. Thus, they proposed a new DEA model combined with second-order stochastic dominance (SSD) and proposed six distinct DEA linear programming models to compute the relative efficiency of mutual funds with SSD. The main advantage of this method is to consider the effects of portfolio diversification, which is neglected by the conventional DEA approaches. Recently, Zhao and Yue (2010) evaluated the funds management companies’ core competence through a multi-subsystem fuzzy data envelopment analysis (MFDEA) model. They divided core competence into marketing service competence and investment research competence. Although their results show relatively high managerial skills, competences are so distinctive among mutual funds management in the marketing and service part. Two quadratic-constrained DEA approaches are proposed by Zhao, Wang and Lai (2011). This model disintegrated risk and excess return as two significant factors of mutual fund performance evaluation into system risk information, non-system risk information, excess return from timing and excess return from selecting. This model attempts to highlight the root reason of each mutual fund’s relative efficiency.
However, the aforementioned literature does not consider (i) an/a enough and significant number of funds to minimize survivorship bias, (ii) management style of funds as surveying class, (iii) management and scale efficiency scores as evaluation measures, and (iv) other stochastic dominance measures in the DEA model framework.
3. Methodology and data
The DEA model measures the relative performance of decision making units and the score of relative efficiencies with multiple outputs and inputs. This model is conceptually defined by Eq. 1:
)1( InputsofSumWeighted
OutputsofSumWeightedEfficiency=
This is a linear programming model that was developed by Charnes et al. (1978; 1984). They
first proposed a model which had an input orientation and supposed constant returns to scale (CRS), and then extended the model based on a variable returns to scale (VRS) model.
3.1. The constant return to scale (CRS) To describe the CRS model, assume that there is a set of n decision making units and each
unit defines s output and m input. The relative performance score of each unit is defined by solving the following CRS model.

6
(2)
jkVu
i
XV
YU
toSubject
XV
YU
hMax
ir
m
iiji
s
rrjr
m
iiji
s
rrjr
,;0,
1
1
1
1
10
∀>
∀≤
=
∑
∑
∑
∑
=
=
=
=
Where r = 1 to s, i = 1 to m, j = 1 to n, rjY = amount of output r produced by DMUi, ijX =
amount of input j utilized by DMUi, Ur = weight given to output r, Vi = weight given to input i. Since the aforementioned model is a nonlinear Model, to solve it easily, we change the model
to a linear model with assumption of 11
=∑=
m
iiji XV ;
(3)
irVu
iXVYU
XVtoSubject
YUhMax
ir
m
iiji
s
rrjr
m
iiji
s
rrjr
,;0,
0
1
11
1
10
∀≥
∀≤−
=
=
∑∑
∑
∑
==
=
=
This linear programming model should be run n times (the number of surveyed DMUs) to
compute the scores of relative performance of each DMU. This score is derived from the input and output weights of each DMU. Those DMUs getting a score of 1 are efficient and the others getting a score of less than 1 are inefficient.
3.2. The variable return to scale (VRS) The CRS assumption is only appropriate when all management styles are operating at an
optimal scale. Many factors (i.e., constraints on finance, imperfect competition, etc.) may cause a management style to not operate at the optimal scale. Banker et al. (1984) proposed a development of the CRS DEA model to compute the VRS situations. The utilizing of the CRS specification when not all management styles are operating at the optimal scale will lead to measures of technical (relative) efficiency, which are confounded by scale efficiency. Thus, the CRS model can be easily justified to compute VRS by adding the convexity constraint of
1=′λIN to Eq. 4:

7
(4)
θMin
ST ∑∑==
≥+−s
rijj
s
rrjr YYu
11
0λ
01 1
≥−∑ ∑= =
m
i
m
iijjiji XXv λθ
0≥λ 1=′λIN Where NI’ is an N×1 vector of one. The calculated technical efficiency by the VRS model is
divided into management efficiency and scale efficiency. To compute the scale efficiency, many studies have decomposed the technical efficiency
scores obtained from a CRS DEA into two components – scale inefficiency and pure technical inefficiency. This may occur by computing both a CRS and a VRS on the same data. If there is a difference in the two technical efficiency scores for a given DMU, this shows that the DMU has scale inefficiency, and that the scale inefficiency can be computed by the difference between the VRS technical score and the CRS technical score. One shortage of scale efficiency measure is that the value does not detect whether the DMU is operating in an area of the increasing or decreasing returns to scale. This may be determined by running an additional DEA problem with non-increasing return to scale (NIRS) imposed. This can be done by altering the DEA model in Eq (4) by substituting the 1=′λIN restriction with 1≤′λIN , as follows:
(5)
θMin
TS. ∑∑==
≥+−s
rijj
s
rrjr YYu
11
0λ
01 1
≥−∑ ∑= =
m
i
m
iijjiji XXv λθ
1≤′λIN 0≥λ The nature of the scale inefficiencies (i.e., due to increasing or decreasing returns to scale) for
a particular management style can be determined by seeing whether the non-increasing return to scale of technical efficiency score is equal to the VRS technical efficiency score. If they are unequal, then increasing returns to scale exist for that management style. If they are equal then decreasing returns to scale apply. Moreover, the management efficiency is derived by dividing the technical efficiency into scale efficiency.
3.3. Prioritization of efficient DMUs After calculating the managers’ efficiency of each management style, since it is possible to
have more than one efficient style, the DEA ranks the efficient and reference styles in terms of two methods, namely, the number of references and the weighted method. The ranking of DMUs is done by Eq. 6:

8
(6)
:.TS
MaxDk
0...)( 22111111 ≥+++− λλ YYYDk Μ
0...)(
0...)(
22111111
22111
≥++−
≥+++−
λλλλ
XXX
YYYD jjjk
Μ
0...)( 22111 ≥++− λλ iii XXX
Where kD is inverse efficiency of kth DMU, tλ is decision variable, jY1 is j th output for first
DMU, and iX1 is i th input for the first DMU (style).
It is clear that if the kth value of jλ equals zero, calculating the efficiency of kth DMU means
that the j th DMU is not a reference for that DMU. The positive values show that the DMU is efficient. Accordingly, the number references by a DMU can be calculated. Moreover, the sum of
the values of jλ after solving linear programming model is considered as DMU weight, which
can be used for ranking. 3.4. Data This research goes through the effect of different kinds of management styles on mutual
funds performance. The 20 kinds of management style are provided based on the classification of the Bloomberg Database. Accordingly, the monthly data of 17,686 US mutual funds for a five-year period, 2005-2010, through the Bloomberg Database are collected to minimize the impact of survivorship bias.
4. Research inputs and outputs
Each decision-making unit refers to a given management style category of mutual funds and this study tends to evaluate the managers’ efficiency of these categories according to the aforementioned methodology. Accordingly, this research applied several criteria, comprising one measure of return and one measure of stochastic dominance in three different forms for the
outputs ijY to be taken into account. As well as both the costs and risk criteria of mutual funds for
the outputs ijX to be considered. Due to the fact that inputs represent management activity
instead of costly raw materials and because the ultimate purpose of the study is outputs produced by that activity, this study uses the output-oriented approach for two approaches of CRS and VRS.
Inefficient management styles may be projected to the efficiency frontier in one of three directions. In the output orientation, the projection is made by increasing at least some outputs until the management style (DMU) moves up to the efficiency frontier without decreasing any other outputs and without increasing any inputs. In contrast, in the input orientation at least some inputs are reduced until the management style moves back toward the efficiency frontier without increasing any other inputs and without decreasing any outputs. Finally, the third approach both reduces input excesses and increases output shortfalls to project the inefficient DMU to the efficiency frontier at some point between the points of output-oriented and input-oriented projection.
9
Since the role of inputs and outputs are considerable in the DEA model, they are introduced as follows:
4.1. Inputs Murthi et al. (1997) in their study employed the mutual fund costs and fees, including
subscription fees, redemption fees, operational expenses, purchase and sale costs and management fees, as one of the DEA inputs. They stated that, all costs are integrated in the expense ratio, loads and turnover indicators. In a similar paper, Daraio and Simar (2005) also claimed that costs and fees are made by Expense Ratio, Loads and Turnover Ratio, so they consider them as their DEA model inputs. In this research these three indicators were used as our model inputs to reflect the role of mutual fund costs and fees in the mutual fund performance.
Expense Ratio - The interactions between the performance of mutual funds and fund costs and fees have been explained in many studies. Addressing the expense issue, the early work of Elton et al. (1993) and Carhart (1997) found a high relationship between mutual fund performance and mutual fund expenses. They explained that mutual funds with high expense ratios have under performed. Mutual funds have a good financial status benefit from the increased size of their funds not by raising their costs and fees.
Turnover - The study of Friend et al. (1970) in this thread showed that a positive relationship
between mutual fund turnover and mutual fund performance exists. The study of Daraio and Simar (2006) in this thread mentioned that “turnover gives an indication of trading activity: funds with higher turnover (implying more trading activity) incur greater brokerage fees for affecting the trades”.
Load Cost - Ippolito (1989) presented that “load funds generally earn sufficiently higher rates of return compared with no-load funds to pay for the extra charges”. In another paper in this line, Sirri and Tufano (1998) also found a relationship between mutual fund performance and load cost.
Beta Coefficient - The second kind of input indicator for our DEA model is the Beta index.
Although researchers are not unanimous in employing a similar risk measure, all believe that the risk parameter is one of the most important variables affecting the performance of mutual funds. There are many techniques to quantify risk employed in different performance measures. However, most methods utilized standard deviation and beta. Murthi et al. (1997) employed the standard deviation as the measure of risk. Consequently, Basso and Funari (2001) captured standard deviation and Beta as DEA inputs. They justified the selection of two risk measures and explained that the standard deviation of the returns is a proper risk measure for the investors who only hold one risky asset, and the Beta coefficient is for the investors who have diversified their investments. Chang (2004) also applied standard deviation and beta coefficient as inputs in his DEA model. Thus, this study uses Beta coefficient as a risk measure because beta quantifies a fund’s volatility relative to the market as well as the beta measure commonly used for portfolio performance.
4.2. Outputs
Return - The most fundamental factor for mutual fund appraisal in both the parametric and
non-parametric methods is the return on mutual fund, since all investors require a maximum return with minimum risk. To measure the return of portfolio and assets, some methods employ mean return, while others use excess return. Basso and Funari (2001) took mean return as the

10
output of their DEA model. Galagadera and Silvapulle (2002), Chang (2004) and Daraio and Simar (2006) applied the mean return as the output of the DEA model as well. However, Murthi et al. (1997) employed the excess return as the output. Excess return was also used by Chen and Lin (2006), and Hsu and Lin (2007) as the output of the DEA model. This paper applies the mean return as one of the DEA model outputs as the mean return leads to a decrease in the presence of negative values.
DARA, CARA, and IARA - So far, some papers used a stochastic dominance indicator as
output of the DEA model. Two concepts of the time occurrence of the returns and the investors’ preference structure are reflected by the stochastic dominance index. This index is analyzed by giving a higher rank to the funds not dominated by other funds.
To apply stochastic dominance, although there is no need for any assumptions regarding the functional shape of the return distribution, it employs any function that is able to characterize a cumulative probability distribution. These stochastic dominance characteristics are consistent with the features of nonparametric methods, especially the DEA model. Basso and Funari (2001) were the first researchers who used a stochastic dominance indicator as one of the outputs of their DEA model. They clearly stated that a highly desirable property for a mutual fund is that it is not dominated by other funds – only the non-dominated portfolios can be considered efficient – which can easily happen in an analysis of mutual fund returns over a long period. A fund turns out to be dominated in some years but not in others. Accordingly, a stochastic dominance indicator, which could be usefully included in the DEA mutual fund performance evaluation, can be defined by determining in how many periods (over the overall number of periods considered in the analysis of the historical data) a fund is efficient according to a given stochastic dominance criterion. Basso and Funari (2003) utilized decreasing absolute risk aversion (DARA) as output for the DEA model. Similarly, Chen and Lin (2006), and Lozano and Gutierrez (2008) followed the Basso and Funari’s model and applied the DARA index in the DEA model.
Thus, this study proposes an appropriate stochastic dominance criterion to each mutual fund corresponding to investors’ preferences (manager’) and investors’ attitude (managers’) towards risk. There are three kinds of attitude towards risk: � Risk averse: If an investor is presented with two kinds of investments (both provide a
similar return but different risks), and he prefers the investment with the lower risk, then he is called risk averse (U’’ ( 0) <0).
� Risk Neutral: If an investor is only concerned with an investment's return and overlooks risk, then he is called risk neutral (U’’ ( 0) =0).
� Risk Seeking: if an investor prefers to take big risks to raise the potential return on investments, then he is called risk seeking (U’’ ( 0) >0).
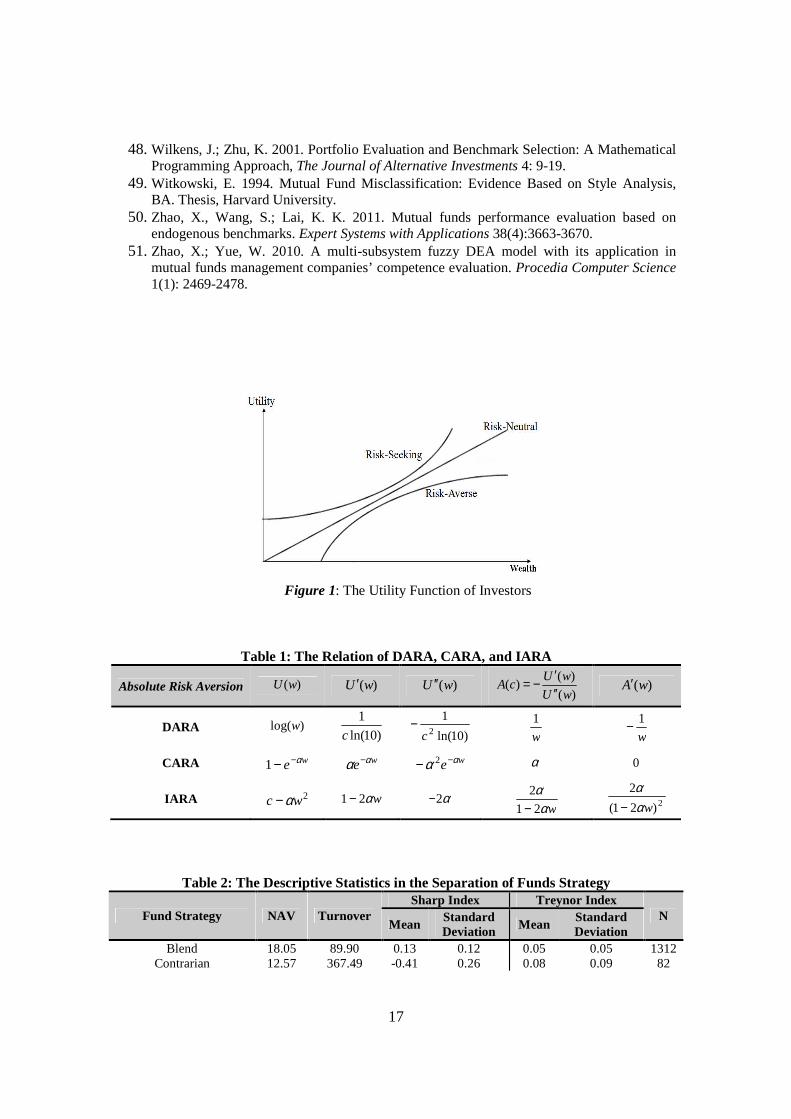
U'' is the second derivative of the utility function of wealth. The utility functions are models that describe an investor’s attitude toward risk. Figure 1 shows the relationship between investor’ wealth and investor’s utility from three different aspects;
Insert Fig. 1 here. These attitudes toward risk can be expressed in a mathematical form as follows:
It is the second derivative of the utility function of wealth. The utility function is able to describe the effect of fluctuations in wealth on investor preferences. An investor exhibits three kinds of absolute risk aversion as follows:
� Decreasing absolute risk aversion (DARA): If investor demand for investing in risky
assets increases as his wealth rises. � Constant absolute risk aversion (CARA): If investor demand for investing in risky assets
keeps the same as his wealth changes. � Increasing absolute risk aversion (IARA): If investor demand for investing in risky assets
decreases as his wealth rises.

11
Arrow (1971) and Pratt (1964) designed a coefficient of absolute risk aversion to show how
investors behave. This coefficient of absolute risk aversion is defined as:
(7) )(
)()(
wu
wuwA
′′′
−=
The first derivative of A(W) at wealth is defined as an index of how absolute risk aversion
behaves with changes in wealth. Now, absolute risk aversion can be calculated with respect to A'(W) as follows:
� Increasing absolute risk aversion A'(W) >0 � Constant absolute risk aversion A'(W) =0 � Decreasing absolute risk aversion A'(W) <0 The functions of absolute risk aversion are unique. Thus, the first and second derivatives of
utility functions at wealth can be easily computed. In the next stage, the coefficients of absolute risk aversion with Arrow and Pratt’s measure are obtained. Finally, by the first derivative of the absolute risk aversion coefficient, three measures of DARA, CARA and IARA are computed and presented in Table 1.
Insert Table 1 here. It is necessary to mention that this study uses Net Asset Value (NAV) of mutual funds instead
of the wealth (W) variable. There are three different Stochastic Dominance measures used. Accordingly, the DEA model is run three times, and each time one of the measures of absolute risk aversion is considered as the output of our DEA model.
5. Empirical Evidence
This study tests the DEA model for different classifications of fund strategies discussed in the prior sections on all data available for the American market. This paper captures the annual returns of 17,555 funds. These funds belong to a variety of categories of fund strategies involving Blend, Contrarian, Current Income, Emerging Market, Equity Income, First Tier, Geographically Focused, Government & Agency, Growth, Growth & Income, Index Fund, Long-Short, Market Neutral, Principal Preservation, Sector Fund, Total Return, and Value. The DEA model empirically evaluates the managers’ efficiency of each of the aforementioned classifications. This study utilizes the mean return along with three dominance relations of CARA, DARA, and IARA as the output of funds, besides the four inputs – fund turnover, expense ratio, load cost, and variance. Then 17 distinguished linear programming models are run to compute the efficiency scores of technical (relative), management, and scale consistent based on the aforementioned input and output. In order to compare the fund strategies performance with the behavior of a market benchmark, this paper utilizes three conventional measures –Sharpe, Treynor, and Jensen’s alpha – to investigate the correlation between each of the three efficiencies (technical, management, and scale) with the market benchmark indexes.
Table 2 reports the descriptive statistics for the 17 categories of American funds strategies. It shows an average of net asset value for each fund strategy in the range of 1 to 27.72 billion dollars. The second column shows the five-year average of fund turnover, which represents substantial trading activity in fund strategies. The next column represents the 5-year mean and standard deviation of any strategy for the two conventional measures of Sharpe and Treynor, respectively. The last column also shows the number of funds in each of the American fund strategies.

12
Insert Table 2 here. Then the CRS model assuming constant returns to scale for computing technical (relative)
efficiency is used, in addition, the VRS model assuming variable returns to scale is applied to compute management and scale efficiency. Thus, considering the two aforementioned models, first the DEA model is computed in the DARA framework with the two output variables of DARA and return and four input variables of fund turnover, expense ratio, load cost, and variance. Table 3 shows the results of the DARA model, in which six fund strategies – Contrarian, First Tier, Government & Agency, Growth & Income, Index Fund, and Principal Preservation – have the highest technical (relative), management, and scale efficiency scores compared to the others. The average numerical value of the three efficiencies is 0.81, 0.921, and 0.874, which means that assuming all other conditions are fixed, the three efficiencies of relative, management, and scale have empty capacity equal to 0.19, 0.079, and 0.126, respectively.
Insert Table 3 here. One of the most important objectives of the DEA model is to determine the reference fund
strategies for inefficient fund strategies. Therefore, this study also identifies the reference strategies based on the results of software Deap2, as shown in Table 4.
Table 4 represents the reference strategies for each mutual fund separately (i.e., three strategies for Contrarian, Growth & Income, and Index Fund, which, respectively, are a reference strategy for Blend or four strategies for Contrarian, First Tier, Growth & Income, and Index Fund, which are a reference for Current Income). These interpretations can be followed for other fund strategies, meaning that each fund strategy manager must consider the performance of its own preference strategies as a pattern to achieve a level of efficiency in future. As shown in Table 4, the efficient strategies (i.e., Contrarian and Government & Agency) are self-referenced.
Insert Table 4 here. Since the six fund strategies in this study are determined as reference, the DEA model is able
to rank each reference strategy. Using two methods – “number of referencing” and “weighted number of references” – this study ranks each reference strategy with each other. To rank the strategies based on the first method, the number of referencing is computed for each efficient strategy after running the 17 linear programming models. A strategy will become a reference unit, if its efficiency score has the highest frequency, in which case it will receive the highest rank. To rank the strategies based on the second method, the weighted average is calculated for each efficient fund strategy and their ranking is done according to the weighted average of each efficient unit when they are preferred. (Table 5).
Insert Table 5 here. Subsequently, the two methods of CRS and VRS are again utilized to compute the DEA
model in the CARA framework while considering two output variables of CARA and return and four input variables of fund turnover, expense ratio, load cost, and variance. Table 6 shows the results of the DEA model of CARA, in which three fund strategies – Contrarian, First Tier, and Government & Agency – simultaneously have the highest technical, management, and scale efficiency scores are compared to the others. The average numerical values of the three efficiencies are 0.463, 1, and 0.463, respectively, which means that assuming all other conditions being fixed, the two efficiencies of relative and scale, similarly, have considerable empty capacity equal to 0.537.
To determine the preference strategies, the evidence of table 6 shows that the six fund strategies are referred to each other. Moreover, the ranking of preference of fund strategies based on the method of the number of referencing shows that three fund strategies – Principal Preservation, Contrarian, and Current Income – have the highest rankings, while the ranking of the method of the weighted number of references detects that three strategies – Principal Preservation, Current Income, and Contrarian – have the highest ranking, respectively.
Similarly, the DEA model is computed in the IARA framework while considering the two output variables of IARA and return and four input variables of fund turnover, expense ratio, load

13
cost, and variance. Table 7 shows the results of the model IARA, where similar to the CARA model, three fund strategies – Contrarian, First Tier, and Government & Agency – have the highest technical, management, and scale efficiency scores compared to the others. The average numerical values of the three efficiencies are 0.286, 0.611, and 0.383, respectively, which means that assuming all other conditions being fixed, three efficiencies have considerable empty capacity equal to 0.714, 0.389, and 0.617, which is worse than the CARA model.
To determine the preference strategies, the evidence of Table 6 shows that ten fund strategies are referenced for the surveying fund strategies. In addition, the ranking of preference fund strategies based on the method of the number of referencing and the weighted number of references shows that three fund strategies – Government & Agency, Contrarian, and First Tier –are respectively ranked among the surveying fund strategies.
Insert Table 6 here. Insert Table 7 here. In order to compare the fund strategies performance with the behavior of a market benchmark
(Table 8), this study makes the correlation between three conventional measures of Sharpe, Treynor, and Jensen’s alpha with each of the three efficiencies computed by the DEA model involving technical (relative), management, and scale efficiency. Table 9 represents the correlation coefficients between three DEA models – CARA, DARA, and IARA – with three conventional measures – Sharpe, Treynor, and Jensen’s Alpha. The evidence shows that the average correlation coefficient of the DARA Model for technical (relative) efficiency is 0.54, while the average of this coefficient for the CARA and IARA models is, respectively, 0.61 and 0.57. For management efficiency, the average of the correlation coefficients for DARA, CARA, and IARA, respectively, are 0.48, 0.62, and 0.56. Similarly the results of the correlation coefficients of IARA are almost similar to DARA, in which the three models of DARA, CARA, and IARA have numerical values equal to 0.52, 0.61, and 0.56, respectively. In addition, the values of the Sharpe, Treynor, and Jensen’s alpha measures have been normalized by dividing the values by the highest value.
Insert Table 8 here. Insert Table 9 here.
6. Conclusion
The methodology of this paper proposes a replacement approach to evaluate the performance of mutual fund managers. More specifically, this study combines the DEA model and stochastic dominance criteria and proposes two new measures in the form of CARA and IARA dominance relations along with the DARA model previously suggested by Basso and Funari (2001) to evaluate the technical (relative), management, and scale efficiency of 17,555 American mutual funds. The three DEA models being proposed in the form of CARA, DARA, and IARA are used to evaluate the managers’ efficiency of management styles. Unlike prior studies that compute the technical efficiency on the funds, this paper extends the analysis on two other efficiencies, namely, management and scale. In addition, this study computes the efficiency scores and determines the preference strategy for each fund strategy.
The evidence shows that the scores of technical, management, and scale efficiency are respectively 0.81, 0.921, and 0.874 for the DARA model, while the efficiency scores of the CARA and IARA models are negligible. Moreover, each fund strategy in any model is ranked based on two methods – the number of referencing and the weighted number of references – so that the managers of inefficient strategy must consider and pattern the managers’ ability of reference (efficient) strategies to improve its efficiency on the fund market in future.
Finally, since the average correlation coefficient between the IARA model and the three conventional measures – Sharpe, Treynor, and Jensen’s alpha – is higher than the two other models, it is able to provide a better explanation of the DEA model than the others.

14
As a proposition for future studies, the three DEA models in the DARA, CARA, and IARA framework can be investigated in terms of the cross DEA model to improve the results.

15
References 1. Arrow, K.J. 1971. Essays in the theory of risk-bearing, Markham. 2. Babalos, V.; Kostakis, A.; Philippas, N. 2009. Managing mutual funds or managing
expense ratios? Evidence from the Greek fund industry, Journal of Multinational Financial Management 19(4): 256-272.
3. Banker, R.D.; Charnes, R.F.; Cooper, W.W. 1984. Some Models for Estimating Technical and Scale Inefficiencies in Data Envelopment Analysis, Management Science 30(9): 1078–1092.
4. Banker, R. D.; Maindiratta, A. 1986. Piecewise loglinear estimation of efficient production surfaces, Management Science 32(1):126-135.
5. Basso, A.; S. Funari. 2001. A data envelopment analysis approach to measure the mutual fund performance, European Journal of Operational Research 135(3): 679-698.
6. Basso, A.; Funari, S. 2003. Measuring the Performance of Ethical Mutual Funds: A DEA Approach, The Journal of the Operational Research Society 54(5):521-531.
7. Basso, A.; Funari, S. 2005. Performance evaluation of ethical mutual funds in slump periods. Econ working paper.
8. Bertin, W.J.; Prather, L. 2009. Management structure and the performance of funds of mutual funds, Journal of Business Research 62(12): 1364-1369.
9. Brown, S.J.; Goetzmann, W.N. 1995. Performance Persistence, Journal of Finance 50(2): 679 - 698.
10. Carhart, M.M. 1997. On persistence in mutual fund performance, Journal of Finance 52(1): 57–82.
11. Chang, K.P. 2004. Evaluating mutual fund performance: an application of minimum convex input requirement set approach, Computers & Operations Research 31: 929-940.
12. Charnes, A.; Cooper, W. W. 1984. Preface to topics in data envelopment analysis, Annals of Operations Research 2(1): 59-94.
13. Charnes, A., Cooper, W. W.; Rhodes, E. 1978. Measuring the efficiency of decision making units, European Journal of Operational Research 2(6):429-444.
14. Chen, Y.-c., Chiu, Y.-h.; Li, M.-c. 2011. Mutual Fund Performance Evaluation – Application Of System Bcc Model. South African Journal of Economics 79(1): 1-16.
15. Chen, Z.; Lin, R. 2006. Mutual fund performance evaluation using data envelopment analysis with new risk measures, Or Spectrum 28(3): 375-398.
16. Choy, Y.K.; Murthi, B.P.S. 2001. Relative Performance Evaluation of Mutual Funds: A Non-Parametric Approach, Journal of Business Finance & Accounting 28(7): 853-876.
17. Christopherson, J. A. 1995. Equity style classifications, The Journal of Portfolio Management 21(3): 32-43.
18. Daraio, C.; Simar, L. 2006. A robust nonparametric approach to evaluate and explain the performance of mutual funds, European Journal of Operational Research 175(1): 516-542.
19. Detzel, F. L.; Weigand, R. A. 1998. Explaining persistence in mutual fund performance, Financial Services Review 7(1):45-55.
20. Elton, E. J. Gruber, M. J. Das, S; Hlavka, M. 1993. Efficiency with Costly Information: A Reinterpretation of Evidence from Managed Portfolios, Review of Financial Studies 6(1):1-22.
21. Fama, E.F.; French, K.R. 1993. Common risk factors in the returns on stocks and bonds, Journal of Financial Economics 33(1): 3-56.
22. Ferris, S.P.; Yan, X. 2009. Agency costs, governance, and organizational forms: Evidence from the mutual fund industry, Journal of Banking & Finance 33(4): 619–626.
23. Friend, I.; Blume, M. E. 1970. Measurement of Portfolio Performance Under Uncertainty, American Economic Review 60(4): 561-575.

16
24. Galagadera, U.A.; Silvapulle, P. 2002. Australian mutual fund performance appraisal using data envelopment analysis, Managerial Finance 28 (9), 60–73.
25. Grinblatt, M.; Titman, S. 1993. Performance Measurement without Benchmarks: An Examination of Mutual Fund Returns, Journal of Business 66(1): 47-68.
26. Haslem, J.A.; Scheraga, C.A. 2003. Data Envelopment Analysis of Morningstar’s Large-Cap Mutual Funds, Journal of Investing 12(4): 41-48.
27. Hsu, C.-S.; Lin, J.-R. 2007. Mutual Fund Performance and Persistence in Taiwan: A Non-Parametric Approach. The Service Industries Journal 27(5): 509-523.
28. Ippolito, R. 1989. Efficiency with costly information: a study of mutual fund performance, 1965-1984, Quarterly Journal of Economics 104, 1-23.
29. Jensen, C.M. 1968. The Performance of Mutual Funds in the Period 1945-1964, Journal of Finance 23(2): 389-416.
30. Joro, T.; Na, P. 2002. Data envelopment analysis in mutual fund evaluation: A critical review. University of Alberta School of Business management science, WP 02-2.
31. Joro, T.; Na, P. 2006. Portfolio performance evaluation in a mean–variance–skewness framework, European Journal of Operational Research 175(1): 446-461.
32. Karagiannidis, I. 2010. Management team structure and mutual fund performance, Journal of International Financial Markets, Institutions and Money 20(2): 197-211.
33. Khorana, A.; Servaes, H.; Wedge, L. 2007. Portfolio manager ownership and fund performance, Journal of Financial Economics 85(1):179-204.
34. Khorana, A.; Tufano, P.; Wedge, L. 2007. Board structure, mergers, and shareholder wealth: A study of the mutual fund industry, Journal of Financial Economics 85(2): 571-598.
35. kim, M.; Shukla, R.; Tomas, M.; 1995. Wolf in sheep’s clothing: Do mutual fund objectives tell the truth, working paper, Syracuse University, Syracuse NY.
36. Lozano, S.; Gutirrez, E. 2008. Data envelopment analysis of mutual funds based on second-order stochastic dominance, European Journal of Operational Research 189: 230-244.
37. Markowitz, H. 1952. Portfolio Selection, Journal of Finance 7(1): 77-91. 38. McMullen, P.; Strong, R. 1998. Selection of Mutual Funds Using Data Envelopment
Analysis, Journal of Business and Economic Studies 4(1), 1-12. 39. Morey, M.R.; Morey, R.C. 1999. Mutual fund performance appraisals: a multi-horizon
perspective with endogenous benchmarking, Omega 27(2): 241-258. 40. Murthi, B.P.S.; Choi, Y.K.; Desai, P. 1997. Efficiency of mutual funds and portfolio
performance measurement: A non-parametric approach, European Journal of Operational Research 98(2): 408-418.
41. Prather, L.; Bertin, W.J.; Henker, T. 2004. Mutual fund characteristics, managerial attributes, and fund performance, Review of Financial Economics 13(4): 305-326.
42. Pratt, J.W. 1964. Risk Aversion in the Small and in the Large, Econometrica 32(1/2):122-136.
43. Renneboog, L.; Ter Horst, J.; Zhang, C. 2008. The price of ethics and stakeholder governance: The performance of socially responsible mutual funds, Journal of Corporate Finance 14(3): 302-322.
44. Sharpe, W.F. 1966. Mutual Fund Performance, Journal of Business 39(1): 119-138. 45. Siggelkow, N. 2003. Why Focus? A Study of Intra-Industry Focus Effects, Journal of
Industrial Economics 51(2):121-150. 46. Sirri, E.R.; Tufano, P. 1998. Costly Search and Mutual Fund Flows, Journal of Finance
53(5):1589-1622. 47. Treynor, J. 1965. How to rate management of investment funds, Harvard Business Review
43(1): 63-75.
17
48. Wilkens, J.; Zhu, K. 2001. Portfolio Evaluation and Benchmark Selection: A Mathematical Programming Approach, The Journal of Alternative Investments 4: 9-19.
49. Witkowski, E. 1994. Mutual Fund Misclassification: Evidence Based on Style Analysis, BA. Thesis, Harvard University.
50. Zhao, X., Wang, S.; Lai, K. K. 2011. Mutual funds performance evaluation based on endogenous benchmarks. Expert Systems with Applications 38(4):3663-3670.
51. Zhao, X.; Yue, W. 2010. A multi-subsystem fuzzy DEA model with its application in mutual funds management companies’ competence evaluation. Procedia Computer Science 1(1): 2469-2478.
Figure 1: The Utility Function of Investors
Table 1: The Relation of DARA, CARA, and IARA
Absolute Risk Aversion )(wU )(wU ′ )(wU ′′ )(
)()(
wU
wUcA
′′′
−= )(wA′
DARA )log(w )10ln(
1
c
)10ln(
12c
− w
1
w
1−
CARA we α−−1 we αα − we αα −− 2 α 0
IARA 2wc α− wα21− α2− wα
α21
2
− 2)21(
2
wαα
−
Table 2: The Descriptive Statistics in the Separation of Funds Strategy
Fund Strategy NAV Turnover Sharp Index Treynor Index
N Mean
Standard Deviation Mean
Standard Deviation
Blend 18.05 89.90 0.13 0.12 0.05 0.05 1312 Contrarian 12.57 367.49 -0.41 0.26 0.08 0.09 82

18
Current Income 10.20 86.81 0.43 0.42 0.16 0.73 3454 Emerging Market 20.72 77.17 0.39 0.09 0.17 0.05 396
Equity Income 15.05 56.39 0.16 0.14 0.10 0.60 294 First Tier 1.03 1.29 -8.58 99.26 57.86 83.90 534
Geographically Focused 17.54 74.29 0.13 0.16 0.07 0.38 2304 Government & Agency 1 0.08 -7.33 47.92 6.76 5.42 332
Growth 20.30 97.15 0.17 0.12 0.07 0.14 2457 Growth & Income 21.97 55.50 0.10 0.11 0.04 0.02 195
Index Fund 27.72 127.75 0.12 0.13 0.05 0.05 630 Long-Short 12.72 259.87 -0.10 0.21 -0.08 0.17 129
Market Neutral 12.01 326.45 -0.17 0.48 -3.05 3.39 83
Principal Preservation 14.60 18.31 1.31 3.49 -1.12 1.97 21
Sector Fund 21.39 114.83 0.19 0.20 0.10 0.09 1320 Total Return 11.15 196.02 0.68 0.40 0.12 0.21 1805
Value 17.83 62.71 0.12 0.13 0.06 0.14 2207
Table 3: The Result of Different Efficiency with DARA
Fund Strategy Technical Efficiency
Management Efficiency
Scale Efficiency Scale Type
Blend 0.831 0.911 0.912 Drs Contrarian 1 1 1 -
Current Income 0.84 0.842 0.997 Irs Emerging Market 0.735 0.984 0.747 Drs
Equity Income 0.785 0.88 0.892 Drs First Tier 1 1 1 -
Geographically Focused 0.701 0.908 0.772 Drs Government & Agency 1 1 1 -
Growth 0.773 0.937 0.825 Drs Growth & Income 1 1 1 -
Index Fund 1 1 1 - Long-Short 0.468 0.811 0.576 Drs
Market Neutral 0.443 0.794 0.557 Drs
Principal Preservation 1 1 1 -
Sector Fund 0.674 0.935 0.72 Drs Total Return 0.73 0.732 0.998 Drs
Value 0.791 0.926 0.855 Drs Mean 0.81 0.921 0.874
Table 4: The Result of Determining the Preference Strategies
Fund Strategy Preference Strategy 1 Preference Strategy 2
Preference Strategy 3
Preference Strategy 4
Blend Contrarian Growth & Income
Index Fund -
Contrarian Contrarian - - -
Current Income Contrarian First Tier Growth & Income
Index Fund
Emerging Market Contrarian Growth & Income Index Fund -
Equity Income Growth & Income Index Fund - -

19
First Tier First Tier - - -
Geographically Focused Index Fund Growth & Income
- -
Government & Agency Government & Agency - - - Growth Growth & Income Index Fund - -
Growth & Income Growth & Income - - - Index Fund Index Fund - - - Long-Short Index Fund Contrarian - -
Market Neutral Contrarian Index Fund - -
Principal Preservation Principal Preservation - - -
Sector Fund Index Fund Growth & Income
- -
Total Return Index Fund Contrarian - -
Value Index Fund Growth & Income
- -
Table 5: The Ranking of Funds Strategy
Fund Strategy Index Fund
Growth &
Income Contrarian
First Tier
Government & Agency Principal Preservation
Number of Referencing
12 9 7 2 1 1
Weighted Number of References
7.065 6.133 1.581 1.121 1 1
Table 8: The Comparison of Conventional Measures and DARA, CARA, and IARA
Fund Strategy Conventional Measures Technical (Relative) Efficiency
Sharpe Treynor Jensen’s Alpha DARA CARA IARA
Blend 0.099 0.001 -0.185 0.824 0.36 0.116 Contrarian -0.313 0.001 -3.502 1 1 1
Current Income 0.324 0.003 0.194 0.84 0.447 0.184 Emerging Market 0.302 0.003 -0.508 0.735 0.269 0.102
Equity Income 0.121 0.002 0.636 0.785 0.338 0.111 First Tier -6.512 1 0.039 1 1 1
Geographically Focused 0.101 0.001 0.044 0.701 0.299 0.096 Government & Agency -5.559 0.117 0.288 1 1 1
Growth 0.136 0.001 -0.015 0.773 0.329 0.106 Growth & Income 0.081 0.001 -0.126 1 0.393 0.126
Index Fund 0.092 0.001 -0.427 1 0.49 0.157 Long-Short -0.078 -0.001 -1.620 0.468 0.236 0.196
Market Neutral -0.134 -0.053 -1.084 0.443 0.261 0.204
Principal Preservation 1 -0.019 -0.031 1 0.368 0.121
Sector Fund 0.146 0.002 1 0.674 0.293 0.094 Total Return 0.518 0.002 0.090 0.73 0.479 0.157
Value 0.099 0.001 0.092 0.791 0.301 0.097

20
Table 6: The Result of DEA Model 2 Using CARA
Fund Strategy
Efficiency
Scale Type
Preference Strategy Priority of References
Technical Management Scale 1 2 3 4 Number of referencing
weighted number
of reference method
Blend 0.36 1 0.36 drs Contrarian Principal
Preservation
Geographically Focused
Index Fund - -
Contrarian 1 1 1 Constant Contrarian - - - 6 1.54 Current Income 0.447 1 0.447 drs Current Income - - - 3 1.999
Emerging Market
0.269 1 0.269 drs Emerging Market
- - - 2 1.407
Equity Income 0.338 1 0.338 drs Principal
Preservation
Current Income
- - 1 0.382
First Tier 1 1 1 Constant First Tier - - -- 1 1
Geographically Focused
0.299 1 0.299 drs Emerging Market
Principal
Preservation - Contrarian 4 1.193
Government & Agency
1 1 1 Constant Government &
Agency - - - 1 1
Growth 0.329 1 0.329 drs Contrarian Principal
Preservation
Geographically Focused
- - -
Growth & Income
0.393 1 0.393 drs Current Income - Principal
Preservation
Geographically Focused
- -
Index Fund 0.49 1 0.49 drs Index Fund - - - 2 1.269 Long-Short 0.236 1 0.236 drs Long-Short - - - 2 1.124

21
Market Neutral 0.261 1 0.261 drs Geographically
Focused Contrarian - - - -
Principal
Preservation 0.368 1 0.368 drs
Principal
Preservation - - -
7
3.816
Sector Fund 0.293 1 0.293 drs - Contrarian - - - - Total Return 0.479 1 0.479 drs - - - - -
Value 0.301 1 0.301 drs Long-Short Equity Income
Principal
Preservation - - -
Mean 0.463 1 0.463 -

22
Table 7: The Result of DEA Model 3 Using IARA
Fund Strategy
Efficiency
Scale Type
Preference Strategy Priority of References
Technical Management Scale 1 2 3 4 Number of referencing
weighted number
of reference method
Blend 0.116 0.51 0.227 drs Government & Agency - - - - - Contrarian 1 1 1 Constant Contrarian - - - 5 1.63
Current Income 0.184 0.541 0.34 drs Contrarian Government & Agency - - - - Emerging Market 0.102 0.518 0.197 drs Government & Agency Contrarian - - - -
Equity Income 0.111 0.52 0.213 drs Government & Agency - - - - - First Tier 1 1 1 Constant First Tier - - - 1 1
Geographically Focused 0.096 0.51 0.188 drs Government & Agency - - - - - Government & Agency 1 1 1 Constant Government & Agency - - - 15 14.37
Growth 0.106 0.51 0.207 drs Government & Agency - - - - - Growth & Income 0.126 0.51 0.248 drs Government & Agency - - - - -
Index Fund 0.157 0.51 0.309 drs Government & Agency - - - - - Long-Short 0.196 0.604 0.325 drs Government & Agency Contrarian - - - -
Market Neutral 0.204 0.597 0.342 drs Government & Agency Contrarian - - - -
Principal Preservation 0.121 0.52 0.232 drs Government & Agency - - - - -
Sector Fund 0.094 0.51 0.185 drs Government & Agency - - - - - Total Return 0.157 0.52 0.302 drs Government & Agency - - - - -
Value 0.097 0.51 0.19 drs Government & Agency - - - - - Mean 0.286 0.611 0.383 - - - - - - -

23
Table 9: The Correlation Coefficients
DARA CARA IARA
Tec
hnic
al E
ffici
ency
DARA SHARPE TREYNOR JENSEN CARA SHARPE TREYNOR JENSEN IARA SHARPE TREYNOR JENSEN
DARA 1.00 1.00 1.00
SHARPE 0.14 1.00 0.65 1.00 0.71 1.00
TREYNOR 0.64 0.35 1.00 0.57 0.35 1.00 0.48 0.35 1.00
JENSEN 0.37 -0.04 0.33 1.00 0.21 -0.04 0.33 1.00 0.11 -0.04 0.33 1.00
Mean 0.54 0.36 0.58 0.41 0.61 0.49 0.56 0.37 0.57 0.50 0.54 0.35
Man
agem
ent E
ffici
ency
DARA 1.00 1 1.00
SHARPE 0.17 1.00 0.66 1.00 0.72 1.00
TREYNOR 0.52 0.35 1.00 0.58 0.35 1.00 0.44 0.35 1.00
JENSEN 0.21 -0.04 0.33 1.00 0.23 -0.04 0.33 1.00 0.07 -0.04 0.33 1.00
Mean 0.48 0.37 0.55 0.37 0.62 0.44 0.56 0.43 0.56 0.51 0.53 0.34
Sca
le E
ffici
ency
DARA 1.00 1.00 1.00
SHARPE 0.07 1.00 0.65 1.00 0.71 1.00
TREYNOR 0.59 0.35 1.00 0.57 0.35 1.00 0.45 0.35 1.00
JENSEN 0.42 -0.04 0.33 1.00 0.21 -0.04 0.33 1.00 0.08 -0.04 0.33 1.00
Mean 0.52 0.34 0.57 0.43 0.61 0.49 0.56 0.37 0.56 0.50 0.53 0.34