The Effects of Workload and Decision Support Automation on Enroute R-Side and D-Side Communication...
22
DOT/FAA/AM-01/20 Larry L. Bailey Ben F. Willems* Linda M. Peterson Civil Aerospace Medical Institute Federal Aviation Administration Oklahoma City, OK 73125 *William J. Hughes Technical Center Federal Aviation Administration Atlantic City International Airport, NJ 22161 December 2001 Final Report This document is available to the public through the National Technical Information Service, Springfield, VA 22161. The Effects of Workload and Decision Support Automation on Enroute R-Side and D-Side Communication Exchanges Office of Aerospace Medicine Washington, DC 20591 U.S. Department of Transportation Federal Aviation Administration
Transcript of The Effects of Workload and Decision Support Automation on Enroute R-Side and D-Side Communication...

DOT/FAA/AM-01/20
Larry L. BaileyBen F. Willems*Linda M. Peterson
Civil Aerospace Medical InstituteFederal Aviation AdministrationOklahoma City, OK 73125
*William J. Hughes Technical CenterFederal Aviation AdministrationAtlantic City International Airport, NJ 22161
December 2001
Final Report
This document is available to the publicthrough the National Technical InformationService, Springfield, VA 22161.
The Effects of Workload andDecision Support Automation onEnroute R-Side and D-SideCommunication Exchanges
Office of Aerospace MedicineWashington, DC 20591
U.S. Departmentof Transportation
Federal AviationAdministration

N O T I C E
This document is disseminated under the sponsorship ofthe U.S. Department of Transportation in the interest of
information exchange. The United States Governmentassumes no liability for the contents thereof.

i
Technical Report Documentation Page
1. Report No. 2. Government Accession No. 3. Recipient's Catalog No.
DOT/FAA/AM-01/20
4. Title and Subtitle 5. Report Date
December 2001The Effects of Workload and Decision Support Automation onEn Route R-Side and D-Side Communication Exchanges
6. Performing Organization Code
7. Author(s) 8. Performing Organization Report No.
Bailey, L. L.1, Willems*, B.F.2, and Peterson, L.M.1
9. Performing Organization Name and Address 10. Work Unit No. (TRAIS)1FAA Civil Aerospace MedicalInstituteP.O. Box 25082Oklahoma City, OK 73125
2FAA William J. Hughes TechnicalCenterAtlantic City InternationalAirport, NJ 22161
11. Contract or Grant No.
12. Sponsoring Agency name and Address 13. Type of Report and Period Covered
Office of Aerospace MedicineFederal Aviation Administration800 Independence Ave., S.W.Washington, DC 20591 14. Sponsoring Agency Code
15. Supplemental Notes
This report was performed under Task HRR518.16. Abstract
The Federal Aviation Administration (FAA) is introducing new decision aid technology, called decision support tools(DSTs), into the air traffic control (ATC) workforce. Although considerable research has focused on the effects thatDSTs will have on pilot-controller communications, relatively little research has been conducted on how DSTs will affectcontroller-controller communications. In this study, we examined the effects that aircraft density and different types ofDSTs have on the communication exchanges occurring within en route ATC teams. Two hypotheses guided theresearch. Hypothesis 1: More communication exchanges will occur under high workload conditions, as compared withlow workload conditions. Hypothesis 2: More communication exchanges will occur when using DSTs, as compared withnot using DSTs. Method. Eight 2-person teams, consisting of certified ATC specialists from an en route center,participated in a decision support automation research experiment. In the experiment communication exchanges of teammembers were assessed within a 2 (aircraft density) X 3 (type of DST) repeated measures design. Communications wereanalyzed by an ATC subject matter expert using an FAA ATC communication taxonomy consisting of three categories:the topic of communication, the grammatical form of communication, and the mode of communication. Results. A totalof 3,194 communication events were coded. Partial support was achieved for hypothesis 1. When communications wereanalyzed as a composite number, no statistically significant results were observed. However, when the categories wereanalyzed separately, main effects for aircraft density were observed for two communication topics: generalcommunications about a specific aircraft, F(1,5) = 11.25. p < .05, and communications involving altitude changes,F(1,5) = 10.66, P < .05. In both cases, there were more communications associated with the high-aircraft-densitycondition. No statistical support was achieved for hypothesis 2. However, trend data suggested partial support for thedominant topics of communication while performing under low aircraft density conditions. Conclusion. Controller-to-controller communications may be differentially affected by varying levels of aircraft density and technology employed.However, further replications are needed before a more definitive statement can be made.
17. Key Words 18. Distribution Statement
Document is available to the public through theNational Technical Information Service;
Air Traffic Control, Communication, Teamwork
Springfield, VA 2216119. Security Classif. (of this report) 20. Security Classif. (of this page) 21. No. of Pages 22. Price
Unclassified Unclassified 20Form DOT F 1700.7 (8-72) Reproduction of completed page authorized


1
THE EFFECTS OF WORKLOAD AND DECISION SUPPORT AUTOMATION ON
EN ROUTE R-SIDE AND D-SIDE COMMUNICATION EXCHANGES
Federal Aviation Administration (FAA) forecastsindicate that the number of passengers carried oncommercial aircraft will double over the next 15 yearsreaching one billion by 2015 (FAA Plan to Modern-ize, 1998). To handle the projected increase in airtraffic, the FAA is introducing new technology to aidair traffic control specialists (ATCSs) in their tacticaland strategic decision making. Research previouslyfocused on the effects of these decision aids on pilot-to-controller communication; however, relatively littleresearch is available concerning the impact of decisionaids on controller-to-controller (CTC) communica-tion (Kanki & Pinzo, 1996). In this study, we exam-ined the effects of aircraft density and automateddecision aids on communication exchanges betweenen route air traffic control teams.
The National Civil Aviation Review Commissionstates that the expected growth in aviation cannot besafely accommodated without significant break-throughs in air traffic modernization. The commis-sion also cites air traffic communications as criticalcomponents requiring modernization in the aviationsystem (Aviation Financing, Air Traffic Control,1999). Several emerging air traffic control systems,including the 21st Voice Switching and Control Sys-tem (VSCS), Display System Replacement (DSR),and the User Request Evaluation Tool (URET) are indiffering stages of implementation. Researchers at theCivil Aerospace Institute (CAMI) and the William J.Hughes Technical Center (WJHTC) are jointly con-ducting investigations to assess the impact of moderniz-ing ATC communications. This research considers bothhardware and software aspects of ATC modernization.
The current joint program of research focuses onCTC communications as they relate to the coordina-tion of job-related tasks. The present study examinescommunication exchanges between En route SectorTeams (ESTs), also known as R-side and D-side airtraffic controller teams, performing under varyinglevels of workload and using various decision supporttools (DSTs). ESTs are composed of two individuals,a radar controller (R-side) and a data controller (D-side). The radar controller’s responsibilities includemonitoring aircraft, maintaining aircraft separation,and communicating via radio with the aircraft in their
airspace (i.e., sector). The data controller’s dutiesinclude maintaining flight progress strips, enteringNational Airspace System (NAS) data, coordinatingsector activities, and conducting intra-facility andinter-facility communication. The above functionsare coordinated through CTC communication.
Operational Error Data BaseTracking the number of operational errors is one
way of evaluating the quality of intra-EST coordina-tion. Broadly speaking, an operational error occurswhen a deviation from the standard operational pro-cedures (SOPs) leads to a loss of aircraft separation.For example, in the en route environment, aircraft atthe same altitude must be separated by at least fivehorizontal miles (FAA Order, 2000). Any time averified loss of separation occurs, an operational error(OE) is recorded in the FAA’s Operational Errordatabase, and an investigation is conducted to deter-mine the factors contributing to the loss of separation.
During an operational error investigation, an op-erational error reporting form is used to help deter-mine the factors contributing to the error. As shownin Table 1, the reporting form is divided into five errorcategories. These include errors associated with: (1)Data posting, (2) Radar display, (3) Communication(primarily pilot to controller), (4) Coordination, and(5) Position relief briefings.ÐW: Each error categoryis further divided into varying levels of specificity.
Of interest in this report are the “intra-position”errors associated with “Coordination.” In the en routeenvironment, intra-position coordination primarilyrefers to problems with EST coordination. Sincecommunication is the means by which the R-side andD-side coordinate their respective tasks, errors incoordination include errors in CTC communica-tions. Table 2 shows the number and percentage ofcoordination related OEs recorded in the FAA’s OEdatabase. For the period from January 1998 throughOctober 2000 approximately 126 out of 505 (25%)OEs were associated with problems of coordination.Of the 126 coordination errors (CEs) 45 (36%) oc-curred in the en route environment. A breakdown inintra-position coordination accounted for 13 out of45 (30%) en route coordination errors (ECEs).

2
Table 1.Structure of FAA ATC Operational Error Reporting Form
1. Data Posting c. Misunderstandinga. Computer entry d. Readback
(1) Incorrect input (1) Altitude(2) Incorrect update (2) Clearance(3) Premature termination of data (3) Identification(4) Other e. Acknowledgment
b. Flight progress strip f. Other(1) Not prepared(2) Not updated 4. Coordination(3) Posted incorrectly a. Area of incident(4) Reposted incorrectly (1) Inter-position(5) Updated incorrectly (2) Intra-position(6) Sequenced incorrectly (3) Inter-sector(7) Resequenced incorrectly (4) Inter-facility(8) Interpreted incorrectly b. An aircraft penetrated designated (9) Premature removal airspace of another position of operation(10) Other or facility without prior approval.
c. Coordination was effected and2. Radar display controller(s) did not utilize information
a. Misidentification exchange.(1) Overlapping data blocks (1) Aircraft identification(2) Acceptance of incomplete or (2) Altitudes/Flight level
difficult to correlated position info. (3) Route of flight(3) Improper use of identifying turn. (4) Clearance limit(4) Failure to reidentify aircraft when (5) Speeds
accepted target identity becomes (6) APREQSquestionable. (7) Special instructions
(5) Failure to confirm aircraft identity (8) Otherafter accepting radar handoff.
(6) Other 5. Position relief briefing deficiencies notedb. Inappropriate use of displayed data a. Employee did not used position relief
(1) Conflict alert Checklist(2) Quick look b. Employee being relieved gave(3) Mode C incomplete briefing(4) MSAW/EMSAW c. Relieving employee did not make use(5) Other of pertinent data exchanged at briefing
d. Other3. Communication error
a. Phraseologyb. Transposition

3
Based on the results of Table 2, it may appear thatintra-position coordination problems are not a majorfactor in the creation of operational errors. However,it should be noted that operational error investiga-tions occur after the fact. Since intra-EST communi-cations are not recorded on tape, an account does notexist of the actual communication exchanges betweenR-side and D-side positions. Controllers must rely ontheir memory to reconstruct both the content andtiming of the communication exchange being investi-gated. Thus, intra-EST communications may be afactor in the creation of OEs, but the current report-ing system is not sensitive enough to capture thedetails. Additionally not all intra-position coordina-tion problems produce an operational error. That is,a breakdown in coordination may occur but theproblem is resolved in time to prevent an operationalerror. Although there may be no loss of aircraft sepa-ration, from a safety perspective, even a potential lossof separation is a matter of concern. A research initia-tive revising the OE reporting form to address theseand other human factors related to the systematicanalysis of OEs is underway at CAMI (Scarborough &Pounds, 2001).
Even if intra-EST communications prove not to bea major factor in the development of OEs, the need toconduct research is not diminished. Empirical knowl-edge of the daily task-related communication ex-changes between R-side and D-side controllers islimited. Considering that the new DSTs are designedto enhance the tactical and strategic decision makingcapabilities of ESTs, further intra-EST communica-tion research is essential. What effect might these newtechnologies have on existing patterns of intra-ESTcommunications? Without an understanding of thecurrent baseline patterns of intra-EST communications,there is no empirical way to answer this question.
Field StudyGiven the lack of understanding of intra-EST com-
munications, Peterson, Bailey & Willems (in press)conducted a field study to determine the kinds andfrequency of intra-EST communication exchangesassociated with routine ATC performance. The fieldstudy was conducted over a three-day period at one ofthe FAA’s en route centers. Trained ATC specialistsusing the FAA’s Controller-to-Controller Communi-cation/Coordination Taxonomy (C4T) recorded atotal of 24 hours of intra-EST communication. Cod-ing occurred in 30-45 minute blocks of time betweenthe hours of 0700 and 1900. Coders chose to observethe most active sectors to ensure a sufficient numberof coding events. Thus, rather than obtaining a statis-tical sample, coders chose a sample of convenience.
The C4T has three communication categories: thetopic of communication, the grammatical form ofcommunication (e.g. question, answer), and the modeof communication (e.g. verbal, nonverbal). Thus theC4T captures the “what” (topic) and “how” (form andmode) of communication. Tables 3-5 respectivelydescribe the C4T sub levels within each of the threecategories. For further information on the develop-ment and operational validation of the C4T, thereader is referred to Peterson, Bailey and Willems (inpress).
A frequency analysis of the coding results indicatedthe following observations. The topic of most intra-EST communications was related to aircraft traffic(40%) and route of flight (15%), with the least com-munications involving inter-sector coordination ap-provals (1%). R-side and D-side controllersdemonstrated no statistical differences in the topic oftheir communication. However, they differed in thegrammatical form of their communication. Whereasthe D-side had a higher percentage of statements and
Table 2.Breakdown of En route Coordination Errors (1998-2000)
YearAll
ATCOEs
All ATCCoordinationErrors (CEs)
All En RouteCoordination
Errors (ECEs)Inter-Position
ECEIntra-Position
ECEInter-Sector
ECEInter-Facility
ECE
# %OE # %CE # %ECE # %ECE # %ECE # %ECE
1998 517 154 30% 47 31% 24 51% 11 23% 0 0 12 26%1999 627 167 27% 59 35% 30 51% 21 35% 0 0 8 14%2000* 371 58 16% 29 50% 19 66% 8 27% 0 0 2 7%Average 505 126 25% 45 36% 24 53% 13 30% 0 0 7 16%
* Through October 1, 2000

4
Table 4.Controller-to-Controller Coordination Communications Taxonomy (C4T): Coordination-CommunicationGrammatical Form.
ATC Coordination-Communication
Grammatical FormDefinitions
Question A direct inquiry about the state or status of sector events.
Answer A response to a direct or implied question
Statement Providing information, without being asked, about the state or status of sector events.
Command A direct order to perform a specific act
Table 3.Controller-to-Controller Coordination Communications Taxonomy (C4T):Coordination-Communication Topic
ATC Coordination-Communication
TopicDefinitions
ApprovalCommunications about intersector control/approval requests (“Get me control for descenton that aircraft.” “APREQ N1234 climbing to FL330.”).
HandoffCommunications relating to the transfer of radar identification of a particular aircraft(“Handoff N1234.” “Did you handoff N1234?”).
Point OutCommunications relating to the transfer of radar identification of a particular aircraft whenradio communications will be retained (“Point out N1234 to 22.”).
TrafficCommunications about a traffic situation involving a specific aircraft. Includes conflict,spacing, other protected air space or terrain and the resolution of that situation (“Are youwatching that aircraft?”).
AltitudeCommunications about altitude not in relation to traffic (“N1234 is requesting flight level220.”).
RouteCommunications regarding headings and/or amendments to route, not in relation to trafficsituations (“N1234 is on a 330 heading.” “Next sector, 27, wants N1234 over WEVER.”).
SpeedCommunications about speed not in relation to traffic situations (“These three aircraft areslowed to 250 knots.”).
WeatherCommunications about weather display or weather updates (Often communicatednonverbally by passing written information: “Sector 22 says continuous moderateturbulence above FL290.”).
FrequencyCommunications about an aircraft’s radio communications transfer or frequencyassignment (“Have you switched N1234 yet?” “Tell them to switch to N1234.”).
Flow MessagesCommunications about traffic flow restrictions not referring to a specific aircraft (“Thenext sector is requesting 25 miles in trail.”) (due to radar outage).
Flight StripsCommunications about flight progress strips (“Where is that strip?”) Often communicatednonverbally.
Equipment Communications about any ATC hardware (The radar is out of service.”).
Aircraft IDCommunications involving identifying a specific aircraft (Who was that who called?”“That was N1234 who called.”).
5
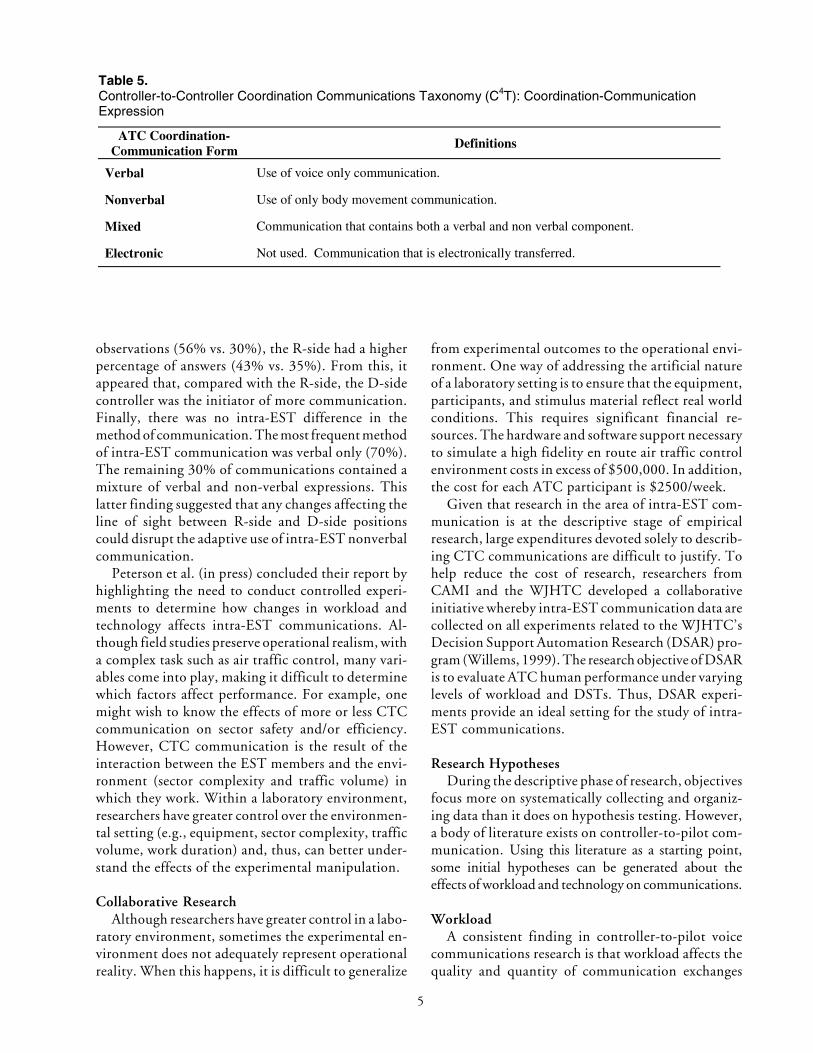
Table 5.Controller-to-Controller Coordination Communications Taxonomy (C4T): Coordination-CommunicationExpression
ATC Coordination-Communication Form
Definitions
Verbal Use of voice only communication.
Nonverbal Use of only body movement communication.
Mixed Communication that contains both a verbal and non verbal component.
Electronic Not used. Communication that is electronically transferred.
observations (56% vs. 30%), the R-side had a higherpercentage of answers (43% vs. 35%). From this, itappeared that, compared with the R-side, the D-sidecontroller was the initiator of more communication.Finally, there was no intra-EST difference in themethod of communication. The most frequent methodof intra-EST communication was verbal only (70%).The remaining 30% of communications contained amixture of verbal and non-verbal expressions. Thislatter finding suggested that any changes affecting theline of sight between R-side and D-side positionscould disrupt the adaptive use of intra-EST nonverbalcommunication.
Peterson et al. (in press) concluded their report byhighlighting the need to conduct controlled experi-ments to determine how changes in workload andtechnology affects intra-EST communications. Al-though field studies preserve operational realism, witha complex task such as air traffic control, many vari-ables come into play, making it difficult to determinewhich factors affect performance. For example, onemight wish to know the effects of more or less CTCcommunication on sector safety and/or efficiency.However, CTC communication is the result of theinteraction between the EST members and the envi-ronment (sector complexity and traffic volume) inwhich they work. Within a laboratory environment,researchers have greater control over the environmen-tal setting (e.g., equipment, sector complexity, trafficvolume, work duration) and, thus, can better under-stand the effects of the experimental manipulation.
Collaborative ResearchAlthough researchers have greater control in a labo-
ratory environment, sometimes the experimental en-vironment does not adequately represent operationalreality. When this happens, it is difficult to generalize
from experimental outcomes to the operational envi-ronment. One way of addressing the artificial natureof a laboratory setting is to ensure that the equipment,participants, and stimulus material reflect real worldconditions. This requires significant financial re-sources. The hardware and software support necessaryto simulate a high fidelity en route air traffic controlenvironment costs in excess of $500,000. In addition,the cost for each ATC participant is $2500/week.
Given that research in the area of intra-EST com-munication is at the descriptive stage of empiricalresearch, large expenditures devoted solely to describ-ing CTC communications are difficult to justify. Tohelp reduce the cost of research, researchers fromCAMI and the WJHTC developed a collaborativeinitiative whereby intra-EST communication data arecollected on all experiments related to the WJHTC’sDecision Support Automation Research (DSAR) pro-gram (Willems, 1999). The research objective of DSARis to evaluate ATC human performance under varyinglevels of workload and DSTs. Thus, DSAR experi-ments provide an ideal setting for the study of intra-EST communications.
Research HypothesesDuring the descriptive phase of research, objectives
focus more on systematically collecting and organiz-ing data than it does on hypothesis testing. However,a body of literature exists on controller-to-pilot com-munication. Using this literature as a starting point,some initial hypotheses can be generated about theeffects of workload and technology on communications.
WorkloadA consistent finding in controller-to-pilot voice
communications research is that workload affects thequality and quantity of communication exchanges

6
(e.g., Prinzo & Britton, 1993). In this literature,workload is primarily measured by the number ofaircraft at a given time (i.e., aircraft density) under thecontrol of a R-side ATCS. As aircraft density in-creases, there is a corresponding trend toward anincreasing number of communication errors (Morrison& Wright, 1989; Morrow, Lee, & Rodvold, 1990).Research suggests that, as ATCS and pilots becomeoverburdened the clarity of their communications(e.g., incomplete phraseology, mispronunciation, andrapid speech) begin to suffer. This, in turn, placesATCS and pilots at a higher risk of committingreadback/hearback errors (Morrison & Wright, 1989).Standard ATC protocol requires pilots and ATCS torepeat what they heard. The sender then knows thatthe message was accurately received. A readback/hearback error occurs when an incorrect pilot orATCS readback of information goes uncorrected.
In addition to communication errors, changes inworkload also affect the kinds of communicationexchanges that occur. For example, researchers atHuman Technology Incorporated (1991) examinedthe effects that ATC communications had on systemperformance. They found that high performance teamsissued more communication reports to pilots than didlower performance teams. Furthermore, compared tolow performance teams, high performance teams is-sued shorter messages as a means of insuring accuracy.Ratings of team performance were based on over-the-shoulder ratings conducted by ATC subject matterexperts. However, it remains to be seen whether theseresults will generalize to the broader ATC populationor are specific to a given experimental manipulation.
AutomationTechnology is sometimes considered to be the
answer for life’s problems. However, technology itselfcan become a burden. In studies of the use of automa-tion in the cockpit, Hart and Sheridan (1984) foundthat pilot workload shifted from a physical burden toa more cognitive one. This was evident when theautomation required pilots to serve as monitors of asystem such as monitoring cockpit flight managementsystem displays (Sarter & Woods, 1994). In studies ofthe use of automation in commercial airlines, Wiener(1985) noted that pilots found the additional task ofmonitoring to be troublesome especially during highworkload. Not only did monitoring add to the fatiguebut there were times when the automation needed tobe turned off or ignored during critical portions of aflight (Wiener, 1988).
In addition to the added burden that some tech-nologies create, operators may not use the technologyas designed because they simply do not trust it (Riley,1994). Technology promises much, but the reality isthat it sometimes falls short on delivery. For example,as part of its ATC modernization program, the FAAdeveloped new data display terminals and keyboardconfigurations. It was expected that the new systemwould help to improve system capacity. However,when the equipment was tested in a field setting, usersfound that they were having problems making thetransition to the new system (Allendoerfer, Galushka,& Mogford, 2000). Compared with performanceunder the old system, ATCSs were slower and tendedto make more data entry errors. Rather than viewingthis as simply a matter of adjustment, users attributedthe problems that they were having to poor systemdesign.. Although some sort of an adjustment periodwas expected, problems such as these emphasize theneed to switch from technology centered approachesto more human centered approaches to moderniza-tion. Whereas the former requires the human to adaptto the technology, the latter requires the technology toadapt to the needs of the user (Billings, 1988).
Although the use of technology is related toworkload, its effects on communication are unclear.From the concept of monitoring, an operator has noneed to communicate unless an event occurs requiringthe actions of another. As far as whether a giventechnology is used or trusted, one might conjecturethat communications would increase during the tran-sition period of adjusting to the new technology. Thiswould be true if there were problems with the technol-ogy and team members had to determine the level oftrust or confidence in the system. However, once thetransition period is completed (and assuming that thesystem is reliable), one would expect communicationsto return to a previous baseline.
Considering the above discussion, the followinghypotheses were derived.
Hypothesis 1: More intra-EST communicationexchanges will occur under high workload condi-tions, as compared with low workload conditions.
Hypothesis 2: More intra-EST communicationexchanges will occur when using DSTs, as comparedwith not using DSTs. This hypothesis is based on theassumption that there will be insufficient trainingtime for participants to feel fully comfortable with thenew system procedures.

7
Study LimitationsOne of the inherent difficulties with conducting
applied research is working within limitations. Twolimitations that affect this current research are a lackof statistical power and financial resources. Statisticalpower refers to the minimal sample size necessary fora given effect to reach statistical significance. As cellsizes fall below this minimum, a the ability to ad-equately test hypotheses is reduced.
Prior to conducting the experiments, researchersconducted a power analysis using software from theMethodologist’s Toolchest (Brent & Thompson,1996). The procedure is derived from Kraemer andTheimann (1987) for related samples balanced de-signs on pair-wise comparisons with a two-tailed testof significance. Assuming a mean difference of 2, anaverage standard deviation of 10, an alpha of .10, anda beta of .50, the results produced a minimum samplesize of 18 cases (or ESTs) or a total of 36 ATCSs.However, in this study, the available financial re-sources could only cover the cost of 8 ESTs or a totalof 16 ATCSs. As is often the case in applied settings,economic realities become the limiting factor in thequality of the studies conducted.
Given the above limitations, one might ask, is thereany real value in studying intra-EST communicationsin a laboratory setting? The answer, of course, de-pends on the value that is placed on inferential statis-tics. There exists the concern among part of thescientific community that, unless results achieve sta-tistical significance, they are not meaningful or arejust artifacts of sampling error (e.g., Branch, 1999).What gets lost is that statistical significance does notguarantee that the results will generalize to the broaderpopulation. Generalization depends on how the samplewas selected to ensure representation (i.e. generaliza-tion back to the population). Continuing with thepreceding example, let us assume that we have a popula-tion of 10,000 enroute ATCSs or 5,000 ESTs. Accord-ing to sampling theory, we would have to draw a randomsample of 357 ESTs to ensure that our sample representsthe enroute population. Sample computations weremade using the website calculator athttp://ebook.stat.ucla.edu/calculators/sampsize.phtml.
Note that an additional 321 ATCSs are needed toensure representation as compared to statistical sig-nificance. If achieving statistical power is cost pro-hibitive, representation is even more so.
One way of dealing with the problem of inadequatesample size is evaluating intra-EST communicationpatterns across numerous studies. Over time, a com-munication profile develops based on known contex-tual factors (i.e., experimental conditions). To the
extent that similarities in the communication profileare observed, this would suggest a phenomena that isrobust and thus indicative of the universal nature ofR-side and D-side communication. However, to theextent that the communication profiles are different,this would suggest that situation-specific conditionsdictated the nature of intra-EST communications.Thus, regardless of the outcome, the systematic col-lection of data has the potential to provide insight intothe nature of intra-EST communications and to pro-vide guidelines for conducting field studies.
METHOD
The research described in this report is a subset ofa broader experiment associated with the WJHTC’sDSAR program. Only the methods directly related tothe assessment of CTC communications are reportedin this study. For additional information on theexperimental design, see Willems (1999).
ParticipantsEight 2-person teams, consisting of certified ATCSs
from an en route center participated in a two-weekDSAR experiment. Participants were paid their regu-lar salary and were on government per diem through-out the duration of the experiment. Following training,participants were randomly assigned to an experimentalcondition.
EquipmentThe equipment used in this experiment was function-
ally equivalent to the workstations used by the R-sideand D-side ATCSs in an en route center. An ATC high-fidelity simulator was used to model the airspace used inthis study. The experimental environment included fullDSR workstations with full operational functionality. A2,000 by 2,000 pixel, 29" video display unit representedthe DSR radarscope. Also included were a DSR flightstrip bay, an en route keyboard and trackball, and a DSTterminal that included both a conflict avoidance tool(CAT) and a flight path planning tool (FPPT). Prior tothe experiment, none of the participants had used theCAT or FPPT.
The CAT used the trajectory of aircraft to predictpotential loss of aircraft separation. For example, allthings being constant, the CAT determined whetherthe trajectory of two aircraft would intersect any timewithin a 20-minute period. Conflict information waspresented in several display windows that depictedvarious flight data and conflict information. Onedisplay window presented a list of all aircraft inboundto the sector. The list showed who was the controlling

8
sector of a particular aircraft; flight data such as flightroute, aircraft type, speed, altitude and beacon code,and conflict indication. The conflict indication dis-played red for predicted violations of less than 5nautical miles and displayed yellow when less than 12nautical miles, but more than 5 nautical miles. Agraphic-plan-display window graphically depictedaircraft and resembled the DSR display.
By a D-side entering a revised altitude or routechange, the FPPT enabled the EST to determine thebest flight plan for resolving a potential intra- and/orinter-sector conflict. Thus, instead of resolving con-flicts as tactical decisions, the FPPT enabled ATCSsto choose a strategic resolution to a given problem.Within an EST, information from the DSTs was pro-cessed by the D-side and communicated to the R-side.
Stimulus MaterialAn ATC supervisor on detail to the WJHTC devel-
oped air traffic control scenarios for use in the trainingand experimental conditions. Each scenario was 45minutes long. For the training condition, six sce-narios placed participants under a moderate workloaddefined as the amount of air traffic that could becomfortably handled by a R-side/D-side team, asperceived by a typical ATC supervisor. For the experi-mental conditions, six low-and seven high-workloadscenarios were developed. The low-workload sce-narios were defined as the least amount of air traffic inwhich a typical ATC supervisor added a D-side toassist the R-side controller. The standard for develop-ing high workload scenarios was the greatest amountof air traffic that a typical ATC supervisor allowed aR-side / D-side team to manage.
MeasuresAll task-related R-side/D-side communications were
videotaped and coded by an ATC subject matter expert(SME) using a computerized version of the C4T. TheSME was a retired ATCS who had spent the last five yearsproviding contract support in the area of ATC commu-nications research. This involved providing subject mat-ter expertise in the development of coding taxonomiesfor both controller- to-pilot communications and con-troller-to-controller communications.
TrainingPrior to participating in the experiment, participants
received four days of training on the air space, scenarioflow and traffic type, DSR workstations, and DSTequipment. After completing the familiarization phaseof training, participants performed ATC tasks in responseto six 45-minute air traffic scenarios. Each scenario was
calibrated by a SME to represent a moderate amount ofworkload. The decision aids used during training fol-lowed the experimental design.
Design and ProceduresCommunication exchanges of team members were
assessed within a 2 (workload) X 3 (type of DST)doubly repeated measures design. The two levels ofworkload were low and high, as previously describedin the Stimulus Material section. DST levels were: (1)Tech 1- only paper flight strips, (2) Tech 2 - electronicflight strips and a CAT, and (3) Tech 3- electronicflight strips, CAT, and a FPPT.
RESULTS
Field ComparisonPrior to hypothesis testing, the frequency data
(collapsed across all trials) were analyzed by topic,grammatical form, and communication mode so thata direct comparison could be made with the fieldstudy conducted by Peterson, et al (in press). Thepurpose of this comparison was to determine if differ-ences existed in the patterns of communication oper-ating within the two settings. Although the experimentwas not modeled after a particular en route center, thescenarios were designed to reflect real-world events.Thus, one might expect similarities between intra-EST communications within a field and experimentalsetting. However, differences are also likely becausecommunications, as a whole, are the product of vari-ous person (e.g., personality) and environmental fac-tors (sector/scenario demands).
Table 6 shows the comparisons for the percentageof R-side and D-side communications related to thetopic of communication, its grammatical form, andthe mode of expression. Although Table 6 shows thatfield and laboratory settings differed in the percentageof total communications that were attributed to agiven topic, both laboratory and field assessmentsidentified the same top three topics. These includedcommunications about “Traffic,” “Route,” and “Alti-tude.” Compared to the field the most noticeabledifference in the experiment was the lack of commu-nications about “Weather (not part of the experi-ment), “Point-Outs,” and “Traffic flow.” Additionally,there were only minimal amount of communicationsconcerning “Flight Strips.”
The grammatical form of communications alsodiffered between the two environments. The fieldresults show a strong tendency for the D-side to makestatements (55.9%) and the R-side (42.8%) to provide

9
Table 6.Contrasting percentage comparisons of R-side and D-side communications in field and laboratorysettings.
Enroute Center Laboratory SettingR-side% D-side% R-side% D-side%
Communication TopicTraffic 41.0 37.9 53.7 51.2Route of flight 14.2 15.6 13.1 11.7Altitude 7.1 8.0 16.0 21.1Weather 5.5 6.8 0.0 0.0Point-out 5.0 6.1 0.0 0.0Traffic flow 5.2 5.6 0.0 0.0Frequency 5.9 4.7 3.5 2.7Flight Strips 5.6 4.5 0.7 1.0Equipment 3.3 4.0 4.5 4.9Hand-off 3.6 3.1 2.9 1.8Speed 2.6 2.8 4.4 2.8Approval 1.0 0.9 1.0 1.8
Communication FormatStatement 29.7 55.9 58.0 77.3Answer 42.8 25.1 18.3 10.4Question 12.2 16.4 22.9 11.3Command Answer 5.8 0.3 0.0 0.0Command 0.5 2.4 0.8 1.0
Communication ModeVerbal 77.1 69.3 93.9 69.0Verbal & Nonverbal 14.7 16.8 5.0 24.7Nonverbal 13.9 13.9 0.5 2.8Equipment 0.0 0.1Equipment & Verbal 0.6 3.4Equipment & Nonverbal 0.0 0.1

10
answers. In contrast, the experiment’s results showboth R-side and D-side predominately making state-ments (58% vs. 77.3%).
Verbal communication is the method of choice forR-side and D-side controllers. However, as Table 6shows, the D-side had a stronger tendency to use amixture of verbal and nonverbal expressions in theexperiment than did the R-side (24.7% vs. 5%). Forthe field setting, the percentage of mixed messages wassimilar for both the R-side and D-side (14.6% vs.16.8%). Another difference between the two settingsis the percentage of nonverbal communications thatwere used. In the field, 13.9% of the communicationswas solely nonverbal for both the R-side and D-side.This is in contrast to the lower percentages recordedduring the experiment (R-side 0.5%, D-side 2.8%).
Hypothesis TestingDuring the experiment, problems occurred with
the computer algorithm used to assign participants toa given condition. This created missing data for threeteams in time 1 and three different teams in time 2.Because the communication component of the ex-periment was primarily descriptive in nature, thedecision was reached not to replace missing data withmean substitutions, but instead to drop the cases fromfurther analysis. Furthermore, since time 1 and time2 data involved missing data for six different teams,the doubly repeated measure design was dropped andchanged to a simple 2 x 3 repeated measure designusing only time 1 data. From these data, 3,194 com-munication events were coded. Descriptive statisticsfor these data are presented in Table 7. These data arealso graphically displayed in Figures 1-3.
A 2 x 3 repeated measures analysis of variance(ANOVA) was used to examine the effects that air-craft density (low vs. high) and level of technology(Tech1, Tech2, and Tech3) had on the topic of intra-EST communication, its grammatical form, and themethod of expression.
Hypothesis 1 stated that there would be greateramounts of communication under high workloadconditions, as compared to low workload conditions.When communications were analyzed as a compositenumber, no statistically significant results were ob-served. Each of the C4T categories was then analyzedseparately to determine if the experimental conditionsaffected any of the subcategories. No significant re-sults were observed for any of the subcategories withinthe grammatical form of communication or the modeof communication. However, main effects forworkload were observed for two communication
topics: (1) communications identifying a specific air-craft, F(1,5) = 11.25. p < .05, and communicationsinvolving altitude changes, F(1,5) = 10.66, p < .05. Inboth cases the high aircraft density condition wasassociated with more communication exchanges be-tween the R-side and D-side positions.
Hypothesis 2 stated that more communicationswould occur in the higher tech condition as comparedto the lower tech conditions. Although statisticalsignificance was not attained, Figure 1a shows thatunder the low workload condition, the highest degreeof technology (tech 3) recorded the most communica-tion events about Traffic and Altitude.
CONCLUSION
In this study we examined the effects of aircraftdensity and different kinds of automated decisionaids on communication exchanges between R-sideand D-side air traffic controller team members. Col-lapsing across all technologies, the results showedmore total communication exchanges under high air-craft density conditions as compared to low aircraftdensity conditions. This result was driven by the toptwo topics of communication: (1) communicationsabout the identification of a specific aircraft, and (2)altitude changes. The effects of automation decisionaids on communications, however, were not as clear.There was some evidence that under the low aircraftdensity condition, more communication exchangesoccurred (about the identification of a specific air-craft, altitude changes, and route of flight) using thehighest level of automation, as compared with the twolower levels of automation.
The overall trend of the C4T profile of the experi-ments (collapsing across all conditions) comparedfavorably with data collected from the field. In bothcases, the top three topics of communication wereTraffic, Route, and Altitude. Also, in both cases,verbal communication was the dominant mode. De-spite these similarities there were notable differencesin the grammatical form of communication betweenR-side and D-side controllers. Whereas in the field itappeared that the R-side was primarily responding tostatements made by the D-side, in the experiment, itappeared that both R-side and D-side controllers wereissuing statements. In addition, more nonverbal com-munications were observed in the field as compared tothe laboratory environment. Given that communica-tion is a function of the characteristics of team mem-bers and the situations that they face, it is not surprisingthat differences occurred. It remains for future research

11
Table 7.C4T Descriptive Statistics of Experimental Conditions.
Tech 1 Tech 2 Tech 3
AircraftDensity Measure n M SD n M SD n M SD
Low
Total Communication 5 63.20 23.27 5 62.60 27.63 5 61.00 27.07
Topic of Communication
Approval 1 1.0 1 1.0 3 1.33 0.58
Handoff 3 3.33 6.43 2 5.0 5.66 3 5.0 4.58
Pointout 0 0 0
Traffic 5 24.40 6.43 5 26.20 21.71 5 28.60 14.28
Altitude 5 8.80 6.53 5 8.80 9.26 5 12.40 5.94
Route of Flight 5 7.4 3.36 5 5.80 4.55 5 9.00 9.80
Speed 5 3.2 2.68 5 4.8 5.93 2 2.50 .71
Weather 0 0 0
Frequency 5 3.4 1.94 3 2.67 0.58 4 2.75 0.96
Traffic Flow 0 0 0
Flight Strips 2 6.0 4.24 0 0
Equipment 2 8.5 10.60 5 5.0 3.87 4 5.0 2.45
Aircraft ID 0 0 0
Grammatical Form ofCommunication
Question 5 9.00 4.36 5 10.20 3.56 5 12.20 7.16
Answer 5 9.60 8.99 5 8.80 4.18 5 8.80 5.22
Statement 5 36.20 11.12 5 42.40 19.63 5 39.60 16.85
Communication Mode
Verbal 5 46.40 18.30 5 53.60 24.09 5 51.60 23.55
Mixed Verbal Nonverbal 5 6.8 7.05 5 6.60 3.51 5 7.80 4.66
High
Total Communication 5 69.00 31.63 5 72.60 5.43 5 60.60 23.07
Topic of Communication
Approval 1 5.00 2 3.0 1.41 1 6.00
Handoff 2 2.0 3 2.33 1.52 2 1.50 .71
Pointout 1 1.50 0 0
Traffic 5 30.40 10.55 5 35.40 13.18 5 36.40 13.16
Altitude 5 20.00 10.86 5 13.60 6.19 5 11.40 5.94
Route of Flight 5 8.20 9.88 5 13.60 10.11 5 5.40 3.78

12
Table 7. (Continued)C4T Descriptive Statistics of Experimental Conditions.
Tech 1 Tech 2 Tech 3
AircraftDensity Measure n M SD n M SD n M SD
HighSpeed 3 3.67 1.53 4 3.50 1.00 4 4.75 5.56
Weather 0 0 0
Frequency 4 3.75 3.59 4 1.75 0.50 4 3.25 1.26
Traffic Flow 0 0 0
Flight Strips 2 4.0 1.41 0 0
Equipment 2 5.5 6.36 3 4.33 1.53 3 6.33 3.51
Aircraft ID 0 0 0
Grammatical Form ofCommunication
Question 5 8.40 2.97 5 13.60 2.88 5 13.40 5.03
Answer 5 7.60 6.43 5 11.00 4.95 5 9.40 6.91
Statement 5 51.80 23.99 5 45.80 6.38 5 42.20 13.03
Communication Mode
Verbal 5 52.80 24.10 5 55.20 8.76 5 56.40 17.90
Mixed Verbal Nonverbal 5 13.80 8.14 5 14.60 7.06 5 8.40 8.14

13
0 10 20 30 40
Approval
Handoff
Pointout
Traffic
Altitude
Route
Speed
Weather
Frequency
Traffic Flow
FlightStrips
Equipment
A/C ID
Tech 1 Tech 2 Tech 3
Figure 1a.Topic of Communication Comparison of Three Decision Support Technologies Under LowWorkload Conditions.

14
0
10
20
30
40
50
Question Answer Statement
Tech1 Tech2 Tech3Figure 2a.Comparison of the Grammatical Form of Communication for Three Decision SupportTechnologies Under Low Workload Conditions.
0
10
20
30
40
50
60
Question Answer Statement
Nu
mb
er o
f C
om
mu
nic
atio
n E
ven
ts
Tech1 Tech2 Tech3Figure 2b.Comparison of the Grammatical Form of Communication for Three Decision SupportTechnologies Under High Workload Conditions.

15
0
10
20
30
40
50
60
Verbal Mixed
Tech1 Tech2 Tech3
Figure 3a.Comparison of the Mode of Communication for Three Decision SupportTechnologies Under Low Workload Conditions.
0
10
20
30
40
50
60
Verbal Mixed
Tech1 Tech2 Tech3
Figure 3b.Comparison of the Mode of Communication for Three Decision SupportTechnologies Under High Workload Conditions.

16
to determine whether and how intra- or inter-teamvariability affects system outcomes of safety, effi-ciency, and effectiveness.
Future DirectionsObjective measures of ATC intra-team coordination
have remained an elusive goal for the FAA. Despite thenumber of training initiatives targeted at improvingATC team performance, none of them has empiricallydemonstrated that they lead to improvements in intra-team coordination within the job setting.
Recently, the FAA funded a cooperative researchprogram with Kansas State University to develop amethod of identifying expert performance: theCochran-Weiss-Shanteau statistic (CWS) (Shanteau,2001; Thomas, 2001; Weiss, 2001). In its currentform, CWS is a summative index that differentiatesbetween levels of expertise residing within individu-als. However, a dynamic measure of performanceexpertise is in the developmental stages. By extendingthis measure to the team level of analysis, researcherswill accomplish a number of objectives. These in-clude: (1) objectively classifying teams based on theirlevels of expertise, (2) determining the role that intra-team communication plays in developing team exper-tise, and (3) determining how levels of team expertiserelate to sector outcome measures such as the averageamount of fuel burn or time in sector.
Whether intra-EST communication research takesadvantage of advances in the measurement of teamexpertise, it is important to explore the impact that intra-EST communications has on system safety and effi-ciency outcomes. To the extent that a relationship exists,researchers will be in a better position to develop moresophisticated models of ATC performance.
REFERENCES
Allendoerfer, K. R., Galushka, J., Mogford, R. H. (2000).Display system replacement baseline research report.(DOT/FAA/CT-TN00/32). Atlantic City Inter-national Airport, NJ: Federal Administration Wil-liam J. Hughes Technical Center.
Aviation Financing, Air Traffic Control Moderniza-tion, and Safety and Security, Statement of theHonorable Jane F. Garvey, Federal Aviation Ad-ministrator, before the House Committee on Ap-propriations, Subcommittee on Transportation,(March 9-10, 1999).
Billings, C. E. (1988). Toward human centered automa-tion. In S. D. Norman & H. W. Orlady (Eds.),Flight deck automation: Promises and realities (pp167- 90). Moffett Field, CA: NASA-Ames Re-search Center.
Branch, M. N. (1999). Statistical inference in behavioranalysis: Some things significance testing does anddoes not do. Behavior Analyst, 22, 87-92.
Brent, E., & Thompson, A. (1996). Methodologist’stoolchest: User’s guide and reference manual. Co-lumbia, MO: Idea Works, Inc.
FAA Plan to Modernize the Air Traffic Control System,Statement of the Honorable Jane F. Garvey, Fed-eral Aviation Administrator, before the Commit-tee on Commerce, Science, and Transportation,Subcommittee on Aviation, (February 26, 1998).
Federal Aviation Administration. (2000). Air TrafficControl (DOT/FAA/Order 7210.65M). Wash-ington, DC: Federal Aviation Administration.
Hart, S. G., & Sheridan, T. B. (1984). Pilot workload,performance, and aircraft control automation. In:Human Factors Considerations in High Perfor-mance Aircraft (AGARD-CP-371) (pp. 18/1-18/12). Neuilly Sur Seine, France: NATO-AGARD.
Human Technology, Inc. (1991). Analysis of control-ler communication in en route air traffic control.Report to the Federal Aviation Administration.McLean, VA.
Kanki, B.G. & Prinzo, O.V. (Eds.) (1996). Methods andmetrics of voice communications. (DOT/FAA/AM-96/10) Department of Transportation, FederalAviation Administration, Office of AerospaceMedicine, Washington, D.C.
Kraemer, C., & Thiemann, S. (1987). How many sub-jects?: Statistical power analysis in research. BeverlyHills: Sage.
Morrison, R. & Wright, R.H. (1989). ATC control andcommunications problems: An overview of recentASRS data. In R. S Jensen (Ed.) Proceedings of theFifth International Symposium on Aviation Psy-chology (pp. 901-7). Columbus, OH: The OhioState University.
Morrow, D.G., Lee, A., & Rodvold, M. (1990).Analysis of routine pilot-controller communica-tion. In Managing the Modern cockpit: ThirdHuman Error Avoidance Techniques Confer-ence Proceedings. Warrendale PA: Society ofAutomotive Engineers, Inc.

17
Peterson, L.M., Bailey, L. L., & Willems, B. (in press).Controller-to-controller communication and coordi-nation taxonomy (C4T) Department of Transpor-tation, Federal Aviation Administration, Office ofAerospace Medicine, Washington, DC.
Prinzo, O. V., & Britton, T. W. (1993). ATC-pilot voicecommunications - A survey of the literature. (DOT/FAA/AM-93/20) Department of Transportation,Federal Aviation Administration, Office of Aero-space Medicine, Washington, DC.
Riley, V. (1994). A theory of operator reliance on automa-tion. In M. Mouloua & R. Parasuraman (Eds.),Human performance in automated systems: Cur-rent research and trends (pp. 8-14). Hillsdale, NJ:Erlbaum.
Sarter, N. B. & Woods, D. D. (1994). Pilot interactionwith cockpit automation II: An experimental studyof pilots’ model and awareness of the flight man-agement system. The International Journal of Avia-tion Psychology,2, 1-28.
Scarborough, A., & Pounds, J. (2001). Retrospectivehuman factors analysis of ATC operational errors.Presented at the 11th International Symposium ofAviation Psychology, Columbus, Ohio.
Shanteau, J. (2001). Results from tests of the CWS methodagainst existing data sets. Presented at the 11th
International Symposium of Aviation Psychology,Columbus, Ohio.
Thomas, R. P. (2001). The adaptation of CWS todynamic stimuli. Presented at the 11th Interna-tional Symposium of Aviation Psychology, Co-lumbus, Ohio.
Weiss, D. J. (2001). The derivation of CWS based onfindings from studies of expert performance. Pre-sented at the 11th International Symposium ofAviation Psychology, Columbus, Ohio.
Wiener, E. L. (1985). Cockpit automation: In need of aphilosophy. In Proceedings of the 1985 BehavioralEngineering Conference (pp. 369-75). Warrendale,PA: Society of Automotive Engineers.
Wiener, E. L. (1988). Field studies in automation. In S.D. Norman & H. W. Orlady (Eds.), Flight deckautomation: Promises and realities (pp 37-55).Moffett Field, CA: NASA-Ames Research Center.
Willems, B.F. (1999). Test plan for decision supportautomation research (DSAR) in the en route airtraffic control environment.(Draft). Atlantic CityInternational Airport, NJ: Federal AdministrationWilliam J. Hughes Technical Center.


![[Exchanges between patients on the Internet]](https://static.fdokumen.com/doc/165x107/633fc9b984ed445bd606d116/exchanges-between-patients-on-the-internet.jpg)