The effects of the internal flow structure on SPM entrapment in the Rotterdam Waterway
24
The Effects of the Internal Flow Structure on SPM Entrapment in the Rotterdam Waterway MICHEL A. J. DE NIJS Environmental Fluid Mechanics Section, Delft University of Technology, Delft, Netherlands JOHAN C. WINTERWERP Environmental Fluid Mechanics Section, Delft University of Technology, and Deltares, Delft, Netherlands JULIE D. PIETRZAK Environmental Fluid Mechanics Section, Delft University of Technology, Delft, Netherlands (Manuscript received 3 February 2009, in final form 27 March 2010) ABSTRACT Field measurements are presented, which are the first to quantify the processes influencing the entrapment of suspended particulate matter (SPM) at the limit of saltwater intrusion in the Rotterdam Waterway. The estuarine turbidity maximum (ETM) is shown to be maintained by the trapping of fluvial SPM at the head of the salt wedge. The trapping process is associated with the raining out of fluvial SPM from the upper, fresher part of the water column, into the layer below the pycnocline. The dominant mechanisms responsible are baroclinic shear flows and the abrupt change in turbulent mixing characteristics due to damping of turbulence at the pycnocline. This view contrasts with the assumption of landward transport of marine SPM by asym- metries in bed stress. The SPM transport capacity of the tidal flow is not fully utilized in the ETM, and the ETM is independent of a bed-based supply of mud. This is explained by regular exchange of part of the ETM with harbor basins, which act as efficient sinks, and that the Rotterdam Waterway is not a complete fluvial SPM trap. The supply of SPM by the freshwater discharge ensures that the ETM is maintained over time. Hence, the ETM is an advective phenomenon. Relative motion between SPM and saltwater occurs because of lags introduced by resuspension. Moreover, SPM that lags behind the salt wedge after high water slack (HWS) is eventually recollected at the head. Hence, SPM follows complex transport pathways and the mechanisms involved in trapping and transport of SPM are inherently three-dimensional. 1. Introduction Suspended particulate matter (SPM)-laden river wa- ters are conveyed through estuaries toward shelf seas. A typical feature of estuaries is the fresh–saltwater mixing region, an area between fresh and saline waters, which is characterized by high SPM concentrations due to local trapping mechanisms. This along-channel maximum SPM concentration is referred to as the estuarine turbidity maximum (ETM). In some estuarine systems, the ETM is considered an important larval fish nursery area because SPM provides a substrate for organisms, and therefore it plays an essential role in the ecosystem (e.g., North and Houde 2003). However, contaminants also adhere to SPM. Therefore, high contaminant levels can be found in the bed at depositional areas even if the water quality is good. ETMs may also play an important role in the sil- tation of harbors located on estuarine systems with typi- cally low river turbidity (De Nijs et al. 2008, 2009). SPM transport pathways, particularly those of fluvial SPM, are of great interest for ecologists; estuarine, river basin, and port management. In consequence, the trans- port and entrapment processes in the fresh–saltwater mixing region have been the subject of many studies for almost a century. The ETM is a well-documented feature and its widespread occurrence has been confirmed by studies in many estuaries: Chesapeake Bay (Schubel 1968), Columbia River (Gelfenbaum 1983; Jay and Musiak Corresponding author address: Michel A. J. de Nijs, P.O. Box 5048, Stevinweg 1, 2600 GA, Delft, Netherlands. E-mail: [email protected] VOLUME 40 JOURNAL OF PHYSICAL OCEANOGRAPHY NOVEMBER 2010 DOI: 10.1175/2010JPO4233.1 Ó 2010 American Meteorological Society 2357
Transcript of The effects of the internal flow structure on SPM entrapment in the Rotterdam Waterway

The Effects of the Internal Flow Structure on SPM Entrapment in theRotterdam Waterway
MICHEL A. J. DE NIJS
Environmental Fluid Mechanics Section, Delft University of Technology, Delft, Netherlands
JOHAN C. WINTERWERP
Environmental Fluid Mechanics Section, Delft University of Technology, and Deltares,
Delft, Netherlands
JULIE D. PIETRZAK
Environmental Fluid Mechanics Section, Delft University of Technology, Delft, Netherlands
(Manuscript received 3 February 2009, in final form 27 March 2010)
ABSTRACT
Field measurements are presented, which are the first to quantify the processes influencing the entrapment
of suspended particulate matter (SPM) at the limit of saltwater intrusion in the Rotterdam Waterway. The
estuarine turbidity maximum (ETM) is shown to be maintained by the trapping of fluvial SPM at the head of
the salt wedge. The trapping process is associated with the raining out of fluvial SPM from the upper, fresher
part of the water column, into the layer below the pycnocline. The dominant mechanisms responsible are
baroclinic shear flows and the abrupt change in turbulent mixing characteristics due to damping of turbulence
at the pycnocline. This view contrasts with the assumption of landward transport of marine SPM by asym-
metries in bed stress. The SPM transport capacity of the tidal flow is not fully utilized in the ETM, and the
ETM is independent of a bed-based supply of mud. This is explained by regular exchange of part of the ETM
with harbor basins, which act as efficient sinks, and that the Rotterdam Waterway is not a complete fluvial
SPM trap. The supply of SPM by the freshwater discharge ensures that the ETM is maintained over time.
Hence, the ETM is an advective phenomenon. Relative motion between SPM and saltwater occurs because of
lags introduced by resuspension. Moreover, SPM that lags behind the salt wedge after high water slack (HWS)
is eventually recollected at the head. Hence, SPM follows complex transport pathways and the mechanisms
involved in trapping and transport of SPM are inherently three-dimensional.
1. Introduction
Suspended particulate matter (SPM)-laden river wa-
ters are conveyed through estuaries toward shelf seas. A
typical feature of estuaries is the fresh–saltwater mixing
region, an area between fresh and saline waters, which is
characterized by high SPM concentrations due to local
trapping mechanisms. This along-channel maximum SPM
concentration is referred to as the estuarine turbidity
maximum (ETM). In some estuarine systems, the ETM is
considered an important larval fish nursery area because
SPM provides a substrate for organisms, and therefore it
plays an essential role in the ecosystem (e.g., North and
Houde 2003). However, contaminants also adhere to
SPM. Therefore, high contaminant levels can be found in
the bed at depositional areas even if the water quality is
good. ETMs may also play an important role in the sil-
tation of harbors located on estuarine systems with typi-
cally low river turbidity (De Nijs et al. 2008, 2009).
SPM transport pathways, particularly those of fluvial
SPM, are of great interest for ecologists; estuarine, river
basin, and port management. In consequence, the trans-
port and entrapment processes in the fresh–saltwater
mixing region have been the subject of many studies for
almost a century. The ETM is a well-documented feature
and its widespread occurrence has been confirmed by
studies in many estuaries: Chesapeake Bay (Schubel
1968), Columbia River (Gelfenbaum 1983; Jay and Musiak
Corresponding author address: Michel A. J. de Nijs, P.O. Box
5048, Stevinweg 1, 2600 GA, Delft, Netherlands.
E-mail: [email protected]
VOLUME 40 J O U R N A L O F P H Y S I C A L O C E A N O G R A P H Y NOVEMBER 2010
DOI: 10.1175/2010JPO4233.1
� 2010 American Meteorological Society 2357

1994), Demerara River (Postma 1967), Ems River
(Postma 1967), Elbe River (Grabemann et al. 1995, 1996;
Kappenberg and Grabemann 2001), Fly River (Wolanski
et al. 1995), Gironde Estuary (Allen et al. 1980), Hudson
River (Geyer et al. 1998, 2001; Orton and Kineke 2001),
Humber-Ouse-Trent (Uncles et al. 2006), Kennebec Bay
(Kistner and Pettigrew 2001), Mekong River (Wolanski
et al. 1996), Seine River (Avoine et al. 1981; Brennon and
Le Hir 1998), Tamar Estuary (Uncles et al. 1985, 1994;
Uncles and Stephens 1989, 1993a,b), Tay River (Weir
and McManus 1987), Weser River (Wellershaus 1981;
Grabemann et al. 1997), Winyah Bay (Patchineelam and
Kjerfve 2004), and York River (Lin and Kuo 2001).
Many of the above studies show that the location of
ETMs coincides with the limit of saltwater intrusion. In
these SPM-trapping regions, storage of mud in the bed
and/or heightened SPM concentrations are observed in
the water column. Many studies have therefore attributed
the presence and distribution of increased SPM concen-
trations on a tidal time scale to the spatial distribution of
erodible SPM in the estuary, such as a ‘‘mud reach.’’ In
fact, many studies have documented either permanent or
temporary storage of mud (during neap tide) in the bed.
In that case, an abundant amount of mud is available for
transport. Furthermore, during certain tidal periods the
entrainment–erosion capacity is too low to deplete the
bed of mud. Examples of such cases are the Columbia
River (Gelfenbaum 1983), Elbe River (Grabemann et al.
1995; Kappenberg and Grabemann 2001), Fly River
(Wolanski et al. 1995), Gironde River (Allen et al. 1980),
Hudson River (Geyer 1993; Geyer et al. 1998; Orton and
Kineke 2001), Humber–Ouse–Trent (Uncles et al. 2006),
Mekong River (Wolanski 1996), Weser River (Wellershaus
1981; Schrottke et al. 2006), Seine River (Brennon and Le
Hir 1998, 1999; Le Hir et al. 2001), Tamar River (Uncles
and Stephens 1989, 1993a,b; Grabemann et al. 1997), and
York River (Lin and Kuo 2001).
Trapped SPM can undergo a continuous cycle of ad-
vection, settling, entrainment, and/or erosion for a long
period of time (e.g., Schubel 1968; Uncles and Stephens
1993a,b; Wolanski et al. 1996; Grabemann et al. 1997)
before permanent deposition occurs in energetically weak
regions, such as harbor basins, inlet tributaries, channel
network systems, or dead water zones. The manifestation
of the aforementioned processes is a cloud of SPM ad-
vected up- and down-estuary by the tidal flow on a tidal
time scale. In some estuaries, this SPM cloud can have
a length scale of several tens of kilometers (e.g., Uncles
et al. 2006).
Various theoretical studies have shown that correlations
between tidal-averaged, tidal varying, and either depth-
averaged quantities and/or vertically varying distributions
of velocity and SPM concentration can produce residual
landward transports that can balance the seaward trans-
port of SPM by the freshwater discharge. These processes
include gravitational circulation (Postma 1967; Festa and
Hansen 1978), internal tidal asymmetry (Jay and Musiak
1994, 1996), front formation (Geyer et al. 1998), formation
of exchange flows in combination with turbulence damp-
ing (Geyer 1993), settling lag (Postma 1961; Groen 1967),
scour lag (Postma 1961), and barotropic tidal asymmetry
(Allen et al. 1980; Speer and Aubrey 1985; Dronkers
1986). These studies indicate that the along-channel dis-
tribution of salinity and SPM are related features in
estuarine environments. They also show that the salinity-
induced density structure provides sufficient conditions to
maintain an ETM near the limit of saltwater intrusion,
independent of a bed supply of mud. The dynamics of the
ETM are not necessarily determined by the behavior of
cohesive sediment, such as flocculation, consolidation, and
sediment-induced density effects. Furthermore 3D nu-
merical simulations by Burchard and Baumert (1998)
and Brennon and Le Hir (1999) support this.
Burchard and Baumert (1998) conducted numerical
experiments to determine the relative contribution of
the gravitational flow and the time-dependent internal
velocity and mixing asymmetry to the formation of an
ETM near the tip of a salt wedge. They concluded that
only the first two mechanisms are necessary to create an
ETM. Furthermore, they deduced that the role of tidal
velocity asymmetry in the ETM formation process is
more important than that of the (residual) gravitational
flow.
Based on the results of numerical simulations, Geyer
(1993) demonstrated that stratification led to the sup-
pression of turbulence at the pycnocline and an associated
reduction in the quantity of SPM that can be carried by the
flow. In consequence, the trapping of SPM at the landward
limit of the salinity intrusion is greatly enhanced. Fur-
thermore, Geyer et al. (2000) found that bed-generated
turbulence was confined beneath the pycnocline and
therefore the estuarine circulation in the Hudson River
was controlled by the bed stress. However, the conse-
quences of these processes on time-dependent SPM en-
trapment have not been discussed.
This paper is part of a series, in which we have addressed
the relationship between the ETM and harbor siltation
(De Nijs et al. 2008, 2009) and the physics controlling
the internal flow structure (De Nijs et al. 2010). Many
authors have focused on either internal or on barotropic
tidal asymmetry to deduce a landward transport of
SPM. However, in De Nijs et al. (2010) it was dem-
onstrated that barotropic tidal asymmetry, imposed at
the mouth of the Rotterdam Waterway, controlled the
advection of the salt wedge and therefore the subsequent
evolution of the internal flow structure. In agreement
2358 J O U R N A L O F P H Y S I C A L O C E A N O G R A P H Y VOLUME 40

with the mechanism proposed by Geyer (1993), it was
shown that stratification led to decoupling effects between
the layers because of suppression of turbulence at the
pycnocline, and that bed-generated turbulence was con-
fined beneath it. In consequence, De Nijs et al. (2010)
found the time-dependent behavior of the internal flow
structure to be governed by the tidal displacement of the
salt wedge, which controlled the height of the pycnocline
above the bed at a particular site and therefore the height
to which bed-generated turbulence can protrude into
the water column. Here, we investigate the implica-
tions of this time-dependent physical mechanism on
ETM formation and SPM distribution. To our knowl-
edge this is the first study to do so.
Here we describe the results of a study designed to
investigate time-dependent SPM entrapment and the
behavior of the ETM in the Rotterdam Waterway,
Netherlands. It is also the first study to verify the exis-
tence of an ETM in the Rotterdam Waterway (De Nijs
et al. 2008, 2009). To establish the nature of the un-
derlying time-dependent processes and the interactions
contributing to the entrapment of SPM on a tidal time
scale, high frequency measurements at several positions
along the estuary are required. Therefore, a detailed field
survey was carried out in the Rotterdam Waterway,
which is described in section 2. In section 3 it is shown that
the salt wedge, with its associated near-bed convergence,
as well as an abrupt change in turbulent mixing charac-
teristics plays an important role in keeping pre-
dominantly fluvial SPM in the Rotterdam Waterway. If
one looks again at the mechanism proposed by Geyer
(1993), it is immediately obvious that any fluvial source of
SPM will be inefficiently transported to the outer estuary
as a result of a reduction in SPM carrying capacity of the
flow above a pycnocline. Therefore, we also make use of
data on the origin of the SPM in the Rotterdam Waterway
in section 3. We do this in order to investigate the role
played by the time-dependent mechanism of De Nijs
et al. (2010) on the distribution of SPM within the es-
tuary. We show that the salt wedge behaves like a sedi-
ment sieve, sorting the sediment along the estuary. We
discuss the implications of this time-dependent mechanism
in section 4.
2. Methods
a. Field site
The lower river branches of the Rhine and Meuse
rivers form an estuary called the Rhine–Meuse estuary
(Fig. 1). The cross sections in the downstream parts of
the estuary are approximately prismatic. Farther up-
estuary, a distinction can be made between main chan-
nel and floodplain, here only a part of the cross section
contributes to storage of water. Down-estuary and in the
middle part of the estuary, harbors, and cutoff river
branches contribute to storage of water. The bed ma-
terial in the Rotterdam Waterway generally consists of
fine and medium sand as the system is too dynamic to
favor siltation of mud on the riverbed. Most of the
dredging in the Rotterdam Waterway occurs in the river
bend at Maassluis. The dredged material is mainly sand;
hardly any mud is dredged. However, in the harbor ba-
sins of the Port of Rotterdam, mud is the dominant
constituent of the dredged material.
b. Survey setup and hydrodynamic conditions
The 13-h boat survey was carried out on 11 April 2006
prior to spring (full moon was 13 April) at times of higher
discharges. Rhine discharges varied from 5800 m3 s21 at
the beginning of April to about 4000 m3 s21 at the day of
the survey. Mean water level changes preceding and
during this survey were smaller than about 0.30 m. This
survey included eight measuring stations (Fig. 1). The
stations were set up to characterize the (internal) tidal
velocity, salinity, and SPM concentration field along the
longitudinal axis of the Rotterdam Waterway at sites
where saltwater is permanently present, during a part of
the tidal cycle and outside the influence sphere of the salt
wedge. Three stations (stations 1, 6, and 7) measured at
the boundaries of a balance area (see section 3c) to
quantify the gross physical mechanisms contributing to
mass transport and to determine the ETM formation time
scale. One vessel (station 8) measured the evolution of
velocity and salinity in a frame of reference moving with
the salt wedge. This style of measuring corresponds with
the Lagrangian description of the ETM dynamics pre-
sented in De Nijs et al. (2008).
c. Instruments and procedures
1) CONVENTIONAL CTD AND TURBIDITY
INSTRUMENTS AND PROFILING PROCEDURES
Optical backscatter (OBS) instruments (OBS-3 and
OBS-3A) were used to measure turbidity profiles. The
OBS-3A combines an OBS probe with conductivity,
temperature, and depth (CTD) sensors. OBS-3 probes
were mounted on frames with CT probes and pressure
sensors at the same level. A comprehensive summary
of the OBS measuring principle can be found in Down-
ing (2006). Water samples have been taken to calibrate
the instruments. The OBS-3A operated with a maximal
frequency response of 2 Hz, while the OBS-3 and CT
probes had a maximal frequency response of 1 Hz. The
instruments operated with an SPM concentration mea-
suring range of approximately 0–8 kg m23. A routine
of profiling was employed where the sensors moved
NOVEMBER 2010 D E N I J S E T A L . 2359
through the water column while data was continuously
logged. Hence, instantaneous flow properties were mea-
sured. Different speeds of the instrument frames winches,
ranging from 0.05 to 1 m s21, have been used over the
water column (De Nijs et al. 2009, 2010) to better profile
the near-bed region where large salinity and SPM gra-
dients occur. The recording ended when the bed was
reached (criterion: pressure did not increase). The time
to complete a downcast amounted to about 90 to 100 s.
Weights were attached to the instrument frames to pre-
vent large deviations from the vertical because of current
drag. Only at locations 3, 4, and 5 (Fig. 1), was it pos-
sible to attach these weights above the instruments.
Therefore, at other locations the near-bed region and bed
may not have been completely profiled and/or properly
detected.
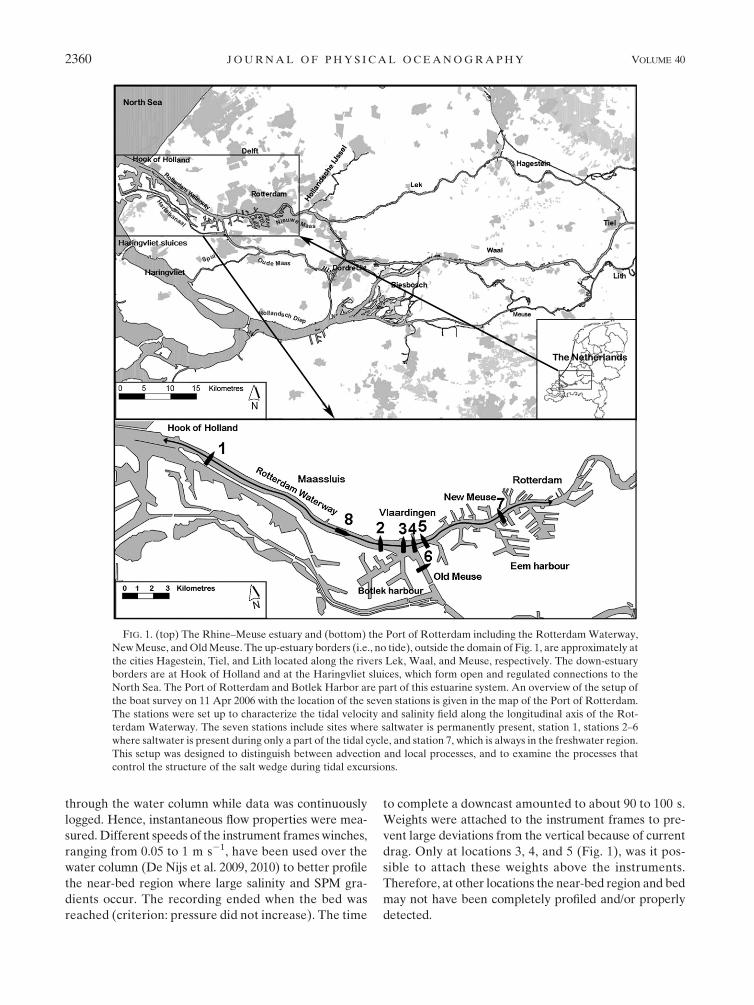
FIG. 1. (top) The Rhine–Meuse estuary and (bottom) the Port of Rotterdam including the Rotterdam Waterway,
New Meuse, and Old Meuse. The up-estuary borders (i.e., no tide), outside the domain of Fig. 1, are approximately at
the cities Hagestein, Tiel, and Lith located along the rivers Lek, Waal, and Meuse, respectively. The down-estuary
borders are at Hook of Holland and at the Haringvliet sluices, which form open and regulated connections to the
North Sea. The Port of Rotterdam and Botlek Harbor are part of this estuarine system. An overview of the setup of
the boat survey on 11 Apr 2006 with the location of the seven stations is given in the map of the Port of Rotterdam.
The stations were set up to characterize the tidal velocity and salinity field along the longitudinal axis of the Rot-
terdam Waterway. The seven stations include sites where saltwater is permanently present, station 1, stations 2–6
where saltwater is present during only a part of the tidal cycle, and station 7, which is always in the freshwater region.
This setup was designed to distinguish between advection and local processes, and to examine the processes that
control the structure of the salt wedge during tidal excursions.
2360 J O U R N A L O F P H Y S I C A L O C E A N O G R A P H Y VOLUME 40

2) SILTPROFILER
Characteristic for estuarine environments is that SPM
concentrations can range from low surface SPM con-
centrations of approximately 0.01–0.05 kg m23 to fluid
mud concentrations near the bed larger than 10 kg m23.
This SPM concentration range is difficult to reliably
measure with conventional instrument packages such as
the OBS-3A. Furthermore, conventional CTD–turbidity
sensor packages lack the capability to provide high ver-
tical resolution needed to measure phenomena such as
pycnoclines, lutoclines, and relative thin fluid mud layers.
The routine of profiling also takes a relatively long time
due to low winch speeds during downcasts.
A high resolution Siltprofiler has been developed to
improve on the aforementioned routine of profiling. Dr.
Robbert Kirby from Ravensrodd Consultants, Ltd., has
provided the blueprints for this device. The Siltprofiler
concept has been further developed at Delft Hydraulics
in collaboration with Dr. Kirby. This profiler is equipped
with sensors that measure with high frequency (80–
100 Hz). These sensors comprise CTD and three tur-
bidity sensors. The latter sensors cover three distinct
measuring ranges. A Seapoint optical backscatter sensor
covers the first measuring range (0–1 kg m23), the second
(1–10 kg m23), and third ranges are covered by infrared
extinction sensors (10–35 kg m23). The Siltprofiler is de-
ployed freefalling. The falling speed amounts approxi-
mately to 1 m s21. A Bluetooth connection (wireless)
transmits the data when it surfaces.
3) BOAT-MOUNTED ADCP VELOCITY
MEASUREMENTS
Velocity measurements were collected with boat-
mounted acoustic Doppler current profilers (ADCPs).
The ADCPs deployed during the boat surveys were RD
instruments acoustic Doppler current profilers 1200-kHz-
type broadband. The depth range covered by the ADCPs
is 20 m. These transects were navigated approximately
perpendicular to the channel and basin axis. The pro-
cedures and settings have been described in De Nijs et al.
(2009, 2010).
4) WATER SPAMPLING, GRAVIMETRIC ANALYSIS,AND CALIBRATION
The phenomena of interest occur within a relatively
short time period. Therefore a routine of turbidity pro-
filing had to be applied, which ensures high temporal
resolution profiling. It was therefore decided to pump
water samples, instead of sampling with bottles. The noz-
zle of the pump sampler was mounted on a frame along
with other measuring equipment. The intake aligns itself
against the primary flow. The intake velocity was ap-
proximately 0.12 m s21.
Water sampling was carried out at positions 1, 2, and 5
at phases of the tide when the flow velocity was either
low (slack) or high (flood and ebb). During this 13-h
survey approximately five sampling periods occurred.
Samples were taken at approximately 0.5 and 3 m from
the bed, and 3 m below the free surface. One-liter water
samples were taken, which were stored in darkness at
48C in order to avoid primary production before con-
ducting gravimetric analysis according to the Dutch
norm NEN 6484.
The OBS sensors were first calibrated for turbidity
(FTU) using formazin mixtures. They then were cali-
brated for SPM (kg m23) by combining water sample
data from different locations. In this analysis water
samples obtained near the bed and with a dry-weight
below 0.01 kg m23 have been left out because of posi-
tioning problems and accuracy constraints imposed by
the gravimetric analysis. As a result, the number of
calibration points became too small to determine cali-
bration curves per location. The turbidity sensors moun-
ted on the Siltprofiler have been calibrated using bed
samples obtained at the turning circle of Botlek Harbor.
d. Data processing
Principal component analysis (Emery and Thomson
2001) has been used to determine the principal axes and
velocities along the direction of maximum and minimum
variance. The first velocities are referred to as primary
or along-channel velocity components, and the latter as
secondary or traverse velocity components. The velocity
data near the surface (blanking distance) and near the
bed (side lobe effects) have been reconstructed by block
extrapolation and a power law description (van Veen
1938) based on the velocity found in the near surface and
deepest profiling point, respectively. Time versus depth
information has been obtained by collecting ADCP tran-
sect data nearest to the CTD–turbidity profiling points. To
be able to determine fluxes the data were gridded onto
a regular grid with approximately the same density as the
profiling data using linear Delaunay triangulation (in-
terpolation). A 2D spatial filter (3 by 3 block weighted)
has been used to smooth the results. Measurements col-
lected with the Siltprofiler were smoothened using poly-
nomial fits of order 6.
e. Estimation of profiles of Reynolds stresses,turbulent viscosities, and SPM carrying capacityof the flow
Reynolds stress terms are estimated from a simplified
along-channel momentum balance
NOVEMBER 2010 D E N I J S E T A L . 2361

ðh
z5z*
›
›zhuwi dz 5�
ðh
z5z*
›u
›t1 u
›u
›x1 g
›h
›x1
ðh
z5z*
g
r0
›r
›xdz1
›huui›x
� �dz 1 t
s, (1)
with u the along-channel or primary velocity compo-
nent, h the water level, r the density of the water, r0 the
reference density of water, huui a normal Reynolds
stress, huwi a Reynolds shear stress, and ts the surface
stress. The up-estuary direction is taken positive. Note
that these calculations are estimates only since proper
ensemble averaging could not be applied. The huwi es-
timates are calculated from the data at stations 1 and 2,
based on the vertical integral of terms 1, 3, and 4 on the
right-hand side of Eq. (1). The stress at the surface is
assumed to be zero. Term 3 has been calculated from
fixed water level stations (see De Nijs et al. 2010). Term
4 has been estimated from the along-channel scalar con-
servation equation neglecting turbulent diffusion, and
transverse and vertical terms (e.g., Geyer et al. 2000) for juj. 0.25 m s21. These estimates have been made consistent
with baroclinic pressure gradients estimated from data
collected from successive passages through the head of the
salt wedge. The distribution of the turbulent viscosity has
been calculated assuming gradient type transport.
f. Decomposition of the total mass transport
Fischer (1972) presented a method for the decom-
position of the total mass transport in an estuary. Dyer
(1974) and Winterwerp (1983) performed similar analyses
where they both assume that lateral transport effects are
negligible and that the along-channel velocity profile is
representative for the cross-sectional mean value. Here we
follow the method in Winterwerp (1983) and highlight the
individual mechanisms contributing to the mass transport
of salt and SPM; see also De Nijs et al. (2009) for a detailed
description. The instantaneous and tidal and cross-sec-
tional-averaged salinity or SPM transport per unit width
are given by
ðh
0
uc dz dt 5 h(u0c
01 u
0c
t1 u
tc
01 u
tc
t
1 u90c9
01 u9
0c9
t1 u9
tc9
01 u9
tc9
t) (2)
and
1
T
ðT
0
ðh
0
uc dz dt 5 h0u
0c
01 u
0hh
tc
ti1 hh
tu
tic
0
1 hhutc
ti1 h
0hu9
0c9
0i1 hhu9
0c9
ti
1 hhu9tc9
0i1 hhu9
tc9
ti, (3)
where the h�i symbol denotes a tidally averaged quan-
tity. The eight terms can be attributed to 1) freshwater
discharge, 2) tidal pumping (Dyer 1997), 3) Stokes drift,
4) transport by trapping (Fischer et al. 1979) that Dyer
(1997) refers to as tidal pumping. The term tidal pumping
is associated in the literature with landward transport
driven by tidal phase differences and tidal asymmetry in
combination with sediment-induced lag effects as a result
of settling and resuspension. Term 5 is associated with the
gravitational circulation. Terms 6–8 indicate changing
profiles within the tide that can be attributed to baroclinic
shear flows and internal tidal asymmetry. The eight terms
on the right-hand sides of Eqs. (2) and (3) will be referred
to as T1–T8 and TT1–TT8, respectively, below.
3. Results
a. An Eulerian perspective on the dynamicsof the ETM
1) FIXED STATIONS
The evolution of the vertical profiles of salinity, SPM
concentration, and velocity, recorded at the fixed sta-
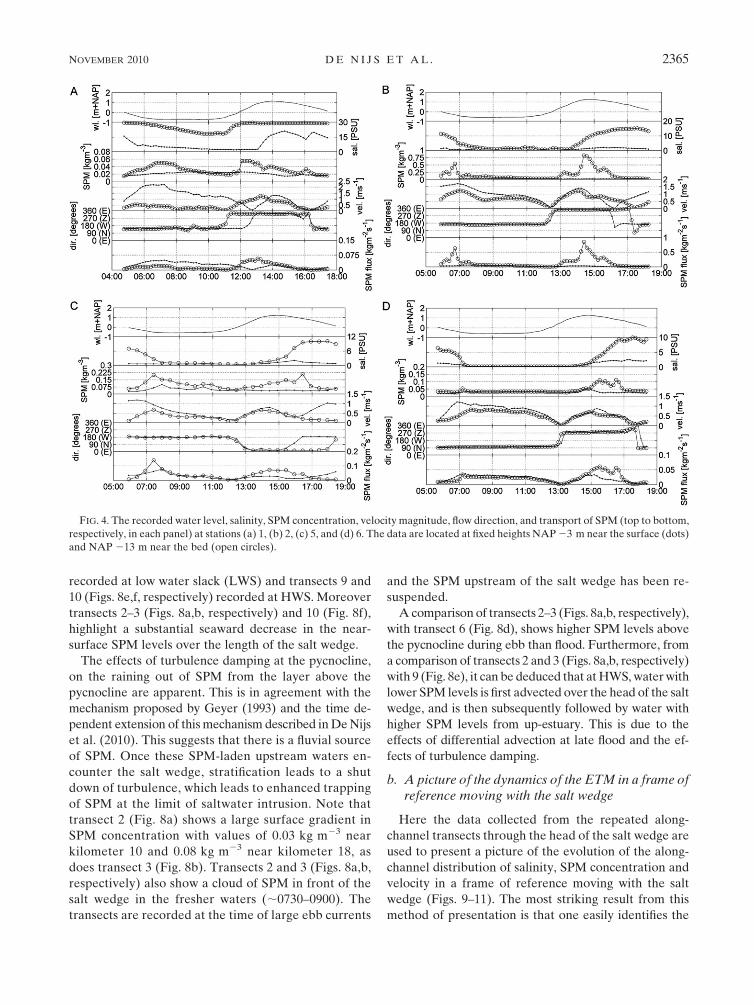
tions, are presented in Figs. 2 and 3. Figure 4 shows time
series of water level, salinity, SPM, velocity, direction,
and SPM transport near the surface and near the bed at
fixed stations. In general, the background concentra-
tions of SPM are low; with the surface SPM concentra-
tions varying between ;0.02 and 0.05 kg m23. High
values of SPM near the bed of ;0.8 kg m23 are ad-
vected with the salt wedge. However, settling of SPM
around LW and HW slack only leads to the de-
velopment of relatively low near-bed SPM concentra-
tion layers of ;0.1 kg m23.
The observed increase in the concentration of SPM
after slack tide, stations 2, 3 (not shown; see De Nijs
2010), 5 and 6 is caused initially by reentrainment of
SPM from the bed, followed by advection of SPM with
the head of the salt wedge. Stations 2 to 6 were located
within a tidal excursion from each other. The measure-
ments at stations 2, 3 (not shown), 5, and 6 show the
advection of clouds of SPM out of the Old and New
Meuse during ebb (station 2: 0600–0700 and 0730–1000;
station 5: 0700–1000; station 6: 0600–0630) and bi-
furcation of the ETM at the junction of the Old and New
Meuse during flood at ;1600 (stations 2, 5, and 6). The
time lag between maximum SPM concentration (Figs. 2
and 4) and maximum near-bed velocity (Figs. 3 and 4), in
combination with the correlated increase of salinity and
turbidity, suggests that high SPM concentrations are the
result of advection of the ETM toward the measuring
2362 J O U R N A L O F P H Y S I C A L O C E A N O G R A P H Y VOLUME 40

locations. Advection dominates the SPM signal over local
entrainment.
In particular, the measurements at stations 2, 3 (not
shown), and 5 show a distinct cloud of SPM below the
pycnocline during ebb (Fig. 2; ;0600–0800). However,
stations 2 and 5 also show a less distinct patch of SPM
(;0730–1000) in the fresher waters, which lags behind
the salt wedge. This latter patch is due to SPM that has
diffused higher into the water column. It is evident that
clouds of SPM are advected up-estuary with the salt
wedge, as the salt wedge retreats any deposited bed
material can then be resuspended as the current in-
creases. Therefore, the lags probably indicate relative
movement between the saltwater and SPM in the New
Meuse (station 5) due to resuspension (Figs. 3 and 4).
The high water slack (HWS) period and therefore the
amount of SPM that settles is larger in the New Meuse
(station 5) than in the Old Meuse (station 6; Figs. 3 and
4; see also De Nijs et al. 2010). Therefore, the observa-
tion of SPM lagging saltwater is more distinct in the New
Meuse.
2) THE EFFECTS OF SALINITY STRATIFICATION ON
TURBULENT MIXING
To understand the effects of salinity stratification on
the distribution of SPM, the evolution of SPM concen-
tration distribution, pycnocline height and gradient
Richardson numbers at the pycnocline at stations 1, 2, 3,
and 6 are presented in Fig. 5. The values of the gradient
Richardson numbers are above 0.25. This suggests that
the pycnocline confines turbulence induced mixing to
the region near the bed. Turbulence can mix SPM below
FIG. 2. Time series of vertical profiles of salinity (PSU) indicated by the blue lines and SPM concentration (kg m23) indicated by the
black lines recorded at stations (a) 1, (b) 2, (c) 5, and (d) 6 during the survey on 11 Apr 2006 [section 4c(4), Fig. 4]. The time of the survey is
shown on the abscissa and position within the water column on the ordinate. The reference frame used in Netherlands is the Normaal
Amsterdamse Peil (NAP). The gray contours depict salinity and the black contours SPM concentration. Saline water was present on both
the flood and ebb at station 1, whereas station 7 was located outside the range of the salt wedge. Station 4 is not included, as it is similar to
stations 3 and 5. Station 3 had a lower measuring frequency than station 2.
NOVEMBER 2010 D E N I J S E T A L . 2363

the pycnocline during ebb–flood advection periods, but
above the pycnocline, SPM concentrations are low.
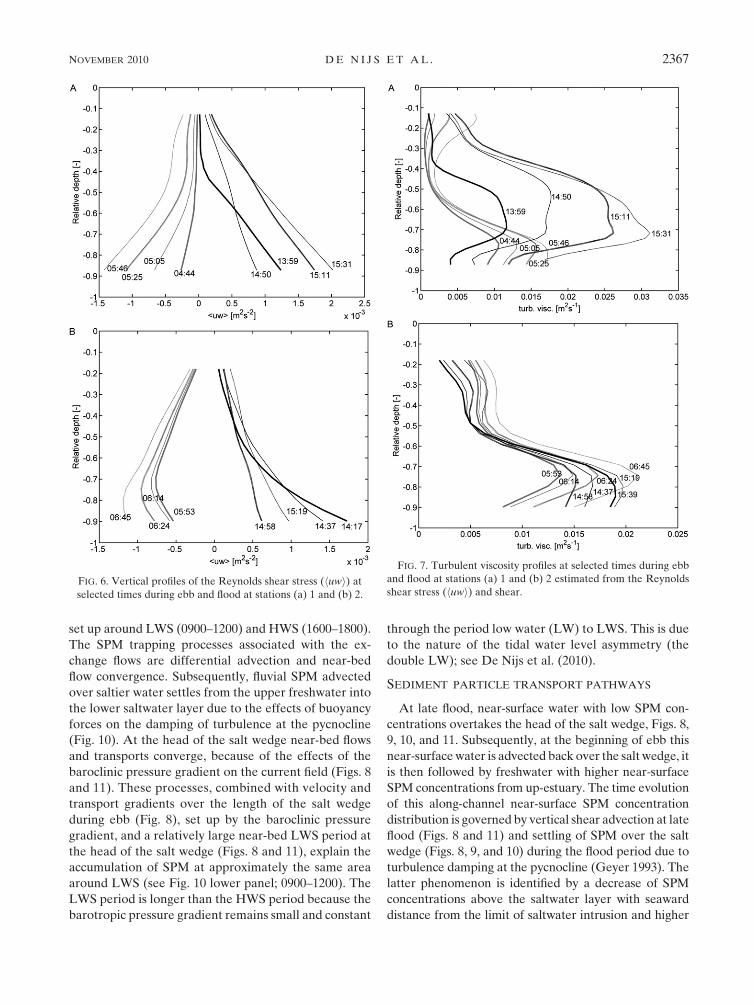
During ebb, the maximal Reynolds stress value is lower
and occurs somewhat higher above the bed than on
flood, Fig. 6. This is because the baroclinic pressure
gradient reinforces the tidal barotropic pressure gradi-
ent on flood and opposes it on ebb. Figure 7 shows tur-
bulent viscosity profiles, with maximal values in the
region near the bed (stations 1 and 2) and at middepth
(station 1) and a marked decrease with height above
the pycnocline. In consequence, Fig. 7 shows how the
pycnocline position in the water column controls the dis-
tribution of the turbulent viscosity at station 1. The
height of the pycnocline above the bed and the maximal
turbulent viscosity values above bed decrease during
ebb, and vice versa during flood, due to down-estuary
and up-estuary advection of the salt wedge by the tide,
respectively (see De Nijs et al. 2010).
3) ALONG-CHANNEL TRANSECTS
A mechanistic description of the SPM trapping pro-
cesses can be derived from the data collected during the
repeated along-channel transects through the head of
the salt wedge (Figs. 8a–f). Transects 3, 5, and 10 (Figs.
8f,b,c, respectively), show that the velocity and transport
gradients are directed into the salt wedge during ebb,
which indicates horizontal trapping. Middepth velocity
maxima are evident on the flood, transects 5 and 6 (Figs.
8c,d, respectively) at the location of the pycnocline.
Around slack water exchange flows are set up by the
baroclinic pressure gradient. These exchange flows are
evident in transects 3 and 5 (Figs. 8b,c, respectively)
FIG. 3. Time series of vertical profiles of velocity (m s21) recorded at stations (a) 1, (b) 2, (c) 5, and (d) 6 during the survey on 11 Apr
2006. The time of the survey is shown on the abscissa and position within the water column on the ordinate. The reference frame used in
the Netherlands for heights is the NAP. The gray colors and contour lines depict velocity, with positive values indicating ebb. Saline water
was present on both the flood and ebb at station 1, whereas station 7 was located outside the range of the salt wedge. Station 4 is not
included in the figures, as it is similar to stations 3 and 5.
2364 J O U R N A L O F P H Y S I C A L O C E A N O G R A P H Y VOLUME 40
recorded at low water slack (LWS) and transects 9 and
10 (Figs. 8e,f, respectively) recorded at HWS. Moreover
transects 2–3 (Figs. 8a,b, respectively) and 10 (Fig. 8f),
highlight a substantial seaward decrease in the near-
surface SPM levels over the length of the salt wedge.
The effects of turbulence damping at the pycnocline,
on the raining out of SPM from the layer above the
pycnocline are apparent. This is in agreement with the
mechanism proposed by Geyer (1993) and the time de-
pendent extension of this mechanism described in De Nijs
et al. (2010). This suggests that there is a fluvial source
of SPM. Once these SPM-laden upstream waters en-
counter the salt wedge, stratification leads to a shut
down of turbulence, which leads to enhanced trapping
of SPM at the limit of saltwater intrusion. Note that
transect 2 (Fig. 8a) shows a large surface gradient in
SPM concentration with values of 0.03 kg m23 near
kilometer 10 and 0.08 kg m23 near kilometer 18, as
does transect 3 (Fig. 8b). Transects 2 and 3 (Figs. 8a,b,
respectively) also show a cloud of SPM in front of the
salt wedge in the fresher waters (;0730–0900). The
transects are recorded at the time of large ebb currents
and the SPM upstream of the salt wedge has been re-
suspended.
A comparison of transects 2–3 (Figs. 8a,b, respectively),
with transect 6 (Fig. 8d), shows higher SPM levels above
the pycnocline during ebb than flood. Furthermore, from
a comparison of transects 2 and 3 (Figs. 8a,b, respectively)
with 9 (Fig. 8e), it can be deduced that at HWS, water with
lower SPM levels is first advected over the head of the salt
wedge, and is then subsequently followed by water with
higher SPM levels from up-estuary. This is due to the
effects of differential advection at late flood and the ef-
fects of turbulence damping.
b. A picture of the dynamics of the ETM in a frame ofreference moving with the salt wedge
Here the data collected from the repeated along-
channel transects through the head of the salt wedge are
used to present a picture of the evolution of the along-
channel distribution of salinity, SPM concentration and
velocity in a frame of reference moving with the salt
wedge (Figs. 9–11). The most striking result from this
method of presentation is that one easily identifies the
FIG. 4. The recorded water level, salinity, SPM concentration, velocity magnitude, flow direction, and transport of SPM (top to bottom,
respectively, in each panel) at stations (a) 1, (b) 2, (c) 5, and (d) 6. The data are located at fixed heights NAP 23 m near the surface (dots)
and NAP 213 m near the bed (open circles).
NOVEMBER 2010 D E N I J S E T A L . 2365

phase difference between the times of maximum SPM
concentration in the waters above and below the
pycnocline, the decrease in the near surface values of
SPM in the seaward direction, and the higher near surface
SPM concentrations on the ebb than on the flood.
Moreover the path taken by a particle of sediment during
the tidal cycle can be deduced.
The advection of the salt wedge and ETM into the
Botlek Harbor region during flood tide is evident (Figs.
9 and 10 lower panels; 1200–1600). It is known from
data collected at a mooring within Botlek Harbor that
part of the SPM in the ETM exchanged with Botlek
Harbor around high water (HW) ;1500 (De Nijs et al.
2008a,b). Salt and turbid water bifurcated into the Old
Meuse and New Meuse (Figs. 9 and 10; 1600). At the
limit of saltwater intrusion, ebb tide started first near
the bed in the Old Meuse followed by the Rotterdam
Waterway and New Meuse, (Fig. 3; stations 5 and 6; see
also De Nijs et al. 2010). Subsequently, the patches of
SPM and saltwater were advected out of both channels
into the Rotterdam Waterway during ebb, but at dif-
ferent phases of the tide. This is noticeable in Fig. 10
(lower panel; 0800–1000) by the presence of the two
clouds of SPM; cloud 1 at the 0.3 kg m23 and cloud 2 at
the 0.2 kg m23 contour line, respectively. The SPM in
the different clouds deposits at ;0900–1100 in ap-
proximately the same area of the river, down-estuary of
Botlek Harbor at LWS. Because of flood resuspension a
single cloud starts to form again at ;1100–1200, ;6 km
inland.
The corresponding velocity field (Fig. 11) indicates
that around slack water lower SPM concentrations (Fig.
10) occurred than during the previous ebb and flood
period. Figs. 9 and 11 also show that exchange flows are
FIG. 5. Time series of vertical profiles of SPM concentration and gradient Richardson number (Rig) recorded at stations (a) 1, (b) 2, (c) 5,
and (d) 6 during the survey on 11 Apr 2006. The time of the survey is shown on the x axis and position within the water column on the y axis.
The black and white contours depict SPM concentration, the gray colors depict gradient Richardson numbers and the gray line, the
position in the water column of maximum gradient Richardson number. The labels indicate the value of the maximum gradient Ri-
chardson number.
2366 J O U R N A L O F P H Y S I C A L O C E A N O G R A P H Y VOLUME 40
set up around LWS (0900–1200) and HWS (1600–1800).
The SPM trapping processes associated with the ex-
change flows are differential advection and near-bed
flow convergence. Subsequently, fluvial SPM advected
over saltier water settles from the upper freshwater into
the lower saltwater layer due to the effects of buoyancy
forces on the damping of turbulence at the pycnocline
(Fig. 10). At the head of the salt wedge near-bed flows
and transports converge, because of the effects of the
baroclinic pressure gradient on the current field (Figs. 8
and 11). These processes, combined with velocity and
transport gradients over the length of the salt wedge
during ebb (Fig. 8), set up by the baroclinic pressure
gradient, and a relatively large near-bed LWS period at
the head of the salt wedge (Figs. 8 and 11), explain the
accumulation of SPM at approximately the same area
around LWS (see Fig. 10 lower panel; 0900–1200). The
LWS period is longer than the HWS period because the
barotropic pressure gradient remains small and constant
through the period low water (LW) to LWS. This is due
to the nature of the tidal water level asymmetry (the
double LW); see De Nijs et al. (2010).
SEDIMENT PARTICLE TRANSPORT PATHWAYS
At late flood, near-surface water with low SPM con-
centrations overtakes the head of the salt wedge, Figs. 8,
9, 10, and 11. Subsequently, at the beginning of ebb this
near-surface water is advected back over the salt wedge, it
is then followed by freshwater with higher near-surface
SPM concentrations from up-estuary. The time evolution
of this along-channel near-surface SPM concentration
distribution is governed by vertical shear advection at late
flood (Figs. 8 and 11) and settling of SPM over the salt
wedge (Figs. 8, 9, and 10) during the flood period due to
turbulence damping at the pycnocline (Geyer 1993). The
latter phenomenon is identified by a decrease of SPM
concentrations above the saltwater layer with seaward
distance from the limit of saltwater intrusion and higher
FIG. 6. Vertical profiles of the Reynolds shear stress (huwi) at
selected times during ebb and flood at stations (a) 1 and (b) 2.
FIG. 7. Turbulent viscosity profiles at selected times during ebb
and flood at stations (a) 1 and (b) 2 estimated from the Reynolds
shear stress (huwi) and shear.
NOVEMBER 2010 D E N I J S E T A L . 2367

FIG. 8. The along-channel and vertical distribution of (top in each set) salinity (dashed lines) and SPM concen-
tration (continuous lines) and (bottom in each set) primary velocity component (negative 5 ebb flow) indicated by
the contours and profiles constructed from passages through the head of the salt wedge; A to J refer to transects
1 to 10, respectively: 11 Apr 2006 (a) 0600–0807 (b) 0807–0958, (c) 1147–1251, (d) 1258–1400, (e) 1604–1701, and
(f) 1701–1828.
2368 J O U R N A L O F P H Y S I C A L O C E A N O G R A P H Y VOLUME 40

near-surface SPM levels during ebb above the salt wedge
than at flood (Figs. 8, 9, and 10).
At slack water, the ETM temporarily loses part of its
SPM because of deposition caused by the low turbulent
mixing rates (Fig. 8 from 0900 to 1200 and Figs. 9, 10, and
11). This results in the formation of fine sediment layers
on the sandy bed. The observations never showed near-
bed concentrations above a few tenths of kilograms per
meter cubed, although inside the ETM concentrations
of about 1 kg m23 have been measured during the flood
FIG. 8. (Continued)
NOVEMBER 2010 D E N I J S E T A L . 2369

period. However, it is estimated that these high SPM
concentration layers are only a few centimeters thick at
slack water, which makes them undetectable with our
instrumentation. Entrainment of SPM from the bed
during the beginning of flood and ebb prevents
permanent storage in the bed. It is therefore anticipated
that the total deposition around slack tide equals the
subsequent total resuspension during flood and ebb. At
the down- and up-estuary stations, peak SPM concen-
trations occur before peak velocities (see Figs. 2 and 4;
FIG. 8. (Continued)
2370 J O U R N A L O F P H Y S I C A L O C E A N O G R A P H Y VOLUME 40
stations 1 and 7, not shown). This indicates that the tidal
potential entrainment–erosion rate exceeds the avail-
ability of sediment at the bed (see also appendix). These
(bed) conditions indicate that SPM transport and en-
trapment are not determined by peak velocity and mix-
ing asymmetries, but are more sensitive to slack water
period asymmetries, lag effects, and processes driven by
the baroclinic pressure gradient and buoyancy forces
such as the formation of exchange flow profiles and
turbulence damping. Furthermore, frequent exchange of
SPM between the ETM and harbor basins limits accu-
mulation of SPM in the ETM, and consequently a bed-
based supply of mud is not formed.
When sediment induced resuspension lags occur after
LWS, the pycnocline still damps turbulent diffusion of
SPM over the entire water column. However, this may not
be the case after HWS when saltwater has been advected
down-estuary or when stratification of the remaining salt-
water may be too weak to damp turbulent mixing. There-
fore, a sediment particle travels on flood below the
pycnocline (Figs. 9, 10, and 2; station 2 from 1200 to
1700) and travels back during ebb higher in the water
column, lagging the retreat of the salt wedge (Fig. 2;
station 2, SPM cloud 1 from 0600 to 0730 and cloud 2
from 0700 to 1100). The measurements indicate that
such an SPM patch, or at least part of it, can eventually
be recollected in the saltwater layer around LWS (Figs. 9
and 10).
c. Tidally averaged budgets and ETM generationtime scale
To analyze the efficiency of the SPM trapping pro-
cesses we define a balance area (Fig. 12). These processes
cause a difference in the seaward-directed tidally aver-
aged SPM transport between the up- and down-estuary
borders, which is larger than the exchange of SPM with
the Botlek Harbor basin (Table 1). The tidally averaged
salinity and SPM transport profiles show up-estuary
transport in the lower layer at the down-estuary bound-
ary of the balance area (station 1) and down-estuary
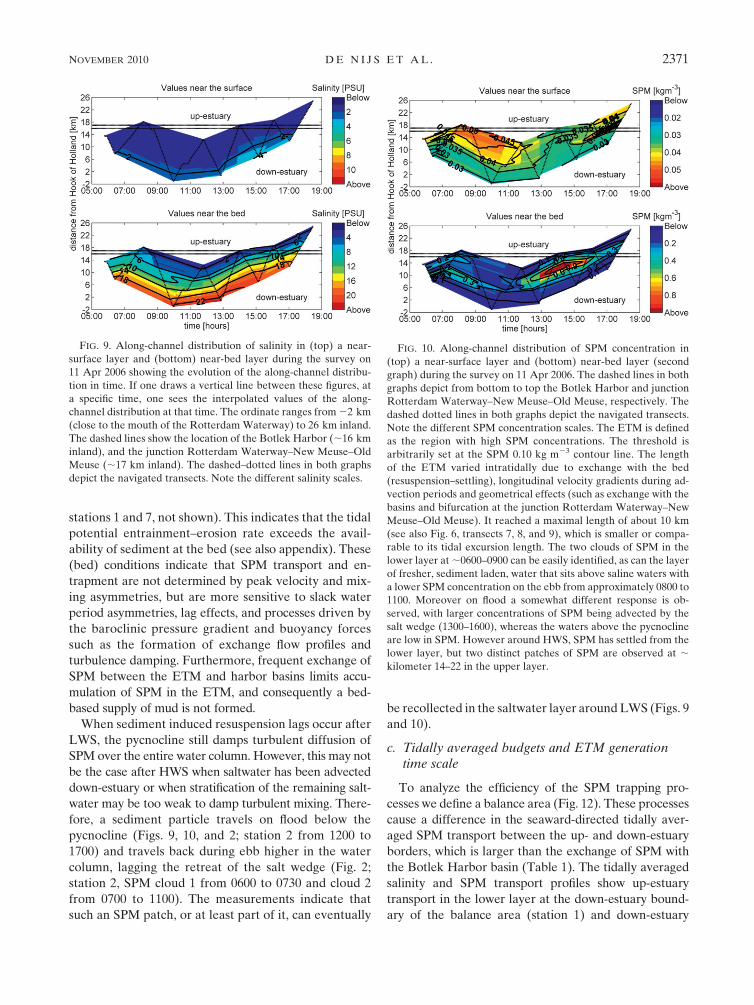
FIG. 9. Along-channel distribution of salinity in (top) a near-
surface layer and (bottom) near-bed layer during the survey on
11 Apr 2006 showing the evolution of the along-channel distribu-
tion in time. If one draws a vertical line between these figures, at
a specific time, one sees the interpolated values of the along-
channel distribution at that time. The ordinate ranges from 22 km
(close to the mouth of the Rotterdam Waterway) to 26 km inland.
The dashed lines show the location of the Botlek Harbor (;16 km
inland), and the junction Rotterdam Waterway–New Meuse–Old
Meuse (;17 km inland). The dashed–dotted lines in both graphs
depict the navigated transects. Note the different salinity scales.
FIG. 10. Along-channel distribution of SPM concentration in
(top) a near-surface layer and (bottom) near-bed layer (second
graph) during the survey on 11 Apr 2006. The dashed lines in both
graphs depict from bottom to top the Botlek Harbor and junction
Rotterdam Waterway–New Meuse–Old Meuse, respectively. The
dashed dotted lines in both graphs depict the navigated transects.
Note the different SPM concentration scales. The ETM is defined
as the region with high SPM concentrations. The threshold is
arbitrarily set at the SPM 0.10 kg m23 contour line. The length
of the ETM varied intratidally due to exchange with the bed
(resuspension–settling), longitudinal velocity gradients during ad-
vection periods and geometrical effects (such as exchange with the
basins and bifurcation at the junction Rotterdam Waterway–New
Meuse–Old Meuse). It reached a maximal length of about 10 km
(see also Fig. 6, transects 7, 8, and 9), which is smaller or compa-
rable to its tidal excursion length. The two clouds of SPM in the
lower layer at ;0600–0900 can be easily identified, as can the layer
of fresher, sediment laden, water that sits above saline waters with
a lower SPM concentration on the ebb from approximately 0800 to
1100. Moreover on flood a somewhat different response is ob-
served, with larger concentrations of SPM being advected by the
salt wedge (1300–1600), whereas the waters above the pycnocline
are low in SPM. However around HWS, SPM has settled from the
lower layer, but two distinct patches of SPM are observed at ;
kilometer 14–22 in the upper layer.
NOVEMBER 2010 D E N I J S E T A L . 2371

transport over the water column at the up-estuary
boundaries (stations 6 and 7). Thus, salinity and SPM
transports converge in the lower layer in a tidal average
sense, and therefore the amount of SPM in the balance
area and thus in the ETM at the head of saltwater in-
creases (Table 1, row 3 minus rows 2 and 4). Based on
this difference in SPM transport the yearly accumulation
rate of SPM in the Rotterdam Waterway is estimated at
1.5 Mt yr21 (Table 1, column 4, rows 2 and 3). Table 1
shows that the amount of SPM transported on flood and
ebb at station 2 in the middle part of the estuary is larger
than at the stations in the upper and lower estuary sta-
tions (columns 2 and 3, cf. rows 2–4 with row 5). The fact
that this yearly accumulation rate is of the same order as
the yearly sedimentation rates of fine-grained sediments
(mud) in the harbor basins along the Rotterdam Wa-
terway and New Meuse (i.e., including the Botlek Har-
bor) indicates the importance of the role of the ETM in
the siltation process of the up-estuary harbor basins
along the Rotterdam Waterway and New Meuse and
vice versa (see De Nijs et al. 2009).
The time scale for the redevelopment of ETM to its
original state, after its hypothetical removal, is esti-
mated from the total amount of SPM displaced during
the flood period at Station 2, and the net supply. This
time scale amounts to 3 tidal periods. Based on exchange
measurements in the Botlek Harbor mouth on 11 April
2005, it is assessed that about one-seventh of the total
amount of SPM in the ETM is transported into the
Botlek Harbor during a tide—the trapping efficiency of
the Botlek Harbor is almost 100% (De Nijs et al. 2008b).
Hence, it acts as an efficient sink for SPM in the ETM.
d. Dispersive fluxes
The instantaneous and tidally averaged fluxes from
the mass transport decomposition analysis are shown in
Figs. A1 and 13, respectively. The tidally averaged dis-
charge (TT1; left-pointing open triangle symbol) is the
dominant mechanism conveying SPM and salinity sea-
ward; it is almost 100% of the export at every station. At
station 1, tidal pumping (TT3 and TT4; open diamond and
open square symbols, respectively) and gravitational
FIG. 11. Along-channel distribution of the primary (along
channel) velocity component (negative 5 flood) in (top) a near-
surface layer and (bottom) near-bed layer recorded during the
survey on 11 Apr 2006. The dashed lines depict (bottom to top) the
Botlek Harbor and junction Rotterdam Waterway–New Meuse–
Old Meuse. The dashed dotted lines depict the navigated transects.
Note the formation of fronts around 0900–1200 and 1600–1800.
These hydrodynamic features are associated with near-bed con-
vergent transports and differential advection. If one draws a verti-
cal line, between the upper and lower water column figures at, for
example, 1100 differential advection is evident; while the angle of
the slack water lines at bottom indicates convergence.
FIG. 12. Balance area of the ETM measured during the survey on 11 Apr 2006. Stations 1, 6,
and 7 define the borders of a domain used to estimate the tidal time scale of transport of salt and
sediment. These transports are used to quantify the SPM budget in the ETM over a tidal cycle,
the generation time scale of the ETM, and the physical processes that contribute to the hori-
zontal transport of SPM.
2372 J O U R N A L O F P H Y S I C A L O C E A N O G R A P H Y VOLUME 40

circulation (TT5; right-pointing open triangle symbol)
contribute predominantly to the landward SPM flux,
15%, 15%, and 70%, respectively. Tidal pumping is the
dominant SPM flux mechanism at the up-estuary stations
(2, 3, 5, and 6). At station 2 the contributions of tidal
pumping and the gravitational circulation are 15%, 55%,
and 30% respectively. Station 7 is outside the excursion
range of saltwater and ETM. Here the landward trans-
port by tidal pumping was 19% of the seaward directed
transport by the tidally averaged discharge. Landward
transport by tidal pumping is counteracted by the tidally
averaged seaward directed discharge, and therefore it
does not play a role in maintaining a stable ETM up-es-
tuary of the saltwater.
If we compare the distribution of the aforementioned
terms at a particular station (stations 1, 2, 3, 5, and 6) for
salinity (upper two panels) and SPM (lower two panels)
there is a strong correlation. The salt wedge and ETM
have been advected through stations 2, 3, 5, and 6 during
both ebb and flood. This suggests that advection of both
the salt wedge and ETM structure determines the SPM
transport terms, not local processes (see also the ap-
pendix). At stations 1, 2, 3, 5, and 6 the tidal depth mean
transport (TT4) also contributes to landward transport
of saltwater. Although, this may reflect some uncertainty,
this type of transport can be attributed to tidal pumping
by the diurnal inequality; that is, the net import of salinity
over a semidiurnal time scale associated with the tidal
asymmetrical displacement of the salt wedge due to dif-
ferences in subsequent low water levels (see De Nijs et al.
2010). This means that tidal pumping by the diurnal in-
equality contributes to the TT4 SPM flux as well.
e. SPM origin and budgets
One of the key questions is how SPM is supplied to the
ETM. This involves the determination of the relative
contribution of marine and fluvial sediment sources
from long-term sediment budget and tracer analyses
(see De Nijs 2011). The results of tracer analyses
indicate that the major constituent in the harbor basins
along the Rotterdam Waterway is fluvial sediment,
about 90%–100%. Based on sediment balances that
cover the period 1977–2000, it is established that the
annual fluvial SPM influx exceeds the siltation rates of
the channels and harbors along the Rotterdam Water-
way and New Meuse. Hence, although the salinity in-
duced density structure keeps SPM in the estuary, the
Rotterdam Waterway does not function as a complete
fluvial SPM trap (see also Table 1, row 3 minus row 2).
About 50% of the annual fluvial SPM flux at the junction
is allowed to escape the Rotterdam Waterway. Tracer
analyses and reanalysis of older tracer studies confirm
this picture, sediments of fluvial origin, ;(10%–25%),
are found down-estuary in the Maasmond (Europoort
and Caland–Beerkanaal).
The siltation rates at Botlek Harbor and the down-
estuary border the Maasmond do not significantly cor-
relate. The siltation rates at Botlek Harbor are commonly
high, while siltation at the Maasmond is determined by
events (Verlaan and Spanhoff 2000). At both areas the
siltation rates show seasonal variation. The siltation rates
at Botlek Harbor are generally higher from winter to
spring (freshets) compared to the summer and early au-
tumn. At the down-estuary border, the Maasmond, high
siltation rates particularly occur from autumn to winter
during and after rough weather periods and associated
high wave activity on the North Sea. The magnitude of
these siltation events indicates a marine source (Verlaan
and Spanhoff 2000).
When sedimentation events occur at the Maasmond,
marine sediments enter this Port system mainly as near-
bed suspensions (Kirby and Parker 1977; Vlemmix 1980;
Kirby 1992; van Woudenberg 1998). The Maasmond
area is much deeper than the Rotterdam Waterway,
which prevents these near-bed marine suspensions from
propagating into the Rotterdam Waterway. Therefore,
TABLE 1. SPM budget in the ETM over a tidal cycle based on data collected on 11 Apr 2006 at stations 1, 2, 3, and 7, and data collected
on 14 Apr 2005 in the mouth of Botlek Harbor. Total SPM fluxes during a part and complete tidal cycle. Positive values denote a down-
estuary-directed SPM flux or a sink flux. It is noted that the current, salt, and SPM concentration structure has been measured at three
points in a cross section. It is therefore emphasized that the fluxes and quantities in Table 1 are approximations. At all stations the net
tidally and depth-averaged sediment transport is directed seaward. Landward transport is only observed at stations 1 and 2 in the near-bed
part of the tidally averaged SPM transport profile (not shown). This up-estuary transport at station 2 is attributed to exchange of part of the
SPM in the ETM from the Rotterdam Waterway into the Botlek Harbor, but relative motion between salt and turbid water also con-
tributes to this observation.
Stations Up-estuary (tons per flood) Down-estuary (tons per ebb) Net (tons per tide)
Station 1 (down-estuary border) 23640 5030 1390
Station 6 (up-estuary border) 21800 3000 1200
Station 7 (up-estuary border) 21730 3990 2260
Station 2 26090 8050
Botlek Harbor (sink) 860
NOVEMBER 2010 D E N I J S E T A L . 2373

the tidal and shear SPM transport terms at station 1 may
not be interpreted as import of marine SPM, but rather
ascribed to the recirculation and advection of accumu-
lated fine sediment, which most likely is mainly of fluvial
origin.
Based on data from yearly bed sample campaigns
collected by the Port Authority, (see De Nijs 2011), it is
established that the dredged material in the Rotterdam
Waterway, New Meuse, and Old Meuse predominantly
consists of fine and medium sand hardly any mud is
dredged, while the dredged material in the harbor basins
along the Rotterdam Waterway and New Meuse mainly
consists of fine sand and mud. This indicates that the har-
bor basins provide efficient fluvial SPM traps as a result of
which no permanent bed source of mud in the Rotterdam
Waterway, New Meuse, and Old Meuse can develop.
The large river discharge gives rise to a large fluvial
SPM flux, although the background river SPM concen-
trations are low (about 0.030 kg m23). Therefore the
background SPM concentration gradients are relatively
weak; that is, the background SPM concentrations (Fig.
2) amount to 0.015 kg m23 at station 1 and 0.030 kg m23
at stations 6 and 7 (not shown).
4. Discussion
SPM accumulation at the head of the salt wedge in the
Rotterdam Waterway is not determined by the magni-
tude of velocity and turbulent mixing asymmetries (e.g.,
van Leussen and van Velzen 1989; Jay and Musiak 1994;
Burchard and Baumert 1998; Chant and Stoner 2001;
Scully and Friedrichs 2003) but rather by trapping pro-
cesses driven by the salinity-induced density structure
operating at the head of the salt wedge. A schematic
highlighting these processes is presented in Fig. 14. It is
the combination of barotropic tidal asymmetry imposed
at the mouth, baroclinicity and suppression of turbu-
lence at the pycnocline that determines the flow struc-
ture in the Rotterdam Waterway (De Nijs et al. 2010).
These processes act to trap fluvial sediments that are in
suspension in the fresher, upper parts of the water col-
umn into the layer beneath the pycnocline. In fact, tur-
bulence damping at the pycnocline operates throughout
the tidal cycle, and hence the SPM above the pycnocline
can settle throughout the tidal cycle slowly clearing the
water column from SPM. The baroclinic pressure gra-
dient and decoupling effects associated with damping of
FIG. 13. The computed terms in the decomposition of the mass transports for the tidal and
cross-sectional- averaged salinity and SPM transport per unit width [Eq. (3) terms TT1–
TT8]. The terms have been obtained from a decomposition of the instantaneous vertical
velocity and SPM profiles recorded at stations 1–3 and 5–7. (top and top middle) Depth
mean (advection) and shear-induced dispersion transport components of salinity, re-
spectively. (bottom middle and bottom) The depth mean (advection) and shear-induced
dispersion transport components of SPM, respectively. Positive values indicate net sea-
ward transport. The locations of stations 1, 2, 3, 5, 6, and 7 are shown in the second panel
from the top.
2374 J O U R N A L O F P H Y S I C A L O C E A N O G R A P H Y VOLUME 40

turbulence at the pycnocline induce vertical velocity
shear during the ebb tide, which favors differential ad-
vection of SPM over the salt wedge and retards near-bed
currents toward LWS. The latter results in near-bed
longitudinal transport gradients, directed into the salt
front, which indicate horizontal trapping.
At the head of the salt wedge near LWS, the baro-
clinic pressure gradient drives a flood current near the
bed, which in turn entrains and transports SPM against
the ebbing current, which causes the observation of ex-
change flows (Fig. 14). These exchange flows indicate
near-bed convergence of transports and relative motion
between salt and freshwater layers, both processes
contribute to SPM trapping near the limit of saltwater
intrusion. Because of the latter process, fresh SPM laden
water is advected over the pycnocline. However, as a
consequence of damping of turbulent mixing by strati-
fication at the pycnocline, the SPM then starts to settle
into the lower, more saline layer beneath. The effect
of turbulence damping on SPM entrapment is indicated
by a distinct seaward decrease of SPM above the salt
wedge. The trapped SPM is recirculated and advected
by currents driven by the baroclinic and barotropic tidal
pressure gradients. This is in agreement with the dis-
persive flux analysis, which shows the dominant con-
tribution of the gravitational circulation and minor
contributions by tidally changing shear and stratification
correlations associated with baroclinic shear flows (ap-
pendix; De Nijs et al. 2010) and internal tidal asymmetry
(e.g., Jay and Musiak 1994, 1996) to up-estuary transport
of salt and SPM (see station 1). Furthermore, the dis-
persive flux analysis shows that barotropic tidal asym-
metry, in combination with sediment induced threshold
lags cannot maintain an SPM balance against the river
flow (see station 7).
However, barotropic asymmetry imposed at the mouth
of the Rotterdam Waterway does have a role to play. It
imposes a time scale on the advection of the salt wedge
and determines the barotropic asymmetries within the
estuary. It arises from the nonlinear deformation of the
tidal wave in the shallow North Sea, before entering
the estuary. A detailed analysis by De Nijs et al. (2010)
found that internal tidal asymmetry, has a negligible
role to play within the Rotterdam Waterway. This is in
contrast to the Columbia River, which is connected to
a deep, narrow offshore shelf. Jay (1991) and Jay and
Musiak (1996) found a less distinct barotropic M4;U
overtide component near the mouth of the Columbia
River. Therefore, the mechanism presented here (Fig.
14) is likely to operate in narrow, partially mixed and
stratified estuaries, with relatively strong river runoff,
which border shallow shelf seas with relatively strong
barotropic tidal forcing.
Although there is a distinct barotropic tidal asym-
metry, the measurements presented here provide sup-
port to the mechanism first proposed by Geyer (1993).
He clearly shows the important role played by turbu-
lence damping, at the pycnocline, in the raining out and
subsequent trapping of fluvial sediment. However, here
FIG. 14. (top) A conceptual sketch of along-channel exchange
flows at LWS and HWS, which depict differential advection and
frontal convergence. SPM becomes trapped near the limit of salt-
water because of near-bed converging SPM transports and SPM
advected over the saline water front settles because of turbulence
damping at the pycnocline. At LWS freshwater with relatively more
SPM is advected over the salt wedge than at HWS. At HWS, SPM-
laden water, which has been above the salt wedge during flood is first
advected back over the wedge followed by fresher water with more
SPM. (bottom two panels) A conceptual Lagrangian sketch of
the relation between sediment entrapment in the Rotterdam Wa-
terway and harbor siltation under typical hydrodynamic conditions.
(bottom panel) Patches indicating elevated SPM concentrations
advancing and retreating with the head of the salt wedge on a
semidiurnal time scale. During flood, tide saline and turbid water
exchange with the harbor basin and bifurcate at the junction into the
New Meuse and Old Meuse and are advected back into the Rot-
terdam Waterway during ebb tide, but at different phases of the tide.
The length of the ETM is smaller than or about equal to the tidal
excursion length. Therefore, the length scale within which high
sediment concentrations occur is smaller than the advection length
scale. This highlights the importance of nonuniformity of the along-
channel SPM distribution (gradients) and advection.
NOVEMBER 2010 D E N I J S E T A L . 2375

we also show that the mechanism operates in a reference
frame moving with the salt wedge, throughout both the
flood and ebb. The observations show a distinct spatial
variation in the current structure and turbulent mixing,
which is driven by the baroclinic structure. Furthermore
we demonstrate that it is this spatial variation that is
responsible for the trapping of fluvial SPM that is in
suspension.
The magnitude of the SPM concentration and distri-
bution is determined by the limited availability of SPM
(mud) at the bed, advection of the salt wedge and as-
sociated ETM, and dynamics of the SPM in the ETM
relative to saltwater due to deposition, resuspension,
and exchange with harbor basins and side channels. The
SPM in the ETM near the head of the salt wedge un-
dergoes a cycle of processes, which include advection,
settling, and entrainment before this SPM is transported
into areas of low hydrodynamic energy, such as harbor
basins. Sediment particles follow complex pathways,
which include vertical excursions between the salt and
freshwater layers because of relative motion between
the saline and turbid water. After HWS relative motion
between saline and turbid water causes the temporary
separation of part of the SPM from the ETM below the
pycnocline. This SPM lags behind the saltwater because
of settling and resuspension. Hence, relative motion
between saline and turbid water favors the transport of
SPM beneath the pycnocline on flood and above it during
ebb. This SPM patch will eventually accumulate again in
the saltwater layer. Relative movement between salt and
turbid water will not result in the accumulation of fine-
grained sediment landward of the saltwater intrusion
because the relatively large, seaward-directed, tidally
averaged discharge counteracts the up-estuary transport
by tidal pumping (see station 7, Fig. 13).
The bed conditions determined from bed samples
(section 3e) and SPM measurements indicate that all
fine sediment settling on the bed is in suspension during
ebb–flood advection periods. This indicates that de-
position at HWS approximately equals entrainment af-
ter HWS and that, subsequently, deposition at LWS
approximately equals entrainment after LWS. In fact,
the entrainment capacity appears more than sufficient to
remobilize the available fine sediments for transport.
Furthermore, the transport conditions indicate that the
transport carrying capacity (Fig. 7) is not fully utilized
(see also De Nijs et al. 2008; De Nijs 2011). Hence, the
ETM behavior is not largely affected by a bed supply of
mud. It is noted that this observation contrasts with many
studies on accumulation of SPM. Those studies show ei-
ther temporary (during neap) or permanent storage of
mud in the bed. In such cases, SPM transport is de-
termined by the magnitude of velocity asymmetries.
The origin of the sediment in the Rotterdam Waterway
lends further support to the mechanism summarized in
Fig. 14. It is concluded that the absence of a bed-based
supply of mud in the Rotterdam Waterway can be at-
tributed to the continuous removal of fine sediment from
the system by sedimentation in the harbor basins and
subsequent dredging operations, where the dredged
sediments are deposited elsewhere (e.g., the North Sea).
Moreover, this system is too dynamic and it does not
function as a complete fluvial SPM trap because of ex-
cursions of saltwater. Therefore, relatively sharp transi-
tions between sandy (Rotterdam Waterway, Old Meuse,
Hartelkanaal, and New Meuse) and muddy beds (har-
bors) occur in spite of a relatively large supply of fluvial
mud. The ETM persists despite the absence of a signifi-
cant marine source of SPM because it is maintained by
trapping of a relatively large fluvial supply of SPM.
Eisma et al. (1980, 1991) found no evidence of salt-
induced flocculation in the Rotterdam Waterway. An
analysis of sediment particles showed that these were
already aggregated by organic matter in the freshwater
region (see also Santema 1953). Dyer et al. (2002) and
van Leussen (1994) indicate that the flocculation pro-
cesses in high energetic estuarine systems are largely
determined by parameters such as SPM concentration
and shear rate. However, an increase in settling of SPM
due to aggregation processes as found in high energetic
estuarine systems on the time scale of the observation(s)
is unlikely. These quantities are low above the pycnocline,
and the SPM concentration decreases seaward (Figs. 8
and 10). The flocculation process in the upper part of the
water column is therefore expected to have a relatively
large time scale (van Leussen 1994).
The mechanism presented in Fig. 14 implies hydrody-
namic sorting of SPM near the surface along the estuary
axis. Past studies (Eisma et al. 1980, 1982, 1991; van
Leussen 1994, p. 60: Eisma et al. 1982) provide support
for this. They observed a gradual seaward increase in the
percentage of fine aggregates and decrease in the per-
centage of large aggregates (macro flocs) in particle size
distributions near the surface. Higher levels of organic
matter were also found in the saltwater region at low
salinities. This suggests the effects of the production of
small scale turbulence in areas of high shear rates around
the pycnocline (Fig. 8; De Nijs 2011), which break up
fragile macro flocs.
Note that we may not use a single near-bed monitor-
ing station (van Leussen and van Velzen 1989) to de-
termine net transport rates, in situations in which flood
transport is concentrated near the bed and ebb transport
is more homogenously distributed over the water col-
umn. However, differences in ebb and flood transport in
the Rotterdam Waterway can already be explained by the
2376 J O U R N A L O F P H Y S I C A L O C E A N O G R A P H Y VOLUME 40

exchange of part of the ETM with the harbor basins (De
Nijs et al. 2009). Furthermore, the effects of advection and
water–bed exchange processes cannot be distinguished
from such single monitoring stations either. For example,
over the spring neap cycle the distance of the saltwater
intrusion limit and ETM relative to the mooring changes.
This causes variations in SPM concentration which are
driven by (asymmetrical) displacements rather than by
local processes (erosion, resuspension). Consequently,
near-bed moorings alone cannot give complete insight in
these processes, nor serve as a dataset to properly test and
validate three-dimensional models.
The key to understanding the mechanisms contributing
to ETM formation in the Rotterdam Waterway is that
there is no bed-based supply of mud, the transport ca-
pacity is not fully utilized and that the SPM in the ETM is
predominantly of fluvial origin. The harbor basins along
the Rotterdam Waterway and New Meuse provide effi-
cient SPM sinks and the Rotterdam Waterway is not
a complete fluvial SPM trap. Even though background
SPM concentrations on the river are relatively low, the
strong regulated river discharge gives rise to a large flu-
vial SPM flux that exceeds the siltation rates of the harbor
basins along the Rotterdam Waterway and New Meuse.
Hence, the fluvial SPM flux is sufficient to maintain the
ETM over time and on subtidal time scales the SPM
trapping efficiency depends on the salt intrusion length.
Therefore, we have a mechanism for ETM formation,
which is in contrast with the maintenance mechanism
suggested by Jay and Musiak (1994) and Burchard and
Baumert (1998). These authors emphasize the impor-
tance of baroclinic and turbulent mixing induced asym-
metry and spatial variation of near-bed currents. It also
contrasts with concepts of landward transport based on
baroclinic driven tidal asymmetries in bed shear stress
(van Leussen and van Velzen 1989) and the resus-
pension height of sediment (Scully and Friedrichs 2003).
Moreover, it is different to the mechanism discussed by
Chant and Stoner (2001), they emphasize the combined
effect of (flood dominated) barotropic tidal asymmetry
and buoyancy on turbulent mixing which drives an
asymmetry in sediment deposition and resuspension
augmenting particle trapping in the Navesink River es-
tuary. However, any (partially) stratified estuary expe-
riences a reduction of turbulence at the pycnocline
throughout the tidal cycle, and will result in the raining
out and trapping of fluvial SPM from the saltwater layer.
In consequence, the mechanism presented here, Fig. 14,
should have broader implications (see Geyer 1993).
Acknowledgments. This research is supported by the
Dutch Technology Foundation STW, Applied Science
Division of now, and the Technology Program of the
Ministry of Economic Affairs. The authors thank the Port
of Rotterdam, in particular Herman Meijer, for giving
support to this research and for providing vessels and
crews to conduct the boat survey. Marc Rotsaert of Port of
Rotterdam is also thanked for assistance and support
during the startup phase of the survey. The authors also
thank RWS Directorate Zuid-Holland, in particular Ad
Schipperen and Arie Barendrecht, for providing vessels
to conduct the boat surveys. Marc Sas of IMDC, Ltd.,
is gratefully acknowledged for providing instruments
and personnel. Royal Boskalis Westminster, Ltd., is also
thanked for providing a captain for the M.S. Tender. We
also thank the EU 6th Framework Programme Project
ECOOP, ‘‘European Coastal Sea Operational Observing
and Forecasting System’’ for providing support for the
preparation of this paper. We are grateful to Prof. Hans
Burchard and an anonymous reviewer for their helpful
comments on the paper.
APPENDIX
Instantaneous Salinity and SPM Transport
Figure A1 presents salt and SPM flux decomposition
of advective transport at stations 1 and 2. The advection
of the ETM and the limited availability of SPM for
transport can be deduced from comparisons of T3 and
T4 SPM fluxes between stations 1 (Fig. A1c) and 2 (Fig.
A1d) and from comparisons between SPM and salt
fluxes at station 2 (Figs. A1b,d). Contrary to station 1,
a peak is observed in the T4 SPM flux during flood
(1300–1500) at station 2. This peak is associated with
advection of the ETM, it lags the peak in T3 (Fig. A1d)
associated with advection of background SPM. A com-
parison with the T4 salt flux at station 2 (Fig. A1b)
between 1400 and 1530 associated with the tidal advec-
tion of the salt wedge supports this. However, after 1445
the T4 SPM flux decreases while the T4 salinity flux
remains high. This difference in time evolution indicates
the limited amount of SPM available for transport in
comparison to salinity. This transport condition can also
be inferred from a comparison of T3 and T4 SPM fluxes
and T4 salinity and SPM fluxes at station 1 (Figs. A1a,c)
between 1200 and 1600. The peak in negative T4 SPM
flux occurs before the peak in negative T3 SPM flux, and
the T4 SPM and salt fluxes are out of phase while the T3
salt and SPM fluxes are in phase. Hence, peak SPM
concentrations occur before peak velocities and SPM
concentrations drop before peak velocities because of the
limited availability of SPM down-estuary of station 1
relative to salinity.
At station 1 (Fig. A1a) the salt balance is governed
by the gravitational circulation and nonclosing tidal
NOVEMBER 2010 D E N I J S E T A L . 2377

correlations associated with an asymmetry in advection of
the salt wedge due to the diurnal inequality. However, at
station 2 (Fig. A1b) T7 and T8 fluxes associated with
baroclinic shear flows, particularly exchange flows around
HWS (between 1600 and 1800), show a significant con-
tribution to the up-estuary salt flux as well. A comparison
of T5–T8 salt and SPM fluxes (Figs. A1b,d) shows similar
time evolution from ebb to the beginning of flood. Dif-
ferences in their (T6–T8 fluxes) time evolution during
flood are likely due to differences in the along-channel
distribution of salt and SPM. In contrast to the salt bal-
ance, the contribution of exchange flows to up-estuary
transport of SPM (T7 and T8) around HWS (between
1600 and 1800) is limited to the T7 flux. This indicates the
limited availability of SPM at the borders of the ETM.
REFERENCES
Allen, G. P., J. C. Salomon, P. Bassoullet, Y. Du Penhoat, and
C. De Grandpre, 1980: Effects of tides on mixing and
suspended sediment transport in macrotidal estuaries. Sedi-
ment. Geol., 26, 69–90.
Avoine, J., G. P. Allen, M. Nichols, J. C. Salomon, and
C. Larsonneur, 1981: Suspended-sediment transport in the
Seine estuary, France: Effect of man-made modifications
on estuary-shelf sedimentology. Mar. Geol., 40, 119–137.
Brennon, I., and P. Le Hir, 1998: Modelling fine sediment dynamics
in the Seine estuary: Interaction between turbidity patterns
and sediment balance. Physics of Estuaries and Coastal Seas,
J. Dronkers and M. Scheffers, Eds., Balkema, 431 pp.
——, and ——, 1999: Modelling the turbidity maximum of the
Seine Estuary (France): Identification of formation processes.
Estuarine Coastal Shelf Sci., 49, 525–544.
Burchard, H., and H. Baumert, 1998: The formation of estuarine
turbidity maxima due to density effects in the salt wedge. A
hydrodynamic process study. J. Phys. Oceanogr., 28, 309–320.
Chant, R. J., and A. W. Stoner, 2001: Particle trapping in a stratified
flood-dominated estuary. J. Mar. Res., 59, 29–51.
De Nijs, M. A. J., 2011: On sedimentation processes in a stratified
estuarine system. Ph.D. thesis, Delft University of Technol-
ogy, in press.
——, J. C. Winterwerp, and J. D. Pietrzak, 2008: SPM variations in
a harbour basin. Sediment and Ecohydraulics, Vol. 9, Pro-
ceedings in Marine Science, Elsevier, 357–378.
FIG. A1. The computed terms in the decomposition of the mass transports for the cross-sectional-averaged (top) salinity and (bottom)
SPM transport per unit width [Eq. (2) terms T1–T8] at stations (a),(c) 1 and (b),(d) 2 during the survey on 11 Apr 2006. Positive values
indicate seaward transport.
2378 J O U R N A L O F P H Y S I C A L O C E A N O G R A P H Y VOLUME 40

——, ——, and ——, 2009: On harbour siltation in the fresh-salt
water mixing region. Cont. Shelf Res., 29, 175–193.
——, J. D. Pietrzak, and J. C. Winterwerp, 2010: Advection of the
salt wedge and evolution of the internal flow structure in the
Rotterdam Waterway. J. Phys. Oceanogr., in press.
Downing, J., 2006: Twenty-five years with OBS sensors: The good,
the bad, and the ugly. Cont. Shelf Res., 26, 2299–2318.
Dronkers, J., 1986: Tidal asymmetry and estuarine morphology.
Neth. J. Sea Res., 20, 117–131.
Dyer, K., 1974: The salt balance in stratified estuaries. Estuarine
Coastal Mar. Sci., 2, 273–281.
——, 1997: Estuaries: A Physical Introduction. 2nd ed. John Wiley
and Sons, 195 pp.
Dyer, K. R., A. J. Bale, M. C. Christie, N. Feates, S. Jones, and
A. J. Manning, 2002: The turbidity maximum in a mesotidal es-
tuary, the Tamar estuary, UK: I. Dynamics of suspended sedi-
ment. Fine Sediment Dynamics in the Marine Environment, J. C.
Winterwerp and C. Kranenburg, Eds., Elsevier Science, 203–218.
Eisma, D., J. Kalf, and M. Veenhuis, 1980: The formation of small
particles and aggregates in the Rhine estuary. Neth. J. Sea Res.,
14, 172–178.
——, G. C. Cadee, R. Laane, and J. Kalf, 1982: Preliminary results
of Annelia and Navicula cruises in the Rhine and Ems estu-
aries, January – February, 1982 Mitt. Geol. Palaont. Inst. Univ.
Hamburg SCOPE/UNEP Sonderb. 52, 633–654.
——, and Coauthors, 1991: Suspended-matter particle size in some
west-European estuaries; part I: Particle-size distribution.
Neth. J. Sea Res., 28, 193–214.
Emery, W. J., and R. E. Thomson, 2001: Data Analysis Methods in
Physical Oceanography. Elsevier, 638 pp.
Festa, J. F., and D. V. Hansen, 1978: Turbidity maxima in partially
mixed estuaries: A two-dimensional numerical model. Estua-
rine Coastal Mar. Sci., 7, 347–359.
Fischer, H. B., 1972: Mass transport mechanisms in partially
stratified estuaries. J. Fluid Mech., 53, 672–687.
——, E. J. List, R. C. Y. Koh, J. Imberger, and N. H. Brooks, 1979:
Mixing in estuaries. Mixing in Inland and Coastal Waters,
Academic Press, 229–278.
Gelfenbaum, G., 1983: Suspended-sediment response to semi-
diurnal and fortnightly tidal variations in a mesotidal estuary:
Columbia River, U.S.A. Mar. Geol., 52, 39–57.
Geyer, W. R., 1993: The importance of suppression of turbulence
by stratification on the estuarine turbidity maximum. Estuar-
ies, 16, 113–125.
——, R. P. Signell, and G. C. Kineke, 1998: Lateral trapping of
sediment in a partially mixed estuary. Physics of Estuaries and
Coastal Seas, J. Dronkers and M. Scheffers, Eds., Balkema,
431 pp.
——, J. H. Trowbridge, and M. M. Bowen, 2000: The dynamics of
a partially mixed estuary. J. Phys. Oceanogr., 30, 2035–2048.
——, J. Woodruff, and P. Traykovski, 2001: Sediment transport and
trapping in the Hudson River Estuary. Estuaries, 24, 670–679.
Grabemann, I., J. Kappenberg, and G. Krause, 1995: Aperiodic
variations of the turbidity maxima of two German coastal
plain estuaries. Neth. J. Aquat. Ecol., 29, 217–227.
——, ——, and ——, 1996: Comparison of the dynamics of the
turbidity maxima in two coastal plain estuaries. Adv. Limnol.,
47, 195–205.
——, R. J. Uncles, G. Krause, and J. A. Stephens, 1997: Behaviour
of turbidity maxima in the Tamar (U.K.) and Weser (F.R.G.)
estuaries. Estuarine Coastal Shelf Sci., 45, 235–246.
Groen, P., 1967: On the residual transport of suspended matter by
an alternating tidal current. Neth. J. Sea Res., 3, 564–574.
Jay, D. A., 1991: Internal asymmetry and anharmonicity in estua-
rine flows. Progress in Tidal Hydrodynamics, B. B. Parker,
Ed., John Wiley and Sons, 521–543.
——, and J. D. Musiak, 1994: Particle trapping in estuarine tidal
flows. J. Geophys. Res., 99C, 445–461.
——, and ——, 1996: Internal tide asymmetry in channels: Origins
and consequences. Mixing Processes in Estuaries and Coastal
Seas, Coastal and Estuarine Studies Monogr., Vol. 50, Amer.
Geophys. Union, 219–258.
Kappenberg, J., and I. Grabemann, 2001: Variability of the mixing
zones and estuarine turbidity maxima in the Elbe and Weser
estuaries. Estuaries, 24, 699–706.
Kirby, R., 1992: Detection and transport of high concentration
suspensions. Proc. First Int. Conf. on the Pearl River Estuary in
the Surrounding Area of Maccao, Macao, China, ICPRESAM,
69–84.
——, and W. R. Parker, 1977: The physical characteristics and
environmental significance of fine-sediment suspensions in
estuaries. Estuaries, Geophysics and the Environment, Na-
tional Research Council, 110–120.
Kistner, D. A., and N. R. Pettigrew, 2001: A variable turbidity
maximum in the Kennebec estuary, Maine. Estuaries, 24, 680–
687.
Le Hir, P., and Coauthors, 2001: Fine sediment transport and ac-
cumulations at the mouth of the Seine Estuary (France). Es-
tuaries, 24, 950–963.
Lin, J., and A. Y. Kuo, 2001: Secondary turbidity maximum in
a micro-tidal partially-mixed estuary. Estuaries, 24, 707–720.
North, E. W., and E. D. Houde, 2003: Linking ETM physics, zoo-
plankton prey and fish early life histories to stripped bass
Morone saxatilis and white perch M. Americana recruitment.
Mar. Ecol. Prog. Ser., 260, 219–236.
Orton, P. M., and G. C. Kineke, 2001: Comparing calculated and
observed vertical suspended sediment distributions from a
Hudson River Estuary turbidity maximum. Estuarine Coastal
Shelf Sci., 52, 401–410.
Patchineelam, S. M., and B. Kjerfve, 2004: Suspended sediment vari-
ability on seasonal and tidal time scales in the Winyah Bay estuary,
South Carolina, USA. Estuarine Coastal Shelf Sci., 59, 307–318.
Postma, H., 1961: Transport and accumulation of suspended matter
in the Dutch Wadden Sea. Neth. J. Sea Res., 1, 148–190.
——, 1967: Sediment transport and sedimentation in the estuarine
environment. Estuaries, G. H. Lauff, Ed., American Associa-
tion for the Advancement of Science, 158–179.
Santema, P., 1953: Coagulatie van rivierslib bij ontmoeting met
zeewater (Coagulation of river silt when meeting seawater).
De Ingenieur, 16, B70–B72.
Schrottke, K., M. Becker, A. Bartholoma, and B. W. Flemming,
2006: Fluid mud dynamics in the Weser estuary turbidity zone
tracked by high-resolution side-scan sonar and parametric
sub-bottom profiler. Geo. Mar. Lett., 26, 185–198.
Schubel, J. R., 1968: Turbidity maximum of the northern Ches-
apeake Bay. Science, 161, 1013–1015.
Scully, M. E., and C. T. Friedrichs, 2003: The influence of asym-
metries in overlying stratification on near-bed turbulence and
sediment suspension in a partially mixed estuary. Ocean Dyn.,
53 (3), 208–209.
Speer, P. E., and D. G. Aubrey, 1985: A study of non-linear tidal
propagation in shallow inlet/estuarine systems. Part II: The-
ory. Estuarine Coastal Shelf Sci., 21, 207–224.
Uncles, R. J., and J. A. Stephens, 1989: Distributions of suspended
sediment at high water in a macrotidal estuary. J. Geophys.
Res., 94 (C10), 14 395–14 405.
NOVEMBER 2010 D E N I J S E T A L . 2379

——, and ——, 1993a: The freshwater-saltwater interface and its
relationship to the turbidity maximum in the Tamar estuary,
U.K. Estuaries, 16, 126–141.
——, and ——, 1993b: Nature of the turbidity maximum in the
Tamar estuary U.K. Estuarine Coastal Shelf Sci., 36, 413–431.
——, R. C. A. Elliot, and S. A. Weston, 1985: Observed fluxes of
water, salt and suspended sediment in a partly mixed estuary.
Estuarine Coastal Shelf Sci., 20, 147–167.
——, M. L. Barton, and J. A. Stephens, 1994: Seasonal variability
of fine-sediment concentrations in the turbidity maximum region
of the Tamar Estuary. Estuarine Coastal Shelf Sci., 38, 19–39.
——, J. A. Stephens, and D. J. Law, 2006: Turbidity maximum in
the macrotidal, highly turbid Humber Estuary UK: Flocs, fluid
mud, stationary suspensions and tidal bores. Estuarine Coastal
Shelf Sci., 67, 30–52.
van Leussen, W., 1994: Estuarine macroflocs and their role in fine-
grained sediment transport. Ph.D. thesis, Utrecht University,
484 pp.
——, and E. van Velzen, 1989: High concentration suspensions:
Their origin and importance in Dutch estuaries and coastal
waters. J. Coast. Res., 5 (Special Issue), 1–22.
van Veen, J., 1938: Water movements in the Straits of Dover.
J. Cons. Int. Expl. Mer, 13, 7–36.
van Woudenberg, C., 1998: First results of preliminary measure-
ments of suspended sediment in the Caland/Beerkanaal (in
Dutch). Public Works, Directorate North Sea, Rep. N98.02,
26 pp.
Verlaan, P. A. J., and R. Spanhoff, 2000: Massive sedimentation
events at the mouth of the Rotterdam Waterway. J. Coastal
Res., 16, 458–469.
Vlemmix, W., 1980: Metingen van de vertikale verdeling van het
zwevende stofgehalte in het zeegebied voor de monding van
de Waterweg, najaar 1978. (Measurements of the vertical
distribution of suspended particulate matter in the area sea-
ward of the mouth of the Rotterdam Waterway, in the fall of
1978). Public Works, Directorate North Sea, Rep. NZ-N-
80.04, 15 pp.
Wellershaus, S., 1981: Turbidity maximum and mud shoaling. Arch.
Hydrobiol., 92, 161–198.
Weir, D. J., and J. McManus, 1987: The role of wind in generating
turbidity maxima in the Tay Estuary. Cont. Shelf Res., 7, 1315–
1318.
Winterwerp, J. C., 1983: Decomposition of the mass transport in
narrow estuaries. Estuarine Coastal Shelf Sci., 16, 627–638.
Wolanski, E., B. King, and D. Galloway, 1995: Dynamics of the
turbidity maximum in the Fly River estuary, Papua New
Guinea. Estuarine Coastal Shelf Sci., 40, 321–337.
——, N. N. Huan, L. T. Dao, N. H. Nhan, and N. N. Thuy, 1996:
Fine-sediment dynamics in the Mekong River estuary, Viet-
nam. Estuarine Coastal Shelf Sci., 43, 565–582.
2380 J O U R N A L O F P H Y S I C A L O C E A N O G R A P H Y VOLUME 40


![Somatostatin receptor scintigraphy with [111In-DTPA-d-Phe1]- and [123I-Tyr3]-octreotide: the Rotterdam experience with more than 1000 patients](https://static.fdokumen.com/doc/165x107/63360adfb5f91cb18a0ba76f/somatostatin-receptor-scintigraphy-with-111in-dtpa-d-phe1-and-123i-tyr3-octreotide.jpg)