Florin Mărginean: Traces of Habitation from the Arpadian Period in the Area of Ghioroc (Arad County)

Interdisciplinary Archaeological ResearchProgramme Maasvlakte 2,Rotterdam
Part 1
Twenty metres deep! The Mesolithic period at the Yangtze Harbour
site – Rotterdam Maasvlakte, the Netherlands. Early Holocene
landscape development and habitation.
J.M. Moree and M.M. Sier (eds)
With contributions by J.J. Boon, D.C. Brinkhuizen, F. Bunnik, K.M. Cohen, H. Cremer,
R.P. Exaltus, K. van Kappel, L.I. Kooistra, H. Koolmees, H. de Kruyk, L. Kubiak-Martens,
J.M. Moree, M.J.L.Th. Niekus, J.H.M. Peeters, D.E.A. Schiltmans, A. Verbaas,
F. Verbruggen, P.C. Vos, and J.T. Zeiler.
Part 2
The Geoarchaeological and Palaeontological research in the
Maasvlakte 2 sand extraction zone and on the artificially created
Maasvlakte 2 beach – a synthesis.
M. Kuitems, Th. van Kolfschoten, F. Busschers, and D. De Loecker.
Epilogue
Mesolithic human skull fragments of the Maasvlakte 2 artificial
beach.
H.J.T. Weerts, W.G. Borst, B.I. Smit, E. Smits, J. van der Plicht, and O.F.R. van Tongeren.
Commissioned by Port of Rotterdam Authority
BOORrapporten 566

7
Twenty metres deep!The Mesolithic period at the Yangtze Harbour site – Rotterdam Maasvlakte, the Netherlands
Early Holocene landscape developmentand habitation
J.M. Moree and M.M. Sier (eds)
With contributions by J.J. Boon, D.C. Brinkhuizen, F. Bunnik, K.M. Cohen, H. Cremer, R.P. Exaltus, K. van Kappel, L.I. Kooistra, H. Koolmees, H. de Kruyk, L. Kubiak-Martens, J.M. Moree, M.J.L.Th. Niekus, J.H.M. Peeters, D.E.A. Schiltmans, A. Verbaas, F. Verbruggen, P.C. Vos, and J.T. Zeiler
Part 1

8
Colophon
Title Twenty metres deep! The Mesolithic period at the Yangtze Harbour site – Rotterdam Maasvlakte, the Netherlands. Early Holocene landscape development and habitation.
Authors J.J. Boon, D.C. Brinkhuizen, F. Bunnik, K.M. Cohen, H. Cremer, R.P. Exaltus, K. van Kappel, L.I. Kooistra, H. Koolmees, H. de Kruyk, L. Kubiak-Martens, J.M. Moree, M.J.L.Th. Niekus, J.H.M. Peeters, D.E.A. Schiltmans, A. Verbaas, F. Verbruggen, P.C. Vos, and J.T. Zeiler
Editors J.M. Moree and M.M. Sier
Translation GrondTaal Vertaalbureau, G.A. van der Kleij (Chapters 1, 2, 4, 5, and 6), and A.C. Bardet (Chapters 3 and 7)
Final editing A.V. Schoonhoven
Layout M.F. Valkhoff
ISSN 1873-8923
Bureau Oudheidkundig Onderzoek RotterdamCeintuurbaan 213b3051 KC RotterdamNetherlandsTelephone +31(0)10-4898500E-mail [email protected]
Copyright © BOOR Rotterdam, March 2015
All rights reserved. No part of this publication may be reproduced, stored in a retrieval system, or transmitted, in any form or by any means, electronic or mechanical, inclu-ding photocopying, recording, or otherwise, without the prior permission in writing of the publishers.
BOOR accepts no liability for damages caused by the use of research results, or by the application of advice contained in this publication.

9
Contents
1 Introduction 15
1.1 Introduction 151.2 Project background 151.3 Project stages 171.4 Results of Stages 1 and 2; preliminary findings of Stages 3 and 4 201.5 Goals and research questions 211.5.1 General issues 211.5.2 Goals 251.5.3 Research questions 251.6 Organisation of this report 27
2 Methods and techniques 31
2.1 Introduction 312.2 Systematic field assessment (Stage 3) 332.2.1 Introduction 332.2.2 Targeted (supplementary) seismic research combined with cone penetration tests 332.2.3 Systematic field assessment: coring 382.2.4 Processing and analysis 412.3 Invasive underwater investigation (Stage 4) 412.3.1 Introduction 412.3.2 Fieldwork 422.3.3 Sieving the bulk bags 492.3.4 Inspecting the sieve residues 512.4 Processing 522.4.1 Introduction 552.4.2 Geological and palaeolandscape research 532.4.3 Lithic analysis 542.4.4 Archaeozoological analysis 542.4.5 Archaeobotanical analysis 542.5 Evaluation of applied field methods and techniques 552.5.1 Introduction 552.5.2 Equipment-related deviations 562.5.3 Oblique position of the grab 562.5.4 Data logging problems 562.5.5 Recommendations 602.5.6 The Yangtze Harbour research project in international perspective 61
3 Landscape genesis and palaeogeography 63
3.1 Introduction 633.2 Research questions 673.3 Results relating to the geological strata between 30 and 15m - asl 683.3.1 Kreftenheye Formation – channel deposits of the rivers Rhine and Meuse (KR) 693.3.2 Kreftenheye Formation, Wijchen Member (lower part) – overbank clays (KRWY-2) 723.3.3 Boxtel Formation, Delwijnen Member – donk or river-dune sand (BXDE) 72 3.3.4 Kreftenheye Formation, Wijchen Member (upper part) – overbank clays (KRWY) 733.3.5 Nieuwkoop Formation, Basal Peat Bed – peat (NIBA) 743.3.6 Echteld Formation – freshwater tidal deposits (EC) 743.3.7 Naaldwijk Formation, Wormer Member – estuarine sediments (NAWO) 76

10
3.3.8 Southern Bight Formation, Bligh Bank Member – young marine sands and offshore channel fills (SBBL) 763.4 Results of geological mapping and modelling 763.4.1 Integration of seismic, coring and CPT data 813.4.2 Seismic profiles of the Yangtze Harbour 823.4.3 Overview geological profile of the Yangtze Harbour 823.4.4 Pattern analyses: palaeosurface of the ‘Pleistocene’ sands and base of the marine sands 863.4.5 Detailed mapping of Target zone East 883.4.6 Detailed mapping of Target zone West 903.5 Results of the dating studies 1003.5.1 OSL datings 1003.5.2 Results of the radiocarbon datings 1003.5.3 Comparing radiocarbon dates of macrofossil and matrix samples from the Basal Peat 1013.5.4 Palynological dating and environmental research 1043.5.5 The ages of successive strata 1083.6 Results from the corings 1113.6.1 Kop van Beer 1123.6.2 The Yangtze Harbour planning area 1143.6.3 Target zone East 1163.6.4 Target zone West 1173.7 Landscape evolution in the Early Holocene 1203.7.1 General palaeogeographical development of the Maasvlakte area 1253.7.2 Stratigraphical link between deltaic landscape and buried river-valley landscape 1283.7.3 Mesolithic habitability of the Boreal deltaic landscape 1293.7.4 Palaeogeography and habitability of Target zone East 1383.7.5 Palaeogeography and habitability of Target zone West 1383.8 Answers to the landscape-genetic and palaeogeographical questions 140
4 Flint and other stone 147
4.1 Introduction 1474.2 Research questions 1474.3 Procedures, methods, and selection 1484.3.1 Description, classification, and technological observations 1484.3.2 Use-wear analysis 1484.3.3 Thin-section analysis 1494.3.4 Analysis black residue 1514.4 Results 1514.4.1 Formation processes 1514.4.2 Selection of raw materials and their origins 1524.4.2.1 Flint 1524.4.2.2 Other stone 1624.4.3 Technology and typomorphological composition of the flint assemblage 1644.4.3.1 Trench 1 1644.4.3.2 Trench 2 1744.4.4 Stone assemblages 1754.4.5 Use-wear analysis: flint 1764.4.5.1 Gathering and processing of vegetable material 1784.4.5.2 Materials of animal origin 1854.4.5.3 Ornament production 1884.4.5.4 Shooting 1894.4.5.5 Other wear traces and worked materials 1894.4.5.6 Multiple use 1904.4.5.7 A comparison of the trenches 1924.4.5.8 Typology versus function 1934.5 Discussion and conclusion 194

11
5 Fauna 201
5.1 Introduction 2015.2 Material and methods 2015.3 Results 2025.3.1 General 2025.3.2 Trench 1 2045.3.2.1 The range of species: game animals and fish 2045.3.2.2 Background fauna 2075.3.3 Trench 2 2085.3.3.1 The range of species: game animals and fish 2085.3.3.2 Background fauna 2105.3.4 Trench 3 2105.3.5 Material from core samples 2125.4 Other characteristics 2125.4.1 Distribution of skeletal parts and ages 2125.4.2 Fish size 2145.5 Landscape and exploited ecozones 2155.6 Seasonality 2175.7 Artefacts and use wear 2175.8 Dating the bone 2185.9 Discussion 219
6 Archaeobotany: landscape reconstruction and plant food subsistence economy on a meso and microscale 223
6.1 Introduction 2236.1.1 Purpose of this study 2236.1.2 Categories of analysed botanical material 2236.1.3 Research questions 2246.2 Material and methods 2256.2.1 Material: cores 2256.2.2 Material: material collection 2276.2.3 Method: pollen 2276.2.3.1 Sampling 2276.2.3.2 Identification 2286.2.3.3 Assessment of the palynological samples 2286.2.3.4 Pollen analysis 2286.2.3.5 Pollen diagrams 2286.2.4 Method: charred microscopic particles 2316.2.5 Method: botanical macroremains 2316.2.5.1 Sampling 2316.2.5.2 Archaeological parenchyma 2326.2.6 Method: charcoal 2336.2.6.1 Charcoal samples from Cores B37A0673/W-04, B37A0675/W-06 and B37A0697/W-28 2336.2.6.2 Sampling charcoal from sieve residues and botanical samples 2336.2.6.3 Charcoal analysis: methods 2336.3 Results radiocarbon analysis 2346.3.1 Radiocarbon analysis: material from the core samples 2346.3.2 Radiocarbon analysis: batches from trenches 2366.4 Results and interpretation: core material analysis 2366.4.1 Trench 1 – Core B37A0675/W-06 2366.4.1.1 Analysed samples 2366.4.1.2 Palynological material 2386.4.1.3 Macroremains 2406.4.1.4 Charred macroscopic remains 2406.4.1.5 Charred microscopic particles (in pollen samples) 2406.4.2 Trench 2 – Core B37A0673/W-04 2426.4.2.1 Analysed samples 2426.4.2.2 Palynological material 242

12
6.4.2.3 Macroremains 2456.4.2.4 Charred macroscopic remains 2456.4.2.5 Charred microscopic particles (in pollen samples) 2456.4.3 Core B37A0697/W-28 2466.4.3.1 Analysed samples 2466.4.3.2 Palynological material 2486.4.3.3 Macroremains 2496.4.3.4 Charred macroscopic remains 2506.4.3.5 Charred microscopic particles (in pollen samples) 2506.5 Analysis results and interpretation of the archaeological layers 2506.5.1 Pollen remains 2506.5.1.1 Trench 1 2506.5.1.2 Trench 2 2536.5.2 Charred microscopic particles 2556.5.3 Botanical macroremains 2556.5.3.1 Trench 1 2566.5.3.2 Trench 2 2586.5.3.3 Trench 3 2606.5.4 Charcoal 2606.5.4.1 Trench 1 2606.5.4.2 Trench 2 2626.5.4.3 Trench 3 2656.6 Synthesis and discussion 2666.6.1 Landscape 2666.6.1.1 Vegetation development on the dune 2666.6.1.2 Vegetation development around the dune 2676.6.2 Human influence and hearths on and near the dune 2676.6.3 Plant food economy 2726.6.3.1 Root foods 2726.6.3.2 Nuts and seeds 2776.6.3.3 Wild berries and fleshy fruits 2826.6.3.4 Seasonality 2836.7 Conclusions 2846.7.1 Landscape and land use 2846.7.2 Plant food supply 285
7 Synthesis 287
7.1 Introduction 2877.2 The Mesolithic habitation on the river dune7.2.1 Chronological context and representativity 2877.2.2 The exploitation of food resources 2897.2.2.1 Animal food resources 2897.2.2.2 Plant-food resources 2917.2.2.3 Exploitation strategies 2927.2.2.4 Food processing and preparation 2947.2.3 Craft activities 2947.2.3.1 Animal and mineral materials 2947.2.3.2 Plant materials 2957.2.3.3 Flint 2957.2.4 The nature of the habitation on the Yangtze Harbour dune 2977.2.4.1 Duration of occupation and seasonal indicators 2977.2.4.2 The settlement context 2987.3 The Yangtze Harbour dune in relation to the Rhine-Meuse estuary 2987.3.1 Chronology and palaeogeographical context 2997.3.1.1 Continuity of occupation in the Rhine-Meuse estuary 2997.3.1.2 Shifting geographical context 3007.3.2 Exploitation of resources 3057.3.2.1 The aquatic environment 3057.3.2.2 Plants aplenty 3077.3.3 Social context and ideology 308

13
7.4 Changing perspectives: on the archaeological understanding of hunter- gatherer landscapes and the significance of the Yangtze Harbour investigations 3097.4.1 The drowning of the southern North Sea basin 3097.4.1.1 The end of a glacial 3097.4.1.2 Shifting coastlines and waterlogging 3107.4.1.3 A tipping point around 6500 BC 3117.4.2 Mesolithic hunter-gatherers in a drowning landscape 3117.4.3 Conclusion 317
List of captions 319Sources of the illustrations 329References 331

14
61.000
61.000
62.000
62.000
63.000
63.000
64.000
64.000
441.
000
441.
000
442.
000
442.
000
443.
000
443.
000
444.
000
444.
000
445.
000
445.
000
446.
000
446.
000
´ Map: Municipality of Rotterdam 2013 1:25.000Scale
0 500m
Afb. 1.1. Ligging van het plangebied Yangtzehaven .
Planning area
´
Yangtzehaven
Europahaven
Edisonbaai
Maasvlakte
Euromax Terminal
Gate TerminalAntarticaweg
Eur
opaw
eg
Beer
kana
al
Fig. 1.1. Location of the Yangtze Harbour planning area.

15
1 Introduction
D.E.A. Schiltmans1 and P.C. Vos2
1.1 Introduction
In 2011 research institute Deltares, section Applied Geology and Geophysics, together with Rotterdam municipal archaeological service (BOOR), carried out a systematic field assessment and an invasive underwater investigation in the Yangtze Harbour planning area, Rotterdam, following a commission by Port of Rotterdam Authority. Projects partners were archaeological company ADC ArcheoProjecten, contractor Projectorganisatie Uitbreiding Maasvlakte (PUMA), and TNO Geological Survey of the Netherlands. The aim of the project was to locate and document any archaeological remains in submerged Late Pleistocene and Early Holocene deposits at a depth of 22m to 17m below asl in the harbour area (see Table 1.1 for administrative project data).The planning area is part of Maasvlakte 1, west of the city of Rotterdam, and encompasses a total area of circa 230ha. The area is roughly defined by the Europa road in the north-west, the Euromax Terminal and Gate Terminal in the north-east, the Beer canal in the south-east and the Antarctica road in the south-west (Fig. 1.1). On the topographical map of the Netherlands (1:25,000 scale) the planning area is pictured on Section 37A, with central coordinates 62.253/443.382 and corner coordinates 60.492/443.731, 60.732/444.337, 64.015/443.035 and 63.775/442.428 respectively. At the time of the project, the planning area was still a functional harbour (Fig. 1.2). It is important to keep in mind that, before the construction of Maasvlakte 1, the area had been part of the sea for a long time (Fig. 1.3).
1.2 Project background
The Yangtze harbour, which originally formed part of the present Maasvlakte 1, serves as a traffic route between the harbour zones Maasvlakte 1 and Maasvlakte 2, the latter of which is currently under development (Fig. 1.4). To enable this, the Yangtze harbour was extended both vertically and horizontally. Firstly, the sea bottom was dredged to a depth of circa 21m - asl, with ensuing soil disturbance affecting levels down to circa 22m - asl. At the time of the research project, the sea bottom was still situated at a depth of circa 17m - asl. Secondly, in November 2012, a corridor to Maasvlakte 2 was constructed in the north-western section of the present Yangtze harbour. Today the Yangtze harbour is called Yangtze canal.Before dredging operations began, Late Pleistocene and Early Holocene sediments were present at a depth of 25m to 17m - asl. Soil removal activities in the context of the construction of Maasvlakte 2 were expected to unearth in this stratigraphic sequence archaeological remains from the Late Palaeolithic (35,000 BP-9200 cal BC) and Mesolithic periods (9200-5300/4400 cal BC).3 This expectation was based on the earlier discovery of archaeological material before, during and after the construction of Maasvlakte 1 (see, among others, Louwe Kooijmans 1971; Verhart 1988; idem 1995; idem 2004; Glimmerveen et al. 2004; Hessing, Sueur, Vos, and Webster 2005; Manders, Otte-Klomp, Peeters, and Stassen 2008), and also on the presence of Mesolithic sites at other locations in the Rotterdam area, e.g. Rotterdam-Emplacement Centraal Station (Guiran and Brinkkemper 2007), Rotterdam-’t Hart (Schiltmans 2010) and Rotterdam-Beverwaard Tramremise (Zijl, Niekus, Ploegaert, and Moree 2011). In 2008 the area’s archaeological potential induced the Port of Rotterdam Authority and the Cultural Heritage Agency of the Netherlands to draft an agreement on the proper course of action should archaeological remains be encountered.4 The agreement guaranteed that, on the one hand, archaeological finds would be treated with due care and, on the other, that the construction of Maasvlakte 2 (including the vertical extension of the Yangtze harbour on Maasvlakte 1 and its corridor to Maasvlakte 2) would not suffer unnecessary delay. Final responsibility for the project rests with the Cultural Heritage Agency of the Netherlands, also on behalf of the Rotterdam municipal archaeological service (BOOR) and the Province of Zuid-Holland. The research project in the Yangtze harbour planning area was carried out under this agreement between the Port of Rotterdam Authority and the Cultural Heritage Agency of the Netherlands.

16
Fig. 1.2. Impression of the Yangtze Harbour planning area during (geo)archaeological investigations.
Administrative project data
Type of research Systematic field assessment (Stage 3) and invasive underwater investigation (Stage 4)
Planning area Name Yangtze Harbour Location Rotterdam (Maasvlakte 1) Municipality Rotterdam
National Grid coordinates 60.492/443.731, 60.732/444.337, 64.015/443.035, and 63.775/442.428
Total area Circa 230ha Cadastral data Unknown Manager/land owner Port of Rotterdam Authority
Commissioning body Port of Rotterdam Authority Competent authority Name organisation Cultural Heritage Agency of the Netherlands
Consulted experts A.D.C. Otte-Klomp MA (policy), B.I. Smit PhD (archaeology), and H.J.T. Weerts PhD (geology and landscape)
Implementation research project Institutions/companies Deltares and BOOR Geological expert P.C. Vos MA Senior surveyor/ KNA registered archaeologist D.E.A. Schiltmans MA Senior KNA registered archaeologist M.M. Sier MA Research period June - December 2011 Archis project registration numbers 48031 (Stage 3) and 48954 (Stage 4)
Research results BOOR site code 1B-09 Archis find registration numbers 418008 (Stage 3) and 419360 (Stage 4)
Location and curation of project documentation Deltares and BOOR archives, project code BOORrapporten 523 and BOOR site code 1B-09
Location and curation of finds BOOR depot
Table 1.1. Administrative project data.

17
Fig. 1.3. The Yangtze Harbour planning area projected onto the ‘Topographic and Military Map of the Kingdom of the Netherlands’, Section Rotterdam 37, situation 1849/1850. In 1849/1850 the planning area was located at a distance of 2.5 to 5km to the coast between Oostvoorne and Hook of Holland.
1.3 Project stages
In 2005 a preliminary desk-based assessment was carried out as part of the planning process that preceded the construction of Maasvlakte 2 (Hessing et al. 2005). This assessment encompassed the entire area potentially affected by soil disturbance, i.e. the land reclamation area Maasvlakte 2, as well as the associated sand extraction area, and the original Yangtze harbour. Amongst other things, the desk-based assessment revealed that the subsoil in the north-western part of the Yangtze harbour possibly contained river dunes (Hessing et al. 2005, 21). River-dune locations have a high archaeological potential with regard to prehistoric sites. A scientific background study of archaeological conservation issues surrounding the construction of Maasvlakte 2 was published in 2008 (Manders et al. 2008). It presented an overview of the body of knowledge then available and of the potential of the Yangtze harbour for future research, specifically regarding the early prehistoric periods (Manders et al. 2008, 18).Between 2009 and the end of 2011 a number of (geo) archaeological studies specifically targeted soil sections below the bottom levels of the Yangtze harbour (17m - asl) which contained Late Pleistocene and Early Holocene sediments that were at risk from the planned construction. The studies proceeded in four stages, with the (preliminary) results of each preceding stage guiding the next one (see also Section 2.1). These were executed on a progressively smaller spatial scale, thus gradually zooming in on the planning area. This resulted in the definition of three research areas, representing the macro, meso, and microscales respectively. Figure 1.5 shows the limits of each research area.
Stages 1 and 2: desk-based assessment and exploratory field assessmentThe first stage, which took place in 2009, consisted of a geoarchaeological desk-based assessment. Analysis of data derived from cone penetration tests and existing core descriptions resulted in a model of the geological stratigraphy and its archaeological potential. This was followed up in 2010 by the second stage, an exploratory field

18
Fig. 1.4. Artist’s impression of the future Maasvlakte (view from the north-west). On the left is Yangtze harbour, the shipping lane connecting Maasvlakte 1 and Maasvlakte 2.
assessment, using geophysical techniques (seismic) and piston cores to test and refine the geological and archaeological models produced by the desk-based assessment. Both the desk-based assessment and the exploratory field assessment compassed the entire planning area (i.e. the macroscale).The results of both stages have been published elsewhere (Vos, van den Berg, Maljers, and de Vries 2009; Vos et al. 2010a). These publications were added to the present publication (see Appendices 3.1 and 3.2).
Stage 3: systematic field assessmentThe results of the first two stages formed the basis for the selection of two target zones, designated as West and East, within the planning area as the focus for Stage 3, a systematic field assessment conducted from June to September 2011 (i.e. the mesoscale). Target zone West, situated in the north-western part of the Yangtze harbour, contained a zone with aeolian river dunes, while Target zone East contained a number of Pleistocene deposits on both sides of a large gully at the centre of the Yangtze harbour. The aim of this stage of the research was to establish the presence or absence of archaeological remains in the two target zones. It involved (additional) detailed seismics in combination with a number of additional cone penetration tests, as well as additional piston cores.Stage 3 resulted in the localisation of flint, burnt and unburnt bone and charcoal in the top layers of river-dune deposits. Based on its stratigraphic position and depth, a Mesolithic date for this material seemed likely. Another phenomenon observed in both target zones was the presence of a very small quantity of charcoal (particles) in a clay layer (see Section 1.4).The results of this stage of the field assessment presented in this study have been reported, but have not yet been published elsewhere.
Stage 4: invasive underwater investigationBased on the results of the systematic field assessment, an invasive underwater investigation was carried out in Target zone West from October 27 to November 9, 2011 in order to provide more information on the nature and date of the archaeological remains (Stage 4). Three trenches were dug in the river-dune area in the north-western part of the planning area, Trenches 1 to 3 (i.e. the microscale). Soil samples were taken from the top of the river-dune deposits and sieving of the samples took place from November 1 to December 22, 2011. This stage of the research project produced large quantities of archaeological material from the Early and/or Middle Mesolithic periods (9200-6500 cal BC) from all three trenches (see Section 1.4).In the present publication the results of the invasive underwater investigation have been combined with those of Stage 3 and Stages 1 and 2 (the latter two published earlier in Vos et al. 2009; idem 2010a).

19
61.000
61.000
62.000
62.000
63.000
63.000
64.000
64.000
441.
000
441.
000
442.
000
442.
000
443.
000
443.
000
444.
000
444.
000
445.
000
445.
000
446.
000
446.
000
Map: Municipality of Rotterdam 2013 1:25,000Scale
0 500m
Afb. 1.5. Overzicht van de ligging van de verschillende onderzoeksgebieden per fase. Het bureauonderzoek (Vos e.a. 2009) en het verkennend inventariserend veldonderzoek (Vos e.a. 2010) zijn uitgevoerd voor het gehele plangebied (fasen 1 en 2), het karterend inventariserend veldonderzoek is verricht in beide selectiegebieden (fase 3) en tijdens het gravend onderzoek zijn drie putten aangelegd (fase 4).
Target zone East (Stage 3)
Trench with trench number (Stage 4)
´
East
West
12
3
Yangtzehaven
Europahaven
Edisonbaai
Planning area (Stages 1 and 2)
Target zone West (Stage 3)
Euromax Terminal
Gate TerminalAntarticaweg
Eur
opaw
eg
Beer
kana
al
Fig. 1.5. Map showing the location of the research areas at each stage. Both the desk-based assessment (Vos et al. 2009) and the exploratory field assessment (Vos et al. 2010a) encompassed the entire planning area (Stages 1 and 2), while the systematic field assessment was limited to the Target zones West and East (Stage 3). During the invasive underwater investigation three trenches were excavated in Target zone West (Stage 4).

20
The Yangtze Harbour project is exceptional. No comparable systematic, underwater (geo) archaeological investigation involving Mesolithic archaeological remains at this depth (17m - asl) has ever been conducted before, anywhere in the world. The organisation and implementation of this interdisciplinary project involved many people, companies and organisations (see Chapter 2), and the final result as presented in this publication is truly a joint effort.
1.4 Results of Stages 1 and 2; preliminary findings of Stages 3 and 4
Within the framework of the Yangtze Harbour project a number of relevant research issues were identified, and specific research questions were formulated in the Project Plan that was drafted before the data generated by the systematic field assessment and the invasive underwater investigation were processed (see Section 1.5). The research questions were based on the results of Stages 1 and 2 and the preliminary findings of Stages 3 and 4, supplemented by the outcome of a number of evaluation and brainstorm sessions. These earlier results and preliminary findings are discussed below to place the research questions in context. The final results will be discussed in other chapters of this publication.
The results of the geoarchaeological desk-based assessment (Stage 1) and the exploratory field assessment (Stage 2) led to the definition of three areas in the Yangtze Harbour planning area likely to contain early prehistoric archaeological remains (Vos et al. 2010a, Appendix C, Appendix 14). Areas of high archaeological potential were two zones which were thought to contain river dunes of the Delwijnen Member (Boxtel Formation), one in the north-western part and one in the south-eastern part of the Yangtze harbour, as well as an area with higher Pleistocene deposits of the Kreftenheye Formation on both sides of a large gully in the central section of the planning area. In addition to these three areas, archaeological remains were also expected in the Early Holocene deposits of the Wijchen Member (Kreftenheye Formation). Few archaeological remains were expected in the superimposed Basal Peat (Nieuwkoop Formation), the freshwater tidal deposits of the Formation Echteld, and the estuarine stratified deposits of the Wormer Member (Naaldwijk Formation), but the possibility that some archaeology might nonetheless turn up in these layers could not be ruled out entirely.
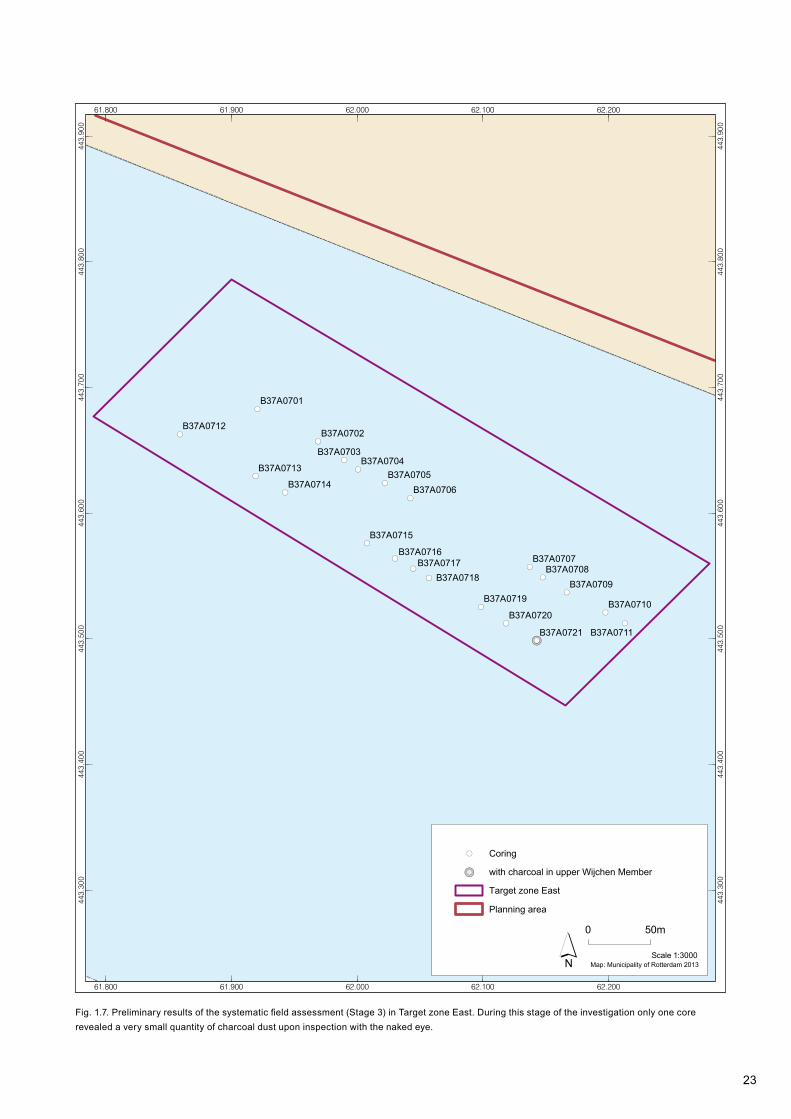
The systematic field assessment (Stage 3) was executed in two of the three zones with a high archaeological potential. The results of the assessment confirmed that Target zone West, in the north-western part of the Yangtze harbour, indeed contained a river dune. The top of the aeolian river-dune deposits was reached at a depth of 21.39m - asl to 18.25m - asl. The dune top had been affected by erosion but its slopes were intact and revealed well-defined soils. Throughout Target zone West, piston cores taken during Stage 3 contained charcoal fragments, flint debitage and burnt as well as unburnt bone at a depth of 21.01m - asl to 18.30m - asl (Fig. 1.6 and Table 1.2). These archaeological indicators seemed to cluster on the slopes of two south-west/north-east oriented extensions of a larger river-dune complex. Most of the finds derived from humic soils on these slopes but some came from an area were the dune top and its soils had been affected by erosion. Its stratigraphic position and depth dates the material to the Mesolithic period. No waste deposits could be observed in cores taken from the natural layers on the slopes of the river dune. The archaeological indicators were interpreted as representing one single site, with central coordinates 61.322/443.872. The site was assigned BOOR site code 1B-09 (elsewhere in this publication referred to as Site 1B-09) and Archis find registration number 418008.In addition to archaeological indicators in river-dune deposits, several cores also contained charcoal (particles) in fluviatile deposits of the upper Wijchen Member (Kreftenheye Formation). In Target zone West a clay layer directly on top of the river-dune deposits, at a depth of 20.40 to 20.35m - asl, produced twelve charcoal fragments (Fig. 1.6), while the upper Wijchen Member in Target zone East, at a depth of 19.88 to 19.80m - asl, yielded a very small quantity of charcoal particles (Fig. 1.7). With Stage 3 still in progress, it was unclear whether the charcoal in the upper Wijchen Member was anthropogenic or natural.
21
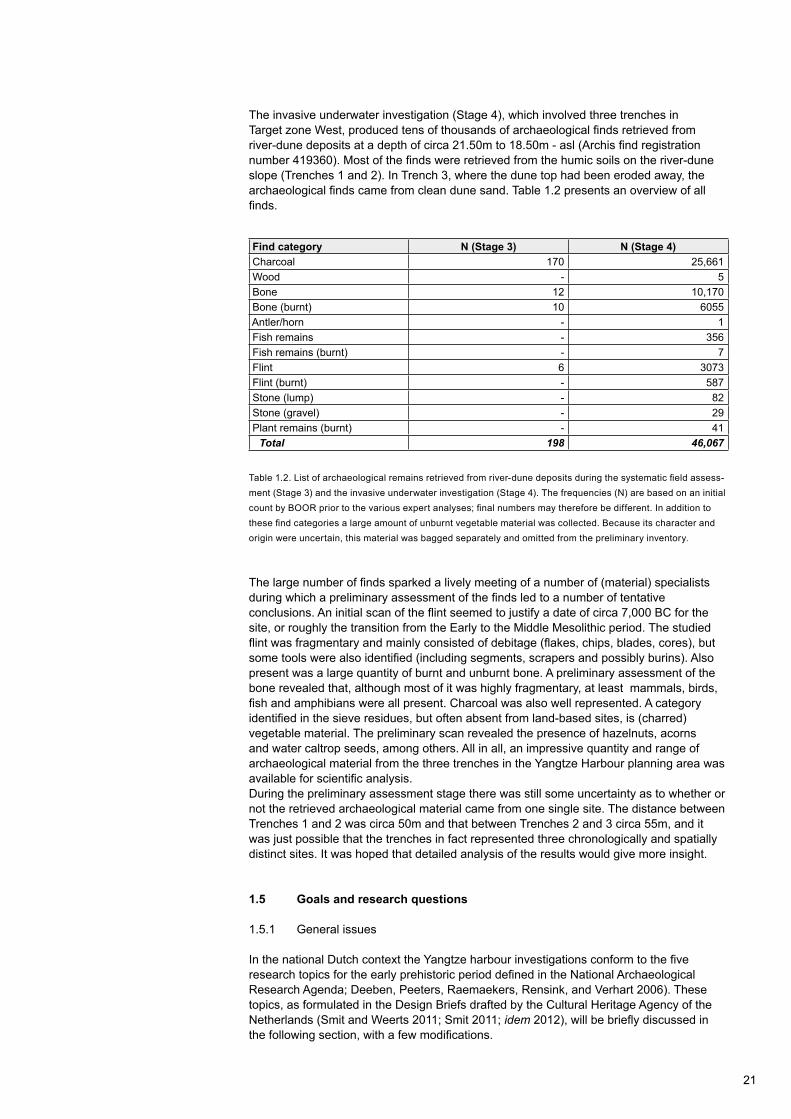
Find category N (Stage 3) N (Stage 4) Charcoal 170 25,661 Wood - 5 Bone 12 10,170 Bone (burnt) 10 6055 Antler/horn - 1 Fish remains - 356 Fish remains (burnt) - 7 Flint 6 3073 Flint (burnt) - 587 Stone (lump) - 82 Stone (gravel) - 29 Plant remains (burnt) - 41 Total 198 46,067
Table 1.2. List of archaeological remains retrieved from river-dune deposits during the systematic field assess-ment (Stage 3) and the invasive underwater investigation (Stage 4). The frequencies (N) are based on an initial count by BOOR prior to the various expert analyses; final numbers may therefore be different. In addition to these find categories a large amount of unburnt vegetable material was collected. Because its character and origin were uncertain, this material was bagged separately and omitted from the preliminary inventory.
The invasive underwater investigation (Stage 4), which involved three trenches in Target zone West, produced tens of thousands of archaeological finds retrieved from river-dune deposits at a depth of circa 21.50m to 18.50m - asl (Archis find registration number 419360). Most of the finds were retrieved from the humic soils on the river-dune slope (Trenches 1 and 2). In Trench 3, where the dune top had been eroded away, the archaeological finds came from clean dune sand. Table 1.2 presents an overview of all finds.
The large number of finds sparked a lively meeting of a number of (material) specialists during which a preliminary assessment of the finds led to a number of tentative conclusions. An initial scan of the flint seemed to justify a date of circa 7,000 BC for the site, or roughly the transition from the Early to the Middle Mesolithic period. The studied flint was fragmentary and mainly consisted of debitage (flakes, chips, blades, cores), but some tools were also identified (including segments, scrapers and possibly burins). Also present was a large quantity of burnt and unburnt bone. A preliminary assessment of the bone revealed that, although most of it was highly fragmentary, at least mammals, birds, fish and amphibians were all present. Charcoal was also well represented. A category identified in the sieve residues, but often absent from land-based sites, is (charred) vegetable material. The preliminary scan revealed the presence of hazelnuts, acorns and water caltrop seeds, among others. All in all, an impressive quantity and range of archaeological material from the three trenches in the Yangtze Harbour planning area was available for scientific analysis.During the preliminary assessment stage there was still some uncertainty as to whether or not the retrieved archaeological material came from one single site. The distance between Trenches 1 and 2 was circa 50m and that between Trenches 2 and 3 circa 55m, and it was just possible that the trenches in fact represented three chronologically and spatially distinct sites. It was hoped that detailed analysis of the results would give more insight.
1.5 Goals and research questions
1.5.1 General issues
In the national Dutch context the Yangtze harbour investigations conform to the five research topics for the early prehistoric period defined in the National Archaeological Research Agenda; Deeben, Peeters, Raemaekers, Rensink, and Verhart 2006). These topics, as formulated in the Design Briefs drafted by the Cultural Heritage Agency of the Netherlands (Smit and Weerts 2011; Smit 2011; idem 2012), will be briefly discussed in the following section, with a few modifications.

22
!(!(!(!(
!(!(
!(!(
!(!(
!(!(
!(!(!(!(
!(!(!(!(
!(!(!(!(
!(
!(
!(
!(
!(
!(
!(
!(
!(!(
!(
!(
!(
!(
!(
!(
!(!(
!(
!(
!(
!(
!(
!( !(
!(
!(
!(!(
!(
!(
!(
!(
!(
!(
!(!(
!(
!(
!(
!(
!(
!(
!(
!(
!(
!(
!(
!( !(
!(
!(
!(!(
!(
!(!(
!(
!(
!(
61.200
61.200
61.300
61.300
61.400
61.400
61.500
61.500
61.600
61.600443.
500
443.
500
443.
600
443.
600
443.
700
443.
700
443.
800
443.
800
443.
900
443.
900
444.
000
444.
000
444.
100
444.
100
Map: Municipality of Rotterdam 20131:3000Scale
0 50m
Afb. 1.6. Eerste resultaten van het karterend inventariserend veldonderzoek (fase 3) in selectiegebied West. Per boring is de aan- of afwezigheid van rivierduinafzettingen en archeologische indicatoren weergegeven.
!( Coring
!( with river-dune deposits
!( with flint in (top) river-dune deposits
!( with bone in (top) river-dune deposits !( with flint and bone in (top) river-dune deposits
!(!( with charcoal in (top) river-dune deposits
!(!( with charcoal in upper Wijchen Member
Target zone West
Planning area
´
B37A0672B37A0671
B37A0670 B37A0679B37A0673
B37A0674B37A0675
B37A0676
B37A0683
B37A0677B37A0678
B37A0690B37A0689
B37A0688B37A0687
B37A0682
B37A0686B37A0681
B37A0691
B37A0692B37A0693
B37A0694
B37A0698B37A0699
B37A0700
B37A0696
B37A0697B37A0684
B37A0685B37A0680
B37A0695
Fig. 1.6. Preliminary results of the systematic field assessment (Stage 3) in Target zone West. Shown here are the presence or absence of river-dune deposits and archaeological indicators in each core.
23
Fig. 1.7. Preliminary results of the systematic field assessment (Stage 3) in Target zone East. During this stage of the investigation only one core revealed a very small quantity of charcoal dust upon inspection with the naked eye.
!(!(B37A0721
B37A0720
B37A0719
B37A0718
B37A0715
B37A0714
B37A0710
B37A0709B37A0708
B37A0707
B37A0706B37A0705
B37A0704B37A0703
B37A0702
Map: Municipality of Rotterdam 20131:3000Scale
0 50m
Afb. 1.7. Eerste resultaten van het karterend inventariserend veldonderzoek (fase 3) in selectiegebied Oost. Tijdens deze onderzoeksfase is met het blote oog slechts in één boring een minimale hoeveelheid houtskoolgruis waargenomen.
! Coring
!(!( with charcoal in upper Wijchen Member
Target zone East
Planning area
´
!
!
!
!
!
!
!
!
!
B37A0712
61.800
61.800
61.900
61.900
62.000
62.000
62.100
62.100
62.200
62.200
443.
300
443.
300
443.
400
443.
400
443.
500
443.
500
443.
600
443.
600
443.
700
443.
700
443.
800
443.
800
443.
900
443.
900
B37A0701
B37A0713
B37A0711
B37A0717B37A0716

24
Colonisation and early settlement history of the Netherlands (Topic 1) The nature of early prehistoric settlement and the population distribution during that period in the wetter parts of the Netherlands are still relatively unknown. So far, thoroughly studied archaeological sites are lacking in the North Sea basin. The great depth and wet conditions at most Dutch early prehistoric sites tend to result in excellent preservation, but the chance that any of these sites can be studied is slim. How much archaeology is actually present in the deeper layers of this part of the Netherlands is therefore unknown. Supra-site analysis is hampered by the small number of excavated or otherwise studied sites. To remedy this situation, more field studies are needed, especially core sampling and excavation.
Land use and settlement systems (Topic 2)Given the methods applied by this project it is highly unlikely that detailed conclusions regarding landscape exploitation and settlement systems in the period the river-dune complex was occupied can be drawn. However, palaeo-ecological analysis may provide some information on landscape use in the research area.
Food economy and the relation between human populations and their environment (Topic 3)The overall good preservation of organic material in the wetter parts of the Netherlands provides some insight into early prehistoric food economy. Analysis of bone material, microscopic and macroscopic plant remains may yield data on for example settlement seasonality, food economy and hunting strategies.
Burials and other forms of deposition of human remains (Topic 4)Little information is available on early prehistoric funerary practices. The information content of human remains encountered at other sites (e.g. Zijl et al. 2011) depends on their state of preservation and degree of fragmentation.
Cultural traditions/social relations and interaction (Topic 5)The presence of exotic materials among the archaeological remains makes it possible to study the North Sea basin site(s) in a wider social and cultural context.
The National Archaeological Research Agenda has its regional counterpart in the Provincial Archaeological Research Agenda, drafted by the Province of Zuid-Holland; Provincie Zuid-Holland 2010). Several items on this agenda also apply to the research carried out in the Yangtze harbour:- Reconstructing the local environment and landscape development, and comparing the results to what is already known;- Obtaining absolute dates (i.e. radiocarbon, OSL and dendrochronology) for sediments and archaeological remains;- Conducting archaeobotanical and archaeozoological studies.
Relevant specifically from an international perspective are two partnerships, North Sea Prehistory Research and Management Framework (NSPRMF) 2009 and Submerged Prehistoric Archaeology and Landscapes of the Continental Shelf (SPLASHCOS). The NSPRMF 2009 agenda contained several general research topics that are relevant to the drowned prehistoric landscapes and archaeological sites of the North Sea basin (Peeters, Murphy, and Flemming 2009). Several of the research priorities derived from these wider topics apply to the Yangtze Harbour project: (1) gaining better insight into the palaeogeography of the North Sea area; (2) improving the chronological framework on the basis of absolute dates obtained on in situ sediments; (3) increasing the number of suitable data points and the improvement of survey techniques.SPLASHCOS is a European research network. Its primary goal is the promotion and stimulation of the study, interpretation and conservation of drowned landscapes and prehistoric archaeology within the boundaries of the European continental shelf (http://www.splashcos.org), in the context of the full range of heritage management activities and with contributions by archaeologists, geologists, marine biologists, authorities, policy makers and the general public. In brief, SPLASHCOS aims to combine, at the European level, various initiatives regarding the study and heritage management of drowned prehistoric landscapes.

25
1.5.2 Goals
The overall goal of the systematic field assessment (Stage 3) and the invasive underwater investigation (Stage 4) was to establish the actual or potential presence of archaeological remains in the two target zones (Smit and Weerts 2011; Smit 2011). Since archaeological remains had already been encountered in Target zone West in the course of Stage 3, the main goal during Stage 4 was the documentation of these remains.
1.5.3 Research questions
On the basis of the data generated by the investigations at the Yangtze harbour, three main themes were defined to guide further analysis (Smit 2012):- Which developments characterised the Late Glacial and Early Holocene landscape?- What are the characteristics of the landscape and environment near the river dunes at the time when they were occupied?- What is the nature of the archaeological remains in the planning area and how are they related to each other, to the landscape and to the general chronological and cultural context?
After the invasive underwater investigation (Stage 4) was completed, but before the start of the analysis stage, these three main themes in turn generated a large number of specific research questions, which – still before the drawing up of the report – were included in the Project Plan (Moree, Schiltmans, and Vos 2012). The Project Plan was in part based on the Design Briefs drafted previously by the Cultural Heritage Agency of the Netherlands (Smit and Weerts 2011; Smit 2011; idem 2012) and also on the results of Stages 1 and 2 and the preliminary findings of Stages 3 and 4, while the material specialists who were involved formulated a number of additional research questions on the basis of a global study of the finds. The results of the (geo) archaeological investigations made it possible to analyse the collected data on three distinct spatial scales: macro (the Yangtze Harbour planning area), meso (the two Target zones West and East) and micro (the three trenches in Target zone West). A fourth, regional scale was added, which encompassed the entire Maasvlakte region. The research questions listed below follow the four spatial scales in descending order.
Regional scaleKnowledge of the regional landscape is crucial for an understanding of the landscape setting of, and (local) landscape development at, the site(s) Yangtze Harbour as well as the palaeo-landscape context of archaeological remains encountered in the Maasvlakte region.
Specific research questions- What was the topographic relief in the Maasvlakte region in the Early Holocene? Where were the major river-dune complexes situated and what was the location of the main channel of the Early Holocene river?- What is the position of the planning area within the framework of the Early Holocene landscape of the Maasvlakte region? What was its distance to the main river? Were there any smaller valleys/valley systems?- How did the drowning process of the area proceed (palaeogeographical reconstruction)?- What is the relation between the archaeological finds in the region and the reconstructed landscape? Is it possible to identify the source of the archaeological material found in secondary contexts?
MacroscaleOn the macroscale, a global outline of the landscape and its development through time needed to be made, including its genesis and depositional processes over time, with approximate dates assigned to these processes. In addition, the drafting of a description, as well as the creation of two and three-dimensional models of the landscape were called for.
26
Specific research questions- What was the exact depth (in m - asl) of the observed deposits and units?- Is it possible to define the spatial limits of these deposits and units on the basis of the results of seismic probing and coring?- Is it possible to reconstruct the topographic relief and environment of the Late Glacial and Early Holocene landscape near the present Yangtze harbour?- What is the formation date of the clay layer (lower Wijchen Member, Kreftenheye Formation) on top of which the river-dune sand was deposited?- When were the river dunes in the planning area (Delwijnen Member, Boxtel Formation) and the sandy river deposits of the Kreftenheye Formation formed?- Is it possible to reconstruct the drowning process that affected the river-dune landscape, and what is the formation date of the Basal Peat (Nieuwkoop Formation) and the other sediments which cover this landscape?- Were there any direct marine influences on the drowning process?- How do these results relate to those obtained during earlier studies carried out in the planning area?
MesoscaleOn the mesoscale, the research zoomed in further on the landscape. This scale required a reconstruction of the landscape and the environment in the western part of the planning area, in the area directly surrounding the site(s). The relation between the river-dune complex (Target zone West) and the higher Pleistocene deposits on both sides of a large gully (Target zone East) needed to be investigated. An important question on this scale was whether or not the gully already carried water when the river dune was occupied, or if this did not occur until later.
Specific research questions- What was the relation between the river-dune complex and the eastern gully?- How was this landscape exploited?- What was the character of the landscape on an around the river dune before, during and after its occupation? Was it a brackish, freshwater or saltwater landscape and did its character change through time?- Is it possible to reconstruct the pedogenesis and precise nature of the soils which constitute the top of the dune?- Likewise, is it possible to reconstruct the pedogenesis and precise nature of the charcoal-rich levels in the upper Wijchen Member (Kreftenheye Formation)?- Are these charcoal-rich layers in the upper Wijchen Member anthropogenic?- What is the relation, if any, between the charcoal-rich levels in the upper Wijchen Member and the archaeological remains retrieved from the river dune?- Did any erosion take place on the slopes of the river dune?
MicroscaleAt the microscale research focussed on the archaeological and palaeo-ecological remains collected in the three trenches during the invasive underwater investigation.
General research questions- What is the composition of the archaeological assemblage and which materials were used?- From which geological layers and/or units did the remains derive?- From what precise depth (in m - asl) were the remains retrieved and what are the National Grid Coordinates of the site, at the maximum level of accuracy feasible within the technical limitations of the project?- Are there indications for erosion and/or re-deposition of some of the archaeological remains? In other words, were the archaeological remains found in situ?- What were the nature, date and state of preservation of the remains?- Did the selected research methods in any way affect the archaeological remains (e.g. damage, context disturbance) ?- To what extent is the observed composition of the archaeological assemblage the product of the selected research methods and how does this compare with the results of land-based excavations?- What does a comparison of the results of the invasive underwater investigation from the three trenches reveal? Are the trenches part of one single archaeological complex

27
with a wide scatter of material, or do they rather represent three isolated, spatially distinct, smaller locations of different character and date?
Specific research questions (inorganic and organic remains)- Which artefact types (e.g. flint, stone, modified wood, modified bone) were encountered at the three locations? What are their origins, typology, technological character and chronological context?- How were the artefacts used in the past?- What activities took place on the river dune?- Are there indications for hunting/fishing, and if so, which species were targeted? How were the various animal populations exploited?- What was the diet of the people living on the river-dune site? Was the food collected in the immediate environment or elsewhere?- What types of food were prepared on the river dune?- Are there indications for seasonality in the activities carried out on the river dune?- How long and when were the three locations occupied?- Are there any indications for short-term occupation, or for changes in the occupation pattern through time?- Do the results of the analysis of fish and other animal remains shed some light on the landscape, exploited ecozones and/or seasonal activities, and is it possible to observe any changes through time? To what extent had the freshwater fish fauna recovered after the last ice age?- Which skeletal parts and animal species were used to produce bone tools?
Synthesis- To what extent are the archaeological remains comparable to those known from other North Sea sites and complexes from the mainland? Which complexes are relevant in this context?- If no comparable sites/complexes are available, what are the implications for the interpretation of the Yangtze Harbour remains?- What is the wider chronological and cultural context of these remains?- Are there indications for (inter)regional transportation of finished goods and/or resources?
1.6 Organisation of this report
This report presents the results of the systematic field assessment (Stage 3) and the invasive underwater investigation (Stage 4) in combination with the results of the desk-based assessment (Stage 1; Vos et al. 2009) and the exploratory field assessment (Stage 2; Vos et al. 2010a) described earlier. In the present publication these two earlier reports form Appendices 3.1 and 3.2. Chapter 2 offers a description of the methods and techniques used during respectively the systematic field assessment (Stage 3; targeted complementary seismic research in combination with cone penetration tests and a coring survey) and the invasive underwater investigation (Stage 4; controlled retrieval of soil samples from the top of the river dune from a dredging platform). The chapter will clarify in more detail the stepped approach deployed by the Yangtze Harbour project as well as the project’s strategy of using the preliminary results of each preceding stage as a guideline for the next one. Section 2.4 explains the multidisciplinary nature of the data processing phase that followed these two stages. The chapter concludes with an evaluation of the methods and techniques and offers recommendations for future research under comparable conditions.Chapter 3 discusses the landscape genesis and palaeogeography of the study area, focussing on its geology as a complex structure of layers and units. These geological units (Section 3.3) in turn form the building blocks for the geological profiles, (three-dimensional) models and landscape reconstructions. After a presentation of the results of the geological survey and model building in Section 3.4, Sections 3.5 and 3.6 provide a detailed discussion of the process of obtaining geological dates and the analysis of a number of selected cores from the Yangtze harbour area. A reconstruction of the landscape in the Early Holocene estuaries of the rivers Rhine, Meuse and Scheldt is presented in Section 3.7. It should be mentioned here that the results of the investigations at and around the Yangtze harbour made it possible to produce landscape reconstructions

28
at three different spatial levels (the Maasvlakte region, the Yangtze Harbour planning area and Target zone West), each time for three or four different periods. Chapter 3 concludes with tentative answers to the palaeolandscape research questions stated in the Project Plan (Moree et al. 2012).Chapter 4 presents the methods and results of an analysis of the lithic assemblage (flint and stone) from Target zone West. Topics discussed include the composition of the assemblage, characteristics of retouched tools and raw materials and their (probable) origins, in part based on the results of thin-section analysis and with a focus on use-wear analysis. The technological characteristics of flakes and blades in particular, in combination with a typological classification of the tools, form a source of information on the technology, age and cultural affiliation of the site(s). Section 4.5 presents the results of an attempt to answer the relevant research questions stated in the Project Plan (Moree et al. 2012).Chapter 5 contains a presentation of the methods and results of the analysis of faunal remains (mammals, birds, fish, amphibians, and reptiles) retrieved from Target zone West, including an overview of the range of identified species, the landscape, exploited ecozones and possible indications of seasonality. The chapter includes a discussion of the encountered bone artefacts on the basis of the results of use-wear analysis and of the chronology of the material as established by radiocarbon dating. Chapter 5 concludes with tentative answers to some relevant research questions from the Project Plan (Moree et al. 2012).The results of archaeobotanical analysis form the subject of Chapter 6. The first two sections discuss the material categories that were encountered (palynological remains, botanical macroremains and charcoal), research questions, the origin of the material (Stage 3 core samples and Stage 4 soil samples) and the methods that were used. The actual results and interpretations are presented in Sections 6.3 (radiocarbon analysis), 6.4 (analysis results of the Stage 3 core samples) and 6.5 (analysis results of the Stage 4 soil samples). Chapter 6 concludes with a synthesis and discussion centring around three themes: landscape, human influence and hearths on and near the river dune, and food economy. The final section discusses relevant research questions from the Project Plan (Moree et al. 2012).The present publication concludes with a synthesis (Chapter 7), presenting an interdisciplinary interpretation of the research results at different spatial levels: the site(s), the Maasmond area, and the North Sea basin. At each spatial level, a number of themes is dealt with and the chapter continues with a discussion on the significance of the Yangtze Harbour project for our understanding of Mesolithic settlement in the Maasmond area and the (drowning) North Sea basin from an international point of view, and in comparison with current research trends.

29
Notes
1. Rotterdam municipal archaeological service (BOOR), Ceintuurbaan 213b, 3051 KC Rotterdam. E-mail: [email protected]. Deltares, section Applied Geology and Geophysics, Princetonlaan 6, 3584 CB Utrecht. E-mail: [email protected]. The chronology adopted here for the Early Mesolithic (9500-8600 BP; 9200-7500 cal BC), Middle Mesolithic (8600-7800 BP; 7500-6500 cal BC) and Late Mesolithic periods (7800-6500/5500 BP; 6500-5300/4400 cal BC) is based on that proposed by Verhart and Arts (2005). It should be noted that Louwe Kooijmans, van den Broeke, Fokkens, and van Gijn (2005) prefer a different chronology: Early Mesolithic period (9600-8200 BP; 8800-7100 cal BC), Middle Mesolithic period (8200-7600 BP; 7100-6450 cal BC), and Late Mesolithic period (7600-6400/6000 BP; 6450-5300/4900 cal BC).4. Dutch title: ‘Samenwerkingsovereenkomst inzake archaeologische vondsten tussen Havenbedrijf Rotterdam N.V. en Rijksdienst voor Archeologie, Cultuurlandschap en Monumenten van het Ministerie van Onderwijs, Cultuur en Wetenschap’.

30
31
2 Methods and techniques
2.1 Introduction
Between 2009 and the end of 2011 a series of (geo)archaeological investigations were carried out in the Yangtze Harbour planning area, Rotterdam municipality, the Netherlands. The aim of these investigations was to trace and record sites of archaeological interest in submerged Late Pleistocene and Early Holocene deposits at depths ranging from 22 to 17m below asl. One specific focus of attention was the potential presence of river-dune deposits of the Delwijnen Member (Boxtel Formation), on top of the sandy fluviatile deposits that are part of the Kreftenheye Formation (see Section 1.2).Investigations into the potential presence of sites of archaeological interest in the Late Pleistocene and Early Holocene deposits in the Yangtze harbour followed a so-called geogenetic approach. This approach involves localising areas of potential archaeological interest on the basis of existing information on the palaeolandscape in question (Groenendijk and Vos 2002) and within the framework of a geological stratigraphic model. Specifically, a geogenetic approach involves establishing the lithofacies (the depositional environment) and formation date of all stratigraphic units in the model. This information forms the basis for a landscape reconstruction (or palaeolandscape model) and for the identification of areas of high archaeological potential within the lithofacies. The resulting archaeological predictive model is linked to the encountered stratigraphic units and the archaeological potential of each unit is assessed (a unit-based archaeological predictive model; see Vos and Bazelmans 2002).
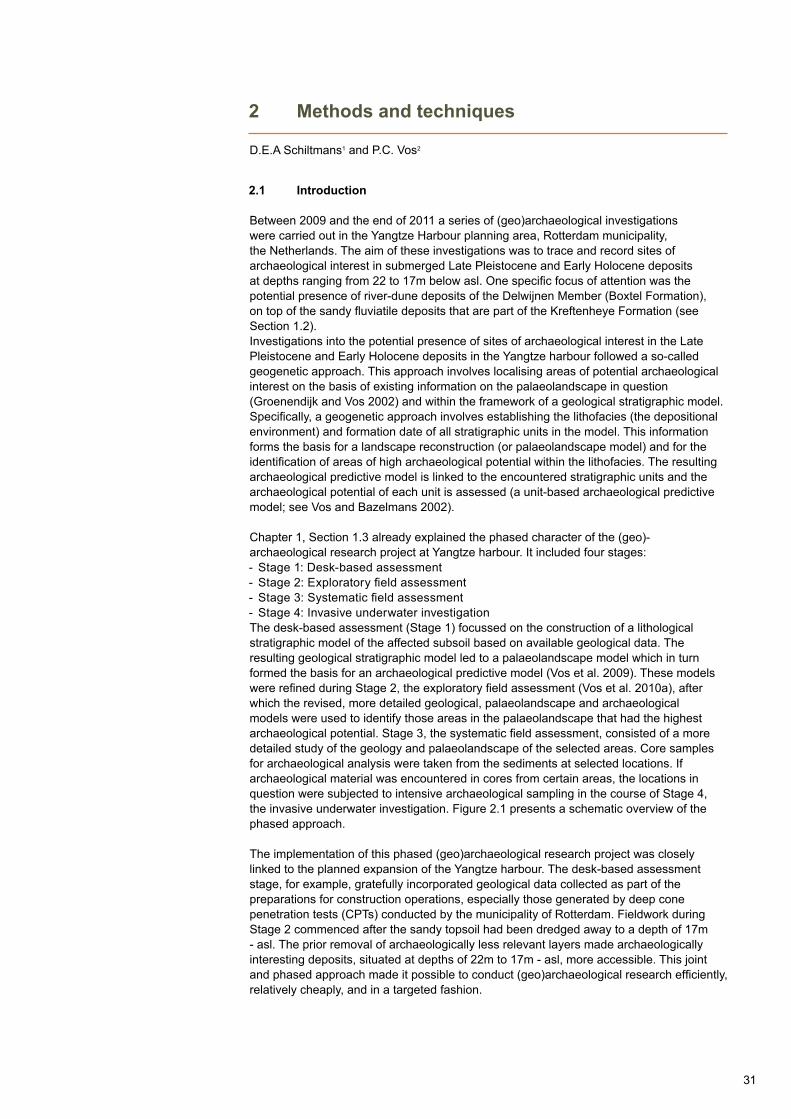
Chapter 1, Section 1.3 already explained the phased character of the (geo)-archaeological research project at Yangtze harbour. It included four stages:- Stage 1: Desk-based assessment- Stage 2: Exploratory field assessment- Stage 3: Systematic field assessment- Stage 4: Invasive underwater investigationThe desk-based assessment (Stage 1) focussed on the construction of a lithological stratigraphic model of the affected subsoil based on available geological data. The resulting geological stratigraphic model led to a palaeolandscape model which in turn formed the basis for an archaeological predictive model (Vos et al. 2009). These models were refined during Stage 2, the exploratory field assessment (Vos et al. 2010a), after which the revised, more detailed geological, palaeolandscape and archaeological models were used to identify those areas in the palaeolandscape that had the highest archaeological potential. Stage 3, the systematic field assessment, consisted of a more detailed study of the geology and palaeolandscape of the selected areas. Core samples for archaeological analysis were taken from the sediments at selected locations. If archaeological material was encountered in cores from certain areas, the locations in question were subjected to intensive archaeological sampling in the course of Stage 4, the invasive underwater investigation. Figure 2.1 presents a schematic overview of the phased approach.
The implementation of this phased (geo)archaeological research project was closely linked to the planned expansion of the Yangtze harbour. The desk-based assessment stage, for example, gratefully incorporated geological data collected as part of the preparations for construction operations, especially those generated by deep cone penetration tests (CPTs) conducted by the municipality of Rotterdam. Fieldwork during Stage 2 commenced after the sandy topsoil had been dredged away to a depth of 17m - asl. The prior removal of archaeologically less relevant layers made archaeologically interesting deposits, situated at depths of 22m to 17m - asl, more accessible. This joint and phased approach made it possible to conduct (geo)archaeological research efficiently, relatively cheaply, and in a targeted fashion.
D.E.A Schiltmans1 and P.C. Vos2

32
Activity
Stage 1 Desk-based assessment
▪ Desk-based assessment
▪ Establishing operational depth
Techniques
▪ Existing cores
▪ Existing CPT results
Product
▪ Geological stratigraphic model
Surface sand suppletion Maasvlakte1
Average sea level
Palaeosurfaces
Stage 2 Exploratory field assessment
▪ Seismic research chirp
▪ Seismic research sparker
▪ Bathymetric imaging harbour
floor
▪ Coring
▪ Existing CPT results
▪ Tested and refined geological
stratigraphic model
▪ Palaeolandscape model
▪ Archaeological predictive
model
▪ Geological exploration
▪ Updating Stage-1 model
▪ Establishing target zones
Dredging down to 17m - asl
Stage 3 Systematic field assessment
▪ Seismic research chirp
▪ CPT
▪ Coring
▪ Archaeological predictive model
▪ Preliminary selection archaeo-
logical research locations/vertical
trajectory
▪ Final selection archaelogical
trenches/vertical trajectory
▪ Geological research target
zones
▪ Update geological/landscape
model target zones
▪ Selection archaeological
research locations
▪ Sampling cores
Zone dredged down to 17m - asl
Archaeologically relevant stratigraphic units
Target zone West (Stage 3)Target zone East (Stage 3)
refin
ing
the
arch
aeol
ogic
al p
redi
ctiv
e m
odel
Stage 4 Invasive underwater investigation
▪ Bathymetric imaging
harbour floor
▪ Mechanical sampling (grab)
▪ Sampling
For every area selected at Stage 2
Archaeological trenches 1, 2, and 3.
For every trench selected at Stage 3
▪ Georeferenced samples
(bulk bags)
Location archaeologicalsample
Fig. 2.1. Schematic overview of the phased approach used during (geo)archaeological investigations in the Yangtze Harbour planning area.
The next section discusses research strategies, methods and techniques associated with Stage 3, the systematic field assessment, and Stage 4, the invasive underwater investigation. The results of Stages 1 and 2 have already been reported elsewhere (Vos et al. 2009; idem 2010a). They will not be discussed in the present chapter; the associated reports are included in the present publication as Appendices 3.1 and 3.2.

33
2.2 Systematic field assessment (Stage 3)
2.2.1 Introduction
The results of the preceding stages led to the definition of three zones in the Yangtze Harbour planning area where Mesolithic remains in Early Holocene deposits could be expected (Vos et al. 2010a, Appendix C, Appendix 14). A consultation between specialists from Deltares and TNO Geological Survey of the Netherlands and the competent authority (in this case the Cultural Heritage Agency of the Netherlands) resulted in the selection of two zones which qualified for further research (Smit and Weerts 2011): Target zone West and Target zone East. The selection was based on a combination of scientific and practical considerations. Target zone West (circa 6.1ha) is a zone in the northwestern part of the Yangtze harbour where seismic imaging (Stage 2) had previously suggested the presence of river dunes. The area’s corner coordinates are 61.160/443.880, 61.375/443.998, 61.605/443.912, and 61.373/443.724. Target zone East (circa 6.7ha) is a zone of higher Pleistocene deposits on both sides of a large gully in the central part of the Yangtze harbour. Its corner coordinates are 61.790/443.677, 61.900/443.786, 62.280/443.560, and 62.166/443.447. Fig. 1.5 shows the locations of both target zones. A third zone of high archaeological potential, an area with possible river dunes in the southeastern part of the Yangtze harbour, was not further investigated as its position immediately opposite the Euromax Terminal made additional research logistically unfeasible. Moreover, Target zone West, in the northwestern part of the Yangtze harbour, formed a comparable area where research could be carried out (relatively) uninterrupted, and within the constraints posed by time, finances and logistics.
In the summer of 2011 a systematic field assessment was conducted (Archis project registration number 48031) consisting of a combination of seismic research and coring, the same methods and techniques that were used during the exploratory phase (Stage 2) but at locations that were spaced much closer. In addition, cone penetration tests were conducted in both target zones. The work proceeded in phases with the (preliminary) results of each previous phase guiding the next.The systematic field assessment followed the guidelines set by the Design Brief drafted by the Cultural Heritage Agency of the Netherlands (Smit and Weerts 2011). Moreover, because of the exceptional conditions and the pioneering nature of the project, whenever feasible, fieldwork also followed Specifications VS03 (‘Implementing core sampling surveys’) and VS04 (‘Implementing geophysical research’) as stipulated by Protocol 4003 (‘Field Assessment’), drafted by the Dutch Archaeology Quality Standard (KNA), Version 3.2, issued by the Committee for Archaeological Quality (CvAK).
2.2.2 Targeted (supplementary) seismic research combined with cone penetration tests
The first research conducted in Target zone West and Target zone East was a targeted (supplementary) seismic exploration, combined with a number of supplementary cone penetration tests (Smit and Weerts 2011: Research stage A1). In addition, the harbour floor was mapped using so-called bathymetric imaging.
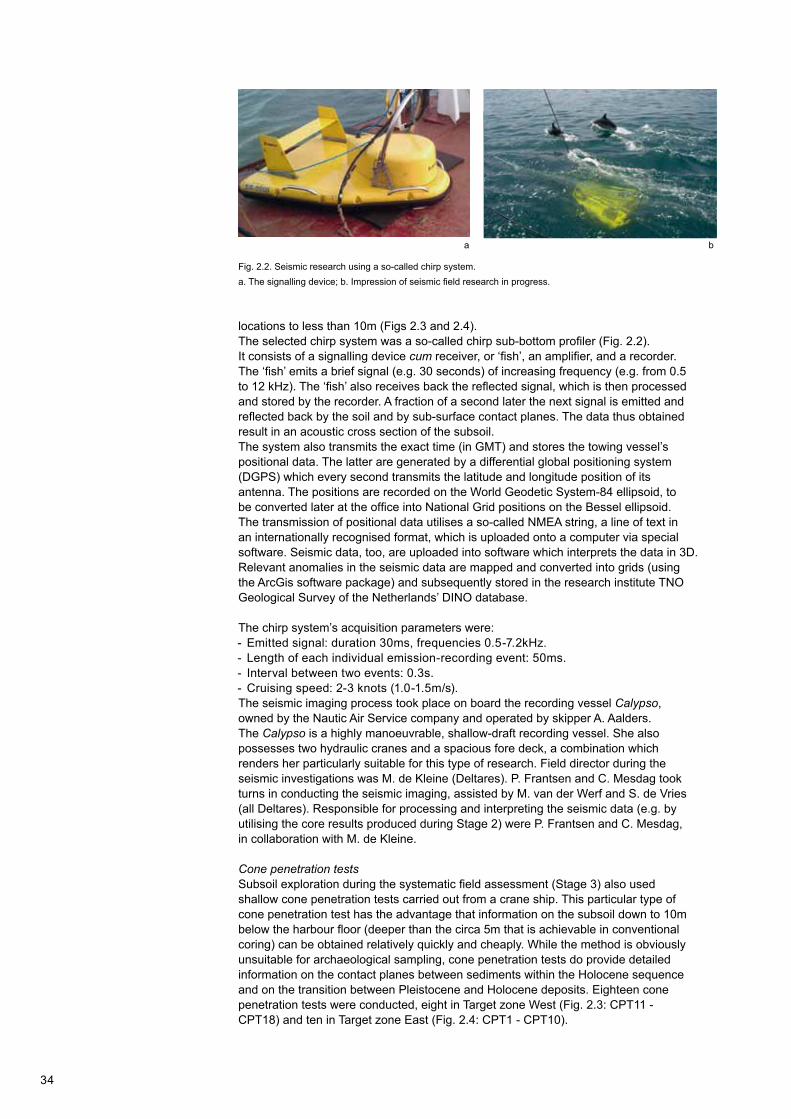
Seismic researchSeismic imaging of the harbour floor during Stage 3 used a so-called chirp system (Fig. 2.2). In general, seismic research involves mapping the sub-surface by emitting and receiving pressure waves. Contrasts between phenomena in the sub-soil (for example contact planes between different soil types) produce differential wave reflection. The degree of sub-soil penetration and resolution depends on wave frequency: higher frequencies result in a higher (i.e. more detailed) resolution but limited penetration; low frequencies produce deep penetration but low resolution. In order to map both deeper and shallower sub-surface layers in sufficient detail, a high-frequency (chirp) and a low-frequency (sparker) system were both used during the exploratory field assessment (Stage 2). Stage 3 used only the chirp system, as this produced acceptable results within the depth range that was to be explored. During Stage 2 grid lines were spaced 100m apart, but during Stage 3 this distance was decreased at a number of selected
34
Fig. 7: Seismische opnamen met de X-star 5.12
Fig. 8: Seismische opnamen met het sparkersysteem
Fig. 2.2. Seismic research using a so-called chirp system. a. The signalling device; b. Impression of seismic field research in progress.
Fig. 7: Seismische opnamen met de X-star 5.12
Fig. 8: Seismische opnamen met het sparkersysteem
a b
locations to less than 10m (Figs 2.3 and 2.4).The selected chirp system was a so-called chirp sub-bottom profiler (Fig. 2.2).It consists of a signalling device cum receiver, or ‘fish’, an amplifier, and a recorder. The ‘fish’ emits a brief signal (e.g. 30 seconds) of increasing frequency (e.g. from 0.5 to 12 kHz). The ‘fish’ also receives back the reflected signal, which is then processed and stored by the recorder. A fraction of a second later the next signal is emitted and reflected back by the soil and by sub-surface contact planes. The data thus obtained result in an acoustic cross section of the subsoil.The system also transmits the exact time (in GMT) and stores the towing vessel’s positional data. The latter are generated by a differential global positioning system (DGPS) which every second transmits the latitude and longitude position of its antenna. The positions are recorded on the World Geodetic System-84 ellipsoid, to be converted later at the office into National Grid positions on the Bessel ellipsoid. The transmission of positional data utilises a so-called NMEA string, a line of text in an internationally recognised format, which is uploaded onto a computer via special software. Seismic data, too, are uploaded into software which interprets the data in 3D. Relevant anomalies in the seismic data are mapped and converted into grids (using the ArcGis software package) and subsequently stored in the research institute TNO Geological Survey of the Netherlands’ DINO database.
The chirp system’s acquisition parameters were:- Emitted signal: duration 30ms, frequencies 0.5-7.2kHz.- Length of each individual emission-recording event: 50ms.- Interval between two events: 0.3s.- Cruising speed: 2-3 knots (1.0-1.5m/s).The seismic imaging process took place on board the recording vessel Calypso, owned by the Nautic Air Service company and operated by skipper A. Aalders. The Calypso is a highly manoeuvrable, shallow-draft recording vessel. She also possesses two hydraulic cranes and a spacious fore deck, a combination which renders her particularly suitable for this type of research. Field director during the seismic investigations was M. de Kleine (Deltares). P. Frantsen and C. Mesdag took turns in conducting the seismic imaging, assisted by M. van der Werf and S. de Vries (all Deltares). Responsible for processing and interpreting the seismic data (e.g. by utilising the core results produced during Stage 2) were P. Frantsen and C. Mesdag, in collaboration with M. de Kleine.
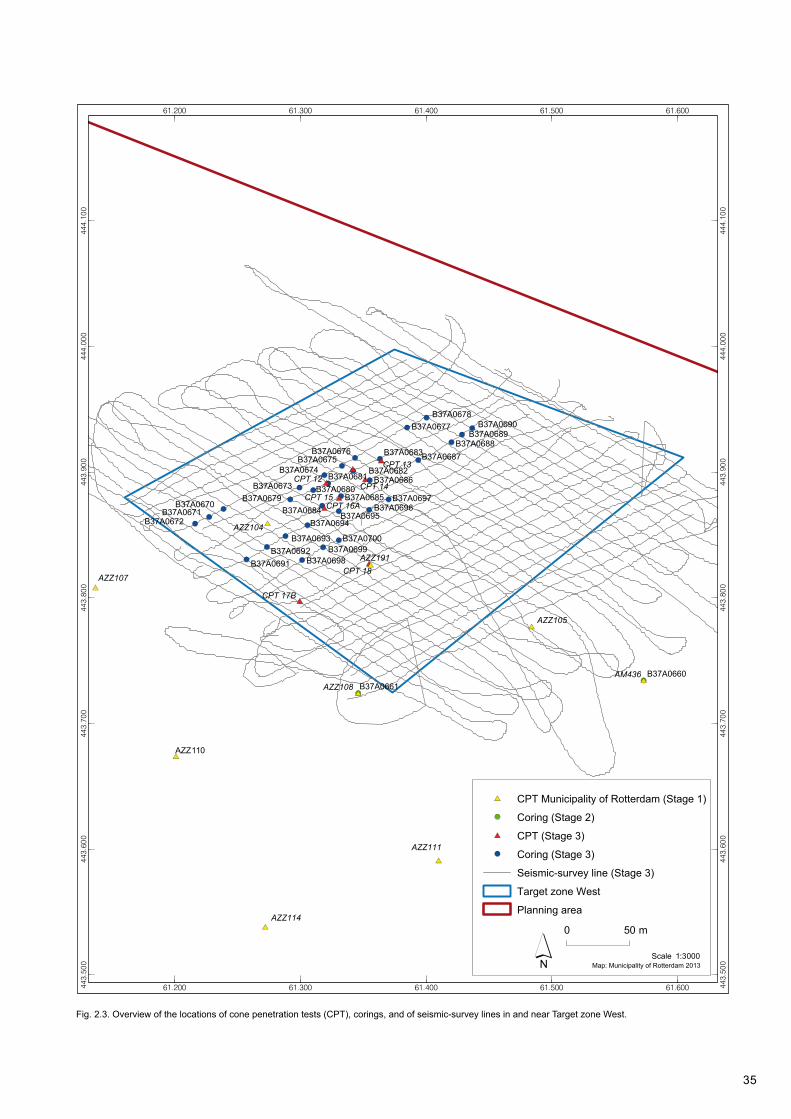
Cone penetration testsSubsoil exploration during the systematic field assessment (Stage 3) also used shallow cone penetration tests carried out from a crane ship. This particular type of cone penetration test has the advantage that information on the subsoil down to 10m below the harbour floor (deeper than the circa 5m that is achievable in conventional coring) can be obtained relatively quickly and cheaply. While the method is obviously unsuitable for archaeological sampling, cone penetration tests do provide detailed information on the contact planes between sediments within the Holocene sequence and on the transition between Pleistocene and Holocene deposits. Eighteen cone penetration tests were conducted, eight in Target zone West (Fig. 2.3: CPT11 - CPT18) and ten in Target zone East (Fig. 2.4: CPT1 - CPT10).
35
!(!(
!(
!(
!(
!(
!(
!(
!(
!(
!(!(
!(
!(
!(
!(
!(
!(
!(!(
!(
!(
!(
!(
!(
!( !(
!(
!(
!(!(
#*
#*#*
#*
#*
#*
#*
#*
!(
!(
#*
#*
#*
#*
#*
#*
#*
#*
#*
#*
61.200
61.200
61.300
61.300
61.400
61.400
61.500
61.500
61.600
61.600443.
500
443.
500
443.
600
443.
600
443.
700
443.
700
443.
800
443.
800
443.
900
443.
900
444.
000
444.
000
444.
100
444.
100
Map: Municipality of Rotterdam 20131:3000Scale
0 50 m
Afb. 2.3. Overzicht van de sonderingen, boringen en gevaren seismische lijnen in en nabij selectiegebied West.
#* CPT Municipality of Rotterdam (Stage 1)!( Coring (Stage 2)#* CPT (Stage 3)!( Coring (Stage 3)
Seismic-survey line (Stage 3)
Target zone West
Planning area
´
B37A0671
B37A0700B37A0699
B37A0698
B37A0697B37A0696
B37A0695B37A0694
B37A0693B37A0692
B37A0691
B37A0690B37A0689
B37A0688B37A0687
B37A0686
B37A0685B37A0684
B37A0682B37A0681
B37A0680B37A0679
B37A0678B37A0677
B37A0676B37A0675
B37A0674
B37A0673
B37A0672
B37A0670
CPT 18
CPT 15CPT 14
CPT 12
CPT 16A
AZZ191
AZZ104
CPT 17B
B37A0683CPT 13
B37A0661B37A0660AM436
AZZ108
AZZ107
AZZ110
AZZ114
AZZ111
AZZ105
Fig. 2.3. Overview of the locations of cone penetration tests (CPT), corings, and of seismic-survey lines in and near Target zone West.

36
Fig. 2.4. Overview of the locations of cone penetration tests (CPT), corings, and of seismic-survey lines in and near Target zone East.
!(
!(
!(
!(
!(
!(
!(
!(
!(
!(
!(
!(
!(
!(
!(
!(
!(
!(
!(
!(
!(
#*
#*
#*
#*
#*
#*
#*
#*#*
#*
!(
!(
!(
#*
#*
#*
#*
#*
#*
#*
#*
#*
#*
#*
#*
#*
61.800
61.800
61.900
61.900
62.000
62.000
62.100
62.100
62.200
62.200
443.
300
443.
300
443.
400
443.
400
443.
500
443.
500
443.
600
443.
600
443.
700
443.
700
443.
800
443.
800
443.
900
443.
900
Afb. 2.4. Overzicht van de sonderingen, boringen en gevaren seismische lijnen in en nabij selectiegebied Oost.
#*
#*
Map: Municipality of Rotterdam 20131:3000Scale
0 50 m
#* CPT Municipality of Rotterdam (Stage 1)!( Coring (Stage 2)#* CPT (Stage 3)!( Coring (Stage 3)
Seismic-survey line (Stage 3)
Target zone East
Planning area
´
B37A0721
B37A0720B37A0719
B37A0718B37A0717
B37A0716B37A0715
B37A0714
B37A0713
B37A0712
B37A071B37A0710
B37A0709B37A0708
B37A0707
B37A0706B37A0705
B37A0704B37A0703
B37A0702
B37A0701
CPT 9CPT 4
CPT 5
CPT 6
CPT 7
CPT 2
CPT 3CPT 8
CPT 1
CPT 10
BM108
AM390
AM112
AM111
B37A0659
B37A0658
BM119
BM118
BM117
#*
#*
BM130
BM129
BM141
BM142
37
Cone penetration testing in the two target zones used a miniature CPT device of the type Sage Sidewinder. A Cone Penetration Test, or CPT, assesses soil bearing capacity by pushing a rod with a cone-shaped tip (top angle 60 degrees), or cone, down into the soil layers and registering the mechanical resistance and cohesive strength encountered by the cone. The cone is pushed down into the soil at a constant rate of 2cm/s.The Mini-CPT was equipped with a calibrated 200mm2 cone. In general, the maximum penetration achievable with a cone penetration test is 10m, depending on soil resistance and vertical deviation. The device can withstand a counter pressure of up to 12kN. If this is exceeded, the device is turned off in order to prevent damage to the cone.Both the Mini-CPT and the followed procedures conformed to the International Reference Test Procedure as published by the International Society of Soil Mechanics and Geotechnical Engineering (ISSMGE, 1999), BS 5930 (BSI, 1999) refers to ISSMGE (1999), Eurocode 7 (CEN, 1999), and the NORSOK Standard G-CR001 (NTS, 1996), which refers to an earlier version of the ISSMGE document. The procedures also conformed to accepted standards issued by ASTM International (ASTM 05778-95) and the Dutch institute for standardisation Nederlands Normalisatie-Instituut in their publication NEN 5140.
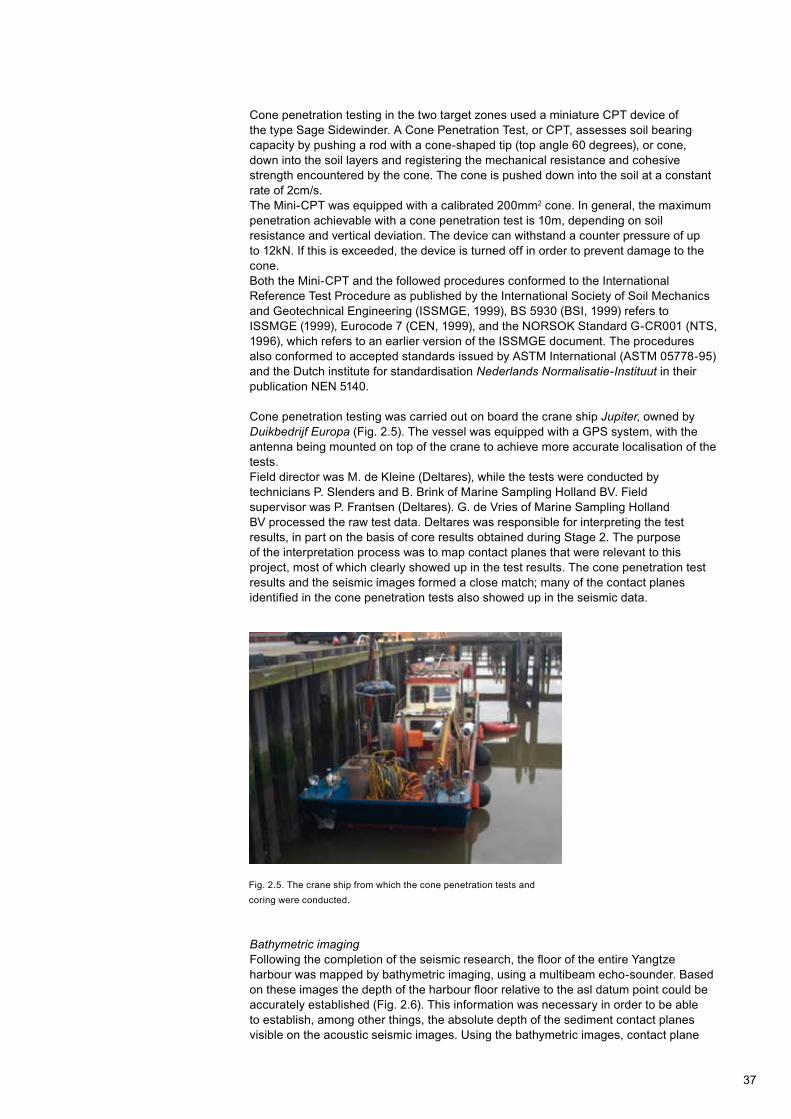
Cone penetration testing was carried out on board the crane ship Jupiter, owned by Duikbedrijf Europa (Fig. 2.5). The vessel was equipped with a GPS system, with the antenna being mounted on top of the crane to achieve more accurate localisation of the tests.Field director was M. de Kleine (Deltares), while the tests were conducted by technicians P. Slenders and B. Brink of Marine Sampling Holland BV. Field supervisor was P. Frantsen (Deltares). G. de Vries of Marine Sampling Holland BV processed the raw test data. Deltares was responsible for interpreting the test results, in part on the basis of core results obtained during Stage 2. The purpose of the interpretation process was to map contact planes that were relevant to this project, most of which clearly showed up in the test results. The cone penetration test results and the seismic images formed a close match; many of the contact planes identified in the cone penetration tests also showed up in the seismic data.
Fig. 9: Het gebruikte meetschip voor de sondeer- en booropnamen.
Fig. 10: Booropnamen met de vibrocore vanaf het meetschip.
Fig. 2.5. The crane ship from which the cone penetration tests and coring were conducted.
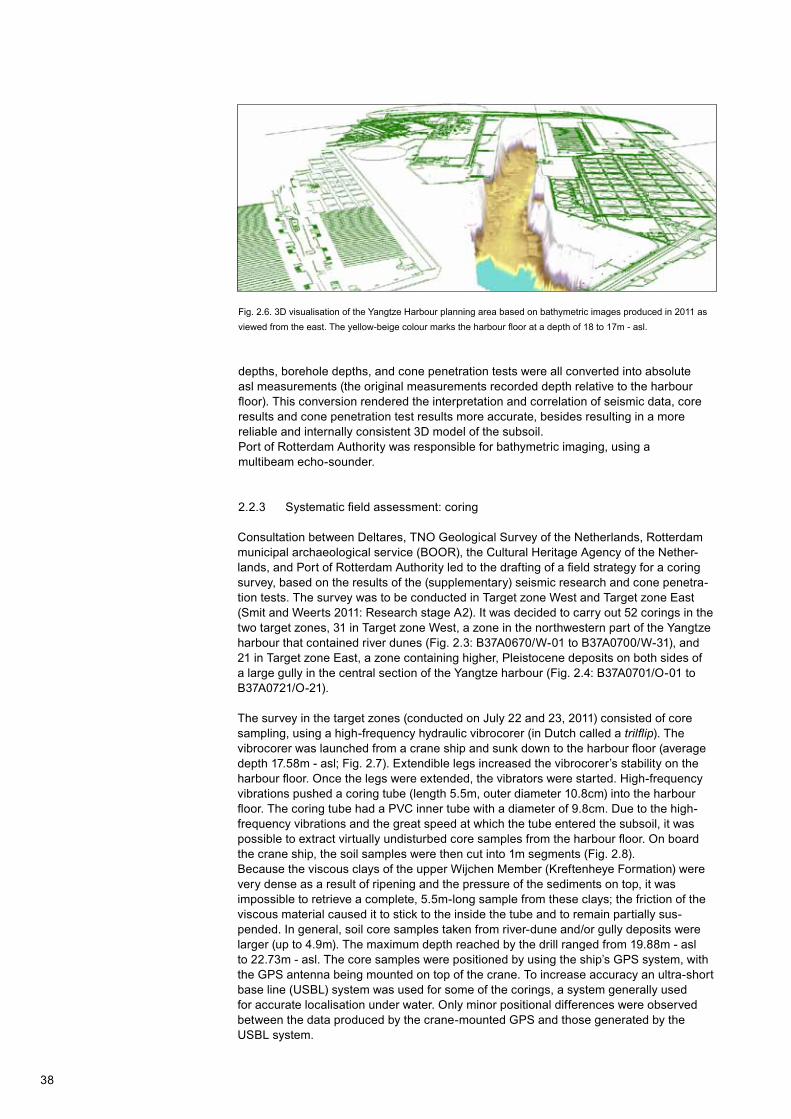
Bathymetric imagingFollowing the completion of the seismic research, the floor of the entire Yangtze harbour was mapped by bathymetric imaging, using a multibeam echo-sounder. Based on these images the depth of the harbour floor relative to the asl datum point could be accurately established (Fig. 2.6). This information was necessary in order to be able to establish, among other things, the absolute depth of the sediment contact planes visible on the acoustic seismic images. Using the bathymetric images, contact plane
38
Fig. 3: Bathymetrie van het havengebied na het uitbaggeren van de haven tot 17 m –NAP. De geel-beige kleur geeft de diepte weer van de haven bodem in 2011 tussen de 17 en 18 m –NAP.Fig. 2.6. 3D visualisation of the Yangtze Harbour planning area based on bathymetric images produced in 2011 as viewed from the east. The yellow-beige colour marks the harbour floor at a depth of 18 to 17m - asl.
depths, borehole depths, and cone penetration tests were all converted into absolute asl measurements (the original measurements recorded depth relative to the harbour floor). This conversion rendered the interpretation and correlation of seismic data, core results and cone penetration test results more accurate, besides resulting in a more reliable and internally consistent 3D model of the subsoil.Port of Rotterdam Authority was responsible for bathymetric imaging, using a multibeam echo-sounder.
2.2.3 Systematic field assessment: coring
Consultation between Deltares, TNO Geological Survey of the Netherlands, Rotterdam municipal archaeological service (BOOR), the Cultural Heritage Agency of the Nether-lands, and Port of Rotterdam Authority led to the drafting of a field strategy for a coring survey, based on the results of the (supplementary) seismic research and cone penetra-tion tests. The survey was to be conducted in Target zone West and Target zone East (Smit and Weerts 2011: Research stage A2). It was decided to carry out 52 corings in the two target zones, 31 in Target zone West, a zone in the northwestern part of the Yangtze harbour that contained river dunes (Fig. 2.3: B37A0670/W-01 to B37A0700/W-31), and 21 in Target zone East, a zone containing higher, Pleistocene deposits on both sides of a large gully in the central section of the Yangtze harbour (Fig. 2.4: B37A0701/O-01 to B37A0721/O-21).
The survey in the target zones (conducted on July 22 and 23, 2011) consisted of core sampling, using a high-frequency hydraulic vibrocorer (in Dutch called a trilflip). The vibrocorer was launched from a crane ship and sunk down to the harbour floor (average depth 17.58m - asl; Fig. 2.7). Extendible legs increased the vibrocorer’s stability on the harbour floor. Once the legs were extended, the vibrators were started. High-frequency vibrations pushed a coring tube (length 5.5m, outer diameter 10.8cm) into the harbour floor. The coring tube had a PVC inner tube with a diameter of 9.8cm. Due to the high-frequency vibrations and the great speed at which the tube entered the subsoil, it was possible to extract virtually undisturbed core samples from the harbour floor. On board the crane ship, the soil samples were then cut into 1m segments (Fig. 2.8).Because the viscous clays of the upper Wijchen Member (Kreftenheye Formation) were very dense as a result of ripening and the pressure of the sediments on top, it was impossible to retrieve a complete, 5.5m-long sample from these clays; the friction of the viscous material caused it to stick to the inside the tube and to remain partially sus-pended. In general, soil core samples taken from river-dune and/or gully deposits were larger (up to 4.9m). The maximum depth reached by the drill ranged from 19.88m - asl to 22.73m - asl. The core samples were positioned by using the ship’s GPS system, with the GPS antenna being mounted on top of the crane. To increase accuracy an ultra-short base line (USBL) system was used for some of the corings, a system generally used for accurate localisation under water. Only minor positional differences were observed between the data produced by the crane-mounted GPS and those generated by the USBL system.
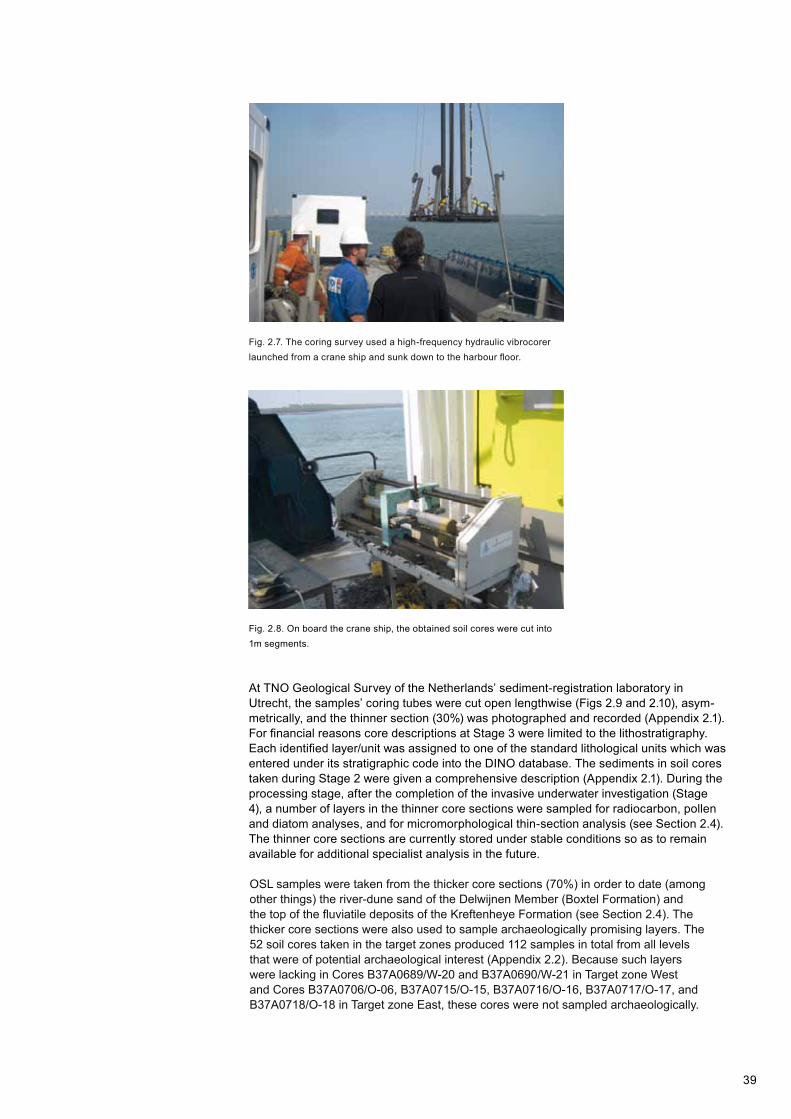
39
Fig. 9: Het gebruikte meetschip voor de sondeer- en booropnamen.
Fig. 10: Booropnamen met de vibrocore vanaf het meetschip.
Fig. 2.7. The coring survey used a high-frequency hydraulic vibrocorer launched from a crane ship and sunk down to the harbour floor.
Fig. 9: Het gebruikte meetschip voor de sondeer- en booropnamen.
Fig. 10: Booropnamen met de vibrocore vanaf het meetschip.
Fig. 2.8. On board the crane ship, the obtained soil cores were cut into 1m segments.
At TNO Geological Survey of the Netherlands’ sediment-registration laboratory in Utrecht, the samples’ coring tubes were cut open lengthwise (Figs 2.9 and 2.10), asym-metrically, and the thinner section (30%) was photographed and recorded (Appendix 2.1). For financial reasons core descriptions at Stage 3 were limited to the lithostratigraphy. Each identified layer/unit was assigned to one of the standard lithological units which was entered under its stratigraphic code into the DINO database. The sediments in soil cores taken during Stage 2 were given a comprehensive description (Appendix 2.1). During the processing stage, after the completion of the invasive underwater investigation (Stage 4), a number of layers in the thinner core sections were sampled for radiocarbon, pollen and diatom analyses, and for micromorphological thin-section analysis (see Section 2.4). The thinner core sections are currently stored under stable conditions so as to remain available for additional specialist analysis in the future.
OSL samples were taken from the thicker core sections (70%) in order to date (among other things) the river-dune sand of the Delwijnen Member (Boxtel Formation) and the top of the fluviatile deposits of the Kreftenheye Formation (see Section 2.4). The thicker core sections were also used to sample archaeologically promising layers. The 52 soil cores taken in the target zones produced 112 samples in total from all levels that were of potential archaeological interest (Appendix 2.2). Because such layers were lacking in Cores B37A0689/W-20 and B37A0690/W-21 in Target zone West and Cores B37A0706/O-06, B37A0715/O-15, B37A0716/O-16, B37A0717/O-17, and B37A0718/O-18 in Target zone East, these cores were not sampled archaeologically.

40
Fig. 2.10. Impression of some of the sliced soil cores.
Fig. 2.9. At TNO Geological Survey of the Netherlands’ sedimentregistration laboratory in Utrecht, the coring tubes were cut open and the cores prepared for further analysis.
The following layers (2 to 117cm thick) were archaeologically sampled during Stage 3:- Fluviatile deposits of the lower Wijchen Member (Kreftenheye Formation).
These clayey deposits, situated directly below the river-dune deposits, were comprehensively sampled.
- River-dune deposits of the Delwijnen Member (Boxtel Formation). Of these deposits the extensively humic top (Soil horizon A), the moderately humic transitional zone, and the ‘clean sand’ (Soil horizon C) were sampled separately.
- Fluviatile deposits of the upper Wijchen Member (Kreftenheye Formation). Of these deposits only the levels that showed soil formation were sampled.
Unfortunately, archaeological sampling of the clayey top of the deposits of the Kreftenheye Formation in Cores B37A0679/W-10 and B37A0682/W-13 in Target zone West was accidentally omitted. The peat of the Basal Peat (Nieuwkoop Formation), the freshwater tidal deposits of the Echteld Formation, and the estuarine layered deposits of the Wormer Member (Naaldwijk Formation) were not archaeologically sampled either, but visually inspected for the presence of archaeological indicators.On the premises of the Rotterdam municipal archaeological service (BOOR), the
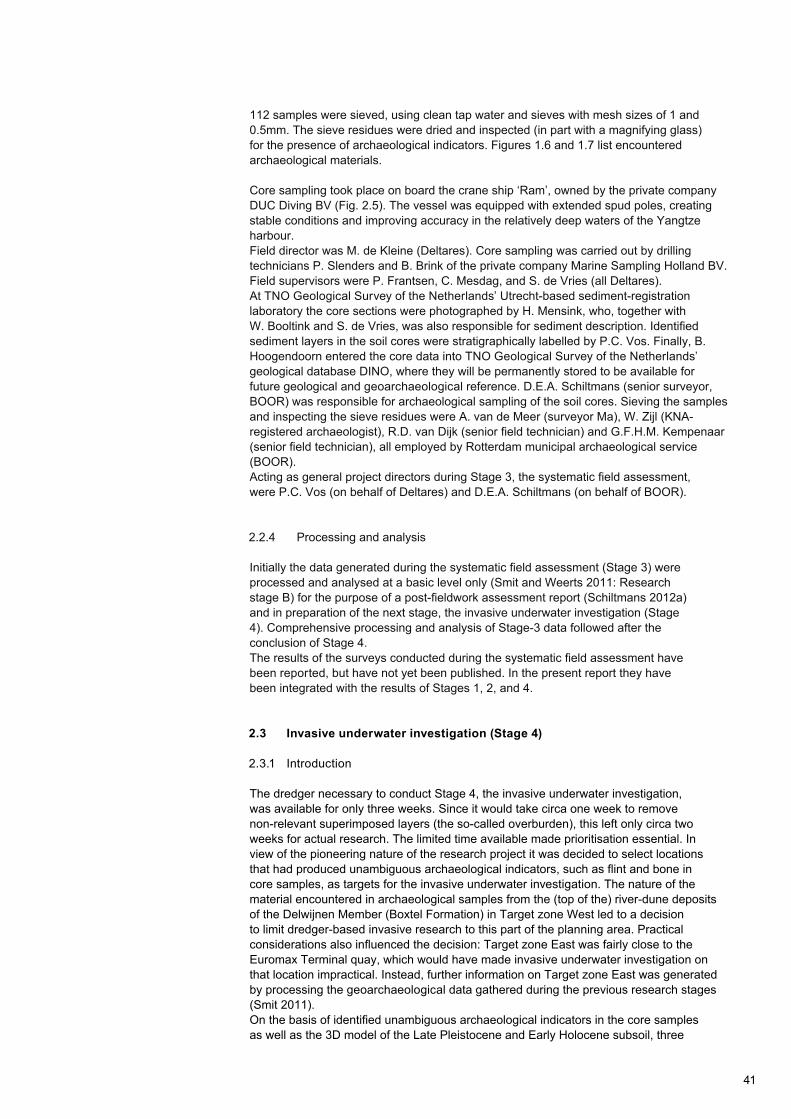
41
112 samples were sieved, using clean tap water and sieves with mesh sizes of 1 and 0.5mm. The sieve residues were dried and inspected (in part with a magnifying glass) for the presence of archaeological indicators. Figures 1.6 and 1.7 list encountered archaeological materials.
Core sampling took place on board the crane ship ‘Ram’, owned by the private company DUC Diving BV (Fig. 2.5). The vessel was equipped with extended spud poles, creating stable conditions and improving accuracy in the relatively deep waters of the Yangtze harbour.Field director was M. de Kleine (Deltares). Core sampling was carried out by drilling technicians P. Slenders and B. Brink of the private company Marine Sampling Holland BV. Field supervisors were P. Frantsen, C. Mesdag, and S. de Vries (all Deltares).At TNO Geological Survey of the Netherlands’ Utrecht-based sediment-registration laboratory the core sections were photographed by H. Mensink, who, together with W. Booltink and S. de Vries, was also responsible for sediment description. Identified sediment layers in the soil cores were stratigraphically labelled by P.C. Vos. Finally, B. Hoogendoorn entered the core data into TNO Geological Survey of the Netherlands’ geological database DINO, where they will be permanently stored to be available for future geological and geoarchaeological reference. D.E.A. Schiltmans (senior surveyor, BOOR) was responsible for archaeological sampling of the soil cores. Sieving the samples and inspecting the sieve residues were A. van de Meer (surveyor Ma), W. Zijl (KNA-registered archaeologist), R.D. van Dijk (senior field technician) and G.F.H.M. Kempenaar (senior field technician), all employed by Rotterdam municipal archaeological service (BOOR).Acting as general project directors during Stage 3, the systematic field assessment, were P.C. Vos (on behalf of Deltares) and D.E.A. Schiltmans (on behalf of BOOR).
2.2.4 Processing and analysis
Initially the data generated during the systematic field assessment (Stage 3) were processed and analysed at a basic level only (Smit and Weerts 2011: Research stage B) for the purpose of a post-fieldwork assessment report (Schiltmans 2012a) and in preparation of the next stage, the invasive underwater investigation (Stage 4). Comprehensive processing and analysis of Stage-3 data followed after the conclusion of Stage 4.The results of the surveys conducted during the systematic field assessment have been reported, but have not yet been published. In the present report they have been integrated with the results of Stages 1, 2, and 4.
2.3 Invasive underwater investigation (Stage 4)
2.3.1 Introduction
The dredger necessary to conduct Stage 4, the invasive underwater investigation, was available for only three weeks. Since it would take circa one week to remove non-relevant superimposed layers (the so-called overburden), this left only circa two weeks for actual research. The limited time available made prioritisation essential. In view of the pioneering nature of the research project it was decided to select locations that had produced unambiguous archaeological indicators, such as flint and bone in core samples, as targets for the invasive underwater investigation. The nature of the material encountered in archaeological samples from the (top of the) river-dune deposits of the Delwijnen Member (Boxtel Formation) in Target zone West led to a decision to limit dredger-based invasive research to this part of the planning area. Practical considerations also influenced the decision: Target zone East was fairly close to the Euromax Terminal quay, which would have made invasive underwater investigation on that location impractical. Instead, further information on Target zone East was generated by processing the geoarchaeological data gathered during the previous research stages (Smit 2011).On the basis of identified unambiguous archaeological indicators in the core samples as well as the 3D model of the Late Pleistocene and Early Holocene subsoil, three

42
locations within Target zone West were ultimately selected for invasive underwater investigation (Fig. 2.11): the locations of Core B37A0676/W-07, Core B37A0673/W-04, and Core B37A0698/W-29.The invasive underwater investigation were guided by an updated, detailed geological 3D stratigraphic model which specifically focussed on the research area (Fig. 3.1). This revised model was based on data generated during the previous research stages in Target zone West (seismic, cone penetration tests, and core sampling). Detailed surveying previously established the depth of the river-dune top, which formed the main starting point for the invasive underwater investigation.
Archaeological research in Target zone West took place by the end of 2011 (Archis project registration number 48954) and was conducted in accordance with a Design Brief (Smit 2011) drafted by the Cultural Heritage Agency of the Netherlands. It should be noted here that this archaeological research project did not constitute an archaeological excavation as defined in the Dutch Archaeology Quality Standard, but rather a controlled and intensive sampling of river-dune deposits. Despite exceptional local conditions and the pioneering character of the research project the aim was nonetheless to proceed as much as possible in accordance with specifications OS01 ‘Project Plan Excavation’, OS02 ‘Main grid, extrapolated grid, fixed asl datum point’, OS04 ‘Find and sample retrieval and recording’, OS06 ‘Recording elevations of levels, features and/or finds’, OS09 ‘Daily and weekly logs’, OS10 ‘Find and sample processing’, OS11 ‘Packaging and temporary storage finds and samples’, OS12 ‘Post-fieldwork assessment report – find and sample assessment’, and OS13 ‘Find and sample selection/disposal and destruction of non-selected finds and samples/selection report’ as laid down in Protocol 4004 ‘Excavation’, laid down in the Quality Norm Dutch Archaeology, Version 3.2, issued by the Committee for Archaeological Quality.
2.3.2 Fieldwork
The invasive underwater investigation in Target zone West was carried out from October 27 to November 9, 2011 (Figs 2.12 and 2.13) and encompassed three trenches: Trench 1 at the location of Core B37A0676/W-07, Trench 2 at the location of Core B37A0673/W-04, and Trench 3 at the location of Core B37A0698/W-29. The systematic field assessment (Stage 3) previously revealed that the river dune in Target zone West in fact consisted of two SW-NE oriented ridges, one in the south-east and a second, slightly lower ridge in the north-west (Fig. 2.11), the two ridges being separated by a depression. The southeastern ridge was originally higher, but had been topped off by subsequent erosion. Trench 1, on the northwestern slope of the southeastern ridge, measured circa 9 x 18m (circa 145m2). Its corner coordinates were 61.332/443.903, 61.342/443.918, 61.346/443.916, 61.348/443.911, 61.341/443.900, and 61.336/443.901. Trench 1 was oriented NE-SW and followed the contours of the river-dune slope. In Core B37A0676/W-07, the intact humic top of the river dune (Soil horizon A) was encountered at a depth of 19.88m - asl. Trench 2, on the southeastern slope of the northwestern ridge and at a distance of circa 50m from Trench 1, measured circa 12 x 14m (circa 153m2). Its corner coordinates were 61.290/443.887, 61.301/443.894, 61.305/443.888, 61.305/443.883, and 61.295/443.877. Trench 2 was also oriented NE-SW, but its main axis was perpendicular to that of the river dune. In Core B37A0673/W-04, the intact humic top of the river dune (Soil horizon A) was encountered at a depth of 18.68m - asl. Trench 3, on the top of the southeastern ridge, consisted of four separate squares of circa 2 x 5m. The corner coordinates of the area encompassing the four squares were 61.297/443.834, 61.306/443.834, 61.306/443.826, and 61.297/443.826 (total area circa 76m2). The distance between Trenches 2 and 3 was circa 55m. In Core B37A0698/W-29, erosion had obliterated the humic top of the river dune (Soil horizon A). However, the river-dune deposits in the same core contained archaeological indicators (Soil horizon C), starting at a depth of 18.62m - asl. Fig 2.14 shows the position of the three trenches.
Stage 4 consisted of a controlled and intensive sampling of river-dune deposits, facilitated by the dredger Triton, owned by Boskalis and borrowed for the occasion by contractor PUMA. The Triton is a pontoon with spud poles and a fixed crane. A tug boat, the Joko VI, manoeuvred the Triton into the desired position, where the spud poles were sunk down

43
Fig. 2.11. Situation of the three locations selected for invasive underwater investigation (Stage 4), relative to previous coring locations (Stage 3) in Target zone West, plotted onto the surveyed top of the Late Pleistocene and Early Holocene sands (fluviatile and river-dune deposits).
!(!(
!(
!(
!(
!
!(
!(
!(
!(!(
!(
!(
!(
!(
!(
!(!(
!(
!(
!(
!(
!(
!( !(
!(
!(
!(!(
((
(Trench 2
Trench 1
Trench 3B37A0698/W-29
B37A0676/W-07B37A0673/W-04
61.200
61.200
61.300
61.300
61.400
61.400
61.500
61.500
61.600
61.600443.
500
443.
500
443.
600
443.
600
443.
700
443.
700
443.
800
443.
800
443.
900
443.
900
444.
000
444.
000
444.
100
444.
100
Map: Municipality of Rotterdam 20131:3000Scale
0 50 m
Afb. 2.11. Ligging van de drie locaties, die geselecteerd waren voor de uitvoer van het gravend onderzoek (fase 4), ten opzichte van de eerder gezette boringen (fase 3) in selectiegebied West. Als ondergrond is de gekarteerde top van het laatpleistocene en vroegholocene zandoppervlak (fluviatiele- en rivierduinafzettingen) afgebeeld.
´
!( Coring (Stage 3)
Trench (Stage 4)
Target zone West
Planning area
Depth top sand in m - asl
!!
< 18.50
18.75 - 18.50
19.00 - 18.75
19.25 - 19.00
19.50 - 19.25
19.75 - 19.50
20.00 - 19.75
20.25 - 20.00
20.50 - 20.25
20.75 - 20.50
21.00 - 20.75
21.25 - 21.00
21.50 - 21.25
> 21.50

44
Fig. 2.12. Impression of the invasive underwater investigation (Stage 4) in the Yangtze harbour, carried out on board the dredger Triton.
Fig. 2.13. Detail of fieldwork in progress.
and fixated the vessel’s position. The Triton’s crane rotates relative to the ship around a slewing unit, while the jib can be raised or lowered. The crane grab is controlled by a combination of these two movements. The grab itself is suspended from the top of the jib by two lines, one for hoisting and one for closing the grab. When the grab is open, the hoist line, which carries the weight, is taut while the jib guy-line is relatively slack. The grab is lowered to just above the desired horizontal position. After a brief pause to allow the grab to loose speed it is lowered further into an exactly horizontal position. Both cables are slackened until the grab has sunk down into the seabed to the desired depth. By pulling the jib guy-line, the grab will first close and then be lifted up. At that stage the hoist line is relatively slack while the jib guy-line tautens.The ‘excavations’ in Target zone West used a horizontal level-cut clamshell grab with a 2 x 5m footprint in open position (Fig. 2.15). The grab’s construction enables its two clams to close horizontally at the same depth when the jib guy-line is pulled. A grab of this type is commonly used to remove the bottom silt of polluted waters. In the field it turned out that the horizontal level-cut clamshell grab could slice off circa 20cm-thick layers of circa 2 x 5m, with lengthwise a slight overlap (see Section 2.5). It should be noted here that before the invasive underwater investigation began, the grab’s footprint in open position was assumed to be 2 x 3m (Smit 2011). Once in the field, however, it

45
Trench 2
Trench 1
Trench 3
1
2
34
56
78
910
11
12
13
14
1516
171819
2021
22
232425
2627
28
2930
3132
3334
3536
3738
61.300
61.300
61.325
61.325
61.350
61.350
443.
825
443.
825
443.
850
443.
850
443.
875
443.
875
443.
900
443.
900
443.
925
443.
925
Map: Municipality of Rotterdam 20131:500Scale
0 15 m
Afb. 2.14. Ligging van de drie putten (inclusief vakken), geprojecteerd op de bathymetrische opname van de havenbodem na afloop van het gravend onderzoek (de zogenaamde uitpeiling). Duidelijk zichtbaar is de overlap tussen de verschillende vakken die is ontstaan als gevolg van de 2 m bij 5 m footprint van de vlakgrijper in geopende stand.
< 17.50
17.75 - 17.50
18.00 - 17.75
18.25 - 18.00
18.50 - 18.25
18.75 - 18.50
19.00 - 18.75
19.25 - 19.00
19.50 - 19.25
19.75 - 19.50
20.00 - 19.75
20.25 - 20.00
20.50 - 20.25
20.75 - 20.50
21.00 - 20.75
21.25 - 21.00
> 21.25
Trench
Sampled batch
´
Depth harbour floor in m - asl
Fig. 2.14. Location of the three trenches (including batches), projected on the bathymetric reading of the harbour floor at the completion of the invasive underwater investigation. The overlap between the batches, that was caused by the 2 x 5m footprint of the grab (open position) is clearly visible.

46
proved to be larger, with the result that the location and size of the ‘excavated’ sections within the three trenches deviated from what was originally planned (see Section 2.5).
Fieldwork proceeded in the following stages:- Before fieldwork began, Port of Rotterdam Authority took detailed bathymetric
images of the original harbour floor in the entire research area, using a multibeam echo-sounder. These images served to produce a revised detailed geological 3D model of Target zone West.
- At the location of Trenches 1 and 2, the topsoil, the so-called overburden, was removed to a depth of circa 0.75m above the top of the river-dune deposits. A safety margin of 0.75m was necessary, because the depth of the top of the deposits had been estimated on the basis of 3D models, with a margin of error. Topsoil removal took into account the slope that would form as the trenches became deeper. At the level of the original harbour floor, Trench 1 measured circa 24 x 32m and Trench 2 circa 26 x 28m. No topsoil was removed over Trench 3 because, due to erosion, the river-dune deposits at that trench might occur directly below the harbour floor.
- After the topsoil had been removed Port of Rotterdam Authority took new bathymetric readings of the newly exposed harbour floor.
- Archaeological fieldwork began after bathymetric imaging was completed. Each trench was excavated in 2 x 3m sections with a lengthwise overlap between sections, a consequence of the 2 x 5m footprint of the level-cut clamshell grab in open position (Figure 2.14 clearly shows the overlap). Each section was deepened in 20cm-thick layers, the so-called batches. Trench 1 encompassed sixteen sections and Trench 2 eighteen, while Trench 3 consisted of four (separate) sections. Four batches of each section in Trench 1 were sampled. In Trench 2, the archaeologically relevant level was thicker than in Trench 1; consequently at least four but sometimes five relevant batches from each section were sampled in Trench 2. It was decided to limit excavations at Trench 3 to as much time as the schedule might allow after work on the other trenches was completed. As a result only three batches were sampled from each section in Trench 3.
According to the original plan, Trench 3 should have consisted of four contiguous sections centred on Core B37A0698/W-29. In the field, however, it proved to be extremely difficult to distinguish the superimposed marine sand from the river-dune deposits (which showed no soil formation). As a result the river-dune deposits were partially removed without being sampled. After a telephone consultation with P.C. Vos from Deltares a decision was made to lay out four new sections around the borehole and to sample the river-dune deposits after all (Fig. 2.14).- According to the original plan the central National Grid coordinates and the elevation
asl of each soil sample, relevant or not, were to be manually entered into the computer on board the dredger Triton (Fig. 2.16). Unfortunately, due to a software problem this was only done for the first day of fieldwork (i.e. 27 October 2011), but not for the other days. However, automated computer logs, daily bathymetric images, and daily field logs enabled PUMA and Port of Rotterdam Authority to reconstruct the position of the various soil samples (see Section 2.5).
- Once the horizontal level-cut clamshell grab had taken a 2 x 5m soil sample (thickness 20cm) it was placed on a second pontoon moored alongside theTriton and inspected by one of BOOR’s archaeologists (Fig. 2.17). If no river-dune deposits were encountered in the soil sample, the sample was not kept but dumped into a holding tank alongside the dredger. If on the other hand a sample was found to contain river-dune sand it was dumped instead into a container on board the second pontoon (Fig. 2.18).
- The archaeologically relevant level in some of the soil samples dumped into the container on board the second pontoon was sampled manually for botanical analysis (5-litre samples; see Fig. 2.19). This was only done for material from the Trenches 1 and 2, as only these contained intact river-dune deposits. Since the soil samples taken by the horizontal level-cut clamshell grab were almost always mixed, these 5-litre samples, taken from ‘clean’ river-dune sand, represented an attempt to prevent pollution by other sediments. In total, 68 botanical samples were collected (Appendix 2.3).
- On the second pontoon, a backhoe with a small hydraulic grab then filled two bulk bags of equal volume, A and B, for each soil sample (Figs 2.20 and 2.21). Theoretically each bulk bag contained 0.6m3 of soil, since the assumption prior to the

47
Fig. 2.15. The horizontal level-cut clamshell grab, with a 2 x 5m footprint in open position, that was used during the invasive underwater investigation.
Fig. 2.16. Fieldwork could be followed ‘live’ on board the dredger Triton via computer. Shown here is the excavation of Trench 3 on November 9, 2011.
Fig. 2.17. Soil samples were assessed on board a second pontoon moored alongside the Triton.
Fig. 2.18 If river-dune deposits were encountered in a soil sample, it was dumped into a container on board the pontoon.
Fig. 2.19. In total, 68 botanical samples of the ‘clean’ river-dune sand were taken manually.
Fig. 2.20. A backhoe with a small hydraulic grab scooped the soil sample out of the container.

48
Fig. 2.21. The backhoe divided the soil from the container over two bulk bags, A and B.
Fig. 2.22. The Manitou, a crane with a long hydraulic jib, moved the bulk bags to the back of the pontoon moored alongside the Triton.
Fig. 2.23. At the end of each working day the dredger Triton unloaded the bulk bags onto the quay.
Fig. 2.24. The invasive underwater investigation resulted in a total of 316 bulk bags.
49
start of the fieldwork was that each soil sample would derive from a 2 x 3m, 20cm-thick batch (i.e. 1.2 m3). The reality in the field was that a level-cut clamshell grab with a 2 x 5m footprint in open position brings up circa 1.8-2.0m3 of soil, or circa 0.9-1.0m3 per bulk bag.
Moreover, the volume of the soil samples was highly variable, probably due to the presence of the Basal Peat (Nieuwkoop Formation) in the subsoil. The horizontal level-cut clamshell grab had great difficulty in penetrating this very dense peat layer. In Trench 2 it was even necessary to break up the peat layer first, using a so-called orange-peel grab. The total number of collected bulk bags amounted to 316 (Appendix 2.3).- A so-called Manitou, a crane with a long hydraulic jib (Fig. 2.22), then moved the bulk
bags to the other side of the second pontoon.- Finally the now empty container was rinsed out with sea water scooped out of the
Yangtze harbour by the large level-cut clamshell grab, and prepared for the next soil sample.
- During Stage 4, Port of Rotterdam Authority used the multibeam echo-sounder to produce new bathymetric images of the freshly exposed underwater surface every day, or one day later in case of a non-working day.
- At the end of each working day, the bulk bags on the second pontoon were brought ashore and unloaded onto the quay, near the soil sieving device (Fig. 2.23).
- After the completion of the invasive underwater investigation, Port of Rotterdam Authority produced new bathymetric images, the so-called out-survey.
The research project in Target zone West was the result of a successful cooperation between contractor PUMA and BOOR. Participating on behalf of PUMA were H. Banning (chief sand division), E.A. Landman (chief surveyor) and G.W. Bloemendal (foreman), the latter also functioning as contact person during fieldwork. Work on board the dredger Triton and the pontoon was carried out by J. van der Panne (skipper of the Triton), F. Zeverboom (crane driver of the Triton), J. van Wijk (skipper of the Joko VI), H. Vitali (crew member Joko VI), J. Juffermans (crane driver), W. Kalkman (crane driver), and B. Rottier (navvy), all PUMA employees or persons contracted by PUMA.Participating in archaeological fieldwork on behalf of BOOR were W. Zijl (KNA-registered archaeologist) and D.E.A. Schiltmans (senior surveyor). On behalf of Port of Rotterdam Authority, the commissioning body, the research project was supervised by W.G. Borst (project director Monitoring Construction Impact Maasvlakte 2) and A. de Pagter (contract manager Maasvlakte 2). Participating on behalf of the Cultural Heritage Agency of the Netherlands, which acted as competent authority in this project, were A.D.C. Otte-Klomp (senior employee Maritime Projects), B.I. Smit (senior researcher Early Prehistory - Holocene) and H.J.T. Weerts (senior researcher Physical Geography and Palaeogeography). Project director was D.E.A. Schiltmans of BOOR.
2.3.3 Sieving the bulk bags
All 316 collected bulk bags were transported from the quay to a soil sieving device, circa 300m from the quay, and temporarily stored there (Fig. 2.24). The sieving device consisted of two so-called ‘Lutter’ sieves (Fig. 2.25), a large (1.6 x 1.6) bulk-sieving contraption with 10mm mesh size that operates on the basis of the dish-washer principle (Fig. 2.26). ADC ArcheoProjecten owned one ‘Lutter’ sieve and leased the other for the duration of the project from archaeology company VUhbs, Amsterdam. A second, smaller sieve with 2mm mesh size was placed at the rinse water outlet behind each ‘Lutter’ sieve (Fig. 2.27). As a result each bulk bag would in theory yield two types of residue: one large 10mm residue and one smaller 2mm residue. The sieving process used sea water pumped up from the Yangtze harbour by a submersible pump with a 10mm-mesh size filter attached. Sieving the contents of the bulk bags was initially hampered by the presence of large lumps of peat and pieces of wood. After consultation with the Cultural Heritage Agency of the Netherlands it was decided to remove the lumps manually after visual inspection. The (larger) pieces of wood were inspected on the ‘Lutter’ sieve for the presence of traces of working. Overall the sieving process continued without serious problems from November 1 to December 22, 2011.Initially only the A bags of each soil sample were sieved. The large amount of archaeological material encountered in the sieve residues, however, necessitated

50
Fig. 2.25. The contents of the bulk bags were sieved using two large ‘Lutter’ sieves with a mesh size of 10mm.
Fig. 2.26. Detail of a soil sample on one of the ‘Lutter’ sieves. The lumps are some of the many peat fragments that were left on the mesh after sieving each batch.
Fig. 2.27. A second, smaller sieve with a 2mm mesh size was placed at the rinse water outlet of the ‘Lutter’ sieve.
Fig. 2.28. The 10mm and 2mm-sieve residues were dried on site in a specially equipped container.
51
renewed consultation with the Cultural Heritage Agency of the Netherlands and Port of Rotterdam Authority, after which it was decided to sieve all B bags as well. This means that all 316 bulk bags were sieved, using sieves with 10mm and 2mm-mesh sizes.During the sieving process ADC ArcheoProjecten also took wet, 1-litre samples of the 2mm residues for the benefit of specialist analyses. A total of 150 1-litre samples were collected (Appendix 2.3). These samples were not dried, unlike all other 10mm and 2mm-sieve residues, which were dried on site using a container specially equipped for the purpose (Fig. 2.28). In this so-called drying shed, minimum temperatures were kept at 30º C and maximum humidity levels at 50%. The dried sieve residues were bagged separately and transferred to the premises of BOOR for further processing. In total, the sieving process resulted in 334 find bags of 10mm-sieve residue and 365 find bags of 2mm-sieve residue. Because some soil samples produced a large amount of sieve residue the total number of residue bags exceeds the number of original bulk bags.
Bulk bag sieving was carried out by ADC ArcheoProjecten. Supervisor was W.B. Waldus, while C. van den Burgt (ADC ArcheoProjecten) and M. van den Berg (Alef Archeowerk) in addition to other tasks operated the sieves, assisted by G. Snoei (crane driver) of Verkade Vlaardingen.
2.3.4 Inspecting the sieve residues
More or less simultaneously with the sieving process, BOOR inspected all sieve residues for the presence of archaeological indicators such as charcoal, bone, flint, fish remains, wood, seeds, and stone (Figs 2.29 and 2.30). A number of sieve residues were still slightly damp upon arrival and required extra drying. In addition, a large number of sieve residues were sieved once more, this time at a mesh size of 0.5mm. This removed fine sand from the residues, improving the visibility of any archaeological indicators present in the process.
The original Design Brief prescribed a so-called evaluation of sieve residues for the presence of archaeological indicators (Smit 2011), a process estimated to take 2 hours per bulk bag (both 10mm and 2mm residues), and also required an estimation of the number of finds per find category. However, sorting the sieve residues took less time than expected. After consultation with the Cultural Heritage Agency of the Netherlands and Port of Rotterdam Authority it was therefore decided to do a complete scan of all sieve residues for all archaeological indicators. Archaeological indicators were collected, counted and bagged by category, with 10mm and 2mm-residue finds being bagged separately. All assigned find inventory numbers matched the associated sample numbers. At this stage archaeological indicators were not yet weighed or identified in more detail.Responsible for inspecting the sieve residues for archaeological indicators and for processing the encountered material were A. van de Meer (surveyor Ma, BOOR), I.B. Koop (volunteer), W. Zijl (KNA-registered archaeologist, BOOR), R.D. van Dijk (senior field technician, BOOR), M. Dikstra (volunteer), G.F.H.M. Kempenaar (senior field technician, BOOR), and G. Kooiman (intern). In charge of the entire process was D.E.A. Schiltmans (senior surveyor, BOOR).
2.4 Processing
2.4.1 Introduction
After the completion of Stage 4 the (digital) administration was checked and when necessary corrected and/or supplemented. All inspected sieve residues were temporarily stored on the premises of BOOR. Archaeological material retrieved from the core samples (Stage 3) and the 10mm and 2mm-sieve residues (Stage 4) was packaged per find category and then also temporarily stored at BOOR.After the completion of basic find and data processing and the presentation of the results in an post-fieldwork assessment report (Schiltmans 2012b) a brainstorm session took place on March 13, 2012. The purpose of the session was, on the one hand, to inform specialists about the project’s status quo and its preliminary results; and, on the other

52
Fig. 2.30. The inspection of the sieve residues resulted in a large number of archaeological indicators. To the right of the hand a large quantity of burnt bone.
Fig. 2.29. Dried sieve residue being sorted at BOOR.
hand, to consult with the organisations present on the drafting of a Design Brief for further analysis and reporting. Participants in the session were a number of specialists; the commissioning body (Port of Rotterdam Authority); the competent authority (Cultural Heritage Agency of the Netherlands), and BOOR and Deltares, the two executive organisations involved in the Yangtze Harbour research project. The brainstorm session resulted in a large number of proposals by the various specialists for further data and find processing and analysis (Kooistra and Kubiak-Martens 2012; Niekus 2012; Vos 2012; Zeiler 2012).On the basis of these results, the Cultural Heritage Agency of the Netherlands, as competent authority, drafted a Design Brief stipulating the requirements for integrated data and find processing and reporting during the project’s Stages 3 and 4 (Smit 2012). Rotterdam municipal archaeological service (BOOR) and Deltares subsequently drafted a Project Plan (Moree et al. 2012), which was a practical translation of the requirements imposed by the Design Brief. All integrated find and data processing and reporting during the Yangtze Harbour research project was carried out in accordance with both the Design Brief and the Project Plan. Project director was D.E.A. Schiltmans (senior surveyor, BOOR). General project manager was M.M. Sier (senior KNA-registered archaeologist, BOOR).
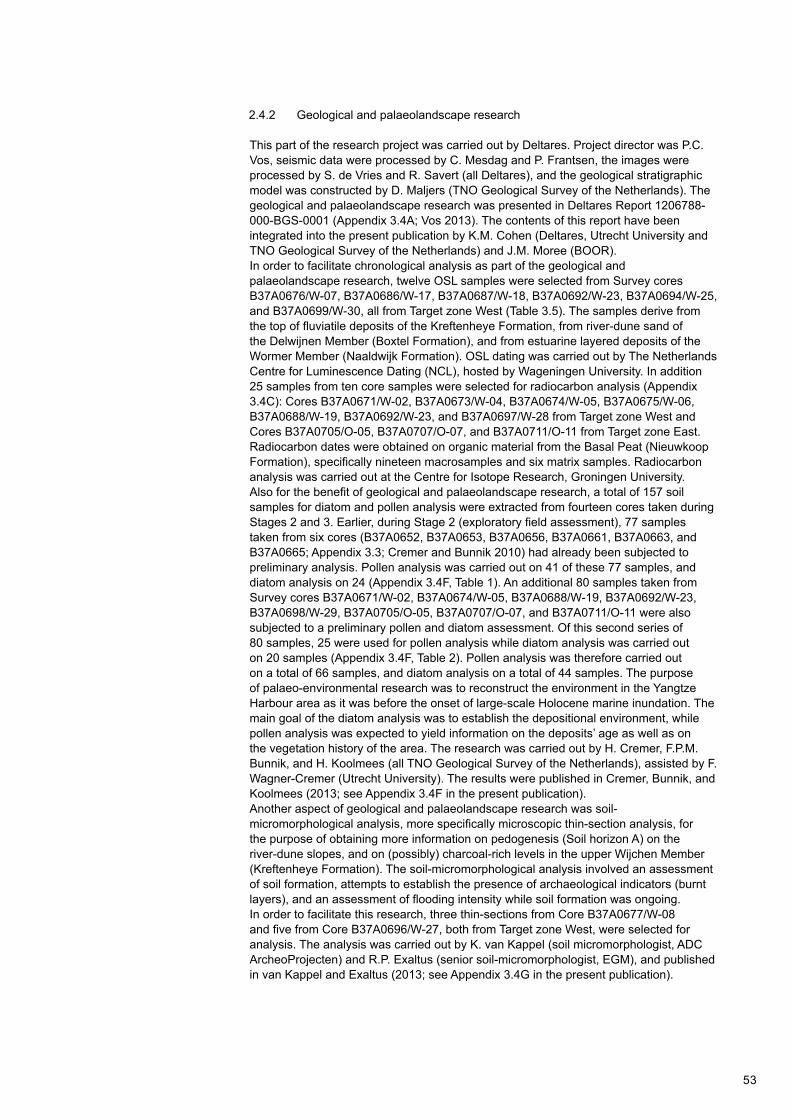
53
2.4.2 Geological and palaeolandscape research
This part of the research project was carried out by Deltares. Project director was P.C. Vos, seismic data were processed by C. Mesdag and P. Frantsen, the images were processed by S. de Vries and R. Savert (all Deltares), and the geological stratigraphic model was constructed by D. Maljers (TNO Geological Survey of the Netherlands). The geological and palaeolandscape research was presented in Deltares Report 1206788-000-BGS-0001 (Appendix 3.4A; Vos 2013). The contents of this report have been integrated into the present publication by K.M. Cohen (Deltares, Utrecht University and TNO Geological Survey of the Netherlands) and J.M. Moree (BOOR).In order to facilitate chronological analysis as part of the geological and palaeolandscape research, twelve OSL samples were selected from Survey cores B37A0676/W-07, B37A0686/W-17, B37A0687/W-18, B37A0692/W-23, B37A0694/W-25, and B37A0699/W-30, all from Target zone West (Table 3.5). The samples derive from the top of fluviatile deposits of the Kreftenheye Formation, from river-dune sand of the Delwijnen Member (Boxtel Formation), and from estuarine layered deposits of the Wormer Member (Naaldwijk Formation). OSL dating was carried out by The Netherlands Centre for Luminescence Dating (NCL), hosted by Wageningen University. In addition 25 samples from ten core samples were selected for radiocarbon analysis (Appendix 3.4C): Cores B37A0671/W-02, B37A0673/W-04, B37A0674/W-05, B37A0675/W-06, B37A0688/W-19, B37A0692/W-23, and B37A0697/W-28 from Target zone West and Cores B37A0705/O-05, B37A0707/O-07, and B37A0711/O-11 from Target zone East. Radiocarbon dates were obtained on organic material from the Basal Peat (Nieuwkoop Formation), specifically nineteen macrosamples and six matrix samples. Radiocarbon analysis was carried out at the Centre for Isotope Research, Groningen University.Also for the benefit of geological and palaeolandscape research, a total of 157 soil samples for diatom and pollen analysis were extracted from fourteen cores taken during Stages 2 and 3. Earlier, during Stage 2 (exploratory field assessment), 77 samples taken from six cores (B37A0652, B37A0653, B37A0656, B37A0661, B37A0663, and B37A0665; Appendix 3.3; Cremer and Bunnik 2010) had already been subjected to preliminary analysis. Pollen analysis was carried out on 41 of these 77 samples, and diatom analysis on 24 (Appendix 3.4F, Table 1). An additional 80 samples taken from Survey cores B37A0671/W-02, B37A0674/W-05, B37A0688/W-19, B37A0692/W-23, B37A0698/W-29, B37A0705/O-05, B37A0707/O-07, and B37A0711/O-11 were also subjected to a preliminary pollen and diatom assessment. Of this second series of 80 samples, 25 were used for pollen analysis while diatom analysis was carried out on 20 samples (Appendix 3.4F, Table 2). Pollen analysis was therefore carried out on a total of 66 samples, and diatom analysis on a total of 44 samples. The purpose of palaeo-environmental research was to reconstruct the environment in the Yangtze Harbour area as it was before the onset of large-scale Holocene marine inundation. The main goal of the diatom analysis was to establish the depositional environment, while pollen analysis was expected to yield information on the deposits’ age as well as on the vegetation history of the area. The research was carried out by H. Cremer, F.P.M. Bunnik, and H. Koolmees (all TNO Geological Survey of the Netherlands), assisted by F. Wagner-Cremer (Utrecht University). The results were published in Cremer, Bunnik, and Koolmees (2013; see Appendix 3.4F in the present publication).Another aspect of geological and palaeolandscape research was soil-micromorphological analysis, more specifically microscopic thin-section analysis, for the purpose of obtaining more information on pedogenesis (Soil horizon A) on the river-dune slopes, and on (possibly) charcoal-rich levels in the upper Wijchen Member (Kreftenheye Formation). The soil-micromorphological analysis involved an assessment of soil formation, attempts to establish the presence of archaeological indicators (burnt layers), and an assessment of flooding intensity while soil formation was ongoing. In order to facilitate this research, three thin-sections from Core B37A0677/W-08 and five from Core B37A0696/W-27, both from Target zone West, were selected for analysis. The analysis was carried out by K. van Kappel (soil micromorphologist, ADC ArcheoProjecten) and R.P. Exaltus (senior soil-micromorphologist, EGM), and published in van Kappel and Exaltus (2013; see Appendix 3.4G in the present publication).
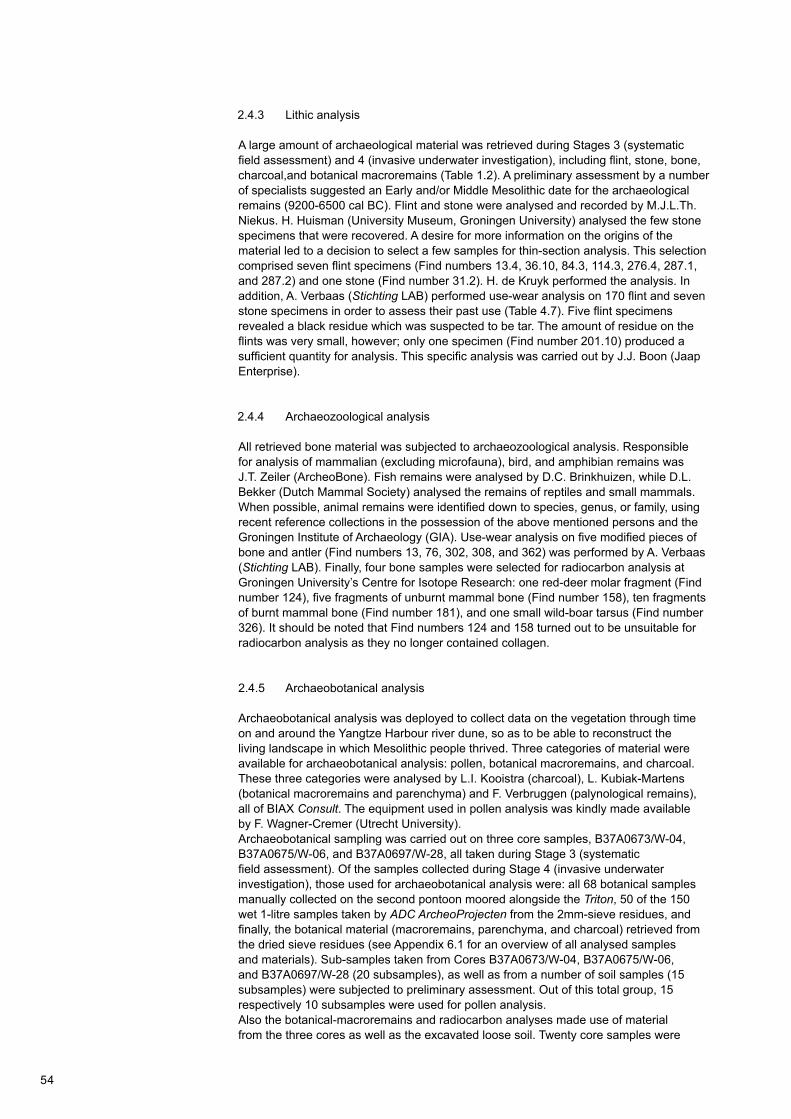
54
2.4.3 Lithic analysis
A large amount of archaeological material was retrieved during Stages 3 (systematic field assessment) and 4 (invasive underwater investigation), including flint, stone, bone, charcoal,and botanical macroremains (Table 1.2). A preliminary assessment by a number of specialists suggested an Early and/or Middle Mesolithic date for the archaeological remains (9200-6500 cal BC). Flint and stone were analysed and recorded by M.J.L.Th. Niekus. H. Huisman (University Museum, Groningen University) analysed the few stone specimens that were recovered. A desire for more information on the origins of the material led to a decision to select a few samples for thin-section analysis. This selection comprised seven flint specimens (Find numbers 13.4, 36.10, 84.3, 114.3, 276.4, 287.1, and 287.2) and one stone (Find number 31.2). H. de Kruyk performed the analysis. In addition, A. Verbaas (Stichting LAB) performed use-wear analysis on 170 flint and seven stone specimens in order to assess their past use (Table 4.7). Five flint specimens revealed a black residue which was suspected to be tar. The amount of residue on the flints was very small, however; only one specimen (Find number 201.10) produced a sufficient quantity for analysis. This specific analysis was carried out by J.J. Boon (Jaap Enterprise).
2.4.4 Archaeozoological analysis
All retrieved bone material was subjected to archaeozoological analysis. Responsible for analysis of mammalian (excluding microfauna), bird, and amphibian remains was J.T. Zeiler (ArcheoBone). Fish remains were analysed by D.C. Brinkhuizen, while D.L. Bekker (Dutch Mammal Society) analysed the remains of reptiles and small mammals. When possible, animal remains were identified down to species, genus, or family, using recent reference collections in the possession of the above mentioned persons and the Groningen Institute of Archaeology (GIA). Use-wear analysis on five modified pieces of bone and antler (Find numbers 13, 76, 302, 308, and 362) was performed by A. Verbaas (Stichting LAB). Finally, four bone samples were selected for radiocarbon analysis at Groningen University’s Centre for Isotope Research: one red-deer molar fragment (Find number 124), five fragments of unburnt mammal bone (Find number 158), ten fragments of burnt mammal bone (Find number 181), and one small wild-boar tarsus (Find number 326). It should be noted that Find numbers 124 and 158 turned out to be unsuitable for radiocarbon analysis as they no longer contained collagen.
2.4.5 Archaeobotanical analysis
Archaeobotanical analysis was deployed to collect data on the vegetation through time on and around the Yangtze Harbour river dune, so as to be able to reconstruct the living landscape in which Mesolithic people thrived. Three categories of material were available for archaeobotanical analysis: pollen, botanical macroremains, and charcoal. These three categories were analysed by L.I. Kooistra (charcoal), L. Kubiak-Martens (botanical macroremains and parenchyma) and F. Verbruggen (palynological remains), all of BIAX Consult. The equipment used in pollen analysis was kindly made available by F. Wagner-Cremer (Utrecht University).Archaeobotanical sampling was carried out on three core samples, B37A0673/W-04, B37A0675/W-06, and B37A0697/W-28, all taken during Stage 3 (systematic field assessment). Of the samples collected during Stage 4 (invasive underwater investigation), those used for archaeobotanical analysis were: all 68 botanical samples manually collected on the second pontoon moored alongside the Triton, 50 of the 150 wet 1-litre samples taken by ADC ArcheoProjecten from the 2mm-sieve residues, and finally, the botanical material (macroremains, parenchyma, and charcoal) retrieved from the dried sieve residues (see Appendix 6.1 for an overview of all analysed samples and materials). Sub-samples taken from Cores B37A0673/W-04, B37A0675/W-06, and B37A0697/W-28 (20 subsamples), as well as from a number of soil samples (15 subsamples) were subjected to preliminary assessment. Out of this total group, 15 respectively 10 subsamples were used for pollen analysis.Also the botanical-macroremains and radiocarbon analyses made use of material from the three cores as well as the excavated loose soil. Twenty core samples were

55
subjected to macroremains analysis and five samples were selected for radiocarbon analysis at the Centre for Isotope Research, Groningen University. Of the 68 botanical samples, 20 were selected for further analysis and five for radiocarbon analysis. All 50 wet 1-litre samples were inspected for the presence of botanical macroremains and parenchyma, while also all material from the dried sieve residues was inspected; five radiocarbon samples were taken from the latter as well. Table 6.3 lists all radiocarbon samples.Charcoal analysis, involving circa 1000 charcoal fragments, focussed on material from the three trenches. The amount of charcoal turned out to be so large (especially the material from the dried sieve residues) that selection was necessary. Any charcoal fragments retrieved from dated core segments that had contributed pollen and botanical remains to the analysis were identified. Of the 68 botanical samples, the same five samples were selected for charcoal analysis that were also subjected to radiocarbon dating, botanical macroremains, and pollen analyses. Seven additional samples were inspected for the presence of charcoal. Since the botanical samples produced rather little charcoal and many of the fragments were unidentifiable, charcoal from the dried sieve residues was also included in the analysis.
2.5 Evaluation of applied field methods and techniques
2.5.1 Introduction
The final stage of every research project calls for an evaluation of the followed procedures. In this context it is important to realise that research such as that performed at the Yangtze harbour has never before been conducted in the Netherlands, or for that matter anywhere else in the world. The highly specific conditions in the area demanded a creative approach of available options and equipment. It was necessary to deploy tools and machines which are normally used in cleaning up polluted silts, not archaeological research. The size of the samples, the depth from which they had to be retrieved, and the fact that all operations had to proceed on board a vessel posed an extra challenge to all concerned. Despite a number of problems and surprises which arose in the process, the conclusion must be that the Yangtze Harbour research project ultimately produced some spectacular results. These results, however, do no obviate the need to take a close look at the project’s methods, and to draw lessons for the future.
Stage 4 was preceded on September 22, 2011 by a consultation/brainstorm session on the nature of the fieldwork and on excavation methods. Present at this session were representatives of Port of Rotterdam Authority, contractor PUMA, Rotterdam municipal archaeological service (BOOR), and the Cultural Heritage Agency of the Netherlands. On September 27, 2011 a second, smaller group of individuals convened to discuss strategy. Finally, on October 18 and 20, 2011 two kick-off meetings took place in which representatives of Port of Rotterdam Authority, PUMA, ADC ArcheoProjecten, BOOR, and the Cultural Heritage Agency of the Netherlands participated.These meetings were based on the premise that Stage 4 should be approached as a special form of environmental dredging. The central issue in environmental dredging operations is not productivity but accuracy. In order to achieve this, environmental dredging operations use a horizontal level-cut clamshell grab. For the purpose of Stage 4 in the Yangtze harbour, contractor PUMA advised the use of a grab with a 2 x 3m footprint in open position and equipped with a highly precise (with a circa 1 to 2cm margin) positioning system, both horizontally and vertically. All movements of the digging component (the grab) should be recorded in a process called data logging, which would afterwards allow a full review of the excavation process.
The following sections are based in part on contributions by W.G. Borst (project director Monitoring Construction Impact MV2, Port of Rotterdam Authority), E.A. Landman (chief surveyor, PUMA), and O.F.R. van Tongeren (Port of Rotterdam Authority).

56
2.5.2 Equipment-related deviations
The horizontal level-cut clamshell grab ultimately selected for the invasive underwater investigation in Target zone West had a 2 x 5m footprint in open position (Fig. 2.15), while the Project Plan had assumed a 2 x 3m footprint and the blueprint for the trenches was based on 2 x 3m sections. The fact that the footprint of the selected grab exceeded the planned dimensions caused a lengthwise overlap between adjoining sections (Fig. 2.14).In addition, the crane on the dredger Triton did not run along a rail system, which would have allowed it to move exactly parallel to the trenches and to position the grab per-pendicular to each trench’s long side. Instead, the crane rotated on the pontoon from a fixed position. As a result, dredging proceeded along an arc (Fig. 2.14).The potential effects of these two points – the larger footprint and the rotational opera-tion – were insufficiently anticipated. Furthermore, some equipment-related deviations only emerged after fieldwork – for which only two weeks had been reserved – had already begun, which left insufficient time to adapt the Stage 4 Project Plan (e.g. by altering the layout of the trenches or the order of excavation).
2.5.3 Oblique position of the grab
Unlike the usual procedure during environmental dredging operations, in which the soil often consists of unstable sediments, the peat of the Basal Peat (Nieuwkoop Formation) was too dense in places to allow the grab to penetrate (sufficiently). In Trench 2 it was even necessary to first break up the peat layer with a so-called orange-peel grab. The extreme density of the peat layer also occasionally forced the grab into an oblique position and consequently to dig along a sloping plane. In the processed daily bathymetric images this phenomenon was visible in views from above and in cross sections of the trenches (Figs 2.31 and 2.32). A shorter distance between the edge of the removed upper section and the short side of the surface exposed by the grab marks a location where the grab could not penetrate and/or slipped. Although the grab still closed horizontally, the surface it created was not horizontal. To illustrate this, imagine the grab as a stiff plank suspended above the centre of a 2 x 5m plane. The grab itself cannot be lowered relative to this point of suspension, but its corners can still alter position. If a given point cannot be lowered further and consequently remains in a high position relative to a fixed centre, the point diametrically opposite relative to the same fixed centre drops by a corresponding distance. This effect occurs in both diagonal directions. The aforementioned lengthwise overlap between adjoining sections forced the grab further into an oblique position (Section 2.5.2), because a surface exposed by the removal of each previous batch would be lower than a trench section where no batch had yet been removed. The result was that the trenches were excavated deeper at the centre than along the margins (Fig. 2.33).Another effect of the grab’s oblique position was that the trenches were not situated at their originally planned positions, either vertically or in orientation. Instead they were rotated as well as dug deeper along the long and short sides closest to the grab. This is the only viable explanation for the phenomenon visible in the daily bathymetric images and the associated cross sections of the trenches.
2.5.4 Data logging problems
An agreement drafted prior to Stage 4 listed the data to be recorded on board the dredger Triton, the so-called data-logging procedure. Basically, everything was to be logged, however, this ‘everything’ was left unspecified. The PUMA employees understood ‘everything’ to mean ‘everything that is customarily logged during environmental dredging operations’. Specifically, these were the following data:- The x and y coordinates of the top of the crane’s jib. These served as the central
coordinates of the grab’s bottom section, assuming the grab to be suspended perfectly vertically;
- The length of the hoist line and jib guy-line. This information was used to calculate the Z value of the grab’s lower centre;
- The position and orientation of the pontoon;- The direction and vertical angle of the crane’s jib;- Tidal data.
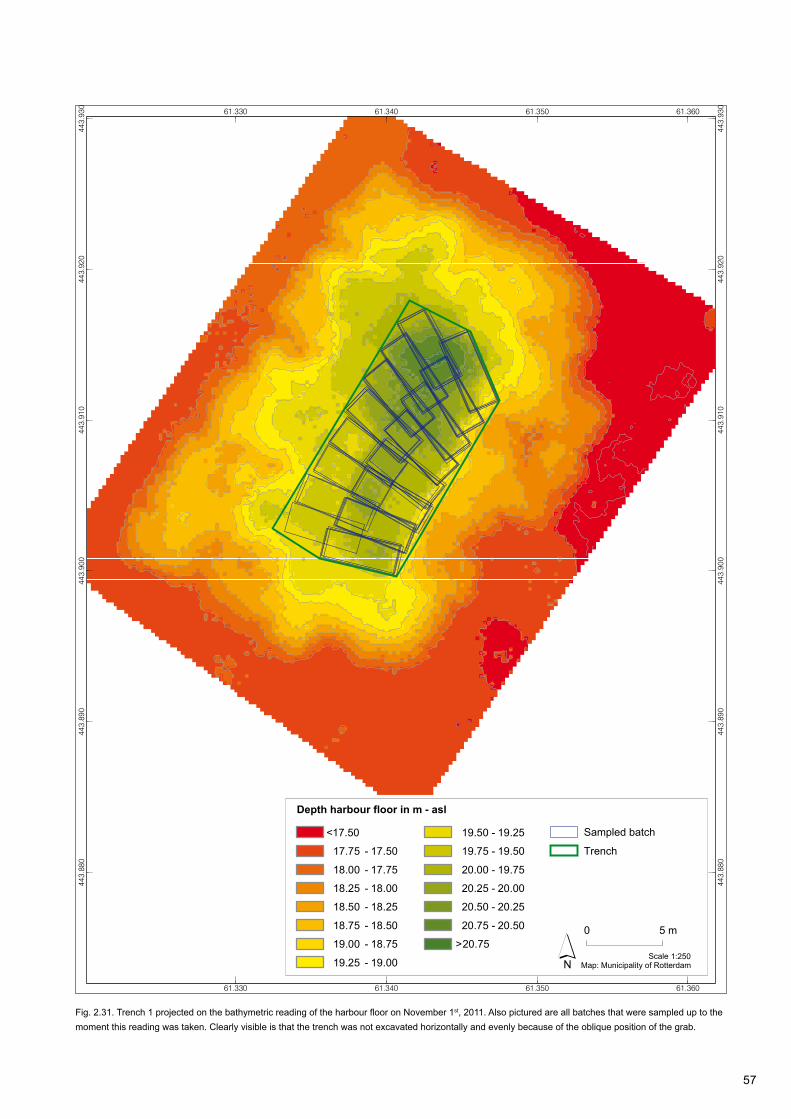
57
61.330
61.330
61.340
61.340
61.350
61.350
61.360
61.360
443.
880
443.
880
443.
890
443.
890
443.
900
443.
900
443.
910
443.
910
443.
920
443.
920
443.
930
443.
930
Map: Municipality of Rotterdam1:250Scale
0 5 m
< 17.50
17.75 - 17.50
18.00 - 17.75
18.25 - 18.00
18.50 - 18.25
18.75 - 18.50
19.00 - 18.75
19.25 - 19.00
19.50 - 19.25
19.75 - 19.50
20.00 - 19.75
20.25 - 20.00
20.50 - 20.25
20.75 - 20.50
> 20.75
Trench
Sampled batch
´
Depth harbour floor in m - asl
Fig. 2.31. Trench 1 projected on the bathymetric reading of the harbour floor on November 1st, 2011. Also pictured are all batches that were sampled up to the moment this reading was taken. Clearly visible is that the trench was not excavated horizontally and evenly because of the oblique position of the grab.
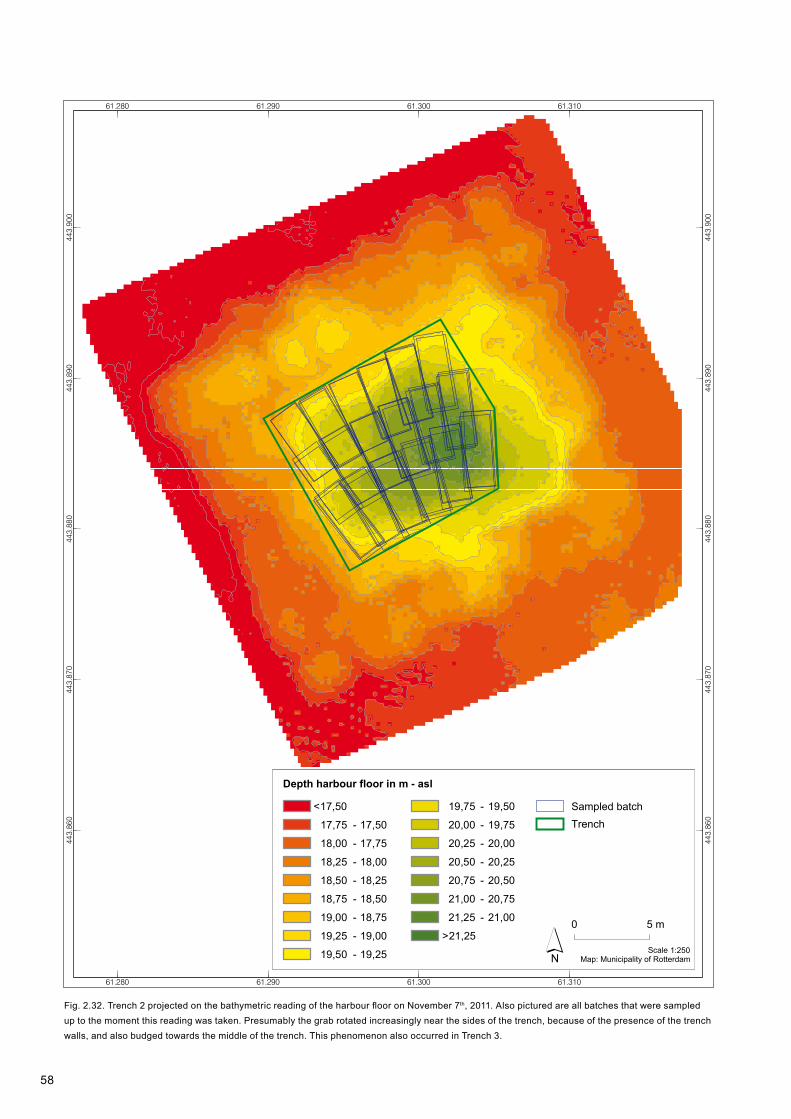
58
61.280
61.280
61.290
61.290
61.300
61.300
61.310
61.310
443.
860
443.
860
443.
870
443.
870
443.
880
443.
880
443.
890
443.
890
443.
900
443.
900
Kaart: Gemeente Rotterdam 20131:250Schaal
0 5 m
Afb. 2.32. Put 2 geprojecteerd op de bathymetrische opname van de havenbodem op 7 november 2011. Tevens afgebeeld zijn alle bemonsterde grepen die zijn uitgevoerd tot aan het moment van deze opname. Vermoedelijk is de grijper vooral aan de randen van de put, als gevolg van de aanwezigheid van de putwanden, in toenemende mate gedraaid en naar het midden van de put verplaatst. In put 3 is dit eveneens gebeurd.
Diepteligging havenbodem in m t.o.v. NAP
hoger dan -17,50
-17,75 tot -17,50
-18,00 tot -17,75
-18,25 tot -18,00
-18,50 tot -18,25
-18,75 tot -18,50
-19,00 tot -18,75
-19,25 tot -19,00
-19,50 tot -19,25
-19,75 tot -19,50
-20,00 tot -19,75
-20,25 tot -20,00
-20,50 tot -20,25
-20,75 tot -20,50
-21,00 tot -20,75
-21,25 tot -21,00
lager dan -21,25
put (fase 4)
bemonsterde grepen
´0 5 m
< 17,50
17,75 - 17,50
18,00 - 17,75
18,25 - 18,00
18,50 - 18,25
18,75 - 18,50
19,00 - 18,75
19,25 - 19,00
19,50 - 19,25
19,75 - 19,50
20,00 - 19,75
20,25 - 20,00
20,50 - 20,25
20,75 - 20,50
21,00 - 20,75
21,25 - 21,00
> 21,25 ´
Depth harbour floor in m - asl
TrenchSampled batch
Map: Municipality of Rotterdam1:250Scale
Fig. 2.32. Trench 2 projected on the bathymetric reading of the harbour floor on November 7th, 2011. Also pictured are all batches that were sampled up to the moment this reading was taken. Presumably the grab rotated increasingly near the sides of the trench, because of the presence of the trench walls, and also budged towards the middle of the trench. This phenomenon also occurred in Trench 3.
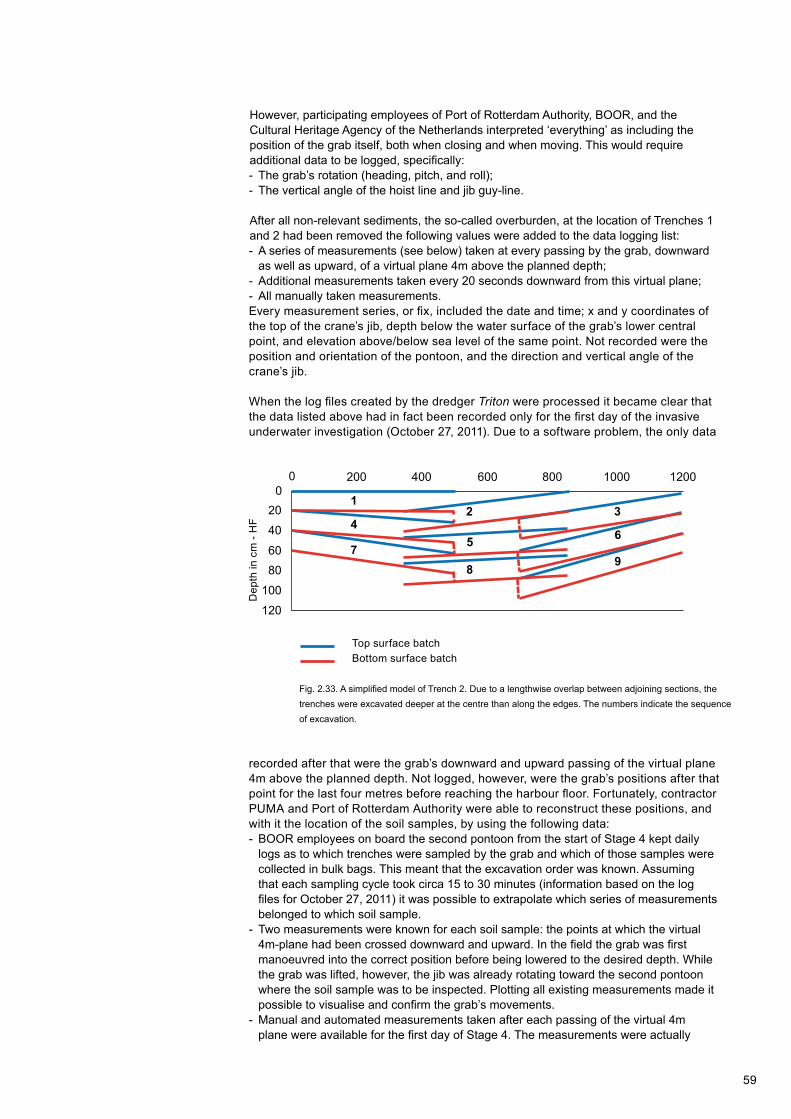
59
However, participating employees of Port of Rotterdam Authority, BOOR, and the Cultural Heritage Agency of the Netherlands interpreted ‘everything’ as including the position of the grab itself, both when closing and when moving. This would require additional data to be logged, specifically:- The grab’s rotation (heading, pitch, and roll);- The vertical angle of the hoist line and jib guy-line.
After all non-relevant sediments, the so-called overburden, at the location of Trenches 1 and 2 had been removed the following values were added to the data logging list:- A series of measurements (see below) taken at every passing by the grab, downward
as well as upward, of a virtual plane 4m above the planned depth;- Additional measurements taken every 20 seconds downward from this virtual plane;- All manually taken measurements.Every measurement series, or fix, included the date and time; x and y coordinates of the top of the crane’s jib, depth below the water surface of the grab’s lower central point, and elevation above/below sea level of the same point. Not recorded were the position and orientation of the pontoon, and the direction and vertical angle of the crane’s jib.
When the log files created by the dredger Triton were processed it became clear that the data listed above had in fact been recorded only for the first day of the invasive underwater investigation (October 27, 2011). Due to a software problem, the only data
020
40
6080
100
120
0 200 400 600 800 1000 12000
20
40
6080
100
120
0 200 400 600 800 1000 1200
Fig. 2.33. A simplified model of Trench 2. Due to a lengthwise overlap between adjoining sections, the trenches were excavated deeper at the centre than along the edges. The numbers indicate the sequence of excavation.
Top surface batchBottom surface batch
recorded after that were the grab’s downward and upward passing of the virtual plane 4m above the planned depth. Not logged, however, were the grab’s positions after that point for the last four metres before reaching the harbour floor. Fortunately, contractor PUMA and Port of Rotterdam Authority were able to reconstruct these positions, and with it the location of the soil samples, by using the following data:- BOOR employees on board the second pontoon from the start of Stage 4 kept daily
logs as to which trenches were sampled by the grab and which of those samples were collected in bulk bags. This meant that the excavation order was known. Assuming that each sampling cycle took circa 15 to 30 minutes (information based on the log files for October 27, 2011) it was possible to extrapolate which series of measurements belonged to which soil sample.
- Two measurements were known for each soil sample: the points at which the virtual 4m-plane had been crossed downward and upward. In the field the grab was first manoeuvred into the correct position before being lowered to the desired depth. While the grab was lifted, however, the jib was already rotating toward the second pontoon where the soil sample was to be inspected. Plotting all existing measurements made it possible to visualise and confirm the grab’s movements.
- Manual and automated measurements taken after each passing of the virtual 4m plane were available for the first day of Stage 4. The measurements were actually
Dep
th in
cm
- H
F
1
4
7
2
5
8
3
6
9

60
taken slightly less than 4m above the planned depth, since these were the first taken after passing the virtual plane. Values for measurements taken on Day 1 ranged from 3.83m to 4.00m (average 3.916m). The margin of error during excavation was circa 2 to 3cm, a considerably smaller margin than that of the depths which could be extrapolated on the basis of the measurements. Measurements plus 3.916m were only used as an additional check.
- After the removal of non-relevant layers of soil, Port of Rotterdam Authority produced bathymetric images of the newly exposed harbour floor. These served as a base line for the excavation model, using 20cm layers as offset (20cm, 40cm, 60cm, 80cm etc.) Because the level of accuracy of the excavation was circa 2 to 3cm, this theoretical depth was assumed to equal the actually excavated depth. This assumption was checked by using the logged depth plus 3.916m.
2.5.5 Recommendations
The issues mentioned above lead to the following recommendations for future archaeo-logical research under similar conditions.
EquipmentDecisions regarding equipment to be used in archaeological fieldwork should be unambiguous. If equipment nonetheless deviates from what was agreed upon, either the Project Plan or the research strategy should be adapted accordingly.Working within an orthogonal grid, which allows for parallel excavation trenches, is strongly recommended. In the case of the Yangtze Harbour project, excavation proceeded along an arc. This is not a problem as long as the crane that is used is hydraulic (with jib and boom) and equipped with a hydraulic horizontal level-cut clamshell grab that is manoeuvrable in all directions. It is not a problem either if that crane is mounted onto a pontoon, provided the jib is long enough to allow it to operate at the desired depth. However, hydraulic cranes with a hydraulically controlled horizontal level-cut clamshell grab are not widely available, as they are normally used only in environmental dredging operations. As operational depth increases, acquiring a suitable hydraulic crane may become difficult. A non-hydraulic crane can only operate within an orthogonal grid if it can move along a rail system parallel to the excavation plane, rather than being fixed onto a pontoon.
Oblique position of the grabUnlike situations involving a non-hydraulic crane, using a hydraulic crane equipped with a hydraulic horizontal level-cut clamshell grab, the grab’s position can be controlled in all directions. Provided data-logging procedures function properly, the position of the grab itself is exactly known. If (very) dense layers are expected in the subsoil, such as the Basal Peat (Nieuwkoop Formation) in the Yangtze harbour, anticipatory measures should be taken before operations begin. It is further recommended to use a greater margin when removing the so-called overburden, in order to prevent non-relevant topsoil from ending up in the excavation trench, for example due to collapse.
Data loggingIt is important that all parties involved are clear before fieldwork begins as to what specific data should be logged. This applies to ‘standard data’ as well as any ‘additional data’ that may be required. In addition, for an optimal review of the logged data it is recommended that the data can be ‘played back’, as it were, like a film. Another option would be to make continuous video recordings of the computer screen on board the dredger, in order to illustrate at some later stage how archaeological fieldwork was carried out. Furthermore, at the end of each day of fieldwork the data logs should be checked to see if everything functioned correctly that day. Backups, while important, are insufficient in themselves. Finally, meticulously kept daily excavation logs are essential. In the case of the invasive underwater investigation at the Yangtze Harbour research project the daily logs kept by BOOR employees proved to be crucial in the reconstruction of the grab’s positions, and by extension of the original locations of the soil samples.

61
2.5.6 The Yangtze Harbour research project in international perspective
Being able to trace and retrieve archaeological material at depths of circa 22m to 18m - asl, deep in the Early Holocene deposits on the bottom of the Yangtze harbour, is a spectacular achievement, and the approaches and results of the research which made it possible therefore deserve the attention of the international scientific community. This applies particularly to the following aspects of research:
GeologyCollecting information on the palaeolandscape is internationally regarded as an important tool for tracing subsoil archaeological remains. What is often overlooked, however, is that detailed knowledge of the geological subsoil is essential when constructing a palaeolandscape model. A phased research approach based on the local geology, such as the research carried out in the Yangtze Harbour planning area, may serve as an international example of how similar research might be conducted elsewhere. The geogenetic approach in itself is a universal method applicable everywhere in the world. Its specific implementation, however, varies from project to project, as it depends on the local geological situation.Phased research approachIn many research projects – national as well as international – the project’s approach (i.e. methods and techniques) and budget are both decided upon before the beginning of the actual field research. The Yangtze Harbour project has demonstrated the importance of a phased project approach, which in each new phase allows for deviations and adaptations of the planned strategy and/or methods, depending on the results of the previous phase regarding geology, palaeolandscape and archaeology. Ultimately, such a flexible, step-by-step approach leads to more detailed geological and archaeological results, and may ultimately even cost less. The latter is certainly the case if the planning of the research project dovetails into the larger operation at hand.
Win-win situationThree aspects of the fieldwork stage of the Yangtze Harbour research project were responsible for creating a win-win situation relative to the overall infrastructural project:- The (geo)archaeological research used geotechnical data collected or generated in
the context of the overall infrastructural project;- The fieldwork stage of the (geo)archaeological research project was deliberately
planned so as to coincide with the construction of the harbour;- Some of the generated information on the (geo)archaeological research results
targeted the general public. This approach resulted not only in free publicity for Port of Rotterdam Authority and contractor PUMA, but also in suitable material for the Maasvlakte FutureLand information centre. The Yangtze Harbour research project proves that (geo)archaeological research, besides being a potential (financial) risk factor, can in fact also generate positive opportunities for those responsible for implementing large infrastructural projects.

62
Notes
1. Rotterdam municipal archaeological service (BOOR), Ceintuurbaan 213b, 3051 KC Rotterdam. E-mail: [email protected]. Deltares, section Applied Geology and Geophysics, Princetonlaan 6, 3584 CB Utrecht. E-mail: [email protected]

63
3.1 Introduction
This chapter presents the results of the geological and palaeogeographical research in the Yangtze Harbour in Rotterdam. It is based on the data gathered in successive stages of the investigations between 2009 and 2011. As research progressed, its scale and focus changed. Starting from the wider environment of the Yangtze Harbour early in the desk-based assessment, it progressively zoomed in, right down to the level of individual dragline scoops from Trenches 1, 2, and 3 in the eventual underwater investigation. The chapter offers an overview of the collected evidence (corings, CPTs, seismics, datings, palaeo-environmental analysis on cores) and their development into detailed and large-scaled maps and plans, geological profiles, core photos, charts, and diagrams. The geological studies of the prospecting stage were crucial input for the decisions leading to archaeological excavation in Target zone West. In this final report they also provide the geographical context for Mesolithic habitation in a landscape situated between the estuary and the hinterland.
The research eventually focused on deposits encountered between 25 and 15 metres - asl. Between 22 and 17m - asl they were subjected to very detailed geological examination. These are deltaic and estuarine river-mouth sediments from the Early Holocene and the beginning of the Middle Holocene (Preboreal, Boreal, earliest Atlantic), spanning the date range from 9000 to 6500 BC. In these deposits evidence of human activity was found in Target zone West (Chapter 2 and Table 3.2). The deposits cover and dissect sandy channel deposits left by rivers of the final phase of the Pleistocene (Weichselian: Younger Dryas). The Early Holocene deposits in their turn were partly eroded during the Middle Holocene, and ultimately were covered by much younger marine sands (of the past 3000 years, Subatlantic). Figure 3.1 visualises the most important sedimentary contacts in the upper meters of the harbour floor as it was at the time of research: at a few metres deep, a preserved surface from the Preboreal (9000 BC, the top of the Pleistocene sands and river dunes), and in the topmost metre (somewhat more in channel fills) up to the harbour floor are the younger marine sands. Between the top of the ‘Pleistocene’ sands and the base of the marine sand are mainly clayey and organic deposits, which in Target zone West contain archaeological remains dating from the Mesolithic.
In the Early and Early/Middle Holocene, the region’s landscape saw some striking changes. The last and most radical of these was its drowning by the North Sea. The present study has confirmed that this transformation in the Yangtze Harbour occurred circa 6500 BC. At this point the area changed from a habitable, terrestrial wetland into a submerged landscape in an offshore position. But this was preceded by a series of more gradual changes in the terrestrial landscape of the valley in its lowest reaches, which must have been witnessed by the Mesolithic population. Initial changes were related to the end of the ice age, which were followed by changes relating to the progressive drowning (transgression) of the land owing to sea-level rise. At the very start of the Holocene, the area was a floodplain in the wide valley of the Rhine and Meuse, where the wind formed river dunes. Throughout the Early Holocene, the main channels of the rivers lay somewhat to the north, outside the planning area. Towards the end of the Early Holocene, the floodplain with its dunes became covered by clayey and peaty deltaic sediments and a wetland floodbasin swamp developed. It was only thereafter that the area was drowned by the North Sea, which incidentially coincided with what we identify as ‘the beginning’ of the Middle Holocene. From this moment on, subaquatic environments prevailed, and the dune and deltaic sediments were locally eroded; but below the Yangtze Harbour Early Holocene buried surfaces have survived over large areas, except for the erstwhile dune crests.
3 Landscape genesis and palaeogeography
P.C. Vos1 and K.M. Cohen2

64
harbour floor (HF) at circa 17m - asl (established by acoustic bathymetry)
base of marine sand (established by seismic survey and corings)
top of river dune at circa 20m - asl (established by seismic survey and corings)
B37A0698/W-29B37A0696/W-027
B37A0673/W-04
B37A0674/W-05B37A0675/W-06
B37A0676/W-07
N
Fig. 3.1. 3D visualisation of the detailed map of the Early Holocene top of the river-dune sand and the base of the marine sand in Target zone West, with the locations of several cores.
harbour floor (HF) at circa 17m - asl (established by acoustic bathymetry)
base of marine sand (established by seismic survey and corings)
top of river dune at circa 20m - asl (established by seismic survey and corings)
B37A0698/W-29B37A0696/W-027
B37A0673/W-04
B37A0674/W-05B37A0675/W-06
B37A0676/W-07
N
WaterYoungest offshore marine deposits, 1.0 to 1.5m thick (LBBS)Archaeologically relevant Early Holocene deposits: soils developed in dune sand, clay, and peat, 1.5 to 3.0m thick (BXDE soil, KRWY, NIBA, EC, and NAWO)Channel deposits of rivers of the last ice age and overlying river-dune sand (KR, KRWY-2, and BDXE)
harbour floor (HF) at circa 17m - asl (established by acoustic bathymetry)
base of marine sand (established by seismic survey and corings)
top of river dune at circa 20m - asl (established by seismic survey and corings)
B37A0698/W-29B37A0696/W-027
B37A0673/W-04
B37A0674/W-05B37A0675/W-06
B37A0676/W-07
N
Thus the substrate of the projected harbour held a preserved landscape from the first half of the Mesolithic, which had drowned in an estuary. The high degree of preservation and the regional geology that was fairly well-understood even at the beginning of the investigations have allowed a very detailed palaeo-environmental reconstruction of the drowned landscape underlying Rotterdam’s Yangtze Harbour.
The organisation of this chapterAfter formulating the specific research questions relating to the local landscape genesis and palaeogeography in Section 3.2, Section 3.3 starts with a description of the distinctions and the nomenclature of the encountered lithostratigraphical units. The nomenclature and its abbreviations return in the legends and headings of the sections, maps, and core descriptions in the following sections and in later chapters. The division of the sedimentary units for the Yangtze Harbour follows the national standard (TNO Geological Survey of the Netherlands) devised for mapping on a regional to national scale. This deployed scheme is not so much specific to this local project, but was taken from the literature. It serves to position the local palaeolandscape study in its regional context, from the starting point of the research onwards. With the zooming-in on the planning area and the Target zones within it, the stratigraphic scheme was progressively refined.

65
Section 3.4 presents the main result of the geological mapping exercise in 2009-2011: the composition of the shallow substrate below the Yangtze Harbour. It deals with the position in time and depth of the various strata (‘beds’, ‘deposits’, ‘sedimentary units’) and their stratigraphical interrelations (‘sedimentary geometry’, ‘architectural elements’) and hence their relative antiquity. Section 3.4 illustrates these different elements with profiles and maps. In all stages of the project an important aim of the geological and palaeogeographical research was the possibility of eventually placing any archaeological finds (recovered in the final, excavation stage) in a regional sedimentary-geological context. This was achieved primarily on the basis of location (x, y), depth (z, relative to mean sea level), and lithological descriptions (of cores and units as distinguished in Section 3.3). The mapping was based on a wide range of source data: legacy core descriptions and cone penetration tests (CPTs) data, newly obtained corings and CPT data, and seismic and bathymetric measurements from 2010 and 2011. These source data are included as appendices to this report, in the national database for geological data (DINO - Data and Information of the Dutch Subsurface, as maintained by TNO Geological Survey of the Netherlands), as well as earlier monographs on parts of the geological and palaeogeographical research. See Table 3.1 for an overview of these appendices. These reports provide technical information about the procurement of the data and their processing into maps and profiles. In the present chapter these matters will be treated only briefly discussed.
Section 3.5 describes the numeric age information as obtained by means of the geological study, from the dating of sediments subsampled from cores. Here the age attribution of the various stratigraphical units is discussed and their reliability assessed. The section also refers to typical rates of sedimentation as would have occurred in the Early Holocene, in phases of the gradual deltaic covering of the landscape. In the earliest phases, the deposition of overbank sediment was very slight and soil formation predominated (Preboreal), in accordance with the area’s position on the margin of the valley. In later phases (Boreal), sedimentation gradually accelerated to circa 20cm per century around 7000 BC, reflecting the area’s position in a delta, some distance upstream from the river mouth. The marine submersion (transgression) of the valley around 6500 BC marks a dramatic further acceleration, reflecting the pace of the sea-level rise of this period and the area’s shifting relative position within the estuary, with the open sea now nearby.
Section 3.6 reports on the research on selected corings in the Yangtze Harbour in the greatest degree of detail. While Sections 3.3 and 3.4 present the general structure of the area in terms of sedimentary units and Section 3.5 discussess the antiquity of each of these units, Section 3.6 stresses the vertical succession as can be observed in cores. It considers gradual changes within sedimentary units as well as more abrupt ones across boundaries between units. It presents vertical series of datings, in relation to sedimentological and pedogenetic facies (including micromorphological detail studies) and the outcome of pollen and diatom analyses. The section further illustrates and underpins the quality of the source data (Table 3.1) and serves as an entry point for future use by specialist scientists.
Secton 3.7 treats the history of the area from the perspective of landscape evolution, the consecutive processes acting on it, the continuing effects of topography and substrate, and the pace of landscape change. Palaeogeographical maps illustrate the series of situations in the Early Holocene (Early and Middle Mesolithic), on the scale of the Yangtze Harbour as a whole as well as zooming in on the sites of the invasive underwater investigation in Target zone West. The effect of the environmental context on the archaeological findings will also be discussed, in general terms (Section 3.7.3) as well as on the scale of Target zones East and West (Sections 3.7.4 and 3.7.5).
Finally, Section 3.8 presents the answers to the landscape-genetic and palaeogeographical research questions.
66
Author, year Stage Author(s), year, title, place (Institute monograph no.) AppendixYangtze Harbour
Vos et al. 2009 1 Vos P.C., M. van den Berg, D. Maljers, and S. de Vries, 2009: Geoarcheologische bureaustudie ten behoeve van het Yangtzehavenproject (1e onderzoeksfase in het verkennend inventariserend veldonderzoek), Utrecht (Deltares-rapport 0906-0193).
3.1
Vos et al. 2010a 2 Vos P.C., M. van den Berg, F. Bunnik, H. Cremer, M. de Kleine, D. Maljers, and C. Mesdag, 2010a: Geoarcheologisch inventariserend veldonderzoek van het Yangtzehaven project (verkennende fase 2), Utrecht (Deltares-rapport 1201894-000-BGS-0003).
3.2
Cremer and Bunnik 2010 2 Cremer, H. and F.P.M. Bunnik, 2010: Diatomeeën- en pollenscans van de boringen Yangtzehaven (B37A0652, B37A0653, B37A0656, B37A0661, B37A0663, B37A0665), Utrecht (TNO-rapport TNO-034-Ut-2010-01150-B).
3.3
de Vries 2011a 3 Vries, S. de, 2011a: Boorbeschrijvingen Yangtzehaven-Oost, Utrecht (Deltares-rapport 1204743-000-BGS-0013).
Revised and incorporated in Appendix 2.1
de Vries 2011b 3 Vries, S. de, 2011b: Boorbeschrijvingen Yangtzehaven-West, Utrecht (Deltares-rapport 1204743-000-BGS-0014).
Revised and incorporated in Appendix 2.1
Schiltmans 2012a 3 Schiltmans, D.E.A., 2012a: Rotterdam Yangtzehaven. Karterend inventariserend veldonderzoek, Rotterdam (evaluatierapport BOOR).
-
Schiltmans 2012b 4 Schiltmans, D.E.A., 2012b: Rotterdam Yangtzehaven. Opgraving, Rotterdam (evaluatierapport BOOR).
-
Vos 2013 3 and 4 Vos, P.C., 2013: Geologisch en paleolandschappelijk onderzoek Yangtzehaven (Maasvlakte, Rotterdam). Toegepast geoarcheologisch onderzoek ten behoeve van de archeologische prospectie in Vroeg Holocene deltaïsche afzettingen van Rijn en Maas in het Maasvlaktegebied, Utrecht (Deltares-rapport 1206788-000BGS-0001).
3.4A
1) Vos 2013: Appendix A
3 and 4 Core descriptions and photos of cores from the Yangtze Harbour investigations.
Revised and incorporated in Appendix 2.1
1) Vos 2013: Appendix B 3 and 4 CPT diagrams of Target zones East and West in the Yangtze Harbour investigations.
3.4B
Vos 2013: Appendix C 3 and 4 Tabulated results of radiocarbon datings in the Yangtze Harbour and Kop van Beer areas.
3.4C
Vos 2013: Appendix D 3 and 4 Overview of pre-existing digital files made available to the project
3.4D
Vos 2013: Appendix E 3 and 4 Seismic overview profiles P1, P2, and P3 of the Yangtze Harbour planning area.
3.4E
Cremer et al. 2013(= Appendix F in Vos 2013)
3 and 4 Cremer, H., F.P.M. Bunnik, and H. Koolmees, 2013: Diato-meeën- en pollenanalyses en scans van geselecteerde boringen van de opgraving Yangtzehaven, Utrecht (TNO-rapport R10346).
3.4F
van Kappel and Exaltus 2013(= Appendix G in Vos 2013)
3 and 4 Kappel, K. van and R.P. Exaltus, 2013: Bodem micro mor fo-logisch onderzoek Yangtzehaven te Rotterdam, Amersfoort (ADC-rapport 3421).
3.4G
Vos 2013: Appendix H 3 and 4 Summary of palaeo-ecological pollen and diatom studies, combined with lithostratigraphical and radiocarbon evidence.
3.4H (see below, Appendix 3.9)

67
Author, year Stage Author(s), year, title, place (Institute monograph no.) AppendixKop van Beer and Papagaaienbek1) Vos and de Vries 2007 n.a. Vos, P.C. and S. de Vries, 2007: Geologisch vooronderzoek
Papegaaibekhaven en Kop van Beer, Utrecht (TNO-rapport 2007-U-R1164/B).
3.5
Cremer and Bunnik 2009 n.a. Cremer, H. and F.P.M. Bunnik, 2009: Diatomeeën- en pollenanalyses (scanonderzoek) van de boringen Papegaaibek (B37A0594) en Kop van Beer (B37A0592), Utrecht (TNO-rapport TNO-034-Ut-2009-00739-A).
3.6
Cremer 2009 n.a. Cremer, H., 2009: Diatomeeënanalyses aan sedimenten van de boringen Papegaaibek (B37A0594) en Kop van Beer (B37A0592), Utrecht (TNO-rapport 034-UT-2009-02346-B).
3.7
Vos et al. 2010b n.a. Vos, P.C., F.P.M. Bunnik, H. Cremer, and F.M. Hennekam, 2010: Paleolandschappelijk onderzoek Papengaaienbek en Kop van Beer. Geobotanisch en 14C-onderzoek van monsters genomen uit vroeg Holocene delta-afzettingen in het gebied Papengaaienbek en Kop van Beer (Maasvlakte, Rotterdam), Geologisch vooronderzoek Papegaaibekhaven en Kop van Beer, Utrecht (Deltares rapport 1201910-000-BGS-0001).
3.8
Vos 2013: Appendix H 3 and 4 Summary of palaeo-ecological pollen and diatom studies, combined with lithostratigraphical and radiocarbon evidence.
extended andincorporated as 3.9.
1) Core descriptions, core photos, and CPT data are kept also in the DINO database of TNO Geological Survey of the Netherlands.
Table 3.1. Overview of monographs on the various geological and palaeogeographical investigations, included as appendices to this chapter.
3.2 Research questions
Specific research questions were formulated for the landscape-genetic and palaeogeographical investigations (Smit 2012); these guided the choice of research methods and the processing of the results. They are systematically answered in Section 3.8.
Questions on the regional scale: the area of Maasvlakte 1 and 2- What was the nature of the palaeotopography in the region of the Maasvlakte at the beginning of the Holocene? Where were the larger river-dune structures situated and where did the main channels of the Early Holocene rivers Rhine and Meuse run?- How was the area of the Yangtze Harbour situated in the wider landscape of the Maasvlakte region in the Early Holocene? How great was the distance to (active) main channels and were there any minor drainage systems?
Specific questions on a ‘macro’ scale: the Yangtze Harbour planning area:- What did the Late Glacial and Early Holocene landscape look like at the location of the present Yangtze Harbour (topography, environment)? - What are the exact depths relative to mean sea level of the encountered deposits and facies units?- How can these deposits and units be spatially defined (with the aid of seismic research and corings)?- What are the respective ages of the river dunes in the research area and the sandy fluvial sediments of the Kreftenheye Formation?- What is the age of the blanketing (Basal) peat?- How did the submergence of the river-dune landscape unfold and when did it occur (as dated from peat that was sampled along the dune flanks)? - Is this drowning attributable to direct marine influence? - How do the findings fit in with the results of earlier research performed in the planning area?
68
Specific questions on the ‘meso’ scale: Target zones West and East:- What did the landscape look like on and around the river dunes? - What is the relationship beween the dune (in Target zone West) and the channel running east of it (in Target zone East)?- How did the landscape around the dune evolve at the time of the dune’s occupation (fresh-water, brackish, marine; diachronic changes)? - What is the pedogenesis and exact nature of the soil in the top of the dune and of the ‘charcoal-rich layers’ in the top of the Wijchen Member?- Do these ‘charcoal-rich layers’ have an anthropogenic origin? - Is there a link between the ‘charcoal-rich layers’ in the Wijchen Member (upper part) and the archaeological remains on the river dunes?- Is there any evidence of erosion on the flank of the dune?
Specific landscape-oriented questions on the ‘micro’ scale: Target zone West:- Are the archaeological remains preserved in situ?- From which geological and/or facies unit do the remains derive? - Is there any evidence of erosion and/or displacement of the archaeological remains?- Did the method of research/excavation affect the archaeological remains (e.g. in terms of damage or context)?
3.3 Results relating to the geological strata between 30 and 15m - asl
The geology of the Yangtze Harbour planning area has been described and subdivided in accordance with the regional lithostratigraphical framework drawn up by TNO Geological Survey of the Netherlands (TNO-GSN) and succinctly described in Westerhoff, Wong, and de Mulder (2003). Elaborate descriptions of the formal units used in this report can be consulted at http://www.dinoloket.nl/nomenclator-ondiep. The nomenclature and codes of the lithostratigraphical units follow the formal nomenclature of TNO-GSN. Within the Early Holocene deposits, further subdivisions into lithogenetic units have been made on the basis of lithology, sedimentary environment, soil formation, and relative positions. The stratigraphical units and their succinct formal descriptions presented here are the basic building blocks of the geological profiles, 3D stratigraphical models, and landscape reconstructions. Apart from the lithology, the lithofacies (sedimentary environment) and transitions between the units are also discussed. The descriptions will allow the incorporation of newly acquired local geological details into the regional mapping. Interpretations of the Yangtze Harbour findings in the Early Holocene geographical context can thus be embedded in recent, preexisting regional reconstructions, such as those in Hijma (2009), Vos, Bazelmans, Weerts, and van der Meulen (2011), and Cohen, Stouthamer, Pierik, and Geurts (2012).
The subdivision adopted here reflects earlier regional geological mappings and is primarily based on sedimentary features (Westerhoff et al. 2003). The usefulness of the subdivision for newly obtained cores was verified in the work presented in this chapter. The high level of detail (sub-decimetre) of the core description in layers meant that in the mainly peaty Basal Peat Bed, more clayey intercalations were also recognised (EC intercalations in the NIBA unit: deposited side-by-side, in the same palaeogeographical situation), and that two beds of overbank clay of the ‘Wijchen Member’ were distinguished (KRWY-2 and KRWY, deposited successively, in separate palaeogeographical situations). The subdivision thus became more detailed than the national subdivision schemes. In earlier lithogenetic mapping of Early Holocene deposits and landscapes in the Rhine estuary (Hijma, Cohen, Hoffmann, van der Spek, and Stouthamer 2009; Bos, Busschers, and Hoek 2012), the authors had already proposed and applied comparable subdivisions within the Wijchen Member and the Basal Peat Bed.
In the situation of the Yangtze Harbour, with a long research history in adjacent areas, it is possible also to make a fair advance assessment (down to about 1000-1500 years) of the numeric age of the encountered strata, based on the mapping of sedimentary sequences and their recorded depths. Palaeo-environmental evidence and landscape-genetic clues can be deduced also from the characteristics of soil formation (colour changes, decalcification, maturity, firmness), sedimentological criteria (stratification, bioturbation), and macroscopic fossils (wood, shells). Figure 3.2 shows three selected cores displaying

69
the various stratigraphical units in their typical facies and succession. Descriptions of the cores, accompanied by a full photographic record, are included as Appendix 2.1 to Chapter 2.
The descriptions per sedimentary unit in his chapter integrate the general results regarding age, palaeo-environment, and landscape change that will return in detail in the subsequent chapters. References in the following descriptions of the Yangtze Harbour units to palynological evidence regarding age and palaeo-environment (pollen, diatoms) rest on results and insights from specialist monographs by TNO-GSN (Cremer and Bunnik 2009; idem 2010; Cremer et al. 2013) from the various preliminary research stages. The present chapter discusses these results in some detail in Sections 3.5 and 3.6. Where in the following descriptions (as well as in Sections 3.4 to 3.6) references are made to sedimentary-geological evidence (seismic-reflection data, sedimentology, micromorphology, and soil formation as observed in cores), these results and insights come from monographs compiled by Deltares (Vos et al. 2009; Vos et al. 2010a; Vos 2013) in collaboration with ADC ArcheoProjecten (van Kappel and Exaltus 2013). Where in the following stratigraphical descriptions absolute datings (radiocarbon and OSL) are mentioned, these are based on results and conclusions from studies by Deltares (Vos et al. 2009; Vos et al. 2010a; Vos 2013) in collaboration with dating laboratories (OSL: Wallinga and Versendaal 2014). These findings are discussed in greater detail in Sections 3.4 and 3.6. All of the above-mentioned monographs are included as appendices to this chapter (see Table 3.1).
The systematic stratigraphical description of the units has served as a framework in the construction of the overview and detailed profiles in Section 3.4. A schematic overview of the stratigraphical units and their partly overlapping age ranges (Section 3.5) is presented in Figure 3.3. The mapping and stratigraphical relationships described in Sections 3.3 and 3.4 provided the organising framework for processing the various radiocarbon and OSL datings into calibrated absolute dates and hence in determining the antiquity and diachroneity of the successive, stratigraphical units. While Section 3.3 discusses the overall geological structure of the Yangtze Harbour area and focuses on the Early Holocene deposits in the floodplain on a regional scale, Section 3.6. zooms in on the succession in individual cores. At this scale, consideration is also given to exceptions to the general pattern, like those occurring in cores from local Early Holocene channel fills.
3.3.1 Kreftenheye Formation – channel deposits of the rivers Rhine and Meuse (KR)
Lithology: The unit consists of sands supplied by the rivers Rhine and Meuse. The sands strongly vary in grain size. At the top of the formation the sands are moderately fine (median grain size circa 150μm) to coarse (median grain size circa 300μm). A wide range of grain sizes occurs. The sands are rich in detrital calcium-carbonates and not or barely humic. At greater depth there is an admixture of gravel. The top of the formation lies at circa 23 to 22m - asl. The deposit of fluvial sands in the deeper subsoil of the Yangtze Harbour continues down to its erosive base at circa 40m - asl (Rijsdijk et al. 2005; Busschers 2008; Hijma 2009; Hijma, Cohen, Roebroeks, Westerhoff, and Busschers 2012). Lithofacies: At the top of the formation, the sands are largely deposited as sand bars in channels of rivers that (in the planning area) were active in the Late Glacial and silted up around the transition to the Holocene (as is evident from OSL datings: see Section 3.5.1). These sandy deposits are stratified, with thin interbeds that in places are loamy. At the top of the formation we are dealing with upper bar facies (i.e. the top of sand bars in a river, mostly deposited under relatively high energetic conditions), which upwards grades into lower overbank facies (i.e. the base of overbank deposits, mostly deposited under lower energetic conditions during floods and trapped by pioneer vegetation). These two facies mark the final phases of silting-up and abandonment of the riverbed.Boundary: The transition to the overlying Wijchen Member (KRWY-2 and KRWY) on the whole is a gradual one (taking at least 10cm) as can be seen in Figure 3.2a. Locally the transition is more abrupt (within 1cm). Where it immediately covers the sands of the Kreftenheye Formation, the Wijchen Member in the planning area is comparatively loamy with sandy interbedding. Also, where at a later date river-dune sand (BXDE) accumulated and covered the KR unit, the two are separated by a fairly thin bed of loamy clay with sandy layers: the Wijchen Member (lower part, KRWY-2).

70
SBBLEC
NIBA
KR
KRWY
LOCATION
CORE
asl:-
SBBL BXDE
soil
BXDE
NIBA
KRWY-2
KR
EC
LOCATION
CORE
asl:-
NAWO
SBBL
EC
NIBA
soil
BXDE
LOCATION
CORE
asl:-
Fig. 3.2. Three cores from the Yangtze Harbour, illustrating the typical stratigraphical sequence (descriptions starting from below).a. Core B37A0713/O-13 in Target zone East, with a typical sequence of KR, KRWY, (EC) NIBA, EC (NAWO), and SBBL.b. Core B37A0676/W-07 in Target zone West, with a typical sequence of KR, KRWY-2, BXDE (with soil), NIBA, EC, and SBBL.c. Core B37A0693/W-24 in Target zone West, with a typical sequence of BXDE, NIBA, EC, NAWO, and SBBL.
a b
c

71
years BC
NAWOECNIBAKRWYBXDEKRWY-2
KR
LithostratigraphyArchaeologyChronostratigraphy
and pollen zonesyears BC
6000
7000
8000
9000
10,000 10,000
9000
8000
7000
6000
Mid
dle
Hol
ocen
eE
arly
Hol
ocen
eLa
te G
laci
alMiddle Atlantic
Early Atlantic
Boreal
Preboreal
Younger Dryas Late Palaeolithic
Late Mesolithic
Middle Mesolithic
7500
6500
Early Mesolithic
9700
8100
7000
6000
Fig. 3.3. Chronological scheme, showing archaeological periods and sedimentary units in the Yangtze Harbour planning area. The red bar marks the period of human presence at the river-dune complex (established by means of radiocarbon datings). KR = Fluvial sands of the Kreftenheye FormationKRWY-2 = Fluvial clays of the Wijchen Member (lower part)BXDE = River-dune sands of the Boxtel FormationKRWY = Fluvial clays of the Wijchen Member (upper part)NIBA = Mostly clayey peat of the Basal Peat Bed (Nieuwkoop Formation)EC = Humic, fine fluvial sediments of the Echteld FormationNAWO = Stratified, fine sand and clay deposits of the Wormer Member
KR
KRWY-2
BXDE
KRWY
NIBA
EC
NAWO

72
3.3.2 Kreftenheye Formation, Wijchen Member (lower part) – overbank clays (KRWY-2)
Lithology: This unit consists of grey loam, sandy clay and clayey sand, and is internally stratified. Its thickness varies between one and several decimetres, and in the Yangtze Harbour area it occurs at a depth of circa 23 to 22m - asl. The cores reached the layer only in Target zone West, below river-dune sand, but CPT data (relatively low cone resistance) reveal that it occurs widely throughout the planning area.
Lithofacies and (local) genesis: The Wijchen Member (lower part) was deposited as overbank silt and clays during periodical floods.The layer marks a phase in which the rivers Rhine and Meuse adjusted to a changing drainage regime at the end of the last glacial in which the river type evolved from a braided to a meandering one. At the time of deposition, the active river channels lay outside the planning area. In the lowest parts of the palaeo-floodplain, the deposit is locally thicker and of a more sandy-interbedded appearance (lithofacies: KRWY- residual-channel fill). These thicker parts affect the seismic reflection characteristics and allow identification of spatial patterns in the relief of the top of the Kreftenheye Formation, particularly in Target zone East (Section 3.4). Boundaries: This is a layered unit which has gradual boundaries, both with the underlying riverbed sands of the Kreftenheye Formation and with the overlying aeolian sands (BXDE), as can be seen in Figure 3.2b. No distinct soil developed in the KRWY-2 layer below the river-dune body, which means that dune formation must have almost immediately followed the deposition of the Wijchen Member (lower part).
3.3.3 Boxtel Formation, Delwijnen Member – donk or river-dune sand (BXDE)
Lithology: The sandy river-dune body in Target zone West consists of moderately fine sand. The material is reasonably well sorted; grain sizes generally vary between 150 and 210μm. Where the palaeo-surface of the sandy river dune has not been eroded, it displays a (strongly) humic soil, dark brown to black in colour. On the flanks of the dune, the soil is over 50cm thick in places, and the humus staining is often distinctly mottled. The sands are carbonaceous, apart from the humic soil in the top of the sand body. The river-dune sand is encountered between 22.5 and 18.5m - asl, with an irregular, rolling surface. Its minimum thickness is a few decimetres, and the maximum preserved thickness is 4 metres. The earliest sedimentation of the Wijchen Member (upper part, KRWY) coincides with the beginning of dune formation (BXDE). The end of dune formation preceded the end of the deposition of the KRWY unit. In earlier monographs (Table 3.1) this member was informally labelled ‘BXDZ: Boxtel Formation, dune sand’. Archaeological residue: In Target zone West, the top of the dune sand in some areas was found to contain flint lithics, burnt and unburnt bone, fish remains, charcoal, and other carbonised botanical material from the Mesolithic. See Table 3.2 for an overview of the archaeological indicators recovered from the sieving residues of core samples. Lithofacies and (local) genesis: These are inland aeolian dune fields that formed in the Early Holocene (OSL datings: Section 3.5.1) in an area of the valley that had become abandoned by the river, but presumably close to the then active river channel. The source of the wind-blown sands lies in sand bars in (silting-up) riverbeds in the near vicinity of the planning area. Eventually the abandoned riverbed sands were overgrown with vegetation, which trapped more clayey flood sediments (KRWY; soil formation in KRWY and the top of KR) and put an end to the sand drifting. The dunes themselves too developed a vegetation cover (soil formation in the top of BXDE). In later phases of the landscape development, the sedimentary environment on the foot and the flank of the dune became considerably wetter (NIBA and EC). Eventually, the surrounding landscape became a wetland, while the dune’s flank and top remained ‘high and dry’. In the Yangtze Harbour area, this situation occurred during the Boreal, coinciding with the Mesolithic occupation. River-dune outcrops of this kind have traditionally been termed donken, a feature of the western Netherlands further upriver, throughout the Middle and Late Holocene and even today. Around the beginning of the Middle Holocene, the donken of the Yangtze Harbour area became submerged, with their crests being eroded while the lower parts were preserved. In its current truncated, buried and drowned condition, the river dune in the Yangtze Harbour might best be termed a ‘drowned donk’. This is how the dune is at times referred to in the following.

73
Core Archaeological residue Depthin m - HF
Depthin m - asl
Archaeological indicator retrieved through research
Target zone West B37A0673/W-04(Trench 2)
-Bone and flint-Charcoal-Carbonised material
2.56-2.362.32-2.162.32-2.16
20.28-20.0820.04-19.8820.04-19.88
Sieve residu from core (Stage 3)Macroscopic plant remains BIAXPollen samples BIAX
B37A0675/W-06 -Bone-Carbonised remains of herbs and charcoal-Carbonised remains of herbs and woody material
2.73-2.492.35-2.12
2.35-2.12
20.37-20.1319.99-19.76
19.99-19.76
Sieve residu from core (Stage 3)Macroscopic plant remains BIAX
Pollen samples BIAX
B37A0676/W-07(Trench 1)
-Charcoal-Charcoal-Charcoal, bone and flint
1.32-0.971.78-1.322.75-1.78
19.03-18.6819.49-19.0320.46-19.49
Sieve residu from core (Stage 3)Sieve residu from core (Stage 3)Sieve residu from core (Stage 3)
B37A0679/W-10 -Charcoal 1.50-1.35 18.58-18.43 Sieve residu from core (Stage 3) B37A0685/W-16 -Flint 1.50-0.69 19.11-18.30 Sieve residu from core (Stage 3) B37A0686/W-17 -Charcoal 1.79-1.58 18.91-18.70 Sieve residu from core (Stage 3) B37A0687/W-18 -Charcoal 3.40-2.72 20.60-19.92 Sieve residu from core (Stage 3) B37A0691/W-22 -Charcoal 1.25-0.85 18.77-18.37 Sieve residu from core (Stage 3) B37A0692/W-23 -Charcoal 3.30-3.20 21.01-20,91 Sieve residu from core (Stage 3) B37A0693/W-24 -Charcoal 3.20-3.09 20.89-20.78 Sieve residu from core (Stage 3) B37A0694/W-25 -Charcoal
-Charcoal0.70-0.551.70-0.70
18.56-18.4119.56-18.56
Sieve residu from core (Stage 3)Sieve residu from core (Stage 3)
B37A0696/W-27 -Charcoal and flint 1.78-1.36 19.55-19.13 Sieve residu from core (Stage 3) B37A0698/W-29(Trench 3)
-Flint 1.75-0.65 19.72-18.62 Sieve residu from core (Stage 3)
Table 3.2. Archaeological evidence in the top of the river-dune sand (BXDE) retrieved from cores.
Boundaries: The transition to the underlying unit – the Wijchen Member (lower part, KRWY-2) – is a gradual one. At the foot of the dune the margin of the sand body is interstratified with the clayey Wijchen Member (upper part, KRWY), with gradual transitions, as can be seen in Figure 3.2b. Higher up on the slope of the dune, the interface with higher parts of the KRWY is more clean-cut. The intercalation marks the boundary between the lower and upper parts of the Wijchen Member (KRWY-2 and KRWY, respectively). The transition to the overlying clayey Basal Peat Bed (NIBA) is on the whole a rapid one (generally less than 2cm). Basal Peat on river-dune sand is sandy, as is shown in Figures 3.2b and c. The distinction from the underlying humic soil is made on the basis of clay content and stratification. The underlying soil is mottled and bioturbated and lacks clear horizontal stratification. By contrast, the more compact Basal Peat immediately on top of it is horizontally stratified (Figures 3.2b and c). Where the donk sand locally extends up to 18.5m - asl, it is erosively truncated by the base of the young marine sand unit (SBBL).
3.3.4 Kreftenheye Formation, Wijchen Member (upper part) – overbank clays (KRWY)
Lithology: The unit consists of clay: firm, moderately silty to strongly silty and humic (often humically stratified), and at the base sandy and mostly sandy-stratified. The clay contains detrital calcium carbonate at the base but towards the top is decalcified. Within the deposit, humic soil levels occur which lack carbonate. The deposit is encountered between 22 and 19m - asl and typically has a thickness of a few decimetres to a metre.Archaeological residue: Locally, carbonised material is present within the humic levels: mainly as fine particles of herbs and – to a lesser extent – of woody material, recognised in the thin sections prepared for studying the micromorphology and in the pollen samples, but encountered also in the form of macroscopic material in sieving residues from cores and in the preparation of pollen samples. Lithofacies and (local) genesis: The grey clay of the Wijchen Member (upper part) with its humic soil levels consists of overbank sediments from the rivers Rhine and Meuse in the Early Holocene. Towards the top, the layer contains increasing amounts of organic matter (its colour changing from grey to dark grey-brown). The dark grey colour of the soils and

74
the absence of diatom skeletons indicate that the rate of sedimentation in the floodplain was modest and that for an extended period the area was only episodically inundated.Boundaries: The stratigraphical transitions to the underlying units (KRWY-2 and BXDE) below 21m - asl are gradual, but more clear-cut up the foot of the dune. The transition to the overlying unit, from the humic top to the overlying Basal Peat Bed (NIBA), on the whole is gradual (1-5cm; Figure 3.2a). The distinction drawn between the clayey Basal Peat and the humic top of the Wijchen Member clays is based on the macroscopically visible plant remains in the Basal Peat.
3.3.5 Nieuwkoop Formation, Basal Peat Bed – peat (NIBA)
Lithology: The unit consists of amorphous, compacted peat. The peat as a rule is clayey, devoid of carbonates, and dark brown in colour. Occasionally, humic, grey-brown, humic clays containing reed roots are found intercalated in the peat deposit: then multiple peat layers can be distinguished. Macroscopically identifiable plant remains include reed fragments, roots and occasionally bits of wood. The Basal Peat occurs between 21 and 19m - asl and typically is one decimetre thick. Archaeological indicators: The peat locally contains charred material: fragments of herbs and woody plants, recognised macroscopically and microscopically in the preparation of pollen samples and in the pollen analysis itself. In the micromorphological study they are referred to as ‘thin burnt levels’ in the peat. Lithofacies and (local) genesis: The Basal Peat Bed in the planning area is predominantly composed of clayey reed peat. Only immediately around the river dunes (BXDE) does the Basal Peat contain more wood (woodland peat). The accumulation of reed peat indicates an episode of very wet conditions in a waterlogged floodbasin, regularly flooded by the river (supply of clay) and a mean water table at or just above the land surface. Compared to the sedimentary environment of the Wijchen Member (upper part, KRWY), conditions were wetter and drainage conditions had deteriorated. The accumulation of the Basal Peat indicates a gradually rising water table during the development of the marsh, under the influence of the rising sea level downstream. In the planning area this happenend during the Early Holocene (between 7500 and 6500 BC; for radiocarbon dates see Section 3.5.2). Compaction of the Basal Peat resulted from its later covering by sediments as the water table and the sea level progressively rose (Section 3.5.4). In contrast to many observations at sites further inland along the southern edge of the Rhine-Meuse Valley (Bos et al. 2012), the Basal Peat Bed in the Yangtze Harbour lacks a clearly evolved ‘woodland subfacies’ at the base of the stratum, which indicates that conditions became wetter quite rapidly. Boundaries: The transition to the underlying units (KRWY and BXDE) on the whole are gradual (Figs 3.2a-c). Immediately above the interface with KRWY, the Basal Peat often displays a clayey facies (Fig. 3.2a). Locally the transition may be more abrupt. In the case of layers of humic clay intercalated with plant remains, the top of the uppermost peaty layer was taken as the top of the stratigraphical unit. The transition to the overlying freshwater tidal clays (EC) is generally abrupt (Figs 3.2a-c). Exceptional situations where the top is marked by a gradual transition occur in local residual-channel depressions. There the typical peaty NIBA deposit as described above is absent, and contemporaneous humic clay was deposited instead (see Section 3.6).
3.3.6 Echteld Formation – freshwater tidal deposits (EC)
Lithology: The unit, consisting of moderately to strongly silty clay, is humic to strongly humic and is stratified in terms of humus content. A characteristic feature is the presence of washed-in wood remains. Also reed and leaf fragments are present. Locally there is an absence of washed-in wood. In the top of the unit, silty laminations increase in thickness. The unit is encountered between 21 and 18m - asl and typically is up to a metre thick. At the very base it mostly lacks carbonates, but higher up it becomes carbonaceous. Lithofacies and (local) genesis: The facies displays silty laminations and the deposits are relatively soft (unlike the underlying KRWY clays). Sedimentation occurred under slight tidal influence, in a freshwater environment. The diatoms and the macroscopic plant remains mark this as a freshwater tidal area. There is no evidence of drying-out or other initial soil-forming processes. For this reason the wood- and reed-rich clays are thought

75
Core Archaeological indicator Depthin m - HF
Depthin m - asl
Archaeological indicator retrieved through research
Yangtze Harbour planning area B37A0653/B-02 -Charcoal
-Charcoal1.66-1.602.06-1.85
19.26-19.2019.66-19.45
Core description (Stage 2)Core description (Stage 2)
B37A0657/B-06 -Charcoal 2.03-1.94 19.33-19.24 Core description (Stage 2)Target zone West B37A0677/W-08 -Ex situ deposited carbonised plant remains
-Ex situ deposited carbonised plant remains-In situ formed thin burnt layers-Ex situ deposited carbonised plant remains-Ex situ deposited carbonised plant remains-In situ formed thin burnt layers
4.464.554.624.644.814.88
21.7821.8721.9421.9622.1322.20
Thin sections micromorphologyThin sections micromorphologyThin sections micromorphologyThin sections micromorphologyThin sections micromorphologyThin sections micromorphology
B37A0697/W-28 -Charcoal-Carbonised remains of herbs and woody material-Carbonised remains of herbs and woody material
2.31-2.262.28-2,24
2.28-2.24
20.40-20.3520.37-20.33
20.37-20.33
Sieve residue from core (Stage 3)Macroscopic plant remains (BIAX)
Pollen samples (BIAX)
Target zone East B37A0721/O-21 -Charcoal 2.42-2.34 19.88-19.80 Sieve residue from core (Stage 3)
Table 3.3. Archaeological indicators from cores in the Wijchen Member (KRWY, upper part).
Core Archaeological indicator Depthin m - HF
Depthin m - asl
Archaeological indicator retrieved through research
Target zone West B37A0673/W-04 -Charcoal
-Carbonised material2.16-1.972.16-1.97
19.88-19.6919.88-19.69
Macroscopic plant remains (BIAX)Pollen samples (BIAX)
B37A0675/W-06 -Carbonised remains of herbs and woody material-Carbonised remains of herbs and woody material
2.12-2.11
2.12-2.11
19.76-19.75
19.76-19.75
Macroscopic plant remains (BIAX)
Pollen samples (BIAX)
B37A0677/W-08 -In situ formed thin burnt layers 4.05 21.37 Thin sections micromorphology B37A0696/W-27 -In situ formed thin burnt layers 1.23 19.00 Thin sections micromorphology B37A0697/W-28 -Carbonised remains of herbs and
woody material-Carbonised remains (unspecified)
2.23-2.22
2.23-2.22
20.32-20.31
20.32-20.31
Macroscopic plant remains (BIAX)
Pollen samples (BIAX)
Table 3.4. Archaeological indicators from cores in the Basal Peat (NIBA).
to have been deposited mainly under water (subaquatic, subtidal). Also the dating of the sediment and the depth relative to the sea-level curve (for this period based on inland Basal Peat; see Section 3.7) imply that most of the EC sediments were deposited below the low-water level. Conditions had become even wetter than the marshy environments of the time when the Basal Peat (NIBA) was formed. No strong evidence of bioturbation is found, which is indicative of relatively rapid sedimentation rates. In some cores penetrating the unit, reed rhizomes occur towards the top, dating to one or two centuries immediately after drowning. These indicate that locally the mud accumulation could temporarily catch up and bring the level of sedimentation into the intertidal zone (see Section 3.6). However this was not the case in most of the cores and hence over large areas and here the general deepening of the subaquatic environment occurred without interruption. Boundaries: The transition to the underlying Basal Peat (NIBA) is an abrupt one (Figs 3.2a-c). That to the overlying estuarine sediments (NAWO) on the whole is very gradual (Fig. 3.2). Apart from a few corings where reed rhizomes towards the top of the EC layer suggest a local build-up of silt into the intertidal zone, the gradual interface marks the transition from a subtidal, freshwater tidal environment to the deeper, brackish underwater environment in the central estuarine zone. In other words: once drowned, sedimentation of tidal clays no longer kept up with the water-level rise, and the drowning and transgression progressed unimpeded. The gradual boundary is marked by a reduction in the density of washed-in plant remains and a changed diatom fauna. Macroscopically it is not always easy to define (Sections 3.5.4 and 3.6). Locally, estuarine channel sands (NAWO) have supplanted the top of the stratigraphical unit (erosive boundary instead of gradual transition; Fig. 3.2c).

76
3.3.7 Naaldwijk Formation, Wormer Member – estuarine sediments (NAWO)
Lithology: The unit consists of strongly silty clay and is internally stratified. Silty laminations occur frequently, and occasionally also sandy lamina a few to numerous mm thick. The clay contains lime and for the most part is slightly humic. Fragments of marine mollusc shells are absent or very few, as are washed-in plant remains. The layer is found between 20 and 18m - asl, and – apart from incised channels – typically has a thickness of up to 1.5m. In channel fills, locally extending to 27m - asl, it is up to ten metres thick. Lithofacies and (local) genesis: The sedimentology (texture, silty and sandy rhythmic laminations) indicates that the slightly marine humic clays are tidal deposits from seaward parts of the estuary. The sediments were largely deposited under water, in the subtidal zone. Diatom analysis has established that the Wormer Member represents a brackish environment (Sections 3.5.4 and 3.6). The shift from a freshwater (EC) to a brackish environment (NAWO) occurred at the transition from the Early to the Middle Holocene (around 6200 BC, as indicated by radiocarbon dating: Section 3.5.2). Boundaries: The transition to the underlying freshwater tidal clays (EC) on the whole is a gradual one (Fig. 3.2a). Internal boundaries also occur, as a result of local scouring within the wider estuary during the deposition of the member (Fig. 3.2c). The transition to the overlying marine sands (SBBL) is clear-cut and erosive (Figs 3.2a and c).
3.3.8 Southern Bight Formation, Bligh Bank Member – young marine sands and offshore channel fills (SBBL)
The sediments in this group are classed as marine sands. Since the sands contain a pelagic shell fauna, they are reckoned to the Southern Bight Formation, Bligh Bank Member (SBBL) (Rijsdijk et al. 2005). Lithology: The unit consists of sand and sand-clay laminated deposits. The sand is always carbonaceous and contains marine shells and shell remains (including Spisula subtruncata, Cut Trough shell); grain size ranges from very fine to moderately coarse grade. The sands are stratified and may contain layers of (silty) clay and loam in varying numbers and thicknesses. This sand-and-clay-layered member was deposited offshore at the mouth of the Rhine-Meuse system. Lithofacies and (local) genesis: The corings in the Yangtze Harbour sampled only the deepest channel fills (below 17m - asl) of this unit. Local more strongly clayey layers represent a facies reflecting the silting-up of such channels. Palynological data show those in the Yangtze Harbour to date from the Subatlantic (Sections 3.5 and 3.6). In the course of recent millennia, several such channels were active in this area. Boundaries: The transition to the underlying units (NAWO, EC, BXDE) is erosive (Figs 3.2a-c). The top of the unit at the time of the investigation was formed by the harbour floor: all young marine sands occurring at a higher level had been dredged away. This also goes for the extraneous sand that was used in constructing the Maasvlakte 1 peninsula.
3.4 Results of geological mapping and modelling
In view of the staggered approach to the study, the geological mapping of the planning area was started from the large-scale Yangtze Harbour and its immediate surroundings (Fig. 3.4), on the basis of available data and maps (Table 3.1: Vos et al. 2009; idem 2010a). This was followed by more detailed mapping of the geology on the scale of Target zones East and West with data newly collected at a higher density (Fig. 3.5). The results of the dating and palaeoenvironmental studies – radiocarbon and OSL datings, series of pollen and diatom analyses from various cores, and micromorphological analyses of thin sections from selected cores (Table 3.1) – were iteratively combined with the insights gained from the geological mapping and the outcome was eventually translated into landscape reconstructions (Section 3.7). The time slices selected for these reconstructions follow from the archaeological and archaeobotanical insights and the radiocarbon ages collected for this purpose. The geological structure presented here in Section 3.4 is the basis for the palaeogeographical reconstructions.
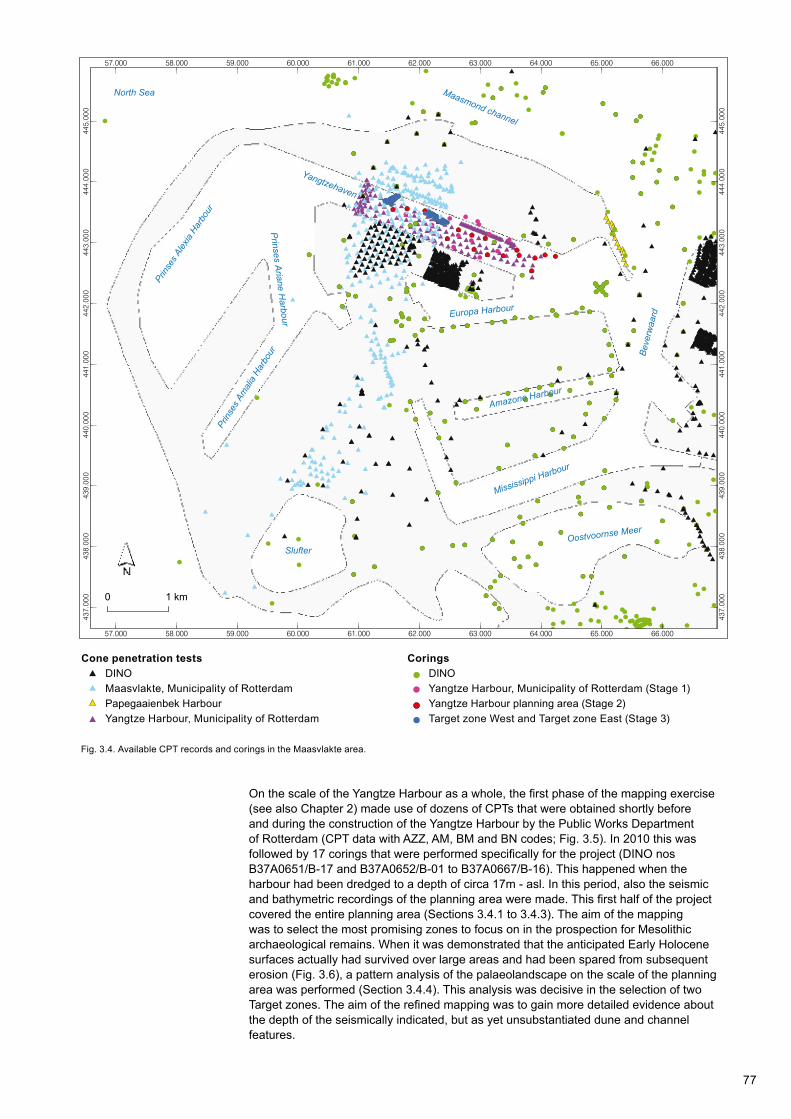
77
Sonderingen
Steekboringen
Sonderingen uit DINO
Sonderingen van Papegaaibekhaven
Sonderingen van Maasvlakte, Gemeentewerken Rotterdam
Sonderingen in Yangtzehaven, Gemeentewerken Rotterdam
Boringen uit DINO
Oost en Westboringen, fase3Steekboringen
, fase2
Papegaaibekhaven
Boringen in
0 1 km
Slufter
Mississippi Harbour
Amazone Harbour
Europa Harbour
Beve
rwaa
rd
Yangtzehaven
Prins
es A
lexia
Harbo
ur
Prinses A
riane Harbour
Prins
es A
mali
a Ha
rbou
r
Oostvoornse Meer
Maasmond channel
North Sea
57.000
57.000
58.000
58.000
59.000
59.000
60.000
60.000
61.000
61.000
62.000
62.000
63.000
63.000
64.000
64.000
65.000
65.000
66.000
66.000
437.
000
437.
000
438.
000
438.
000
439.
000
439.
000
440.
000
440.
000
441.
000
441.
000
442.
000
442.
000
443.
000
443.
000
444.
000
444.
000
445.
000
445.
000
0 1 km
´
Sonderingen
Steekboringen
Sonderingen uit DINO
Sonderingen van Papegaaibekhaven
Sonderingen van Maasvlakte, Gemeentewerken Rotterdam
Sonderingen in Yangtzehaven, Gemeentewerken Rotterdam
Boringen uit DINO
Oost en Westboringen, fase3Steekboringen
, fase2
Papegaaibekhaven
Boringen in
0 1 km
Slufter
Mississippi Harbour
Amazone Harbour
Europa Harbour
Beve
rwaa
rd
Yangtzehaven
Prins
es A
lexia
Harbo
ur
Prinses A
riane Harbour
Prins
es A
mali
a Ha
rbou
r
Oostvoornse Meer
Maasmond channel
North Sea
Cone penetration testsDINOMaasvlakte, Municipality of RotterdamPapegaaienbek HarbourYangtze Harbour, Municipality of Rotterdam
Sonderingen
Steekboringen
Sonderingen uit DINO
Sonderingen van Papegaaibekhaven
Sonderingen van Maasvlakte, Gemeentewerken Rotterdam
Sonderingen in Yangtzehaven, Gemeentewerken Rotterdam
Boringen uit DINO
Oost en Westboringen, fase3Steekboringen
, fase2
Papegaaibekhaven
Boringen in
0 1 km
Slufter
Mississippi Harbour
Amazone Harbour
Europa Harbour
Beve
rwaa
rd
Yangtzehaven
Prins
es A
lexia
Harbo
ur
Prinses A
riane Harbour
Prins
es A
mali
a Ha
rbou
r
Oostvoornse Meer
Maasmond channel
North Sea
DINOYangtze Harbour, Municipality of Rotterdam (Stage 1)Yangtze Harbour planning area (Stage 2)Target zone West and Target zone East (Stage 3)
Fig. 3.4. Available CPT records and corings in the Maasvlakte area.
Corings
On the scale of the Yangtze Harbour as a whole, the first phase of the mapping exercise (see also Chapter 2) made use of dozens of CPTs that were obtained shortly before and during the construction of the Yangtze Harbour by the Public Works Department of Rotterdam (CPT data with AZZ, AM, BM and BN codes; Fig. 3.5). In 2010 this was followed by 17 corings that were performed specifically for the project (DINO nos B37A0651/B-17 and B37A0652/B-01 to B37A0667/B-16). This happened when the harbour had been dredged to a depth of circa 17m - asl. In this period, also the seismic and bathymetric recordings of the planning area were made. This first half of the project covered the entire planning area (Sections 3.4.1 to 3.4.3). The aim of the mapping was to select the most promising zones to focus on in the prospection for Mesolithic archaeological remains. When it was demonstrated that the anticipated Early Holocene surfaces actually had survived over large areas and had been spared from subsequent erosion (Fig. 3.6), a pattern analysis of the palaeolandscape on the scale of the planning area was performed (Section 3.4.4). This analysis was decisive in the selection of two Target zones. The aim of the refined mapping was to gain more detailed evidence about the depth of the seismically indicated, but as yet unsubstantiated dune and channel features.
Sonderingen
Steekboringen
Sonderingen uit DINO
Sonderingen van Papegaaibekhaven
Sonderingen van Maasvlakte, Gemeentewerken Rotterdam
Sonderingen in Yangtzehaven, Gemeentewerken Rotterdam
Boringen uit DINO
Oost en Westboringen, fase3Steekboringen
, fase2
Papegaaibekhaven
Boringen in
0 1 km
Slufter
Mississippi Harbour
Amazone Harbour
Europa Harbour
Beve
rwaa
rd
Yangtzehaven
Prins
es A
lexia
Harbo
ur
Prinses A
riane Harbour
Prins
es A
mali
a Ha
rbou
r
Oostvoornse Meer
Maasmond channel
North Sea
57.000
57.000
58.000
58.000
59.000
59.000
60.000
60.000
61.000
61.000
62.000
62.000
63.000
63.000
64.000
64.000
65.000
65.000
66.000
66.000
437.
000
437.
000
438.
000
438.
000
439.
000
439.
000
440.
000
440.
000
441.
000
441.
000
442.
000
442.
000
443.
000
443.
000
444.
000
444.
000
445.
000
445.
000
0 1 km
´
Sonderingen
Steekboringen
Sonderingen uit DINO
Sonderingen van Papegaaibekhaven
Sonderingen van Maasvlakte, Gemeentewerken Rotterdam
Sonderingen in Yangtzehaven, Gemeentewerken Rotterdam
Boringen uit DINO
Oost en Westboringen, fase3Steekboringen
, fase2
Papegaaibekhaven
Boringen in
0 1 km
Slufter
Mississippi Harbour
Amazone Harbour
Europa Harbour
Beve
rwaa
rd
Yangtzehaven
Prins
es A
lexia
Harbo
ur
Prinses A
riane Harbour
Prins
es A
mali
a Ha
rbou
r
Oostvoornse Meer
Maasmond channel
North Sea
57.000
57.000
58.000
58.000
59.000
59.000
60.000
60.000
61.000
61.000
62.000
62.000
63.000
63.000
64.000
64.000
65.000
65.000
66.000
66.000
437.
000
437.
000
438.
000
438.
000
439.
000
439.
000
440.
000
440.
000
441.
000
441.
000
442.
000
442.
000
443.
000
443.
000
444.
000
444.
000
445.
000
445.
000
0 1 km
´

78
0 500 m
!
!
!!
!!
!
!
!!
!!!!
!!
!
!!!!!
!!!!
!!
!
!!
!!! !
!!!
!!!!
!!!
!!!
#
#
#
##
#
#
#
#
#
##
##
#
#
#
#
#
#
#
#
#
#
#
#
#
#
#
#
#
#
#
#
#
#
#
#
#
#
#
#
#
#
#
#
#
#
#
#
#
#
#
#
#
#
#
#
#
#
#
#
#
#
#
#
#
#
#
#
#
#
#
#
#
# #
#
#
#
#
#
#
#
#
#
#
##
#
#
###
##
###
#
####
##
#
!(
!(!(!(
!(
!(
!(
!(
!(
!(!(
!(
!(
!(
!(
!(
!(
#
#
#
#
#!
#
%
%
%
%
%
%
%%
%
%
%
%
%
%
%
%
%
%
%
%
%
222
8996
7747
6427
5143
3593
1920
129
6590
5422
4289
3159
2012
1059
127
6253
5496
4507
3457
2387
1293
Steekboringen in overzichtsprofiel
Geologisch overzichtsprofiel
Profiel op seismische lijn 1 met schotpunten (Afb. 3.7a)
Profiel op seismische lijn 2 met schotpunten (Afb. 3.7b)
Profiel op seismische lijn 3 met schotpunten (Afb. 3.7c)
Selectiegebied, WestSelectiegebied, Oost
Sonderingen in overzichtsprofiel !
#
Plangebied
#
!(
#
!
Sonderingen, fase 2Steekboringen, fase 2
Sonderingen Gemeentewerken Rotterdam
Steekboringen, fase 3
Oevergrens Yangtzehaven 2011
#
!!
!
!
61.000
61.000
62.000
62.000
63.000
63.000
64.000
64.000
443.
000
443.
000
444.
000
444.
000
!
!!!
!!
!!!
!!
!
!!
!!!!
!!
!
!!!!!
!!!!
!!
!
!!
!!! !
!!!
!!!!
!!!
!!!
#
#
#
##
#
#
#
#
#
##
##
#
#
#
#
#
#
#
#
#
#
#
#
#
#
#
#
#
#
#
#
#
#
#
#
#
#
#
#
#
#
#
#
#
#
#
#
#
#
#
#
#
#
#
#
#
#
#
#
#
#
#
#
#
#
#
#
#
#
#
#
#
# #
#
#
#
#
#
#
#
#
#
#
##
#
!(
!(!(!(
!(
!(
!(
!(
!(
!(!(
!(
!(
!(
!(
!(
!(
#
###
##
###
#
######
##
%
%
%
%
%
%
%%
%
%
%
%
%
%
%
%
%
%
%
%
%
B37A0666
BN57
BN56
BM107
BM753BM122
BM137
BM139
BM142
BM112
BM111
BM110
BM117
BM118
BM119
AM383
BZZ76 BZZ54
BN450
BN449
BN448
BN447
BN446
BN445
BN443
BN442
BN441
BN440
BN439
BN438
BN437
BN436
BM754
BM752
BM751
BM749
BM638
BM141
BM140
BM138
BM136
BM135
BM134
BM130
BM129
BM127
BM126
BM125
BM124
BM123
BM121
BM120
BM116
BM115
BM114
BM113
BM109
BM108
BM106
BM105
BM104
AM438
AM436
AM392
AM391AM390
AM389
AM112
AM111
AZZ191
AZZ186
AZZ168
AZZ158
AZZ147
AZZ146
AZZ138
AZZ125
AZZ124
AZZ123
AZZ121
AZZ114
AZZ113AZZ112
AZZ111
AZZ110
AZZ109AZZ108
AZZ107AZZ105
AZZ104
AZZ103
61.000
61.000
62.000
62.000
63.000
63.000
64.000
64.000
443.
000
443.
000
444.
000
444.
000
0 500 m
Profile on seismic-survey line 1 with shot points (Fig. 3.7a)Profile on seismic-survey line 2 with shot points (Fig. 3.7b)Profile on seismic-survey line 3 with shot points (Fig. 3.7c)Cone penetration test, Municipality of Rotterdam (Stage 1)Cone penetration test (Stage 2) Corings (Stage 2)Corings (Stage 3)Corings used in overview geological profileCone penetration test used in overview geological profile
a
b
Course of overview geological profileYangtze harbour planning areaTarget zone WestTarget zone EastEdge of Yangtze Harbour (2011)
0 500 m
!
!
!!
!!
!
!
!!
!!!!
!!
!
!!!!!
!!!!
!!
!
!!
!!! !
!!!
!!!!
!!!
!!!
#
#
#
##
#
#
#
#
#
##
##
#
#
#
#
#
#
#
#
#
#
#
#
#
#
#
#
#
#
#
#
#
#
#
#
#
#
#
#
#
#
#
#
#
#
#
#
#
#
#
#
#
#
#
#
#
#
#
#
#
#
#
#
#
#
#
#
#
#
#
#
#
# #
#
#
#
#
#
#
#
#
#
#
##
#
#
###
##
###
#
####
##
#
!(
!(!(!(
!(
!(
!(
!(
!(
!(!(
!(
!(
!(
!(
!(
!(
#
#
#
#
#!
#
%
%
%
%
%
%
%%
%
%
%
%
%
%
%
%
%
%
%
%
%
222
8996
7747
6427
5143
3593
1920
129
6590
5422
4289
3159
2012
1059
127
6253
5496
4507
3457
2387
1293
Steekboringen in overzichtsprofiel
Geologisch overzichtsprofiel
Profiel op seismische lijn 1 met schotpunten (Afb. 3.7a)
Profiel op seismische lijn 2 met schotpunten (Afb. 3.7b)
Profiel op seismische lijn 3 met schotpunten (Afb. 3.7c)
Selectiegebied, WestSelectiegebied, Oost
Sonderingen in overzichtsprofiel !
#
Plangebied
#
!(
#
!
Sonderingen, fase 2Steekboringen, fase 2
Sonderingen Gemeentewerken Rotterdam
Steekboringen, fase 3
Oevergrens Yangtzehaven 2011
#
!!
!
!
61.000
61.000
62.000
62.000
63.000
63.000
64.000
64.000
443.
000
443.
000
444.
000
444.
000

79
!
!!!
!!
!!!
!!
!
!!
!!!!
!!
!
!!!!!
!!!!
!!
!
!!
!!! !
!!!
!!!!
!!!
!!!
#
#
#
##
#
#
#
#
#
##
##
#
#
#
#
#
#
#
#
#
#
#
#
#
#
#
#
#
#
#
#
#
#
#
#
#
#
#
#
#
#
#
#
#
#
#
#
#
#
#
#
#
#
#
#
#
#
#
#
#
#
#
#
#
#
#
#
#
#
#
#
#
# #
#
#
#
#
#
#
#
#
#
#
##
#
!(
!(!(!(
!(
!(
!(
!(
!(
!(!(
!(
!(
!(
!(!(
!(
#
###
##
###
#
####
##
##
%
%
%
%
%
%
%%
%
%
%
%
%
%
%
%
%
%
%
%
%
B37A0667
B37A0665B37A0664
B37A0663
B37A0662
B37A0661B37A0660
B37A0659
B37A0658
B37A0657B37A0656
B37A0655
B37A0654 B37A0653 B37A0652B37A0651 B37A0666
61.000
61.000
62.000
62.000
63.000
63.000
64.000
64.000
443.
000
443.
000
444.
000
444.
000
0 500 m
!
!!!
!!
!!!
!!
!
!!
!!!!
!!
!
!!!!!
!!!!
!!
!
!!
!!! !
!!!
!!!!
!!!
!!!
#
#
#
##
#
#
#
#
#
##
##
#
#
#
#
#
#
#
#
#
#
#
#
#
#
#
#
#
#
#
#
#
#
#
#
#
#
#
#
#
#
#
#
#
#
#
#
#
#
#
#
#
#
#
#
#
#
#
#
#
#
#
#
#
#
#
#
#
#
#
#
#
# #
#
#
#
#
#
#
#
#
#
#
##
#
!(
!(!(!(
!(
!(
!(
!(
!(
!(!(
!(
!(
!(
!(
!(
!(
#
###
##
###
#
######
##
%
%
%
%
%
%
%%
%
%
%
%
%
%
%
%
%
%
%
%
%
!!!!
!!!!!!
!!!
!!
#
###
##
##
#
##
#
##
#
#
#
#
#
#
#
#
#
#
#
# #
##
!
!!
!
!!
!
!
!
!
#
B37A0694
B37A0700 B37A0703B37A0704
B37A0705B37A0706
B37A0707B37A0708
B37A0709B37A0710
B37A0711
BN56
BN57
AM389
BN447BN445
BN441
BN436
BM754
BM752
BM104
BM105BM106
BM115
BM116
AM436
CPT 4CPT 5
CPT 6
CPT 7
CPT 2
CPT 3CPT 8
CPT 1
AZZ105
AZZ104
AZZ103
AZZ138
AZZ158
CPT 18
B37A0702
B37A0701
B37A0670
B37A0660
B37A0662
B37A0656
B37A0663
B37A0664
B37A0653B37A0665
B37A0652B37A0666
B37A0659B37A0693
61.000
61.000
62.000
62.000
63.000
63.000
64.000
64.000
443.
000
443.
000
444.
000
444.
000
0 500 m
Fig. 3.5. Positions of the various recordings and of Target zones West and East in the Yangtze Harbour planning area.a. Codes of shot points on seismic survey lines.b. Codes of cone penetration tests.c. Codes of corings for mapping the planning area.d. Location of selected recordings used in the overview profile (Fig. 3.8).
c
d

80
0 500 m
61.000
61.000
62.000
62.000
63.000
63.000
64.000
64.000
443.
000
443.
000
444.
000
444.
000
Fig. 3.6. Top of the Late Pleistocene and Early Holocene sand (KR and BXDE) relative to asl, with the position of Target zones West and East in the Yangtze Harbour planning area.a. Zones of erosion by marine channel activity in the Middle and Late Holocene.b. Position of recordings selected for the overview profile (Fig. 3.8).
Area eroded by NAWO channelArea eroded by SBBL channel
BN56
BN57
AM389
BN447BN445
BN441
BN436
BM754
BM752
BM104
BM105BM106
BM115
BM116
AM436
CPT 4CPT 5
CPT 6CPT 7
CPT 2CPT 3
CPT 8
CPT 1
AZZ105
AZZ104AZZ103
AZZ138
AZZ158
CPT 18
B37A0702B37A0701
B37A0670
B37A0660
B37A0662
B37A0656
B37A0663
B37A0664 B37A0653
B37A0665
B37A0652 B37A0666
B37A0659
B37A0693
0 500 m
61.000
61.000
62.000
62.000
63.000
63.000
64.000
64.000
443.
000
443.
000
444.
000
444.
000
Coring used in overview profileCone penetration test used in overview profileGeneral geological profile (Fig. 3.8)
BN56
BN57
AM389
BN447BN445
BN441
BN436
BM754
BM752
BM104
BM105BM106
BM115
BM116
AM436
CPT 4CPT 5
CPT 6CPT 7
CPT 2CPT 3
CPT 8
CPT 1
AZZ105
AZZ104AZZ103
AZZ138
AZZ158
CPT 18
B37A0702B37A0701
B37A0670
B37A0660
B37A0662
B37A0656
B37A0663
B37A0664 B37A0653
B37A0665
B37A0652 B37A0666
B37A0659
B37A0693
0 500 m
61.000
61.000
62.000
62.000
63.000
63.000
64.000
64.000
443.
000
443.
000
444.
000
444.
000
0 500 m
61.000
61.000
62.000
62.000
63.000
63.000
64.000
64.000
443.
000
443.
000
444.
000
444.
000
< 18,018,5 - 18,019,0 - 18,519,5 - 19,020,0 - 19,5
Top sand in m - asl
Target zone WestTarget zone East
0 500 m
61.000
61.000
62.000
62.000
63.000
63.000
64.000
64.000
443.
000
443.
000
444.
000
444.
000
0 500 m
61.000
61.000
62.000
62.000
63.000
63.000
64.000
64.000
443.
000
443.
000
444.
000
444.
000
0500 m
61.000
61.000
62.000
62.000
63.000
63.000
64.000
64.000
443.000
443.000
4 44.000
444.000
a
b
20,5 - 20,021,0 - 20,521,5 - 21,022,0 - 21,5
0 500 m
61.000
61.000
62.000
62.000
63.000
63.000
64.000
64.000
443.
000
443.
000
444.
000
444.
000
0 500 m
61.000
61.000
62.000
62.000
63.000
63.000
64.000
64.000
443.
000
443.
000
444.
000
444.
000
22,5 - 22,023,0 - 22,524,0 - 23,0> 24,0
0 500 m
61.000
61.000
62.000
62.000
63.000
63.000
64.000
64.000
443.
000
443.
000
444.
000
444.
000
BN56
BN57
AM389
BN447BN445
BN441
BN436
BM754
BM752
BM104
BM105BM106
BM115
BM116
AM436
CPT 4CPT 5
CPT 6CPT 7
CPT 2CPT 3
CPT 8
CPT 1
AZZ105
AZZ104AZZ103
AZZ138
AZZ158
CPT 18
B37A0702B37A0701
B37A0670
B37A0660
B37A0662
B37A0656
B37A0663
B37A0664 B37A0653
B37A0665
B37A0652 B37A0666
B37A0659
B37A0693
0 500 m
61.000
61.000
62.000
62.000
63.000
63.000
64.000
64.000
443.
000
443.
000
444.
000
444.
000

81
In the two selected areas, Target zones East and West, detailed mapping was carried out at the depth interval between 25 and 17m - asl (Sections 3.4.5 and 3.4.6). To this end, fresh seismic recordings were made at greater density along lengthwise and crosswise lines. These were processed into maps and profiles, which served to identify the locations where even denser CPT and coring research was to be performed. In Target zone East, 21 further corings and 10 cone penetration tests were carried out; in Target zone West, 31 corings and 8 cone penetration tests (Fig. 3.5) were executed. From the newly obtained cores the intactness of buried surfaces could be assessed, as well as the type of fill in the channel features and the thickness of the geological strata on the flank and foot of the dune. The outcome could be confronted with the overall picture of the area from earlier mapping. Some cores from Target zone West were found to contain archaeological residues (Chapter 2 and Sections 3.3.3 and 3.3.4). This prompted the decision to investigate around the corings concerned: Excavation trenches 1, 2 and 3. As invasive underwater investigation was to take place in Target zone West and not in Target zone East, the profiles and maps of Target zone West were worked out in closer detail (detailed maps as well as profiles) than in Target zone East (profiles only).
3.4.1 Integration of seismic, coring and CPT data
The seismic lines clearly brought out in particular the Holocene channel features. The distinction between younger and older channels (Fig. 3.6) was based on the corings of 2010 and the detailed analysis of selected cores. Younger channels belong to the SSBL member (age: Subatlantic; channel-fill lithology: largely sandy, with intercalated clay layers; Section 3.3.8). Older channels belong to the NAWO member (age: Atlantic; channel-fill lithology: mostly clayey, with thin intercalations of silt and sand; Section 3.3.7).
All data were digitally processed into maps and profiles (2D), into relief models of bounding surfaces (2.5D) and to geomodels of the intervals between the bounding surfaces (3D; experimental, not incorporated in this final report; see Vos 2013). For a spatial representation of the palaeorelief, both in the planning area and in Target zones West and East, two palaeosurfaces were interpolated to full coverage: (i) the top of the Pleistocene-Early Holocene sand (KR, including KRWY-2, and BXDE) and (ii) the base of the marine sands and offshore channels (the erosive base of SBBL). These two interfaces spatially define the drowned complex of Early Holocene fluvial and deltaic deposits (KRWY, NIBA, EC, NAWO). The bathymetry of the harbour floor provides a third bounding surface. The result, presented as a series of elevation maps (Sections 3.2.4 and 3.2.5), was used for compiling visualisations such as Figure 3.1.
Observations concerning sedimentary-unit contacts in the network of corings and in the CPT interpretations constituted the input for interpolating the bounding surfaces. Also the depths of the unit contacts inferred from the seismic reflections along the three track lines were used as guiding data in the interpolations. Thus a consistent three-dimensionial image of the stratigraphy could be achieved even with a limited number of corings.
The chosen interpolation technique is known as block kriging. It takes into account the variation of multiple data points within a grid cell. The choice of block size represents a compromise between the far higher data density along the seismic lines and the much lower data density from corings and CPT between the track lines. This was of critical importance in the interpolations for the Yangtze Harbour (data from Stage 2). Because of the higher data density in the Target zones (Stage 3), the choice of interpolation method was less crucial there. The higher resolution of the (seismic) records in Target zone West is reflected in the locally finer detail in the surface of the sand (Fig. 3.6).
Since the overlying surfaces were independently interpolated, it is possible that in the resulting model they appear to intersect (top of BXDE above the base of SBBL, or SBBL higher than the harbour floor). Geologically this is an impossibility, for which reason the interpolations had to be systematically adjusted (method: Stafleu et al. 2013, 99-100). Wherever the interpolated level of an older sedimentary boundary lies above that of a younger one, the elevation of the former is reduced to coincide with that of the latter. Even after these corrections, the interpolations still produce some artefacts in the form of relief,

82
suggested by the model, which in reality does not necessarily exist, especially along the margins of the model area. Further artefacts arose where the seismic and the CPT data were interpreted differently: the older CPT data and their interpretation in many instances deviated from the geological structure suggested by the subsequently obtained seismic data. In such cases, the seismic evidence was given precedence. Outside the area covered by the seismic lines, no independent corroboration of the CPT data was possible. In the modelled boundaries and the maps presented here, such artefacts have as much as possible been eliminated. For further technical details, the reader is referred to the monograph by Vos (2013, 20-26), included here as Appendix 3.4A.
3.4.2 Seismic profiles of the Yangtze Harbour
The seismic profiles (Fig. 3.7) were interpreted on the basis of the stratigraphical information obtained from the corings and cone penetration tests. In particular, the spatial extent and cross-cutting relationships of the various units become manifest from tracing the seismic reflections. In high-frequency ‘chirp’ profiles, features spaced 30cm apart will still be observable as separate reflectors. For ‘sparker’ data, obtained with a lower frequency, the resolution is reduced to 1.5m. The appendices offer further details about the gathering of seismic evidence (Table 3.1; Vos 2013 - Appendix D = Appendix 3.4 in the present publication). The seismic method offers a considerably lower vertical resolution than the CPT and the core descriptions. On the other hand, seismic lines, used complementarily to the CPT and core data, provide a spatially continuous profile. Through seismics, two features can be traced throughout the area: (i) the surface of the ‘Pleistocene’ sand (KR including KRWY-2, and BXDE) and (ii) the base of the marine sands and channel incisions (erosive boundaries of SBBL and NAWO channels). Locally, scoured-out channels could be traced seismically as well.
Not just the chosen frequency bands, but also the depth of the habour floor affected the quality and interpretation of the seismic data. In the uncorrected data, the depth of the harbour floor not only depended on the depth of the towfish below the water surface, but also on the course of the tides while the measurements were conducted. In shallow offshore seismic recordings it is customary to perform a post-process adjustment if a high standard of accuracy in the absolute elevation data is required. In the case of the Yangtze Harbour this was crucial, not just for determining the position of the palaeogeographical features and archaeological remains with respect to mean sea level (with a view to subsequent archaeological underwater investigation), but also for relating the Mesolithic habitation phases to the changing sea levels in the Early and Middle Holocene. In the post-processing and interpretation phase, the harbour-floor depth in the seismic data was ‘forced’ by means of digital processing to match the depths recorded in multibeam surveys by the Rotterdam Port Authority in the summer of 2011 (Section 2.2.2). In this way, harbour depths were linked to mean sea level in a single action. The processing of parts of seismic lines that ran close to the underwater slope of the harbour basin required further manual correction. In such cases part of the bottom echo was not reflected from below but from the sloping side. Forcing to true depth may then produce spurious depths for the reflectors.
3.4.3 Overview geological profile of the Yangtze Harbour
The overview geological profile (Fig. 3.8) is based on coring and CPT data and presents the structure of the subsoil between 30 and 17m - asl. The surface of the ‘Pleistocene’ sand (KR, KRWY-2 and BXDE) everywhere lies below 18.5m - asl. This depth marks the erosive boundary between river-dune sand (BXDE) and younger marine sands (SBBL), and consequently the highest preserved occurrences of river-dune sand with soil formation in it (see also Section 3.4.4). Locally the dune had been higher, but the erosion made it impossible to determine its exact original elevation. In the landscape reconstructions (Section 3.7), the dunes in Target zone West were attributed an original elevation of 16 to 15m - asl, which would mean that the dunes when newly formed rose some 4 to 6 metres above their surroundings.
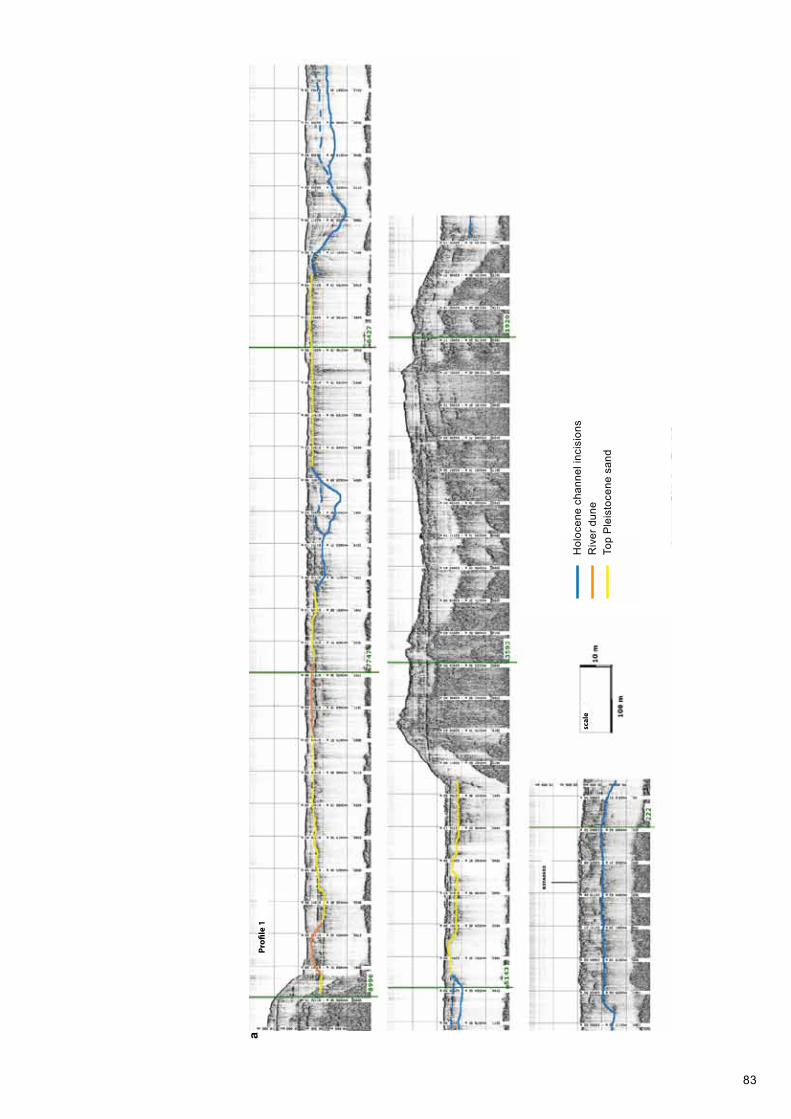
83
scal
e
Pro�
le 1
scal
e
Pro�
le 1
Hol
ocen
e ch
anne
l inc
isio
nsR
iver
dun
eTo
p P
leis
toce
ne s
and
a
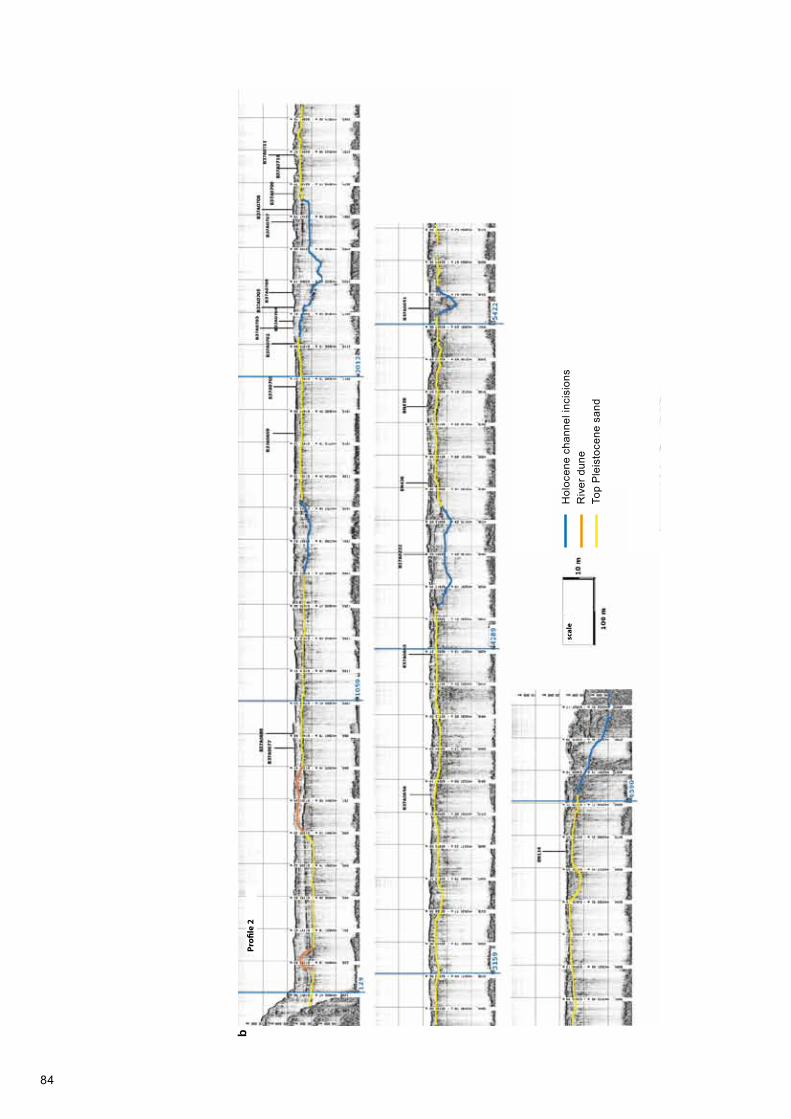
84
scal
e
Pro�
le 2
scal
e
Pro�
le 1
Hol
ocen
e ch
anne
l inc
isio
nsR
iver
dun
eTo
p P
leis
toce
ne s
and
b

85
scal
e
Pro�
le 3
scal
e
Pro�
le 1
Hol
ocen
e ch
anne
l inc
isio
nsR
iver
dun
eTo
p P
leis
toce
ne s
and
Fig.
3.7
. Sei
smic
-sur
vey
profi
les
in th
e Ya
ngtz
e H
arbo
ur p
lann
ing
area
. The
ba
thym
etric
ally
cor
rect
ed ‘c
hirp
’ refl
ectio
n da
ta a
re s
how
n in
mon
ochr
ome;
th
e co
lour
ed li
nes
indi
cate
the
mos
t im
port
ant b
ound
arie
s. In
blu
e, e
rosi
ve
chan
nel f
eatu
res
(inte
rpre
ted
as S
BB
L an
d N
AW
O c
hann
els)
; in
oran
ge, t
he
top
of th
e riv
er d
unes
(thi
ck b
eds
of B
XD
E, c
onta
ct w
ith N
IBA
and
EC
), an
d in
yel
low
, the
‘Ple
isto
cene
’ sub
surf
ace
(KR
, thi
n be
ds o
f BX
DE
and
KR
WY
). Fo
r the
pos
ition
of t
he p
rofil
es, s
ee F
igur
e 3.
5.
a. S
eism
ic-s
urve
y lin
e 1;
b. S
eism
ic-s
urve
y lin
e 2;
c. S
eism
ic-s
urve
y lin
e 3.
c
86
The top of the Pleistocene fluvial deposits (KR) is marked by the Wijchen Member (lower part, KRWY-2) and lies between circa 23.5m - asl (CPT AZZ138) and circa 21.5m - asl towards the east. Locally the KRWY-2 deposits and the top of the KR deposits have been lumped together in the logging and mapping, owing to the gradual nature of their contact. At some locations there is evidence of deep scouring and reworking by marine channels (NAWO and SBBL). In those locations, cores don’t reach the Kreftenheye Formation until as far down as 27.5m - asl. But across the greater part of the planning area, the top of the floodplain had been preserved almost intact. Almost all of the cores reached the KR fluvial sands around 22m - asl.
The aeolian dune sand above the fluvial sands displays variations in elevation and thickness that may exceed 2.5m. The rolling dune relief also affects the elevation and thickness of the overlying Wijchen Member (KRWY). This ranges from a few decimetres to a metre in thickness; towards the west its top lies at circa 20m - asl and towards the east at circa 19m - asl. Despite the variable elevation, the lithology of the KRWY bed is uniform thoughout the profile: at its base it is grey, loamy and stratified, while towards the top the clay becomes progressively more humic and at least one soil horizon has developed within. Cores B37A0674/W-05 and B37A0697/W-28 show how the Wijchen Member tapers out against the river dune: in these cores just a clayey intercalation is encountered at the boundary between river-dune sand and Basal Peat.
The base of the Basal Peat (NIBA) follows the rolling surface of the higher parts of the dune complex and the slightly less undulating blanket of the Wijchen Member over the lower parts of the dune and surrounding floodplain. Freshwater tidal sediments (Echteld Formation, EC) and brackish estuarine deposits (Wormer Member, NAWO) even further levelled the ‘Pleistocene’ palaeorelief. The lowermost sample from the base of the Basal Peat Bed was taken at circa 20.9m - asl; the highest at circa 19.3m - asl. The peat within the overview section varies strongly in clay admixture and thickness. In core B37A0688/W-23 the peat layer is almost 50cm thick and well developed; in core B37A0690/W-21, its thickness is just 7cm.
Soil formation (in the KRWY unit) and compaction after subseqent burial (KRWY, NIBA, EC and NAWO units) rendered the Early Holocene deposits relatively resistant to later erosion. As a result, the boundary with the young marine sands (SBBL) in the west and the middle of the overview profile varies only moderately in elevation, between 20 and 18.5m - asl. Towards the east of the profile, the SBBL erosion extended to a greater depth. Closer after the drowning event, and before the Early Holocene sediments were much compacted, estuarine channels (NAWO) locally cut deeply into the Kreftenheye Formation. This erosion especially affected the lower-lying parts inherited from the Pleistocene relief. Target zone East is such an area (core B37A0706/O-06). In the seismic profiles also (Fig. 3.7), the channel is clearly outlined to a depth of circa 25m - asl. In the CPT diagrams, the clayey-sandy fill of this channel is clearly recognisable in the low but strongly fluctuating cone-resistance values (Fig. 3.8: CPT4). See also Section 3.4.5.
3.4.4 Pattern analyses: palaeosurface of the ‘Pleistocene’ sands and base of the marine sands
The map of the top of the ‘Pleistocene’ sands (Fig. 3.6) reveals various patterns. Pattern analysis was employed in the selection of the Target zones. The recognition of dune features (Target zone West) and of non-marine channel features (Target zone East) was of particular importance. Pattern analysis is also a crucial part of translating lithological features like those observed in individual cores into the spatial extent of stratigraphical units and the first step towards creating palaeogeographical maps from geological data.
On the scale of the planning area, multiple patterns in the top of the ‘Pleistocene’ sand stand out. First, at Target zone West there is a relatively high ridge in the west, which continues in a southerly direction. The tops of this ridge, also beyond the overview geological profile, extended to 18.5m - asl, but at this level are then truncated by marine sand. In this part of the harbour complex, the higher river-dune bodies also clearly appear in the seismic data. The erosion has largely removed the humic soil in the top of the river-dune sand. The lowest points with river-dune sand have their surface at circa 20.5m - asl

87
zand
leem
klei
veen
gyttj
a
grin
d
Hoo
fdlit
holo
gie
geen
mon
ster
San
d
Loam
Cla
y
Pea
t
No
reco
very
500
mLi
thos
trat
igra
phy
1614 1810 12 20 22 24 26 28 32 34
Depth in m - asl
1614 1810 12 20 22 24 26 28 32 343030
3636
0
AZZ138
AZZ158
AZZ103
AZZ104
AZZ105
CPT18A
CPT1A
CPT2ACPT3ACPT8
AM436
CPT4ACPT5A
CPT6A
CPT7A
BM116
BM115
BM106
BM105
BM104
BM754
BN436
BN57
BN441
BN445
BN447
B37A0670 / W-01B37A0693 / W-24B37A0694 / W-25B37A0700 / W-31
B37A0660 / B-09
B37A0659 / B-08
B37A0701 / O-01
B37A0702 / O-02
B37A0707 / O-07B37A0708 / O-08B37A0709 / O-09B37A0710 / O-10B37A0711 / O-11
B37A0662 / B-11
B37A0663 / B-12
B37A0656 / B-02
B37A0664 / B-13
B37A0653 / B-02
B37A0665 / B-14
B37A0652 / B-01
B37A0666 / B-15
SB
BL
NA
WO
EC
NIB
AK
RW
YB
XD
EK
RW
Y-2
KR
SB
BL
NA
WO
EC
KR
WY
BX
DE
KR
Targ
et z
one
Wes
t
Ta
rget
zon
e E
ast
CoringsCPTs
BM752
SB
BL:
Sou
ther
n B
ight
For
mat
ion
Sub
atla
ntic
offs
hore
(out
let)
chan
nels
/ m
arin
e sa
nd
NAW
O: N
aald
wijk
For
mat
ion
- Wor
mer
Mem
ber
Est
uarin
e de
posi
ts
EC
: Ech
teld
For
mat
ion
Fres
hwat
er ti
dal d
epos
its, f
luvi
al c
lays
NIB
A: N
ieuw
koop
For
mat
ion
- Bas
al P
eat
Pea
t, cl
ayey
BX
DE
: Box
tel F
orm
atio
n - D
elw
ijnen
Mem
ber
Riv
er-d
une
sand
KR
WY-
2: K
refte
nhey
e Fo
rmat
ion
- low
er W
ijche
n M
embe
rO
verb
ank
clay
s
KR
: Kre
ftenh
eye
Form
atio
nFl
uvia
l cha
nnel
san
ds, u
ndiff
eren
tiate
d
Wat
er
Sedi
men
t typ
e in
cor
es
KR
WY:
Kre
ftenh
eye
Form
atio
n - u
pper
Wijc
hen
Mem
ber
Ove
rban
k cl
ays
B37A0703 / O-03B37A0704 / O-04B37A0705 / O-05
Nor
thw
est
Sou
thea
st
Con
e re
sist
ance
(qc)
Con
e pe
netr
atio
n te
sts
Fric
tion
ratio
(Rf)
Fig.
3.8
. Ove
rvie
w g
eolo
gica
l pro
file
thro
ugh
the
Yang
tze
Har
bour
pla
nnin
g ar
ea. F
or it
s po
sitio
n, s
ee F
igur
es 3
.5 a
nd 3
.6.
88
and are non-erosively covered with clayey sediments. In areas with sand elevations between 20.5 and 18.5m - asl, the old dune surfaces can therefore be regarded as preserved.
A second pattern is formed by a relatively broad and deep incision in the southeast (Fig. 3.6). In cores and seismic graphs the incision extended to well below 24m - asl. It is attributed to the most recent period of offshore scouring (SBBL; Subatlantic).
A third pattern is especially well-developed in the central part of the planning area. It consists of continuous, moderately deep, channel-shaped depressions (depths between 24 and 22m - asl), with somewhat higher tops (22 to 19m - asl) on both sides of the channel feature. In Target zone East there is a younger channel-shaped depression also, which extends far deeper and has cut into a shallower channel feature (see below). The older, shallower channel is a residual channel with a SE-NW orientation. It was inherited from a local riverbed that filled up and was abandoned at the beginning of the Holocene. The stratigraphy shows that the first phase of sandy infilling of the residual channel coincides with the formation of a loamy layer in the top of the Kreftenheye Formation (KRWY-2) and the birth of the river dunes (BXDE) on relatively high parts of the floodplain (with thin occurrences of KRWY-2 accentuating differences in elevation). In the seismic images the residual channel manifested itself as a thicker occurrence of the Wijchen Member. This shows that in the lowest parts of the fluvial landscape clay sedimentation continued to take place, while in the higher parts dunes were forming (see also Section 3.4.5).
The phenomena at the top of the Formation of Kreftenheye that are encountered in the planning area display sedimentary and morphological features that are typical of meandering transitional river systems from late-glacial and Early Holocene abandonment phases. These are known also from upstream parts in the valley, for instance from earlier investigations in Rotterdam (including the excavations for the Kruisplein underground car-park in 2011, Schiltmans and van de Meer 2014), from regional studies in the western and central Netherlands (geological profiles in Busschers et al. 2007; Hijma et al. 2009; palaeogeographical maps in Cohen et al. 2012), and from areas even further upstream in the Rhine and Meuse valleys (Vandenberghe 1995; Berendsen, Hoek, and Schorn 1995; Kasse et al. 2005; Janssens et al. 2012).
In the base of the marine sands, the already mentioned younger offshore erosion channel in the southeast of the planning area is immediately evident. Further, among the patterns in the surface of the ‘Pleistocene’, only the deeper channel feature at the centre of the planning area below 18.5m - asl still appears in the base of the marine sand. This is a channel oriented SW-NE, formed as part of the estuary at the beginning of the Middle Holocene (part of the NAWO stratigraphical unit). Locally the channel feature follows the depression of the residual channel in the top of the fluvial deposits. These phenomena required closer investigation, which was the reason to select this area as Target zone East. The densified grid of corings, however, produced no archaeological indicators – apart from the weak indicator of charcoal in the Wijchen Member – and unlike in Target zone West, the researchers decided against performing invasive underwater investigation in Target zone East.
Despite post-processing to minimise the effect, the maps of surface of ‘Pleistocene’ sands and base of marine sands, apart from geologically relevant patterns, still include marginal zones with interpolation artefacts along the northern side of the harbour, in the immediate vicinity of the Target zones. This can be attributed to difficult-to-correct slope reflections in the northernmost seismic line.
3.4.5 Detailed mapping of Target zone East
Target zone East was chosen as an area for archaeological mapping because of the presence of a distinct channel feature. The rationale was that residual channels amidst the river-dune field, and likewise later-active secondary channels in the floodplain, offered lines of communication for Mesolithic man, which meant that there would be an increased chance of finding archaeological remains along these channels. For more detailed

89
mapping, two seismic lines were sailed across the channel feature and its immediate surroundings, across the locations of earlier corings and cone penetration tests (Fig. 3.9). Additional corings and CPT were performed. The seismic data and the deepest corings indicate that the depth of the channel extends to at least 28m - asl. All corings in this channel feature show a silt-laminated, clayey, estuarine channel-fill facies.
From cone penetration test CPT 8 just west of the channel feature, it is evident that immediately beside this estuarine feature also an older clayey deposit occurs. This clayey interval lay at a depth between 23 and 21m - asl: too deep to be reached in corings B37A0704/O-04 and B37A0705/O-05 (Fig. 3.10). In the detailed profile (Fig. 3.11), the deposit has been attributed to the Wijchen Member (lower part, KRWY-2). Immediately on top lies a sandy deposit whose upper surface extends to 20m - asl. This sand is regarded as a spur of the relatively thin river-dune body in Target zone East. The top of this sand deposit was encountered in cores B37A0701/O-01 to B37A0705/O-05, B37A0709/O-09, and B37A0711/O-11; towards the top it merges into the clay deposit of the Wijchen Member (lower part, KRWY). The transitional interval (sand with a few thin clay layers) is regarded as an alternation of fluvial and aeolian deposits (Section 3.3.2).
The residual channel in Target zone East, with its thickened Wijchen Member (lower part), is not the only example of a depression in the planning area. A comparable depression
B37A0721
B37A0720
B37A0719
B37A0718B37A0717
B37A0716
B37A0715
B37A0714
B37A0713
B37A0712
B37A0711B37A0710
B37A0709
B37A0708B37A0707
B37A0706
B37A0705
B37A0704B37A0703
B37A0702
B37A0701
CPT 9CPT 4
CPT 5
CPT 6
CPT 7
CPT 2
CPT 3
CPT 8
CPT 1
CPT 10
BM108
AM392
AM390
AM112
AM111
Line 31
Line 30
Line 46
Line 39
Line 41
Line 38Line 40
Line 45
Line
37
Line 34
Line 35
Line 36
Line 44Line 43
Line 42
Line 32
Line 33
Line 51
Line
52
Line 54
Line 50
Line 53
Line 49
Line 47
Line 48
Line
55
Line 56
B37A0659
B37A0658
61.800
61.800
61.900
61.900
62.000
62.000
62.100
62.100
62.200
62.200
62.300
62.300
443.
500
443.
500
443.
600
443.
600
443.
700
443.
700
443.
800
443.
800
0 50 m
Low: 33,5
´
High: 9,76
Geologisch profiel selectiegebied Oost (Afb. 3.X)
Seismische lijnen
Steekboringen fase 3
Steekboringen fase 2Sonderingen fase 2
Sonderingen Gemeentewerken Rotterdam
Diepte top ‘pleistoceen’ zand(KR en BXDE) in m - NAP
Cone penetration test by the Municipality of Rotterdam (Stage 1)Cone penetration test (Stage 3)Coring (Stage 2)Coring (Stage 3)Seismic-survey linesGeological profile, Target zone East (Fig. 3.11) Top sand (KR and BXDE) in m - aslHigh: 19,76
Low: 33,5
Fig. 3.9. Detailed map of Target zone East. Top of the Late Pleistocene and Early Holocene sand (KR and BXDE) relative to asl, with the positi-ons of the seismic-survey lines, the cone penetration tests and corings, and the course of the detailed geological profile (Fig. 3.11).

90
appears in core B37A0663/B-12 in the overview profile (Fig. 3.8). This supports the pattern analysis interpreting these depressions as a continuous residual channel feature from the Late Glacial and earliest Holocene. Closer to the channel, the top of the Pleistocene fluvial sand lies lower than it does at a greater distance (compare cores B37A0701/O-01 and B37A0709/O-09; Fig. 11). Given the relief of the Pleistocene sands on the scale of the planning area (Fig. 3.5a) and taking account of palaeogeographical considerations on an even larger scale (Hijma and Cohen 2011; Vos et al. 2011), it is likely that the residual channel followed a meandering course in an east-west direction.
The younger channel system has a finely laminated, silty-clayey fill, producing a characteristic ‘dentate’ CPT image (CPT 4A). The older residual channel at its very base has a loamy-sandy fill (this is still reckoned to KR) and was subsequently filled in with loamy clay (reckoned to KRWY-2). The bottom of the fill of the residual channel probably is of Preboreal age, but the filling-in of the depression continued well into the Boreal (cores B37A0663/B-12 and B37A0705/O-05; Section 3.6) and is partly contemporaneous with the period of dune formation and the Early Holocene deltaic drowning (BXDE, KRWY, NIBA and EC). The feature continued to be a local depression throughout the period under consideration. Shortly after the submersion of the area, at the transition to the Middle Holocene, erosion by estuarine channels took hold of these lower parts.
An important insight is that the estuarine channel of the beginning of the Middle Holocene in Target zone East bears a filial relationship to the residual channel of the Early Holocene floodplain (KR and KRWY-2). The seismic survey (in Target zone East and in the planning area as a whole) suggests that the NAWO channel followed a northeast-southwest course. In Target zone East the two features are locally aligned. Hence the reoccupation appears to be a merely local phenomenon.
3.4.6 Detailed mapping of Target zone West
The area was selected because it comprised a body of river-dune sand. The dune features were discovered as the seismic recordings were processed. In the CPT performed in the early phase of the study, the dune sands were not recognised because they have a comparatively low cone resistance. The dune-sand intervals were at first interpreted as a channel-fill facies. At the time, corings into the dune complex were not yet available.
For the detailed mapping of Target zone West, first a grid of seismic lines were sailed across the dune complex covered by deltaic sediments, and up-to-date bathymetric data were gathered (Figs 3.12 and 3.13). Subsequently extra corings and cone penetration tests were performed, more closely spaced than in the earlier stage. With the new data, the course of the most significant bounding surfaces (top of ‘Pleistocene’ sand and base of the marine sand; see Section 3.4) was plotted and modelled in 3D. In cores such as B37A0676/W-07, B37A0673/W-04, and B37A0698/W-29, hard archaeological evidence was encountered in the top of the river-dune sand. During the invasive underwater investigation from three trenches, at the sites of these three corings on the flank and foot of the dune, large archaeological samples were taken as a series of pontoon-crane large grab samples, mainly from stratigraphical units BXDE, KRWY, NIBA, and EC (Section 3.4.1). The cores and the excavated material were subjected to elaborate geological, archaeological, and archaeobotanical analysis. In this way, the soggy and later on marshy, drowning dune landscape of the Mesolithic could be reconstructed in considerable detail.
The mapping exercise showed that the river-dune body consisted of two ridges, a northwestern and a southeastern one (Fig. 3.12), which probably continue southwest beyond the Yangtze Harbour. The ridges run southwest-northeast. Two geological profiles obliquely run across the dune complex (Figs 3.14 and 3.15; the oblique transection shows the dune ridges as relatively wide features.) No obvious parabolic forms are apparent in the truncated dune ridges. The overall structure of the complex is formed by the two sandy ridges in a SE-NW direction, separated by a depression with a marshy fill (Fig. 3.14). The underwater Trenches 1 and 2 lie on the slopes on either side of this small depression. At the heart of the southeastern ridge, the marine sand overlies the dune body discordantly; the crest of the dune with the expected dark soil is absent here. The northwestern ridge is a little lower than the southeastern. Trench 3 lies more centrally on the southeastern dune ridge, at a spot where the top of the dune had been eroded (see Section 3.7).
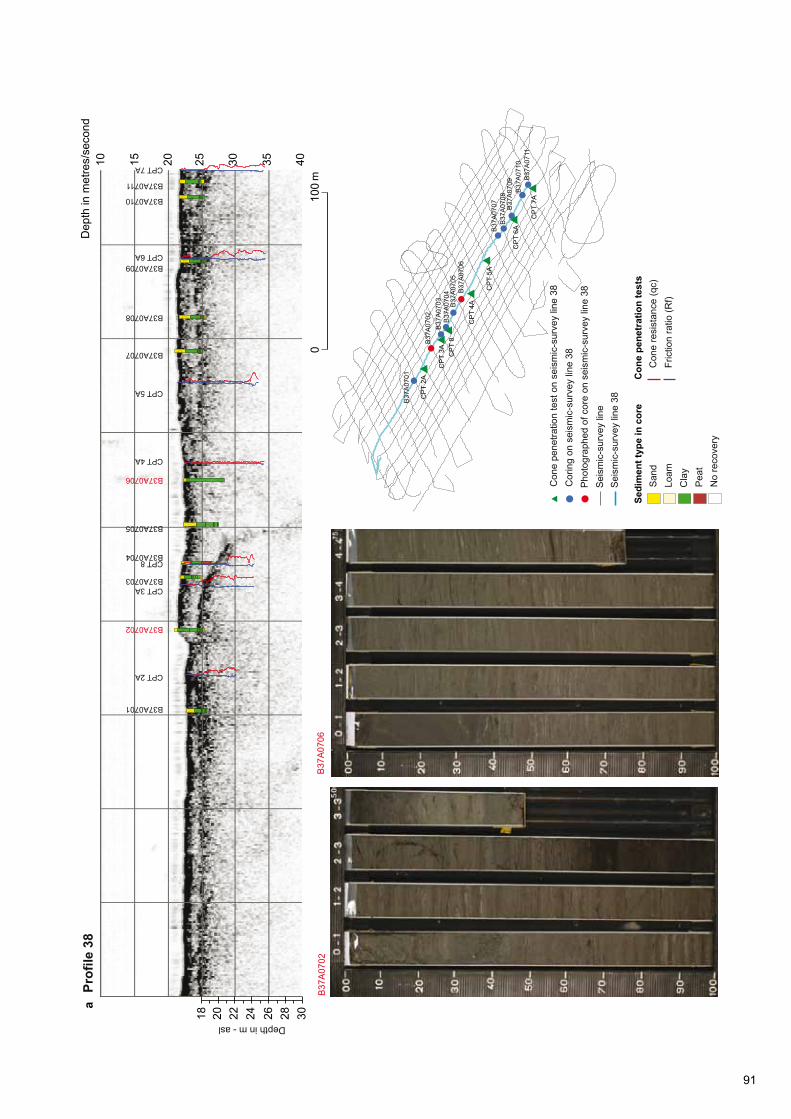
91
10 15 20 25 30 35 40
Dep
th in
met
res/
seco
nd
m
Prof
ile 3
8
!
!
!!
!!
!!
!
!!
##
#
#
#
#
#C
PT
4A
CP
T 5A
CP
T 6A
CP
T 7A
CP
T 2A
CP
T 3A CP
T 8
B37
A07
08
B37
A07
11
B37
A07
09B
37A
0710
B37
A07
06
B37
A07
02
B37
A07
01
B37
A07
07
B37
A07
03B
37A
0704
B37
A07
05
B37A0701
CPT 2A
B37A0702
CPT 3AB37A0703
CPT 8B37A0704
B37A0705
CPT 5A
B37A0707
B37A0708
CPT 6AB37A0709
B37A0710
B37A0711
CPT 7A
B37A0706
CPT 4A
B37
A07
02B
37A
0706
100
0
Depth in m - asl
18 20 22 24 26 28 30
San
dLo
amC
lay
Pea
tN
o re
cove
ry
Sedi
men
t typ
e in
cor
e
# ! !
Cor
ing
on s
eism
ic-s
urve
y lin
e 38
P
hoto
grap
hed
of c
ore
on s
eism
ic-s
urve
y lin
e 38
Sei
smic
-sur
vey
line
Sei
smic
-sur
vey
line
38
Con
e pe
netra
tion
test
on
seis
mic
-sur
vey
line
38
Con
e re
sist
ance
(qc)
Con
e pe
netr
atio
n te
sts
Fric
tion
ratio
(Rf)
a

92
10 15 20 25 30 35 40
Dep
th in
met
res/
seco
ndPr
ofile
51
!
!
#C
PT
4B
37A
0715
B37
A07
06
B37A0706
B37A0715
Cpt04
B37
A07
15B
37A
0706
18 20 22 24 26 28 30
Depth in m - asl
m10
00
San
dLo
amC
lay
Pea
tN
o re
cove
ry
Sedi
men
t typ
e in
cor
e
Con
e pe
netra
tion
test
on
seis
mic
-sur
vey
line
51# ! !
Cor
ing
on s
eism
ic-s
urve
y lin
e 51
Pho
togr
aphe
d co
re o
n se
ism
ic-s
urve
y lin
e 51
Sei
smic
-sur
vey
line
Sei
smic
-sur
vey
line
51
Con
e re
sist
ance
(qc)
Con
e pe
netr
atio
n te
sts
Fric
tion
ratio
(Rf)
Fig.
3.1
0. D
etai
led
seis
mic
-sur
vey
profi
les
in T
arge
t zon
e E
ast.
a. S
eism
ic-s
urve
y lin
e 38
; b. S
eism
ic-s
urve
y lin
e 51
.
b

93
1.0
8:
0.1
5:
1.1
6:
1.0
7:
16 18 20 22 24
16 18 20 22 24
26 28
26 28
CPT1A
CPT2A
CPT3A
CPT8A
CPT4A
CPT5A
CPT6A
CPT7A
B37A0659 / B-08
B37A0701 / O-01
B37A0702 / O-02
B37A0705 / O-05
B37A0706 / O-06
B37A0707 / O-07
B37A0708 / O-08
B37A0709 / O-09
B37A0710 / O-10
B37A0711 / O-11
B37A0703 / O-03
B37A0704 / O-04
SB
BL
NAW
O
EC
NIB
AK
RW
Y
BX
DE
KR
WY-
2
KR
SB
BL
EC
KR
WY BX
DE
KR
depth in m - asl
100
mLi
thos
trat
igra
phy
0
SB
BL:
Sou
ther
n B
ight
For
mat
ion
Sub
atla
ntic
offs
hore
(out
let)
chan
nels
/ m
arin
e sa
nd
NAW
O: N
aald
wijk
For
mat
ion
- Wor
mer
Mem
ber
Est
uarin
e de
posi
ts
EC
: Ech
teld
For
mat
ion
Fres
hwat
er ti
dal d
epos
its, f
luvi
al c
lays
NIB
A: N
ieuw
koop
For
mat
ion
- Bas
al P
eat
Pea
t, cl
ayey
BX
DE
: Box
tel F
orm
atio
n - D
elw
ijnen
Mem
ber
Riv
er-d
une
sand
KR
WY-
2: K
refte
nhey
e Fo
rmat
ion
- low
er W
ijche
n M
embe
rO
verb
ank
clay
s
KR
: Kre
ftenh
eye
Form
atio
nFl
uvia
l cha
nnel
san
ds, u
ndiff
eren
tiate
d
Wat
er
CoringsCPTs
KR
WY:
Kre
ftenh
eye
Form
atio
n - u
pper
Wijc
hen
Mem
ber
Ove
rban
k cl
ays
Wes
tE
ast
San
d
Loam
Cla
y
Pea
t
No
reco
very
Sedi
men
t typ
e in
cor
es
Con
e re
sist
ance
(qc)
Con
e pe
netr
atio
n te
sts
Fric
tion
ratio
(Rf)
Fig.
3.1
1. D
etai
led
geol
ogic
al p
rofil
e of
Tar
get z
one
Eas
t. Fo
r its
pos
ition
, see
Fig
ure
3.9.

94
B37A0671
B37A0700B37A0699
B37A0698
B37A0697
B37A0696B37A0695
B37A0694
B37A0693
B37A0692
B37A0691
B37A0690B37A0689
B37A0688
B37A0687
B37A0686
B37A0685
B37A0684
B37A0683
B37A0682
B37A0680B37A0679
B37A0678
B37A0677
B37A0676B37A0675
B37A0674
B37A0673
B37A0672
B37A0670
CPT 18
CPT 15
CPT 14
CPT 13
CPT 12
CPT 17B
CPT 16A
Line 20
Line 22
Line 24
Line 27
Line 19
Line 21Line 17
Line 18
Line 28
Line 16
Line 12
Line 13
Line 11
Line
14
Line 23Line 15Line 09
Line 07
Line 10
Line 06
Line 03Line 02Line 01
Line 05
Line 08a
Line 25
Line 04a
Line 29
Line 26
B37A0661
B37A0660AM436
AM389
AZZ191
AZZ108
AZZ107
AZZ105
AZZ104
B37A0681
61.200
61.200
61.300
61.300
61.400
61.400
61.500
61.500
61.600
61.600
443.
700
443.
700
443.
800
443.
800
443.
900
443.
900
444.
000
444.
000
0 50 m
Low: 33,5
´
High: 9,76
Geologisch profiel 2 selectiegebied West (Afb. 3.15)
Seismische lijnen
Steekboringen fase 3
Steekboringen fase 2Sonderingen fase 2
Sonderingen Gemeentewerken Rotterdam
Diepte top ‘pleistoceen’ zand(KR en BXDE) in m - NAP
Geologisch profiel 1 selectiegebied West (Afb. 3.14)
!(!(
!(
!(
!(
!(
!(
!(
!(
!(
!(!(
!(
!(
!(
!(
!(
!(
!(!(
!(
!(
!(
!(
!(
!( !(
!(
!(
!(!(
Cone penetration test by Municipality of Rotterdam (Stage 1)Cone penetration test (Stage 3)Coring (Stage 2)Coring (Stage 3)Seismic-survey lineGeological profile 1, Target zone West (Fig. 3.14)Geological profile 2, Target zone West (Fig. 3.15) Top sand (KR and BXDE) in m - aslHigh: 19,76
Low: 33,5
Fig. 3.12. Detailed map of Target zone West. Top of the Late Pleisto-cene and Early Holocene sand (KR and BXDE) relative to asl, with the positions of the seismic-survey track lines, cone penetration tests, and corings, and the course of detailed geological profiles 1 and 2 (Figs 3.14 and 3.15).
At a depth of 24 to 22m - asl, a thin bed of the KRWY-2 deposit separates the river-dune body (BXDE) from the underlying floodplain and fluvial sand (KR; Section 3.3). The higher crests of the river-dune body were eroded immediately previous to the deposition of the young marine sands (SBBL). The dividing erosive interface always lies around 18,5m - asl. In cores from locations lower down on the dune flank, the old dune surface did survive. At such locations, soil formation had stained the top of the sand brown, often to a depth of several decimetres. The sites truncated by erosion lack such evidence of soil formation, which implies that in those places marine erosion removed at least 0.5 to 1m of dune sand. It is estimated that the dune in Target zone West originally reached an elevation of 17.5 to 15m - asl.
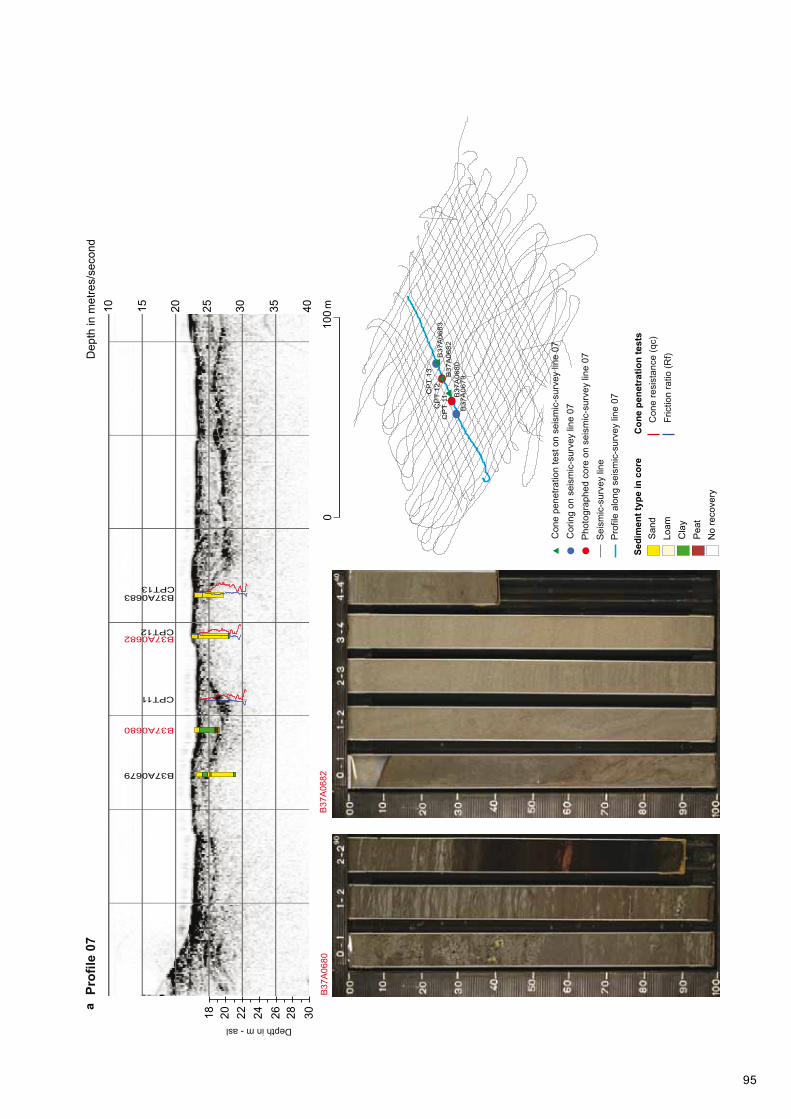
95
10 15 20 25 30 35 40
Dep
th in
met
res/
seco
nd
!!
!!
##
#C
PT
13C
PT
12C
PT
11
B37
A06
80B
37A
0679
B37
A06
82B
37A
0683
CPT11
CPT12
CPT13
B37A0679
B37A0680
B37A0683
B37A0682
B37
A06
80B
37A
0682
18 20 22 24 26 28 30m
Prof
ile 0
7
100
0
Depth in m - asl
Sedi
men
t typ
e in
cor
e
Con
e pe
netra
tion
test
on
seis
mic
-sur
vey
line
07
# ! !
Cor
ing
on s
eism
ic-s
urve
y lin
e 07
Pho
togr
aphe
d co
re o
n se
ism
ic-s
urve
y lin
e 07
Sei
smic
-sur
vey
line
Pro
file
alon
g se
ism
ic-s
urve
y lin
e 07
San
dLo
amC
lay
Pea
t N
o re
cove
ry
Con
e re
sist
ance
(qc)
Con
e pe
netr
atio
n te
sts
Fric
tion
ratio
(Rf)
a

96
10 15 20 25 30 35 40
Dep
th in
met
res/
seco
nd
!!
!
!!!
##
#C
PT
15CP
T 14
CP
T 16
A
B37
A06
90B
37A
0689
B37
A06
88B
37A
0686
B37
A06
85B
37A
0684
B37A0684
CPT14
B37A0688
B37A0689
B37A0690
B37A0686
B37A0685CPT15
CPT16A
B37
A06
86B
37A
0689
18 20 22 24 26 28 30m
Prof
ile 0
8a
100
0
Depth in m - asl
Sedi
men
t typ
e in
cor
e
Con
e pe
netra
tion
test
on
seis
mic
-sur
vey
line
08a
# ! !
Cor
ing
on s
eism
ic-s
urve
y lin
e 08
aP
hoto
grap
hed
core
on
seis
mic
-sur
vey
line
08a
Sei
smic
-sur
vey
line
Pro
file
alon
g se
ism
ic-s
urve
y lin
e 08
a
San
dLo
amC
lay
Pea
tN
o re
cove
ry
Con
e re
sist
ance
(qc)
Con
e pe
netr
atio
n te
sts
Fric
tion
ratio
(Rf)
b

97
B37
A06
85B
37A
0674
10 15 20 25 30 35 40
Dep
th in
met
res/
seco
nd
!!
!
##
CP
T 15
CP
T 11
B37
A06
96B
37A
0685
B37
A06
74CPT11B37A0674
CPT15B37A0685
B37A0696
18 20 22 24 26 28 30m
Prof
ile 2
6
100
0
Depth in m - asl
Sedi
men
t typ
e in
cor
e
Con
e pe
netra
tion
test
on
seis
mic
-sur
vey
line
26# ! !
Cor
ing
on s
eism
ic-s
urve
y lin
e 26
Pho
togr
aphe
d co
re o
n se
ism
ic-s
urve
y lin
e 26
Sei
smic
-sur
vey
line
Pro
file
alon
g se
ism
ic-s
urve
y lin
e 26
San
dLo
amC
lay
Pea
tN
o re
cove
ry
Con
e re
sist
ance
(qc)
Con
e pe
netr
atio
n te
sts
Fric
tion
ratio
(Rf)
c
Fig.
3.1
3. D
etai
led
seis
mic
-sur
vey
profi
les
in T
arge
t zon
e W
est.
a. S
eism
ic-s
urve
y lin
e 07
;b.
Sei
smic
-sur
vey
line
08A
; c.
Sei
smic
-sur
vey
line
26.

98
18 20 22 24
18 20 22 24
AZZ107
AZZ104
CPT11
CPT12
CPT13
B37A0672 / W-03
B37A0671 / W-02
B37A0670 / W-11
B37A0679 / W-10
B37A0673 / W-04
B37A0680 / W-11
B37A0674 / W-05
B37A0675 / W-06
B37A0676 / W-07
B37A0683 / W-14
B37A0687 / W-18
B37A0682 / W-13
SB
BL NAW
O EC
NIB
AK
RW
Y
BX
DE
KR
WY-
2
KR
SB
BL
NAW
OE
C
NIB
AK
RW
Y
BX
DE
KR
WY-
2
KR
San
d
Loam
Cla
y
Pea
t
No
reco
very
Lith
ostr
atig
raph
y
SB
BL:
Sou
ther
n B
ight
For
mat
ion
Sub
atla
ntic
offs
hore
(out
let)
chan
nels
/ m
arin
e sa
nd
NAW
O: N
aald
wijk
For
mat
ion
- Wor
mer
Mem
ber
Est
uarin
e de
posi
ts
EC
: Ech
teld
For
mat
ion
Fres
hwat
er ti
dal d
epos
its, f
luvi
al c
lays
NIB
A: N
ieuw
koop
For
mat
ion
- Bas
al P
eat
Pea
t, cl
ayey
KR
WY:
Kre
ftenh
eye
Form
atio
n - u
pper
Wijc
hen
Mem
ber
Ove
rban
k cl
ays
BX
DE
: Box
tel F
orm
atio
n - D
elw
ijnen
Mem
ber
Riv
er-d
une
sand
KR
WY-
2: K
refte
nhey
e Fo
rmat
ion
- low
er W
ijche
n M
embe
rO
verb
ank
clay
s
KR
: K
refte
nhey
e Fo
rmat
ion
Riv
erbe
d sa
nds,
und
iffer
entia
ted
Wat
er
Sedi
men
t typ
e in
cor
e
Pre
sum
ed o
rigin
al h
eigh
t of d
une
(BX
DE
)
CoringsCone penetration tests Wes
tE
ast
Con
e re
sist
ance
(qc)
Con
e pe
netr
atio
n te
sts
Fric
tion
ratio
(Rf)
100
m
Depth in m - asl
0
Fig.
3.1
4. D
etai
led
geol
ogic
al p
rofil
e 1
in T
arge
t zon
e W
est.
For i
ts p
ositi
on s
ee F
igur
e 3.
12.

99
CP
T17
CP
T15
CP
T14
CP
T12
B37
A06
98 /
W-2
9
B37
A06
99 /
W-3
0B
37A
0700
/ W
-31
B37
A06
95 /
W-2
6
B37
A06
86 /
W-1
7
B37
A06
82 /
W-1
3
B37
A06
75 /
W-0
6
SBBL
NAWO
EC
NIBA
KRWY
BXDE
KRWY-2KR
NAWO
EC
NIBA
KRWY-2
KR
South North
50 m0
Cor
ings
CPT
sD
epth
in m
- as
l
18
20
22
24
18
20
22
24
Sand
Loam
Clay
Peat
No recovery
Lithostratigraphy
SBBL: Southern Bight FormationSubatlantic offshore (outlet) channels / marine sand
NAWO: Naaldwijk Formation - Wormer MemberEstuarine deposits
EC: Echteld FormationFreshwater tidal deposits, fluvial claysNIBA: Nieuwkoop Formation - Basal PeatPeat, clayey
KRWY: Kreftenheye Formation - upper Wijchen MemberOverbank clays
BXDE: Boxtel Formation - Delwijnen MemberRiver-dune sand
KRWY-2: Kreftenheye Formation - lower Wijchen MemberOverbank clays
KR: Kreftenheye FormationFluvial channel sands, undifferentiated
Water
Sediment type in cores
Presumed original height of river dune (BXDE)
Cone resistance (qc)
Cone penetration tests
Friction ratio (Rf)
CP
T17
CP
T15
CP
T14
CP
T12
B37
A06
98 /
W-2
9
B37
A06
99 /
W-3
0B
37A
0700
/ W
-31
B37
A06
95 /
W-2
6
B37
A06
86 /
W-1
7
B37
A06
82 /
W-1
3
B37
A06
75 /
W-0
6
SBBL
NAWO
EC
NIBA
KRWY
BXDE
KRWY-2KR
NAWO
EC
NIBA
KRWY-2
KR
South North
50 m0
Cor
ings
CPT
sD
epth
in m
- as
l
18
20
22
24
18
20
22
24
Sand
Loam
Clay
Peat
No recovery
Lithostratigraphy
SBBL: Southern Bight FormationSubatlantic offshore (outlet) channels / marine sand
NAWO: Naaldwijk Formation - Wormer MemberEstuarine deposits
EC: Echteld FormationFreshwater tidal deposits, fluvial claysNIBA: Nieuwkoop Formation - Basal PeatPeat, clayey
KRWY: Kreftenheye Formation - upper Wijchen MemberOverbank clays
BXDE: Boxtel Formation - Delwijnen MemberRiver-dune sand
KRWY-2: Kreftenheye Formation - lower Wijchen MemberOverbank clays
KR: Kreftenheye FormationFluvial channel sands, undifferentiated
Water
Sediment type in cores
Presumed original height of river dune (BXDE)
Cone resistance (qc)
Cone penetration tests
Friction ratio (Rf)
Fig. 3.15. Detailed geological profile 2 in Target zone West. For its position see Figure 3.12.
The substantial thickness of the brown, humified soil is remarkable, for instance in core B37A06736/W-07. Also its patchy colouring was noted. No clear illuvial and eluvial horizons are present. Besides the fairly limited time for soil formation (Section 3.5), this may be explained by repeated slumping and/or washing in of humic matter from higher parts of the dune. Micromorphological studies (Section 3.6; Vos 2013 - appendix G = appendix 3.4G in the present report) have confirmed the occurrence of slope processes on the flanks of the dune. The patchiness can be explained as the work of soil organisms and maybe as treefalls. Disturbance of the soil by human trampling in the Early and/or Middle Mesolithic is also a distinct possibility. The dating evidence (OSL datings of the slumped topsoil) and micromorphological findings indicate that the disturbance occurred at the time of the marshy encasing of the foot of the dune. In core B37A0697/W-28 a thin layer of KRWY clay is only just seen to taper off between the BXDE sand with soil in its top and the NIBA layer, but such intercalations are quite rare.
CP
T17
CP
T15
CP
T14
CP
T12
B37
A06
98 /
W-2
9
B37
A06
99 /
W-3
0B
37A
0700
/ W
-31
B37
A06
95 /
W-2
6
B37
A06
86 /
W-1
7
B37
A06
82 /
W-1
3
B37
A06
75 /
W-0
6
SBBL
NAWO
EC
NIBA
KRWY
BXDE
KRWY-2KR
NAWO
EC
NIBA
KRWY-2
KR
South North
50 m0
Cor
ings
CPT
sD
epth
in m
- as
l
18
20
22
24
18
20
22
24
Sand
Loam
Clay
Peat
No recovery
Lithostratigraphy
SBBL: Southern Bight FormationSubatlantic offshore (outlet) channels / marine sand
NAWO: Naaldwijk Formation - Wormer MemberEstuarine deposits
EC: Echteld FormationFreshwater tidal deposits, fluvial claysNIBA: Nieuwkoop Formation - Basal PeatPeat, clayey
KRWY: Kreftenheye Formation - upper Wijchen MemberOverbank clays
BXDE: Boxtel Formation - Delwijnen MemberRiver-dune sand
KRWY-2: Kreftenheye Formation - lower Wijchen MemberOverbank clays
KR: Kreftenheye FormationFluvial channel sands, undifferentiated
Water
Sediment type in cores
Presumed original height of river dune (BXDE)
Cone resistance (qc)
Cone penetration tests
Friction ratio (Rf)

100
3.5 Results of the dating studies
A combination of techniques has allowed a close dating of the geological sequence. These techniques comprised numeric dating methods (radiocarbon and OSL) on samples taken from cores and excavated material, relative dating based on cross-cutting relationships and regional lithostratigraphical correlations (Section 3.4), and palynological dating based on the natural development of the vegetation succession in the Early Holocene, which can be correlated to regional reference diagrams (and their radiocarbon dating: Hoek 1997; idem 2008).
The dates attributed to the successive units (Section 3.3) follow not so much from selected individual datings as from the consistency of series of OSL and radiocarbon datings from multiple superimposed deposits. The OSL technique is suitable for dating the burial of sand in terrestrial environments: units KR and BXDE. The radiocarbon method can be applied to various kinds of organic material. This technique was useful especially for units KRWY, NIBA, EC, and NAWO, because these contained charcoal and humic sediment, and for the units BXDE and KRWY, because of the presence of charcoal and humic soils. The use of palynological dating techniques in deltaic environments is less than ideal. Since the river along with its clay also redeposits palynological material, not just developments in the local vegetation, but also those in the wider catchment area will be reflected by pollen in clayey organic sediments. For reconstructing the development of the local and regional vegetation, the NIBA Member is the most informative. The standard vegetation succession, classically described as the pollen zones Preboreal > Boreal > Atlantic (Fig. 3.3), was indeed clearly recognisable in vertical series of pollen samples derived from sediment sequences (Section 3.3).
This chapter evaluates the individual datings in detail. The accuracy of individual datings varies according to technique and also depends on the material selected for dating. For instance, single OSL dates in the Early Holocene interval have a greater uncertainty range (500 to 800 years; Section 3.5.1) than do radiocarbon dates (80 to 160 years; Section 3.5.2). When series of multiple datings are considered in sequence, the reproducibility of the dating effort is enhanced and the uncertainty in some cases can be somewhat reduced (especially for levels within KRWY, NIBA, and EC in Target zone West). By collating datings of multiple types on samples from a single level within a stratigraphical unit, the quality of the various dating methods can be compared (Section 3.5.3). In certain cases, the results of different methods diverged, because, besides the dating methods, also what had been sampled differed. In such cases an explanation of the divergence was sought, in order to decide which results should be rejected or used for dating the deposition of the stratum in question (Section 3.5.4). Radiocarbon datings of the Basal Peat Bed (NIBA) can be related to the mean water table at the time of deposition (Jelgersma 1961; van de Plassche 1982; Cohen 2005; Hijma and Cohen 2010). In these cases, the age-depth relationship offers a further opportunity for testing the consistency of a dating series (Section 3.5.5).
3.5.1 OSL datings
From cores in Target zone West, twelve samples from six cores were selected for OSL dating (Table 3.3). They included four samples from the top of the Pleistocene river sands (KR), seven samples of the base and top of the river-dune body (BXDE) and one sample of marine channel-fill sand (NAWO). The OSL datings were performed at the laboratory of the Netherlands Centre for Luminescence dating (NCL) at Delft University of Technology (NCL moved to Wageningen in 2013). The dates indicate that the body of river-dune sand was formed at the beginning of the Holocene (Preboreal to early Boreal).
3.5.2 Results of the radiocarbon datings
In all stages of the mapping exercise, samples for radiocarbon dating were taken from the cores. The organic material from the sediment selected for dating differs according to stratigraphical unit. From the Wijchen Member (upper part, KRWY), charcoal and organic matrix samples were sent in for dating, from the Basal Peat (NIBA), organic
101
matrix samples and selected plant macrofossils (seeds, buds), and from the freshwater tidal deposits (EC), ingrown reed rhizomes and fragments of alder (Alnus) wood. In the following, whenever selected datings are discussed and presented in tabular form, they are arranged according to stratigraphical unit. Section 3.6 discusses the various datings per individual core. Full lists of radiocarbon dates are included among the appendices to this chapter (Table 3.1; Vos 2013 - Appendix C = Appendix 3.4C in the present report).
The datings from cores gathered across the planning area in 2010 were performed in the radiocarbon laboratory at Poznan, Poland (Poz codes). These samples came from the following cores: B37A0653/B-02 (seven datings on KRWY, NIBA, and EC), B37A0655/B-04 (one dating of EC), B37A0656/B-05 (two datings of EC), B37A0657/B-06 (one dating of KRWY), B37A0658/B-07 (one dating of EC), B37A0659/B-08 (one dating of EC), and B37A0665/B-14 (one dating of SBBL). Three earlier datings of organic matrix from the NIBA layer in cores from the Kop van Beer area (Vos, Bunnik, Cremer, and Hennekam 2010) are also included (Section 3.6). These were performed by Beta Inc. in Miami, USA (Beta codes).
The datings of the cores gathered in 2011 in Target zones West and East were performed in the radiocarbon laboratory at the University of Groningen (GrA codes). The material selected in this stage consisted of macrofossil samples carefully picked by BIAX Consult from samples of short-lived terrestrial vegetation in the Basal Peat (see also Chapter 6). A total of two BXDE-soil and 17 NIBA-peat macrofossil samples were dated. In six cases, the NIBA macrofossil sample was analysed side-by-side with the organic matrix from the same depth, i.e. the fine organic sediment from which the coarser vegetal matter (macroscopic remains and ingrown roots) had been extracted, the aim being to compare the results from the matrix with those from the macroscopic samples. The outcome of the comparison of the six macrofossil-matrix pairs proved pre-existing matrix datings of organic Early Holocene deltaic sediments in the Rhine-Meuse estuary in the vicinity of the planning area of relevance to the present study.In Target zone East nine samples – all from the Basal Peat – were dated, from the following cores: B37A0705/O-05 (3 macroscopic and 1 matrix), B37A0707/O-07 (1 macrofossil and 1 matrix sample), and B37A0711/O-11 (2 macrofossil and 1 matrix sample). In Target zone West two samples came from the soil in the top of the river-dune sand in cores B37A0673/W-04 (1 macrofossil sample) and B37A0675/W-06 (1 macrofossil sample) and 14 samples from the Basal Peat in the cores B37A0671/W-02 (2 macrofossil and 1 matrix sample), B37A0673/W-04 (1 macrofossil sample), B37A0674/W-05 (2 macrofossil and 1 matrix sample), B37A0675/W-06 (1 macrofossil sample), B37A0688/W-19 (1 macrofossil sample), B37A0692/W-23 (1 matrix and 3 macrofossil samples), and B37A0697/W-28 (1 macrofossil sample).
The radiocarbon dates (in years BP) were recalculated into calibrated ages (years cal BC) with the program OxCal (v4.1; Bronk Ramsey 2009), with the (then) current calibration curve (IntCal09). In the text of this report, the median calibrated dates are used. For the laboratory codes and original outcomes in uncalibrated radiocarbon years, accuracy and confidence range (2σ, 95%) after calibration, the reader is referred to appendix 3.4C (= Appendix C in Vos 2013). The sample code consists of the serial number of the core and the depth in cm relative to the top of the core (in most cases the dredged harbour floor). Samples from cores from the stage of detailed mapping of Target zones West and East have serial numbers W-xx and O-xx in their codes, respectively. Samples from earlier cores have as their serial number the final four digits of the DINO core number (the map sheet number B37A having been omitted). The depth of the sample within the core was measured and its depth relative to mean sea level calculated by equating the top of the core with the depth of the harbour floor (see Section 3.4).
3.5.3 Comparing radiocarbon dates of macrofossil and matrix samples from the Basal Peat
Datings of six pairs of matrix and macrofossils from the Basal Peat were compared (Table 3.4). Because the macrofossils consisted of carefully determined and selected plant materials, their dates were in the first instance regarded as the more reliable. While this proved correct for sample O-05/353, by contrast it did not for sample W-02/328. In the

102
Cor
eD
epth
in m
- H
FD
epth
In m
- as
lSt
ratig
raph
ical
pos
ition
N
CL
num
ber
Dat
ein
cal
enda
r yea
rs
BP
Dat
e
in c
alen
dar y
ears
B
C
Bay
sian
cal
ibra
ted
age
in c
alen
dar y
ears
BC
B37
A06
76/W
-07
1.50
-1.3
819
.21-
19.0
9B
XD
E, t
op, i
n st
rong
ly h
umic
soi
l76
1221
5
8500
± 5
00
6500
± 5
0069
00 ±
300
B37
A06
76/W
-07
1.95
-1.8
519
.66-
19.5
6B
XD
E, i
n hu
mic
soi
l76
1221
6
10,4
00 ±
800
84
00 ±
800
7800
± 4
50B
37A
0676
/W-0
74.
82-4
.72
22.5
3-22
.43
KR
, clo
se to
top,
bel
ow K
RW
Y-2
7612
217
10
,900
± 7
00
8900
± 7
0098
50 ±
350
B37
A06
86/W
-17
1.75
-1.6
518
.87-
18.7
7B
XD
E, i
n hu
mic
soi
l (to
p er
oded
)76
1221
8
9900
± 5
00
7900
± 5
0077
50 ±
400
B37
A06
86/W
-17
4.45
-4.3
521
.57-
21.4
7B
XD
E, a
t gre
ater
dep
th76
1221
9
11,0
00 ±
600
90
00 ±
600
9000
± 3
50B
37A
0687
/W-1
82.
40-2
.31
19.6
0-19
.51
BX
DE
, top
, in
stro
ngly
hum
ic s
oil
7612
220
84
00 ±
500
64
00 ±
500
6850
± 3
00B
37A
0687
/W-1
83.
55-3
.43
20.7
5-20
.63
BX
DE
, in
hum
ic s
oil
7612
221
10
,700
± 6
00
8700
± 6
0089
00 ±
300
B37
A06
87/W
-18
4.40
-4.3
021
.60-
21.5
0K
R, c
lose
to th
e to
p, b
elow
KR
WY-
276
1222
2
11,5
00 ±
700
95
00 ±
700
9900
± 3
50B
37A
0692
/W-2
31.
93-1
.83
19.6
4-19
.54
NAW
O, c
hann
el-fi
ll sa
nd76
1222
3
7900
± 5
00
5900
± 5
00B
37A
0694
/W-2
54.
30-4
.20
22.1
6-22
.06
KR
, clo
se to
the
top,
bel
ow K
RW
Y-2
7612
224
12
,600
± 8
00
10,6
00 ±
800
10,
050
± 45
0B
37A
0699
/W-3
03.
50-3
.40
21.4
8-21
.38
BX
DE
, clo
se to
the
base
, abo
ve K
RW
Y-2
7612
225
11
,100
± 7
00
9100
± 7
0091
00 ±
350
B37
A06
99/W
-30
4.30
-4.2
022
.28-
22.1
8K
R, c
lose
to th
e to
p, b
elow
KR
WY-
276
1222
6
11,8
00 ±
700
98
00 ±
700
9950
± 4
00
Tabl
e 3.
5. O
SL
datin
gs o
f sam
ples
from
cor
es in
Tar
get z
one
Wes
t (W
allin
ga a
nd V
erse
ndaa
l 201
4). T
he B
ayes
ian
calib
ratio
n w
as e
xecu
ted
in O
xCal
4.2
and
invo
lves
OS
L da
tings
of t
he to
p of
KR
, OS
L da
tings
of t
he lo
wer
BX
DE
, rad
ioca
rbon
dat
es o
f the
old
est b
one
fragm
ents
, and
OS
L da
tings
of t
he s
oil i
n th
e to
p of
BX
DE
in s
ucce
ssiv
e or
der.
The
youn
gest
pos
sibl
e da
ting
of th
e hu
mic
top
of th
e riv
er-d
une
sand
is s
et a
t 650
0 B
C, c
ongr
uent
with
the
drow
ning
his
tory
of t
he d
une.

103
four other cases, the outcomes partially overlapped (both in uncalibrated and calibrated form, and taking into account the confidence range). Apparently the organic matrix at the sampled level in the Basal Peat consisted of humic material of roughly the same age as the macrofossils embedded in it. This outcome is not surprising in an environment of woodland peat with the water table gradually rising over many years.
In two cases (O-05/353 and W-02/328) there appeared a distinct difference. Matrix sample O-05/353 is almost 800 years older than its macroscopic counterpart. A part of the humic material at a depth of 353cm in core O-05 must at any rate be older than the macrofossils picked from it. The date of the macrofossil sample is here regarded as representative for the age of the local peat. The matrix sample may have incorporated local aquatic vegetable matter that was subject to hard-water effects. The dated macrofossils by contrast derived from carefully selected terrestrial riparian plants.
Matrix sample W-02/328 on the other hand proved 800 years younger than the associated macrofossil remains. In this sample, from the top of the NIBA layer in the core (B370671/W-02 at 20.80m - asl), it is the matrix date that was considered the more representative for the deposit. These deviating datings concern the very top of the Basal Peat, which is an interface that has been affected by the floodwaters that drowned the peat. The diatom and palynological analyses indicate marine influence in the top of the Basal Peat. In the other cores from the Yangtze Harbour area, marine diatoms and pollen markers of nearby marine influence (salt-marsh species) have been found only in sediments younger than 6500 BC (= 8450 cal BP). The flooding of the top of the Basal Peat in core B370671/W-02, like the matrix date, is attributed to that same period in time. The flooding process appears to have affected the topmost 22cm of the NIBA layer (307-329cm in the core). It is likely that in the flooding also macroscopic remains were washed about locally. This could explain the presence of older macroscopic material at the top of the peat layer. The presumed local reworking had not been appreciated at the time when the macroscopic sample was picked, prepared and sent in. Pollen analysis provides another argument in support of the younger date for the sediment in the top of the NIBA layer in this core. The analysis at 3.28m presents an Atlantic pollen spectrum as might be expected around 6500 BC, rather than a Boreal one corresponding with the date of 7120 BC. The results from the macrofossil sample, the thickness of the peat layer below 3.28m, the pollen spectra within it, and its elevation with respect to mean sea level, do however suggest that the peat layer locally had more-or-less attained its ultimate thickness and elevation. The age difference between the matrix and macroscopic components of this sample can therefore be attributed to flooding and the sample’s position in the very top of the NIBA deposit.
More generally, comparison of the dates of matrix and macrofossil samples from the same depth shows that dating a single matrix sample is fallible; however, when multiple matrix samples are dated the results will be as reproducible and just as consistent as in the case of a similar set of picked macrofossil samples. Matrix samples from levels within the clayey Basal Peat of the Rhine and Meuse estuary hence offer useful dating evidence for the pacing of the transgression, with a precision of 100 to 200 years, especially in the case of multiple sampling (from different cores in the area), and definitely so when combined with dating of macrofossils and with palynological analysis to verify the sedimentary environment. Having macrofossils dated is the better option, but if this cannot be effected in the short term, sending in matrix samples in the prospective stage is a sensible alternative. This conclusion relates specifically to palaeogeographical applications in the Early Holocene and beginning of the Middle Holocene in the Rhine-Meuse estuary, where swamps and marshlands expanded quite swiftly, the marshy zone – that was to become Basal Peat – shifting inland in response to relatively rapid sea-level and water-table rises. In the case of peat from later periods (‘Hollandveen Member’) and swampland closer to the edge of the coastal and deltaic plains, and in the case of use for other than palaeogeographical purposes such as palaeo-sea-level studies, the comparison of macrofossil and matrix radiocarbon dating is expected to turn out less favourable for the matrix dating.
104
Arguably more important than comparing techniques, is the conclusion that using just a single sample, whether macrofossil or matrix, to radiocarbon-date a sediment is too prone to error. Submitting a series of samples from a cored sequence is recommended, both for matrix and macrofossil samples alike. The above discussion of the dates from core B37A0671/W-02 highlights the risk of reworked macroscopic material, unrecognised as such, being erroneously selected for dating. In the case of too few datings, the reliability of neither macrofossil nor matrix samples can be verified. The discrepancies did not show until matrix and macroscopic samples were dated concurrently. In this case, the decisive arguments in favour of adoption or rejection came from the pollen and diatom analyses on the core in question and from contextual evidence supplied by neighbouring cores (of similar stratigraphy and depth below mean sea level) that had been subjected to the same multiple dating strategy.
Not only in determining dates of the Basal Peat, but also in dating humic layers in the (top of the) Wijchen Member and in the top of dune sands, the choice presents itself of sending in a matrix sample or selected macroscopic material (charcoal, root wood). What was said above about the comparability and verifiability of matrix and macroscopic samples specifically applies to the Basal Peat. The comparison works out differently when soil levels are concerned (see for instance Section 3.6.2).
3.5.4 Palynological dating and environmental research
The outcome of the pollen and diatom analyses will be briefly summarised here per stratigraphical unit and in chronological order, on the basis of a series of TNO Geological Survey of the Netherlands’ reports: Cremer (2009), Cremer and Bunnik (2009 and 2010) and Cremer et al. (2013), which are included in this chapter as appendices (Appendices 3.7, 3.6, 3.3, and 3.4F). First a total of 157 samples were scanned for diatoms and pollen by way of a pilot study. Of this set, 80 samples were formally counted, and the results elaborated in pollen and diatom diagrams. The research question for the diatom analysis concerned the aquatic environment at the time of sedimentation. Of particular palaeogeographical interest – and apparent even in the pilot scans – is where in the sequence marine influence first begins to manifest itself. Pollen analysis offers an indication of the age of the investigated succession and records the development of the vegetation in the area. The initial scans allow only rough assessments; precise counts produce greater detail and enhanced chronological resolution. On the basis of species assemblages and relative shares in the total pollen count, the core intervals that were palynologically scanned and/or counted were assigned to pollen zones A(0) to E. In the planning area, these display a marked correlation with the various stratigraphical units. These zones can be compared to the standard supraregional zoning for the Late Glacial and Early Holocene (Bølling, Allerød, Younger Dryas and Preboreal, Boreal, Atlantic, Subboreal, Subatlantic; Fig. 3.3). The ages in calendar years of these zones rest upon radiocarbon dates and correlation with the climatostratigraphy of the NGRIP core from the Greenland ice cap (Hoek 1997; idem 2008).
Lower Wijchen Member (KRWY-2): pollen zone A0Of the three investigated clayey samples, two contained pollen grains. None of the samples contained any diatom exoskeletons. The pollen spectrum is indicative of different types of vegetation simultaneously: vegetations of dry soils, local marsh vegetation consisting of reed-sedge associations, and aquatic vegetations. The environments they reflect were part of the floodplain of the Rhine-Meuse valley in the Late Glacial. Palynologically there are two possibilities: (i) slotting into the Preboreal, or (ii) slotting into the Allerød interstadial (Betula phase followed by the Pinus phase). The clearly present, redeposited component complicates identification of the exact biochronostratigraphical position of these spectra. OSL and radiocarbon datings together with the regional palaeogeography point to a Preboreal origin (Section 3.5.5).
Upper Wijchen Member (KRWY): pollen zone AThe investigated clayey samples from the Wijchen Member (upper part) contain many pollen grains of Pinus, as well as pollen of reeds and sedge-marsh vegetations, and a number of pollen types indicative of open water. The samples on the whole are devoid of diatoms. In those cases where diatoms were present, these occurred in low

105
Sam
ple
code
Stra
tigra
phy
- lit
holo
gyM
ater
ial
Dep
thin
m -
asl
Labo
rato
ry
code
D
ate
in ra
dioc
arbo
n ye
ars
BP
(± 1
σ
rang
e)
Cal
ibra
ted
age
in c
alen
dar
year
s B
C (±
2 σ
ra
nge)
Med
ian
age
in c
alen
dar
year
s B
C
O-0
5/35
3N
IBA
- cla
yey
Mat
rix20
.69
GrA
-550
3382
45 ±
40
7453
-708
672
68O
-05/
355-
351,
5N
IBA
- cla
yey
Mac
rosc
opic
rem
ains
20.7
1-20
.68
GrA
-550
0276
35 ±
40
6589
-642
964
76
O-0
7/27
5N
IBA
- cla
yey
Mat
rix19
.61
GrA
-550
3477
15 ±
40
6633
-647
065
45O
-07/
275-
272,
5N
IBA
- cla
yey
Mac
rosc
opic
rem
ains
19.6
2-19
.59
GrA
-550
1077
55 ±
40
6649
-648
365
81
O-1
1/23
5N
IBA
- cla
yey
Mat
rix19
.70
GrA
-550
3578
60 ±
40
6998
-659
766
96O
-11/
238-
235
NIB
A - c
laye
yM
acro
scop
ic re
mai
ns19
.73-
19.7
0G
rA-5
5012
7875
± 4
070
23-6
610
6726
W-0
2/32
8N
IBA
- cla
yey
Mat
rix20
.80
GrA
-550
3674
50 ±
40
6383
-625
663
21W
-02/
329-
327
NIB
A - c
laye
yM
acro
scop
ic re
mai
ns20
.81-
20.7
9G
rA-5
5014
8130
± 4
071
71-7
062
7120
W
-05/
271
NIB
AM
atrix
20.3
5G
rA-5
5037
8120
± 4
072
96-7
043
7113
W-0
5/27
2-27
0N
IBA
- cla
yey
Mac
rosc
opic
rem
ains
20.3
7-20
.35
GrA
-550
1682
20 ±
40
7355
-707
872
37
W
-23/
308
NIB
A - g
rain
s of
san
dM
atrix
20.7
9G
rA-5
5040
8280
± 4
074
69-7
184
7338
W-2
3/31
0-30
5N
IBA
- cla
yey
Mac
rosc
opic
rem
ains
20.8
1-20
.76
GrA
-550
3882
30 ±
40
7448
-708
272
48
Tabl
e 3.
6. C
ompa
rison
s of
six
pai
rs o
f rad
ioca
rbon
dat
ings
of m
atrix
and
mac
rosc
opic
sam
ples
from
var
ious
leve
ls in
the
Bas
al P
eat i
n Ta
rget
zon
es W
est a
nd E
ast.

106
concentrations and were exclusively freshwater species indicative of a sedimentation environment in shallow, stagnant water. Pollen zone A is of Preboreal to Boreal age.
Basal Peat (NIBA) with humic-clay intercalations: pollen zone BPeaty samples of the Basal Peat display a characteristic local flora, including marsh ferns, reeds, and sedge. Regional pollen (tree pollen) shows a Boreal assemblage. The top of the unit may show Atlantic traits (advent of Alnus tree pollen). Peaty samples generally lack diatoms, but where the peat has developed a clayey facies some diatoms do occur. These samples tend to be poor in diatoms and like the Wijchen Member contain only freshwater species from shallow, stagnant aquatic environments. As the radiocarbon datings also indicate, the Basal Peat Bed in the planning area formed from circa 7000 BC on, in the Boreal and the earliest Atlantic.
Clays of the Echteld Formation (EC): pollen zone C The humic, often wood-containing clays overlying the Basal Peat contain diatoms that represent a remarkable range of ecological groups. Notably, besides freshwater species, also coast-allochthonous, shallow marine diatoms occur at all depths in the deposit. These were imported through tidal action and their presence indicates that the planning area had come to experience direct influence of the sea. The overall assemblage indicates freshwater to slightly brackish open-water conditions. In a deltaic setting, this can be termed an interdistributary bay or upper-estuarine tidal floodbasin environment, characteriseded by low-lying, permanently submerged areas situated between the higher levees of the channels and the river dunes along the delta-plain margin, which in this period still were dry land.
Also the recovered pollen grains indicate that the environment – despite the incipient marine influence – still was predominantly fresh-water. The fern-rich marsh vegetations and those of open water were the most important local vegetations. Regional pollen (tree pollen) shows an Atlantic assemblage, fitting in with the obtained radiocarbon dates (circa 6500 and 6000 BC). This zone is characterised by a distinct increase in Alnus pollen and the presence of Tilia pollen. The pollen spectrum (like the drifted macroscopic remains) reflects the contemporary vegetation in the river delta and the valley upstream of the planning area (cf. Van de Woude 1984). Towards the top of the EC deposits, near the transition to the Wormer Member (NAWO), the percentages of the marsh ferns (Dryopteris) are stongly reduced, whereas marine markers (foraminifers, dinoflaggellates) and the pollen types of salt-marsh vegetations (Chenopodiaceae, Armeria) increase.
Wormer Member (NAWO): pollen zone CThe samples from this stratigraphical unit all contain diatoms. The assemblage strongly resembles that of the Echteld Formation, but the share of freshwater diatoms is reduced, which indicates a more open environment, central in the estuary. The sediments continue to be largely underwater deposits, despite the low percentages of bottom-dwelling diatom species (benthos). The marine pollen indicators increase in this layer, but there is no major trend break from spectra in the underlying Echteld Formation. The pollen zone remains the same: of Atlantic age. None of the analysed samples shows typical salt-marsh or mud-flat vegetations: riverine vegetation dominates all the pollen spectra.
Marine sand and channels of the Blight Bank Member (SBBL): pollen zones D and EObviously this layer contains marine diatoms and pollen markers. Notable is the relatively strong share of freshwater elements, which points to a steady supply of fresh water from the river and the vicinity of river mouths (the combined outflow of today’s Oude Maas and Nieuwe Maas). The pollen grains of Fagus, Carpinus, and Cerealia points to a Subboreal to Subatlantic age (pollen zone D). The offshore channel fill from core B37A0665/B-14 is relatively young (radiocarbon dating of a marine mollusc shell) and belongs to the modern era, also according to its pollen assemblage (pollen zone E).
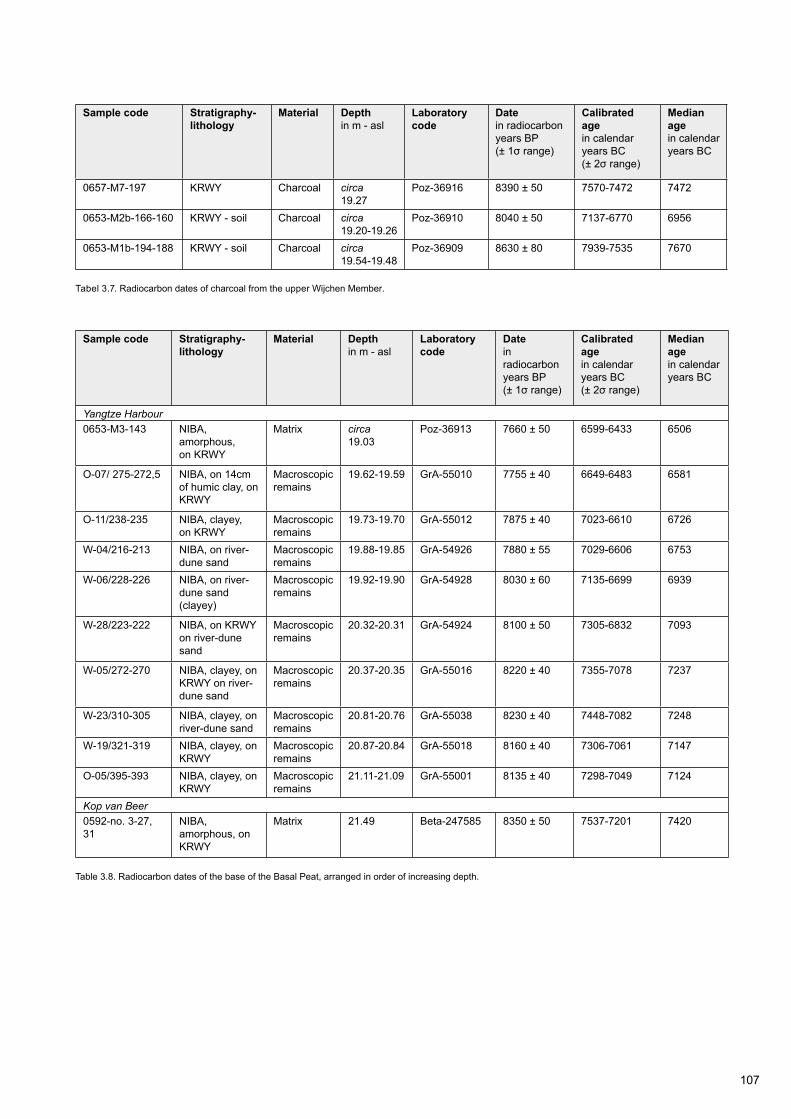
107
Tabel 3.7. Radiocarbon dates of charcoal from the upper Wijchen Member.
Sample code Stratigraphy- lithology
Material Depthin m - asl
Laboratory code
Datein radiocarbonyears BP (± 1σ range)
Calibrated agein calendar years BC (± 2σ range)
Median agein calendar years BC
0657-M7-197 KRWY Charcoal circa 19.27
Poz-36916 8390 ± 50 7570-7472 7472
0653-M2b-166-160 KRWY - soil Charcoal circa19.20-19.26
Poz-36910 8040 ± 50 7137-6770 6956
0653-M1b-194-188 KRWY - soil Charcoal circa 19.54-19.48
Poz-36909 8630 ± 80 7939-7535 7670
Sample code Stratigraphy- lithology
Material Depthin m - asl
Laboratory code
Datein radiocarbonyears BP (± 1σ range)
Calibrated agein calendar years BC (± 2σ range)
Median agein calendar years BC
Yangtze Harbour0653-M3-143 NIBA,
amorphous,on KRWY
Matrix circa 19.03
Poz-36913 7660 ± 50 6599-6433 6506
O-07/ 275-272,5 NIBA, on 14cm of humic clay, on KRWY
Macroscopic remains
19.62-19.59 GrA-55010 7755 ± 40 6649-6483 6581
O-11/238-235 NIBA, clayey, on KRWY
Macroscopic remains
19.73-19.70 GrA-55012 7875 ± 40 7023-6610 6726
W-04/216-213 NIBA, on river-dune sand
Macroscopic remains
19.88-19.85 GrA-54926 7880 ± 55 7029-6606 6753
W-06/228-226 NIBA, on river-dune sand (clayey)
Macroscopic remains
19.92-19.90 GrA-54928 8030 ± 60 7135-6699 6939
W-28/223-222 NIBA, on KRWY on river-dune sand
Macroscopic remains
20.32-20.31 GrA-54924 8100 ± 50 7305-6832 7093
W-05/272-270 NIBA, clayey, on KRWY on river-dune sand
Macroscopic remains
20.37-20.35 GrA-55016 8220 ± 40 7355-7078 7237
W-23/310-305 NIBA, clayey, on river-dune sand
Macroscopic remains
20.81-20.76 GrA-55038 8230 ± 40 7448-7082 7248
W-19/321-319 NIBA, clayey, on KRWY
Macroscopic remains
20.87-20.84 GrA-55018 8160 ± 40 7306-7061 7147
O-05/395-393 NIBA, clayey, on KRWY
Macroscopic remains
21.11-21.09 GrA-55001 8135 ± 40 7298-7049 7124
Kop van Beer0592-no. 3-27, 31
NIBA, amorphous, on KRWY
Matrix 21.49 Beta-247585 8350 ± 50 7537-7201 7420
Table 3.8. Radiocarbon dates of the base of the Basal Peat, arranged in order of increasing depth.
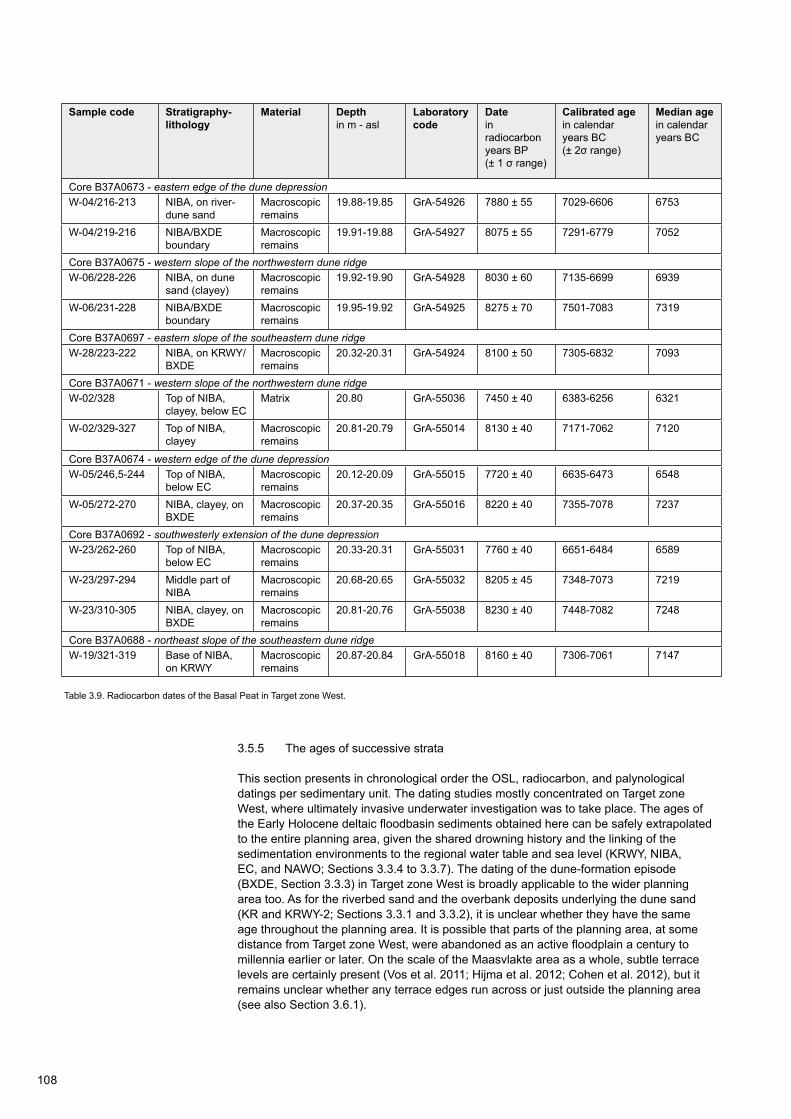
108
Sample code Stratigraphy- lithology
Material Depthin m - asl
Laboratory code
Datein radiocarbonyears BP (± 1 σ range)
Calibrated agein calendar years BC (± 2σ range)
Median agein calendar years BC
Core B37A0673 - eastern edge of the dune depressionW-04/216-213 NIBA, on river-
dune sandMacroscopic remains
19.88-19.85 GrA-54926 7880 ± 55 7029-6606 6753
W-04/219-216 NIBA/BXDE boundary
Macroscopic remains
19.91-19.88 GrA-54927 8075 ± 55 7291-6779 7052
Core B37A0675 - western slope of the northwestern dune ridgeW-06/228-226 NIBA, on dune
sand (clayey)Macroscopic remains
19.92-19.90 GrA-54928 8030 ± 60 7135-6699 6939
W-06/231-228 NIBA/BXDE boundary
Macroscopic remains
19.95-19.92 GrA-54925 8275 ± 70 7501-7083 7319
Core B37A0697 - eastern slope of the southeastern dune ridgeW-28/223-222 NIBA, on KRWY/
BXDEMacroscopic remains
20.32-20.31 GrA-54924 8100 ± 50 7305-6832 7093
Core B37A0671 - western slope of the northwestern dune ridgeW-02/328 Top of NIBA,
clayey, below ECMatrix 20.80 GrA-55036 7450 ± 40 6383-6256 6321
W-02/329-327 Top of NIBA, clayey
Macroscopic remains
20.81-20.79 GrA-55014 8130 ± 40 7171-7062 7120
Core B37A0674 - western edge of the dune depressionW-05/246,5-244 Top of NIBA,
below ECMacroscopic remains
20.12-20.09 GrA-55015 7720 ± 40 6635-6473 6548
W-05/272-270 NIBA, clayey, on BXDE
Macroscopic remains
20.37-20.35 GrA-55016 8220 ± 40 7355-7078 7237
Core B37A0692 - southwesterly extension of the dune depressionW-23/262-260 Top of NIBA,
below ECMacroscopic remains
20.33-20.31 GrA-55031 7760 ± 40 6651-6484 6589
W-23/297-294 Middle part of NIBA
Macroscopic remains
20.68-20.65 GrA-55032 8205 ± 45 7348-7073 7219
W-23/310-305 NIBA, clayey, on BXDE
Macroscopic remains
20.81-20.76 GrA-55038 8230 ± 40 7448-7082 7248
Core B37A0688 - northeast slope of the southeastern dune ridgeW-19/321-319 Base of NIBA,
on KRWYMacroscopic remains
20.87-20.84 GrA-55018 8160 ± 40 7306-7061 7147
Table 3.9. Radiocarbon dates of the Basal Peat in Target zone West.
3.5.5 The ages of successive strata
This section presents in chronological order the OSL, radiocarbon, and palynological datings per sedimentary unit. The dating studies mostly concentrated on Target zone West, where ultimately invasive underwater investigation was to take place. The ages of the Early Holocene deltaic floodbasin sediments obtained here can be safely extrapolated to the entire planning area, given the shared drowning history and the linking of the sedimentation environments to the regional water table and sea level (KRWY, NIBA, EC, and NAWO; Sections 3.3.4 to 3.3.7). The dating of the dune-formation episode (BXDE, Section 3.3.3) in Target zone West is broadly applicable to the wider planning area too. As for the riverbed sand and the overbank deposits underlying the dune sand (KR and KRWY-2; Sections 3.3.1 and 3.3.2), it is unclear whether they have the same age throughout the planning area. It is possible that parts of the planning area, at some distance from Target zone West, were abandoned as an active floodplain a century to millennia earlier or later. On the scale of the Maasvlakte area as a whole, subtle terrace levels are certainly present (Vos et al. 2011; Hijma et al. 2012; Cohen et al. 2012), but it remains unclear whether any terrace edges run across or just outside the planning area (see also Section 3.6.1).
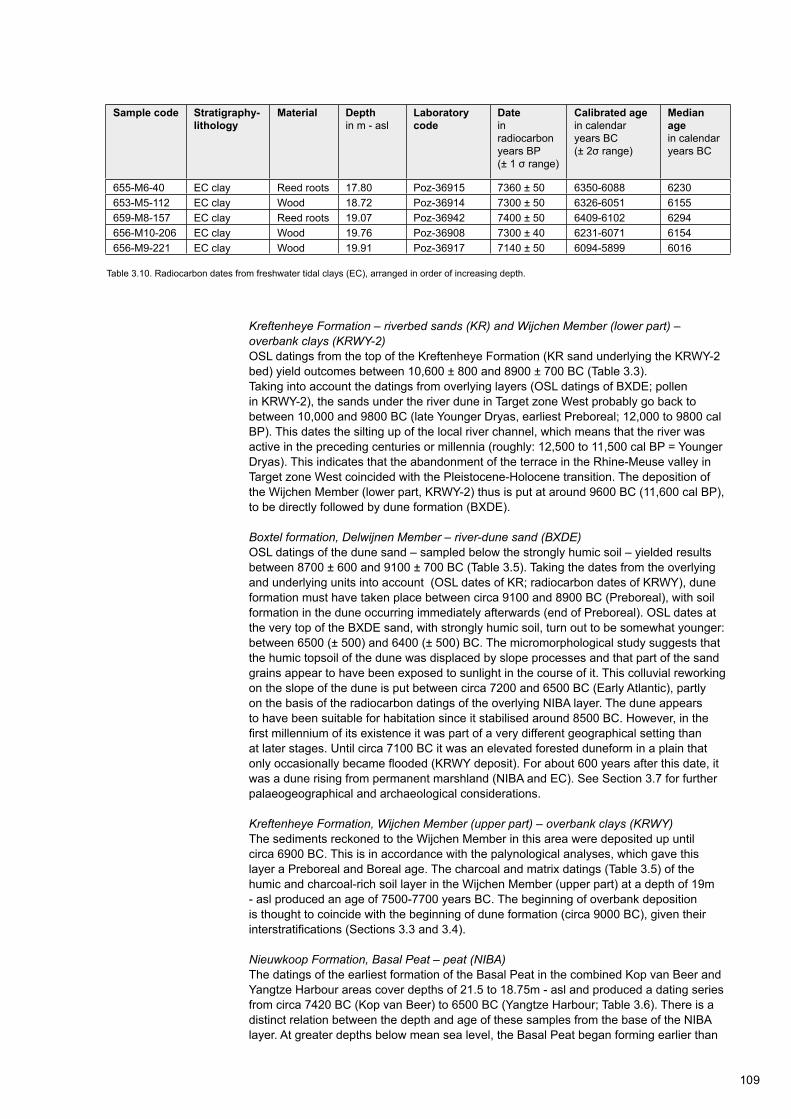
109
Table 3.10. Radiocarbon dates from freshwater tidal clays (EC), arranged in order of increasing depth.
Sample code Stratigraphy- lithology
Material Depthin m - asl
Laboratory code
Datein radiocarbonyears BP (± 1 σ range)
Calibrated agein calendar years BC (± 2σ range)
Median agein calendar years BC
655-M6-40 EC clay Reed roots 17.80 Poz-36915 7360 ± 50 6350-6088 6230653-M5-112 EC clay Wood 18.72 Poz-36914 7300 ± 50 6326-6051 6155659-M8-157 EC clay Reed roots 19.07 Poz-36942 7400 ± 50 6409-6102 6294656-M10-206 EC clay Wood 19.76 Poz-36908 7300 ± 40 6231-6071 6154656-M9-221 EC clay Wood 19.91 Poz-36917 7140 ± 50 6094-5899 6016
Kreftenheye Formation – riverbed sands (KR) and Wijchen Member (lower part) – overbank clays (KRWY-2)OSL datings from the top of the Kreftenheye Formation (KR sand underlying the KRWY-2 bed) yield outcomes between 10,600 ± 800 and 8900 ± 700 BC (Table 3.3). Taking into account the datings from overlying layers (OSL datings of BXDE; pollen in KRWY-2), the sands under the river dune in Target zone West probably go back to between 10,000 and 9800 BC (late Younger Dryas, earliest Preboreal; 12,000 to 9800 cal BP). This dates the silting up of the local river channel, which means that the river was active in the preceding centuries or millennia (roughly: 12,500 to 11,500 cal BP = Younger Dryas). This indicates that the abandonment of the terrace in the Rhine-Meuse valley in Target zone West coincided with the Pleistocene-Holocene transition. The deposition of the Wijchen Member (lower part, KRWY-2) thus is put at around 9600 BC (11,600 cal BP), to be directly followed by dune formation (BXDE).
Boxtel formation, Delwijnen Member – river-dune sand (BXDE) OSL datings of the dune sand – sampled below the strongly humic soil – yielded results between 8700 ± 600 and 9100 ± 700 BC (Table 3.5). Taking the dates from the overlying and underlying units into account (OSL dates of KR; radiocarbon dates of KRWY), dune formation must have taken place between circa 9100 and 8900 BC (Preboreal), with soil formation in the dune occurring immediately afterwards (end of Preboreal). OSL dates at the very top of the BXDE sand, with strongly humic soil, turn out to be somewhat younger: between 6500 (± 500) and 6400 (± 500) BC. The micromorphological study suggests that the humic topsoil of the dune was displaced by slope processes and that part of the sand grains appear to have been exposed to sunlight in the course of it. This colluvial reworking on the slope of the dune is put between circa 7200 and 6500 BC (Early Atlantic), partly on the basis of the radiocarbon datings of the overlying NIBA layer. The dune appears to have been suitable for habitation since it stabilised around 8500 BC. However, in the first millennium of its existence it was part of a very different geographical setting than at later stages. Until circa 7100 BC it was an elevated forested duneform in a plain that only occasionally became flooded (KRWY deposit). For about 600 years after this date, it was a dune rising from permanent marshland (NIBA and EC). See Section 3.7 for further palaeogeographical and archaeological considerations.
Kreftenheye Formation, Wijchen Member (upper part) – overbank clays (KRWY)The sediments reckoned to the Wijchen Member in this area were deposited up until circa 6900 BC. This is in accordance with the palynological analyses, which gave this layer a Preboreal and Boreal age. The charcoal and matrix datings (Table 3.5) of the humic and charcoal-rich soil layer in the Wijchen Member (upper part) at a depth of 19m - asl produced an age of 7500-7700 years BC. The beginning of overbank deposition is thought to coincide with the beginning of dune formation (circa 9000 BC), given their interstratifications (Sections 3.3 and 3.4).
Nieuwkoop Formation, Basal Peat – peat (NIBA)The datings of the earliest formation of the Basal Peat in the combined Kop van Beer and Yangtze Harbour areas cover depths of 21.5 to 18.75m - asl and produced a dating series from circa 7420 BC (Kop van Beer) to 6500 BC (Yangtze Harbour; Table 3.6). There is a distinct relation between the depth and age of these samples from the base of the NIBA layer. At greater depths below mean sea level, the Basal Peat began forming earlier than

110
it did in higher parts, which complies with expectations and existing insights linking the regional formation of Basal Peat to sea-level rise and its effect on the water table in the Rhine-Meuse Valley (Jelgersma 1961; van de Plassche 1982; van Dijk, Berendsen, and Roeleveld 1991; Cohen 2005; Hijma and Cohen 2010). In the course of circa 950 years, the level from which the Basal Peat could begin to develop rose by circa 2.75m. This means that throughout this period, the rise in the regional water table raised the level at which marsh formation could set in by an average of 0.3m per century (see also Section 3.8).
From Target zone West there is a series of datings of the base of the Basal Peat where it immediately overlies the river-dune sand. In two cases, the dated Basal Peat overlies ‘KRWY on BXDE’. These datings cover a depth range of 20.80 to 19.85m - asl and the period 7250 to 6750 BC. Depth and age of the dated samples from the base of the peat layer reflect the mean water table at the time of the peat formation: this stood at most 20cm above the level from where the dated sample came (Cohen 2005). The peat cover crept up the foot of the dune at a rate of one vertical metre in about 500 years. The datings make it clear that around 7000 BC the bulk of the dune was still clear of marsh. The dune surface above circa 20m - asl remained dry land at the time of peat formation, be it amidst changing surroundings. See Section 3.7 for further palaeogeographical and archaeological considerations. Besides datings of the beginning of peat formation (from the ‘base’ of Basal Peat), also the humic sand at the dune surface (‘BXDE-NIBA transition’) and higher levels in the peat (‘middle’ and ‘top’) were dated at multiple locations. The top of the Basal Peat (under EC, with evidence of waterborne redeposition in core B37A0671/W-02) is put between 6550 and 6300 BC by three radiocarbon datings (Table 3.7). This age matches that of a drowning event that was earlier documented for Rotterdam city centre, where archaeological research was carried out in construction trenches at Station Blijdorp and the Central Station (Cohen and Hijma 2008; Hijma and Cohen 2010; 8450 ± 44 cal BP = 6500 BC). The datings of the top of the Basal Peat in the Yangtze Harbour corroborate and support earlier conclusions concerning sea levels around 6500 - 6400 BC (Hijma and Cohen 2010). Table 3.7 presents all radiocarbon dates of the Basal Peat in Target zone West, with special attention to sample positions vis-à-vis dune morphology (see also Section 3.6).
Because of the slight time-depth differences and the relatively broad uncertainty range of the datings, it is difficult to be precise about the time-depth relations of the peat’s encroachment on the dune body. As some of the samples come from the central depression and others from the dune flanks open to the valley, we cannot assign to the full assemblage of datings a single time-depth relationship linked to a rise in the water table. The obtained series of datings does seem to corroborate the notion of a gradually progressing water-table rise and vertical peat encroachment, as was observed in the Atlantic at the base of the Rhine-Meuse delta (Cohen 2005) and also has been postulated for the Maasvlakte area in the Boreal (Hijma and Cohen 2010; see Section 3.7). Given their age, the dated samples from the base of the Basal Peat on the foot and the flank of the dune in Target zone West, particularly in the dune depression, lie higher with respect to mean sea level than do those in the wider planning area, including Target zone East, beyond, in the Kop van Beer (Vos and de Vries 2007), and further surroundings (Hijma and Cohen 2010). Locally higher water tables may explain these differences. A similar argument was invoked earlier to explain the time-depth relations in dated ‘Basal Peat’ in depressions within larger dune complexes in the Rhine-Meuse valley (Jelgersma 1961; van de Plassche 1982) and on coversand slopes along the northern and southern margins of the delta (van de Plassche 1982; Cohen 2005). Those dates too turned out ‘superelevated’ compared to curves compiled from data gathered along the flanks of isolated dunes in the central part of the delta (Jelgersma 1961; van de Plassche 1982). The higher landforms adjoining Target zone West to the southwest suggest that a locally elevated palaeowatertable prevailed also in this part of the Yangtze Harbour.
Echteld Formation – freshwater tidal deposits (EC)Shortly after 6500 BC, most of the Yangtze Harbour became covered with the organically rich clays of the Echteld Formation. The datings of wood from the EC clay (Table 3.8) indicate that this stratigraphical unit continued being formed up until circa 6000 BC, reed rooting being present up to about 6250 BC. The dates from this freshwater tidal clay in the Yangtze Harbour area match and corroborate earlier conclusions relating to the eventual
111
drowning of terrestrial marshlands below the present Maasvlakte. Around 6500 BC, this landscape was almost instantaneously (in a period of a month to a year) replaced by freshwater tidal mudflats. The boundary between NIBA and EC marks the actual moment of transgression. In the course of a few centuries, this environment evolved into more open and brackish tidal water. These developments can be related regionally and globally to a marked acceleration of the sea-level rise in this very period and, in the southern North Sea, at this very depth range (Hijma and Cohen 2010; Section 3.7).
Naaldwijk Formation, Wormer Member – estuarine deposits (NAWO)A single OSL dating of estuarine channel-fill sand (NAWO) yielded a date of 5900 ± 500 BC. The suitability of OSL for dating channel-fill sands from transgressive estuarine contexts is as yet unproven and its deployment in this project must be regarded as experimental. A smaller grain size was selected for the measurements on this NAWO-OSL sample, than for the other, above-mentioned OSL samples from units KR and BXDE. On the basis of radiocarbon dates of reed rhizomes from the underlying EC clay, an age of circa 6000 BC (or even somewhat younger) is to be expected . It is likely that coarser sand grains in the channel just before their deposition – transported in relatively deep water, central in the estuary and with flocculating sediment higher up in the water column – were not exposed to full sunlight, resulting in ‘too old’ a date in the preliminary OSL reporting (featured in Vos 2013, 31-32). The estuarine channels are thought to have received their sandy fill mainly from eroded river dunes and Early Holocene deltaic river-mouth deposits in the immediate vicinity. The apparent age of these sands matches the date obtained from the channel sands. The sampled channel feature is taken to date from circa 6000 BC.
3.6 Results from the corings
The results of a selection of research corings (Figs 3.16 and 3.17; Table 3.9) from the Yangtze Harbour area are described below. Quite a large number of corings were performed as part of the mapping exercise. On the one hand this documented the overall stratigraphy of the subsoil of the Yangtze Harbour (reported in Section 3.3), and on the other, unusual features in the area could be identified, where the stratigraphy locally deviated (for instance in the lowermost points of the drowned landscape; discussed in Section 3.4). This resulted in a well-founded choice of Target zones and the decision to perform the invasive underwater investigation in Trenches 1, 2, and 3 (Target zone West). Whereas the earlier parts of this chapter dealt with the geological structure and chronology of the deposits area by area, this part will present the results and findings from the individual cored sequences, with an emphasis on integrating the geological findings with the dating and palaeo-environmental research. This integration will also highlight the importance of understanding a core’s position in the palaeolandscape (proximal-distal, lower-higher, wetter-drier) for interpreting its stratigraphy and chronology. A full overview of the corings performed in the planning area is part of the appendices to Chapter 2 (Appendix 2.1). All core data – and photos – can also be viewed online, on http://www.dinoloket.nl (TNO Geological Survey of the Netherlands). Elaborate radiocarbon dating and pollen and diatom analyses were performed (scans, formal counts, chronology, and environmental interpretations) on several selected cores, from which pollen and diatom samples were prepared. Micromorphological studies were carried out on two cores. These studies were reported in a number of monographs and as such incorporated in the set of appendices to the present chapter (Table 3.1). To start with, the results of the radiocarbon dating and the pollen and diatom analyses were integrated with the core descriptions for the landscape-genetic study (Table 3.1; Vos 2013 - Appendix H = Appendix 3.4H in the present report). During the writing of this chapter, the study was being expanded by also including the cores used for OSL dating and the micromorphological analysis, as well as the cores investigated by BIAX Consult (Appendix 3.10).
All of the core descriptions presented below are accompanied by the following records as well: a photo of the core, lithostratigraphical logging, the termination depth of the coring below the dredged harbour bottom (HF), depths with respect to mean sea level, and an indication of the level of palynological analysis (evaluating scan or full count). The sample codes incorporate not only the serial number of the coring, but also the depth of the sample within the core (in cm below the harbour floor).

112
Fig. 3.16. Top of the Late Pleistocene and Early Holocene sand (KR and BXDE) relative to asl, with the location and research type per coring in the Yangtze Harbour planning area.
B37A0661
B37A0705
B37A0707
B37A0711
B37A0656
B37A0663
B37A0653B37A0665
B37A0652
0 500 m
61.000
61.000
62.000
62.000
63.000
63.000
64.000
64.000
443.
000
443.
000
444.
000
444.
000
< 18.018.5 - 18.019.0 - 18.519.5 - 19.020.0 - 19.520.5 - 20.021.0 - 20.521,5 - 21.022.0 - 21.522.5 - 22.023.0 - 22.524.0 - 23.0> 24.0
Top sand in m - asl.
0 500 m
61.000
61.000
62.000
62.000
63.000
63.000
64.000
64.000
443.
000
443.
000
444.
000
444.
000
0 500 m
61.000
61.000
62.000
62.000
63.000
63.000
64.000
64.000
443.
000
443.
000
444.
000
444.
000
B37A0661
B37A0705
B37A0707
B37A0711
B37A0656
B37A0663
B37A0653B37A0665
B37A0652
0 500 m
61.000
61.000
62.000
62.000
63.000
63.000
64.000
64.000
443.
000
443.
000
444.
000
444.
000
Seismic-survey line 1 with shot pointsSeismic-survey line 2 with shot pointsSeismic-survey line 3 with shot points
B37A0661
B37A0705
B37A0707
B37A0711
B37A0656
B37A0663
B37A0653B37A0665
B37A0652
0 500 m
61.000
61.000
62.000
62.000
63.000
63.000
64.000
64.000
443.
000
443.
000
444.
000
444.
000
B37A0661
B37A0705
B37A0707
B37A0711
B37A0656
B37A0663
B37A0653B37A0665
B37A0652
0 500 m
61.000
61.000
62.000
62.000
63.000
63.000
64.000
64.000
443.
000
443.
000
444.
000
444.
000
B37A0661
B37A0705
B37A0707
B37A0711
B37A0656
B37A0663
B37A0653B37A0665
B37A0652
0 500 m
61.000
61.000
62.000
62.000
63.000
63.000
64.000
64.000
443.
000
443.
000
444.
000
444.
000
Target zone WestTarget zone EastEdge of Yangtze Harbour (2011)
B37A0661
B37A0705
B37A0707
B37A0711
B37A0656
B37A0663
B37A0653B37A0665
B37A0652
0 500 m
61.000
61.000
62.000
62.000
63.000
63.000
64.000
64.000
443.
000
443.
000
444.
000
444.
000
B37A0661
B37A0705
B37A0707
B37A0711
B37A0656
B37A0663
B37A0653B37A0665
B37A0652
0 500 m
61.000
61.000
62.000
62.000
63.000
63.000
64.000
64.000
443.
000
443.
000
444.
000
444.
000
!(
!
!
!
!
!
!
Subsampled corings (Stage 3)
3.6.1 Kop van Beer
Core B37A0592This core (Vos and de Vries 2007) contained amorphous Basal Peat, immediately overlying the Wijchen Member (upper part, KRWY). The core comes from the close vicinity of the Yangtze Harbour, at a slightly more northeasterly location, where the Wijchen Member (lower part, KRWY) and the Basal Peat (NIBA) lie about a metre lower than in the actual Yangtze Harbour. Three radiocarbon dates (all matrix samples) from the Basal Peat, with a depth between 21.58 and 21.49m - asl, overlap within each other’s standard deviations. Their calibrated ages lie between 7511 and 7383 BC, which puts 7450 BC at 21.5m - asl. Pollen analysis supports the Boreal age of the Basal Peat in this core. Also the topmost 10 cm of the Wijchen Member is palynologically dated to the Boreal. Below it, the KRWY has a Preboreal spectrum (Vos et al. 2010b). The Basal Peat and the Wijchen Member (lower part) were on the whole poor in diatoms. The few encountered diatoms all belong to freshwater species. Both the Wijchen Member (lower part, KRWY) and the Basal Peat (NIBA) represent fully freshwater environments. In the case of KRWY it was
OSL dating
Micromorphology
Pollen and diatoms
Pollen, diatoms, and radiocarbon dating
Pollen, diatoms, radiocarbon dating, and OSL dating
Pollen, macroscopic remains, and radiocarbon dating
No specialist research

113
61.200
61.200
61.300
61.300
61.400
61.400
61.500
61.500
61.600
61.600
443.
600
443.
600
443.
700
443.
700
443.
800
443.
800
443.
900
443.
900
444.
000
444.
000
0 50 m
Top sand in m - asl.
< 18.50
18.75 - 18.50
19.00 - 18.75
19.25 - 19.00
19.50 - 19.25
19.75 - 19.50
20.00 - 19.75
20.25 - 20.00
20.50 - 20.25
20.75 - 20.50
21.00 - 20.75
21.25 - 21.00
21.50 - 21.25
> 21.50
!( OSL datingInvasive underwater investigation (Stage 4)
Target zone West
Edge of planning area
Micromorphology
Pollen and diatoms
Pollen, diatoms, and radiocarbon dating
Pollen, diatoms, radiocarbon dating, and OSL dating
Pollen, macroscopic remains, and radiocarbon dating
Subsampled corings (Stage 3)
No specialist research
!
!
!
!
!
!
!(
!(
!(
!(
!(
!
!
!
!
!
!
!
!
!
!
!
!
!
!!
!
!
!
!!
!
!!
!!
!
B37A0672
B37A0671B37A0670
B37A0691
B37A0679
B37A0673
B37A0692
B37A0694B37A0693
B37A0680B37A0681B37A0674
B37A0675B37A0676
B37A0682
B37A0677B37A0678
B37A0683
B37A0690
B37A0689B37A0688
B37A0687B37A0686
B37A0697B37A0696B37A0685B37A0695B37A0684
B37A0698B37A0699
B37A0700
Fig. 3.17. Top of the Late Pleistocene and Early Holocene sand (KR and BXDE) relative to asl, with the location and research type per core in Target Zone West.
a floodplain environment relatively close to the active river, which during part of the year was subject to soil formation, when it fell dry after seasonal inundation. NIBA reflects a depositional environment with wetter conditions: a floodbasin that was largely waterlogged throughout the year (Section 3.3). The transition from KRWY to NIBA indicates increased frequency of flooding and extended duration of individual inundation episodes, coupled with deteriorating drainage conditions.
At the Kop van Beer, the transition from floodplain (KRWY) to floodbasin (NIBA) environment set in earlier than at the Yangtze Harbour. This corresponds with the somewhat greater depth of the Pleistocene surface and its more northerly, seaward location. The valley surface lay lower here and the area was located closer to the active river channel, which meant that it was more regularly flooded. The differences in elevation can be attributed to subtle terracing within the valley around the Yangtze Harbour. This resulted from the change in river style due to the change in the rivers’ discharge regime and valley, gradient and the reduced active channel belt width, at the transition from the Pleistocene to the Holocene (Section 3.7). In a north-south section across the Rhine-Meuse valley, the differences in elevation between terraces originating from various
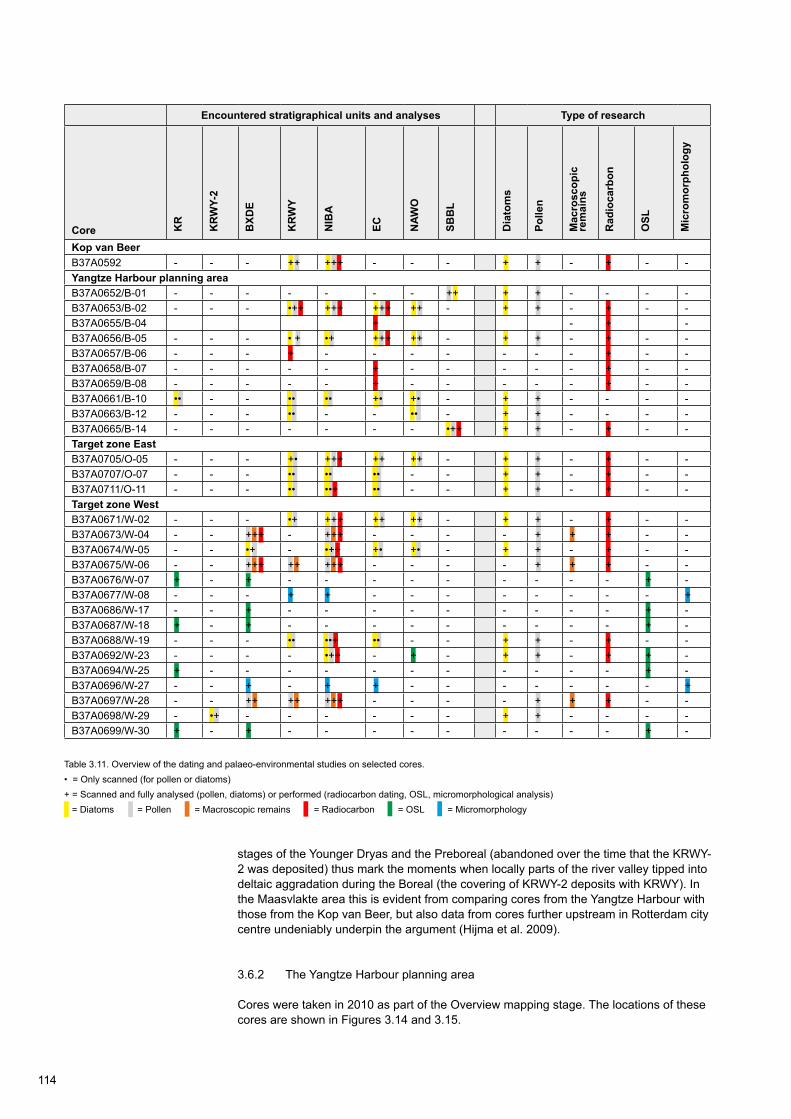
114
Table 3.11. Overview of the dating and palaeo-environmental studies on selected cores.• = Only scanned (for pollen or diatoms)+ = Scanned and fully analysed (pollen, diatoms) or performed (radiocarbon dating, OSL, micromorphological analysis)
Encountered stratigraphical units and analyses Type of research
Core KR
KR
WY-
2
BXD
E
KR
WY
NIB
A
EC NAW
O
SBB
L
Dia
tom
s
Polle
n
Mac
rosc
opic
re
mai
ns
Rad
ioca
rbon
OSL
Mic
rom
orph
olog
y
Kop van BeerB37A0592 - - - ++ +++ - - - + + - + - -Yangtze Harbour planning area B37A0652/B-01 - - - - - - - ++ + + - - - -B37A0653/B-02 - - - •++ +++ +++ ++ - + + - + - -B37A0655/B-04 + - + -B37A0656/B-05 - - - • + •+ +++ ++ - + + - + - -B37A0657/B-06 - - - + - - - - - - - + - -B37A0658/B-07 - - - - - + - - - - - + - -B37A0659/B-08 - - - - - + - - - - - + - -B37A0661/B-10 •• - - •• •• +• +• - + + - - - -B37A0663/B-12 - - - •• - - •• - + + - - - -B37A0665/B-14 - - - - - - - •++ + + - + - -Target zone EastB37A0705/O-05 - - - +• +++ ++ ++ - + + - + - -B37A0707/O-07 - - - •• •• •• - - + + - + - -B37A0711/O-11 - - - •• ••+ •• - - + + - + - -Target zone WestB37A0671/W-02 - - - •+ +++ ++ ++ - + + - + - -B37A0673/W-04 - - +++ - +++ - - - - + + + - -B37A0674/W-05 - - •+ - •++ +• +• - + + - + - -B37A0675/W-06 - - +++ ++ +++ - - - - + + + - -B37A0676/W-07 + - + - - - - - - - - - + -B37A0677/W-08 - - - + + - - - - - - - - +B37A0686/W-17 - - + - - - - - - - - - + -B37A0687/W-18 + - + - - - - - - - - - + -B37A0688/W-19 - - - •• ••+ •• - - + + - + - -B37A0692/W-23 - - - - •++ - + - + + - + + -B37A0694/W-25 + - - - - - - - - - - - + -B37A0696/W-27 - - + - + + - - - - - - - +B37A0697/W-28 - - ++ ++ +++ - - - - + + + - -B37A0698/W-29 - •+ - - - - - - + + - - - -B37A0699/W-30 + - + - - - - - - - - - + -
stages of the Younger Dryas and the Preboreal (abandoned over the time that the KRWY-2 was deposited) thus mark the moments when locally parts of the river valley tipped into deltaic aggradation during the Boreal (the covering of KRWY-2 deposits with KRWY). In the Maasvlakte area this is evident from comparing cores from the Yangtze Harbour with those from the Kop van Beer, but also data from cores further upstream in Rotterdam city centre undeniably underpin the argument (Hijma et al. 2009).
3.6.2 The Yangtze Harbour planning area
Cores were taken in 2010 as part of the Overview mapping stage. The locations of these cores are shown in Figures 3.14 and 3.15.
= Diatoms = Pollen = Macroscopic remains = Radiocarbon = OSL = Micromorphology
115
Core B37A0652/B-01This core consists of offshore outlet channel deposits (SBBL). On the grounds of their pollen content, the channel sediments can be placed in the Subboreal or (early) Atlantic.
Core B37A0653/B-02In this core, Basal Peat (NIBA) was encountered immediately on top of the Wijchen Member (KRWY) and covered by freshwater tidal clay (EC). In the Wijchen Member (upper part) two humic soil levels had developed, both rich in charcoal remains and sampled for radiocarbon dating. Charcoal and matrix samples were sent in with diverging results. Precedence was given to the charcoal dates. The matrix date from the upper humic layer (0653-M2b/166-160: KRWY) is clearly too old, given the presence of younger charcoal 30cm below it. The matrix date of the lower humic layer seems a bit too young, in part because the pollen spectrum at this depth in the Wijchen Member still has a Preboreal composition.
The matrix date of the base of the Basal Peat (0653-M3/143; 6506 BC) seems reliable (Section 3.5.3). With this outcome the youngest beginning of Basal Peat formation in the area has been established in this core (Table 3.6). For the relatively isolated cores gathered in the initial mapping stage, the elevation of the dredged-out harbour floor was less accurately documented than for the corings performed later in the Target zones. This has implications for the depth, around 19.03m - asl, of this youngest date of Basal Peat expansion. Possibly the harbour depth has still been underestimated and the sample came from 10-30cm further down. Even then, this youngest base of Basal Peat sample occupied a relatively high spot in the palaeolandscape. The core is located at some distance from the Target zones, outside the immediate influence of the river-dune complex and its water table. As a result of regular floodings, the Wijchen Member has built up to a comparatively high level. At its base the Basal Peat was formed in a distinctly freshwater environment, but towards the top the peat is increasingly clayey, and diatom analysis shows the first marine effects (incidental contact, as in a storm surge). Even in the closing phase of peat formation, the water was predominantly fresh. These indications continue into the bottom of the clays that cover the Basal Peat: these were deposited in a freshwater to slightly brackish environment (freshwater tidal clay, EC). The dates of the top of the Basal Peat (0653-M5/122) and the wood in the Echteld Formation (0653-M4/135) indicate that the clay in this layer was formed between circa 6500 (Table 3.7) and 6200 BC (Table 3.8).
Core B37A0656/B-05This core displayed the full sequence of Wijchen Member (KRWY), Basal Peat (NIBA), freshwater tidal clay (Echteld Formation, EC), and estuarine clay (Wormer Member, NAWO). The lowermost samples of the Wijchen Member (B-05/303) provided a palynological date in the Preboreal. Above it, the Wijchen Member and the Basal Peat present Boreal pollen spectra.
Two radiocarbon dates of pieces of wood are available from the top of the freshwater tidal clay, with ages between 6100 and 6000 BC. Pollen analysis puts both the EC and the NAWO deposits in the Atlantic. Diatom analysis shows that the earliest marine markers are found at the base of the Echteld Formation (sample B-05/242) and that the density of marine elements increases towards the top of the core, whereas the underlying sediments were clearly deposited in a fully freshwater environment.
Core B37A0661/B-10In this core, the Basal Peat (NIBA) was encountered directly on top of the Wijchen Member (KRWY) and covered by humic clays (EC) which upwards merged into estuarine clay (NAWO). No radiocarbon datings were performed. The base of the Wijchen Member (upper part) has a Preboreal pollen spectrum, and in the evaluating scan the overlying deposit was classed as Boreal. This tentative classification at this location continues into the humic clays, whereas in other cores this transition consistently produces early Atlantic pollen spectra. The uppermost sample in the humic clays (B-102/216) shows the first allochthonous marine diatoms. This level has been recognised also in cores in the vicinity, where it was dated to circa 6500 BC. Higher up, the diatom content in the sediment is typical of a brackish-marine environment.

116
Core B37A0663/B-12This core contained the Wijchen Member (KRWY), covered by estuarine clay (Wormer Member, NAWO). There was no evidence of the Basal Peat (NIBA) or the freshwater tidal clay of the Echteld Formation (EC). Moreover, the sedimentology of the Wijchen Member in this core deviates from the general picture. The lithofacies displays many thin, loamy layers and can be regarded as a residual-channel fill facies. Presumably the coring was made in an extension of the residual channel identified in Target zone East (Section 3.4; Figs 3.9-3.11). Palynological evidence offers a Boreal picture in the lower part (KRWY; local residual-channel facies). The bottom-most pollen sample (3.96m - HF) appears still to be Preboreal.
Towards the top, there is a silty-layered clayey facies, typical of the Wormer Member (NAWO). The estuarine conditions are corroborated by marine diatoms. Near the base of this interval, (2.90m - HF), freshwater diatom species still predominate over marine ones. Around 3.17m - HF also some wood appears. Presumably this is a reworked layer and hence a discontinuity at the base of the NAWO layer. The pollen spectra were interpreted in the same sense: at the base of the presumed reworked layer the picture is predominantly Preboreal; immediately above it, the pollen spectrum is Atlantic. The disturbed interval between 3.25 and 3.05m - HF therefore can also be regarded as a local channel-fill facies. The interval is more distinctly layered but less humic than the fluvial clays in the NIBA and EC strata; it may have been formed in the same period. The absence of the Basal Peat or a contemporaneous organic residual-channel facies, reworked or not, is another exceptional feature. An explanation can be that channel scouring in the estuarine phase locally cut into unconsolidated fresh EC channel-fill facies. The reworking might have started even in the phase of freshwater tidal deposits (i.e. contemporaneous with EC deposition elsewhere). Strongly deviating from all the above, the topmost sample (at 0.07m - HF) presents an early Atlantic pollen spectrum. The very top of this core is reckoned to the SBBL unit.
Core B37A0665/B-14This core consists of offshore channel deposits (SBBL). The topmost part, down to 19.50m - asl, is very recent (post-medieval), given the radiocarbon date of a marine mollusc shell. The channel-fill deposits below 19.50m - asl have been palynologically dated to at least 1500 to 2000 years earlier (Roman or pre-Roman period).
3.6.3 Target zone East
These are cores taken in 2011, in the stage of detailed mapping as described in Chapter 2.
Core B37A0705/O-05 This core presented the full sequence of the Wijchen Member (KRWY), Basal Peat (NIBA), Echteld Formation (EC), and Wormer Member (NAWO). The core was taken beside the channel-shaped depression near the top of the Pleistocene sands. Three datings of macroscopic remains from the Basal Peat are available, dating the formation of this deposit to between 7100 and 6500 BC. At the top of the Basal Peat (O-05/347) the first allochthonous marine diatoms were encountered. This level dates from circa 6476 BC, given the radiocarbon date from 10cm lower down (O-05/355-351). In sample O-05/151 a few allochthonous pollen grains resembling Cerealia pollen types were found (probably representing a coastal grass species; not evidence of very early agriculture) in an otherwise coastal-vicinity Atlantic pollen spectrum. Other than its depth might suggest, the formation of the Basal Peat started relatively late at this site. In this core the underlying channel fill may have become more strongly compacted since the peat started forming, which might explain the deviating time-depth relationship of the dated peat. Pollen analysis puts the deposition of the Wijchen Member clays in the Boreal, which agrees with the radiocarbon datings (sample O-05/395-387). The detailed profile across Target zone East (Fig. 3.11) extrapolates wind-blown dune sand in the channel fill and presumes the filling to have predominantly taken place in the Preboreal (locally very thick deposit of KRWY-2, inferred from seismic data). The alternative is to regard a larger part of the residual-channel fill as of Boreal age. In that case we should envisage intercalated dune sand as of Boreal origin. Intercalated dune

117
sand must then be envisaged somewhat deeper in the fill, while the KRWY-2 part of the channel fill must have been somewhat thinner and the KRWY part thicker.
Core B37A0707/O-07 The sequence of Wijchen Member (KRWY), Basal Peat (NIBA) and the Echteld Formation (EC) shows up in this core. In contrast to the general picture, the transition from KRWY to NIBA in this core is a gradual one. In the 2.91 to 2.75m - HF interval, a humic, clayey deposit was intercalated between the strongly humic top of the KRWY and the base of the actual Basal Peat. The humic clay is a local floodbasin clay and here can be regarded lithostratigraphically as a sublayer of the Basal Peat (Section 3.3.5).
A paired dating of matrix and macroscopic remains from the base of the Basal Peat was performed (Table 3.4). The results of the double dating matched up well (6581 BC). Pollen analysis indicates a Preboreal age for all deposits below this level. The first evidence of marine diatoms was found directly above the radiocarbon-dated level, in sample O-07/265. The intercalated humic clay presumably represents the period 7000 (2.91m) to 6500 BC (2.75m).
Core B37A0711/O-11 This core displayed the sequence Wijchen Member (KRWY), Basal Peat (NIBA), and Echteld Formation (EC). Two dates are available from the Basal Peat in this core, with ages between 6400 and 6750 BC. The pollen at this point indicates a date in the Atlantic. The earliest marine evidence is found in the first clayey sample above the Basal Peat (O-11-233; at 2.23m in the core, which has its end depth at 2.90m) and hence in this core also postdates 6500 BC. Below it, the Basal Peat and the Wijchen Member are purely fluvial, the latter with Boreal pollen spectra.
3.6.4 Target zone West
These are cores taken in 2011, in the stage of detailed mapping as described in Chapter 2.
Core B37A0671/W-02 Although the full sequence of the Wijchen Member (KRWY), Basal Peat (NIBA), Echteld Formation (EC), and Wormer Member (NAWO) is represented in this core, the Basal Peat has proven itself atypical here. First, its base in this core lies at an unusually great depth for Target zone West, between 20.81 and 20.60m - asl. Furthermore, a paired macrofossil-and-matrix radiocarbon sample, from 3.28m deep in the core, yielded divergent results (Table 3.4). The accumulation of the original peaty layer at this depth must be put between circa 7125 and 6900 BC, but the deposit was subsequently inundated and reworked (see also Section 3.5.3). The topmost 22cm of ‘inundated Basal Peat’ shows marine diatoms in assemblages comparable to those at the base of the freshwater tidal clays (EC). The inundation must have taken place around 6450 BC, which is congruent with the result from the matrix sample and the datings from the NIBA-EC boundary in the vicinity (Sections 3.5.4 and 3.5.5).
Below 3.28m, the NIBA Member appears alternately peaty and humic. In this respect this core is comparable with B37A0707/O-07 in Target zone East. The pollen spectrum at this depth in the Basal Peat and at the transition to the Wijchen Member indicates a Boreal age.
The diatom assemblages in the freshwater tidal clay (just 10cm thick, but 30cm if the reworked top of the Basal Peat is included) and the Wijchen Member (KRWY) display a general trend of increasing marine species towards the top. In sample W-02/208 and W-02/153 a few drifted Cerealia-like pollen grains turned up in an otherwise coastal-vicinity Atlantic spectrum (probably representing a coastal grass species; not evidence of very early agriculture). In this respect, the core is comparable to B37A0705/O-05 in Target zone East. Above it, the Wormer Member (sample W-02/103) coarsens upwards, which may be indicative of an intensified tidal dynamic as the estuary deepened. Palynologically too this facies becomes younger: presumably Late Atlantic, possibly the earliest Subboreal.

118
Core B37A0673/W-04 This core contained the full sequence of river-dune sand (BXDE), Basal Peat (NIBA), freshwater tidal clay (EC), estuarine clay (NAWO), and offshore channel deposits (SBBL). This coring was located at the spot of the later excavated Trench 2. In the top of the river-dune sand charred botanical material, bone, and flint lithics were found. The Basal Peat too contained charred plant remains. BIAX Consult performed extensive botanical studies on the river-dune sand and peaty samples from the Basal Peat (see Chapter 6 for the results). A radiocarbon dating of macroscopic remains from the base of the Basal Peat (Table 3.6) places the beginning of local peat formation at 19.88m - asl at around 6753 BC. This date counts as a terminus ante quem for the archaeological remains in the top of the dune sand.
Core B37A0674/W-05 In this core the full sequence from river-dune sand (BXDE), clayey Basal Peat (NIBA), freshwater tidal clay (EC), and estuarine clay (NAWO) was encountered. The core was taken from the central depression in the river-dune complex of Target zone West. Two radiocarbon datings are available, from the base and the top of the Basal Peat, respectively (2.70 and 2.42m - HF). These put the formation of the layer between 7237 and 6548 BC (Table 3.7). The first marine diatoms turn up in the clay immediately overlying the Basal Peat (W-05/238). Pollen from the humic river-dune sand at the bottom of the core indicates a Boreal age. The lower radiocarbon sample produced a relatively high age, given its depth relative to mean sea level. This can be explained by the core’s position in the dune complex and the locally prevailing water table. Along the margins of the dune depression, the water table would have been some decimetres higher than further north along the dune flank where it met the Early Holocene Rhine-Meuse floodplain.
Core B37A0675/W-06This core displayed the entire sequence of river-dune sand (BXDE), Basal Peat (NIBA), freshwater tidal clay (EC), estuarine clay (NAWO), and offshore channel-fill deposits (SBBL). The coring was performed close to the (at that point yet to be excavated) Trench 1. The top of the dune sand contained bone and carbonised material and carbonised botanical matter was detected also in the Basal Peat. BIAX Consult performed extensive botanical analyses on the river-dune sand and on peat from the Basal Peat (see Chapter 6 for the results). From the base of the Basal Peat at 19.92m - asl there is a radiocarbon date of macroscopic remains (Table 3.6) which puts the local beginning of peat formation around 6939 BC. This date can be regarded as a terminus ante quem for the archaeological evidence in the top of the river-dune sand.
Core B37A0677/W-08 The full sequence of Wijchen Member (KRWY), Basal Peat (NIBA), Echteld Formation (EC), and Wormer Member (NAWO) was identified in this core. As in core B37A0707/O-07, a layer of humic reed clay was intercalated here at the transition from the Wijchen Member to the Basal Peat (4.46 to 4.18m - HF). The pedological investigation of this core was focused mainly on the underlying levels.
The core lies north of Target zone West and river-dune sand (BXDE) is expected to underly the Wijchen Member (Figs 3.14 and 3.15). In the Wijchen Member, dark soil levels were encountered throughout the area (Section 3.3.4). On the northern flank of the river-dune complex in Target zone West, two such levels join up with the charcoal-rich soil that developed in the sand of the river dune. The soil levels in the core are found at 4.75 to 4.66m and 4.55 to 4.46m - HF and proved to be full of fine charcoal particles. In the Basal Peat ‘thin burnt layers’ were observed.
The core was selected for micromorphological analysis of the ‘charcoal-rich Wijchen Member on river-dune sand’. The Wijchen Member as was found in this core is not typical of this layer throughout the planning area: it is specific for the foot of the river dune in Target zone West. In the core three important intervals, 4.90 to 4.45m, 4.45 to 4.30m, and 4.15 to 4.00m - HF, were (eventually) successfully prepared and consolidated and processed into three thin sections of 15 x 9cm with a thickness of 25μm. This interval

119
covers the Wijchen Member (4.90 to 4.18m - HF) and the overlying Basal Peat. Despite considerable effort, the 4.30 to 4.15m (humic reed clay) interval and the very top of the 4.45-4.30m interval could not be consolidated and were hence not analysed. See van Kappel and Exaltus (2013) and Vos (2013, 51-52) for the method of preparation. The thin sections are comparatively large to allow disturbances resulting from the coring process to be recognised and excluded from the interpretation.
The aim of the micromorphological analyses was to reveal the degree of soil formation, the extent of eventual archaeological residues (‘burnt layers’), and the intensity of inundations at the time of soil formation. An important conclusion has been that the black colouration of the two dark horizons in the Wijchen Member (upper part) on the foot of the dune was not caused by humus accumulation (soil formation), but by adventitious carbonised vegetal matter. This was due to the vegetation along the edge of the river dune being burnt away. Given the archaeobotanical and archaeological evidence, it is likely that man was involved in this process. As regards indications of soil formation, there is a difference in maturity between the Wijchen Member with its dark horizons on the one hand and the overlying humic clay and Basal Peat on the other. In core W-08 these deposits above the actual Wijchen Member were found to also contain a great deal of burnt plant material. Slope processes on the flank of the river dune may be responsible for the remarkably young OSL dating which was obtained locally from the humic top of the dune-flank surface: between circa 7000 and 6500 BC (Table 3.3). This outcome may reflect colluvial movement through localised slumping and/or to trampling. The fact that humus-rich sand slipped downhill also suggests that the slope processes occurred only relatively late in the exposed existence of the dune, not until after considerable soil formation had taken place. These findings can be speculatively linked to the rising water table around the dune and intensified trampling of the dune as the area of dry landscape diminished in the period between 7000 and 6500 BC. See Section 3.7 for further palaeogeographical and archaeological considerations.
Core B37A0688/W-19 In this core the full sequence of the Wijchen Member (KRWY), clayey Basal Peat (NIBA), Echteld Formation (EC),and Wormer Member (NAWO) was identified. The coring was performed on the northern edge of the river-dune complex in Target zone West. A single radiocarbon date is available for the base of the Basal Peat (Tables 3.6 and 3.7), from a relatively great depth. This depth and the location on the northern edge of the dune complex explain the comparatively high median age (7147 BC) obtained for the base of the Basal Peat. This radiocarbon date is in agreement with the Boreal pollen spectrum. Upwards, the Basal Peat displays clayey stratification (cf. cores B37A0677/W-08 and B37A0707/O-07). The diatom content (sample W-19/305) of these deposits reflects a fully freshwater environment. This dates the sediments below 2.89m - HF to before 6500 BC. The pollen spectra at these depths correspondingly point to the transition from the Boreal to the Atlantic.
Core B37A0692/W-23This core was found to contain a succession of river-dune sand (BXDE), Basal Peat (NIBA), and silty, layered estuarine clay (NAWO). There was charcoal in the top of the dune sand. From the Basal Peat there are three radiocarbon dates of macroscopic remains (Table 3.7), which put the formation of this layer between 7250 and 6575 BC. The date of 7250 BC at the base of the peat counts as a terminus ante quem for the archaeological evidence in the top of the dune sand. The Basal Peat in this part of the planning area is relatively peaty. The covering clays (2.71 to 0.67m - HF; NAWO) in this core were not scanned for diatoms. An OSL dating is available from the NAWO unit: 5900 ± 500 BC. The transition from the underlying Basal Peat in this core is an abrupt one. Parallel to the cores in the close vicinity, one might expect a deposit of freshwater sediments (EC) interbedded between NIBA and NAWO, given the palaeogeographical developments proposed for the 6500-6300 BC period (see Section 3.5.5, Table 3.8). The absence of an intercalated EC layer can be explained by erosion in the estuarine conditions that arose from 6300 BC (Figs 3.14 and 3.15), as the area progressively became submerged and tidal effects increased. This fits in with the silt-laminated aspect of the NAWO clay in this core.

120
Core B37A0696/W-27 The full sequence of river-dune sand with a soil (BXDE), Basal Peat (NIBA), freshwater tidal clay (EC), and estuarine clay (NAWO) appears in this core. It was taken from a flank of the eastern dune ridge in Target zone West (Fig. 3.12). In this core a soil level was identified in the top of the dune surface, dark in colour and with a considerable thickness of 70cm (2.04 to 1.35m - HF). The soil level was found to be rich in charcoal and besides contained a great deal of burnt plant material. Other cores with relatively thick soils in the dune sand are B37A0673/W-04, B37A0675/W-06, B37A0676/W-07, B37A0687/W-18, and B37A0693/W-24.
The core was selected for micromorphological analysis of the remarkably thick soil in the river-dune sand, on the flank of what presumably was the highest dune ridge in Target zone West (Figs 3.14 and 3.15). The interval between 2.00 and 1.00m - HF was sampled for micromorphological analysis. The intervals between 2.00 and 1.90m, 1.90 to 1.60m, 1.60 to 1.45m, 1.45 to 1.15m, and from 1.15 to 1.00m were processed into five thin sections of 15 x 9cm, with a thickness of 25μm (van Kappel and Exaltus 2013; Vos 2013, 51-52). The thin sections are relatively large so as to allow disturbances resulting from the coring process to be recognised and excluded from the analysis. The aim of the micromorphological analyses was to discover the degree of soil formation, to what extent anthropogenic residues are involved (‘burnt layers’), and the intensity of inundations at the time of the soil’s formation. An important conclusion is that the great thickness of the soil layers and their enrichment with organic material was caused by slope processes (trampling, solifluction) and that soil had slipped down from parts of the river dune just a little higher up. This enrichment involved the dune sand coloured dark by humus (normal soil formation) as well as burnt macroscopic remains (presumably anthropogenic, Mesolithic). Part of the archaeological material in the dark soil layer therefore does not lie in situ in the strictest sense, but was transported over a short distance (a matter of metres) down the slope of the dune flank. Given the stratigraphy, this process must have occurred around the same time as the enclosure of the foot of the dune in deltaic sediments (KRWY and NIBA), which is confirmed by datings of burnt macroscopic remains from the invasive underwater investigation (see Chapter 6).
Core B37A0697/W-28 In this core, the succession of dune sand (BXDE), overbank clays (KRWY), Basal Peat (NIBA), freshwater tidal clay (EC), and offshore channel sediments (SBBL) were encountered. It is a core taken from the eastern slope of the river dune. The Wijchen Member and the Basal Peat contained carbonised botanical material. BIAX Consult performed botanical analysis on the river-dune sand, the Wijchen Member, and the Basal Peat. See Chapter 6 for the results. A radiocarbon date is available for the base of the Basal Peat (Table 3.6), which puts the local start of peat formation at 20.32m - asl around 7093 BC. This date may be regarded as a terminus ante quem for the carbonised botanical material in the Wijchen Member.
Core B37A0698/W-29This core reached the loamy top of the Kreftenheye Formation (KRWY-2) below the base of the river-dune sand (BXDE). This loamy interval, at a depth of 22.58 to 22.36m - asl, was sampled for diatoms and pollen at three depths. Only the topmost sample contained any pollen and no diatoms were encountered. The pollen spectrum was interpreted as Preboreal (see also Section 3.5.4).
3.7 Landscape evolution in the Early Holocene
The investigations in and around the Yangtze Harbour allow local updates of existing palaeogeographic map series on the scale of the Rhine-Meuse system (Vos et al. 2011; Hijma and Cohen 2011). This is necessary for correctly interpreting the archaeological findings. For this purpose, the newly gathered data have been used to make landscape reconstructions on three scales: the wider Maasvlakte area, the Yangtze Harbour planning area within it, and Target zone West around the archaeological trenches. This was done for four or five time slices in the Early and Middle Holocene, so that the independently dated archaeological and archaeobotanical evidence could be placed in the appropriate palaeolandscape.
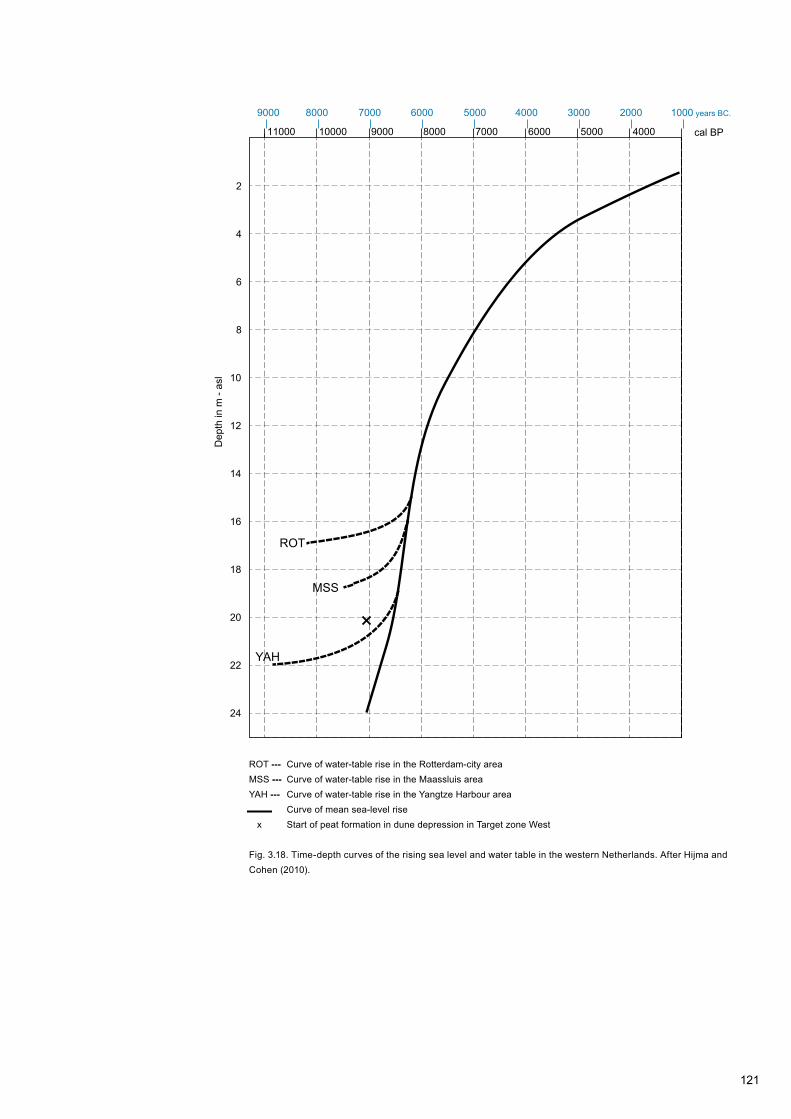
121
2
11000 10000 9000 8000 7000 6000 5000 4000 cal BP
2000 1000 years BC.3000400050006000700080009000
4
6
8
10
12
14
Dep
th in
m -
asl
16
18
20
22
24
ROT
MSS
YAH
ROT --- Curve of water-table rise in the Rotterdam-city areaMSS --- Curve of water-table rise in the Maassluis areaYAH --- Curve of water-table rise in the Yangtze Harbour area Curve of mean sea-level rise x Start of peat formation in dune depression in Target zone West
2
11000 10000 9000 8000 7000 6000 5000 4000 cal BP
2000 1000 years BC.3000400050006000700080009000
4
6
8
10
12
14
Dep
th in
m -
asl
16
18
20
22
24
ROT
MSS
YAH
Fig. 3.18. Time-depth curves of the rising sea level and water table in the western Netherlands. After Hijma and Cohen (2010).

122
0 1 2 km
Sandy soil - relatively high-lying fluvial sands (KR facies)Sandy soil - river-dune sand (BXDE facies on KR)Floodplain - freshwater fluvial environment (KRWY facies)Drainage towards the main river channel - shallow freshwater fluvial environment (KRWY channel-fill facies)Planning area Target zone West Target zone East
0 1 2 km
0 1 2 km
8400 BC
0 1 2 km
0 1 2 km
7150 BC
Sandy soil - relatively high-lying fluvial sands (KR facies)Sandy soil - river-dune sand (BXDE facies)Floodplain - freshwater fluvial environment (KRWY facies)Lakes and shallow pools - freshwater fluvial environment (KRWY and EC facies)Waterlogged floodplain, overgrown and inundated part of the year - freshwater fluvial environment (NIBA and EC facies)Planning area Target zone West Target zone East
a
b

123
0 1 2 km
0 1 2 km
6400 BC
Sandy soil - river-dune sand (BXDE facies)Waterlogged floodplain, overgrown and inundated part of the year - freshwater fluvial environment (EC facies, on NIBA and older units)Freshwater tidal area, permanently submerged - fresh to slightly brackish environment (EC facies on NIBA and older units)Deep subtidal area/tidal channels in the estuarine area - brackish to marine environment (NAWO facies) Planning area Target zone West Target zone East
0 1 2 km
0 1 2 km
6000 BC
Intertidal area/mudflats in the estuarine area - brackish to marine environment ( inferred, but this facies has hardly survived)Shallow subtidal zone in the estuarine area - brackish to marine environment (NAWO facies)Deep subtidal area and tidal channels in the estuarine area - brackish to marine environment (NAWO facies)Planning area Target zone West Target zone East
c
d

124
Intertidal area/mudflats in the estuarine area - brackish to marine environment (inferred, but this facies has hardly survived)Shallow subtidal area in the estuarine area - brackish to marine environment (NAWO facies)Deep subtidal area and tidal channels in the estuarine area - brackish to marine environment (NAWO facies)Barrier spits (inferred; this facies was entirely removed by subsequent coastal erosion) Planning area Target zone West Target zone East
0 1 2 km
0 1 2 km
4500 BC
Fig. 3.19. Palaeogeographical reconstructions of the Maasvlakte area. a. 8400 BC; b. 7150 BC; c. 6400 BC; d. 6000 BC; e. 4500 BC.
e
The landscape reconstructions follow from the geological mapping and new insights into age and depositional environment gained from the sedimentological, palynological, and dating analyses (as presented in Sections 3.3 to 3.6). Where the text below mentions corroborating research results (insights resulting from OSL, radiocarbon, pollen and diatom analyses, micromorphology, sedimentary logging of the cores), this refers to preceding sections. Reports on the basic data have been included as appendices (Table 3.1). The palaeogeographical reconstructions for the Maasvlakte area (Fig. 3.19, maps for 8400, 7150, 6400, 6000, and 4500 BC) incorporate not only the evidence from the Yangtze Harbour and the research in the close vicinity (around Papegaaienbekhaven, Kop van Beer, and Tank Terminal West), but also evidence from earlier studies that was available in the DINO database.
In the maps up to 6400 BC, the time-depth relation of the regional development of the Basal Peat in the Maasvlakte region is linked to the elevation of the underlying sand. The curve describing the rising water table in the area of the Yangtze Harbour over the period 7500-6500 BC is a new result (Figs 3.3 and 3.18; Section 3.5.4; Table 3.10). It runs somewhat higher than earlier curves describing the water-table rise at the centre of the valley (Hijma and Cohen 2010), which is consistent with the Yangtze Harbour’s position on the southern margin of the valley.

125
Maps of 6400 BC and later incorporate time-depth relations of the formation of the Basal Peat upstream of the area. This involves the existing sea-level curve for Rotterdam (Hijma and Cohen 2010) which reflects the striking acceleration of sea-level rise, submersion, and transgression in the area over the period between 6500 to 6300 BC. The dates obtained for the NIBA-EC and EC-NAWO boundaries, as well as the local sedimentary and palynological changes in environment, are consistent with the regional reconstructions of the drowning of the Rhine estuary in this period (Table 3.10).
The regional maps (Fig. 3.19) match up with those in Hijma (2009) and Hijma and Cohen (2011). Obviously the degree of detail increases as the study progressively focuses on the Yangtze Harbour (Fig. 3.20; maps for 8400, 7150, 7000, 6400, and 6000 BC). Especially the relief of the top of the ‘Pleistocene’ sand (and its patterning) is very scale-dependent.
3.7.1 General palaeogeographical development of the Maasvlakte area
In the Late Glacial, the Rhine-Meuse floodplain had evolved from a braided river system with many subsidiary channels into a meandering river system with a large main channel. At the beginning of the Holocene (Preboreal) the lower parts of the floodplain were occasionally flooded when the river ran high and in such episodes clay would be deposited: the Wijchen Member (KRWY-2, KRWY). In the open floodplain, sand drifting produced aeolian dunes (donken). Around this time such dune development occurred throughout the Dutch river region, the delta in the western Netherlands, and the southern North Sea (see, among others, Busschers et al. 2007; Hijma et al. 2009; idem 2012; Vos et al. 2011; Cohen et al. 2012).
In the Yangtze Harbour planning area, the river-dune sands from this phase (BXDE) are of Preboreal age (between 9100 and 8900 BC; Section 3.5). Subsequently a process of delta formation began, which was specific for the Early Holocene of the westernmost Netherlands and the adjacent coastal area. Upstream from Rotterdam, the transformation from river valley to delta in essence started around 6500 BC; it was related to a temporary acceleration in the sea-level rise (Hijma and Cohen 2010; idem 2011). But this transformation had started earlier downstream, owing to the lower elevation of the river valley (this chapter).
In the first part of the Boreal (Figs 3.19 and 3.20a; map 8400 BC), the dunes in the planning area still stood proud from the river plain by several metres. It is estimated that in the planning area these dune tops were 4 to 6 metres higher than their surroundings (Section 3.4), the highest among them possibly reaching to 15m - asl. It should be noted that the dune area continued south of the planning area and joined up with areas of coversand, where tops may well have been even higher. In 8400 BC the sea level still was low, the sea far out, and there was as yet no sign of any marine influence. At times of increased discharge, the lower parts of the area, up to circa 21m - asl, might flood, even up to the foot of the dunes (Figs 3.8, 3.11, 3.14, and 3.15). Given the modest thickness of the Wijchen Member, generally less than 0.5m, the average regional sedimentation rate was modest: less than 1mm a year. The wettest, lowest parts of the floodplain, especially in the northern part of the planning area, saw the development of reedlands, while the higher, dune-covered parts at this time received no sediment and could develop soils instead. The planning area was part of the southern margin of the Rhine-Meuse floodplain. Towards the southeast, the river-dune landscape continued into a wooded coversand landscape, drained by small streams running into the Rhine-Meuse valley. To the southwest, it merged into the coversand landscape that drained into the valley of the river Scheldt. The confluence of the Scheldt and Rhine-Meuse and their valley systems lay far west of the planning area (Hijma and Cohen 2011; Vos et al. 2011; Hijma et al. 2012).
In the course of the Boreal, the sea level in the southern North Sea rose from circa 30 to 24m - asl. Owing to the higher sea level and the approaching coastline, the gradient of the river decreased, which caused the river levels to rise with respect to the floodplain. As a result, the water table in the floodplain and along its margins also rose. Up till then, large parts of the plain would fall dry after inundations and the clayey sediments left behind had been subject to incipient soil formation (KRWY). The relatively long stretch of time over which the KRWY layer was formed (between circa

126
Time slice Criteria
8400 BC Terrestrial landscape. Water table below the surface, not only in the dune but also in the wider, surrounding floodplain, apart from its very lowest parts.
7500 BC Deltaic landscape. Incipient peat growth at circa 21.5m - asl. Lower-lying parts inundated with increasing frequency.
7250 BC Deltaic landscape. Peat growth extending to 21m - asl. Very gradual expansion of waterlogging. The water table rises by 10 to 20cm per century.
7000 BC Deltaic landscape. Peat growth extending to 20.5m - asl in the planning area; in Target zone West however, to 20.0m - asl (up against the dune slope, local effects). The water table rise accelerates from 20 to 30cm per century.
6400 BC Freshwater tidal - estuarine landscape. The landscape is dominated by open water and mudflats, reed fringes along tidal levees, and dune tops. At extreme low tide, the area higher than 19.0m - asl is exposed. This landscape existed for just one or two centuries: the area has just seen a very rapid rise in sea level (a metre in a year) and is about to undergo a second such event, resulting from developments in North America (Hijma and Cohen 2010). This ties in with the reed rhizomes of this period encountered at elevations between 18 and 17m - asl in the freshwater tidal area of the Yangtze Harbour and with the sea-level curve in Figure 3.18. Further explanation in Section 3.7.1 and Figure 3.21.
6000 BC Estuarine landscape. The Yangtze Harbour and its wide surroundings are permanently submerged and the tidal range had increased. Virtually only open water, near the mouth of the estuary. The maps reflect an extreme low-tide level of 16.0m - asl. Mean sea level at the time was approximately 13.5m - asl.
4500 BC Offshore area near the river mouth. The offshore channel in the southeast of the planning area has been assigned an arbitrary age of 4500 BC. This is the earliest possible dating; the channel may not have become active until a later date. Indeed it may have been active in multiple phases. The sea level at the time was about 6m - asl.
Table 3.12. The time-depth relations employed in the time series of palaeogeographical maps (Figs 3.19, 3.20, and 3.24).
8500 and 7000 BC) and the relatively slight thickness of the layer (a few dm) indicate that the sedimentation rate was slow (on average less than 1mm a year). With the rise of the water table in the Boreal, the floodplain became a floodbasin that between floods remained waterlogged throughout the year (NIBA, clayey peat, peaty clay, and humic clayey intercalations). Figures 3.19b and 3.20 reflect this situation. The palaeo-ecological study has shown that open water remained in the lower parts, forming shallow pools with aquatic vegetation. This change marks the transition from river valley to delta, which in the planning area is dated to around 7250 BC (Table 3.6). Further northeast it occurred somewhat earlier, around 7450 BC (at the Kop van Beer; Section 3.6.1; Table 3.1).
By around 7000 BC, peat had formed up to the present level of circa 20m - asl (Fig. 3.16c). Given its subsequent compaction, the peat surface must have been somewhat (decimetres) higher at the time. On the higher parts of the dune’s foot in the 20.0 to 19.5m - asl zone, some grey clays of the Wijchen Member accumulated as flood deposits up until circa 7000 BC. Some dark soil horizons developed in it. In contrast to the lower-lying parts of the landscape, the foot of the dunes would even in this phase be inundated only occasionally and the surface lay above the water table for the rest of the year. Hydrological differences resulting from local relief meant that at the end of the Boreal, clayey NIBA(-EC) peat formation and KRWY clay sedimentation could take place simultaneously. The river-dune crests in the planning area still rose several metres above the delta plain, but increasing parts of the foot of the dunes became covered by deltaic deposits (cf. Figs 3.20b and c).
127
On the scale of the planning area, the formation of the Basal Peat (below 19m - asl) was a distinctly diachronic process. As the water table progressively rose, the peat (NIBA) encroached on the slopes of the dunes and filled any depressions in its surface. From the time-depth data of dated samples from the base of the Basal Peat (Section 3.5.5; Table 3.6), it is apparent that between 7200 and 6500 BC the water table rose by 20 to 30cm per century (Fig. 3.18). The lower parts came to be permanently submerged and pools with marsh ferns and reed-sedge vegetations developed. The pools were surrounded by reedy margins, and both environments together trapped flood sediments which accumulated vertically as the water table continued to rise. At high tide especially, clay would be introduced from the large rivers to the north and northeast of the planning area and be trapped and deposited particularly in the marshy margins, thus forming the humic clayey to clayey-peaty Basal Peat. From 7000 BC the pools in this slowly drowning landscape steadily grew in extent. As the water table rose, the peat too progressively expanded, at the expense of the dry dune area (Fig. 3.20b). Dune complexes such as that in Target zone West became wooded islands and peninsulas amidst clayey, freshwater marshland with reeds, carr, and open water in the form of pools and small lakes, some of which will have been connected to the actual river to the north through narrow high-water runnels. Up until 6500 BC, the growth of the Basal Peat had been the result of a comparatively slow process of water-table rise, which with the approach of the coastline had slowly accelerated to 30cm per century (Fig. 3.18). After this, the brief interval of 6500 to 6200 BC saw the sea level in the southern North Sea rise from circa 19.5m to circa 15.5m - asl, which definitively drowned the floodplain and the dunes in the Yangtze Harbour area. In this phase of final submergence by the sea, the rise in the water level was significantly more rapid than it had been previously (Table 3.10). The accelerated progress of submersion with the ever-approaching coastline and river mouth in the Rhine-Meuse delta is a very common observation (Cohen 2005). However, specifically in the area between the Maasvlakte and Rotterdam city centre, and in the very period covering 6500 to 6000 BC there is a twist to the history of the sea-level rise that gave the drowning of this area an extra acceleration.
Around 6500 BC, within a period of several months to years, the sea level rose worldwide by at least a metre because of the near-complete draining of vast ice lakes on the North-American continent (Lakes Agassiz and Ojibway), as a result of the melting of ice caps in what today is the Hudson Bay. Presumably these lakes were drained in two main events: an initial one around 6500 BC and a second around 6300 BC. At any rate, the period in question (195 ± 68 years) saw the sea level in the research area rise by 4.06 ± 0.50 m, which was over twice as fast as in the centuries immediately before and after (Hijma and Cohen 2010). This evidence was inferred both from datings and regional mapping of transgressive boundaries in the Rhine estuary, including datings from parts of the Maasvlakte area north of the planning area, and from the embedding of these observations in global sea-level history. The notion that the acceleration in this very period took the form of two brief pulses is based on considerations of the size and depth of the former ice lakes on the North American continent, the size of the then remaining ice cap blocking the Hudson Bay, and observations at depth in the Labrador Sea between Canada and Greenland which received the outflow (Hijma and Cohen 2010 and citations therein). In the planning area too there is further independently established evidence of dramatic landscape changes (cf. Figs 3.19b and c and Figs 3.20c and d), which in a very brief time (Tables 3.7 and 3.8) caused a transformation from river basin to estuary. These changes can be directly related to the sea-level rise curves established for Rotterdam and globally.
Whereas just a little later, in the Middle Holocene, many coastal regions experienced a quite gradual transition from fluvial to estuarine landscapes as a result of a slowly progressing sea-level rise, the Yangtze Harbour area saw a rapid transformation (Cohen 2005; Hijma and Cohen 2010). The terrestrial deltaic sediments (KRWY and NIBA) from the preceding periods now became covered by freshwater sediments deposited under water (EC). The sedimentology of these deposits reflects the growing effect of the tides. Initially the area drowned in fresh water; witness the diatom content in which fluvial species are strongly represented, with a small admixture of marine types. The latter in EC sediments can be attributed to tidal effects and occasional storm surges in an otherwise river-fed freshwater environment. The deltaic, periodically flooded landscape had changed into a freshwater tidal area that to a large extent kept former land surfaces permanently submerged, i.e. below low-tide level. Initially the area received relatively

128
much fine sediment from the feeding rivers, which became trapped through the tidal action. Sediment was deposited four times a day in the brief moments of slack water at each turning of the tide (ebb to flood, flood to ebb). The tidal range in this initial submersed situation still was less than it was to become in later periods (a few decimetres rather than 1.5 metres; van der Molen and de Swart 2001; Hijma and Cohen 2010). Through tidal action and steady sediment delivery, sediments could initially still accumulate locally alongside the estuarine channels to a level higher than the low-tide mark (around 6250 BC, given the results of reed datings in Table 3.8). Between the inlets and river channels with their reed-covered levees, this landscape comprised both intertidal expanses (continually flooding and resurfacing, mudflats), and large intervening stretches that were permanently flooded (subtidal zones). The cores from which drifted wood in the EC deposit was dated (Table 3.8) come from this environment. The wood itself had probably been carried along from upstream and shows that the banks and floodplains upriver supported riparian forests. Such wood-rich subaquatic deposits are indeed known for the period around 7500 BC from core observations in Rotterdam’s city centre and from Delft (Hijma 2009).
The freshwater-tidal-clay environment may be compared to that of the Biesbosch area in the Netherlands in recent centuries, and to the Rhine-Meuse estuary as it functioned in Roman and Early Medieval times (known as Helinium, e.g. Zonneveld 2013), although in the transgressive setting of the planning area this was a short-lived situation, existing for just 150 to 250 years. The depth at which the freshwater-saltwater contact is encountered (EC-NAWO contact; Table 3.10) complies with the relative sea-level positions for the time as reconstructed for Rotterdam and its environs (Fig. 3.18), and even allows us to further refine the sea-level rise during the acceleration event (Fig. 3.21 presents a tentative scenario). Ultimately, the steady rise of the sea level won out over river-mouth sedimentation, and the whole area was definitively drowned.
The sea level continued to rise and the tidal action grew stronger between 6500 and 6000 BC (van der Molen and de Swart 2001). As a result, even the last high parts of the dunes were flooded, undercut, and eroded at the top. Given the sea-level position and assuming maximum dune elevations of 15,0m - asl in the planning area, the highest dune tops in Target zone West must have been obliterated around 6300 BC. This left the entire planning area permanently under water, with silty-clayey, tidally stratified deposits almost throughout (Wormer Member, NAWO). Locally, new tidal channels scoured out, in one case down to over 27m - asl. Somewhat further east and southeast we may still assume the presence of intertidal and supratidal areas in this period (Vos et al. 2011). The main river mouth at this time entered the valley-wide estuary tens of kilometres northeast of the planning area (Hijma et al. 2009; Hijma and Cohen 2011; Cohen et al. 2012).
From all of the above stages, deposits in this area have been preserved up to 17.5m - asl without being affected by erosive processes on the sea floor in the past 8000 years. This is due to the protective effect of the relatively thick clayey and peaty KRWY, NIBA, and EC deposits, which offered enhanced resistance to erosion of the sea floor by wave action and tidal currents. Above 17.5m - asl, however, this protective cover was absent, and hence the Early Holocene dune sands have eroded away. Here we find strongly silty-sandy layered clays (NAWO) and marine sands (SBBL) with a marine mollusc fauna.
3.7.2 Stratigraphical link between deltaic landscape and buried river-valley landscape
The Pleistocene subsurface in the planning area consists of deposits of the rivers Rhine and Meuse that functioned during the final phase of the last glacial. The deposits consist of moderately coarse to coarse sands which were left as sand bars in a multi-channel riverbed. In the Late Glacial (circa 14,500 to 11,700 BP; Fig. 3.3), the climate changed, and with it the river style (e.g. Vandenberghe, 1995). In the Central-European interior, and somewhat later in the North Sea area as well, permafrost disappeared from the subsoil. The summers became warmer and the winters milder. The discharge regime of the Rhine and Meuse changed, switching from being snowmelt- to rainfall-dominated. Also the vegetation cover in the valley and the entire catchment changed, and so did the sediment load and transport capacity of the river. The result was that meandering river systems evolved in the Rhine-Meuse valley. These occupied a much narrower part of the

129
valley floor (Cohen 2003; Hijma et al. 2009) than their braided predecessors in the coldest phases of the last glacial (Busschers et al. 2007) had done. The Yangtze Harbour area lay to the south of the main meander belt of the joint Rhine and Meuse of the Early Holocene, on a low river terrace that in the earliest part of the Holocene had been abandoned as a riverbed.
The Preboreal meandering rivers cut into the floodplain, leaving abandoned braidplains in the form of low terraces. At times of peak discharge, these functioned as incidental floodplains for the meandering rivers to the north, notably in years when in the hinterland snowmelt coincided with heavy rainfall and flooding exceeded average levels. In such years, loams and clays would be deposited across the floodplain. Through the remainder of the year, and in years of limited flooding, these parts were dry and soil formation occurred. The flood sediments from the earliest meandering rivers overlie the abandoned braidplain as a thin cover (Wijchen Member, lower part, KRWY-2).
In the Younger Dryas and Preboreal, large-scale sand-drifting took place from the periodically dry sand bars into the surrounding valley of the Rhine and Meuse. This caused river-dune fields to establish, whose dune forms either became permanent features in the higher parts of the floodplain (in Dutch known as donken), or continued to drift. In and around the Yangtze Harbour area too, such sand drifts took place across the young floodplain. In Target zone West, part of a channel belt was abandoned, presumably in the second half of the Younger Dryas (Table 3.3), and from that moment dune formation began here. Somewhat later, presumably at the transition to the Preboreal, Target zone East also saw a channel belt abandoned, and here too dune formation ensued. In lower parts of the floodplain, overbank sedimentation from flooding rivers would continue, locally right up to the foot of the dunes. The dunes were consolidated by a pioneer vegetation during the Preboreal and eventually became wooded towards the beginning of the Boreal. This period also saw soil formation in the dune surface.
During the Boreal, overbank sedimentation increased. From the Boreal on, the floodplain gradually became wetter, under the influence of the sea-level rise downstream. The coastline and river mouth had by then approached up to what is now the southern North Sea. The vicinity of the river mouth and the sea had a moderating effect on the gradient of the river and raised the water table in the valley (Cohen 2005). The landscape was transformed into a permanently marshy region that was inundated ever more frequently and where the clayey sediments no longer properly dried out. This explains the different facies of the younger (upper) parts of the Wijchen Member with respect to their older (lower) equivalents. Within deposits of the Wijchen Member, several Early Holocene soil horizons and intercalated dune sands have been identified; for example, in building pits at Station Blaak (Guiran 1997, 30) and Kruisplein (Schiltmans 2014), and in geological mappings (Busschers et al. 2007; Hijma et al. 2009). In the Maasvlakte area and below the Nieuwe Waterweg (the canalised main river outlet through the Rotterdam Harbour area), the Wijchen Member is marked by a greater variation in depth, a greater thickness and a more complex internal structure compared to its facies in the central delta and further upstream.
3.7.3 Mesolithic habitability of the Boreal deltaic landscape
Despite the gradual drowning of the surrounding landscape and occasional floods from the rivers, large parts of the foot of the dunes as well as the flanks and crests were permanently dry throughout the Boreal. From the earliest development of the dunes on, the area must have been a favourable location for human settlement, given the close vicinity of the freshwater deltaic environment, the connection of the dune area to the region of wooded coversands and brook valleys to the south, and the nearby active channel belts of the great rivers. The great diversity of habitats in the surroundings and the high and dry position of the dune – then still safe for habitation – made the (former) donk in Target zone West an ideal spot to settle for the hunters and gatherers in the Boreal and earliest Atlantic. No major river channel with clear fresh water was available in the close vicinity, but in those days there was one about a kilometre north of the planning area (Hijma et al. 2009).

130
0 500 m
61.000
61.000
62.000
62.000
63.000
63.000
64.000
64.000
443.
000
443.
000
444.
000
444.
000
Sandy soil - relatively high-lying fluvial sands (KR facies; any KRWY-2/BXDE cover less than 50cm thick)Sandy soil - windblown sand (BXDE facies, in the form of river dunes up to several metres high)Floodplain - freshwater fluvial environment (KRWY facies)Lakes and shallow pools - freshwater fluvial environment (KRWY and EC facies)Planning area Target zone West Target zone East
0 500 m
61.000
61.000
62.000
62.000
63.000
63.000
64.000
64.000
443.
000
443.
000
444.
000
444.
000
Sandy soil - river-dune sand (BXDE facies)Floodplain - freshwater fluvial environment (KRWY facies)Lakes and shallow pools - freshwater fluvial environment (KRWY and EC facies)Waterlogged floodbasin, overgrown and inundated part of the year - freshwater fluvial environment (NIBA and EC facies)Planning area Target zone West Target zone East
8400 BC
7250 BC
a
b

131
0 500 m
61.000
61.000
62.000
62.000
63.000
63.000
64.000
64.000
443.
000
443.
000
444.
000
444.
000
0 500 m
61.000
61.000
62.000
62.000
63.000
63.000
64.000
64.000
443.
000
443.
000
444.
000
444.
000
Sandy soil - river-dune sand (BXDE facies)Waterlogged floodbasin, overgrown and inundated part of the year - freshwater fluvial environment (EC facies on NIBA and older units)Freshwater tidal area, permanently submerged - freshwater to slightly brackish environment (EC facies, on NIBA and older units)Planning area Target zone West Target zone East
Sandy soil - river-dune sand (BXDE facies)Floodplain - freshwater fluvial environment (KRWY facies)Lakes and shallow pools - freshwater fluvial environment (NIBA and EC facies)Waterlogged floodbasin, overgrown and inundated part of the year - freshwater fluvial environment (NIBA and EC facies)Planning area Target zone West Target zone East
7000 BC
6400 BC
d
c

132
0 500 m
61.000
61.000
62.000
62.000
63.000
63.000
64.000
64.000
443.
000
443.
000
444.
000
444.
000
Intertidal zone/mudflats in the estuarine area - brackish to marine environment (overwhelming part of the facies eroded)Shallow subtidal area in the estuariy - brackish to marine environment (NAWO facies)Deep subtidal area/tidal channels in the estuarine area - brackish to marine environment (NAWO facies)Planning area Target zone West Target zone East
6000 BC
Fig. 3.20. Palaeogeographical reconstruction of the Yangtze Harbour area.a. 8400 BC; b. 7250 BC; c. 7000 BC; d. 6400 BC; e. 6000 BC
e
Along the foot of the dune, the clayey Basal Peat contains a great deal of wood, which points to spinneys on the dunes. In the wider planning area the Basal Peat also holds some wood remains, but there it is especially rich in reeds, which indicates fairly open vegetation in this marshy area. When the Wijchen Member (upper part) was deposited, in the first half of the Boreal, the vegetation may have been more wooded, but it should be remembered that alder (Alnus) did not occur generally until shortly before the end of the Boreal. Where the Basal Peat covers the Wijchen Member, reeds and aquatic vegetations predominated.
With the approach of the coastline and the river mouth, and the progressive drowning of the area in the Boreal, the area of freshwater marshland downstream from the dune expanded and the travel distance to the marine hunting and gathering grounds became shorter. This probably made the location even more attractive. With the rapid transformation of the landscape into a freshwater tidal area around 6500 BC, almost all of the dry-land area disappeared and thereby the area lost much of its potential for exploitation and habitation. We may assume that in the Early Atlantic dune complexes situated further inland in the shifting estuary developed an environment and attraction similar to those of the Maasvlakte area in the second half of the Boreal. It is likely that people went on to exploit these more easterly parts in similar ways to what they had done in the downstream area before it was drowned.

133
6000
6250
6500
6700
brak
sea level
tidal rangeRhine-Meuse water level freshwater tidal zone
tidal range water level in the Rhine-Meuse estuary
water level at the Rhine-Meuse mouth -13
100 m
tidal range
several km away
sea-level rise by two one-metre leaps around 6500 and 6250 BC
groundwater table
Northeast Southwest
-15
-23
calving
Depth in m - asl
calving
compaction
compaction
peat growth
0
Years BC
-17
-19
-21
-13
-15
-23
-17
-19
-21
-13
-15
-23
-17
-19
-21
-13
-15
-23
-17
-19
-21
Subaquatic deposition: brackishSubaquatic deposition: freshwaterTerrestrial accumulation: peat growth
Fig. 3.21. The accelerated drowning of the landscape in the second half of the 7th millennium BC. After 6500 BC the river dune was surrounded by subaquatic sedimentary environments only.

134
g k
4
32
1
1
2
3
4
g k
4
32
1
1
2
3
4
Fluvial landscapeFreshwater tidal landscapeEstuarine tidal landcapeNorth Sea and inlet
Main landscape types
Estuarine/fluvial delta
g k
4
32
1
1
2
3
4
Pleistocene sandy soils
Terrestrial landscape
g k
4
32
1
1
2
3
4
Section Yangtze harbour planning area (depicted in more detail below).
Fig. 3.22. Schematic maps of landscape types in the Rhine-Meuse estuary in the Early Holocene. After Vos (2010).
g k
4
32
1
1
2
3
4
g k
4
32
1
1
2
3
4
g k
4
32
1
1
2
3
4
g k
4
32
1
1
2
3
4
g k
4
32
1
1
2
3
4
River channelNatural leveeMarshy, clayey floodbasinsSwampy floodbasinsPleistocene upland
Figure 3.22 schematically represents a major estuary with fluvial and estuarine landforms. In such an area four landscape zones can be distinguished, each with their characteristic sedimentary environments, habitats, and opportunities for human subsistence. These are:1. Fluvial zone with meandering river channel, levees and floodbasin with swamp and carr wetlands. 2. Freshwater tidal zone with tidal channels, creeks, wetter floodbasin areas, and carr and reed wetland along the margins.3. Estuarine zone with tidal channels, mudflats and brackish salt-marsh, and fringes of carr and reed wetland along the margins.4. Open sea with estuary outlet and offshore channels (permanently submerged). Moreover, the estuary is surrounded by a terrestrial landscape: mostly wooded Pleistocene land.
The landscape zones shifted inland in response to sea-level rise. For the fixed area of the Yangtze Harbour planning area, the inland shift of the fluvial and estuarine zones meant that it passed through a sequence from landscape type 1 through 2 and 3, and eventually to 4. The distance between the adjoining terrestrial landscape and the site in the first instance remained unchanged. This wetter gap did not significantly widen until the transition from type 3 to 4. The Mesolithic occupants of the planning area presumably made use of all of the adjacent landscape types: the terrestrial landscape bordering to the south and southeast, the fluvial landscape to the north and northeast (upstream into the Rhine-Meuse Valley), and the ever-approaching estuarine landscape downstream.
At the point when the Yangtze Harbour area changed into a freshwater tidal landscape, the dune in Target zone West lay like a hub among the terrestrial landscapes to the south, and the ecotone of wet landscapes of river and estuary. Around 6750 BC, landscape zones 1, 2, 3, and 4 all lay within the close vicinity of the Yangtze Harbour dune. To hunter-gatherers this made the dune a highly attractive spot for seasonal occupation.

135
The occupants of the hunters’ camp on the dune could obtain food and materials from a variety of landscape zones: the dry dune lay on the convergence of the interior, river delta, and sea (see also Chapters 5, 6, and 7).
A current example of a river-dominated deltaic landscape like that of the Maasvlakte in the middle Boreal is found in the Cumberland Marshes of central Canada (Fig. 3.23). This is a deltaic area which in a formerly glaciated terrain encroaches on a large freshwater lake. As for the side-by-side occurrence of the described landscape types, the Danube delta can also serve as a comparison, be it that here no transgressive drowning occurs. Along the North Sea, no modern parallel exists for the late Boreal/early Atlantic freshwater tidal environments awaiting further marine drowning. But younger pre- and protohistoric equivalents for clayey-peaty floodplains with local river-dune outcrops, at some distance from a major channel are known. In the last millennium BC and the first millennium AD, for example, landscapes in the central Netherlands’ river district and those around the mouths of the Utrechtse Vecht and Gelderse IJssel, which empty into the central Netherlands’ lagoon, were comparable in these respects.
Fig. 3.23. Reference images of the Cumberland Marshes, Canada.

136
61.200
61.200
61.300
61.300
61.400
61.400
61.500
61.500
61.600
61.600
443.
700
443.
700
443.
800
443.
800
443.
900
443.
900
444.
000
444.
000
0 100 m
1
2
3
61.200
61.200
61.300
61.300
61.400
61.400
61.500
61.500
61.600
61.600
443.
700
443.
700
443.
800
443.
800
443.
900
443.
900
444.
000
444.
000
0 100 m
1
2
3
Sandy soil - relatively high-lying fluvial sands (KR facies)Sandy soil - river-dune sand (BXDE facies)Floodplain deposits - freshwater fluvial environment (KRWY facies)Lakes and shallow pools - freshwater fluvial environment (KRWY and EC facies)Location of archaeological trenches, numbered 1 to 3.
Sandy soil - relatively high-lying fluvial sands (KR facies)Sandy soil - river-dune sand (BXDE facies)Floodplain deposits - freshwater fluvial environment (KRWY facies)Lakes and shallow pools - freshwater fluvial environment (KRWY and EC facies)Location of archaeological trenches, numbered 1 to 3.
8400 BC
7500 BC
1
a
b
1
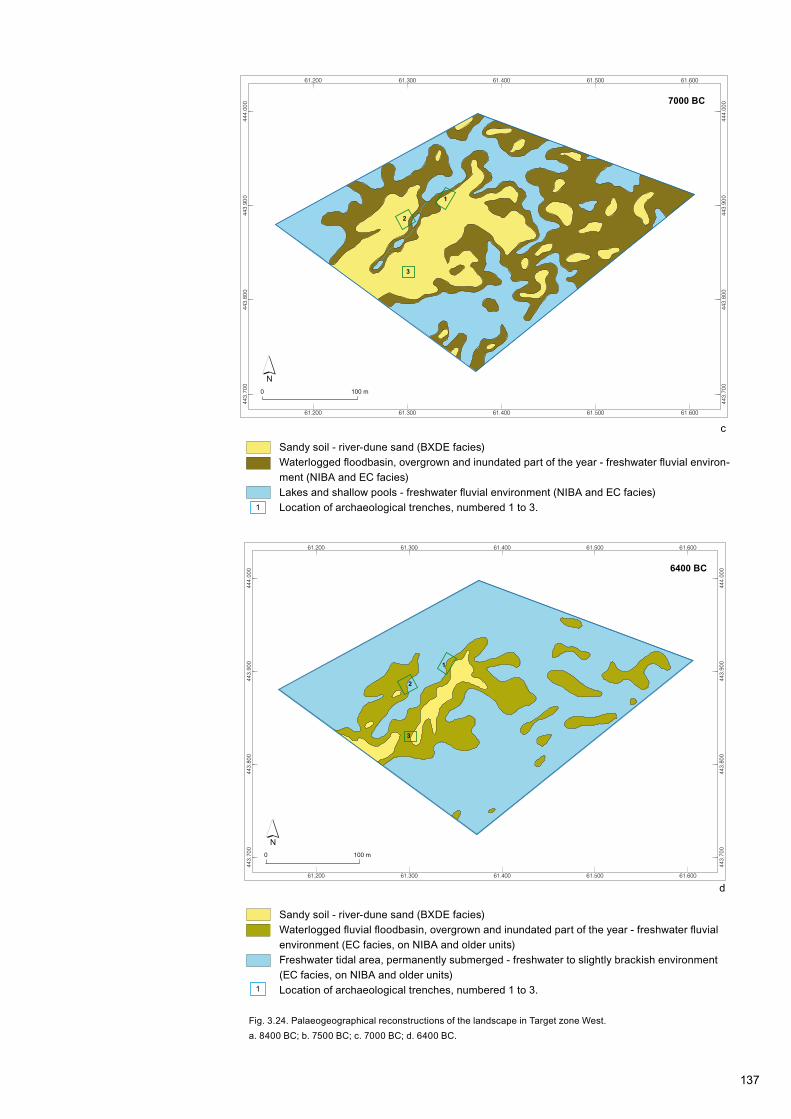
137
61.200
61.200
61.300
61.300
61.400
61.400
61.500
61.500
61.600
61.600
443.
700
443.
700
443.
800
443.
800
443.
900
443.
900
444.
000
444.
000
0 100 m
1
2
3
1
2
3
61.200
61.200
61.300
61.300
61.400
61.400
61.500
61.500
61.600
61.600
443.
700
443.
700
443.
800
443.
800
443.
900
443.
900
444.
000
444.
000
0 100 m
Sandy soil - river-dune sand (BXDE facies)Waterlogged floodbasin, overgrown and inundated part of the year - freshwater fluvial environ-ment (NIBA and EC facies)Lakes and shallow pools - freshwater fluvial environment (NIBA and EC facies)Location of archaeological trenches, numbered 1 to 3.
Sandy soil - river-dune sand (BXDE facies)Waterlogged fluvial floodbasin, overgrown and inundated part of the year - freshwater fluvial environment (EC facies, on NIBA and older units)Freshwater tidal area, permanently submerged - freshwater to slightly brackish environment (EC facies, on NIBA and older units)Location of archaeological trenches, numbered 1 to 3.
7000 BC
6400 BC
Fig. 3.24. Palaeogeographical reconstructions of the landscape in Target zone West.a. 8400 BC; b. 7500 BC; c. 7000 BC; d. 6400 BC.
c
1
d
1
138
3.7.4 Palaeogeography and habitability of Target zone East
Target zone East was investigated because of the presence of a marine tidal channel dating from the Atlantic, occupying what may be an inherited Late-Glacial or early Preboreal channel feature (Fig. 3.11). The period when this residual channel held water may well coincide with the dune formation in Target zone West. It is possible that (early) Mesolithic people in this period made use of the channel for accessing hunting encampments or to reach the dune. It cannot be ruled out that in the Preboreal around 8400 BC a small local watercourse drained the site, even in dry spells between major river floods (Fig. 3.20a). For the landscape reconstruction of the 7250 to 7150 BC period (Fig. 3.20b) it was assumed that such waterborne connections still existed in the Boreal. Apart from the channel and the marshy depression beside it, it seems that until 7000 BC most of the Target zone lay above the water table, and that this part of the Rhine-Meuse floodplain was accessible for the greater part of the year. Any human activity in Target zone East cannot be considered separately from the activities in Target zone West. In the period between 8400 and 7000 BC (Figs 3.20a and b), from the moment the river dune was consolidated by vegetation up to the deltaic waterlogging of the floodplain, both Target zones were part of the same, only occasionally flooded landscape. In this period the presence of a still open and navigable connecting residual channel would have enabled regular visits to the dune. Only with the onset of the deltaic waterlogging and the emergence of new waterborne connections would Target zone East have lost its attraction to Mesolithic people. Sediment core analyses in the Target zone yielded no archaeological evidence apart from relatively many charcoal remains in the top of the Wijchen Member. However, the coring programme was performed only on a modest scale, the samples from the cores are small and from the deeper parts of the channel fill there was no cored material at all. In the core that reached deepest (B37A0706/O-06), a younger estuarine channel had eroded the sediments of middle Mesolithic interest, including any archaeological residue it might have contained.
After 7000 BC, Target zone East became progressively wetter, as is evidenced by the widespread peat formation and deposition of humic clays (Fig. 3.20c). The time-depth relationship of the base of the peat in Target zone East differs from that in Target zone West. This is due to local differences in groundwater seepage and drainage at the time of peat growth, the nature of the deposits immediately underlying the peat, and differences in position relative to the edge of the floodplain. Peat formation began around 7150 BC, at a depth of circa 21m - asl (in core B37A0705/O-05), and continued until circa 6500 BC, at a depth of 19.5m - asl (in core B37A0707/O-07). From circa 6500 BC, a tidal influence becomes noticeable. At depths of 20.66 and 19.76m - asl (3.5 and 2.5m -HF) in the fluvial clay immediately overlying the Basal Peat, core B37A0705/O-05 contained not only freshwater diatoms but also diatoms of brackish and marine environments. From then on, the area was almost permanently submerged in fresh to slightly brackish water.
It was presumably around 6000 BC that the estuarine channel in Target zone East (Fig. 3.20d) came into being. It soon grew deeper and continued to function until after 5500 BC. The channel scoured down to at least 28m - asl (CPT4, Figs 3.8 and 3.11) and constitutes the deepest erosive feature from this period in the planning area. Over this period the mean sea level rose from circa 13.5 to 10m - asl. This means that the channel when it was active was over 15m deep, not counting the tidal range of 1.5 to 2.5m. Given the rapid rise of the sea level and the modest height of the dunes in the planning area, it seems most unlikely that there was any habitation along this channel at this time; presumably even the shoulders of the channel were almost permanently submerged in the estuary. Any larger intertidal landforms would have been situated several kilometres upstream from the planning area, and towards the estuary’s margins.
3.7.5 Palaeogeography and habitability of Target zone West
For Target zone West, four detailed landscape reconstructions were compiled: for 8400, 7500, 7000, and 6400 BC (Fig. 3.24; characterisations in Table 3.10). The locations of the archaeological trenches are indicated in the reconstruction maps. The grey clay of the Wijchen Member (lower part) and the clayey Basal Peat adjoining the dune both developed diachronically over the period 7500 to 7000 BC and are presented as
139
partially synchronous. The reconstructions in Fig. 3.24 therefore were made on the basis of not only the horizontal extent of the lithofacies, but also their elevation. The palaeogeographical maps thus do not merely reflect the distribution maps of the lithofacies in Section 3.4.
In the first of the map series (8400 BC), the dune and its surroundings still form a terrestrial landscape. Only at times of high discharge in the Rhine and Meuse would the floodplain around the dune be flooded for brief periods, but the area was predominantly dry, as it had also been in the immediately preceding period of dune formation. The dune became overgrown with woodland and developed a soil profile. This profile is the most distinct in the dune sands, where the surface in those days lay well above the regional water table (Fig. 3.24a). Indeed large parts of the floodplain around the dune presumably had a water table several decimetres below the surface. In the first instance only the very lowest parts of the surrounding floodplain were waterlogged. The maps of 7500 and 7000 BC (Figs 3.24b and c) show the progressively wetter condition of the area resulting from the rising water table and the river’s changing flood regime. Fig. 3.24d reflects the situation after the process of submersion accelerated, shortly after 6500 BC, when the area had become a freshwater tidal landscape.
Central depression, surrounded by higher landThe maximum depth of the isolated depression lies at circa 21.5m - asl. Here (e.g. in core B37A0673/W-04) the relatively great thickness of the Basal Peat stands out. Given the elevation of the dune surface below 20m - asl, the absence of KRWY beds is another notable feature (Figs 3.14 and 3.15). The peat in the depression is decidedly clayey, from its very base where it overlies the dune sand. At 21.0 to 20.5m - asl the peat dates from about 7150 BC: the final phase of the Boreal. These combined findings indicate that between the end of the Boreal and the beginning of the Atlantic, the depression held a pool, in which organic matter from dead vegetation accumulated from the edges. As a result of the difference in elevation between the depression and the crest of the dune there was a steep ecological gradient between the shallow pool with peat accumulation and the high and dry, wooded dune. Small amounts of clay were deposited among the organic matter in the depression whenever the Rhine and Meuse overtopped their banks, but the cores described in Section 3.6.4 show that the bulk of such sediment was deposited on the outer margin of the river-dune complex.
In the map of 7000 BC, Trenches 1 and 2 lie at the edge of the drowning dune, on either side of a more-or-less isolated depression, on the northwestern and southeastern ridges, respectively (Fig. 3.24c). Between 7250 and 7000 BC, the low-lying area immediately around the dune (surface between 20 and 22m - asl) was regularly flooded at times of high water in the Rhine and Meuse. Given the grey clays deposited there until 6900 BC, levels up to 19m - asl were periodically flooded when the rivers ran high. Trench 3 lies at the heart of the southeastern dune ridge and therefore remained a dry location for longer. Around the depression, the dunes in Target zone West rose several metres above the floodplain. These high-lying parts would not (yet) be inundated during episodes of high river water and for this reason must have been attractive to Mesolithic people.
After 6500 BC the habitability of the dune was fast becoming severely compromised (Figs 3.18 and 3.24d), and certainly by 6200 BC Target zone West must be regarded as fully submerged. Any further outcrops in the Yangtze Harbour to the southwest of Target zone West would have been completely drowned by 6000 BC. Between 7200 and 6400 BC, the dune tops in Target zone West stood out as high and dry dune-sand outcrops in an area regularly flooded by the river, with a vegetation (trees) marking them out from their surroundings as landmarks visible from the river further north, similar to later, Middle Holocene donken in the ‘Green Heart’ of the western Netherlands (see e.g. van der Woude 1984).
Charcoal, slope processes, and trapping of waterborne materialThe humic soil on the river dune of Target zone West was preserved only on the slopes, up to 19m - asl at the highest, and there it is remarkably thick (often more than 50cm) and patchy. This is explained by creep and slumping of humic soil from higher parts of the dune, down the flank and towards the foot of the dune, with brown-coloured sand accumulating below. Micromorphological analysis confirmed the role of slope processes
140
on the flank of the dune, which according to the OSL datings occurred between 7500 and 6500 BC, as the dune gradually became submerged. Possibly intensive trampling by people played a part in this process. This colluvial movement down the side of the dune means that part of the archaeological material will no longer be in situ; it may have been displaced downslope by several metres.
These slope processes in part also explain the high charcoal content (natural and anthropogenic) in the soil on and around the dune. The charcoal was observed both in the brown river-dune sand on the dune slopes and in dark bands within the grey clays deposited on the foot of the dune as it drowned. Around the dune, these dark layers are due not so much to soil formation, as to incorporation of fine carbonised plant remains and charcoal particles, presumably in the period between 7250 and 7000 BC. In the observed concentrations and forms (see also Chapter 6), the many carbonised remains clearly point to human presence. Finer charcoal particles may have been washed downslope up to ten metres around the dune. With the progressive encapsulation of the dune in its peaty surroundings between 7000 and 6500 BC, we might expect to see fine matter washed off the dune being trapped in higher concentrations closest to the high and dry central ridges of the dune complex. This would be observable in the marsh immediately below the slope of the surviving dune ridges (peaty and clayey facies within NIBA Basal Peat) rather than in the muddy clay covering the most peripheral part of the dune-sand slope.
3.8 Answers to the landscape-genetic and palaeogeographical questions
This section answers the research questions formulated in the Design Brief (Section 3.2; Smit 2012). Questions regarding the palaeogeography were addressed on four levels, on different scales: of the Maasvlakte as a whole, of the Yangtze Harbour planning area, of Target zones East and West, and of the archaeological trenches. The following text is based on, and complements, earlier findings in the Deltares Report (Vos 2013). Further elaborations were made possible by newly available integrative interpretations arrived at a late stage in the proceedings.
Questions on the regional scale: Maasvlakte 1 and 2What was the palaeotopography in the Maasvlakte region at the beginning of the Holocene; where were the larger river-dune complexes and the main channel(s) of the Early Holocene rivers Rhine and Meuse situated?
In the early Holocene, the area lay on the southern margin of the Rhine-Meuse valley. The surface of the Late Pleistocene riverbed sands lay between circa 24 and 20m - asl. In Target zone West within the Yangtze Harbour planning area, the dunes on top of these sands may have reached elevations of around 15m - asl. Elsewhere in the Maasvlakte area there may have been even higher dune tops, but given the current resolution of the geological mapping of the wider area, this cannot as yet be confirmed or disproved. The principal river channel at the beginning of the Holocene is believed to have run north of Hoek van Holland (Hijma 2009; Hijma and Cohen 2011), some kilometres north of the planning area.
How was the area of the Yangtze Harbour situated in the wider landscape of the Maasvlakte region in the Early Holocene? How great was the distance to (active) main channels, and what evidence is there of any minor drainage systems?
In the Early Holocene (Preboreal and Boreal) the planning area was part of the shared floodplain of the rivers Rhine and Meuse. In the lower parts of the plain (between 23 and 20m - asl) sedimentation of clay occurred: the Wijchen Member. According to reconstructions by Hijma and Cohen (2011) the river channel lay a few kilometres north of the planning area. The smaller branches of the main stream probably followed residual-channel depressions that had survived from the fluvial style change at the Pleistocene-Holocene transition. The pattern displayed by non-erosive depressions in the top of the Pleistocene surface in the planning area points in this direction.

141
Specific questions on the ‘macro’ level: the Yangtze Harbour areaWhat did the Late Glacial and Early Holocene landscapes look like at the present site of the Yangtze Harbour, in terms of topography and environment?
Between circa 9000 and 8000 BC, the planning area saw the development of a river-dune complex which extended into Target zone West. The maximum dune height presumably was a good 7 metres above the floodplain. Exact reconstruction of this height is impossible because of subsequent erosion. The lower parts of the floodplain (around 20 to 21m - asl) were periodically inundated and developed into reed wetlands. The higher parts of the area remained dry up to the end of the Early Holocene.
What are the exact depths below mean sea level of the encountered deposits and facies units?
The oldest flood-deposited clays of the Rhine and Meuse are found under the river-dune sands. These clays lie at a depth of circa 22m - asl and originated around 9000 BC. In Target zone West they are covered by a river-dune complex. The dune was preserved up to circa 18.5m - asl. Its original top had disappeared through marine erosion, but initially it presumably stood a good 7 metres above the floodplain. The foot of the dune was covered even in the Early Holocene by terrestrial deposits: first, by a grey fluvial clay (circa 8000-7000 BC; stratigraphical unit KRWY), subsequently by clayey peat (circa 7250-6500 BC; stratigraphical unit NIBA). Later the foot and the flank of the dune were further covered by freshwater tidal and estuarine clay from the earliest beginning of the Middle Holocene: first by freshwater tidal clay rich in organic matter (from circa 7250 to 6000 BC; stratigraphical unit EC), then by tidal-layered estuarine clay (after 6000 BC; stratigraphical unit NAWO). On this transgressive series of sediments lies a complex of much younger marine sands that were deposited offshore (stratigraphical unit SBBL). The boundary between the transgressive sequence (and the river-dune tops) and the marine sands is erosive and appears around 18.5m - asl, and deeper (below 20m - asl) where larger tidal channels have cut in.
How can these deposits and units be spatially defined (on the basis of seismic surveys and corings)?
The seismic data show the relief of the sand surface, with features such as dunes and channel transections. The stratigraphy of the Early Holocene deltaic deposits is based on sediments retrieved by means of corings of excellent quality, in which the stratification of the deposits can be recognised with millimetre precision. With the knowledge obtained from the cores, the lithofacies can also be recognised in the CPT results, whose results had been ambiguous before seismic data and high-quality corings were available. With the incremental numbers of corings and new insights into local genesis and sequences, the final report could offer considerable improvements on earlier interpretations.
What are the ages of the river dunes present in the research area and the sandy deposits of the Kreftenheye Formation?
The definitive formation of the river dune in Target zone West is put in the Early Holocene: between circa 9000 and 8500 BC. The top of the underlying fluvial sands was for the most part deposited in the Late Glacial to Early Holocene. By the time of the earliest archaeological traces (8400 BC), the aeolian building up of the dune had probably been completed, the dune had become wooded, and soil formation in the dune sand was in progress.
What is the age of the blanketing (basal) peat?
In and immediately around the planning area, the formation of the Basal Peat Bed at depths between circa 21.5 and 19.0m - asl took place between circa 7500 and 6500 BC.
How did the submergence of the river-dune landscape unfold and when did it occur (as dated from peats sampled along the dune flanks)?

142
Up to the middle Boreal (around 7500 BC), only the lowest parts of the floodplain (around 21m - asl) were flooded occasionally, at times of high river discharge. In the last part of the Boreal (around 7000 BC) the approaching of the sea becomes apparent by a rising water table. As a result, the gradient in the Rhine-Meuse valley declined and the river levels and water table in the planning area rose. This caused progressive waterlogging of the area around the dune body. From 7200 BC depressions at the foot of the dune became so wet that peat formation took hold there. Until 6500 BC, the peat encroached up the foot of the dune at a vertical rate of about 20 to 30cm a century. Around 7000 BC the peat limit around the dune lay at about 20m - asl, and around 6500 BC at about 19m - asl.
Is this drowning attributable to direct marine influence?
Up until 6500 BC the area experienced no direct marine influence. In those days it was part of the river valley. The valley did, however, see some indirect upstream effect of rising sea levels. The sedimentation of fluvial clays and the formation of Basal Peat (lithostratigraphical units KRWY and NIBA) reflect a period of about 1000 years in which deltaic aggradation and increasingly frequent inundation by the river preceded the actual drowning. Between 7500 and 6500 BC the floodplain flanking the degrading river became a marshy floodbasin in a valley that was steadily filling up.
From 6500 BC the area did experience direct marine influence. From this moment on, sediments and palynology document evidence of tides and storm floods and increasing brackishness. The two or three centuries between 6500 and 6250 BC are marked by a peculiar development related to leaps in the sea-level rise (‘a metre a year’) on top of the already rapid rise in sea level (‘a metre a century’). The overall sea-level rise over this period in this part of the North Sea was 4.06 ± 50cm, as is inferred from occurrences of the Basal Peat between the Maasvlakte and the city of Rotterdam. Roughly half of the rise is attributed to this extra sea-level acceleration: a first event around 6500 ± 44 BC was followed within 195 ± 68 years by a second one of comparable volume (Hijma and Cohen 2010). The sea-level jumps are attributed to developments in North America, where in this period large, continental meltwater lakes (Lakes Agassiz and Ojibway) finally emptied when the Hudson Bay lost its ice cap. This resulted in, among other things, a temporary cooling of the climate, which in the Greenland ice cap saw its acme 8200 years ago. These developments dominated the Holocene sea-level history at the very time when the Yangtze Harbour area was being swallowed by the sea.
At the beginning of this period, most of the area became submerged. Because of the voluminous outflow of riverwater, the environment was largely a freshwater one, but the vicinity of the sea and estuary is apparent in the evidence of tides and diatom assemblages. This landscape existed for just one or two centuries; this is clear from datings performed in the Yangtze Harbour area on samples from the base and the top of the freshwater tidal deposits (stratigraphical unit EC), and supports the presumed volume and timing of the sea-level jumps as referred to above. By around 6250 BC the area had further drowned and from then on there was direct marine influence in the area and sedimentation took place under water. In the first instance this concerned mostly fine-grained sediments from a brackish estuary (stratigraphical unit NAWO), but the area eventually became part of an offshore zone where wave action eroded the top of the older deposits everywhere. These conditions promoted general erosive processes through wave action and tidal currents down to 18m - asl, and locally, where estuarine and offshore channels took shape, down to several metres below this. As the sea level rose even further, marine sands were deposited (stratigraphical unit SBBL). The now offshore research area had become permanently marine, but up to circa 5500 BC continued to receive the outflow of the Meuse into the open sea, and from circa 500 BC also that of major channels of the Rhine.
How do these results fit in with those of earlier research in the planning area?
The palaeogeographical findings in this concluding report tie in with those of the earlier reports on the planning area. From the moment it became clear that there were dunes and a drowned Early Holocene landscape in the area, as well as archaeological evidence, attention was divided between reconstruction of the fluvial-terrestrial landscape in Early Mesolithic times (maps 8400 and 7500 BC) and deltaic wetland landscapes with

143
Mesolithic occupation dating from the Boreal and earliest Atlantic (maps 7500 to 6500 BC). Benefiting from palynological analyses – conducted quite late in the process – and integrated interpretations, the landscape reconstructions were considerably refined spatially and chronologically with respect to the earlier reports, while being worked out in greatest detail for Target zone West.
Confronting the local history of accelerating submergence with regional and global sea-level developments in the period between 6500 and 6300 BC could not be achieved before dating evidence became available for this concluding report. In Rotterdam’s Yangtze Harbour, the markedly rapid drowning around 6500 BC goes a long way towards explaining the exceptional preservation of geological layers with archaeological remains from preceding periods. Maps representing the times after 6500 BC therefore do not reflect the geographical context for the archaeological residues, but rather the context in which they were preserved.
Specific questions on the ‘meso’ level: Target zones West and East:What was the landscape like on and around the river dune?
Throughout the Early Holocene, the landscape was constantly evolving. From 8400 to 7500 BC, the area around the dune was dry land almost year-round. Only the lowest parts around 21m - asl would flood during high water. The deepest depressions in the landscape became progressively waterlogged, turning into reedland. On the dune, overgrown with scrub and spinneys, a soil developed. From 7200 BC the water table in the floodplain began to rise in response to the sea level rising downstream. As a result, a fringe of marsh, forming woodland peat, with small pools developed around the dune. These parts remained waterlogged throughout the year, owing to the higher local water table which had developed in the dune above the Wijchen Member and from time to time the pools would be flushed with river water. At greater distances from the dune too, the lower parts of the floodplain transformed into peaty marshland with reeds, and lakes filled up with humic-clayey deposits. Somewhat higher parts of the floodplain, including the foot of the dune, in the first instance still rose above the mean water table. Here the periodical deposition of overbank clay continued a little longer, but as the water table rise slightly accelerated and the river floods intensified, these parts too became progressively wetter and the marshes and lakes expanded. On the flank and top of the dune, soil formation proceeded and woodland continued to grow. Archaeological remains have turned up in the soil on the flank of the dune and associated archaeological residues have been found in the sedimentary deposits at the foot of the dune.
Around 6500 BC the area underwent dramatic changes. In a short while it drowned and became part of a shallow, freshwater tidal zone, which was to exist for just a few centuries. The accelerated sea-level rise in this period meant that a large part of the freshwater tidal zone was almost permanently submerged. The sedimentary deposits containing archaeological evidence at the foot of the dune disappeared under water by 6500 BC. It is argued that small areas of dune crest did not yet drown at the first acceleration of the sea-level rise. In Target zone West, a small remnant of the highest part of the dune (above 18m - asl) initially may still have emerged from the freshwater tidal landscape. Immediately southwest of the Yangtze Harbour, higher dune tops may have held out somewhat longer, but marine erosion of the dune tops began in this period. While in Target zone West the foot of the dune was preserved over a large area owing to clayey and peaty covering deposits and its depth, the sandy tops were truncated at 18.5m - asl. As the sea-level continued to rise to circa 16m - asl (6250 BC) and then on to 13m - asl, we may assume that by around 6000 BC even the last of the dune tops in the area of the Yangtze Harbour had been undercut and washed away.
What is the relation between the dune (in Target zone West) and the channel running east of it (in Target zone East)?
The sediment in the channel in Target zone East is an estuarine channel fill. Estuarine channels evolved only with the intensification of the tides after 6500 BC, thus at the time when the river dune was already drowning. There is no geomorphological relation between the sediment in the estuarine channel and the dune. However, the estuarine channel may follow a probably meandering residual channel of

144
the former floodplain. The beginning of dune formation in Target zone West presumably occurred around 9000 BC, shortly after the abandonment of this channel, and dune formation coincided with the first phase of the filling-in of this residual channel. Aeolian activity at this time is apparent also around the residual channel in Target zone East, and is probably coeval with the dune formation in Target zone West. It left a deposit of dune sand up to a metre thick in parts of Target zone East. Even after dune formation had ceased and the surface had become overgrown (from 8400 BC), the residual channel remained a marshy depression with possibly even some open water. The residual channel may have remained important for the drainage of the area towards the river, possibly even functioning as the lower course of a stream fed from the south, across the floodplain. This would have been in a phase when the river dune in Target zone West as well as the floodplain around the residual channel in Target zone East lay farthest from and highest above any active river channel.
From the river, north of the research area, people at this time might have reached the dune by taking canoes up the local drainage system and into the residual channel. Other routes to the dune are imaginable also in this phase, e.g. by foot along the highest parts of the floodplain, while the dune may also have been accessed from the higher and drier interior to the south. Determining accessibility links between the active river, the dune in Target zone West, and the residual channel in Target zone East before 7500 BC is a matter of speculation. At any rate, there were distinct differences in accessibility between the relatively dry floodplain before 7500 BC and the increasingly waterlogged conditions afterwards. As the area gradually drowned after 7500 BC, the residual channel as a series of depressions in the floodplain certainly became permanently inundated, taking the form of interconnected pools and lakes fringed with marshy reedland, a situation that we can nowadays observe in parts of the Danube delta. Target zone West in this period saw changes not so much to the dune itself, as to its surroundings. The wetter conditions will have enhanced the dune’s accessibility by canoe. In this period there may also have been other routes, even more direct ones, bypassing the residual channel.
How did the landscape around the dune evolve at the time of the dune’s occupation (fresh-water, brackish, marine; diachronic changes)?
At the time of the Early Mesolithic occupation (map 8400 BC) the dune was a knoll overgrown with scrub and spinneys in a plain that was occasionally flooded by the river. This floodplain too was wooded, though there were also some marshier spots. Soil formation occurred both on the dune and in the floodplain, the lowermost parts excepted.
In a somewhat later phase of Mesolithic occupation (maps 7500 and 6500 BC) the wider surroundings of the dune became wetter. The river inundated the area more frequently and more sedimentation took place. Soil formation continued only in the higher parts of the dune. The clayey peat and humic clays around the dune indicate that there were marshes with freshwater pools. The water still was entirely fresh. Downstream from the area, the river mouth and associated estuarine environments were moving closer, at a distance that Mesolithic man would have found traversable. Up to 6500 BC there was as yet no direct marine influence at the dune foot in the Yangtze Harbour. Once marine influence did manifest itself, the submersion occurred quite rapidly. By then the colluvium at the foot of the dune with its archaeological residue (washed-down fine charcoal in the top of clay beds) had been covered over by the Basal Peat, as had the slipped, charcoal-rich, disturbed soil on the lower slope of the dune.
What is the pedogenesis and exact nature of the soil in the top of the dune and of the ‘charcoal-rich levels’ in the top of the Wijchen Member?
A dark brown to black soil developed in the top of the dune. A great deal of peaty material and decomposed vegetable matter is found in the top of the soil. Also some small charcoal fragments were recovered from it. Further down, the organic content is reduced while root remnants and mite excrement indicate biological activity. The black staining of levels in the top of the Wijchen Member around the river dune was caused by an intensive enrichment with charcoal particles. These are not humic soils.
145
Do these ‘charcoal-rich levels’ have an anthropogenic origin?
On the basis of just the geological and palaeo-environmental research this is hard to tell with certainty, but in the planning area it does seem likely that man played an important role, for example by burning off the vegetation.
Is there a link between the ‘charcoal-rich levels’ in the Wijchen Member (upper part) and the archaeological residues on the dune?
Most probably there is, but on the basis of the palaeogeographical data alone this cannot be ascertained, because the presence of charcoal may also result from natural forest fires. However, the abundance of charcoal and charred plant remains in the sand and clay soils does suggest a human origin. Further archaeobotanical and archaeological research will have to bring more clarity.
Was there any erosion of the flank of the dune?
The flanks of the dune were not eroded by fluvial activity or marine scouring. But they do display a soil that reflects slope processes (creep, slumping), possibly caused by trampling. This displaced soil is covered over by peat and clay. The top of the dune, above circa 19.0/18.5m - asl, has been obliterated by subsequent Holocene marine erosion.
Specific questions relating to the landscape on the ‘micro’ level: Target zone WestAre the archaeological remains in situ?
The archaeological remains were found mainly on the flanks of the dune. The dark soil on the dune slope is thick (often more than 40cm) and often patchy in appearance. As the micromorphological study revealed, slope processes have meant that soil material from higher up slipped down to a lower part of the slope. For this reason it is likely that part of the recovered remains were not strictly in situ.
Which geological and/or facies unit produced the archaeological evidence?
Most came from the partially displaced humic soil in the top of the dune flanks. By the time of its slumping, humus had already accumulated in the soil. This puts the disturbance on the dune flank in the latter part of the dune’s existence: presumably between 7500 and 6500 BC. Waterlogging of the foot of the dune may have rendered the slope of the dune more prone to slipping.
Is there any evidence of erosion and/or displacement of the archaeological remains?
Yes, there is; see above. A horizontal displacement of several metres is likely (estimate: one to ten metres). OSL datings of the sand in the soil on the flanks of the dune indicate that the grains were exposed to light as late as between 7000 and 6500 BC. This light exposure is attributed to colluvial processes and/or trampling on the flank of the dune.
Did the method of research/excavation affect the archaeological remains (e.g. in terms of damage or context)?
Given the method of excavation and recovery with the aid of a pontoon crane, and the slight thickness of the individual strata, the exact context of the archaeological material cannot be fully ascertained. Some contamination with sediments from overlying and underlying deposits is expected in almost every ‘big bag’ that was examined. However, the effect of this on the results will be only slight, because on the one hand the archaeological remains were present in just one stratigraphical level (the displaced soil) and on the other, every ‘batch’ lifted by the crane was very closely inspected in the course of recovery.

146
Notes
1. Deltares, Afdeling Toegepaste Geologie en Geofysica (TGG), Princetonlaan 6, 3584 CB Utrecht. E-mail: [email protected]. Universiteit Utrecht, Departement Fysische Geografie, Heidelberglaan 2, 3584 CS Utrecht. E-mail [email protected] Deltares, Afdeling Toegepaste Geologie en Geofysica (TGG), Princetonlaan 6, 3584 CB Utrecht. TNO Geological Survey of the Netherlands, Afdeling Geomodellering, Princetonlaan 6, 3584 CB Utrecht.

147
M.J.L.Th. Niekus1, A. Verbaas2, H. de Kruyk3, and J.J. Boon4
4.1 Introduction
This chapter presents the methods and results of an analysis of the lithic component of a Mesolithic site on a river dune buried deep in the subsoil of the planning area Rotterdam-Yangtze Harbour. The lithic component comprised 2976 pieces of flint in total with a combined weight of 2056.2g, as well as 262 pieces of stone (combined weight 501.1g).5 Specific topics of discussion will include the composition of the assemblage, the characteristics of the retouched tools, and the raw materials and their (probable) origins, the latter in part based on a thin-section analysis of some of the flint, performed by Hans de Kruyk. The function of the flint and stone tools will also be addressed, on the basis of the results of use-wear analysis carried out by Annemieke Verbaas. An assessment of some technological characteristics of the assemblage – especially blades and cores – in combination with typological classification, will provide additional information on the technological system and on the chronology and cultural affiliation of the site. The stone assemblage is largely composed of natural pebbles with some recent intrusions; there are no more than a few dozen worked and/or used specimens (including a blade of Wommersom quartzite), which will be briefly discussed. The chapter concludes with an attempt to formulate answers to the research questions (see Section 4.2). A limited literature survey served to place the site in a wider context. The results will be presented for each research trench separately. As Trench 3 and the soil core samples produced only a few finds, these will be dealt with in brief.
4.2 Research questions
The analysis presented here was guided by a number of questions of varying scope, following Smit (2012).
Microscale general- What is the material composition of the archaeological stone assemblage?- What is the age of the archaeological objects?- What were the geological units and/or facies from which the remains were retrieved?- What was the impact of the methods of retrieval and post-retrieval processing on the condition, context data, etc. of the archaeological remains?- To what extent did the analysis methods affect the composition of the archaeological assemblage? How does this compare to conditions at excavations carried out on land?
Microscale specific- What artefact types were recovered from the three research areas? What were their origin, typological and technological characteristics, and chronological context?- What activities were carried out by the occupants of the dune site?- What functions did the artefacts have in the past?
Synthesising questions- How do these archaeological remains compare to archaeological remains/complexes known from the North Sea area and from land-based sites? Are there parallels to specific sites/complexes?- If no parallel sites can be identified, how should we interpret the Rotterdam-Yangtze Harbour remains?- What is the wider chronological and cultural context of the Yangtze Harbour flint assemblage?- Are there indications for (inter)regional contact/transport of finished goods and (raw) materials?
4 Flint and other stone
148
Additional research questions- Are the analysis results for the three research trenches similar or different? Do all three trenches together represent one large cluster of archaeological material (find complex), or is each trench a sample of a distinct, spatially isolated, smaller cluster of different character and date?
4.3 Procedures, methods, and selection
This section will briefly discuss the procedures and methods used in the analysis. Thin-section analysis of the flint material will receive particular attention because of its innovative nature, and also because of its importance in determining the origins of the raw materials and the identification of post-depositional surface modifications (see e.g. de Kruyk 2009; de Kruyk and Timmner 2014; de Vries et al. 2012).
4.3.1 Description, classification, and technological observations
All flint and stone specimens were examined macroscopically (occasionally with a 10x magnifying glass), identified, and recorded under its find number in a separate Excel spreadsheet.6 If a find number encompassed more than one piece, each specimen was assigned an additional serial number. All pieces over or equalling 10mm were recorded individually, as were blade and tool fragments smaller than 10mm. Chips and other – usually burnt – fragments smaller than 10mm were recorded in bulk after sorting them into burnt and unburnt pieces. Appendix 4.1 lists all recorded metrical and non-metrical characteristics. The typological classification of the flint was based on Deeben and Schreurs (1997), Newell and Vroomans (1972, including the unpublished Material List), Peeters, Schreurs, and Verneau (2001), and Price (1975); Idem (1980).
4.3.2 Use-wear analysis
Use-wear analysis involves studying and interpreting any traces of wear formed on artefacts during use. A stereo microscope (a Nikon and a Leica, both with ringlight with magnifications 10-65x) and a metallographic microscope (a Nikon Optiphot and a Leica DM6000M with magnifications 50 tot 560x) were used to analyse the Yangtze Harbour flint and stone. A stereo microscope provides a clear image of an object’s condition and any traces of wear, e.g. edge rounding, use retouch and distribution. A metallographic microscope allows a more detailed study of these phenomena. Observed are use retouch, edge rounding, striations, polish, and the distribution of these traces of wear. In combination these characteristics provide clues to the nature of both the worked material and the performed actions.An assessment of the quality of the flint and its suitability for use-wear analysis preceded the analysis. For this purpose the first author selected 73 flint pieces according to the criteria listed below. These pieces were studied by the second author for the presence of post-depositional surface changes and other damage. At this stage the focus was not on the detection and interpretation of use wear. When encountered, however, it was recorded.
The preliminary assessment revealed that the material, although it appeared fresh, nonetheless had been affected whilst still in the soil and also by the chosen methods of retrieval and collection in the field (see Section 4.4.1 for more details), but that most of it was still suitable for use-wear analysis. It was decided to subject all pieces which met one of the selection criteria listed below to a brief inspection. Heavily damaged specimens were immediately rejected for further analysis.
Selection criteria were the presence of:- Intentional retouch (‘tools’);- A straight working edge at least 5mm long;- A-point protruding far enough to be functional;- A straight, blunt working edge;- The absence of heavy post-depositional or retrieval-related damage.
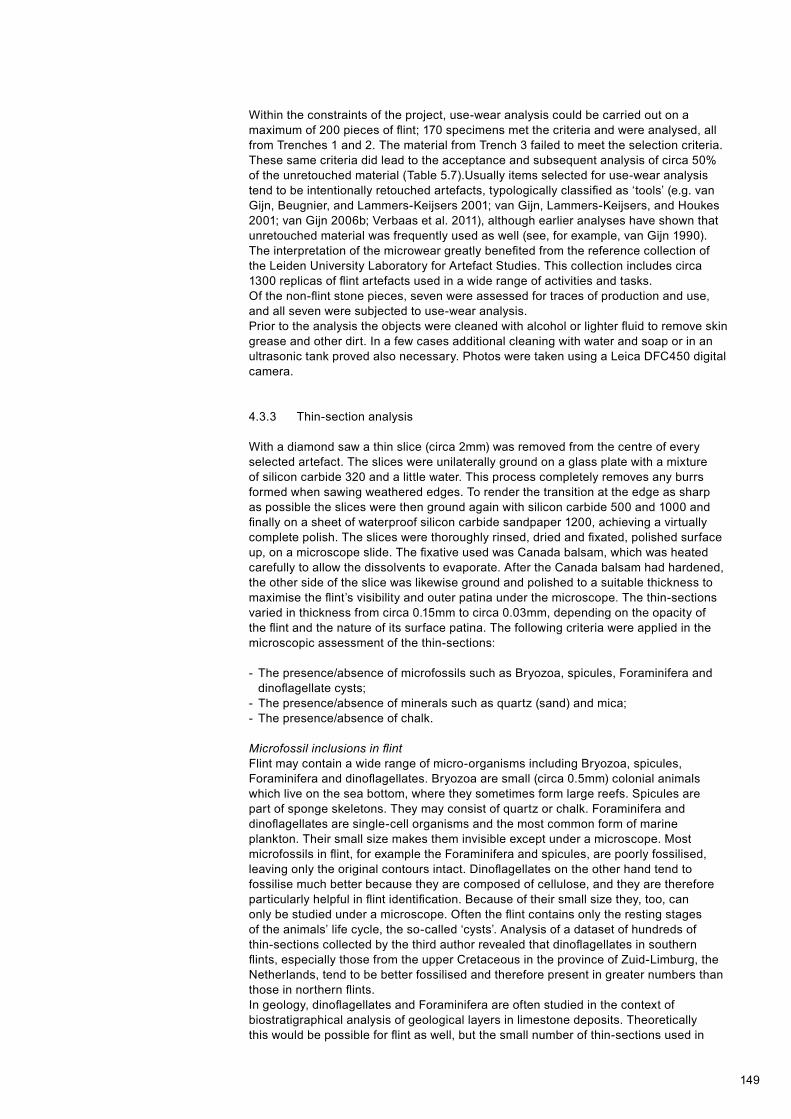
149
Within the constraints of the project, use-wear analysis could be carried out on a maximum of 200 pieces of flint; 170 specimens met the criteria and were analysed, all from Trenches 1 and 2. The material from Trench 3 failed to meet the selection criteria. These same criteria did lead to the acceptance and subsequent analysis of circa 50% of the unretouched material (Table 5.7).Usually items selected for use-wear analysis tend to be intentionally retouched artefacts, typologically classified as ‘tools’ (e.g. van Gijn, Beugnier, and Lammers-Keijsers 2001; van Gijn, Lammers-Keijsers, and Houkes 2001; van Gijn 2006b; Verbaas et al. 2011), although earlier analyses have shown that unretouched material was frequently used as well (see, for example, van Gijn 1990).The interpretation of the microwear greatly benefited from the reference collection of the Leiden University Laboratory for Artefact Studies. This collection includes circa 1300 replicas of flint artefacts used in a wide range of activities and tasks.Of the non-flint stone pieces, seven were assessed for traces of production and use, and all seven were subjected to use-wear analysis.Prior to the analysis the objects were cleaned with alcohol or lighter fluid to remove skin grease and other dirt. In a few cases additional cleaning with water and soap or in an ultrasonic tank proved also necessary. Photos were taken using a Leica DFC450 digital camera.
4.3.3 Thin-section analysis
With a diamond saw a thin slice (circa 2mm) was removed from the centre of every selected artefact. The slices were unilaterally ground on a glass plate with a mixture of silicon carbide 320 and a little water. This process completely removes any burrs formed when sawing weathered edges. To render the transition at the edge as sharp as possible the slices were then ground again with silicon carbide 500 and 1000 and finally on a sheet of waterproof silicon carbide sandpaper 1200, achieving a virtually complete polish. The slices were thoroughly rinsed, dried and fixated, polished surface up, on a microscope slide. The fixative used was Canada balsam, which was heated carefully to allow the dissolvents to evaporate. After the Canada balsam had hardened, the other side of the slice was likewise ground and polished to a suitable thickness to maximise the flint’s visibility and outer patina under the microscope. The thin-sections varied in thickness from circa 0.15mm to circa 0.03mm, depending on the opacity of the flint and the nature of its surface patina. The following criteria were applied in the microscopic assessment of the thin-sections:
- The presence/absence of microfossils such as Bryozoa, spicules, Foraminifera and dinoflagellate cysts;- The presence/absence of minerals such as quartz (sand) and mica;- The presence/absence of chalk.
Microfossil inclusions in flintFlint may contain a wide range of micro-organisms including Bryozoa, spicules, Foraminifera and dinoflagellates. Bryozoa are small (circa 0.5mm) colonial animals which live on the sea bottom, where they sometimes form large reefs. Spicules are part of sponge skeletons. They may consist of quartz or chalk. Foraminifera and dinoflagellates are single-cell organisms and the most common form of marine plankton. Their small size makes them invisible except under a microscope. Most microfossils in flint, for example the Foraminifera and spicules, are poorly fossilised, leaving only the original contours intact. Dinoflagellates on the other hand tend to fossilise much better because they are composed of cellulose, and they are therefore particularly helpful in flint identification. Because of their small size they, too, can only be studied under a microscope. Often the flint contains only the resting stages of the animals’ life cycle, the so-called ‘cysts’. Analysis of a dataset of hundreds of thin-sections collected by the third author revealed that dinoflagellates in southern flints, especially those from the upper Cretaceous in the province of Zuid-Limburg, the Netherlands, tend to be better fossilised and therefore present in greater numbers than those in northern flints.In geology, dinoflagellates and Foraminifera are often studied in the context of biostratigraphical analysis of geological layers in limestone deposits. Theoretically this would be possible for flint as well, but the small number of thin-sections used in

150
Origins Mineral inclusionsNorthern flint Bryozoa flint Habernis (Germ) - Bryozoa flint (transparent type) Hohenhain (Germ) - Danien flint Habernis (Germ) - Falster flint Falster (DK) - Senonian flint Habernis (Germ) - Senonian flint Hohwachter (Germ) - Senonian flint Neustadt (Germ) - Heligoland flint Type 1 Heligoland (Germ) - Heligoland flint Type 2 Heligoland (Germ) - Heligoland flint Type 3 Heligoland (Germ) - Heligoland flint Type 4 Heligoland (Germ) - Heligoland flint Type 5 Heligoland (Germ) - Hemmoor flint Hemmoor (Germ) - Kristianstad flint Kristianstad (S) +++ Hökholz flint Hökholz (Germ) +Southern flint Lousberg flint Aachen (Germ) + Rijckholt flint Rijckholt (NL) + Eben Emaël flint Eben Emaël (B) + Maastricht: Enci quarry in various horizons Maastricht (NL) + to +++ Valkenburg flint Valkenburg (NL) + Grand Pressigny flint Grand Pressigny (Fr) +++
Table 4.1. Mineral inclusions in European flint types, flint sorted into northern and southern types. Scattered, small: +; many, relatively large: +++.
the analysis was insufficient for the purpose. Stratigraphical analysis often focusses exclusively on dinoflagellates and Foraminifera because the developmental stages of these animals are clearly distinct, unlike those of spicules and Bryozoa. This was the main reason for concentrating on the presence of dinoflagellates in the thin-sections.
Mineral inclusions in flintMany flint types contain minerals such as quartz, mica and sometimes also feldspars. Most inclusions are small, varying in diameter from >0.1mm to circa 0.2mm. Some types of flint contain inclusions of circa 0.5mm. A possible explanation is that these types originated in seas which contained mineral silts deposited far from the coast by rivers. The following observation by the third author confirmed this. In November 2012 a 10-litre sample of sea water was taken at 52° N – 003° E (circa 40 nautical miles from the coast at Hook of Holland) and microscopically analysed for the presence of microminerals. The water contained numerous small mineral particles measuring 5μm tot 0.2mm in diameter and included mica, quartz and feldspars.Other analyses carried out by the third author revealed that only two of the northern flint types contain mineral inclusions; Kristianstad flint from Sweden and Hökholz flint from North Germany. Kristianstad flint is dark and bituminous with an extremely high mineral content in the form of quartz and mica, but occasionally also feldspars. Hökholz flint contains hardly any minerals ans it takes some effort to recognise them. On the other hand, all of the studied southern flints do. This makes the presence or absence of minerals a useful clue to the flint’s origin. Table 4.1 lists the reference observations.
Calcium carbonate in flintMany flint types contain calcium carbonate fragments in varying numbers, remnants of the limestone matrix in which the flint was formed. European flint types with many lime fragments are the matt ‘Danien’ flint from North Germany and Valkenburg flint from the south of the Netherlands. The lime content in these flints may reach 10% or more and when immersed in hydrochloric acid these flints fizz vehemently, albeit briefly. The presence or absence of lime is yet another clue to the origin of the flint.

151
4.3.4 Analysis black residue
A hybrid of a lanceolate/C-point was found to contain a black residue which was suspected to be tar. With the aid of a stereomicroscope a sample of the residue was taken. When this proved to be insufficient for mass spectrometry, it was decided to retrieve additional black material from the find bag in which the point had been kept. The sample was transferred to a small glass mortar, mixed with 40μl of ethanol and ground with a glass pestle. A 5μl-aliquot of the suspension was transferred to the coil of the Platinum-Rhodium wire (9/1; diameter 100μm) of the analysis probe, where the ethanol was allowed to evaporate under vacuum conditions. The probe was inserted into the JEOL SX102-102A 4 sector mass spectrometer. When the coil was heated the organic components of the sample evaporated or underwent a process of pyrolysis in which they degraded into smaller molecules and were subsequently analysed. Conditions for analysis were set at electron ionisation 16 eV, acceleration voltage 8 keV, scan range 25-1000 Dalton and scan-cycle time 1s.
4.4 Results
4.4.1 Formation processes
At first impression the flint looked well preserved. The surfaces seemed fresh and some of the edges were still sharp. Microscopically, however, the specimens’ condition appeared less good. Post-depositional processes and retrieval methods during the underwater research had affected the material. In some instances the flint had been slightly altered whilst still in the soil matrix, a process which had left a sheen covering the entire surface and making interpretation of the use wear difficult or even impossible. The intensity of these surface modification processes varied greatly; some pieces had barely been affected, while others displayed a high level of alteration and as a result were no longer interpretable. Variations between the trenches in the intensity of this phenomenon were not recorded systematically.The research methods – using mechanical diggers and mechanical screening of the soil – were another damaging factor. Traces of contact with metal were the most obvious, but as these are easily identified their presence did not rule out use-wear analysis. Occasionally, however, metal scratches which completely overlaid or crossed the prehistoric use wear made further analysis impossible. Besides contact with metal, another factor with a negative impact was the deployment of the so-called ‘Lutter sieve’, a semi-mechanised contraption for water screening archaeological soil material in bulk. The movement of the sieve in combination with sand and water inflicted damage to the artefacts (Fig. 4.1a) resembling that observed in experiments on fired arrowheads which had hit the ground (Fig. 4.1b, Lammers-Keijsers, Verbaas, van Gijn, and Pomstra, in preparation). The marks observed during the shooting experiments were indistinguishable from damage caused by grains of sand in the Lutter sieve during the find retrieval process, making an identification of traces of shooting impossible. Finally, the sieving process also resulted in edge damage which closely resembled use retouch. Microscopically, however, this ‘sieve retouch’ could sometimes be distinguished from use retouch because in the latter the distal face of the retouch is rounded (Fig. 4.1c), while ‘sieve retouch’ cuts across any use wear present. On tools that had been used on harder materials, however, use retouch was hardly worn at all; in such cases the distinction between ‘sieve retouch’ and use retouch was very difficult to make.Many of the studied flints are grey to dark grey, almost black. Thin-section analysis of a number of specimens (see Section 4.4.2) revealed this colour to be a result of the presence of iron sulphide. This black patina is sometimes called ‘swamp patina’ (Stoel 1991; Stapert 1993). It is commonly observed on flint which has been exposed to anaerobic conditions for a long time (e.g. Stapert 1986; Johansen, Niekus, and Stapert 2009). Whether all observed dark flint types have the black patina is uncertain; in some cases the colour may simply be the flint’s natural colour. Other observed secondary surface changes were white patina, gloss and rounding. White patina, caused by a chemical solution process interpreted as probably resulting from contact with soil acids (for example from plant roots; Stapert 1976), was observed on only four artefacts (Find numbers 219.2, 303.1, 321.2 and 338.1). As was stated earlier, most of the flint looked

152
Fig. 4.1. Post-depositional and experimental marks on the flint.a. Traces of contact with a metal screen and with sand on the surface of Find number 316.12, formed during retrieval in the field. Original magni-fication 100x.b. Retouch with rounded back edge on Find number 23.1. Traces interpreted as resulting from working hide in both a longitudinal and a transverse direction. Original magnification 100x.c. Traces left by contact with soil on an experimentally fired arrowhead after it hit the ground. Original magnification 100x.
a b
c
fairly fresh and sharp. One small chip with black patina (Find number 209.1) was much rounded, possibly the result of rolling. This particular specimen, however, may not be an artefact, but could also be a geofact instead (i.e. naturally modified flint). Another chip, also with black patina (Find number 181.2), exhibited an intense gloss, probably caused by the abrasive action of sand. In general the assemblage displayed no signs of large-scale secondary displacement or rolling after its deposition on the dune.
4.4.2 Selection of raw materials and their origins
The next sections will discuss the flint and stone types and their probable origins. Flint and stone will be presented separately.
4.4.2.1 Flint
Flint identification focussed on the presence or absence of fossils (especially Bryozoa), texture, and characteristics of the cortex (when present) or other old surfaces which pre-dated the reduction process (see Appendix 4.1). A summary of the flint classification, based on visual criteria, is presented in Table 4.2. As Trench 3 and the soil core samples produced very few flints (all of unknown origin) these were excluded. Although Trenches 1 and 2 appear very similar, Trench 1 seems to have produced slightly more specimens of southern flint types, while northern flint (i.e. that containing Bryozoa) was more common in Trench 2. The significance of this observation is unknown, since the raw material of most of the chips and burnt pieces could not be further classified.

153
Trench 1 Trench 2 TotalFlint Type N % N % N %Indeterminate 735 88.2 2079 97.5 2814 94.9Rijckholt type 52 6.2 14 0.7 66 2.2Bryozoa flint 1 0.1 18 0.8 19 0.6River pebble (‘Maasei’) 3 0.4 3 0.1 6 0.2Flint with cavities 3 0.4 - - 3 0.1‘Southern’ 14 1.7 5 0.2 19 0.6Northern? 3 0.4 7 0.3 10 0.3Southern? 22 2.6 7 0.3 29 1.0 Total 833 100.0 2133 99.9 2966 99.9
Table 4.2. Flint assemblages from Trenches 1 and 2 classified by flint type and probable origin. The category ‘indeterminate’ comprises unclassifiable, burnt fragments and artefacts as well as chips. ‘Rijckholt type’ here and elsewhere refers to flint which resembles Rijckholt flint, but which does not necessarily derive from the actual Rijckholt deposits.
In order to obtain more detailed information on the origin of the material, a thin-section analysis was performed on a small sample of seven flints and one stone specimen, Find numbers 13.4, 36.10, 84.3, 114.3, 276.4, 287.1 and 287.2 (all flint) and 31.2 (stone). The results for the flint will be discussed below.
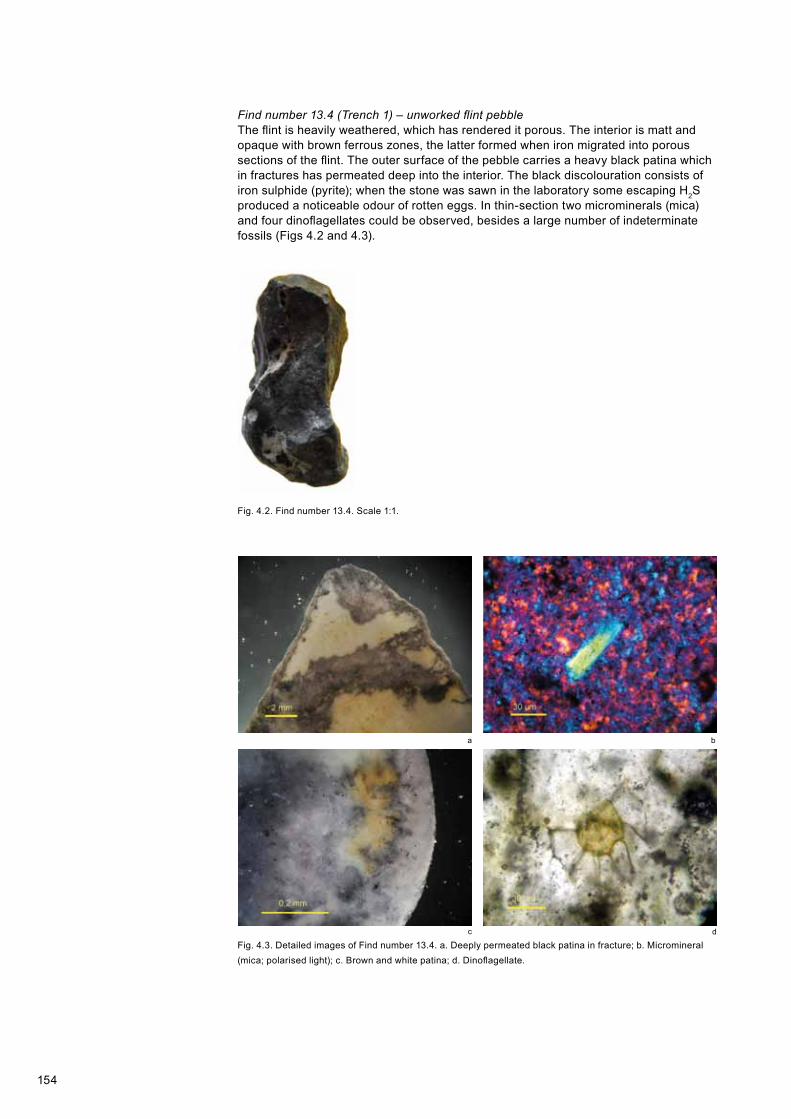
154
Fig. 4.3. Detailed images of Find number 13.4. a. Deeply permeated black patina in fracture; b. Micromineral (mica; polarised light); c. Brown and white patina; d. Dinoflagellate.
a b
c d
Fig. 4.2. Find number 13.4. Scale 1:1.
Find number 13.4 (Trench 1) – unworked flint pebbleThe flint is heavily weathered, which has rendered it porous. The interior is matt and opaque with brown ferrous zones, the latter formed when iron migrated into porous sections of the flint. The outer surface of the pebble carries a heavy black patina which in fractures has permeated deep into the interior. The black discolouration consists of iron sulphide (pyrite); when the stone was sawn in the laboratory some escaping H2S produced a noticeable odour of rotten eggs. In thin-section two microminerals (mica) and four dinoflagellates could be observed, besides a large number of indeterminate fossils (Figs 4.2 and 4.3).

155
Fig. 4.4. Find number 36.10. Scale 1:1.
Fig. 4.5. Detailed images of Find number 36.10. a. Deeply permeated black patina in fracture; b. Porosity as a result of weathering; c. Foraminifer; d. Micromineral (mica; polarised light).
a b
c d
Find number 36.10 (Trench 1) – blockThe flint is heavily weathered, which has rendered it porous. The interior is matt and opaque. The black patina is well developed on the exterior and has permeated deeply into the interior. The black patina consists of iron sulphide (pyrite) and released some H2S gas upon being sawn. In thin-section the flint contains many indeterminate fossils, four microminerals (mica) but no dinoflagellates (Figs 4.4 and 4.5).
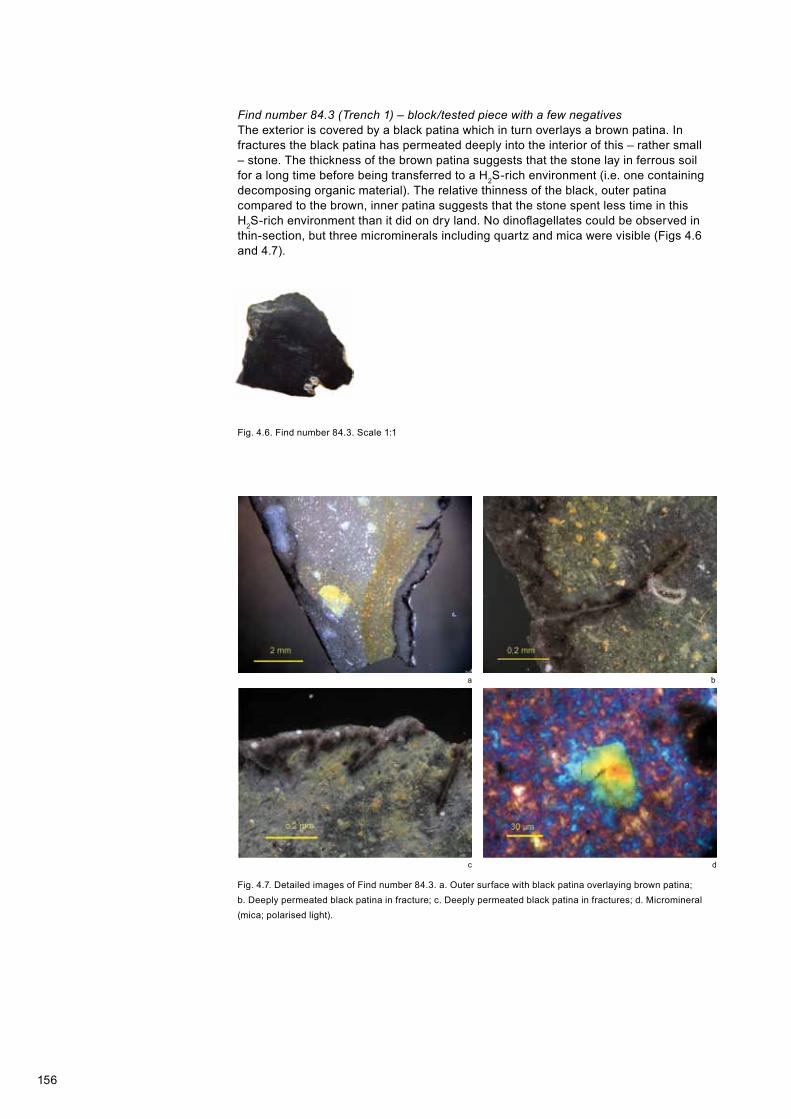
156
Fig. 4.6. Find number 84.3. Scale 1:1
Fig. 4.7. Detailed images of Find number 84.3. a. Outer surface with black patina overlaying brown patina; b. Deeply permeated black patina in fracture; c. Deeply permeated black patina in fractures; d. Micromineral (mica; polarised light).
a b
c d
Find number 84.3 (Trench 1) – block/tested piece with a few negativesThe exterior is covered by a black patina which in turn overlays a brown patina. In fractures the black patina has permeated deeply into the interior of this – rather small – stone. The thickness of the brown patina suggests that the stone lay in ferrous soil for a long time before being transferred to a H2S-rich environment (i.e. one containing decomposing organic material). The relative thinness of the black, outer patina compared to the brown, inner patina suggests that the stone spent less time in this H2S-rich environment than it did on dry land. No dinoflagellates could be observed in thin-section, but three microminerals including quartz and mica were visible (Figs 4.6 and 4.7).

157
Fig. 4.8. Find number 114.3. Scale 1:1.
Fig. 4.9. Detailed images of Find number 114.3. a. Deeply permeated black patina; b. Dinoflagellate; c. Micro-mineral (mica; polarised light); d. Micromineral (mica) containing other microminerals (polarised light).
a b
c d
Find number 114.3 (Trench 1) – flake of Rijckholt-type flintThis flake is also heavily weathered and porous as a result. The interior is matt and opaque, the exterior is covered in a black patina which has permeated deeply into the interior. The black patina consists of iron sulphide (pyrite) and releases some H2S gas upon being sawn. In thin-section two dinoflagellates and four microminerals (quartz and mica) were visible, the latter including a micromineral inside another micromineral, a phenomenon commonly observed in mica (Figs 4.8 and 4.9).

158
Fig. 4.10. Find number 276.4. Scale 1:1.
Fig. 4.11. Detailed images of Find number 276.4. a. Black patina in the edge zone of the flint; b. Black patina which extends to the flint’s core; c. and d. Bryozoa.
a b
c d
Find number 276.4 (Trench 2) – flake, northern flintThe flake is heavily weathered, which has rendered it porous. The interior is matt and opaque while the exterior is covered in a black patina which has permeated to the stone’s core. The black patina consists of iron sulphide (pyrite). The flint contains many (remains of) Bryozoa and can therefore be classified as a Bryozoa type. In thin-section one dinoflagellate could be observed but no minerals were present (Figs 4.10 and 4.11).

159
Fig. 4.12. Find number 287.1. Scale 1:1.
Fig. 4.13. Detailed images of Find number 287.1. a. Black patina in the edge zone of the flint; b. and c. Dinofla-gellates; d. Mineral (mica).
a b
c d
Find number 287.1 (Trench 2) – core preparation flakeThe flint is heavily weathered, which has rendered it porous. The interior is matt and opaque while the exterior is covered in a black patina which extends to the stone’s core. The black patina consists of iron sulphide (pyrite). When the flint was sawn, some escaping H2S gas left a distinct odour of rotten eggs. In thin-section two quartz minerals and ten dinoflagellates could be observed. The stone also contained many indeterminate fossils (Figs 4.12 and 4.13).
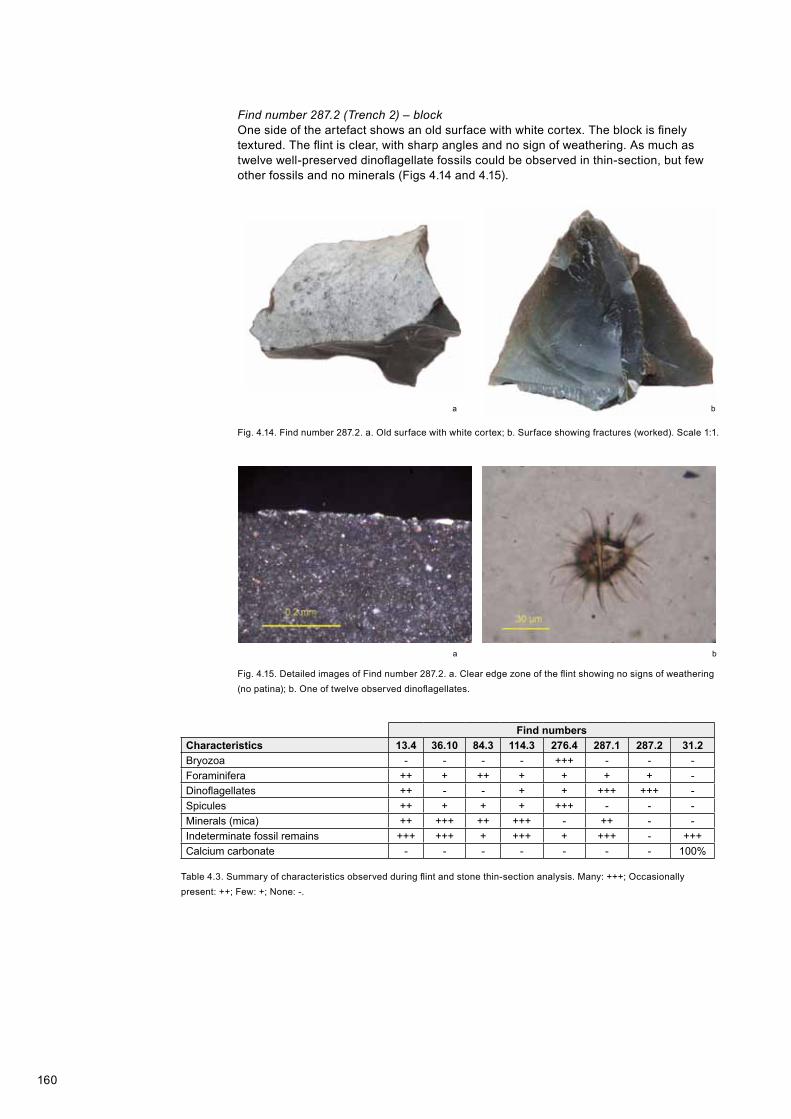
160
Fig. 4.15. Detailed images of Find number 287.2. a. Clear edge zone of the flint showing no signs of weathering (no patina); b. One of twelve observed dinoflagellates.
a b
a b
Find numbersCharacteristics 13.4 36.10 84.3 114.3 276.4 287.1 287.2 31.2Bryozoa - - - - +++ - - -Foraminifera ++ + ++ + + + + -Dinoflagellates ++ - - + + +++ +++ -Spicules ++ + + + +++ - - -Minerals (mica) ++ +++ ++ +++ - ++ - -Indeterminate fossil remains +++ +++ + +++ + +++ - +++Calcium carbonate - - - - - - - 100%
Table 4.3. Summary of characteristics observed during flint and stone thin-section analysis. Many: +++; Occasionally present: ++; Few: +; None: -.
Fig. 4.14. Find number 287.2. a. Old surface with white cortex; b. Surface showing fractures (worked). Scale 1:1.
Find number 287.2 (Trench 2) – blockOne side of the artefact shows an old surface with white cortex. The block is finely textured. The flint is clear, with sharp angles and no sign of weathering. As much as twelve well-preserved dinoflagellate fossils could be observed in thin-section, but few other fossils and no minerals (Figs 4.14 and 4.15).
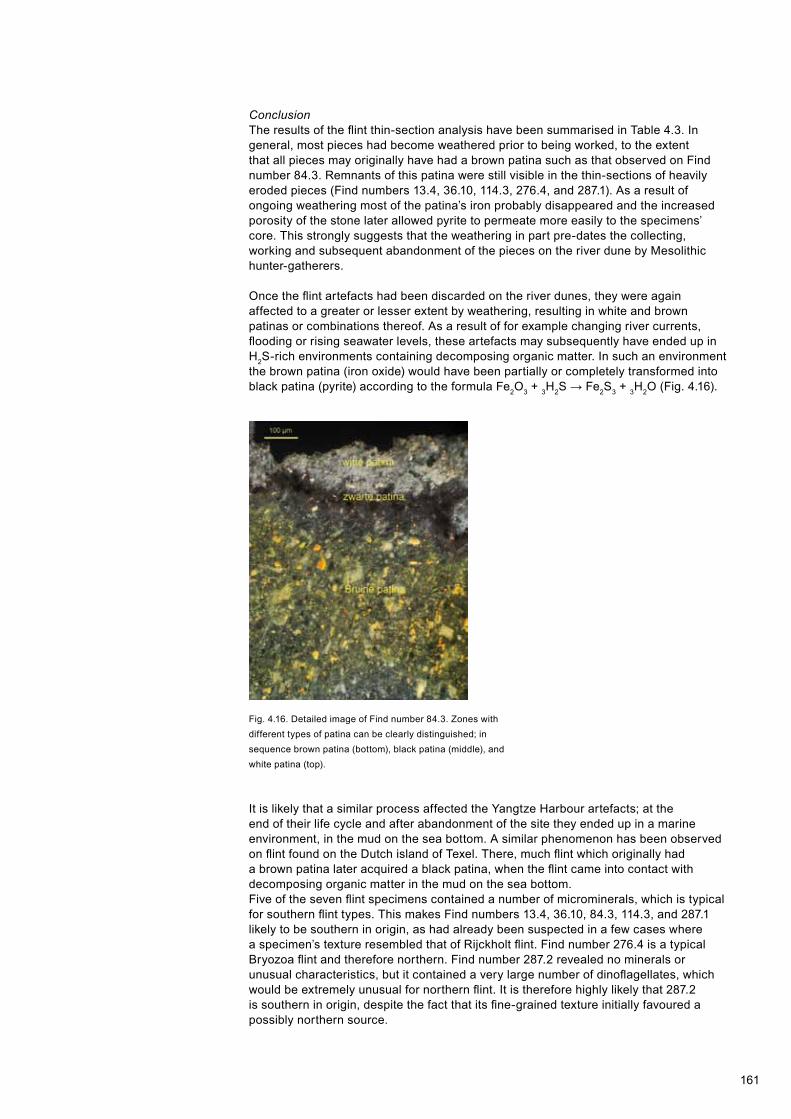
161
Fig. 4.16. Detailed image of Find number 84.3. Zones with different types of patina can be clearly distinguished; in sequence brown patina (bottom), black patina (middle), and white patina (top).
ConclusionThe results of the flint thin-section analysis have been summarised in Table 4.3. In general, most pieces had become weathered prior to being worked, to the extent that all pieces may originally have had a brown patina such as that observed on Find number 84.3. Remnants of this patina were still visible in the thin-sections of heavily eroded pieces (Find numbers 13.4, 36.10, 114.3, 276.4, and 287.1). As a result of ongoing weathering most of the patina’s iron probably disappeared and the increased porosity of the stone later allowed pyrite to permeate more easily to the specimens’ core. This strongly suggests that the weathering in part pre-dates the collecting, working and subsequent abandonment of the pieces on the river dune by Mesolithic hunter-gatherers.
Once the flint artefacts had been discarded on the river dunes, they were again affected to a greater or lesser extent by weathering, resulting in white and brown patinas or combinations thereof. As a result of for example changing river currents, flooding or rising seawater levels, these artefacts may subsequently have ended up in H2S-rich environments containing decomposing organic matter. In such an environment the brown patina (iron oxide) would have been partially or completely transformed into black patina (pyrite) according to the formula Fe2O3 + 3H2S → Fe2S3 + 3H2O (Fig. 4.16).
It is likely that a similar process affected the Yangtze Harbour artefacts; at the end of their life cycle and after abandonment of the site they ended up in a marine environment, in the mud on the sea bottom. A similar phenomenon has been observed on flint found on the Dutch island of Texel. There, much flint which originally had a brown patina later acquired a black patina, when the flint came into contact with decomposing organic matter in the mud on the sea bottom.Five of the seven flint specimens contained a number of microminerals, which is typical for southern flint types. This makes Find numbers 13.4, 36.10, 84.3, 114.3, and 287.1 likely to be southern in origin, as had already been suspected in a few cases where a specimen’s texture resembled that of Rijckholt flint. Find number 276.4 is a typical Bryozoa flint and therefore northern. Find number 287.2 revealed no minerals or unusual characteristics, but it contained a very large number of dinoflagellates, which would be extremely unusual for northern flint. It is therefore highly likely that 287.2 is southern in origin, despite the fact that its fine-grained texture initially favoured a possibly northern source.

162
Trench 1 Trench 2 TotalStone type N % Weight
in gN % Weight
in gN % Weight
in g%
Silicate limestone? 42 42.0 4.4 61 37.4 5.6 103 39.2 10.0 2.0Bluestone 23 23.0 8.0 32 19.6 2.6 55 20.9 10.6 2.1Quartz geode? - - - 48 29.4 4.6 48 18.3 4.6 0.9Quartzite 16 16.0 1.8 - - - 16 6.1 1.8 0.4Quartz sandstone 9 9.0 150.6 4 2.5 137.0 13 4.9 287.6 57.4Vein quartz 1 1.0 3.5 11 6.7 26.9 12 4.6 30.4 6.1Micaceous sandstone 6 6.0 115.4 5 3.1 39.2 11 4.2 154.6 30.9Limestone? 2 2.0 0,5 - - - 2 0.8 0.5 0.1Wommersom quartzite - - - 2 1.2 1.0 2 0.8 1.0 0.2Amber 1 1.0 < 0.1 - - - 1 0.4 < 0.1 - Total 100 100.0 284.2 163 99.9 216.9 263 100.2 501.1 100.1
Table 4.4. Stone assemblages from Trenches 1 and 2, classified by stone type.
The conclusion is that the flint assemblage from Trenches 1 and 2 contains a mixture of northern and southern flint types. A few fragments of flint river pebble, or so-called ‘Maasei’ (‘Meuse-egg’), a type characterised by a rounded exterior with many circular microfractures on the surface, definitely derive from gravelly fluviatile deposits.Also the Rijckholt-type flints are likely to derive from a secondary source, judging by the many glossy old surfaces observed on the specimens; there are no indications that this is primary, i.e. mined flint. Virtually all Yangtze Harbour artefacts of Bryozoa flint completely lack a cortex or other old surfaces which pre-date the working/reduction process, which makes it impossible to establish (if at all possible) whether the raw material was collected from glacial or till deposits, or had become secondarily embedded in fluviatile deposits. In general the virtual absence of a cortex or other old surfaces on Yangtze Harbour flint artefacts suggests that preparation and/or the primary reduction of flint nodules may have taken place elsewhere, and that the raw material was transported to the river dune in a prepared or semi-finished state (cores, blades and such). If true, this means that the raw materials may have been collected at a greater distance from the dune. Where exactly is unknown; no gravelly deposits surfacing in that period have been identified. In this respect Yangtze Harbour resembles many other coastal and semi-coastal sites. One possible source of flint nodules is the North Sea area west of the site, as this was largely dry land when the site Yangtze Harbour was occupied.7
4.4.2.2 Other stone
Besides many thousands of natural pebbles/gravel retrieved from the soil core samples, dozens of stones (including a piece of metal slag) retrieved from the trenches are also interpreted as recent intrusions. A total of 263 stones or stone fragments, however, were interpreted as definitely or probably associated with the Mesolithic occupation phase (Table 4.4).
The raw material of one Wommersom quartzite blade fragment (Find number 280.5) – also called ‘Grès-quartzite de Wommersom’, or GQW – and one heavily burnt flake (Find number 336.8), which may also be of Wommersom quartzite originated from the area around Tienen in Belgium (Fig. 4.17). This material is not known to occur secondarily in fluviatile deposits, which means that it must have arrived at the site either through direct acquisition at the source, or through exchange networks. One 4.8mm amber fragment – possibly debitage – may derive from local sources in the (wider) area around Yangtze Harbour. The vein quartzes and some of the sandstones (especially the micaceous variety) probably came from gravelly fluviatile deposits of the rivers Rhine and/or Meuse. The presence of some flat sandstone river pebbles and two lydites points to such an origin. These pieces were not included in Table 4.4 as they showed no signs of knapping and/or use and may in fact be recent intrusions. In the course of the analysis many dozens of – usually small – fragments of (dark) grey
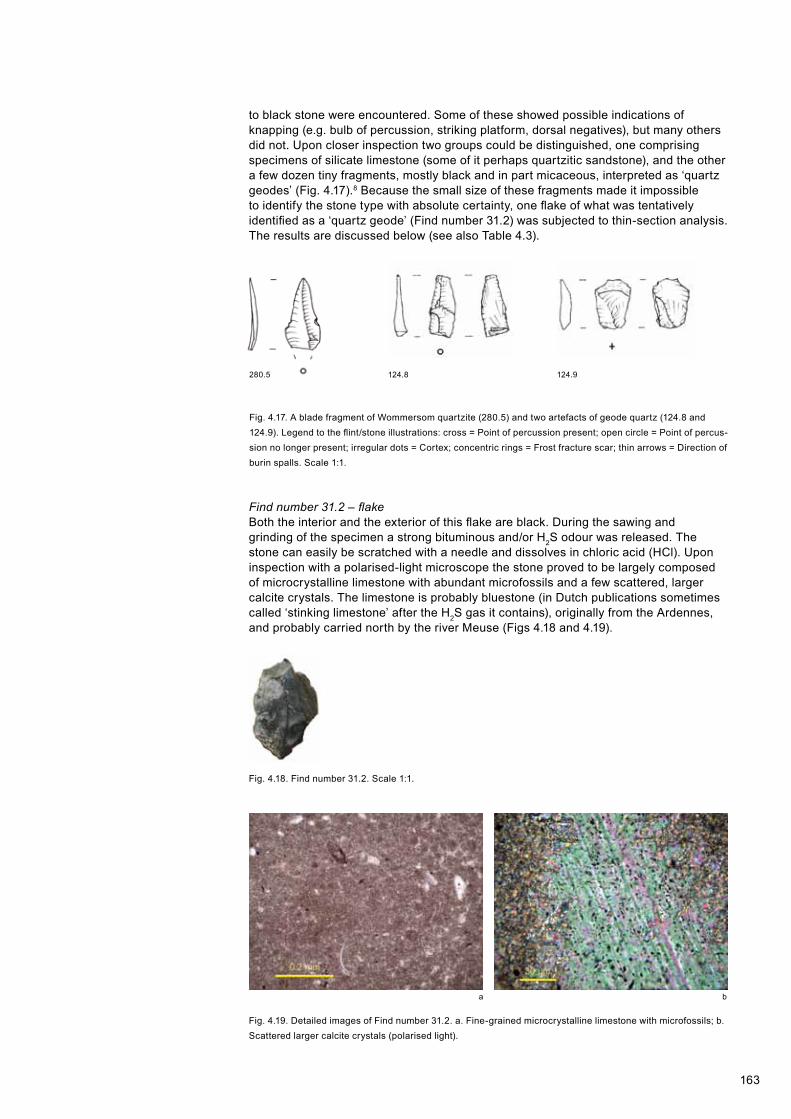
163
280.5 124.8 124.9
Fig. 4.17. A blade fragment of Wommersom quartzite (280.5) and two artefacts of geode quartz (124.8 and 124.9). Legend to the flint/stone illustrations: cross = Point of percussion present; open circle = Point of percus-sion no longer present; irregular dots = Cortex; concentric rings = Frost fracture scar; thin arrows = Direction of burin spalls. Scale 1:1.
a b
Fig. 4.18. Find number 31.2. Scale 1:1.
Fig. 4.19. Detailed images of Find number 31.2. a. Fine-grained microcrystalline limestone with microfossils; b. Scattered larger calcite crystals (polarised light).
to black stone were encountered. Some of these showed possible indications of knapping (e.g. bulb of percussion, striking platform, dorsal negatives), but many others did not. Upon closer inspection two groups could be distinguished, one comprising specimens of silicate limestone (some of it perhaps quartzitic sandstone), and the other a few dozen tiny fragments, mostly black and in part micaceous, interpreted as ‘quartz geodes’ (Fig. 4.17).8 Because the small size of these fragments made it impossible to identify the stone type with absolute certainty, one flake of what was tentatively identified as a ‘quartz geode’ (Find number 31.2) was subjected to thin-section analysis. The results are discussed below (see also Table 4.3).
Find number 31.2 – flakeBoth the interior and the exterior of this flake are black. During the sawing and grinding of the specimen a strong bituminous and/or H2S odour was released. The stone can easily be scratched with a needle and dissolves in chloric acid (HCl). Upon inspection with a polarised-light microscope the stone proved to be largely composed of microcrystalline limestone with abundant microfossils and a few scattered, larger calcite crystals. The limestone is probably bluestone (in Dutch publications sometimes called ‘stinking limestone’ after the H2S gas it contains), originally from the Ardennes, and probably carried north by the river Meuse (Figs 4.18 and 4.19).

164
ConclusionMost of the stone other than flint at Yangtze Harbour probably derived from gravelly fluviatile deposits associated with the rivers Meuse and/or Rhine. With regard to the (quartz) sandstone, however, the possibility cannot be excluded that at least some of it ultimately came from the north. It need not have been collected directly from glacial deposits, however; the material may also have eroded out of boulder clays such as those along the moraine of the Utrechtse Heuvelrug, and subsequently become embedded in fluviatile deposits. Distribution of northern erratics by drift ice is another possibility.9 Thin-section analysis revealed that at least some of the grey to black fragments are bluestone, but more analysis is needed to establish whether this also applies to the rest of the material. Some of the ‘silicate limestone’ may in fact also be bluestone. The source of bluestone is in Belgium north of the Ardennes.
4.4.3 Technology and typomorphological composition of the flint assemblage
Table 4.5 shows the typo-technological composition of the Yangtze Harbour lithic assemblage. The total assemblage consists of almost 3,000 pieces, collectively weighing 2056.2g. Of the flint 17.8% (N=530) was retrieved from 10mm-sieve residues while 2443 pieces (82.1%) were collected from 2mm-sieve residues. Three artefacts were retrieved by screening the soil core samples; these flints all came from (the top of) the dune.10 Approximately one fifth of the total assemblage showed traces of burning. There are 114 tools, 3.8% of the total assemblage. In the next few sections the lithic assemblages from Trenches 1 and 2 will be discussed separately. The finds from Trench 3 and from the soil core samples will not be discussed, due to their low numbers. Table 4.5 shows that all flint reduction stadia are represented in both assemblages; there are unprepared flint nodules11, cores at various stages of reduction, decortication and core preparation pieces, core rejuvenation pieces, flakes, blades, and retouched tools.
4.4.3.1 Trench 1
In total, 833 pieces of flint were retrieved from Trench 1, circa 47% (N=393) of them chips smaller than 10mm. The raw material was relatively small in size; the average length of the three unworked flint nodules was 38.7mm, the average weight a mere 22.5g. One small flint river-pebble (a so-called ‘Maasei’) weighing only 3.4g, may however be a recent intrusion. As was mentioned in Section 4.4.2.1, some of the raw material was possibly brought to the site in a semi-finished state or as nodules. This does not apply to all flint, for the assemblage includes some decortication (N=21) and core preparation pieces (N=11). Most of the core preparation pieces – blades and flakes – are unifacial, i.e. the dorsal side has been reduced on one side only. This is likely the result of the many frost fractures in the raw material, which therefore easily broke into angular fragments during the first stages of the reduction process. This made extensive preparation unnecessary as the fragments already had the straight dorsal side required to guide the removal of the first blade. The average length of the eight complete core preparation pieces is 27.5mm. An exception is one 55mm-long core preparation blade (Fig. 4.20).
The twelve complete cores – one of which, a blade core, had shattered along an internal frost fracture during the knapping process – fall roughly into three general categories: cores at an early stage of the reduction process or tested pieces (N=4, average weight 32.7g), blade cores (N=3, average weight 6.1g), and flake cores (N=2, average weight 11.0g). The three remaining cores can best be described as completely exhausted core remnants (average weight 10.3g). They show mainly flake scars, but at an earlier stage they may also have been used in blade production. Encountered core shapes are prismatic, polyhedral, rectangular or square, all in approximately equal numbers. Core reduction generally proceeded from one surface, occasionally two (i.e. semi-peripheral). Two cores had been worked from all sides. Cortex (partially) covered the sides of roughly half of the cores.
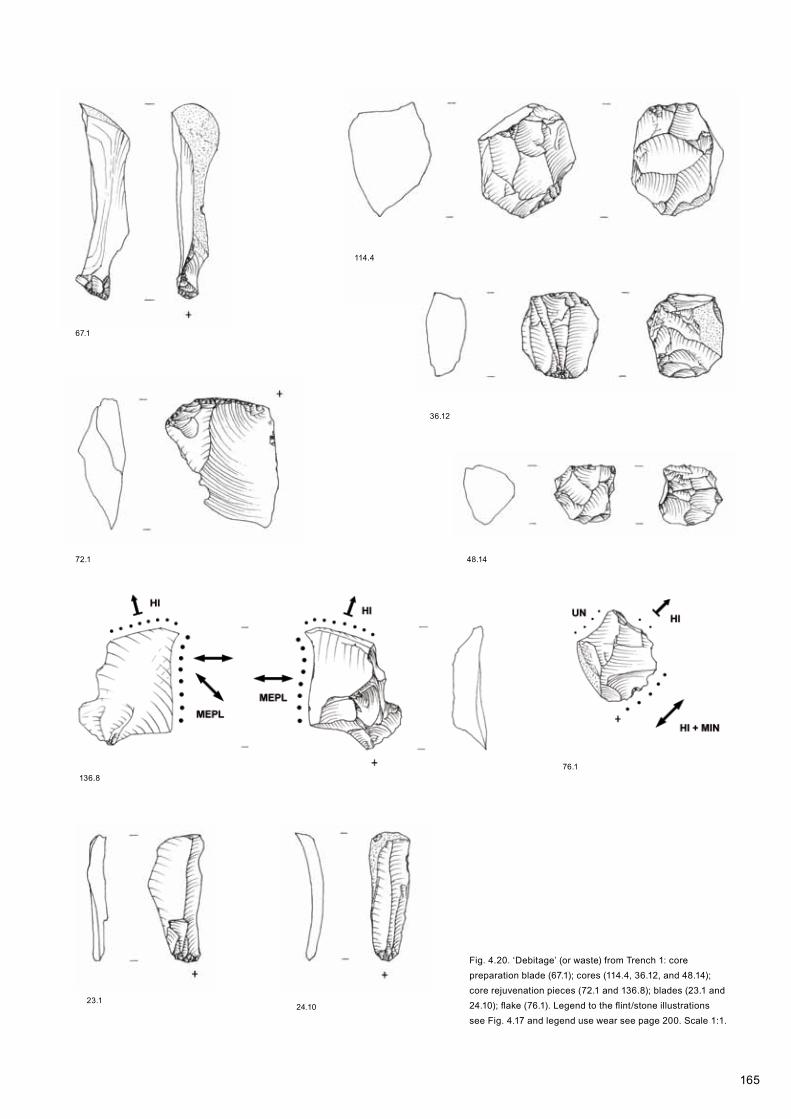
165
67.1
114.4
36.12
48.1472.1
136.8
23.124.10
76.1
Fig. 4.20. ‘Debitage’ (or waste) from Trench 1: core preparation blade (67.1); cores (114.4, 36.12, and 48.14); core rejuvenation pieces (72.1 and 136.8); blades (23.1 and 24.10); flake (76.1). Legend to the flint/stone illustrations see Fig. 4.17 and legend use wear see page 200. Scale 1:1.

166
Tren
ch 1
Tren
ch 2
Tren
ch 3
Soi
l cor
e sa
mpl
esTo
tal
N%
N B
urnt
N%
N B
urnt
N%
N B
urnt
N%
N B
urnt
N%
N B
urnt
Deb
itage
Chi
ps (0
-5m
m)
364.
35
292
13.7
47-
--
266
.7-
330
11.1
52 C
hips
(5-1
0mm
)35
742
.986
1069
50.1
231
228
.6-
133
.31
1429
48.0
318
Fla
kes
(10-
15m
m)
9611
.511
208
9.8
431
14.3
--
--
305
10.2
54 F
lake
s (>
15m
m)
154
18.5
1524
811
.648
--
--
--
402
13.5
63 B
lade
s42
5.0
510
24.
829
114
.3-
--
-14
54.
934
Dec
ortic
atio
n pi
eces
212.
55
120.
62
--
--
--
331.
17
Cor
e pr
epar
atio
n pi
eces
111.
31
221.
04
--
--
--
331.
15
Cor
e re
juve
natio
n pi
eces
242.
92
532.
510
--
--
--
772.
612
Cor
es13
1.6
19
0.4
1-
--
--
-22
0.7
2 B
lock
s/an
gula
r deb
ris17
2.0
28
0.4
1-
--
--
-25
0.8
3 U
nwor
ked
nodu
les
30.
4-
20.
1-
228
.6-
--
-7
0.2
- S
hatte
red
burn
t flin
t15
1.8
1511
0.5
11-
--
--
-26
0.9
26 P
otlid
s2
0.2
28
0.4
8-
--
--
-10
0.3
10 R
esha
rpen
ing
flake
s-
--
10.
0-
--
--
--
10.
0-
Mic
robu
rins
30.
41
70.
3-
--
--
--
100.
31
Ret
ouch
chi
ps-
--
10.
0-
--
--
--
10.
0-
Bur
in s
palls
(cer
tain
and
pos
sibl
e)-
--
60.
3-
--
--
--
60.
2-
Sub
tota
l79
495
.315
120
5996
.543
56
85.8
-3
100.
01
2862
95.9
587
Tool
s S
ubto
tal
394.
72
743.
59
114
.3-
--
-11
43.
811
Tot
al83
310
0.0
153
2133
100.
044
47
100.
11
310
0.0
129
7699
.759
8
(=18
.4%
)(=
20.8
%)
(=14
.2%
)(=
33.3
%)
(=20
.1%
)
N%
N B
urnt
N%
N B
urnt
N%
N B
urnt
N%
N B
urnt
N%
N B
urnt
Tool
s R
etou
ched
pie
ces
1230
.81
2635
.13
--
--
--
3833
.34
Poi
nts
1230
.8-
2229
.73
--
--
--
3429
.83
Scr
aper
s4
10.3
-11
14.9
2-
--
--
-15
13.2
2 B
urin
s (c
erta
in a
nd p
ossi
ble)
717
.9-
912
.2-
110
0.0
--
--
1714
.9-
Not
ched
pie
ces
--
-2
2.7
1-
--
--
-2
1.8
1 C
ombi
natio
n to
ols
25.
1-
11.
4-
--
--
--
32.
6-
Spl
inte
red
piec
es-
--
11.
4-
--
--
--
10.
9-
Bor
ers
12.
6-
11.
4-
--
--
--
21.
8
Too
l fra
gmen
ts, i
ndet
erm
inat
e1
2.6
11
1.4
--
--
--
-2
1.8
1 T
otal
3910
0.1
274
100.
29
110
0.0
--
--
114
100.
111
Tabl
e 4.
5. T
ypo-
tech
nolo
gica
l cla
ssifi
catio
n of
the
flint
ass
embl
ages
from
Tre
nche
s 1,
2, a
nd 3
and
the
soil
core
sam
ples
. The
freq
uenc
ies
incl
ude
frag
men
ts. F
ragm
ents
of a
rtef
acts
whi
ch c
ould
not
be
furt
her
clas
sifie
d ar
e gr
oupe
d un
der t
he c
ateg
ory
‘ang
ular
deb
ris’.
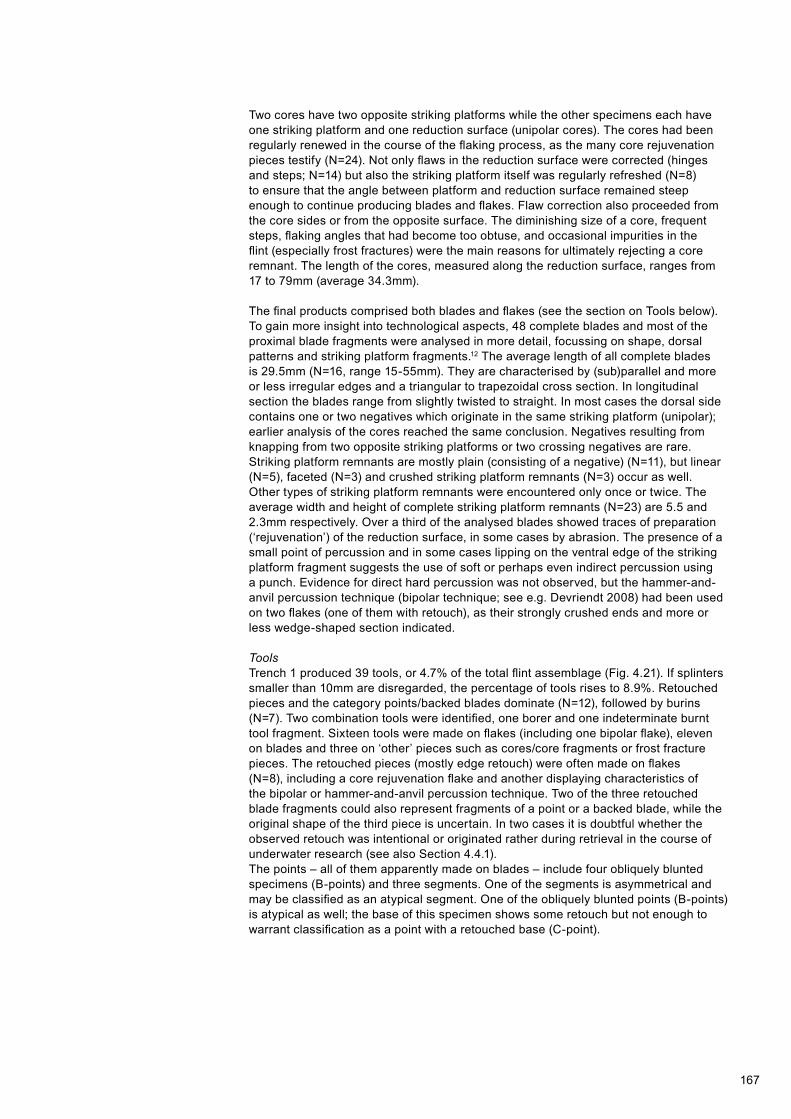
167
Two cores have two opposite striking platforms while the other specimens each have one striking platform and one reduction surface (unipolar cores). The cores had been regularly renewed in the course of the flaking process, as the many core rejuvenation pieces testify (N=24). Not only flaws in the reduction surface were corrected (hinges and steps; N=14) but also the striking platform itself was regularly refreshed (N=8) to ensure that the angle between platform and reduction surface remained steep enough to continue producing blades and flakes. Flaw correction also proceeded from the core sides or from the opposite surface. The diminishing size of a core, frequent steps, flaking angles that had become too obtuse, and occasional impurities in the flint (especially frost fractures) were the main reasons for ultimately rejecting a core remnant. The length of the cores, measured along the reduction surface, ranges from 17 to 79mm (average 34.3mm).
The final products comprised both blades and flakes (see the section on Tools below). To gain more insight into technological aspects, 48 complete blades and most of the proximal blade fragments were analysed in more detail, focussing on shape, dorsal patterns and striking platform fragments.12 The average length of all complete blades is 29.5mm (N=16, range 15-55mm). They are characterised by (sub)parallel and more or less irregular edges and a triangular to trapezoidal cross section. In longitudinal section the blades range from slightly twisted to straight. In most cases the dorsal side contains one or two negatives which originate in the same striking platform (unipolar); earlier analysis of the cores reached the same conclusion. Negatives resulting from knapping from two opposite striking platforms or two crossing negatives are rare. Striking platform remnants are mostly plain (consisting of a negative) (N=11), but linear (N=5), faceted (N=3) and crushed striking platform remnants (N=3) occur as well. Other types of striking platform remnants were encountered only once or twice. The average width and height of complete striking platform remnants (N=23) are 5.5 and 2.3mm respectively. Over a third of the analysed blades showed traces of preparation (‘rejuvenation’) of the reduction surface, in some cases by abrasion. The presence of a small point of percussion and in some cases lipping on the ventral edge of the striking platform fragment suggests the use of soft or perhaps even indirect percussion using a punch. Evidence for direct hard percussion was not observed, but the hammer-and-anvil percussion technique (bipolar technique; see e.g. Devriendt 2008) had been used on two flakes (one of them with retouch), as their strongly crushed ends and more or less wedge-shaped section indicated.
ToolsTrench 1 produced 39 tools, or 4.7% of the total flint assemblage (Fig. 4.21). If splinters smaller than 10mm are disregarded, the percentage of tools rises to 8.9%. Retouched pieces and the category points/backed blades dominate (N=12), followed by burins (N=7). Two combination tools were identified, one borer and one indeterminate burnt tool fragment. Sixteen tools were made on flakes (including one bipolar flake), eleven on blades and three on ‘other’ pieces such as cores/core fragments or frost fracture pieces. The retouched pieces (mostly edge retouch) were often made on flakes (N=8), including a core rejuvenation flake and another displaying characteristics of the bipolar or hammer-and-anvil percussion technique. Two of the three retouched blade fragments could also represent fragments of a point or a backed blade, while the original shape of the third piece is uncertain. In two cases it is doubtful whether the observed retouch was intentional or originated rather during retrieval in the course of underwater research (see also Section 4.4.1).The points – all of them apparently made on blades – include four obliquely blunted specimens (B-points) and three segments. One of the segments is asymmetrical and may be classified as an atypical segment. One of the obliquely blunted points (B-points) is atypical as well; the base of this specimen shows some retouch but not enough to warrant classification as a point with a retouched base (C-point).

168
13.3
98.1
3.1
65.154.1
23.1
123.7
46.215.1
151.1
18.7
133.1124.9
118.1
Fig. 4.21. Tools from Trench 1: retouched pieces (13.3 and 98.1); obliquely blunted points or B-points (3.1, 65.1, and 54.1), segment (23.1); hybrid seg-ment/triangle (123.7); scalene triangle (15.1); microburin (46.2); various burin types (151.1, 18.7, 133.1, and 124.9), and an artefact resembling a burin (118.1). Legend to the flint/stone illustrations see Fig. 4.17 and legend use wear see page 200. Scale 1:1.
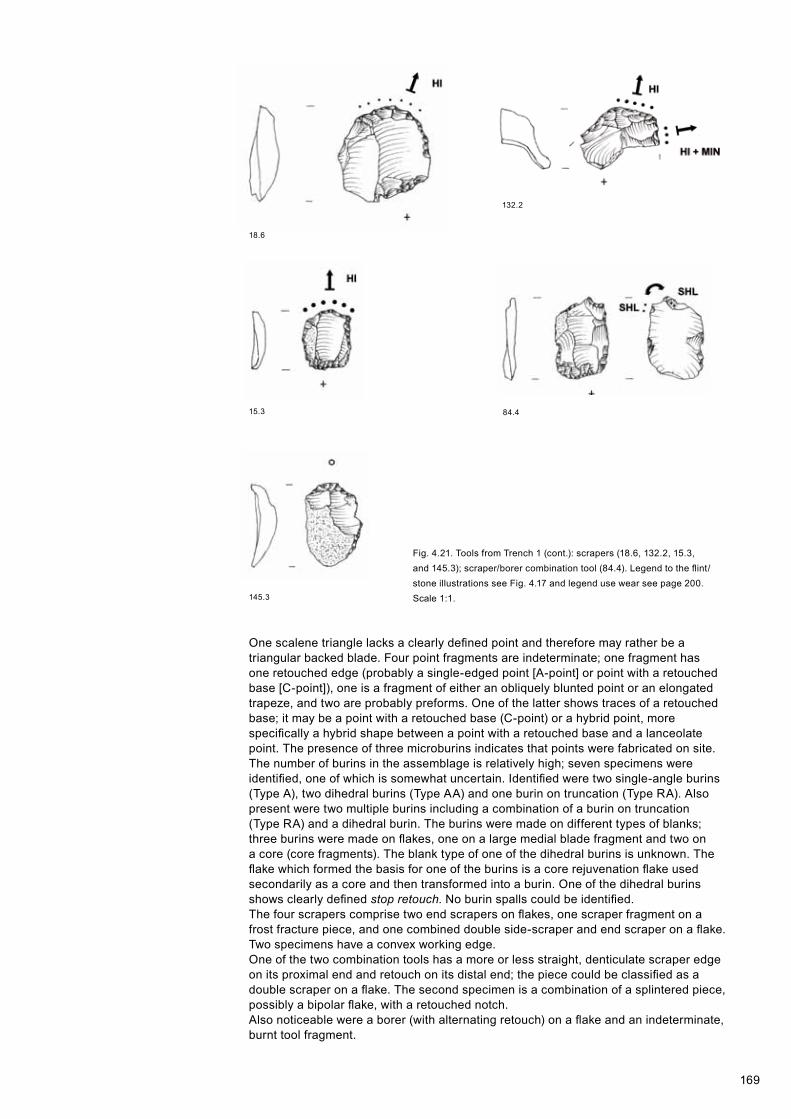
169
Fig. 4.21. Tools from Trench 1 (cont.): scrapers (18.6, 132.2, 15.3, and 145.3); scraper/borer combination tool (84.4). Legend to the flint/stone illustrations see Fig. 4.17 and legend use wear see page 200.Scale 1:1.
18.6
132.2
15.3
145.3
84.4
One scalene triangle lacks a clearly defined point and therefore may rather be a triangular backed blade. Four point fragments are indeterminate; one fragment has one retouched edge (probably a single-edged point [A-point] or point with a retouched base [C-point]), one is a fragment of either an obliquely blunted point or an elongated trapeze, and two are probably preforms. One of the latter shows traces of a retouched base; it may be a point with a retouched base (C-point) or a hybrid point, more specifically a hybrid shape between a point with a retouched base and a lanceolate point. The presence of three microburins indicates that points were fabricated on site.The number of burins in the assemblage is relatively high; seven specimens were identified, one of which is somewhat uncertain. Identified were two single-angle burins (Type A), two dihedral burins (Type AA) and one burin on truncation (Type RA). Also present were two multiple burins including a combination of a burin on truncation (Type RA) and a dihedral burin. The burins were made on different types of blanks; three burins were made on flakes, one on a large medial blade fragment and two on a core (core fragments). The blank type of one of the dihedral burins is unknown. The flake which formed the basis for one of the burins is a core rejuvenation flake used secondarily as a core and then transformed into a burin. One of the dihedral burins shows clearly defined stop retouch. No burin spalls could be identified.The four scrapers comprise two end scrapers on flakes, one scraper fragment on a frost fracture piece, and one combined double side-scraper and end scraper on a flake. Two specimens have a convex working edge.One of the two combination tools has a more or less straight, denticulate scraper edge on its proximal end and retouch on its distal end; the piece could be classified as a double scraper on a flake. The second specimen is a combination of a splintered piece, possibly a bipolar flake, with a retouched notch.Also noticeable were a borer (with alternating retouch) on a flake and an indeterminate, burnt tool fragment.

170
337.2
174.2
276.5
242.6
298.3
195.1
194.6
243.4
205.4
191.2
Fig. 4.22. ‘Debitage’ from Trench 2: core preparation blades (337.2 and 174.2); cores (194.6, 276.5, 242.6, and 298.3); core rejuvenation pieces (195.1, 243.4, 205.4, and 191.2). Legend to the flint/stone illustrations see Fig. 4.17 and legend use wear see page 200. Scale 1:1.

171
295.1
266.1
307.6
207.1
268.1
316.1
301.1
275.1
257.4
232.1
Fig. 4.22. ‘Debitage’ from Trench 2 (cont.): flakes (295.1, 268.1, 275.1, 266.1, 257.4, and 307.6); blades (207.1, 232.1, 316.1, and 301.1). Legend to the flint/stone illustrations see Fig. 4.17 and legend use wear see page 200. Scale 1:1.
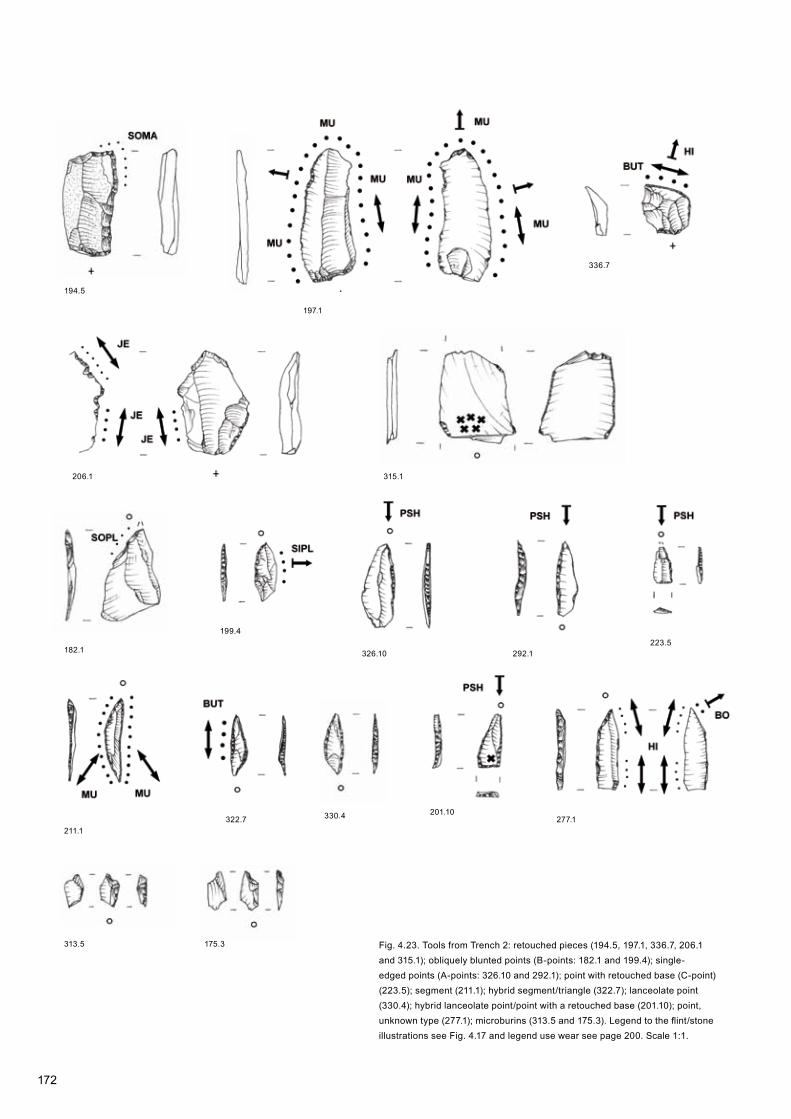
172
194.5
197.1
336.7
206.1 315.1
182.1
199.4
326.10 292.1223.5
211.1322.7 330.4 201.10
277.1
313.5 175.3 Fig. 4.23. Tools from Trench 2: retouched pieces (194.5, 197.1, 336.7, 206.1 and 315.1); obliquely blunted points (B-points: 182.1 and 199.4); single-edged points (A-points: 326.10 and 292.1); point with retouched base (C-point) (223.5); segment (211.1); hybrid segment/triangle (322.7); lanceolate point (330.4); hybrid lanceolate point/point with a retouched base (201.10); point, unknown type (277.1); microburins (313.5 and 175.3). Legend to the flint/stone illustrations see Fig. 4.17 and legend use wear see page 200. Scale 1:1.
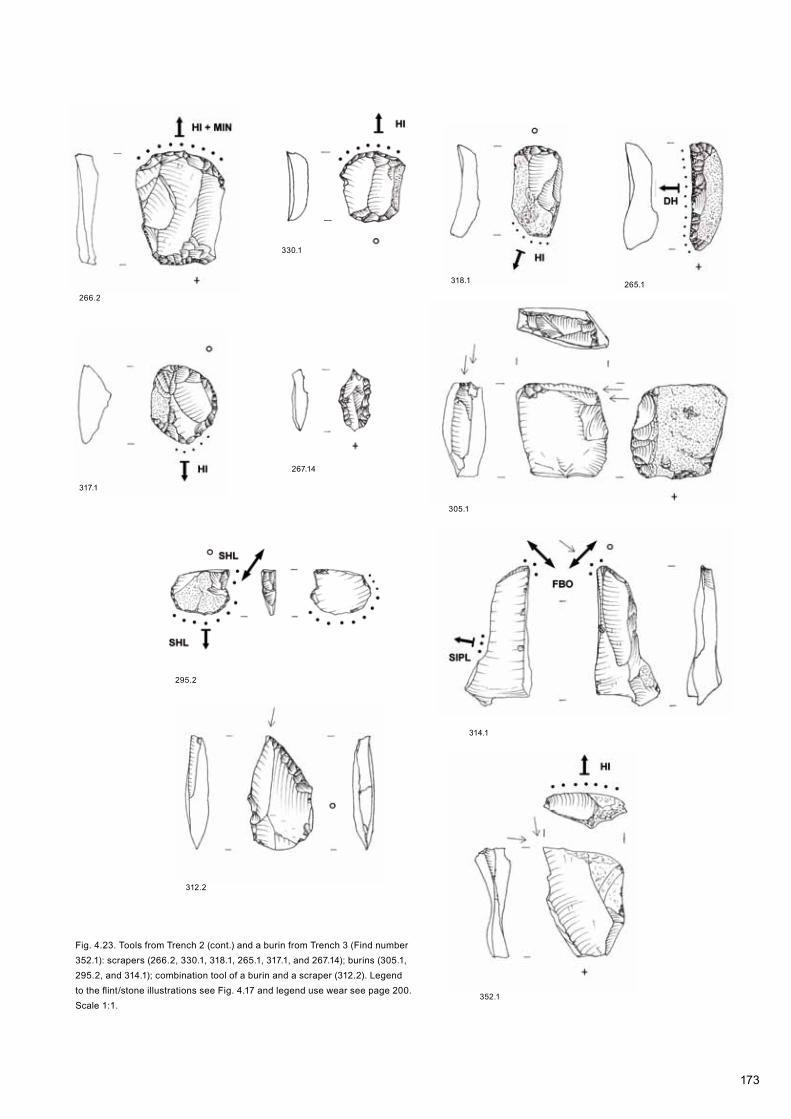
173
266.2
330.1
318.1 265.1
317.1
267.14
305.1
312.2
314.1
295.2
352.1
Fig. 4.23. Tools from Trench 2 (cont.) and a burin from Trench 3 (Find number 352.1): scrapers (266.2, 330.1, 318.1, 265.1, 317.1, and 267.14); burins (305.1, 295.2, and 314.1); combination tool of a burin and a scraper (312.2). Legend to the flint/stone illustrations see Fig. 4.17 and legend use wear see page 200. Scale 1:1.

174
4.4.3.2 Trench 2
Trench 2 produced 2133 pieces of flint, over 60% of them chips <10mm. Circa 20% of the flints showed traces of burning. Two small unworked flint nodules – one of them a flint river pebble, a so-called ‘Maasei’ – weigh only 2.1g and 4.6g, and are probably recent intrusions. Decortication and core preparation pieces are represented by respectively 12 (mostly flakes) and 22 pieces (blades and flakes). The average length of complete specimens is 25mm (N=8), resp. 25.2mm (N=13). As in Trench 1, most of the core preparation pieces have a unifacially worked dorsal side. On a third of them at least some surfaces follow internal frost fractures in the original nodule (Fig. 4.22).Of the nine cores (four blade, four flake, one exhausted) one is at the early stages of reduction. The four complete flake cores are slightly smaller on average than the three complete blade cores (flake cores 14.6g, blade cores 20.5g). This suggests that used blade cores may have been re-used to produce flakes. Three of the seven cores that were chosen for further study are prismatic. Approximately half of the cores have been reduced either on all sides or from the front and the back starting from one of the sides. In only one case do the sides still possess a cortex. Two cores have two opposite striking platforms, although a working face and a correction face cannot always clearly be distinguished. There are 53 core rejuvenation pieces (38 flakes, 11 blades and 4 indeterminate), which is a relatively high number. Still, rejuvenation of the striking platform (N=20) or the striking platform edge (N=16) was a frequently used technique to maintain a suitable angle with the flaking/reduction surface. Correction of the reduction surface was also often carried out (N=9), especially to remove steps and hinges, until for example the small size of the remaining core, or angles that had become too obtuse made it impossible to continue. The average length of the complete rejuvenation pieces (N=42) is 21.0mm.
ToolsTools form 3.5% of the total assemblage from Trench 2 (N=74), or 9.6% if chips <10mm are disregarded (Fig. 4.23). Retouched pieces (N=26) and points/backed blades (N=22) dominate, followed by scrapers (N=11) and burins (N=9). Other tool types are represented by only one or two specimens. More than half of the tools (N=42) are on flakes, 22 on blades, two on what are probably core fragments or exhausted cores, while the blank type of the remaining eight pieces is unknown.With the exception of one retouched chip (5-10mm), the retouched pieces are mainly flakes (N=18) including two core rejuvenation flakes, and blades (N=7). In certain cases the retouch may be a result of the retrieval and screening methods used during the underwater research. Most of the retouch that was encountered can be classified as simple edge retouch, but steeper forms occur as well. Usually retouch is on the dorsal side but two flakes carry ventral retouch, one of them on both edges. One long side of a virtually complete blade has retouch along its entire length in combination with a retouched oblique, distal end.The point assemblage is diverse; it includes four single-edged points (A-points), six obliquely blunted points (B-points), two segments, one point with a retouched base (C-point) and one lanceolate point (a type characterised by two retouched edges and a unretouched base). There are also two hybrid points, one a triangle/segment hybrid shape and the other combining two retouched edges with a retouched base (hybrid C-point/lanceolate point). A point with a kink in the backed edge is of an indeterminate type. The broken points (N=5) include two probable fragments of a single-edged point or a point with a retouched base, one possible fragment of a hybrid point (transitional point with retouched base to lanceolate point), one fragment of a point or a backed blade, and one indeterminate fragment. A retouch flake and seven microburins, some of them of substantial size, indicate that points were being produced on site. In addition to one scraper resharpening flake, eleven actual scrapers were identified: seven end scrapers, two double scrapers, one side scraper, and one round scraper. One of the double scrapers is a double side-scraper. All scrapers are on flakes, in one case specifically a core preparation flake.
The nine burins can be subdivided into six single-angle burins (Type A; one of them double), one burin on truncation (Type RA), one dihedral burin (Type AA) and one combination of a Type RA and a Type A burin. Seven burins are on flakes, one on a blade fragment, and one on a re-used core. Six burin spalls were also identified. More

175
than half of the burins were on a relatively large flake or blade.Both notched pieces are on flakes; the classification of one specimen as a notched piece is uncertain. The only combination tool is a scraper on a flake which also has a single-angle burin on the fracture. Also retrieved were a splintered piece of unknown blank type, a borer on a core remnant (possibly a combination tool of a borer and a splintered piece) and one indeterminate tool fragment.
4.4.4 Stone assemblages
Table 6 presents a classification of the stone assemblages from Trenches 1 and 2. The nine stones from Trench 3 have been excluded; these consist of seven pieces of natural gravel, one probably recent stone, and a piece of metal slag (as the air bubbles indicate) weighing 730g.
Trench 1A total of 77 chips <10mm were recovered of which 17 were bluestone and 16 quartzite, while the material of two chips resembled limestone. The rest, the majority, were classified as ‘silicate limestone’ (N=42).Of the flakes, four are bluestone and two quartz sandstone. Both blade fragments (a proximal-medial fragment and a medial fragment) are bluestone. Of the eight angular fragments (average weight 15.8g, range 3g to 92.8g) six are micaceous sandstone, one is quartz sandstone and one is vein quartz. Several of the micaceous sandstone fragments probably derive from the same stone; one of the fragments is burnt and may derive from a ‘cooking stone’ (Beuker and Casparie 1989). Six fragments of quartz sandstone and one of micaceous sandstone show traces of polish. Three of these fit together, while two more fragments probably also derive from the same stone (the total weight of these five fragments is 122.2g). Use-wear analysis was performed on all pieces which carried traces of polish. Unfortunately the five fragments which probably came from the same stone were burnt and showed surface weathering, making it impossible to interpret the traces. Find number 47, a quartz sandstone fragment with traces of polish, clearly showed a completely smooth working surface, but at high magnification revealed no use- wear, making it impossible to identify the contact material. Finally, Find number 133.2, a micaceous sandstone fragment with polish, revealed use wear that resulted from wood polishing.

176
Trench 1 Trench 2 TotalN % Weight
in gN % Weight
in gN % Weight
in gDebitage Chips (0-5mm) 19 19.2 1.1 42 25.8 1.9 61 23.3 3.0 Chips (5-10mm) 58 58.6 9.1 99 60.7 10.9 157 59.9 20.0 Flakes (>10mm) 6 6.1 21.5 3 1.8 4.0 9 3.4 25.5 Blades 2 2.0 0.5 1 0.6 0.4 3 1.1 0.9 Blocks 8 8.1 124.6 17 10.4 68.4 25 9.5 193.0 Subtotal 93 94.0 156.8 162 99.3 85.6 255 97.2 242.4
Tools Subtotal 6 6.1 127.4 1 0.6 131.3 7 2.7 258.7 Total 99 100.1 284.2 163 99.9 216.9 262 99.9 501.1
N % Weightin g
N % Weightin g
N % Weightin g
Tools Fragments with traces of polish 6 100.0 127.4 1 100.0 131.3 7 100.0 258.7 Total 6 100.0 127.4 1 100.0 131.3 7 100 258.7
Table 4.6. Typo-technological classification of the stone assemblages from Trenches 1 and 2. The frequencies include fragments.
Trench 2The raw material of most of the 141 chips <10mm from this trench was quartz geode (N=80), while the remaining 61 pieces were silicate limestone. The identification of two pieces (both on micaceous sandstone) as ‘flake’ is uncertain. The surface of the third, definite flake (Find number 336.8) contains mica fragments which means that it is probably Wommersom quartzite, but due to the heavily burnt state of the piece this interpretation is somewhat doubtful. The raw material of the only blade, a medial-distal fragment, is definitely Wommersom quartzite (Find number 280.5).There are 17 fragments (average weight 4g, range 0.6-18.2g) of three different raw materials: vein quartz (N=11), quartz sandstone (N=3) and micaceous sandstone (N=3). Two artefacts show traces of polish, one quartz sandstone fragment (131.3g, Find number 277.1) and one micaceous sandstone fragment (17g, Find number 277.2). The quartz sandstone piece was burnt and weathered, making use-wear analysis impossible. The second, micaceous sandstone piece showed traces which suggested that a vegetable material had been pounded with it.
4.4.5 Use-wear analysis: flint
This section discusses material from Trenches 1 and 2 together; in the tables, however, the material is listed separately for each trench. Of the 170 analysed pieces of flint, 99 (58%) show use wear on 129 zones in total (Tables 5.7 and 5.9). In other words, some artefacts have multiple used edges, with a maximum of three on one and the same piece (Table 5.8). The other pieces either showed no use wear (N=58), or were not interpretable (N=13). An absence of traces of wear does not automatically imply that those artefacts were never used; if flint artefacts are used for only a short period use wear may not always form (van den Dries and van Gijn 1997). It is also possible that post-depositional surface changes and retrieval-related damage may have covered any use wear originally present. Use wear was identified on 50% (N=42) of the studied unretouched pieces and on 66% of the retouched ones (N=57).The material reflected a wide range of activities related to food gathering and processing, but also to various craft activities, even shell and jet working. The possible implication of the latter is that ornaments or other objects of shell and jet were produced on site.
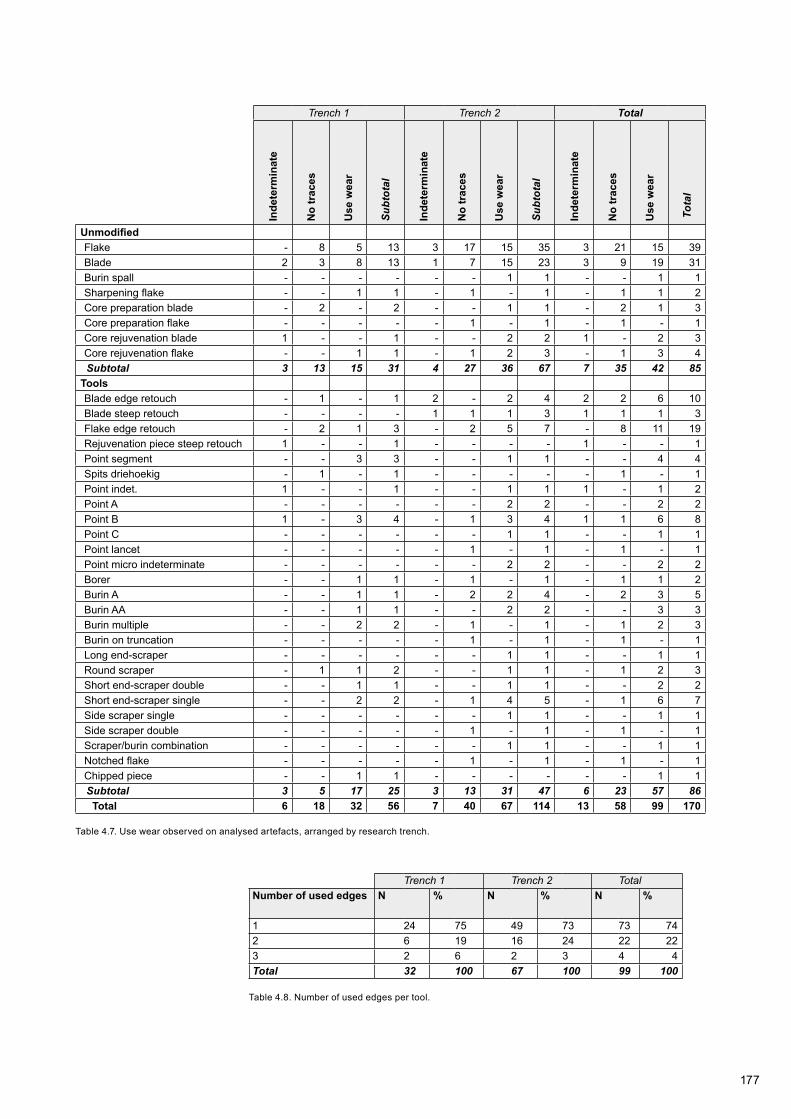
177
Table 4.8. Number of used edges per tool.
Trench 1 Trench 2 Total
Inde
term
inat
e
No
trac
es
Use
wea
r
Sub
tota
l
Inde
term
inat
e
No
trac
es
Use
wea
r
Sub
tota
l
Inde
term
inat
e
No
trac
es
Use
wea
r
Tot
al
Unmodified Flake - 8 5 13 3 17 15 35 3 21 15 39 Blade 2 3 8 13 1 7 15 23 3 9 19 31 Burin spall - - - - - - 1 1 - - 1 1 Sharpening flake - - 1 1 - 1 - 1 - 1 1 2 Core preparation blade - 2 - 2 - - 1 1 - 2 1 3 Core preparation flake - - - - - 1 - 1 - 1 - 1 Core rejuvenation blade 1 - - 1 - - 2 2 1 - 2 3 Core rejuvenation flake - - 1 1 - 1 2 3 - 1 3 4 Subtotal 3 13 15 31 4 27 36 67 7 35 42 85Tools Blade edge retouch - 1 - 1 2 - 2 4 2 2 6 10 Blade steep retouch - - - - 1 1 1 3 1 1 1 3 Flake edge retouch - 2 1 3 - 2 5 7 - 8 11 19 Rejuvenation piece steep retouch 1 - - 1 - - - - 1 - - 1 Point segment - - 3 3 - - 1 1 - - 4 4 Spits driehoekig - 1 - 1 - - - - - 1 - 1 Point indet. 1 - - 1 - - 1 1 1 - 1 2 Point A - - - - - - 2 2 - - 2 2 Point B 1 - 3 4 - 1 3 4 1 1 6 8 Point C - - - - - - 1 1 - - 1 1 Point lancet - - - - - 1 - 1 - 1 - 1 Point micro indeterminate - - - - - - 2 2 - - 2 2 Borer - - 1 1 - 1 - 1 - 1 1 2 Burin A - - 1 1 - 2 2 4 - 2 3 5 Burin AA - - 1 1 - - 2 2 - - 3 3 Burin multiple - - 2 2 - 1 - 1 - 1 2 3 Burin on truncation - - - - - 1 - 1 - 1 - 1 Long end-scraper - - - - - - 1 1 - - 1 1 Round scraper - 1 1 2 - - 1 1 - 1 2 3 Short end-scraper double - - 1 1 - - 1 1 - - 2 2 Short end-scraper single - - 2 2 - 1 4 5 - 1 6 7 Side scraper single - - - - - - 1 1 - - 1 1 Side scraper double - - - - - 1 - 1 - 1 - 1 Scraper/burin combination - - - - - - 1 1 - - 1 1 Notched flake - - - - - 1 - 1 - 1 - 1 Chipped piece - - 1 1 - - - - - - 1 1 Subtotal 3 5 17 25 3 13 31 47 6 23 57 86 Total 6 18 32 56 7 40 67 114 13 58 99 170
Table 4.7. Use wear observed on analysed artefacts, arranged by research trench.
Trench 1 Trench 2 Total Number of used edges N % N % N %
1 24 75 49 73 73 74 2 6 19 16 24 22 22 3 2 6 2 3 4 4 Total 32 100 67 100 99 100

178
Lo
ngitu
dina
l
C
uttin
g
S
havi
ng/P
lani
ng
Lo
ngitu
dina
l ind
et.
Tr
ansv
erse
S
crap
ing
S
havi
ng/P
lani
ng
Tr
ansv
erse
inde
t.
D
iago
nal
E
ngra
ving
D
iago
nal i
ndet
.
O
ther
R
eam
ing
S
hoot
ing
(pos
sibl
y)
Tr
ansv
erse
/long
itudi
nal
U
ncer
tain
B
lack
resi
due
To
tal
Vegetable Plant, siliceous - 1 - - - - - - - - - - - 1 Bark 1 - - 1 - 1 - - - - - - - 3 Wood, soft - - - 1 - - - - - - - - - 1 Plant, medium-hard - - - - 1 - - - - - - - - 1 Plant 1 - - - - - - 1 - - 1 1 - 4Animal Hide - - - 6 - - - - - - 1 - - 7 Hide, dry - - - 1 - - - - - - - - - 1 Hide with mineral addition - - 1 3 - - - - - - - - - 4 Bone - - - - - - 1 - - - - - - 1 Fish 2 - - - - 1 - - - - - - - 3 Animal, soft - - - 2 - - - - - - - - - 2 Animal, medium-hard - - 1 - - - - - - - - - - 1Inorganic Shell - - - - - - - - 1 - - - - 1 Inorganic, medium-hard - - - - - 1 - - - - - - - 1Unknown Soft material - - - - - 2 - - - - - - - 2 Medium-hard material - - 1 - - 1 - - - - - - - 2 Uncertain - - - - - - - - - 2 - 3 - 5 Black residue - - - - - - - - - - - - 2 2 Total 4 1 3 14 1 6 1 1 1 2 2 4 2 42
Table 4.9.a. Trench 1. Contact material versus performed motion of all artefacts showing traces of use wear.
4.4.5.1 Gathering and processing of vegetable material
Use wear related to the gathering, processing and preparation of vegetable material is usually observed in flint assemblages, but it is rarely possible to identify the plants involved down to the level of family or species on the basis of microwear alone. Often only a general distinction is possible between non-siliceous plant material, siliceous plant material, bark and wood. This makes it difficult to distinguish between food gathering and processing and other activities. Exceptions are some traces left by non-siliceous plant material, such as wood and bark; these are always associated with craft activities.
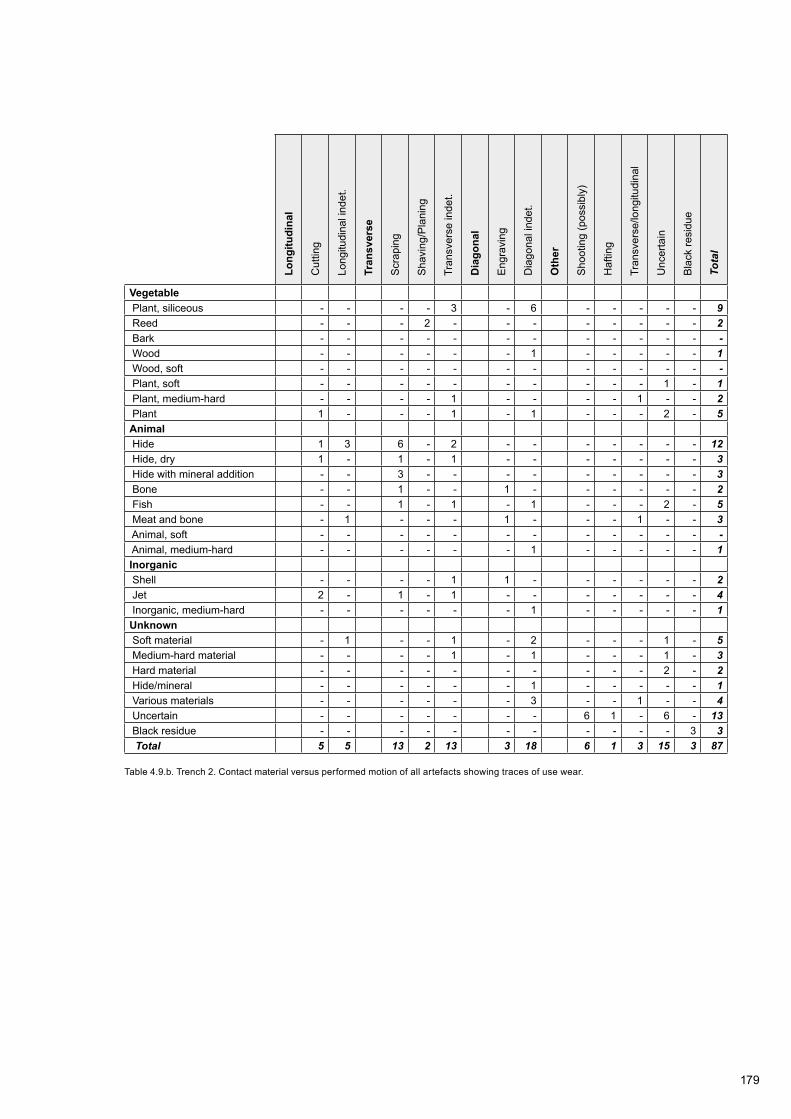
179
Lo
ngitu
dina
l
C
uttin
g
Lo
ngitu
dina
l ind
et.
Tr
ansv
erse
S
crap
ing
S
havi
ng/P
lani
ng
Tr
ansv
erse
inde
t.
D
iago
nal
E
ngra
ving
D
iago
nal i
ndet
.
O
ther
S
hoot
ing
(pos
sibl
y)
H
aftin
g
Tr
ansv
erse
/long
itudi
nal
U
ncer
tain
B
lack
resi
due
To
tal
Vegetable Plant, siliceous - - - - 3 - 6 - - - - - 9 Reed - - - 2 - - - - - - - - 2 Bark - - - - - - - - - - - - - Wood - - - - - - 1 - - - - - 1 Wood, soft - - - - - - - - - - - - - Plant, soft - - - - - - - - - - 1 - 1 Plant, medium-hard - - - - 1 - - - - 1 - - 2 Plant 1 - - - 1 - 1 - - - 2 - 5Animal Hide 1 3 6 - 2 - - - - - - - 12 Hide, dry 1 - 1 - 1 - - - - - - - 3 Hide with mineral addition - - 3 - - - - - - - - - 3 Bone - - 1 - - 1 - - - - - - 2 Fish - - 1 - 1 - 1 - - - 2 - 5 Meat and bone - 1 - - - 1 - - - 1 - - 3 Animal, soft - - - - - - - - - - - - - Animal, medium-hard - - - - - - 1 - - - - - 1Inorganic Shell - - - - 1 1 - - - - - - 2 Jet 2 - 1 - 1 - - - - - - - 4 Inorganic, medium-hard - - - - - - 1 - - - - - 1Unknown Soft material - 1 - - 1 - 2 - - - 1 - 5 Medium-hard material - - - - 1 - 1 - - - 1 - 3 Hard material - - - - - - - - - - 2 - 2 Hide/mineral - - - - - - 1 - - - - - 1 Various materials - - - - - - 3 - - 1 - - 4 Uncertain - - - - - - - 6 1 - 6 - 13 Black residue - - - - - - - - - - - 3 3 Total 5 5 13 2 13 3 18 6 1 3 15 3 87
Table 4.9.b. Trench 2. Contact material versus performed motion of all artefacts showing traces of use wear.

180
Vegetable
Plant, siliceous
Bark
Soft wood
Plant, medium-hard
Plant
Animal
Hide
Hide, dry
Hide with mineral addition
Bone
Fish
Animal, soft
Animal, medium-hard
Inorganic
Shell
Inorganic, medium-hard
Unknown
Material, soft
Middelhard mat.
Unsure
Black residue
Total
Unm
odifi
ed F
lake
1-
1-
--
--
-1
--
--
--
--
3 B
lade
--
--
4-
--
-2
1-
--
-2
--
9 R
esha
rpen
ing
flake
--
--
--
--
--
-1
--
--
--
1 C
ore
reju
vena
tion
flake
--
-1
-1
--
--
--
--
--
--
2M
odifi
ed F
lake
with
edg
e re
touc
h-
--
--
2-
1-
-1
--
--
-1
-5
Seg
men
t-
1-
--
1-
--
--
--
-1
--
-3
Obl
ique
ly b
lunt
ed p
oint
(B-p
oint
)-
--
--
--
--
--
--
-1
-2
14
Bor
er-
--
--
--
--
--
-1
--
--
-1
Bur
in s
ingl
e-an
gle
(Typ
e A
)-
2-
--
--
--
--
--
--
--
-2
Bur
in d
ihed
ral (
Type
AA
)-
--
--
1-
--
--
--
--
--
-1
Bur
in m
ultip
le-
--
--
--
11
--
--
1-
--
-3
Rou
nd s
crap
er-
--
--
--
1-
--
--
--
--
-1
Sho
rt en
d-sc
rape
r, do
uble
--
--
--
1-
--
--
--
--
--
1 S
hort
end-
scra
per,
sing
le-
--
--
2-
1-
--
--
--
--
-3
Spl
inte
red
piec
e-
--
--
--
--
--
--
--
-2
13
Tot
al1
31
14
71
41
32
11
12
25
242
Tabl
e 4.
10a.
Tre
nch
1. A
rtef
act t
ype
vers
us c
onta
ct m
ater
ial o
f all
arte
fact
s sh
owin
g tr
aces
of u
se w
ear.

181
Tabl
e 4.
10b.
Tre
nch
2. A
rtef
act t
ype
vers
us c
onta
ct m
ater
ial o
f all
arte
fact
s sh
owin
g tr
aces
of u
se w
ear.
Vegetable
Plant, siliceous
Reed
Wood
Plant, soft
Plant, medium-hard
Plant
Animal
Hide
Hide, dry
Hide with mineral addition
Bone
Fish
Meat and bone
Animal, medium-hard
Inorganic
Shell
Jet
Inorganic, medium-hard
Unknown
Material, soft
Material, medium-hard
Material, hard
Hide/mineral
Various materials
Unsure
Black residue
Total
Unm
odifi
ed
Flak
e
1
-
1
-
2
3
-
-
1
-
3
-
1
-
-
-
2
-
-
-
-
1
-
15
B
lade
3
-
-
-
-
2
-
1
-
-
-
-
-
-
-
-
1
3
-
1
1
1
-
13
B
urin
spa
ll
-
-
-
-
-
-
1
-
-
-
-
-
-
-
-
-
-
-
-
-
-
-
-
1
Cor
e pr
epar
atio
n bl
ade
-
-
-
-
-
-
-
-
-
-
-
-
-
-
-
1
-
-
-
-
-
-
-
1
C
ore
reju
vena
tion
blad
e
1
-
-
-
-
-
-
-
-
-
-
-
-
-
-
-
-
-
-
-
-
2
-
3
Cor
e re
juve
natio
n fla
ke
-
2
-
-
-
-
-
-
-
-
-
-
-
-
-
-
-
-
-
-
-
1
-
3 M
odifi
ed
Bla
de w
ith e
dge
reto
uch
1
-
-
-
-
-
1
-
-
-
1
1
-
-
-
-
1
-
2
-
1
-
-
8
B
lade
with
ste
ep re
touc
h
-
-
-
-
-
-
-
-
-
-
-
-
-
-
-
-
1
-
-
-
-
-
-
1
Flak
e w
ith e
dge
reto
uch
1
-
-
-
-
-
3
1
-
-
-
1
-
-
3
-
-
-
-
-
-
1
2
12
S
egm
ent
-
-
-
-
-
-
-
-
-
-
-
-
-
-
-
-
-
-
-
-
2
-
-
2
P
oint
inde
term
inat
e
-
-
-
-
-
-
2
-
-
1
-
-
-
-
-
-
-
-
-
-
-
-
-
3
Sin
gle-
edge
d po
int (
A-p
oint
)
-
-
-
-
-
-
-
-
-
-
-
-
-
-
-
-
-
-
-
-
-
3
-
3
Obl
ique
ly b
lunt
ed p
oint
(B-p
oint
)
1
-
-
1
-
-
-
-
-
-
-
-
-
-
-
-
-
-
-
-
-
1
-
3
Poi
nt w
ith re
touc
hed
base
(C-p
oint
)
-
-
-
-
-
-
-
-
-
-
-
-
-
-
-
-
-
-
-
-
-
1
-
1
Poi
nt m
icro
lith,
inde
term
inat
e
-
-
-
-
-
-
-
-
-
-
-
1
-
-
-
-
-
-
-
-
-
1
1
3
Bur
in s
ingl
e-an
gle
(Typ
e A
)
-
-
-
-
-
-
-
-
-
-
-
-
-
-
1
-
-
-
-
-
-
1
-
2
Bur
in d
ihed
ral (
Type
AA
)
1
-
-
-
-
-
1
-
-
1
-
-
-
-
-
-
-
-
-
-
-
-
-
3
Long
end
-scr
aper
-
-
-
-
-
-
1
-
-
-
-
-
-
-
-
-
-
-
-
-
-
-
-
1
R
ound
scr
aper
-
-
-
-
-
-
1
-
-
-
-
-
-
-
-
-
-
-
-
-
-
-
-
1
S
hort
end-
scra
per,
doub
le
-
-
-
-
-
-
1
-
-
-
-
-
-
-
-
-
-
-
-
-
-
-
-
1
Sho
rt en
d-sc
rape
r, si
ngle
-
-
-
-
-
-
1
1
2
-
-
-
-
-
-
-
-
-
-
-
-
-
-
4
S
ide
scra
per,
sing
le
-
-
-
-
-
-
-
-
-
-
1
-
-
-
-
-
-
-
-
-
-
-
-
1
Scr
aper
/bur
in c
ombi
natio
n
-
-
-
-
-
-
-
-
-
-
-
-
-
2
-
-
-
-
-
-
-
-
-
2 T
otal
9
2
1
1
2
5
1
2
3
3
2
5
3
1
2
4
1
5
3
2
1
4
13
3
87

182
Tren
ch 1
Longitudinal
Cutting
Shaving
Longitudinal indeterminate
Transversal
Scraping
Planing
Transversal indeterminate
Diagonal
Engraving
Diagonal indeterminate
Other
Reaming
Shooting (possibly)
Transversal/longitudinal
Unsure
Black residue
Total
Unm
odifi
ed
F
lake
1
1-
1
--
-
-
--
--
-3
Bla
de
2-
1
1-
2
-1
-
-1
1-
9 R
ehar
peni
ng fl
ake
-
-1
-
--
-
-
--
--
-1
Cor
e re
juve
natio
n fla
ke
--
-
11
-
--
-
--
--
2M
odifi
ed
F
lake
with
edg
e re
touc
h
--
1
3-
-
--
-
--
1-
5 S
egm
ent
-
--
-
-2
-
-
--
1-
-3
Obl
ique
ly b
lunt
ed p
oint
(B-p
oint
)
--
-
--
1
--
-
2-
-1
4 B
orer
-
--
-
--
-
-
1-
--
-1
Bur
in s
ingl
e-an
gle
(Typ
e A
)
1-
-
1-
-
--
-
--
--
2 B
urin
dih
edra
l (Ty
pe A
A)
-
--
1
--
-
-
--
--
-1
Bur
in m
ultip
le
--
-
1-
1
1-
-
--
--
3 R
ound
scr
aper
-
--
1
--
-
-
--
--
-1
Sho
rt en
d-sc
rape
r, do
uble
-
--
1
--
-
-
--
--
-1
Sho
rt en
d-sc
rape
r, si
ngle
-
--
3
--
-
-
--
--
-3
Spl
inte
red
piec
e
--
-
--
-
--
-
--
21
3
Tot
al
41
3
141
6
11
1
22
42
42
Tabl
e 4.
11a.
Tre
nch
1. A
rtef
act t
ype
vers
us p
erfo
rmed
mot
ion
of a
ll ar
tefa
cts
show
ing
trac
es o
f use
wea
r.

183
Tren
ch 2
Longitudinal
Cutting
Longitudinal indeterminate
Transversal
Scraping
Planing
Transversal indeterminate
Diagonal
Engraving
Diagonal indeterminate
Other
Reaming
Shooting (possibly)
Transversal/longitudinal
Unsure
Black residue
Total
Unm
odifi
ed
F
lake
-
1
1-
3
-4
-
-1
5-
15 B
lade
2
-
--
2
-7
-
--
2-
13 B
urin
spa
ll
--
1
--
-
-
--
--
-1
Cor
e pr
epar
atio
n bl
ade
-
-
--
-
-1
-
--
--
1 C
ore
reju
vena
tion
blad
e
--
-
--
-
1
--
-2
-3
Cor
e re
juve
natio
n fla
ke
--
-
2-
-
-
--
-1
-3
Mod
ified
B
lade
with
edg
e re
touc
h
-1
-
-1
1
2
--
12
-8
Bla
de w
ith s
teep
reto
uch
-
-
--
-
--
-
--
1-
1 F
lake
with
edg
e re
touc
h
3-
4
--
-
1
--
11
212
Seg
men
t
--
-
--
-
2
--
--
-2
Poi
nt in
dete
rmin
ate
-
2
1-
-
--
-
--
--
3 S
ingl
e-ed
ged
poin
t (A
-poi
nt)
-
-
--
-
--
2
1-
--
3 O
bliq
uely
blu
nted
poi
nt (B
-poi
nt)
-
-
--
1
--
1
--
1-
3 P
oint
with
reto
uche
d ba
se (C
-poi
nt)
-
-
--
-
--
1
--
--
1 P
oint
mic
rolit
h, in
dete
rmin
ate
-
1
--
-
--
1
--
-1
3 B
orer
-
-
--
-
--
-
--
--
- B
urin
sin
gle-
angl
e (T
ype
A)
-
-
--
1
--
1
--
--
2 B
urin
dih
edra
l (Ty
pe A
A)
-
-
1-
1
1-
-
--
--
3 L
ong
end-
scra
per
-
-
--
1
--
-
--
--
1 R
ound
scr
aper
-
-
--
1
--
-
--
--
1 S
hort
end-
scra
per,
doub
le
--
1
--
-
-
--
--
-1
Sho
rt en
d-sc
rape
r, si
ngle
-
-
3-
1
--
-
--
--
4 S
ide
scra
per,
sing
le
--
1
--
-
-
--
--
-1
Scr
aper
/bur
in c
ombi
natio
n
--
-
-1
1
-
--
--
-2
Tot
al5
513
213
318
61
315
387
Tabl
e 4.
11b.
Tre
nch
2. A
rtef
act t
ype
vers
us p
erfo
rmed
mot
ion
of a
ll ar
tefa
cts
show
ing
trac
es o
f use
wea
r.

184
Fig. 4.24. Traces formed by contact with vegetable material.a. Traces on Find number 314.1, interpreted as resulting from processing siliceous plant material with a scraping motion. Original magnification 200x.b. Traces on Find number 295.1, interpreted as resulting from cutting siliceous plant material. Original magnification 100x.c. Traces on Find number 191.2, interpreted as resulting from shaving reed. Original magnification 200x.d. Traces on Find number 268.6, interpreted as resulting from wood working. Original magnification 200x.
a b
c d
Processing of siliceous plant materialUse wear associated with the processing of siliceous plant material was often encountered in the Yangtze Harbour assemblage (Table 4.9). In most cases the process involved scraping movements, both transverse and diagonal. Examples of siliceous plants are cereals, grass species, reed and bulrush. The processing of these plants leaves highly characteristic traces: a broad band of reflective polish which upon repeated use results in a continuous, smooth surface with a few to many striations (Figs 4.24a and 4.24b). Differentiation occurs within this general category of traces related to the scraping of siliceous plant material, but linking these variations to specific contact materials is difficult (van Gijn et al. 2001b; Peeters et al. 2001). This form of use wear is often observed on Mesolithic and Early Neolithic artefacts, especially on blades, but rarely observed on artefacts from later periods. In the Yangtze Harbour assemblages these traces are also found mainly on blades and other unretouched objects, but also on a dihedral burin and an obliquely blunted point (Table 4.10). Microwear recorded in experiments as resulting from the harvesting of grass seeds or the scraping and crushing of reed resembles the observed archaeological traces but is not an exact match. It is likely that this type of use wear on archaeological artefacts was caused by similar activities, but whether these were related to food gathering/processing or to craft activities is unknown. It is clear, however, that whatever activity may have been involved was carried out frequently. This type of use wear was identified on seven of the 129 (5.5%) observed used edges (Figs 4.23 and 4.24).
185
Besides use wear formed by scraping siliceous plant material, other observed use-wear types resulted from other ways of processing the same material. A flake with long straight edges had been used to harvest siliceous plant material (Figs 4.22 and 4.24b), and use wear on a core rejuvenation flake probably resulted from shaving reed (Figs 4.22 and 4.24c).
Bark processingThe two lateral sides of a burin showed use wear resulting from the cutting and scraping of bark (Fig. 4.21). Bark can be used to make rope or containers. In general it is ready for use immediately after being removed from the tree, but the bark of some tree species produces a better-quality rope if it is first processed to extract the fibres. This particular burin was probably used both to cut bark into small strips and to scrape it to extract the fibres.
WoodworkingUse wear associated with woodworking – probably to make utensils or other objects – was observed on two flakes. The distal section and part of the lateral sides of one flake had been used to scrape wood, while wood had been shaved with the other flake (Fig. 4.24d).
VariousIn addition to these traces of wear yet others resulting from processing vegetable material were observed, but these could not be specified more precisely (Table 4.9, Fig. 4.22). The tools involved may have been used to harvest and process food but also for various crafts. Use wear of this type is mainly found on unretouched artefacts. These may represent ad hoc use, when any piece of flint that happens to be available is used in the task at hand.
4.4.5.2 Materials of animal origin
Use wear interpreted as resulting from the processing of material of animal origin (craft activities, food gathering and processing) was observed on 48 working zones (37%).
Hide processingThe vast majority of the observed use wear associated with material of animal origin resulted from the processing of animal skins (N=30): cleaning fresh skins, processing skins to turn them into leather or furs, and making items of clothing or other utilitarian objects. Fresh skins are usually scraped immediately after the carcass has been flayed. They can then be processed further at once, or dried and stored to be made into leather or furs at a later time. Processing skins is a lengthy and labour-intensive task which may take anything from a day to several weeks depending its nature of the, and these activities are therefore often associated with long-time or permanent occupation of a site (van Gijn 2010).Use wear interpreted as ‘dry-skin processing’ includes activities such as thinning or softening skins in connection with leather and fur production. Also observed were indications of subsequent production stages in which for example clothes and containers were made out of hide, leather and fur (Figs 4.1b and 4.21).Scraping skins was the most frequently encountered activity. A wide range of artefacts were involved, not only scrapers but also burins, unmodified flakes and retouched flakes. Two types of wear could be distinguished, a broad and a narrow band of polish (Figs 4.25a and 4.25b). Pieces with a narrow band of polish were probably used on a hard surface such as a piece of wood or compacted sand or clay, while pieces with a broad band of polish were used on softer surfaces such as grass, moss or the worker’s own thigh. This may have been a matter of personal preference or instead represent different stages in the production process.

186
Fig. 4.25. Traces formed by contact with material of animal origin.a. Traces on Find number 15.3, interpreted as resulting from scraping hide with a mineral addition on a hard surface. Original magnification 200x.b. Traces on Find number 133.3, interpreted as resulting from scraping hide on a soft surface. Original magnification 200x.c. Traces on Find number 76.1, interpreted as resulting from cutting hide with a mineral addition. Original magnification 200x.d. Traces on Find number 82.4, interpreted as resulting from processing fish. Original magnification 100x. The band of polish includes a round area almost devoid of traces.e. Traces on Find number 277.4, interpreted as resulting from scraping fish, probably de-scaling. Original mag-nification 100x. The band of polish includes an area devoid of traces.f. Traces on Find number 314.1, interpreted as resulting from engraving fresh bone. Original magnification 200x.g. Traces on Find number 322.7, interpreted as resulting from butchering. Original magnification 200x.h. Traces on Find number 322.7, interpreted as resulting from butchering after which the object was retouched and re-used to scrape hide. Original magnification 200x.
a b
c d
e f
g h

187
Seven edges (on scrapers, a unretouched flake and a burin) revealed traces associated with the processing of hide with a mineral addition, specifically scraping (N=6; Figs 4.21 and 4.25a) and activities involving a longitudinal motion such as cutting (N=1; Fig. 4.20 and 4.25c). Mineral substances such as ochre can be added to skins as a tanning agent, to improve the quality of the skins, or to add colour. In some cases, however, the added material appears to have been sand or a similar substance. This may have been done deliberately, but it is also possible that the processed skin was very sandy.
Bone processingThree zones with use wear interpreted as resulting from bone processing were observed. Interestingly, all three tools involved had also been used in another task seemingly unrelated to bone processing. Use wear observed on the tip of a burin resulted from carving fresh bone (Figs 4.23 and 4.25f), while the lateral side of the same burin was used to scrape siliceous plant material. Dry bone had been carved with another burin while its lateral side had been used to scrape a medium-hard mineral material (Fig. 4.21), such as ochre or soft limestone. The third tool is a point, the tip of which had been used to scrape bone, while hide had been cut with the opposite lateral side. Only in the last case there is reason to believe the two activities may have been linked, as both contact materials were of animal origin. There are two possible reasons for using one artefact in multiple, non-related tasks: 1. after the first task was finished the artefact was deliberately kept for future re-use; 2. a piece of flint was taken from a stash, used, put back again, and later re-used at random. Which task was performed first with these three tools cannot be established, as the use-wear zones do not overlap
ButcheringFinally, some of the observed use wear had resulted from a combination of meat and bone processing interpreted as butchering. Both lateral sides of a microlithic point had been used in this activity (Figs 4.23 and 4.25g); the tool’s shape and dimensions suggest that it was originally hafted, although no direct traces of hafting were observed. Recent experiments (Siebelink, van Gijn, Pomstra, Lammers-Keijsers, and Langer 2012) indicate that a composite knife is an ideal butchering tool. The tip of a retouched blade showed use wear related to meat and bone processing, while its lateral sides had been used to clean fish. Perhaps the two sets of tasks included cleaning fish bones, or cutting tendons or sinew from bone. Finally, the most interesting artefact was described as a flake with use-retouch. This tool had first been used in butchering, with a cutting motion, after which the edge had been retouched and subsequently used to scrape hide. The two tasks can be distinguished because they overlap only partially; a broad zone with butchering-related wear is cross-cut by retouch and overlaid by a zone with transverse traces, which have also rounded the distal face of the retouch (Fig. 4.25h).
Fish processingEight zones with use wear related to fish processing were identified, on flakes, blades, one retouched blade and one scraper (Table 4.10; Figs 4.25d and 4.25e). It is unusual to encounter this type of use wear this often (6%) on archaeological material. Why it is not observed more often in Dutch assemblages is unknown. Perhaps this type of use wear is not always recognised, for example because of poor preservation, poor development of the use wear itself, or patina on the flint surface.13 The Yangtze Harbour material tends to be well preserved, and this may have contributed to the identification of fish-processing use wear at that site. Fish processing produces a greasy polish with a messy distribution that forms irregularly along the used edge. The polish includes round patches without traces or only lightly developed ones (Fig. 25d); presumably these mark the places where fish scales sticking to the surface prevented the formation of use wear (García Díaz 2009).Not all traces of fish processing were equally clear. A few tools were interpreted as ‘probably used to process fish’ and which exact stage in the process they represented also remains uncertain. It may have been fish preparation prior to consumption, but it is also possible that the skins of larger fish species were made into – for example – leather. The latter is not very likely, however, as flint is unsuitable for scraping fish skins; tools of wood, bone or antler would have produced better results.
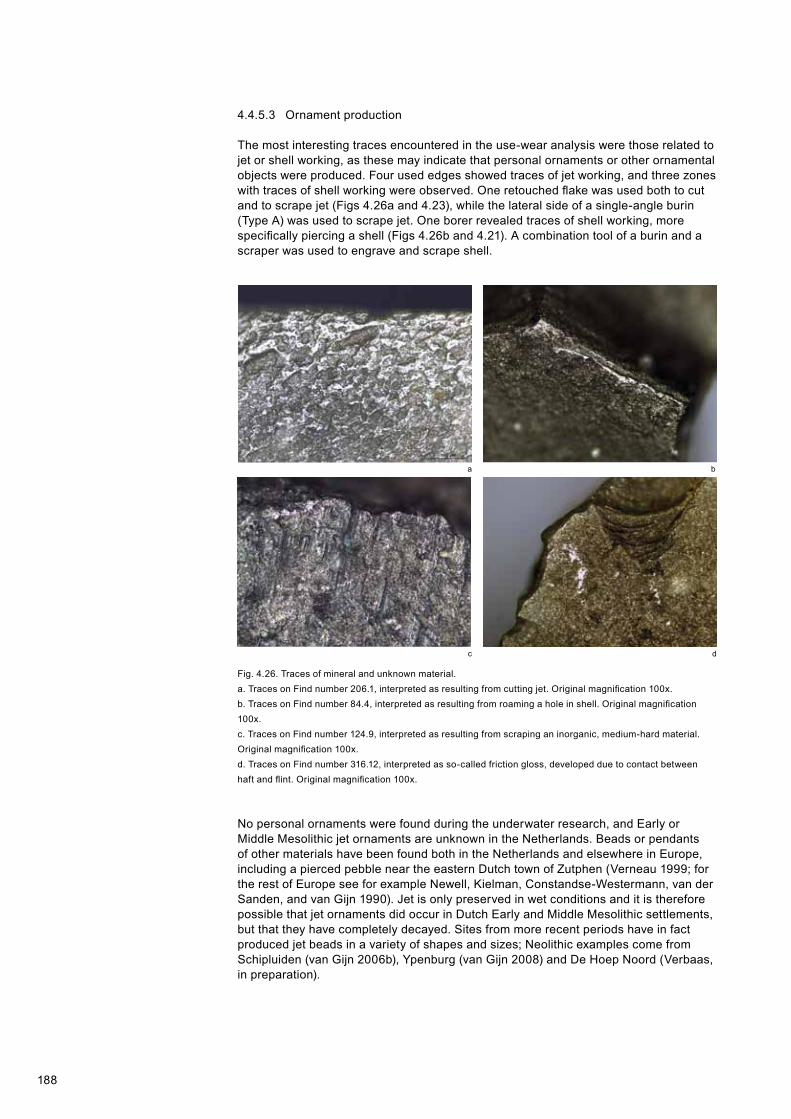
188
Fig. 4.26. Traces of mineral and unknown material.a. Traces on Find number 206.1, interpreted as resulting from cutting jet. Original magnification 100x.b. Traces on Find number 84.4, interpreted as resulting from roaming a hole in shell. Original magnification 100x.c. Traces on Find number 124.9, interpreted as resulting from scraping an inorganic, medium-hard material. Original magnification 100x.d. Traces on Find number 316.12, interpreted as so-called friction gloss, developed due to contact between haft and flint. Original magnification 100x.
a b
c d
4.4.5.3 Ornament production
The most interesting traces encountered in the use-wear analysis were those related to jet or shell working, as these may indicate that personal ornaments or other ornamental objects were produced. Four used edges showed traces of jet working, and three zones with traces of shell working were observed. One retouched flake was used both to cut and to scrape jet (Figs 4.26a and 4.23), while the lateral side of a single-angle burin (Type A) was used to scrape jet. One borer revealed traces of shell working, more specifically piercing a shell (Figs 4.26b and 4.21). A combination tool of a burin and a scraper was used to engrave and scrape shell.
No personal ornaments were found during the underwater research, and Early or Middle Mesolithic jet ornaments are unknown in the Netherlands. Beads or pendants of other materials have been found both in the Netherlands and elsewhere in Europe, including a pierced pebble near the eastern Dutch town of Zutphen (Verneau 1999; for the rest of Europe see for example Newell, Kielman, Constandse-Westermann, van der Sanden, and van Gijn 1990). Jet is only preserved in wet conditions and it is therefore possible that jet ornaments did occur in Dutch Early and Middle Mesolithic settlements, but that they have completely decayed. Sites from more recent periods have in fact produced jet beads in a variety of shapes and sizes; Neolithic examples come from Schipluiden (van Gijn 2006b), Ypenburg (van Gijn 2008) and De Hoep Noord (Verbaas, in preparation).

189
4.4.5.4 Shooting
Seven points and a burin revealed a form of use wear suggestive of use as projectiles (Figs 4.21 and 4.23). Use wear observed on experimentally fired projectile points includes impact fractures (moon-shaped fractures formed upon impact) and linear streaks of polish, or polish with striations formed upon impact with an animal or the soil (Lammers et al., in press). Unfortunately the damage sustained by the Yangtze Harbour material during retrieval/collection is identical to the traces observed on the experimentally fired points, making it impossible in this case to distinguish archaeological use wear from recent damage. The interpretation of observed impact fractures is equally problematic, as these may originate in many different ways such as through contact with other arrows inside a quiver, when points are being dropped on the ground, or when excavated soil is being screened. Such fractures have therefore been interpreted by default as ‘possibly projectile-related’.
4.4.5.5 Other wear traces and worked materials
Black residueOn five artefacts a black residue was observed which was suspected to be tar. Unfortunately the amount of residue on most of the tools was so small that only one artefact contained a sufficient amount for analysis. Figure 4.27 shows the spectrum obtained by combining scans 50 to 80. The spectrum reveals the presence of a thermally dissociating polymer. The observed peaks point to an angiosperm lignin which displays a syringyl-guaiacyl pattern. The basic elements of this type of lignin are sinapyl alcohol (m/z 210, 167, 154) and coniferyl alcohol (m/z 180, 137, 124). The carbohydrate signal, indicating cellulose and hemicellulose with peaks at m/z 60, 73, 98, 126 and 114, is very low which points at biological degradation by micro-organisms. The conclusion was that the analysed material consisted of the fossilised walls of plant cells.14 There were no indications for the presence of vegetable adhesives, pitch or fats; antioxidants and plasticisers from the find bag were detected, however. The high-temperature analysis results revealed the presence of reduced sulphur, indicative of sulphate reduction and by implication a marine environment. In conclusion, analysis of the fossil plant remains showed that it is likely that the artefact was originally deposited in a bog environment but was later redeposited elsewhere; if it had come directly out of a bog it would still have had actual peat sticking to it (i.e. plant remains). The high lignin content of the sample suggests that it may have been a carr environment, where many woody species with a high lignin content (including roots) occur.
VariousIn addition to these remains of a black residue, various other contact materials were observed. However, these could not be identified in any more detail except for the conclusion that soft, medium-hard and hard materials had been worked in a range of activities. Many of the observed traces were insufficiently developed to allow interpretation while others, although often encountered in archaeological assemblages, have not yet been experimentally reproduced. One reason for this is the extensiveness of Mesolithic and more recent technologies (van Gijn 2010), which are not yet fully understood. Another possible explanation is that several contact materials of almost equal hardness may have been combined on one tool, thus resulting in traces that are indistinguishable from one another.

190
Fig. 4.27. Mass spectrum of a black substance observed on Find number 201.10, identified as fossil angiosperm lignin containing some poly-saccharide.
flint black
4.4.5.6 Multiple use
Two types of multiple use were observed: four edges had each been used to work several different contact materials (Table 4.9 and Fig. 4.23) and 26 artefacts contained multiple used zones (Table 4.12 and Fig. 4.20-23).Artefacts in the first category (multiple materials worked with one edge) revealed use wear characteristic of a number of contact materials which however could no longer be distinguished as the traces overlapped. Perhaps these tools had been kept and re-used in various tasks. Alternatively, they may have been used in the making of one object composed of a number of different raw materials.Most artefacts with multiple used edges, however, had been used on the same material throughout, albeit involving different motions or activities. An example is Find number 76.1, a flake used both to cut and to scrape hide. Occasionally, however, the different wear traces seem to be the result of seemingly unconnected activities. This may simply be due to our lack of understanding of the technological complex; perhaps these tools were involved in yet unknown craft activities.In the case of four pieces the various activities carried out with the same tool were almost certainly unrelated: 1. A blade used to cut dry hide and to harvest siliceous plant material; 2. A burin (Figs 4.23 and 4.25f) of which the tip had been used to engrave fresh bone and the lateral side to scrape siliceous plant material; 3. A multiple burin (Figs 4.21 and 4.25g) used to engrave bone and applied in a transverse direction to an inorganic medium-hard material; 4. A core rejuvenation flake used to plane a medium-hard vegetable material and to scrape (possibly fresh) hide.
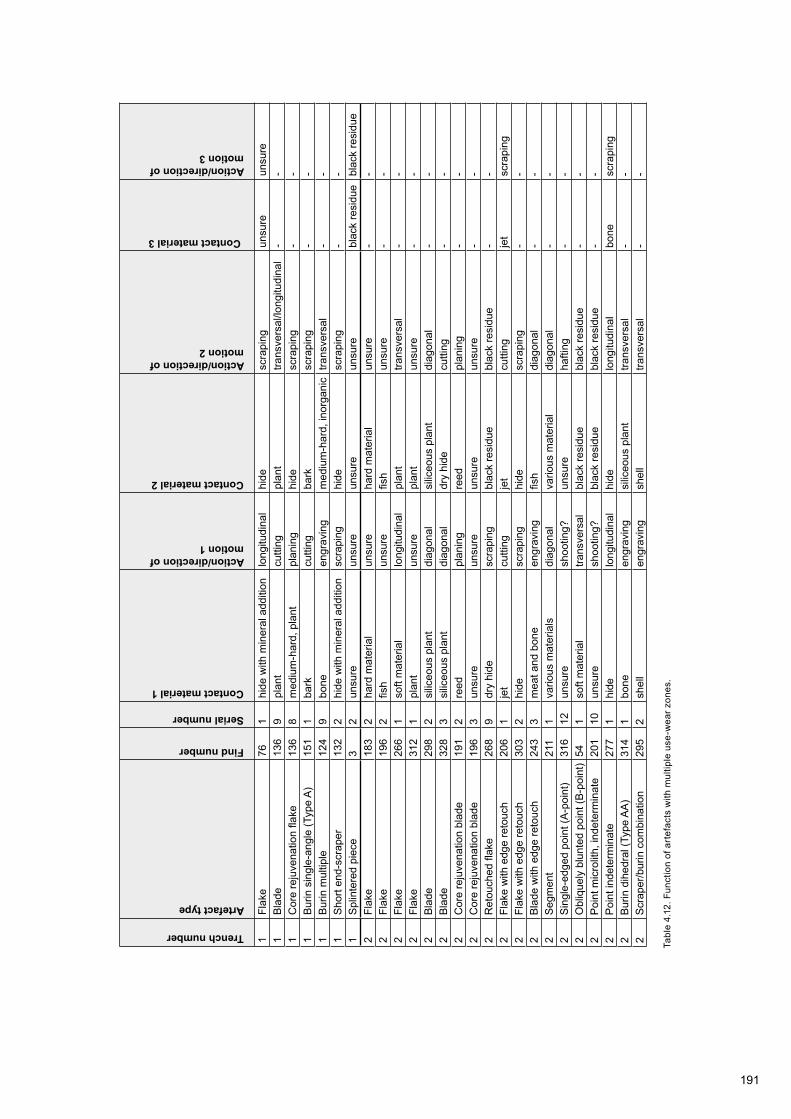
191
Trench number
Artefact type
Find number
Serial number
Contact material 1
Action/direction of motion 1
Contact material 2
Action/direction of motion 2
Contact material 3
Action/direction of motion 3
1 F
lake
76
1 h
ide
with
min
eral
add
ition
long
itudi
nal
hid
e s
crap
ing
uns
ure
uns
ure
1 B
lade
136
9 p
lant
cut
ting
pla
nt tr
ansv
ersa
l/lon
gitu
dina
l -
- 1
Cor
e re
juve
natio
n fla
ke 1
36 8
med
ium
-har
d, p
lant
pla
ning
hid
e s
crap
ing
- -
1 B
urin
sin
gle-
angl
e (T
ype
A)
151
1 b
ark
cut
ting
bar
k s
crap
ing
- -
1 B
urin
mul
tiple
124
9 b
one
eng
ravi
ng m
ediu
m-h
ard,
inor
gani
c tr
ansv
ersa
l -
- 1
Sho
rt en
d-sc
rape
r 1
32 2
hid
e w
ith m
iner
al a
dditi
on s
crap
ing
hid
e s
crap
ing
- -
1 S
plin
tere
d pi
ece
3 2
uns
ure
uns
ure
uns
ure
uns
ure
bla
ck re
sidu
e b
lack
resi
due
2 F
lake
183
2 h
ard
mat
eria
l u
nsur
e h
ard
mat
eria
l u
nsur
e -
- 2
Fla
ke 1
96 2
fish
uns
ure
fish
uns
ure
- -
2 F
lake
266
1 s
oft m
ater
ial
long
itudi
nal
pla
nt tr
ansv
ersa
l -
- 2
Fla
ke 3
12 1
pla
nt u
nsur
e p
lant
uns
ure
- -
2 B
lade
298
2 s
ilice
ous
plan
t d
iago
nal
sili
ceou
s pl
ant
dia
gona
l -
- 2
Bla
de 3
28 3
sili
ceou
s pl
ant
dia
gona
l d
ry h
ide
cut
ting
- -
2 C
ore
reju
vena
tion
blad
e 1
91 2
reed
pla
ning
reed
pla
ning
- -
2 C
ore
reju
vena
tion
blad
e 1
96 3
uns
ure
uns
ure
uns
ure
uns
ure
- -
2 R
etou
ched
flak
e 2
68 9
dry
hid
e s
crap
ing
bla
ck re
sidu
e b
lack
resi
due
- -
2 F
lake
with
edg
e re
touc
h 2
06 1
jet
cut
ting
jet
cut
ting
jet
scr
apin
g 2
Fla
ke w
ith e
dge
reto
uch
303
2 h
ide
scr
apin
g h
ide
scr
apin
g -
- 2
Bla
de w
ith e
dge
reto
uch
243
3 m
eat a
nd b
one
eng
ravi
ng fi
sh d
iago
nal
- -
2 S
egm
ent
211
1 v
ario
us m
ater
ials
dia
gona
l v
ario
us m
ater
ial
dia
gona
l -
- 2
Sin
gle-
edge
d po
int (
A-p
oint
) 3
16 1
2 u
nsur
e s
hoot
ing?
uns
ure
haf
ting
- -
2 O
bliq
uely
blu
nted
poi
nt (B
-poi
nt)
54 1
sof
t mat
eria
l tr
ansv
ersa
l b
lack
resi
due
bla
ck re
sidu
e -
- 2
Poi
nt m
icro
lith,
inde
term
inat
e 2
01 1
0 u
nsur
e s
hoot
ing?
bla
ck re
sidu
e b
lack
resi
due
- -
2 P
oint
inde
term
inat
e 2
77 1
hid
e lo
ngitu
dina
l h
ide
long
itudi
nal
bon
e s
crap
ing
2 B
urin
dih
edra
l (Ty
pe A
A)
314
1 b
one
eng
ravi
ng s
ilice
ous
plan
t tr
ansv
ersa
l -
- 2
Scr
aper
/bur
in c
ombi
natio
n 2
95 2
she
ll e
ngra
ving
she
ll tr
ansv
ersa
l -
-
Tabl
e 4.
12. F
unct
ion
of a
rtef
acts
with
mul
tiple
use
-wea
r zon
es.
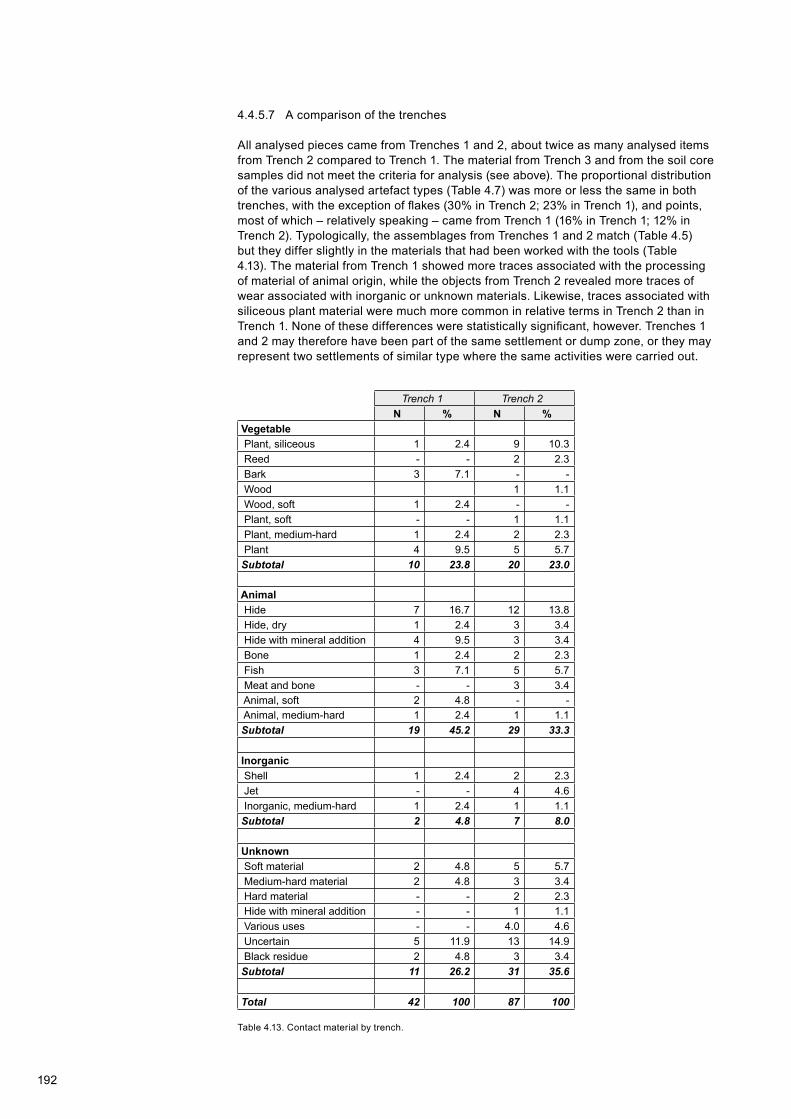
192
Trench 1 Trench 2
N % N % Vegetable Plant, siliceous 1 2.4 9 10.3 Reed - - 2 2.3 Bark 3 7.1 - - Wood 1 1.1 Wood, soft 1 2.4 - - Plant, soft - - 1 1.1 Plant, medium-hard 1 2.4 2 2.3 Plant 4 9.5 5 5.7 Subtotal 10 23.8 20 23.0
Animal Hide 7 16.7 12 13.8 Hide, dry 1 2.4 3 3.4 Hide with mineral addition 4 9.5 3 3.4 Bone 1 2.4 2 2.3 Fish 3 7.1 5 5.7 Meat and bone - - 3 3.4 Animal, soft 2 4.8 - - Animal, medium-hard 1 2.4 1 1.1 Subtotal 19 45.2 29 33.3
Inorganic Shell 1 2.4 2 2.3 Jet - - 4 4.6 Inorganic, medium-hard 1 2.4 1 1.1 Subtotal 2 4.8 7 8.0
Unknown Soft material 2 4.8 5 5.7 Medium-hard material 2 4.8 3 3.4 Hard material - - 2 2.3 Hide with mineral addition - - 1 1.1 Various uses - - 4.0 4.6 Uncertain 5 11.9 13 14.9 Black residue 2 4.8 3 3.4 Subtotal 11 26.2 31 35.6
Total 42 100 87 100
Table 4.13. Contact material by trench.
4.4.5.7 A comparison of the trenches
All analysed pieces came from Trenches 1 and 2, about twice as many analysed items from Trench 2 compared to Trench 1. The material from Trench 3 and from the soil core samples did not meet the criteria for analysis (see above). The proportional distribution of the various analysed artefact types (Table 4.7) was more or less the same in both trenches, with the exception of flakes (30% in Trench 2; 23% in Trench 1), and points, most of which – relatively speaking – came from Trench 1 (16% in Trench 1; 12% in Trench 2). Typologically, the assemblages from Trenches 1 and 2 match (Table 4.5) but they differ slightly in the materials that had been worked with the tools (Table 4.13). The material from Trench 1 showed more traces associated with the processing of material of animal origin, while the objects from Trench 2 revealed more traces of wear associated with inorganic or unknown materials. Likewise, traces associated with siliceous plant material were much more common in relative terms in Trench 2 than in Trench 1. None of these differences were statistically significant, however. Trenches 1 and 2 may therefore have been part of the same settlement or dump zone, or they may represent two settlements of similar type where the same activities were carried out.

193
Based on the wide range of worked materials and activities, it is highly unlikely that Yangtze Harbour was a special-activity site. On such sites, less diversity in worked materials is expected, as well as more focus on one activity. The presence of use wear associated with hide processing, related to leather and pelts production, with ornament production and with other crafts also contradicts an interpretation as special-activity site. The results of the use-wear analysis rather suggest that Yangtze Harbour was a long-term settlement site, although it is difficult to estimate the duration of the occupation.
4.4.5.8 Typology versus function
Typological flint classifications are generally based on a tool’s ascribed function. However, previous studies (e.g. van Gijn 1990; idem 2010; van Gijn, van Betuw, Verbaas, and Wentink 2006; Siebelink et al. 2012) have shown that in many cases these ascribed functions do not match the activities the tools were actually used for. The Yangtze Harbour material is a good illustration in point (Tables 4.10 and 4.11). Here, other artefact types than scrapers – e.g. burins, flakes and retouched pieces – have also been used in hide processing. Virtually all scrapers have been used for that purpose exclusively, with only two exceptions: one scraper had been used to process fish, and another to work shell. All in all, however, there seems to be a near-perfect match between scrapers and their function.With respect to points, however, the situation at Yangtze Harbour is different. The points appear to have been used in a wide range of tasks; while some may have been projectiles, others were used to process vegetable material, meat and bone in a wide range of activities. Microlithic points are well known to have had a wide range of functions, as for example components of composite tools (for example, Siebelink et al. 2012), hafted or hand-held. Only one Yangtze Harbour point showed traces of hafting in the form of friction gloss (Fig. 4.26d).Since conditions at the site were unfavourable for the preservation of tar/pitch, and many flint surfaces had moreover sustained damage (scratching) during retrieval, it is possible that other traces of hafting once existed but were obliterated or can no longer be recognised. Perhaps more points were used in composite tools, or hafted individually.It is generally assumed that burins were used to carve or engrave materials such as bone (e.g. the so-called metapodium technique; see van den Broeke 1983; van Gijn 1990), and indeed several Yangtze Harbour burins were used to carve fresh or dry bone. However, other burins had been used for a range of other activities, such as scraping hide, jet and bark, and also to cut bark.Only one of the two analysed borers, a specimen with a broken tip, was subjected to microwear analysis. This revealed traces of shell working, more specifically (as the distribution of the traces indicated) reaming a hole. Of course it is possible that the borer had been used in puncturing/boring, but no traces of such activities could be observed, in part because the tip was missing.Retouched specimens turned out to be multifunctional, as could be expected. At Yangtze Harbour they had been deployed in a wide range of tasks and on an equally wide range of contact materials. Some archaeologists continue to regard unretouched pieces as semi-finished blanks for tool production, but this is incorrect. Although unretouched pieces may have been intended for future retouch, they were also used directly and in large numbers for various tasks.The conclusion is that the assumption of a one-to-one relation between a tool’s ascribed and actual function as deduced from its observed use wear is clearly incorrect. Even if a tool type was used mainly for one specific task (e.g. scrapers), the relation was not exclusive; hide processing for example involved other tool types as well.

194
4.5 Discussion and conclusion
Archaeological investigation of part of a submerged river dune in the Rotterdam Yangtze Harbour planning area yielded almost 3,000 flint artefacts and several hundred pieces of other stone. Virtually all finds came from two spatially distinct trenches (Trenches 1 and 2). Based on the artefacts’ typo-technological characteristics they represent Mesolithic occupation; no indications of earlier, (Late) Palaeolithic or later, Neolithic occupation were identified in the lithic assemblage.The composition of the point assemblage suggests a date in the Early (circa 9500-8600BP) and Middle (circa 8600-7800BP) Mesolithic periods (Verhart and Arts, 2005); no Late Mesolithic component (e.g. trapezia) was present. A relatively early date for (some of) the finds is confirmed by the presence of burins. Radiocarbon dates obtained on botanical remains and animal bone clearly indicate that especially the material from Trench 2 represents not one single occupation phase but rather a succession of episodes over a considerable period of time.Both trenches have produced artefacts at all stages of reduction, from raw material and primary debitage to discarded tools. Except for a few minor differences in raw material, technology and tool types, the assemblages from the two trenches are overall comparable. It seems likely that at least some of the raw material was brought to the dune in a semi-finished state; this suggests that no suitable flint may have been available nearby, at least not in large quantities. The presence of small core remnants and bipolar artefacts and a preference for core rejuvenation suggests a curated approach to the available raw materials. Soft or indirect percussion was an often applied technique and both blades and flakes, with or without retouch, were used as tools.Of the 170 pieces of flint subjected to use-wear analysis, 99 revealed traces on a total of 129 used zones. The nature of the traces varied greatly, encompassing activities related to food preparation and acquisition as well as various crafts. Of particular interest is use wear associated with jet or shell working, probably in the context of ornament production.In the category plant-related use wear, traces associated with the processing of siliceous plant material form the largest category. Although use wear associated with harvesting siliceous plants was observed on two pieces, the most commonly identified activity was scraping siliceous plant material. Despite extensive experimental research it is still unknown what activity left these traces, but they are generally assumed to be connected to craft activities. This type of use wear is often observed on flint artefacts from the Mesolithic and Neolithic periods.Besides traces left by siliceous plant material, there were others associated with the processing of unspecified plants, with wood working, or with bark processing for rope production.In the category ‘material of animal origin’ the most commonly observed use wear was associated with various hide processing stages, including the application of minerals such as ochre. The entire production process from raw skins to leather and furs appears to be represented. In addition to hide processing, butchering mammals and cleaning fish as well as working bone were also represented by use wear. Bone was probably made into tools, some of which were actually found during the underwater research.Several artefacts had been used on a range of materials. Occasionally the same working edge had been used throughout, making it impossible to distinguish the traces associated with each individual activity, while other tools had multiple working edges. This phenomenon may reflect the re-use of artefacts on multiple, unrelated occasions. An alternative explanation is that one artefact with one working edge may have been used at all stages and on all materials involved in the production of one final product. An example would be a basket made of rushes, with a wooden lid and a bone toggle to close it, or a knife with a wooden handle tied with rope made of vegetable fibres.This is the first Early and Middle Mesolithic assemblage from a Dutch site which has been systematically subjected to use-wear analysis. Because all pieces which met the selection criteria could be analysed, it was possible to reconstruct the full range of activities performed with the tools. The diversity of these activities, which includes hide and wood processing and ornament making, suggests long-term occupation by a substantial group of people, although use-wear analysis and typo-technological analysis in themselves do not allow an estimate of the exact duration.

195
Few or no differences were observed between the two analysed trenches; the full range of activities appears to have been carried out at both locations. It is therefore likely that both trenches represent the same settlement, or perhaps multiple, long-term occupation phases , each involving the same activities on the site.The following section lists the research questions presented in Section 4.2 and formulates answers based on the analysis of the flint and stone assemblages. Trench 3 and the soil core samples are once again omitted because of the small number of finds they produced.
Microscale, generalWhat were the geological units and/or facies from which the remains were retrieved?
The flint and stone assemblages came from the top of the dune.
What is the material composition of the archaeological stone assemblage?
The archaeological objects discussed in this chapter were made of flint and other types of stone. The flint included primarily northern (Bryozoa flint) and primarily southern (Rijckholt type flint) types. However, determination of much of the flint was hampered by the fact that it was burnt and/or by its small size (chips<10mm). The stone assemblage included a few pieces on Wommersom quartzite as well as several types of sandstone, probably quartz geode, bluestone and a material classified as silicate limestone, in addition to types that occurred only sporadically.
What is the age of the archaeological objects?
The flints as well as part of the stone assemblage (excluding specimens classified as recent intrusions) date from the Mesolithic period; the Early (circa 9500-8600BP) and Middle Mesolithic (circa 8600-7800BP) are both represented, with a probable emphasis on the earlier period.The composition of the point assemblage suggests that the lithics from Trench 1 may represent a slightly older occupation phase than those from Trench 2. In Trench 1 obliquely blunted points (B-points) and segments dominate, with one scalene triangle. Obliquely blunted points (B-points) and segments are also present in Trench 2, but the point types from that trench are more diverse: single-edged points (A-points) were identified as well, as was a point with a retouched base (C-point), a lanceolate point, and a hybrid between these two point types, while one of the segments from Trench 2 tends towards a triangle. That being said, however, there are reasons for caution. Firstly, Trench 2 produced significantly more material than Trench 1, thus increasing the chance that certain point types will be identified. Secondly, the available radiocarbon dates do not support an earlier date for Trench 1. The three oldest dates (i.e. Early Mesolithic) obtained on material from the site, two on animal bone (9215 ± 45BP, GrA-56453 and 9205 ± 45BP, GrA-56454) and one on a fragment of a charred hazelnut shell (8920 ± 45BP, GrA-55485), both derive from Trench 2. The situation is complicated further by the two other dates from Trench 2, 7750 ± 45BP (GrA-55403) and 7685 ± 45BP (GrA-44404). Both dates suggest human activity at the site towards the end of the Middle Mesolithic or the start of the Late Mesolithic.The most likely explanation is that the material from Trench 2 represents a palimpsest of both Early Mesolithic and transitional Middle/Late Mesolithic material. This may also explain the diversity in point types, with the segments representing the earliest occupation phase, and the lanceolate point and the hybrid of a point with a retouched base/lanceolate point deriving from a Middle Mesolithic occupation phase. The single-edged and obliquely blunted points cannot be assigned to one specific phase as they were used during both the Early and the Middle Mesolithic period. Based on current knowledge, points with a retouched base (C-points) first appeared around 9,000BP which suggests that the specimen from Trench 2 post-dates the very earliest occupation phase.The five radiocarbon dates from Trench 1 all fall within the range of 8135 to 7820BP, suggestive of human activity in the second half of the Middle Mesolithic. There is nothing in these dates to suspect a palimpsest with a considerable time depth; on the other hand, the presence of segments suggests an earlier occupation phase not reflected by the dates.

196
What is the nature and condition of the excavated remains?
The lithic assemblages mainly consist of debitage from various stages of flint reduction, blades and flakes, (retouched) tools, and material related to tool production and/or maintenance. Apart from some post-depositional damage (see below) and natural surface changes (especially black patina) the material is very well preserved and relatively fresh.
What was the impact of the methods of retrieval and post-retrieval processing on the condition, context data etc. of the archaeological remains?
The adopted field research methods have had a negative impact on the information content of the finds, particularly regarding microwear. Dozens of artefacts displayed edge removals which were very similar to microwear but in fact represented recent damage. Artefact surfaces showed traces left by the metal screens that were used as well as scratches formed by contact with sand. The presence of recent retouch hampered use-wear analysis and in some cases made it impossible. Moreover, some original use wear may have been overlooked because it had become modified or completely obliterated. The surface of many objects, for example, contained clusters of linear striations in combination with polish which may relate to the use of these objects as projectile points, but which in many cases more likely represent recent damage sustained during retrieval and/or processing of the finds. Because they are indistinguishable from use wear encountered on actual projectile points, accurate interpretation of the use wear on these objects was very difficult.
To what extent did the analysis methods affect the composition of the archaeological assemblage? How does this compare to conditions at excavations carried out on land?
Apart from the above mentioned forms of recently sustained damage on the flint implements the Yangtze Harbour assemblage does not seem to differ materially from assemblages excavated on land (compare Verrebroek, Belgium – Crombé, Perdaen, Sergant, and Caspar 2010; Hanzelijn Railway – Verbaas et al. 2011; Dronten – Niekus, Knippenberg, and Devriendt 2012). All artefact types, from small chips to larger pieces (flake and blade cores) were represented. The main difference with land-based sites was a lack of data on the spatial distribution of artefacts, rendering analysis of spatial patterns and the identification of activity areas virtually impossible.
Microscale, specificWhat artefact types were recovered from the three research areas? What were the origin, typological and technological characteristics, and chronological context?
Virtually all artefact types commonly encountered at Mesolithic sites were represented at Yangtze Harbour: raw flint nodules, decortication and core preparation pieces, cores at various stages of reduction, core rejuvenation flakes, chips, blades and flakes. Tool types include retouched flakes and blades, scrapers, various point types, burins, a few notched artefacts, combination tools, splintered pieces and borers. Burin spalls, microburins, a resharpening flake (probably from a scraper), and a retouch chip point at tool production and/or maintenance.
What activities were carried out by the occupants of the dune site?
The people living on the river dune at Yangtze Harbour imported flint from elsewhere and struck blades and flakes from it which they then retouched and/or used directly for a wide range of tasks. Many of the retouched tools (scrapers, burin, borers etc.) were probably made, used and subsequently discarded on site. The presence of burin spalls indicates that burins were being produced or renewed, and a resharpening flake from a scraper indicates scraper maintenance. The presence of microburins, a retouch chip and a few probable preforms of points indicates local point production, to replace specimens damaged during the hunt. Burnt artefacts point to the presence of hearths. The function of sandstone fragments with traces of polish is unknown, but the degree of fragmentation suggests they may have been cooking stones.
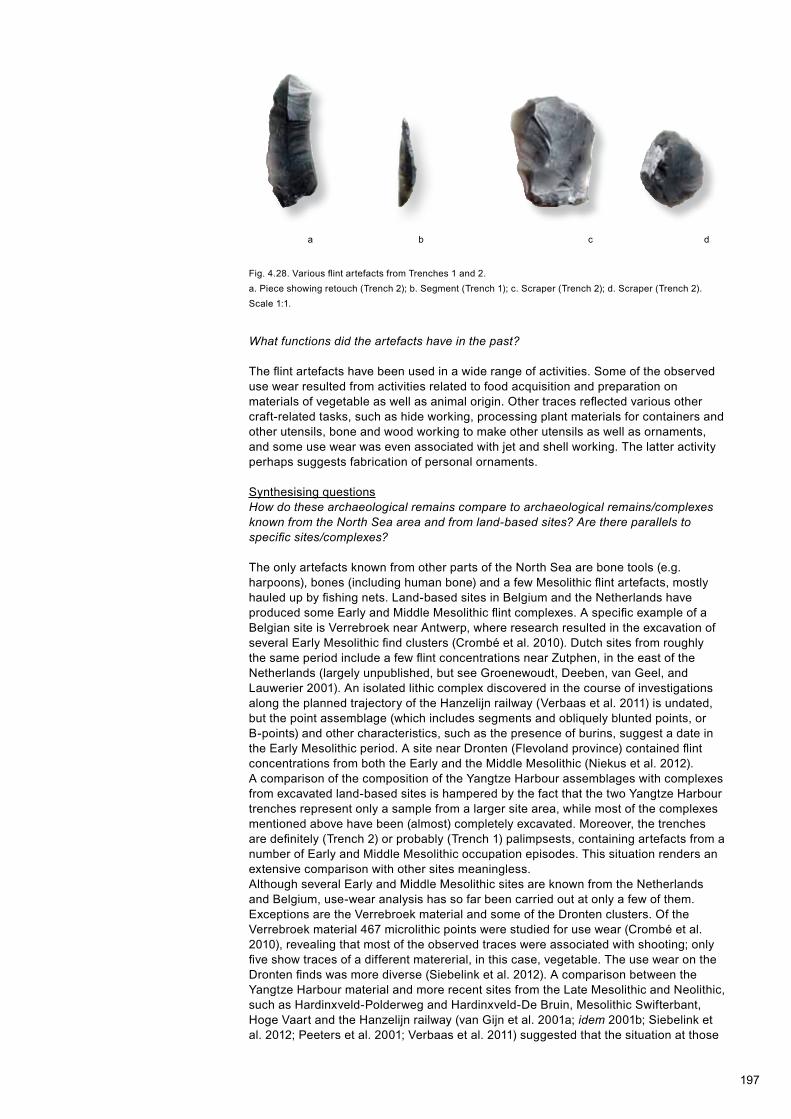
197
Fig. 4.28. Various flint artefacts from Trenches 1 and 2.a. Piece showing retouch (Trench 2); b. Segment (Trench 1); c. Scraper (Trench 2); d. Scraper (Trench 2). Scale 1:1.
a b c d
What functions did the artefacts have in the past?
The flint artefacts have been used in a wide range of activities. Some of the observed use wear resulted from activities related to food acquisition and preparation on materials of vegetable as well as animal origin. Other traces reflected various other craft-related tasks, such as hide working, processing plant materials for containers and other utensils, bone and wood working to make other utensils as well as ornaments, and some use wear was even associated with jet and shell working. The latter activity perhaps suggests fabrication of personal ornaments.
Synthesising questionsHow do these archaeological remains compare to archaeological remains/complexes known from the North Sea area and from land-based sites? Are there parallels to specific sites/complexes?
The only artefacts known from other parts of the North Sea are bone tools (e.g. harpoons), bones (including human bone) and a few Mesolithic flint artefacts, mostly hauled up by fishing nets. Land-based sites in Belgium and the Netherlands have produced some Early and Middle Mesolithic flint complexes. A specific example of a Belgian site is Verrebroek near Antwerp, where research resulted in the excavation of several Early Mesolithic find clusters (Crombé et al. 2010). Dutch sites from roughly the same period include a few flint concentrations near Zutphen, in the east of the Netherlands (largely unpublished, but see Groenewoudt, Deeben, van Geel, and Lauwerier 2001). An isolated lithic complex discovered in the course of investigations along the planned trajectory of the Hanzelijn railway (Verbaas et al. 2011) is undated, but the point assemblage (which includes segments and obliquely blunted points, or B-points) and other characteristics, such as the presence of burins, suggest a date in the Early Mesolithic period. A site near Dronten (Flevoland province) contained flint concentrations from both the Early and the Middle Mesolithic (Niekus et al. 2012).A comparison of the composition of the Yangtze Harbour assemblages with complexes from excavated land-based sites is hampered by the fact that the two Yangtze Harbour trenches represent only a sample from a larger site area, while most of the complexes mentioned above have been (almost) completely excavated. Moreover, the trenches are definitely (Trench 2) or probably (Trench 1) palimpsests, containing artefacts from a number of Early and Middle Mesolithic occupation episodes. This situation renders an extensive comparison with other sites meaningless.Although several Early and Middle Mesolithic sites are known from the Netherlands and Belgium, use-wear analysis has so far been carried out at only a few of them. Exceptions are the Verrebroek material and some of the Dronten clusters. Of the Verrebroek material 467 microlithic points were studied for use wear (Crombé et al. 2010), revealing that most of the observed traces were associated with shooting; only five show traces of a different matererial, in this case, vegetable. The use wear on the Dronten finds was more diverse (Siebelink et al. 2012). A comparison between the Yangtze Harbour material and more recent sites from the Late Mesolithic and Neolithic, such as Hardinxveld-Polderweg and Hardinxveld-De Bruin, Mesolithic Swifterbant, Hoge Vaart and the Hanzelijn railway (van Gijn et al. 2001a; idem 2001b; Siebelink et al. 2012; Peeters et al. 2001; Verbaas et al. 2011) suggested that the situation at those

198
sites somewhat resembled that at the site Yangtze Harbour, although some of the more recent sites contained a smaller range of activities. This may be a result of selection methods and/or of the specific character of those sites.
What is the wider chronological and cultural context of the Yangtze Harbour flint assemblage?
Typologically, the Yangtze Harbour point assemblage ties in with the general Early and Middle Mesolithic situation as defined for the Netherlands (see e.g. Deeben and Arts 2005; Peeters and Niekus 2005; Verhart and Arts 2005; Verhart and Groenendijk 2005). The observed discrepancy between, on the one hand, part of the tool assemblage (specifically points and burins) and the radiocarbon dates from Trench 1, and, on the other hand, the length of time (circa 1500 14C years) suggested by the radiocarbon dates from Trench 2 indicates that the site represents a palimpsest formed over a long period of time. This makes the definition of chronological and cultural subunits within the Trench 1 and 2 assemblages extremely difficult.
Are there indications for (inter)regional contact/transport of finished goods and (raw) materials?
Most of the raw materials, flint as well as stone, were probably obtained locally or regionally from gravelly fluviatile deposits. No locations are known where such deposits surfaced while the site was occupied; one area which warrants further study in this respect is the North Sea. The glacial deposits in the Utrechtse Heuvelrug area in the central Netherlands are a possible source of primarily northern flint (Bryozoa flint), but the material may also have ended up in Meuse or Rhine deposits through erosion.One blade fragment and perhaps also one flake were of Wommersom quartzite. The only known source of this material (a fine, grey form of quartzite) is near the village of Wommersom, circa 5km east of Tienen in the Belgian province of Flemish Brabant. The distance in a straight line between Rotterdam-Yangtze Harbour and Wommersom is circa 147km; Rotterdam is at the north-western limit of the distribution area of Wommersom quartzite (see Figure 8.4, left, in Verhart and Groenendijk 2005). This means that the material had to be transported over a considerable distance before arriving at the dune at Yangtze Harbour, either through acquisition directly at the Wommersom source or through exchange with other hunter-gatherer groups who had access to the material. Considering this distance, the presence of only two artefacts on Wommersom quartzite at Yangtze Harbour is not surprising; analysis by van Oorsouw (1993) and others showed that there is a direct correlation between the percentage of debitage in an assemblage and the site’s proximity to a source.
Additional research questionsAre the analysis results for the three research trenches similar or different? Do all three trenches together represent one large cluster of archaeological material (find complex), or is each trench a sample of a distinct, spatially isolated, smaller cluster of different character and date?
The available data do not allow the formulation of an answer to this question. Some small differences between the assemblages from each trench were observed regarding for example raw material, technological aspects and point assemblage composition, but the significance of these differences is uncertain. The trenches represent only a small sample of what was probably a larger concentration of archaeological material which may or may not have been a palimpsest (see above). Whether this palimpsest represents a series of several small single-occupation sites or one large multiple-occupation site is yet impossible to determine.The results of the use-wear analysis could not provide unambiguous answers either. Trenches 1 and 2 are very similar in the ways flint objects were used. The artefacts from Trench 1 revealed more traces associated with the processing of siliceous plant matter, but the range of processed materials was equally large. It is therefore impossible to say whether what we are dealing with is one cluster of archaeological material, or rather two find complexes of similar function.

199
Notes
1. Lopendediep 28, 9712 NW Groningen, the Netherlands. E-mail: [email protected]. Stichting LAB, Van Steenisgebouw, Einsteinweg 2, 2333 CC Leiden, the Netherlands. E-mail: [email protected]. Hoffmanstraat 14, 4143 BE Leerdam, the Netherlands. E-mail: [email protected]. Jaap Enterprise, Nieuwendammerdijk 79, 1025 LD Amsterdam, the Netherlands. E-mail: [email protected]. Excluded from these totals were small natural pebbles and flint/stone fragments which are almost certainly recent intrusions.6. Nine pieces of flint were classified as SXX; these are all listed in the table for flint. The 227 fragments of natural stone (including Wommersom quartzite) classified as SVU are listed in the table for natural stone; these comprise 28 find numbers.7. More research is needed, however. A pilot study on North Sea flint nodules involving thin-section analysis, and possibly chemical analysis as well, is currently in preparation.8. We are most grateful to H. Huisman (Groningen University Museum) for his assistance in the identification of the natural stone assemblage.9. According to J.H.M. Peeters (Groningen Institute of Archaeology) some finds from the province of Noord-Brabant, the Netherlands, represent northern material (including Bryozoa flint) that probably arrived there as inclusions in drift ice (written communication, May 2013).10. A few artefacts were retrieved from botanical samples during analysis; these have been omitted from the present study.11. However, some of the unworked flint may be natural in origin or represent recent intrusive material.12. These are retouched and non-retouched blades as well as core preparation and rejuvenation pieces.13. The interpretation of use wear associated with fish processing greatly benefited from assistance rendered by Virginia García Díaz, who possesses extensive expertise on the subject and has carried out numerous experiments on the use of flint tools in fish processing (García Díaz 2009).14. Comparable degradation processes have been studied in depth by van der Heijden and Boon (1994).

200
Legend use wear, figs 4.20, 4.21, 4.22, and 4.23
AN Material of animal originBA BarkBO BoneBUT Meat and bone – butcheringDH Dry hideFBO Fresh boneFI FishHI HideHI + MIN Hide with mineral additionJE JetMEPL Medium-hard plant materialMU Various materialsPL Plant materialPSH Possible shootingSHL ShellSIPL Siliceous plant materialSOMA Soft materialSOPL Soft plant materialST StoneUN Unsure
Scraping
Impact
Transverse scraping/planing
Longitudinal cutting
Diagonal
Puncturing/boring
Black residue
Friction gloss Well-developed traces of wear Moderately developed traces of wear Slightly developed traces of wear
AN dierlijk materiaalBA bastBO beenBUT vlees en bot - slachtenDH droge huidFBO vers botFI visHI huidHI+MIN huid met minerale toevoegingJE gitMEPL middelhard plantaardig materiaalMU divers materiaalPL plantaardig materiaalPSH mogelijk schietenSHL schelpSIPL siliciumhoudende plantenSOMA zacht materiaalSOPL zacht plantaardig materiaalST steenUN onzeker
schrapen
impact
transversaal schrapen / schaven
longitudinaal snijden
diagonaal
boren
zwart residu
frictieglans
goed ontwikkelde sporen van gebruik
gemiddeld ontwikkelde sporen van gebruik
licht ontwikkelde sporen van gebruik
Legenda AN dierlijk materiaal BA bast BO been BUT vlees en bot – slachten DH droge huid FBO vers bot FI vis HI huid HI+MIN huid met minerale
toevoeging JE git MEPL middelhard plantaardig
materiaal MU divers materiaal SHL schelp SIPL siliciumhoudende planten SOMA zacht materiaal SOPL zacht plantaardig
materiaal PL plantaardig materiaal PSH mogelijk schieten ST steen UN onzeker
schrapen impact
transversaal schrapen / schaven longitudinaal snijden diagonaal boren zwart residu frictieglans
goed ontwikkelde sporen van gebruik
gemiddeld ontwikkelde sporen van gebruik
licht ontwikkelde sporen van gebruik
Bijlage 4.2 Legenda gebruikssporen

201
Fig. 5.1. Bone. a. Burnt; b. Unburnt.
5 Fauna
5.1 Introduction
The investigation of the river dune at Yangtze Harbour has produced a large quantity of zoological material. In total 16,423 remains of mammals, birds, fish, amphibians and reptiles were retrieved from the site, part of which were found in a burnt state. The material also includes five worked pieces of bone and antler.The current chapter describes adopted methods and procedures and continues by revealing the results of the research into the animal component of the Mesolithic material found at the dune site. This chapter will look into the range of represented species, the landscape and exploited ecozones, seasonal indications and the use of bone artefacts based on use-wear analysis. Where relevant, results will be presented for each trench separately, paying less attention to the finds from Trench 3 and the core samples as these were sparse. The chapter concludes by addressing the following research questions:
- Which species were the object of hunting, fowling, and fishing, and how were the various animal populations exploited?- What information does analysis of the animal remains reveal regarding the contemporary landscape and exploited ecozones?- What information can the animal remains provide with respect to seasonal activities?- Do the results from the three trenches differ in any way with regard to the aforementioned aspects?
J.T. Zeiler1 and D.C. Brinkhuizen2, in collaboration with D.L. Bekker3 and A. Verbaas4
5.2 Material and methods
The remains of mammals (excluding microfauna), birds and amphibians were analysed by Jørn Zeiler. Fish remains were studied by Dick Brinkhuizen, Dick Bekker analysed the small-mammal and reptilian remains. When possible, animal remains were identified to the level of species, genus, or family, using recent reference collections of the authors themselves and of the Groningen Institute of Archaeology (GIA). Use-wear analysis of the five worked pieces of bone and antler was carried out by Annemieke Verbaas.All remains were counted, the remains of mammals and birds were also weighed. Noteworthy characteristics (burning, modification, gnawing) were recorded. Data published by Bull and Payne (1982), Habermehl (1985), Iregren and Stenflo (1982), Mariezkurrena (1983) and Zeiler (1988) were used as a frame of reference for (slaughter) age assessment. A general impression of the animals’ size was obtained using measurements taken on remains of wild boar and of various species of fish, in case of the former by following the method published by von den Driesch (1976) and in the case of the fish by using data published by Brinkhuizen (1989). Besides calculating size on the basis of a range of established formulae, size was also estimated on the basis of skeletal parts of modern reference specimens.

202
Mesh size
2 mmMesh size
10 mmCore samples
mesh size 2 mmTotal
N % N % N % N %Mammals (excluding microfauna)
11481 69.9 614 3.7 13 0.1 12108 73,7
Microfauna 2685 16.3 18 0.1 6 - 2709 16,5Birds 738 4.5 61 0.4 1 - 800 4,9Fish 601 3.7 26 0.1 - - 627 3,8Amphibians 26 0.2 - - - - 26 0,2Reptiles 123 0.7 - - - - 123 0,7Other 28 0.2 2 - - - 30 0,2 Total 15682 95.5 721 4.4 20 0.1 16423 100
Table 5.1. Frequency of animal remains per category and collection method (percentages based on the total number of remains).
Data coding followed the AHR module for zoology.5 Analysis of the range of represented species was carried out for each trench separately. For the analysis of slaughter age, distribution of skeletal parts and size, however, information from all three trenches was combined as the data sets were too limited to allow a trench by trench analysis. When necessary the origin (trench) of respective skeletal parts are mentioned in the text and the tables.
5.3 Results
5.3.1 General
The great majority (95%) of the animal remains were retrieved from soil samples sieved at a 2mm mesh size (Table 5.1). Mammal remains dominated (90%), but those of microfauna species, especially small rodents, were also prominent (65% of identified remains; Table 5.2). Bird and fish remains were less numerous and there were even fewer remains of reptiles and amphibians. The category ‘other’ comprised remains of crab, molluscs and other marine organisms, such as sea urchins and acorn barnacles, all of recent origin. Also recent were ten fish remains, conspicuous by a lighter colour and fewer signs of damage.6 These two recent groups will be ignored in this chapter.In the 10mm sieve residue mammal remains also formed the largest group (88%), while microfauna remains were less common than in the 2mm sieve residue, which considering the larger mesh size was to be expected (Table 2). It also explains the absence of amphibians and reptiles, and the much smaller number of fish remains.
The ratio identified/unidentified is roughly similar for both the 2mm and the 10mm sieve residues; in both cases the percentage ‘identified’ was circa 15% (Table 5.3). However, the various animal categories differ considerably in this respect. Of the material retrieved from 2mm sieve residues, 10% of the mammal remains (excluding microfauna) and 15% of those of birds could be identified. In contrast, the percentage of identified fish remains was 75%. Remains retrieved from 10mm sieve residues display the same pattern: 8.5% of the mammal remains could be identified, against 56% of those of birds and 88.5% of fish remains.This pattern is undoubtedly the result of the relatively poor preservation and high degree of fragmentation of the mammal remains. A high degree of fragmentation may have multiple causes – butchering and consumption practices, post-depositional processes such as trampling and gnawing by animals – while burning may have been another important factor. For birds and fishes the percentage of burnt bone was very low, while it was much higher for mammal bone, respectively 24% (10mm) and up to 46% (2mm; Table 5.3). Burnt bone was almost always calcined, which indicates temperatures of 650-700°C. Such high temperatures will have intensified the fragmentation of remains substantially.
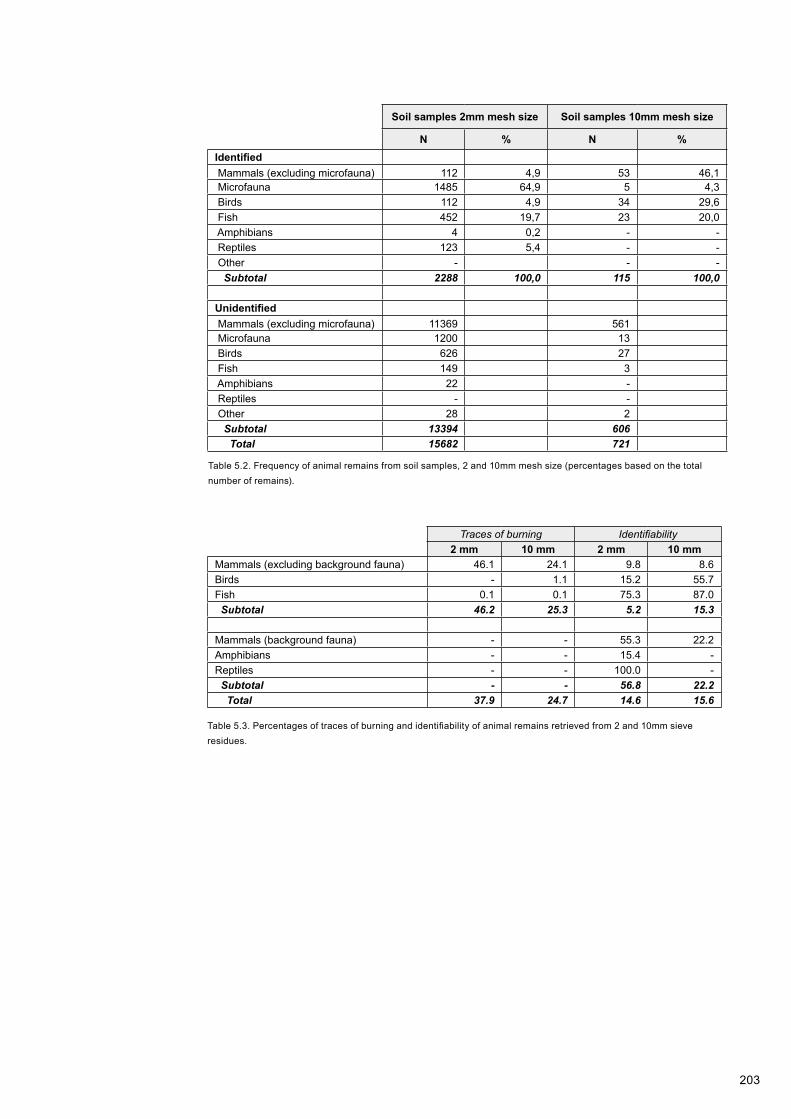
203
Soil samples 2mm mesh size Soil samples 10mm mesh size
N % N %Identified Mammals (excluding microfauna) 112 4,9 53 46,1 Microfauna 1485 64,9 5 4,3 Birds 112 4,9 34 29,6 Fish 452 19,7 23 20,0 Amphibians 4 0,2 - - Reptiles 123 5,4 - - Other - - - Subtotal 2288 100,0 115 100,0
Unidentified Mammals (excluding microfauna) 11369 561 Microfauna 1200 13 Birds 626 27 Fish 149 3 Amphibians 22 - Reptiles - - Other 28 2 Subtotal 13394 606 Total 15682 721
Table 5.2. Frequency of animal remains from soil samples, 2 and 10mm mesh size (percentages based on the total number of remains).
Traces of burning Identifiability2 mm 10 mm 2 mm 10 mm
Mammals (excluding background fauna) 46.1 24.1 9.8 8.6Birds - 1.1 15.2 55.7Fish 0.1 0.1 75.3 87.0 Subtotal 46.2 25.3 5.2 15.3
Mammals (background fauna) - - 55.3 22.2Amphibians - - 15.4 -Reptiles - - 100.0 - Subtotal - - 56.8 22.2 Total 37.9 24.7 14.6 15.6
Table 5.3. Percentages of traces of burning and identifiability of animal remains retrieved from 2 and 10mm sieve residues.

204
Fig. 5.2. Smew. Male (top) and female (bottom).
Fig. 5.3. Water rail.
5.3.2 Trench 1
5.3.2.1 The range of species: game animals and fish
Game animalsOne of the most striking aspects of the zoological assemblage was the wide range of species present, despite the fact that only a small part of the remains could be identified. With at least 18 identified species, birds were the best represented category, followed by fish (at least 12 species) and mammals (7 species; see Tables 5.4 and 5.5).The majority of identified mammal remains derived from large game species: wild boar (Sus scrofa), red deer (Cervus elaphus), and roe deer (Capreolus capreolus). The other mammals were all fur-bearing species: beaver (Castor fiber), otter (Lutra lutra), European polecat (Mustela putorius), and weasel (Mustela nivalis).Among the bird species waterfowl formed the largest group: ducks, particularly mallard (Anas platyrhynchos), and common teal or garganey (Anas crecca/A. querquedula). Other species were northern shoveler (Anas clypeata), diving duck species (Aythya sp.; possibly tufted duck, Aythya fuligula), common goldeneye (Bucephala clangula), and smew (Mergellus albellus; Fig. 5.2).Besides ducks, other species of waterfowl were identified as well: goose (Anser sp.), coot (Fulica atra), and common moorhen (Gallinula chloropus). The second category among bird species were marsh birds: great bittern (Botaurus stellaris), grey heron (Ardea cinerea), and water rail (Rallus aquaticus), the latter (Fig. 5.3) represented by no fewer than 17 remains from at least three different individuals. The third category was formed by woodland species: northern goshawk (Accipiter gentilis), common wood pigeon (Columba palumbus), woodcock (Scolopax rusticola), and one small songbird, a finch (Fringillidae). The bone fragment of a gull (Larus sp.) reflected the site’s proximity to the coast. Although the exact species could not be determined, its size was comparable to that of a herring gull (Larus argentatus).7

205
2mm 10mmN % Weight
in gN Weight
in g
Mammals (identified) Red deer (Cervus elaphus) 2 0.8 5 13.9 Roe deer (Capreolus capreolus) 1 0.4 2 2.7 Wild boar (Sus scrofa) 6 2.6 2 16.3 Beaver (Castor fiber) - - 2 25.2 Otter (Lutra lutra) 1 0.2 5 7.2 European polecat (Mustela putorius) 3 0.3 - - Weasel (Mustela nivalis) 1 0.1 - - Small carnivore (Carnivora) 2 0.5 - - Total 17 4.9 16 65.3
Mammals (unidentified) Small mammal 12 1.6 5 4.1 Medium-sized mammal - - 10 12.0 Mammal, indet. 2974 150.6 55 29.3 Total 2986 152.2 70 45.4
Birds (identified) Great bittern (Botaurus stellaris) 1 1.2 0.1 1 0.6 Grey heron (Ardea cinerea) - - - 1 0.5 Goose (Anser sp.) - - - 1 1.2 Mallard (Anas platyrhynchos) 13 15.7 5.2 14 14.7 Northern shoveler (Anas clypeata) 1 1.2 0.1 4 3.2 Common teal/-/garganey (Anas crecca/A. querquedula) 7 7.2 0.8 4 1.8
Common goldeneye (Bucephula clangula) 1 1.2 0.5 - - Smew (Mergellus albellus) 1 1.2 0.3 - - Diving duck sp. (Aythya sp.) - - - 1 0.6 Duck species (Anatidae) 26 31.3 4.4 - - Coot (Fulica atra) 2 2.4 0.3 1 0.2 Common moorhern (Gallinula chloropus) 5 6.0 0.1 1 0.2 Water rail (Rallus aquaticus) 17 20.5 1.1 - - Wader sp. (Charadriidae/Scolopacidae) - - - 1 0.2 Gull (Larus sp.) 1 1.2 0.9 - - Northern goshawk (Accipiter gentilis) - - - 1 1.3 Common wood pigeon (Columba palumbus) 7 8.4 0.7 - - Eurasian woodcock (Scolopax rusticola) 1 1.2 - - - Small songbird (Passeriformes) 1 1.2 - - - Total 84 100.0 14.5 30 24.5
Birds (unidentified) Indet. 406 20.5 26 5.3 Total 406 20.5 26 5.3
Table 5.4. Frequency and weight of mammal and bird bone retrieved from 2mm and 10mm sieve residues, Trench 1 (excluding background fauna). Because of the low frequencies, no percentages were calculated for respectively mammals (2mm) and all material (10mm).

206
2mm 10mmN1 % N2 % N2
Fish (identified) Freshwater species Bream (Abramis brama) 9 2.8 9 4,1 - Roach (Rutilus rutilus) 2 0.6 2 0.9 - Tench (Tinca tinca) 5 1.6 5 2.2 - Carp species (Cyprinidae) 100 31.7 51 23.3 - Pike (Esox lucius) 106 33.5 104 47.5 17 Perch (Perca fluviatilis) 72 22.8 26 11.9 1 Subtotal 294 93.0 197 90.0 18
Migratory species Atlantic sturgeon (Acipenser oxyrinchus) 1 0.3 1 0.5 - Eel (Anguilla anguilla) 6 1.9 6 2.7 - Salmon/sea trout (Salmo salar/S. trutta) 1 0.3 1 0.5 - Twaite shad/allis shad (Alosa fallax/A. alosa) 1 0.3 1 0.5 - Plaice/flounder (Pleuronectes platessa/Platichthys flesus) 7 2.2 7 3.2 - Subtotal 16 5.1 16 7.3 -
Marine species Spotted ray (Raja montagui) 1 0.3 1 0.5 - Turbot (Scophthalmus maximus) 1 0.3 1 0.5 1 Right-eyed flatfishes (Pleuronectidae) 4 1.3 4 1.8 - Subtotal 6 1.9 6 2.7 1 Total 316 100.0 219 100.0 19
Fish ( unidentified) Indet. 127 127 3 Total 127 127 3
Table 5.5. Number of fish remains, 2mm and 10mm sieve residues, Trench 1. N1 = Number of remains including scales; N2 = Number of remains excluding scales (no scales in 10mm residue). Because of the low frequencies, no percentages were calculated for 10mm residues.
FishMost of the identified fish bones came from freshwater species: bream (Abramis brama), roach (Rutilus rutilus), tench (Tinca tinca), carp species (Cyprinidae), pike (Esox lucius), and perch (Perca fluviatilis). After pike, carp species appear to be the most common fish, however this impression is largely the result of the large number of carp scales. The same applies to perch. As fish species differ significantly in the durability of their scales – perch scales tend to survive well – this factor may introduce some bias in the observed ratios. Scales were therefore excluded from the totals (see Table 5.5, column N2).8 After this correction the most common fish species turned out to be pike, followed by carp species and perch.
Identified anadromous/catadromous fish species (i.e. fish that migrate between salt and freshwater) included Atlantic sturgeon (Acipenser oxyrinchus), eel (Anguilla anguilla), salmon/sea trout (Salmo salar/S. trutta), and twaite shad/allis shad (Alosa fallax/A. alosa). Based on their size, seven of the eleven identified remains of plaice/flounder/dab (Pleuronectidae) could be more specifically assigned to plaice/flounder (Pleuronectes platessa/Platichthys flesus).9 Of these two species plaice lives exclusively in salt water, while flounder migrates between salt and fresh water. The fact that most of the identified remains belonged to freshwater or migrating fish indicates that freshwater fishing took place, with flounder probably being part of the catch. The most unusual species was Atlantic sturgeon, identified by part of its scutes.10 Until quite recently remains of sturgeon from (pre) historic contexts were automatically classified as European sturgeon (Acipenser sturio). Recently, however, evidence has been accumulating that both species have in fact co-existed in Western Europe since prehistoric times.11 Previously the oldest identified remains of Acipenser oxyrinchus were Neolithic in date (Vlaardingen site), but the Yangtze Harbour material proves that the species was common to these waters at a much earlier date, in the Early to Middle Mesolithic period.12

207
Fig. 5.4. Spotted ray (male).
2mm 10mmMammals Water vole (Arvicola terrestris) 1042 3 Root vole (Microtus oeconomus) 7 - Common vole/field vole (Microtus arvalis/M. agrestis) 2 - Common vole/root vole (Microtus arvalis/M. oeconomus) 2 - Bank vole (Clethrionomys glareolus) 1 - Small rodent (Rodentia) 584 7 Mole (Talpa europaea) 6 1 Subtotal 1644 11
Amphibians Marsh frog (Rana ridibunda/ R. esculenta) 2 - Frog/toad (Anura) 19 - Subtotal 21 -
Reptiles Grass snake (Natrix natrix) 118 - Subtotal 118 - Total 1783 11
Table 5.6. Number of remains (NR) of background fauna, 2 and 10mm sieve residues, Trench 1.
The marine fish assemblage included yet another remarkable species, spotted ray (Raja montagui; Fig. 5.4). Unlike turbot (Scophthalmus maximus), spotted ray has not been identified earlier in a Dutch archaeological context.
5.3.2.2 Background fauna
The background fauna assemblage largely consisted of small rodents, with water vole (Arvicola amphibius) as the dominant species (Table 5.6). The remains (molars and skull fragments) derived from at least 159 individuals. Other identified vole species were root vole (Microtus oeconomus), bank vole (Myodes glareolus) and common vole/field vole (Microtus arvalis/M. agrestis).
Those remains of which the classification could not be narrowed down further than to ‘small rodent’ mostly consisted of incisors, but there were some postcranial (non-skull) small bones as well. Because of the numerical preponderance of water vole, it is likely that these ‘small rodent’ bones derive from the same species. The fact that one single species dominated the small rodent assemblage suggests that we are in fact dealing with the local rodent fauna, with a part of the remains possibly deriving from owl pellets. Another small mammal identified in the assemblage was the mole (Talpa europaea), which was represented by at least 13 individuals.
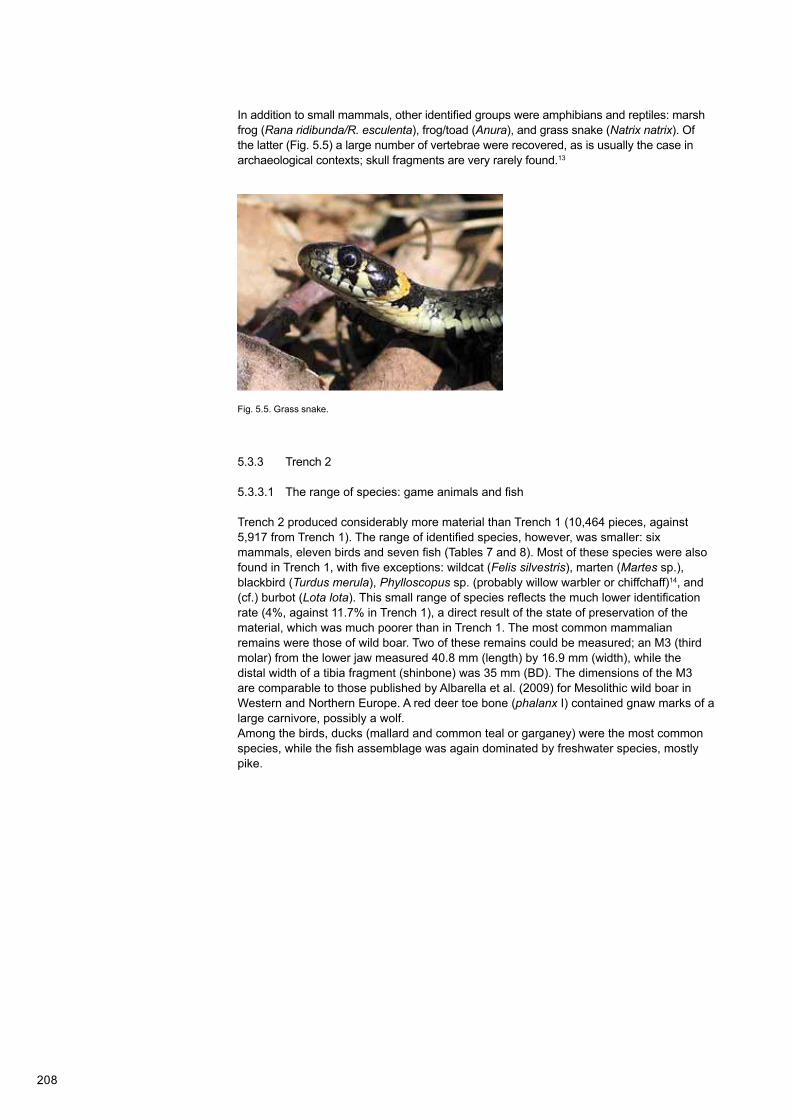
208
Fig. 5.5. Grass snake.
In addition to small mammals, other identified groups were amphibians and reptiles: marsh frog (Rana ridibunda/R. esculenta), frog/toad (Anura), and grass snake (Natrix natrix). Of the latter (Fig. 5.5) a large number of vertebrae were recovered, as is usually the case in archaeological contexts; skull fragments are very rarely found.13
5.3.3 Trench 2
5.3.3.1 The range of species: game animals and fish
Trench 2 produced considerably more material than Trench 1 (10,464 pieces, against 5,917 from Trench 1). The range of identified species, however, was smaller: six mammals, eleven birds and seven fish (Tables 7 and 8). Most of these species were also found in Trench 1, with five exceptions: wildcat (Felis silvestris), marten (Martes sp.), blackbird (Turdus merula), Phylloscopus sp. (probably willow warbler or chiffchaff)14, and (cf.) burbot (Lota lota). This small range of species reflects the much lower identification rate (4%, against 11.7% in Trench 1), a direct result of the state of preservation of the material, which was much poorer than in Trench 1. The most common mammalian remains were those of wild boar. Two of these remains could be measured; an M3 (third molar) from the lower jaw measured 40.8 mm (length) by 16.9 mm (width), while the distal width of a tibia fragment (shinbone) was 35 mm (BD). The dimensions of the M3 are comparable to those published by Albarella et al. (2009) for Mesolithic wild boar in Western and Northern Europe. A red deer toe bone (phalanx I) contained gnaw marks of a large carnivore, possibly a wolf.Among the birds, ducks (mallard and common teal or garganey) were the most common species, while the fish assemblage was again dominated by freshwater species, mostly pike.
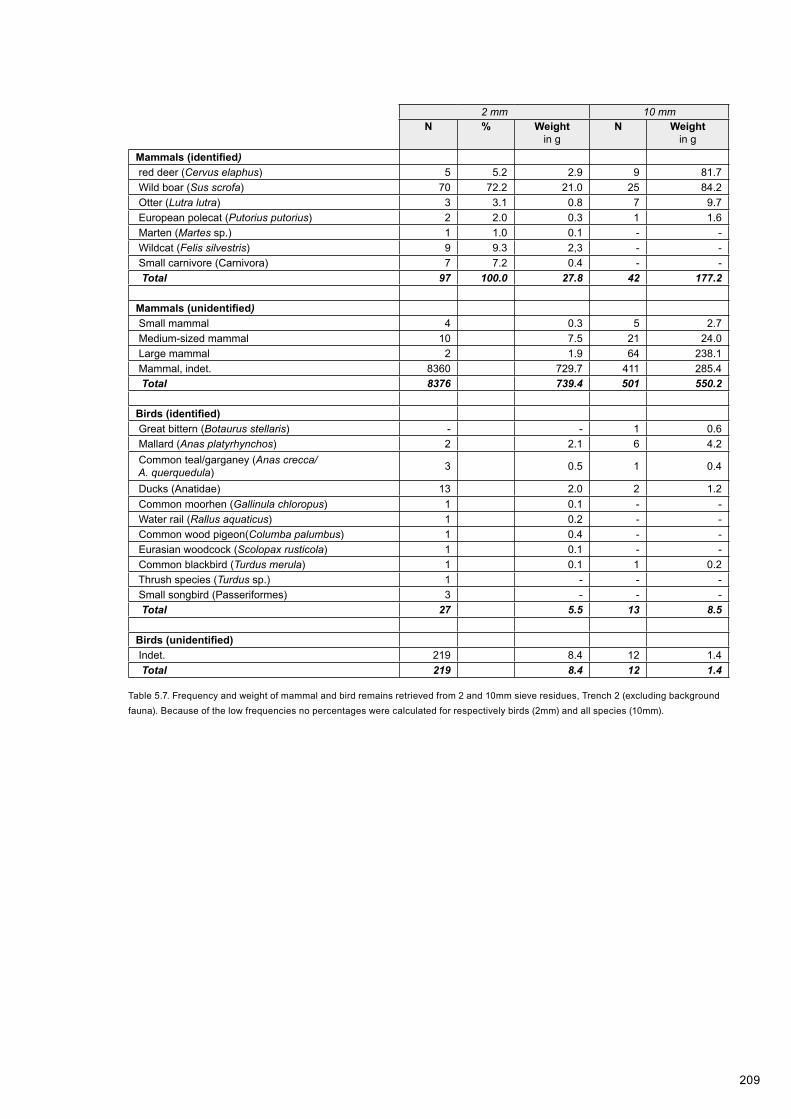
209
2 mm 10 mmN % Weight
in gN Weight
in g
Mammals (identified) red deer (Cervus elaphus) 5 5.2 2.9 9 81.7 Wild boar (Sus scrofa) 70 72.2 21.0 25 84.2 Otter (Lutra lutra) 3 3.1 0.8 7 9.7 European polecat (Putorius putorius) 2 2.0 0.3 1 1.6 Marten (Martes sp.) 1 1.0 0.1 - - Wildcat (Felis silvestris) 9 9.3 2,3 - - Small carnivore (Carnivora) 7 7.2 0.4 - - Total 97 100.0 27.8 42 177.2
Mammals (unidentified) Small mammal 4 0.3 5 2.7 Medium-sized mammal 10 7.5 21 24.0 Large mammal 2 1.9 64 238.1 Mammal, indet. 8360 729.7 411 285.4 Total 8376 739.4 501 550.2
Birds (identified) Great bittern (Botaurus stellaris) - - 1 0.6 Mallard (Anas platyrhynchos) 2 2.1 6 4.2 Common teal/garganey (Anas crecca/ A. querquedula) 3 0.5 1 0.4
Ducks (Anatidae) 13 2.0 2 1.2 Common moorhen (Gallinula chloropus) 1 0.1 - - Water rail (Rallus aquaticus) 1 0.2 - - Common wood pigeon(Columba palumbus) 1 0.4 - - Eurasian woodcock (Scolopax rusticola) 1 0.1 - - Common blackbird (Turdus merula) 1 0.1 1 0.2 Thrush species (Turdus sp.) 1 - - - Small songbird (Passeriformes) 3 - - - Total 27 5.5 13 8.5
Birds (unidentified) Indet. 219 8.4 12 1.4 Total 219 8.4 12 1.4
Table 5.7. Frequency and weight of mammal and bird remains retrieved from 2 and 10mm sieve residues, Trench 2 (excluding background fauna). Because of the low frequencies no percentages were calculated for respectively birds (2mm) and all species (10mm).

210
2mm 10mmN1 % N2 % N2
Fish (identified) Freshwater species Tench (Tinca tinca) 1 0.8 1 1.9 - Carp species (Cyprinidae) 30 24.6 6 11.5 - Pike (Esox lucius) 30 24.6 28 53.8 1 Perch (Perca fluviatilis) 50 41.0 4 7.7 2 cf. Burbot (Lota lota) 1 0.8 1 1.9 - Subtotal 112 91.8 42 80.8 3
Migratory species Eel (Anguilla anguilla) 2 1.6 2 3.8 Allis shad (Alosa alosa) 1 0.8 1 1.9 Twaite shad/allis shad (Alosa fallax/ A. alosa) 1 0.8 1 1.9 Plaice/flounder (Pleuronectes platessa/Platichthys flesus) 4 3.3 4 7.7
Subtotal 8 6.6 8 15.4 -
Marine species Right-eyed flatfishes (Pleuronectidae) 2 1.6 2 3.8 Subtotal 2 1.6 2 3.8 - Total 122 100.0 52 100.0 3
Fish (unidentified) Indet. 22 22 - Total 22 22 -
Table 5.8. Number of fish remains, 2 and 10mm sieve residues, Trench 2. N1 = Number of remains including scales; N2 = Number of remains excluding scales (no scales in 10mm mesh size residue). Because of the low frequencies, no percentages were calcula-ted for 10mm residues.
5.3.3.2 Background fauna
The share of microfauna remains in Trench 2 was considerably smaller than proved to be the case for Trench 1, however almost all species identified in Trench 1 were also found in Trench 2. The only species missing in Trench 2 was bank vole (Table 5.9). Remains of water vole were again the most common, with at least 86 individuals identified. Mole was present with remains of at least eleven individuals.
5.3.4 Trench 3
Trench 3 produced only a few dozen animal remains, mostly fish (Table 5.10). Fish was also the only category of which some species could be identified. All three subcategories – freshwater, migrating, and marine species – were represented. In general, fish remains were better preserved than those of mammals and birds.
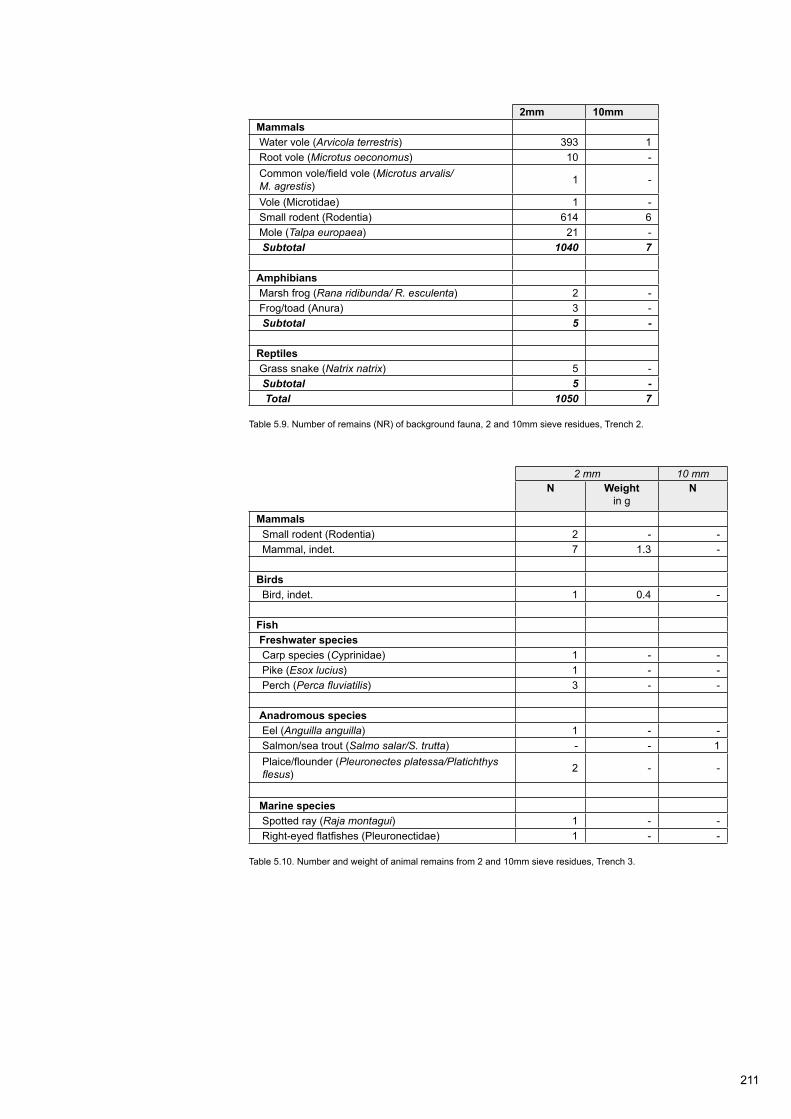
211
2mm 10mmMammals Water vole (Arvicola terrestris) 393 1 Root vole (Microtus oeconomus) 10 - Common vole/field vole (Microtus arvalis/ M. agrestis) 1 -
Vole (Microtidae) 1 - Small rodent (Rodentia) 614 6 Mole (Talpa europaea) 21 - Subtotal 1040 7
Amphibians Marsh frog (Rana ridibunda/ R. esculenta) 2 - Frog/toad (Anura) 3 - Subtotal 5 -
Reptiles Grass snake (Natrix natrix) 5 - Subtotal 5 - Total 1050 7
Table 5.9. Number of remains (NR) of background fauna, 2 and 10mm sieve residues, Trench 2.
2 mm 10 mmN Weight
in gN
Mammals Small rodent (Rodentia) 2 - - Mammal, indet. 7 1.3 -
Birds Bird, indet. 1 0.4 -
Fish Freshwater species Carp species (Cyprinidae) 1 - - Pike (Esox lucius) 1 - - Perch (Perca fluviatilis) 3 - -
Anadromous species Eel (Anguilla anguilla) 1 - - Salmon/sea trout (Salmo salar/S. trutta) - - 1 Plaice/flounder (Pleuronectes platessa/Platichthys flesus) 2 - -
Marine species Spotted ray (Raja montagui) 1 - - Right-eyed flatfishes (Pleuronectidae) 1 - -
Table 5.10. Number and weight of animal remains from 2 and 10mm sieve residues, Trench 3.
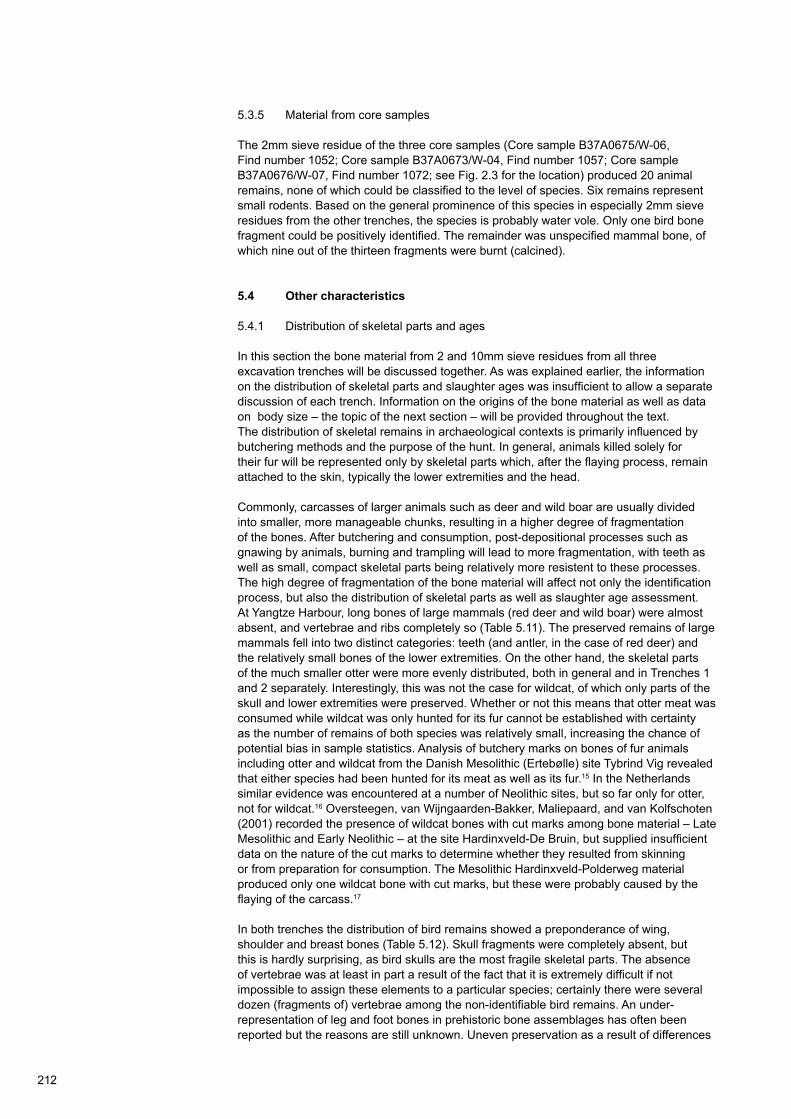
212
5.3.5 Material from core samples
The 2mm sieve residue of the three core samples (Core sample B37A0675/W-06, Find number 1052; Core sample B37A0673/W-04, Find number 1057; Core sample B37A0676/W-07, Find number 1072; see Fig. 2.3 for the location) produced 20 animal remains, none of which could be classified to the level of species. Six remains represent small rodents. Based on the general prominence of this species in especially 2mm sieve residues from the other trenches, the species is probably water vole. Only one bird bone fragment could be positively identified. The remainder was unspecified mammal bone, of which nine out of the thirteen fragments were burnt (calcined).
5.4 Other characteristics
5.4.1 Distribution of skeletal parts and ages
In this section the bone material from 2 and 10mm sieve residues from all three excavation trenches will be discussed together. As was explained earlier, the information on the distribution of skeletal parts and slaughter ages was insufficient to allow a separate discussion of each trench. Information on the origins of the bone material as well as data on body size – the topic of the next section – will be provided throughout the text.The distribution of skeletal remains in archaeological contexts is primarily influenced by butchering methods and the purpose of the hunt. In general, animals killed solely for their fur will be represented only by skeletal parts which, after the flaying process, remain attached to the skin, typically the lower extremities and the head.
Commonly, carcasses of larger animals such as deer and wild boar are usually divided into smaller, more manageable chunks, resulting in a higher degree of fragmentation of the bones. After butchering and consumption, post-depositional processes such as gnawing by animals, burning and trampling will lead to more fragmentation, with teeth as well as small, compact skeletal parts being relatively more resistent to these processes. The high degree of fragmentation of the bone material will affect not only the identification process, but also the distribution of skeletal parts as well as slaughter age assessment. At Yangtze Harbour, long bones of large mammals (red deer and wild boar) were almost absent, and vertebrae and ribs completely so (Table 5.11). The preserved remains of large mammals fell into two distinct categories: teeth (and antler, in the case of red deer) and the relatively small bones of the lower extremities. On the other hand, the skeletal parts of the much smaller otter were more evenly distributed, both in general and in Trenches 1 and 2 separately. Interestingly, this was not the case for wildcat, of which only parts of the skull and lower extremities were preserved. Whether or not this means that otter meat was consumed while wildcat was only hunted for its fur cannot be established with certainty as the number of remains of both species was relatively small, increasing the chance of potential bias in sample statistics. Analysis of butchery marks on bones of fur animals including otter and wildcat from the Danish Mesolithic (Ertebølle) site Tybrind Vig revealed that either species had been hunted for its meat as well as its fur.15 In the Netherlands similar evidence was encountered at a number of Neolithic sites, but so far only for otter, not for wildcat.16 Oversteegen, van Wijngaarden-Bakker, Maliepaard, and van Kolfschoten (2001) recorded the presence of wildcat bones with cut marks among bone material – Late Mesolithic and Early Neolithic – at the site Hardinxveld-De Bruin, but supplied insufficient data on the nature of the cut marks to determine whether they resulted from skinning or from preparation for consumption. The Mesolithic Hardinxveld-Polderweg material produced only one wildcat bone with cut marks, but these were probably caused by the flaying of the carcass.17
In both trenches the distribution of bird remains showed a preponderance of wing, shoulder and breast bones (Table 5.12). Skull fragments were completely absent, but this is hardly surprising, as bird skulls are the most fragile skeletal parts. The absence of vertebrae was at least in part a result of the fact that it is extremely difficult if not impossible to assign these elements to a particular species; certainly there were several dozen (fragments of) vertebrae among the non-identifiable bird remains. An under-representation of leg and foot bones in prehistoric bone assemblages has often been reported but the reasons are still unknown. Uneven preservation as a result of differences
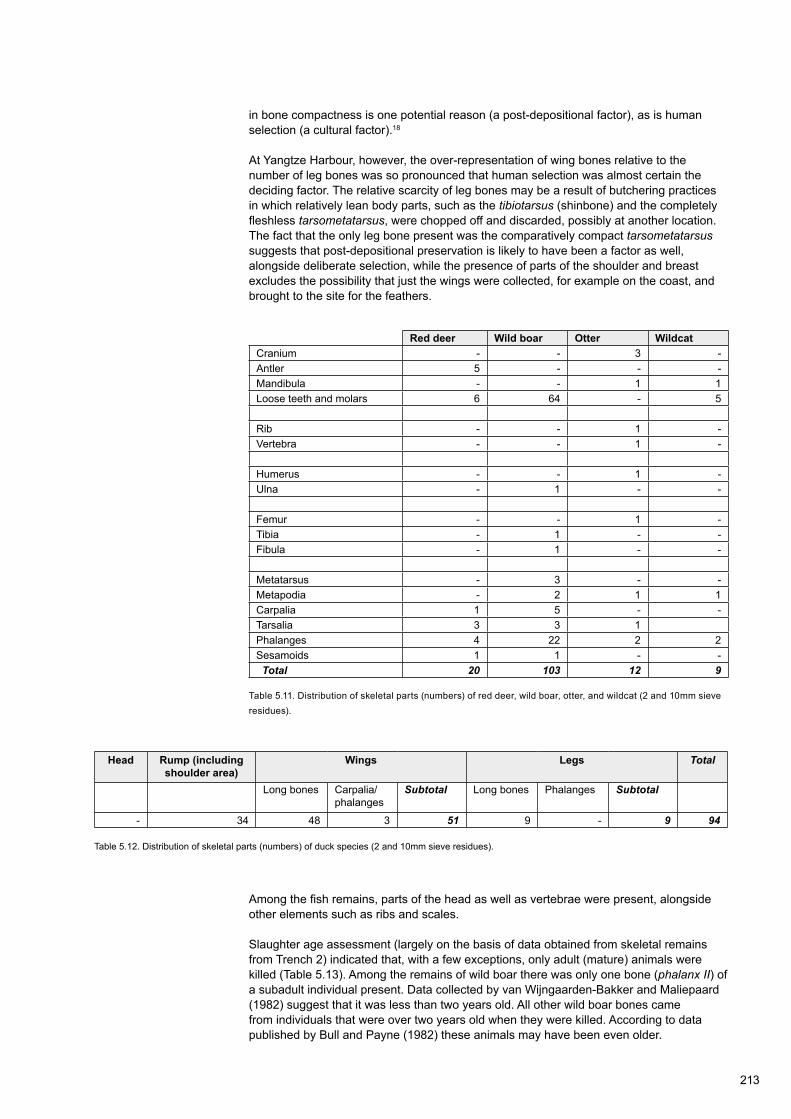
213
Red deer Wild boar Otter WildcatCranium - - 3 -Antler 5 - - -Mandibula - - 1 1Loose teeth and molars 6 64 - 5
Rib - - 1 -Vertebra - - 1 -
Humerus - - 1 -Ulna - 1 - -
Femur - - 1 -Tibia - 1 - -Fibula - 1 - -
Metatarsus - 3 - -Metapodia - 2 1 1Carpalia 1 5 - -Tarsalia 3 3 1Phalanges 4 22 2 2Sesamoids 1 1 - - Total 20 103 12 9
Table 5.11. Distribution of skeletal parts (numbers) of red deer, wild boar, otter, and wildcat (2 and 10mm sieve residues).
Head Rump (including shoulder area)
Wings Legs Total
Long bones Carpalia/ phalanges
Subtotal Long bones Phalanges Subtotal
- 34 48 3 51 9 - 9 94
Table 5.12. Distribution of skeletal parts (numbers) of duck species (2 and 10mm sieve residues).
in bone compactness is one potential reason (a post-depositional factor), as is human selection (a cultural factor).18
At Yangtze Harbour, however, the over-representation of wing bones relative to the number of leg bones was so pronounced that human selection was almost certain the deciding factor. The relative scarcity of leg bones may be a result of butchering practices in which relatively lean body parts, such as the tibiotarsus (shinbone) and the completely fleshless tarsometatarsus, were chopped off and discarded, possibly at another location. The fact that the only leg bone present was the comparatively compact tarsometatarsus suggests that post-depositional preservation is likely to have been a factor as well, alongside deliberate selection, while the presence of parts of the shoulder and breast excludes the possibility that just the wings were collected, for example on the coast, and brought to the site for the feathers.
Among the fish remains, parts of the head as well as vertebrae were present, alongside other elements such as ribs and scales.
Slaughter age assessment (largely on the basis of data obtained from skeletal remains from Trench 2) indicated that, with a few exceptions, only adult (mature) animals were killed (Table 5.13). Among the remains of wild boar there was only one bone (phalanx II) of a subadult individual present. Data collected by van Wijngaarden-Bakker and Maliepaard (1982) suggest that it was less than two years old. All other wild boar bones came from individuals that were over two years old when they were killed. According to data published by Bull and Payne (1982) these animals may have been even older.
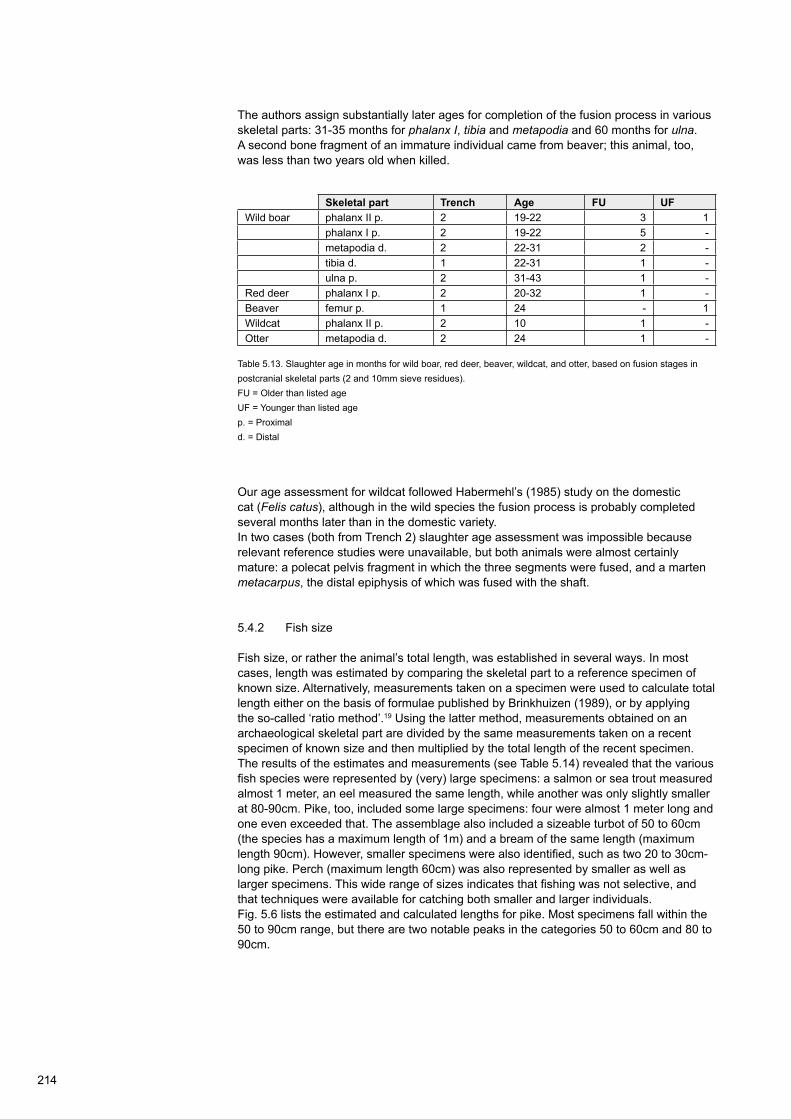
214
Skeletal part Trench Age FU UFWild boar phalanx II p. 2 19-22 3 1
phalanx I p. 2 19-22 5 -metapodia d. 2 22-31 2 -tibia d. 1 22-31 1 -ulna p. 2 31-43 1 -
Red deer phalanx I p. 2 20-32 1 -Beaver femur p. 1 24 - 1Wildcat phalanx II p. 2 10 1 -Otter metapodia d. 2 24 1 -
Table 5.13. Slaughter age in months for wild boar, red deer, beaver, wildcat, and otter, based on fusion stages in postcranial skeletal parts (2 and 10mm sieve residues). FU = Older than listed ageUF = Younger than listed agep. = Proximald. = Distal
Our age assessment for wildcat followed Habermehl’s (1985) study on the domestic cat (Felis catus), although in the wild species the fusion process is probably completed several months later than in the domestic variety.In two cases (both from Trench 2) slaughter age assessment was impossible because relevant reference studies were unavailable, but both animals were almost certainly mature: a polecat pelvis fragment in which the three segments were fused, and a marten metacarpus, the distal epiphysis of which was fused with the shaft.
5.4.2 Fish size
Fish size, or rather the animal’s total length, was established in several ways. In most cases, length was estimated by comparing the skeletal part to a reference specimen of known size. Alternatively, measurements taken on a specimen were used to calculate total length either on the basis of formulae published by Brinkhuizen (1989), or by applying the so-called ‘ratio method’.19 Using the latter method, measurements obtained on an archaeological skeletal part are divided by the same measurements taken on a recent specimen of known size and then multiplied by the total length of the recent specimen. The results of the estimates and measurements (see Table 5.14) revealed that the various fish species were represented by (very) large specimens: a salmon or sea trout measured almost 1 meter, an eel measured the same length, while another was only slightly smaller at 80-90cm. Pike, too, included some large specimens: four were almost 1 meter long and one even exceeded that. The assemblage also included a sizeable turbot of 50 to 60cm (the species has a maximum length of 1m) and a bream of the same length (maximum length 90cm). However, smaller specimens were also identified, such as two 20 to 30cm-long pike. Perch (maximum length 60cm) was also represented by smaller as well as larger specimens. This wide range of sizes indicates that fishing was not selective, and that techniques were available for catching both smaller and larger individuals.Fig. 5.6 lists the estimated and calculated lengths for pike. Most specimens fall within the 50 to 90cm range, but there are two notable peaks in the categories 50 to 60cm and 80 to 90cm.
The authors assign substantially later ages for completion of the fusion process in various skeletal parts: 31-35 months for phalanx I, tibia and metapodia and 60 months for ulna.A second bone fragment of an immature individual came from beaver; this animal, too, was less than two years old when killed.
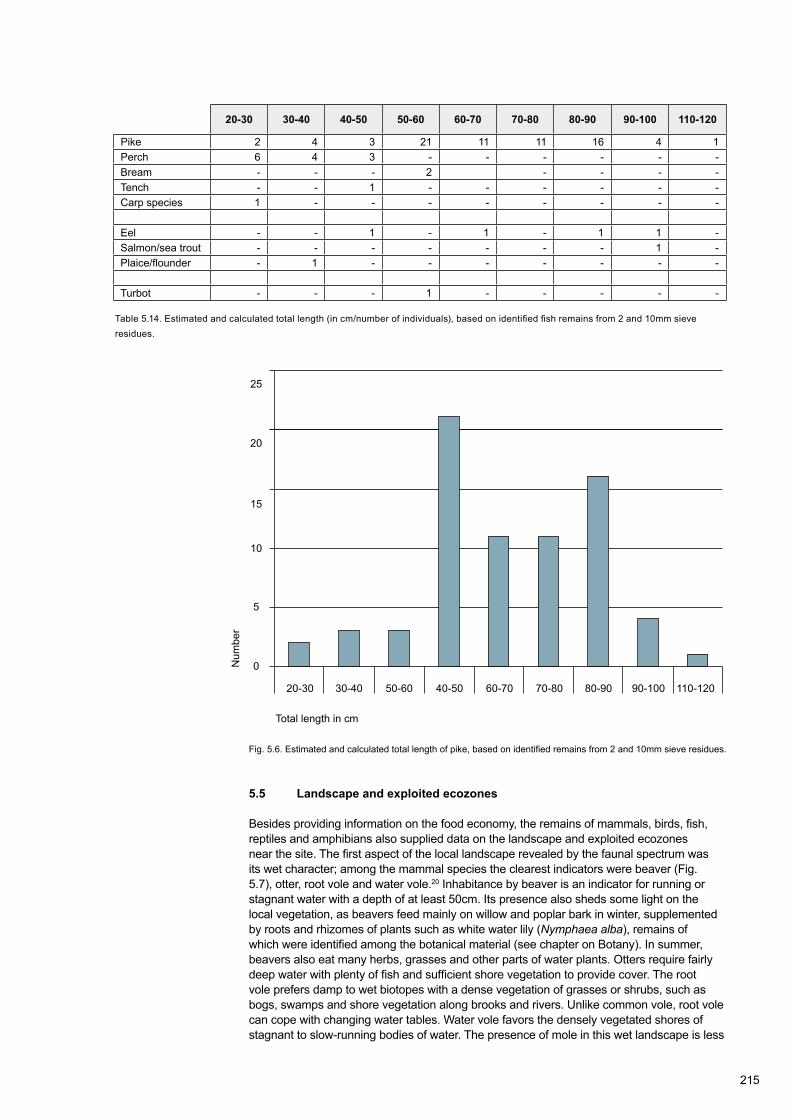
215
20-30 30-40 40-50 50-60 60-70 70-80 80-90 90-100 110-120
Pike 2 4 3 21 11 11 16 4 1Perch 6 4 3 - - - - - -Bream - - - 2 - - - -Tench - - 1 - - - - - -Carp species 1 - - - - - - - -
Eel - - 1 - 1 - 1 1 -Salmon/sea trout - - - - - - - 1 -Plaice/flounder - 1 - - - - - - -
Turbot - - - 1 - - - - -
Table 5.14. Estimated and calculated total length (in cm/number of individuals), based on identified fish remains from 2 and 10mm sieve residues.
Fig. 5.6. Estimated and calculated total length of pike, based on identified remains from 2 and 10mm sieve residues.
25
20
15
10
5
0
20-30 30-40 40-5050-60 60-70 70-80 80-90 90-100 110-120
Total length in cm
Num
ber
5.5 Landscape and exploited ecozones
Besides providing information on the food economy, the remains of mammals, birds, fish, reptiles and amphibians also supplied data on the landscape and exploited ecozones near the site. The first aspect of the local landscape revealed by the faunal spectrum was its wet character; among the mammal species the clearest indicators were beaver (Fig. 5.7), otter, root vole and water vole.20 Inhabitance by beaver is an indicator for running or stagnant water with a depth of at least 50cm. Its presence also sheds some light on the local vegetation, as beavers feed mainly on willow and poplar bark in winter, supplemented by roots and rhizomes of plants such as white water lily (Nymphaea alba), remains of which were identified among the botanical material (see chapter on Botany). In summer, beavers also eat many herbs, grasses and other parts of water plants. Otters require fairly deep water with plenty of fish and sufficient shore vegetation to provide cover. The root vole prefers damp to wet biotopes with a dense vegetation of grasses or shrubs, such as bogs, swamps and shore vegetation along brooks and rivers. Unlike common vole, root vole can cope with changing water tables. Water vole favors the densely vegetated shores of stagnant to slow-running bodies of water. The presence of mole in this wet landscape is less
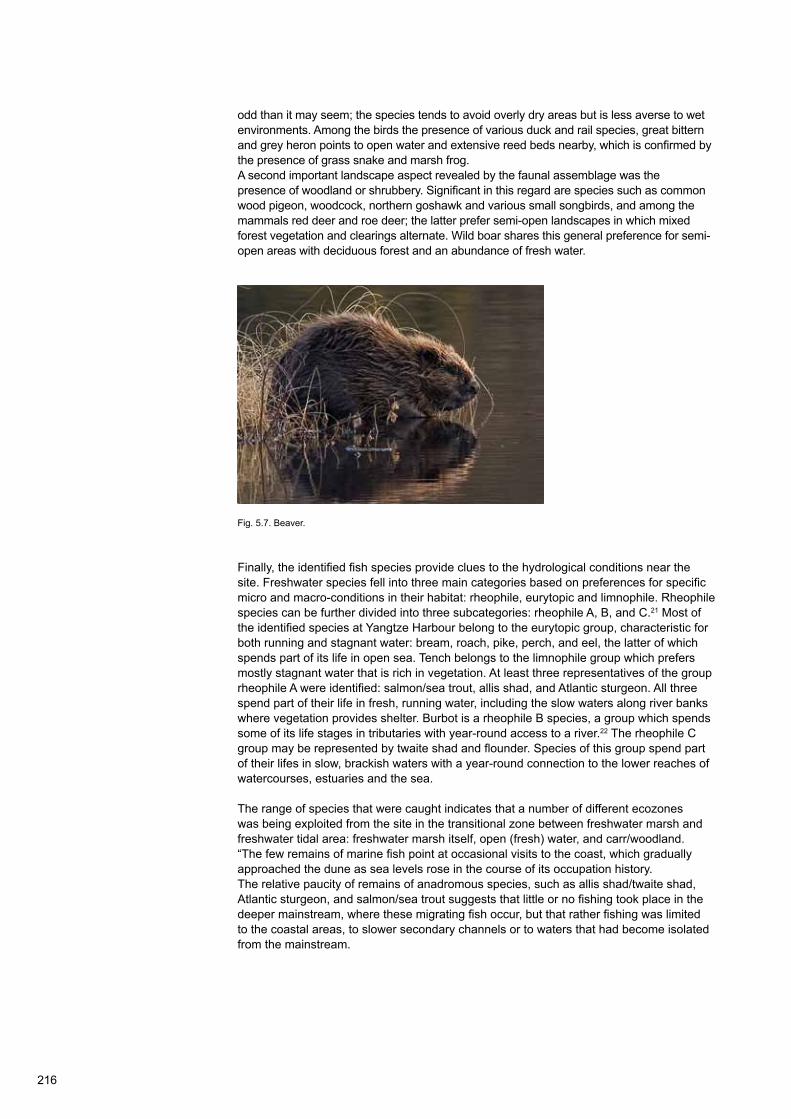
216
Fig. 5.7. Beaver.
odd than it may seem; the species tends to avoid overly dry areas but is less averse to wet environments. Among the birds the presence of various duck and rail species, great bittern and grey heron points to open water and extensive reed beds nearby, which is confirmed by the presence of grass snake and marsh frog.A second important landscape aspect revealed by the faunal assemblage was the presence of woodland or shrubbery. Significant in this regard are species such as common wood pigeon, woodcock, northern goshawk and various small songbirds, and among the mammals red deer and roe deer; the latter prefer semi-open landscapes in which mixed forest vegetation and clearings alternate. Wild boar shares this general preference for semi-open areas with deciduous forest and an abundance of fresh water.
Finally, the identified fish species provide clues to the hydrological conditions near the site. Freshwater species fell into three main categories based on preferences for specific micro and macro-conditions in their habitat: rheophile, eurytopic and limnophile. Rheophile species can be further divided into three subcategories: rheophile A, B, and C.21 Most of the identified species at Yangtze Harbour belong to the eurytopic group, characteristic for both running and stagnant water: bream, roach, pike, perch, and eel, the latter of which spends part of its life in open sea. Tench belongs to the limnophile group which prefers mostly stagnant water that is rich in vegetation. At least three representatives of the group rheophile A were identified: salmon/sea trout, allis shad, and Atlantic sturgeon. All three spend part of their life in fresh, running water, including the slow waters along river banks where vegetation provides shelter. Burbot is a rheophile B species, a group which spends some of its life stages in tributaries with year-round access to a river.22 The rheophile C group may be represented by twaite shad and flounder. Species of this group spend part of their lifes in slow, brackish waters with a year-round connection to the lower reaches of watercourses, estuaries and the sea.
The range of species that were caught indicates that a number of different ecozones was being exploited from the site in the transitional zone between freshwater marsh and freshwater tidal area: freshwater marsh itself, open (fresh) water, and carr/woodland. “The few remains of marine fish point at occasional visits to the coast, which gradually approached the dune as sea levels rose in the course of its occupation history.The relative paucity of remains of anadromous species, such as allis shad/twaite shad, Atlantic sturgeon, and salmon/sea trout suggests that little or no fishing took place in the deeper mainstream, where these migrating fish occur, but that rather fishing was limited to the coastal areas, to slower secondary channels or to waters that had become isolated from the mainstream.
217
5.6 Seasonality
Evidence for seasonality is scarce. Based on the location of modern breeding grounds and migratory behaviour, the presence of the two duck species smew and common goldeneye (both from Trench 1) may point to on-site activity in the period late autumn to spring. Today, smew only visits the Netherlands from November to April, which is also the period when common goldeneye is most abundant (November-March).23 However, goldeneye also visits the Netherlands outside this period and may even nest there, albeit in very small numbers.The occurrence of certain fish species also reflects seasonal activities, especially twaite shad/allis shad (Trenches 1 and 2) and salmon/sea trout (Trenches 1 and 3), anadromous species which live in open sea but spawn in freshwater. Allis shad used to appear in April-May, while twaite shad arrived later, in June-July. The spawning grounds of allis shad were usually slightly further upstream than those of twaite shad, which spawned in freshwater just above the point where it became brackish.24 Sea trout swims upriver to its spawning grounds in summer, while salmon can be found in freshwater throughout the year. With regard to this species, Dutch river fishermen used to distinguish between winter salmon, summer salmon and the so-called ‘Jacob salmon’,25 based on the period of their upriver migration, weight, the developmental stage of gonadal products and the corresponding physical condition. Winter salmon swam upriver from October to late April, summer salmon followed from May to the end of November. The small ‘Jacob salmon’ (length 61 to 67cm) 26 appeared upriver from early July until November, with the peak of its migration taking place around July 25th, St James’ day (James = Jacob in Dutch).Another anadromous species is sturgeon. These fish swim upriver to spawn in late spring, but outside that period they may also occur in brackish waters.27 This makes the species unsuitable as an indicator for seasonality at (semi) coastal sites such as Yangtze Harbour.We may conclude that the animal bone material tentatively point at on-site activities in virtually all seasons.
5.7 Artefacts and use wear
The animal remains also included some worked pieces of bone and antler, four of them tool fragments, a fifth a possible ornament. All five items were analysed for traces of modification and use, using a stereo microscope (Wild M3Z; magnification 10-64x) and a metallographic microscope (Leica DM 6000M magnification 100-500x). A stereo microscope allows the identification of traces of modification as well as an assessment of an artefact’s overall wear. A metallographic microscope is suitable for studying the distribution and characteristics of polish, which anables interpretation of the nature of the contact material and the tasks performed with the artefact.28 Although at first sight the bone tools appeared to be in good condition, microscopic inspection revealed that traces of use wear on them had deteriorated by post-depositional soil conditions, and perhaps also by the adopted excavation methods. It was therefore no longer possible to establish the likely nature of the contact material.
Find number 13 (Trench 1).This tip fragment of a bone awl (weight 0.3g) was probably made of red deer antler. The awl had clearly been used, as indicated by rounding and abrasion of the tip and the rest of the surface. The tip was damaged, but whether this damage is use-related or post-depositional is unknown. The fracture probably occurred when too much pressure was applied to the tool. Under high magnification, the surface revealed clusters of fine, parallel scratches suggestive of both a piercing and a rotating motion. The scratches may be the result of erosion, but the difference between these scratches and post-depositional wear on other artefacts makes it likely that they represent use wear.
Find number 76 (Trench 1).This fragment of a mammal bone (species indeterminate; weight 1.5g) appears to have been modified, but whether or not it is an artefact remains uncertain (Fig. 5.8.a). Use-wear analysis was considerably hampered by the fact that the bone’s outer layer was almost completely worn away. Part of the edge seemed to be more rounded than the rest, a possible indication of use.

218
Fig. 5.8. Tools made of bone and antler. a. Tool fragment; b. Axe or chisel fragment of red deer antler; c. Possible bead of bird bone. d. Possible awl fragment. Scale a. and b. 1:1; diameter c. 6.7mm; length d. 12 mm.
a b
c
d
Find number 302 (Trench 2).The shape of this long bone fragment of a large mammal (weight 1.1g) suggested it is possibly an awl fragment. This object was also heavily weathered, resulting in the disappearance of the outer layer, which made it difficult to firmly establish whether or not it was indeed a deliberately shaped tool.
Find number 308 (Trench 2).On the basis of its shape, this object of red deer antler was classified as a fragment of a small axe or chisel (weight 11.1g; Fig. 5.8.b). The cutting edge was completely rounded by use and later weathering. Analysis revealed the direction of the traces to be perpendicular to the working edge. The fact that the cutting edge is rounded makes a function as an axe or chisel unlikely. That may have been a previous function of the tool, but its final use prior to being discarded involved a soft material that was being worked in a direction perpendicular to the tool’s working edge, a possibility being that it was used for scraping or stretching skins.
Find number 362 (Trench 2).This artefact is made of a fragment from the middle section of a bird long bone (weight 0.4g). It is hollow and shaped like a bead (Fig. 5.8.c). The complete calcination of the surface made use-wear analysis virtually impossible. The object is broken on one side, an event which occurred after heating. On the other side are some traces of wear which are consistent with its interpretation as a bead.
So far very few Early or Middle Mesolithic bone tools have been identified in the Netherlands. The best known finds are the many bone and antler harpoons from the North Sea.29 The lack of comparable finds from other contexts makes the Yangtze Harbour specimens valuable, despite the fact that any use wear on them has all but disappeared by erosion. Objects such as these shed some light on the role of bone tools in this period. This is also true of the bone bead, yet another rare find. Although our use-wear analysis of the Yangtze Harbour flint assemblage produced some indirect evidence for ornament production,30 this bone bead fragment is the only actual ornament found during the excavation.
5.8 Dating the bone
The composition of the unworked bone assemblage provided no clues to its date, other than the Mesolithic period in general. None of the identified species is specific to a particular period within the Holocene; all of them are still part of the modern Dutch fauna.The typology of the five bone and antler tools does not provide a more precise chronological framework either.

219
Radiocarbon samples were taken of four bone fragments in order to narrow down the date of at least part of the find assemblage. The bone of the two samples from Trench 1 with Find numbers 158 and 124 no longer contained any collagen, which rendered radiocarbon dating impossible. However, the remaining two pieces, from Trench 2, could be dated; they produced matching dates in the Early Mesolithic period: 8555 to 8302 BC (Find number 181; bone, mammal indeterminate; GrA-56453, 9215 ± 45 BP) and 8548 to 8300 BC (Find number 326; bone, wild boar, GrA-56454, 9205 ± 45 BP).
5.9 Discussion
Despite the fact that only a small part of the Yangtze Harbour animal bone assemblage could be identified, the range of represented species is remarkable. This is particularly true for birds (19 species), but also for fish (13 species), and mammals (9 species, excluding microfauna). In this respect the situation at Yangtze Harbour is comparable to that of the Late Mesolithic occupation phase at the site Hardinxveld-De Bruin, where 24 species of bird, 13 species of fish, and 12 species of mammal were identified. Sturgeon was much more common at Hardinxveld-De Bruin than it was at Yangtze Harbour, and Hardinxveld-De Bruin also lacked marine fish. At both sites, however, wild boar was the most important game animal alongside red deer, various fur animals, and ducks.31 Archaeozoological analysis of the Mesolithic occupation phase at the site Hardinxveld-Polderweg produced roughly similar results. Of the 13 mammal species identified at Hardinxveld-Polderweg, wild boar, red deer, and fur animals such as otter and beaver dominated, while among the birds (28 species) ducks were prominent. Among the fish (15 species) the number of freshwater types far surpassed that of migrating species, while marine fish were completely absent at Hardinxveld-Polderweg.
The research questions listed in Section 5.1. can now be answered:
Which species were the object of hunting, fowling and fishing, and how were the various populations exploited?
The identified animal remains indicate that wild boar was the primary game animal, alongside red deer, roe deer, and a number of fur-bearing species: otter, beaver, European polecat, marten, wildcat, and weasel. At least some of these fur animals may also have been killed for their meat. With a few exceptions only adult (mature) animals were killed. Besides mammals, a wide range of bird species were hunted, particularly ducks and rails, but also great bittern, grey heron, common wood pigeon, and woodcock. Whether small songbirds were also deliberately caught or whether they, like rodents, reptiles, and amphibians, were part of the background fauna and ended up at the site without human intervention, is uncertain.Besides hunting and fowling, fishing was another important activity at the site. Mainly freshwater fish were found, with pike as the dominant species. The captured individuals tended to be largish to very large, but some were smaller, an indication that fishing was not selective and that fishing techniques and strategies were adequate to catch individuals of varying sizes.
What information does analysis of the animal remains reveal regardeing the contemporary landscape and exploited ecozones?
The range of identified species points at a wet and partially forested, freshwater landscape close to the sea. The abundant remains of freshwater fish and the presence of beaver, otter, and various ducks, rails and herons point at the proximity of (reed) marsh and bodies of slow or stagnant water. The background fauna of European water vole, root vole (a species well adapted to dynamic landscapes with variable water tables), grass snake, and marsh frog confirms this reconstruction.Species such as northern goshawk, woodcock, common wood pigeon, and various kinds of small songbirds suggest that woodland or shrubs could be found nearby. Red deer, roe deer and wild boar prefer a semi-open, watery landscape with deciduous forests.The (few) remains of migrating fish reveal the existence of an open connection with the sea, while the nearness of the sea itself is evident by the presence of marine species (spotted ray and turbot).

220
Concluding, we may state that the people who occupied the site exploited a number of different ecozones in the area – freshwater marshes, bodies of open (fresh) water, as well as carr/woodland – in combination with incidental visits to the coast.
What information can the animal remains provide with respect to seasonal activities?
Evidence for seasonality is sparse and limited to only a handful of species. Two duck species, common goldeneye and smew (Trench 1), suggest fowling between late autumn and spring. Two fish species, allis shad (possibly also twaite shad; Trenches 1 and 2) and sea trout (Trenches 1 and 3; assuming that it is indeed sea trout and not salmon) were caught in summer, when these fish swim upriver to spawn.
Do the results from the three trenches differ in any way with regard to the aforementioned aspects?
Because the number of identified remains from Trenches 1 and 2 was relatively small, any conclusion with regard to possible differences in the composition of the zoological assemblage between the trenches has to be tentative. Trench 3 produced only a very limited amount of zoological remains.The range of species, mammals as well as birds and fish, was roughly similar in Trenches 1 and 2. The most important species in both trenches were wild boar, red deer, ducks, and a number of freshwater fish (pike, carp species, and perch). Marine species were encountered in all three trenches. Together these data suggest that the adopted hunting and fishing methods, and by implication the exploited ecozones, were more or less the same for all trenches. A note of caution is in order, however, as the percentage of identified remains in Trench 1 was almost three times higher than in Trench 2. This difference is probably a reflection of the poorer preservation conditions in Trench 2.
221
Notes
1. ArchaeoBone, Blekenweg 61, 9753 JN Haren. E-mail: [email protected]. Koninginnelaan 18a, 9717 BT Groningen. E-mail: [email protected]. Zoogdiervereniging VZZ, Groningen. E-mail: [email protected]. Stichting LAB, Van Steenisgebouw, Einsteinweg 2, 2333 CC Leiden. E-mail: [email protected]. Projectgroep Archeologie AHR 2003. This module was developed within the framework of a large-scale excavation project in the Harnaschpolder, near the city of Delft in the west of the Netherlands.6. These are four remains of cod (or another Gadid), two of right-eyed flatfish sp., one of eel, and three of unidentified species.7. The black-headed gull (Larus ridibundus) breeds in freshwater environments, but it is smaller.8. See also Niekus, Brinkhuizen, Kerkhoven, Huisman, and Velthuizen 2012, 67.9. Unfortunately these plaice/flounder remains were unsuitable for determination to any particular species.10. The identification was confirmed by Ms Els Thieren (KU Leuven), who is currently preparing a doctoral dissertation on differences between Acipenser sturio and A. oxyrinchus.11. See, for example, Ludwig et al. 2002; Ludwig, Madowiecki, and Benecke 2009; van Neer, Thieren, and Brinkhuizen 2012.12. There is no reason to assume that these are recent intrusions; in colour and preservation they resemble the other fish remains.13. The authors are aware of only one site, the Early Bronze Age site Schagen Hoep-Noord, as having produced skull fragments as well as vertebrae (Zeiler, Brinkhuizen, and Bekker 2007; see also van Wijngaarden-Bakker and Troostheide 2003).14. The other two remains of small songbirds could not be assigned to a particular species.15. Trolle-Lassen 1987.16. See, for example, Zeiler 1997; Idem 2006.17. Van Wijngaarden-Bakker, Cavallo, van Kolfschoten, Maliepaard, and Oversteegen 2001.18. See, for example, Serjeantson 2009.19. Measured were the first vertebra (perch, pike), quadratum, articulare, and keratohyale (pike), dentale (pike, bream), hyomandibulare (plaice/flounder), vomer (eel), and urostyl (perch).20. Broekhuizen, Hoekstra, van Laar, Smeenk, and Thissen 1992.21. Quak 1994.22. The identification of this species is uncertain.23. Bijlsma, Hustings, and Camphuysen 2001.24. Boddeke 1971. Both species used to be much more common than they are today; allis shad has virtually disappeared from Dutch rivers (Nijssen and de Groot 1987).25. Groot and Schaap 1973.26. Van Doorn 1971.27. Magnin 1962.28. Van Gijn 2006a; idem 2010.29. Tsiopelas 2010; Louwe Kooijmans 1971.30. Section 4.4.5.3, this publication.31. Oversteegen et al. 2001; Beerenhout 2001b.

222

223
6 Archaeobotany: landscape reconstruction and plant food subsistence economy on a meso and microscale
6.1 Introduction
6.1.1 Purpose of this study
The botanical material at the Yangtze Harbour site was retrieved from the uppermost sand layer of the river dune and from deposits formed in the surrounding lower, often marshy areas. Due to favourable conditions for preservation a broad spectrum of plant remains was available for analysis.Archaeobotanical analysis was used to gather data on the vegetation development on and around the dune, in order to gain information on the landscape Mesolithic groups lived in. It was a landscape rich in resources, including plant foods and fuel. In order to investigate the interaction between people and landscape three locations were subjected to pollen analysis, and analysis of botanical macroremains and charcoal was carried out on a large number of soil samples.
6.1.2 Categories of analysed botanical material
Three categories of botanical remains were available for analysis: pollen, botanical macroremains, and wood, the latter preserved only in charred form. Each category formed a separate source of information.
PollenThe strength of pollen analysis in general lies in its ability to trace developments in vegetation and land use for a given area. In archaeological contexts peat and sediments/deposits formed during the occupation of a site are the primary sources of information, as pollen remains (pollen, spores of bracken, moss and horsetail, and other microfossils, such as fungi and algae spores) were absorbed into these layers during their formation, resulting in a veritable archive which documents changes in vegetation structure, both local and regional.
Botanical macroremainsIn order to obtain more detailed information on vegetation development and to reconstruct the local vegetation as it was when the dune was occupied, pollen analysis was combined with macroremains analysis. Unlike many pollen types, botanical macroremains can often be identified down to the level of individual species. Because macroremains (i.e. seeds and fruits) usually end up in the soil in the vicinity of the plant that produced them, they form a rich source of data on especially local vegetation.
Macroremains analysis is also invaluable to identify food plants or other plants deliberately collected for specific purposes. Research into the Mesolithic food economy of temperate north-western Europe was for a long time dominated by a focus on animal, and specifically marine food resources. There were some early attempts to emphasise the importance of plant foods in hunter-gatherer diets; Clarke (1976), for example, stated that plant foods were a major dietary component in the Mesolithic period. However, a lack of archaeobotanical evidence made it impossible to assess the role of plant foods directly, not only with regard to Clarke’s model for Mesolithic Europe, but also for hunter-gatherer diet in general. One of the main reasons why plant remains at hunter-gatherer sites were largely neglected (or not recognised) was the conviction that such remains are rare in these early contexts. This conviction was mainly based on the obvious abundance of animal remains, while the only edible plant remains commonly encountered at Mesolithic sites were hazelnuts, and sometimes also remains of water chestnut and various fruits and berries (Price 1989; Zvelebil 1994). Fortunately the situation has since improved, particularly as a result of a greater awareness among
L. Kubiak-Martens1, F. Verbruggen2, and L.I. Kooistra3
224
archaeologists, who are now using a more interdisciplinary approach in their studies of hunter-gatherer sites. Archaeobotanists are increasingly part of the research team in projects which focus on hunter-gatherer sites, and archaeobotanical data on the food economy of early sites are now being collected systematically (see e.g. Regnell, Gaillard, Bartholin, and Karsten 1995; Perry 1999; idem 2002; Kubiak-Martens 1999; idem 2002; idem 2011a; idem 2011b; Mason and Hather 2000; Mason, Hather, and Hillman 2002; Kubiak-Martens and Tobolski 2008).The real breakthrough in hunter-gatherer archaeobotany, however, came with the introduction of the scanning electron microscope, or SEM, which allowed the identification of charred vegetative parenchyma (Hather 1991; idem 1993; idem 2000). Underground storage organs such as roots and tubers largely consist of starchy parenchyma besides containing other carbohydrates and sugars. This makes roots and tubers a reliable potential food source for humans. The recent application of the newly developed identification technique for archaeological parenchymous tissue to material from a number of hunter-gatherer sites in temperate Europe revealed that roots and tubers were indeed substantial components of early human diets (see e.g. Perry 1999; idem 2002; Kubiak-Martens 1999; idem 2002; idem 2011a; Mason and Hather 2000; Mason et al. 2002). The technique was also successfully applied in the Yangtze Harbour project.
CharcoalThe third material category in archaeobotanical analysis is wood. As a raw material for shelters, weapons, tools, baskets, fish traps, and much else, wood was crucial to Mesolithic people. In addition, wood could be used as fuel for hearths, which provided warmth, cooked foods, or useful substances such as adhesive (pitch or tar). Wood analysis attempts to retrieve information on how the wood was used, while in archaeological contexts it can also provide information on the types of woody vegetation that existed near the site. At the Yangtze Harbour site, wood analysis did not identify any wooden objects however, only charcoal. Charcoal may be a waste product of fires deliberately started and controlled by people, but also of natural forest fires. The range of identified wood species and their components, in combination with the results of pollen and macroremains analysis, usually gives a fairly accurate indication of what caused the charring.
In this chapter the analysis results will first be discussed for the three categories of botanical material separately, after which all results will be combined in Section 7.6, ‘Synthesis and discussion’, in order to answer specific research questions. The analyses will proceed on a number of scales: the landscape on the dune and its immediate surroundings (the so-called mesoscale) and life on the dune itself (microscale).
6.1.3 Research questions
Specific questions formulated in the context of the archaeobotanical analysis were (Smit 2012):
Mesoscale- What was the nature of the landscape on and near the dune?- How was this landscape being exploited?- What was the nature of the surrounding landscape when the dune was occupied? Was it a freshwater, brackish or saltwater landscape, and were there any changes through time?- Are the charcoal-rich levels in the upper Wijchen Layer anthropogenic in origin?
Microscale general- What is the nature, date and state of preservation of the retrieved remains?- Did the adopted methods of analysis and/or retrieval in any way affect the archaeo- logical remains (e.g. damage, loss of context)?- To what extent does the archaeological assemblage as it is today reflect the adopted methods of analysis? How do those results compare to those obtained at land-based sites?
225
Microscale specific- Which activities were carried out by the people who lived on the dune?- What was the diet of these people? Did the food derive from the immediate area or was it collected elsewhere?- What types of food were prepared on the dune?- Is it possible to distinguish seasonal activities?- What is the chronological range of the finds from the three research trenches?- Are there indications for short-term settlement? Are there observeable changes in the exploitation of the dune through time?
Synthesising questions – microscale- To what extent are similar archaeological remains/sites elsewhere in the North Sea- area or on land useful parallels to the Yangtze Harbour site archaeological finds? Which sites in particular are relevant in this context?- If none of the known land-based sites are comparable, how should the Yangtze Harbour site archaeological complex be interpreted?- Are there indications for (inter)regional contacts and/or barter of goods and/or resources?
Additional research questions- What is the age of the clay layer (lowermost Wijchen Layer) which underlies the dune, and what is the chronology of the occupation on top of the dune?- What information on the relation between the three research trenches can the analysis results provide? Do the trenches represent one large archaeological complex with a wide distribution of finds, or instead three spatially distinct, smaller sites of widely different character and chronology?
These research questions guided our selection of analysis methods as well as forming a frame of reference for our discussion of the analysis results (see for the latter Section 7.6, ‘Synthesis and Discussion’).
6.2 Material and methods
The archaeobotanical material derived mainly from Trenches 1 and 2 (Fig. 6.1), supplemented by a few botanical samples from Trench 3 and from three cores: B37A0673/W-04 (Trench 2-area), B37A0675/W-06 (Trench 1-area) and B37A0697/W-28 (a depression just east of the dune - Fig. 6.1). Appendix 6.1 presents an overview of all analysed samples.
6.2.1 Material: cores
During a core sampling survey that was carried out from the deck of a dredger in the project area, a number of sediment cores were taken, using a hydraulic core. Cores B37A0673/W-04, B37A0675/W-06 and B37A0697/W-28, taken in the west of the study area, were selected for additional archaeobotanical analysis on a meso and microscale. Relevant data generated by these cores have been listed in Table 6.1. Core B37A0673/W-04 (Trench 2-area) produced evidence for human presence. Core B37A0675/W-06 was taken near Trench 1 at a location where the top of the dune was well preserved. Core B37A0697/W-28 was taken in a depression east of the dune. Because peat formation may have begun relatively early there, it was thought that the peat might have preserved information on the landscape at the locations of Cores B37A0673/W-04 and B37A0675/W-06 during the period when the dune was settled. Fig. 6.1. shows the location of the cores in the study area; the differences in elevation between parts of the dune top are prominent.

226
B37A0697/W-28
B37A0675/W-06
B37A0673/W-04
0 50 m
18,5 / 1819 / 18,519,5 / 1920 / 19,520,5 / 2021 / 20,521,5 / 2122 / 21,5
B37A0697/W-28
B37A0675/W-06
B37A0673/W-04
0 50 m
18,5 / 1819 / 18,519,5 / 1920 / 19,520,5 / 2021 / 20,521,5 / 2122 / 21,5
B37A0697/W-28
B37A0675/W-06
B37A0673/W-04
0 50 m
18,5 / 1819 / 18,519,5 / 1920 / 19,520,5 / 2021 / 20,521,5 / 2122 / 21,5
Core
B37A0697/W-28
B37A0675/W-06
B37A0673/W-04
0 50 m
18,5 / 1819 / 18,519,5 / 1920 / 19,520,5 / 2021 / 20,521,5 / 2122 / 21,5
Trench
B37A0697/W-28
B37A0675/W-06
B37A0673/W-04
0 50 m
18,5 / 1819 / 18,519,5 / 1920 / 19,520,5 / 2021 / 20,521,5 / 2122 / 21,5
B37A0697/W-28
B37A0675/W-06
B37A0673/W-04
0 50 m
18,5 / 1819 / 18,519,5 / 1920 / 19,520,5 / 2021 / 20,521,5 / 2122 / 21,5
Fig. 6.1. Location of the cores mentioned in this chapter, B37A0673/W-04, B37W0675/W-06, and B37W0697/W-28, projected onto the surveyed former surface of the Late Pleistocene and Early Holocene sand (fluviatile and river-dune sediments) in Target zone West. Also shown are the locations of the other cores taken at Stage 3 and the excavated trenches of Stage 4.
0 100 m
0 100 m
Top sand in m - asl
Target zone West
Trench 1
Trench 2
Trench 3
18.5 - 1819 - 18.519.5 - 1920 - 19.520.5 - 2021 - 20.521.5 - 2122 - 21.5
Table 6.1. Administrative data of the analysed core samples.
Core National Grid coordinateX
National Grid coordinateY
Depth HFin m - asl
Date core
B37A0673/W-04 61.299 443.887 17.72 7-23-2011B37A0675/W-06 61.333 443.904 17.64 7-23-2011B37A0697/W-28 61.370 443.878 18.09 7-23-2011
The lithological and stratigraphical descriptions (carried out by S. de Vries of Deltares and M. van Waijjen of BIAX Consult) are summarised in Table 6.2.
The lowermost sediments in the cores are sands deposited by the rivers Rhine and Meuse, that are part of the Kreftenheye Formation. Inundation clays of the lower and upper Wijchen Layers form the top segment of the Kreftenheye Formation. Locally, wind-blown sands of the Delwijnen Member (Boxtel Formation) are superimposed on the lower Wijchen Layer. The Mesolithic archaeological material is contained in the top section of the river dune deposits. Directly on top of the dune sand – and elsewhere on top of the lower Wijchen Layer – are the upper Wijchen Layer and peat deposits (Basal Peat Layer [Du. Basisveen Laag], Nieuwkoop Formation). The peat in turn is covered by clay: freshwater tidal deposits of the rivers Rhine and Meuse that are part of the Echteld Formation. These marine stratified clays are interpreted as estuary deposits of the Wormer Member. In the North Sea-area, the sand encountered in the top segment of the cores was deposited on the sea bottom and should be interpreted as the marine sands of the Bligh Bank Member.

227
Core Depthin cm - HF
Depthin m - asl
Lithological unit Stratigraphy
B37A0673/W-04 103-000 18.75-17.72 Sand Southern Bight Formation180-103 19.52-18.75 Clay and silt layers Naaldwijk Formation (Wormer Member)190-180 19.62-19.52 Humic clay Echteld Formation
216-190 19.88-19.62 Peat Nieuwkoop Formation (Basal Peat Layer) 260-216 20.32-19.88 Humic sand Boxtel Formation (Delwijnen Member)B37A0675/W-06 054-000 18.18-17.64 Sand Southern Bight Formation 189-054 19.53-18.18 Clay and silt layers Naaldwijk Formation (Wormer Member) 197-189 19.61-19.53 Humic clay Echteld Formation 212-197 19.76-19.61 Peat Nieuwkoop Formation (Basal Peat Layer) 218-212 19.82-19.76 Humic sand Boxtel Formation (Delwijnen Member) 222-218 19.86-19.82 Clay Kreftenheye Formation (Wijchen Layer) 275-222 20.39-19.86 Humic sand Boxtel Formation (Delwijnen Member)B37A0697/W-28 125-000 19.34-18.09 Sand Southern Bight Formation 192-125 20.01-19.34 Humic clay Echteld Formation 224-192 20.33-20.01 Peat Nieuwkoop Formation (Basal Peat Layer) 228-224 20.37-20.33 Clay Kreftenheye Formation (Wijchen Layer) 245-228 20.54-20.37 Humic sand Kreftenheye Formation
Table 6.2. Lithological and stratigraphic units of the analysed core samples.
6.2.2 Material: material collection
Field research at the site proceeded from the deck of a dredger. First the three trenches were subdivided into 2 x 5m sections from which the top layer of the dune was removed in 20cm-slices using a dragline excavator. In the course of this procedure some problems arose (see Section 2.5.3, ‘Oblique position of the grab’), which made it impossible to maintain a strictly vertical stratigraphy. The soil was stored in bulk bags and subsequently sieved by ADC ArcheoProjecten staff, using two Lutter sieves with mesh sizes of 10 and 2mm and sea water from the Yangtze harbour. The 10mm-residues were dried; of the 150 2mm-residues one litre was set aside and stored wet, while the remainder was also dried. BOOR staff sorted out botanical remains and charcoal (besides flint and other relevant material) from all dry 2mm and 10mm-sieve residues, 376 in total. This material was presented to BIAX Consult for analysis. Of the 150 2mmresidues that were stored wet, 50 were selected for botanical analysis; these residues were presented to BIAX Consult unsorted.While field research was still in progress, 68 sub-samples for botanical analysis of 5 litre each were collected by hand from the removed 20cm layers of soil, prior to their storage in bulk bags. This was done because a certain degree of contamination between layers could be expected. The 5-litre botanical samples were therefore taken from the core of each layer and contain only material from the find-bearing strata from the top of the dune, avoiding intrusive material from the peat cover. In this chapter a machine-dug 20cm-layer will be called a ‘batch’.
6.2.3 Method: pollen
6.2.3.1 Sampling
Subsamples for pollen analysis were taken from Cores B37A0673/W-04, B37A0675/W-06 and B37A0697/W-28 (20 sub-samples) and from a number of individual soil samples (15 sub-samples). Depending on sediment type and the presence of organic material, the volume of the sub-samples ranged from 2 to 5cm3. Sampling focussed on the layers of humic dune sand (Delwijnen Member-Boxtel Formation) and the superimposed peat (Basal Peat Layer [Du. Basisveen Laag], Nieuwkoop Formation). Fig 6.2 shows the location of the analysed separate soil samples, while Fig 6.3 shows the exact location of the palynological core samples within each core. M. Hagen of the Laboratory for Sediment analysis of the Faculty of Earth and Life Sciences, VU University Amsterdam, supervised the preparation of the 35 sub-samples for analysis, following Erdtman’s standard procedures (Erdtman 1960;

228
Fægri, Kaland, and Krzywinski 1989, with modifications by Konert 2002). A known quantity of Lycopodium spores was added to each sample to allow an initial global assessment of the pollen concentrations (Stockmarr 1971).4 Appendix 6.2 lists the administrative data for the pollen samples.
6.2.3.2 Identification
Pollen and spore types were identified using an optical microscope (Olympus BX41, with phase-contrast imaging when necessary, maximum magnification 10x100), BIAX Consult’s own reference collection, and identification manuals (Beug 2004; Moore, Webb, and Collinson 1991; Punt et al. 1976-2009). Terminology followed guidelines published in the 22nd edition of the Dutch standard manual in the field, Heukels’ Flora van Nederland (van der Meijden 1996). Identified were pollen and spores as well as so-called non-pollen palynomorphs, or NPPs (van Geel 1976; idem 1998). Ecological classification of encountered species followed the standard Dutch manuals De Nederlandse Ecologische Flora and Heukels’ Flora van Nederland (Weeda, Westra, Westra, and Westra 1985-1994; van der Meijden 1996). Present-day environmental preferences and biotopes provided a framework for the reconstruction of the environment in the past.
6.2.3.3 Assessment of the palynological samples
The first stage of the pollen research (performed by Frederike Verbruggen, who also carried out further analysis) consisted of an assessment of the twenty pollen samples from the three selected cores with respect to concentration, preservation and species spectrum of the pollen remains they contained. Appendices 6.3a to 6.3c present the results of this assessment stage. On the basis of the results, fifteen core samples were selected for further analysis.In addition, fifteen palynological sub-samples were taken from botanical soil samples. They were briefly assessed as to their suitability for analysis, after which ten of them were selected for further analysis, with all layers being evenly represented.
6.2.3.4 Pollen analysis
Pollen analysis involved counting all observed pollen remains in order to calculate the proportions in which the various types occurred. To obtain reliable results, a minimum of 600 pollen and spores were counted, including all species with the exception of water plants. Percentages for all palynomorphs were calculated based on this so-called total pollen sum. After reaching the pollen sum, the microscopic slides were completely scanned in order to determine the presence of palynomorphs that had not been encountered previously.
6.2.3.5 Pollen diagrams
The results of the pollen analysis were graphically presented in pollen diagrams, one for each core, using the Tilia and TG-View software packages (Grimm 1992-2004). Palynomorphs (pollen, spores and NPPs) are arranged along the x-axis by ecological category, while the y-axis lists the samples’ vertical location within the core (in cm HF and in cm - asl), thereby in fact creating a relative chronology because the pollen samples were taken from the cores in stratigraphical order. Pollen samples from the archaeological layers were not taken in stratigraphical order, however. These pollen diagrams were therefore presented as histograms, with the layers arranged along the y-axis. The order in which palynomorph types were arranged, was determined by their relative prevalence. Pollen types observed after the counting process was completed are marked in the diagram by a cross (+). The grey area which surrounds the curves represents a factor 10 increment in the actual calculated percentages, to improve the visibility of pollen types present in extremely small percentages.

229
B37A0673/W-04
0 25 m
35
3738
36
34 3332 31 30
29
28 27 26 25 2423
22 21 20 1918 17
12
34
56
78
910
1112
1314
1516
Trench 1
Trench 2
Trench 3
B37A0675/W-06
B37A0697/W-28sample 416batch 0
sample 447batch 3
sample 424batch 1
sample 422batch 1
sample 404batch 2
sample 401batch 3 sample 393
batch 2
sample 402batch 3
sample 385batch 1
sample 382batch 0
0 100 m
0 100 m
B37A0673/W-04
Put 1
Put 2
Put 3
B37A0675/W-06
B37A0697/W-28vnr 416greep 0
vnr 447greep 3
vnr 424greep 1
vnr 422greep 1
vnr 404greep 2
vnr 401greep 3 vnr 393
greep 2
vnr 402greep 3
vnr 385greep 1
vnr 382greep 0
0 25 m
B37A0697/W-28
B37A0675/W-06
B37A0673/W-04
0 50 m
18,5 / 1819 / 18,519,5 / 1920 / 19,520,5 / 2021 / 20,521,5 / 2122 / 21,5
Target zone West
Fig. 6.2. Location of loose soil samples from Trenches 1 and 2 that were subjected to pollen analysis. Shown within each trench are the numbered sections and the locations of Cores B37A0673/W-04, B37W0675/W-06, and B37W0697/W-28. The plan is projected onto a map of the surveyed former surface of the Late Pleistocene and Early Holocene sand (fluviatile and river-dune deposits) in Target zone West.
Pollen diagrams of each core include two summary diagrams in which the various pollen types have been arranged according to the ecology of the plants that produced them. The first summary diagram (left) reflects the relative contribution of each ecological group to the total pollen sum, which covers all spores and pollen (with the exception of those of water plants).5 This diagram therefore reveals trends in regional and local vegetation developments. The second summary diagram shows the contributions of ecological groups relative to a pollen sum that consists of pollen types of plants confined to dry soils.6 ‘Marsh’ vegetation (excluded from this total pollen sum) may be regarded as the local vegetation on and around the dune, and is therefore likely to be over-represented in the pollen diagrams (Janssen 1973; idem 1981). The second summary diagram (right) shows differences in regional pollen types between the ecological groups. In the context of the Yangtze Harbour site it is particularly important to know which species were local, as the purpose of the archaeobotanical analysis was to collect information on the vegetation history of the river dune. Analysis of the botanical macroremains revealed that trees such as hazel, which are normally included

230
B37
A06
73/W
-04
Polle
n sa
mpl
es
14C
St
ratig
raph
y
BX
5742
: 198
-197
BX
5743
: 213
-212
BX
5744
: 216
-215
BX
5745
: 217
-216
BX
5746
: 221
-220
BX
5747
: 226
-225
BX
5748
: 232
-231
178
Cla
yey
sand
195
Cla
y
216
228
238
216-
213
219-
216
Pea
t
Pea
ty s
and
Hum
ic s
and
San
d
B37
A06
75/W
-06
Polle
n sa
mpl
es
14C
St
ratig
raph
y
BX
5749
: 212
-211
BX
5752
: 223
-222
BX
5782
: 228
-227
BX
5783
: 229
-228
BX
5753
: 230
-229
BX
5754
: 231
-230
BX
5755
: 235
-234
BX
5751
: 221
-220
BX
5750
: 216
-215
Cla
yey
sand
197
Cla
y
222
228
245
228-
226
231-
228
Pea
t
Pea
ty s
and
Hum
ic s
and
San
d
219
Hum
ic c
lay
212
Hum
ic s
and
201
Cla
yey
sand
197
B37
A06
97/W
-28
Polle
n sa
mpl
es
14C
St
ratig
raph
y
BX
5756
: 223
-222
BX
5759
: 230
-229
BX
5758
: 228
-227
BX
5757
: 226
-225
Pea
t
226,
5B
row
n cl
ayB
lack
cla
y22
9
Slig
htly
hum
ic
sand
228
Tran
sitio
n
224
223-
222
245
San
d
Fig.
6.3
. Loc
atio
ns o
f pol
len
sam
ples
and
radi
ocar
bon
sam
ples
in C
ores
B37
A06
73/W
-04,
B37
A06
75/W
-06,
and
B37
A06
97/W
-28.
All
dept
hs in
cm
- H
F (=
Top
of t
he c
ore)
. Dep
th o
f the
har
bour
floo
r res
p. 1
7.72
m
- asl
(B37
A06
73/W
-04)
, 17.
64m
- as
l (B
37A
0675
/W-0
6), a
nd 1
8.09
m -
asl (
B37
A06
9/W
-28)
.

231
in (total) pollen sums, occurred locally. All plants were therefore included in the pollen sum, the second summary diagram allowing a comparison with earlier palynological studies, where the ‘marsh vegetation’ had been excluded from the pollen sum.
6.2.4 Method: charred microscopic particles
Quantitative analysis of charred microscopic plant particles in the analysed pollen samples (cores and archaeological layers) was performed in order to obtain information on any increase or decrease in the frequency of fires during the period coinciding with the accumulation of organic material in the dune sand and the formation of peat.7 This is a potential indicator of human activity on or near the dune, and the results of the analysis may therefore contribute to a reconstruction of the landscape and its exploitation.This stage of the analysis was carried out at the Laboratory for Palaeobotany and Palynology (Palaeo-ecology department), Utrecht University. It involved studying pollen samples under an optical microscope (Olympus BH-2; magnification 10x20), connected via an Olympus XC30 camera to a computer using AnalySIS auto 5.1 software (Olympus Soft Imaging Solutions GmbH).8 Twenty-five fields were analysed, each measuring 366.1 x 271.8µm9 and each situated at fixed coordinates within the total sample in order to remove any subjectivity in the selection of fields for analysis. The diameter of the charcoal particles was not measured. However, the surface area and the exact number of charred microscopic particles were measured, thus providing information on charred particle concentrations.Under a microscope charred structures can often be recognised by their black or dark-brown colour and angular circumference. The most successful method to train the AnalySIS software to recognise charred particles proved to be assigning a so-called ‘red value’ to the particles. The darker a particle’s red value, the greater the likelihood that it is a charred particle.10 If the red value exceeds a pre-determined threshold, the software will classify it as charred, if not, it will be classified as un-charred. Constant visual control of the process is necessary, however, adding any non-classified particles by hand and removing others that may be dark but do not appear to be charred.11 A number or parameters were recorded of all the particles classified as charred, including their surfaces (in µm2).12 A comparison of the sum of the surface measurements of all charred microscopic particles with the total analysed surface (25 x 366.1 x 2718µm = 2.49mm2) provides only an indication of the total ‘thickness’ of the sample.13 In order to enable correction, this Lycopodium spores were added to the pollen samples. Since the volume, the quantity of Lycopodium spores, and the total surface of charred particles of each pollen sample are known, the number of Lycopodium spores counted on the analysed surface can be used to infer the sample volume corresponding to a surface of 2.49mm2. This parameter may then be used to calculate the density of charred microscopic particles, expressed in mm2/ml. This figure is an indicator of the number of particles at specific levels in the core, and by implication of the number of fires in the past.
6.2.5 Method: botanical macroremains
6.2.5.1 Sampling
Analysis of plant macroremains was carried out by Lucy Kubiak-Martens on the three cores mentioned in Section 6.2.1, the 68 botanical soil samples mentioned in Section 6.2.2, all of the dry-sieve residues retrieved from the 2 x 5m sections (376 in total), and 50 of the 150 wet-sieve residues.At the Deltares laboratory the cores were split lengthwise asymmetrically, after which the thinner section of Cores B37A0673/W-04, B37A0675/W-06 and B37A0697/W-28 was brought to BIAX Consult for further sampling. For the purpose of macroremains analysis (including macroscopic charcoal analysis) and selection of material for radiocarbon analysis the lowest part of each stratum in the sediment sequence of the cores (corresponding to the top of the dune/humic sand and the transition to peat) was subdivided into 1cm-slices. Twenty samples from this series were subjected to macroremains analysis and five to radiocarbon analysis. All samples were wet-sieved
232
at mesh size 0.25mm, using tap water, after which a binocular incident light microscope at magnification 6x to 60x was used to identify plant remains. Suitable radiocarbon samples were taken from potentially interesting levels in each core and sent to Groningen University’s Centre for Isotope Research.Macroremains analysis was also performed on 68 5-litre botanical soil samples from various batches taken from the archaeological layers in Trenches 1 and 2. At BIAX Consult all samples were first wet-sieved at mesh sizes 2mm, 1mm and 0.5mm, while 0.5-litre sub-samples taken from each sample were wet-sieved at mesh size 0.25mm. Observed macroremains were sorted and identified using a binocular incident light microscope at magnification 6x to 60x. Ecological classification of encountered species was based on Schaminée, Weeda, and Westhof 1995; Schaminée, Stortelder, and Weeda 1996, and Stortelder, Schaminée, and Hommel 1999.All the botanical samples were first assessed for their botanical value on the basis of preservation, range of species, and the number of macroremains present. This led to the selection of twenty samples for further analysis, based on their botanical potential as well as their position relative to the river dune deposits and/or the onset of peat formation. Any charred remains and particularly charred parenchyma encountered at the assessment stage and during further analysis were carefully recorded. Out of these twenty samples, five samples from various archaeological layers in Trenches 1, 2 and 3 were selected for radiocarbon analysis. Appendix 6.4 presents the results of the archaeobotanical assessment, as well as information on the origin of the samples, while Appendix 6.5 presents the results of the macroremains analysis.In addition to the macroremains analysis, 376 dry-sieve residues (see Section 6.2.2) containing fragments larger than 2mm and/or 10mm were assessed for the presence of plant remains in general and charred remains of edible plants in particular (including charred parenchyma), again using a binocular incident light microscope at magnification 6x to 60x. The residues derived from Batches 0, 1, 2 and 3 from Trench 1, Batches 0, 1, 2, 3 and 4 from Trench 2, and Batches 0, 1 and 2 from Trench 3. Five radiocarbon samples came from various batches taken in Trenches 1, 2 and 3. After drying the sieve residues BOOR employees first divided them into OPX 2 and 10mm residues (mainly waterlogged remains) and OPH 2 and 10mm-residues (mainly charcoal and other charred plant remains).14 Both fractions were combined at the interpretation stage. Appendix 6.6 presents the results of the assessment process.Based on the results of this assessment of dry-sieve residues, fifty wet-sieve residues out of a total of 150 (1 litre, mesh size 2mm) were also assessed for the presence of plant remains in general and of archaeological parenchyma in particular, again using a binocular incident light microscope. A summary of the results can be found in Appendix 6.7.
6.2.5.2 Archaeological parenchyma
Remains of charred vegetative storage tissue such as charred parenchyma tend to be very fragile,and compared to, for example, seeds or nut shells the chance that such tissue will be preserved in an archaeological context is remote. This is because storage tissue often contains relatively large quantities of water and oils, which renders it susceptible to damage by fire and also to crumbling during the recovery process. Because of the nature of charred parenchyma, it is often necessary to process a large number of samples. This was certainly the case at the Yangtze Harbour site , where researchers were especially alert throughout the assessment and analysis stages for the presence of charred parenchyma, which resulted in the recovery of almost 35 charred fragments of the material. With the exception of one morphologically intact tuber of a member of the Cyperaceae family (sedges) the fragments were usually small (2 to 6mm). Ultimately 25 fragments were selected as being potentially identifiable. The identification of charred parenchyma requires a SEM microscope. Potentially identifiable remains were examined by Lucy Kubiak-Martens at the SEM laboratory of the Naturalis Biodiversity Center in Leiden. The specimens were mounted on SEM stubs using double-sided carbon tape strips, gold-coated, and examined using a JOEL JSM-5300 scanning electron microscope at magnification 35x to 750x. The specimens were all photographed and described. Identification followed anatomical criteria formulated by Hather (1991; idem 1993) and also made use of BIAX Consult’s own reference collection for underground plant storage organs.

233
6.2.6 Method: charcoal
Charcoal analysis that was carried out by Laura Kooistra concentrated on material retrieved by various methods from the three cores and three research trenches. The quantity of charcoal was sufficiently large so as to make selection necessary.
6.2.6.1 Charcoal samples from Cores B37A0673/W-04, B37A0675/W-06 and B37A0697/W-28
When encountered, charcoal remains from all dated core segments, which had also produced pollen and botanical remains suitable for analysis, were identified (see Section 6.2.5.1. for sampling procedures).
6.2.6.2 Sampling charcoal from sieve residues and botanical samples
While field research was in progress, BOOR staff kept all charcoal from dry-sieve residues separate from other botanical remains, counted the fragments and stored them in zip bags. The sieve residues produced a total of 25,000 charcoal fragments (Schiltmans 2012b). The 68 botanical samples were assessed at BIAX Consult by L. Kubiak-Martens (see Section 6.2.5.1). The total number of potentially identifiable charcoal fragments was estimated to be ca. 2000. The first charcoal to be analysed was that retrieved from botanical samples, because in these samples the risk of contamination by material from other batches and/or subrecent material was the smallest. Charcoal analysis was carried out on the five samples (from various batches from Trenches 1 and 2) that had also been selected for radiocarbon dating and macroremains and pollen analysis, and on seven additional samples that were studied on charcoal alone. All these samples were sorted by charcoal content, batch, and trench (see Appendix 6.8 for a list of analysed charcoal samples).The 5-litre botanical samples contained relatively little charcoal and in some cases the fragments were too small for identification, while some larger fragments appeared to have split into several smaller ones, a situation which could result in a distorted impression of the charcoal assemblage that was originally present. It was therefore decided to study charcoal from sieve residues as well, especially the 10mm-residues. Residues with the highest charcoal content were preferred whilst trying to achieve an even distribution over all batches and trenches. Trench 3 produced little charcoal and therefore contributed little to the analysis.Because the degree of fragmentation can be species-specific, 2mm-sieve residues of a number of batches from Trenches 1 and 2 served as a control group.
6.2.6.3 Charcoal analysis: methods
Two microscopes were used for charcoal analysis. An optical microscope at magnifications up to 10x4 served to obtain a global impression of the range of charcoal types, while wood determination was carried out with an optical dark-field microscopy at magnifications up to 10x40, using the BIAX Consult reference collection and appropriate manuals (especially Schweingruber 1982; idem 1990)In addition to wood charcoal identification, an attempt was made to identify the part of the tree the charcoal fragment derived from (stem, branch, twig, knot, bark, root). In addition to these primary characteristics, the fragment’s state of preservation was recorded as well. Three factors which generally affect charcoal preservation can be detected through morphological analysis: the condition of the wood immediately before charring, the nature of the charring process itself, and the conditions the charcoal has been exposed to since.The condition of wood before it becomes charred leaves tell-tale signs. Wood that is infested by fungi or insects will contain charred hypha or galleries made by larvae. Wood that was grown through with roots or partially decayed can also be recognised as such. In such cases the structural integrity of the wood will have been affected, often leading to compression and deformation, while voids left by plant roots can sometimes still be observed in the charred wood. Wood with a high moisture content

234
may split during the charring process, often radially, as the evaporating moisture causes pressure fluctuations, and charcoal fragments showing such radial fractures may therefore derive from damp or wet wood. One example of damp wood that is prone to splitting when heated is fresh wood, i.e. wood from a living tree. However, dead firewood that has not dried properly before being burnt may also split. In the case of oak wood (Quercus), however, the situation is more complicated. Oak wood contains exceptionally heavy medullary rays along which it will often split whilst drying. Splits in oak charcoal therefore do not necessarily mean that the wood was damp.In some cases the texture and hardness of the charcoal can provide morphological clues to the charring process itself. Partially brown charcoal may have been charred at low temperatures and under oxygen-poor conditions, while vitreous charcoal may have been formed in an oxygen-free, low-temperature environment. High temperatures, on the other hand, may lead to sintering. The resulting charcoal will be very hard and the wood structure partially disintegrated.Between the vitreous (originating as a viscous fluid) and sintered (originating as wood charcoal) stages an intermediate, amorphous stage may occur. In that case morphological analysis alone is insufficient to determine whether the fragment originated as a viscous fluid or as intensely sintered wood.Clues to post-depositional conditions are the degree of fragmentation, the shape of the charcoal fragments, and the location/presence of mineral particles in the wood structure. Charcoal that has remained on the surface for a long time tends to be highly fragmented and much rounded, while charcoal that has been under pressure for any amount of time easily breaks or pulverises, allowing mineral particles in the soil to enter the wood structure.The results of a qualitative assessment of the charcoal (extent of wood degradation before and during the charring process, estimated post-depositional decay) have been listed together with the results of the analysis.
6.3 Results radiocarbon analysis
For the purpose of radiocarbon analysis, botanical macroremains (charred, waterlogged, charcoal) of terrestrial plants were sorted out, deriving from cores and from sections of the three trenches. Table 6.3 shows the results of the radiocarbon analysis.
6.3.1 Radiocarbon analysis: material from the core samples
Two radiocarbon samples of botanical material were taken from Core B37A0675/W-06 (Trench 1), one from the top of the lowermost humic sand layer (19.95-19.92m - asl) and the other from the base of the superimposed peaty sand (19.92-19.90m - asl).15 The first produced a date between 7501 and 7083 BC (GrA-54925, 8275 ± 70 BP) and refers to the vegetation on the dune during the second half of the Boreal period. The second sample, from the base of the peaty sand, produced a date between 7135 and 6699 BC (GrA-54928; 8030 ± 60 BP), probably coinciding with the Boreal-Atlantic transition.Two radiocarbon samples were also taken from Core B37A0673/W-04 (Trench 2), one from the top of the peaty sand (19.91-19.88m - asl) and the other from the base of the peat (19.88-19.85m - asl). The material from the top of the dune dated to between 7291 and 6779 BC (GrA-54927, 8075 ± 55 BP), i.e. the Boreal-Atlantic transition. Although this range partially overlaps that of the final-Boreal date obtained on Core 6 from the lowermost humic sand layer from Trench 1, it may be slightly younger. In fact, it does match the date produced by the second sample from Core 6, Trench 1, which came from the peaty sand deposit. The second sample from Core 4, Trench 2, representing the base of the peat, yielded a date of 7029 to 6606 BC (GrA-54926, 7880 ± 55 BP), which corresponds to the beginning of the Atlantic period. These dates suggest that both Core 4, Trench 2 and Core 6, Trench 1 reflect increasingly wet conditions at the Boreal-Atlantic transition, to the extent that peat formation began.

235
Tren
ch o
r cor
eD
epth
in m
-asl
Bat
ch o
rlit
holo
gica
l un
it
Sam
ple
num
ber
Sam
ple
cate
gory
14C
mat
eria
lLa
bora
tory
code
Dat
ein
14C
yea
rs B
PC
alib
rate
d ag
ein
cal
enda
r yea
rs B
C
Tren
ch 1
119
.41
038
2B
otan
ical
sam
ple
(5 li
tre)
Haz
el (C
oryl
us a
vella
na),
nuts
hell
2 frg
. (c)
GrA
-554
8278
20 ±
45
6812
-650
8
119
.09
154
OP
H 2
mm
Com
mon
clu
b-ru
sh (S
choe
nopl
ectu
s la
cust
ris) r
hizo
me,
1 fr
g. (c
)G
rA-5
5481
8015
± 4
570
71-6
768
119
.74
239
3B
otan
ical
sam
ple
(5 li
tre)
Haz
el (C
oryl
us a
vella
na),
nuts
hell
1 frg
. (c)
Bra
nche
d bu
r-re
ed (S
parg
aniu
m e
rect
um),
seed
1x
(c)
Ree
d (P
hrag
mite
s), c
ulm
1 fr
g. (c
)
GrA
-554
8379
70 ±
45
7047
-669
9
120
.27
340
1B
otan
ical
sam
ple
(5 li
tre)
Ree
d (P
hrag
mite
s), c
ulm
, few
frgs
(c)
GrA
-554
8478
60 ±
45
7022
-659
51
20.2
73
8O
PX
10m
mO
ak (Q
uerc
us),
acor
n (c
otyl
edon
), 1
frg. (
c)G
rA-5
5402
8135
± 4
573
04-7
047
119
.42
138
5B
otan
ical
sam
ple
(5 li
tre)
Haz
el (C
oryl
us a
vella
na),
nuts
hell
1 frg
. (c)
Pin
e (P
inus
), co
ne s
cale
, 1 fr
g. (c
)G
rA-5
5349
Sam
ple
lost
in la
bora
tory
du
ring
14C
mea
sure
men
t-
B37
A06
75/W
-06
228-
226c
m -
HF
19.9
2-19
.90
Bas
e pe
aty
sand
-C
ore
Her
bace
ous
plan
t rem
ains
, mul
tiple
ste
m/
leaf
frgs
(c)
GrA
-549
2880
30 ±
60
7135
-669
9
231-
228c
m -
HF
19.9
5-19
.92
Top
sand
-C
ore
Dec
iduo
us ta
xon,
cha
rcoa
l, tre
e pa
rt in
dete
rmin
ate,
5 fr
g.G
rA-5
4925
8275
± 7
075
01-7
083
Tren
ch 2
220
.46
142
4B
otan
ical
sam
ple
(5 li
tre)
Haz
el (C
oryl
us a
vella
na),
nuts
hell,
1 fr
g. (c
)G
rA-5
5485
8920
± 4
582
50-7
956
220
.43
228
6O
PX
2m
mYe
llow
flag
(Iris
pse
udac
orus
), se
ed 2
x (c
)G
rA-5
5403
7750
± 4
566
50-6
477
220
.31
330
8O
PX
2m
mH
azel
(Cor
ylus
ave
llana
), nu
tshe
ll 1
frg. (
c)O
ak (Q
uerc
us),
fruit
wal
l (pe
ricar
p), 1
frg.
(c
)
GrA
-554
0476
85 ±
45
6607
-644
6
B37
A06
73/W
-04
216-
213c
m -
HF
19.8
8-19
.85
Bas
al P
eat
-C
ore
Birc
h (c
f. B
etul
a), b
ud s
cale
s, c
irca.
50
frgs
(w)
Inde
term
inat
e, c
harc
oal,
tree
part
inde
term
inat
e, 3
frgs
GrA
-549
2678
80 ±
55
7029
-660
6
219-
216c
m -
HF
19.9
1-19
.88
Top
sand
-C
ore
Con
ifer,
char
coal
, tre
e pa
rt in
dete
rmin
ate,
4
frgs
Dec
iduo
us ta
xon,
cha
rcoa
l, tre
e pa
rt in
dete
rmin
ate,
2 fr
gs
GrA
-549
2780
75 ±
55
7291
-677
9
Tren
ch 3
319
.15
234
5O
PH
2m
mA
lder
(Aln
us),
char
coal
, tre
e pa
rt in
dete
rmin
ate,
1 fr
g.G
rA-5
5405
7450
± 4
064
12-6
237
B37
A06
97/W
-28
223-
222c
m -
HF
20.3
2-20
.31
Bas
al p
eat
-C
ore
Com
mon
clu
b-ru
sh (S
choe
nopl
ectu
s la
cust
ris),
seed
, 12x
(w)
GrA
-549
2481
00 ±
50
7305
-683
2
Tabl
e 6.
3. R
adio
carb
on d
ates
obt
aine
d on
sel
ecte
d bo
tani
cal m
acro
rem
ains
, Yan
gtze
Har
bour
. All
date
s w
ere
calib
rate
d us
ing
OxC
al 4
.2 (B
ronk
Ram
sey
2013
; Rei
mer
et a
l. 20
09) a
t a s
igni
fican
ce le
vel o
f 2σ
(95.
4%).
Lege
nd: f
rg./f
rgs
= Fr
agm
ent/f
ragm
ents
; w =
Wat
erlo
gged
; c =
Cha
rred
; see
d =
See
ds a
nd fr
uits
; HF
= H
arbo
ur fl
oor i
n 20
11.

236
The peat formation process continued into the Atlantic period. One radiocarbon sample was taken from Core B37A0697/W-28, from the base of the peat which here occurs at a depth of 20.33 to 20.32m - asl. The sample produced a date of 7305 to 6832 BC (GrA-54924, 8100 ± 50 BP), i.e. the Boreal-Atlantic transition. Together the radiocarbon dates suggest that peat formation may have begun slightly earlier on the east flank of the dune than it did elsewhere, at the location of Cores 6 (Trench 1) and 4 (Trench 2). The dates also indicate that the botanical material retrieved from the top of the humic dune sand and the superimposed peat represents the transitional period from the Boreal to the Early Atlantic (calibrated at 7000 BC; van Gijssel and van der Valk 2005, 61). In archaeological terms this encompasses the end of the Early Mesolithic and the beginning of the Middle Mesolithic (ca. 7100 BC; van den Broeke, van Gijn, and Fokkens 2005, 28).
6.3.2 Radiocarbon analysis: batches from trenches
Radiocarbon samples were also collected from each of the three trenches: six from Trench 1, three from Trench 2 and one from Trench 3. Charred plant remains were preferred as at the Yangtze Harbour site these, together with burnt bone, were likely to have become charred as a result of human activity. Table 6.3 presents the analysis results. One sample, from Trench 1, Batch 1, was accidentally destroyed during the 14C-counting phase. Trench 1 produced two dateable samples from the lowermost Batch (Batch 3), resulting in one Boreal and one Late Boreal to Early Atlantic date. The botanical material from Batches 1 and 2 was dated to the Boreal-Early Atlantic transition, while the material the uppermost Batch (Batch 0) in this trench produced a date in the Atlantic period.In Trench 2, Batches 1, 2 and 3 all produced dateable samples. The botanical material from Batches 2 and 3 dated from the Atlantic period while the material from Batch 1 could be assigned to the Boreal. These result are the reverse of what would be expected on the basis of the stratigraphy, according to which Batch 3 should pre-date Batches 1 and 2 as it was situated below them. It is likely that the stratigraphic relation between the batches is indeed chronological within one section of the trench, but not necessarily also between sections. The three radiocarbon samples each came from another section: Batch 1 from Section 19, Batch 2 from Section 29 and Batch 3 from Section 31. Table 6.3 lists the depth below asl for each radiocarbon sample. This clearly shows that of the three samples, the one from Batch 1 was deepest and that from Batch 3 highest. Fig. 6.1 and Fig. 6.2 indicate that this particular trench was situated on an uneven part of the dune, and this may explain the seemingly contradictory dates. It is also possible that the individual batches do not represent different periods but only one, and that all botanical remains from the archaeological stratum should be treated as one unit which covers the period from the Boreal up to and including the Early Atlantic (see also the discussion in Chapter 7). Of the botanical material from Trench 3, only that from Batch 2 was dated, producing the youngest date for the entire site (6412-6237 BC, Table 6.3).
6.4 Results and interpretation: core material analysis
The following section will discuss the results and interpretations of the pollen, macroremains, and charcoal analyses for each trench and core.
6.4.1 Trench 1 – Core B37A0675/W-06
6.4.1.1 Analysed samples
Eleven levels of Core B37A0675/W-06 were examined for the presence of charcoal and other charred and waterlogged plant remains. Nine out of these eleven were in addition assessed for the presence of pollen remains. Eight of the nine levels represented the dune top (see lithological column in Fig. 6.3), the top level consisting of the clayey peat which at that location covered the dune. As mentioned earlier, two levels from this core were radiocarbon dated.

237
195
200
205
210
215
220
225
230
235
Depth (in cm -HB)
19.7
0
19.7
5
19.8
0
19.8
5
19.9
0
19.9
5
20.0
0
20.0
5
Depth in m -asl
7029
-660
6
7291
-677
9Radiocarbon date (cal BC)
1020
3040
5060
7080
9010
0
Trees and shrubs (dry soils)Trees (damp/wet soils)
Herbaceous plants, general
Meadow vegetation
Marsh and shore vegetation
1020
3040
5060
7080
9010
0
Trees and shrubs (dry soils)Trees (damp/wet soils)
Herbaceous plants, general
Heath and raised-bog species
1020
3040
Pinus (B)
10Betula (B)
1020
30
Corylus (B) 10Tilia (B) 10Fraxinus excelsior type (B)
10Ulmus (B)
1020
30
Quercus (B) 10Viburnum opulus type (B)
10Salix (B)
1020
3040
50
Alnus (B)
10Hedera helix (B)
10Pteridium aquilinum
10Polypodium
10Caryophyllaceae (B)10Chenopodiaceae p.p. (B
)
10Asteraceae tubuliflorae
10Asteraceae liguliflorae
10Brassicaceae (B)
10
Pro
porti
onal
dis
tribu
tion
(%)
Apiaceae (B)
10Rubiaceae (B)
10Fallopia (B)
10Artemisia (B)
10Sphagnum
10Calluna vulgaris (B)
1020Poaceae (B)
10Rhinanthus type (B)
10Rumex acetosa group (P)
10Filipendula (B)
10Mentha type (B)
10Alisma type (B)
10Typha angustifolia
10Oenanthe fistulosa type (P)
10Dryopteris type
10Equisetum
10Cyperaceae (B)
10Sparganium (P)
10Nymphaea (B)
10Type 128A
10Type 128B
10Botryococcus
10Zygnemataceae
10Spirogyra (T.132)
10Sordaria (T.55A)
10Type 229
10Type 86 10Puccinia sp. (T.357)
10cf. Type 145
10Type 361
10Type 729
10Juncus seed fragment
10Type 353B
10Glomus cf. G. fa
sciculatum (T.207)
10Type 18 10Diporotheca rhizophila (T.143)
10Charcoal
363 63 72 23Pollen concentration (1000 grains/ml)
677
629
648
740
Pollen count
Lithology - Age
Pea
t - A
tlant
icum
Pea
ty s
and
- Bor
eaal
Hum
ic s
and
- Bor
eaal
Tree
s (d
ry s
oils
)Tr
ees
(wet
)Fo
rest
Her
bace
ous
plan
ts, g
ener
alRu
dera
lsG
rass
esS
crub
Mar
sh/s
hore
Wat
erA
lgae
(fre
shw
ater
)Dun
gM
icro
foss
ils (o
ther
)H
eath
er
Tota
l pol
len
coun
t
Pol
len
anal
ysis
: F. V
erbr
ugge
n (2
012)
Fig.
6.4
. Pol
len
diag
ram
Cor
e B
37A
0675
/W-0
6 (s
ituat
ed ju
st o
utsi
de T
renc
h 1)
. (B)
= Id
entifi
catio
n ba
sed
on B
eug
2004
; (P)
= Id
entifi
catio
n ba
sed
on th
e se
ries
publ
ishe
d by
Pun
t et a
l. 19
76-2
009.
Depth in m - asl
Depth (in cm - HF)
Pea
t - A
tlant
ic p
erio
d
Pea
ty s
and
- Bor
eal
Hum
ic s
and
- Bor
eal

238
6.4.1.2 Palynological material
The nine palynological samples were the first to be assessed. The pollen material proved to be reasonably well preserved, and despite sometimes low pollen concentrations all of the assessed samples qualified for analysis. Fig. 6.4 presents the pollen diagram, a graphic version of Appendix 6.9 which summarises the pollen analysis results for Core B37A0675/W-06 (both absolute frequencies and percentages). What clearly emerges from the pollen diagram is that, while in all periods tree pollen was the most common type, the range of tree species varied through time. The lowest core level, for example, representing the humic sand and peaty sand strata interpreted as Boxtel Formation river dune deposits, proved to contain much pine and hazel pollen, while in the top layers of the peaty sand the pollen percentage of pine had decreased and that of oak increased. The latter is located just above the level which produced a radiocarbon date of 7135 to 6699 BC, the Boreal-Early Atlantic transition.This change from pine forests to mixed deciduous forests with oak was not a local phenomenon; it has been observed throughout north-western Europe in the Early Holocene period as marking the Boreal-Atlantic transition. The milder climate of the Early Holocene allowed a number of tree species which previously had been absent from what is now the Netherlands to establish themselves in this region. Not all species arrived at the same time, however, due to considerable differences in migration speed, environmental tolerance levels (e.g. temperature, substrata) and competitiveness.The overall result was the so-called European Early Holocene vegetation succession. The cold-resistant species birch and pine arrived first, followed by more temperate, deciduous species such as oak, lime, and elm. Because these vegetation changes have been reliably dated, they serve as (relative) chronological markers which can be compared directly to radiocarbon dates.A landscape dominated by pine and hazel, for example, characterises the Boreal period, while oak and alder were common in the Atlantic period (Janssen 1974, 56; Cappers and Neef 2012, 351). In the area of the Netherlands the transition between these two biozones occurred ca. 7000 BC (see e.g. Janssen and Törnqvist 1991, 113).16
Not only the observed pollen counts for pine, oak and alder fit the general picture, but also lime, a species that reached the Netherlands as early as the Boreal period and spread further in the Atlantic period, is present in the pollen diagram for Core B37A0675/W-06.
In Core B37A0675/W-06 the proportion of alder pollen increases throughout the analysed sequence. This again illustrates the Early Holocene vegetation succession. In the Atlantic period alder began to dominate the wetter parts of the Dutch landscape.An important aspect reflected in the Yangtze Harbour material, besides overall vegetation trends, is the local component. The increasing wetness of the landscape, which ultimately resulted in its complete inundation, can be expected to be reflected in the pollen samples from older to younger layers as a decrease in forest cover on drier soils accompanied by an increase in wetland forests. Indeed, the preferred habitat of alder, a wetland species, increased, although the proportion of alder pollen was never particularly high. The latter may be related to the sediments’ age, for alder pollen often only reaches extremely high values in the Middle Atlantic period. Another possible explanation for the relatively moderate values for alder pollen at the Yangtze Harbour site may be that environmental conditions near the sampling location did not particularly favour alder. This is not unlikely, since the sea level rose so quickly that there were probably few suitable locations for alder (see Chapter 3). Results for Core B37A0675/W-06 definitely confirmed that there were local stands of birch and oak, as observed bud scales of those species testify.
The pollen analysis also revealed the presence of many herbaceous plants in the Boreal and Atlantic forests, such as common polypody (Polypodium vulgare) and bracken (Pteridium aquilinum). The former prefers locations on or near tree trunks, while the latter thrives in open, moderately humic woodland and in clearings (Weeda et al. 1985, 50 and 31). Bracken is more common in pine woods than in mixed deciduous forests. It is likely that these same forests also housed some ferns that produced the spores of male-fern type (Dryopteris type) identified in the samples. Besides ferns other identified forest plants include ivy (Hedera helix), mistletoe (Viscum album) and

239
hop (Humulus lupulus). Hop is a vine, ivy a climber and mistletoe a true parasite. Once it has infested a tree top, mistletoe will send out roots into its host’s stem to tap into the sap stream and extract water and nutrients (Weeda et al. 1985, 132 and 133). Ivy and mistletoe are known to prefer damp conditions, and they are sometimes used as climate markers (Iversen 1944, 463): mistletoe requires average July temperatures above 15°C (Zagwijn 1994, 69), while ivy will only produce flowers if minimum winter temperatures remain above -1.7 tot -2°C and average July temperatures exceed 13°C (Zagwijn 1994, 69). Pollen analysis revealed that ivy and mistletoe were both common in the Netherlands especially in the Atlantic period, a relatively warm part of the Holocene (Janssen 1974, 56). Pollen samples from Cores B37A0675/W-06 and B37A0673/W-04 (Trench 2) indicate that ivy was already present in the Boreal. A distribution diagram for common ivy produced by Zagwijn (1994, 71) showed that this climber reached the Netherlands early in that period. The hop vine appeared in the landscape around the Yangtze Harbour site during the Atlantic period. Occasional stands of heather (Calluna vulgaris) may have occurred around the site in openings, particularly in the Boreal forest cover, while clearings in the Boreal and the Atlantic forests may have included grasses (Poaceae) and a number of herbaceous types such as various species of rattle (Rhinanthus type), sorrel (Rumex acetosa type), the goosefoot family (Chenopodiaceae), the pink family (Caryophyllaceae), the bedstraw family (Rubiaceae), the carrot family (Apiaceae), the cress family (Brassicaceae), the rose family (Rosaceae), and the aster family (Asteraceae); the latter represented by e.g. groundsel (Senecio type), chamomile (Matricaria type), and thistle (Carduus/Cirsium).
Core B37A0675/W-06 also produced pollen of a number of ruderal plants typical of locations which constantly receive fresh nutrients. Such enrichment may be anthropogenic but also natural, e.g. near nutrient-rich (eutrophic) water. Ruderal plants identified at the Yangtze Harbour site are mugwort (Artemisia), persicaria (Persicaria maculosa type), stinging nettle (Urtica dioica type), and knotgrass (Polygonum aviculare type). Interestingly, the appearance of stinging nettle pollen in the sequence, after those of mugwort, coincided with the deposition of the humic clay layer. Knotgrass type is regarded as a typical roadside weed (Weeda et al. 1985, 143), while persicaria type, stinging nettle and mugwort (Artemisia vulgaris) thrive on eutrophic locations along bodies of water. Marsh plant pollen greatly increase in the stratigraphic sequence in the peaty sand deposits, marking the beginning of the Atlantic period. In wet areas the vegetation included plants such as mint type (Mentha), dropwort (Filipendula), meadow rue (Thalictrum) , loosestrife (Lythrum), and probably also bittersweet (cf. Solanum dulcamara). More marshy or swampy places supported stands of sedges (Cyperaceae), ferns of e.g. the male-fern type (Dryopteris type), and bur-reed (Sparganium), as well as bulrush (Typha), horsetail (Equisetum), tubular water dropwort type (Oenanthe fistulosa type) and sweet-grass type (Glyceria type). From the humic sand on top of the humic clay and dating to the Atlantic period came pollen of shore plants such as lesser-marshwort type (Apium inundatum type), cowbane type (Cicuta virosa type), water-plantain type (Alisma type), and milk-parsley type (Peucedanum palustre type).Indicator plants for open water were found mainly in the peaty sand and above. Examples are duckweed (Lemnaceae), water lily (Nymphaea), yellow water-lily (Nuphar), and water chestnut (Trapa natans).A number of water algae species were identified as well, for example T.128A and -B sensu Van Geel (van Geel, Hallewas, and Pals 1983), Botryococcus, Mougeotia, and green algae of the Ygnemataceae family, such as Spirogyra. Cyanobacteria were represented by remains of the Gloeotrichia type.Traces of fungi which grow on dung, including Sordaria type, Tripterospora type and Sporormiella type, were encountered especially in the top layers of the peaty sand and the superimposed humic clay and sand. Dung fungi are often found on – but are not limited to – dung of large herbivores (G. Verkleij, Centraalbureau voor fungusculturen, personal communication, June 2013). Large herbivores produce large quantities of dung, and the vegetation they feed on (e.g. grass) may therefore contain fungus ascospores. After passing through the intestinal tract these are excreted and thus spread further.17 The presence of coprophilous fungi at the Yangtze Harbour site may indicate that large herbivores roamed the area, although it is possible that the spores derived from for example carnivore or human excrement. Dung fungus ascospores do not easily spread, they tend to be local. An interesting observation in the analysed sequence from Core B37A0675/W-06 is an increase in T.729 spores
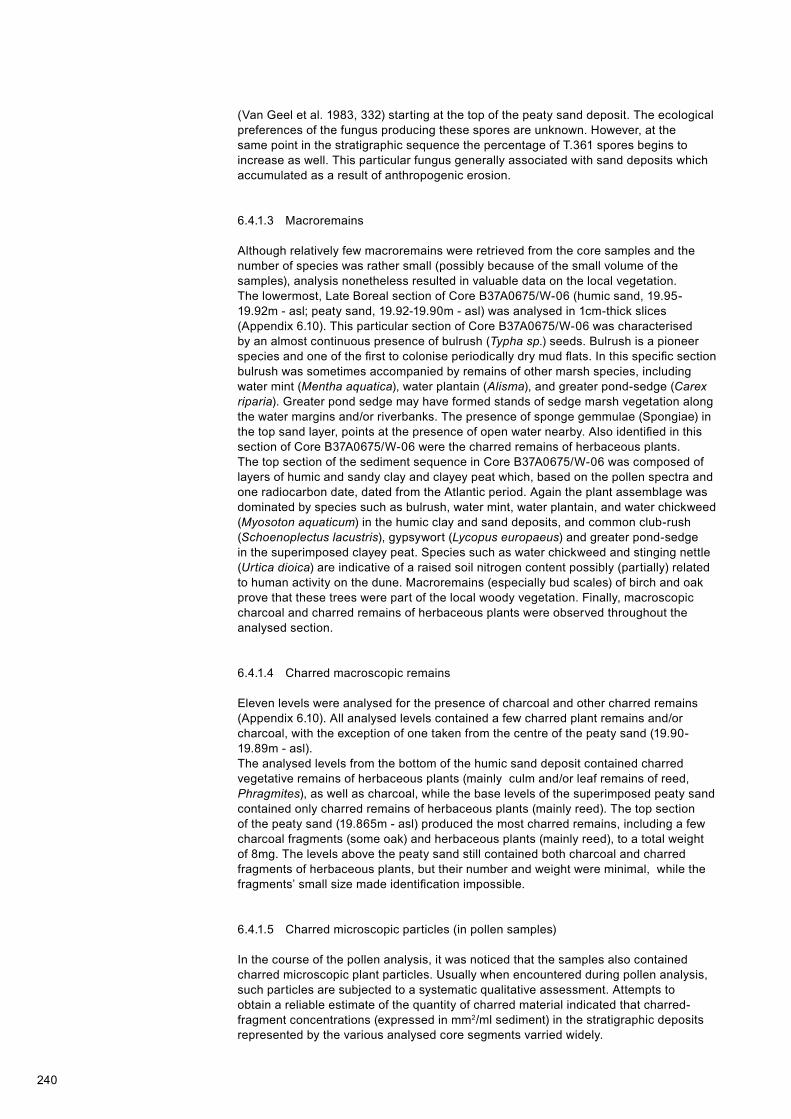
240
(Van Geel et al. 1983, 332) starting at the top of the peaty sand deposit. The ecological preferences of the fungus producing these spores are unknown. However, at the same point in the stratigraphic sequence the percentage of T.361 spores begins to increase as well. This particular fungus generally associated with sand deposits which accumulated as a result of anthropogenic erosion.
6.4.1.3 Macroremains
Although relatively few macroremains were retrieved from the core samples and the number of species was rather small (possibly because of the small volume of the samples), analysis nonetheless resulted in valuable data on the local vegetation.The lowermost, Late Boreal section of Core B37A0675/W-06 (humic sand, 19.95-19.92m - asl; peaty sand, 19.92-19.90m - asl) was analysed in 1cm-thick slices (Appendix 6.10). This particular section of Core B37A0675/W-06 was characterised by an almost continuous presence of bulrush (Typha sp.) seeds. Bulrush is a pioneer species and one of the first to colonise periodically dry mud flats. In this specific section bulrush was sometimes accompanied by remains of other marsh species, including water mint (Mentha aquatica), water plantain (Alisma), and greater pond-sedge (Carex riparia). Greater pond sedge may have formed stands of sedge marsh vegetation along the water margins and/or riverbanks. The presence of sponge gemmulae (Spongiae) in the top sand layer, points at the presence of open water nearby. Also identified in this section of Core B37A0675/W-06 were the charred remains of herbaceous plants.The top section of the sediment sequence in Core B37A0675/W-06 was composed of layers of humic and sandy clay and clayey peat which, based on the pollen spectra and one radiocarbon date, dated from the Atlantic period. Again the plant assemblage was dominated by species such as bulrush, water mint, water plantain, and water chickweed (Myosoton aquaticum) in the humic clay and sand deposits, and common club-rush (Schoenoplectus lacustris), gypsywort (Lycopus europaeus) and greater pond-sedge in the superimposed clayey peat. Species such as water chickweed and stinging nettle (Urtica dioica) are indicative of a raised soil nitrogen content possibly (partially) related to human activity on the dune. Macroremains (especially bud scales) of birch and oak prove that these trees were part of the local woody vegetation. Finally, macroscopic charcoal and charred remains of herbaceous plants were observed throughout the analysed section.
6.4.1.4 Charred macroscopic remains
Eleven levels were analysed for the presence of charcoal and other charred remains (Appendix 6.10). All analysed levels contained a few charred plant remains and/or charcoal, with the exception of one taken from the centre of the peaty sand (19.90-19.89m - asl).The analysed levels from the bottom of the humic sand deposit contained charred vegetative remains of herbaceous plants (mainly culm and/or leaf remains of reed, Phragmites), as well as charcoal, while the base levels of the superimposed peaty sand contained only charred remains of herbaceous plants (mainly reed). The top section of the peaty sand (19.865m - asl) produced the most charred remains, including a few charcoal fragments (some oak) and herbaceous plants (mainly reed), to a total weight of 8mg. The levels above the peaty sand still contained both charcoal and charred fragments of herbaceous plants, but their number and weight were minimal, while the fragments’ small size made identification impossible.
6.4.1.5 Charred microscopic particles (in pollen samples)
In the course of the pollen analysis, it was noticed that the samples also contained charred microscopic plant particles. Usually when encountered during pollen analysis, such particles are subjected to a systematic qualitative assessment. Attempts to obtain a reliable estimate of the quantity of charred material indicated that charred-fragment concentrations (expressed in mm2/ml sediment) in the stratigraphic deposits represented by the various analysed core segments varried widely.
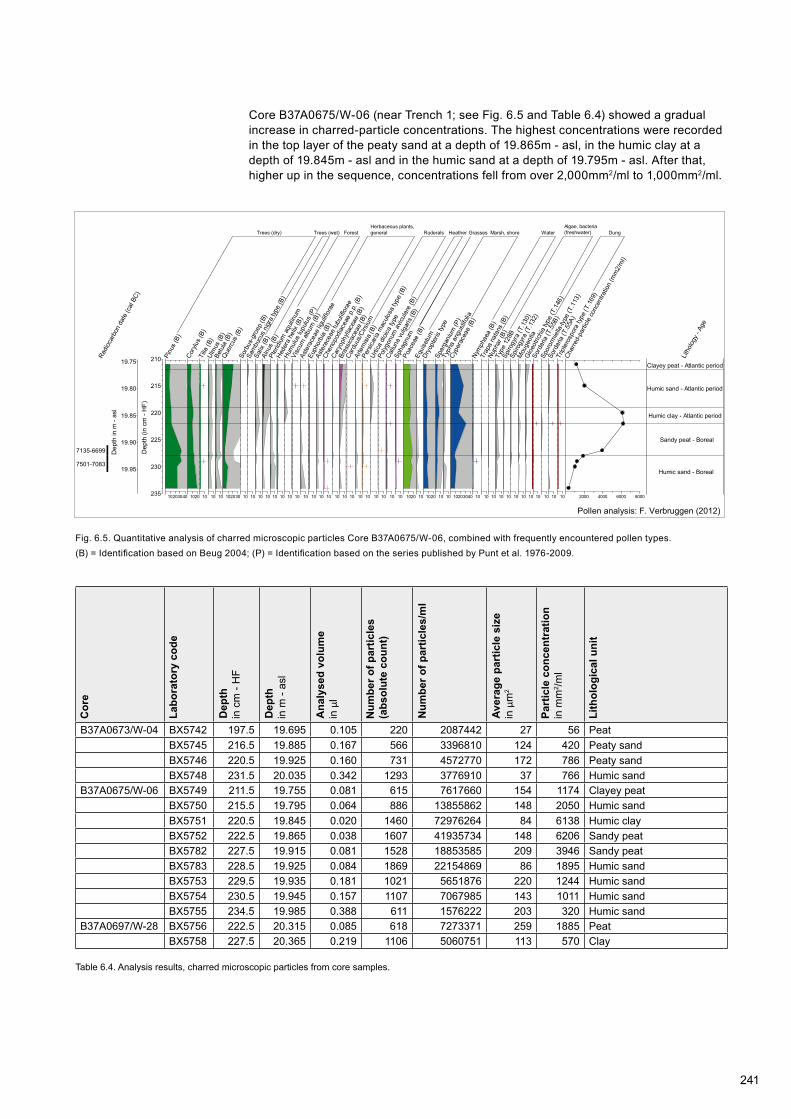
241
210
215
220
225
230
235
Dep
th (i
n cm
- H
F)
19.75
19.80
19.85
19.90
19.95
Dep
th in
m -
asl
7135-6699
7501-7083
Radi
ocar
bon
date
(cal
BC)
10203040
Pinu
s (B
)
1020
Cory
lus
(B)
10
Tilia
(B)
10
Ulm
us (B
)
10
Betu
la (B
)
102030
Que
rcus
(B)
10
Sorb
us-g
roep
(B)
10
Sam
bucu
s ni
gra
type
(B)
10
Salix
(B)
10
Alnu
s (B
)
10
Pter
idium
aqu
ilinum
10
Hede
ra h
elix
(B)
10
Hum
ulus
lupu
lus
(P)
10
Visc
um a
lbum
(B)
10
Aste
race
ae lig
uliflo
rae
10
Euph
orbi
a (B
)
10
Aste
race
ae tu
bulifl
orae
10
Chen
opod
iacea
e p.
p. (B
)
10
Cary
ophy
llace
ae (B
)
10
Bras
sicac
eae
(B)
10
Card
uus/
Cirs
ium
10
Arte
misi
a (B
)
10
Pers
icaria
mac
ulosa
type
(B)
10
Urtic
a di
oica
type
10
Polyg
onum
avic
ular
e (B
)
10
Callu
na v
ulga
ris (B
)
10
Spha
gnum
1020
Poac
eae
(B)
10
Equi
setu
m
1020
Dryo
pter
is ty
pe
10
Spar
gani
um (P
)
10
Typh
a an
gust
ifolia
10203040
Cype
race
ae (B
)
10
Nym
phae
a (B
)10
Trap
a na
tans
(B)
10
Nuph
ar (B
)10
Type
128
B
10Sp
irogy
ra (T
.130
)
10
Spiro
gyra
(T.1
32)
10
Mou
geot
ia
10
Glo
eotri
chia
type
(T.1
46)
10
Sord
aria
(T.5
5B)
10
Spor
orm
iella
-type
(T.1
13)
10
Sord
aria
(T.5
5A)
10
Trip
tero
spor
a ty
pe (T
.169
)
2000 4000 6000 8000
Char
red-
parti
cle c
once
ntra
tion
(mm
2/m
l)
Lith
olog
y - A
ge
Clayey peat - Atlantic period
Humic sand - Atlantic period
Humic clay - Atlantic period
Sandy peat - Boreal
Humic sand - Boreal
Trees (dry) Trees (wet) Forest Ruderals Heather Water DungGrassesgeneralHerbaceous plants,
Marsh, shoreAlgae, bacteria(freshwater)
Pollen analysis: F. Verbruggen (2012)
Fig. 6.5. Quantitative analysis of charred microscopic particles Core B37A0675/W-06, combined with frequently encountered pollen types. (B) = Identification based on Beug 2004; (P) = Identification based on the series published by Punt et al. 1976-2009.
Cor
e
Lab
orat
ory
code
Dep
th in
cm
- H
F
Dep
th in
m -
asl
Ana
lyse
d vo
lum
e in
µl
Num
ber o
f par
ticle
s (a
bsol
ute
coun
t)
Num
ber o
f par
ticle
s/m
l
Ave
rage
par
ticle
siz
e in
µm
2
Par
ticle
con
cent
ratio
n in
mm
2 /ml
Lith
olog
ical
uni
t
B37A0673/W-04 BX5742 197.5 19.695 0.105 220 2087442 27 56 PeatBX5745 216.5 19.885 0.167 566 3396810 124 420 Peaty sandBX5746 220.5 19.925 0.160 731 4572770 172 786 Peaty sandBX5748 231.5 20.035 0.342 1293 3776910 37 766 Humic sand
B37A0675/W-06 BX5749 211.5 19.755 0.081 615 7617660 154 1174 Clayey peatBX5750 215.5 19.795 0.064 886 13855862 148 2050 Humic sandBX5751 220.5 19.845 0.020 1460 72976264 84 6138 Humic clayBX5752 222.5 19.865 0.038 1607 41935734 148 6206 Sandy peatBX5782 227.5 19.915 0.081 1528 18853585 209 3946 Sandy peatBX5783 228.5 19.925 0.084 1869 22154869 86 1895 Humic sandBX5753 229.5 19.935 0.181 1021 5651876 220 1244 Humic sandBX5754 230.5 19.945 0.157 1107 7067985 143 1011 Humic sandBX5755 234.5 19.985 0.388 611 1576222 203 320 Humic sand
B37A0697/W-28 BX5756 222.5 20.315 0.085 618 7273371 259 1885 PeatBX5758 227.5 20.365 0.219 1106 5060751 113 570 Clay
Table 6.4. Analysis results, charred microscopic particles from core samples.
Core B37A0675/W-06 (near Trench 1; see Fig. 6.5 and Table 6.4) showed a gradual increase in charred-particle concentrations. The highest concentrations were recorded in the top layer of the peaty sand at a depth of 19.865m - asl, in the humic clay at a depth of 19.845m - asl and in the humic sand at a depth of 19.795m - asl. After that, higher up in the sequence, concentrations fell from over 2,000mm2/ml to 1,000mm2/ml.

242
The average total surface of the analysed particles in the various samples ranged from 140 to 220µm2, with the exception of a sample from the top of the humic sand (19.795m - asl) and in the humic clay (19.845m - asl); the average particle surface in this sample was 85µm2. The high particle concentrations in the clay are therefore not a product of their substantial size, but purely a reflection of the number of particles per ml sample, which was the highest of all analysed layers. The results of micromorphological analysis confirmed this (see Chapter 3.6.4). It is possible, however, that the distance over which the charred particles had been transported, together with the clay particles, was greater than in the case of the particles in the other layers.A comparison of these results with the quantity of macroscopic (i.e. visible with a binocular incident light microscope) charred particles reveals that the top section of the peaty sand (19.865m - asl) contained both many macroscopic, as many charred microscopic particles, and that the particles derived from herbaceous (including reed particles) and woody plants. In the humic clay layers above (19.845m - asl), on the other hand, a large number of microscopic fragments was not mirrored at a macroscopic level. Microscopic analysis showed that this material was highly fragmented. Again, both herbaceous and woody species were probably present.
6.4.2 Trench 2 – Core B37A0673/W-04
6.4.2.1 Analysed samples
Eleven levels of this core were examined for the presence of charcoal and other charred and waterlogged plant remains – the seven selected earlier for pollen analysis and four additional levels – in order to collect potentially suitable material for radiocarbon analysis (Fig. 6.3).
6.4.2.2 Palynological material
An assessment of the seven pollen samples revealed that three samples (one from the peaty sand and two from the peat) contained pollen material that was moderately to well preserved, but in insufficient concentrations for a reliable analysis. The four remaining samples, however, contained sufficient material which was moreover moderately to well preserved. These four samples were selected for analysis: one from the humic sand, the two topmost samples from the peaty sand on the dune, and one from the top of the peat. Figure 6.6 and Appendix 6.11 present analysis results for the pollen samples from Core B37A0673/W-04.
The pollen spectra for Core B37A0673/W-04 reveal a trend observed earlier in Core B37A0675/W-06: a transition from pine wood to mixed oak forest. In Core B37A0673/W-04 this vegetation change coincides with the transition between peaty sand and peat. It matches the two radiocarbon dates from Core B37A0673/W-04, which place the onset of the peat formation at the Boreal-Atlantic transition. These pine and (later developed) deciduous forests would exist at higher points in the landscape which surrounded the Yangtze Harbour site, including the river dune itself. A few bud scales of birch and/or oak and of alder retrieved from the peat prove that these trees actually grew on the dune.
Forests also grew further inland. Coastal landscapes such as that at the Yangtze Harbour site are often relatively open so that pollen may be scattered over fairly great distances, and it is possible that the tree pollen found on the dune derived not only from local trees but also from stands further away.Regarding the Yangtze Harbour landscape, the dune sand/peat transition in Core B37A0673/W-04, in addition to a shift from pine forest to deciduous forest, also showed a relative decrease in pollen from herbaceous plant species. The latter species either thrive everywhere, or morphological criteria alone do not allow a more precise identification than to family level, which makes it impossible to link these taxa to a specific environment. In the samples from the humic and peaty sand, the pollen involved belonged specifically to the goosefoot (Chenopodiaceae) and cress (Brassicaceae) families, and both Asteraceae tubuliflorae and Asteraceae liguliflorae from the aster family.
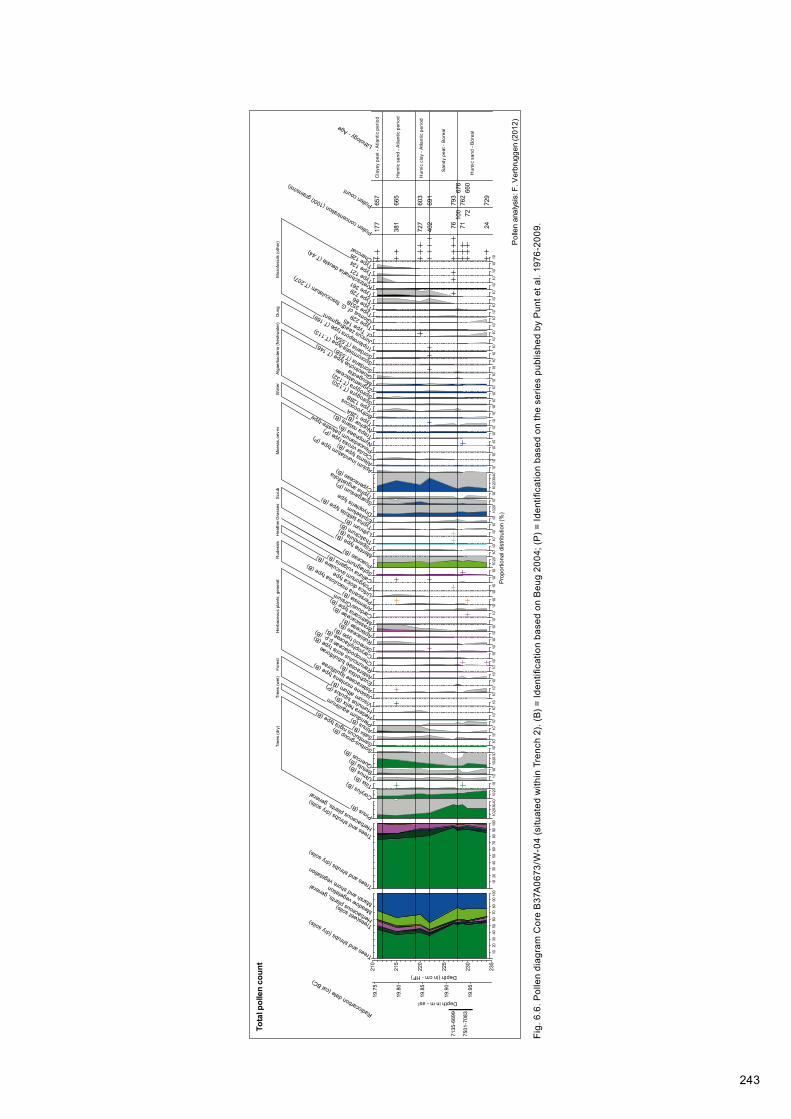
243
210
215
220
225
230
235
Depth (in cm -HB)
19.7
5
19.8
0
19.8
5
19.9
0
19.9
5
Depth in m -asl
7135
-669
9
7501
-708
3Radiocarbon date (cal BC)
1020
3040
5060
7080
9010
0
Trees and shrubs (dry soils)Trees(wet soils)
Herbaceous plants, general
Meadow vegetation
Marsh and shore vegetation
1020
3040
5060
7080
9010
0
Trees and shrubs (dry soils)
Trees and shrubs (dry soils)
Herbaceous plants, general
1020
3040
Pinus (B)
1020
Corylus (B)
10Tilia (B) 10Ulmus (B)
10Betula (B)
1020
30
Quercus (B) 10Sorbus-group (B)
10Sambucus nigra type (B)
10Salix (B)
10Alnus (B)
10Pteridium aquilinum
10Hedera helix (B)
10Humulus lupulus (P)
10Viscum album (B)
10Jasione montana type (B)
10Asteraceae liguliflorae
10Euphorbia (B)
10Asteraceae tubuliflorae
10Ranunculus acris type (B)
10Chenopodiaceae p.p. (B)
10Caryophyllaceae (B)10Senecio type (B)
10Rubiaceae (B)10Apiaceae (B)
10Brassicaceae (B)
10Matricaria type (B
)
10Carduus/Cirsium
10Artemisia (B)
10Persicaria maculosa type (B)
10Urtica dioica type
10Polygonum aviculare (B)
10Calluna vulgaris (B)
10Sphagnum
1020
Poaceae (B)
10Mentha type (B)
10
Pro
porti
onal
dis
tribu
tion
(%)
Filipendula (B)
10Thalictrum (B)
10Lythrum (B)
10Typha latifolia type (B)
10Equisetum
1020
Dryopteris type
10Sparganium (P)
10Typha angustifolia
1020
3040
Cyperaceae (B) 10Apium inundatum type (P)
10Alisma type (B)
10Cicuta virosa type (P)
10Peucedanum palustre-type
10Nymphaea (B)
10Trapa natans (B)
10Nuphar (B)
10Type 128A
10Botryococcus
10Type 128B
10Spirogyra (T.130)
10Spirogyra (T.132)
10Zygnemataceae
10Mougeotia
10Gloeotrichia type (T.146)
10Sordaria (T.55B)
10Sporormiella-type (T.113)
10Sordaria (T.55A)
10Tripterospora type (T.169)
10Juncus zaadfragment
10cf. Type 145
10Type 229
10Glomus cf. G. fa
sciculatum (T.207)
10Type 353B
10Type 86 10Type 729
10Type 361
10Kretzschmaria deusta (T.44)
10Type 121
10Type 124
10Type 126
10Charcoal
177
381
727
402 76
100
7172
24Pollen concentration (1000 grains/ml)
657
665
603
691
793
676
762
660
729
Pollen count
Lithology - Age
Cla
yey
peat
- A
tlant
icum
Hum
ic s
and
- Atla
ntic
um
Hum
ic c
lay
- Atla
ntic
um
San
dy p
eat -
Bor
eaal
Hum
ic s
and
- Bor
eaal
Tree
s (d
ry)
Tree
s (w
et)
Fore
stH
erba
ceou
s pl
ants
, gen
eral
Rud
eral
sH
eath
erS
crub
Moe
ras,
oev
erW
ater
Alg
ae/b
acte
ria (f
resh
wat
er)
Dun
gM
icro
foss
ils (o
ther
)G
rass
es
Tota
l pol
len
coun
t
Pol
len
anal
ysis
: F. V
erbr
ugge
n (2
012)
Fig.
6.6
. Pol
len
diag
ram
Cor
e B
37A
0673
/W-0
4 (s
ituat
ed w
ithin
Tre
nch
2). (
B) =
Iden
tifica
tion
base
d on
Beu
g 20
04; (
P) =
Iden
tifica
tion
base
d on
the
serie
s pu
blis
hed
by P
unt e
t al.
1976
-200
9.
Cla
yey
peat
- A
tlant
ic p
erio
d
Hum
ic s
and
- Atla
ntic
per
iod
Hum
ic c
lay
- Atla
ntic
per
iod
San
dy p
eat -
Bor
eal
Hum
ic s
and
- Bor
eal
Depth in m - asl
Depth (in cm - HF)

244
All analysed samples contained pollen of mugwort (Artemisia). Its presence in relatively young deposits is usually interpreted as a sign of human activity, because these species are known to follow human settlement. However, mugwort is a ruderal plant, which grows naturally in places where the soil has been disturbed, due to either human activity or natural causes. Some mugwort species are not ruderal, sea wood (Artemisia maritima) for example can be found in salt marshes. However, no evidence for the presence of saltmarsh species has come forward at the Yangtze Harbour site, which makes it more likely that the mugwort pollen represents the ruderal mugwort. In the case of Yangtze Harbour it is likely that mugwort grew in open places in the forest which covered the dune, or on the edge of the dune where it merged into marshy lower ground. In addition to mugwort pollen, the pollen spectrum for the dune sand also revealed another ruderal taxon, Fallopia. Pollen from this taxon was retrieved from the sample taken from the lowermost level of the humic sand. Black bindweed (Fallopia convolvulus), one of two species producing this type of pollen (Beug 2004, 191), often occurs on cultivated land (Weeda et al. 1985, 144). Of course there were no cultivated fields in the Late Boreal, when the local population consisted of hunter-gatherers. The second plant producing this type of pollen, however, is copse bindweed (Fallopia dumetorum), a species which prefers eutrophic places such as dry woodland edges and scrubland (van der Meijden 1996, 151). It is therefore likely that the Fallopia pollen in the sample derive from copse bindweed. The presence in one of the samples from Trench 1, Batch 2 of macroremains of copse bindweed suggests that this species was indeed part of the local vegetation on the dune (see Section 6.5.4.1.)Core B37A0673/W-04 also contained a few pollen grains of heather, especially in the samples from the humic and peaty sand which contained botanical material dated to the Boreal. This suggests that small patches of heather occurred here and there in forest clearings in the second part of the Boreal.Meadow communities, containing species such as rattle and sorel alongside grasses, could be found in many parts of the landscape around the Yangtze Harbour dune: in marshy reed beds but also in forest clearings and alder carr. High percentages of alder pollen and alder macroremains in the peat deposits prove that such biotopes existed in the area in the Atlantic period and coincided with the peat formation.
Pollen indicated that the undergrowth on the dune included typical herbaceous species such as loosestrife, meadow rue, spirea and mint, as indicated by pollen.In Core B37A0673/W-04 (Trench 2) pollen and spores of shore and marsh vegetation were well represented at all levels. Spores of a male-fern type (Dryopteris type), for example, were common. A number of plants produces such spores, including marsh fern (Thelypteris), which in reed beds is often the dominant undergrowth species (Weeda et al. 1985, 34), and male fern (Dryopteris filix-mas), which prefers light woodland areas (Weeda et al. 1985, 46). Other ferns producing this spore type are typical shore and marsh plants, such as crested buckler-fern (Dryopteris cristata) and both the broad and narrow buckler fern (Dryopteris dilatata and D. carthusiana). Besides wood-fern type pollen, sedges, bur-reed, horsetail and lesser bulrush (Typha angustifolia) appear prominently in the pollen samples from Core B37A0673/W-04. These are all typical shore and marsh species. Bur-reed is a so-called amphibious plant; it sometimes floats like a true water plant while elsewhere it may grow on the shore, usually in or near oligotrophic, running water (Weeda et al. 1994, 236). Lesser bulrush is a typical pioneer plant in hydrosere succession situations (Weeda et al. 1994, 243), an environment in which reed (Phragmites australis) is also common. Reed pollen, however, is virtually indistinguishable from pollen of other members of the grass family and therefore falls under the general Poaceae type. Reed may well have grown in the marshy environment of the Yangtze Harbour dune.During the accumulation of peat , and possibly even earlier, water lily grew near the site in open water. No other water plant pollen was identified. The presence of algae such as T.128A and T.128B sensu van Geel (van Geel et al. 1983), Debarya, Botryoccus and green algae of the Zygnemataceae family, such as Spirogyra (T.130 and T.132 sensu van Geel; Pals, van Geel, and Delfos 1980) indicates that open (fresh) water was present nearby. Algae remains were particularly common in the Boreal section of the sequence.An ascospore of Sordaria (T.55A sensu van Geel) was identified in a sample from the top of the peaty dune sand, an indication that dung was present in the environment of the site. This may have come from large herbivores which grazed in the area,

245
but Sordaria will also grow on the faeces of other organisms.The dune sand produced several so-called non-pollen palynomorphs, for example T.357 (Puccinia sp.), which is a plant fungus and causes a rusty-brown discoloration on for example leaves. Also common in the top of the peaty dune sand was T.361, which is often linked to human activity, because it indicates a deposition of sandy erosion material at the site, for example as a result of nearby deforestation (van Geel, Boncke, and Dee 1981, 438).
6.4.2.3 Macroremains
The humic and peaty sand layers in Core B37A0673/W-04 (Trench 2) produced only remains of terrestrial plants (Appendix 6.12). This could mean that the soils around the sampling location of Core B37A0673/W-04 were drier in the Late Boreal period than those at the location of Core B37A0675/W-06, which in the core section for this period contained many marsh plants. The main species in the sand layers of Core B37A0673/W-04 is stinging nettle (Urtica dioica), occasionally accompanied by all-seed goosefoot (Chenopodium polyspermum) and bud scales of birch (Betula). Birch prefers acidic, mostly oligotrophic soils; stinging nettle and all-seed goosefoot, on the other hand, both need eutrophic soils. All-seed goosefoot is a pioneer of (among others) disturbed, damp to wet sandy soils, which are dry for part of the year (Weeda et al. 1985, 160). Stinging nettle is a nitrophyte, which naturally occurs on various nutrient-rich locations such as damp deciduous forests, riparian forest, and the margins of marshes (Weeda et al. 1985). Perhaps stinging nettle grew near the dune in one of these locations. An alternative explanation is that the soils on the dune had become enriched with extra nitrogen as a result of human activity, which favoured stinging nettle as well as all-seed goosefoot. Human activity may also be responsible for the presence of charcoal and/or charred herbaceous plant remains in both the humic and the peaty sand layers.The peat in Core B37A0673/W-04 resembles the peat in Core B37A0675/W-06 in the composition of the macroremains assemblage. Also the peat deposits in Core B37A0675/W-06 were succeeded by a marsh vegetation with species such as bulrush (Typha), bittersweet (Solanum dulcamara), water plantain (Alisma) and tufted sedge (Carex elata). The peat also contained macroremains of stinging nettle, while macroremains of birch (Betula; bud scales/fruits) and black alder (Alnus glutinosa) suggest that these tree species may have contributed to the peat formation. Macroscopic charcoal was encountered sporadically in the peat layers.
6.4.2.4 Charred macroscopic remains
Of the eleven analysed levels, the lowest, deriving from the humic sand at a depth of 20.035m - asl, contained the most charcoal (Appendix 6.12): almost sixty charcoal fragments in total, fifty of which were too small to be identified, while the remainder came from oak. The total weight of the charcoal from this level (1cm thick, volume slightly over 6cm3) was 67mg, which is abundant for the Yangtze Harbour site. Most of the analysed levels of the peaty sand produced only a few, very small charcoal fragments, one of which could be identified as oak and another as a conifer. The peaty sand produced no charred remains at 19.895m - asl. None of the analysed levels of the humic sand and the peaty sand contained charred remains of herbaceous plants.Hardly any charred remains were observed in the peat above the peaty sand, only the level at 19.86 to 19.85m - asl produced three, unidentifiable charcoal fragments, together weighing less than 1mg. Charred remains of herbaceous plants were again absent.
6.4.2.5 Charred microscopic particles (in pollen samples)
Charred particles in the pollen samples of Core B37A0673/W-04 from Trench 2 revealed developments similar to those in Core B37A0675/W-06 from Trench 1 (Table 6.4 and Fig. 6.7), although in absolute terms the concentrations of charred particles in Core B37A0673/W-04 were significantly lower than in Core B37A0675/W-06. The

246
Fig. 6.7. Analysis results charred microscopic particles Core B37A0673/W-04, combined with frequently encountered pollen types. (B) = Identification based on Beug 2004; (P) = Identification based on the series published by Punt et al. 1976-2009.
195
200
205
210
215
220
225
230
235
Dep
th (i
n cm
-HB
)
19.70
19.75
19.80
19.85
19.90
19.95
20.00
20.05
Dep
th in
m -a
sl
7029-6606
7291-6779
Radi
ocar
bon
date
(cal
BC)
10203040
Pinu
s (B)
10
Betu
la (B
)
102030
Cory
lus (
B)
10
Tilia
(B)
10
Frax
inus e
xcels
ior ty
pe (B
)
10
Ulm
us (B
)
102030
Quer
cus (
B)
10
Vibu
rnum
opu
lus ty
pe (B
)
10
Salix
(B)
1020304050
Alnu
s (B)
10
Hede
ra h
elix
(B)
10
Pter
idium
aqu
ilinum
10
Cary
ophy
llace
ae (B
)
10
Chen
opod
iacea
e p.
p. (B
)
10
Aste
race
ae tu
bulifl
orae
10
Aste
race
ae lig
uliflo
rae
10
Bras
sicac
eae
(B)
10
Fallo
pia (B
)
10
Arte
misi
a (B
)10
Callu
na v
ulgar
is (B
)
1020Po
acea
e (B
)
10
Typh
a an
gusti
folia
10
Dryo
pter
is typ
e
10
Equis
etum
10
Cype
race
ae (B
)
10
Spar
ganiu
m (P
)
10
Nym
phae
a (B
)
10
Type
128
A
10
Type
128
B
10
Botry
ococ
cus
10
Spiro
gyra
(T.1
32)
10
Sord
aria
(T.5
5A)
200 400 600 800
Char
red-
parti
cle c
once
ntra
tion
(mm
2/m
l)
Lith
olog
y - A
ge
Peat - Atlanticum
Peaty sand - Boreaal
Humic sand - Boreaal
Trees (dry soils) Trees (wet) Ruderals Water (freshwater)Algae
DungForestHerbaceousplants, general
HeatherGrasses Marsh,shore
Pollen analysis: F. Verbruggen (2012)
highest concentrations were observed in the humic and peaty sand and the lowest in the peat, with those in the sand being up to thirteen times higher than those in the peat. Average particle size in the humic sand of this particular core was 37µm2. In the peaty sand on top of this it was much bigger, i.e. 124 and 172µm2 on average. The smallest average particle size for charred fragments (27µm2) was encountered in the peat. In other words: the humic sand contained very high concentrations of relatively small particles, while the succeeding layer of peaty sand contained larger particles and moreover in higher concentrations. The charred fragments in the peat were both smaller and less numeours, resulting in a much lower concentration (in mm2/ml) than in the humic sand. Perhaps the distance between the peat and the (dry) river dune was greater, as peat formation requires wet conditions. A comparison with the results of the macroscopic analysis (see above) showed high values macroscopically and microscopically for the humic sand at a depth of 20.035m - asl. The two samples from the peaty sand both produced charred remains, but their weight remained well below 1mg. The fact that the microscopic analysis revealed relatively high concentrations reflects the high degree of fragmentation of the charred particles. Unlike the charred macroscopic material from Core B37A0675/W-06 (Trench 1), the material from Core B37A0673/W-04 mainly derived from woody species.
6.4.3 Core B37A0697/W-28
6.4.3.1 Analysed samples
This core came from a depression east of the dune. Four core sections were examined for the presence of pollen, charcoal and other charred and waterlogged plant remains. From bottom to top the examined sequence represents the top of a moderately humic sand layer, two distinct clay layers, and the base of the peat.
Dep
th in
m -
asl
Dep
th (i
n cm
- H
F
Peat - Atlantic period
Peaty sand - Boreal
Humic sand - Boreal

247
222.
5
223.
0
223.
5
224.
0
224.
5
225.
0
225.
5
226.
0
226.
5
227.
0
227.
5
Depth (in cm -HB)
20.3
2
20.3
3
20.3
4
20.3
5
20.3
6
Depth in m -asl
7305
-683
2
Radiocarbon date (cal BC)
1020
3040
5060
7080
9010
0
Trees and shrubs (dry soils)Trees (damp/wet soils)
Herbaceous plants, general
Meadow vegetation
Marsh and shore vegetation
1020
3040
5060
7080
9010
0
Trees and shrubs (dry soils)
Trees (damp/wet soils)
Herbaceous plants, general
10Sorbus group (B)
10Tilia (B) 1020
30
Pinus (B)
1020
Corylus (B) 10Betula (B)
10Ulmus (B)
1020
3040
Quercus (B)
10Alnus (B)
10Salix (B)
10Humulus lupulus (P)
10Pteridium aquilinum
10Hedera helix (B)
10Polypodium
10Asteraceae tubuliflorae
10Chenopodiaceae p.p. (B)
10cf. Gentiana
10Matricaria type (B)10Senecio type (B)
10Apiaceae (B)10Ranunculus acris type (B)
10Asteraceae liguliflorae
10Brassicaceae (B)
10Rubiaceae (B)
10Artemisia (B)
10Persicaria maculosa type (B)
10Calluna vulgaris (B)
10Sphagnum
10Rumex acetosa type (P)
10Rumex crispus p.p. (P)
10
Pro
porti
onal
dis
tribu
tion
(%)
Ophioglossum vulgatum
1020
Poaceae (B)
10Trifolium (B)
10Dryopteris type
10Sparganium (P)
10Alisma type (B)
1020
Cyperaceae (B)
10Equisetum
10Typha angustifolia
10Oenanthe fistulosa type (P)
10Apium inundatum type (P)
10Glyceria type
10cf. Trapa natans (B)
10Nuphar (B)
10Nymphaea (B)
10Spirogyra (T.130)
10Spirogyra (T.132)
10Type 128B
10Type 128A
10Zygnemataceae
10Gloeotrichia type (T.146)
10Cercophora type (T.112)
10Sordaria (T.55A)
10Sordaria (T.55B)
10Sporormiella type (T.113)
10Type 86 10Puccinia sp. (T.357)
10Geolossum sphagnophilum (T.77A)
10Type 361
10Type 179
10Type 353A
10Charcoal
304 53Pollen concentration (1000 grains/ml)
659
634
Pollen count
Lithology - Age
Pea
t- Tr
ansi
tion
Atla
ntic
per
iod
Bro
wn
clay
- Tr
ansi
tion
Atla
ntic
perio
d
Bla
ck c
lay
- Bor
eaal
Tree
s (d
ry)
Tree
s (w
et)
Fore
stH
erba
ceou
s pl
ants
, gen
eral
Rude
rals
Hea
ther
Gra
sses
Mar
sh a
nd s
hore
veg
etat
ion
Wat
er(fr
eshw
ater
)A
lgae
/bac
teria
Dun
gM
icro
foss
ils (o
ther
)
Tota
l pol
len
coun
t
Pol
len
anal
ysis
: F. V
erbr
ugge
n (2
012)
Fig.
6.8
. Pol
len
diag
ram
Cor
e B
37A
0697
/W-2
8. (B
) = Id
entifi
catio
n ba
sed
on B
eug
2004
; (P)
= Id
entifi
catio
n ba
sed
on th
e se
ries
publ
ishe
d by
Pun
t et a
l. 19
76-2
009.Depth in m - asl
Depth (in cm - HF)
Pea
t - T
rans
ition
Atla
ntci
per
iod

248
6.4.3.2 Palynological material
After assessment, two of the four pollen samples were analysed. Pollen analysis was not possible for the moderately humic sand of the dune, because of the low concentration and poor preservation of the pollen. The sample from the layer above, a black clay interpreted as the upper Wijchen Layer and part of the Boxtel Formation (Fig. 3), lent itself to a pollen count.The second analysed sample came from the base of the dated peat layer above the black clay layer.
Fig. 6.8 and Appendix 6.13 present the pollen analysis results. It should be noted that they are based on only two samples, and that small fluctuations in the vegetation are invisible in this diagram. The pollen spectra of Core B37A0697/W-28 are very similar to those of Cores B37A0673/W-04 and B37A0675/W-06.Once again, the pollen samples reflect a transition from pine forest (the clay layer) to mixed oak forest (the base of the peat), which places the lower pollen sample in the Late Boreal period and the peat sample at the Boreal-Atlantic transition. The fact that the pollen spectrum for the black clay layer reflects the Boreal period does not automatically imply that the clay layer itself was therefore formed in the Boreal. Black soil formation may have occurred after the clay deposits had become inundated as a result of rising ground water levels, which in turn was caused by rising sea levels.Forests in the Late Boreal contained pine as well as hazel and oak, and to a lesser extent birch, elm, lime, and species of the rowan group (Sorbus group). These forests probably covered the dune top and flanks. The peat of Core B37A0697/W-28 produced bud scales of birch, which suggests that this species occurred locally. Alder and willow grew in lower, more damp places. The low percentages for alder pollen in the analysed sequence, despite highly favourable conditions for that species, suggests that this pollen spectrum, also reflects the Boreal-Atlantic transition. Boreal and Early Atlantic forests included hop and ivy, besides ferns such as bracken and polypody. As before, a small quantity of heather pollen reflected the presence of this small shrub in forest clearings. Both analysed sections furthermore contained grass pollen, while pollen of various docks and sorrels, such as common-sorrel type (Rumex acetosa type) and curled dock (Rumex crispus p.p.) as well as clover (Trifolium), together with spores of adder’s tongue (Ophioglossum vulgatum) give an impression of the types of herbaceous plants and ferns growing among the grasses. According to the pollen analysis other elements of this herbaceous vegetation included representatives of the families Brassicaceae, Rosaceae, Chenopodiaceae, Apiaceae, Rubiaceae, and Asteraceae, (the latter represented by Matricaria and Senecio) and Ranunculus acris type.
Core B37A0697/W-28 also contained pollen of ruderal species, albeit in low percentages. Mugwort was present in both samples and persicaria type was encountered in the peat sample. Interestingly, although both pollen types may occur naturally persicaria type pollen was found at the base of the peat in this core, while the same type was encountered in Core B37A0675/W-06 (Trench 1) in the sandy deposits of the river dune. The knotweed (Fallopia type) identified in Core B37A0673/W-04 (Trench 2) also occurred in the humic dune sand. If the persicaria type indeed indicates human presence, the implication is that people were still living nearby at the onset of peat accumulation on the east flank of the dune during the Boreal-Atlantic transition.That lower parts of this landscape were relatively damp is revealed by the nature of the sediments (black clay and peat) and by high percentages for pollen and spores of shore and marsh plants such as sedges, bur-reed, bulrush and male fern (Dryopteris type). It is highly likely that some of the grass pollen derive from reed, which is to be expected in a marshy environment like this. In open water grew water plants such as yellow water-lily, white water-lily (one seed was also identified), and probably water chestnut, as well as a number of freshwater algae.In Core B37A0697/W-28, dung fungi of the types Cercophora, Sordaria and Sporormiella were found only in peat, the same layer that also contained pollen of persicaria type. Also well represented in the peat was the fungus T.361, a species also identified in Core B37A0675/W-06 (Trench 1), especially in peaty sand and humic sand. Again these levels are more or less similar to those which produced pollen of the persicaria type. All these microfossils are suggestive of human presence; as was mentioned earlier with regard to Core B37A0675/W-06, fungus T.361 is also associated with human activity (van Geel et al. 1981, 438).
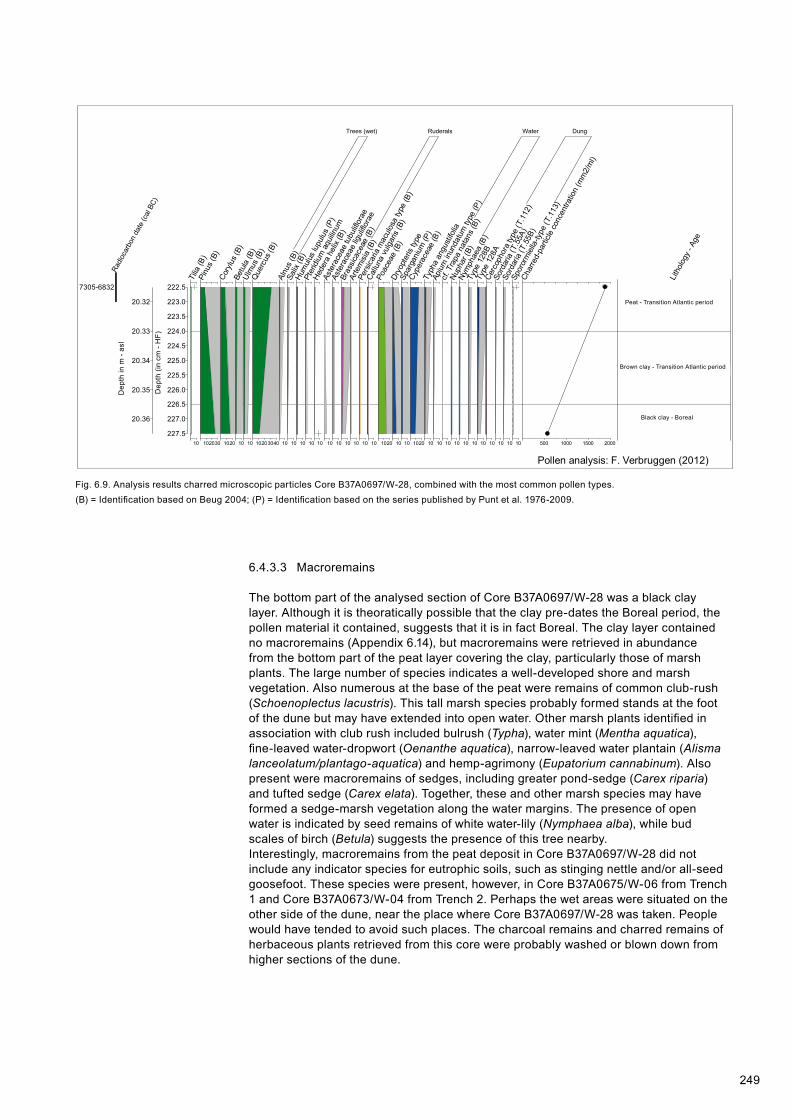
249
Fig. 6.9. Analysis results charred microscopic particles Core B37A0697/W-28, combined with the most common pollen types.(B) = Identification based on Beug 2004; (P) = Identification based on the series published by Punt et al. 1976-2009.
222.5
223.0
223.5
224.0
224.5
225.0
225.5
226.0
226.5
227.0
227.5
Dep
th (i
n cm
-HB
)
20.32
20.33
20.34
20.35
20.36
Dep
th in
m -a
sl
7305-6832
Radi
ocar
bon
date
(cal
BC)
10
Tilia
(B)
102030
Pinu
s (B
)
1020
Cory
lus (
B)
10
Betu
la (B
)
10
Ulm
us (B
)
10203040
Que
rcus
(B)
10
Alnu
s (B
)
10
Salix
(B)
10
Hum
ulus
lupu
lus
(P)
10
Pter
idiu
m a
quilin
um
10
Hede
ra h
elix
(B)
10
Aste
race
ae tu
bulifl
orae
10
Aste
race
ae lig
uliflo
rae
10
Bras
sicac
eae
(B)
10
Arte
misi
a (B
)
10
Pers
icaria
mac
ulos
a ty
pe (B
)
10
Callu
na v
ulga
ris (B
)
1020
Poac
eae
(B)
10
Dryo
pter
is ty
pe
10
Spar
gani
um (P
)
1020
Cype
race
ae (B
)10
Typh
a an
gust
ifolia
10
Apiu
m in
unda
tum
type
(P)
10cf
. Tra
pa n
atan
s (B
)
10Nu
phar
(B)
10
Nym
phae
a (B
)
10
Type
128
B
10
Type
128
A
10
Cerc
opho
ra ty
pe (T
.112
)
10
Sord
aria
(T.5
5A)
10
Sord
aria
(T.5
5B)
10
Spor
orm
iella
-type
(T.1
13)
500 1000 1500 2000
Char
red-
parti
cle c
once
ntra
tion
(mm
2/m
l)
Lith
olog
y - A
ge
Peat - Transition Atlanticum
Brown clay - Transition Atlantic
period
Black clay - Boreaal
Trees (wet) Ruderals Water Dung
Pollen analysis: F. Verbruggen (2012)
6.4.3.3 Macroremains
The bottom part of the analysed section of Core B37A0697/W-28 was a black clay layer. Although it is theoratically possible that the clay pre-dates the Boreal period, the pollen material it contained, suggests that it is in fact Boreal. The clay layer contained no macroremains (Appendix 6.14), but macroremains were retrieved in abundance from the bottom part of the peat layer covering the clay, particularly those of marsh plants. The large number of species indicates a well-developed shore and marsh vegetation. Also numerous at the base of the peat were remains of common club-rush (Schoenoplectus lacustris). This tall marsh species probably formed stands at the foot of the dune but may have extended into open water. Other marsh plants identified in association with club rush included bulrush (Typha), water mint (Mentha aquatica), fine-leaved water-dropwort (Oenanthe aquatica), narrow-leaved water plantain (Alisma lanceolatum/plantago-aquatica) and hemp-agrimony (Eupatorium cannabinum). Also present were macroremains of sedges, including greater pond-sedge (Carex riparia) and tufted sedge (Carex elata). Together, these and other marsh species may have formed a sedge-marsh vegetation along the water margins. The presence of open water is indicated by seed remains of white water-lily (Nymphaea alba), while bud scales of birch (Betula) suggests the presence of this tree nearby.Interestingly, macroremains from the peat deposit in Core B37A0697/W-28 did not include any indicator species for eutrophic soils, such as stinging nettle and/or all-seed goosefoot. These species were present, however, in Core B37A0675/W-06 from Trench 1 and Core B37A0673/W-04 from Trench 2. Perhaps the wet areas were situated on the other side of the dune, near the place where Core B37A0697/W-28 was taken. People would have tended to avoid such places. The charcoal remains and charred remains of herbaceous plants retrieved from this core were probably washed or blown down from higher sections of the dune.
Dep
th in
m -
asl
Dep
th (i
n cm
- H
F)
Brown clay - Transition Atlantic period
Peat - Transition Atlantic period
Black clay - Boreal
250
6.4.3.4 Charred macroscopic remains
Charred remains were retrieved from both the black clay and the peat (Appendix 6.14). The fragments were very small, the combined weight of the remains of all levels amounting to less than 1mg. Both samples seemed to contain more charred remains of herbaceous plants (including reed) than of woody species, but charcoal was encountered in both. Charcoal of willow was identified in the black clay. The charcoal from the peat came from unidentifiable conifer species, and one fragment may be hazel.
6.4.3.5 Charred microscopic particles (in pollen samples)
The results of the macroscopic and microscopic analyses complemented each other. Two samples of Core B37A0697/W-28, one from the black clay and the other from the peat, were examined for the presence of charred fragments (Table 6.4 and Fig. 6.9). The only charred fragments revealed by macroscopic analysis were too small for weight assessment. Microscopic analysis showed that the clay sample contained the smallest charred particles. Although in absolute terms the software recognised more particles as charred in the clay than in the peat, the clay contained fewer particles per ml, i.e. in concentration, than the peat (see Fig. 6.9).If the presence of charred material indeed indicates human activity nearby – and at the Yangtze Harbour dune site this is likely – this would confirm the pollen analysis results. There, too, indicators for human presence were found mainly in the peat. The analysis results of the other two cores match these observations.In conclusion, analysis of both pollen and (macroscopic and microscopic) charred remains suggests that evidence for human presence is concentrated in Core B37A0675/W-06 (Trench 1) and Core B37A0673/W-04 (Trench 2) in the sandy dune deposits, and in Core B37A0697/W-28 at the base of the peat. In each case the core segments in question date to the Boreal-Atlantic transition.
6.5 Analysis results and interpretation of the archaeological layers
Analysis of the archaeological layers on the dune focussed on Trenches 1 and 2. Little botanical material was retrieved from Trench 3, also the dune top deposits in that trench had been eroded away. The analysis results (pollen, macroremains, charcoal) will be discussed by trench and batch.
6.5.1 Pollen remains
Ten pollen sub-samples from 5-litre samples taken at different horizontal (sections) and vertical (batches) locations in Trenches 1 and 2, were analysed. Figure 6.2 shows the pollen samples’ location, while Appendix 6.15 and Figure 6.10 summarise the analysis results. Because there was no direct stratigraphic link between the different samples, the pollen diagram is a histogram rather than a line diagram. In the histogram the samples are organised by batch and by trench number.
6.5.1.1 Trench 1
The archaeological layer in Trench 1 was subdivided into four batches numbered 0 to 3.
Trench 1, Batch 3The bottom section of Batch 3 was sampled twice: Sample Number 401, Section 1 and Sample Number 402, Section 2. The two samples each produced a very different pollen spectrum. Pollen sample 401, Section 1, for example, contained many pollen of pine and hazel, but fewer of oak and alder, which places the sample in the Late Boreal period or at the Boreal-Atlantic transition. This matches the radiocarbon date obtained on botanical material, ca. 7022 to 6595 BC (GrA-55484, 7860 ± 45 BP). The pollen sample contained very few grass pollen, but sedge pollen were numerous, indicating
251
that the area around this dune extension probably included large stands of sedge and/or club rush (Schoenoplectus). Also identified were pollen of pondweed (Potamogeton), another water plant giving yet another indication of the presence of open water at this time.The other analysed sample from Batch 3 (Sample number 402, Section 2) produced a pollen spectrum that was surprisingly different from that produced by the sample from the-adjoining Section 1. The Section-2 sample mainly contained pollen of alder and oak, but relatively few pine pollen. This would date the sample to the Atlantic rather than the Boreal period. Pollen and spores of sedge, bur-reed and especially male fern (Dryopteris type), which tended to be common in the other samples, were rare in Sample 402. Grass pollen, on the other hand, were common, and also present were ascospores of dung fungus. This large discrepancy between pollen spectra from two samples from the same batch and trench may be a result of the sampling methods. Alternatively, the local terrain may have been so uneven that the two samples, though from the same batch, in fact came from different contexts.
Trench 1, Batch 2Batch 2 also contributed two pollen samples to the analysis, Sample Number 393, Section 2 and Sample Number 404, Section 15. Botanical material from Batch 2, Section 2 provided a radiocarbon date of 7047 to 6699 BC (GrA-55483, 7970 ± 45), or the Boreal-Atlantic transition. The pollen spectra of the two samples are very similar. Alder pollen was present in low quantities in both samples, and pine pollen were relatively more common than oak pollen. In addition to tree pollen, the samples contained pollen and spores of a number of herbaceous forest species, such as hop, polypody, ivy, and bracken. Other herbaceous taxa represented by their pollen included members of the families Caryophyllaceae, Brassicaceae, Asteraceae, and Chenopodiaceae, and black-horehound type (Ballota type). Compared to the other samples, the samples from Batch 2 produced low percentages for tree-pollen, but very high percentages for pollen and spores of shore and marsh species, mainly due to the relative abundance of sedge and bur-reed pollen in both samples. Pollen of truly aquatic species were not identified in this batch. There were bodies of freshwater in the vicinity, however, as the various identified species of freshwater algae prove. No dung fungus ascospores were found in the analysed samples from Batch 2.
Trench 1, Batch 1Only one pollen sample from Batch 1 was analysed, Sample Number 385, Section 7. It contained relatively many elm pollen, and also pine pollen occurred in fairly high percentages. This suggests a Boreal-Atlantic transitional date for this sample. Spores of male fern (Dryopteris type) , grass pollen (including reed), and sedges were also well represented, but aquatic species were absent and algae remains were present only in very small quantities.
Trench 1, Batch 0One sample from Batch 0 was analysed, Sample Number 382, Section 8.Botanical material from this sample produced a radiocarbon date for this batch of 6812 to 6508 BC (GrA-55482, 7820 ± 45 BP). Despite this seemingly straightforward Early Atlantic date, Sample 382 was probably contaminated. Several pollen of beech (Fagus) were identified, but beech first appeared in the Netherlands in the Late Subboreal period (Bronze Age) and did not spread until the Subatlantic period (Iron Age and later). The presence of beech pollen in Sample 382, in combination with those of the ruderal ribwort plantain (Plantago lanceolata), suggests contamination with sediments dating from ca. 2000 BC or later. The top section of Batch 0 was eroded, with younger dune sand lying directly on top of peat or river clays in the entire dune area. Elsewhere in the river valley some tidal gully deposits of the Wormer Member can be found beneath younger sea sands. It is likely that the topsoils at this location were not completely removed prior to field research, so that sediments in Sample 382, taken from what was indeed Level 0, became mixed up with much younger deposits above. Yet another sign of contamination was the presence of many diatoms native to salt or brackish environments, such as siliceous remains of Podosira stelliger, habitats of which include tidal gullies (Hendey 1974; Metcalfe et al. 2000, 103) and Aulacodiscus argus, a marine benthic diatom (Hasle and Syvertsen 1996, 141). Other identified remains of marine organisms included dinoflagellate cysts (marine plankton) and Foraminiferae
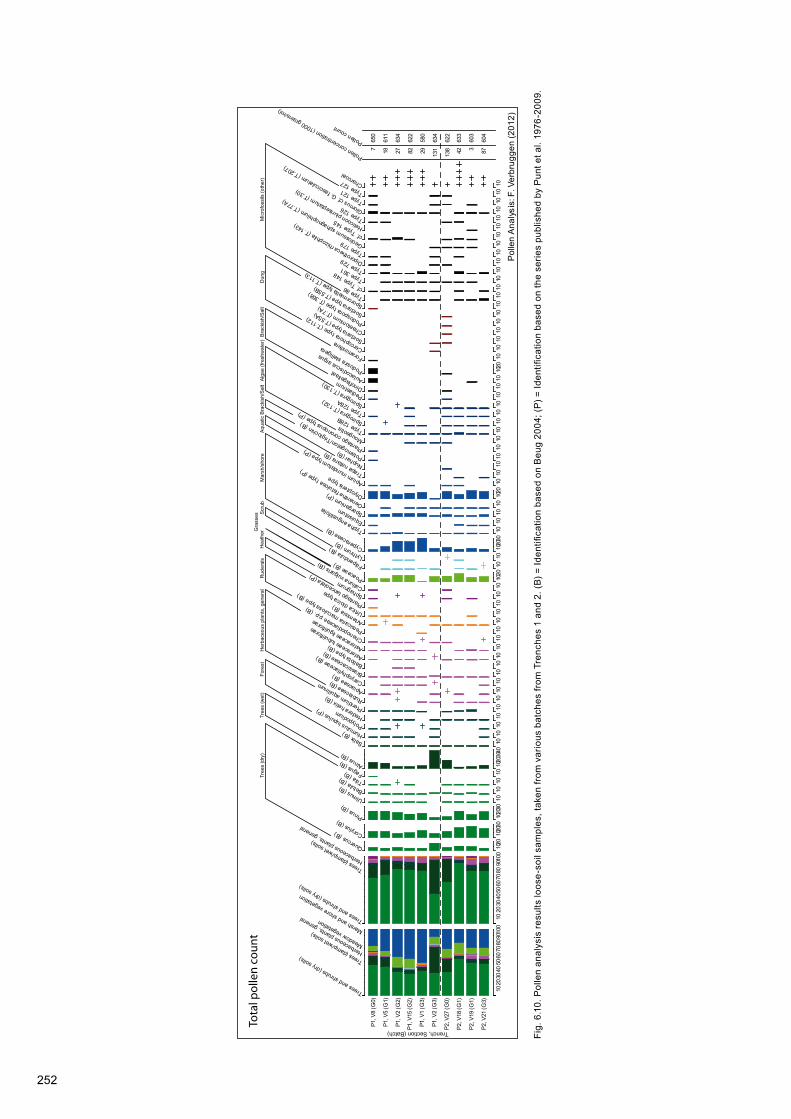
252
P1, V
8 (G
0)
P1, V
5 (G
1)
P1, V
2 (G
2)
P1, V
15 (G
2)
P1, V
1 (G
3)
P1, V
2 (G
3)
P2, V
27 (G
0)
P2, V
18 (G
1)
P2, V
19 (G
1)
P2, V
21 (G
3)
Trench, Section (Batch)
1020
3040
5060
7080
9010
0
Trees and shrubs (dry soils) Trees (damp/wet soils)
Boskruiden
Herbaceous plants, general
Ruderalen
Heide- en hoogveenplanten
Ruigtekruiden
Meadow vegetationMarsh and shore vegetation
1020
3040
5060
7080
9010
0
Trees and shrubs (dry soils)
Trees (damp/wet soils)
Boskruiden
Herbaceous plants, general
Ruderalen
Heide- en hoogveenplanten
1020Quercus (B
) 1020
30
Corylus (B) 1020
30
Pinus (B)
10Ulmus (B)
10Betula (B)
10Tilia (B) 10Fagus (B)
1020
3040
Alnus (B)
10Salix (B) 10Humulus lupulus (P)
10Polypodium
10Hedera helix (B)
10Pteridium aquilinum
10Rubiaceae (B)
10Apiaceae (B)
10Caryophyllaceae (B)
10Brassicaceae (B)
10Ballota type (B)
10Asteraceae tubuliflorae
10Asteraceae liguliflo
rae10Chenopodiaceae p.p. (B
)10Persicaria maculosa type (B
)
10Artemisia (B)
10Urtica dioica type
10Plantago lanceolata (P)
10Sphagnum
10Calluna vulgaris (B)
1020
Poaceae (B) 10Filipendula (B)
10Lythrum (B)
1020
30
Cyperaceae (B) 10Typha angustifolia
10Equisetum 10Sparganium (P)
10Oenanthe fistulosa type (P)
1020Dryopteris type
10Apium inundatum type (P)
10Trapa natans (B)
10Nuphar (B)
10Potamogeton/Triglochin (B)
10Plantago coronopus type (P)
10Mougeotia 10Type 128B
10Spirogyra (T.132)
10Type 128A
10Spirogyra (T.130)
10Pediastrum
10Dinoflagellaat
10Aulacodiscus argus
1020Podosira stelligera
10Foraminifera
10Cercophora type (T.112)
10Sordaria type (T.55A)
10Chaetomium (T.7A)
10Podospora type (T.368)
10Sordaria type (T.55B)
10Sporormiella type (T.113)
10Type 86 10cf. Type 148
10Type 361 10Type 729 10Diporotheca rhizophila (T.143)
10Type 179 10Geolossum sphagnophilum (T.77A)
10cf. Type 145
10Helicoon pluriseptatum (T.30)
10Type 126 10Glomus cf. G. fa
sciculatum (T.207)
10Type 121 10Type 127 10Charcoal
7 18 27 82 29 131
138 42 3 87Pollen concentration (1000 grains/ml)
650
611
634
622
580
634
622
633
603
604
Pollen count
Tree
s (d
ry)
Tree
s (w
et)
Fore
stH
erba
ceou
s pl
ants
, gen
eral
Rud
eral
sH
eath
erG
rass
es Scr
ubM
arsh
/sho
reA
quat
ic B
rack
ish/
Sal
tA
lgae
(fre
shw
ater
)B
rack
ish/
Sal
tD
ung
Mic
rofo
ssils
(oth
er)
Pol
len
Ana
lysi
s: F
. Ver
brug
gen
(201
2)
Tota
l pol
len
coun
t
Fig.
6.1
0. P
olle
n an
alys
is re
sults
loos
e-so
il sa
mpl
es, t
aken
from
var
ious
bat
ches
from
Tre
nche
s 1
and
2. (B
) = Id
entifi
catio
n ba
sed
on B
eug
2004
; (P)
= Id
entifi
catio
n ba
sed
on th
e se
ries
publ
ishe
d by
Pun
t et a
l. 19
76-2
009.

253
(marine benthic organisms). Nonetheless the contamination of Sample 382 does not appear to be extensive, as its vegetation spectrum does not reveal any major discrepancies with those produced by other analysed samples (Fig. 6.10).
6.5.1.2 Trench 2
In Trench 2 the only archaeological layers sampled for pollen analysis were Batches 0, 1 and 3. The samples came from a number of different sections.
Trench 2, Batch 3Batch 3 in this trench produced one sample, Sample Number 447, Section 21. Among the tree pollen, pine was more common that oak and alder, which suggests a Late Boreal rather than an Early Atlantic date for this sample. Also identified were grass pollen and spores of male fern (Dryopteris type), and to a lesser extent pollen of sedges and bur-reed. Water chestnut was represented in this sample by three pollen grains.
Trench 2, Batch 1Two pollen samples from Batch 1 were analysed, Sample Number 422, Section 18 and Sample Number 424, Section 19. These two sections adjoined, and it is therefore hardly surprising that the two pollen spectra are very similar.
Pine pollen were more numerous in these samples that oak pollen. The percentage for alder pollen was low, which in itself would suggest a Late Boreal or transitional Late Boreal to Early Atlantic date. This would be slightly younger than the radiocarbon date produced by botanical macroremains from Sample Number 424, Section 19, which indicated a range of 8250 to 7956 BC (GrA-55485, 8920 ± 45). The discrepancy may be a result of contamination during retrieval, perhaps some of the scooped-up layers were younger or older layers than the target layer. Moreover, the botanical macroremains suggest an Early Boreal date for the sample. Both samples contained hazel pollen in fairly high percentages, as well as spores of male fern (Dryopteris type), and pollen of grasses and sedges. Unlike the sample from Batch 1, Trench 1, the Trench-2 pollen samples also produced pollen of aquatic species such as water lily and water chestnut, besides a number freshwater algae. Dung fungus ascospores were not encountered in Batch 1.
Trench 2, Batch 0The one analysed sample from the top of Batch 0 came from Section 27 (Find number 416, Section 27). The sample contained 55% tree pollen, mostly alder, which suggests an Atlantic date. Other tree species that were well represented included pine, oak and hazel, and to a lesser extent elm, birch and lime. The remaining 45% consisted of pollen and spores of herbaceous plants. Spores of male fern (Dryopteris type) were the most common, followed by pollen of grasses and sedges. These species thrive in damp environments such as shores and marshes, and their presence therefore indicates that the local landscape was fairly damp to wet. Reed is often an important component of the vegetation in such locations. However, it is difficult and often impossible to distinguish reed pollen (Phragmites australis) from those of other grasses on the basis of pollen morphology alone. In this case, however, at least some of the grass pollen in this and other samples collected from the batches probably came from reed.18 The presence of reed among the macrobotanical remains from the archaeological layer (e.g. Batch 0, Trench 2 and Batch 1, Trench 2) proves that the species indeed occurred in the local landscape of the study area. Pollen of water plants such as yellow water-lily and whorled water-milfoil (Myriophyllum verticillatum) were also identified, as were many freshwater algae. Also present, however, were plants characteristic of dry places, such as representatives of the families Brassicaceae, Asteraceae and Chenopodiaceae, as well as heather. Mugwort was present in large numbers. Sample Number 416, Section 27 from Trench 2 also contained remains of marine organisms, as did Sample Number 382 from Batch 0, Trench 1. In Sample 416 these remains consisted of two dinoflagellate cysts and one fragment of a diatom skeleton. Since these are very small numbers, and also because the sample had probably become slightly contaminated during retrieval, these marine organisms cannot be taken as evidence for a nearby marine environment coeval with the deposition of archaeological

254
P1,
V8
(G0)
P1,
V5
(G1)
P1,
V2
(G2)
P1,
V15
(G2)
P1,
V1
(G3)
P1,
V2
(G3)
P2,
V27
(G0)
P2,
V18
(G1)
P2,
V19
(G1)
P2,
V21
(G3)
Trench, Section (Batch)
1020
3040
5060
7080
9010
0
Trees and shrubs (dry soils)Trees (damp/wet soils)
Boskruiden
Herbaceous plants, general
Ruderalen
Heide- en hoogveenplanten
Ruigtekruiden
Meadow vegetation
Marsh and shore vegetation
1020Quercus (B)
1020
30
Corylus (B) 1020
30
Pinus (B)
10Ulmus (B)
10Betula (B)
10Tilia (B) 10Fagus (B)
1020
3040
Alnus (B)
10Brassicaceae (B)
10Asteraceae tubuliflorae
10Asteraceae liguliflorae
10Persicaria maculosa type (B)
10Artemisia (B)
10Urtica dioica type
10Plantago lanceolata (P)10Sphagnum
10Calluna vulgaris (B)
1020Poaceae (B)
1020
30Cyperaceae (B)
10Typha angustifolia
10Sparganium (P)
10Oenanthe fistulosa type (P)
1020Dryopteris type
10Trapa natans (B)
10Type 128B
10Spirogyra (T.132)
10Type 128A
10Aulacodiscus argus
1020Podosira stelligera
10Cercophora type (T.112)
10Sordaria type (T.55A)
10Chaetomium (T.7A)
10Podospora type (T.368)
10Sordaria type (T.55B)
10Sporormiella type (T.113)
500
1000
1500
Charred-particle concentration (m
m2/ml)
Tree
s (d
ry)
Rude
rals
Heat
her
Gra
sses
Dun
gTr
ees
(wet
)pl
ants
, gen
eral
Her
bace
ous
Mar
sh, s
hore
Wat
erAlg
ae (f
resh
wat
er)
Bra
ckis
h/S
alt
Pol
len
anal
ysis
: F. V
erbr
ugge
n (2
012)
Fig.
6.1
1. A
naly
sis
resu
lts, c
harr
ed m
icro
scop
ic p
artic
les
from
loos
e-so
il sa
mpl
es, t
aken
from
var
ious
bat
ches
from
Tre
nche
s 1
and
2.(B
) = Id
entifi
catio
n ba
sed
on B
eug
2004
; (P)
= Id
entifi
catio
n ba
sed
on th
e se
ries
publ
ishe
d by
Pun
t et a
l. 19
76-2
009.

255
Tre
nch
Sec
tion
Bat
ch
Sam
ple
num
ber
Lab
orat
ory
Cod
e
Ana
lyse
d vo
lum
e in
µl
Num
ber o
f par
ticle
s (a
bsol
ute
coun
t)
Num
ber o
f par
ticle
s/m
l
Ave
rage
par
ticle
siz
e in
µm
2
Fra
gmen
t con
cent
ratio
n in
mm
2 /ml
1 8 0 382 BX5869 0.872 651 747 117 871 5 1 385 BX5872 0.920 762 828 81 671 2 2 393 BX5876 0.592 1549 2615 99 2601 15 2 404 BX5878 0.117 1221 10437 100 10441 1 3 401 BX5880 0.436 1244 2853 123 3501 2 3 402 BX5881 0.067 246 3698 247 9122 27 0 416 BX5870 0.058 343 5869 89 5212 18 1 422 BX5875 0.180 1327 7388 164 12082 19 1 424 BX5874 2.144 899 419 91 382 21 3 447 BX5882 0.094 621 6590 62 410
Table 6.5. Analysis results charred microscopic particles from 5-litre samples taken from different batches.
layer/Batch 0 in Trench 2. Of further interest in Sample Number 416, Section 27 was the presence of a number of coprophilous fungi such as Sordaria type (A and B), Chaetomium type and Podospora type. The presence of ascospores of these fungi suggests that the environment contained excrement/dung.
6.5.2 Charred microscopic particles
Table 6.5 and Fig. 6.11 show the analysis results for charred microscopic particles found in the pollen samples taken from loose soil.Analysis of charred microscopic particles detected in the 5-litre samples revealed relatively low concentrations, with the exception of three samples which contained concentrations of > 500mm2/ml. These are Sample 422 (Trench 2, Section 18, Batch 1), Sample 404 (Trench 1, Section 15, Batch 2) and Sample 402 (Trench 1, Section 2, Batch 3). During pollen analysis two of them, Samples 422 and 404, upon inspection with the naked eye appeared to contain extremely high quantities of charred fragments. Sample 402, however, contained very few charred fragments, an observation that was confirmed by microscopic analysis. However, these few fragments are relatively large, resulting in a fairly large total measured surface for the charred particles, and this in turn resulted in a dense concentration when measured in mm2/ml.
6.5.3 Botanical macroremains
Twenty botanical 5-litre samples were analysed, from a number of different sections (horizontal) and batches (vertical) in Trenches 1, 2 and 3. Appendix 6.5 presents a summary of the results. In the following section these will be discussed in detail for each trench and batch.The matrices of the samples from Batches 1 to 3 consisted of humic sand (or ’peaty sand’). Trench 1 produced more analysed botanical material than Trench 2. As this allowed a more detailed reconstruction of the local vegetation near Trench 1, the results of this trench will be discussed at greater length.

256
6.5.3.1 Trench 1
Trench 1, Batch 3Two samples from Batch 3 were selected for macroremains analysis, Sample Number 401, Section 1 and Sample Number 402, Section 2. A number of species characteristic of a freshwater-marsh vegetation dominated the assemblage: common club-rush (Schoenoplectus lacustris), branched bur-reed (Sparganium erectum), bulrush (Typha), reed (Phragmites), hemp-agrimony (Eupatorium cannabinum), bittersweet (Solanum dulcamara), and water mint (Mentha aquatica). Most of these species are tall herbs, the diversity suggesting well-developed communities that were part of an extensive zone of marsh vegetation in low and damp parts of the dune flanks and/or along temporarily exposed water margins or river banks. A number of closely related sedge species, such as greater pond-sedge (Carex riparia), tufted sedge(C. elata), lesser pond sedge (C. acutiformis), and cyperus sedge (C. pseudocyperus), probably formed communities of sedge marsh vegetation along the water, with the tall greater pond-sedge possibly being the dominant species.Two more marsh species can be added to this list, yellow flag (Iris pseudacorus) and marsh spurge (Euphorbia palustris). Macroremains of both species were found in dry-sieve residue samples from Batch 3.
The marshes developed along the shores of open, fresh water with few or no currents, as the presence of water plants such as white water-lily (Nymphaea alba), yellow water-lily (Nuphar lutea), and water chestnut (Trapa natans) indicates. The latter two species were identified in dry-sieve residue samples from Batch 3.
The presence of fruits, buds, and catkins of alder (Alnus glutinosa) in the macroremains suggests the presence of this tree on damp soils on the dune flanks. Its preferred habitat is alder carr and/or riparian forest. Bittersweet (Solanum dulcamara), too, grew in marshes, but also in forest, especially among alder carr vegetation. Oak may have grown on the higher, drier places on the dune since buds and bud scales of oak were identified in both botanical samples from Archaeological Layer 3. Interestingly, three of the botanical samples (5-litre sample number 394, Section 4, and the dry-sieve residue samples Number 28, Section 3B and Number 48, Section 5B) contained charred cone scales of Scots pine (Pinus sylvestris), which may indicate that Scots pine grew on dry places on the dune and that its cones were collected as fuel. In the charcoal assemblage, however, Scots pine is rare. The presence of Scots pine in the batch is a possible indication that the botanical material was deposited in the Late Boreal or during the Boreal-Atlantic transition. A similar chronostratigraphical position for Batch 3 is also suggested by the results of pollen analysis carried out on one of the samples from the same layer (Sample number 401, Section 1; see Section 6.5.1.1 in this publication).
The analysis (of sieve residue samples in particular but also of 5-litre samples) produced clear evidence for the presence of a shrub vegetation, with species such as hazel (Corylus avellana) and dogwood (Cornus sanguinea). Both species prefer forest edges or dry soils in forest clearings. Among these shrubs grew various herbaceous species with a preference for shade and sandy soils, such as three-nerved sandwort (Moehringia trinervia). Local conditions also favoured nitrophilous plants such as stinging nettle, which possibly grew wherever dying alder trees enriched the soil with nitrogen, but which equally may have benefited from human activity on the dune.The presence of charred stem fragments of reed (Phragmites) in the two samples from Batch 3 suggests that this marsh plant may have been burnt in situ in the marsh, or alternatively that it was collected for various purposes and afterwards burnt. Also identified in the samples from Batch 3 were numerous charred remains of edible plants, such as hazelnuts, acorns, water chestnut, dogwood, and also fragments of charred parenchyma. These remains are almost certainly associated with the settlement on the dune, and specifically with food preparation (see the discussion in Section 6.6.3).
Trench 1, Batch 2Five botanical samples from Batch 2 were selected for analysis: Sample Number 389, Section 6, Sample Number 393, Section 2, Sample Number 398, Section 13, Sample Number 404, Section 15, and Sample Number 406, Section 16. The composition of

257
the macroremains assemblage retrieved from this batch largely resembles that from Batch 3. In both batches freshwater-marsh species dominated, although the Batch-2 assemblage contained more species. In addition to the marsh species identified in Batch 3 (common club-rush, branched bur-reed, reed, marsh spurge, yellow flag, water mint) Batch 2 also included marsh woundwort (Stachys palustris), gypsywort (Lycopus europaeus), common marsh-bedstraw (Galium palustre), great sedge (Cladium mariscus, charred seeds), and water plantain (Alisma). Each of the ‘new’ species was represented by only a few remains. Lower and more damp parts of the dune were probably characterised by damp alder carr, as indicated by the presence of remains of alder.
Also identified were many remains of plants which thrive in open water, both species with floating leaves (yellow water-lily and water chestnut) and others with submerged leaves (holly-leaved naiad (Najas marina) and rigid hornwort, or Ceratophyllum demersum).All these species were encountered in dry-sieve residues. The presence of holly-leaved naiad is significant; in central and north-western Europe this plant is regarded as a thermophile species which reached its maximum expansion in the Atlantic optimum.
Batch 2 contained, among others, nitrophilous species. Seed remains of stinging nettle were common, as were seeds of all-seed goosefoot. The latter is an annual characteristic of wet, nutrient-rich, sandy soils, as are two other species identified in Batch 2, persicaria (Persicaria maculosa) and water chickweed (Myosoton aquaticum). Yet another nitrophilous plant, copse bindweed (Fallopia dumetorum), would prefer dry marginal zones such as a forest edge or scrub vegetation (Van der Meijden 1996). Although accumulation of nitrogen compounds occurs naturally, especially in fluviatile environments, the raised soil nitrogen content at and around the Mesolithic site was probably also in part a result of human activity.
Large numbers of hazelnut shells, fruit stones of dogwood and hawthorn (Crataegus monogyna), and seeds of Guelder rose (Viburnum opulus) and crab apple (Malus sylvestris) in Batch 2, Trench 1 point at the presence of a well-developed shrub vegetation on the dune. Many of the hazelnut shells show rodent gnaw marks. The samples from Batch 2 produced clear evidence for the presence of oak on the dune, while charred remains of pine cone scales in one of the 5-litre samples (Sample number 398, Section 13) prove that Scots pine still grew there as well, and moreover that the botanical material in Batch 2 was probably deposited in the Late Boreal or Early Atlantic period. A Late Boreal-Atlantic transitional date was confirmed by pollen spectra for the same batch (see Section 6.5.2.1)
Charred macroremains of acorns, hazelnut shells, hawthorn fruit stones, seeds of yellow water-lily, and spines of water chestnut, all collected from the dry-sieve residues from Batch 2, may be connected to the gathering and processing of plant food (see the discussion in Section 6.6.3). Also charred stem fragments of reed and other herbaceous plants found in the 5-litre samples and the dry-sieve residues offer some clues to human activity on the dune.
Trench 1, Batch 1Two botanical samples from Batch 1 were analysed, Sample Number 385, Section 5 and Sample Number 388, Section 3. The water and marsh plant assemblages were similar to those encountered in the previous batch, although Batch 1 contained fewer species. Both Batch-1 samples produced remains of water plants; white water-lily and holly-leaved naiad were each represented by only one seed. Alder was the dominant tree species on wet soils. Stinging nettle, water chickweed, greater celandine (Chelidonium majus), and all-seed goosefoot again point at a high soil nitrogen content at and around the Mesolithic site.There are data suggesting that the environment at this period included clearings and/or relatively open forest. Many remains of hazelnut shells, alder and dogwood in combination with hawthorn and Guelder rose (in the dry-sieve residues) suggest a landscape dominated by shrub vegetation. A common tree was oak, as the diversity and number of oak remains indicated (buds, bud scales, cupules, abscission scars). The remains of pine cone scales identified in one of the samples (Sample number 385,

258
Section 5) suggest a Late Boreal or Early Atlantic date for the formation of this batch. The same sample contained seeds of holly-leaved naiad, a species which maximum distribution coincided with the Atlantic period (see above). Its earliest distribution history is little known, however, so that it is impossible to draw conclusions regarding the date of the botanical deposits solely on the basis of this species. More reliable information comes from the pollen spectrum for the same sample (Section 5, Sample Number 385), which suggests a date around the Boreal-Atlantic transition (see Section 6.5.1.1).Charred remains of edible plants in botanical Sample 388, Section 3 (including charred acorn parenchyma) and in dry-sieve residues indicate that plant foods were processed on the dune (see discussion in Section 6.6.3).
Trench 1, Batch 0Batch 0 contributed three botanical samples to the analysis, Sample Number 382, Section 8, Sample Number 383, Section 9, and Sample Number 392, Section 14. The matrices of these samples were much more humic than in Batches 3, 2 and 1, and they also contained many wood and root remains. These matrices possibly represent (carr) peat.The number of typical marsh species was significantly greater than in Batch 1. In addition to earlier identified species (common club-rush, water mint, gypsywort, common marsh-bedstraw, greater pond-sedge, Cyperus sedge, marsh spurge, bittersweet, branched bur-reed, and marsh woundwort), Batch 0 contained three other marsh species: milk parsley (Peucedanum palustre), fine-leaved water-dropwort (Oenanthe aquatica) and common-water-crowfoot type (Ranunculus aquatilis type), as well as bogbean (Menyanthes trifoliata) and yellow flag (Iris pseudacorus), both identified in dry-sieve residues. Open water with curled pondweed (Potamogeton crispus), yellow water-lily, and holly-leaved naiad could still be found in the vicinity of the dune at this time, but the significant increase in the number of marsh species indicates that marsh communities now occupied larger areas. Some damp places would have been taken up by black alder (fruits of Alnus glutinosa were often encountered in Sample Number 383) and perhaps by birch as well (fruits and bud scales in Sample Number 382).
Macroremains of oak, hazel (in botanical samples as well as sieve residues), dogwood, hawthorn, Guelder rose, and purging buckthorn (Rhamnus cathartica; in sieve residues) indicate that vegetation on the dune was fairly open. No macroremains of pine were identified in the analysed samples from Batch 0.
Indications for human activity were evident and numerous. Charred remains of herbaceous plants (including stems of reed, Phragmites, and of other herbaceous species in Sample Number 382 and Sample Number 383) may indicate that the marsh vegetation had been deliberately burnt, while charred remains of edible plants in sieve residues from Batch 0 suggest that plant foods were processed on the river dune (see below, Section 6.6.3).
6.5.3.2 Trench 2
Trench 2, Batch 4Only the wet and dry-sieve residues from Batch 4, Trench 2 were sampled. Hazelnut shells dominated the macroremains assemblage, often in combination with oak buds, bud scales and cupules, and catkins of alder (Alnus). Several residues also contained fruit stones of dogwood and seeds of Guelder rose. Like hazel, these are shrubs, an indication that parts of the dune were covered in shrub vegetation. A few seed remains of water plants were also identified (yellow water-lily and holly-leaved naiad), while one sample contained remains of yellow flag, a marsh plant.
Trench 2, Batch 3In comparison with Batch 3, Trench 1, Batch 3, Trench 2 contained both fewer species and fewer remains. This is almost certainly due to the fact that only one sample was selected for analysis (Sample number 447, Section 21). The general pattern which emerges from Trenches 1 and 2, however, is very similar. Common club rush was the

259
most common species among the marsh plants, together with water mint, fine-leaved water-dropwort, yellow flag, and marsh spurge. Bittersweet probably also grew in marshland and/or alder carr.Conditions in the sedge marsh, where greater pond-sedge and tufted sedge flourished, were comparable to those emerging from Batch 3, Trench 1. Identified indicator species for open water were white water-lily and duckweed (Lemna). On the dune itself stood groves of oak, hazel, dogwood, hawthorn, and Guelder rose (the last two species identified in sieve residues). Stinging nettle again points at a raised soil nitrogen content.Several residues from Batch 3 contained charred hazelnut shell remains. The pollen spectrum suggested a Late Boreal deposition date for the botanical material in this batch (see Section 6.5.1.2).
Trench 2, Batch 2Batch 2, Trench 2 also contributed only one sample to the analysis, Sample Number 443, Section 29. The presence of seeds of all-seed goosefoot suggests a possible connection with Batch 2, Trench 1, for, like stinging nettle, all-seed goosefoot is another indicator species for a raised soil nitrogen content. Many of the analysed sieve residues contained numerous remains of tree taxa (oak and alder) and shrubs (hazel, dogwood, hawthorn) as well as some charred remains, mainly hazelnut shells.
Trench 2, Batch 1Batch 1 produced three 5-litre samples, Sample Number 422, Section 18, Sample Number 424, Section 19 and Sample Number 433, Section 32. The three samples contained few macroremains, but nonetheless some marsh species could be identified: greater pond-sedge, tufted sedge, yellow flag, common club-rush, fine-leaved water-dropwort, and bulrush. Two other species, all-seed goosefoot and stinging nettle (both also identified in Batch 1, Trench 1) are suggestive of a raised soil nitrogen content.One of the samples, Sample Number 424, produced seed remains of white water-lily. Of some interest was the identification of complete, charred spine of water chestnut in one of the sieve residues (Sample number 293, Section 30-A) and of pollen of the same species in both samples from Batch 1, Trench 2 (Sample numbers 422 and 424, see Section 6.5.2.2). The pollen spectra suggest a probable date in the Late Boreal or the Boreal-Atlantic transitional period for the botanical material from this Batch. Macroremains of oak and alder and both non-charred and charred remains of hazelnut shells were also observed, while one of the samples (Sample number 422, Section 18) contained charred remains of herbaceous plants (including reed and possibly others as well).
Trench 2, Batch 0Batch 0 contributed four samples to the analysis: Sample Number 408, Section 18, Sample Number 409, Section 19, Sample Number 416, Section 27, and Sample Number 419, Section 33. The matrices of these samples were similar to those for the samples from Trench 1 in that both groups contained much organic material in the form of waterlogged wood remains as well as tree-root wood. The seed assemblage from Batch 0, Trench 2 was also similar in composition to that from Batch 0, Trench 1. Prominent were marsh species such as common club-rush, greater pond-sedge, fine-leaved water-dropwort, water mint, marsh spurge, bittersweet, yellow flag, hemp-agrimony, water plantain, and bulrush.Batch 0 produced few remains of aquatic plants, and only two species: white water-lily and yellow water-lily (the latter in sieve residues). This decrease in aquatic species may signify that bodies of open water around the dune were disappearing and that the dune flanks were increasingly covered by marsh vegetation and in places also by damp meadows with species such as meadow buttercup or creeping buttercup (Ranunculus acris/repens). More nutrient-rich, shady places (e.g. alder carr) may have offered conditions favourable to species such as marsh woundwort (Stachys palustris).Remains of oak and alder were common, particularly in the sieve residues from Batch 0, Trench 1, and this suggests that the forest that covered the dune probably contained many trees of both. Macroremains of hazel (mainly waterlogged, but also a few charred shell remains), dogwood and occasionally hawthorn and Guelder rose were often encountered together with oak and alder.

260
A pollen spectrum obtained from Sample Number 416, Section 27 suggests an Atlantic date for the botanical material in the sediments of this Batch (see Section 6.5.1.2).
6.5.3.3 Trench 3
In Trench 3 only sieve residues of three layers of the top of the dune were sampled (Batches 0, 1 and 2). The composition of the botanical macroremains in all three sampled layers was similar. Alder catkins (Alnus) were observed in virtually all analysed residues, occasionally in combination with hazelnut shells and/or cupules of acorns (Batch 1), or with a dogwood fruit stones (Batches 1 and 2).
6.5.4 Charcoal
6.5.4.1 Trench 1
A total of 392 charcoal fragments from Trench 1 were analysed, their combined weight amounting to 21.191g (Appendix 6.16). Of this number, 239 fragments (combined weight 1.257g) came from 5-litre samples, 123 (combined weight 18.688g) from 10mm-sieve residues, and 30 (combined weight 1.246g) from 2mm-sieve residues. The charcoal from the 5-litre samples was highly fragmentary so that 17% of the number of fragments (over 10% of their combined weight) could no be identified (Table 6.6). Because the charcoal fragments from the sieve residues were much larger, their identification rate was expected to be significantly higher. This proved to be not the case. Of the total number of fragments, 7% remained unidentified. These were not the smallest fragments either, for they represented over 16% of the total weight. Upon closer examination, the unidentifiable charred fragments turned out to be bark, wood of tree roots or knots, and decayed wood. Bark and root/knot wood is almost always non-specific and therefore often impossible to assign to one particular species, genus, or even type.
Trench 1, Batch 3Botanical material from Batch 3, i.e. the lowest batch, was dated to the Boreal-Atlantic transition (see Section 6.3.2). The pollen spectrum revealed the presence of pine, oak, alder and hazel. Among the identified species in the charcoal assemblage oak and alder were the most common, both in numbers and in weight, while pine, hazel, buckthorn and willow were less common. The fact that the two dominant species were oak, which prefers dry to damp soils, and alder, a typical wetland species, suggests that both types of environments existed. Hazel and buckthorn prefer damp, usually calcareous, mineral-rich soils, neither species will grow taller than 5 or 6m (van der Meijden 1996, 113 and 284), while oak on favourable soils may reach 30m. Although hazel and buckthorn can be found in deciduous forests, they will only mature if sufficient light and space are available. The charcoal may come from hearths and/or cooking fires, which means that the wood was perhaps selected deliberately for its suitability as fuel. As fuel, wood is likely to have been collected nearby and as such may give a general impression of the woody vegetation near the site. The presence of these species in itself suggests that open forest or forest edges existed nearby. This is confirmed by the percentage of tree pollen, which did not exceed 70%. The many indicator species for marshland and open water in the pollen assemblage and among the botanical macroremains further suggest that this forest edge may have formed the border between a damp dune area and marshland. In that case, the forest higher up on the dune, further away from Trench 1, was possibly dense.Little pine charcoal was encountered in this batch, despite the fact that one of the pollen samples (Sample number 401, Section 1, a 5-litre sample; see Section 6.5.1.1) contained much pine pollen. During analysis, Sample 401 revealed two fragments of pine charcoal. Pine is known for its high pollen production, and it prefers the same soil conditions as oak, hazel, and buckthorn. The combination of abundant pine pollen, but little pine charcoal, may perhaps be explained by assuming that the trees grew at some distance of Trench 1. Alternatively, the pine pollen may be slightly older than the pine charcoal, and pine may have already largely disappeared from the deciduous forests by the time the fire that produced the pine charcoal burnt. It is even possible, though less

261
likely, that the Mesolithic people who visited the dune did not use pine wood as fuel.Alder and willow are typical wetland species. Macroremains analysis suggested that the identified alder charcoal may derive specifically from black alder.19 Black alder is a true marsh tree, which may reach a height of 24m and grows on acidic soils and peat. Despite its adaptation to wet soils, however, black alder does not tolerate great fluctuations in the groundwater table.Only one charcoal fragment of willow was identified. Today willow is represented in the Netherlands by about a dozen species, most of which do not exceed 10m. Two species, however, may grow up to 20m tall: crack willow (Salix fragilis) and white willow (S. alba). Whether the willow species on the Yangtze Harbour dune site were trees or shrubs is unknown, even macroremains analysis could not provide a definitive identification. Most willow species grow on damp but mineral soils and tolerate changing water levels quite well. Unlike alder, for instance, willow can survive prolonged inundation. Two smaller species of willow prefer peaty soils. The fact that alder dominated the charcoal assemblage suggests that the water table in the marshes near Trench 1 in this period was fairly stable.In addition to taxa identification, charcoal analysis also involved an assessment of the tree part and the condition of the wood prior to charring. The charcoal from the botanical samples was too fragmented to be able to identify the precise part of the tree, although the straight growth rings of most of the charcoal fragments from 10mm-sieve residues render it likely that most of the wood derived from stems or from branches with a diameter of at least 10cm. A few fragments showed charred hypha and a warped wood structure, but in most cases the wood seems to have been in good condition before the onset of the charring process.Whether the wood was charred as a result of natural causes or in man-made hearths could not be established on the basis of the charcoal alone. However, the fact that little charred tree-root wood was found and that tree taxa from different habitats of the landscape were represented, suggests hearths, rather than a burnt landscape.
Trench 1, Batch 2Like the botanical material from Batch 3, the material from Batch 2 dates from the Boreal-Atlantic transition. The results of the radiocarbon analysis revealed the Batch 2 material to be slightly younger than that from Batch 3 (see Section 6.5.1). The pollen spectrum showed an increase in the number of typical marsh species, in comparison to Batch 3. Alder pollen was less prominent. Among the species typical of drier soils pine was relatively more common that oak.Relatively few charcoal fragments from this batch were analysed (N=87), which may explain why pine was absent. A more likely explanation, however, is the Atlantic date of the charcoal, as the presence of oak, alder, hazel, and willow suggested. Oak was the most common species, followed by elm. These two species, too, are characteristic of the Atlantic period. Overall, Batch 2 resembled Batch 3. However, the predominance of oak in the charcoal assemblage was surprising since the same sample had produced relatively little oak pollen.
Trench 1, Batch 1Although Batch 1 came from a higher level than Batch 2, the dates obtained for the samples from the two batches suggested a roughly similar date in the Boreal-Atlantic transition. There is however a chance that the samples were contaminated. The pollen spectrum once again indicates a marsh landscape dominated by marsh plants and alder, while in drier places pine seems to have been more common than oak. The charcoal assemblage is fairly diverse, with oak as the dominant species, and typical of the Atlantic period. Also identified were charcoal of Pomoideae, alder, hazel, buckthorn, and willow. The Pomoideae included species such as crab apple (Malus sylvestris), hawthorn (Crataegus), wild pear (Pyrus pyraster), and rowan (Sorbus aucuparia).Like hazel and buckthorn, Pomoideae form shrubs or low trees which prefer dry to damp mineral soils. Together with oak, these shrubs and low trees will have grown on the dune or on the edge of a marsh. Only oak can reach a significant height, but overall the drier parts of the landscape near Trench 1 seem to have been covered in open forest, or perhaps to have formed a transitional zone between forest and marsh. Although pine prominently appeared in the pollen spectrum, no pine charcoal was identified. Perhaps the pine trees stood further away. Alternatively, the pine pollen may be slightly older than the charcoal, as was mentioned above. The typical marsh taxa
262
alder and willow were present in relatively low percentages.Growth rings observed in most of the charcoal fragments were straight, while a few other fragments which showed curved rings may derive from branches. A few charred twigs were also identified. The wood appeared to have been in reasonably good condition before it became charred. The wide range of species, representing a number of different landscape types, as well as a virtual absence of tree-root wood makes it likely that the charcoal is anthropogenic, more specifically that it represents waste from hearths.
Trench 1, Batch 0The composition of the botanical material from the uppermost batch in Trench 1 (Batch 0) suggested an Early Atlantic date. The pollen spectrum, on the other hand, was very similar to that for Batch 1, although some of the identified pollen suggested that the batch may have been contaminated by (much) younger material (see Section 6.5.2.1). The charcoal assemblage in Batch 0, too, consisted of a wide range of species typical of the Atlantic period. Oak was the most common tree, followed by hazel, alder, apple, Guelder rose (Viburnum opulus), lime (Tilia) and buckthorn. Guelder rose was not observed in the deeper layers. This shrub, which seldom grows over 3m tall, tolerates both damp and wet, usually eutrophic soils. Because of its small size it prefers open forest or scrub vegetation. Lime can be found on damp to dry, mineral and often calcareous soils and like oak it can grow up to 30m tall (van der Meijden 1996, 440-441). The tree is a type species of Atlantic deciduous, mostly dense forests.Two wood taxa, pine and willow, that had been observed in deeper batches were absent from Batch 0 although their pollen was present. Perhaps these species formed only a minor component of the local vegetation. In some cases it was impossible to identify the tree part the charcoal fragments came from, but stems, branches and knots were probably all present. Tree-root wood, however, was absent. The wood seems to have been reasonably intact when it was charred. This charcoal, too, probably derived from hearths, not natural fires.
6.5.4.2 Trench 2
Trench 2 produced a total of 589 charcoal fragments with a combined weight of 67.750g (Appendix 6.16). Of these, 293 fragments (4.752g) came from 5-litre samples, 272 (61.144g) from 10mm-sieve residues and 24 (1.854g) from 2mm-sieve residues. Compared to Trench 1, Trench 2 produced both more and larger charcoal fragments (Table 6.7). As was the case in Trench 1, the charcoal from the Trench-2 5-litre samples was highly fragmented so that circa 17% of the fragments could not be identified. In weight, however, these indeterminate fragments constituted no more than 3%,emphasizing the fragmentary state of the material. Most of the charcoal from 10mm-sieve residues could be identified.
Trench 2, Batch 4The charcoal assemblage largely consisted of oak (N=60), with a few fragments of apple, hazel, buckthorn, and willow. Four fragments could not be identified, two due to advanced degradation of the wood prior to charring, and two others because they probably derived from bark. Although pine was absent, the charcoal assemblage corresponded to the Boreal-Atlantic transition, as the identified deciduous tree species were among the first to colonise the area of the Netherlands after the last ice age.
Trench 2, Batch 3As was stated earlier, the botanical material from Batch 3 was deposited in the Atlantic period. The comparatively high pollen percentages for pine, however, would rather suggest a Late Boreal date for this batch, which was taken from the humic dune sand.As in Batch 4, oak dominated the assemblage while a few fragments of apple, pine, and willow were also identified. The absence of alder from the two lowermost batches in Trench 2 is slightly odd. Trench 2 deviates in this respect from Trench 1, where alder was encountered in all batches. Although the charcoal-analysis results do not allow a definite chronological conclusion, the taxa spectrum does not contradict a Late Boreal date.

263
Botanical sample (5 litre)Batch 0 Batch 1 Batch 2 Batch 3
Species N Weightin g
N Weightin g
N Weightin g
N Weightin g
Apple type - - 2 0.0030 - - - -Pine - - - - - - 2 0.009Oak 23 0.032 21 0.1380 39 0.214 77 0.599Alder - - - - - - 7 0.031Guelder rose - - - - - - - -European ash - - - - - - - -Hazel - - 9 0.0380 1 0.003 4 0.017Juniper/Fir - - - - - - - -Lime - - - - - - - -(Purging) Buckthorn - - 3 0.0130 - - 1 0.005Willow - - 8 0.0180 1 0.005 - -Indeterminate 16 0.016 7 0.0300 9 0.060 9 0.026 Total 39 0.048 50 0.240 50 0.282 100 0.687
Table 6.6. Charcoal: analysis results (summary), Trench 1. a. Botanical samples (5 litre); b. OPH10: wood/charcoal from 10mm residue; c. OPH2: wood/charcoal from 2mm residue.
OPH2Batch 0 Batch 2
Species N Weightin g
N Weightin g
Apple type - - - -Pine - - - -Oak 4 0.243 12 0.419Alder 6 0.293 6 0.161Guelder rose - - - -European ash - - - -Hazel - - - -Juniper/fir - - - -Lime 1 0.081 - -(Purging) Buckthorn - - - -Willow - - - -Indeterminate - - 1 0.049 Total 11 0.617 19 0.629
OPH10Batch 0 Batch 1 Batch 2 Batch 3
Species N Weightin g
N Weightin g
N Weightin g
N Weightin g
Apple type 1 0.028 1 0.380 - - - -Pine - - - - - - - -Oak 16 2.555 38 5.613 5 0.106 5 0.949Alder 4 0.211 5 1.239 7 0.098 16 2.409Guelder rose 1 0.111 - - - - - -European ash - - - - - - - -Hazel 6 0.889 1 0.035 - - - -Juniper/Fir - - - - - - - -Lime - - - - - - - -(Purging) Buckthorn 1 0.126 3 0.270 - - 1 0.322Willow - - - - 1 0.011 1 0.023Indeterminate 1 0.080 3 2.430 5 0.330 1 0.473 Total 30 4.000 51 9.967 18 0.545 24 4.176
a
b
c

264
Botanical sample (5 litre)Batch 0 Batch 1 Batch 2 Batch 3
Species N Weight in g
N Weightin g
N Weightin g
N Weightin g
Apple type - - - - - - 1 0.005Pine - - 5 0.004 - - 7 0.012Oak 34 0.920 56 0.682 91 2.750 26 0.082Alder - - 1 0.020 - - - -Guelder rose - - - - 1 0.024 - -European ash - - - - - - - -Hazel - - 5 0.030 - - - -Juniper/Fir - - - - - - - -Lime - - - - - - - -(Purging) Buckthorn - - 1 0.010 - - - -Willow 15 0.082 - - - - - -Indeterminate 1 0.003 22 0.056 8 0.034 19 0.038 Total 50 1.005 90 0.802 100 2.808 53 0.137
OPH10Batch 0 Batch 1 Batch 2 Batch 3 Batch 4
Species N Weightin g
N Weightin g
N Weightin g
N Weightin g
N Weightin g
Apple type 1 0.021 - - - - 1 0.340 - -Pine - - - - - - - - - -Oak 37 18.363 65 24.723 50 4.79 38 6.131 54 1.849Alder 1 1.99 1 0.298 - - - - - -Guelder rose - - - - - - - - - -European ash - - - - - - - - - -Hazel 5 0.132 - - - - - - 2 0.092Juniper/Fir - - - - - - - - - -Lime - - - - - - - - - -(Purging) Buckthorn - - - - - - - - - -Willow 5 1.425 4 0.683 3 0.011 1 0.040 1 0.021Indeterminate 1 0.131 - - - - - - 2 0.104 Total 50 22.062 70 25.704 53 4.801 40 6.511 59 2.066
OPH2Batch 2 Batch 4
Species N Weightin g
N Weightin g
Apple type - - 1 0.071Pine - - - -Oak 13 0.990 6 0.544Alder - - - -Guelder rose - - - -European ash - - - -Hazel 1 0.037 - -Juniper/fir - - - -Lime - - - -(Purging) Buckthorn - - 2 0.108Willow - - - -Indeterminate - - 1 0.104 Total 14 1.027 10 0.827
Table 6.7. Charcoal: analysis results (summary), Trench 2.a. Botanical samples (5 litre); b. OPH10: wood/charcoal from 10mm residue; c. OPH2: wood/charcoal from 2mm residue.
a
b
c

265
For most fragments, it was impossible to establish from which part of the tree they derived, mainly because some of the fragments came from weathered and partially decayed wood, while others were amorphous and contained large cavities. Although no wood structure could be observed, the amorphous material seems to derive mainly from samples that also contained pine charcoal.
Trench 2, Batch 2 The established age of the material from Batch 2 was comparable to that for Batch 3, i.e. the Late Boreal or Early Atlantic period. No pollen analysis was carried out. Although a fairly large quantity of charcoal was analysed (N=167), the observed range of species was small, with mainly oak accompanied by fragments of Guelder rose, hazel, and willow. Most fragments were too small to identify the part of the tree they came from.
Trench 2, Batch 1Of the radiocarbon samples taken from Trench 2 the material from Batch 1, which should be the top level, was in fact the deepest (Section 7.3.1). Perhaps this (locally) deep position of Batch 1 was responsible for the Boreal date of the material. The pollen spectrum, with its comparatively high values for pine, seems to confirm this early date and the charcoal assemblage does not contradict it, with again oak as the dominant species supplemented by pine, alder, hazel, buckthorn and willow. The number of unidentifiable fragments was rather high; most of them were amorphous with large cavities; again they occurred in combination with pine charcoal.In most cases it was impossible to establish from which tree part the fragments derived. Straight growth rings, suggesting stems or large branches, were observed a few times, as was knotted wood. The range of species was typical for open forest or a forest edge in a fairly dry area. Trees and shrubs characteristic of a marsh vegetation were rare in the charcoal assemblage.
Trench 2, Batch 0No radiocarbon date is available for Batch 0, Trench 2 itself. However, the top of the sand layer from Core B37A0673/W-04 was dated to the Boreal-Atlantic transition (Section 6.3.1, Table 6.3). Alder was a prominent species in the pollen spectrum, as were marsh and aquatic species. In the charcoal assemblage, however, alder was identified only once. As was the case for the other batches from Trench 2, oak was the most common species followed by willow. Apple and hazel were present with one and five fragments respectively. The presence of willow agrees with the wet character of the landscape that emerged from the pollen spectrum. Some of the charcoal was brittle and brown; it may have been incompletely charred.
6.5.4.3 Trench 3
The residues from Trench 3 produced only 35 charcoal fragments from Batches 0, 1 and 2 combined (Table 6.8 and Appendix 6.16). A radiocarbon date obtained on alder charcoal from Batch 2 placed the material from the humic top layer of the dune in the Atlantic period. The charcoal assemblage was composed of oak, alder, ash (Fraxinus excelsior), possibly juniper (cf. Juniperus communis), and willow. Ash prefers wet to fairly damp soils with a slightly clayey component, it does not grow on pure sandy soils. The identification of juniper is uncertain. Based on the morphology of the wood, fir (Abies alba) could not be excluded either. However, unless this charcoal fragment is intrusive, fir would be highly unlikely as this species is unknown in contexts from this period in the Netherlands. Juniper is a conifer which prefers dry, relatively oligotrophic sandy soils. It was identified in the sample which produced the youngest date, possibly indicating that the drier dune sections gradually lost soil nutrients in the course of the Atlantic period.Trench 3 produced fairly large quantities of alder and willow charcoal. This may be related to the drowning of the environment in the course of the Atlantic period.
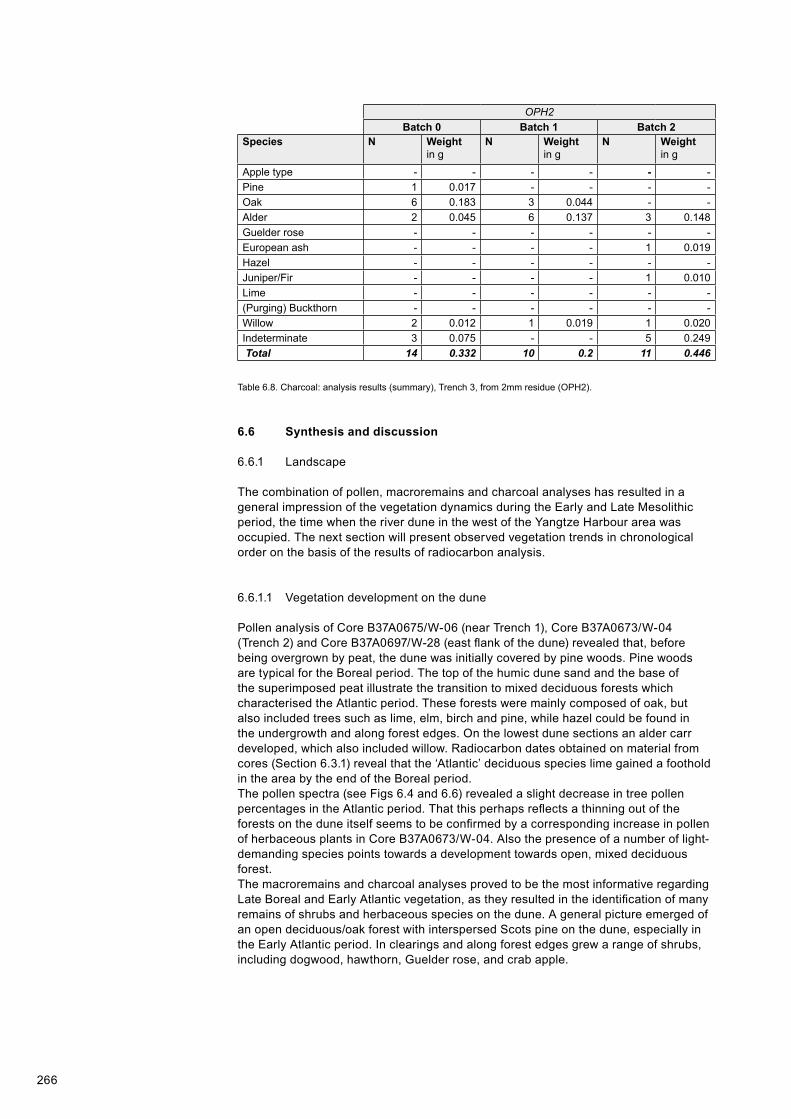
266
OPH2Batch 0 Batch 1 Batch 2
Species N Weight in g
N Weight in g
N Weight in g
Apple type - - - - - -Pine 1 0.017 - - - -Oak 6 0.183 3 0.044 - -Alder 2 0.045 6 0.137 3 0.148Guelder rose - - - - - -European ash - - - - 1 0.019Hazel - - - - - -Juniper/Fir - - - - 1 0.010Lime - - - - - -(Purging) Buckthorn - - - - - -Willow 2 0.012 1 0.019 1 0.020Indeterminate 3 0.075 - - 5 0.249 Total 14 0.332 10 0.2 11 0.446
Table 6.8. Charcoal: analysis results (summary), Trench 3, from 2mm residue (OPH2).
6.6 Synthesis and discussion
6.6.1 Landscape
The combination of pollen, macroremains and charcoal analyses has resulted in a general impression of the vegetation dynamics during the Early and Late Mesolithic period, the time when the river dune in the west of the Yangtze Harbour area was occupied. The next section will present observed vegetation trends in chronological order on the basis of the results of radiocarbon analysis.
6.6.1.1 Vegetation development on the dune
Pollen analysis of Core B37A0675/W-06 (near Trench 1), Core B37A0673/W-04 (Trench 2) and Core B37A0697/W-28 (east flank of the dune) revealed that, before being overgrown by peat, the dune was initially covered by pine woods. Pine woods are typical for the Boreal period. The top of the humic dune sand and the base of the superimposed peat illustrate the transition to mixed deciduous forests which characterised the Atlantic period. These forests were mainly composed of oak, but also included trees such as lime, elm, birch and pine, while hazel could be found in the undergrowth and along forest edges. On the lowest dune sections an alder carr developed, which also included willow. Radiocarbon dates obtained on material from cores (Section 6.3.1) reveal that the ‘Atlantic’ deciduous species lime gained a foothold in the area by the end of the Boreal period.The pollen spectra (see Figs 6.4 and 6.6) revealed a slight decrease in tree pollen percentages in the Atlantic period. That this perhaps reflects a thinning out of the forests on the dune itself seems to be confirmed by a corresponding increase in pollen of herbaceous plants in Core B37A0673/W-04. Also the presence of a number of light-demanding species points towards a development towards open, mixed deciduous forest.The macroremains and charcoal analyses proved to be the most informative regarding Late Boreal and Early Atlantic vegetation, as they resulted in the identification of many remains of shrubs and herbaceous species on the dune. A general picture emerged of an open deciduous/oak forest with interspersed Scots pine on the dune, especially in the Early Atlantic period. In clearings and along forest edges grew a range of shrubs, including dogwood, hawthorn, Guelder rose, and crab apple.
267
6.6.1.2 Vegetation development around the dune
The dominant plant category in the Boreal and Early Atlantic periods were freshwater-marsh species. The marsh vegetation was characterised by extensive zones with bulrush, common club-rush and reed, together with yellow flag, branched bur-reed, marsh spurge and water mint. Most of these species form tall plants and their diversity suggests well-developed marsh vegetation along rivers and other bodies of slow to stagnant, fresh water. A number of closely related sedge species such as greater pond-sedge (possibly the dominant species), tufted sedge, lesser pond sedge, and Cyperus sedge may have formed a zone of sedge marsh vegetation along exposed water margins and/or riverbanks. The water plant assemblage was dominated by white water-lily and yellow water-lily, in addition to water chestnut, holly-leaved naiad (Najas marina), and rigid hornwort (Ceratophyllum demersum). Initially isolated stands of alder carr may have existed along water edges. In addition to the species already mentioned, this alder carr included marsh plants such as bittersweet, hemp-agrimony and stinging nettle, while birch could be found at the foot of the dune. When peat formation began, in the Early Atlantic period, alder probably became more prominent while indicator species for open water decreased (Fig. 6.6). Alder macroremains and charcoal were identified in many samples, particularly those dated to the Late Boreal and Atlantic periods; the youngest radiocarbon date produced by the botanical assemblage was obtained on alder charcoal (Table 6.3). Since alder does not tolerate a fluctuating water table, the implication is that towards the end of the study period (circa 6412 to 6237 BC, Table 6.3) the dune was situated nowhere near a freshwater tidal area or other running water.
6.6.2 Human influence and hearths on and near the dune
It is often assumed that hunter-gatherers do not affect their environment in ways which leave micro or macro-fossil traces, with the exception of activities involving fire (e.g. Hicks 1993). Various reasons for a deliberate burning of parts of the landscape have been suggested. Most discussions focus on hunting-related activities, while alternative explanations, such as the improvement of growing conditions for food plants, have so far received little attention (see e.g. Mellars 1976; Simmons 1996; Mason 2000). However, a number of recent studies in South Scandinavia involving micro and macro-analysis of charcoal remains demonstrated the importance of natural, climate related fires in Early and Middle Holocene forest dynamics. Greisman and Gaillard (2009) and Olsson et al. (2010), for example, stated that the warmer and drier climate which prevailed during these periods led to frequent and intense forest fires.Separating local from regional fires is an essential first step to distinguish climate-related fire events from anthropogenic fires. Establishing what type of vegetation was burnt is the second step in this process. Most studies of charcoal distribution and deposition indicate that the larger and heavier charcoal particles will be deposited near the source of the fire; their presence therefore indicates a local fire. Smaller and lighter particles, on the other hand, are transported over greater distances, and they therefore suggest regional fires (see e.g. Clark, Lynch, Stocks, and Goldammer 1998; Blackford 2000; Olsson et al. 2010). Blackford (2000) stated that charcoal particles smaller than 20µm are the most reliable indicators for regional ‘background noise’, while particles larger than 125µm would indicate a local fire. Particle diameter measurement was not part of the analyses of the Yangtze Harbour samples. However, surface measurement and quantification of charred microscopic particles were carried out, resulting in information on particle concentrations.
In order to establish the cause of the burning events in Target area West at the Yangtze Harbour site between ca. 8000 and 6000 BC, cores B37A0673/W-04, B37A0675/W-06 and B37A0697/W-28 were subjected to a coordinated combination of pollen analysis, analysis of charred microscopic particles in pollen samples, macroremains, and charcoal. Every layer sampled for pollen was also studied for other types of remains. Analyses of charred microscopic particles used the pollen samples, and for macroremains and charcoal analysis, soil was used that was left over after pollen samples had been taken.
268
Core B37A0675/W-06, near Trench 1, revealed a shift from relatively high to low concentrations of charred fragments. In the humic sand, the peaty sand and the humic clay the concentration of charred fragments gradually decreased from top to bottom from over 6,000mm2/ml to 2,000 and 1,000mm2/ml. The highest concentrations were measured in the top section of the peaty sand (19.87m - asl) and in the humic clay (19.85m - asl). Average particle size in the different samples varied from 140 to 220µm2. Exceptions were the samples from the top of the humic sand (19.83m - asl) and from the humic clay (19.85m - asl), interpreted as the upper Wijchen Layer. Average particle size in these samples was 85µm2. However, the concentration of charred fragments in the clay was exceptionally high, in fact the highest observed in all the studied layers.
Core B37A0673/W-04 from Trench 2 showed a similar trend, with concentrations of charred microscopic particles in the sand being up to 13 times higher than in the peat. Average charred-particle surface in this core was 37µm2 in the humic sand, 124 to 172µm2 in the superimposed peaty sand, and a mere 27µm2 in the peat. In other words, the humic sand contained very high concentrations of relatively small particles; the peaty sand above contained larger fragments and in fairly high concentrations; finally, the charred fragments in the peat were both smaller and fewer in number, resulting in much lower concentrations (in mm2/ml) than in the humic sand. In Core B37A0673/W-04 concentrations of charred particles tended to be lower than in Core B37A0675/W-06.
Two samples from Core B37A0697/W-28, taken from respectively the black clay and the superimposed peat, were analysed for the presence of charred fragments. The clay sample contained both the smallest and the highest number of charred particles, according to the automated count. After conversion to mm2/ml, however, the concentration of charred particles in the clay proved to be smaller than in the peat. The high concentrations in the peat may be a result of an earlier onset of peat formation at the location of Core B37A0697/W-28 than at the locations of Cores B37A0673/W-04 and B37A0675/W-06. In this respect, Core B37A0697/W-28 is diachronous with the humic sand in Cores B37A0673/W-04 and B37A0675/W-06.
Already in prehistory, human activities had a profound impact on natural vegetation, although much less so than today. In a Mesolithic landscape subtle differences in pollen compositionare are often the only sign of human presence. In order to enable quantification of this factor, some researchers have designated a few pollen types as ‘anthropogenic indicators’. Behre (1981) listed anthropogenic indicators in natural plant communities and woodland pasture. This may also be relevant to the situation at the dune site Yangtze Harbour, although any grazing in the Mesolithic period will have involved non-domesticated herbivores. The following pollen types (all also identified at the Yangtze Harbour site) are being accepted as indicators of human presence: pink family Caryophyllaceae, knotgrass type (Polygonum aviculare type), persicaria type (Persicaria maculosa type), cress family (Brassicaceae), aster family (Asteraceae liguliflorae and Asteraceae tubuliflorae), grasses (Poaceae), clover (Trifolium), buttercup family (Ranunculaceae), sorrel (Rumex acetosa type), sedges (Cyperaceae), carrot family (Apiaceae), sheep’s-bit type (Jasione montana type), heather (Calluna vulgaris), juniper (Juniperus communis), bracken (Pteridium aquilinum), common polypody (Polypodium vulgare), goosefoot family (Chenopodiaceae), nettle (Urtica), and mugwort (Artemisia). Kuneš, Pokorný, and Ŝída (2008) added bedstraw family (Rubiaceae), bittersweet type (Solanum dulcamara type), meadow rue (Thalictrum), and water chestnut (Trapa natans) to this list. It is important to keep in mind that all these potential anthropogenic indicators may occur in several natural environments as well, and that the presence of these pollen therefore does not constitute direct evidence for human presence in the vicinity. Direct evidence for human activity solely on the basis of pollen is not possible for the Mesolithic period, unlike the Neolithic period, when for example pollen of crop plants (such as cereals) and arable weeds constitute such evidence.A list of pollen types in each core sample that are considered potential anthropogenic indicators reveals clear differences between the individual layers (Fig. 6.12).

269
195
200
205
210
215
220
225
230
235
Dep
th (i
n cm
- H
B)
19.70
19.75
19.80
19.85
19.90
19.95
20.00
20.05
Dep
th in
m -
asl
7291-6779
7029-6606
20 40
S o m a n t r o p o g e n e in d ic a t o r e n ( % )
2000 4000 6000 8000
C o n c e n t r a t ie v e r k o o ld e f r a g m e n t e n ( m m 2 / m l)
Peat
Peaty sand
Humic sand
B37A0670/W-04
Radiocarbon date (circal BC)
Combined anthropogenic indicators (%)
Charred-particle concentration (mm2 /ml)
210
215
220
225
230
235
Dep
th (i
n cm
- H
B)
19.75
19.80
19.85
19.90
19.95
Dep
th in
m -
asl
7501-7083
7135-6699
20 40 2000 4000 6000 8000
Clayey peat
Humic sand
Humic clay
Sandy peat
Humic sand
B37A0675/W-06
222.5
223.0
223.5
224.0
224.5
225.0
225.5
226.0
226.5
227.0
227.5
Dep
th (i
n cm
- H
B)
20.32
20.33
20.34
20.35
20.36
Dep
th in
m -
asl
7305-6832
20 40
S o m a n t r o p o g e n e in d ic a t o r e n ( % )
2000 4000 6000 8000
C o n c e n t r a t ie v e r k o o ld e f r a g m e n t e n ( m m 2 / m l)
Peat
Brown clay
Black clay
B37A0697/W-28
Lithology
Fig. 6.12. Total pollen percentages for anthropogenic indicators and charred-fragment concentrations (in mm2/ml) in Cores B37A0673/W-04, B37A0675/W-06, and B37A0697/W-28.

270
Core B37A0675/W-06, taken next to Trench 1, shows a steady increase in pollen percentages for anthropogenic indicators in the humic sand and the peaty sand (Fig. 6.12). A parallel increase is observable for spores of the fungus T.361, a species associated with sand deposits resulting from human activity. Concentrations of charred microscopic particles gradually increase as well, reaching a maximum in the top of the peaty sand and in the humic clay above. In the clay, however, pollen percentages for anthropogenic indicator species decrease. The specific nature of the clay layer may explain this: it is a natural alluvial deposit formed during inundations by branches of the rivers Rhine and Meuse. However, micromorphological analysis identified large quantities of burnt plant remains in the clay layers in cores taken in this area. These charcoal fragments may represent a local event.20 While the clay was being deposited, it incorporated many charred microscopic particles as well as pollen, as the high pollen concentrations (Fig. 6.4) and comparatively high concentrations of charred fragments in this layer show. In the humic sand which covers the clay, concentrations of charcoal fragments decrease, while pollen percentages for anthropogenic indicators on the other hand are high. Finally, in the peat in top of the humic sand pollen percentages for anthropogenic indicators and charcoal-fragment concentrations are both low, which suggests a decline in human activity.
In Core B37A0673/W-04 from Trench 2 it can be observed that the layers containing the highest pollen percentages for anthropogenic indicators can be found in the humic and peaty sand, with a maximum at 19.92m - asl (Fig. 6.12b). This suggests human activity on the dune. A comparison with the results of automated microscopic analysis of charred particles shows that this maximum corresponds with a maximum for charred particles. Examination of the layers from which the pollen samples came, revealed that the humic and peaty sand of Core B37A0673/W-04, in addition to oak charcoal, contained charred fragments of herbaceous plants as well. In the peat, pollen percentages for anthropogenic indicators and charred fragment concentrations both declined to the point where virtually no charred remains could be detected, either microscopically or macroscopically. This suggests that human influence on the landscape had declined by the time the peat layer was being deposited. Changing environmental conditions, specifically rapid inundation, probably rendered the dune less attractive as a settlement location as its useful (i.e. dry) area shrank.
Cores B37A0673/W-04 and B37A0675/W-06 (and to a lesser extent also Core B37A0697/W-28) both showed a decrease in the ratio between arboreal (AP) and non-arboreal (NAP) pollen around the period the humic sand was being deposited (Appendix 6.9, 6.11 and 6.13). A relative decline in arboreal pollen is often a reflection of a gradual decrease in forest cover.21 Bos and Janssen 1996 and Bos and Urz 2003 stated that such small-scale shifts, which both studies also observed during pollen analysis carried out on Palaeolithic and Early Mesolithic deposits in the Netherlands and Germany, may reflect human activity in the vicinity. This may also have been the case at the Yangtze Harbour site, although here the observed decrease in the AP/NAP ratio may also reflect the drowning of the landscape, a process in which the forest would be replaced by marshland.
Another interesting observation is the extremely high values for the total surface of charred particles per ml in Core B37A0675/W-06, compared to for example Core B37A0673/W-04 (compare Figs 6.12a and 6.12b). The most likely explanation is that local fires burnt at or near the location of Core B37A0675/W-06. The question is whether these fires were natural or anthropogenic. Finding the source of the charred remains might shed some light on this. The sample taken from the top of the peaty sand (19.87m - asl) contained charcoal of oak, besides other species. It may represent the location of a local seat of a fire which originated in the woods on (the flanks of) the dune. The cause of this fire – in a forest on dry ground – may have been natural, for example lightning. The data presently available, however, leave open the possibility that the fire was in fact started deliberately by people in order to clear a piece of land. Alternatively, the charcoal may simply come from hearths or cooking fires. The sample from the clay layer also contained high concentrations of charred particles (see Fig. 6.12a), but these turned out to be not charcoal but mainly charred remains of herbaceous plants (including reed). The fact that the dune was surrounded by wetlands makes it unlikely that natural fires would start there. Human intervention, i.e.
271
the deliberate burning of marsh vegetation, is a realistic scenario. A number of scholars have suggested that burning marsh vegetation may have been part of a hunting strategy (Mellars 1976, 15). It would create open space in what was otherwise a (dense) forest environment, but more importantly it would allow young, fresh sprouts to grow which would attract game to the area (see e.g. Innes and Blackford 2003). That game animals could indeed be found near the site is shown by the numerous faunal remains, but also by the identification of dung fungus ascospores. Raised values for these dung fungus ascospores were encountered in Core B37A0675/W-06 (near Trench 1) and in Core B37A0673/W-04 (Trench 2) in the highest stratigraphic levels of the dune, just before the peat covered them and immediately after the highest concentrations of charred particles had been reached (see Figs 6.4 and 6.6). Although large-herbivore dung is not the only medium these dung fungi grow on, it is likely that herbivores, as major dung producers and consumers of vegetation, contributed to the spread of the fungi.Burning the vegetation may have had more advantages besides facilitating the hunt. As was stated above, the practice may also have generated more plant foods (see e.g. Mellars 1976; Simmons 1996; Mason 2000). In general pollen analysis often shows an increase in hazel pollen during a regeneration phase which follows a fire (see e.g. Innes, Blackford, and Simmons 2010, 439). Similar increases for hazel pollen were also observed in the cores taken at the Yangtze Harbour site.
That Mesolithic people would deliberately burn the local vegetation merely to increase their hazelnut crop seems unlikely. Many other edible plants, especially herbaceous species, probably benefited as well from episodic fires. An example would be the burning of reed marshes containing bulrush (Typha), an intervention that would stimulate the formation of rhizomes. Bulrush rhizomes are edible, and they are being regarded as a potential source of starchy food for Mesolithic people in Europe (Holden, Hather, and Watson 1995; Perry 1999). Mesolithic groups who visited the Yangtze Harbour dune may have had another important reason to burn the local vegetation: in summer and autumn, reeds in reed marshes grow so tall that it becomes impossible to see ahead and to cross through. Burning (parts of) the marsh vegetation from time to time solves the problem. Tracks through the marshes to open water were necessary in order to maintain access to drinking water, and in late summer and early autumn to collect the seeds of water lilies and water chestnuts. If this was indeed the reason behind the marsh fires at the Yangtze Harbour site, then these fires would have burnt in late summer and early autumn as shown by the presence of charred seeds of marsh plants such as yellow flag, branched bur-reed and great sedge, species which carry fruits and ripe seeds at this time of year. This would also have been the time when the marshes would be at their driest, making it easier to set fire to them.Not all charred remains at the site, however, came from natural or anthropogenic fires; certainly the larger charcoal fragments from the batches in Trenches 1 and 2 probably did not. The main argument is the fact that charcoal analysis detected only a few types of wood, while the local vegetation included more species, according to macroremains analysis. Birch, hawthorn and dogwood, for example, were absent from the charcoal assemblage while they were definitely part of the local vegetation. Apparently the charcoal assemblage represents a selection from the total range of woody plants which grew on and around the dune. This makes it likely that the charcoal from Trenches 1, 2 and 3 represents hearth or cooking fire waste. That settlement waste accumulated on the dune is also evident from the numerous charred food remains found in batches from Trenches 1 and 2 (see Section 6.6.3).
The results of the combined botanical analysis allow a more specific interpretation of the charred material. The presence of charred remains of herbaceous marsh plants in particular (see Section 6.6.3) suggests deliberate burning of the local marsh vegetation by the Mesolithic groups, either to improve hunting conditions or to increase the yield of edible plants, or perhaps both. In addition it may have ensured easier access to open water. Burning the reed beds would have been the most efficient strategy to achieve this. Undoubtedly the exploitation of this ecological zone was part of the range of activities carried out by Mesolithic groups who visited the Yangtze Harbour dune.The charcoal and charred remains of edible plants are mainly associated with activities that took place at the Mesolithic site itself; they represent the waste products of hearths/cooking fires and food preparation.
272
6.6.3 Plant food economy
In general the Mesolithic period in north-western Europe is viewed as one characterised by a hunter-gatherer economy. One of the aims of the archaeobotanical analysis was to collect data on the exploitation of plant food resources by the Mesolithic groups which in the Early Holocene visited the dune in Target area West at the Yangtze Harbour site. The identification of charred remains of edible plants was a focus of attention, in particular charred parenchyma as its presence would be a potential indicator that edible roots and tubers had been processed at the site.The charred plant remains also included specimens of an intensely vitreous material. In general such materials may form in a number of ways, for example when sugar, protein-rich parenchyma or resinous wood (e.g. pine wood) become charred. This material was not studied within the framework of the present study.
An attempt was made to reconstruct the diet of the people living at the dune site Yangtze Harbour on the basis of the charred and non-charred remains of edible plants identified in a number of samples and representing different episodes in the site’s occupation history. The study was based on the assumption that charred remains of edible plants are clear indicators that such plants were deliberately processed, while non-charred remains only indicate the mere presence (and therefore availability) of these plant food resources on and/or around the dune. In the next section each category of identified edible plant remains will be discussed below (Table 6.9).
6.6.3.1 Root foods
Lesser celandineOne of the dry-sieve residues and one botanical sample from Batch 3, Trench 1 (Sample number 28 - Section 3B) contained charred remains of the tubers of lesser celandine (Ranunculus ficaria, syn. Ficaria verna). In both cases the material was associated with an early occupation phase. The pollen spectra suggested a Late Boreal or Boreal-Atlantic transitional date for the botanical material from Batches 2 and 3, Trench 1. The radiocarbon dates obtained on charred plant remains from these batches suggested a deposition date of ca. 7047- 6699 cal BC22 and 7304- 7047 cal BC23 (Late Boreal/Early Atlantic), which corresponds to the Middle Mesolithic period.
The tubers were fragmented, and their identification therefore required the use of a SEM microscope to analyse the anatomy of the charred parenchymatous and vascular tissue (Figs 6.13a. and b.).
Lesser celandine may form extensive patches, and each plant yields a rich harvest of root tubers (Figs 6.13c. and d.). For these reasons it may have been much esteemed by Mesolithic groups in temperate Europe as an edible root food. However, as the tubers of lesser celandine contain toxins they must first be processed (dried, boiled or roasted in hot ashes) to prepare them for consumption (Mason and Hather 2000).Lesser celandine tubers have been encountered on other Mesolithic sites in the Netherlands and also in Scotland. Charred tubers, complete as well as fragmentary, were identified at the nearby Mesolithic river dune site Hardinxveld-Polderweg (Bakels and van Beurden 2001) and at the site Staosnaig on the Scottish island of Colonsay in West Scotland (Mason and Hather 2000; Mithen, Finlay, Carruthers, Carter, and Ashmore 2001). So far Staosnaig has produced the most convincing evidence that tubers of lesser celandine were indeed used as food by Mesolithic hunter-gatherers, which makes the site relevant to the present study. At Staosnaig large numbers of tubers were found together with a huge number of hazelnut shells in what has been interpreted as a roasting pit or oven. The obvious conclusion is that lesser celandine was collected intentionally and on a large scale for consumption by Mesolithic groups. With what intensity the plant was being exploited at the Yangtze Harbour site is uncertain, but the few identified fragments show that the tubers were certainly gathered and processed.
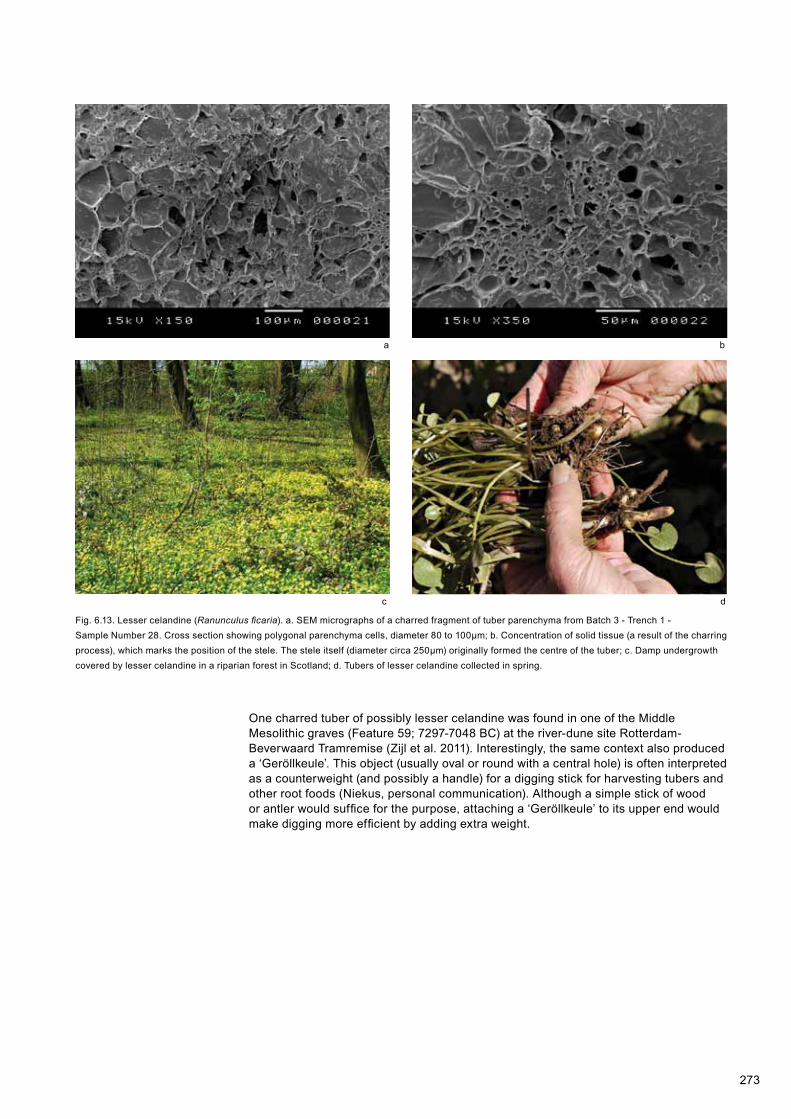
273
Fig. 6.13. Lesser celandine (Ranunculus ficaria). a. SEM micrographs of a charred fragment of tuber parenchyma from Batch 3 - Trench 1 - Sample Number 28. Cross section showing polygonal parenchyma cells, diameter 80 to 100µm; b. Concentration of solid tissue (a result of the charring process), which marks the position of the stele. The stele itself (diameter circa 250µm) originally formed the centre of the tuber; c. Damp undergrowth covered by lesser celandine in a riparian forest in Scotland; d. Tubers of lesser celandine collected in spring.
One charred tuber of possibly lesser celandine was found in one of the Middle Mesolithic graves (Feature 59; 7297-7048 BC) at the river-dune site Rotterdam-Beverwaard Tramremise (Zijl et al. 2011). Interestingly, the same context also produced a ‘Geröllkeule’. This object (usually oval or round with a central hole) is often interpreted as a counterweight (and possibly a handle) for a digging stick for harvesting tubers and other root foods (Niekus, personal communication). Although a simple stick of wood or antler would suffice for the purpose, attaching a ‘Geröllkeule’ to its upper end would make digging more efficient by adding extra weight.
a b
c d

274
Tren
ch 1
Tren
ch 2
Tren
ch 3
Bat
ch 3
Bat
ch 2
Bat
ch 1
Bat
ch 0
Bat
ch 4
Bat
ch 3
Bat
ch 2
Bat
ch 1
Bat
ch 0
Bat
ch 2
Bat
ch 1
Bat
ch 0
Roo
t veg
etab
les/
root
s an
d tu
bers
Sed
ge fa
mily
(Cyp
erac
eae)
- ‘b
ulb’
/cor
m-
--
--
--
c-
--
-C
omm
on c
lub-
rush
(Sch
oeno
plec
tus
lacu
stris
) - rh
izom
e-
-c
--
--
--
--
- L
esse
r cel
andi
ne (R
anun
culu
s fic
aria
) - tu
ber (
c)c
c-
--
--
--
--
-N
uts
and
seed
s
H
azle
nut (
Cor
ylus
ave
llana
)c+
wc+
wc+
wc+
ww
c+w
c+w
c+w
c+w
-w
-Ye
llow
wat
er-li
ly (N
upha
r lut
ea)
wc+
wc+
ww
ww
ww
--
--
Oak
(Que
rcus
) c+
wc+
wc+
wc+
ww
wc
c+w
c+w
-w
-W
ater
che
stnu
t (Tr
apa
nata
ns)
cc
-c
--
-c
w-
-w
Wild
ber
ries
and
flesh
y fr
uits
Dog
woo
d (C
ornu
s sa
ngui
nea)
c+
ww
c+w
c+w
ww
c+w
c+w
ww
w-
Haw
thor
n (C
rata
egus
mon
ogyn
a)
-c+
ww
w-
ww
wc+
w-
--
Cra
b ap
ple
(Mal
us s
ylve
stris
) -
w-
w-
--
--
--
-S
loe
(Pru
nus
spin
osa)
--
-w
--
--
--
--
Ros
e (R
osa)
--
--
--
w-
--
--
Dew
berr
y (R
ubus
cae
sius
) -
--
w-
--
--
--
-G
ueld
er ro
se (V
ibur
num
opu
lus)
-
ww
ww
-w
ww
--
-Va
rious
oth
er p
lant
rem
ains
Roo
t/tub
er p
aren
chym
a c
cc
c-
cc
cc
--
-Fr
uit/c
otyl
edon
par
ench
yma
--
--
--
-c
--
--
Tabl
e 6.
9. E
dibl
e pl
ants
that
wer
e pa
rt of
the
Mes
olith
ic d
iet.
Lege
nd: w
= W
ater
logg
ed, c
= C
harr
ed.

275
Fig. 6.14. Charred fragments of a common-club-rush rhizome (Schoenoplectus lacustris) from Trench 1 - Batch 1 - Sample Number 54 (dry residue). Visible is a conspicuously smooth cross section, which suggests that the rhizome may have been cut before becoming charred (a. and b. show the same fragment).
Fig. 6.15. SEM micrographs of a charred rhizome fragment of common club-rush (Schoenoplectus lacustris) from Trench 1 - Batch 1 - Sample Number 54. Visible is aerenchyma tissue with randomly placed vascular bundles. a. Overview; b. Detail.
Fig. 6.16. SEM micrographs of a charred rhizome fragment of common club-rush (Schoenoplectus lacustris) from Trench 1 - Batch 1 - Sample Number 54. Visible is aerenchyma tissue with randomly placed vascular bundles each completely surrounded by a sclerenchyma sheath. a. Overview; b. Detail.
a b
a b
a b

276
Fig. 6.17. Charred tuber of a member of the sedge family (Cyperaceae) from Trench 2 - Batch 1 - Sample Number 334 (dry residue).
Fig. 6.18. SEM micrographs showing a cross section of the tuber of a member of the sedge family, Trench 2 - Batch 1 - Sample Number 334.a. Cross section with vascular bundles randomly placed in the parenchyma tissue; b. Individual, amphivasal concentric bundles with phloem tissue surrounded by xylem (the phloem is almost completely deteriorated due to charring; its position is marked by cavities at the centre of each bundle).
Common club-rushAnatomical characteristics observed during SEM analysis led to the identification of six charred parenchyma fragments as having derived from the rhizome of common club-rush (Schoenoplectus lacustris). All six fragments were recovered from Batch 1, Trench 1 (Sample Number 54 - Section 6B). Pollen spectra and macroremains both suggested a Late Boreal or Early Atlantic date for the botanical material in this batch, while radiocarbon analysis of one of the charred rhizome fragments resulted in a date of 7071-6768 BC24, which again corresponds to the Late Boreal/Early Atlantic period.
Of potential significance is the fact that one morphologically intact fragment in cross section showed an unusually smooth surface, as if the rhizome had been cut before becoming charred (see Fig. 6.14). Analysis of the internal anatomy of the fragment revealed well-preserved aerenchyma tissue containing scattered vascular bundles (aerenchyma is a storage tissue characteristic of water and marsh plants). Species identification was based on the anatomy of vascular tissue. The vascular bundles in these fragments were collateral and at the xylem pole possessed a thick fibrous (sclerenchyma) sheath (Fig. 6.15), which in a number of cases surrounded the complete vascular bundle (Fig. 6.16).
a b
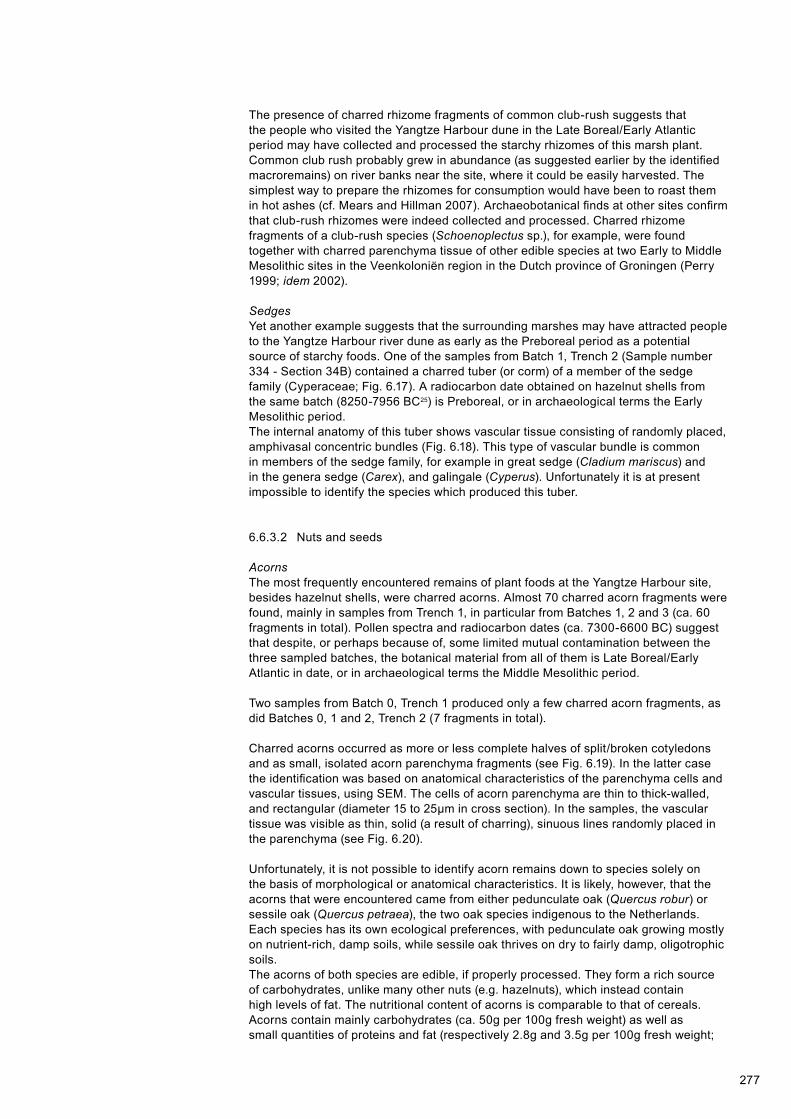
277
The presence of charred rhizome fragments of common club-rush suggests that the people who visited the Yangtze Harbour dune in the Late Boreal/Early Atlantic period may have collected and processed the starchy rhizomes of this marsh plant. Common club rush probably grew in abundance (as suggested earlier by the identified macroremains) on river banks near the site, where it could be easily harvested. The simplest way to prepare the rhizomes for consumption would have been to roast them in hot ashes (cf. Mears and Hillman 2007). Archaeobotanical finds at other sites confirm that club-rush rhizomes were indeed collected and processed. Charred rhizome fragments of a club-rush species (Schoenoplectus sp.), for example, were found together with charred parenchyma tissue of other edible species at two Early to Middle Mesolithic sites in the Veenkoloniën region in the Dutch province of Groningen (Perry 1999; idem 2002).
SedgesYet another example suggests that the surrounding marshes may have attracted people to the Yangtze Harbour river dune as early as the Preboreal period as a potential source of starchy foods. One of the samples from Batch 1, Trench 2 (Sample number 334 - Section 34B) contained a charred tuber (or corm) of a member of the sedge family (Cyperaceae; Fig. 6.17). A radiocarbon date obtained on hazelnut shells from the same batch (8250-7956 BC25) is Preboreal, or in archaeological terms the Early Mesolithic period.The internal anatomy of this tuber shows vascular tissue consisting of randomly placed, amphivasal concentric bundles (Fig. 6.18). This type of vascular bundle is common in members of the sedge family, for example in great sedge (Cladium mariscus) and in the genera sedge (Carex), and galingale (Cyperus). Unfortunately it is at present impossible to identify the species which produced this tuber.
6.6.3.2 Nuts and seeds
AcornsThe most frequently encountered remains of plant foods at the Yangtze Harbour site, besides hazelnut shells, were charred acorns. Almost 70 charred acorn fragments were found, mainly in samples from Trench 1, in particular from Batches 1, 2 and 3 (ca. 60 fragments in total). Pollen spectra and radiocarbon dates (ca. 7300-6600 BC) suggest that despite, or perhaps because of, some limited mutual contamination between the three sampled batches, the botanical material from all of them is Late Boreal/Early Atlantic in date, or in archaeological terms the Middle Mesolithic period.
Two samples from Batch 0, Trench 1 produced only a few charred acorn fragments, as did Batches 0, 1 and 2, Trench 2 (7 fragments in total).
Charred acorns occurred as more or less complete halves of split/broken cotyledons and as small, isolated acorn parenchyma fragments (see Fig. 6.19). In the latter case the identification was based on anatomical characteristics of the parenchyma cells and vascular tissues, using SEM. The cells of acorn parenchyma are thin to thick-walled, and rectangular (diameter 15 to 25µm in cross section). In the samples, the vascular tissue was visible as thin, solid (a result of charring), sinuous lines randomly placed in the parenchyma (see Fig. 6.20).
Unfortunately, it is not possible to identify acorn remains down to species solely on the basis of morphological or anatomical characteristics. It is likely, however, that the acorns that were encountered came from either pedunculate oak (Quercus robur) or sessile oak (Quercus petraea), the two oak species indigenous to the Netherlands. Each species has its own ecological preferences, with pedunculate oak growing mostly on nutrient-rich, damp soils, while sessile oak thrives on dry to fairly damp, oligotrophic soils.The acorns of both species are edible, if properly processed. They form a rich source of carbohydrates, unlike many other nuts (e.g. hazelnuts), which instead contain high levels of fat. The nutritional content of acorns is comparable to that of cereals. Acorns contain mainly carbohydrates (ca. 50g per 100g fresh weight) as well as small quantities of proteins and fat (respectively 2.8g and 3.5g per 100g fresh weight;

278
Fig. 6.19. Acorn. a. Charred fragments from Trench 1 - Batch 3 - Sample Number 28; b. Two halves of acorn cotyledons from Trench 1 - Batch 2 - Sam-ple Number 115, both from dry-sieve residues (scale circa 2:1).
Fig. 6.20. Examples of charred acorn parenchyma (SEM micrographs). a. From Trench 2 - Batch 2 - Sample Number 442 (botanical sample), showing thick-walled acorn parenchyma cells; b. From Trench 1 - Batch 0 - Sample Number 111 (wet-sieve residue), thin-walled parenchyma cells and the curved outlines of the vascular bundles are clearly visible.
Kuhnlein and Turner 1991). Acorns of north-western European species, however, also contain high levels of tannin, which renders them bitter and inedible unless the tannin is removed first (Mason 1995). Ethnographic records mention several methods for processing acorns, most of them involving dehusking the acorns first (Chestnut 1974; Kuhnlein and Turner 1991). The ethnographically documented use of acorns as food in widely different environments, as well as a growing body of archaeobotanical evidence for the presence of acorns at Mesolithic sites, has led a number of scholars to conclude that acorns may have been one of the staple foods of hunter-gatherer groups in temperate Europe (see e.g. Mason 1995; idem 2000; Kubiak-Martens 1999; idem 2011b; Bakels, van Beurden, and Vernimmen 2001; Mason et al. 2002; Regnell 2012).
The presence of charred acorns at the Yangtze Harbour site suggests that they were probably processed and consumed locally. Remarkably, hardly any charred fragments of acorn fruit walls (pericarp) or cupules (cupula) were found (with the exception of Sample Number 308, Layer 3, Trench 2 and Sample Number 83, Layer 1, Trench 1), while waterlogged (non-charred) fruit-wall remains, cupules and abscission scars (’disks’) were common. This may suggest that the acorns had already been husked when the cotyledons came into contact with fire or hot ashes, presumably to be roasted.
a b
a b

279
Water chestnutsAnother potential food source available to Mesolithic groups at the Yangtze Harbour site was water chestnut (Trapa natans). This aquatic plant grows in shallow to deep waters, where it forms floating leaf rosettes and nut-like fruits with two to four sharp spines (Fig. 6.21b.). In Europe, the relatively warm climate conditions during the Atlantic period in particular favoured this species. In the Late Holocene, however, dropping temperatures and more recently also human intervention (e.g. drainage of marshland and lakes) contributed to its disappearance from a number of north-western European countries, including the Netherlands.
In the Early Holocene the plant still grew around the dune site Yangtze Harbour, which is confirmed by pollen and macroremains. Pollen of water chestnut was found in samples taken from peaty sand deposits in Core B37A0675/W-06, Trench 1 (Section 6.4.1.2). Macroremains took the form of charred complete or fragmentary spines and fragments of endocarp (the shell; see Fig. 6.22). A total of fourteen fragments of water chestnut were identified. Ramarkably, most of the charred remains came from Trench 1, Batches 2 and 3, however a few came from Batch 0 (in dry-sieve residues).Pollen spectra and radiocarbon dates (both suggesting a range of ca. 7300 to 6600 BC) indicate a Late Boreal/Early Atlantic date for the botanical material from the three batches, which means that the charred water chestnut remains at the Yangtze Harbour site are associated with Middle Mesolithic activities on the dune.The charred state of the remains suggests that the nuts were exposed to fire after having been collected and brought to the camp.
The kernel (the inner cotyledon) of water chestnut is rich in starch and protein (52% and 20% respectively), as well as containing some fats and sugars (7% and 3% respectively; Borojević 2009). The nuts may be eaten fresh, but they can also be boiled, roasted, or dried and then ground into a flour (Borojević 2009). Roasting extends the storage period. Archaeological publications contain many examples of the use of water chestnuts as food (Zvelebil 1994).
Evidence for the consumption of this protein and starch-rich food comes from two nearby Late Mesolithic river-dune sites, Hardinxveld-Polderweg (ca. 5500-5000 BC) and Hardinxveld-De Bruin (ca. 5500-4450 BC). Both sites produced charred shells and kernels (see Bakels and van Beurden 2001, Bakels et al. 2001, respectively). Earlier excavations at Rotterdam-Emplacement Centraal Station, another Late Mesolithic river-dune site (Brinkkemper 2007), also produced remains of water chestnut, in the form of waterlogged and charred nut spines and spine tips. The charred condition of the water chestnut remains at these Late Mesolithic sites has led to the assumption that the kernels were eaten. Moreover, the remains were found on what where at the time higher and drier sections of these dune sites, which means that the nuts must have been intentionally collected and brought there. The most informative archaeological site with regard to the processing of water chestnuts is Sarnata in Latvia (2700-2490 BC), where a ca. 40cm-thick layer of water chestnut shells and ashes was found (Zvelebil 1994).The Mesolithic dwellers of the Yangtze Harbour dune site could easily collect the nuts in the stagnant waters around the site. The nuts were probably roasted before being cracked and eaten. Roasting the nuts while they are still in their shells makes subsequent dehusking easier (cf. Borojević 2009). The fracture patterns on shell and spine fragments at the Yangtze Harbour site (see Fig. 7.22b.) suggest that the nuts were cracked possibly with a tool of antler and/or wood, or between two stones.
HazelnutsOf the ca. 75 charred hazelnut shell fragments (Corylus avellana) found at the Yangtze Harbour site, most came from samples from Trench 1 (Batches 0, 1, 2 and 3; ca. 60 in total) while Trench 2 produced far fewer fragments (also Batches 0, 1, 2 and 3; ca. 15 in total). The remains were found scattered throughout the batches and sections; no concentrations were observed. Fewer charred hazelnut fragments were found at Yangtze Harbour than is usually the case at Mesolithic sites. Perhaps the dune was only visited for short periods at a time, or the fact that the available area of dry ground was gradually shrinking left fewer locations suitable for hazel bushes. The remains occurred in all strata, however, which indicates that the nuts were collected and eaten during every occupation episode.

280
Fig. 6.21. Water chestnut (Trapa natans): a. Floating leaf rosettes; b. Nuts with spines.
Fig. 6.22. Water chestnut (Trapa natans): a. Charred fragment, a complete spine from Trench 1 - Batch 3 - Find Number 18; b. Shell and spine frag-ments from Trench 1 - Batch 2 - Find Number 55.
The fat content of hazelnuts is very high (62g per 100g fresh weight) and the nuts are also a rich source of protein. They can be eaten fresh, dried, roasted, or ground and mixed with other foods such as meat, berries, or boiled roots. The nuts can also be boiled in water to extract the oil, which in turn may be combined with other foods (Kuhnlein and Turner 1991).
The abundant occurrence of charred hazelnut shell remains, as well as evidence of the processing of nuts at many Mesolithic sites, suggests that hazelnuts were probably one of the staple foods in the hunter-gatherer diet of Mesolithic Europe. Large concentrations of charred hazelnut shells are often interpreted as material that was overheated in roasting pits or ovens. In addition, the frequency of grinding and pounding tools on Mesolithic sites (for example at Duvensee in northern Germany) are considered to be equipment used in nut processing, which would again underline the importance of hazelnut exploitation (Holst 2010). The archaeological material found at Staosnaig in Scotland also points at systematic and intensive exploitation of hazelnuts in Mesolithic Europe. The many thousands of charred hazelnut shell fragments found at the latter site were explained as overheated waste products of roasting pits in which very large quantities of nuts had been processed within a short period (Mithen et al. 2001).
a b
a
b
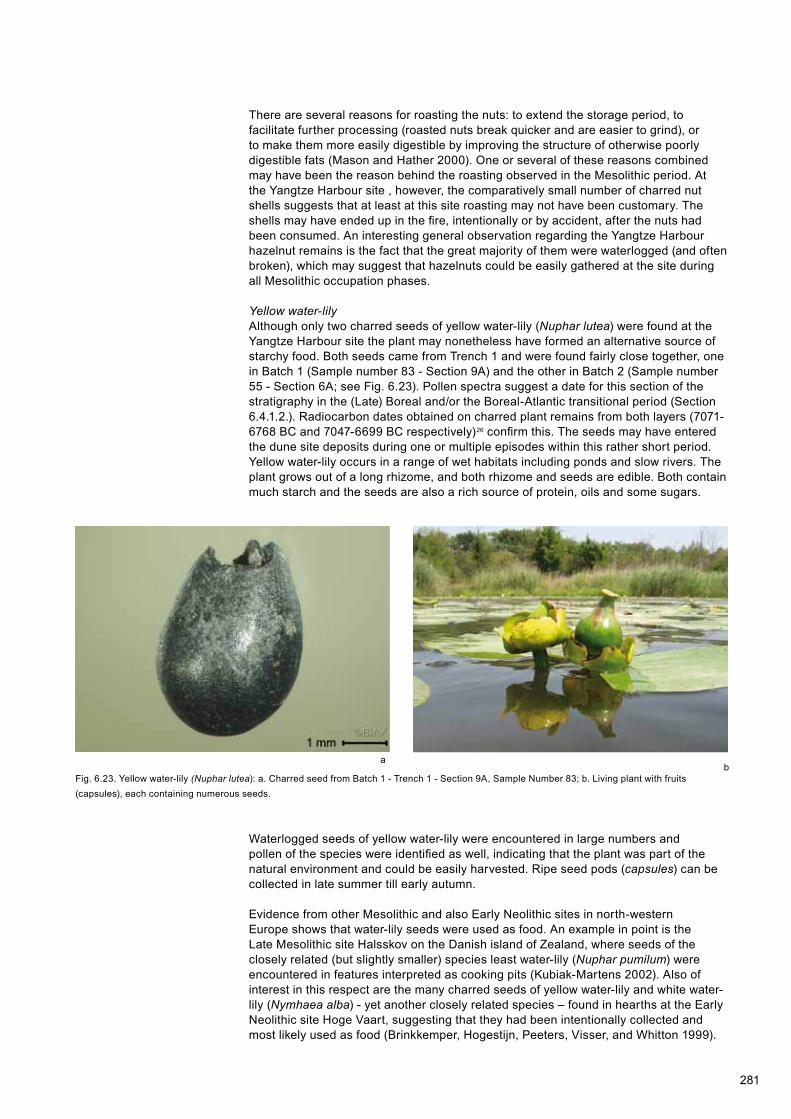
281
There are several reasons for roasting the nuts: to extend the storage period, to facilitate further processing (roasted nuts break quicker and are easier to grind), or to make them more easily digestible by improving the structure of otherwise poorly digestible fats (Mason and Hather 2000). One or several of these reasons combined may have been the reason behind the roasting observed in the Mesolithic period. At the Yangtze Harbour site , however, the comparatively small number of charred nut shells suggests that at least at this site roasting may not have been customary. The shells may have ended up in the fire, intentionally or by accident, after the nuts had been consumed. An interesting general observation regarding the Yangtze Harbour hazelnut remains is the fact that the great majority of them were waterlogged (and often broken), which may suggest that hazelnuts could be easily gathered at the site during all Mesolithic occupation phases.
Yellow water-lilyAlthough only two charred seeds of yellow water-lily (Nuphar lutea) were found at the Yangtze Harbour site the plant may nonetheless have formed an alternative source of starchy food. Both seeds came from Trench 1 and were found fairly close together, one in Batch 1 (Sample number 83 - Section 9A) and the other in Batch 2 (Sample number 55 - Section 6A; see Fig. 6.23). Pollen spectra suggest a date for this section of the stratigraphy in the (Late) Boreal and/or the Boreal-Atlantic transitional period (Section 6.4.1.2.). Radiocarbon dates obtained on charred plant remains from both layers (7071-6768 BC and 7047-6699 BC respectively)26 confirm this. The seeds may have entered the dune site deposits during one or multiple episodes within this rather short period.Yellow water-lily occurs in a range of wet habitats including ponds and slow rivers. The plant grows out of a long rhizome, and both rhizome and seeds are edible. Both contain much starch and the seeds are also a rich source of protein, oils and some sugars.
Fig. 6.23. Yellow water-lily (Nuphar lutea): a. Charred seed from Batch 1 - Trench 1 - Section 9A, Sample Number 83; b. Living plant with fruits (capsules), each containing numerous seeds.
Waterlogged seeds of yellow water-lily were encountered in large numbers and pollen of the species were identified as well, indicating that the plant was part of the natural environment and could be easily harvested. Ripe seed pods (capsules) can be collected in late summer till early autumn.
Evidence from other Mesolithic and also Early Neolithic sites in north-western Europe shows that water-lily seeds were used as food. An example in point is the Late Mesolithic site Halsskov on the Danish island of Zealand, where seeds of the closely related (but slightly smaller) species least water-lily (Nuphar pumilum) were encountered in features interpreted as cooking pits (Kubiak-Martens 2002). Also of interest in this respect are the many charred seeds of yellow water-lily and white water-lily (Nymhaea alba) - yet another closely related species – found in hearths at the Early Neolithic site Hoge Vaart, suggesting that they had been intentionally collected and most likely used as food (Brinkkemper, Hogestijn, Peeters, Visser, and Whitton 1999).
ab

282
Fig. 6.24. Dogwood (Cornus sanguinea): a. Charred and broken fruit stones from Batch 1 - Trench 1 - Sample Number 54-6B (a radiocarbon date of 7071 to 6768 cal BC obtained on material from Batch 1 suggests a Middle Mesolithic date); b. Living plant with berries.
Fig. 6.25. Hawthorn (Crataegus monogyna): a. Charred fruit-stone retrieved from a botanical sample (Batch 1 - Trench 2 - Sample Number 419); b. Living plant with berries.
6.6.3.3 Wild berries and fleshy fruits
DogwoodWaterlogged plant macroremains provided much information on many types of berries and fruits that would have been available at and around the site. All analysed batches and especially dry-sieve residues contained many dogwood (Cornus sanguinea) fruit stones, which suggests that this species, which prefers open places and forest edges, grew nearby during all Mesolithic occupation episodes. Interestingly, many fruit stones had been crushed or broken, and even more remarkable was the fact that some fruit stones were broken as well as charred (Batches 0, 1 and 3, Trench 1; Batches 1 and 2, Trench 2). The presence of especially charred fruit stones can perhaps be explained by assuming that they represent the waste products of oil extraction. (Fig. 6.25, image left). Dogwood seeds and fruit stones contain up to 50% of non-volatile oils, which can be used as fuel (e.g. in lamps) or to impregnate wood or leather. Dogwood fruit stones are frequently encountered in large numbers, and often in a fragmented and partly charred state, at South-Scandinavian Mesolithic sites, which suggests that oil had been extracted from them (Regnell et al. 1995; Regnell 2012). It is therefore quite possible that the dogwood fruit stones found at the Yangtze Harbour site were used for the same purpose.
a b
a b

283
VariousIn addition to starchy roots and tubers, acorns, nuts and oily seeds the plant macroremains encountered at Yangtze Harbour also included various kinds of fruits and berries, such as hawthorn (Crataegus monogyna - Fig. 6.25a), Guelder rose (Viburnum opulus) and occasionally crab apple (Malus sylvestris) and sloe (Prunus spinosa). Most of these remains were waterlogged, but there were also a few charred remains of hawthorn.Although the number of fruit and berry remains varied from batch to batch, their presence indicates that a wide range of edible plants was locally available when the dune was visited by Mesolithic groups, and consequently that the local diet may have been equally varied.
Of some interest was the presence of charred macroremains of various marsh plant species. Although it is unlikely that these remains represent food plants they may nonetheless be associated with human activity on the dune. These species are for example yellow flag (Iris pseudacorus), branched bur-reed (Sparganium erectum), and great sedge (Cladium mariscus), charred seeds of which were identified, and more commonly reed (Phragmites), of which charred stems (culm fragments) were found. It is possible that these remains are the result of deliberate burning of marsh vegetation. One of the best documented examples of intentional vegetation burning in the Mesolithic period comes from the Early Mesolithic (Preboreal) layers at Star Carr, the lake-edge site in North Yorkshire, England. There, the practice involved not forest clearance but burning of marsh vegetation, reed beds in particular (Hather 1998; Law 1998). The combination of charred marsh plant seeds and many charred remains of reed and possibly other herbaceous plants at the site Yangtze Harbour seems to indicate that there, too, burning marsh vegetation was a deliberate strategy in the context of human activity on and around the dune. This would make the site a suitable case study in a general discussion of the use of fire by Mesolithic groups.
6.6.3.4 Seasonality
Seasonality is one of the most intriguing issues in any study of hunter-gatherer subsistence, and also at the Yangtze Harbour site. In general, by determining which food plants were available when, and what would be the optimal time to process those foods, it is possible to establish the most likely season(s) a site was occupied. Assuming that food storage did not take place, the best period to harvest fruits, berries and seeds of e.g. hawthorn, dogwood, Guelder rose, crab apple and yellow water-lily at the site Yangtze Harbour would have been late summer and early autumn. Directly after that, in early to late autumn, potential staples such as hazelnuts and acorns would become available, so that occupation may also have extended into that season. Roots and tubers may also have been harvested in autumn. Although these foods are available throughout most of the year, their highest starch and carbohydrate content coincides with the period between autumn and early spring.

284
6.7 Conclusions
6.7.1 Landscape and land use
This chapter focussed on the analysis of botanical material. Combined with information on sediment stratigraphy and the ten radiocarbon dates relevant in this context, the results of this analysis allow a tentative reconstruction of the contemporary landscape and its exploitation at and around the dune in the western part of the present-day Yangtze harbour.The radiocarbon dates provide a timeframe for the vegetation development. As was the case elsewhere in the Netherlands, the drier parts of the landscape at the Yangtze Harbour site were covered in pine forest until ca. 7000 BC. After that, deciduous forests including oak took over in drier areas while, alder colonised wet soils. On the Yangtze Harbour river dune this transition from pine to deciduous forests occurred around 7250 BC, after the onset of peat formation, when the immediate environment of the dune was being transformed into a peat marsh which would ultimately cover large areas of the dune itself (see Chapter 3.3.5). However, radiocarbon dates obtained on botanical material from the top layer of the dune in Trenches 1, 2, and 3 in combination with pollen analysis show that this peat formation process around the dune may in fact have begun ca. 500 years earlier. This would explain why the archaeological find layer in Trenches 1 and 2 was humic; plant remains such as those frequently encountered at the Yangtze Harbour site can only be preserved in waterlogged conditions.Although concentrations were low, in absolute numbers the quantity of charred plant remains from the top of the dune was impressive. Plant macroremains and charcoal analysis revealed these remains to have become charred as a result of human activity. The charcoal assemblage did not include all wood types available on and around the dune, and the charred botanical macroremains contained relatively many edible species. It is therefore likely that the charcoal predominantlyrepresents waste from hearths and cooking fires, while the charred macroremains resulted from food preparation processes. Some of the charred material, however, consisted of non-edible parts of marsh plants. Macroscopic and microscopic analysis of these remains led to the conclusion that the Mesolithic groups deliberately set fire to the marshes, perhaps to improve hunting conditions and to increase the yield of plant foods. An alternative explanation for this practice may be that it improved (and maintained) access to the dune.Radiocarbon analysis of charred botanical remains from the archaeological layers, as well as the species spectrum in botanical assemblages from the three studied locations (Trenches 1, 2 and 3), indicate that occupation at the site was most intense in the period from ca. 7300 to ca. 6600 BC, or the Boreal-Atlantic transition, which in archaeological terms coincided with the end of the Early Mesolithic and (mainly) the Middle Mesolithic period.
The radiocarbon analysis produced two dates which fall outside this range. Charred hazelnuts from Trench 2 yielded a radiocarbon date of 8200 to 7950 BC, which is older, while a date obtained on alder charcoal from Trench 3 was dated to the period 6400 to 6200 BC, or in other words younger than the bulk of the dates from the site.The specific nature of the landscape forms a possible explanation for the intensity of human activity in the period 7300 tot 6600 BC. At this time, the dune in Target zone West of the Yangtze Harbour area provided a dry place in what were otherwise extensive marshes. Its varied character made the landscape an attractive area for hunting, fishing and plant food gathering. It did not include many dry places, however, which is why human activity tended to concentrate on the few that were available. In the period before 7300 BC, when the landscape as a whole was drier, there were more places available besides the dune, and this may explain why there were fewer Early Mesolithic botanical remains at the Yangtze Harbour site . After 6500 BC, however, the landscape changed into a freshwater tidal zone, which severely limited the settlement choices for Mesolithic groups (See chapter 3.5.3). The dune sections south-west of the studied areas, which were probably the highest, may have remained in use the longest.
285
6.7.2 Plant food supply
Analysis of the food remains produced evidence for the use of starchy tubers and roots including tubers of lesser celandine, rhizomes of common club-rush and tubers/corms of sedge species. The few identified charred parenchyma remains were nonetheless sufficient to prove that starchy roots and tubers had been processed by the peoples who visited the Yangtze Harbour dune. Species like bulrush and various types of ferns were not identified as charred parenchyma but may still have been collected for their edible, starchy rhizomes.The presence of charred hazelnuts, acorns, and water chestnuts, all in moderate quantities, proves that plant oils, non-vegetative starch, and proteins were part of the local diet. Starch may also have been provided by gathering and processing the seeds of yellow water-lily, while the presence of crushed and especially charred dogwood kernels suggests oil extraction. Yet another possibly significant food source used by the Mesolithic people at the Yangtze harbour site were fruits and berries such as hawthorn, Guelder rose and crab apple. Shrubs or low trees of these species probably grew along the edge of deciduous forests and/or in clearings, where the fruits could be easily collected. Even though the fruits and berries were of little caloric value to the Mesolithic groups, they would have provided an important nutrient in the form of fruit sugar (which is the most basic unit of carbohydrates) and they would have been a good source of vitamin C. Finally, the young shoots and leaves of a large number of herbaceous plants such as stinging nettle, sorrel and several goosefoot species could be eaten as green vegetables.The overall range of identified plant foods – fruits, berries, seeds, nuts, roots, and tubers – suggests that Mesolithic groups certainly visited the dune site in Target zone West of the Yangtze harbour between late summer and late autumn, and perhaps even until spring.

286
Notes
1. BIAX Consult, Hogendijk 134, 1506 AL Zaandam. E-mail [email protected]. BIAX Consult, Hogendijk 134, 1506 AL Zaandam. E-mail [email protected]. BIAX Consult, Hogendijk 134, 1506 AL Zaandam. E-mail [email protected]. Pollen samples BX5742 to BX5783 and BX5869 to BX5883 contained 2 tablets of respectively 18.583 and 20.848 spores.5. Shown are trees, shrubs, and undergrowth (dark green), herbaceous plants of dry soils (pink), heather, and marsh vegetation (purple), meadow vegetation (light green), herbaceous scrubland vegetation (blue), marsh, and shore vegetation (light blue), and water plants (dark blue).6. The main chart to the right shows trees, shrubs, and undergrowth (dark green), herbaceous vegetation of dry soils (yellow), and heather and marsh vegetation (purple).7. Strictly speaking this is not charcoal, since at least some of the charred microscopic particles derive from herbaceous plants.8. The authors are most grateful to Prof. dr. F. Wagner-Cremer, chair of the palaeo-ecology department, for kindly granting the use of the analysis equipment.9. Analysis of 25 fields was expected to produce results that could be reliably extrapolated to the complete sample.10. Pollen and spores also acquire a dark colour during the acetolysis stage of the pollen preparation process. However, non-charred organic material in pollen samples will often be paler, less glossy, and also less angular than charred material.11. Very thin charred particles (e.g. small charred fragments of herbaceous plants) often appear pale, while folded Lycopodium spores that are known to be non-charred, as they were added during the pollen preparation process, will often appear dark.12. Particles smaller than 1µm2 were omitted from the analysis.13. If only little glycerine is added to the pollen residue, the sample material will be thicker and therefore appear to contain more particles than if the sample is very diluted, in which case the particles are spaced further apart.14. OPX is the abbreviation used in Archis to refer to non-specific vegetable material. OPH in Archis refers to wood, including charcoal.15. The organic-material content of the sandy layer on top of the humic sand was so high that it was initially believed to be part of the peat formation. However, the actual peat formation (Nieuwkoop Formation) began higher up in the sequence, at a depth of 2.12 m - HF, which corresponds with 19.76m - asl.16. Janssen and Törnqvist established a date of 6000 14C years BC for the Boreal-Atlantic transition, corresponding with a calibrated date of 7000 cal BC.17. The life cycle of many fungi of the Sordariaceae family is only complete after the ascospores have passed through the herbivore digestive tract. Only then they are able to germinate properly.18. Reed pollen are often relatively dark and have thick cell walls and a prominent annulus. A positive identification is often impossible. However, some of the Poaceae pollen meet these criteria, making it highly likely that at least some of the grass pollen derive from reed.19. The various alder species cannot be distinguished solely on the basis of wood anatomy.20. The more so as the sedimentation rate of these clay layers was (very) low.21. These ratios are sometimes used to determine the degree of openness of a particular landscape; a high AP/NAP ratio equals dense woodland, while a low AP/NAP ratio reflects a relatively open landscape.22. GrA-55483: 7970 ± 45 14C years BP.23. GrA-55402: 8135 ± 45 14C years BP.24. GrA-55481: 8015 ± 45 14C years BP.25. GrA-55485: 8920 ± 45 14C years BP.26. GrA-55481: 8015 ± 45 14C years BP and GrA-55483: 7970 ± 45 14C years BP.
287
7.1 Introduction
In the foregoing chapters, various disciplines have focused on data relating to the stratigraphy, palaeogeography, archaeozoology, archaeobotany, and lithic material from Rotterdam’s Yangtze Harbour. This chapter presents a synthesis, aimed at integrating the results on different spatial scales: the site, the Rhine-Meuse estuary, and the southern North Sea basin. Subsequently we shall discuss the scientific significance of these investigations for our understanding of the area’s Mesolithic occupation in an international perspective. A link is made to current research into the drowning of the postglacial landscape in what is now the North Sea.
7.2 The Mesolithic habitation on the river dune
The following sections focus on the character of the Mesolithic settlement on the river-dune complex.2 Attention is given to the exploitation of food resources, craft activities, and the provenance of raw materials. The discussion of these aspects is preceded by a brief review of the chronological context and representativity of the recovered material.
7.2.1 Chronological context and representativity
The geological study (Chapter 3) has shown that the river-dune complex in the Yangtze Harbour lies in the southern margin of the Rhine-Meuse floodbasin. On the basis of OSL datings and other evidence, it was concluded that the dune complex evolved in the Preboreal, around 9000 BC. The AMS analyses on a few samples of burnt bone (of wild boar and an unidentified mammal) produced dates between circa 8550 and 8300 BC (see Section 5.8). As these are the earliest dates that can be directly associated with human activity, it seems likely that the occupation started in the Late Preboreal. Charred botanical macrofossils recovered at the foot of the dune were found to date from circa 8250 to 6500 BC (see Table 6.3). The micromorphological analysis showed that the humic soil in the top of the dune sand can be related to slope processes (colluvial reworking) in the Early Atlantic, which may be anthropogenic in origin. Given the covering of the colluvial layer by the Basal Peat (dated between 7000 and 6500 BC), it is clear that such processes at any rate coincided with the final occupation activity, at the transition from the Boreal to the Early Atlantic. From the regional history of the rise in sea level and the reconstructed height of the dune, it is clear that the dune complex was submerged by circa 6400/6300 BC at the latest. Judging by the datings of charred plant remains that can be related to human intervention, it seems that human activity ceased around 6500 BC.
When considering the time depth of Mesolithic occupation at this site, it is important to keep in mind that the landscape in the river zone was subject to continuous change. The nature of the inundations and the situation of the river-dune complex changed as a result. Initially the dunes lay far inland in the Rhine-Meuse valley and floodings were infrequent. With the approach of the sea in the last part of the Boreal, the rivers inundated the floodplain and the foot of the dune ever more frequently and for longer periods. It was not until the Early Atlantic that the area actually became submerged; in the first instance it became a freshwater tidal area with a regime of daily flooding, which gradually transformed into a brackish estuarine context several metres under water. The interplay between the hydrological conditions (ground water and surface water), the supply of nutrients (in the case of inundation: eutrophic versus mesotrophic), soil formation, and sedimentary processes (erosion and deposition) brought about physical changes to the landscape. Consequently, the accessibility of the dune complex to hunter-gatherers changed as well (Fig. 7.1).
7 Synthesis
J.H.M. Peeters1, D.C. Brinkhuizen, K.M. Cohen, L.I. Kooistra, L. Kubiak-Martens, J.M. Moree, M.J.L.Th. Niekus, D.E.A. Schiltmans, A. Verbaas, F. Verbruggen, P.C. Vos, and J.T. Zeiler
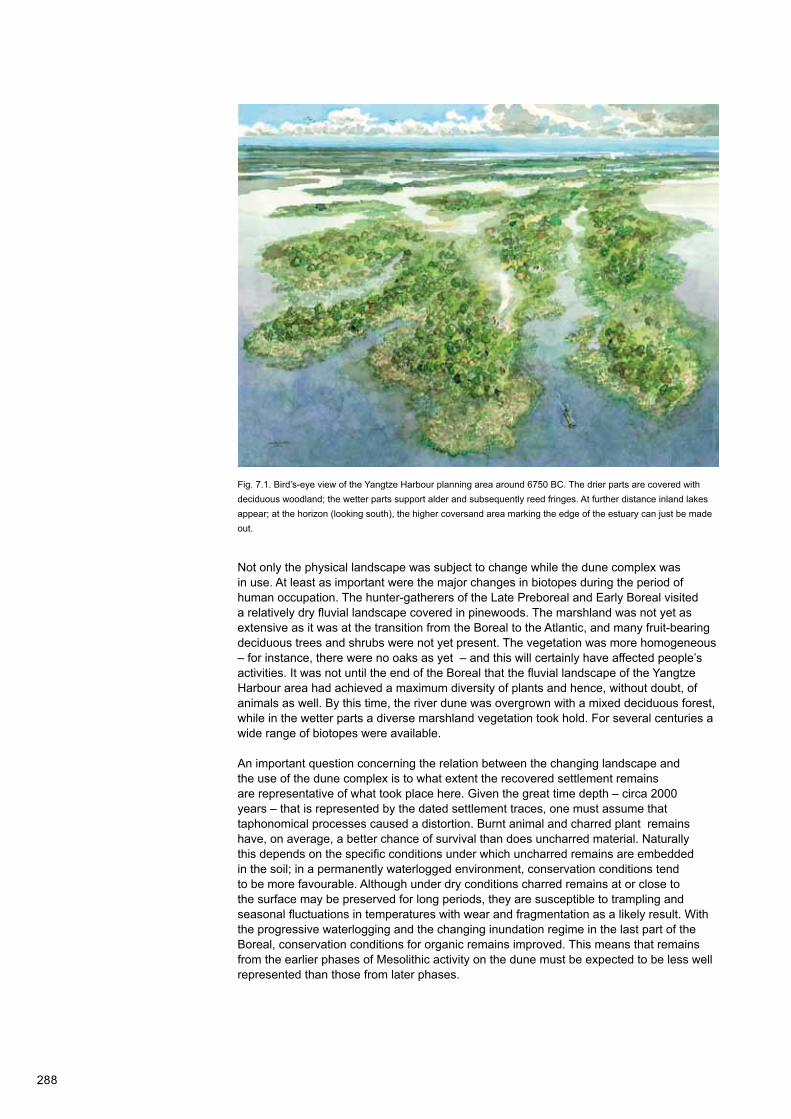
288
Not only the physical landscape was subject to change while the dune complex was in use. At least as important were the major changes in biotopes during the period of human occupation. The hunter-gatherers of the Late Preboreal and Early Boreal visited a relatively dry fluvial landscape covered in pinewoods. The marshland was not yet as extensive as it was at the transition from the Boreal to the Atlantic, and many fruit-bearing deciduous trees and shrubs were not yet present. The vegetation was more homogeneous – for instance, there were no oaks as yet – and this will certainly have affected people’s activities. It was not until the end of the Boreal that the fluvial landscape of the Yangtze Harbour area had achieved a maximum diversity of plants and hence, without doubt, of animals as well. By this time, the river dune was overgrown with a mixed deciduous forest, while in the wetter parts a diverse marshland vegetation took hold. For several centuries a wide range of biotopes were available.
An important question concerning the relation between the changing landscape and the use of the dune complex is to what extent the recovered settlement remains are representative of what took place here. Given the great time depth – circa 2000 years – that is represented by the dated settlement traces, one must assume that taphonomical processes caused a distortion. Burnt animal and charred plant remains have, on average, a better chance of survival than does uncharred material. Naturally this depends on the specific conditions under which uncharred remains are embedded in the soil; in a permanently waterlogged environment, conservation conditions tend to be more favourable. Although under dry conditions charred remains at or close to the surface may be preserved for long periods, they are susceptible to trampling and seasonal fluctuations in temperatures with wear and fragmentation as a likely result. With the progressive waterlogging and the changing inundation regime in the last part of the Boreal, conservation conditions for organic remains improved. This means that remains from the earlier phases of Mesolithic activity on the dune must be expected to be less well represented than those from later phases.
Fig. 7.1. Bird’s-eye view of the Yangtze Harbour planning area around 6750 BC. The drier parts are covered with deciduous woodland; the wetter parts support alder and subsequently reed fringes. At further distance inland lakes appear; at the horizon (looking south), the higher coversand area marking the edge of the estuary can just be made out.

289
It is difficult to dissect the recovered assemblages chronologically. Most remains come from the humic top layer of the dune flank, where slope processes and possibly trampling have led to mixing up of material of different periods. Only for the directly dated remains can an age be effectively established. Given the available datings and stratigraphical associations, most of the (charred and uncharred) plant remains seem to date from the Late Boreal/Early Atlantic (Middle Mesolithic). A similar age is likely for the unburnt bone material, most of which is likely to be associated with the later habitation phase, when increasingly wet conditions prevailed. One Early Boreal dating of hazelnut shells and two Late Boreal datings of unburnt mammalian remains must be regarded as vestiges of Early Mesolithic activity on the dune complex. At any rate part of the flint assemblage typologically and technologically ties in with a Late Boreal to Early Atlantic settlement period.
Another factor which affects representativity is the position of the investigated sites relative to the dune complex. It was explained in Chapter 3 that throughout the area the highest parts of the river dunes have been eroded away. This goes for the dune in Target zone West and adjacent areas to the southwest, as well as for the smaller dune tops in Target zone East. Any settlement remains will have been destroyed during the process. The position of the sampling excavations on the lower part of the dune flanks implies that the recovered archaeological remains derive from depositional contexts differing from those that once existed higher up. On the flanks we are likely to be dealing with slopewash, containing remains from above and/or with dumped rubbish, and we should not assume that all erstwhile activities or behavioural contexts will be represented down below. Shelter structures and burials, for instance, will presumably have been present only on the highest parts (Hamburg and Louwe Kooijmans 2001; Louwe Kooijmans and Nokkert 2001; Zijl et al. 2011). Conversely, it might be that certain activities were specifically linked to the zones lower down. Still, all this does not mean that the material gathered in this investigation only represents activities differing from those performed on the higher, uninvestigated or eroded parts of the dunes. Both intentionally discarded and post-depositionally displaced material on the lower flanks will still, to some extent, reflect activities performed on the higher parts of the dune (Amkreuz 2013).
7.2.2 The exploitation of food resources
As was shown in Chapters 5 and 6, the investigations produced a great deal of evidence about the use of animal and plant food resources that might be found in and around the dune complex. This section examines how the encountered botanical and faunal remains are to be interpreted in the changing geographical context. This is the basis for an exploitation model of the research area in, particularly, the Boreal and Early Atlantic.
7.2.2.1 Animal food resources
The archaeozoological study (Chapter 5) produced evidence of a wide range of potential animal food. The recovered bone remains represent mammals, birds and fishes, as well as some amphibians and reptiles. An important question of course is which part of this assemblage actually fed humans and which part should be regarded as naturally accumulated background fauna. Because of the severe fragmentation of the bone material, this cannot be determined on the evidence of for instance butchery and cut marks. The most direct evidence lies in the burnt preservation condition of bone fragments and in the range of species.
Given the rather limited proportion of identifiable fragments, the range of species is remarkably wide. The recovered remains represent various ecological zones (Table 7.1). Species that belong in dry or wet terrestrial environments (marshy floodbasin, riverbanks) predominate. The plentiful ‘microfauna’ also fits into this picture. Also there are species which may be found in a range of geographical zones, from the coast to estuary and the hinterland, such as various diadromous fishes which migrate between marine, brackish, and freshwater environments. Only spotted ray and turbot are true marine fishes. Strictly speaking, this also goes for plaice, but its remains are hard to distinguish from flounder, a species which may live in marine, brackish, and coastal freshwater habitats.
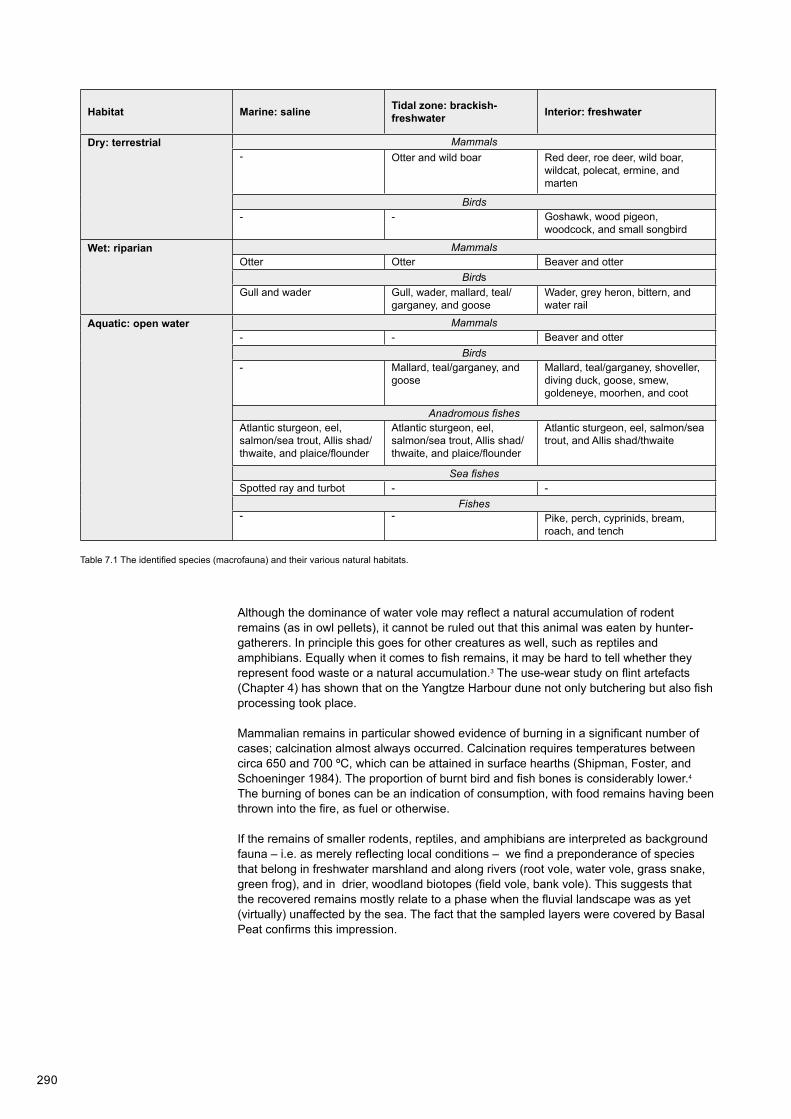
290
Although the dominance of water vole may reflect a natural accumulation of rodent remains (as in owl pellets), it cannot be ruled out that this animal was eaten by hunter-gatherers. In principle this goes for other creatures as well, such as reptiles and amphibians. Equally when it comes to fish remains, it may be hard to tell whether they represent food waste or a natural accumulation.3 The use-wear study on flint artefacts (Chapter 4) has shown that on the Yangtze Harbour dune not only butchering but also fish processing took place.
Mammalian remains in particular showed evidence of burning in a significant number of cases; calcination almost always occurred. Calcination requires temperatures between circa 650 and 700 ºC, which can be attained in surface hearths (Shipman, Foster, and Schoeninger 1984). The proportion of burnt bird and fish bones is considerably lower.4 The burning of bones can be an indication of consumption, with food remains having been thrown into the fire, as fuel or otherwise.
If the remains of smaller rodents, reptiles, and amphibians are interpreted as background fauna – i.e. as merely reflecting local conditions – we find a preponderance of species that belong in freshwater marshland and along rivers (root vole, water vole, grass snake, green frog), and in drier, woodland biotopes (field vole, bank vole). This suggests that the recovered remains mostly relate to a phase when the fluvial landscape was as yet (virtually) unaffected by the sea. The fact that the sampled layers were covered by Basal Peat confirms this impression.
Habitat Marine: saline Tidal zone: brackish-freshwater Interior: freshwater
Dry: terrestrial Mammals- Otter and wild boar Red deer, roe deer, wild boar,
wildcat, polecat, ermine, and marten
Birds- - Goshawk, wood pigeon,
woodcock, and small songbird
Wet: riparian MammalsOtter Otter Beaver and otter
BirdsGull and wader Gull, wader, mallard, teal/
garganey, and gooseWader, grey heron, bittern, and water rail
Aquatic: open water Mammals- - Beaver and otter
Birds- Mallard, teal/garganey, and
goose Mallard, teal/garganey, shoveller, diving duck, goose, smew, goldeneye, moorhen, and coot
Anadromous fishesAtlantic sturgeon, eel, salmon/sea trout, Allis shad/thwaite, and plaice/flounder
Atlantic sturgeon, eel, salmon/sea trout, Allis shad/thwaite, and plaice/flounder
Atlantic sturgeon, eel, salmon/sea trout, and Allis shad/thwaite
Sea fishesSpotted ray and turbot - -
Fishes- - Pike, perch, cyprinids, bream,
roach, and tench
Table 7.1 The identified species (macrofauna) and their various natural habitats.

291
7.2.2.2 Plant-food resources
As regards the use of plant-food and subsistence resources, charred remains (roots, tubers, acorns, nutshells, seeds) of plants provide the most immediate evidence. Here also a wide variety of species are encountered, representing various environments ranging from dry woodland to more or less open water (Table 7.2). Evidently various ecological zones were exploited, which offered a variety of plant-food resources to the hunter-gatherers who visited the Yangtze Harbour dune. The zones are (1) woodland and forest margins on dry (to moist) places for gathering acorns, hazelnuts, tubers of lesser celandine, berries of dogwood, and hawthorn, and possibly also other berry-bearing plants and crab apples; (2) wet zones for gathering underground plant parts, such as rhizomes of common club-rush and tubers of the sedge family; and, (3) open water for gathering fruits of water chestnut and seeds of the yellow water-lily. Hazelnut and acorn are the best-documented food resources for the Mesolithic and are almost invariably part of Mesolithic assemblages throughout Europe. Fragments of charred hazelnut shells are easily identified even by non-experts, but other remains are less readily picked out. To a large degree this is due to methodical limitations; the identification of fragile, charred archaeological parenchyma remains requires specialist analysis (see e.g. Perry 1997; Kubiak-Martens 1999; idem 2002).
Hazelnuts especially are often considered an important part of the Mesolithic diet (Holst 2010), but their importance may well be overestimated in proportion to starch-rich roots and tubers, and fruits and seeds. In this respect especially, the Yangtze Harbour research has yielded unanticipated results. Owing to the explicit attention to charred plant remains, important evidence emerged for the use of starch-rich vegetative foods (including rhizomes of common club-rush and tubers of lesser celandine), as well as non-vegetative starchy foods (such as acorns and water lily seeds, Table 7.2). This probably was food that was seasonally gathered at and in the close vicinity of the site. The identification of starch-rich food resources has definite implications for our understanding of the plant food component in the hunter-gatherers’ diet. Starch-rich roots and tubers formed an important part of the diet, especially when they were accessible and plentiful. The Yangtze Harbour-results support the notion that starch was an important source of energy and that the Mesolithic diet was considerably more varied than is commonly assumed, with a more balanced ratio of plant to animal food (cf. Zvelebil 1994). To gain better insight into the importance to Mesolithic hunter-gatherers of plant food resources – starch-rich ones in particular – compared to animal protein, it is necessary to extend sophisticated research into archaeological parenchyma remains also to other sites.
Species Plant part used Habitat AgeOak (Quercus robur/petraea) Acorns Woodland Late Boreal*Hazel (Corylus avellana) Nuts Woodland/scrub Early Boreal - Early Atlantic*Hawthorn (Crataegus monogyna) Berries Forest margin/scrub UndeterminedLesser celandine (Ranunculus ficaria) Tubers Moist woodland Late Boreal - Early AtlanticSedges (Cyperaceae)Dogwood (Cornus sanguinea)
Rhizome/seedBerries/seeds
Marsh/water edge Forest margin
Early BorealLate Boreal - Early Atlantic
Common club-rush (Schoenoplectus lacustris) Rhizomes Water edge Late Boreal - Early Atlantic*Yellow water-lily (Nuphar lutea) Seeds Shallow/deep water Late Boreal - Early AtlanticWater chestnut (Trapa natans) Nuts Shallow/deep water Late Boreal - Early Atlantic
Table 7.2 Overview of identified plant-food resources (all found in charred remains).* AMS radiocarbon-dated.
292
7.2.2.3 Exploitation strategies
The relatively wide range of identified animals and plants will have been hunted, caught and gathered in various ways. The larger mammals (red deer, roe deer and wild boar) were hunted. Flint points can be regarded as evidence of hunting from the settlement, be it that this could not be corroborated by use-wear analysis, because much of the flint had suffered recent damage. The estimated age of the animals suggests a preference for adult individuals. Yet it should be remembered that young animals tend to be underrepresented in bone assemblages.
To what extent active hunting took place in the close vicinity of the dune complex cannot be established. Although the above-mentioned species potentially lived in the immediate surroundings of the site, this does not necessarily imply that they were also hunted most intensively and successfully there. The local and regional presence of large game may strongly vary throughout the year and over the years. From ethnographic sources it is known that hunter-gatherers, like for instance the Mistassini Cree in the north of Quebec, keep a close eye on the game population.5 Hunting is usually done near the settlement, but expeditions may also be undertaken from hunting camps at considerable distances, with hunters covering as much as 30 or 40 kilometres in a single day (Rogers 1963).
Evidence of the exploitation of food resources at considerable distance from the river-dune complex is found in the presence of some marine fish species and coastal birds. As was explained in Chapter 3, well into the Boreal the coast lay over 20km away, and – given the results of the diatom analysis – there was no hint of a nearby marine environment until the transition to the Early Atlantic. Yet it cannot be ruled out that even at this early date (peri-)marine food resources were exploited in the more remote coastal and estuarine areas. Although fishing generally takes place in the immediate surroundings of a settlement, we should definitely allow for the possibility that greater distances were involved. With waterborne transportation, the distance to be covered (there and back by canoe) may be great, as long as harvesting the resource within a single day is feasible. The marine fish species are likely to have been caught at a considerable distance from the dune, as the sampled deposits were covered by a layer of Basal Peat which was formed in a freshwater environment.
Given the large number of freshwater fish species, it is likely that fishing mainly took place close by. The remains show that the fish often were large specimens, although smaller fishes too are represented. This may indicate the use of a diversity of fishing methods such as fish traps, nets, or harpoons. The bone artefacts from this site include no (fragments of) harpoon heads, in contrast to those of Maasvlakte 1, where hundreds of specimens were collected (see Section 7.3.2.1; Verhart 1988).
Collecting plant foods and hunting for strongly territorial game (for instance beavers and otters) by means of snares and traps will have been done in the vicinity of the dune. In this respect the position of the river-dune complex in the margin of an extensive river valley is ideal, not only because of the availability of a wide range of food sources, but also the possibility of waterborne transport of people and materials.
Good accessibility of the settlement would have been a prerequisite. The investigations yielded strong evidence of the repeated burning off of vegetation in the marshy zone around the dune. This conclusion is based on the horizontal position of charred plant remains in the cores, especially Core B37A0675/W-06 (see Chapter 6). In the microscopic and macroscopic analyses, the charred remains were identified largely as culms and (possibly) leaves of reeds (Phragmites). In macro-remains, these are accompanied by charred seeds of plants common in reedmarsh vegetation - including yellow flag, branched burr-reed and galingale. It is unlikely that these remains represent food plants. In various micromorphological thin sections too, horizontally oriented, charred plant remains were encountered in dark-coloured levels within the upper part of the Wijchen Member (Fig. 7.2). This orientation indicates that the remains are an in situ reflection of the burning of the local reed vegetation.6 Although several different reasons may be suggested for intentionally burning marsh vegetation, such as economic and strategic considerations (e.g. Mellars 1976), creating a connection between the waterside and the dune may have been an important motive. The marshy zone around the dune in
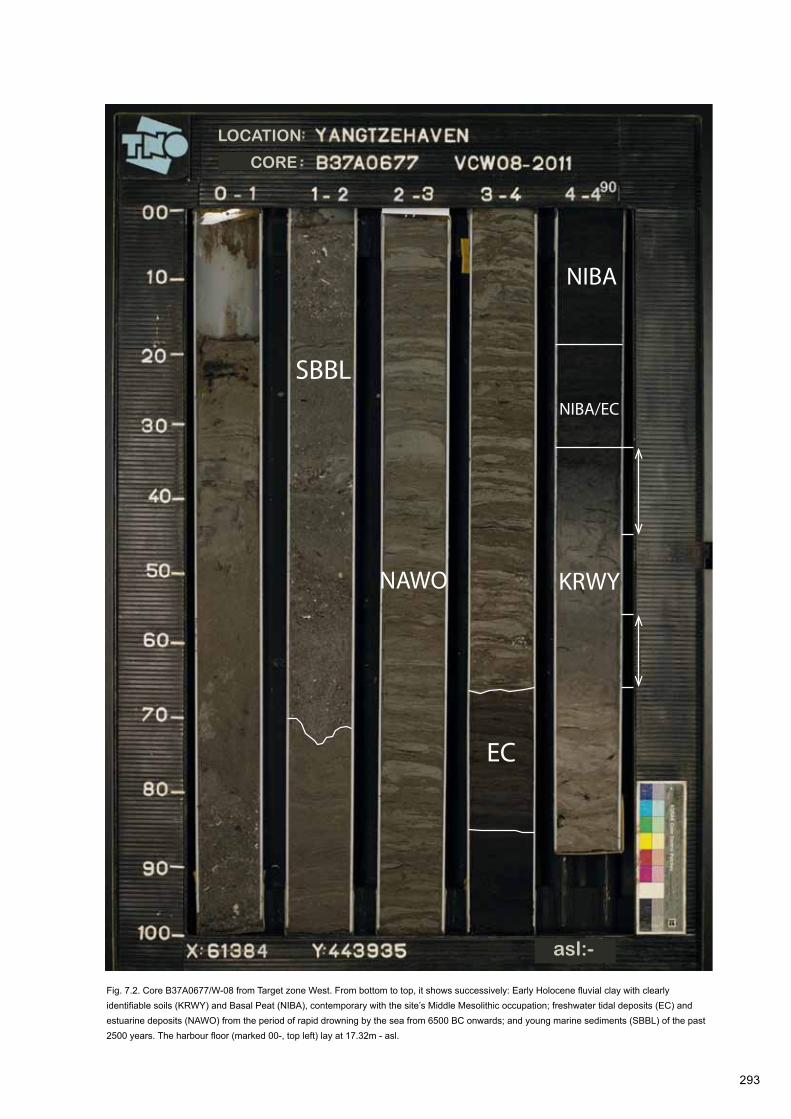
293
SBBL
NAWO
EC
NIBA/EC
NIBA
KRWY
LOCATION
CORE
asl:-
Fig. 7.2. Core B37A0677/W-08 from Target zone West. From bottom to top, it shows successively: Early Holocene fluvial clay with clearly identifiable soils (KRWY) and Basal Peat (NIBA), contemporary with the site’s Middle Mesolithic occupation; freshwater tidal deposits (EC) and estuarine deposits (NAWO) from the period of rapid drowning by the sea from 6500 BC onwards; and young marine sediments (SBBL) of the past 2500 years. The harbour floor (marked 00-, top left) lay at 17.32m - asl.

294
the Yangtze Harbour area would have constituted an inconvenient barrier between the sandy knoll and the open water; burning the reeds may have been an effective strategy for facilitating and maintaining accessibility.
7.2.2.4 Food processing and preparation
The acquisition and consumption of food is a primary condition for life. Since no direct ‘field observations’ could be made, it is not possible to draw specific conclusions about the way foodstuffs were processed or prepared, for instance in cooking pits. Burnt bone and charred macro-remains of nuts, acorns, fruits, seeds, rhizomes, and tubers which are considered food remains, do however indicate that fire was employed. Burnt artefacts and presumed cooking stones point to the presence of hearths. Charcoal too can – among other things – be interpreted as waste from hearths.
There are various reasons to believe that the charcoal – other than the above-mentioned reed and other marsh plant remains – did not derive from natural marsh fires. The charcoal spectrum is dominated by deciduous trees and shrubs that grew on the dry dune crest, while the surrounding marshland supported far fewer trees – such as alder and willow – that could have been a source of the charcoal. This indicates that the charcoal would not have been the result of marsh fires. It is theoretically possible that the charcoal resulted from natural fires on the dune, but this explanation is rather unlikely given the absence of charred herbaceous plants of dry habitats, other than food remains such as the retrieved, charred tubers of lesser celandine.
A comparison of the charcoal assemblages with the evidence from the pollen and macro-remains prompts the tentative conclusion that not all of the woody vegetation on the dune was affected by fire. For instance, charcoal of fruit-bearing trees and shrubs is scarce. Though there is some charcoal of apple-like trees or shrubs, possibly apple or hawthorn. Of sloe and dogwood there is no charcoal at all, whereas their fruit-stones do appear in macro-remains. An explanation may be that no sloe or dogwood was gathered for fuel, because these made poor firewood, while other wood types – pine and oak – were plenty available and burn with a good flame.
7.2.3 Craft activities
The Yangtze Harbour dune also saw a wide diversity of activities of a more artisan nature. To a large degree these can be inferred from the way in which flint and other stone tools were used for the processing of non-food resources. The use-wear traces on flint artefacts show that plant as well as animal and mineral materials were worked. Besides, the archaeozoological and botanical macro-remains themselves provided evidence of the use of plant and faunal resources for non-food uses.
7.2.3.1 Animal and mineral materials
The larger mammals such as red deer, roe deer, wild boar, and beaver will have been important as sources of meat and fat. This also goes for smaller species such as otter and maybe even water vole. The animals may also have yielded skins and sinews, as well as bones, teeth, and antler. It is likely that some smaller mammals such as wildcat, polecat, and ermine were caught primarily for their fur.
The processing of skins is one of the activities documented by the use-wear analysis on flints (Chapter 4). Various flint artefacts can by their use-wear traces be attributed to the cleaning of fresh skins, the production of leather or furs, and the processing of skins into items such as garments or containers. To these ends, people used various flint tools: scrapers, burins and flakes (both retouched and unmodified ones). Also there is evidence that hints at the addition of mineral materials, for instance as tanning agents, but it is not quite clear whether this was intentional. Important in any case is the observation that no specific stage in skin processing predominates, which suggests that these crafts were practiced in the domestic sphere.
295
Some use wear on flint tools points to bone working. The traces of working fresh and dry bone may reflect the production of implements such as harpoon heads and axe hafts. Also the chunks of sandstone – fragmented through heating – with evidence of grinding might point to the polishing of bone or antler. Among the archaeozoological material, a few fragments of bone implements were found, which is an indication of local use.
Also, some flint tools showed traces pointing to the processing of jet and shell. The activities this entails are cutting, scraping, engraving and widening of perforations. It is possible that also the lumps of sandstone with grinding marks are connected with this craft. Although this is a tentative idea, the working of jet and shell might be linked to the production of jewellery or other ornaments.7 This activity is not known to have been documented earlier in a Mesolithic context. As so far just a few Early Mesolithic assemblages have been properly examined for use wear on flint tools, it is not possible to say to what extent this was a common or an unusual activity. The bone material retrieved at the Yangtze Harbour at any rate included part of a bead made out of bird bone (see Fig. 5.8c).
7.2.3.2 Plant materials
Although no utensils made from plant materials were recovered, it is likely that plant materials played an important part in the production of utensils. The study of use wear on flint artefacts produced evidence of bark, which may have been used to make for instance rope or containers, and wood (Chapter 4). Traces of woodworking may relate to making canoes, paddles, bows, or hafts for flints, such as scrapers.
The use-wear analysis also showed that the working of siliceous plants (such as grasses, reeds or horsetail) was a regular activity. Evidence of this activity has been frequently observed in the Mesolithic and the Early Neolithic, and appears to be expressly related to wetland contexts (van Gijn 2010). Siliceous plant matter was processed in a scraping fashion, yet it is unclear whether this activity is related to food processing, such as harvesting the seeds of wild grasses, or maybe to the production of for example containers or mats from flattened and scraped reeds.8
A remarkable discovery is the presence of charred and broken or crushed fruit-stones of dogwood. At various Mesolithic sites in southern Sweden (Bökeberg, Tågerup), fruit-stones of dogwood have been found in large numbers (Regnell et al. 1995, Regnell 2012). This could point to oil extraction from the fruit-stones and the seeds, which contain up to 50% of non-volatile oil that can be used as a fuel or impregnation agent.
7.2.3.3 Flint
The typo-technological composition of the flint assemblage shows that flint-knapping was a regular activity. All stages of the process are represented. There are a few raw, unworked flint nodules, as well as cores in various stages of processing, decortication, core-preparation, core-rejuvenation, and corrective flakes, blades, and retouched tools. Almost 4% of all flint artefacts are retouched tools, such as points, scrapers, burins, notched pieces, and borers. Burin spalls, notch remnants (‘microburins’), a resharpening flake (presumably of a scraper), and a retouch chip all point to the production and/or maintenance of tools.
Relatively small flint nodules were brought to the dune to be knapped there into flakes and small blades for the production of tools, such as points, scrapers, burins, and borers. The flint nodules are unlikely to have been gathered in the immediate vicinity of the dune. It is possible that they were picked up in the beds of the active rivers further north during periods of low water. Meuse gravel does have a flint component, but the fluvial deposits underlying the Maasvlakte contain very little gravel. Older Rhine-Meuse terrace deposits, such as those occurring south of the Yangtze Harbour area, are somewhat more gravelly. These deposits are covered almost entirely by coversands from the final part of the Pleistocene, but where streams cut more deeply into the coversand during the Early Holocene, such gravel could outcrop locally in the slopes and beds. Hence streams that

296
Fig. 7.3. Distribution of Wommersom quartzite used as a raw material for tools during the Middle and Late Mesolithic (after Gendel 1984 and 1987, see Louwe Kooijmans, van den Broeke, Fokkens, and van Gijn 2005, with additional data from the sites Rotterdam-Beverwaard Tramremise, Rotterdam-’t Hart, Rotterdam-Yangtze Harbour, and Hoge Vaart A27 in Flevoland). Based on the wetland context of the sites from Rotterdam and Hoge Vaart, a tentative northern boundary of the distribution area is indicated in pink. The yellow dot marks the location where the Wommersom quartzite outcrops, and was quarried; Rotterdam-Yangtze Harbour is indicated with a red dot.
0 100 km
0 100 km
at a short distance to the southeast of the Yangtze Harbour drained into either the Rhine-Meuse valley or the river Scheldt, and thereby cut into the Kreftenheije Formation (Units B5 and B6; Busschers et al. 2007), also may have provided access to raw flint.
At a greater distance downstream, but accessible along the Rhine-Meuse system, the gravel and flint component rises again, also in the active riverbeds of the Early Holocene. From the confluence with the river Thames, the deposits can be classed as rich in flint. The Early Holocene coastal zone in that particular area may therefore have been an important source of flint nodules. This potential source was partly lost around 8000 BC because of the rising sea level, but flint could still be gathered along the seashore in the drowning regions. Other more remote occurrences of flint similar to that which was worked on the Yangtze Harbour dune, are found in the ice-pushed ridges of the central Netherlands, especially the Utrechtse Heuvelrug.
That connections with far-flung locations existed, however, is evident from the occasional occurrence of Wommersom quartzite, a rock from a specific area near the Belgian town of Tienen/Tirlemont. Mapping the geographical distribution of this rock (van Oorsouw 1993) shows that progressively less Wommersom quartzite is found as the distance from its source increases (a distance-decay curve). Rotterdam lies in the marginal zone of the distribution area (Fig. 7.3). The river Scheldt connected Tienen/Tirlemont with the Maasvlakte area and would have been a distribution route for this material. The fragment of amber too (Chapter 4) may have come from quite far away. In the Netherlands, amber – originally deriving from the Baltic area – is found mainly on the coast.
297
7.2.4 The nature of the habitation on the Yangtze Harbour dune
The foregoing sections together paint a differentiated picture of human occupation that is marked by a wide variety of activities and use of resources. The diversity implicit in the data is remarkable, especially given the relatively modest volume of the overall assemblage and the proportion of identifiable material. This prompts the question of how to envisage the nature of the habitation on the dune. As was discussed in Section 7.2.1, it is unlikely that the history of occupation and the activities performed at the site through time are ‘fully’ represented in the data (cf. Amkreuz 2013). Nonetheless, the results definitely illuminate aspects that offer deeper insight into the nature of the habitation on the Yangtze Harbour dune.
7.2.4.1 Duration of occupation and seasonal indicators
As was established in the foregoing sections, the dune site in the Yangtze Harbour was visited by people at any rate from the Late Preboreal into the earliest part of the Atlantic. On the basis of radiocarbon datings of archaeozoological and archaeobotanical remains and the palaeogeographical developments, we must reckon with a good millennium-and-a-half of human activity. But this would not have been a period of continuous human presence. Groups of hunter-gatherers came and went, for generations upon generations. How frequently and how long they resided on the dune is unknown, but the evidence of single use on most of the flint tools suggests that these periods were always of fairly short duration, maybe in the order of a few weeks. In the course of this interval the landscape changed dramatically, and with it the availability of various resources. Whether the site became more intensively used over the course of this period, or when it saw its heyday, cannot be determined unambiguously on the basis of the evidence alone.
Some insight into the possible duration of human residence might be derived from the seasonal clues implicit in the recovered plant and animal resources that were available in the Late Boreal and Early Atlantic. The best season to collect seeds and berries listed in Table 7.2 would have been late summer and early autumn. Early to late autumn would have been best for gathering hazelnuts, acorns, and chestnuts. Rhizomes of common club-rush too may have been harvested in the autumn. Even though many root foods would have been available throughout the year, their highest concentration of starch occurs between autumn and early spring. A problem however is that especially nuts and roots/tubers can be eaten throughout the year, if they are stored for later consumption. Hazelnuts and acorns were probably roasted, which made them more preservable. Storage of food by Mesolithic hunter-gatherers is difficult to demonstrate, but is very likely to have been practised (Binford 1980). For instance, Cunningham (2011) stresses the importance of small-scale food storage by hunter-gatherers as a prerequisite for maintaining their mobility system.
The identified animal species offer some rough seasonal indications. Although the mammals would have occurred locally throughout the year, the presence of fur animals could point to winter activity, when pelts are at their best, if these animals were indeed hunted for their fur. Other clues come from some birds (smew and goldeneye), which nowadays appear mainly from late autumn into spring, and from diadromous fish species (thwaite, Ellis shad, sea salmon), which migrate upriver in spring and summer.
The combined archaeobotanical and archaeozoological data thus represent all seasons. The broad seasonal spread of the find assemblage, in as far as it relates to the Late Boreal and the Early Atlantic, may be a palimpsest of many shifts and alternations in the seasonal use of the site throughout its occupation history. Indeed it is possible that there were (brief) visits in all seasons, throughout the year. The absence of a distinct clustering of season-specific species does suggest that the visits to the Yangtze Harbour dune were not perennially limited to a particular part of the year. There may have been considerable variation over the long chronological interval in which the dune was used.
Another tricky question concerns the intensity of occupation. How much time passed between the various periods of activity on the Yangtze Harbour dune? Did people return to this location on an annual basis, or might several years pass before people ‘disembarked’

298
here again? An answer may be (partly) implicit in the levels with burnt marsh vegetation remains that were found in the cores. Micromorphological thin-section analysis and the archaeobotanical data have shown that reedmarsh vegetation must have been burnt in situ on multiple occasions. The conditions for burning reeds are best when they are dry, in autumn and winter through early spring. It is very likely that the intentional burning of marsh vegetation was repeatedly done in order to make the dune flank accessible after periods of absence, in which the vegetation would time and again recover. Reed fringes may in the course of one or two years regrow sufficiently to render passage virtually impossible without renewed intervention. This observation may allow a glimpse of the rhythms governing the use of the Yangtze Harbour dune, at any rate in a particular period.
7.2.4.2 The settlement context
The evidence that groups of hunter-gatherers in the course of many centuries, over many generations, kept returning to the Yangtze Harbour dune means that the site continued to play a role in the lives of these people. The great diversity of activities that could be demonstrated, suggests that the settlement was not one of ‘specialised’ use with a marked emphasis on just a few, directly related activities. So-called ‘special-purpose’ encampments are marked by a one-sided range of functions and associated tools. This was not the case on the Yangtze Harbour dune, which nonetheless does not exclude the possibility that the dune was also used for specific activities such as seasonal harvesting of plant resources. However, on the basis of the present evidence this cannot be ascertained.
The functional variation that could be demonstrated by the use wear on the flint tools points to a context in the domestic or residential sphere. That is to say, a settlement or encampment where one or more families resided, where food was prepared and consumed, and where all sorts of materials were processed into utilitarian items, possibly including personal and other ornaments. Despite the lack of direct evidence, shelters will have been built on the dune, as well as other structures that for instance served the processing and storage of animal and plant foods. The production, use and disposal of tools at the site tie in with such a context, which most closely matches what in the literature is termed a ‘base camp’ (Binford 1980).
The recovered evidence of the production of various tools and possibly also decorative or artistic items on the dune in the Yangtze Harbour does not necessarily mean that these were all used locally. Some tools and ornaments are likely to have been carried from one location to the next, and may have been retained for years, or indeed generations.
It must be kept in mind that the dune site may have served different purposes through time. Given the great time depth that is evident from the vestiges, it is quite plausible that the role of the site changed over time. The physical landscape was subject to dramatic changes and the vegetation evolved from rather homogeneous to highly varied, which resulted in shifting possibilities for exploitation of all sorts of resources. Nor does the social context of settlers’ activities need to have remained constant, whether or not in response to the geographical transformations. Maybe this location was repeatedly used for many generations (‘continuity of habitation’), while the focus of their activities strongly changed (‘behavioural discontinuity’; Peeters 2007; idem 2009a; idem 2009b).
7.3 The Yangtze Harbour dune in relation to the Rhine-Meuse estuary
The habitation on the Yangtze Harbour dune should not be considered in isolation. Traces of Mesolithic habitation have been encountered at various locations in the Rhine-Meuse estuary, so far all on river dunes (Figs 7.4 and 7.5). Besides, numerous stray items of Mesolithic age are known, especially from Maasvlakte 1 (and now also from the beach of Maasvlakte 2), where – since its construction in the 1970s – hundreds of bone harpoon heads have been gathered from the dredged-up sand (Verhart 1988). On beaches elsewhere along the coast (and now also from Maasvlakte 2), many Mesolithic objects are collected that were brought up with sand from the North Sea. This section examines how the picture presented by the Yangtze Harbour ties in with what else is known from the region.

299
Fig. 7.4. Location of the discussed Mesolithic sites in and around Rotterdam, in relation to the river-dune complexes identified by detailed mapping programmes (compiled by: Municipality of Rotterdam Archaeological Service BOOR). 1. Rotterdam-Maasvlakte 1; 2. Rotterdam-Yangtze Harbour; 3. Rotterdam-Emplacement Centraal Station; 4. Rotterdam-Hillegersberg; 5. Rotterdam-Grindweg/Argonautenweg; 6. Rotterdam-Bergse Bos; 7. Rotterdam-De Velden; 8. Rotterdam-Blankenburgstraat/Hoogvlietstraat; 9. Rotterdam-’t Hart; 10. Rotterdam-IJsselmonde; 11. Rotterdam-Beverwaard Tramremise; 12. Hardinxveld-De Bruin; 13. Hardinxveld-Polderweg.
Scheldt and Rhine-Meuse river- and stream valleys
River dunes
Coversand on fluvial terraces
!(!(
!( !(!(
!(
!(!(!(
!(!(
!(
!(!(!(
!(
!(
!(
0 10 km
´
!(
1
2
4
5 6
3
87
9 10
11
1213
Rhine-Meuse
Scheldt
!(!(
!( !(!(
!(
!(!(!(
!(!(
!(
!(!(!(
!(
!(
!(
0 10 km
´
!(
1
2
4
5 6
3
87
9 10
11
1213
Rhine-Meuse
Scheldt
!(!(
!( !(!(
!(
!(!(!(
!(!(
!(
!(!(!(
!(
!(
!(
0 10 km
´
!(
1
2
4
5 6
3
87
9 10
11
1213
Rhine-Meuse
Scheldt
!(!(
!( !(!(
!(
!(!(!(
!(!(
!(
!(!(!(
!(
!(
!(
0 10 km
´
!(
1
2
4
5 6
3
87
9 10
11
1213
Rhine-Meuse
Scheldt
7.3.1 Chronology and palaeogeographical context
Since the construction of Maasvlakte 1 in the 1970s and early 1980s, private collectors have gathered remarkable numbers of bone harpoon heads and various other antler and bone artefacts. In 1988 Verhart published an overview of these finds. On typological grounds, an (Early) Mesolithic age was deemed the most likely, and this was supported by two radiocarbon dates which indicated Preboral and Late Boreal ages (Verhart 1988). But a third point produced a Middle Atlantic origin.9 For a long while, the ‘Maasvlakte points’ were regarded as the earliest signs of hunter-gatherer activity around the Meuse estuary. The excavations carried out earlier by Louwe Kooijmans on river-dune crests (donken) and on dune flanks in the polder Alblasserwaard related mainly to the Neolithic. In this region the excavations at Hardinxveld-Polderweg and Hardinxveld-De Bruin yielded the very first evidence from the Late Mesolithic (Louwe Kooijmans 2001a; idem 2001b; Figs 7.4 and 7.5). In recent years, however, the archaeologists from BOOR have carried out various investigations in Rotterdam, which also brought to light earlier phases of Mesolithic occupation, in part contemporary with the occupation on the Yangtze Harbour dune (Döbken, Guiran, and van Trierum 1992; Guiran and Brinkkemper 2007; Moree, Schoonhoven, and van Trierum 2010; Zijl et al. 2011; Schiltmans 2013).
7.3.1.1 Continuity of occupation in the Rhine-Meuse estuary
The available radiocarbon dates show that the settlement traces from the Yangtze Harbour dune are among the earliest in the Rhine-Meuse estuary (Table 7.3). The harpoon heads of Maasvlakte 1 are (in part?) contemporaneous, as are the Mesolithic settlement traces that were found at Rotterdam-Beverwaard Tramremise (Zijl et al. 2011). A chronological gap of several centuries, between circa 6400 and 6000 BC (Table 7.3), appears between the end of the Mesolithic settlement on the Yangtze Harbour dune and the beginning of activity at the sites of Rotterdam-Emplacement Centraal Station (Guiran and Brinkkemper

300
2007), Hardinxveld-Polderweg (Louwe Kooijmans 2001a), Hardinxveld-De Bruin (Louwe Kooijmans 2001b), and Rotterdam-Groenenhagen, the possible result of the fairly small number of available radiocarbon datings and the generally limited size of the investigated areas. Equally, it may reflect an interruption in the occupation of the region or specific taphonomic conditions due to the environmental change from a river valley to an estuary in this particular period (see also Section 7.4.1.3).
Only the sites at Hardinxveld have been investigated more intensively, but here too it should be said that only relatively small parts of the dunes were excavated. The ‘starting dates’ of both sites around 5500 BC (Late Mesolithic) are based mainly on radiocarbon dating. Yet the flints include various microliths (triangles, segments, and fairly many A- and B-points), which may in fact be of Middle Mesolithic age.
For the site of Rotterdam-Beverwaard Tramremise, the few radiocarbon dates of the Mesolithic fall between circa 7600 and 7100 BC. To what extent these dates are a reliable reflection of local Mesolithic activity is hard to assess. Given the presence of Swifterbant-type pottery, there was local activity even into the Neolithic, and the crest of this river dune was not submerged until circa 3500 BC (Zijl et al. 2011, 25). The flint assemblage includes material which on technological and typological grounds may well be of Late Mesolithic and/or Early Neolithic age.
The investigated sites in the Rhine-Meuse estuary display a quasi-continuous Mesolithic/Neolithic occupation history from the second half of the Preboreal onwards. The earliest phase is represented by the site in the Yangtze Harbour. The long habitation history of the dune is paralleled at the other investigated sites, be it that the starting and ending dates of their occupation markedly differ. As the dating possibilities and research strategies strongly vary among the investigated sites, the starting date is not always clear. Only in the case of the Yangtze Harbour dune can it be positively demonstrated, thanks to radiocarbon datings of burnt bone and OSL datings of dune sand and underlying fluvial sand, that human activity started as early as the second half of the Preboreal. The end date in the Rhine-Meuse estuary seems always to coincide with the submersion of the sandy knolls that Mesolithic and Neolithic people inhabited.10
7.3.1.2 Shifting geographical context
As a result of the rising sea level, all of the known sites in the area were progressively influenced by the proximity of the sea. The major rivers and the upstream regions underwent great changes since the Late Glacial. Climate change caused the width of the rivers to decrease from ca 13,000 BC onwards (Hijma et al. 2009), whereas in the preceding millennia it had increased (Busschers et al. 2007). The Bølling interstadial, the first warm phase in the Late Glacial, saw a rise in mean summer temperature. As a result, the subsoil was no longer permanently frozen and the braided river system became a network of meandering, parallel channels, the largest of which were to remain active into the Early Holocene. In response to the rising temperature, precipitation and soil humidity, a dense vegetation cover developed in the river valley and its catchment area. As a result a more regular discharge was established, transporting less sediment than in the preceding colder periods. Beside the remaining channels, fluvial plains abandoned by the river survived as low terraces which flooded only at high water levels, when they received deposits of silt and clay. The river channels themselves continued to meander actively. Their meandering belt became wider and the beds of the larger channels deepened. An effect of this was that the smaller channels lost their share in the discharge and in the course of the Late Glacial became obsolete. The smaller Late Glacial channels became residual channels, winding depressions in the floodplain holding stagnant water, which gradually filled up with organic sediment. Residual channels are known from all periods of the Later Glacial and Early Holocene. In the Rhine-Meuse valley in the central and western Netherlands, the river did not abandon the last of its secondary channels until sometime in the Early Holocene (Hijma et al. 2009).
Concurrent with the trend towards progressive warming of the climate from the Last Glacial Maximum (LGM) into the Holocene, the Late Glacial period saw some major climatic fluctuations. The most striking one occurred between 11,900 and 9750 BC:

301
100
30km
+10 0
-10
-20
-30depth in m - asl
Maa
svla
kte
river
dun
eR
otte
rdam
-Y
angt
ze H
arbo
ur
coastal dunes
river
dun
eR
otte
rdam
-B
ever
waa
rdTr
amre
mis
e
river
dun
eH
ardi
nxve
ld-
Pol
derw
eg
0 -10
+10
Rot
terd
amci
ty-c
entr
eN
ethe
rland
s | G
erm
any
wes
tea
st
Nor
th S
ea
young marine sands
outle
t cha
nnel
s
7000
BC
6500
BC
7500
BC
valle
y flo
or b
etwe
en
9000
BC
and
the
star
t
of d
elta
form
atio
n
terra
ce s
urfa
ce, f
orm
ed
circa
12,
000
year
s ag
o fluvia
l sed
imen
ts d
epos
ited
betw
een
24,0
00 y
ears
ago
and
the
star
t of d
elta
form
atio
n
olde
r Ple
istoc
ene
fluvia
l sed
imen
ts
faults
Peelho
rst
valle
y flo
or b
etwe
en
9000
BC
and
the
star
t
of d
elta
form
atio
n
terra
ce s
urfa
ce, f
orm
ed
circa
15,
000
year
s ag
o
fluvi
al c
lay
beach barrier expansion
since 4000 BC
brac
kish
brac
kish
peat
1000
BC
fresh
wat
er
trans
gres
sive
con
tact
650
0 BC
fluvi
al c
lay
and
peat
fresh
wat
er
fluvia
l cla
y an
d pe
at
6000
BC
5000
BC
4000
yea
rs B
CD
ELT
AD
ELT
A
VALL
EY
VALL
EY
‘ant
ropo
cene
’, en
larg
ed, y
oung
est H
oloc
ene
delta
Late
Hol
ocen
e de
lta
Mid
dle
Holo
cene
del
taLa
te H
oloc
ene
lago
on
Mid
dle
Hol
ocen
e es
tuar
y
Early
Hol
ocen
e
delta
peat
exc
avat
ion
and
pold
er re
clam
atio
ns o
f the
pas
t 100
0 ye
ars
clay
500
100k
m
Meu
se
Rhi
ne
Ger
man
y
Am
ster
dam
Rot
terd
am
0
50 k
m
500
100k
m
Maa
s
Rijn
Dui
tsla
nd
Am
ster
dam
Rot
terd
am
0
50 k
mFi
g. 7
.5. S
chem
atic
sec
tion
show
ing
the
anat
omy
of th
e R
hine
-Meu
se d
elta
, with
tim
e lin
es in
dica
ting
wat
er-ta
ble
rise
and
drow
ning
.

302
Tabl
e 7.
3. D
ates
of s
ites
and
stra
y fin
ds.
=
Trac
es o
f hab
itatio
nX
=
Trac
es o
f hab
itatio
n w
ith g
rave
s2
= N
umbe
r of d
ated
stra
y fin
ds*
=
From
var
ious
loca
tions
in th
e N
orth
Sea
and
bea
ches
of t
he w
este
rn N
ethe
rland
s
Age
in c
alen
dar y
ears
BC
11,000
10,000
9600
9200
8800
8400
8000
7600
7200
6800
6400
6000
5600
5200
4800
4400
4000
3600
3200
2800
Site
Rot
terd
am-Y
angt
ze H
arbo
ur R
otte
rdam
-Bev
erw
aard
Tra
mre
mis
eX
X R
otte
rdam
-Em
plac
emen
t CS
Rot
terd
am-IJ
ssel
mon
de R
otte
rdam
-’t H
art
Har
dinx
veld
-Pol
derw
egX
X H
ardi
nxve
ld-D
e B
ruin
XX
Rot
terd
am-G
roen
enha
gen
Stra
y fin
ds H
uman
ske
leta
l rem
ains
*1
13
11
21
Arte
fact
s: P
oint
s fro
m M
aasv
lakt
e 1
11
1 A
rtefa
ct: W
illem
stad
figu
rine
1

303
the Late or Younger Dryas, a temporary cooling of the climate in especially Greenland, the northern Atlantic Ocean, and Europe. The then active riverbeds in part broadened again and returned to a semi-braided pattern. Also the vegetation in the Netherlands reverted from a Boreal pioneer woodland (Allerød) to a tundra-like landscape. Also, and especially along the widening sandy riverbeds, the displacement of sand by the wind strongly increased. From the periodically dried-out floodplain and the larger stream valleys, the wind threw up river dunes along the river courses and terrace slopes. At a greater distance from riverbeds and stream valleys, fresh sand-drifting occurred among the sparse vegetation, and a final generation of parabolic dunes formed in the coversand regions. Along the great rivers, river dunes would continue to form in the Preboreal and locally even into the Boreal (Maasvlakte: the present report; Schiedam and Rotterdam: Pons and Bennema 1958; Rotterdam Blijdorp: Cohen and Hijma 2008; Hijma et al. 2009; Alblasserwaard (Hazendonk): van der Woude 1983).
The Yangtze Harbour research has shown that it was a long while before any direct marine influence became noticeable. In the course of the Preboreal and indeed most of the Boreal, there continued to be a freshwater, fluvial environment around this westerly dune. At the beginning of the Preboreal the coast still lay far off in the present North Sea, and the sea level was some 50m below where it is today. The Rhine drained towards the southwest with the Meuse, Scheldt, and Thames as tributaries, and emptied into the sea at the Strait of Dover. The confluence of the Rhine and Thames is envisaged as some 150km downstream from the Maasvlakte (Bridgland and d’Olier 1995), off the coast of Flanders. North of the Rhine valley lay an extensive coversand region drained by the rivers Overijsselse Vecht and Eem. Here and there in the dry North Sea plain were some elevated areas as well, such as the current Dogger Bank. At the beginning of the Holocene, the North Sea coast lay over 300km to the north. Reconstructions (Jelgersma 1979; Coles 1998) put the coast north of the Dogger Bank (the current 60m-depth contour), running from northern England to the northern tip of Denmark. A watershed would have run between the isle of Texel and the Dogger Bank. The river Elbe formed the most important drainage system east of this watershed (Figge 1980; Fig. 7.6), while the lower courses of rivers like the Weser, Ems, and Hunze (northeastern Netherlands) traversed the area in a northerly direction. The English rivers drained into the western catchment area.
In the Early Mesolithic, the Rotterdam area still occupied an inland position in the Rhine-Meuse valley. In the Preboreal it periodically experienced brief (some weeks, varying from year to year) inundations of the floodplain. For most of the year, however, the water table lay below the surface, allowing soil formation and sand drifting to occur. With the development to a more deltaic situation in the Boreal, flooding occurred with greater regularity and frequency. Groundwater would appear at or a little above the surface for larger parts of the year, and over the width of the river valley more differentiated wetland environments developed. Only the valley margins and the river-dune areas within in the valley remained as elevated parts unaffected by inundation along the river. This continued to be the situation into the Early Atlantic.
It was not until halfway through the Early Atlantic that the sea level had risen to such an extent that an estuary formed in this area. Such an environment had earlier occurred in the Boreal, be it dozens of kilometres downstream. In the estuary, the inundation regime was determined mainly by the sea level and tidal fluctuations, and occasionally by high river discharge or storm surges. In the estuarine area a freshwater tidal environment prevailed. By the time of the younger radiocarbon-dated settlement phases in the Yangtze Harbour, such an environment must have existed a few kilometres downstream from the site. Between 6500 and 6300 BC the site itself briefly lay in the freshwater zone of the estuary (Chapter 3). Towards the end of the Early Atlantic the freshwater estuary zone had moved upstream of the site, and the Maasvlakte area had become part of a brackish to marine environment. In the Middle/Late Atlantic, the presence of salt-tolerant vegetation such as glasswort and saltmarsh rush at the site of Rotterdam-Emplacement Centraal Station points to marine influence (Brinkkemper in: Guiran and Brinkkemper 2007). The area between the Maasvlakte and Rotterdam Centrum in this period would have been a brackish estuary (Hijma and Cohen 2011). The site in the Yangtze Harbour by then had already been submerged for centuries.

304
circa 7000 years BC
Today's coastline
Afb. 7.6. De holocene inundatie van de Noordzee. De kustlijnen en de veronderstelde positie van een door zeegaten onderbroken strandwallengordel
(stippellijnen) is voor drie tijdstippen gereconstrueerd (naar Beets en Van der Spek 2000, in: De Mulder, Geluk, Ritsema, Westerhof en Wong 2003).
Fig. 7.6. The Holocene flooding of the North Sea. Deeper parts (darker shade of blue) drowned between 8000 and 7000 BC. The presumed coastline position at 7000 BC and a beach-barrier alignment breached by tidal inlets are indicated, the latter by a dotted line. Rotterdam-Yangtze Harbour is marked with the red dot.
circa 7000 years BCToday's coastline
Afb. 7.6. De holocene inundatie van de Noordzee. De kustlijnen en de veronderstelde positie van een door zeegaten onderbroken strandwallengordel (stippellijnen) is voor drie tijdstippen gereconstrueerd (naar Beets en Van der Spek 2000, in: De Mulder, Geluk, Ritsema, Westerhof en Wong 2003).
An important supra-regional aspect of the submersion is the fact that a connection was made between the northern (from Scotland-Scandinavia) and southern (from the Strait of Dover) sea basins, as a result of which the current tidal regime established itself. Between 6500 and 5500 BC, this was accompanied by a considerable increase of the tidal range (Fig. 7.7). Initially, the tidal range was slightly tempered by a rise of the mean sea level resulting from the establishment of an amphidromic point in the Southern Bight, around which the tidal surge has rotated ever since (van der Molen and de Swart 2001; Hijma and Cohen 2010).11 The configuration between 8000 and 7000 BC with a narrow Strait of Dover and a relatively broad, shallow bay in the southern North Sea suggests that the tides at the mouth of the Rhine at the time were strongly subdued (see also Uehara, Scourse, Horsburgh, Lambeck, and Purcell 2006).12
For the Rhine-Meuse estuary, the sea-level rise meant that the water-table regime from about 6550 BC was directly influenced by the sea. Because of its westward position, the Yangtze Harbour dune had earlier experienced ‘wet feet’ (Chapter 3; Fig. 7.5). Regionally, peat formation could occur from as early as 7250 BC in lower, frequently flooded spots along the river courses, as well as in depressions in river-dune areas and along the feet of dunes in the margins of floodplains. Previously, floods had mostly deposited clay, while in the remainder of the year soil formation could take place and peat growth was limited to local pools and residual channels.
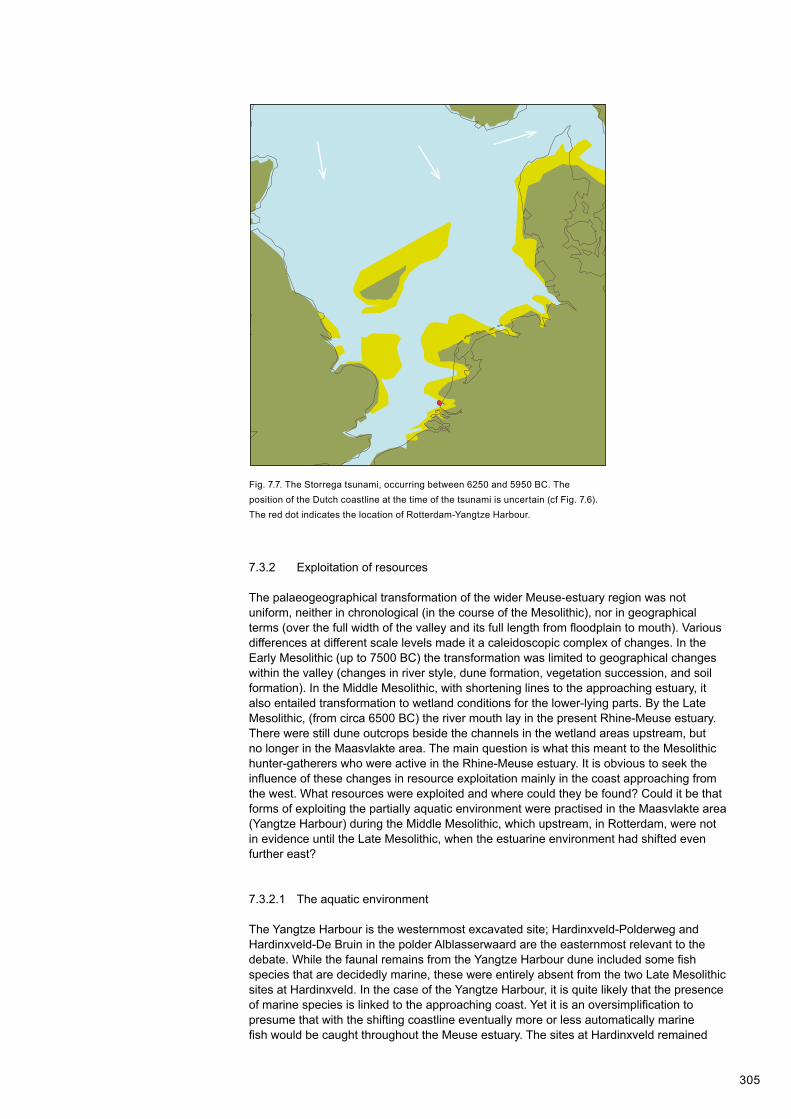
305
Afb. 7.7. Storegga tsunami van tussen 8300 en 8000 jaar geleden/6250 voor Chr.
b. Onzekere kustlijnposities Nederland ten tijde van de tsunami. De witte lijnen
illustreren hoe het tsunami gol�ront de Noordzee binnenliep - de dikste lijnen
zijn de vermoedelijke brekerzones (naar Cohen en Hijma 2008).
Fig. 7.7. The Storrega tsunami, occurring between 6250 and 5950 BC. The position of the Dutch coastline at the time of the tsunami is uncertain (cf Fig. 7.6). The red dot indicates the location of Rotterdam-Yangtze Harbour.
7.3.2 Exploitation of resources
The palaeogeographical transformation of the wider Meuse-estuary region was not uniform, neither in chronological (in the course of the Mesolithic), nor in geographical terms (over the full width of the valley and its full length from floodplain to mouth). Various differences at different scale levels made it a caleidoscopic complex of changes. In the Early Mesolithic (up to 7500 BC) the transformation was limited to geographical changes within the valley (changes in river style, dune formation, vegetation succession, and soil formation). In the Middle Mesolithic, with shortening lines to the approaching estuary, it also entailed transformation to wetland conditions for the lower-lying parts. By the Late Mesolithic, (from circa 6500 BC) the river mouth lay in the present Rhine-Meuse estuary. There were still dune outcrops beside the channels in the wetland areas upstream, but no longer in the Maasvlakte area. The main question is what this meant to the Mesolithic hunter-gatherers who were active in the Rhine-Meuse estuary. It is obvious to seek the influence of these changes in resource exploitation mainly in the coast approaching from the west. What resources were exploited and where could they be found? Could it be that forms of exploiting the partially aquatic environment were practised in the Maasvlakte area (Yangtze Harbour) during the Middle Mesolithic, which upstream, in Rotterdam, were not in evidence until the Late Mesolithic, when the estuarine environment had shifted even further east?
7.3.2.1 The aquatic environment
The Yangtze Harbour is the westernmost excavated site; Hardinxveld-Polderweg and Hardinxveld-De Bruin in the polder Alblasserwaard are the easternmost relevant to the debate. While the faunal remains from the Yangtze Harbour dune included some fish species that are decidedly marine, these were entirely absent from the two Late Mesolithic sites at Hardinxveld. In the case of the Yangtze Harbour, it is quite likely that the presence of marine species is linked to the approaching coast. Yet it is an oversimplification to presume that with the shifting coastline eventually more or less automatically marine fish would be caught throughout the Meuse estuary. The sites at Hardinxveld remained

306
relatively far inland, in a fluvial environment without any evidence of marine influence, even long after the Yangtze Harbour was drowned by the sea. Other sites have yielded too few faunal remains to show what happened in the intervening region, which underlines how fragmentary the data base still is.
Judging by the currently known evidence, it appears that many resources were exploited in close proximity to the site. In the case of the Yangtze Harbour dune, it is clear that a rich variety of plant and animal resources were available on and near the dune complex. A comparable picture emerges for Hardinxveld-Polderweg and Hardinxveld-De Bruin. Also Rotterdam-Beverwaard Tramremise, Rotterdam-Groenenhage, and Rotterdam-Emplacement Centraal Station tie in with this, although for these sites considerably fewer data are available. At the same time, one should be cautious in considering the ‘potential availability’ and the actual provenance of a recovered/demonstrated resource. Resources may well have been potentially available, but in reality their availability may have strongly fluctuated in space and time. As was mentioned in Section 7.2.2.3, certain resources may have been brought in over considerable distances, even if in landscape reconstructions they might be deemed potentially available ‘locally’. This goes both for mammals and fishes. On the basis of ethnographic evidence relating to hunter-gatherers in Boreal landscapes in particular, it seems likely that smaller game and fur mammals, as well as birds, fishes and plant foods were sourced in the immediate surroundings.
Although the species marked as food resources in the recovered assemblages were available in the close vicinity, this does not necessarily imply either that these were exploited randomly and in the same way throughout the region. The well-preserved faunal remains from Hardinxveld-Polderweg and Hardinxveld-De Bruin show that pike was a specifically targeted fish species, probably in late winter and early spring, when these fish congregate in shallow floodwaters to spawn (Beerenhout 2001a, 264; idem 2001b, 323-324). Also it was clear that fishes from a range of biotopes were caught: the main channels of large rivers, the pools outside them with stagnant or slowly flowing water, and the seasonally inundated areas. This range of biotopes is fully represented also by the fish remains found on the Yangtze Harbour dune.
The exploitation of fishes from different biotopes implies different fishing methods. In active channels the use of fishing weirs – consisting of wattle panels with one or more gaps with funnels in them – is a very effective way of catching fish migrating upstream (Bulten, van der Heijden, and Hamburg 2009). It is a passive method, based on a knowledge of the seasonal migratory behaviour of fish species. Also tidal channels where certain marine fish species swim upstream with the tide, can be used in this manner; as the tide goes out, the fish will be trapped by the weir. Various Neolithic examples of such fishing systems are known from the Netherlands (Hoge Vaart-A27; Emmeloord-J97). Besides, traps and nets may have been used, both in running and stagnant water. Fish traps are known from various findspots in the Netherlands, including Hardinxveld-De Bruin (Louwe Kooijmans, Hänninen, and Vermeeren 2001b), Hoge Vaart-A27 (Hamburg, Kruijshaar, Nientker, Peeters, and Rast-Eicher 2001) and Emmeloord-J97 (Bulten et al. 2009). Fragments of knotted string that may represent parts of nets are known from Rotterdam-Emplacement Centraal Station (Guiran and Brinkkemper 2007) and Hardinxveld-Polderweg (Louwe Kooijmans, Vermeeren, and van Waveren 2001a).
Less clarity exists about the use of harpoons in fishery. As noted earlier, the Rhine-Meuse estuary stands out for the hundreds of points made of bone, at least part of which are interpreted as harpoon heads (Verhart 1988; idem 1995). Given the lack of evidence about the original context from which these artefacts derive, it is not certain that they all relate to fishery. Yet the research into the palaeogeographical evolution of the Yangtze Harbour has made it clear that the harpoon heads of Maasvlakte 1, judging by their (in most cases presumed) antiquity, were in fact ‘discarded’ in a freshwater estuarine landscape rather than a marine one. It is well possible that harpoons were used for spearing larger fishes, such as salmon, sea trout and sturgeon, once they had been trapped by a fish weir.

307
7.3.2.2 Plants aplenty
As shown in Sections 7.2.2.2 and 7.2.2.3, the study in the Yangtze Harbour yielded a surprising amount of evidence about the use of plant resources. It was established that the dune flank deposits contained quite a wide range of species which may have provided plant foods. The intensively visited sites at Hardinxveld a similar picture. Other Mesolithic (and Early Neolithic) sites in the Rhine-Meuse estuary have yielded less evidence, mainly because of less intensive research.
Besides hazelnut and acorn, water chestnut seems to be a standard feature. Charred remains of water chestnut are known from Yangtze Harbour, Rotterdam-Emplacement Centraal Station, Hardinxveld-Polderweg and Hardinxveld-De Bruin.13 Also, charred remains of starch-rich tubers of lesser celandine have been found at Yangtze Harbour and in the nearby river-dune site Hardinxveld-Polderweg (Bakels and van Beurden 2001). Seeds of yellow water-lily and berries of hawthorn and dogwood – whose charred remains have been identified at the above-mentioned sites – may also have been eaten.
As was mentioned in Section 7.2.3.2, oil may have been extracted from the seeds of dogwood. The systematic occurrence of dogwood seeds in the more sizeable botanical assemblages, not only in the Rhine-Meuse estuary but also elsewhere in the Netherlands and abroad (southern Sweden), may point to this. Notably, the charred specimens from the Yangtze Harbour are broken or crushed, which is a strong indication that the berries and/or seeds were processed.
From the currently available data it becomes increasingly clear that plant resources played a significant role in the life of the Mesolithic hunter-gatherers. The importance of plant resources and their exploitation was earlier emphasised by Zvelebil (1994). The insights from the Yangtze Harbour study and the data from elsewhere in the Rhine-Meuse estuary offer supporting arguments for this. The importance of plant resources is apparent not only from the recovered plant remains, but also from the use-wear traces identified on the flint and other stone artefacts. The use of blades for scraping and flattening siliceous plants was documented also at both Hardinxveld sites (van Gijn et al. 2001a; idem 2001b). The flints from Rotterdam-Beverwaard Tramremise and Rotterdam-Groenenhagen have not (yet) been examined for use wear, but it is likely that such processing took place at these sites too. According to van Gijn (2010) it was a recurrent activity, apparently linked to wetland hunter-gathering.
There are also signs of Mesolithic hunter-gatherers having actively interfered in the vegetation. Fire played an important part in this process. Along the Yangtze Harbour dune, indications were found of repeated burning of reed beds, in all probability to improve access to the sandy knoll, or conversely to improve access to the river. Although in a wetland setting this may appear less likely, there may be other reasons too for burning off patches of vegetation (Mellars 1976). Ethnographically it is known that hunter-gatherers – like those in North America and Australia – did so to create open country and improve the view, while attracting game to the rejuvenated vegetation. A more open vegetation may also boost the production of nuts and fruits in the spinneys.
In the Netherlands and other northwest European countries, there has been growing evidence of the deliberate burning of vegetation. For the Early and Middle Mesolithic in the Netherlands, the Yangtze Harbour, Zutphen-Ooijerhoek (Bos, van Geel, Groenewoudt, and Lauwerier 2005), Almere-Overgooi (Opbroek and Lohof 2011), Hanzelijn-Gebied VIII (de Moor et al. 2009), and Groningen-Meerstad (Woldring, Schepers, Mendelts, and Fens 2012) are important sites. A distinct parallel to the Yangtze Harbour is the English site of Star Carr (Yorkshire), where evidence of the intermittent burning-off of reeds has also been connected to keeping open water accessible and creating wider views (Mellars and Dark 1998). But even for the Late Glacial there are various indications of such practices, for instance at Milheeze in the Netherlands (Bos and Janssen 1996; Bos, Bohncke, and Janssen 2006), Rieme in Belgium (Bos, Verbruggen, Engels, and Crombé 2013), and the Lahn valley in Germany (Bos and Urz 2003). In particular it is the repeated occurrence of horizontally lying, charred reed remains like those encountered in the Yangtze Harbour and at Star Carr, that makes a natural explanation unlikely.
308
7.3.3 Social context and ideology
In all likelihood, rivers played an important role in the provision of information (Lovis and Donahue 2011). Information about the availability of all sorts of subsistence resources is of crucial importance to hunter-gatherer groups (Whallon 2011). But also, information about the activities of more or less related groups is essential for maintaining social contacts (Kelly 1995, 150-151). Choices about residing at site A or B in particular seasons are strongly affected by the available information.
In Section 7.2.4 it was proposed that the broad spectrum of activities and the great time depth of the Yangtze Harbour dune site might reflect repeated use of this site as a base camp.14 People will in the course of time have adjusted their activities to the changing landscape and biotopes. The river-dune complex was certainly suitable as a location for long-term use. Other extensive river-dune complexes near the Meuse estuary, where also the higher parts of the dune could be investigated (Rotterdam-Beverwaard Tramremise, Hardinxveld-Polderweg, and Hardinxveld-De Bruin), show evidence of various phenomena which for reasons of non-preservation and excavation method could not be studied in the Yangtze Harbour. At the two Hardinxveld sites, pits of varying sizes were uncovered, including a few large ones which were interpreted as sunken-floored huts (Hamburg and Louwe Kooijmans 2001; Louwe Kooijmans and Nokkert 2001). At Hardinxveld-De Bruin some small pits in the surrounding peat were found to contain ritual depositions from the Early Neolithic habitation phase (Louwe Kooijmans and Nokkert 2001). Besides, burials came to light at both Hardinxveld sites and at Rotterdam-Beverwaard Tramremise. At Hardinxveld-Polderweg the graves were inhumations of humans and dogs (Smits and Louwe Kooijmans 2001a) and at Hardinxveld-De Bruin, human inhumation graves (Smits and Louwe Kooijmans 2001b). Both sites also yielded isolated human remains which were recovered among the settlement debris. At the site of Rotterdam-Beverwaard Tramremise, cremation remains were recovered (Zijl et al. 2001).
Although at the sites in the Yangtze Harbour any evidence of built structures or burials is obviously lacking, such features are likely to have been present originally. Archaeological research into the early prehistoric occupation of the Rhine-Meuse estuary has consistently focused on the (higher) river-dune crests. Human – and canine – burials would then be no exception. In other areas too, for instance in Flevoland, river dunes and natural levees consistently yield graves, while isolated human remains are frequently found among the traces of settlements. Maybe this reflects a specific meaning of such sites in the landscape, maintaining historical relations between people and places, as nodes in time (time nodes; Peeters 2007). In a transforming landscape, close to a shifting coastline, such a function may be of a persistent nature and determine the structure of landscape use. Human skeletal remains from the Mesolithic that are on occasion picked up along the Dutch coast or fished up from the North Sea near the Brown Ridge, may derive from eroded graves or cemeteries.
In this connection it should be remembered that it is hard to get a grip on the spatial scale on which to consider the use of landscapes by Mesolithic (and Early Neolithic) hunter-gatherers, not only when it comes to the spots where people lived for shorter or longer periods, but also for the interconnections between these places. The ‘exotic’ provenance of certain raw materials, for instance, may reveal links to relatively distant areas. In Section 7.2.3.3 the presence of Wommersom quartzite on the Yangtze Harbour dune was already mentioned. Some artefacts of this material were identified also at both Hardinxveld sites, Rotterdam-Beverwaard Tramremise, Rotterdam-’t Hart, and at Hoge Vaart-A27 in Flevoland (van Gijn et al. 2001a; idem 2001b; Niekus in Zijl et al. 2011; Schiltmans 2010; Peeters et al. 2001; Amkreuz 2013). The material may have been acquired by the estuary dwellers themselves from outcrops in Belgium. These outcrops were accessible via the river Scheldt and its tributaries Dijle and Demer. It is quite possible that both the downstream Rhine-Meuse valley and the Scheldt catchment area were exploited by the same population group.
Lithic raw material gathered at various spots in that area became widely distributed. It cannot be ruled out that Wommersom quartzite ended up this far north from its source through contacts with other groups. Unfortunately, the distribution areas of other lithic raw materials are more difficult to establish. In contrast to the Wommersom quartzite – easily
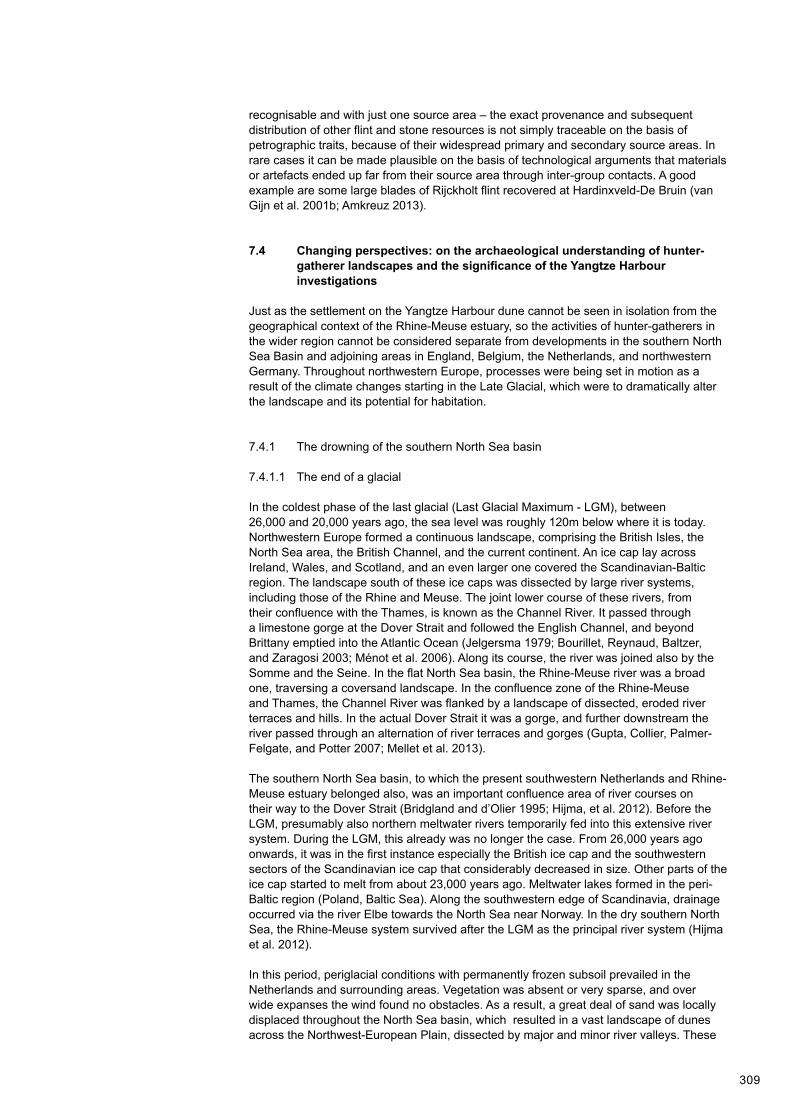
309
recognisable and with just one source area – the exact provenance and subsequent distribution of other flint and stone resources is not simply traceable on the basis of petrographic traits, because of their widespread primary and secondary source areas. In rare cases it can be made plausible on the basis of technological arguments that materials or artefacts ended up far from their source area through inter-group contacts. A good example are some large blades of Rijckholt flint recovered at Hardinxveld-De Bruin (van Gijn et al. 2001b; Amkreuz 2013).
7.4 Changing perspectives: on the archaeological understanding of hunter- gatherer landscapes and the significance of the Yangtze Harbour investigations
Just as the settlement on the Yangtze Harbour dune cannot be seen in isolation from the geographical context of the Rhine-Meuse estuary, so the activities of hunter-gatherers in the wider region cannot be considered separate from developments in the southern North Sea Basin and adjoining areas in England, Belgium, the Netherlands, and northwestern Germany. Throughout northwestern Europe, processes were being set in motion as a result of the climate changes starting in the Late Glacial, which were to dramatically alter the landscape and its potential for habitation.
7.4.1 The drowning of the southern North Sea basin
7.4.1.1 The end of a glacial
In the coldest phase of the last glacial (Last Glacial Maximum - LGM), between 26,000 and 20,000 years ago, the sea level was roughly 120m below where it is today. Northwestern Europe formed a continuous landscape, comprising the British Isles, the North Sea area, the British Channel, and the current continent. An ice cap lay across Ireland, Wales, and Scotland, and an even larger one covered the Scandinavian-Baltic region. The landscape south of these ice caps was dissected by large river systems, including those of the Rhine and Meuse. The joint lower course of these rivers, from their confluence with the Thames, is known as the Channel River. It passed through a limestone gorge at the Dover Strait and followed the English Channel, and beyond Brittany emptied into the Atlantic Ocean (Jelgersma 1979; Bourillet, Reynaud, Baltzer, and Zaragosi 2003; Ménot et al. 2006). Along its course, the river was joined also by the Somme and the Seine. In the flat North Sea basin, the Rhine-Meuse river was a broad one, traversing a coversand landscape. In the confluence zone of the Rhine-Meuse and Thames, the Channel River was flanked by a landscape of dissected, eroded river terraces and hills. In the actual Dover Strait it was a gorge, and further downstream the river passed through an alternation of river terraces and gorges (Gupta, Collier, Palmer-Felgate, and Potter 2007; Mellet et al. 2013).
The southern North Sea basin, to which the present southwestern Netherlands and Rhine-Meuse estuary belonged also, was an important confluence area of river courses on their way to the Dover Strait (Bridgland and d’Olier 1995; Hijma, et al. 2012). Before the LGM, presumably also northern meltwater rivers temporarily fed into this extensive river system. During the LGM, this already was no longer the case. From 26,000 years ago onwards, it was in the first instance especially the British ice cap and the southwestern sectors of the Scandinavian ice cap that considerably decreased in size. Other parts of the ice cap started to melt from about 23,000 years ago. Meltwater lakes formed in the peri-Baltic region (Poland, Baltic Sea). Along the southwestern edge of Scandinavia, drainage occurred via the river Elbe towards the North Sea near Norway. In the dry southern North Sea, the Rhine-Meuse system survived after the LGM as the principal river system (Hijma et al. 2012).
In this period, periglacial conditions with permanently frozen subsoil prevailed in the Netherlands and surrounding areas. Vegetation was absent or very sparse, and over wide expanses the wind found no obstacles. As a result, a great deal of sand was locally displaced throughout the North Sea basin, which resulted in a vast landscape of dunes across the Northwest-European Plain, dissected by major and minor river valleys. These
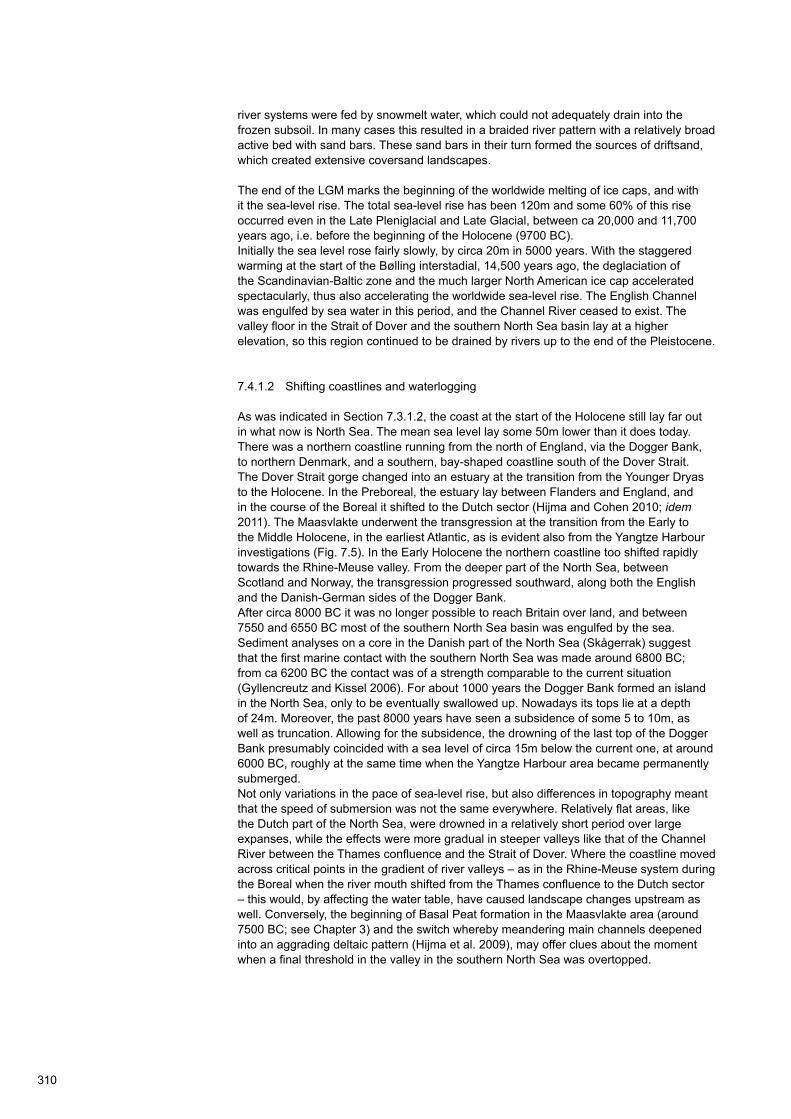
310
river systems were fed by snowmelt water, which could not adequately drain into the frozen subsoil. In many cases this resulted in a braided river pattern with a relatively broad active bed with sand bars. These sand bars in their turn formed the sources of driftsand, which created extensive coversand landscapes.
The end of the LGM marks the beginning of the worldwide melting of ice caps, and with it the sea-level rise. The total sea-level rise has been 120m and some 60% of this rise occurred even in the Late Pleniglacial and Late Glacial, between ca 20,000 and 11,700 years ago, i.e. before the beginning of the Holocene (9700 BC). Initially the sea level rose fairly slowly, by circa 20m in 5000 years. With the staggered warming at the start of the Bølling interstadial, 14,500 years ago, the deglaciation of the Scandinavian-Baltic zone and the much larger North American ice cap accelerated spectacularly, thus also accelerating the worldwide sea-level rise. The English Channel was engulfed by sea water in this period, and the Channel River ceased to exist. The valley floor in the Strait of Dover and the southern North Sea basin lay at a higher elevation, so this region continued to be drained by rivers up to the end of the Pleistocene.
7.4.1.2 Shifting coastlines and waterlogging
As was indicated in Section 7.3.1.2, the coast at the start of the Holocene still lay far out in what now is North Sea. The mean sea level lay some 50m lower than it does today. There was a northern coastline running from the north of England, via the Dogger Bank, to northern Denmark, and a southern, bay-shaped coastline south of the Dover Strait. The Dover Strait gorge changed into an estuary at the transition from the Younger Dryas to the Holocene. In the Preboreal, the estuary lay between Flanders and England, and in the course of the Boreal it shifted to the Dutch sector (Hijma and Cohen 2010; idem 2011). The Maasvlakte underwent the transgression at the transition from the Early to the Middle Holocene, in the earliest Atlantic, as is evident also from the Yangtze Harbour investigations (Fig. 7.5). In the Early Holocene the northern coastline too shifted rapidly towards the Rhine-Meuse valley. From the deeper part of the North Sea, between Scotland and Norway, the transgression progressed southward, along both the English and the Danish-German sides of the Dogger Bank. After circa 8000 BC it was no longer possible to reach Britain over land, and between 7550 and 6550 BC most of the southern North Sea basin was engulfed by the sea. Sediment analyses on a core in the Danish part of the North Sea (Skågerrak) suggest that the first marine contact with the southern North Sea was made around 6800 BC; from ca 6200 BC the contact was of a strength comparable to the current situation (Gyllencreutz and Kissel 2006). For about 1000 years the Dogger Bank formed an island in the North Sea, only to be eventually swallowed up. Nowadays its tops lie at a depth of 24m. Moreover, the past 8000 years have seen a subsidence of some 5 to 10m, as well as truncation. Allowing for the subsidence, the drowning of the last top of the Dogger Bank presumably coincided with a sea level of circa 15m below the current one, at around 6000 BC, roughly at the same time when the Yangtze Harbour area became permanently submerged. Not only variations in the pace of sea-level rise, but also differences in topography meant that the speed of submersion was not the same everywhere. Relatively flat areas, like the Dutch part of the North Sea, were drowned in a relatively short period over large expanses, while the effects were more gradual in steeper valleys like that of the Channel River between the Thames confluence and the Strait of Dover. Where the coastline moved across critical points in the gradient of river valleys – as in the Rhine-Meuse system during the Boreal when the river mouth shifted from the Thames confluence to the Dutch sector – this would, by affecting the water table, have caused landscape changes upstream as well. Conversely, the beginning of Basal Peat formation in the Maasvlakte area (around 7500 BC; see Chapter 3) and the switch whereby meandering main channels deepened into an aggrading deltaic pattern (Hijma et al. 2009), may offer clues about the moment when a final threshold in the valley in the southern North Sea was overtopped.

311
7.4.1.3 A tipping point around 6500 BC
The moment around 6500 BC manifests itself in several locations in the North Sea basin – and around all oceans throughout the world – as an important tipping point during the transgression. Between 8050 and 6450 BC, Hijma and Cohen (2010) state, the mean water table in the future Rhine-Meuse estuary rose from about 24 to 19.5m - asl (Fig. 7.5). From ca 7000 BC this water-table rise progressively accelerated. Around 6450 BC (± 44 years) the area was drowned, and within 200 years the sea level rose from 19.7m - asl to 15.6m - asl. This four-metre rise according to Hijma and Cohen comprised a structural background rise of circa 2m and a sea-level ‘jump’ of similar amplitude. The ‘jump’ is related to the Hudson Bay being freed of its ice cap, and the sudden wholesale drainage of the meltwater-filled Lake Agassiz-Ojibway in Canada. This released a gigantic volume of fresh water into the ocean, which resulted in a worldwide absolute sea-level rise (among others, Törnqvist and Hijma 2012; Cohen and Hijma 2013; see Fig. 3.21).
The drainage of Lake Agassiz-Ojibway is also linked to a brief climatic ‘blip’ in particularly the North-Atlantic part of the world, the so-called ‘8.2 ka event’.15 The influx of fresh water into the ocean slowed down the warm Gulf Stream and the northern hemisphere experienced a cooler phase. In the same time frame, a submarine landslide on the edge of the Norwegian continental shelf (the Storegga landslide) caused a tsunami. This tsunami certainly affected the coasts of Norway, Iceland, and Scotland, as well as those of the southern North Sea: the coasts of the Dogger uplands, eastern England and offshore parts of the Netherlands (Weninger et al. 2008). In contrast to the sea-level jump preceding the ‘8.2 ka event’, well-documented in the Maasvlakte area, neither the timing of the Storegga tsunami, nor the water depths and location of contemporary coastlines in the North Sea area are accurately known (Fig. 7.8). Below Rotterdam Centrum, around 13m - asl, there is sedimentary evidence of a region-wide marine flooding having occurred around 6000 BC; possibly this sedimentary marker may be linked to the Storegga tsunami rolling up the Rhine-Meuse estuary. Yet the erosive impact of this tsunami may have been limited in these parts, owing to the buffering capacity of the estuary and the Rhine delta which had by then formed (Cohen and Hijma 2008; Hijma 2009). Research into the antiquity of tsunami-related deposits in Norway and Scotland has dated the tsunami to between 6200 and 5950 BC (Weninger et al. 2008). The background of steady sedimentation in the Rhine-Meuse estuary and the limited erosive effect lend the Rotterdam dating of the tsunami to circa 6000 BC greater accuracy than do the spectacularly thicker deposits left under high-energetic conditions along the Norwegian and British coasts.
In considering the permanent sea-level jump and the possible one-off impact of a tsunami, it is remarkable that their timing should coincide with the chronological gap, mentioned in Section 7.3.1.1, which separated the submergence of the Early/Middle Mesolithic site in the Yangtze Harbour from the (Late) Mesolithic sites further inland. The absence of sites in the Rhine-Meuse estuary with hard evidence of human activity between circa 6400 and 6000 BC may, as suggested earlier, be an artefact of research intensity. But it is also imaginable that the gap is due to the effects of accelerated sea-level rise on Mesolithic habitation in the area, which may have suffered a brief interruption (discontinuity of habitation). At the same time, erosion along the banks of the broad, young estuary may have affected the preservation of many contemporary traces of habitation. Remains lying at or close to the surface would run a greater chance of being washed away than those which at deeper levels – on the flanks and at the feet of river dunes – had already been embedded in sediment. On the basis of current evidence, it is unclear what factors – research intensity, sedimentary conditions during occupation, preservation conditions immediately afterwards, habitation discontinuity – are responsible for the chronological hiatus, but it is a phenomenon that does require further investigation.
7.4.2 Mesolithic hunter-gatherers in a drowning landscape
The Mesolithic occupation of the southern North Sea basin, also known as ‘Doggerland’, has over the past fifteen years enjoyed a great deal of attention, mainly as a result of an article by Coles, published in 1998, in which he presented an overview of the changing palaeogeographical conditions and the then known archaeological evidence. The

312
significance of Coles’ article lies mainly in its emphatic statement that the former dry land in the current southern North Sea should not be regarded as a mere land bridge between England and the continent, but as part of a continuous landscape. From the perspective that coastal zones must have been particularly attractive to Mesolithic hunter-gatherers because of the wealth and relative stability and predictability of resources, Doggerland may even have constituted a core region (Fig. 7.9).
As much as a century ago, Reid (1913) formulated the first ideas relating to the North Sea as a formerly wooded and habitable region. Clark in 1936 also pointed out the potential importance of this submerged land, when he realised that settlement traces of the early Maglemosian culture, which in southern Scandinavia was known especially from the coasts, must largely have disappeared into the sea. Despite more evidence having since then become available about its palaeogeographical features (Gaffney, Thomson, and Fitch 2007), it must be admitted that the archaeological significance of Doggerland is still highly speculative. However, the growing number of finds (Glimmerveen et al. 2004; van Kolfschoten and van Essen 2004; Verhart 2004) does suggest that the expectation of archaeological ‘wealth’ – at any rate in the region where Doggerland bordered on the Rhine-Meuse-Thames valley – is not wholly unfounded.
In relation to the drowning of the southern North Sea region, the geographical position of the Yangtze Harbour dune is exemplary. The dune in the Preboreal is contemporary with the Dogger uplands16 becoming an island in the North Sea and the context in which the dune was inhabited changed from a terrestrial landscape into an estuarine one until the dune was entirely submerged by the transgression which also engulfed the Dogger uplands. Yet there is an important difference between the situation of the Dogger uplands and that of the Rhine-Meuse estuary: the island had no hinterland, while the estuary did. This implies that human exploitation of the changing landscape in the estuary must be placed in a different context from that of the drowning Dogger uplands.
Even though in several respects the resolution of the data is less than optimal for adequately answering all the questions, it should be stated that a ‘window’ like the Yangtze Harbour presents a unique contribution to our understanding of a distant past: the Early and Middle Mesolithic of the drowning North Sea. Importantly, our knowledge of Mesolithic hunter-gatherers is almost entirely based on sites located in today’s dry or reclaimed land, and rarely in what then were lush lowland areas in the vicinity of the sea. Clark (1936) argued that the North Sea area played a large role in the technological and typological correspondences between artefacts from England and southern Scandinavia. His ideas were supported by palaeo-ecological evidence derived from scattered lumps of peat retrieved from the sea. Moreover, one chunk of peat from the ‘Leman and Ower Banks’, off the Norfolk coast, was found to contain a bone harpoon head. Some 35 years later, Louwe Kooijmans (1971) published a series of Mesolithic artefacts from the Europoort area and from the Brown Ridge. Over the past ten years, more new finds have been published (Glimmerveen et al. 2004; van Kolfschoten and van Essen 2004; Verhart 2004) and further theoretical arguments have been put forward for attaching greater value to drowned, prehistoric landscapes, and to coastal regions in particular (Bailey 2004; Flemming 2004).
Around the millennium, research in the southern Scandinavian coastal zone strongly influenced ideas about how prehistoric hunter-gatherers made use of coastal zones and how the exploitation of aquatic resources would have contributed to the development of sedentism, territoriality and social differentiation (Fischer 1995; idem 2004; Waddington 2007). But the question, of course, is to what extent that region can serve as a model for what went on elsewhere along the northwest-European coasts. There may well have been greater regional differentiation than was initially presumed (cf. Louwe Kooijmans 2001a).
Essential to our understanding is the spatial scale on which hunter-gatherers made use of the landscape and the role of information (Whallon 2011). Ethnographic evidence may be instructive in this respect.17 For instance, Lovis and Donahue (2011) show the kind of geographical knowledge about river courses and lakes that is current among hunter-gatherer groups in southeastern Labrador. Although geometrically distorted, the maps drawn by native Americans display huge detailing of river systems and lakes across vast areas, equivalent in size up to the Netherlands, Flanders, and southeast England, the southern North Sea and the Dover Strait combined (Fig. 7.10).18 A crucial role in
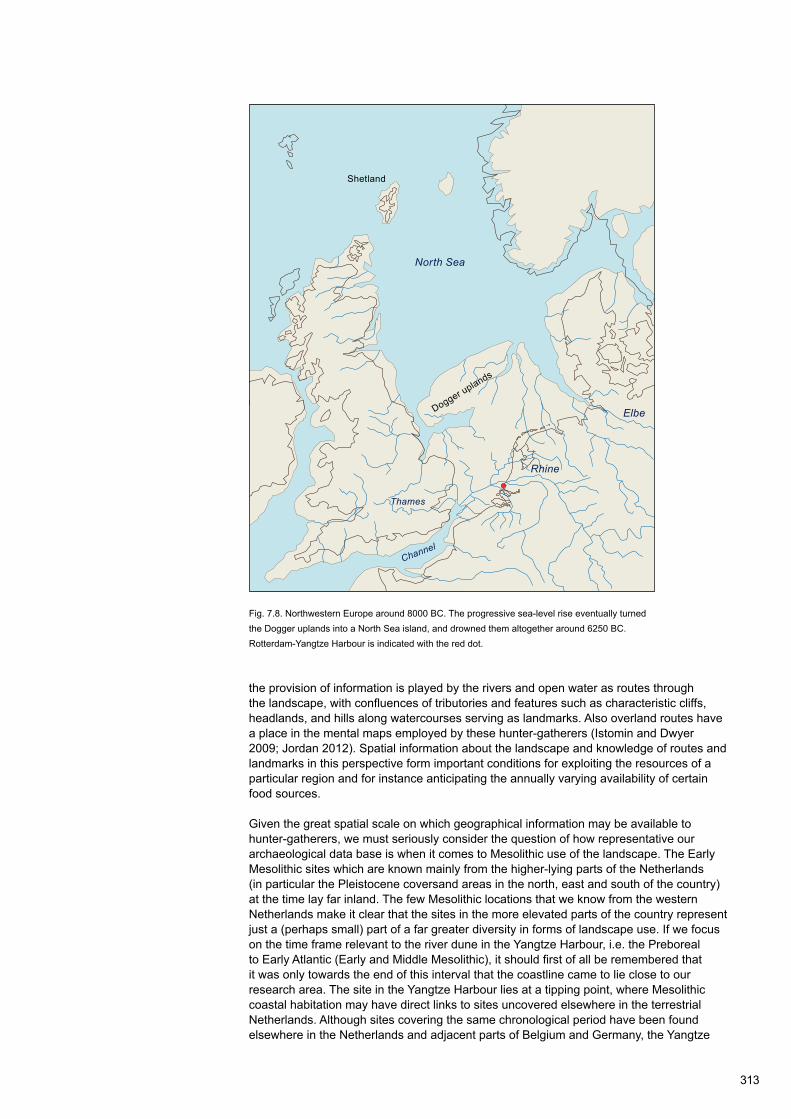
313
Rhine
Elbe
Channel
Thames
North Sea
Shetland
Dogger uplands
Fig. 7.8. Northwestern Europe around 8000 BC. The progressive sea-level rise eventually turned the Dogger uplands into a North Sea island, and drowned them altogether around 6250 BC. Rotterdam-Yangtze Harbour is indicated with the red dot.
the provision of information is played by the rivers and open water as routes through the landscape, with confluences of tributories and features such as characteristic cliffs, headlands, and hills along watercourses serving as landmarks. Also overland routes have a place in the mental maps employed by these hunter-gatherers (Istomin and Dwyer 2009; Jordan 2012). Spatial information about the landscape and knowledge of routes and landmarks in this perspective form important conditions for exploiting the resources of a particular region and for instance anticipating the annually varying availability of certain food sources.
Given the great spatial scale on which geographical information may be available to hunter-gatherers, we must seriously consider the question of how representative our archaeological data base is when it comes to Mesolithic use of the landscape. The Early Mesolithic sites which are known mainly from the higher-lying parts of the Netherlands (in particular the Pleistocene coversand areas in the north, east and south of the country) at the time lay far inland. The few Mesolithic locations that we know from the western Netherlands make it clear that the sites in the more elevated parts of the country represent just a (perhaps small) part of a far greater diversity in forms of landscape use. If we focus on the time frame relevant to the river dune in the Yangtze Harbour, i.e. the Preboreal to Early Atlantic (Early and Middle Mesolithic), it should first of all be remembered that it was only towards the end of this interval that the coastline came to lie close to our research area. The site in the Yangtze Harbour lies at a tipping point, where Mesolithic coastal habitation may have direct links to sites uncovered elsewhere in the terrestrial Netherlands. Although sites covering the same chronological period have been found elsewhere in the Netherlands and adjacent parts of Belgium and Germany, the Yangtze

314
Afb. 7.9. Kaart van Zuidoost-Labrador in Canada. Het weergegeven gebied is ongeveer zo groot als de Benelux, het aangrenzende deel van Duitsland, de zuidelijke Noordzee en Oost-Engeland teza-men (naar Lovis en Donahue 2011).a. Het systeem van rivieren en meren (getekend door Mathieu Medicabo).b. Een gecorrigeerd beeld (naar Leacock 1969, 7, map 1 en map 2).
a
b
Afb. 7.9. Kaart van Zuidoost-Labrador in Canada. Het weergegeven gebied is ongeveer zo groot als de Benelux, het aangrenzende deel van Duitsland, de zuidelijke Noordzee en Oost-Engeland teza-men (naar Lovis en Donahue 2011).a. Het systeem van rivieren en meren (getekend door Mathieu Medicabo).b. Een gecorrigeerd beeld (naar Leacock 1969, 7, map 1 en map 2).
a
bFig. 7.9. Maps of southeastern Labrador, Canada. The area shown is roughly the size of the Benelux, the adjacent part of Germany, the southern North Sea, and eastern England put together. a. The map drawn by Mathieu Medicabo shows a distorted image of the area, which on the other hand is very detailed in representing the coastline, river courses, and lakes.b. A conventional map with the cartographically correct representation of the area (after Leacock 1969, 7, Folders 1 and 2).
Scale 1:3,000,000
a
b
0 100 km

315
Fig. 7.10. Scatter diagram of uncalibrated radiocarbon dates and elevations above prehistoric sea level. In addition to Niekus 2006 (black dots, N = 393; plotted in relation to the sea-level rise curve of the northern Netherlands). With additional data from the Yangtze Harbour (the present report), Hardinxveld-Polderweg, and Hardinxveld-De Bruin (Out 2009), Willemstad (van Es and Casparie 1968; van de Plassche 1982; Amkreuz 2013) and several Rotterdam sites (see Table 7.3, data from the site list attached to the ROaA, in preparation), plotted in relation to the sea-level rise curve of the Rhine-Meuse estuary (Hijma and Cohen 2010).
90
80
70
60
50
40
30
20
10
0
Ele
vatio
n in
met
res
abov
e pr
ehis
toric
sea
leve
l
14C years BP 9600 8860
7000
7600
6000
6600
5000
5600
8000
Rotterdam-Yangtze HarbourRotterdam-Beverwaard TramremiseRotterdam-IJsselmondeRotterdam-‘t HartRotterdam-Emplacement Centraal StationWillemstad figurine Hardinxveld-De Bruin phase 1Hardinxveld-De Bruin phase 2Hardinxveld-Polderweg
Hearth/fire pitBone/charcoal from graveCharcoal from pitCharcoal from occupation layerCarbonised hazelnut shellOther botanical materialBone, wood, antlerWillemstad figurine
calendar years BC
Harbour site at present is the only one where the drowning process can be closely followed in relation to this early phase of the Mesolithic (cf. Niekus 2006; Figs 7.5 and 7.11).
One aspect that once again emerged from the research into the dune occupation in the Yangtze Harbour is that the formation of river dunes continued into the Early Holocene. Preboreal habitation on river dunes is well documented in various parts of the country, for instance in the current IJssel valley in the eastern Netherlands (Groenewoudt et al. 2001). It is remarkable that in other periods, where river dunes are present, as at Swifterbant (in the polder Oostelijk Flevoland), evidence of Early Mesolithic activity on river dunes is lacking, whereas it does appear in coversand areas in the same region (Peeters 2007). Conversely, there is intensive activity on the river dunes at Swifterbant, mainly in the Late Mesolithic and Early Neolithic, while at this time hardly any is documented

316
on the river dunes and coversand ridges in the eastern Netherlands. Such shifts within and among regions may be connected to the dynamics of the landscape at different scale levels (Peeters 2007; idem 2009a). As regards the Early Mesolithic, it is possible that the formation process of river dunes was decisive for the presence or absence of human activity. In areas where river dunes stabilised more readily under the influence of waterlogging and vegetation growth, human activity may have manifested itself sooner than in dune areas that formed over a longer period. The question therefore is whether prehistoric hunter-gatherers were keen to occupy any river dune as soon as it was consolidated by vegetation, or only those dunes with a favourable location for other reasons as well. For a better insight into such potential links, we need to chart the age of individual river dunes in different regions. The research in the Yangtze Harbour is of obvious importance in this respect too.
Sites like those in the Rhine-Meuse estuary of course do not stand alone. They are part of a pattern which reflects the use of the landscape in a broader context. Given the archaeozoological and archaeobotanical evidence from the Yangtze Harbour, different landscape zones were exploited: the freshwater fluvial plain and the drier elevations enclosed by or adjacent to this, the brackish tidal zone and the marine environment. It is unclear to what extent the various plant and animal (food) resources were exploited in the immediate proximity of the dune, or were imported to the site from elsewhere. But it is evident that the Yangtze Harbour and other Mesolithic river-dune sites in the western Netherlands should be considered as part of a network of places and zones in the landscape, that were linked together through routes (Amkreuz 2013).
The occurrence of non-anadromous marine fishes indicates that these hunter-gatherers must have travelled across open water to the sea over a distance of 10 to 20km. It should be remembered that the distances over which hunter-gatherers move in watery landscapes can be considerable. Remains of canoes are found relatively often in Mesolithic contexts where wood has been preserved, indicating that they were a regular means of transport. The major systems of the Rhine, Meuse, and Scheldt may in the Preboreal and Boreal have been important lines of communication. With their numerous tributaries and streams they form a network – a dendritic ‘nerve system’ – crisscrossing this hunter-gatherer landscape. The scattered occurrence of Wommersom quartzite, for instance, is an indication of the geographical scope of Mesolithic contacts and transport movements within this network.
While the river and stream systems would have been of great significance as routes in the terrestrial parts of hunter-gatherer landscapes, coasts too must have played an important part. On the one hand as waterways connecting coastal locations and separate river systems/estuaries, on the other, as part of a differentiated landscape offering extra opportunities for resource exploitation. However, relatively little is known about the use of coastal zones by Mesolithic hunter-gatherers. Most of the research has been done in the southern Scandinavian region, where the generally shallow waters with good visibility offer favourable opportunities for systematic underwater research (Pedersen, Fisher, and Aaby 1997; Harff and Lüth 2007). Also some research has been performed along the British coast, e.g. around the Severn estuary (Bell 2007), in the Solent (Momber, Tomalin, Scaife, Satchell, and Gillespie 2011), and the estuary of the Howick Burn, Northumberland (Waddington 2007). Yet in terms of geological and geographical development, these regions are not comparable to the lowlands of the North Sea basin. The southern Scandinavian region lies at the pivotal point of isostatic sinking and uplift, which means that here the influence of the global sea-level rise has affected the geographical dynamics quite differently. Besides, the steep coast of the British Isles gave rise to different coastal developments on the western shore of the North Sea than on the eastern. From the perspective of regionally differing geological processes and palaeogeographical conditions, the low-lying North Sea basin in the course of the Late Glacial and Early Holocene transgression underwent a continuously changing structure in terms of shifting coastlines, the position and nature of estuaries, and the presence of lakes. As a consequence, the opportunities offered by coasts, rivers and lakes for waterborne transport also changed. Especially in those areas where the drowning at times progressed very rapidly, as in the Dutch part of the continental shelf, these changes are likely to have fundamentally affected the ‘infrastructure’ of the hunter-gatherers’ landscape.

317
7.4.3 Conclusion
Questions relating to the representativity of the current archaeological data base, both from a national and from an international perspective, can be answered only when more insight is gained into what went on in these ‘black box’ areas. How representative is the current ‘terrestrial’ archaeological archive of the ways in which Mesolithic hunter-gatherers exploited the landscape? What correspondences or differences may there be between developments in the North Sea basin and the southern Scandinavian region?
Improving our insight into these matters is important in order to eventually identify any behavioural changes instigated by the dynamic landscape. Did the development towards a more sedentary way of life occur through an increased focus on the exploitation of stable, predictable, marine resources, as the ‘Scandinavian model’ suggests? Did, as a result of the shrinking habitable area, population densities everywhere increase, with stronger territoriality and social differentiation as a result? To what extent is there a causal link to the technological changes – a Middle Mesolithic versus a Late Mesolithic technology – which seem to have taken hold after the southern North Sea filled up?
To achieve a more nuanced picture of what effect the drowning southern North Sea basin would have had on the hunting-gathering landscape, it is necessary for investigations into the submerged areas to be continued. So far, the research in the Yangtze Harbour has been exceptional. The study, in many ways a pioneering one, has shown that a well thought-out, phased research strategy, even in challenging conditions, may produce very valuable results.

318
Notes
1. Rijksuniversiteit Groningen, Groninger Instituut voor Archeologie, Poststraat 6, 9712 ER Groningen. E-mail: j.h.m. peeters @rug.nl. 2. No systematic distinction will be made between Target zones West and East. Excavation took place in Target zone West only. 3. In particular, unburnt scales of freshwater perch and jawbone fragments of pike frequently turn up in Holocene deposits in the western Netherlands, both at archaeological sites and in natural contexts. In many cases we may presume that the specimens died a natural death. 4. Yet it should be taken into account that this contrast may wholly or in part result from fragmentation.5. See, for example, the documentary film Cree hunters of Mistassini by Richardson and Lanzelo, 1974 (http://www.nfb.ca/film/cree_hunters). 6. More widely scattered carbonised particles are likely to reflect burnt organic material that was locally dispersed by water and wind. 7. Jet beads were made in the Neolithic, as is evident from finds in coastal settlements at Ypenburg (van Gijn 2008) and Schipluiden (van Gijn 2006). From the Mesolithic so far no jet is known, which may, however, be due to conservation conditions (Chapter 4). In the Netherlands and immediate surroundings, the same goes for ornaments of shell. Elsewhere in western Europe, some Mesolithic sites have yielded shell pendants, such as the cemeteries of Hoëdic and Téviec off the coast of Brittanny (Péquart, Péquart, Boule, and Vallois 1937, Péquart and Péquart 1954).8. Such items are rarely found at archaeological sites. One example, however, is the find of a series of impressions of reed matting of the Early Neolithic from the site Almere-Hoge Vaart (Hamburg et al. 2001; Peeters 2007). 9. They were dated as follows: 9945 ± 115 BP (Ua-642), 6160 ± 135 BP (Ua-643), and 9690 ± 125 (Ua-644). The harpoon heads are usually made of antler or bone of red deer or aurochs. 10. It should be noted that the site Rotterdam-Emplacement Centraal Station was investigated only by means of mechanical corings, containing channel fill that yielded bits of vegetable fibre twisted into string, and in one case with fine knots: possibly remains of fishing nets. This makes the context a different one from the other investigated sites. 11. At an amphidromic point there is no tidal rising or falling of the sea’s surface. 12. No detailed calculations of the tides in the southern North Sea for the period before the connection are available. 13. Although the charred and uncharred macro-remains from Rotterdam-Emplacement Centraal Station derive from a channel, which means that there is a real chance of their being a natural accumulation, it was argued that this was consumption waste, given the presence of charred barbed spines from the water chestnut – these easily detach from fully ripened nuts – and the association of these remains with charcoal-rich sandy sediment (Brinkkemper in: Guiran and Brinkkemper 2007).14. Yet it should be kept in mind that the encountered remains mainly derive from a deposit of colluvial sediment at the foot of the dune. This is an accumulation of mixed waste from different use phases (see Section 7.2.1). 15. In the international literature the name of the ‘8.2 ka event’ refers to its calibrated date in thousands of years before present, i.e. 8200 years ago. Its climatic impact in the Greenland ice cap peaked at 6250 BC. 16. The Dogger Bank is also known as the Dogger Hills, in imitation of Coles (1998). This designation is avoided here, because ‘Hills’ is too suggestive of a hilly landscape, while in reality it is a large domed feature. 17. The use of ethnographic evidence in the archaeology of hunter-gatherers is often contested. In our opinion, data relating to historically documented and still living hunter-gatherer communities certainly have relevance to archaeological research, but must not be used as a window into the past. These peoples’ documented behaviour is not a simple parallel to prehistoric behaviour. 18. It should be noted that the maps discussed by Lovis and Donahue (2011) were drawn at the behest of ethnographers in the 20th century. The hunter-gatherers themselves do not use material maps.

319
List of captions
Illustrations
1. Introduction
Fig. 1.1. Location of the Yangtze Harbour planning area.Fig. 1.2. Impression of the Yangtze Harbour planning area during (geo) archaeological investigations.Fig. 1.3. The Yangtze Harbour planning area projected onto the ‘Topographic and Military Map of the Kingdom of the Netherlands’, Section Rotterdam 37, situation 1849/1850. In 1849/1850 the planning area was located at a distance of 2.5 to 5km to the coast between Oostvoorne and Hook of Holland.Fig. 1.4. Artist’s impression of the future Maasvlakte (view from the north-west). On the left is Yangtze harbour, the shipping lane connecting Maasvlakte 1 and Maasvlakte 2.Fig. 1.5. Map showing the location of the research areas at each stage. Both the desk-based assessment (Vos et al. 2009) and the exploratory field assessment (Vos et al. 2010a) encompassed the entire planning area (Stages 1 and 2), while the systematic field assessment was limited to the Target zones West and East (Stage 3). During the invasive underwater investigation three trenches were excavated in Target zone West (Stage 4).Fig. 1.6. Preliminary results of the systematic field assessment (Stage 3) in Target zone West. Shown here are the presence or absence of river-dune deposits and archaeological indicators in each core.Fig. 1.7. Preliminary results of the systematic field assessment (Stage 3) in Target zone East. During this stage of the investigation only one core revealed a very small quantity of charcoal dust upon inspection with the naked eye.
2. Methods and techniques
Fig. 2.1. Schematic overview of the phased approach used during (geo)archaeological investigations in the Yangtze Harbour planning area.Fig. 2.2. Seismic research using a so-called chirp system. a. The signalling device; b. Impression of seismic field research in progress.Fig. 2.3. Overview of the locations of cone penetration tests (CPT), corings, and of seismic- survey lines in and near Target zone West.Fig. 2.4. Overview of the locations of cone penetration tests (CPT), corings, and of seismic- survey lines in and near Target zone East.Fig. 2.5. The crane ship from which the cone penetration tests and coring were conducted.Fig. 2.6. 3D visualisation of the Yangtze Harbour planning area based on bathymetric images produced in 2011 as viewed from the east. The yellow-beige colour marks the harbour floor at a depth of 18 to 17m - asl.Fig. 2.7. The coring survey used a high-frequency hydraulic vibrocorer launched from a crane ship and sunk down to the harbour floor. Fig. 2.8. On board the crane ship, the obtained soil cores were cut into 1m segments.Fig. 2.9. At TNO Geological Survey of the Netherlands’ sediment registration laboratory in Utrecht, the coring tubes were cut open and the cores prepared for further analysis. Fig. 2.10. Impression of some of the sliced soil cores.Fig. 2.11. Situation of the three locations selected for invasive underwater investigation (Stage 4), relative to previous coring locations (Stage 3) in Target zone West, plotted onto the surveyed top of the Late Pleistocene and Early Holocene sands (fluviatile and river- dune deposits).Fig. 2.12. Impression of the invasive underwater investigation (Stage 4) in the Yangtze harbour, carried out on board the dredger Triton.Fig. 2.13. Detail of fieldwork in progress.Fig. 2.14. Location of the three trenches (including batches), projected on the bathymetric reading of the harbour floor at the completion of the invasive underwater investigation. The overlap between the batches, that was caused by the 2 x 5m footprint of the grab (open position) is clearly visible.
320
Fig. 2.15. The horizontal level-cut clamshell grab, with a 2 x 5m footprint in open position, that was used during the invasive underwater investigation. Fig. 2.16. Fieldwork could be followed ‘live’ on board the dredger Triton via computer. Shown here is the excavation of Trench 3 on November 9, 2011.Fig. 2.17. Soil samples were assessed on board a second pontoon moored alongside the Triton.Fig. 2.18. If river-dune deposits were encountered in a soil sample, it was dumped into a container on board the pontoon.Fig. 2.19. In total, 68 botanical samples of the ‘clean’ river-dune sand were taken manually.Fig. 2.20. A backhoe with a small hydraulic grab scooped the soil sample out of the container.Fig. 2.21. The backhoe divided the soil from the container over two bulk bags, A and B. Fig. 2.22. The Manitou, a crane with a long hydraulic jib, moved the bulk bags to the back of the pontoon moored alongside the Triton.Fig. 2.23. At the end of each working day the dredger Triton unloaded the bulk bags onto the quay. Fig. 2.24. The invasive underwater investigation resulted in a total of 316 bulk bags.Fig. 2.25. The contents of the bulk bags were sieved using two large ‘Lutter’ sieves with a mesh size of 10mm.Fig. 2.26. Detail of a soil sample on one of the ‘Lutter’ sieves. The lumps are some of the many peat fragments that were left on the mesh after sieving each batch.Fig. 2.27. A second, smaller sieve with a 2mm mesh size was placed at the rinse water outlet of the ‘Lutter’ sieve.Fig. 2.28. The 10mm and 2mm-sieve residues were dried on site in a specially equipped container.Fig. 2.29. Dried sieve residue being sorted at BOOR.Fig. 2.30. The inspection of the sieve residues resulted in a large number of archaeological indicators. To the right of the hand a large quantity of burnt bone.Fig. 2.31. Trench 1 projected on the bathymetric reading of the harbour floor on November 1st, 2011. Also pictured are all batches that were sampled up to the moment this reading was taken. Clearly visible is that the trench was not excavated horizontally and evenly because of the oblique position of the grab.Fig. 2.32. Trench 2 projected on the bathymetric reading of the harbour floor on November 7th, 2011. Also pictured are all batches that were sampled up to the moment this reading was taken. Presumably the grab rotated increasingly near the sides of the trench, because of the presence of the trench walls, and also budged towards the middle of the trench. This phenomenon also occurred in Trench 3.Fig. 2.33. A simplified model of Trench 2. Due to a lengthwise overlap between adjoining sections, the trenches were excavated deeper at the centre than along the edges. The numbers indicate the sequence of excavation.
3. Landscape genesis and palaeogeography
Fig. 3.1. 3D visualisation of the detailed map of the Early Holocene top of the river-dune sand and the base of the marine sand in Target zone West, with the locations of several cores.Fig. 3.2. Three cores from the Yangtze Harbour, illustrating the typical stratigraphical sequence (descriptions starting from below). a. Core B37A0713/O-13 in Target zone East, with a typical sequence of KR, KRWY, (EC) NIBA, EC (NAWO), and SBBL. b. Core B37A0676/W-07 in Target zone West, with a typical sequence of KR, KRWY-2, BXDE (with soil), NIBA, EC, and SBBL. c. Core B37A0693/W-24 in Target zone West, with a typical sequence of BXDE, NIBA, EC, NAWO, and SBBL.Fig. 3.3. Chronological scheme, showing archaeological periods and sedimentary units in the Yangtze Harbour planning area. The red bar marks the period of human presence at the river-dune complex (established by means of radiocarbon datings). Fig. 3.4. Available CPT records and corings in the Maasvlakte area.Fig. 3.5. Positions of the various recordings and of Target zones West and East in the Yangtze Harbour planning area. a. Codes of shot points on seismic survey lines. b. Codes of cone penetration tests. c. Codes of corings for mapping the planning area. d. Location of selected recordings used in the overview profile (Fig. 3.8).Fig. 3.6. Top of the Late Pleistocene and Early Holocene sand (KR and BXDE) relative to asl, with the position of Target zones West and East in the Yangtze Harbour planning area. a. Zones of erosion by marine channel activity in the Middle and Late Holocene.

321
b. Position of recordings selected for the overview profile (Fig. 3.8).Fig. 3.7. Seismic-survey profiles in the Yangtze Harbour planning area. The bathymetrically corrected ‘chirp’ reflection data are shown in monochrome; the coloured lines indicate the most important boundaries. In blue, erosive channel features (interpreted as SBBL and NAWO channels); in orange, the top of the river dunes (thick beds of BXDE, contact with NIBA and EC), and in yellow, the ‘Pleistocene’ subsurface (KR, thin beds of BXDE and KRWY). For the position of the profiles, see Figure 3.5. Fig. 3.8. Overview geological profile through the Yangtze Harbour planning area. For its position, see Figures 3.5 and 3.6.Fig. 3.9. Detailed map of Target zone East. Top of the Late Pleistocene and Early Holocene sand (KR and BXDE) relative to asl, with the positions of the seismic-survey lines, the cone penetration tests and corings, and the course of the detailed geological profile (Fig. 3.11).Fig. 3.10. Detailed seismic-survey profiles in Target zone East.Fig. 3.11. Detailed geological profile of Target zone East. For its position, see Figure 3.9. Fig. 3.12. Detailed map of Target zone West. Top of the Late Pleistocene and Early Holocene sand (KR and BXDE) relative to asl, with the positions of the seismic-survey track lines, cone penetration tests, and corings, and the course of detailed geological profiles 1 and 2 (Figs 3.14 and 3.15).Fig. 3.13. Detailed seismic-survey profiles in Target zone West.Fig. 3.14. Detailed geological profile 1 in Target zone West. For its position see Figure 3.12.Fig. 3.15. Detailed geological profile 2 in Target zone West. For its position see Figure 3.12.Fig. 3.16. Top of the Late Pleistocene and Early Holocene sand (KR and BXDE) relative to asl, with the location and research type per coring in the Yangtze Harbour planning area. Fig. 3.17. Top of the Late Pleistocene and Early Holocene sand (KR and BXDE) relative to asl, with the location and research type per core in Target Zone West.Fig. 3.18. Time-depth curves of the rising sea level and water table in the western Netherlands. After Hijma and Cohen (2010).Fig. 3.19. Palaeogeographical reconstructions of the Maasvlakte area. a. 8400 BC; b. 7150 BC; c. 6400 BC; d. 6000 BC; e. 4500 BC.Fig. 3.20. Palaeogeographical reconstruction of the Yangtze Harbour area. a. 8400 BC; b. 7250 BC; c. 7000 BC; d. 6400 BC; e. 6000 BCFig. 3.21. The accelerated drowning of the landscape in the second half of the 7th millennium BC. After 6500 BC the river dune was surrounded by subaquatic sedimentary environments only. Fig. 3.22. Schematic maps of landscape types in the Rhine-Meuse estuary in the Early Holocene. After Vos (2010).Fig. 3.23. Reference images of the Cumberland Marshes, Canada.Fig. 3.24. Palaeogeographical reconstructions of the landscape in Target zone West. a. 8400 BC; b. 7500 BC; c. 7000 BC; d. 6400 BC.
4. Flint and other stone
Fig. 4.1. Post-depositional and experimental marks on the flint. a. Traces of contact with a metal screen and with sand on the surface of Find number 316.12, formed during retrieval in the field. Original magnification 100x. b. Retouch with rounded back edge on Find number 23.1. Traces interpreted as resulting from working hide in both a longitudinal and a transverse direction. Original magnification 100x. c. Traces left by contact with soil on an experimentally fired arrowhead after it hit the ground. Original magnification 100x.Fig. 4.2. Find number 13.4. Scale 1:1.Fig. 4.3. Detailed images of Find number 13.4. a. Deeply permeated black patina in fracture; b. Micromineral (mica; polarised light); c. Brown and white patina; d. Dinoflagellate.Fig. 4.4. Find number 36.10. Scale 1:1.Fig. 4.5. Detailed images of Find number 36.10. a. Deeply permeated black patina in fracture; b. Porosity as a result of weathering; c. Foraminifer; d. Micromineral (mica; polarised light).Fig. 4.6. Find number 84.3. Scale 1:1Fig. 4.7. Detailed images of Find number 84.3. a. Outer surface with black patina overlaying brown patina; b. Deeply permeated black patina in fracture; c. Deeply permeated black patina in fractures; d. Micromineral (mica; polarised light).

322
Fig. 4.8. Find number 114.3. Scale 1:1.Fig. 4.9. Detailed images of Find number 114.3. a. Deeply permeated black patina; b. Dinoflagellate; c. Micromineral (mica; polarised light); d. Micromineral (mica) containing other microminerals (polarised light).Fig. 4.10. Find number 276.4. Scale 1:1.Fig. 4.11. Detailed images of Find number 276.4. a. Black patina in the edge zone of the flint; b. Black patina which extends to the flint’s core; c. and d. Bryozoa.Fig. 4.12. Find number 287.1. Scale 1:1.Fig. 4.13. Detailed images of Find number 287.1. a. Black patina in the edge zone of the flint; b. and c. Dinoflagellates; d. Mineral (mica).Fig. 4.14. Find number 287.2. a. Old surface with white cortex; b. Surface showing fractures (worked). Scale 1:1.Fig. 4.15. Detailed images of Find number 287.2. a. Clear edge zone of the flint showing no signs of weathering (no patina); b. One of twelve observed dinoflagellates.Fig. 4.16. Detailed image of Find number 84.3. Zones with different types of patina can be clearly distinguished; in sequence brown patina (bottom), black patina (middle), and white patina (top).Fig. 4.17. A blade fragment of Wommersom quartzite (280.5) and two artefacts of geode quartz (124.8 and 124.9). Legend to the flint/stone illustrations: cross = Point of percussion present; open circle = Point of percussion no longer present; irregular dots = Cortex; concentric rings = Frost fracture scar; thin arrows = Direction of burin spalls. Scale 1:1.Fig. 4.18. Find number 31.2. Scale 1:1.Fig. 4.19. Detailed images of Find number 31.2. a. Fine-grained microcrystalline limestone with microfossils; b. Scattered larger calcite crystals (polarised light).Fig. 4.20. ‘Debitage’ (or waste) from Trench 1: core preparation blade (67.1); cores (114.4, 36.12, and 48.14); core rejuvenation pieces (72.1 and 136.8); blades (23.1 and 24.10); flake (76.1). Legend to the flint/stone illustrations see Fig. 4.17 and legend use wear see page 200. Scale 1:1. Fig. 4.21. Tools from Trench 1: retouched pieces (13.3 and 98.1); obliquely blunted points or B-points (3.1, 65.1, and 54.1), segment (23.1); hybrid segment/triangle (123.7); scalene triangle (15.1); microburin (46.2); various burin types (151.1, 18.7, 133.1, and 124.9), and an artefact resembling a burin (118.1); scrapers (18.6, 132.2, 15.3, and 145.3); scraper/borer combination tool (84.4). Legend to the flint/stone illustrations see Fig. 4.17 and legend use wear see page 200. Scale 1:1. Fig. 4.22. ‘Debitage’ from Trench 2: core preparation blades (337.2 and 174.2); cores (194.6, 276.5, 242.6, and 298.3); core rejuvenation pieces (195.1, 243.4, 205.4, and 191.2); flakes (295.1, 268.1, 275.1, 266.1, 257.4, and 307.6); blades (207.1, 232.1, 316.1, and 301.1). Legend to the flint/stone illustrations see Fig. 4.17 and legend use wear see page 200. Scale 1:1.Fig. 4.23. Tools from Trench 2 and a burin from Trench 3 (Find number 352.1): retouched pieces (194.5, 197.1, 336.7, 206.1 and 315.1); obliquely blunted points (B-points: 182.1 and 199.4); single-edged points (A-points: 326.10 and 292.1); point with retouched base (C-point) (223.5); segment (211.1); hybrid segment/triangle (322.7); lanceolate point (330.4); hybrid lanceolate point/point with a retouched base (201.10); point, unknown type (277.1); microburins (313.5 and 175.3); scrapers (266.2, 330.1, 318.1, 265.1, 317.1, and 267.14); burins (305.1, 295.2, and 314.1); combination tool of a burin and a scraper (312.2). Legend to the flint/stone illustrations see Fig. 4.17 and legend use wear see page 200. Scale 1:1.Fig. 4.24. Traces formed by contact with vegetable material. a. Traces on Find number 314.1, interpreted as resulting from processing siliceous plant material with a scraping motion. Original magnification 200x. b. Traces on Find number 295.1, interpreted as resulting from cutting siliceous plant material. Original magnification 100x. c. Traces on Find number 191.2, interpreted as resulting from shaving reed. Original magnification 200x. d. Traces on Find number 268.6, interpreted as resulting from wood working. Original magnification 200x.Fig. 4.25. Traces formed by contact with material of animal origin. a. Traces on Find number 15.3, interpreted as resulting from scraping hide with a mineral addition on a hard surface. Original magnification 200x. b. Traces on Find number 133.3, interpreted as resulting from scraping hide on a soft surface. Original magnification 200x. c. Traces on Find number 76.1, interpreted as resulting from cutting hide with a mineral addition. Original magnification 200x. d. Traces on Find number 82.4, interpreted as resulting from processing fish. Original magnification 100x. The band of polish includes a round

323
area almost devoid of traces. e. Traces on Find number 277.4, interpreted as resulting from scraping fish, probably de-scaling. Original magnification 100x. The band of polish includes an area devoid of traces. f. Traces on Find number 314.1, interpreted as resulting from engraving fresh bone. Original magnification 200x. g. Traces on Find number 322.7, interpreted as resulting from butchering. Original magnification 200x. h. Traces on Find number 322.7, interpreted as resulting from butchering after which the object was retouched and re-used to scrape hide. Original magnification 200x.Fig. 4.26. Traces of mineral and unknown material. a. Traces on Find number 206.1, interpreted as resulting from cutting jet. Original magnification 100x. b. Traces on Find number 84.4, interpreted as resulting from roaming a hole in shell. Original magnification 100x. c. Traces on Find number 124.9, interpreted as resulting from scraping an inorganic, medium-hard material. Original magnification 100x. d. Traces on Find number 316.12, interpreted as so-called friction gloss, developed due to contact between haft and flint. Original magnification 100x.Fig. 4.27. Mass spectrum of a black substance observed on Find number 201.10, identified as fossil angiosperm lignin containing some polysaccharide.Fig. 4.28. Various flint artefacts from Trenches 1 and 2. a. Piece showing retouch (Trench 2); b. Segment (Trench 1); c. Scraper (Trench 2); d. Scraper (Trench 2). Scale 1:1.
5. Fauna
Fig. 5.1. Bone. a. Burnt; b. Unburnt.Fig. 5.2. Smew. Male (top) and female (bottom).Fig. 5.3. Water rail.Fig. 5.4. Spotted ray (male).Fig. 5.5. Grass snake.Fig. 5.6. Estimated and calculated total length of pike, based on identified remains from 2 and 10mm sieve residues.Fig. 5.7. Beaver.Fig. 5.8. Tools made of bone and antler. a. Tool fragment; b. Axe or chisel fragment of red deer antler; c. Possible bead of bird bone. d. Possible awl fragment. Scale a. and b. 1:1, diameter c. 6.7mm, length d. 12 mm.
6. Archaeobotany: landscape reconstruction and plant food subsistence economy on a meso and microscale
Fig. 6.1. Location of the cores mentioned in this chapter, B37A0673/W-04, B37W0675/W-06, and B37W0697/W-28, projected onto the surveyed former surface of the Late Pleistocene and Early Holocene sand (fluviatile and river-dune sediments) in Target zone West. Also shown are the locations of the other cores taken at Stage 3 and the excavated trenches of Stage 4.Fig. 6.2. Location of loose soil samples from Trenches 1 and 2 that were subjected to pollen analysis. Shown within each trench are the numbered sections and the locations of Cores B37A0673/W-04, B37W0675/W-06, and B37W0697/W-28. The plan is projected onto a map of the surveyed former surface of the Late Pleistocene and Early Holocene sand (fluviatile and river-dune deposits) in Target zone West.Fig. 6.3. Locations of pollen samples and radiocarbon samples in Cores B37A0673/W-04, B37A0675/W-06, and B37A0697/W-28. All depths in cm - HF (= Top of the core). Depth of the harbour floor resp. 17.72m - asl (B37A0673/W-04), 17.64m - asl (B37A0675/W-06), and 18.09m - asl (B37A069/W-28).Fig. 6.4. Pollen diagram Core B37A0675/W-06 (situated just outside Trench 1). (B) = Identification based on Beug 2004; (P) = Identification based on the series published by Punt et al. 1976-2009.Fig. 6.5. Quantitative analysis of charred microscopic particles Core B37A0675/W-06, combined with frequently encountered pollen types. (B) = Identification based on Beug 2004; (P) = Identification based on the series published by Punt et al. 1976-2009.Fig. 6.6. Pollen diagram Core B37A0673/W-04 (situated within Trench 2). (B) = Identification based on Beug 2004; (P) = Identification based on the series published by Punt et al. 1976-2009.Fig. 6.7. Analysis results charred microscopic particles Core B37A0673/W-04, combined with

324
frequently encountered pollen types. (B) = Identification based on Beug 2004; (P) = Identification based on the series published by Punt et al. 1976-2009.Fig. 6.8. Pollen diagram Core B37A0697/W-28. (B) = Identification based on Beug 2004; (P) = Identification based on the series published by Punt et al. 1976-2009.Fig. 6.9. Analysis results charred microscopic particles Core B37A0697/W-28, combined with the most common pollen types. (B) = Identification based on Beug 2004; (P) = Identification based on the series published by Punt et al. 1976-2009.Fig. 6.10. Pollen analysis results loose-soil samples, taken from various batches from Trenches 1 and 2. (B) = Identification based on Beug 2004; (P) = Identification based on the series published by Punt et al. 1976-2009.Fig. 6.11. Analysis results, charred microscopic particles from loose-soil samples, taken from various batches from Trenches 1 and 2. (B) = Identification based on Beug 2004; (P) = Identification based on the series published by Punt et al. 1976-2009.Fig. 6.12. Total pollen percentages for anthropogenic indicators and charred-fragment concentrations (in mm2/ml) in Cores B37A0673/W-04, B37A0675/W-06, and B37A0697/W-28.Fig. 6.13. Lesser celandine (Ranunculus ficaria). a. SEM micrographs of a charred fragment of tuber parenchyma from Batch 3 - Trench 1 - Sample Number 28. Cross section showing polygonal parenchyma cells, diameter 80 to 100µm; b. Concentration of solid tissue (a result of the charring process), which marks the position of the stele. The stele itself (diameter circa 250µm) originally formed the centre of the tuber; c. Damp undergrowth covered by lesser celandine in a riparian forest in Scotland; d. Tubers of lesser celandine collected in spring.Fig. 6.14. Charred fragments of a common-club-rush rhizome (Schoenoplectus lacustris) from Trench 1 - Batch 1 - Sample Number 54 (dry residue). Visible is a conspicuously smooth cross section, which suggests that the rhizome may have been cut before becoming charred (a. and b. show the same fragment).Fig. 6.15. SEM micrographs of a charred rhizome fragment of common club-rush (Schoenoplectus lacustris) from Trench 1 - Batch 1 - Sample Number 54. Visible is aerenchyma tissue with randomly placed vascular bundles. a. Overview; b. Detail.Fig. 6.16. SEM micrographs of a charred rhizome fragment of common club-rush (Schoenoplectus lacustris) from Trench 1 - Batch 1 - Sample Number 54. Visible is aerenchyma tissue with randomly placed vascular bundles each completely surrounded by a sclerenchyma sheath. a. Overview; b. Detail.Fig. 6.17. Charred tuber of a member of the sedge family (Cyperaceae) from Trench 2 - Batch 1 - Sample Number 334 (dry residue).Fig. 6.18. SEM micrographs showing a cross section of the tuber of a member of the sedge family, Trench 2 - Batch 1 - Sample Number 334. a. Cross section with vascular bundles randomly placed in the parenchyma tissue; b. Individual, amphivasal concentric bundles with phloem tissue surrounded by xylem (the phloem is almost completely deteriorated due to charring; its position is marked by cavities at the centre of each bundle).Fig. 6.19. Acorn. a. Charred fragments from Trench 1 - Batch 3 - Sample Number 28; b. Two halves of acorn cotyledons from Trench 1 - Batch 2 - Sample Number 115, both from dry-sieve residues (scale circa 2:1).Fig. 6.20. Examples of charred acorn parenchyma (SEM micrographs). a. From Trench 2 - Batch 2 - Sample Number 442 (botanical sample), showing thick-walled acorn parenchyma cells; b. From Trench 1 - Batch 0 - Sample Number 111 (wet-sieve residue), thin-walled parenchyma cells and the curved outlines of the vascular bundles are clearly visible.Fig. 6.21. Water chestnut (Trapa natans): a. Floating leaf rosettes; b. Nuts with spines.Fig. 6.22. Water chestnut (Trapa natans): a. Charred fragment, a complete spine from Trench 1 - Batch 3 - Find Number 18; b. Shell and spine fragments from Trench 1 - Batch 2 - Find Number 55.Fig. 6.23. Yellow water-lily (Nuphar lutea): a. Charred seed from Batch 1 - Trench 1 - Section 9A, Sample Number 83; b. Living plant with fruits (capsules), each containing numerous seeds.Fig. 6.24. Dogwood (Cornus sanguinea): a. Charred and broken fruit stones from Batch 1 - Trench 1 - Sample Number 54-6B (a radiocarbon date of 7071 to 6768 cal BC obtained on material from Batch 1 suggests a Middle Mesolithic date); a. Charred fruit-stone retrieved from a botanical sample (Batch 1 - Trench 2 - Sample Number 419); b. Living plant with berries.Fig. 6.25. Hawthorn (Crataegus monogyna): a. Charred fruit-stone retrieved from a botanical

325
sample (Batch 1 - Trench 2 - Sample Number 419); a. Living plant with berries.7. Synthesis
Fig. 7.1. Bird’s-eye view of the Yangtze Harbour planning area around 6750 BC. The drier parts are covered with deciduous woodland; the wetter parts support alder and subsequently reed fringes. At further distance inland lakes appear; at the horizon (looking south), the higher coversand area marking the edge of the estuary can just be made out. Fig. 7.2. Core B37A0677/W-08 from Target zone West. From bottom to top, it shows successively: Early Holocene fluvial clay with clearly identifiable soils (KRWY) and Basal Peat (NIBA), contemporary with the site’s Middle Mesolithic occupation; freshwater tidal deposits (EC) and estuarine deposits (NAWO) from the period of rapid drowning by the sea from 6500 BC onwards; and young marine sediments (SBBL) of the past 2500 years. The harbour floor (marked 00-, top left) lay at 17.32m - asl. Fig. 7.3. Distribution of Wommersom quartzite used as a raw material for tools during the Middle and Late Mesolithic (after Gendel 1984 and 1987, see Louwe Kooijmans, van den Broeke, Fokkens, and van Gijn 2005, with additional data from the sites Rotterdam- Beverwaard Tramremise, Rotterdam-’t Hart, Rotterdam-Yangtze Harbour, and Hoge Vaart A27 in Flevoland). Based on the wetland context of the sites from Rotterdam and Hoge Vaart, a tentative northern boundary of the distribution area is indicated in pink. The yellow dot marks the location where the Wommersom quartzite outcrops, and was quarried; Rotterdam-Yangtze Harbour is indicated with a red dot.Fig. 7.4. Location of the discussed Mesolithic sites in and around Rotterdam, in relation to the river- dune complexes identified by detailed mapping programmes (compiled by: Municipality of Rotterdam Archaeological Service BOOR). Fig. 7.5. Schematic section showing the anatomy of the Rhine-Meuse delta, with time lines indicating water-table rise and drowning.Fig. 7.6. The Holocene flooding of the North Sea. Deeper parts (darker shade of blue) drowned between 8000 and 7000 BC. The presumed coastline position at 7000 BC and a beach- barrier alignment breached by tidal inlets are indicated, the latter by a dotted line. Rotterdam-Yangtze Harbour is marked with the red dot. Fig. 7.7. The Storrega tsunami, occurring between 6250 and 5950 BC. The position of the Dutch coastline at the time of the tsunami is uncertain (cf Fig. 7.6). The red dot indicates the location of Rotterdam-Yangtze Harbour.Fig. 7.8. Northwestern Europe around 8000 BC. The progressive sea-level rise eventually turned the Dogger uplands into a North Sea island, and drowned them altogether around 6250 BC. Rotterdam-Yangtze Harbour is indicated with the red dot. Fig. 7.9. Maps of southeastern Labrador, Canada. The area shown is roughly the size of the Benelux, the adjacent part of Germany, the southern North Sea, and eastern England put together. a. The map drawn by Mathieu Medicabo shows a distorted image of the area, which on the other hand is very detailed in representing the coastline, river courses, and lakes. b. A conventional map with the cartographically correct representation of the area (after Leacock 1969, 7, Folders 1 and 2).Fig. 7.10. Scatter diagram of uncalibrated radiocarbon dates and elevations above prehistoric sea level. In addition to Niekus 2006 (black dots, N = 393; plotted in relation to the sea-level rise curve of the northern Netherlands). With additional data from the Yangtze Harbour (the present report), Hardinxveld-Polderweg, and Hardinxveld-De Bruin (Out 2009), Willemstad (van Es and Casparie 1968; van de Plassche 1982; Amkreuz 2013) and several Rotterdam sites (see Table 7.3, data from the site list attached to the ROaA, in preparation), plotted in relation to the sea-level rise curve of the Rhine-Meuse estuary (Hijma and Cohen 2010).
Tables
1. Introduction
Table 1.1. Administrative project data.Table 1.2. List of archaeological remains retrieved from river-dune deposits during the systematic field assessment (Stage 3) and the invasive underwater investigation (Stage 4). The frequencies (N) are based on an initial count by BOOR prior to the various expert analyses; final numbers may therefore be different. In addition to these find categories a large amount of unburnt vegetable material was collected. Because its character and origin were uncertain, this material was bagged separately and omitted from the
326
preliminary inventory.
3. Landscape genesis and palaeogeography
Table 3.1. Overview of monographs on the various geological and palaeogeographical investigations, included as appendices to this chapter. Table 3.2. Archaeological evidence in the top of the river-dune sand (BXDE) retrieved from cores.Table 3.3. Archaeological indicators from cores in the Wijchen Member (KRWY, upper part).Table 3.4. Archaeological indicators from cores in the Basal Peat (NIBA).Table 3.5. OSL datings of samples from cores in Target zone West (Wallinga and Versendaal 2014). The Bayesian calibration was executed in OxCal 4.2 and involves OSL datings of the top of KR, OSL datings of the lower BXDE, radiocarbon dates of the oldest bone fragments, and OSL datings of the soil in the top of BXDE in successive order. The youngest possible dating of the humic top of the river-dune sand is set at 6500 BC, congruent with the drowning history of the dune.Table 3.6. Comparisons of six pairs of radiocarbon datings of matrix and macroscopic samples from various levels in the Basal Peat in Target zones West and East.Tabel 3.7. Radiocarbon dates of charcoal from the upper Wijchen Member.Table 3.8. Radiocarbon dates of the base of the Basal Peat, arranged in order of increasing depth.Table 3.9. Radiocarbon dates of the Basal Peat in Target zone West. Table 3.10. Radiocarbon dates from freshwater tidal clays (EC), arranged in order of increasing depth.Table 3.11. Overview of the dating and palaeo-environmental studies on selected cores.Table 3.12. The time-depth relations employed in the time series of palaeogeographical maps (Figs 3.19, 3.20, and 3.24).
4. Flint and other stone
Table 4.1. Mineral inclusions in European flint types, flint sorted into northern and southern types.Table 4.2. Flint assemblages from Trenches 1 and 2 classified by flint type and probable origin. The category ‘indeterminate’ comprises unclassifiable, burnt fragments and artefacts as well as chips. ‘Rijckholt type’ here and elsewhere refers to flint which resembles Rijckholt flint, but which does not necessarily derive from the actual Rijckholt deposits.Table 4.3. Summary of characteristics observed during flint and stone thin-section analysis.Table 4.4. Stone assemblages from Trenches 1 and 2, classified by stone type.Table 4.5. Typo-technological classification of the flint assemblages from Trenches 1, 2, and 3 and the soil core samples. The frequencies include fragments. Fragments of artefacts which could not be further classified are grouped under the category ‘angular debris’. Table 4.6. Typo-technological classification of the stone assemblages from Trenches 1 and 2. The frequencies include fragments.Table 4.7. Use wear observed on analysed artefacts, arranged by research trench.Table 4.8. Number of used edges per tool.Table 4.9.a. Trench 1. Contact material versus performed motion of all artefacts showing traces of use wear.Table 4.9.b. Trench 2. Contact material versus performed motion of all artefacts showing traces of use wear.Table 4.10a. Trench 1. Artefact type versus contact material of all artefacts showing traces of use wear.Table 4.10b. Trench 2. Artefact type versus contact material of all artefacts showing traces of use wear.Table 4.11a. Trench 1. Artefact type versus performed motion of all artefacts showing traces of use wear.Table 4.11b. Trench 2. Artefact type versus performed motion of all artefacts showing traces of use wear.Table 4.12. Function of artefacts with multiple use-wear zones.Table 4.13. Contact material by trench.
327
5. Fauna
Table 5.1. Frequency of animal remains per category and collection method (percentages based on the total number of remains).Table 5.2. Frequency of animal remains from soil samples, 2 and 10mm mesh size (percentages based on the total number of remains).Table 5.3. Percentages of traces of burning and identifiability of animal remains retrieved from 2 and 10mm sieve residues.Table 5.4. Frequency and weight of mammal and bird bone retrieved from 2mm and 10mm sieve residues, Trench 1 (excluding background fauna). Because of the low frequencies, no percentages were calculated for respectively mammals (2mm) and all material (10mm).Table 5.5. Number of fish remains, 2mm and 10mm sieve residues, Trench 1. N1 = Number of remains including scales; N2 = Number of remains excluding scales (no scales in 10mm residue). Because of the low frequencies, no percentages were calculated for 10mm residues.Table 5.6. Number of remains (NR) of background fauna, 2 and 10mm sieve residues, Trench 1.Table 5.7. Frequency and weight of mammal and bird remains retrieved from 2 and 10mm sieve residues, Trench 2 (excluding background fauna). Because of the low frequencies no percentages were calculated for respectively birds (2mm) and all species (10mm).Table 5.8. Number of fish remains, 2 and 10mm sieve residues, Trench 2. N1 = Number of remains including scales; N2 = Number of remains excluding scales (no scales in 10mm mesh size residue). Because of the low frequencies, no percentages were calculated for 10mm residues.Table 5.9. Number of remains (NR) of background fauna, 2 and 10mm sieve residues, Trench 2.Table 5.10. Number and weight of animal remains from 2 and 10mm sieve residues, Trench 3.Table 5.11. Distribution of skeletal parts (numbers) of red deer, wild boar, otter, and wildcat (2 and 10mm sieve residues).Table 5.12. Distribution of skeletal parts (numbers) of duck species (2 and 10mm sieve residues).Table 5.13. Slaughter age in months for wild boar, red deer, beaver, wildcat, and otter, based on fusion stages in postcranial skeletal parts (2 and 10mm sieve residues). Table 5.14. Estimated and calculated total length (in cm/number of individuals), based on identified fish remains from 2 and 10mm sieve residues.
6. Archaeobotany: landscape reconstruction and plant food subsistence economy on a meso and microscale
Table 6.1. Administrative data of the analysed core samples. Table 6.2. Lithological and stratigraphic units of the analysed core samples.Table 6.3. Radiocarbon dates obtained on selected botanical macroremains, Yangtze Harbour. All dates were calibrated using OxCal 4.2 (Bronk Ramsey 2013; Reimer et al. 2009) at a significance level of 2σ (95.4%).Table 6.4. Analysis results, charred microscopic particles from core samples.Table 6.5. Analysis results charred microscopic particles from 5-litre samples taken from different batches.Table 6.6. Charcoal: analysis results (summary), Trench 1. Table 6.7. Charcoal: analysis results (summary), Trench 2. Table 6.8. Charcoal: analysis results (summary), Trench 3, from 2mm residue (OPH2).Table 6.9. Edible plants that were part of the Mesolithic diet.
7. Synthesis
Table 7.1. The identified species (macrofauna) and their various natural habitats.Table 7.2. Overview of identified plant-food resources (all found in charred remains).Table 7.3. Dates of sites and stray finds.

328
329
Sources of the illustrations
Unless noted otherwise, either the authors of the respective chapters or the editors (BOOR) provided all photographs and figures presented in this publication.
Inside front and back covers
Watercolours by M.F. Valkhoff (BOOR)
1. Introduction
Port of Rotterdam Authority, Projectorganisatie Maasvlakte 2 - Figure 1.4
2. Methods and techniques
B.I. Smit (Cultural Heritage Agency of the Netherlands) - Figure 2.12
J. van der Panne (PUMA) - Figures 2.15, 2.21, and 2.23
H.J.T. Weerts (Cultural Heritage Agency of the Netherlands) - Figure 2.17
W. Zijl (BOOR) - Figures 2.18 and 2.20
M. van den Berg (Alef Archeowerk B.V.) - Figure 2.25
G.F.H.M. Kempenaar (BOOR) - Figure 2.29
Port of Rotterdam Authority, Projectorganisatie Maasvlakte 2 - Figure 2.33
3. Landscape genesis and palaeogeography
S. van Asselen and I.J. Bos (Department of Physical Geography, Utrecht University) - Figure 3.23
4. Flint and other stone
Laboratory for Artefact Studies, Leiden University - Figures 4.1, 4.24 to 4.27
H. de Kruyk (Leerdam) - Figures 4.2 to 4.16, 4.18, and 4.19
H. B. Versloot (Niekerk) - Figures 4.17, 4.20 to 4.23
5. Fauna
Wikipedia - Figures 5.2, 5.3 and 5.7
After Nijssen and de Groot 1987 - Figure 5.4
6. Archaeobotany: landscape reconstruction and plant food subsistence economy on a meso and microscale
http://sagebud.com/buttercup-ranunculus (photo courtesy of Roger Griffith) - Figure 6.13c
330
http://www.agefotostock.com/en/Stock-Images/Rights-Managed/BWI-BLW042551 (photo courtesy of R. Koenig) - Figure 6.13d
M. van Waijjen (BIAX Consult) - Figures 6.14, 6.17, 6.19, 6.22, 6.24a, and 6.25a
http://www.boga.ruhr-uni-bochum.de/html/Trapa_natans_Foto.html (photo courtesy of Annette Höggemeier, Botanischer Garten Ruhr-Universität Bochum) - Figure 6.21ahttp://www.my.gardenguides.com - Figure 6.21b
http://flora.nhm-wien.ac.at/Seiten-Arten/Nuphar-lutea.htm (photo courtesy of A. Mrkvicka in Botanik im Bild/Flora von Österreich) - Figure 6.23b
http://www.kuleuven-kulak.be - Figure 6.24b
http://www.floraplanta.nl - Figure 6.25b
7. Synthesis
M.F. Valkhoff (BOOR) - Figure 7.1
After Gendel 1984 and 1987, in Louwe Kooijmans et al. 2005, supplemented by BOOR and K. Cohen (Department of Physical Geography, Utrecht University) - Figure 7.3
Data BOOR Rotterdam, Louwe Kooijmans 2001a, idem 2001b and Vos et al. 2011 - Figure 7.4
After Cohen and Hijma 2013, adapted by K. Cohen (Department of Physical Geography, Utrecht University) - Figure 7.5
After Beets and Van der Spek 2000, adapted by K. Cohen (Department of Physical Geography, Utrecht University) - Figure 7.6
After Cohen and Hijma 2008, adapted by K. Cohen (Department of Physical Geography, Utrecht University) - Figure 7.7
After Vos et al. 2011, adapted by K. Cohen (Department of Physical Geography, Utrecht University) - Figure 7.8
After Lovis and Donahue 2011 - Figure 7.9
After Niekus 2006, supplemented by K. Cohen (Department of Physical Geography, Utrecht University) - Figure 7.10

331
Bibliography
Albarella, U., K. Dobney and P. Rowley-Conwy, 2009: Size and shape of the Eurasian wild boar (Sus Scrofa), with a view to the reconstruction of its Holocene history, Environmental Archaeology 14(2), 103-136.
Amkreutz, L.W.S.W., 2013: Persistent traditions. A long-term perspective on cummunities in the process of Neolithization in the Lower Rhine Area (5500-2500 cal BC), Leiden (PhD Thesis Leiden University).
Bailey, G., 2004: The wider significance of submerged archaeological sites and their relevance to world prehistory, in: N.C. Flemming (ed.), Submarine prehistoric archaeology of the North Sea. Research priorities and collaboration with Industry, York (CBA Research Report 141), 3-10.
Bakels, C.C. and L.M. van Beurden, 2001: Archeobotanie, in: L.P. Louwe Kooijmans (ed.), Archeologie in de Betuweroute. Hardinxveld-Giessendam Polderweg. Een mesolithisch jachtkamp in het rivierengebied (5500-5000 v. Chr.), Amersfoort (Rapportage Archeologische Monumentenzorg 83), 325-378.
Bakels, C.C., L.M. van Beurden and T.J.J. Vernimmen, 2001: Archeobotanie, in: L.P. Louwe Kooijmans (ed.), Archeologie in de Betuweroute. Hardinxveld-Giessendam De Bruin. Een kampplaats uit het Laat-Mesolithicum en het begin van de Swifterbant-cultuur (5500-4450 v. Chr.), Amersfoort (Rapportage Archeologische Monumentenzorg 88), 369-433.
Beerenhout, B., 2001a: Vissen, in: L.P. Louwe Kooijmans (ed.), Archeologie in de Betuweroute. Hardinxveld-Giessendam Polderweg. Een mesolithisch jachtkamp in het rivierengebied (5500-5000 v. Chr.), Amersfoort (Rapportage Archeologische Monumentenzorg 83), 243-276.
Beerenhout, B., 2001b: Vissen, in: L.P. Louwe Kooijmans (ed.), Archeologie in de Betuweroute. Hardinxveld-Giessendam De Bruin. Een kampplaats uit het Laat-Mesolithicum en het begin van de Swifterbant-cultuur (5500-4450 v. Chr.), Amersfoort (Rapportage Archeologische Monumentenzorg 88), 299-325.
Beets, D.J. and A.J.F. van der Spek, 2000: The Holocene evolution of the barrier and the back-barrier basins of Belgium and the Netherlands as a function of late Weichselian morphology, relative sea-level rise and sediment supply, Netherlands Journal of Geosciences - Geologie en Mijnbouw 79(1), 3-16.
Behre, K.-E., 1981: The interpretation of anthropogenic indicators in pollen diagrams, Pollen et Spores 23(2), 225-245.
Bell, M.G. (ed.), 2007: Prehistoric Coastal Communities: The Mesolithic in Western Britain, York (CBA Research Report 149).
Berendsen, H.J.A., W.Z. Hoek and E. Schorn, 1995: Late Weichselian and Holocene river channel changes of the rivers Rhine and Meuse in the Netherlands (Land van Maas en Waal), Paläoklimaforschung/Palaeoclimate Research 14, 151-171.
Beug, H.-J., 2004: Leitfaden der Pollenbestimmung für Mitteleuropa und angrenzende Gebiete, München.
Beuker, J.R. and W.A. Casparie, 1989: Mesolithische bewoningssporen op een zandopduiking te Nieuw-Schoonebeek, Nieuwe Drentse Volksalmanak 106, 117-186.
References
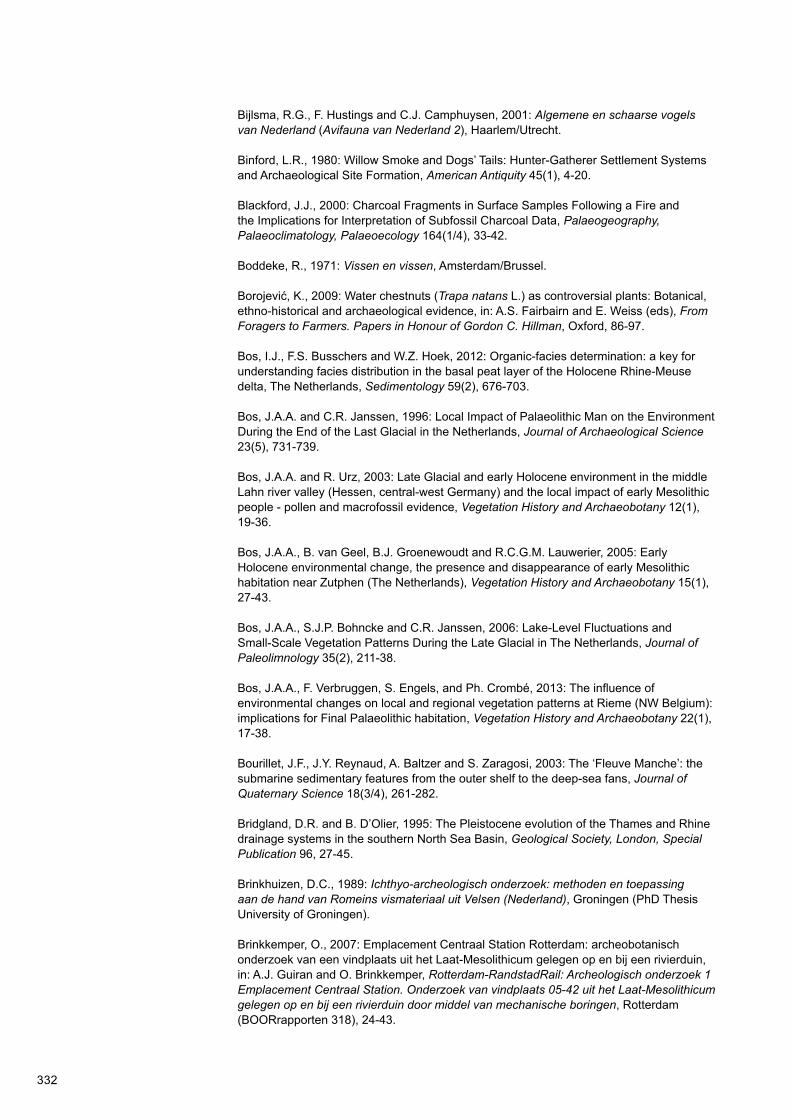
332
Bijlsma, R.G., F. Hustings and C.J. Camphuysen, 2001: Algemene en schaarse vogels van Nederland (Avifauna van Nederland 2), Haarlem/Utrecht.
Binford, L.R., 1980: Willow Smoke and Dogs’ Tails: Hunter-Gatherer Settlement Systems and Archaeological Site Formation, American Antiquity 45(1), 4-20.
Blackford, J.J., 2000: Charcoal Fragments in Surface Samples Following a Fire and the Implications for Interpretation of Subfossil Charcoal Data, Palaeogeography, Palaeoclimatology, Palaeoecology 164(1/4), 33-42.
Boddeke, R., 1971: Vissen en vissen, Amsterdam/Brussel.
Borojević, K., 2009: Water chestnuts (Trapa natans L.) as controversial plants: Botanical, ethno-historical and archaeological evidence, in: A.S. Fairbairn and E. Weiss (eds), From Foragers to Farmers. Papers in Honour of Gordon C. Hillman, Oxford, 86-97.
Bos, I.J., F.S. Busschers and W.Z. Hoek, 2012: Organic-facies determination: a key for understanding facies distribution in the basal peat layer of the Holocene Rhine-Meuse delta, The Netherlands, Sedimentology 59(2), 676-703.
Bos, J.A.A. and C.R. Janssen, 1996: Local Impact of Palaeolithic Man on the Environment During the End of the Last Glacial in the Netherlands, Journal of Archaeological Science 23(5), 731-739.
Bos, J.A.A. and R. Urz, 2003: Late Glacial and early Holocene environment in the middle Lahn river valley (Hessen, central-west Germany) and the local impact of early Mesolithic people - pollen and macrofossil evidence, Vegetation History and Archaeobotany 12(1), 19-36.
Bos, J.A.A., B. van Geel, B.J. Groenewoudt and R.C.G.M. Lauwerier, 2005: Early Holocene environmental change, the presence and disappearance of early Mesolithic habitation near Zutphen (The Netherlands), Vegetation History and Archaeobotany 15(1), 27-43.
Bos, J.A.A., S.J.P. Bohncke and C.R. Janssen, 2006: Lake-Level Fluctuations and Small-Scale Vegetation Patterns During the Late Glacial in The Netherlands, Journal of Paleolimnology 35(2), 211-38.
Bos, J.A.A., F. Verbruggen, S. Engels, and Ph. Crombé, 2013: The influence of environmental changes on local and regional vegetation patterns at Rieme (NW Belgium): implications for Final Palaeolithic habitation, Vegetation History and Archaeobotany 22(1), 17-38.
Bourillet, J.F., J.Y. Reynaud, A. Baltzer and S. Zaragosi, 2003: The ‘Fleuve Manche’: the submarine sedimentary features from the outer shelf to the deep-sea fans, Journal of Quaternary Science 18(3/4), 261-282.
Bridgland, D.R. and B. D’Olier, 1995: The Pleistocene evolution of the Thames and Rhine drainage systems in the southern North Sea Basin, Geological Society, London, Special Publication 96, 27-45.
Brinkhuizen, D.C., 1989: Ichthyo-archeologisch onderzoek: methoden en toepassing aan de hand van Romeins vismateriaal uit Velsen (Nederland), Groningen (PhD Thesis University of Groningen).
Brinkkemper, O., 2007: Emplacement Centraal Station Rotterdam: archeobotanisch onderzoek van een vindplaats uit het Laat-Mesolithicum gelegen op en bij een rivierduin, in: A.J. Guiran and O. Brinkkemper, Rotterdam-RandstadRail: Archeologisch onderzoek 1 Emplacement Centraal Station. Onderzoek van vindplaats 05-42 uit het Laat-Mesolithicum gelegen op en bij een rivierduin door middel van mechanische boringen, Rotterdam (BOORrapporten 318), 24-43.

333
Brinkkemper, O., W.J. Hogestijn, J.H.M. Peeters, D. Visser and C. Whitton, 1999: The Early Neolithic site at Hoge Vaart, Almere, the Netherlands, with particular reference to non-diffusion of crop plants, and the significance of site function and sample location, Vegetation History and Archaeobotany 8(1/2), 79-86.
Broeke, P.W. van den, 1983: Neolithic bone and antler objects from the Hazendonk near Molenaarsgraaf (Prov. South Holland), Oudheidkundige Mededelingen uit het Rijksmuseum van Oudheden te Leiden 64, 163-195.
Broeke, P.W. van den, A.L. van Gijn and H. Fokkens, 2005: Een prehistorie van deze tijd, in: L.P. Louwe Kooijmans, P.W. van den Broeke, H. Fokkens and A.L. van Gijn (eds), Nederland in de prehistorie, Amsterdam, 17-31.
Broekhuizen, S., B. Hoekstra, V. van Laar, C. Smeenk and J.B.M. Thissen (eds), 1992: Atlas van de Nederlandse zoogdieren, Utrecht.
Bronk Ramsey, C., 2009: Bayesian Analysis of Radiocarbon Dates, Radiocarbon 51(1), 337-360.
Bull, G. and S. Payne, 1982: Tooth eruption and epiphyseal fusion in pigs and wild boar, in: B. Wilson, C. Grigson and S. Payne (eds), Ageing and sexing animal bones from archaeological sites, Oxford (BAR British Series 109), 55-71.
Bulten, E., F. van der Heijden and T. Hamburg, 2009: Prehistorische visweren en fuiken op kavel J97 bij Emmeloord, Archeologie 13, 47-62.
Busschers, F.S., 2008: Unravelling the Rhine. Response of a fluvial system to climate-change, sea-level oscillation and glaciation, Enschede (PhD Thesis VU University Amsterdam).
Busschers, F.S., C. Kasse, R.T. Van Balen, J. Vandenberghe, K.M. Cohen, H.J.T. Weerts, J. Wallinga, C. Johns, P. Cleveringa and F.P.M. Bunnik, 2007: Late Pleistocene evolution of the Rhine-Meuse system in the southern North Sea Basin: imprints of climate change, sea-level oscillations and glacio-isostacy, Quaternary Science Reviews 26(25/28), 3216-3248.
Cappers, R.T.J. and R. Neef, 2012: Handbook of Plant Palaeoecology, Groningen (Groningen Archaeological Studies 19).
Chestnut, V.K., 1974: Plants Used by the Indians of Mendocino County, California, Fort Bragg California.
Clark, J.G.D., 1936: The Mesolithic Settlement of Northern Europe. A Study of the Food-gathering Peoples of Northern Europe during the Early Post-glacial Period, Cambridge.
Clark, J.S., J. Lynch, B.J. Stocks and J.G. Goldammer, 1998: Relationships between charcoal particles in air and sediments in west-central Siberia, The Holocene 8(1), 19-29.
Clarke, D.L., 1976: Mesolithic Europe: the economic basis, in: G. de G. Sieveking, I.H. Longworth and K.E. Wilson (eds), Problems in Economic and Social Archaeology, London, 449-481.
Cohen, K.M., 2003: Differential subsidence within a coastal prism: Late-Glacial - Holocene tectonics in the Rhine-Meuse delta, the Netherlands, Utrecht (Netherlands Geographical Studies 316).
Cohen, K.M., 2005: 3D Geostatistical Interpolation and Geological Interpretation of Paleo-Groundwater Rise in the Holocene Coastal Prism in the Netherlands, SEPM Special Publication 83, 341-364.
Cohen, K.M. and M.P. Hijma, 2008: Het Rijnmondgebied in het Vroeg-Holoceen: inzichten uit een diepe put bij Blijdorp (Rotterdam), Grondboor en Hamer 62(3/4), 64-71.

334
Cohen K.M., Stouthamer E., Pierik H.J. and Geurts A.H. (2012) - Rhine Meuse Delta Studies’ Digital Basemap For Delta Evolution And Palaeogeography. Utrecht University. Digital Dataset. Persistent identifier: urn:nbn:nl:ui:13-nqjn-zl. https://easy.dans.knaw.nl/ui/datasets/id/easy-dataset:52125
Cohen, K.M. and M.P. Hijma, 2013: The transgressive Early-Middle Holocene boundary - the case for a GSSP at Rotterdam, Rhine Delta, North Sea Basin, Ciências da Terra Volume Especial 7, 148-149.
Coles, B.J., 1998: Doggerland: a Speculative Survey, Proceedings of the Prehistoric Society 64, 45-81.
Cremer, H., 2009: Diatomeeënanalyses aan sedimenten van de boringen Papegaaibek (B37A0594) en Kop van Beer (B37A0592), Utrecht (TNO-rapport 034-UT-2009-02346-B).
Cremer, H. and F.P.M. Bunnik, 2009: Diatomeeën- en pollenanalyses (scanonderzoek) van de boringen Papegaaibek (B37A0594) en Kop van Beer (B37A0592), Utrecht (TNO-rapport 034-Ut-2009-00739-A).
Cremer, H. and F.P.M. Bunnik, 2010: Diatomeeën- en pollenscans van de boringen Yangtzehaven (B37A0652, B37A0653, B37A0656, B37A0661, B37A0663, B37A0665), Utrecht (TNO-rapport 034-Ut-2010-01150-B).
Cremer, H., F.P.M. Bunnik and H. Koolmees, 2013: Diatomeeën- en pollenanalyses en scans van geselecteerde boringen van de opgraving Yangtzehaven, Utrecht (TNO-rapport R10346).
Crombé, Ph., M. van Strydonck and M. Boudin, 2009: Towards a Refinement of the Absolute (Typo)Chronology for the Early Mesolithic in the Coversand Area of Northern Belgium and the Southern Netherlands, in: Ph. Crombé, M. Van Strydonck, J. Sergant, M. Boudin and M. Bats (eds), Chronology and Evolution within the Mesolithic of North-West Europe. Proceedings of an International Meeting, Brussels, May 30th-June 1st 2007, Cambridge, 95-112.
Crombé, Ph., Y. Perdaen, J. Sergant and J.P. Caspar, 2010: Wear Analysis on Early Mesolithic Microliths from the Verrebroek Site, East Flanders, Belgium, Journal of Field Archaeology 28(3/4), 253-269.
Cunningham, P., 2011: Caching your savings: The use of small-scale storage in European prehistory, Journal of Anthropological Archaeology 30(2), 135-144.
Deeben, J.H.C. and J. Schreurs, 1997: Codelijst voor laatpaleolithische, mesolithische en neolithische artefacten. Tweede versie (bijgesteld op 11-04-2001), Amersfoort.
Deeben, J.H.C. and N. Arts, 2005: Van jagen op de toendra naar jagen in het bos. Laat-paleolithicum en vroeg-mesolithicum, in: L.P. Louwe Kooijmans, P.W. van den Broeke, H. Fokkens and A.L. van Gijn (eds), Nederland in de prehistorie, Amsterdam, 139-156.
Deeben, J.H.C., J.H.M. Peeters, D.C.M. Raemaekers, E. Rensink and L.B.M. Verhart, 2006: De vroege prehistorie, NOaA hoofdstuk 11 (versie 1.0), 6-23 (http://www.noaa.nl).
Devriendt, I.I.J.A.L.M., 2008: Becoming Neolithic. The Mesolithic-Neolithic transition and its impact on the flint and stone industry at Swifterbant (the Netherlands), Documenta Praehistorica 35, 131-141.
Dijk, G.J. van, H.J.A. Berendsen and W. Roeleveld, 1991: Holocene water level development in The Netherlands’ river area; implications for sea-level reconstruction, Netherlands Journal of Geosciences - Geologie en Mijnbouw 70(4), 311-326.
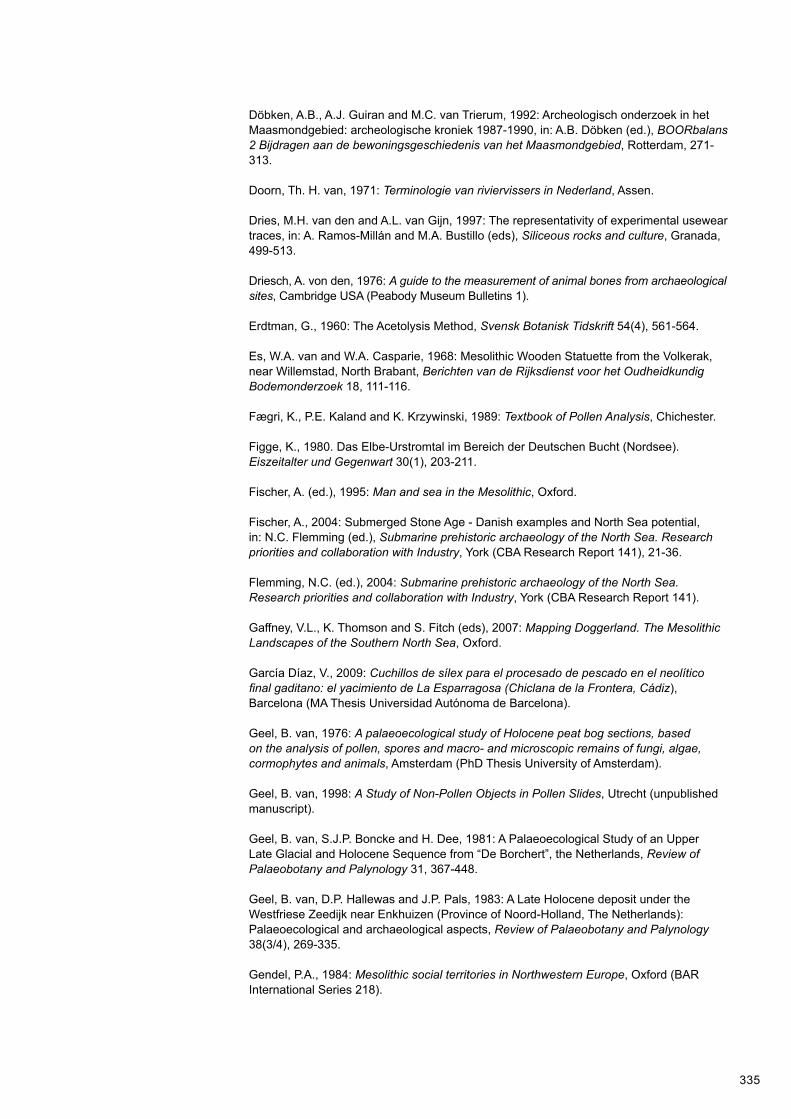
335
Döbken, A.B., A.J. Guiran and M.C. van Trierum, 1992: Archeologisch onderzoek in het Maasmondgebied: archeologische kroniek 1987-1990, in: A.B. Döbken (ed.), BOORbalans 2 Bijdragen aan de bewoningsgeschiedenis van het Maasmondgebied, Rotterdam, 271-313.
Doorn, Th. H. van, 1971: Terminologie van riviervissers in Nederland, Assen.
Dries, M.H. van den and A.L. van Gijn, 1997: The representativity of experimental usewear traces, in: A. Ramos-Millán and M.A. Bustillo (eds), Siliceous rocks and culture, Granada, 499-513.
Driesch, A. von den, 1976: A guide to the measurement of animal bones from archaeological sites, Cambridge USA (Peabody Museum Bulletins 1).
Erdtman, G., 1960: The Acetolysis Method, Svensk Botanisk Tidskrift 54(4), 561-564.
Es, W.A. van and W.A. Casparie, 1968: Mesolithic Wooden Statuette from the Volkerak, near Willemstad, North Brabant, Berichten van de Rijksdienst voor het Oudheidkundig Bodemonderzoek 18, 111-116.
Fægri, K., P.E. Kaland and K. Krzywinski, 1989: Textbook of Pollen Analysis, Chichester.
Figge, K., 1980. Das Elbe-Urstromtal im Bereich der Deutschen Bucht (Nordsee). Eiszeitalter und Gegenwart 30(1), 203-211.
Fischer, A. (ed.), 1995: Man and sea in the Mesolithic, Oxford.
Fischer, A., 2004: Submerged Stone Age - Danish examples and North Sea potential, in: N.C. Flemming (ed.), Submarine prehistoric archaeology of the North Sea. Research priorities and collaboration with Industry, York (CBA Research Report 141), 21-36.
Flemming, N.C. (ed.), 2004: Submarine prehistoric archaeology of the North Sea. Research priorities and collaboration with Industry, York (CBA Research Report 141).
Gaffney, V.L., K. Thomson and S. Fitch (eds), 2007: Mapping Doggerland. The Mesolithic Landscapes of the Southern North Sea, Oxford.
García Díaz, V., 2009: Cuchillos de sílex para el procesado de pescado en el neolítico final gaditano: el yacimiento de La Esparragosa (Chiclana de la Frontera, Cádiz), Barcelona (MA Thesis Universidad Autónoma de Barcelona).
Geel, B. van, 1976: A palaeoecological study of Holocene peat bog sections, based on the analysis of pollen, spores and macro- and microscopic remains of fungi, algae, cormophytes and animals, Amsterdam (PhD Thesis University of Amsterdam).
Geel, B. van, 1998: A Study of Non-Pollen Objects in Pollen Slides, Utrecht (unpublished manuscript).
Geel, B. van, S.J.P. Boncke and H. Dee, 1981: A Palaeoecological Study of an Upper Late Glacial and Holocene Sequence from “De Borchert”, the Netherlands, Review of Palaeobotany and Palynology 31, 367-448.
Geel, B. van, D.P. Hallewas and J.P. Pals, 1983: A Late Holocene deposit under the Westfriese Zeedijk near Enkhuizen (Province of Noord-Holland, The Netherlands): Palaeoecological and archaeological aspects, Review of Palaeobotany and Palynology 38(3/4), 269-335.
Gendel, P.A., 1984: Mesolithic social territories in Northwestern Europe, Oxford (BAR International Series 218).

336
Gendel, P.A., 1987: Socio-stylistic analysis of lithic artefacts from the Mesolithic of Northwestern Europe, in: P. Rowley-Conwy, M. Zvelebil and H.P. Blankholm (eds), Mesolithic Northwest Europe: recent trends, Sheffield, 65-73.
Gijn, A.L. van, 1990: The wear and tear of flint. Principles of functional analysis applied to Dutch Neolithic assemblages, Leiden (Analecta Praehistorica Leidensia 22).
Gijn, A.L. van, 2006a: Implements of bone and antler: a Mesolithic tradition continued, in: L.P. Louwe Kooijmans and P.F.B. Jongste (eds), Schipluiden. A Neolithic settlement on the Dutch North Sea coast c. 3500 cal BC, Leiden (Analecta Praehistorica Leidensia 37/38), 207-224.
Gijn, A.L. van, 2006b: Ornaments of jet, amber and bone, in: L.P. Louwe Kooijmans and P.F.B. Jongste (eds), Schipluiden. A Neolithic settlement on the Dutch North Sea coast c. 3500 cal BC, Leiden (Analecta Praehistorica Leidensia 37/38), 195-205.
Gijn, A.L. van, 2008: De ornamenten van Ypenburg, in: J.M. Koot, L. Bruning and R.A. Houkes (eds), Ypenburg-locatie 4. Een nederzetting met grafveld uit het Midden-Neolithicum in het West-Nederlandse kustgebied, Leiden, 277-288.
Gijn, A.L. van, 2010: Flint in Focus. Lithic Biographies in the Neolithic and Bronze Age, Leiden.
Gijn, A.L. van, V. Beugnier and Y.M.J. Lammers-Keijsers, 2001a: Vuursteen, in: L.P. Louwe Kooijmans (ed.), Archeologie in de Betuweroute. Hardinxveld-Giessendam Polderweg. Een mesolithisch jachtkamp in het rivierengebied (5500-5000 v. Chr.), Amersfoort (Rapportage Archeologische Monumentenzorg 83), 119-161.
Gijn, A.L. van, Y.M.J. Lammers-Keijsers and R. Houkes, 2001b: Vuursteen, in: L.P. Louwe Kooijmans (ed.), Archeologie in de Betuweroute. Hardinxveld-Giessendam De Bruin. Een kampplaats uit het Laat-Mesolithicum en het begin van de Swifterbant-cultuur (5500-4450 v. Chr.), Amersfoort (Rapportage Archeologische Monumentenzorg 88), 153-191.
Gijn, A.L. van, V. van Betuw, A. Verbaas and K. Wentink, 2006: Flint, procurement and use, in: L.P. Louwe Kooijmans and P.F.B. Jongste (eds), Schipluiden. A Neolithic settlement on the Dutch North Sea coast c. 3500 cal BC, Leiden (Analecta Praehistorica Leidensia 37/38), 129-166.
Gijssel, K. van and B. van der Valk 2005: Aangespoeld, gestuwd en verwaaid: de wording van Nederland, in: L.P. Louwe Kooijmans, P.W. van den Broeke, H. Fokkens and A.L. van Gijn (eds), Nederland in de prehistorie, Amsterdam, 45-74.
Glimmerveen, J., D. Mol, K. Post, J.W.F. Reumer, H. van der Plicht, J. de Vos, B. van Geel, G. van Reenen and J.P. Pals, 2004: The North Sea Project: the first palaeontological, palynological, and archaeological results, in: N.C. Flemming (ed.), Submarine prehistoric archaeology of the North Sea. Research priorities and collaboration with Industry, York (CBA Research Report 141), 43-52.
Greisman, A. and M.J. Gaillard, 2009: The role of climate variability and fire in early and mid-Holocene forest dynamics of southern Sweden, Journal of Quaternary Science 24(6), 593-611.
Groenendijk, H.A. and P.C. Vos, 2002: Outside the Terp Landscape: Detecting Drowned Settlements by using the Geo-genetic Approach in the Coastal Region North of Grijpskerk, Berichten van de Rijksdienst voor het Oudheidkundig Bodemonderzoek 45, 57-80.
Groenewoudt, B.J., J.H.C. Deeben, B. van Geel and R.C.G.M. Lauwerier, 2001: An Early Mesolithic Assemblage with faunal remains in a stream valley near Zutphen, the Netherlands, Archäologisches Korrespondenzblatt 31(3), 329-348.
Groot, S.J. de and S. Schaap, 1973: De Nederlandse visserij rond 1900, Amsterdam.
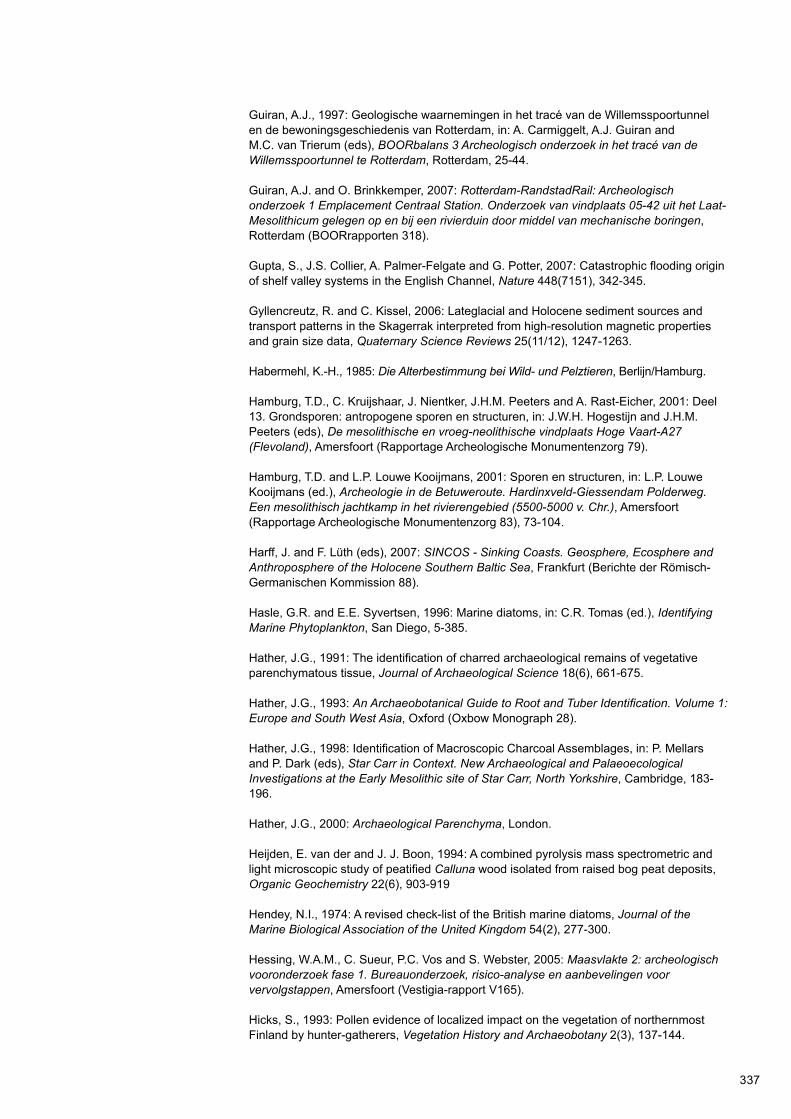
337
Guiran, A.J., 1997: Geologische waarnemingen in het tracé van de Willemsspoortunnel en de bewoningsgeschiedenis van Rotterdam, in: A. Carmiggelt, A.J. Guiran and M.C. van Trierum (eds), BOORbalans 3 Archeologisch onderzoek in het tracé van de Willemsspoortunnel te Rotterdam, Rotterdam, 25-44.
Guiran, A.J. and O. Brinkkemper, 2007: Rotterdam-RandstadRail: Archeologisch onderzoek 1 Emplacement Centraal Station. Onderzoek van vindplaats 05-42 uit het Laat-Mesolithicum gelegen op en bij een rivierduin door middel van mechanische boringen, Rotterdam (BOORrapporten 318).
Gupta, S., J.S. Collier, A. Palmer-Felgate and G. Potter, 2007: Catastrophic flooding origin of shelf valley systems in the English Channel, Nature 448(7151), 342-345.
Gyllencreutz, R. and C. Kissel, 2006: Lateglacial and Holocene sediment sources and transport patterns in the Skagerrak interpreted from high-resolution magnetic properties and grain size data, Quaternary Science Reviews 25(11/12), 1247-1263.
Habermehl, K.-H., 1985: Die Alterbestimmung bei Wild- und Pelztieren, Berlijn/Hamburg.
Hamburg, T.D., C. Kruijshaar, J. Nientker, J.H.M. Peeters and A. Rast-Eicher, 2001: Deel 13. Grondsporen: antropogene sporen en structuren, in: J.W.H. Hogestijn and J.H.M. Peeters (eds), De mesolithische en vroeg-neolithische vindplaats Hoge Vaart-A27 (Flevoland), Amersfoort (Rapportage Archeologische Monumentenzorg 79).
Hamburg, T.D. and L.P. Louwe Kooijmans, 2001: Sporen en structuren, in: L.P. Louwe Kooijmans (ed.), Archeologie in de Betuweroute. Hardinxveld-Giessendam Polderweg. Een mesolithisch jachtkamp in het rivierengebied (5500-5000 v. Chr.), Amersfoort (Rapportage Archeologische Monumentenzorg 83), 73-104.
Harff, J. and F. Lüth (eds), 2007: SINCOS - Sinking Coasts. Geosphere, Ecosphere and Anthroposphere of the Holocene Southern Baltic Sea, Frankfurt (Berichte der Römisch-Germanischen Kommission 88).
Hasle, G.R. and E.E. Syvertsen, 1996: Marine diatoms, in: C.R. Tomas (ed.), Identifying Marine Phytoplankton, San Diego, 5-385.
Hather, J.G., 1991: The identification of charred archaeological remains of vegetative parenchymatous tissue, Journal of Archaeological Science 18(6), 661-675.
Hather, J.G., 1993: An Archaeobotanical Guide to Root and Tuber Identification. Volume 1: Europe and South West Asia, Oxford (Oxbow Monograph 28).
Hather, J.G., 1998: Identification of Macroscopic Charcoal Assemblages, in: P. Mellars and P. Dark (eds), Star Carr in Context. New Archaeological and Palaeoecological Investigations at the Early Mesolithic site of Star Carr, North Yorkshire, Cambridge, 183-196.
Hather, J.G., 2000: Archaeological Parenchyma, London.
Heijden, E. van der and J. J. Boon, 1994: A combined pyrolysis mass spectrometric and light microscopic study of peatified Calluna wood isolated from raised bog peat deposits,Organic Geochemistry 22(6), 903-919
Hendey, N.I., 1974: A revised check-list of the British marine diatoms, Journal of the Marine Biological Association of the United Kingdom 54(2), 277-300.
Hessing, W.A.M., C. Sueur, P.C. Vos and S. Webster, 2005: Maasvlakte 2: archeologisch vooronderzoek fase 1. Bureauonderzoek, risico-analyse en aanbevelingen voor vervolgstappen, Amersfoort (Vestigia-rapport V165).
Hicks, S., 1993: Pollen evidence of localized impact on the vegetation of northernmost Finland by hunter-gatherers, Vegetation History and Archaeobotany 2(3), 137-144.

338
Hijma, M.P., 2009: From river valley to estuary. The early-mid Holocene transgression of the Rhine-Meuse valley, The Netherlands, Utrecht (Netherlands Geographical Studies 389).
Hijma, M.P., K.M. Cohen, G. Hoffmann, A.J.F. van der Spek and E. Stouthamer, 2009: From river valley to estuary: the evolution of the Rhine mouth in the early to middle Holocene (western Netherlands, Rhine-Meuse delta), Netherlands Journal of Geosciences - Geologie en Mijnbouw 88(1), 13-53.
Hijma, M.P. and K.M. Cohen, 2010: Timing and magnitude of the sea-level jump preluding the 8200 yr event, Geology 38(3), 275-278.
Hijma, M.P. and K.M. Cohen, 2011: Holocene transgression of the Rhine river mouth area, The Netherlands/Southern North Sea: palaeogeography and sequence stratigraphy, Sedimentology 58(6), 1453-1485.
Hijma, M.P, K.M. Cohen, W. Roebroeks, W.E. Westerhoff and F.S. Busschers, 2012: Pleistocene Rhine-Thames landscapes: geological background for hominin occupation of the southern North Sea region, Journal of Quaternary Science 27(1), 17-39.
Hoek, W.Z., 1997: Palaeogeography of Lateglacial Vegetations. Aspects of Lateglacial and Early Holocene vegetation, abiotic landscape, and climate in The Netherlands, Utrecht/Amsterdam (Netherlands Geographical Studies 230).
Hoek, W.Z., 2008: The Last Glacial-Interglacial Transition, Episodes 31(2), 226-229.
Holden, T.G., J.G. Hather and J.P.N. Watson, 1995: Mesolithic plant exploitation at the Roc del Migdia, Catalonia, Journal of Archaeological Science 22(6), 769-778.
Holst, D., 2010: Hazelnut economy of early Holocene hunter-gatherers: a case study from Mesolithic Duvensee, northern Germany, Journal of Archaeological Science 37(11), 2871-2880.
Innes J.B. and J.J. Blackford, 2003: The Ecology of Late Mesolithic Woodland Disturbances: Model Testing with Fungal Spore Assemblage Data, Journal of Archaeological Science 30(2), 185-194.
Innes, J.B., J.J. Blackford and I.G. Simmons, 2010: Woodland disturbance and possible land-use regimes during the Late Mesolithic in the English uplands: pollen, charcoal and non-pollen palynomorph evidence from Bluewath Beck, North York Moors, UK, Vegetation History and Archaeobotany 19(5/6), 439-452.
Iregren, A.E. and S.G. Stenflo, 1982: An osteological and statistical attempt to interpret seasonal occupation of dwelling sites in Northern Sweden by studying the beaver (Castor fiber L.), Pact 7, 225-234.
Istomin, K.V. and M.J. Dwyer, 2009: Finding the Way: A Critical Discussion of Anthropological Theories of Human Spatial Orientation with Reference to Reindeer Herders of Northeastern and Western Siberia, Current Anthropology 50(1), 29-49.
Iversen J., 1944: Viscum, Hedera and llex as Climate Indicators, Geologiska Föreningen i Stockholm Förhandlingar 66(3), 463-483.
Janssen, C.R., 1973: Local and regional pollen deposition, in: H.J.B. Birks and R.G. West (eds), Quaternary Plant Ecology, Oxford, 31-42.
Janssen, C.R., 1974: Verkenningen in de palynologie, Utrecht.
Janssen, C.R., 1981: On the reconstruction of past vegetation by pollen analysis: a review, Proceedings of the Koninklijke Nederlandse Akademie van Wetenschappen 84, 197-210.

339
Janssen, C.R. and T.E. Törnqvist, 1991: The role of scale in the biostratigraphy and chronostratigraphy of the Holocene Series in The Netherlands, The Holocene 1(2), 112-120.
Janssens, M.M., C. Kasse, S.J.P. Bohncke, H. Greaves, K.M. Cohen, J. Wallinga and W.Z. Hoek, 2012: Climate-driven fluvial development and valley abandonment at the last glacial-interglacial transition (Oude IJssel-Rhine, Germany), Netherlands Journal of Geosciences - Geologie en Mijnbouw 91(1/2), 37-62.
Jelgersma, S.,1961: Holocene Sea Level Changes in the Netherlands, Den Haag (Mededelingen Geologische Stichting CVI-7).
Jelgersma, S., 1979: Sea-level changes in the North Sea Basin, in: E. Oele, R.T.E. Schüttenhelm and A.J. Wiggers (eds), The Quaternary history of the North Sea, Uppsala (Acta Universitatis Upsaliensis. Symposia Universitatis Upsaliensis Annum Quingentesimum Celebrantis 2), 233-248.
Johansen, L., M.J.L.Th. Niekus and D. Stapert, 2009: Zwarte vuurstenen uit het Midden-Paleolithicum in Nederland, Paleo-aktueel 20, 1-8.
Jordan, P. (ed.), 2012: Landscape and Culture in Northern Eurasia, Walnut Creek.
Kappel, K. van and R.P. Exaltus, 2013: Bodemmicromorfologisch onderzoek Yangtzehaven te Rotterdam, Amersfoort (ADC-rapport 3421).
Kasse, C., W.Z. Hoek, S.J.P. Bohncke, M. Konert, J.W.H. Weijers, M.L. Cassee and R.M. van der Zee, 2005: Late Glacial fluvial response of the Niers-Rhine (western Germany) to climate and vegetation change, Journal of Quaternary Science 20(4), 377-394.
Kelly, R.L., 1995: The Foraging Spectrum. Diversity in Hunter-Gatherer Lifeways, Washington.
Kolfschoten, Th. van and H. van Essen, 2004: Palaeozoological heritage from the bottom of the North Sea, in: N.C. Flemming (ed.), Submarine prehistoric archaeology of the North Sea. Research priorities and collaboration with Industry, York (CBA Research Report 141), 70-80.
Konert, M., 2002: Pollen Preparation Method, Amsterdam (internal report VU University Amsterdam).
Kooistra, L.I. and L. Kubiak-Martens, 2012: Yangtzehaven, voorstellen voor uitwerking botanische materialen, Zaandam (internal report BIAX Consult).
Kruyk, H. de, 2009: Verwering van vuursteen, Grondboor en Hamer 63(5), 129-133.
Kruyk, H. de and J. Timmner, 2014: New insights into tabular and red Heligoland flint by means of thin sections and SEM/EDX analyses/Neue Erkenntnisse zum Helgoländer Plattenflint und roten Helgoländer Flint durch den Einsatz von Dünnschliffen und SEM/EDX-Analysen, Siedlungs- und Küstenforschung im südlichen Nordseegebiet/Settlement and Coastal Research in the Southern North Sea Region 37, 45-58.
Kubiak-Martens, L., 1999: The plant food component of the diet at the late Mesolithic (Ertebølle) settlement at Tybrind Vig, Denmark, Vegetation History and Archaeobotany 8(1/2), 117-127.
Kubiak-Martens, L., 2002: New evidence for the use of root foods in pre-agrarian subsistence recovered from the late Mesolithic site at Halsskov, Denmark, Vegetation History and Archaeobotany 11(1/2), 23-32.

340
Kubiak-Martens, L., 2011a: Voedseleconomie: parenchym en andere plantaardige macroresten, in: E. Lohof, T. Hamburg and J.P. Flamman (eds), Steentijd opgespoord. Archeologisch onderzoek in het tracé van de Hanzelijn-Oude Land, Leiden/Amersfoort (Archol-rapport 138 and ADC-rapport 2576), 465-481.
Kubiak-Martens, L., 2011b: Het macrorestenonderzoek, in: G. Noens (ed.), Een afgedekt Mesolithisch nederzettingsterrein the Hempens/N31 (Gemeente Leeuwarden, Provincie Friesland, NL.). Algemeen kader voor de studie van een lithische vindplaats, Gent (Archaeological Reports Ghent University 7), 231-241.
Kubiak-Martens, L. and K. Tobolski, 2008: Plants in hunter-gatherer subsistence in the middle Vistula river valley at Całowanie (Poland) in the late Pleistocene and early Holocene, in: Z. Sułgostowska and A.J. Tomaszewski (eds), Man-Millennia-Environment. Studies in honor of Romuald Schild, Warsaw, 87-98.
Kuhnlein, H.V. and N.J. Turner, 1991: Traditional Plant Foods of Canadian Indigenous Peoples: Nutrition, Botany and Use, Philadelphia (Food and Nutrition in History and Anthropology 8).
Kuneš, P., P. Pokorný and P. Šída, 2008: Detection of the impact of early Holocene hunter-gatherers on vegetation in the Czech Republic, using multivariate analysis of pollen data, Vegetation History and Archaeobotany 17(3), 269-287.
Lammers-Keijsers, Y.M.J., A. Verbaas, A.L. van Gijn and D. Pomstra, in preparation: Arrowheads without traces: not used, perfect hit or excessive hafting material?, in Anonymous, Conference Proceedings of Use-Wear 2012. International Conference on Use-Wear Analysis, Faro, Portugal.
Law, C., 1998: The Uses and Fire-ecology of Reedswamp Vegetation, in: P. Mellars and P. Dark (eds), Star Carr in Context. New Archaeological and Palaeoecological Investigations at the Early Mesolithic site of Star Carr, North Yorkshire, Cambridge, 197-206.
Leacock, E.B., 1969: The Montagnais-Naskapi Band, in: D. Damas (ed.): Contributions to Anthropology: Band Societies, Ottawa, 1-18.
Louwe Kooijmans, L.P., 1971: Mesolithic Bone and Antler Implements from the North Sea and from the Netherlands, Berichten van de Rijksdienst voor het Oudheidkundig Bodemonderzoek 20/21, 27-73.
Louwe Kooijmans, L.P. (ed.), 2001a: Archeologie in de Betuweroute. Hardinxveld-Giessendam Polderweg. Een mesolithisch jachtkamp in het rivierengebied (5500-5000 v. Chr.), Amersfoort (Rapportage Archeologische Monumentenzorg 83).
Louwe Kooijmans, L.P. (ed.), 2001b: Archeologie in de Betuweroute. Hardinxveld-Giessendam De Bruin. Een kampplaats uit het Laat-Mesolithicum en het begin van de Swifterbant-cultuur (5500-4450 v. Chr.), Amersfoort (Rapportage Archeologische Monumentenzorg 88).
Louwe Kooijmans, L.P., K. Hänninen and C.E. Vermeeren, 2001: Artefacten van hout, in: L.P. Louwe Kooijmans (ed.), Archeologie in de Betuweroute. Hardinxveld-Giessendam De Bruin. Een kampplaats uit het Laat-Mesolithicum en het begin van de Swifterbant-cultuur (5500-4450 v. Chr.), Amersfoort (Rapportage Archeologische Monumentenzorg 88), 435-477.
Louwe Kooijmans, L.P. and M. Nokkert, 2001: Sporen en structuren, in: L.P. Louwe Kooijmans (ed.), Archeologie in de Betuweroute. Hardinxveld-Giessendam De Bruin. Een kampplaats uit het Laat-Mesolithicum en het begin van de Swifterbant-cultuur (5500-4450 v. Chr.), Amersfoort (Rapportage Archeologische Monumentenzorg 88), 75-115.

341
Louwe Kooijmans, L.P., C.E. Vermeeren and A.M.I. van Waveren, 2001: Artefacten van hout en vezels, in: L.P. Louwe Kooijmans (ed.), Archeologie in de Betuweroute. Hardinxveld-Giessendam Polderweg. Een mesolithisch jachtkamp in het rivierengebied (5500-5000 v. Chr.), Amersfoort (Rapportage Archeologische Monumentenzorg 83), 379-418.
Louwe Kooijmans, L.P., P.W. van den Broeke, H. Fokkens and A.L. van Gijn (eds), 2005: Nederland in de prehistorie, Amsterdam.
Lovis, W.A. and R.E. Donahue, 2011: Space, Information and Knowledge: Ethnocartography and North American Boreal Forest Hunter-Gatherers, in: R. Whallon, W.A. Lovis and R.K. Hitchcock (eds), Information and its Role in Hunter-Gatherer Bands, Santa Fe (Ideas Debates and Perspectives 5), 59-84.
Ludwig, A., L. Debus, D. Lieckfeldt, I. Wirgin, N. Benecke, I. Jenneckens, P. Williot, J.R. Waldman and C. Pitra, 2002: Fish populations: When the American sturgeon swam east, Nature 419(6906), 447-448.
Ludwig, A., D. Makowiecki and N. Benecke, 2009: Further evidence of trans-Atlantic colonization of Western Europe by American Atlantic sturgeons, Archaeofauna 18, 185-192.
Magnin, E., 1962: Recherches sur la systématique et la biologie des Acipensérides, Acipenser sturio L., Acipenser oxyrhynchus Mitchill et Acipenser fulvescens Raf., Annales de la Station Centrale d’Hydrobiologie Appliquée 9, 7-242.
Manders, M.R., A.D.C. Otte-Klomp, J.H.M. Peeters and P. Stassen, 2008: Wetenschappelijk kader voor de archeologische monumentenzorg bij de aanleg van de tweede Maasvlakte, Europoort-Rotterdam, Amersfoort (Rapportage Archeologische Monumentenzorg 169).
Mariezkurrena, K., 1983: Contribución al conocimiento del desarrollo de la dentición y el esqueleto postcraneal de Cervus elaphus, Munibe 35 (3/4), 149-202.
Mason, S.L.R., 1995: Acornutopia? Determining the Role of Acorns in Past Human Subsistence, in: J. Wilkins, D. Harvey and M.J. Dobson (eds), Food in Antiquity, Exeter, 12-24.
Mason, S.L.R., 2000: Fire and Mesolithic subsistence - Managing oaks for acorns in northwest Europe?, Palaeogeography, Palaeoclimatology, Palaeoecology 164(1/4), 139-150.
Mason, S.L.R. and J.G. Hather, 2000: Parenchymatous plant remains from Staosnaig, in: S. Mithen (red), Hunter-gatherer landscape archaeology. The Southern Hebrides Mesolithic Project 1988-1998, Cambridge (McDonald Institute Monographs), 415-425.
Mason, S.L.R., J.G. Hather and G.C. Hillman, 2002: The archaeobotany of European hunter-gatherers: some preliminary investigations, in: S.L.R. Mason and J.G. Hather (eds), Hunter-Gatherer Archaeobotany. Perspectives from the Northern Temperate zone, Londen, 188-196.
Mears, R. and G.C. Hillman, 2007: Wild food, Londen.
Meijden, R. van der, 1996: Heukels’ Flora van Nederland, Groningen.
Mellars, P., 1976, Fire ecology, animal populations and man: a study of some ecological relationships in prehistory, Proceedings of the Prehistoric Society 42, 15-45.
Mellars, P. and P. Dark (eds), 1998: Star Carr in Context. New Archaeological and Palaeoecological Investigations at the Early Mesolithic site of Star Carr, North Yorkshire, Cambridge.

342
Mellett, C.L., D.M. Hodgson, A.J. Plater, B. Mauz, I. Selby and A. Lang, 2013: Denudation of the continental shelf between Britain and France at the glacial-interglacial timescale, Geomorphology 203, 79-96.
Ménot, G., E. Bard, F. Rostek, J.W.H. Weijers, E.C. Hopmans, S. Schouten, J.S.S. Damsté, 2006: Early Reactivation of European Rivers During the Last Deglaciation, Science 313(5793), 1623-1625.
Metcalfe, S.E., S. Ellis, B.P. Horton, J.B. Innes, J. McArthur, A. Mitlehner, A. Parkes, J.S. Pethick, J. Rees, J. Ridgway, M.M. Rutherford, I. Shennan and M.J. Tooley, 2000: The Holocene evolution of the Humber Estuary: reconstructing change in a dynamic environment, Geological Society, London, Special Publication 166, 97-118.
Mithen, S., N. Finlay, W. Carruthers, S. Carter and P. Ashmore, 2001: Plant Use in the Mesolithic: Evidence from Staosnaig, Isle of Colonsay, Scotland, Journal of Archaeological Science 28(3), 223-234.
Molen, J. van der and H.E de Swart, 2001: Holocene tidal conditions and tide-induced sand transport in the southern North Sea, Journal of Geophysical Research: Oceans (1978-2012) 106(C5), 9339-9362.
Momber, G., D. Tomalin, R. Scaife, J. Satchell and J. Gillespie (eds), 2011: Mesolithic Occupation at Bouldnor Cliff and the Submerged Prehistoric Landscapes of the Solent, York (CBA Research Report 164).
Moor, J.J.W. de, J.A.A. Bos, M.T.I.J. Bouman, C. Moolhuizen, R.P. Exaltus, F.P.A. Maartense and T.J.M. van der Linden, 2009: Definitief Archeologisch Onderzoek in het tracé van de Hanzelijn in het Nieuwe Land. Een interdisciplinaire geo-archeologische waardering van het begraven landschap van Oostelijk Flevoland, Delft.
Moore, P.D., J.A. Webb and M.E. Collinson, 1991: Pollen Analysis, Oxford.
Moree, J.M., A.V. Schoonhoven and M.C. van Trierum, 2010: Archeologisch onderzoek van het BOOR in het Maasmondgebied: archeologische kroniek 2001-2006, in: A. Carmiggelt, M.C. van Trierum and D.A. Wesselingh (eds), BOORbalans 6 Bijdragen aan de bewoningsgeschiedenis van het Maasmondgebied, Rotterdam, 77-240.
Moree, J.M., D.E.A. Schiltmans and P.C. Vos, 2012: Rotterdam Yangtzehaven. Plan van Aanpak uitwerking en rapportage: inventariserend veldonderzoek (fase 3) en gravend onderzoek (fase 4), Rotterdam (BOOR-PvA2012002).
Newell, R.R. and A.P.J. Vroomans, 1972: Automatic Artefact Registration and System for Archaeological Analysis with the Philips P1100 Computer: a Mesolithic Test Case, Oosterhout.
Newell, R.R., D. Kielman, T.S. Constandse-Westermann, W.A.B. van der Sanden and A.L. van Gijn, 1990: An Inquiry into the Ethnic Resolution of Mesolithic Regional Groups. The Study of Their Decorative Ornaments in Time and Space, Leiden.
Niekus. M.J.L.Th., 2006: A geographically referenced 14C database for the Mesolithic and the early phase of the Swifterbant Culture in the northern Netherlands, Palaeohistoria 47/48, 41-99.
Niekus, M.J.L.Th, 2012: Uitwerking lithisch materiaal Yangtzehaven Rotterdam, Groningen (internal report).
Niekus, M.J.L.Th., D.C. Brinkhuizen, A.A. Kerkhoven, J.J. Huisman and D.E.P. Velthuizen, 2012: An Early Atlantic Mesolithic site with micro-triangles and fish remains from Almere (the Netherlands), in: D.C.M. Raemaekers, E. Esser, R.C.G.M. Lauwerier and J.T. Zeiler (eds), A bouquet of archaeozoological studies. Essays in honour of Wietske Prummel, Groningen (Groningen Archaeological Studies 21), 61-78.

343
Niekus, M.J.L.Th., S. Knippenberg and I.I.J.A.L.M. Devriendt, 2012: Vuursteen, in: T. Hamburg, A. Müller and B. Quadflieg (eds), Mesolithisch Swifterbant. Mesolithisch gebruik van een duin ten zuiden van Swifterbant (8300-5000 v.Chr.). Een archeologische opgraving in het tracé van de N23/N307, provincie Flevoland, Leiden/Amersfoort (Archol-rapport 174 and ADC-rapport 3250), 157-241.
Nijssen, H. and S.J. de Groot, 1987: De vissen van Nederland, Utrecht.
Olsson, F., M.J. Gaillard, G. Lemdahl, A. Greisman, P. Lanos, D. Marguerie, N. Marcoux, P. Skoglund and J. Wäglind, 2010: A continuous record of the fire covering the last 10,500 calendar years from southern Sweden - The role of climate and human activities, Palaeogeography, Palaeoclimatology, Palaeoecology 291(1/2), 128-141.
Oorsouw, M.-F. van, 1993: Wommersom Revisited. Een analyse van de verspreiding en het gebruik van Wommersomkwartsiet in Nederland, Leiden (MA Thesis Leiden University).
Opbroek, M. and E. Lohof (eds), 2012: Tijd in centimeters. Een kijkje in het landschap van een dekzandrug te Almere. Een Inventariserend Veldonderzoek in de vorm van proefsleuven en een hoogwaardig booronderzoek, Amersfoort (ADC-rapport 2662).
Out, W.A., 2009: Sowing the seed? Human impact and plant subsistence in Dutch wetlands during the Late Mesolithic and Early and Middle Neolithic (5500-3400 cal BC), Leiden (Archaeological Studies Leiden University 18).
Oversteegen, J.F.S., L.H. van Wijngaarden-Bakker, R. Maliepaard and Th. van Kolfschoten, 2001: Zoogdieren, vogels, reptielen, in: L.P. Louwe Kooijmans (ed.), Archeologie in de Betuweroute. Hardinxveld-Giessendam De Bruin. Een kampplaats uit het Laat-Mesolithicum en het begin van de Swifterbant-cultuur (5500-4450 v. Chr.), Amersfoort (Rapportage Archeologische Monumentenzorg 88), 209-297.
Pals, J.P., B. van Geel and A. Delfos, 1980: Paleoecological studies in the Klokkeweel bog near Hoogkarspel (Province of Noord Holland), Review of Palaeobotany and Palynology 30, 371-418.
Pedersen, L., A. Fischer and B. Aaby (eds), 1997: The Danish Storebælt Since the Ice Age - Man, Sea and Forest, Copenhagen.
Peeters, J.H.M., 2007: Hoge Vaart-A27 in context: towards a model of Mesolithic-Neolithic land use dynamics as a framework for archaeological heritage management, Amersfoort (PhD Thesis University of Amsterdam).
Peeters, J.H.M., 2009a: ‘Occupation Continuity’ and ‘Behavioural Discontinuity’: Abrupt Changes in Forager Land-use at the Mid/Late Atlantic Boundary in the Flevoland Polders (The Netherlands), in: Ph. Crombé, M. Van Strydonck, J. Sergant, M. Boudin and M. Bats (eds), Chronology and Evolution within the Mesolithic of North-West Europe. Proceedings of an International Meeting, Brussels, May 30th-June 1st 2007, Cambridge, 693-708.
Peeters, J.H.M., 2009b: Early Holocene landscape dynamics and forager land-use diversity: the example of Hoge Vaart-A27 (Almere, The Netherlands), in: S.B. McCartan, R. Schulting, G. Warren and P. Woodman (eds): Mesolithic Horizons. Papers presented at the Seventh International Conference on the Mesolithic in Europe, Belfast 2005, Oxford, 269-276.
Peeters, J.H.M., J. Schreurs and S.M.J.P. Verneau, 2001: Deel 18. Vuursteen: typologie, technologische organisatie en gebruik, in: J.W.H. Hogestijn and J.H.M. Peeters (eds), De mesolithische en vroeg-neolithische vindplaats Hoge Vaart-A27 (Flevoland), Amersfoort (Rapportage Archeologische Monumentenzorg 79).
Peeters, J.H.M. and M.J.L.Th. Niekus, 2005: Het Mesolithicum in Noord-Nederland, in: J.H.C. Deeben, E. Drenth, M.-F. van Oorsouw and L.B.M. Verhart (eds), De steentijd van Nederland, Meppel (Archeologie 11/12), 201-234.

344
Peeters, J.H.M., P. Murphy and N.C. Flemming (eds), 2009: North Sea Prehistory Research and Management Framework (NSPRMF) 2009, Amersfoort.
Péquart, M., S.J. Péquart, M. Boule and H. Vallois, 1937: Téviec. Station-nécropole mésolithique du Morbihan, Paris.
Péquart, M. and S.J. Péquart, 1954: Hoëdic. Deuxième station-nécropole du mésolithique côtier Armoricain, Antwerpen.
Perry, D.W., 1997: The archaeology of hunter-gatherers: plant use in the Dutch Mesolithic, New York (PhD Thesis New York University).
Perry, D.W., 1999: Vegetative Tissues from Mesolithic Sites in the Northern Netherlands, Current Anthropology 40(2), 231-237.
Perry, D.W., 2002: Preliminary results of an archaeobotanical analysis of Mesolithic sites in the Veenkoloniën, Province of Groningen, the Netherlands, in: S.L.R. Mason and J.G. Hather (eds), Hunter-Gatherer Archaeobotany. Perspectives from the Northern Temperate zone, Londen, 108-116.
Plassche, O. van de, 1982: Sea-level change and water-level movements in the Netherlands during the Holocene, Amsterdam (PhD Thesis VU University Amsterdam).
Pons, L.J. and J. Bennema, 1958: De morfologie van het Pleistocene oppervlak in Westelijk Midden-Nederland, voor zover gelegen beneden gemiddeld zeeniveau (N.A.P), Tijdschrift van het Kon. Ned. Aard. Genootschap 75, 120-153.
Price, T.D., 1975: Mesolithic settlement systems in the Netherlands, Michigan (PhD Thesis University of Michigan).
Price, T.D., 1980: The Mesolithic of the Drents Plateau, Berichten van de Rijksdienst voor het Oudheidkundig Bodemonderzoek 30, 11-63.
Price, T.D., 1989: The reconstruction of Mesolithic diets, in: C. Bonsall (ed.), The Mesolithic in Europe. Papers Presented at the Third International Symposium, Edinburgh, 1985, Edinburgh, 48-59.
Projectgroep Archeologie AHR, 2003: Specificaties voor datastructuur en formulieren ten behoeve van Archeologische Monumentenzorg AHR-project.
Provincie Zuid-Holland, 2010: Provinciale Onderzoeksagenda Archeologie Zuid-Holland, Den Haag.
Punt, W. (ed.), 1976: The Northwest European Pollen Flora I, Amsterdam.
Punt, W. and G.C.S. Clarke (eds), 1980: The Northwest European Pollen Flora II, Amsterdam.
Punt, W. and G.C.S. Clarke (eds), 1981: The Northwest European Pollen Flora III, Amsterdam.
Punt, W. and G.C.S. Clarke (eds), 1984: The Northwest European Pollen Flora IV, Amsterdam.
Punt, W., S. Blackmore and G.C.S. Clarke (eds), 1988: The Northwest European Pollen Flora V, Amsterdam.
Punt, W. and S. Blackmore (eds), 1991: The Northwest European Pollen Flora VI, Amsterdam.
Punt, W., S. Blackmore and P.P. Hoen (eds), 1995: The Northwest European Pollen Flora VII, Amsterdam.

345
Punt, W., S. Blackmore and P.P. Hoen (eds), 2003: The Northwest European Pollen Flora VIII, Amsterdam.
Punt, W., S. Blackmore, P.P. Hoen and P.J. Stafford (eds), 2009: The Northwest European Pollen Flora IX, Amsterdam.
Quak, J., 1994: De visstand in stromende wateren, in: A.J.P. Raat (ed.), Vismigratie, visgeleiding en vispassages in Nederland, Nieuwegein, 59-84.
Regnell, M., 2012: Plant subsistence and environment at the Mesolithic site Tågerup, southern Sweden: new insights on the ‘’Nut Age’’, Vegetation History and Archaeobotany 21(1), 1-16.
Regnell, M., M.J. Gaillard, T.S. Bartholin and P. Karsten, 1995: Reconstruction of environment and history of plant use during the late Mesolithic (Ertebølle culture) at the inland settlement of Bökeberg III, southern Sweden, Vegetation History and Archaeobotany 4(2), 67-91.
Reid, C., 1913: Submerged forests, Cambridge.
Reimer, P.J., M.G.L. Baillie, E. Bard, A. Bayliss, J.W. Beck, P.G. Blackwell, C.B. Ramsey, C.E. Buck, G.S. Burr, R.L. Edwards, M. Friedrich, P.M. Grootes, T.P. Guilderson, I. Hajdas, T.J. Heaton, A.G. Hogg, K.A. Hughen, K.F. Kaiser, B. Kromer, F.G. McCormac, S.W. Manning, R.W. Reimer, D.A. Richards, J.R. Southon, S. Talamo, C.S.M. Turney, J. van der Plicht and C.E. Weyhenmeyer, 2009: IntCal09 and Marine09 Radiocarbon Age Calibration Curves, 0-50,000 Years cal BP, Radiocarbon 51(4), 1111-1150.
Rijsdijk, K.F., S. Passchier, H.J.T. Weerts, C. Laban, R.J.W. Van Leeuwen and J.H.J. Ebbing, 2005: Revised Upper Cenozoic stratigraphy of the Dutch sector of the North Sea Basin: towards an integrated lithostratigraphic, seismostratigraphic and allostratigraphic approach, Netherlands Journal of Geosciences - Geologie en Mijnbouw 84(2), 129-146.
Rogers, E.S., 1963: The hunting group - hunting territory complex among the Mistassini Indians, Ottawa.
Schaminée, J.H.J., E.J. Weeda and V. Westhoff, 1995: De vegetatie van Nederland, deel 2. Plantengemeenschappen van wateren, moerassen en natte heiden, Uppsala/Leiden.
Schaminée, J.H.J., A.H.F. Stortelder and E.J. Weeda, 1996: De vegetatie van Nederland, deel 3. Plantengemeenschappen van graslanden, zomen en droge heiden, Uppsala/Leiden.
Schiltmans, D.E.A., 2010: Rotterdam IJsselmonde ’t Hart. Een opgraving ter plaatse van het nieuwe stadshart van IJsselmonde (vindplaats 13-66), Rotterdam (BOORrapporten 424).
Schiltmans, D.E.A., 2012a: Rotterdam Yangtzehaven. Karterend inventariserend veldonderzoek, Rotterdam (evaluatierapport BOOR).
Schiltmans, D.E.A., 2012b: Rotterdam Yangtzehaven. Opgraving, Rotterdam (evaluatierapport BOOR).
Schiltmans, D.E.A., 2013: Rotterdam Groenenhagen-Tuinenhoven De Zwanen-Rietpark. Een opgraving van een vindplaats uit het Neolithicum op een rivierduin op IJsselmonde (vindplaats 13-78), Rotterdam (BOORrapporten 491).
Schiltmans, D.E.A. and A. van de Meer, 2014: Rotterdam Parkeergarage Kruisplein. Een verkennend inventariserend veldonderzoek in de vorm van een archeologische begeleiding door middel van grondboringen en profielwaarnemingen, Rotterdam (BOORrapporten 496).

346
Schweingruber, F.H., 1982: Mikroskopische Holzanatomie, Birmensdorf.
Schweingruber, F.H., 1990: Anatomie europäischer Hölzer, Stuttgart.
Serjeantson, D., 2009: Birds, Cambridge USA (Cambridge Manuals in Archaeology).
Shipman, P., G. Foster and M. Schoeninger, 1984: Burnt bones and teeth: an experimental study of colour, morphology, crystal structure and shrinkage, Journal of Archaeological Science 11(4), 307-325.
Siebelink, M., A.L. van Gijn, D. Pomstra, Y.M.J. Lammers-Keijsers and J.J. Langer, 2012: Gebruikssporenanalyse van vuursteen, in: T. Hamburg, A. Müller and B. Quadflieg (eds), Mesolithisch Swifterbant. Mesolithisch gebruik van een duin ten zuiden van Swifterbant (8300-5000 v.Chr.). Een archeologische opgraving in het tracé van de N23/N307, provincie Flevoland, Leiden/Amersfoort (Archol-rapport 174 and ADC-rapport 3250), 243-267.
Simmons, I.G., 1996: The Environmental Impact of Later Mesolithic Cultures. The Creation of Moorland Landscape in England and Wales, Edinburgh.
Smit, B.I., 2011: Programma van Eisen. Definitief veldonderzoek: uitvoer gravend onderzoek Yangtzehaven Rotterdam, Amersfoort.
Smit, B.I., 2012: Programma van Eisen. Uitwerking and rapportage veldonderzoek: steekboringen and seismisch onderzoek (fase 3) en gravend onderzoek Yangtzehaven Rotterdam, Amersfoort.
Smit, B.I. and H.J.T. Weerts, 2011: Programma van Eisen. Inventariserend veldonderzoek: karterend archeologisch onderzoek Yangtzehaven Rotterdam, Amersfoort.
Smits, E. and L.P. Louwe Kooijmans, 2001a: De menselijke skeletresten, in: L.P. Louwe Kooijmans (ed.), Archeologie in de Betuweroute. Hardinxveld-Giessendam Polderweg. Een mesolithisch jachtkamp in het rivierengebied (5500-5000 v. Chr.), Amersfoort (Rapportage Archeologische Monumentenzorg 83), 419-440.
Smits, E. and L.P. Louwe Kooijmans, 2001b: Menselijke skeletresten, in: L.P. Louwe Kooijmans (ed.), Archeologie in de Betuweroute. Hardinxveld-Giessendam De Bruin. Een kampplaats uit het Laat-Mesolithicum en het begin van de Swifterbant-cultuur (5500-4450 v. Chr.), Amersfoort (Rapportage Archeologische Monumentenzorg 88), 479-498.
Stafleu, J., D. Maljers, F.S. Busschers, J.L. Gunnink, J. Schokker, R.M. Dambrink, H.J. Hummelman and M.L. Schijf, 2012: GeoTop modellering, Utrecht (TNO-rapport R10991).
Stapert, D., 1976: Some natural surface modifications on flint in the Netherlands, Palaeohistoria 18, 7-41.
Stapert, D., 1986: The handaxe from Elahuizen (province of Friesland, the Netherlands); an exercise in interpreting secondary surface modifications, Helinium 26, 3-19.
Stapert, D., 1993: Paleolithicum (tot 9000 v.Chr.): Haerst, gem. Zwolle, in: A.D. Verlinde (ed.), Archeologische kroniek van Overijssel over 1992, Overijsselse Historische Bijdragen 108, 130-133.
Stockmarr, J., 1971: Tablets with Spores used in Absolute Pollen Analysis, Pollen et Spores 13(4), 615-621.
Stoel, P., 1991: Patina-onderzoek bij vuursteen, Archeologie 3, 50-53.
Stortelder, A.H.F., J.H.J. Schaminée and P.W.F.M. Hommel, 1999: De vegetatie van Nederland, deel 5. Plantengemeenschappen van ruigten, struwelen en bossen, Uppsala/Leiden.

347
Törnqvist, T.E. and M.P. Hijma, 2012: Links between early Holocene ice-sheet decay, sea-level rise and abrupt climate change, Nature Geoscience 5(9), 601-606.
Trolle-Lassen, T., 1987: Human exploitation of fur animals in Mesolithic Denmark: a case study, Archaeozoologia 1(2), 85-102.
Tsiopelas, N., 2010: Mesolithic bone and antler barbed points from Europoort. An experimental approach, Leiden (MA Thesis Leiden University).
Uehara, K., J.D. Scourse, K.J. Horsburgh, K. Lambeck and A.P. Purcell, 2006: Tidal evolution of the northwest European shelf seas from the Last Glacial Maximum to the present, Journal of Geophysical Research: Oceans (1978–2012) 111(C9), C09025.
Vandenberghe, J., 1995: Timescales, climate and river development, Quaternary Science Reviews 14(6), 631-638.
Van Neer, W., E, Thieren and D.C. Brinkhuizen, 2012: Identification of a 19th century sturgeon from North-East Friesland, in: D.C.M. Raemaekers, E. Esser, R.C.G.M. Lauwerier and J.T. Zeiler (eds), A bouquet of archaeozoological studies. Essays in honour of Wietske Prummel, Groningen (Groningen Archaeological Studies 21), 197-203.
Verbaas, A., in preparation: Barnsteen, in: Anonymous, Rapportage Hoep Noord.
Verbaas, A., M.J.L.Th. Niekus, A.L. van Gijn, S. Knippenberg, Y.M.J. Lammers-Keijsers and P.C. van Woerdekom, 2011: Vuursteen uit de Hanzelijn, in: E. Lohof, T. Hamburg and J.P. Flamman (eds), Steentijd opgespoord. Archeologisch onderzoek in het tracé van de Hanzelijn-Oude Land, Leiden/Amersfoort (Archol-rapport 138 and ADC-rapport 2576), 335-393.
Verhart, L.B.M.,1988: Mesolithic barbed points and other implements from Europoort, the Netherlands, Oudheidkundige Mededelingen uit het Rijksmuseum van Oudheden te Leiden 68, 145-194.
Verhart, L.B.M., 1995: Fishing for the Mesolithic. The North Sea, a submerged Mesolithic landscape, in: A. Fischer (ed.), Man and Sea in the Mesolithic. Coastal settlement above and below present sea level, Oxford (Oxbow Monograph 53), 291-302.
Verhart, L.B.M., 2004: The implications of prehistoric finds on and off the Dutch coast, in: N.C. Flemming (ed.), Submarine prehistoric archaeology of the North Sea. Research priorities and collaboration with Industry, York (CBA Research Report 141), 57-61.
Verhart, L.B.M. and N. Arts, 2005: Het Mesolithicum in Zuid-Nederland, in: J.H.C. Deeben, E. Drenth, M.-F. van Oorsouw and L.B.M. Verhart (eds), De steentijd van Nederland, Meppel (Archeologie 11/12), 235-260.
Verhart, L.B.M. and H.A. Groenendijk, 2005: Leven in overvloed. Midden- en laat-mesolithicum, in: L.P. Louwe Kooijmans, P.W. van den Broeke, H. Fokkens and A.L. van Gijn (eds), Nederland in de prehistorie, Amsterdam, 161-178.
Verneau, S.M.J.P., 1999: Een Mesolithisch jachtkamp te Zutphen. 8000 jaar voor Christus: jagers-verzamelaars in de Ooyerhoek, Zutphen (Lithos-rapport 1).
Vos, P.C., 2012: Geologische en archeolandschappelijke eindrapportage fase 3 Yangtzehaven project, Utrecht (internal report Deltares).
Vos, P.C., 2013: Geologisch en paleolandschappelijk onderzoek Yangtzehaven (Maasvlakte, Rotterdam). Toegepast geoarcheologisch onderzoek ten behoeve van de archeologische prospectie in Vroeg Holocene deltaïsche afzettingen van Rijn en Maas in het Maasvlaktegebied, Utrecht (Deltares-rapport 1206788-000-BGS-0001).

348
Vos, P. C. and J.G.A. Bazelmans, 2002: De geogenetische aanpak: gericht prospectief archeologisch onderzoek op geologisch laagniveau, Archeologische Monumentenzorg - Nieuwsbrief van de Rijksdienst voor het Oudheidkundig Bodemonderzoek 2, 28-29.
Vos, P.C. and S. de Vries, 2007: Geologisch vooronderzoek Papegaaibekhaven en Kop van Beer, Utrecht (TNO-rapport 2007-U-R1164/B).
Vos, P.C., M. van den Berg, D. Maljers and S. de Vries, 2009: Geoarcheologische bureaustudie ten behoeve van het Yangtzehavenproject (1e onderzoeksfase in het verkennend inventariserend veldonderzoek), Utrecht (Deltares-rapport 0906-0193).
Vos, P.C., M. van den Berg, F.P.M. Bunnik, H. Cremer, M. de Kleine, D. Maljers and C. Mesdag, 2010a: Geoarcheologisch inventariserend veldonderzoek van het Yangtzehaven project (verkennende fase 2), Utrecht (Deltares-rapport 1201894-000-BGS-0003).
Vos, P.C., F.P.M. Bunnik, H. Cremer and F.M. Hennekam, 2010b: Paleolandschappelijk onderzoek Papengaaienbek en Kop van Beer. Geobotanisch en 14C-onderzoek van monsters genomen uit vroeg Holocene delta-afzettingen in het gebied Papengaaienbek en Kop van Beer (Maasvlakte, Rotterdam). Geologisch vooronderzoek Papegaaibekhaven en Kop van Beer, Utrecht (Deltares-rapport 1201910-000-BGS-0001).
Vos, P.C., J.G.A. Bazelmans, H.J.T. Weerts and M.J. van der Meulen (eds), 2011: Atlas van Nederland in het Holoceen. Landschap en bewoning vanaf de laatste ijstijd tot nu, Amsterdam.
Vries, F. de, L. Postma, M. Postma, M.J.L.Th. Niekus, H. Paas, H. de Kruijk and J. Timmner, 2012: IJzer als echtheidstoets - De omstreden Vermaning-artefacten: vervalsingen of niet? (with English summary), in: M.J.L.Th. Niekus, R.N.E. Barton, M. Street and Th. Terberger (eds), A mind set on flint. Studies in honour of Dick Stapert, Groningen (Groningen Archaeological Studies 16), 457-472.
Vries, S. de, 2011a: Boorbeschrijvingen Yangtzehaven-Oost, Utrecht (Deltares-rapport 1204743-000-BGS-0013).
Vries, S. de, 2011b: Boorbeschrijvingen Yangtzehaven-West, Utrecht (Deltares-rapport 1204743-000-BGS-0014).
Waddington, C. (ed.), 2007: Mesolithic Settlement in the North Sea Basin. A Case Study from Howick, North-East England, Oxford.
Wallinga, J. and A.J. Versendaal, 2014: Luminescentiedateringsrapport Yangtzehaven, Wageningen (NCL-7612).
Weeda, E.J., R. Westra, Ch. Westra and T. Westra, 1985: Nederlandse oecologische flora. Wilde planten en hun relaties 1, Deventer.
Weeda, E.J., R. Westra, Ch. Westra and T. Westra, 1987: Nederlandse oecologische flora. Wilde planten en hun relaties 2, Deventer.
Weeda, E.J., R. Westra, Ch. Westra and T. Westra, 1988: Nederlandse oecologische flora. Wilde planten en hun relaties 3, Deventer.
Weeda, E.J., R. Westra, Ch. Westra and T. Westra, 1991: Nederlandse oecologische flora. Wilde planten en hun relaties 4, Deventer.
Weeda, E.J., R. Westra, Ch. Westra and T. Westra, 1994: Nederlandse oecologische flora. Wilde planten en hun relaties 5, Deventer.
Weninger, B., R. Schulting, M. Bradtmöller, L. Clare, M. Collard, K. Edinborough, J. Hilpert, O. Jöris, M.J.L.Th Niekus, E.J. Rohling and B. Wagner, 2008: The catastrophic flooding of Doggerland by the Storegga Slide tsunami, Documenta Praehistorica 35, 1-24.

349
Westerhoff, W.E., T.E. Wong and E.F.J. de Mulder, 2003: Opbouw van de ondergrond, in: E.F.J. de Mulder, M.C. Geluk, I.L. Ritsema, W.E. Westerhoff and T.E. Wong (eds), De ondergrond van Nederland, Groningen/Houten, 247-352.
Whallon, R., 2011: An Introduction to Information and its Role in Hunter-Gatherer Band-Level Societies, in: R. Whallon, W.A. Lovis and R.K. Hitchcock (eds), Information and its Role in Hunter-Gatherer Bands, Santa Fe (Ideas Debates and Perspectives 5), 1-28.
Wijngaarden-Bakker, L.H. van and C.H. Maliepaard, 1982: Leeftijdsbepaling aan het skelet van het wilde zwijn Sus scrofa Linnaeus, 1758, Lutra 25, 30-37.
Wijngaarden-Bakker, L.H. van, C. Cavallo, Th. van Kolfschoten, C.H. Maliepaard and J.F.S. Oversteegen, 2001: Zoogdieren, vogels, reptielen, in: L.P. Louwe Kooijmans (ed.), Archeologie in de Betuweroute. Hardinxveld-Giessendam Polderweg. Een mesolithisch jachtkamp in het rivierengebied (5500-5000 v. Chr.), Amersfoort (Rapportage Archeologische Monumentenzorg 83), 181-242.
Wijngaarden-Bakker, L.H. van and K.D. Troostheide, 2003: Bones and Eggs. The Archaeological Presence of the Grass Snake Natrix natrix (L.) in The Netherlands, Environmental Archaeology 8(2), 111-118.
Woldring, H., M. Schepers, J. Mendelts and R. Fens, 2012: Camping and foraging in Boreal hazel woodland. The environmental impact of Mesolithic hunter-gatherers near Groningen, the Netherlands, in: M.J.L.Th. Niekus, R.N.E. Barton, M. Street and Th. Terberger (eds), A mind set on flint. Studies in honour of Dick Stapert, Groningen (Groningen Archaeological Studies 16), 381-392.
Woude, J.D. van der, 1983. Holocene paleoenvironmental evolution of a perimarine fluviatile area. Geology and paleobotany of the area surrounding the archaeological excavation at the Hazendonk river dune (Western Netherlands), Leiden (Analecta Praehistorica Leidensia 16).
Woude, J.D. van der, 1984: The fluviolagoonal palaeoenvironment in the Rhine/Meuse deltaic plain, Sedimentology 31(3), 395-400.
Zagwijn, W.H., 1994: Reconstruction of climate change during the Holocene in western and central Europe based on pollen records of indicator species, Vegetation History and Archaeobotany 3(2), 65-88.
Zeiler, J.T., 1988: Age determination based on epiphyseal fusion in post-cranial bones and tooth wear in otters (Lutra lutra), Journal of Archaeological Science 15(5), 555-561.
Zeiler, J.T., 1997: Hunting, fowling and stock-breeding at Neolithic sites in the western and central Netherlands, Groningen (PhD Thesis University of Groningen).
Zeiler, J.T., 2006: Mammals, in: L.P. Louwe Kooijmans and P.F.B. Jongste (eds), Schipluiden. A Neolithic settlement on the Dutch North Sea coast c. 3500 cal BC, Leiden (Analecta Praehistorica Leidensia 37/38), 375-420.
Zeiler, J.T., 2012: Onderzoek dierlijke resten Yangtzehaven Rotterdam, Haren (internal report ArchaeoBone).
Zeiler, J.T., D.C. Brinkhuizen and D.L. Bekker, 2007: Niet bij vee alleen. Archeozoölogisch onderzoek van de Vroege Bronstijdvindplaats Hoep Noord te Schagen, Leeuwarden (ArchaeoBone-rapport 54 and internal report Archeologische Werkgroep “Kop van Noord-Holland”).
Zijl, W., M.J.L.Th. Niekus, P.H.J.I. Ploegaert and J.M. Moree, 2011: Rotterdam Beverwaard Tramremise. De opgraving van de top van een donk met sporen uit het Mesolithicum en Neolithicum (vindplaats 13-83), Rotterdam (BOORrapporten 439).

350
Zonneveld, I., 2013: Helinium. Maas, Rijn- en Striene-estuarium, de bakermat van Holland, Vakblad natuur bos landschap 1(2013), 32-36.
Zvelebil, M., 1994: Plant Use in the Mesolithic and its Role in the Transition to Farming, Proceedings of the Prehistoric Society 60, 35-74.
Other sources
Bronk Ramsey, C., 2013: OxCal v.4.2 software, Oxford.
Cohen, K.M., E. Stouthamer, H.J. Pierik and A.H. Geurts, 2012: Digitaal Basisbestand Paleogeografie van de Rijn-Maas Delta/Rhine-Meuse Delta Studies’ Digital Basemap for Delta Evolution and Palaeogeography, Utrecht (http://persistent-identifier.nl/?identifier=urn:nbn:nl:ui:13-nqjn-zl).
Grimm, E.C., 1992-2004: Tilia, Tilia-Graph and TGView, Springfield.
http://flora.nhm-wien.ac.at/Seiten-Arten/Nuphar-lutea.htm
http://www.agefotostock.com/en/Stock-Images/Rights-Managed/BWI-BLW042551
http://www.boga.ruhr-uni-bochum.de/html/Trapa_natans_Foto.html
http://www.dinoloket.nl
http://www.dinoloket.nl/nomenclator-ondiep
http://www.floraplanta.nl/bomenenheesters/images/meidoorn.jpg
http://my.gardenguides.com
https://www.kuleuven-kulak.be/kulakbiocampus/images/bomen-heesters/Cornus%20sanguinea%20-%20Rode%20kornoelje/index.htm
http://www.splashcos.org
Richardson, B. and T. Lanzelo, 1974: Cree Hunters of Mistassini, Montreal (http://www.nfb.ca/film/cree_hunters).
Copyright © 2022 FDOKUMEN


![[Working paper] The Political Squatters' Movement and Its Social Centres in the Gentrifying City of Rotterdam](https://static.fdokumen.com/doc/165x107/6331ad15b6829c19b80b9ad4/working-paper-the-political-squatters-movement-and-its-social-centres-in-the.jpg)