The Effects of Resolution on Users Playing First Person ...
12
The Effects of Resolution on Users Playing First Person Shooter Games Kajal Claypool a and Mark Claypool b a Oracle, Nashua, NH, USA b Worcester Polytechnic Institute, Worcester, MA, USA ABSTRACT Computer games are often played on devices with varying display resolutions. While higher resolutions generally provide more immersive game play they can yield reduced frame rates and/or increased costs, making choosing the optimal reso- lution important. Despite this importance, to the best of our knowledge, there has been no extensive study of the effects of resolution on users playing computer games. This paper presents results from extensive user studies measuring the impact of resolution on users playing First Person Shooter games. The studies focus on the effects of resolution in conjunction with low and high contrast virtual environments, full screen and windowed modes and identification of long-range objects. Analysis indicates resolution has little impact on performance over the range of conditions tested and only matters when the objects being identified are far away or small and are reduced to too few pixels to be distinguishable. 1. INTRODUCTION The growth in the capabilities of computer hardware has enabled compelling computer games to run on hardware from desktop PCs with powerful graphics down to mobile and hand-held devices designed specifically for games. Because of the cost of game development, a triple-A game will often be released for several platforms with a variety of display capabilities, from large screen plasma displays to small, limited color screens. Even games released only for PCs must be effective over several generations of processor power and graphics card capabilities. Game players, and computer users in general, are constantly pushing for higher display resolutions. Higher resolutions provide the opportunity for finer levels of detail that make a game virtual world more immersive and can provide infor- mation that helps with the game play. While maximizing the resolution may be desirable, higher resolutions often come at the expense of lower frame rates, making the game play less smooth and responsive. The diversity of gaming hardware exacerbates the problem, forcing game platform designers and game developers to combine the available capabilities of the hardware with an ad hoc understanding of the effects of resolution on game play in an effort to provide compelling computer games. Much of the intuition for the effects of resolution on games is based on studies of perceived quality for video. 1–3 These studies have examined the effects of resolution on users passively watching streaming video, and generally find that satisfaction with the video degrades sharply with a decrease in resolution. However, passively watching video does not have the same interaction requirements as does playing a computer game, and computer game players often care most about their performance in the game, not necessarily their perception of quality. Other studies 1, 4–7 have examined the effects of resolution on users actively engaged in an interactive media environment. These studies have generally found that resolution can affect performance, but is not as directly correlated to performance as resolution is for users passively watching video. However, even these more interactive applications do not have the same requirements in terms of response time as do computer games. Our previous work on the effects of display settings on computer games presented results from a user study that measured the impact of frame rate and resolution on user performance in a First Person Shooter (FPS) game. 8 Contrary to previous results for streaming video, display resolution was shown to have little impact on user performance. While the user study had a significantly large user base so as to be statistically meaningful, the study only tested the FPS game in a full screen mode with the opponent easily identified because of the high contrast map used in the study. This paper expands Further author information: Kajal Claypool: email - [email protected] Mark Claypool: email - [email protected], phone - 1 508 831 5409
-
Upload
khangminh22 -
Category
Documents
-
view
0 -
download
0
Transcript of The Effects of Resolution on Users Playing First Person ...
The Effects of Resolution on Users Playing First Person
Shooter Games
Kajal Claypoola and Mark Claypoolb
aOracle, Nashua, NH, USAbWorcester Polytechnic Institute, Worcester, MA, USA
ABSTRACT
Computer games are often played on devices with varying display resolutions. While higher resolutions generally providemore immersive game play they can yield reduced frame rates and/or increased costs, making choosing the optimal reso-lution important. Despite this importance, to the best of our knowledge, there has been no extensive study of the effects ofresolution on users playing computer games. This paper presents results from extensive user studies measuring the impactof resolution on users playing First Person Shooter games. The studies focus on the effects of resolution in conjunctionwith low and high contrast virtual environments, full screen and windowed modes and identification of long-range objects.Analysis indicates resolution has little impact on performance over the range of conditions tested and only matters whenthe objects being identified are far away or small and are reduced to too few pixels to be distinguishable.
1. INTRODUCTION
The growth in the capabilities of computer hardware has enabled compelling computer games to run on hardware fromdesktop PCs with powerful graphics down to mobile and hand-held devices designed specifically for games. Becauseof the cost of game development, a triple-A game will often be released for several platforms with a variety of displaycapabilities, from large screen plasma displays to small, limited color screens. Even games released only for PCs must beeffective over several generations of processor power and graphics card capabilities.
Game players, and computer users in general, are constantly pushing for higher display resolutions. Higher resolutionsprovide the opportunity for finer levels of detail that make a game virtual world more immersive and can provide infor-mation that helps with the game play. While maximizing the resolution may be desirable, higher resolutions often comeat the expense of lower frame rates, making the game play less smooth and responsive. The diversity of gaming hardwareexacerbates the problem, forcing game platform designers and game developers to combine the available capabilities ofthe hardware with an ad hoc understanding of the effects of resolution on game play in an effort to provide compellingcomputer games.
Much of the intuition for the effects of resolution on games is based on studies of perceived quality for video.1–3
These studies have examined the effects of resolution on users passively watching streaming video, and generally find thatsatisfaction with the video degrades sharply with a decrease in resolution. However, passively watching video does nothave the same interaction requirements as does playing a computer game, and computer game players often care mostabout their performance in the game, not necessarily their perception of quality. Other studies1, 4–7 have examined theeffects of resolution on users actively engaged in an interactive media environment. These studies have generally foundthat resolution can affect performance, but is not as directly correlated to performance as resolution is for users passivelywatching video. However, even these more interactive applications do not have the same requirements in terms of responsetime as do computer games.
Our previous work on the effects of display settings on computer games presented results from a user study thatmeasured the impact of frame rate and resolution on user performance in a First Person Shooter (FPS) game.8 Contraryto previous results for streaming video, display resolution was shown to have little impact on user performance. While theuser study had a significantly large user base so as to be statistically meaningful, the study only tested the FPS game in afull screen mode with the opponent easily identified because of the high contrast map used in the study. This paper expands
Further author information:Kajal Claypool: email - [email protected] Claypool: email - [email protected], phone - 1 508 831 5409
the range of the results with two additional user studies in evaluating the effects of resolution on user performance in FPSgames under constraints of low contrast, windowed mode and objects at greater virtual distances.
Results are presented for three carefully designed user studies investigating the effects of resolution on users playinga First Person Shooter (FPS) game, a popular game genre. Custom maps were designed to allow repeated measurementof user performance through the core aspects of FPS play – moving and shooting at an opponent. Test harnesses weredeveloped to first collect demographic data for each user, and then cycle through the custom maps with different resolu-tions, collecting performance data and user perceptions. Over one-hundred and twenty users participated in three sets ofexperiments, providing a large enough base for statistical significance for most of the data analyzed.
Analysis shows that user performance is remarkably insensitive to different resolutions for a range of game conditions.While users have more difficulty when constrained by low contrast or small windows, different resolutions in these condi-tions do not have a significant impact. In fact, resolution only affects performance for identification tasks when the numberof pixels used to represent the item is too small to have the object be discernible at a low resolution. This result is supportedby users’ own perception of the game playability under different resolutions. However, user assessment of the quality ofthe display does correlate with the resolution.
The results presented in this paper provide a thorough, quantitative understanding of the effects of resolution on theplayability of FPS games, making it useful for: (1) game players who need to be able to make informed decisions ongraphic card purchases and adjustments to game display settings; and (2) hardware developers, including those designinggraphics cards and small, resource-constrained devices to enable better targeting of hardware improvements to aspects ofthe display that matter.
The rest of this paper is as follows: Section 2 provides insights into the tested settings and expected performanceunder different resolutions; Section 3 details custom software and the experimental methodology used for the user studies;Section 4 analyzes the results from the user studies; Section 5 mentions some some selected related work; and Section 6summarizes our conclusions.
2. RESOLUTION AND GAMES
While the primary player actions in a FPS game are movement and shooting, a secondary player action is identificationthat often occurs along with shooting and movement. For example, for shooting, identification determines an opponentavatar among a group of avatars, or for movement, identification spots a power-up in a distant tunnel. Identification issuccessful if a player can accurately distinguish the artifact/adversary and act on the identification. A general assumptionis that resolution affects identification since resolution is directly correlated with the number of pixels used to represent theobjects being identified. However, our earlier work8 showed resolution to have little or no effect on a player’s performancein a First Person Shooter (FPS) game. This can perhaps be explained by the fact that the results were for identificationof a light colored opponent against a dark background with low resolutions expanded to the size of the monitor using fullscreen mode. The goal of this work is to expand previous test conditions and determine if resolution affects identificationand, hence, user performance, over a wider range of conditions: contrast (Section 2.1), display mode (Section 2.2) anddistance (Section 2.3).
2.1. Contrast
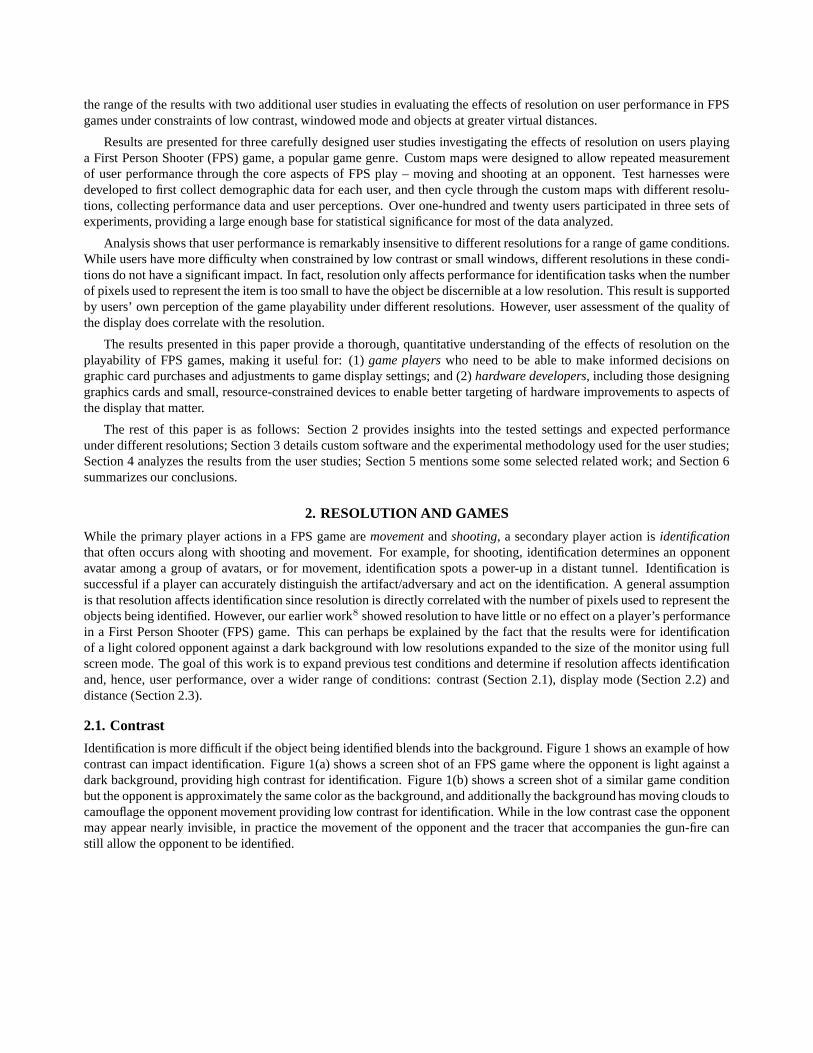
Identification is more difficult if the object being identified blends into the background. Figure 1 shows an example of howcontrast can impact identification. Figure 1(a) shows a screen shot of an FPS game where the opponent is light against adark background, providing high contrast for identification. Figure 1(b) shows a screen shot of a similar game conditionbut the opponent is approximately the same color as the background, and additionally the background has moving clouds tocamouflage the opponent movement providing low contrast for identification. While in the low contrast case the opponentmay appear nearly invisible, in practice the movement of the opponent and the tracer that accompanies the gun-fire canstill allow the opponent to be identified.
(a) High Contrast (b) Low Contrast
Figure 1. Visual Depiction of the Effects of Contrast
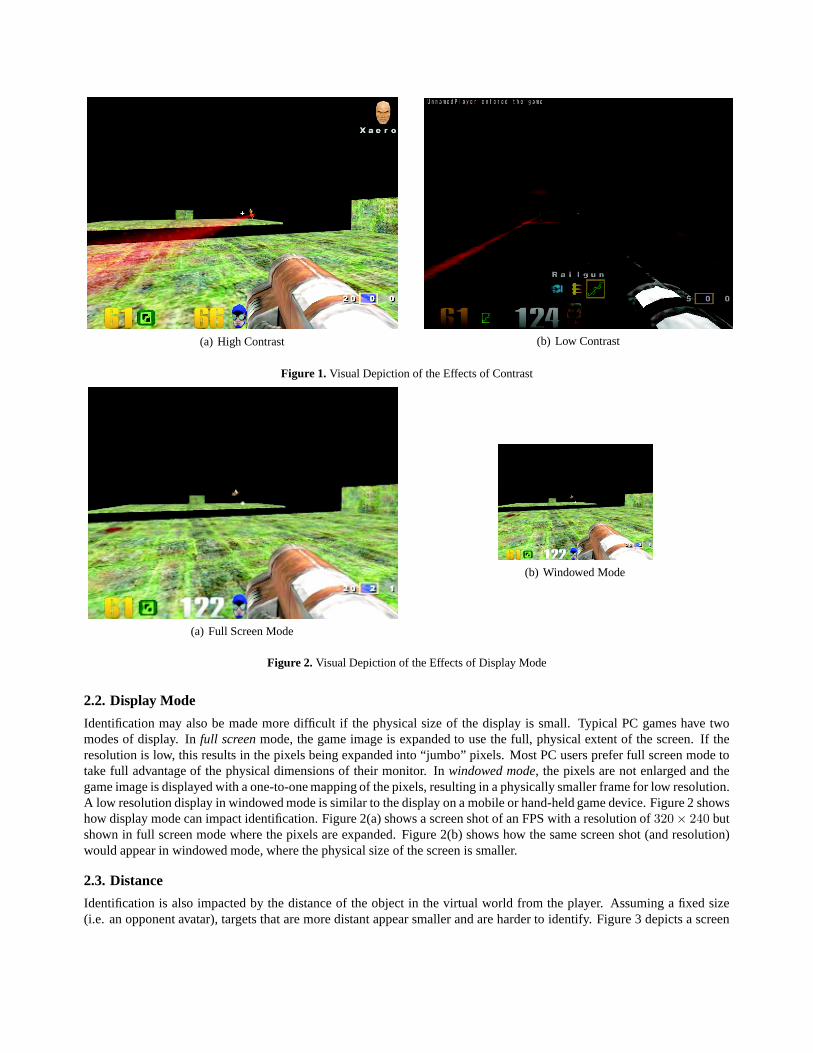
(a) Full Screen Mode
(b) Windowed Mode
Figure 2. Visual Depiction of the Effects of Display Mode
2.2. Display Mode
Identification may also be made more difficult if the physical size of the display is small. Typical PC games have twomodes of display. In full screen mode, the game image is expanded to use the full, physical extent of the screen. If theresolution is low, this results in the pixels being expanded into “jumbo” pixels. Most PC users prefer full screen mode totake full advantage of the physical dimensions of their monitor. In windowed mode, the pixels are not enlarged and thegame image is displayed with a one-to-one mapping of the pixels, resulting in a physically smaller frame for low resolution.A low resolution display in windowed mode is similar to the display on a mobile or hand-held game device. Figure 2 showshow display mode can impact identification. Figure 2(a) shows a screen shot of an FPS with a resolution of 320× 240 butshown in full screen mode where the pixels are expanded. Figure 2(b) shows how the same screen shot (and resolution)would appear in windowed mode, where the physical size of the screen is smaller.
2.3. Distance
Identification is also impacted by the distance of the object in the virtual world from the player. Assuming a fixed size(i.e. an opponent avatar), targets that are more distant appear smaller and are harder to identify. Figure 3 depicts a screen
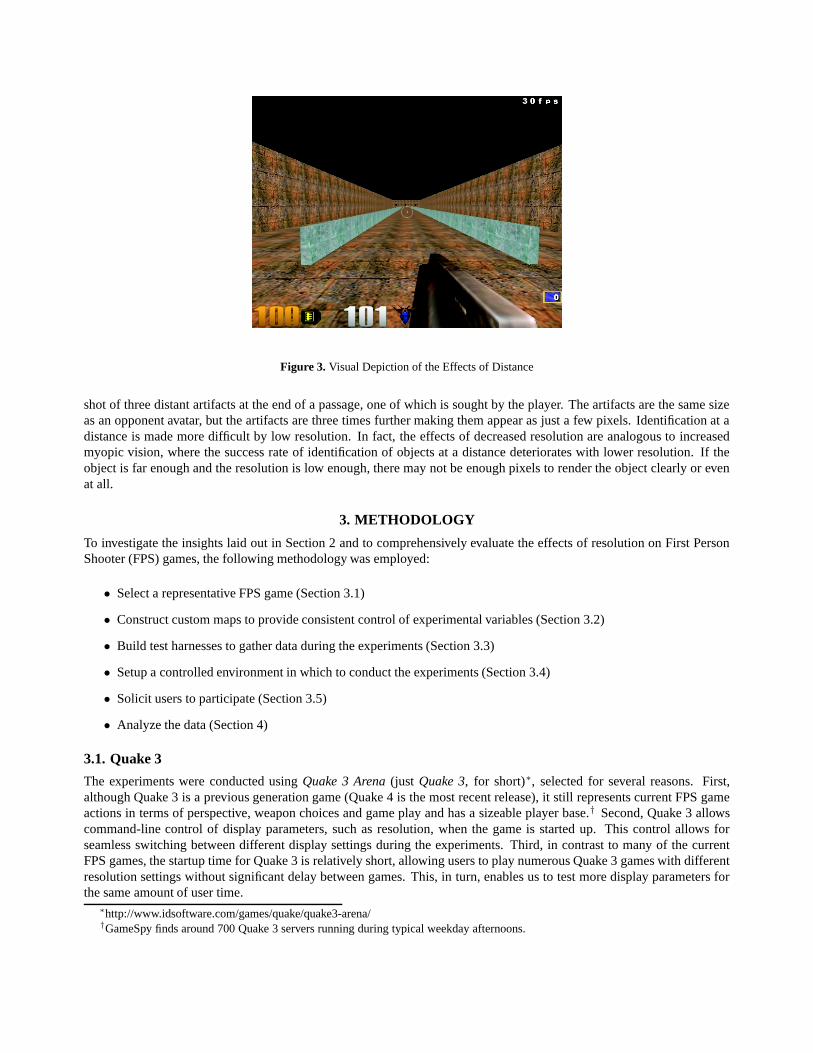
Figure 3. Visual Depiction of the Effects of Distance
shot of three distant artifacts at the end of a passage, one of which is sought by the player. The artifacts are the same sizeas an opponent avatar, but the artifacts are three times further making them appear as just a few pixels. Identification at adistance is made more difficult by low resolution. In fact, the effects of decreased resolution are analogous to increasedmyopic vision, where the success rate of identification of objects at a distance deteriorates with lower resolution. If theobject is far enough and the resolution is low enough, there may not be enough pixels to render the object clearly or evenat all.
3. METHODOLOGY
To investigate the insights laid out in Section 2 and to comprehensively evaluate the effects of resolution on First PersonShooter (FPS) games, the following methodology was employed:
• Select a representative FPS game (Section 3.1)
• Construct custom maps to provide consistent control of experimental variables (Section 3.2)
• Build test harnesses to gather data during the experiments (Section 3.3)
• Setup a controlled environment in which to conduct the experiments (Section 3.4)
• Solicit users to participate (Section 3.5)
• Analyze the data (Section 4)
3.1. Quake 3
The experiments were conducted using Quake 3 Arena (just Quake 3, for short)∗, selected for several reasons. First,although Quake 3 is a previous generation game (Quake 4 is the most recent release), it still represents current FPS gameactions in terms of perspective, weapon choices and game play and has a sizeable player base.† Second, Quake 3 allowscommand-line control of display parameters, such as resolution, when the game is started up. This control allows forseamless switching between different display settings during the experiments. Third, in contrast to many of the currentFPS games, the startup time for Quake 3 is relatively short, allowing users to play numerous Quake 3 games with differentresolution settings without significant delay between games. This, in turn, enables us to test more display parameters forthe same amount of user time.
∗http://www.idsoftware.com/games/quake/quake3-arena/†GameSpy finds around 700 Quake 3 servers running during typical weekday afternoons.
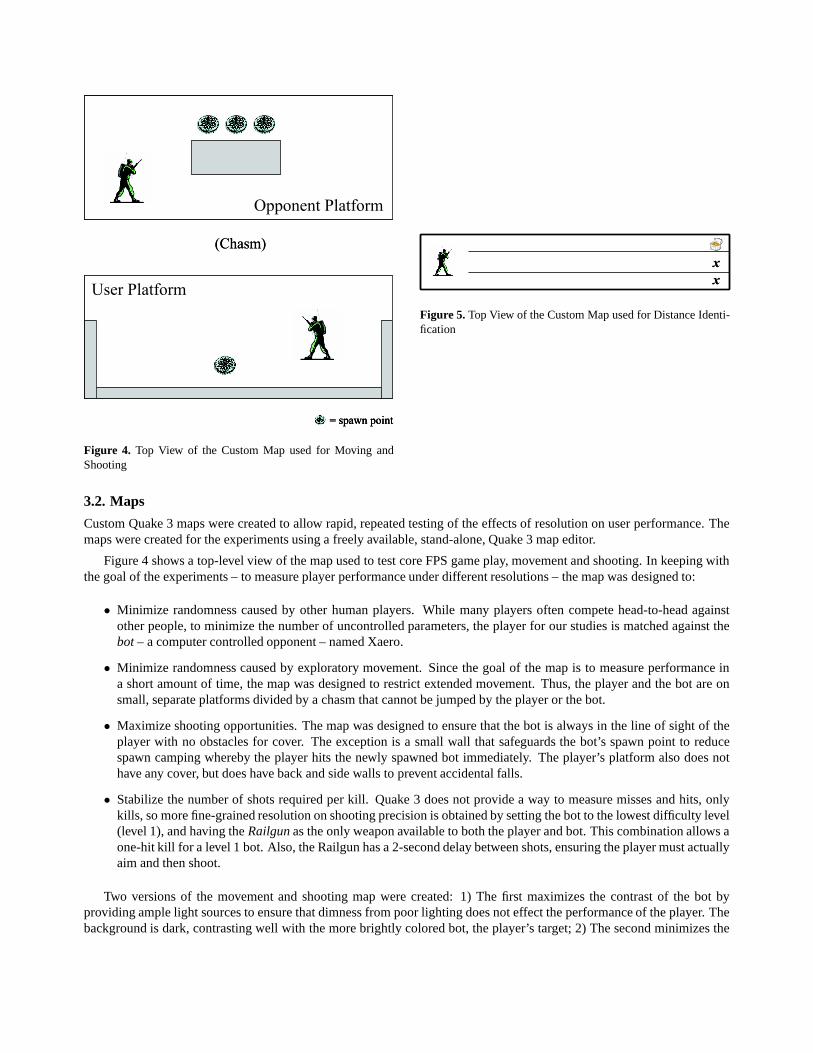
Figure 4. Top View of the Custom Map used for Moving andShooting
Figure 5. Top View of the Custom Map used for Distance Identi-fication
3.2. Maps
Custom Quake 3 maps were created to allow rapid, repeated testing of the effects of resolution on user performance. Themaps were created for the experiments using a freely available, stand-alone, Quake 3 map editor.
Figure 4 shows a top-level view of the map used to test core FPS game play, movement and shooting. In keeping withthe goal of the experiments – to measure player performance under different resolutions – the map was designed to:
• Minimize randomness caused by other human players. While many players often compete head-to-head againstother people, to minimize the number of uncontrolled parameters, the player for our studies is matched against thebot – a computer controlled opponent – named Xaero.
• Minimize randomness caused by exploratory movement. Since the goal of the map is to measure performance ina short amount of time, the map was designed to restrict extended movement. Thus, the player and the bot are onsmall, separate platforms divided by a chasm that cannot be jumped by the player or the bot.
• Maximize shooting opportunities. The map was designed to ensure that the bot is always in the line of sight of theplayer with no obstacles for cover. The exception is a small wall that safeguards the bot’s spawn point to reducespawn camping whereby the player hits the newly spawned bot immediately. The player’s platform also does nothave any cover, but does have back and side walls to prevent accidental falls.
• Stabilize the number of shots required per kill. Quake 3 does not provide a way to measure misses and hits, onlykills, so more fine-grained resolution on shooting precision is obtained by setting the bot to the lowest difficulty level(level 1), and having the Railgun as the only weapon available to both the player and bot. This combination allows aone-hit kill for a level 1 bot. Also, the Railgun has a 2-second delay between shots, ensuring the player must actuallyaim and then shoot.
Two versions of the movement and shooting map were created: 1) The first maximizes the contrast of the bot byproviding ample light sources to ensure that dimness from poor lighting does not effect the performance of the player. Thebackground is dark, contrasting well with the more brightly colored bot, the player’s target; 2) The second minimizes the
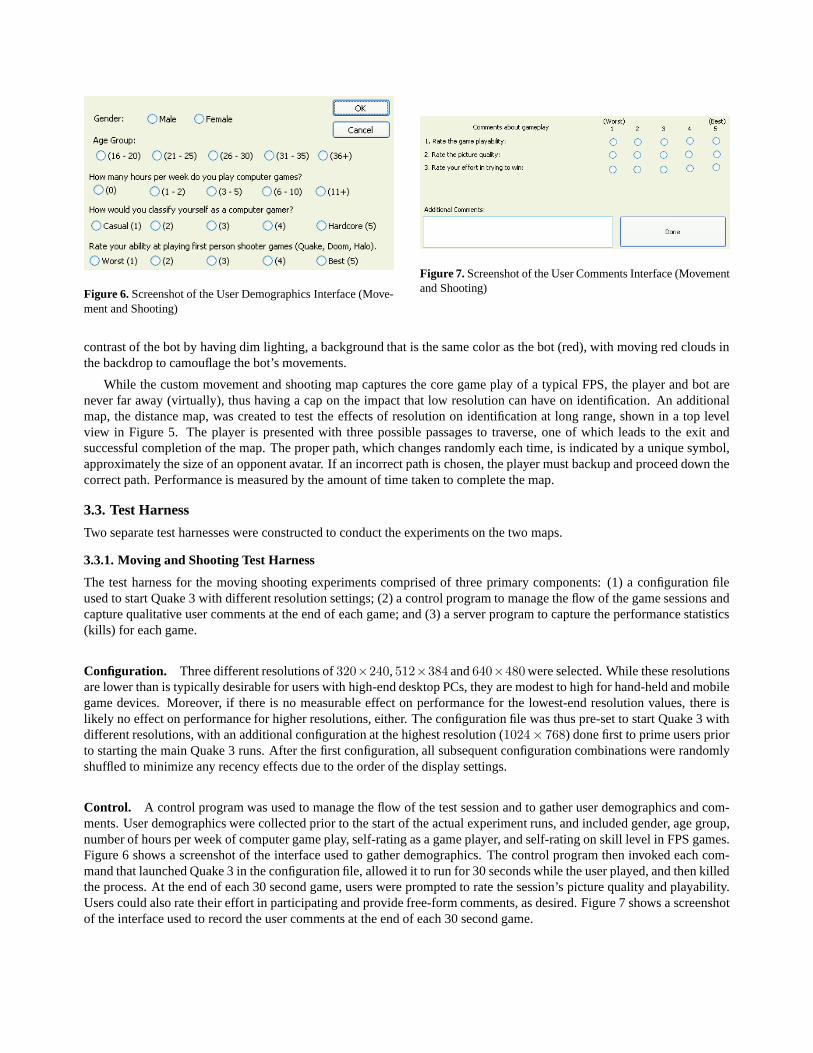
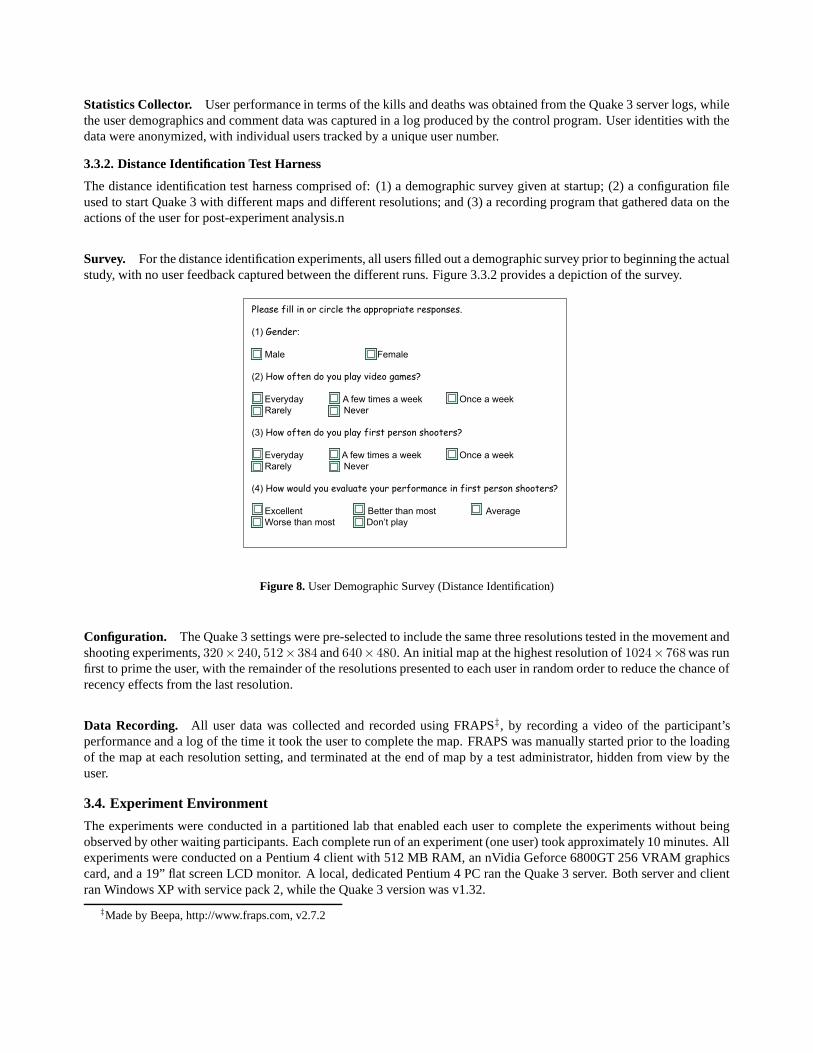
Figure 6. Screenshot of the User Demographics Interface (Move-ment and Shooting)
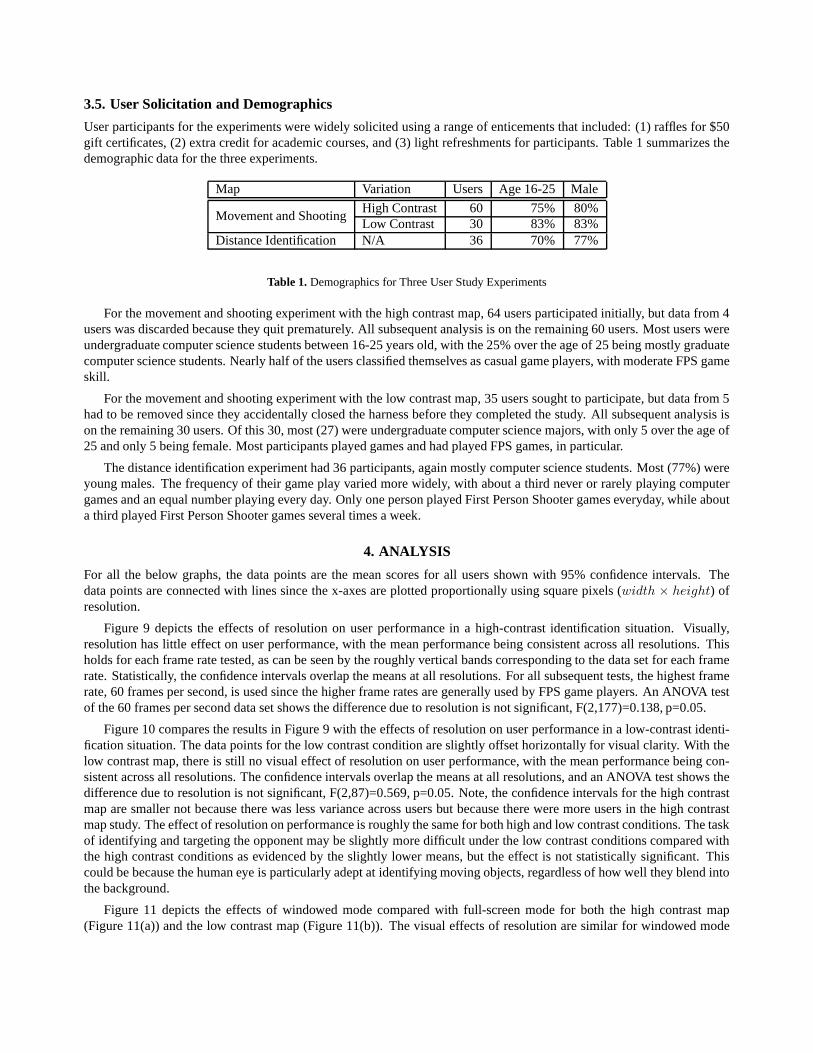
Figure 7. Screenshot of the User Comments Interface (Movementand Shooting)
contrast of the bot by having dim lighting, a background that is the same color as the bot (red), with moving red clouds inthe backdrop to camouflage the bot’s movements.
While the custom movement and shooting map captures the core game play of a typical FPS, the player and bot arenever far away (virtually), thus having a cap on the impact that low resolution can have on identification. An additionalmap, the distance map, was created to test the effects of resolution on identification at long range, shown in a top levelview in Figure 5. The player is presented with three possible passages to traverse, one of which leads to the exit andsuccessful completion of the map. The proper path, which changes randomly each time, is indicated by a unique symbol,approximately the size of an opponent avatar. If an incorrect path is chosen, the player must backup and proceed down thecorrect path. Performance is measured by the amount of time taken to complete the map.
3.3. Test Harness
Two separate test harnesses were constructed to conduct the experiments on the two maps.
3.3.1. Moving and Shooting Test Harness
The test harness for the moving shooting experiments comprised of three primary components: (1) a configuration fileused to start Quake 3 with different resolution settings; (2) a control program to manage the flow of the game sessions andcapture qualitative user comments at the end of each game; and (3) a server program to capture the performance statistics(kills) for each game.
Configuration. Three different resolutions of 320×240, 512×384 and 640×480 were selected. While these resolutionsare lower than is typically desirable for users with high-end desktop PCs, they are modest to high for hand-held and mobilegame devices. Moreover, if there is no measurable effect on performance for the lowest-end resolution values, there islikely no effect on performance for higher resolutions, either. The configuration file was thus pre-set to start Quake 3 withdifferent resolutions, with an additional configuration at the highest resolution (1024× 768) done first to prime users priorto starting the main Quake 3 runs. After the first configuration, all subsequent configuration combinations were randomlyshuffled to minimize any recency effects due to the order of the display settings.
Control. A control program was used to manage the flow of the test session and to gather user demographics and com-ments. User demographics were collected prior to the start of the actual experiment runs, and included gender, age group,number of hours per week of computer game play, self-rating as a game player, and self-rating on skill level in FPS games.Figure 6 shows a screenshot of the interface used to gather demographics. The control program then invoked each com-mand that launched Quake 3 in the configuration file, allowed it to run for 30 seconds while the user played, and then killedthe process. At the end of each 30 second game, users were prompted to rate the session’s picture quality and playability.Users could also rate their effort in participating and provide free-form comments, as desired. Figure 7 shows a screenshotof the interface used to record the user comments at the end of each 30 second game.
Statistics Collector. User performance in terms of the kills and deaths was obtained from the Quake 3 server logs, whilethe user demographics and comment data was captured in a log produced by the control program. User identities with thedata were anonymized, with individual users tracked by a unique user number.
3.3.2. Distance Identification Test Harness
The distance identification test harness comprised of: (1) a demographic survey given at startup; (2) a configuration fileused to start Quake 3 with different maps and different resolutions; and (3) a recording program that gathered data on theactions of the user for post-experiment analysis.n
Survey. For the distance identification experiments, all users filled out a demographic survey prior to beginning the actualstudy, with no user feedback captured between the different runs. Figure 3.3.2 provides a depiction of the survey.
Figure 8. User Demographic Survey (Distance Identification)
Configuration. The Quake 3 settings were pre-selected to include the same three resolutions tested in the movement andshooting experiments, 320×240, 512×384 and 640×480. An initial map at the highest resolution of 1024×768 was runfirst to prime the user, with the remainder of the resolutions presented to each user in random order to reduce the chance ofrecency effects from the last resolution.
Data Recording. All user data was collected and recorded using FRAPS‡, by recording a video of the participant’sperformance and a log of the time it took the user to complete the map. FRAPS was manually started prior to the loadingof the map at each resolution setting, and terminated at the end of map by a test administrator, hidden from view by theuser.
3.4. Experiment Environment
The experiments were conducted in a partitioned lab that enabled each user to complete the experiments without beingobserved by other waiting participants. Each complete run of an experiment (one user) took approximately 10 minutes. Allexperiments were conducted on a Pentium 4 client with 512 MB RAM, an nVidia Geforce 6800GT 256 VRAM graphicscard, and a 19” flat screen LCD monitor. A local, dedicated Pentium 4 PC ran the Quake 3 server. Both server and clientran Windows XP with service pack 2, while the Quake 3 version was v1.32.
‡Made by Beepa, http://www.fraps.com, v2.7.2
3.5. User Solicitation and Demographics
User participants for the experiments were widely solicited using a range of enticements that included: (1) raffles for $50gift certificates, (2) extra credit for academic courses, and (3) light refreshments for participants. Table 1 summarizes thedemographic data for the three experiments.
Map Variation Users Age 16-25 Male
Movement and ShootingHigh Contrast 60 75% 80%Low Contrast 30 83% 83%
Distance Identification N/A 36 70% 77%
Table 1. Demographics for Three User Study Experiments
For the movement and shooting experiment with the high contrast map, 64 users participated initially, but data from 4users was discarded because they quit prematurely. All subsequent analysis is on the remaining 60 users. Most users wereundergraduate computer science students between 16-25 years old, with the 25% over the age of 25 being mostly graduatecomputer science students. Nearly half of the users classified themselves as casual game players, with moderate FPS gameskill.
For the movement and shooting experiment with the low contrast map, 35 users sought to participate, but data from 5had to be removed since they accidentally closed the harness before they completed the study. All subsequent analysis ison the remaining 30 users. Of this 30, most (27) were undergraduate computer science majors, with only 5 over the age of25 and only 5 being female. Most participants played games and had played FPS games, in particular.
The distance identification experiment had 36 participants, again mostly computer science students. Most (77%) wereyoung males. The frequency of their game play varied more widely, with about a third never or rarely playing computergames and an equal number playing every day. Only one person played First Person Shooter games everyday, while abouta third played First Person Shooter games several times a week.
4. ANALYSIS
For all the below graphs, the data points are the mean scores for all users shown with 95% confidence intervals. Thedata points are connected with lines since the x-axes are plotted proportionally using square pixels (width × height) ofresolution.
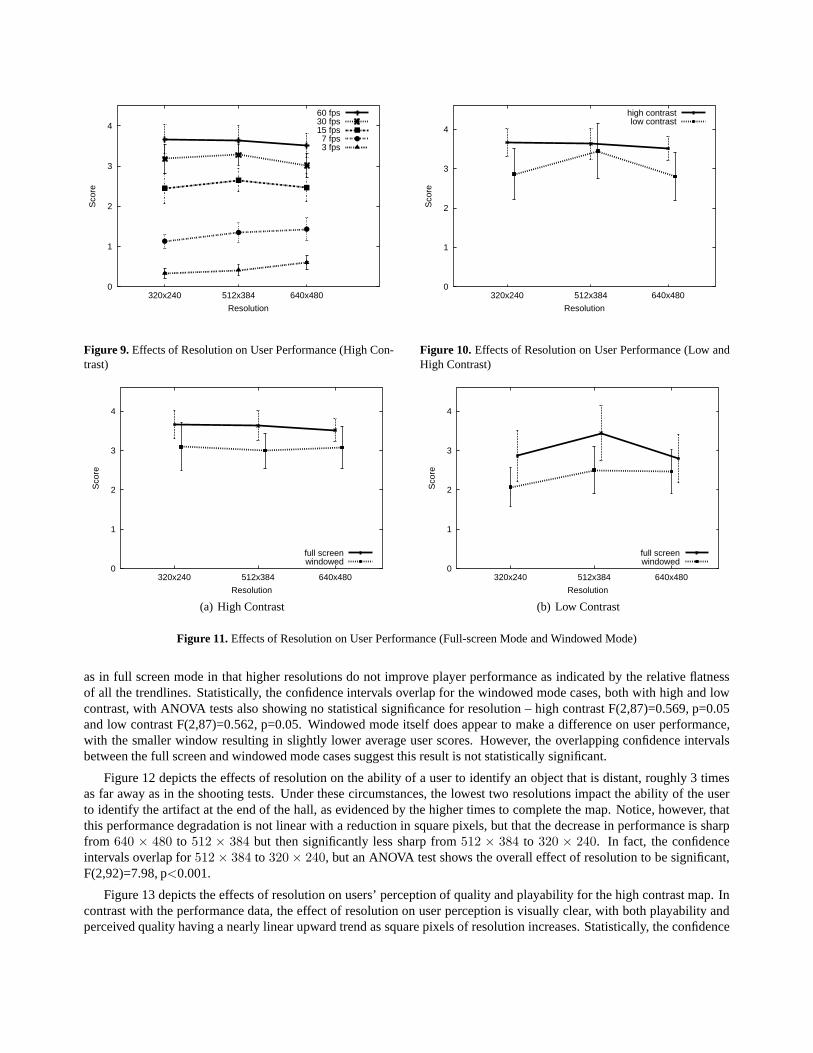
Figure 9 depicts the effects of resolution on user performance in a high-contrast identification situation. Visually,resolution has little effect on user performance, with the mean performance being consistent across all resolutions. Thisholds for each frame rate tested, as can be seen by the roughly vertical bands corresponding to the data set for each framerate. Statistically, the confidence intervals overlap the means at all resolutions. For all subsequent tests, the highest framerate, 60 frames per second, is used since the higher frame rates are generally used by FPS game players. An ANOVA testof the 60 frames per second data set shows the difference due to resolution is not significant, F(2,177)=0.138, p=0.05.
Figure 10 compares the results in Figure 9 with the effects of resolution on user performance in a low-contrast identi-fication situation. The data points for the low contrast condition are slightly offset horizontally for visual clarity. With thelow contrast map, there is still no visual effect of resolution on user performance, with the mean performance being con-sistent across all resolutions. The confidence intervals overlap the means at all resolutions, and an ANOVA test shows thedifference due to resolution is not significant, F(2,87)=0.569, p=0.05. Note, the confidence intervals for the high contrastmap are smaller not because there was less variance across users but because there were more users in the high contrastmap study. The effect of resolution on performance is roughly the same for both high and low contrast conditions. The taskof identifying and targeting the opponent may be slightly more difficult under the low contrast conditions compared withthe high contrast conditions as evidenced by the slightly lower means, but the effect is not statistically significant. Thiscould be because the human eye is particularly adept at identifying moving objects, regardless of how well they blend intothe background.
Figure 11 depicts the effects of windowed mode compared with full-screen mode for both the high contrast map(Figure 11(a)) and the low contrast map (Figure 11(b)). The visual effects of resolution are similar for windowed mode
0
1
2
3
4
640x480512x384320x240
Sco
re
Resolution
60 fps30 fps15 fps
7 fps3 fps
Figure 9. Effects of Resolution on User Performance (High Con-trast)
0
1
2
3
4
640x480512x384320x240
Sco
re
Resolution
high contrastlow contrast
Figure 10. Effects of Resolution on User Performance (Low andHigh Contrast)
0
1
2
3
4
640x480512x384320x240
Sco
re
Resolution
full screenwindowed
(a) High Contrast
0
1
2
3
4
640x480512x384320x240
Sco
re
Resolution
full screenwindowed
(b) Low Contrast
Figure 11. Effects of Resolution on User Performance (Full-screen Mode and Windowed Mode)
as in full screen mode in that higher resolutions do not improve player performance as indicated by the relative flatnessof all the trendlines. Statistically, the confidence intervals overlap for the windowed mode cases, both with high and lowcontrast, with ANOVA tests also showing no statistical significance for resolution – high contrast F(2,87)=0.569, p=0.05and low contrast F(2,87)=0.562, p=0.05. Windowed mode itself does appear to make a difference on user performance,with the smaller window resulting in slightly lower average user scores. However, the overlapping confidence intervalsbetween the full screen and windowed mode cases suggest this result is not statistically significant.
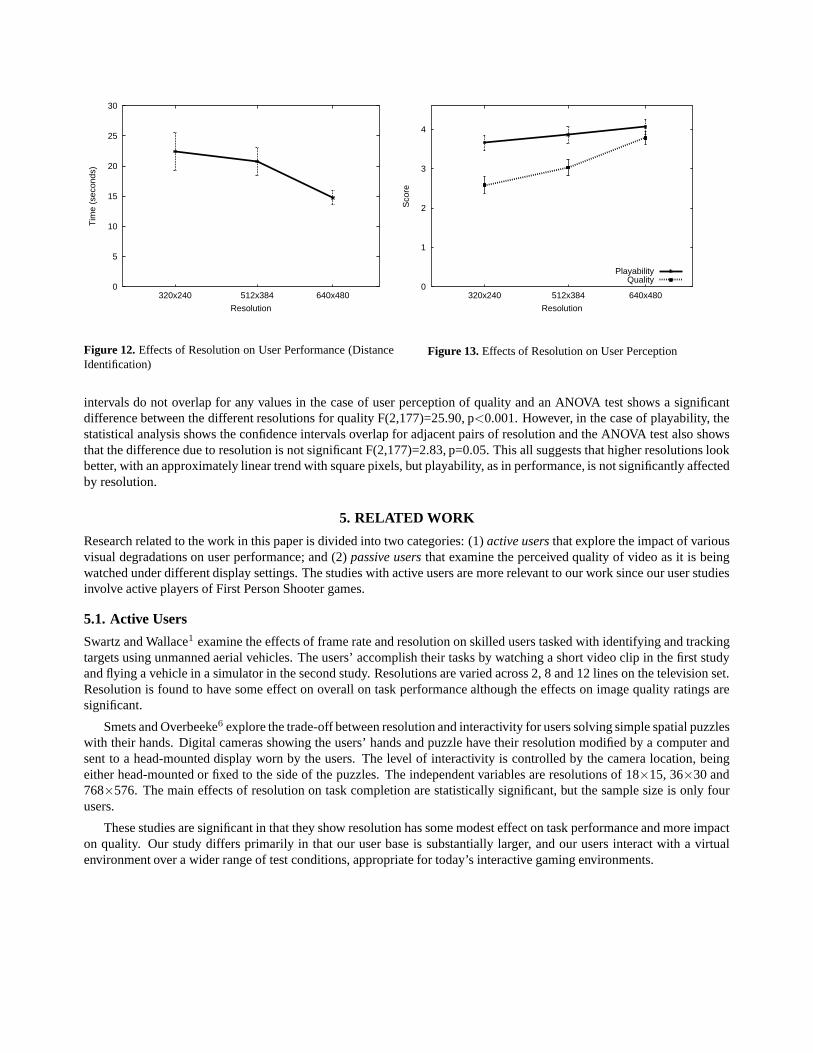
Figure 12 depicts the effects of resolution on the ability of a user to identify an object that is distant, roughly 3 timesas far away as in the shooting tests. Under these circumstances, the lowest two resolutions impact the ability of the userto identify the artifact at the end of the hall, as evidenced by the higher times to complete the map. Notice, however, thatthis performance degradation is not linear with a reduction in square pixels, but that the decrease in performance is sharpfrom 640 × 480 to 512 × 384 but then significantly less sharp from 512 × 384 to 320 × 240. In fact, the confidenceintervals overlap for 512× 384 to 320× 240, but an ANOVA test shows the overall effect of resolution to be significant,F(2,92)=7.98, p<0.001.
Figure 13 depicts the effects of resolution on users’ perception of quality and playability for the high contrast map. Incontrast with the performance data, the effect of resolution on user perception is visually clear, with both playability andperceived quality having a nearly linear upward trend as square pixels of resolution increases. Statistically, the confidence
0
5
10
15
20
25
30
640x480512x384320x240
Tim
e (s
econ
ds)
Resolution
Figure 12. Effects of Resolution on User Performance (DistanceIdentification)
0
1
2
3
4
640x480512x384320x240
Sco
re
Resolution
PlayabilityQuality
Figure 13. Effects of Resolution on User Perception
intervals do not overlap for any values in the case of user perception of quality and an ANOVA test shows a significantdifference between the different resolutions for quality F(2,177)=25.90, p<0.001. However, in the case of playability, thestatistical analysis shows the confidence intervals overlap for adjacent pairs of resolution and the ANOVA test also showsthat the difference due to resolution is not significant F(2,177)=2.83, p=0.05. This all suggests that higher resolutions lookbetter, with an approximately linear trend with square pixels, but playability, as in performance, is not significantly affectedby resolution.
5. RELATED WORK
Research related to the work in this paper is divided into two categories: (1) active users that explore the impact of variousvisual degradations on user performance; and (2) passive users that examine the perceived quality of video as it is beingwatched under different display settings. The studies with active users are more relevant to our work since our user studiesinvolve active players of First Person Shooter games.
5.1. Active Users
Swartz and Wallace1 examine the effects of frame rate and resolution on skilled users tasked with identifying and trackingtargets using unmanned aerial vehicles. The users’ accomplish their tasks by watching a short video clip in the first studyand flying a vehicle in a simulator in the second study. Resolutions are varied across 2, 8 and 12 lines on the television set.Resolution is found to have some effect on overall on task performance although the effects on image quality ratings aresignificant.
Smets and Overbeeke6 explore the trade-off between resolution and interactivity for users solving simple spatial puzzleswith their hands. Digital cameras showing the users’ hands and puzzle have their resolution modified by a computer andsent to a head-mounted display worn by the users. The level of interactivity is controlled by the camera location, beingeither head-mounted or fixed to the side of the puzzles. The independent variables are resolutions of 18×15, 36×30 and768×576. The main effects of resolution on task completion are statistically significant, but the sample size is only fourusers.
These studies are significant in that they show resolution has some modest effect on task performance and more impacton quality. Our study differs primarily in that our user base is substantially larger, and our users interact with a virtualenvironment over a wider range of test conditions, appropriate for today’s interactive gaming environments.
5.2. Passive Users
Tripathi and Claypool3 study the impact of resolution on videos with different content, specifically high-motion videos andlow-motion videos. Users watch and rate the perceived quality of several short video clips degraded by a reduced framerate or a reduced resolution. The authors find that the effects of decreasing the resolution depend upon the motion content,with low-motion videos appearing more degraded with a decrease in resolution than do high-motion videos.
McCarthy et al.2 examine the percentage of time videos at varying resolutions are acceptable to users of small screendevices, such as mobile phones. In their study, users watch sports videos in which the resolution is gradually decreased(with full-screen mode) until the users indicate the quality is not acceptable. Contrary to earlier findings, the authors findusers prefer higher resolutions to higher frame rates.
These studies are significant in that they show that at least for some videos, performance suffers at low resolutionand that users generally prefer higher resolutions. Our work differs in that computer games, in general, and First PersonShooter games, specifically, are highly interactive.
6. CONCLUSION
The proliferation of computer games and computer game devices has increased the need for a thorough understanding ofthe impact of resolution on game play. This is especially important as increases to resolution often come at the real cost ofbetter hardware or as a tradeoff cost in that frame rates are often reduced at higher resolution.
This paper presents results from extensive users studies that extend earlier results in gauging the impact of resolutionof First Person Shooter (FPS) games. Carefully designed test maps and harnesses were constructed to allow controlledmeasurement of the impact of resolution on quantitative performance and qualitative assessment. Focused testing includesexamination of high and low contrast conditions, full screen and windowed mode and identification at a distance. Over 120users participated in three users studies, providing statistical significance for most data analyzed.
Overall, resolution has no statistical impact on user performance over the range of conditions tested. Identificationwith high contrast, such as when targeting a light colored opponent against a dark background, is generally easier thanidentification with low contrast, such as when targeting a camouflaged opponent against a complex, moving background,but resolution does not change the relative difficulty of the tasks. Similarly, identification in a full screen condition wherea low resolution is stretched to the limits of the display is generally easier than in a windowed mode where the pixels aredisplayed one-to-one with the display, but the relative difficulty of the task is not changed by resolution. In fact, resolutiononly affects performance in FPS games when the relative size of the object being identified (such as for a distant opponent)is too small to be rendered by the pixels in the resolution. These performance characteristics are reflected in that there is nostatistical significance in user playability ratings under different resolutions, although user quality ratings do show a nearlinear increase with an increase in square pixels.
While it is assumed that the results obtained in this study generalize to other computer game genres, the specific genretested, First Person Shooters, has numerous differences from other genres. For example, Real-Time Strategy (RTS) gamesrely heavily upon detailed information on individual units and the map for effective game play. Future work could includea study similar to the one presented in this paper for RTS games, third-person action games, or sports and racing games.
Acknowledgments
The authors would like to acknowledge the help of Timothy Connor, Feissal Daama, Adam Fiske, Leon Kay and RyanKennedy for their help in running the experiments and for the many users that participated in the three user studies –without their help, the data analysis in this paper would not be possible.

REFERENCES
1. M. Swartz and D. Wallace, “Effects of Frame Rate and Resolution Reduction on Human Performance,” in Proceedingsof IS&T’s 46th Annual Conference, (Munich, Germany), 1993.
2. J. McCarthy, M. A. Sasse, and D. Miras, “Sharp or Smooth? Comparing the Effects of Quantization versus FrameRate for Streamed Video,” in Proceedings of ACM CHI Conference on Human Factors in Computing Systems, (Vienna,Austria), Apr. 2004.
3. A. Tripathi and M. Claypool, “Improving Multimedia Streaming with Content-Aware Video Scaling,” in Workshop onIntelligent Multimedia Computing and Networking (IMMCN), (Durham, North Carolina, USA), Mar. 2002.
4. S. Bryson, “Effects of Lag and Frame Rate on Various Tracking Tasks,” in Proceedings of SPIE Stereoscopic Displaysand Applications, 1915, pp. 155–166, Sept. 1993.
5. M. J. Massimino and T. B. Sheridan, “Teleoperator Performance with Varying Force and Visual Feedback,” HumanFactors , pp. 145 – 157, Mar. 1994.
6. G. Smets and K. Overbeeke, “Trade-off Between Resolution and Interactivity in Spatial Task Performance,” IEEEComputer Graphics and Applications , pp. 46 – 51, Sept. 1995.
7. J. Zebarth, “Let Me Be Me,” in Proceedings of Globecom – IEEE Telecommunications Conference, pp. 389 – 393,(Houston, TX, USA), Nov. 1993.
8. M. Claypool, K. Claypool, and F. Damaa, “The Effects of Frame Rate and Resolution on Users Playing First PersonShooter Games,” in Proceedings ACM/SPIE Multimedia Computing and Networking (MMCN) Conference, (San Jose,CA, USA), Jan. 2006.