The Effects of Privatization on Firms and on Social Welfare
101
The Effects of Privatization on Firms and on Social Welfare R. Fischer U. de Chile R. Gutierrez P. Serra U. de Chile 1 July, 2002 1 Contact at [email protected] or [email protected]. We received support from the IABD-Red de Centros. We wish to thank Florencio Lopez-de-Silanes for many helpful comments. We also thank Pablo Gonz´ alez for help with the analysis of the educational reform. Manuel Cruzat and ´ Angel Gajardo were most helpful in providing data for Fepasa and Ferronor, respectively.
-
Upload
independent -
Category
Documents
-
view
1 -
download
0
Transcript of The Effects of Privatization on Firms and on Social Welfare

The Effects of Privatization on Firms and on Social Welfare
R. FischerU. de Chile
R. Gutierrez P. SerraU. de Chile 1
July, 2002
1Contact at [email protected] or [email protected] . We received support from theIABD-Red de Centros. We wish to thank Florencio Lopez-de-Silanes for many helpful comments. We alsothank Pablo Gonzalez for help with the analysis of the educational reform. Manuel Cruzat and AngelGajardo were most helpful in providing data for Fepasa and Ferronor, respectively.

Abstract
In this study we analyze the Chilean privatization process as a whole. Since it has been a wide-ranging process, we examine its different aspects. After a historic review of the privatization pro-cess, we study the 37 Chilean State Owned Enterprises (SOE’s) that were privatized during theperiod 1981-2000 and for which pre-privatization and post-privatization financial, employmentand productive data are available. We show that these firms behaved no differently from the aver-age firm in their economic sectors after privatization, implying that they were efficient SOE’s. Thelarge increase in profitability of privatized firms can be explained by the performance of firms inthe regulated sector. In particular, employment in these firms increased after privatization, show-ing that they were no overmanned under government control. We show that the profitability inthe sector is due to the more efficient use of physical capital and by the fact that the regulatorswere unable to transfer these gains to consumers. Next, we examine the effects of the privati-zation of social services. We analyze in detail the effects of privatization on the performance oftelecommunications and the electric sector. We find confirmation of the fact that in the regulated,natural monopoly sectors profits increased, whereas sectors that are characterized by competition,profits have been lower. Nevertheless, regulated firms are fairly efficient, implying that incentiveregulation has been successful. Another privatization process involved infrastructure, where themain highways and ports have been franchised successfully, and where the benefits in terms ofreduced transportation costs will increase the efficiency of the economy as a whole. Next we studythe effects of the privatization of the pension system, the health insurance system and of educa-tion through a voucher system. We find that the big benefit of the pension system is that pensionscan no longer be expropriated by the political system, but that the system is expensive, thoughcosts have fallen lately. The private health insurance system has not been a big success due to theinformation asymmetries that plague health care, but have had the beneficial effect of showing theinefficiencies of the public system and thus putting pressure on it to improve. Similarly, the useof vouchers has not been shown unequivocally to lead to a better education system (though thereis some evidence that this is so), but has put pressure on the public system to improve. More-over, vouchers would be more effective if parents were informed of the results of their childrenin standardized tests and if public schools were able to fire bad teachers. Finally, the increasedcompetition in higher education has led to improvements in the quality of the traditional Statefinanced institutions and to a large increase in the coverage of higher education.
JEL: L33Keywords: Privatization, Chile.

Contents
1 Introduction 11.1 Privatization of SOE’s . . . . . . . . . . . . . . . . . . . . . . . . . . . . . . . . . . . . 31.2 Privatization of regulated sectors . . . . . . . . . . . . . . . . . . . . . . . . . . . . . . 5
1.2.1 Privatization of utilities . . . . . . . . . . . . . . . . . . . . . . . . . . . . . . . 51.2.2 The privatization of infrastructure . . . . . . . . . . . . . . . . . . . . . . . . . 61.2.3 The privatization of social services . . . . . . . . . . . . . . . . . . . . . . . . . 7
2 The Performance of Privatized Firms 92.1 A brief history of the privatization of public enterprises . . . . . . . . . . . . . . . . . 10
2.1.1 The era of state intervention . . . . . . . . . . . . . . . . . . . . . . . . . . . . . 102.1.2 The First Round of Privatization . . . . . . . . . . . . . . . . . . . . . . . . . . 122.1.3 The Crisis of the early 80s . . . . . . . . . . . . . . . . . . . . . . . . . . . . . . 142.1.4 The Privatization of the historic SOEs (1985-89) . . . . . . . . . . . . . . . . . 162.1.5 Privatizations during the 90s . . . . . . . . . . . . . . . . . . . . . . . . . . . . 17
2.2 Data on Privatized Chilean Firms . . . . . . . . . . . . . . . . . . . . . . . . . . . . . . 192.2.1 Data problems . . . . . . . . . . . . . . . . . . . . . . . . . . . . . . . . . . . . 202.2.2 Treatment of Mergers and demergers . . . . . . . . . . . . . . . . . . . . . . . 222.2.3 Data adjustments . . . . . . . . . . . . . . . . . . . . . . . . . . . . . . . . . . . 22
2.3 Effects of privatization on Chilean firms . . . . . . . . . . . . . . . . . . . . . . . . . . 232.3.1 Profitability . . . . . . . . . . . . . . . . . . . . . . . . . . . . . . . . . . . . . . 232.3.2 Efficiency . . . . . . . . . . . . . . . . . . . . . . . . . . . . . . . . . . . . . . . 242.3.3 Assets and investment . . . . . . . . . . . . . . . . . . . . . . . . . . . . . . . . 252.3.4 Productivity . . . . . . . . . . . . . . . . . . . . . . . . . . . . . . . . . . . . . . 252.3.5 Employment . . . . . . . . . . . . . . . . . . . . . . . . . . . . . . . . . . . . . 26
3 Privatization of Regulated Sectors 283.1 The Efficiency of Privatized Utilities . . . . . . . . . . . . . . . . . . . . . . . . . . . . 28
i

3.1.1 The Privatization Process . . . . . . . . . . . . . . . . . . . . . . . . . . . . . . 283.1.2 The Regulatory framework . . . . . . . . . . . . . . . . . . . . . . . . . . . . . 293.1.3 Evaluation of privatization in the regulated sectors . . . . . . . . . . . . . . . 34
3.2 Infrastructure franchises . . . . . . . . . . . . . . . . . . . . . . . . . . . . . . . . . . . 473.3 Highways and airports . . . . . . . . . . . . . . . . . . . . . . . . . . . . . . . . . . . . 493.4 Concessions for Port Management and Operation . . . . . . . . . . . . . . . . . . . . 55
4 Privatization of social services 604.1 The privatization of the pension system . . . . . . . . . . . . . . . . . . . . . . . . . . 60
4.1.1 Evaluation of the private pension fund system. . . . . . . . . . . . . . . . . . . 614.2 The health insurance system . . . . . . . . . . . . . . . . . . . . . . . . . . . . . . . . . 64
4.2.1 An evaluation of the private health insurance system . . . . . . . . . . . . . . 674.3 Public education and school vouchers . . . . . . . . . . . . . . . . . . . . . . . . . . . 69
4.3.1 An evaluation of the reform . . . . . . . . . . . . . . . . . . . . . . . . . . . . . 714.3.2 Tertiary Education . . . . . . . . . . . . . . . . . . . . . . . . . . . . . . . . . . 74
5 Conclusions 76
6 Appendix 83
ii

Chapter 1
Introduction
The object of this paper is to evaluate the effects of privatization on the efficiency of firms andinstitutions in Chile. The Chilean privatization process was one of the earliest –and probably theearliest– in the current worldwide trend towards privatization. One of its chief characteristics wasthat it was all-encompassing. In the three decades that followed the fall of the government of thesocialist president Salvador Allende (12/70–9/73), all the banks and firms that had been acquiredor expropriated by Allende’s government were either privatized or liquidated. Farms that hadbeen expropriated since the agrarian reform of 1965 were privatized, as well as a majority of thefirms that were government owned before December 1970.
The military government also privatized the pension system and a part of the health insurancesystem. Government promoted vouchers for subsidized private schools and allowed free entryinto tertiary education (university and other post-high school education). Finally, the private sec-tor improved or built and operates most large infrastructure projects such as highways, seaports,airports, water reservoirs and even jails. In addition, in a bid to decentralize government, localgovernments (municipalities) became responsible for the lowest level of the public health caresystem as well as for public schooling.
The privatization is part of a much wider process of economic liberalization that Chile initi-ated in 1974, a major reversal of the policies followed by the country since the forties, which werecharacterized by an increasing participation of the state in the economy (see Galetovic (1998)). Inthe period pre-1974, the state played a role not only through the public firms, but also via regu-lations and other forms of intervention in the economy. The government would set the interestrate and the exchange rate, and regulate almost 3,000 prices. As part of its import substitutionstrategy, the government protected those sectors deemed essential. This meant that internationaltrade was restricted by quantitative restrictions as well as by high, heterogeneous tariffs. All ofthis machinery started to disappear in 1974, with the country’s turn towards a market economy,
1

where the price system is the main mechanism for resource allocation and the private sector is thecenterpiece of the economy, Moreover, in an effort to reduce the size of the state, many traditionalsupervisory activities were surrendered to the private market: private custom agents relievedsome of the duties of the customs office, private laboratories test new roads and the effluent fromwater treatment plants and industry, and the courts employ private individuals to run or liquidatebankrupt companies. Major overhauls of the tax system have simplified it and reduced tax rates.
It is possible to distinguish three main phases in the Chilean privatization process, even thoughany chronological division is arbitrary. In the first phase, which covers the period 1974-1980, 259firms that were expropriated or illegally taken during the Allende’s government were restored totheir original owners. The government also sold or liquidated an additional 118 firms acquiredin the same period (conserving 7 of in that category). In addition, 34 of the 65 firms pre-1970government owned firms were also privatized or closed. Nevertheless, at the end of the decadethe government still owned 40 firms, some of them because they were considered of strategicimportance and some because there were no takers. In particular, government owned all of themajor telecom and electric firms, and copper mining companies.
In the second phase, from 1980 to 1989, the state privatized the telecom and electric firms aswell as most of the firms previously considered strategic: the CAP steel works, the flag carrierLAN, and other major firms. It also finished selling the last few firms that had been acquired bythe socialist government. By 1989, only 16 of the 66 firms dating from the pre-December 1970period were still in the hands of the government. During this period, specially in the first yearsof the decade, many activities which had been traditionally provided by the state, such as thepension system, health financing and the educational system were privatized, at least partially.
The privatization of SOEs slowed down in the period 1990-2001. However, the governmentsold the three main water and sewage companies and completed the privatization of the electricsector. The distinguishing feature of this period, however, is the privatization –through concessioncontracts– of infrastructure management. From 1993 onwards, the main highways, expresswaysand airports have been built, maintained and operated by private investors. The main state-ownedports were also franchised to private firms.
Most analysts ascribe the strong growth in the Chilean economy that begun in 1985 (after a se-vere crisis in the first half of the decade) to economic liberalization. If we accept this premise, wemay still wonder about the specific contribution of privatization. The problem is that so many sys-temic changes occurred at the same time that it is difficult to evaluate the separate contribution of aparticular policy.1 Nevertheless, (Larraın and Vergara (1995)), suggest that the rest of the programwould not have been credible in the absence of a privatization process. Moreover, privatization
1Some put the accent on the pension fund reform while others underscore the role of the 1984 tax reform.
2

was important in helping balance the budget and in developing the capital markets.2 However,in this paper we focus on the direct effect privatization had on the efficiency of privatized sectorsand therefore do not look at the global effects on the rest of the economy.
1.1 Privatization of SOE’s
The Chilean privatization of SOEs has been a long-lasting and still unfinished process. There arestill 38 firms –most of them of economic importance– that remain in public hands: ENAP, themonopoly oil refinery; CODELCO, a copper mining concern that is the largest company in Chile;ENAMI, a copper refinery; Banco del Estado, the fourth largest commercial bank; the post office;the subway; the Chilean Mint; the rail lines; the State lottery; ten ports, Zofri, the free trade zone;and other minor companies, representing in all, around 9% of total GDP in 1998.3 The perceptionthat Chile has advanced further along the privatization route than most other countries is probablydue to the fact that most traditionally infrastructure and social services have been privatized ratherthan the extent to which the state has retired from the productive sector.
As can be seen from table 1.1, between 1974 and 2001, 125 firms have been privatized. How-ever, most of these firms were owned by the State for only a short time and only 65 of these stayedlong enough in public hand to count as real SOEs (see table 2.1). Most of the firms acquired duringthe socialist government (1970-1973) were privatized by 1978, and by 1983 only one of those firmswas still state-owned. At least 55 other firms controlled by the government have been liquidated.Several of these were only viable while protected by large tariffs and other non-tariff barriers andbecame nonviable after the opening of the economy (Hachette and Luders (1994)). Note also thatin the period 1979-1989 many state-owned firms were created by subdivision of larger firms, andwere later sold.
As compared to later processes (in Mexico, for instance, see La Porta and Lopez-de Silanes(1999)), privatization in Chile was not transparent in its early stages. This can be explained par-tially by the violent social convulsions that affected Chile in the period 1970-1982, which involveda socialist government, a coup leading to a dictatorship, three large economic crisis (1973, 1975and 1982), major structural changes on the economy and by the fact that the policy makers wereexploring untried policies in a context of no freedom of the press. There almost no records of pri-vatizations that took place in the 1970’s. Moreover, accounting books tell little about the value ofa firm when inflation rates reached levels of more than 500% in some years, and bookkeeping reg-ulations were loose and were only upgraded during the 1982 crisis. Therefore, most of the usable
2During the 80’s, taxes were reduced and the government was able to finance the transition to a private pensionsystem without going into deficit. Clearly, funds were not used to delay fiscal adjustment, as happened in Argentina.
3Shares of state related firms in GDP were obtained from Hachette (2000).
3
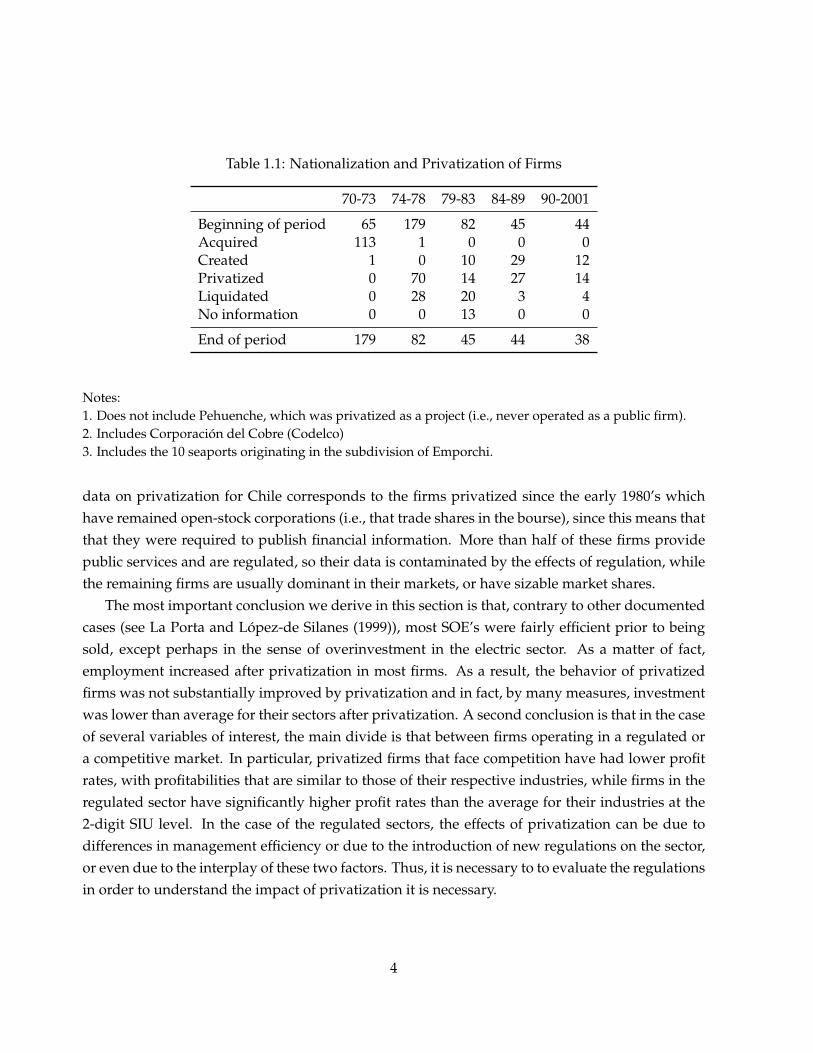
Table 1.1: Nationalization and Privatization of Firms
70-73 74-78 79-83 84-89 90-2001
Beginning of period 65 179 82 45 44Acquired 113 1 0 0 0Created 1 0 10 29 12Privatized 0 70 14 27 14Liquidated 0 28 20 3 4No information 0 0 13 0 0
End of period 179 82 45 44 38
Notes:1. Does not include Pehuenche, which was privatized as a project (i.e., never operated as a public firm).2. Includes Corporacion del Cobre (Codelco)3. Includes the 10 seaports originating in the subdivision of Emporchi.
data on privatization for Chile corresponds to the firms privatized since the early 1980’s whichhave remained open-stock corporations (i.e., that trade shares in the bourse), since this means thatthat they were required to publish financial information. More than half of these firms providepublic services and are regulated, so their data is contaminated by the effects of regulation, whilethe remaining firms are usually dominant in their markets, or have sizable market shares.
The most important conclusion we derive in this section is that, contrary to other documentedcases (see La Porta and Lopez-de Silanes (1999)), most SOE’s were fairly efficient prior to beingsold, except perhaps in the sense of overinvestment in the electric sector. As a matter of fact,employment increased after privatization in most firms. As a result, the behavior of privatizedfirms was not substantially improved by privatization and in fact, by many measures, investmentwas lower than average for their sectors after privatization. A second conclusion is that in the caseof several variables of interest, the main divide is that between firms operating in a regulated ora competitive market. In particular, privatized firms that face competition have had lower profitrates, with profitabilities that are similar to those of their respective industries, while firms in theregulated sector have significantly higher profit rates than the average for their industries at the2-digit SIU level. In the case of the regulated sectors, the effects of privatization can be due todifferences in management efficiency or due to the introduction of new regulations on the sector,or even due to the interplay of these two factors. Thus, it is necessary to to evaluate the regulationsin order to understand the impact of privatization it is necessary.
4

1.2 Privatization of regulated sectors
This section analyzes the Chilean experience with privatization of regulated sectors. It focusseson the privatization of utilities and social services that occurred in the 80’s and on the privateinfrastructure franchises of the 90’s. In these sectors, the government switched from a role ofprovider to the role of regulator.
Even though these two are different sectors, they share some important characteristics. First,these are imperfect markets, with failures such as non-convexities (leading to natural monopolies)and asymmetric information. Second, they produce “merit” goods or services, which require thatthe State guarantee access to all of the population. These privatizations are interesting not onlyby the fact that they represented a shift towards the private sector but also because of the policiesthat were introduced in order to deal with these market failures and guarantee universal accessand by the results, successful or not, of these measures.
Despite the many market imperfections, the military government believed that there werebenefits to be obtained from transferring property to a profit-maximizing private sector as com-pared to a public sector that followed procedures. Nevertheless, the government was aware thatadequate incentives were required in order for private activity to increase welfare. This is theexplanation for the fact that the regulations that were introduced prior to privatization tendedto promote competition whenever possible and to simulate efficient behavior when competitionwas impossible. The government believed that market discipline played an essential role in eco-nomic policy, so much so that one of the first economic laws it introduced (in October 1973) was athorough revamping of the antitrust legislation.
1.2.1 Privatization of utilities
In this section we analyze the post-privatization performance of regulated utilities, and relate itto regulatory legislation. We focus on the electric and telecom companies that were privatizedbetween 1985 and 1989.4 The gains in efficiency from privatization can derive both from the dif-ferential efficiency between the public and private management as well as from the effect of therules and regulations that were imposed on the sector. During the 1980s Chile reformed and liber-alized its electric and telecom sectors. The process started in the late 1970s with the establishmentof new regulatory bodies and the introduction of new legislation in 1982, and culminated withthe privatization of the major firms between 1985 and 1989. One trait that infrastructure-basedsectors share is that competitive segments coexist with other segments that constitute a naturalmonopoly. Chile’s policy has been to introduce competition wherever possible and to regulate
4We do not include the water sanitation companies, which were sold during the late 90’s and for which there is littleevidence about their performance, one way or another.
5

non-competitive segments of industry.The cornerstone of the Chilean electric reform was the introduction of competition in the
wholesale contract market for energy. The unbundling of transmission services was a prereq-uisite for wholesale competition to survive. Thus it was necessary to introduce the principle ofopen access to the transmission network. The second major change was that investment in gen-eration was left to market forces. Existing firms or potential entrants will invest in generationcapacity whenever a project has a return on capital that is commensurate with the sector’s risk.The third major regulatory innovation was the introduction of incentive regulation to calculatethe value added by the distribution sector. This implies that prices are set so that an efficient dis-tribution company will attain a predetermined rate of return (Fischer and Serra (2000)). The lawsregulating the telecommunication sector follows a similar pattern. They provide for free pricesin all sectors deemed competitive, but regulates rates of basic phone services considered to be lo-cal monopolies. As the local network is considered an essential facility for competitors, the 1982law has required local telephone service operators to provide access to their network to any otheroperator that requests the service.
On average, SOEs increased their profitability and efficiency after privatization, following thetrend of the national economy, but the behavior of firms that provide regulated services can besingled out. Their productivity –and consequently their profitability– increased by more than inthe case of the non-regulated firms. Hence, there is some evidence that the incentive mechanismhave worked and provided incentives for efficiency. On the other hand, the high profits ratesof these firms are also evidence of regulatory failure. In fact, the available evidence shows thata large fraction of the efficiency gains were not transferred to consumers as prescribed by theregulatory model. Nonetheless this situation has changed in the last five years as regulators havebecome more forceful and competition has made its mark even sectors previously considered tobe natural monopolies.
1.2.2 The privatization of infrastructure
Even though there were some early plans to franchise infrastructure during the Pinochet govern-ment, it was the democratically elected Alwyin government that managed to pass a law allow-ing private franchises of highways and other infrastructure projects. There were delays at first asmany practical problems had to be solved. Nevertheless, by the time of the Frei government (1994-2000), everything was ready and the franchising of infrastructure went into full swing. During thenext six years, most of privately profitable projects were franchised to national and internationalfirms. Projects worth more than US$4 billion are operational or are close to being operational. Afurther US$2.5 billion have been auctioned or will be auctioned during the year 2002, but have not
6

yet started construction; and a further US$650 million are under consideration, but have not beenevaluated in detail.
By the mid-90’s, the government discovered that it faced bottlenecks in seaports, a seriousproblem, since most Chilean international cargo is transported by shipping. There were multi-ple private cargo transfer and storage operators a each port, but there was little investment inequipment and activities were not well coordinated. The government decided to franchise portterminals (“frentes de atraque”) to private operators.5. Given their scarcity in Chile due to geo-graphical reasons, terminals can be considered essential facilities. In order to increase efficiencyand investment in the ports, the main terminals were auctioned, under restrictions on horizontaland vertical integration that were supposed to limit their ability to command a bottleneck.
The program of infrastructure franchising has been successful overall. There have been fewproblems in the highway program, specially as compared to the experience of Mexico, which even-tually cost taxpayers an estimated US$ 8 billion. By now the country can boast of a substantiallyupgraded road infrastructure and lower transport costs. Moreover, since franchise auctions wereopen and competitive, tolls (user prices) should be close to average cost, which is second best op-timal in the presence of economies of scale. However, there are potential problems with the trafficguarantees the government has included in contracts in order to facilitate access to loans, sincethey represent unaccounted for liabilities to government that are pro-cyclical. Finally, there havebeen noticeable improvements in the efficiency of the privatized ports. The loading and unload-ing process has become twice as fast in just one year, and this has a multiplier effect on transportcosts, since shorter stays in port mean that more efficient but also more capital intensive ships canafford to operate from Chile.
1.2.3 The privatization of social services
Social services were privatized starting in the early 1980’s. In 1980, the government introducedlegislation that created the private pension fund system. This system is based on compulsory con-tributions to individual pension accounts. Workers are required to contribute 10% of their grosswage income to the pension fund administrator of their choice.6 In 1981 the private health in-surance system was introduced. Again, workers were compelled to contribute 7% of their grossincome to purchase health insurance, either through the public system or through the health insur-ance company of their choice.7 In a bid for decentralization of government activities, municipal-ities became responsible for primary public health care. Public schools –previously managed by
5A terminal is an autonomous operational unit within a port that consists of adjoining berthing spaces and theirassociated support and service areas, thereby making it possible to auction the terminals at a port as separate items
6Pension fund administrators charge average commissions representing 2.5% of the income of contributors, butwhich represent less than 1% of accumulated funds.
7The compulsory health contribution was initially 4% but rose to 7% after a few years.
7

the state– were also transferred to municipalities and a voucher system that did not discriminatebetween municipal and private schools was introduced to finance basic and high schools.
The objective guiding these measures to promote private participation in social services wastwofold. The first objective was to increase efficiency, specially through competition betweenthe various participants in a sector. Second, to hand the responsibility for decisions concerningchildren’s education or retirement pensions to families. This agenda was based on a deep-rooteddistrust of the role of the State on both social and economic decisions. However, as these arecomplex decisions, where asymmetric information is rampant, the State remained a rule-setterand supervisor. The main problem has been the reluctance of private individuals to acquire theknowledge needed to make rational decisions.8 As a result many individuals do not understandthe main aspects that are involved in the choice of a provider of these services.
Lack of understanding on the part of consumers has led providers to focus their competitiveefforts on marketing and sales effort rather than the variables that are relevant from the point ofview of an enlightened policy-maker (extent of coverage of a health plan in the case of the privatehealth insurance system, net rate of return on a pension fund in the case of the private pensionsystem and quality of schooling in the case of the subsidized private schools). Nevertheless, therehave been important benefits from the privatization of social services. In the case of the privatepension system, the likelihood that politicians are able to misuse pension funds is far smaller, in-creasing the security of pensions. In the case of the health insurance and the private subsidizedschools, competition from the private sector has increased the visibility of public sector inefficien-cies, which is under pressure to improve its performance.
The rest of the paper is organized as follows. The next chapter analyzes the privatizationof state owned firms, and the effect on their performance, efficiency and other parameters. Thethird chapter is devoted to a qualitative assessment of privatization of regulated sectors. Firstwe analyze the privatized utilities and their sectors in more detail. Then we look at the privateprovision of infrastructure through franchises. The fourth chapter examines the privatization ofthe social sector, including health, pensions and education. The last chapter concludes.
8Of course, their decisions may be rational in a word where agents have limited rationality.
8

Chapter 2
The Performance of Privatized Firms
In this chapter we report the effects of privatization on 37 non-financial firms that were privatizedbetween 1979 and 1999. During this period 13 additional non-financial firms were privatized, butwe were unable the necessary information for this study. This is symptomatic of one of nega-tive features of the Chilean privatization process: the lack of transparency (Hachette and Luders(1994)). There are no public records of privatizations during the 70’s. Some of these firms wentbankrupt subsequently or became private corporations (i.e., without openly traded shares) so thatthey do not publish accounting information. Therefore, most of the usable data on privatizationfor Chile corresponds to the open-stock firms privatized since the early 1980’s which are requiredto publish financial information. Nineteen of the thirty seven firms in the sample belong to reg-ulated sectors, so their data is contaminated by the effects of regulation, while the remainder areusually dominant firms in their markets, or have sizable market shares.1 In this chapter we re-port both absolute and normalized (adjusted) changes in various performance ratios before andafter privatization. The normalization allows us to compare the behavior of privatized firms tothe performance of the sector to which they belong.
The next section describes the history of the nationalization and the privatization period. Thethird section describes the data and our treatment. The fourth section examines the effects ofprivatization.
1Of the 12 companies in the unregulated sector, four: CAP, ENAEX, LAN Chile and Soquimich are monopolies,while COLBUN, ENDESA and GENER represent almost all of the generating capacity in the Central interconnectedelectric system.
9

2.1 A brief history of the privatization of public enterprises
2.1.1 The era of state intervention
State participation in the economy has had a long history in Chile, even though it becomes reallysignificant since 1940. After the crisis of the 1930’s (according to Mamalakis (1976), Chile was oneof the countries that suffered most in the crisis), the country chose an import substitution strategyand more state intervention. Thirty years later, the government owned or controlled more than51% of 67 firms, 22 of which were created by law and 45 were under the control of the Corporacionde Fomento (CORFO), a government organization created to promote industrial production, seetable 2.1. These firms operated only in sectors that the State deemed too important to be leftto the market, or which were originally private firms that had gone bankrupt, with governmentintervention in order to save them.2
Table 2.1: State owned and seized firms
Type of firm 1970 1973 1983 1990 2000
Enterprises 66 251 44 40 37Banks 1 19 2 1 1Seized 0 325 0 0 0
Source: Hachette and Luders (1994). The number of firms for 1973 includes 37 subsidiaries of subsidiariesof CORFO and 112 firms in which CORFO held minority stakes. Data for 2000 compiled by the authors.
Corfo had been set up in 1939 to help economic development through the promotion of invest-ments. It operated through loans and loan guarantees to the private sector, through research anddevelopment of projects and eventually, through their implementation. In fact, Corfo establishedfirms that were deemed vital to development.3 Some of the main firms set up by Corfo wereEmpresa de Nacional de Electricidad (Endesa, 1944), Companıa de Acero del Pacıfico (CAP, 1946)la Industria Azucarera Nacional (Iansa, 1953), la Empresa Nacional de Telecomunicaciones (En-tel, 1964), Petroquımica Chilena (Petrox, 1967), Sociedad Quımica y Minera de Chile (Soquimich,1968), Celulosa Constitucion (Celco, 1969), Celulosa Arauco (1967) and Industrias Forestales SA(Inforsa, 1970). There were minority private shareholders in these firms (43% in the case of CAP).Corfo was also a minority shareholder in two other firms.
Among the firms created by law, there is Correo y Telegrafos, which has been public since
2For example, in 1965, value added in state related firms was just 14.5% of GDP.3However, Corfo may have only displaced private investment in those sectors.
10
before independence, Ferrocarriles del Estado, founded in 1851, Lınea Aerea Nacional, createdin 1931, Empresa Nacional del Petroleo (Enap), established in 1950, the Empresa Marıtima delEstado, separated from Ferrocarriles in 1953, the Banco del Estado, established in 1953 by themerger of state owned financial institutions established in the previous century, Empresa Nacionalde Minerıa, created in 1960, and the Empresa Portuaria de Chile, separated from the Customsoffice in 1960.
Table 2.2: Number of state owned firms
1973 1978 1983 1989 2001
State owned pre-1970 65 46 32 19 14Acquired 70 -73 113 34 1 0 0Created 70 -73 1 1 1 1 0Acquired 74-78 1 1 0 0Created 79-83 10 2 1Created 84-89 22 13Created 90-2001 10
SOEs 179 82 45 44 38
A change of policy occurred in the late 1960’s when the government started timidly acquiringprivate firms. Previously, all SOES’s have been created by the State itself, except for those troubledfirms unable to repay the CORFO loans. Codelco, was established in 1968 to acquire 50% of theshares in the four largest copper mines, where copper was the main export, representing morethan 80% of all exports. In 1970 Chilectra was acquired by Corfo, which meant that the Stateowned all of the electric sector. Moreover, in the period 1965-1970, 22% of the arable land (4.1million hectares) was expropriated in a land reform process. Most of the land was not transferredto the peasants (except for six hundred and two thousand hectares), but was kept in public hands(Rosende and Reinsten (1986)).
The path of state intervention in the economy accelerated in December1970, when a socialistgovernment took office with the professed aim of creating a vast state owned sector. The targetwas to acquire all firms whose equity exceeded US$500.000, in current dollars as well as all of thebanking sector, the import-export sector and all utilities. A majority in congress opposed this plan,so the government resorted to administrative measures and legal loopholes. First, Corfo offered tobuy shares in any bank or publicly traded firm. Given the uncertainty of the times, many investorsdecided to sell out (see table 2.2).
11

In the period 1971-1973, Corfo managed to buy a majority share in 113 industrial firms and14 banks, as well as a minority sharehold in 68 other firms and 5 banks, while creating only onenew firm (Transmarchilay). Therefore, in September 1973 the state was a majority controller in179 firms and 15 banks, and was a minority shareholder in 70 firms and 4 banks. Another 259firms were intervened or nationalized. In this case he government used pre-existing legislationthat allowed intervention or expropriation of firms when there was a threat of shortages. Themodus operandi was to have a strike in the firm, which was then taken over by workers. Since thefirm had stopped operations, there was a risk of shortage, which allowed the intervention of thegovernment.
To recapitulate, by September 1973, the government controlled 441 firms and 15 banks, andthere were few important companies in private hands (the firms under control of the state repre-sented almost 40% of GDP). In addition there were 66 agro-industrial plants and equipment builtand/or operated by Socoagro, a subsidiary of Corfo. The state owned 8.979 thousand hectares, ofwhich 5,873 had been expropriated in 1971-1973 (Larroulet (1984)) and the share of the State in theeconomy was growing apace.
2.1.2 The First Round of Privatization
After the coup of September 1973, the military government in power began to develop a strategyof economic liberalization. One of its aspects was the return to the original owners of the firmsthat had been intervened by government. During the year 1974, 202 firms were returned to theirowners and 39 were given back the next year, leaving only 18 firms to be normalized in the nextfew years. Hence, most of these firms were returned to their original owners by 1975, so theystayed in the hands of the government for only a few years and hence are not representative ofSOE’s.4 At the same time, the land that had been expropriated was privatized: 28% of the land,that had been expropriated illegally was returned to its original owners, another 52% was dividedinto small landholdings and sold to the peasants at subsidized prices (many of the peasants laterresold the land), while the remainder was privatized through public auction or was transferred tothe Corporacion Nacional Forestal ( Hachette and Luders (1994)).
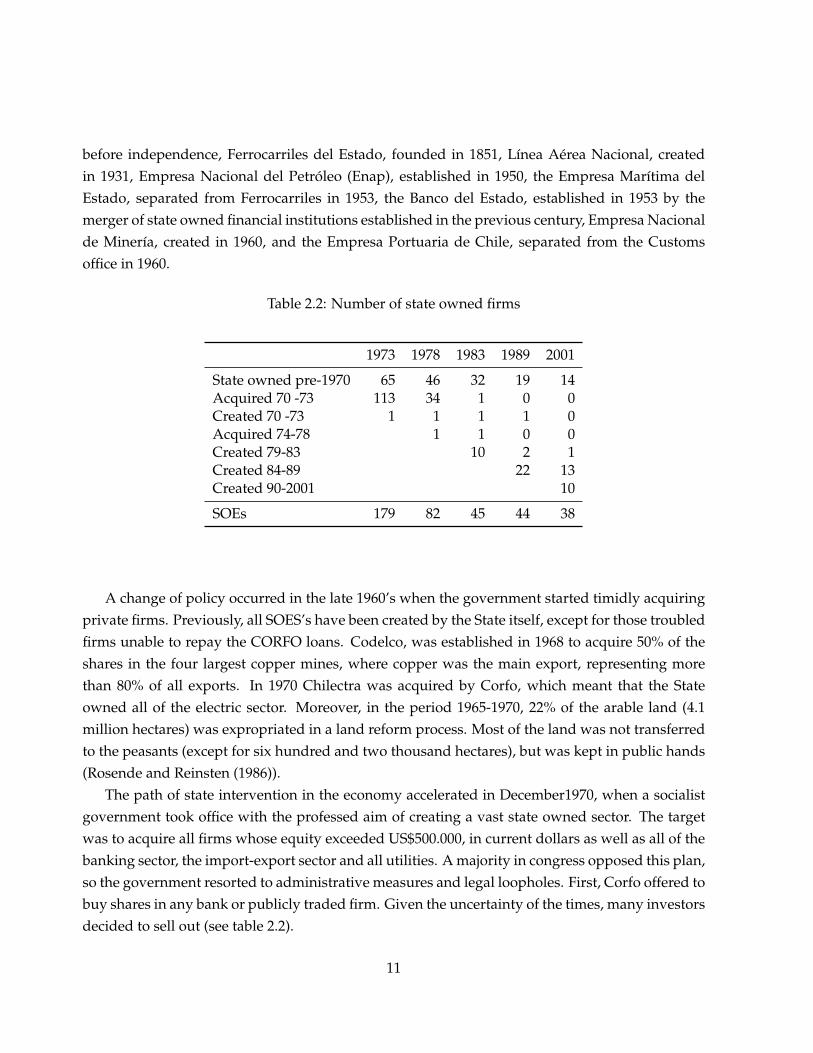
Between 1975 and 1977 the government privatized most of the firms that had been acquired in1971-1973. Most of the share holdings in banks were sold in 1976, leaving a few that were sold in1976. In the period 1975-1977, 70 state controlled firms were privatized, while 28 other firms wereclosed and its assets sold in auction (see table 2.3). By 1980, the state had control over only 10 ofthe 115 firms acquired by the socialist government. On the other hand the military dictatorshipdecided to keep the largest electric and telecom companies. The same strategic reasons made
4See Saez (1996), Meller (1996).
12
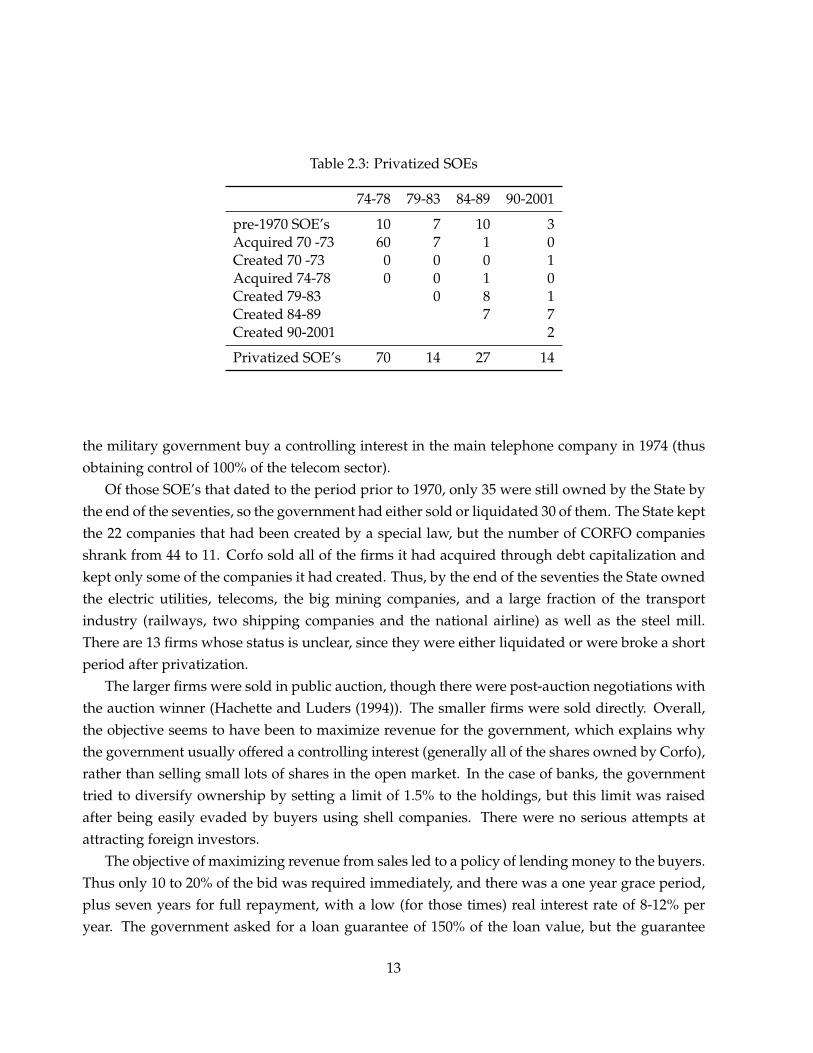
Table 2.3: Privatized SOEs
74-78 79-83 84-89 90-2001
pre-1970 SOE’s 10 7 10 3Acquired 70 -73 60 7 1 0Created 70 -73 0 0 0 1Acquired 74-78 0 0 1 0Created 79-83 0 8 1Created 84-89 7 7Created 90-2001 2
Privatized SOE’s 70 14 27 14
the military government buy a controlling interest in the main telephone company in 1974 (thusobtaining control of 100% of the telecom sector).
Of those SOE’s that dated to the period prior to 1970, only 35 were still owned by the State bythe end of the seventies, so the government had either sold or liquidated 30 of them. The State keptthe 22 companies that had been created by a special law, but the number of CORFO companiesshrank from 44 to 11. Corfo sold all of the firms it had acquired through debt capitalization andkept only some of the companies it had created. Thus, by the end of the seventies the State ownedthe electric utilities, telecoms, the big mining companies, and a large fraction of the transportindustry (railways, two shipping companies and the national airline) as well as the steel mill.There are 13 firms whose status is unclear, since they were either liquidated or were broke a shortperiod after privatization.
The larger firms were sold in public auction, though there were post-auction negotiations withthe auction winner (Hachette and Luders (1994)). The smaller firms were sold directly. Overall,the objective seems to have been to maximize revenue for the government, which explains whythe government usually offered a controlling interest (generally all of the shares owned by Corfo),rather than selling small lots of shares in the open market. In the case of banks, the governmenttried to diversify ownership by setting a limit of 1.5% to the holdings, but this limit was raisedafter being easily evaded by buyers using shell companies. There were no serious attempts atattracting foreign investors.
The objective of maximizing revenue from sales led to a policy of lending money to the buyers.Thus only 10 to 20% of the bid was required immediately, and there was a one year grace period,plus seven years for full repayment, with a low (for those times) real interest rate of 8-12% peryear. The government asked for a loan guarantee of 150% of the loan value, but the guarantee
13

could be in the form of the shares in the company. In the case of banks, the minimum paymentwas 20% (on average 23% was paid up front) and the loan had to be paid in full within two yearsat a real interest rate of 8%. The government offered easy conditions because the private sectorwas still very undercapitalized due to the effects of the policies of the early 70’s.
2.1.3 The Crisis of the early 80s
Most financial firms, as well as several banks that had been privatized in the period 1975-79, weretaken over by the State during the economic crisis of 1981-83. Beginning in 1981, several banksbecame effectively broke because they could not recover loans from troubled companies, many ofthem related firms, which were either broke or had suffered severe losses.5 In November 1981,the government took over four banks and two more banks in 1982, all of which were later closed.In January 1983, the government had to take over 8 additional banks that had failed to repayinternational loans (three of these banks were later closed down). Ironically, most of the financialinstitutions that had been privatized during 1975 and 1976 representing 55% of all financial assets,were again being run by the State in the early 80’s (Rosende and Reinsten (1986)).
By December 1984, the accumulated losses of the financial sector represented more than 200%of the sector’s equity and reserves, and 18% of GDP (Valenzuela Silva (1989)). In order to continueto have access to international credit markets, the government had to guarantee all foreign loansof the banks that it had taken over while rescuing local depositors. The government also tookover many non-financial companies, as well as the private pension funds (AFP) that were linkedto the troubled banks, either because they had unpaid loans from the banks or because they wereowned by the same economic conglomerates (Rosende and Reinsten (1986)). Between 40 and 90firms were taken over by the State, giving rise to the so called “area rara” (the weird sector). Hencein the 1982 crisis, the state became once more the controller of many previously privatized firms.This new period of state control was fairly short and firms were not considered to be truly stateowned.
The trigger of the crisis had an international origin (a large raise in the prime rate in 1981 plus amoderate fall in the terms of trade), but the impact was amplified by serious mistakes in economicpolicy, some of which were related to the privatization process. The Chilean financial systemwas fragile so the rise in interest rates, coupled to the stoppage in capital inflows, weakenedthe new conglomerates, most of which had high debt to asset ratios. The mechanism used forprivatization in the 70’s led to concentrated property holdings and gave rise to economic groups(conglomerates) that were highly leveraged (see Sanfuentes (1984)). In many cases, the buyersof banks used bank deposits to pay the loans incurred in buying the banks. When firms were
5Related firms are those that belong to the same conglomerate.
14

privatized in the period 1976-1977, the new owners of banks again used their client’s deposits orloans from other financial institutions to buy the firms. As we have mentioned, the buyers wererequired to put up collateral for 150% of the loan used to buy state owned firms, but shares inthe firm could be used as collateral. In this way, large and highly indebted conglomerates wereformed.
The lack of regulation in the banking system made it easy to lend money to related firms andeven when restrictions were imposed, they were easily eluded. In the case of the two main banks,21% and 50% of all loans went to members of the conglomerate. The bank regulator did not keeptrack of the quality of the loan portfolio. Ideology played its part in the lack of regulation, sincegovernment economists argued that if the banks were receiving deposits, private investors musthave decided that the projects to which the banks were loaning money were profitable, and reg-ulation was unnecessary. However, the regulator failed to realize the effect of implicit depositinsurance on their assumptions. In 1976 depositors in a newly privatized failing bank were pro-tected from losses and this created the perception among depositors of an implicit state insurance.Moreover, investors in the conglomerates believed that they were too large to fail (Vergara (1996)).Regulatory changes in order to monitor the quality and supervise the concentration of bank loanswere only put in place in 1982, while a stringent new banking law was introduced in 1986.
In addition to the financial resources from their affiliated banks, the two largest conglomer-ates managed mutual funds (82%), insurance companies (53%) and pension funds (68%) that gavethem even more control over the economy (Sanfuentes (1984)). These institutions would buyshares of firms in the conglomerate, thus raising share prices. The indebtedness of the conglom-erates was due in part to the level of real interest rates in the period 1975-1981, which were highbecause of the excessive demands for credit of the conglomerates in order to buy even more pri-vatized firms. The high real rates were compensated by capital gains in the stock market. In 1981the government allowed banks to contract loans abroad which led to a rapid increase in indebt-edness. Firms which had access to international loans obtained credit at much lower rates thansmaller firms with no access. In less than two years foreign debt doubled, with the two largestgroups holding 52% of the debt.
Starting in 1985, the banks that had been taken over began to be privatized once again. Pre-ferred shares representing 70% of equity were sold to new buyers. The banks sold their bad loansto the central bank and were recapitalized. In return, the Central Bank became a claimant in futureprofits in the banks6 When selling the two major banks, the government strove to create a broadbased class of shareholders, for two reasons: to provide stability and to make it more difficultto revert the privatization process. The mechanism was the so called popular capitalism: buyerswere only required to put 5% down, while Corfo gave them a 15 year loan for the remainder.
6In other words, the Central Bank exchanged fresh money for a claim on profits.
15

There was a one year grace period at zero real interest rate, there was a 30% discount for timelyrepayment of the loan and generous tax benefits. There was a limit to the number of shares perbuyer (and limits were enforced). Three additional banks were sold to groups of investors.
The two main conglomerates had been the owners of the larger AFPs (Provida, Santa Marıa,San Cristobal y Alameda), which held 68% of worker’s funds. The two largest (Provida and SantaMarıa) were sold via the popular capitalism scheme (without the tax benefits). Aetna, whichowned 49% of AFP Santa Marıa, was sold enough shares to get control, while the rest went tosmall buyers. Banker’ Trust bought 40% of the shares in Provida, with the remaining shares goingto small buyers. The other two AFPs were merged and auctioned under the name of AFP Union.
After their recapitalization, the government also auctioned the other firms it had taken over.In most cases, a controlling package was auctioned, but in contrast to the procedure of the 70’s,the government required that payment be upfront. The major companies were bought by localconglomerates in association with foreign investors. In order to increase the attraction of the auc-tions to foreigners, they were allowed to pay with Chilean bonds that were selling in the marketat 60% of par value. Unfortunately, there is little information about the detailed transactions ofthat period, as there seem to be no clear records.
2.1.4 The Privatization of the historic SOEs (1985-89)
During the period 1985-1989, the government privatized 27 firms and closed down three othercompanies, while creating 29 companies through subdivisions of larger SOEs. Only three of thenew SOEs were entirely new (Zofri, Metro and Cotrisa). In particular, eleven water and sewagecompanies were created from the national water works. The firms that were sold in this periodwere pre-1970 SOEs or firms that were spin-offs of pre-1970’s SOEs, created in order to be priva-tized. The State sold 12 pre-1970’s SOEs and 14 firms that were spin-offs of SOEs as well as twoother firms that were acquired in the 70’s and had been kept for strategic reasons. Most of the firmsold in this period were utilities and included 13 electric and 3 telecommunications companies.
There were four different mechanisms for privatization in this period First, best price offersfor the firm or for controlling packages in open international auctions. The second mechanismwas the auction of non-controlling packages of shares on the stock market. A third mechanismwas the direct sale of shares to the workers of privatized companies, public employees, and smallinvestors, the so-called labor and popular capitalism. Workers and public employees financedthe purchases of shares by using their severance benefits and loans from public institutions atsubsidized interest rates. Private pension funds participated in the privatization process throughthe acquisition of packages of shares in the stock market. Finally, public utility users that neededto interconnect to the system or increase the capacity of their connection were required to pay for
16

Table 2.4: Revenues from privatization of Chilean Public Enterprises 1985-1989, (US$ MM)
1985 1986 1987 1988 1989 Total
13 Electric Firms 16,4 124,3 393 632,5 77,9 1244,13 Telecom Firms 0,9 55,6 35,5 344 192,1 628,1Soquimich 4,7 85,4 71,5 60,9 0,0 222,5Cap 12,1 139,5 53,2 0,0 0,0 204,8Ecom 3,2 0,2 0,0 0,0 2,8 6,2Iansa 0,0 8,8 1,0 50,8 8,0 68,6Labchile 0,0 2,8 3,8 18,1 3,1 27,8Schwager 0,0 0,0 6,1 2,2 7,0 15,3Enaex 0,0 13,4 0,0 0,0 0,0 13,4Isegen 0,0 0,0 0,0 0,0 5,6 5,6Lanchile 0,0 0,0 0,0 7,0 75,9 82,9Chilefilms 0,0 0,0 0,0 4,5 0,0 4,5Isevida 0,0 0,0 0,0 0,0 8,8 8,8
Total 37,3 430 564,1 1120 381,2 2532,6
Source: Corfo Annual reports. US$ of 31/12/1995.
the infrastructure, in return for shares in the company (Bitran and Saez, 1994).
2.1.5 Privatizations during the 90s
The first elected government after the military regime (1990-1994) stopped the privatization pro-cess almost completely, in contrast to the second elected government (1994-2000) which gave anew impulse to the privatization process. In the period 1994-2001 fourteen companies were pri-vatized while four were closed down. During the same period twelve new firms were created,ten of them being subdivisions of Emporchi, the port authority. By late 2001, 38 firms remained inpublic hands, of which fourteen were pre-1970 SOEs and 24 had been created after 1980, mainly bysplitting traditional SOEs. The current SOEs include the largest copper mining company, the oilrefinery, nine regional water and sewage companies, the post office, the subway, a copper refinery,ten ports, the post office and a commercial bank.
Between 1994 and 2000 the government used public auctions to sell all the state owned trans-portation companies: two shipping companies (Empremar and Transmarchilay), a cargo railwaycompany in the northern part of the country (Ferronor), the cargo railway company in the CentralZone (Fepasa), and sold the remaining 27% of the national airline in the stock exchange. Ferronor
17

bought the northern rail system, which consists of several lines that run from mines in the Andesto ports and carry minerals. It has been a successful company. Fepasa got the cargo concession inthe rail system south of Santiago, but the lines were kept by the State (which also kept the moneylosing passenger rail system). Unfortunately for this second company, the rail lines were in worseshape than expected, as was the case with the rolling equipment. Moreover, its holding companyhad financial problems and initially Fepasa made some commercial mistakes. Hence, it is onlyafter several years in private hands that it has been able to achieve positive operational flows.
During this period, the State also completed the privatization of the electric sector. Edelnor wasprivatized in the period 1991-1994. In 1995 Codelco, the State-owned copper mining company,hived off and then sold its thermal power plant (Tocopilla). A 37,5% stake in Colbun was sold in1996. Before the sale just over 15% of Colbun was traded on the stock market. In December 1997the government auctioned 4,65% of Colbun in the stock market, and repeated that performance in2001, selling its remaining shares. The government also privatized a radio company.7
The two most important privatization of the 90s, were those of the three largest water andsewage companies. The military regime did not privatize sanitation services, unlike the case ofother public services. The need to raise tariffs significantly before it became feasible to privatizethese services was a hindrance to the sale of the water companies. The military government feltthat privatization followed by a substantial price hike would have been politically unpopular. Infact, in the late 1980s, water rates were on average less than half of what was needed to financeprovision of the service, with prices covering less than 20% of outlays in the desertic northernregions. Prior to privatization, however, charges had to be raised so that the water companiescould cover their costs.
Sectoral modernization began in 1977, with the creation of the Servicio Nacional de Obras San-itarias (Sendos). This service absorbed several agencies belonging to different ministries and madeit possible to reduce the workforce from 10,000 to 3,000. Apart from regulatory responsibilities forthe whole sector, Sendos charged with providing water services in the regions. In the same year,state-owned water companies were set up in the Santiago Metropolitan Region (Emos) and in theVth Region (Esval), based on pre-existing small companies. In 1989 eleven regional joint-stockcompanies affiliated to the state development corporation (CORFO) were created out of Sendos.
In 1988, a new regulatory framework was set up for the sector, closely matching its electricitysector counterpart. The new rate system allows for the self-financing of efficient firms. Pricingzones with relatively homogeneous costs were also established. The new pricing system wasintroduced gradually in 1990, and charges rose by an average of 90% in real terms between 1990
7The only valuable asset in this company were the rights to the FM spectrum, which were sold separately under al-legedly questionable circumstances. The remaining AM frequencies were not valuable and the company went bankruptvery shortly.
18

and 1994, although by this time the rate adjustment process was still not complete in all regions.The price rise was steeper in areas with higher costs, exceeding 500% in some cases, and by 1998average regional water rates ranged from US$0.43 to US$ 1.21 per cubic meter. Arrears were cutfrom 7.9% in 1990 to 2.9% in 1994, as a result of a business oriented approach and by the possibilityof cutting off service to customers in arrears. In 1994 the average rate of return on equity amongpublic water companies was 6.3%.
The Frei government decided to privatize water companies. However, it wanted to strengthenthe regulatory framework before selling the firms, since it was not totally satisfied with the waythe regulation of privatized public utilities was working. In 1995 the government sent a bill toCongress improving the rate settlement process. Congress approved the bill in December 1997,after a prolonged and heated debate, since it was assumed that the bill was in preparation forprivatization.
The privatization of the water sector begun in 1998. Since then the three mayor water andsewage companies have been sold. A scheduled rate revision took place in the two major sanita-tion companies after privatization. The tariff revision resulted in a 20% increase in the tariff ratesof both firms. The increase is more or less in line with the 10% cost of capital estimated for thesector (the public firms had a 7% rate of return on equity), and the selling prices reflect these num-bers. The privatized firms are investing in sewage treatment plants and this will lead to furthertariff increases. Currently (2002), the government is in the process of franchising its remainingwater and sewage companies.
2.2 Data on Privatized Chilean Firms
Given the history of the privatization process described above, the data are difficult to obtainin usable form. We excluded from our analysis privatizations that took place between 1975 and1979. First, because most firms that were privatized during this period had been managed by thegovernment for only a few years. Furthermore, the political and economic turbulence of the 70’srenders available information highly idiosyncratic. In fact, economic data from 1971 to 1973 showsignificant distortions, and the economic recovery did not start until 1976. Moreover, accountingstandards were laxer and were changed in 1982. Hence in this paper we focus on the 54 firmsprivatized in the period in the 1979-2001. Two of these are insurance companies and are thusexcluded from the sample, which includes only non-financial firms. Two water companies thatwere privatized in 1999 have also been excluded, since there is only one year of post-privatizationdata. Of the remaining fifty firms, only thirty-four are publicly traded in the stock-exchange andthus are obliged to provide financial information to the public, while the other 16 have no public
19

Table 2.5: Status of privatized firms 1983-2000
Status Type Number
Privatized 54Analyzed 37
Publicly traded 34Privately held 3
Not AnalyzedToo recent 2Privately held (no data) 13Financial 2
Source: Authors’ computations. One additional firm (Pehuenche), an hydro-electric project at the time ofprivatization, was merged with Endesa without ever operating independently.
disclosure requirements.8 However, we were able to have access to the information of three ofthe firms in the latter group (Fepasa, Empremar, Ferronor) and they have been included in thesample.9 This leaves 37 firms for which we have usable data (see table 2.5).
2.2.1 Data problems
The basic source of information are the standardized quarterly reports that companies with pub-licly traded shares (plus some other firms designated by law) must provide the Chilean Securitiesand Exchange Commission (SVS), the so-called FECUs. The FECU corresponding to Decemberincludes the annual financial report and other information, including the number of workers inthe firm.10 FECUs have been required for the last 20 years and are available in digital form.11
Previous to important changes in the accounting standards introduced in 198212, the accountinginformation of firms was not standardized and is thus less descriptive of the true financial status of
8Some of these sixteen firms had never been publicly traded, while others were taken off the stock market (i.e.,became private or “closed”) after privatization.
9This is a very slow process, since the firms are not required to provide the information. Obtaining data for Empre-mar, Fepasa and Ferronor took almost three months, because it required obtaining information not only from the firmsbut also from the original state-owned firm.
10Another interesting source of information at the plant level is the INIA survey, which registers quarterly dataon many of the variables of interest for this study. Unfortunately, secrecy considerations imply that the informationprovided by the National Institute of Statistics (INE), which owns the survey makes it impossible to use the data forour purposes. The INE refuses to provide information on whether a particular plant was ever privatized, so we wereunable to use this rich data source for this study.
11The digital form does not include the number of workers, which must be reconstructed from the FECUs in paperform.
12Circular 239, Superintendencia de Valores y Seguros (1982).
20

firms. An additional source of information were the annual company reports. However, the datain the annual reports is not standardized, and is therefore less useful.
There is no source for the following data at the firm level: number of white and blue collarworkers, average wages, salary differentials and output price indexes. Another important datalimitation is that there are no readily available physical data, since only output of some productsare described in the annual reports, and the products themselves change between annual reportsand, finally, we have no price index of these products. As an example, a steel company mightproduce steel in ingots and liquid form, iron ore and other products. Should we assume thatphysical productivity has gone down because steel ingots per worker have fallen, or is it due to achange in the demand for ingots as compared to liquid steel, for instance?
In principle, one might look at sales per worker as an index of productivity, and we do thisin the paper. However, most of the firms we analyze are either regulated or face very few com-petitors, so that prices are not competitively based and more sales per employee after privatiza-tion could be due either to higher prices or to higher productivity, or to a combination of bothfactors. In our analysis, in addition to working with the whole sample of firms, we analyze theperformance of the group of regulated and unregulated firms. Our definition of a regulated firm isslightly ad-hoc: if the government, through interventions in the market or though tariff regulation,has the ability to change the profitability of a company.13 This implies that all electric distributioncompanies are regulated for our purposes, as are local and long distance telephone companies.14
IANSA, the monopoly sugar refinery, is a doubtful case, since the government, sets the price it cancharge for sugar through a price stabilization mechanism known as “bandas”.15 We have com-pared the results obtained by assigning IANSA to either group (regulated or unregulated) andthere are no major difference between the two cases.
In order to measure the impact of privatization on firms we exclude the two years immediatelyprior to and post privatization. There is a potential cleansing effect in the accounts before thesale of the company, while the years following privatization could not be representative of thepost-privatization performance if the firm is still undergoing a reorganization process. Hencewe compare years three to five prior to privatization with years three to five post privatization.Nevertheless, we have examined the data in the three years prior to privatization, in order to geta feeling for the cleansing effect described in La Porta and Lopez-de Silanes (1999).
13We have included the electric generating companies among unregulated firms because they sell a large fraction oftheir energy in unregulated long term contracts.
14Telex, a long distance operator, was not regulated during the period under consideration.15IANSA has a powerful lobby among southern landholders.
21

2.2.2 Treatment of Mergers and demergers
Using data three to five years prior to and post privatization creates a set of problems. Somefirms were spun just a short period before being privatized. For instance, Chilectra was dividedinto three firms prior to privatization. Six regional distribution companies, Colbun and smallergenerating companies were spun off ENDESA. The problem is that pre-privatization FECU’s forthe newly independent firms do not exist and therefore it is not straightforward to determine thechange in performance due to privatization. Similarly, in the case of mergers, we do not have post-privatization independent FECU’s. In these cases we have to rework the data in order to assignthe assets of the original firms to each daughter firm. Conversely, when the firms are merged wehave to “disassemble” the merged firm into its original constituents.
The procedure we follow is to assign the different variables in proportion to their fraction ofthe merged firm at the time of privatization. For example, suppose that Firms A demerges fromfirm Z and both are privatized. In order to obtain data on a variable prior to privatization, take thedata at privatization, and consider the proportions of that variable for the combined firm. Thenassign the data in the combined FECU or variables not in the FECU (prior to privatization), inthose proportions. A similar procedure is used in order to analyze data for merged firms.
2.2.3 Data adjustments
In order to eliminate the effect of economic conditions on the performance of firms, we also presentnormalized comparisons. Firm performance ratios are normalized by subtracting the average val-ues of the two-digit SIC group to which it belongs. Although the two-digit decomposition encom-passes widely differing industries, going to more digits in the decomposition would not have beenuseful, since the firms in question represent most if not all of the industry at more detailed SIClevels. We have subtracted the two-digit averages rather than used ratios because of the extremevariations in these ratios, which would have given excessive weight to some observations. More-over, the interpretation is simple: if an adjusted ratio for a privatized firm is negative, the ratiois worse than the average of that variable in its (two-digit) sector. Some two-digit average ratioshave been treated differently because of the extreme variation in the data. For example, considerthe ratio Net Income/Sales (or PPE) for a small timber company in the control group that sells aforest. This is a non-operational income, there are very few sales, and the ratio of net income tosales is astronomical. In these cases we have taken the sum of net income for firms in the controlgroup and divided it by total sales of the firms in the control group to obtain a more reasonableresult.
22

Table 2.6: Net income to equity, privatized SOEs
Firm 1970 1974 1979 1983 1986 Year Privat.
CAP 10.9 0.5 0.2 0.7 2.3 1986Chilectra 0.5 -3.2 2.6 4.6 – 1986CTC 0.7 -4.1 1.7 11.9 10.9 1987ENDESA 0.3 -4.3 2.4 6.4 4.9 1988ENTEL -0.7 -3.4 12.3 13.0 35.4 1988IANSA -9.3 12.1 -9.8 -24.0 5.5 1988Lab. Chile 4.1 7.9 0.5 -196.4 12.8 1989Soquimich -65.3 11.9 -7.9 10.1 30.8 1986
Source: Saez (1996).
2.3 Effects of privatization on Chilean firms
We analyze the firms before and after privatization both in terms of absolute performance andby comparing them to a benchmark given by the average behavior of their sector at the two-digitlevel, as we have mentioned before. The first part of the analysis in each subsection is devotedto unadjusted data. Perhaps the most interesting result we obtain is the difference between theperformance of regulated and unregulated firms. The detailed tables and graphs with the pre-and post-privatization performance appear in the appendix.
2.3.1 Profitability
Prior to privatization, in contrast to Mexico (see La Porta and Lopez-de Silanes (1999)), SOE’swere fairly profitable. Most of the large SOE’s that were privatized were profitable, as shown intable 2.6, so the firms did not have to go through the large changes that were required in othercountries. Even though on average privatized firms were profitable, several smaller firms (and afew large ones such as ENDESA in 1985) did have losses prior to privatization. If anything, at thetime there were complaints that the government was selling the crown jewels. Hence, the scopefor efficiency benefits from privatization was relatively small.
Using table 6.1, which is analogous to the first part of table IV in La Porta and Lopez-de Silanes(1999), we can analyze profitability before and after privatization. If we consider the profitabilityvariables: Operating income to sales (OI/S), Operating income to physical assets (OI/PPE), Netincome to sales (NI/S) and Net income to physical assets (NI/PPE), we observe that there seemsto be a significant change in the profitability ratios before and after privatization. In particular, we
23

observe that NI/S rose from less than 2% to 13% on average and that NI/PPE rose from less thanfour percent to more than 16%. Moreover, the profitability measures are strongly positive.
However, this change in profitability is mainly due to the change in the results of regulatedfirms.16 While the profitability ratios improve for the group of unregulated firms, there is enoughvariation in the results that we cannot show that the change is significant. The important ratioNI/PPE increases from a low 4% to a fairly reasonable rate slightly above 12%. By contrast, in thecase of regulated firms the change in profitability ratios is far more important. The ratio NI/PPErises from 3.5% to 20.5% and the same pattern of large increases in profitability of regulated firmsoccurs for the other profitability ratios.
When we consider adjusted variables (see Table 6.4), obtained by normalizing the profitabilityratios by subtracting the ratio of their sector, we find that the improvement is less significant.This implies that part of the improvement observed in the previous paragraph can be largelyexplained by a simultaneous improvement in the profitability of the sector. Nevertheless, the netincome ratio NI/PPE for the sample of firms rises from 1.5% above the average in the sector toalmost 10% above average for the sector. What is interesting is that the profitability ratios withrespect to sales are not significantly different from that of the industry as a whole, which seems toindicate that the increased profitability is related to a better use of physical assets, or alternatively,to overinvestment prior to privatization.
As in the case of non-adjusted variables, most of the change in profitability is due to the in-crease in the profitability ratios of the regulated firms. While there is an increase in adjustedprofitability of non-regulated firms after privatization, the increase is non-significant. Moreover,the profitability of these firms is not significantly different from that of the other firms in theirsector. By contrast, all adjusted profitability ratios except for NI/S increase significantly after pri-vatization in the group of regulated firms. Moreover, these firms, which had average profitabilitysimilar to that of their sectors, became much more profitable afterwards, which seem to indicatethat the regulators were unable to pass the gains in efficiency to consumers.
2.3.2 Efficiency
Efficiency is described by the cost per unit (Cost/Sales) and by the sales to physical assets (S/PPE)ratio shown in Table 6.2. The cost per unit ratio falls by a small but significant amount at the10% level for the sample of privatized firms. The S/PPE ratio falls slightly but non-significantly.Once again, there is a large difference in the behavior of regulated and non-regulated firms. Costper unit falls significantly for regulated firms, while it barely changes for non-regulated firms.
16As we have mentioned before, IANSA is assumed to be non-regulated, but results do not change if we group itamong the regulated firms.
24
Similarly, S/PPE ratio increases significantly (at 10%) for the regulated firms, whereas it falls fornon-regulated firms.17
When we examine adjusted efficiency ratios, see Table 6.5, we observe that there is no differ-ence between the privatized firms and the cost per unit in their sectors and there is no changepost-privatization. Moreover, for this ratio there is no difference between regulated and unreg-ulated firms. Things are different for the S/PPE ratio, since the firms in the group of privatizedfirms seem to have much higher ratios than the average for their sector.
2.3.3 Assets and investment
Table 6.3 shows variables related to assets and investment. The average value of the logarithm ofphysical assets (the log of the geometric mean of PPE) shows an increase that is non-significantafter privatization. In fact the change is concentrated in the regulated sector, where the increasein physical assets is significant. The investment to sales ratio (I/S) fell significantly (at 10%) afterprivatization, which seems to imply that firms invested more productively. Again, the big changelies in the regulated sector, where this variable fell from a value of 1.92 to 1.43 on average (compareto 1.84 to 1.79 in the non-regulated sector). An alternative explanation is that SOEs that operatedin a competitive setting were investing efficiently before privatization so there was not that muchscope for improvement.
The ratio of investment to physical assets (I/PPE) for the whole set of firms remained con-stant, but again there is a difference between regulated and non-regulated firms. There was anon-significant fall in this ratio for the non-regulated firms and an increase for regulated firms(again, non-significant). The ratios of investment and physical assets per employee increased sub-stantially after privatization: workers had access to better equipment. What is interesting here isthat it is in the non-regulated firms that the increase is significant.
When we consider adjusted ratios (see Table 6.6, there are no significant changes in the behav-ior before and after privatization. The only important difference is that first, the privatized firmsare much larger than the average for their sectors and the I/PPE ratios is also significantly higher.However, in the case of this last variable, this holds only for regulated firms.
2.3.4 Productivity
In Table 6.2 we have the productivity ratios of sales to employees and operating income to em-ployees. Both these ratios show that productivity increased significantly as firms became private,
17In a personal communication, R. Luders observed that he had not been able to detect improved performance inprivatized firms in Hachette and Luders (1994). His explanation was that managers of state owned firms were ideolog-ically committed to efficiency during the 80’s. For further evidence of this, see table 6.1.
25

as expected. However, once again, most of the change was due to the behavior of regulated firms,whose sales to employment ratios increased by 88% and whose operating income to employmentratios rose by 325%. We were unable to obtain employment data for all firms in a sector at thetwo-digit level, so we have not compared the growth in productivity of privatized firms with thefirms in their sectors.
We have also examined physical productivity for firms for which we could obtain measuresof physical product (tons, passenger/km, GWh, etc) in table 6.8. We have used these variables toconstruct productivity ratios and then we have taken the percentage difference before and afterprivatization. The results show that firms increased their productivity by about 25% on averageafter privatization, but there is enough variation in the data that this is not significant for the wholesample nor for regulated or unregulated firms separately. However, some caution is required inthe use of this data: most firms have more than one line of production, and therefore a fall inphysical productivity on the basis of one product may mean nothing. As an example, Lan Chileseems to have decreased its productivity in terms of passenger/km after privatization. However,after privatization, the firm began a successful cargo branch, whose revenues are about the sameas as those in the passenger segment of the company. Therefore, the data in this section may showthat productivity has increased in physical terms, but unless we have the prices of these differentproducts and their production, this comparison is not very informative.
2.3.5 Employment
As can be seen from table 2.7, there is no evidence that firms fired workers during the period inthe period 1983-1992, which includes the year that the firm was privatized. In fact it appears thatfirms increased the number of workers on aggregate. Moreover, it is clear that SOEs reduced theiremployment levels years before they were privatized (more than three years in most cases). How-ever, different firms were privatized at different times, and therefore it is interesting to see if thiscontinues to hold for the complete sample of privatized firms, considering the time in which theywere privatized. To examine this issue, we use table 6.7. Again, there is no evidence that firmsfired workers after privatization. Employment increased slightly but non-significantly after pri-vatization: the average firm grew from 1193 to 1381 employees. Both regulated and unregulatedfirms grew in size. Note that on average, non-regulated firms are larger.
26

Table 2.7: Employment changes in privatized firms
Firm 1970 1973 1979 1983 1986 1992 Privatized
CAP 7025 11637 9321 6519 6667 9643 1986Chilectra* NA 4250 4196 3846 4133 4712 1986CTC 5887 7252 7206 6338 6938 8504 1987ECOMa 188 341 333 165 149 NA 1986ENAEX 344 340 394 388 470 NA 1987ENDESA* 6512 8504 4270 2705 2905 2980 1988ENTEL 1161 1458 1236 1338 1402 1748 1988IANSA 2827 2881 1597 1079 2027 1561 1988Lab. Chile 3608 4546 2059 1372 883 797 1989Soquimich 10814 10684 7109 4096 4704 3242 1986
Source: From Saez (1996). Data for 1992 from FECU’s. Data for Endesa (apart from 1970) from Hachetteand Luders (1994) (for the principal office, and the last year is 1989). Data for Chilectra from Saez (1996)
except for 1986 and 1992. Those years obtained by aggregation of all the firms that were originally part ofthe firms in 1980 using data on Hachette and Luders (1994) for 1986. a: ECOM went bankrupt before 1992.
27

Chapter 3
Privatization of Regulated Sectors
3.1 The Efficiency of Privatized Utilities
In this section we provide an assessment of the privatization-cum-regulation process carried outat electricity and telecommunications companies between 1985 and 1989. The evaluation consid-ers the aims of the privatization, namely to provide capital for expansion of utilities that the Statewas not able to fund at the necessary level, to enhance the efficiency of enterprises, and to trans-fer those efficiency gains to consumers. In the previous section we saw that SOEs increased theirprofitability and efficiency after privatization. These changes, however, are in line with those ofthe rest of the economy. But firms that provide regulated services stand apart. Their profitabil-ity increased more than those of non-regulated firms. This difference has to be attributed to theinterplay between privatization and regulation.
3.1.1 The Privatization Process
The government privatized most of the telecom and electricity industries between 1985 and 1989.Some of the smallest companies were sold through public auctions. Larger firms were privatizedthrough different mechanisms: sale of shares in the stock market; the periodic auction of pack-ages of shares on the stock market, and the direct sale of shares to employees of privatized firms(labor capitalism), public employees and small investors (popular capitalism). Pension funds,company’s employees and foreign investors acquired most of the shares.
In the late 1970s, the telecommunications industry was dominated by two public enterprises:CTC, which provided basic telephone service throughout almost the entire country, and Entel,the only international long-distance provider. 1 The State also owned two regional local telephone
1These two companies shared the domestic long-distance market.
28

Table 3.1: Privatization of Chilean Telecom Companies 1984-1989 (UU$ Millions December 95)
Company 1985 1986 1987 1988 1989 Total
Entel 0.2 36.7 8.4 81.8 105.0 232.2CTC 0.7 4.7 27.1 262.2 87.1 381.7Telex 0.0 14.2 0.0 0.0 0.0 14.2
Total 0.9 55.6 35.5 344.0 192.1 628.1
Source: CORFO Annual reports
companies (CNT and Telcoy) and Correos y Telegrafos, which provided telegraph service. In 1982,the Government sold Telcoy and CNT in public bidding, and both were acquired by VTR, a localtelegraph operator. However, the privatization of the large telecom firms only started in 1995.By the end of 1987 25% of the equity of CTC was in private hands. In 1988 the government sold45% of the ownership of the company to a foreign investor. In the case of ENTEL, in 1995 and1996 the government sold 30% and 3%, respectively, of its shares, most of which was acquired bypension funds. In 1988, the State further reduced its stake in Entel to 37.7%. This time, companyworkers were the main purchasers(12.5%). The revenues from the privatization process of themain telecom firms appear in table 3.1.
The privatization of the two largest electricity companies (Endesa and Chilectra) also startedin 1986. In order to create competition in the wholesale electricity market they were restructuredprior to privatization. The restructuring involved separating distribution from generation. En-desa, the largest company, was divided into 14 companies: six generating companies, six distribu-tion companies, and two small isolated companies combining generation and distribution in thesouthern part of the country. Chilectra was divided into three firms: a generating company, andtwo distribution companies. Most of the firms were under private control by 1989. The revenuesfrom the privatization process of the main telecom firms appear in table 3.2.
3.1.2 The Regulatory framework
Some services provided by utilities were considered to be natural monopolies and therefore thedevelopment of regulatory institutions preceded their privatization. Regulatory bodies were cre-ated in the late 1970s for each sector: the National Energy Commission (CNE) and the Undersec-retariat of Telecommunications, respectively. They are responsible for granting operating licenses,monitoring technical standards, and setting rates for services where competition is insufficient.Regulation, operation, and, to some extent, policy-making had previously been in the hands of
29

Table 3.2: Privatization of Electric Companies 1984-1989 (US$ Millions December 95)
Sector Company 1985 1986 1987 1988 1989 Total
DistributionChilmetro 10 36 83,3 0 0 129,3Chilquinta 2,4 11,1 18,7 0 0 32,2Emec 0 6 7,5 0 0 13,5Emel 0 7,9 0 0 0 7,9Emelat 0 0 9,7 0,9 0 10,6Emelari 0 0 0 0 3,1 3,1Eliqsa 0 0 0 0 4,8 4,8Elecda 0 0 0 0 6,1 6,1
Generation*Endesa 0 0 180,0 585,4 63,8 829,2Pullinque 0 0 62 0 0 62Chilgener 4 22,2 31,8 33,8 0 91,8Pilmaiquen 0 41,1 0 0 0 41,1
IntegratedEdelmag 0 0 0 4,8 0,1 4,9
Total 16,4 124,3 393,0 624,9 77,9 1236,5
Source: CORFO annual memories.Note: * Excludes Pehuenche, which was sold as a project for US$7,6 millions
30

the SOEs themselves. Moreover, new regulatory legislation was introduced in 1982. The aims ofthese laws were to create the conditions for competition to arise whenever possible, and to guar-antee, in cases where there was insufficient competition, that the efficiency gains expected fromprivatization would be transferred to consumers.
Under these rules, concessions to operate utility services are not exclusive, and objective, non-discriminatory criteria govern the granting of licenses. Only technical reasons, as in the case ofmobile telephony, may limit the number of operators. On the other hand, legislation mandates thatservice be provided within the area of the concession, defines continuity and quality standards,and requires interconnection with other firms when regulators deem this to be necessary. Tariffs ofregulated services are based on the long-term marginal cost of a hypothetical efficient firm. Pricesare set every four (electricity distribution) or five years (basic telephony), and within the pricesetting periods they are indexed to the prices of the main inputs used to provide the service. Theseparation of rates from current costs is intended to create an incentive for firms to be efficient.
Chile’s regulations did provide for open access to essential facilities, but did not regulate ac-cess charges at first. Moreover, Chilean legislation does not preclude vertical integration. Thus, in1992, Enersis, a holding company that owned distribution companies which supply 44.4% of themarket in the Central Interconnected System (SIC), took control of the largest power generationcompany (Endesa), which in turn owned the main transmission system. It is fairly well knownthat monopolies that are vertically integrated into non-regulated segments may have an incentiveto sabotage its down-stream competitors (Beard et al. (2001)). Accusations by their competitorsthat integrated monopolies had discriminated led to regulatory changes. In 1994 the telecommu-nications law was amended to mandate the regulation of access charges to the local telephonenetwork. In 1997 the Antitrust Commission instructed Endesa to re-charter its subsidiary as apublic stock corporation and open its ownership to participation of other shareholders. Finally,Endesa sold its transmission subsidiary in 1999.
The electricity sector.
Electrical sector legislation distinguishes among three distinct activities: generation, transmissionand distribution. Only distribution firms need a concession. Distribution licenses are granted forindefinite periods, but may be cancelled if the quality of service falls below the legal standard.Power-generating firms and transmission companies within the same area must interconnect, andthey must co-ordinate their operations through an economic load dispatch center (CDEC). Theaims of CDEC are to guarantee the most economical operation of all generating facilities, to guar-antee the right of power-generation companies to sell energy at any point in the system, and tosafeguard the security of the system. The specific tasks of a CDEC are to plan he short-term opera-
31

tion of the system, to handle the dispatch of electric energy, to calculate the spot price of electricityand to co-ordinate major preventive maintenance of generation units. All plants must be avail-able for dispatch (refusal to provide energy when requested can lead to severe penalties), unlessmaintenance has been scheduled. The optimal operation of the various facilities, independentlyof existing supply contracts, calls for transfers of energy to be made between power generators, atthe so called spot price, which is the operational (or marginal) cost of the most expensive plant inoperation at a given time.
The Chilean regulatory system distinguishes between large and small customers. The former,with maximum power demands above 2MW, are free to negotiate the terms of their supply withthe various generating firms. Small customers, on the other hand, purchase energy from distri-bution companies at regulated prices, which are made up of two components: the node price, atwhich the distribution firms buy energy from power-generation firms, and the value added ofdistribution, which pays for distribution services. Distribution charges are computed for differenturban or rural areas in such a way that an efficient firm operating in an area with those characteris-tics would make a 10% return the replacement value (NRV) of its assets. This charge is calculatedas a weighted average of the findings of outside studies contracted for by the industry and CNE,respectively, with the CNE study accounting for two thirds of the final figure. These figures areapplied to the real firms to calculate average profit levels for the industry over the NRV of assets.If average profits are more than 14% or less than 6%, distribution costs are adjusted to the nearestquantum.
The node price, in turn, has two components: the price of energy and the price of peak power.In order to guarantee stable rates for small consumers, the price of energy is computed every sixmonths as an average of the marginal costs expected over the next 48 months, using projections ofdemand, fuel prices, water-reserve levels, generating plants under construction and the indicativeplan drawn up by CNE. The price of peak power is defined as the annual cost of increasing powerduring peak hours with the least expensive plant. This cost is increased to take into account thereserve margin (or security level) of the system.
Large customers (including distribution companies) are required to have contracts with gen-erating companies. In turn, every power-generation company must have the capacity to meetthe yearly energy contracts, bearing in mind potential dry spells that would affect the hydroelec-tric plants and average capacity of thermal generation units. Power-generation firms must also beable to satisfy peak demand; measured as the average gross hourly demand they have undertakento supply their customers at the system’s peak times. A yearly determination is made of powerand energy deficits/superavits incurred by the generation companies in respect of their supplycontracts that would give rise to transfers between producers. The terms of energy-transfer ar-rangements are negotiated between the firms, while transfers of peak power are made at the price
32

set by CNE.Finally, power-generating firms pay marginal cost plus a basic fee for use of the transmission
lines. Given that there are significant economies of scale in building lines, marginal-cost pricingdoes not allow for recovery of all transmission costs. The difference between the total cost of aline and the revenue collected through marginal costs is designated as the basic fee. Then, foreach line, the basic fee has to be distributed among the various power-generating firms. Thebasic charge is negotiated between the transmission company and the generating company, anddisagreements must be settled by arbitration. The assignment of basic cost for a line among thevarious generating firms is based on maximum demand at peak times. The foregoing criteria haveno solid conceptual basis, particularly as regards the assigning of the entire transmission cost tothe generating firms.
Telecommunications.
The legislation governing telecommunications provides for free pricing of telecommunications.However, rates are set for those services the Antitrust Commission considers to be provided un-der conditions of inadequate competition.2 The telephone companies themselves, on the basisof guidelines set by Subtel, carry out the studies that are used to set rates. The companies handin these studies to Subtel, which has 120 days to present its objections and counterproposals. Acommittee of three experts arbitrates disagreements between the companies and Subtel, both inregard to guidelines and to objections. The company appoints one member of the committee, theregulator a second one, and the two parties agree the third on. Although the regulators make thefinal decision, they tend to follow the recommendations of the experts, since the companies arelikely otherwise to go to court.
The ambiguities of the 1982 law had created a legal monopoly in long-distance service. In 1989,a number of companies applied to Subtel for licenses to operate long-distance services. The finaldecision was not handed down for several years, because of the indecisiveness of the courts as towhether or not vertical integration of local and long-distance service should be allowed. Finally, in1993, the Antitrust Commission authorized the participation of local telephone companies in thelong-distance market. In 1994 the law was modified in order to introduce the competition in longdistance though the multi-carrier system, and following the ruling of the Commission, it imposedrestrictions on local telephone concessionaires that wished to operate in the long-distance market.In the first place, they had to do so through subsidiaries organized as independent joint-stockcompanies, subject to supervision by the Superintendence of Securities and Insurance (the ChileanSecurities an Exchange Commission). The law also required local telephone service providers not
2Congress excluded mobile telephony (except for access charges) from this requirement, so user prices are free,independent of the competitive conditions.
33

to discriminate among long-distance carriers with respect to quality of service and information onlong-distance traffic. Moreover, the access charges to the local network were regulated.
In 1988, the Government set standards for mobile telephone service, though an early entranthad had a concession since 1981. The regulations created two concession areas for mobile service,with two licenses in each area, to be granted on a first-come, first-served basis. In November1996, Subtel granted three nation-wide PCS licenses, using a “beauty contest” where geographiccoverage and speed of implementation were the key bidding variables. Until 1999, subscribershad to pay the same fee both for the calls they made as for the calls they received, which was adisincentive to the use of mobile phones. In February 1999, the regulator introduced a ”callingparty pays” principle, in which callers are forced to pay for all charges (including the regulatedaccess charges) when calling mobile phones.3
3.1.3 Evaluation of privatization in the regulated sectors
An assessment of the privatization process carried out at electricity and telecommunications com-panies between 1985 and 1989 should consider the objectives of the process. As we have men-tioned before, the objectives were to increase the efficiency of these firms, and to provide re-sources for investment in new capacity. Therefore, a complete evaluation of the privatization-cum-regulation process would require, as a counterfactual, a prediction on how the privatizedfirms would have developed if they had remained in the public sector. Here we take a more mod-est approach. We analyze, for each sector, the post-privatization evolution of a set of variables, andrelate their behavior to the regulatory changes. In particular, the comparison between regulatedutilities and those that operate in competitive markets makes it possible to draw inferences re-garding the effectiveness of the regulatory system. In some cases, the differences are so significantthat inferences can be drawn despite the obvious limitations of this approach.
The electric sector.
Between 1988 and 2000 electricity generation grew from 16,914 GWh to 39,142 GWh, and installedcapacity rose from 4,016 MW to 10,045 MW. In the Central Interconnected System, capacity grewless than electric generation, and this can be explained by the fact that peak demand grew ata lower rate during those years, owing to the use of peak-demand pricing.4 Moreover, power-generating firms have generally invested earlier than required under the Government’s indicative
3The high value of the mobile access charge has played a prominent role in the accusations by the local telephonecompany that its competition is being subsidized.
4Initially, the creation in the early 1990s, of an interconnected system in the northern part of the country helpedincrease the use of existing capacity in that area. However, commercial mistakes in the late 90’s led to overcapacity andlarge losses.
34

investment plan. Despite the installation of new capacity ahead of the plan, there have beenperiods of energy shortages in the Central Interconnected System (SIC) due to the system’s heavydependence on hydroelectric power (in some years, such as 1992, 97% of generation is provided byhydroelectric power). These outages, however, seem to have been caused by regulatory failures.
Outages are caused by excessive demand in relation to supply in specially dry years, becausethe inflexibility of the (forward looking) regulated energy prices for small customers makes themunresponsive to supply constraints. When those hydrological conditions are expected, the regu-lated price is set as the outage cost (i.e. the cost to users of long run supply failures).5 On the otherhand, generating companies must compensate users in these conditions by future energy bills byan amount equal to the outage cost times the amount of non-delivered energy. Hence, during asevere drought, the actual price faced by customers is the outage cost, making users indifferent be-tween reducing their energy consumption and not having energy, so in theory, the supply deficitwill be eliminated.
Unfortunately, this compensation mechanism has never been used. Regulations (introducedat the suggestion of the largest hydroelectric operator) eliminated these compensations when thedrought is drier than the driest year that is used in computing the node price. Moreover, no proce-dures were introduced to deal with that case. After the 1998 blackouts the law was modified andnow imposes compensations under all circumstances. In response, generators have not renewedtheir contracts with distributors t supply energy at the node price, leading to an impasse.
Labor productivity in the privatized companies has improved considerably. In Endesa, thelargest generator, power generated per worker rose from 2.2 GWh in in 1989 to 18.1 GWh in 2001(see table 3.3). If we only consider employees working in the holding company and in the genera-tion subsidiaries, the power generated per worker rises from 6.3 GWh in 1991 to 28.7 GWh in 2000.Labor productivity in electricity distribution has also grown substantially after privatization. Forexample, Chilectra, the largest distributor, more than doubled its annual sales of electricity sinceprivatization, from 3,612 GWh in 1987 to 9,253 GWh in 2001 and its customer base grew from 973thousands to 1,289 thousands. The number of workers, meanwhile, fell from 2,587 to 722, and thenumber of clients per worker grew from 376 in 1987 to 1,785 in 2001. In addition, energy lossesfell from 19% to 5.4% in the same period (see table 3.4).
5In fact there are several such costs, depending on the amount of the energy deficit.
35

Table 3.3: Endesa: Investment, Power Generation and Productivity of Labour
Year Dom. invest. Invest. abroad Dom. gener. Local workers Labor Prod.a
US$ MM US$ MM GWh All Generationb All Generation
1988 – – 7,420 – – – –1989 110 – 6,649 2,980 – 2.2 –1990 – – 6,608 2,883 – 2.3 –1991 131 – 8,521 2,445 1,357 3.5 6.31992 47 102 10,022 2,347 1,302 4.3 7.71993 107 165 10,627 2,088 1,058 5.1 10.01994 94 51 11,277 1,970 1,970 5.7 5.71995 180 119 11,783 2,255 1,038 5.2 11.41996 235 391 12,898 1,692 879 7.6 14.71997 415 1,023 13,247 1,674 929 7.9 14.31998 579 462.6 12,188 1,763 980 6.9 12.41999 301 362.4 13,672 1,383 711 9.9 19.22000 145 78 15,346 888c 574 17.3 26.72001 – – 15,741 – – – –
Source: Company’s annual reports.Notes: a: In GWh/worker. b: Assumes that 30,5% of employees work in transmission in 1991 and1992 (the 1993 figure). c: The reduction in the labor force is partially explained by the sale of thetransmission subsidiary.
36

Tabl
e3.
4:C
hile
ctra
:Sal
es,E
mpl
oyee
s,Pr
oduc
tivi
tyof
Labo
r,an
dEn
ergy
Loss
Year
1987
1988
1989
1990
1991
1992
1993
1994
1995
1996
1997
1998
1999
2000
2001
Sale
s(G
Wh)
3,61
23,
844
4,07
04,
230
4,56
85,
338
6,47
66,
359
6,67
67,
256
7,64
78,
175
8,42
58,
854
9,52
3C
usto
mer
s97
31,
008
938
935
960
988
1,01
81,
064
1,10
01,
133
1,16
91,
212
1,23
91,
262
1,28
9Em
ploy
ees
2,58
72,
565
2,14
42,
159
2,12
52,
086
1,85
61,
823
1,80
11,
643
1,66
21,
383
1,38
386
7,72
2La
bor
Prod
.a37
639
343
743
345
247
354
958
761
068
970
372
489
61,
455
1,78
5Sa
les/
wor
kerb
1.4
1.5
1.9
2.0
2.1
2.6
3.5
3.5
3.7
4.4
4.6
5.9
6.1
10.2
12,8
Ener
gyLo
sses
(%)
19.8
18.8
16.1
13.6
13.3
12.0
10.6
9.3
9.0
8.6
7.6
6.0
5.3
5.2
5,4
Sour
ce:C
hile
ctra
’san
nual
repo
rts.
Not
es:a :C
usto
mer
spe
rw
orke
r.b :G
Wh.
37

Table 3.5 shows the node prices in the two main interconnected systems (SIC and SING), incurrent dollars and pesos. There has been a clear downward trend in energy prices since gener-ating firms were privatized. In constant pesos, the drop is approximately 33% in SIC and 73%in SING. This is explained primarily by the decline in prices of fuels used at the thermoelec-tric plants (partly explained by the appreciation of the peso), which play a part in determiningmarginal prices. In the SIC, the fall has been particularly sharp from 1997 onwards, owing to theanticipation of the arrival of natural gas supplies from Argentina (recall that the regulated price ofenergy is forward looking). A greater load factor (use) as a fraction of installed capacity and thetransfer to consumers of these gains in productivity also help explain the lower prices. The profitsof the main power-generating company have increased moderately since privatization, reaching apeak of 15.7% return on equity (ROE) in 1995 (see table 13) and declining in the following years, asa result of unfavorable hydrological conditions and the fact that the installation of more efficientcombined-cycle gas turbines and the arrival of natural gas from Argentina reduced the economicvalue of existing plants.6 Note that the fall in profitability in the generating industry led to furtherlabor-productivity gains in the late 90s.
Regulation of distribution firms has been less successful. According to data from the Ministryof Economics, the value added (i.e. the charge to consumers) by distribution for Chilectra fellby 18% in the rate-setting process of 1992 and by an additional 5% in the rate-setting process of1996. However, this price reduction in the VAD does not match the efficiency gains achieved afterprivatization. This situation led to increases in the profits of distribution companies. The returnon equity obtained by Chilectra increased from 8% in 1988 to 32% in 1996-98. In the 2000 rate-setting process, rates were reduced by a further 18%, which led to lower profit rates at first. Inresponse, Chilectra increased labor productivity substantially. The rest of the industry has gonethrough a similar process. The profit levels in distribution are much higher than those of thegenerating companies, which in any event are subject to greater risks, both for lack of a securemarket (they operate under competition) and because of the potential for droughts (see Table 3.6).Some of the distribution industry profits come from unregulated services which are unlikely tobecome competitive, because they are closely related to regulated services, as in the case of therenting of meters. Distribution companies also obtain significant returns from allowing phoneand cableTV companies to hang cables in their poles. However, these returns are not consideredwhen estimating the income of the efficient firm, so in effect, consumers can pay more than twicefor the same infrastructure.
6Chile has no stranded cost principle, so the introduction of a new technology may reduce to zero the value ofexisting power plants.
38

Table 3.5: Change in Node Prices and in Residential Rates
Year Node price Residential
SICa SINGa SICb SINGb SICb
1987 22.2 53.4 2.4 5.9 14.731988 26.1 49.7 2.9 5.6 15.871989 26.8 51.7 3.3 6.4 16.971990 22.6 59.5 3.0 7.9 18.151991 19.3 47.8 2.6 6.5 15.831992 18.9 36.9 2.9 5.6 15.721993 20.4 37.8 3.1 5.7 15.081994 21.1 34.7 3.7 6.1 15.311995 18.4 23.1 3.7 4.6 15.441996 15.4 23.5 3.1 4.8 14.651997 12.7 18.8 2.7 4.0 13.771998 10.7 14.0 2.1 2.8 12.161999 11.4 11.4 2.1 2.1 12.162000 14.9 13.7 2.6 2.4 –
Source: CNE.Notes:a: October 2000 pesos per KWh.b: Current US¢ per KWh.
39
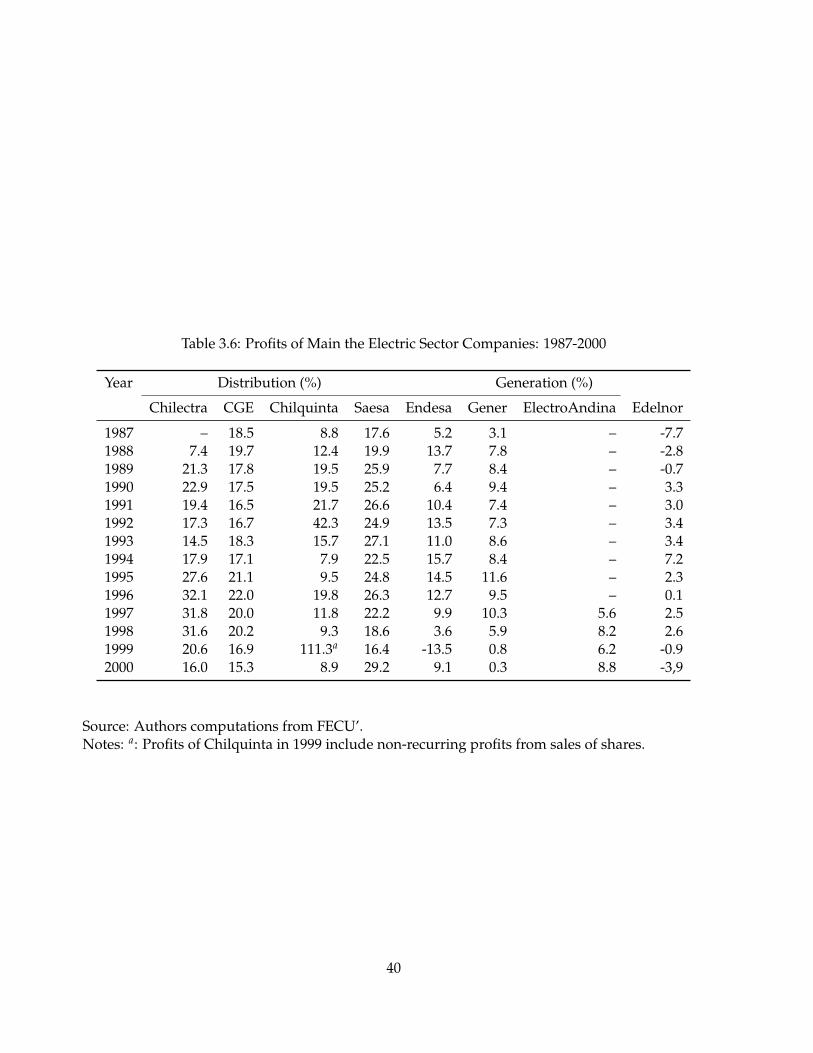
Table 3.6: Profits of Main the Electric Sector Companies: 1987-2000
Year Distribution (%) Generation (%)
Chilectra CGE Chilquinta Saesa Endesa Gener ElectroAndina Edelnor
1987 – 18.5 8.8 17.6 5.2 3.1 – -7.71988 7.4 19.7 12.4 19.9 13.7 7.8 – -2.81989 21.3 17.8 19.5 25.9 7.7 8.4 – -0.71990 22.9 17.5 19.5 25.2 6.4 9.4 – 3.31991 19.4 16.5 21.7 26.6 10.4 7.4 – 3.01992 17.3 16.7 42.3 24.9 13.5 7.3 – 3.41993 14.5 18.3 15.7 27.1 11.0 8.6 – 3.41994 17.9 17.1 7.9 22.5 15.7 8.4 – 7.21995 27.6 21.1 9.5 24.8 14.5 11.6 – 2.31996 32.1 22.0 19.8 26.3 12.7 9.5 – 0.11997 31.8 20.0 11.8 22.2 9.9 10.3 5.6 2.51998 31.6 20.2 9.3 18.6 3.6 5.9 8.2 2.61999 20.6 16.9 111.3a 16.4 -13.5 0.8 6.2 -0.92000 16.0 15.3 8.9 29.2 9.1 0.3 8.8 -3,9
Source: Authors computations from FECU’.Notes: a: Profits of Chilquinta in 1999 include non-recurring profits from sales of shares.
40

Table 3.7: Telecom Statistics (1987-2000)
Year Lines in servicea Densityb Mobile Phonesa Int. Trafficc
1980 363 – – 8.01985 537 – – 13.41986 558 – – 16.21987 581 4.7 – 21.21988 631 4.9 – 27.51989 689 5.4 4.9 29.91990 864 6.5 13.9 38.81991 1,957 7.8 36.1 47.01992 1,283 9.6 64.4 53.11993 1,521 10.9 85.2 59.51994 1,634 11.6 115.7 63.51995 1,891 13.2 197.3 113.61996 2,264 15.6 319.5 144.21997 2,693 18.3 409.7 198.81998 2,947 20.4 964.2 215.01999 3,109 20.6 2260.7 210.22000 3,365 22.0 3401.5 222.52001d 3,581 23.1 5271.5 241.0
Source: Subtel.Notes: a: Thousands. b: Lines /100 inhabitants. c: Million minutes. d: December 2001 (estimated).
Telecommunications.
Since privatization, the telecommunications sector has experienced rapid growth, as shown byall indicators. Between 1987 and 2001, the number of lines in service rose by a factor of almostsix, so the line density rose from 4.7 to 23.1 lines per 100 inhabitants (Table 3.7). In the mainlocal phone company (Telefonica), which accounts for 76% of all subscribers, average installationtime was reduced from 416 days in 1993 to 6 days in 2001, and the waiting list, which in 1987included 237 thousand people, had been reduced to 32 thousand by 2001, having reached a peakof 314 thousand in 1992. Digital commutation rose from the 36% in 1987, to 100% in 1993. Long-distance traffic also grew significantly. Outgoing international traffic rose by a factor of 10, from21.2 million minutes in 1987 to 241.0 million minutes in 2001. Growth was especially rapid afterthe introduction of competition in long distance services (see table 3.7). The number of lines perworker in the largest telecommunications firm grew from 74 in 1987 to 845 in 2001 (see table 3.8).
This period has also seen the emergence of new services, such as beepers, data transmission,
41

Table 3.8: Telefonica-CTC: basic fixed phone statistics
Year Linesa Share Workersb Lines/Workerb Install. Time Waiting lista
1980 360 99.3 6.911 52 – 1501985 505 94.1 6.894 73 – 1811986 528 94.6 7.219 73 – 2281987 548 94.3 7.414 74 – 2321988 592 93.7 7,518 79 – 2361989 646 93.8 7,366 88 – 2841990 812 94.0 7,530 108 – 3081991 997 94.3 7,994 125 – 2411992 1,213 94.5 7,991 152 – 3141993 1,437 94.5 8,133 177 416.0 1981994 1,545 94.6 7,424 208 208.9 1171995 1,754 92.8 7,449 235 169.8 521996 2,056 90.8 7,073 291 55.4 721997 2,394 88.9 6,898 347 38.6 971998 2,650 89.9 6,917 383 35.4 581999 2,592 83.4 5,649 459 15.4 272000 2,701 80.3 4,639 582 4.3 102001 2,723 76.1 3,223 845 5.7 32
Source: Subtel and CTC annual reports.Notes: a: Thousands. b:Excludes employees working in subsidiaries.
42
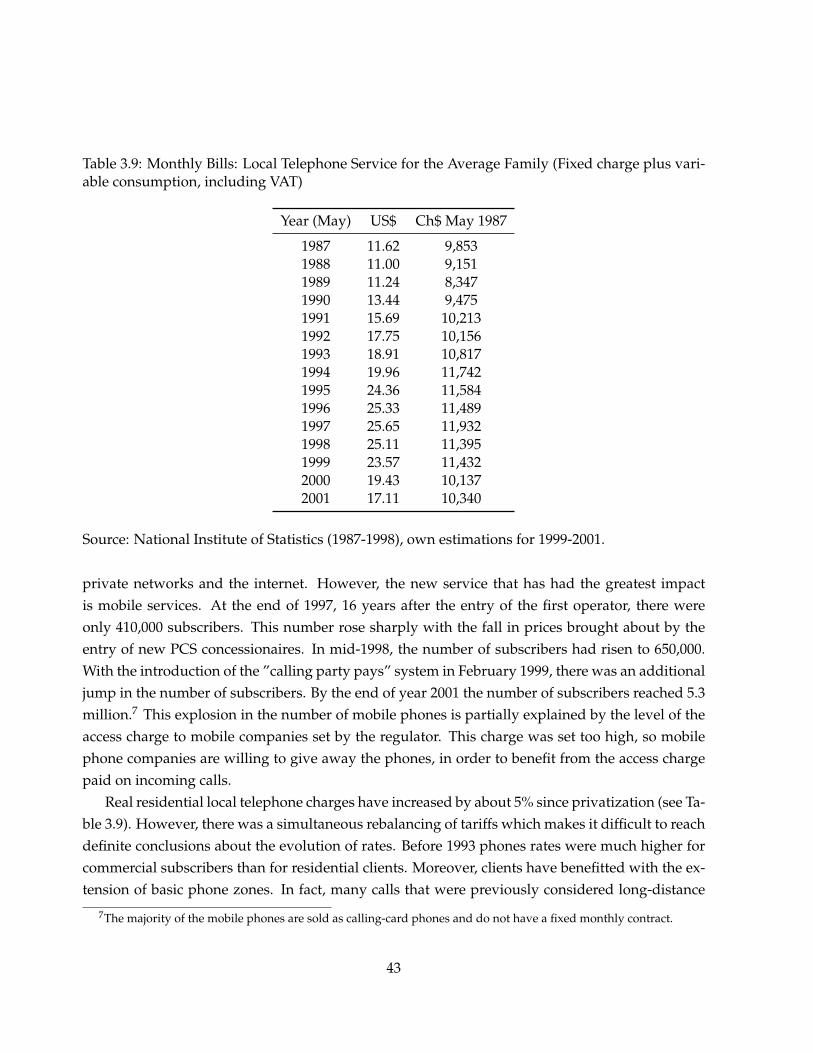
Table 3.9: Monthly Bills: Local Telephone Service for the Average Family (Fixed charge plus vari-able consumption, including VAT)
Year (May) US$ Ch$ May 1987
1987 11.62 9,8531988 11.00 9,1511989 11.24 8,3471990 13.44 9,4751991 15.69 10,2131992 17.75 10,1561993 18.91 10,8171994 19.96 11,7421995 24.36 11,5841996 25.33 11,4891997 25.65 11,9321998 25.11 11,3951999 23.57 11,4322000 19.43 10,1372001 17.11 10,340
Source: National Institute of Statistics (1987-1998), own estimations for 1999-2001.
private networks and the internet. However, the new service that has had the greatest impactis mobile services. At the end of 1997, 16 years after the entry of the first operator, there wereonly 410,000 subscribers. This number rose sharply with the fall in prices brought about by theentry of new PCS concessionaires. In mid-1998, the number of subscribers had risen to 650,000.With the introduction of the ”calling party pays” system in February 1999, there was an additionaljump in the number of subscribers. By the end of year 2001 the number of subscribers reached 5.3million.7 This explosion in the number of mobile phones is partially explained by the level of theaccess charge to mobile companies set by the regulator. This charge was set too high, so mobilephone companies are willing to give away the phones, in order to benefit from the access chargepaid on incoming calls.
Real residential local telephone charges have increased by about 5% since privatization (see Ta-ble 3.9). However, there was a simultaneous rebalancing of tariffs which makes it difficult to reachdefinite conclusions about the evolution of rates. Before 1993 phones rates were much higher forcommercial subscribers than for residential clients. Moreover, clients have benefitted with the ex-tension of basic phone zones. In fact, many calls that were previously considered long-distance
7The majority of the mobile phones are sold as calling-card phones and do not have a fixed monthly contract.
43

calls are now considered local calls. In 1993 rates were 8,6% higher than in 1987, as a result of the1988 tariff-setting process. In the 1993 tariff-setting process residential rates were further increasedby 9,8%. This tariff rise was explained by the need to compensate the partial elimination of subsi-dies from long-distance service to local service and the unification of residential and commercialrates. Starting in 1994, access charges for long-distance calls were substantially reduced.
The 1999 rate-setting process can be considered a turning point. Basic phone rates were re-duced by 11%, at the same time that access charges to the local network were reduced by anaverage of 72%. As a result, in 2001 basic phone rates for an average family were still 5% higherthan in 1987, but access charges for long distance calls were much lower. The deregulation of long-distance service in 1994 eliminated the need for rate setting in that market. Deregulation coupledto the reduction in access charges to the local network, led to a dramatic fall in long-distance rates.This is illustrated by the value of a one-minute call to the United States, a route that represents42% of international traffic. In 1987 the average per minute cost of a call to the US was US$1,51.If the regulated rate setting process had remained in place, the price today during normal hourswould be 2.40 dollars, which can be compared to the current price of call of about US$ 0,10.8
Since long-distance companies, as well as other telecom operators, require access to local net-works in order to provide service, it became very important to regulate fees for access to the publicnetwork. In the 1994 rate-setting process, the regulator established the rule that the access chargefor incoming and outgoing domestic long-distance calls and outgoing international calls wouldbe 0.63 times the charge for a local call, which is higher than the real cost of providing the service.Even worse, the per-minute access charge for incoming international calls was set at a rate that was14 times the local rate during normal hours and 84 times the local rate during reduced-rate hours.High access charges to local networks, coupled with strong competition in the industry on thepart of the market leader, Telefonica-CTC, meant that many long-distance operators had seriousfinancial difficulties in the period 1994-1999. The local telephony companies, which were allowedto operate in the long-distance market through subsidiaries, had incentives to charge below coston long-distance calls, since by lowering rates long-distance traffic would increase and the com-panies would benefit from the higher revenue arising from access charges to the local network,a reward that the other long-distance companies did not have. In response, the 1999 rate-settingprocess reduced access rates by an additional 62.7% on national and international outgoing calls.In the case of incoming international traffic, the charge was reduced by 97.5% in normal hours andby 99.6% in off-peak periods (from the previous high levels). The average reduction in regulatedaccess charges was about 72%.
8The price drop has not been so great on other routes. Carriers pay so-called accountancy rates to their foreigncounterparts for traffic imbalances on international routes. On those routes where outgoing traffic exceeds incomingcalls, the marginal cost of providing service should include the accountancy rate.
44

Prices of mobile telephony have also declined sharply with increased competition. At the endof 1997, subscribers paid a fixed charge of 15,000 pesos plus 130 pesos per minute for calls madeas well as calls received. The entry of Entel PCS in March 1998 led to a marketing war amongoperators that entailed heavy spending on advertising and brought about a significant decline inprices. In early 1998, Telefonica-CTC offered 60 free calling minutes for a fixed monthly charge of7,080 pesos and billed additional outgoing minutes at 124 pesos during normal hours and 80 pesosduring reduced-rate hours.9 In addition, customers who signed a two-year contract received themobile phone for free. Other plans offered 200 free calling minutes for 16,000 pesos. Clearly,increased competition significantly reduced rates.
The profitability of Telefonica-CTC increased after privatization and remained high until 1997,as shown in table 3.10, as regulators were unsuccessful in passing Telefonica-CTC’s efficiencygains to customers. This state of affairs changed in 1998, as Telefonica-CTC began to shift invest-ment towards competitive sectors such as mobile telephony and long distance. Telefonica-CTCwas also affected by the rate setting process of 1999 that lowered local rates and access charges tothe local network. Moreover, Telefonica-CTC suffered from the devaluation of the peso (20-30%)that began in 1998, since it had not hedged its dollar denominated debt. Another negative effectwas the decline in demand growth and the increase in non-paying clients due to the slowdown inthe economy that began in late 1998. Finally, Telefonica-CTC is responsible for the access chargesto mobile phone companies of its non-paying clients, and these access charges are twenty timeshigher than those that Telefonica-CTC can charge.
Telefonica-CTC has implemented a strict cost reduction plan, which has included a drasticreduction in the number of workers. The decline in employment is due to the elimination of in-efficiencies in the firma as well as by the reduction in planned investment due to the decline inprofitability caused by the new rates and slower economic growth. This increase in efficiency hasallowed the company to achieve small profits in 2001 after two years of large losses. Since sever-ance payments are large, part of the explanation for the losses is the cost of reducing employmentin the company. It is probable that the company will have higher profits in 2002 as employmentin Telefonica-CTC seems to have stabilized.
The two regional basic telephone companies that are dominant in their respective areas (Telcoyand CNT) were less affected by the tariff-setting process and have maintained their profit levels.Entel, is in the opposite situation. While it was a regulated monopoly provider of long-distanceservices, its rates were much higher than the cost of providing service, and this allowed it to haveprofit levels above 50% for several years. Deregulation led to dramatic falls in long-distance ratesand profits (see table 3.10). In 1998 the company had losses due to the strong competition in longdistance, its restructuring costs and the cost of entry into mobile telephony, where it has become
9The calling party pays principle means that incoming calls are not charged.
45
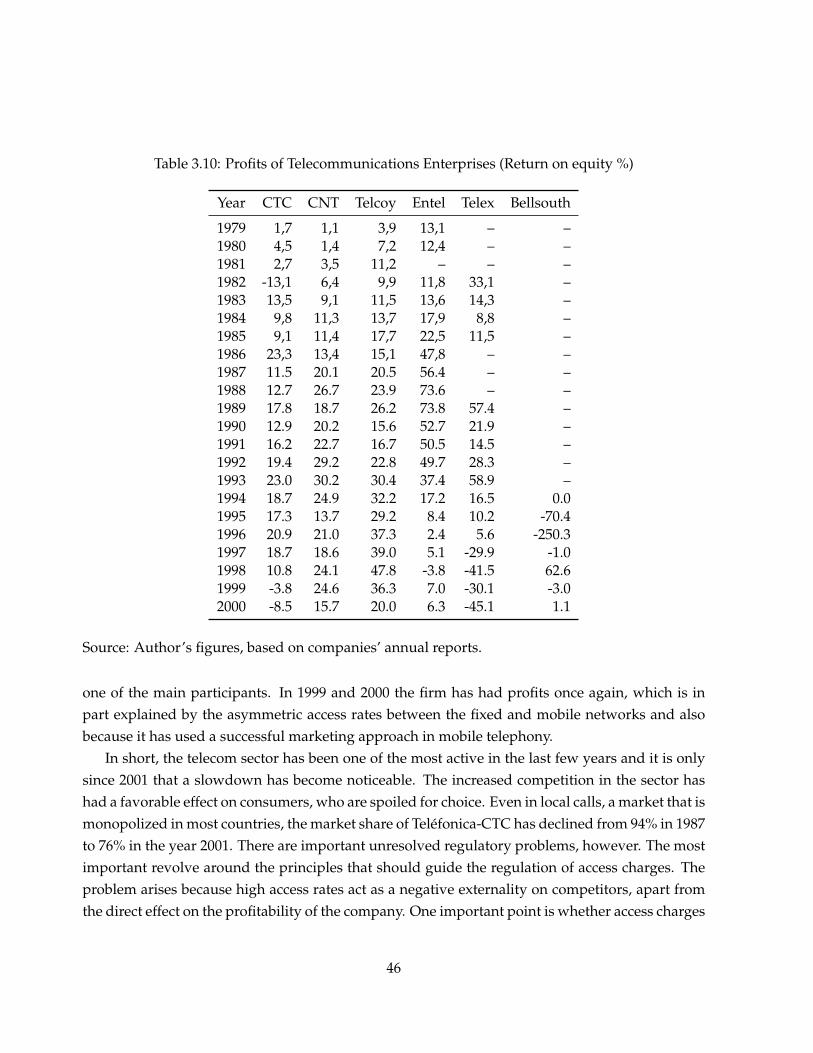
Table 3.10: Profits of Telecommunications Enterprises (Return on equity %)
Year CTC CNT Telcoy Entel Telex Bellsouth
1979 1,7 1,1 3,9 13,1 – –1980 4,5 1,4 7,2 12,4 – –1981 2,7 3,5 11,2 – – –1982 -13,1 6,4 9,9 11,8 33,1 –1983 13,5 9,1 11,5 13,6 14,3 –1984 9,8 11,3 13,7 17,9 8,8 –1985 9,1 11,4 17,7 22,5 11,5 –1986 23,3 13,4 15,1 47,8 – –1987 11.5 20.1 20.5 56.4 – –1988 12.7 26.7 23.9 73.6 – –1989 17.8 18.7 26.2 73.8 57.4 –1990 12.9 20.2 15.6 52.7 21.9 –1991 16.2 22.7 16.7 50.5 14.5 –1992 19.4 29.2 22.8 49.7 28.3 –1993 23.0 30.2 30.4 37.4 58.9 –1994 18.7 24.9 32.2 17.2 16.5 0.01995 17.3 13.7 29.2 8.4 10.2 -70.41996 20.9 21.0 37.3 2.4 5.6 -250.31997 18.7 18.6 39.0 5.1 -29.9 -1.01998 10.8 24.1 47.8 -3.8 -41.5 62.61999 -3.8 24.6 36.3 7.0 -30.1 -3.02000 -8.5 15.7 20.0 6.3 -45.1 1.1
Source: Author’s figures, based on companies’ annual reports.
one of the main participants. In 1999 and 2000 the firm has had profits once again, which is inpart explained by the asymmetric access rates between the fixed and mobile networks and alsobecause it has used a successful marketing approach in mobile telephony.
In short, the telecom sector has been one of the most active in the last few years and it is onlysince 2001 that a slowdown has become noticeable. The increased competition in the sector hashad a favorable effect on consumers, who are spoiled for choice. Even in local calls, a market that ismonopolized in most countries, the market share of Telefonica-CTC has declined from 94% in 1987to 76% in the year 2001. There are important unresolved regulatory problems, however. The mostimportant revolve around the principles that should guide the regulation of access charges. Theproblem arises because high access rates act as a negative externality on competitors, apart fromthe direct effect on the profitability of the company. One important point is whether access charges
46

should be based on costs adjusted to the demand facing a company (since the local monopoly hasa higher phone density, costs are lower) a principle which Telefonica-CTC claims represents asubsidy to the competition and the competition deems essential for survival, or if rates should besymmetric for identical services. The inclusion of fixed costs is also an issue in this regard: shouldthey be included in the cost calculations? Finally, a further issue is that time metering of callsor access may be inappropriate when capacity is not a constraint (at least for standard telephonecalls) due to technological change.
The problem is that in the case of access charges, price competition can break down. Consider asituation where users value outgoing calls more than incoming calls and Telefonica-CTC’s accessrates are set low, while its smaller rivals have high regulated rates due to their higher costs. ATelefonica-CTC client would pay the regulated rate for calls within the Telefonica-CTC network,but a higher rate for calls to Telefonica-CTC’s rivals. Conversely, a rival’s client faces a cheaper rateto call a Telefonica-CTC phone. Since Telefonica-CTC is by far the largest company, with 76% ofall telephone lines, most of rival’s calls end up in Telefonica-CTC’s network in any case. Since therivals pay a low access rate for these calls, they might be able to charge a low rate for phone serviceeven though their own networks are more expensive. Thus the rivals can gain market share at theexpense of Telefonica-CTC by having high access charges. Of course, if users also value incomingcalls, this incentive to raise access charges is smaller since clients will not appreciate the fact thatnobody calls them because it is expensive. Nevertheless, on balance, heavy users of outgoing callsare more attractive to firms than clients who put more weight on incoming calls.
On the other hand, the last mile is an essential facility in telecoms. Cable companies usuallyhave access to the last mile, but other operators (long distance, mobile telephony, internet accessproviders) require access to the local telephone network (or to the cable network) in order to reachconsumers.10 Since Telefonica-CTC faces regulated rates, it has incentives to become a monopolyin the competitive sectors.11 It can achieve a monopoly by non-price discrimination against theother operators. In order to reduce this risk and preserve competition in the other markets, theregulator may prefer to incur in the social cost of having more than one last mile service provider.Which option is better depends on the extent of economies of phone line density.
3.2 Infrastructure franchises
By the early 1980s, continuous high growth rates for the last years had led to congestion andsevere quality problems in highways, seaports and airports. Even though the government had
10A wireless fixed system, WLL, has not been as successful as expected in breaking down the local telephonemonopoly in the last mile.
11See Beard et al. (2001).
47

increased the expenditure in infrastructure several times over the minuscule amounts spent dur-ing the 1980s, they were insufficient. Therefore franchising became the hope for rehabilitating andexpanding public infrastructure. In 1992 a franchise law was passed allowing the private sector tofinance and operate highways, airports and other infrastructure.
Franchises have other advantages in addition to solving the problem of governments that donot have the resources (financial, managerial and supervisory) to provide for infrastructure needs.In fact, there are several economic arguments in favor of highway franchising, whenever possi-ble:12 first, the fact that when the same firms is in charge of construction and maintenance there arebetter incentives to invest in non-verifiable quality; second, private projects are managed betterand are usually more efficient than state-owned companies; third, it is politically easier to justifycost-based tolls when the project is a private concession; fourth, the cost of the project is imposedon users and not on the rest of society; and sixth, there is built-in screening mechanism againstsocially wasteful projects, since a project with a negative private return will most likely also havea negative social return (i.e., be a white elephant). Moreover, when franchise auctions are openand competitive, tolls or user prices should be close to average cost, which is second best optimalin the presence of economies of scale.
From 1994 to the present, 32 projects have been auctioned for a total amount of about US$5.0 billion, of which 18 are already operational. In addition, in 1997, a law was passed allowingfranchises of the infrastructure of public ports. Currently, over 2,000 km of interurban highwaystogether with the main airports and seaports are privately managed. Even though the system hasbeen remarkably successful, there are several challenges for the future. One of the challenges ishow to incorporate flexibility in order to react to changed conditions (for instance, unexpectedpermanent increases in traffic that require widening a road or raising the toll) while at the sametime keeping a reputation of not renegotiating contracts when the franchise is loosing money orof expropriating money-making franchises. Another problem is that most of the privately prof-itable projects have been franchised, and the projects that remain require government subsidiesin order to have interested bidders. But the existence of government subsidies negates many ofthe advantages of infrastructure franchises and the optimal approach to franchising in this case isequivalent to the traditional approach of franchising the building of the road to the lowest bidderand financing it upfront from public funds.13
12For more details on these arguments, see Engel et al. (To be published). For a different perspective, see Gomez-Loboand Hinojosa (2000).
13Engel Fischer and Galetovic (2002): Highway Franchising with Subsidies, unpublished.
48

3.3 Highways and airports
The private sector has financed the construction of new highways and airports through build-operate-and-transfer (BOT) concessions (see table 3.11). More recently the government has ex-tended the range of concessions contracts to the building of water reservoirs for irrigation and ofpenal complexes (see tables 3.12 and 3.13).14 In general the auction process for concessions hasoperated as follows. The government sets the minimum technical specifications of the project andgrants a concession for 20 or 30 years to the bidder offering to charge the lowest user price forbuilding, operating and maintaining the project. Bidders must first pass through a technical vet-ting process that qualifies them to make an economic bid. A ceiling and a floor price are imposed.If the ceiling is reached, the bidders compete on the minimum subsidy they request. On the otherhand, if the floor price is reached, the firm that offers the largest payment to the State wins theconcession.
The first project, a 42 million-dollar tunnel, was put out to tender at the end of 1992, completedin time at very close to the budgeted cost, and inaugurated in 1995. The most important franchisedhighway project has been the improvement of the Pan-American Highway, with a total investmentestimated at US$ 2.4 billion, and total length of 1,511 km. The project was put out to tender dividedin 8 segments, and concessions awarded over a two-year period. The final stretch, adjudicated inMay 1998, runs from Santiago to Talca, with an estimated cost of US$750MM. The concession willlast 25 years. Starting in 1995, the cargo and passenger terminals of the eight main airports wereawarded in a public bidding. Airport concession-holders have invested about US$ 271 million, ofwhich 200 million were spent in Santiago.
14There are some doubts about the rationale for this last type of concession contract, since it appears to be a means ofevading the standard budgetary process.
49

Table 3.11: Concessions that are operational
Project Project Investment FranchiseName origin (MMUS$) length (yrs)
Northern access to Concepcion Public 214 28Access to Santiago’s Airport Public 9 12La Serena Airport Public 4 10Route 78, Santiago - San Antonio Public 172 23,67Road of La Madera Public 31 25Road Nogales - Puchuncavı Public 12 22Road Santiago - Los Andes Private 131 28Route 5, Chillan - Collipulli Public 192 21Route 5, Los Vilos - La Serena Public 244 25Route 5, Santiago - Los Vilos Public 251 23Route 5, Talca - Chillan Public 171 12,5Route 5, Temuco - Rıo Bueno Public 211 25Carriel Sur Airport, Concepcion Private 25 16,5El Loa Airport, Calama Private 4 12El Tepual Airport, Puerto Montt Public 6 12Iquique Airport Public 6 12El Melon tunnel Public 50 23
Source: MOP
50

Tabl
e3.
12:P
roje
cts
unde
rco
nstr
ucti
on
Nam
e%
built
Proj
ect
Bidd
er’s
budg
eted
Fran
chis
e(d
ecem
ber
2001
)O
rigi
nex
pens
e(M
MU
S$)
leng
th(y
rs)
Cer
roM
oren
oA
irpo
rt,A
ntof
agas
ta10
0Pr
ivat
e8
10In
tern
acio
nalA
irpo
rt,S
anti
ago
100
Publ
ic17
015
Punt
aA
rena
sA
irpo
rt98
.95
Publ
ic10
9Sa
ntia
go-V
alpa
ra’is
o-V
ina
delM
arhi
ghw
ay77
,96
Publ
ic38
325
Lito
ralC
entr
alR
oad
0.00
Publ
ic67
30R
oute
5,C
ollip
ulli-
Tem
uco
91.7
9Pu
blic
256
25R
oute
5,R
’ioBu
eno-
Puer
toM
ontt
99.3
0Pu
blic
236
25R
oute
5,Sa
ntia
go-T
alca
yA
cces
oSu
ra
Sant
iago
33.7
8Pu
blic
698
25N
orth
-Sou
thur
ban
high
way
,San
tiag
o1.
08Pu
blic
517
30C
osta
nera
Nor
teur
ban
high
way
33.4
0Pu
blic
405
30El
Bato
rese
rvoi
r,Il
lape
lA
ucti
oned
2001
NA
3725
Alt
erna
teM
elip
illa
road
Auc
tion
edN
A19
25A
mer
ico
Vesp
ucio
Sout
hur
ban
high
way
Auc
tion
ed20
01N
A28
30A
mer
ico
Vesp
ucio
Nor
thur
ban
high
way
,San
tiag
oA
ucti
oned
2001
NA
250
30In
tern
atio
nalr
oad
60A
ucti
oned
ener
o20
02N
A16
530
Rou
teTa
lcah
uano
-Pen
coA
ucti
oned
2001
NA
1925
Gro
up1
jails
(Iqu
ique
-La
Sere
na-R
anca
gua)
Auc
tion
ed20
0175
15a
20
Sour
ce:M
OP.
51

Tabl
e3.
13:P
roje
cts
inpr
oces
s
Proj
ect
Stat
usPr
ojec
tcos
tFr
anch
ise
Auc
tion
Bidd
ing
Nam
eD
ec.2
001
(MM
US$
)le
ngth
(yrs
)da
teda
te
New
Reg
iona
lAir
port
,Ata
cam
aC
allf
orbi
ds25
20O
ctob
er20
01A
pril
2002
Jails
,Gro
up2
(Con
cepc
i’on,
Val
divi
a)C
allf
orbi
ds50
22O
ctob
er20
01M
ay20
02C
omm
uter
rail
Mel
ipill
a-Sa
ntia
go-B
atuc
oC
allf
orbi
ds30
018
July
2002
Chi
loe
Brid
geC
allf
orbi
ds35
0A
ppro
x30
Aug
ust2
002
Air
port
,Ari
caN
YAa
1010
June
2002
Sept
embe
r20
02Ja
ils,G
roup
3(S
anti
ago1
,2,V
Reg
ion
Inte
rior
)N
YA80
20Ju
ne20
02O
ctob
er20
02In
tern
atio
nalA
irpo
rtIV
Reg
ion
NYA
4520
Nov
embe
r20
02In
term
edia
tete
ch.,
Rec
olet
a-I
ndep
ende
ncia
NYA
171
20Ju
ne20
02D
ecem
ber
2002
Ecol
ogic
alco
mpl
ex,S
anti
ago
NYA
5030
2nd
sem
.,20
02N
orth
-Wes
tacc
ess
Sant
iago
NYA
160
301s
tsem
.,20
022n
dse
m.,
2002
Exch
ange
stat
ions
Qui
nta
Nor
mal
,Gra
nA
veni
daN
YA60
302n
dse
m.2
002
1sts
em.,
2003
Land
port
,Los
And
esN
YA16
252n
dse
m.2
002
1sts
em.2
003
Inte
rmed
iate
high
way
ring
,ElS
alto
-Ken
nedy
NYA
3230
2nd
sem
.200
21s
tsem
.200
3C
onve
nto
Vie
jore
serv
oir
NYA
210
20a
252n
dse
m.2
002
1sts
em.2
003
Impr
ovem
entR
oute
5:La
Sere
na-C
alde
raN
YA10
517
apro
x.2n
dse
m.2
002
1sts
em.2
003
Exch
ange
stat
ions
Paja
rito
s,Sa
ntos
Dum
ont
NYA
60-
1sts
em.2
003
2nd
sem
.200
3Ja
ils,G
roup
4(S
anti
ago
2,V
regi
on)
NYA
5015
to20
1sts
em.2
003
2nd
sem
.200
3N
ewA
irpo
rtIX
Reg
ion
NYA
4820
to25
1sts
em.2
003
2nd
sem
.200
3M
aint
enan
ceR
oute
66N
YA64
181s
tsem
.200
32n
dse
m.2
003
Sour
ce:M
OP
Not
es:a :N
otye
tauc
tion
ed.
52

Concessions raise important regulatory issues. There are end-point problems, especially asregards maintenance close to the end of the concession period. One major problem is caused by thelength of infrastructure concessions, coupled to the rigidity of the contract rules. For instance, incases of congestion, welfare maximization may require increases in the user fee set in the originalcontract. The question is how to share the increased income, since the firm bid on a lower priceand unless it gets a fraction of the increased revenue, prefers to keep the lower price. However,when contracts are expected to be renegotiated, the benefits of competitive bidding are largelylost, since the firm’s ability to negotiate, or its lobbying capacity counts as much or more thanits efficiency (Williamson (1976)). Shortening the concession period is not a solution, since therewould be not enough time for concessionaires to recoup their investments, requiring governmentsubsidies.
The first infrastructure concession, the Melon Tunnel, illustrates these problems. Though ithad no cost overruns and was built on time, it has not been successful and is unlikely to recoupthe original investment (the firm has been making annual losses of about US$ 1.5 million). Thewinner’s curse (fairly common in a newly developed system, such as infrastructure concessions)meant that the winner offered to pay substantially more than the runner-up. They overestimatedthe demand for the road at the toll ceiling, since a significant percentage of drivers choose the oldalternative road.15 The winner has claimed that the lower-than-estimated demand is due to theconstruction of new alternative roads and are offering to reduce the toll if the government lowersthe annual payment. Such an agreement would almost certainly be socially beneficial in the shortrun, but the Government has refused to renegotiate, on the grounds that it would set a reputationfor renegotiation of agreements.
Franchise-holders have discovered that willingness to pay is less than anticipated when an al-ternative free route is available, even if an economic computation implies that the savings in timeand wear and tear on the vehicle compensate the toll. Even in cases where alternatives are notcompetitive at all, demand can be highly variable and depend on macroeconomic and regionaleffects. Moreover, the traffic over a specific road depends on the other links in the highway net-work. Thus, Government may affect the demand on a particular route when it alters the rest ofthe network, and government flexibility in this respect is obviously required.16 The Governmentdealt with this problem by introducing minimum traffic guarantees, which promise that if traffic
15The franchise was awarded to the firm that had the highest score in an index that weighed (mainly) the toll and thepayment to the government. Due to poor auction design weights were set such that payments to the government has ahigher relative weight, so the bidders set tolls at the ceiling and bid positive payments.
16If government promised to compensate the franchise holders for each change in the network that was claimed toaffect their traffic flows, there would be endless and expensive negotiation of the impact of the changes. An exampleof the effects of these restrictions is Orange County’s Riverside Freeway, which is terminally congested because itscontract with the private 91 Express Lanes does not allow expansion without permission from the owner of the privatefranchise. See Engel et al. (To be published).
53

flows fall below predetermined levels (usually equivalent the toll revenues that would pay 70%of estimated construction costs), the government will make up the shortfall.
Giving guarantees to concession-holders makes it easier for bidders to obtain loans in the fi-nancial system, which translates into a larger number of bidders and therefore greater compe-tition. On the other hand, State guarantees have some disadvantages. First, they increase thechances that projects which are neither privately nor socially profitable will be undertaken. Pri-vate investors might push for higher estimated construction costs, so that the guarantee covers allof their actual construction costs, even though they know that that actual traffic would probablybe much lower (given that the guarantee covers 70% of estimated construction costs). Second, itis inconvenient to eliminate all risks from the concession-holder during the highway operationperiod, because it would mean the benefits of private management being lost. Third, guaranteescreate contingent liabilities for the Government, but are seldom valued and are excluded in theyear-to-year budget or counted as government debt. However, there is a seldom observed po-litical economy advantage to guarantees: if traffic falls far below expectations, government canalways point to the guarantees as a way to reduce the pressures to renegotiate the franchise con-tract.
In order to avoid some of the problems associated to standard auctions, the government hasbeen experimenting with a new mechanism to auction infrastructure concessions advocated byEngel et al. (To be published).17 In their proposal, the regulator sets the maximum toll that theconcession-holder can charge, and then awards the concession to the firm demanding the leastpresent-value of revenue (PVR) for building and then operating the highway, until the requiredrevenue is collected through toll payments. Hence the duration of the concession is endogenous.This auction mechanism reduces the risk faced by the franchise holder, because the present valueof the total income the concession-holder will receive is known in advance. There remains a lesserrisk associated with the time the franchise-holder takes to collect the required sum. The longer thetime taken to collect the desired income, the greater will be the operating and maintenance costsincurred by the concession-holder. 18
An additional advantage of PVR auctions is that they are inherently flexible. Early termina-tion of a concession is not a problem, for instance if required in order to widen the highway. Ifthe government compensates the operator with the amount remaining to be collected, minus es-timated savings on maintenance and operation costs, this is a fair compensation to the franchise
17A similar approach had already been used in the UK when awarding the franchises of the Second Severn Bridgeand the Queen Elizabeth II bridge over the Thames. The main difference with the UK approach is that there was noauction for the bridges.
18Since maintenance cost is directly related to traffic flow (and its composition), it is possible to reduce this risksubstantially by bidding for a modified PVR which is computed net of an estimate of the road deterioration causedby vehicles. In that case, the only remaining risk is related to operational expenses, which are minor and can also beaccommodated through cost estimates.
54

holder. Hence PVR greatly reduces the scope for disagreement. The authority could also changethe toll charged by the franchise holder in order to be closer to the optimal toll given the level ofcongestion without affecting the franchise holder.19
The highway linking Santiago and Valparaıso was auctioned using the PVR method. In Febru-ary 1998 a Spanish consortium won the concession. It sought a present value revenue of UF11,938,207 (approximately US$ 400 million), an amount it expects to collect in 15 years. The price-cap for the toll is Ch$ 1,800 (about US$ 3). In this instance, the rules required that bidders seekinga minimum guaranteed income would have had to pay the government for this guarantee. Re-markably, two out of four bidders, including the winner, did not seek the guarantee. Thus, inprinciple, the State did not assume any risk.
Starting in year 1999 the government has awarded four urban highway concessions in Santiagothat represent a total investment of about 1,370 million dollars (two franchises for the improve-ment of a road that rings around Santiago and two that cross Santiago in the North-South andEast-West directions). Auctioning urban highways has proven more difficult than expected. First,in urban highways the range of government decisions influencing traffic is much broader than ininter-urban highways. For example the construction of access roads, complementary or substi-tute routes, the expansion of the subway system, or the introduction of tolls on congested streetscan affect traffic patterns. Moreover, the construction of highways generates urban problems. Forexample, the construction of a large-capacity urban expressways can cause the deterioration ofthe surrounding area. In Santiago, people living in a well-to-do residential area adjacent to a pro-posed highway mounted a strong campaign against its construction. While they could not preventits construction, they forced major changes that increased the cost substantially. Ecologists haveopposed urban highways because they believe highways will encourage car use and so increasepollution; instead they favor investing in public transport. While the argument is correct whenthe highways are free, this is no longer the case when these highways have tolls that depend onthe level of congestion. The four highways that have been adjudicated, will reduce congestionsubstantially and the fact that users pay for them implies that the standard relocation effects offree highways will be dampened.
3.4 Concessions for Port Management and Operation
There are 10 state-owned ports and 22 private ports in Chile. The state-owned seaports have nat-ural advantages due to their better geographic localization. In general the private ports are usedfor bulk cargo, so they need less infrastructure than the state owned ports, which are normally
19This requires that the contract specify a minimum toll in order to avoid the threat of expropriation of the franchiseholder.
55

specialized to general cargo (normally in containers). This type of cargo requires calm waters forloading and unloading, so the state owned ports are usually protected by extensive works.
Private participation on state-owned ports started in 1981 when private firms were allowedto perform the duties of loading and unloading ships at the docks, as well as on-port storageservices. This change greatly increased efficiency in cargo handling, making it unnecessary toinvest in expanding these ports, even though previously, under public operation, the ports wereterminally congested. The port authority (Empresa Portuaria de Chile- Emporchi), however, keptthe management of all state-owned port infrastructure, that is to say, docking sites and storagefacilities.
In the middle of the 1990’s, it became evident that rapid growth in foreign trade would, in theshort term, render inadequate the cargo transfer capacity in state-owned ports. This was particu-larly true of ports located in the central zone of the country where, for geographic reasons, thereis little potential for development of new ports. Chile has few well protected bays and inlets andmost of these lie in the middle of urban centers. Expanding the number of docking sites at existingports is possible, at least in the case of the port of San Antonio, but at a high cost. In addition tothese stumbling blocks, a dearth of stacking and storage space within the ports themselves furthercompounds problems, since urban growth and sprawl has severely limited the ability of theseport service areas to expand.20 Finally, having multiple private operators conspired against thecoordination of activities and investment in specialized gantry cranes for containers.
The government feared that inefficient port operations would have a multiplier effect on thecosts of the transportation chain. Ships range from large, fast and expensive types to slower anddepreciated hulls. Since an efficient ship costs tens of millions of dollars, from the point of viewof a shipping company the main cost of an inefficient port is not the tariffs for docking and load-ing/unloading but rather the capital cost of the ship. Inefficient ports tend to receive slower, olderand smaller ships with higher operational costs. Hence, even in addition to having high dock-ing and loading/unloading costs, inefficient ports raise the total transport cost of traded goodsby much more and render a country non-competitive in international markets for its goods. Thiswas one of the fears of the Chilean government, since Chile is an open economy that depends onremaining competitive for its future growth.
The government believed that it was possible to increase the transfer capacity of the state-owned ports by increasing private participation in port administration and operation. Moreover,the government began to think of ports as consisting of terminals known as “frentes de atraque”,which combine groups of docking sites and storage space that could function as independent unitsand believed that these terminals would be operated best by a single private firm, that would co-ordinate its activities and internalize all the benefits of investment in new equipment. Based on
20San Antonio is an exception and has been able to expand these support areas.
56

this assessment, a bill was introduced in Congress for modernization of the state-owned port sec-tor, which was enacted on December 1997. The law split Emporchi into 10 different SOE’s or portauthorities, one for each state-owned port, which were granted the power to award concessions tomultiple or single private companies for the administration and operation of port infrastructure.
Granting concessions for state-owned port administration and operations posed certain risksto competition in the sector. There are only three ports in the central zone of Chile (Region V),which is where the most of the general cargo enters and leaves the country. Two of these portsare state-owned (Valparaıso and San Antonio) while the remaining port is privately owned (Ven-tanas). Altogether, these three ports are endowed with seven “frentes de atraque”, but not allof these are able to berth large vessels. Additionally, it is necessary to consider that some termi-nals are especially built for transfer of containers, others for bulk cargo (where there is no lack ofcompetition), and still others, for standard cargo.
In other countries, large-scale port users, mainly shipping companies, own their cargo termi-nals, because such an arrangement provides operational advantages. In Chile, however, since sofew “frentes de atraque” are available, only a small number of users of significant size wouldbe able to own their terminal and this would, of course, place other users at a great disadvan-tage. Even though regulations make it mandatory for prices to be made public and set on anon-discriminatory basis, concessionaires can use subtle methods to discriminate against non-integrated shippers, which are difficult to prove and, therefore, to penalize. These methods in-clude assigning the choice spaces in the holding areas to one company over another, providingbetter quality service to one company as compared to others, using insider information, and ma-nipulating docking reservations.
In drafting the port modernization law (Law 19.542), legislators took into account the above-mentioned problems and included several clauses into the law for the purpose of safeguardingcompetition in the sector. Firstly, the law requires that concessions be awarded through publicauctions and only for up to 30 years. Secondly, concessionaires must be incorporated as publiclyowned stock companies, which are engaged in a single line of business. Thirdly, the rates set byconcessionaires must be made public and established on a non-discriminatory basis. Fourthly,proposed by-laws and internal regulations for concessions are required as an integral part of therules of bidding. These rules must conform to objective technical and non-discriminatory stan-dards, especially with regard to assignment of spaces and reserve capacity.
The two port authorities in Region V put up for simultaneous public bidding three out of thesix docking areas they owned. Two of these were the “frentes de atraque” capable of berthing thelargest vessels at each port, while the third was the bulk terminal of San Antonio. The port author-ities, in consultation with the Antitrust Prevention Commission, imposed additional conditions toconcession-holders to prevent risks of abuse of a dominant position, as provided for by the law.
57

Their conditions included ceilings on horizontal integration, restrictions on vertical integration,additional rules of transparency, reserving the right to set maximum prices in order to preventlow bidder turnout, and quality standards.
The rules specified, for instance, that significant users (defined as those that shipped more than15% of the cargo in the region) should not own more than 40% of the stock and/or voting sharesin the firms that operated the port franchises. According to the port authorities, it was necessaryto limit significant users to a minority position in the company in order to reduce the possibility ofdiscrimination. Concessionaires are required to grant any interested party expeditious access toinformation such as cargo contracts, service priorities, and type of cargo and consignees, so that allof the interested parties will have the same information. Finally, the port authorities can imposepenalties for low quality of service. Minimum transfer speeds and maximum waiting times forships are specified in the concession contracts.
The concessions were awarded in July 1999. In principle, each one was to be awarded tothe bidder that offered the lowest maximum port transfer rate index, which was an average of 4transfer charges. Nonetheless, in fairness to private port competitors, the rules of bidding for eachdocking front specified a minimum rate floor index. Moreover, the minimum rate floor has thebeneficial effect of creating ex-post rents for the non-integrated port, which implies that the in-centives for underhand integration with a shipper and then discriminating against its competitionare reduced. In the event that more than one bidder offered the minimum rate index establishedin the rules, a tie-breaking payment was to be offered in addition.21 This payment was over andabove the leasing payment that was established in the rules of bidding for the port infrastructure,and was calculated on the basis of the economic value of the property.
The bidding attracted a great deal of interest, and a total of 21 bids were tendered by consor-tiums made up of leading domestic and foreign companies, of which 19 included the minimumrate index, plus the additional tie-breaking payment. All terminals were awarded in the end onthe basis of the tie-breaking payment amount. Consequently, the average rates for port serviceswere reduced by over 10% in the “frentes de atraque” that were awarded in concession and thegovernment was also able to take in revenues that tripled its expectations and added up to 267million U.S. dollars.
The results of the first years of operation have also satisfied the government’s expectations,as can be seen with data for the Port of Valparaıso (Table 3.14). The efficiency in port servicesincreased substantially. Similarly, the transfer speed at the port of Iquique increased by 41% injust half a year.22 Finally, in the franchised terminal at San Antonio, the main port, the transfer
21Ex-ante rents are dissipated via this cash payment. See Engel et al. (2001) for a detailed analysis.22Report of the President of Empresa Portuaria de Iquique, 2000.
58

velocity rose from 475 ton/hr to 635 ton/hr, an increase of 34%.23 In the Valparaıso concession,investment in new cranes, computer software and other equipment during 2001 topped US$8MM,with another US$27.5 expected until 2006.
Table 3.14: Valparaıso: Time spent in loading and unloading (U/L) and transfer velocity
1999 2001 2002 (est.)
U/L Time (hrs) 45.0 26.3 21.0Productivity (containers/hr) 25.5 43.7 54.8
Source: Empresa Puerto Valparaıso. Loading and Unloading time refers to a Eurosal vessel with 1150 cargomovements.
23Source: Empresa Portuaria San Antonio.
59

Chapter 4
Privatization of social services
In 1980, the military government introduced reforms that transferred a major fraction of socialsecurity to the private sector. That same year, another set of reforms began to transfer public ed-ucation to the private sector through a system of implicit vouchers. The prime objective was toimprove efficiency (though there was an ideological component independent of the efficiency ob-jective), specially through competition in the provision of social services. When the governmenthanded the administration of these sectors to the private sector, it also gave citizens the responsi-bility for their decisions regarding social security and the education of their children. Since theseare complex services with asymmetrical information and strong externalities, the State kept a su-pervisory role.
4.1 The privatization of the pension system1
One of the more radical reforms was the privatization of the pension system. In 1980 the govern-ment approved a law that created the private pension fund administrators (AFPs), which beganoperating in July 1981. This new system introduced compulsory savings accounts for retirement.Workers are required to deposit 10% of their gross wages (with a maximum amount of 6 UF -around US$150/month) in the AFP of his choice. They can add voluntary amounts in order toincrease their savings. The AFP’s receive a commission that is charged in addition to the amountthat goes to the pension fund. In December 2000, the commissions varied between 3,55% and2,24% of the monthly income of a worker, and depended on the income of the worker and thespecific policies of the AFP. The State remained responsible for three specific aspects of social se-curity. First, it regulates and supervises the AFP’s and created a specialized supervisory agency(Superintendencia) for this task. Second, it pays the pensions of workers that had retired and the
1For a detailed account of the pension reform see Acuna and Iglesias (2000).
60

old pay-as-you-go system, and also receives the contributions of the workers that chose to remainin the old pension system, which required the creation of a new institution, the Instituto de Nor-malizaci’on Previsional (INP). The third obligation is the financing of pensions for those workerswhose savings are not sufficient to finance a minimum monthly pension, as well as even smallerpensions for those who do not have any resources.
The change from a pay-as-you-go system to a fully funded, personal system represented ahuge cost to the State during the transition, as it had to continue to pay the pensions under the oldsystem as well as bonuses representing contributions to the old pension system for those workerswho switched to the new system. At the same time, the number of active contributors to the pay-as-you-go system fell by 70% as workers switched. The operational deficit of the pay-as-you-gosystem reached its maximum value of 8,1% of GDP in 1992, and has been falling ever since. Reach-ing a value of 3,7% in 2001. The State was able to finance this deficit by reducing expenditures,with the income received by the sale of state owned enterprises and by indebtedness, partly to theprivate pension system. For example, in November 1984, 43.3% of the assets administered by theAFP’s were government debt. This percentage has been falling and by February 2000, only 34.4%of the funds administered by AFP’s were government debt.
4.1.1 Evaluation of the private pension fund system.
In order to analyze the effects of the private pension fund system, there are two aspects that need tobe considered. First, there are benefits to the agents that are directly involved: AFPs and workers.A second possible aspect is the effect of the system on the economy as a whole. We will concentrateon the first aspect, even though we briefly mention the global effects of the reform. There is noquestion that the existence of AFP’s, which were fairly sophisticated investors (buying publicdebt, bonds and shares) as compared to average workers or the State, gave a big impetus to thedevelopment of a local capital market. Moreover, their existence made it easier to privatize firmsduring the second half of the 80’s, and their participation in the privatization process had the effectof distributing the property of these firms among workers.
It is often mentioned that the private pension system raised the Chilean savings rate, but theevidence is not conclusive regarding this issue.2 Clearly, the government’s decision to reducespending in order to help finance the transition to the new system did have a positive impact onthe national savings rate. However, the reduction in public spending meant less investment ininfrastructure, health and education (see table 4.5 for spending in education).
The owners of the pension funds administrators have clearly benefitted, with high rates ofreturn on assets, as can be seen in table 4.1. By the mid 90’s, the AFP’s became less profitable, but
2Other authors attribute the increase in the savings rate to the the 1984 tax reform that reduced to 10% the incometax on retained profits on firms.
61

Table 4.1: Profitability of the private social security funds administrators and of the funds.
Year Administrators Funds
1985 17.9 13.41990 56.7 15.61995 21.7 -2.51997 17.5 4.72000 50.2 4.42001 33.8 6.7
this is partly explained by rent dissipation, i.e., an increase in the competition between AFP’s forclients. Sales effort represented 36% of operational costs of AFP’s in 1997 (46% of operational costsif the life insurance premium is excluded). The competition was so intense that every month 5% ofaffiliates switched AFP’s. In 1999, in a misguided attempt to reduce the sales effort and hence leadto lower commissions to affiliates, the government introduced rules that made it more difficult toswitch AFP’s. AFP’s benefitted most from the change as the reduced competitive effort led to anincrease in their profitability, given the levels of concentration in the industry. The government isattempting to reintroduce more competition by opening the system to other financial institutions.
The biggest advantage for workers is that they have more security about the destiny of theirpension contributions. Under the pay-as-you-go system, politicians used the pension contribu-tions as a piggy-bank to be raided for political purposes. Pensions depended in many cases on theability to exert political pressure of the 32 different pension systems. Even within one of these sys-tems, there was a lot of discretion in the amounts a worker could receive in pensions. Hence, it wasnot uncommon for two workers who had contributed exactly the same amount to receive vastlydifferent amounts in pensions. As a consequence of these problems, the system was bankrupt,so there was no guarantee that the promised pensions could ever be delivered, and in fact themilitary government reduced pensions discretionally in order to finance a budget deficit after the1982 crisis.
An often touted advantage of the AFP system is that it allows for freedom of choice among ad-ministrators. However, workers seem not to respond to the most important variable in the system:the profitability of their pension savings, which depends, to a large measure, on the commissionscharged. After more than 20 years of the system, a survey showed that only 3% of the workersknew the commissions charged by the AFP’s (Cerc, noviembre 2001). Among the people that hadswitched in the previous year, only 12% answered that they had done because of the better per-formance of the new AFP and only 17% said it was due to the level of commissions. This lack of
62

knowledge is the reason that AFP’s compete mainly by rent dissipation through sales effort.The affiliates have also benefitted from the high rates of return of their savings. On average,
since inception in July 1981 up to December 2001, the average real return on pension funds hasbeen 10.68%. This high returns are explained in large part by the huge increase in the valueof shares after the AFP’s were allowed to invest significant amounts in the stock market in theearly 90’s. The returns have been smaller more recently. From January 1996 to December 2001,the return fell to 5,65%. Given that the AFP’s are constrained in the types and the amounts ofinstruments they can invest, it is difficult to judge the quality of the AFPs’ investment decisions.Moreover, since the law sets penalties for AFP’s whose fund returns fall by more than 2% belowthe average of the industry, while there is no compensating benefit when the returns are higherthan average (except for marketing possibilities), the AFP’s tend to invest with herd-like behavior.This explains the fact that the returns of all AFP’s funds show very little dispersion. The averagereturns vary from 10.43% to 11.00% annually since inception. In any case, the system has allowedworkers to benefit from the increased values of shares. The limits on investment have been relaxedgradually and hopefully the ability to invest well will become more important in the future.
The system is costly. As can be seen in table 4.2, workers have to pay net commissions (ex-cluding the life insurance premium) in addition to the pension contribution, which in March 1985fluctuated between 31.4 and 53.6% of the pension contribution, a fraction that depended on theincome of the worker and the specific AFP. By December 2001, commissions had fallen to between15.1 and 27.2% of the worker’s pension contribution. These numbers are very high when com-pared to the administrative costs of the public pension fund, which represent 1.4% of the incomeof the system and 7% of worker’s contributions. On the other hand, when the commissions inAFP’s are measured in terms of accumulation, they represented 9.1% of the accumulated fund in1984 and had fallen to 1% by December 2000. This price is still higher, but getting close to the costof similar funds in the US.
In order to know the effective rate of return of workers, it is necessary to subtract the commis-sions (net of insurance premiums) from the return of the AFP’s funds. For the period between July1981 and December 2001 the effective return was 7.17% for an individual who earned $105.500.For an individual earning the top rate for compulsory contributions ($975,760), the effective returnwas 7.43%. To sum up, almost thirty percent of the return of the AFP’s funds went to pay their ser-vices. Moreover, the average rate hides differences between AFP’s, since for a low income worker,the effective rate of return for the period between July 1981 and December 2001 varied from 6.61%to 7.71%, that is by more than one percentage point over more than twenty years. Over time thesenumbers have become less striking: from January 1996 to December 2001 the average effectivereturn was 4.51% for the lowest income workers and 4.66% for those with salaries of 60UF, whichis about 1% lower than the average return for the fund: 5.65%. This numbers show that the system
63

Table 4.2: Commissions of Private Social Security Administrators
Year % of contributions to the fund % of fund accum.
Maximum Minimum Average
Gross Net* Gross Net* Gross Net*
1985 63.8 38.6 41.7 16.5 11.6 9.11990 62.3 52.0 31.9 21.6 4.2 2.41995 42.6 34.8 28.4 20.6 1.9 1.22000 36.6 30.2 22.5 16.1 1.5 1.02001 33.8 27.2 21.7 15.1 – –
Source: Superintendencia de AFP.Notes: *: Excludes the life insurance premium, estimated as 2,52% of gross income for 1985, and1,03%, 0,78%, 0,64 y 0,67% for the years 1990, 1995, 2000 and 2002, respectively.
is becoming less expensive for workers, probably due to scale economies.A further problem with the system concerns the options at retirement. There are severe restric-
tions on how the fund can be disposed, the main choice being an annuity lasting for the life of thepensioner (plus a smaller fraction to a widow), or a system by which the pensioner receives a setannual fraction of the remaining funds (which can still earn returns). The second option repre-sents no additional costs for the retired workers, but the first option, chosen by most pensionersas it eliminates investment risk, could be very expensive, at times reaching more than 5% of totalfunds.3 These high commissions led to intense sales efforts which led to higher costs. The govern-ment has introduced legislation that promises to provide better information on the costs of theseannuities to retiring workers and this has led to a decline in the commissions, which have fallenby almost half.
4.2 The health insurance system4
Another innovation of 1981 was the partial privatization of the health insurance system. Themilitary government introduced a law-decree that created the private health insurance firms, theIsapres. All active and retired workers must contribute a fraction of their income to a health in-surance system, but they can choose between one of the 15 open Isapres (four of them have 67.2%of all affiliates) or the public health insurance system (Fonasa). At present, the compulsory contri-
3Part of the commission was used to illegally provide cash to the pensioners4A complete, though slightly dated analysis of the private health care system can be found in Fischer and Serra
(1996)
64
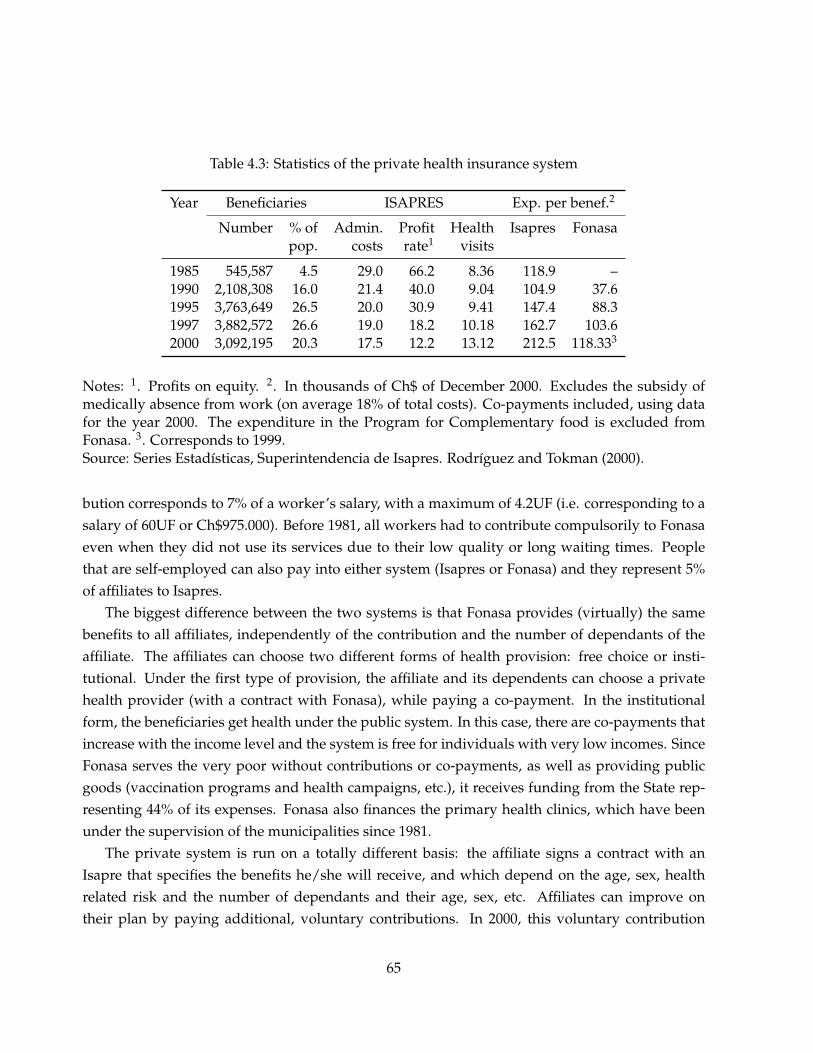
Table 4.3: Statistics of the private health insurance system
Year Beneficiaries ISAPRES Exp. per benef.2
Number % of Admin. Profit Health Isapres Fonasapop. costs rate1 visits
1985 545,587 4.5 29.0 66.2 8.36 118.9 –1990 2,108,308 16.0 21.4 40.0 9.04 104.9 37.61995 3,763,649 26.5 20.0 30.9 9.41 147.4 88.31997 3,882,572 26.6 19.0 18.2 10.18 162.7 103.62000 3,092,195 20.3 17.5 12.2 13.12 212.5 118.333
Notes: 1. Profits on equity. 2. In thousands of Ch$ of December 2000. Excludes the subsidy ofmedically absence from work (on average 18% of total costs). Co-payments included, using datafor the year 2000. The expenditure in the Program for Complementary food is excluded fromFonasa. 3. Corresponds to 1999.Source: Series Estadısticas, Superintendencia de Isapres. Rodrıguez and Tokman (2000).
bution corresponds to 7% of a worker’s salary, with a maximum of 4.2UF (i.e. corresponding to asalary of 60UF or Ch$975.000). Before 1981, all workers had to contribute compulsorily to Fonasaeven when they did not use its services due to their low quality or long waiting times. Peoplethat are self-employed can also pay into either system (Isapres or Fonasa) and they represent 5%of affiliates to Isapres.
The biggest difference between the two systems is that Fonasa provides (virtually) the samebenefits to all affiliates, independently of the contribution and the number of dependants of theaffiliate. The affiliates can choose two different forms of health provision: free choice or insti-tutional. Under the first type of provision, the affiliate and its dependents can choose a privatehealth provider (with a contract with Fonasa), while paying a co-payment. In the institutionalform, the beneficiaries get health under the public system. In this case, there are co-payments thatincrease with the income level and the system is free for individuals with very low incomes. SinceFonasa serves the very poor without contributions or co-payments, as well as providing publicgoods (vaccination programs and health campaigns, etc.), it receives funding from the State rep-resenting 44% of its expenses. Fonasa also finances the primary health clinics, which have beenunder the supervision of the municipalities since 1981.
The private system is run on a totally different basis: the affiliate signs a contract with anIsapre that specifies the benefits he/she will receive, and which depend on the age, sex, healthrelated risk and the number of dependants and their age, sex, etc. Affiliates can improve ontheir plan by paying additional, voluntary contributions. In 2000, this voluntary contribution
65

represented 26% of the compulsory contributions. The clients of Isapres must use private healthproviders. To obtain the benefits they can either buy a voucher previous to going to a doctor thathas a contract with the Isapre or pay any doctor and then get a reimbursement from the Isapre.In general, the reimbursement is not total and when using a voucher the beneficiary normallyhas a co-payment. The amount of the co-payment or reimbursement depends the specific planthat the affiliate has contracted with the Isapre. On average, the co-payments represent 14.3% ofthe compulsory contribution in the private system. There is no information regarding the non-reimbursed fraction of user’s expenditure of users that do not buy vouchers, but go directly totheir health providers and ask for reimbursement afterwards.
The private system is too expensive for most people. The beneficiaries of the private systemare employed, with middle or high incomes and have a low health risk. The 7% of compulsorycontribution is not sufficient to buy into a good plan for lower income individuals or for poten-tial affiliates with high health risks. In these cases, the voluntary contribution in order to get anappropriate program would be too expensive. For example, only 7.2% of beneficiaries are olderthan 65 years (this is an improvement on the 4% of 1990). The CASEN socioeconomic survey of1988 showed that only 6.7% of the population older than 65 years is affiliated to Isapres and thatonly 3.1% of the members of the lowest income quintile are affiliated to Isapres (while 54.2% ofthe households in the highest income quintile was a beneficiary of the Isapre system).
The number of beneficiaries of the Isapre system grew constantly until 1997, when it repre-sented 26.5% of the population. Since then, the percentage of the population affiliated to thesystem has been decreasing, slowly, until it reached 20.3% of the population in 2000. There areseveral reasons for the decrease in the number of beneficiaries: i) There has been an increase inthe unemployment rate since 1998, ii) the increased funding for Fonasa (expenditure per affiliatehas increase 300%), has meant that it has become a relatively more attractive system, iii) the re-moval in the year 2000 of a subsidy to employers that reduced corporate taxes by up to 2% of thesalaries of employees if the employer applied it to collective plans in an Isapre.5 (iv) the increasedsupervision by Fonasa to bar clients of Isapres from getting free services (as indigents) from thepublic system (a survey showed that 24% of beneficiaries of the Isapre system had used the publicsystem).
Another reason for families to move back to the public health system is that Isapre health planshave become more expensive. The increase in regulation of the private health system has increasedits costs, but there are additional reasons for the increase in the cost of the private (and also of thepublic health system, see Table 4.3). There has been an increase in both the number of health visits
5In a collective plan, the Isapre establishes a contract with a substantial number of workers in the company. Thereduction in adverse selection and other expenses implies that the individual price of a plan can be up to 30% less thanwhen plans are contracted individually. Employer’s contribution under this subsidy amounted to 3.3% of the revenueof the Isapre system.
66
by beneficiary and in the cost of these visits. Rodrıguez and Tokman (2000) have constructed anindex of the numbers of all forms of health provision, valued by the prices paid by Fonasa toprivate providers of medical services in the free choice system. The authors have estimated thatthis index has increased by 104% in the period 1990-1999, while total cost (excluding the subsidyfor medical absences from work) increased by 165%, showing that there has been an increase in theunit costs of medical services of 30%. In the public sector this increase in unit costs has been muchlarger, since the unit costs have increased by 141%. Total expenditure in Fonasa has increasedby 290% in the period 1990-1999, while the number of individual forms of health provision hasincreased by only 22%. The large increase in unit costs can be interpreted as a loss of efficiency,but it may also have a component of better quality of service.
4.2.1 An evaluation of the private health insurance system
The Isapre system was, until the late 90’s, a very profitable system. While the profit on equity plusreserves was only 12.2% in the year 2000, it had been significantly higher in the past, reaching66.2% in 1985. Higher income households benefitted by receiving better health care in exchangefor their compulsory contributions. An overall assessment is difficult, since there is also the costto the public health system, which lost the compulsory contributions of these same households.
The expense per beneficiary in the Isapre system is almost twice as high as in the public system,even though this difference has decreased over time. This comparison underestimates the cost ofthe private health system, because it omits the direct payments of ISAPRE affiliates for the part oftheir treatment that is not covered by their plan (the data on expenditure in public health does notinclude the transfers from municipalities to the primary health care centers, but this is a relativelysmall amount). Notice, however, that the number of health visits does not differ between thetwo systems. Table 4.4 shows that, except for the image tests (X-rays, NMR, CAT-scans, etc) thenumber of health services does not differ by much between the two systems. In fact, the publicsystem has more surgeries, which are expensive.
A cursory analysis might suggest that the public system is more efficient. The problem withthat interpretation is that there is a significant difference in the quality of the care in the two sys-tems.6 There are some economic principles that suggest that private, individual health care insur-ance with free choice of services and providers is more expensive than public insurance withoutfree choice.7 First, because there is a tendency to overprovide services: the classical example isthe fact that 63.4% of all pregnancies in the private sector end in a caesarean section, while the
6Another difference may be due to the fact that the aggregates in table 4.4 may hide differences in the compositionof services.
7On the other hand, another set of economic principles indicates that public systems are less efficient due to lack ofcompetition.
67

Table 4.4: Health services provision per beneficiary, 1999
Type of service Fonasa Isapres Difference (%)
Doctor visits 3.85 3.89 1.0Lab. Exams 4.84 3.59 -25.8Image exams 0.54 0.80 48.1Pathologic Anatomy 0.13 0.14 7.7Surgery 0.12 0.10 -16.7
Average cost* 61,352 59,474 -3.1
Sources: Anuarios Estadısticos Ministerio de Salud, Series Estadısticas, Superintendencia de Is-apres.*: Ch$ of 1999. The prices of Fonasa free choice are used in the valuation of services.
average for the public sector with no free choice is about half that rate.8 Second, the administra-tive cost of individual insurance contracts is higher, among other things, because Isapres evaluatethe health risks of each new affiliate and must ensure that the level of reimbursement and thecoverage are appropriate for their particular plans.9 In the year 2000, the administrative and mar-keting expense were 17.5% of total revenues, while profits were equivalent to 2.2% of revenues.On the other hand, the administrative expense in Fonasa is only 1.5% of total expense. Third, acentralized system may be able to contract services at monopsony prices.
One of the main problems of the Isapre system is that plans tend to offer good coverage forroutine health care, while they offer poor coverage of catastrophic illness, which is the main objectof compulsory health insurance. In the last two years, strong criticism on this basis has forcedthe Isapres to offer catastrophic illness insurance. The catastrophic illness insurance operates asystem without free choice that takes over all expenses after a specified yearly expenditure by thebeneficiary. This approach seems interesting, but as there is little experience there are no seriousevaluations of how it works. In any case, it is interesting to speculate as to the reasons why clientswould choose plans which lack good coverage for catastrophic illness. One explanation mightbe that affiliates are myopic and do not evaluate the cost of illnesses that are rare though costly.Second, affiliates may move to the public sector if they require cover for an illness which has littlecoverage under their private plan. Third, the system is not transparent, since plans will claim topay up to up to X% of a standard defined by the Isapre for a given treatment. Often the standard
8Interestingly enough, in the section of the public sector with free choice, the caesarean section rate is the same as inthe private sector. This suggests that free choice by itself leads to overprovision.
9The Isapres must also ensure against fraud, which occurs when affiliates lend their personal identification cards tonon-beneficiaries.
68

is not publicly available.Another problem is that Isapres try to exclude beneficiaries who develop expensive illnesses.
In an attempt to end this problem, since 1991 the Isapres are required to renew their contracts toany affiliate who desires renewal. However, the Isapres have found a way around this obligationby raising the price of these plans and offering new plans with similar benefits but at the originalprice to affiliates that do not represent a high risk. The Superintendencia that supervises Isapreshas instituted rules that try to reduce this type of risk selection, but it runs into the inherent insta-bility of the private health insurance system. Since low cost affiliates in a given plan are attractiveto other ISAPRES, there is a tendency to attract them to a plan with similar characteristics (in an-other Isapre) but without the expensive individuals. Even if this last problem might be solved,affiliates who acquire or whose dependants acquire an expensive illness have lost their ability toswitch Isapres, thus losing one of the main advantages of the system: the freedom of choice be-tween Isapres. Most of these problems arise from the serious information asymmetries in privatehealth systems (see Fischer and Serra (1996)). There are ways of reducing these problems, but theyare intrinsic to private health insurance systems so they cannot be eliminated from a system whichsimultaneously has free choice of providers and asymmetric information.
4.3 Public education and school vouchers
The country has gone a long way to decentralize its publicly funded education system. In 1980,just before the policy reform that initiated the decentralization process, the Economics Ministryspent 45% of its budget directly. At present, more than 93% of the budget of the Education Ministryis transferred to local governments or to private or other autonomous education organizations, asshown in table 4.5. The main object of the reform of the educational system was to improvethe quality of the state financed education by having competition between education providers.These institutions would compete for students, as the transfers would be linked to the number ofstudents attending classes in the institution. The government hoped that competition would bebased on que academic quality of the educational establishments.
The two main elements of the reform of primary and secondary education were i) the transferof state-owned schools from the central government to the local municipalities, ii) the establish-ment of a common subsidy (an implicit voucher) per enrolled student both at public, and privatenonprofit and for-profit schools. The only requirement for a school to receive the implicit voucheris that the student be enrolled and attending classes at the school. In the year 2000 the amounttransferred to primary and secondary schools amounted to Ch$809,006MM. Of this amount, Ch$322,377 MM went to the private schools and CH$ 486,628 was assigned to the municipal schools.The municipal schools received additional funding for infrastructure amounting to Ch$62,319 MM
69

Table 4.5: Budget of the Education Ministry
Year Total Subsidies Other transfers Tertiary education
Amounts % Amounts % Amounts %
1980 657317 47729 7.3 2582 0.4 246214 37.51981 739359 177892 24.1 4184 0.6 181137 24.51985 667028 301531 45.2 82596 12.4 183979 27.61990 537247 342802 63.8 56602 10.5 101240 18.81994 803076 484509 60.3 117722 14.7 132230 16.52000 1516003 954739 63.0 275893 18.2 191860 12.7
Source:1. Amounts in millions of Ch$ of 2000.
from the municipalities and Ch$56,898 MM from the central government. Since 1993 the privatesubsidized schools have been allowed to receive additional payments paid by the families of stu-dents, subject to a series of restrictions including a tax to the Education Ministry and a fund forscholarships of families that cannot afford to pay these amounts.10. Even though the municipalschools can also charge additional amounts, these monthly fees are much smaller. The local andcentral government funds received directly by the municipal schools are slightly larger than theamounts received by the private subsidized schools from these additional fees. Gonzalez (2002),shows that the private subsidized schools received Ch$ 68,600 MM from these additional fees,while the municipal schools received only Ch$1,400MM.
The reform has led to a large increase in the number of private subsidized schools.11 The num-ber of private subsidized schools rose from 1,627 in 1980 to 3,287 in 2000, while the number ofmunicipal schools fell slightly from 6,370 a 6,250 in the same period. In 1981, only 15,1% of all pri-mary and secondary students attended the private subsidized system (mainly religious schools)while 37.3% are enrolled in these schools in 2000. One unintended consequence of the reform isthe decrease in the rates of truancy, which is easily explained by the inherent characteristics of thevoucher scheme, though it is possible that the system has led to a loosening of the standards forpromotion of students.
The growth in the public, subsidized sector might have been greater if the value of the subsidyper student had not been reduced substantially in the mid-80’s. If we set the real value of the
10The possibility existed since 1980, but was scarcely used because 40% of contributions had to go to the EducationMinistry
11Around 10% of the students belonging to the higher income groups attend purely private schools, which receiveno subsidy.
70

Table 4.6: Types of primary and secondary schools
Type of school 1980 1985 1994 2000
Public, Centralized 6370 808 0 0(%) 72.4 8.2 0.0 0.0Municipal 0 5668 6221 6250(%) 0.0 57.8 63.6 58.9Private, subsidized 1627 2667 2707 3287(%) 18.5 27.2 27.7 31.0Private, no subsidy 802 668 860 1068(%) 9.1 6.8 8.8 10.1
Total 8799 9811 9788 10605
subsidy per student at 100 in 1982, by 1985 the the value in real terms had fallen to 75, and evenby 1990, it stood at 76 (see Gonzalez (2002)). During the 90’s this fall was reversed, and the realvalue of the subsidy index reached value of 104 by 1994. By 1999, the value was 169, implyingthat in real terms, there had been an increase of almost 70% in the resources per student in onedecade. This implies that after the rapid increase in the number of subsidized, private schoolsof the early eighties, and the stagnation of the late eighties, by 1995, the number of these schoolsstarted increasing once again. In order to survive the decline in the value of the voucher in theperiod 1985–1994, the private, subsidized schools increased enrollment by 25%.
4.3.1 An evaluation of the reform
There is no question that parents like the possibility of choice, and this is one of the reasons for thepopularity of the new schools. A more complex question is to determine whether they add valueto education. One important element is provided for by the SIMCE tests, which are standardizednational tests which measure achievement of educational standards. On average, private, non-subsidized schools do best, private, subsidized schools come next (much farther down) and themunicipal schools have the worst performance on these tests. However, a large fraction of thedifference between the schools can be attributed to differences on socioeconomic (including edu-cation) of the parents. In one recent study, Mizala and Romaguera (2000), show that these variablesexplain the difference between the performance of municipal and private subsidized schools forthe SIMCE of fourth grade in 1996. In the same study, the unexplained difference between privatenon-subsidized and private subsidized schools falls to only five points. The explanation for thisresidual difference is probably the enormous difference in expenditure between subsidized and
71

Table 4.7: Simce Test Results, fourth grade.
Type of school 1988 1990 1992 1994 1996 1998
Municipal 49.25 56.70 63.85 64.43 68.00 –Private subsidized 56.35 58.8 70.15 70.66 73.65 –Private, non-subsidized 76.15 80.05 86.05 85.07 85.85 –
non-subsidized private schools.However, these results are not robust, since in an analysis of the SIMCE of 1998 for the tenth
grade, Mizala and Romaguera (2001) find that the private subsidized schools have better resultsthan the municipal schools, even after controlling for socioeconomic variables. In short it appearsthat the private subsidized schools have obtained results that are equal or better than those ofmunicipal schools, even after normalizing by socioeconomic variables, at a lower governmentexpense. In fact, the subsidized schools have invest in infrastructure, while the municipal schoolshave used the previously existing infrastructure of the state schools, and improvements have beenfinanced by the government. There are various possible explanations of this result. One is thatprivate schools have managed to do this because they are more flexible, they have more studentsper class and because they apparently are more efficient.12
Some facts point to a more rigid and less efficient municipal school system. The idea behindthe implicit vouchers is that the income of a school would depend primarily on the number ofstudents, and not on historical criteria of budget assignment. However, mayors manage the in-come from vouchers corresponding to all students enrolled in their municipal school system, andfor political reasons the mayors have refused to lower the revenue of those schools with fewerstudents. A second factor is the Estatuto Docente (Teachers Statute) of 1991, which made it almostimpossible to fire teachers no matter how bad their performance and set a fixed pay scale that de-pends on seniority and not on performance (see Beyer (2000)). For the last ten years, the teacher’sassociation has managed to stop any attempts at grading teachers based on the quality of theirperformance. Even though the minimum wage established in the Estatuto applies to the private,subsidized schools, other conditions do not apply, and it is possible to fire teachers at the end ofthe school year, under the standard rules for labor contracts in Chile.
A different explanation for the better results obtained in standardized tests by subsidized pri-vate schools compared to municipal schools, is that the former can be selective, whereas the latter
12Since this is an area where ideology plays an important role, it is important to read the evaluations with a pinch ofsalt.
72

cannot reject students unless they do not have openings.13 However, there might be a selectionbias, since parents that care more about their children may prefer private subsidized schools. Sincethere are so many alternative explanations, perhaps the comparison between municipal and pri-vate subsidized schools is besides the point since one of the main beneficial effects of the vouchersystem has been to increase the awareness of school quality and to make schools behave morecompetitively.
The fact that school level Simce results are published has increased the incentives for schoolowners to compete for the best students, though not necessarily through improvements in thequality of education. Moreover, prestigious schools can choose their students and they selectfor academic quality, so that standardized tests magnify the contribution of the highly selectiveschools to the results.14
The overall results of the reform of 1981 are still not clear. For instance, Hsie and Urquiola(2001) believe that the effects of the reform have been negative or at most non-significant. Theyargue that the median quality of students at municipal schools decreased, as the best studentsemigrated to the private subsidized schools. Since they believe that students get better results de-pending on the quality of their classmates, this migration was bad for the students that remained(and, by the same token, it was good for those that migrated). These authors claim that the loss tothe first group is larger than the gain to those that migrated, based on their finding that in thosemunicipalities in which there is a higher proportion of private schools, the average results in stan-dardized tests are worse than the national average. This finding is consistent with an educationalproduction function which shows better average results from aggregation rather than segregationof students by ability. However, the inherent weaknesses of their claim is that it cannot separateclearly cause and effect, since one among many competing interpretations might be that theremore students in private schools in a particular municipality because the municipal schools areworse than average.
Any analysis, moreover, must consider that there are several reasons why competition betweenschools – the mechanism through which the quality of schooling was to improve under the reform– was damped. First, parents did not have objective measures of school quality: tests equivalentto the Simce have been used since the 80’s, but only in 1995 were these results published at theschool level. Second, the Teachers Statute has reduced flexibility in the hiring and discharging ofteachers. Third, municipal schools have been shielded from competition.
13See Gauri (1998) and Parry (1996). In a recent survey that examined the 100 schools of each type with the besteducational results, admissions testing occurred in 88% of private non-ubsidized schools, 68% of subsidized and 22%of public schools.
14In order to reduce any perverse incentives, the Education Ministry introduced in 1996 the National PerformanceEvaluation System (SNED), which evaluates a school with respect to its own past history and which penalizes schoolsthat expel students.
73

Table 4.8: Enrollment in tertiary education
Type 1983 1987 1991 1993 1995 1997 1999 2000
Universities 108.049 121.219 143.526 188.253 223.889 259.790 286.357 302.572Traditional 105.341 113.567 114.698 138.267 154.885 175.641 195.372 201.186Private 2.708 7.652 28.828 49.986 69.004 84.149 90.985 101.386
IPa 25.244 29.595 37.376 38.076 40.980 56.972 74.456 79.904Subsidized 17.720 10.548 6.802 0 0 0 0 0Private 7.524 19.047 30.574 38.076 40.980 56.972 74.456 79.431
CFTb 39.702 67.583 65.987 83.245 72.735 54.036 50.821 53.354
TOTAL 172.995 218.397 246.889 309.574 337.604 370.798 411.634 435.830
Source: Ministerio de Educacion.Notes: a: Professional institutes. b: Centros de formacion tecnica.
4.3.2 Tertiary Education
There have been important changes in tertiary education, which involves universities, technicalinstitutes and other centers of post-secondary education. The changes involve both financing,management and the opening of the system to new, private entrants. The object, once again, wasto improve the quality and efficiency of the system via the introduction of competition. Once theywere allowed, a large number of new, private universities were created. Until 1980 there wereonly two public universities, plus five private universities that were financed by the State. In 1981the regional centers of the two state universities were set up as 17 independent universities (threemore regional centers became universities later on). Simultaneously, the government introducednondiscriminatory rules for creating new private universities without direct state financial sup-port. There are now 39 new private universities, which enroll 32% of all university students in theyear 2000.
The financing of the university system also was radically changed. The education authoritieshave directed more and more resources to primary and secondary education, as can be seen intable 4.5. The main reason is that spending in universities is considered regressive, since the ma-jority of students belong to middle and upper income households. Moreover, there was evidencefor a wider divergence between private and social returns in primary and secondary education,which meant that there was less need to subsidize a college education since the benefits are wellinternalized. As a result of this change, the State financing of the university system was cut fromalmost 100% in 1980 to around 30% by 2000. Universities were allowed to raise fees to compensatefor the reduction in direct transfers from government. Up to 1981 university fees had been nomi-nal. Lower income students benefitted from a system of student loans at subsidized rates (2% in
74

real terms). These loans enabled students to pay their fees totally or partially, and in the case ofvery poor students included small amounts for living expenses.
The system through which the state finances the university system was also reformed in orderto introduce competition. Until 1981, the government made direct transfers to universities to covertheir expenditures. By the year 2000, only 41% of all state financing of universities was a directtransfer. Another 10% went to the universities via competitive improvement projects, 24% went tostudents (16% as a student loans and 8% in grants), 7% went to the universities that attracted thebest students (according to the Prueba de Aptitud Academica, a Chilean version of the SAT), 13%through competitive research funds and finally 4% as the State contribution for private donations.The new, private universities can only compete for the last three sources of funds, though theyhave argued that this is not a level playing field (though they are the main recipients of privatedonations). In the future, state guaranteed student loans will probably be provided to students inthe new private universities.
Our evaluation of these changes is positive. First, the total enrollment in the university sys-tem grew from 108,049 students in 1983 to 302,572 in the year 2000, vastly increasing access tothe university system, even though students pay substantial fees as compared to the almost freeuniversities of 1980. Private individuals have dedicated large resources to university education,and these have compensated for the decline in government support. Second, the increased com-petition for public funds and, more recently, for students, has had a salutary effect on the system.The concern for the needs of students and for the quality of teaching has increased, as the mainuniversities face an increasing challenge from private universities.
An important problem is that there are few objective indicators of the quality of the differentuniversities that can be used by students when selecting a university. Most of the research is stillcarried out in the traditional universities, due to their longer tradition and the fact they receivedirect funding from the state. However, the traditional public universities (except those that arelinked to the Catholic Church, which face another threat: many of the new private universitiesare competing for conservative, catholic students) suffer from management problems that maythreaten their future. For instance, the presidents are selected by the professors, so they have torespond to corporate interests which may conflict with efficient management. Finally, the pub-lic universities labor under an inflexible civil service system, which is another obstacle to goodmanagement.
75
Chapter 5
Conclusions
This chapter collects our results and presents some hypothesis that represent consistent expla-nations for these results. Unfortunately, the lack of information limits the verifiability of thesehypothesis. First, we found that privatized firms experienced significant improvements in effi-ciency, but this improvement is no different from the change experienced by other private firms intheir respective economic sectors. This allows us to conclude that Chilean SOE’s were efficient be-fore privatization, at least if we compare them to private firms in their respective sectors. This hasbeen noted before by other researchers, including Hachette and Luders (1994). This conclusion isconsistent with the fact that employment levels in privatized firms were stable for several yearsbefore privatization, and rose afterwards. This is not surprising, given that several years prior toprivatization, State Owned Enterprises (SOEs) had suffered reorganizations, specially in terms ofreducing the number of workers (see table 2.7).
Second, we found that there are significant differences in the post-privatization performanceof regulated and non-regulated firms. Hence we have reported separate results for each group offirms. In what follows we give an account of adjusted results, i.e. where we have normalized theperformance of firms with respect to the performance of their economic sectors at the 2-digit SIUlevels. We focus first on the behavior of firms that era not regulated. Results for this group showno major changes in efficiency measured as unit costs and sales over PPE after privatization. Sincethese firms operated in competitive sectors, and their efficiency did not grew compared to otherfirms in their sectors, adjusted profitability should not show major changes after privatization,and this is the case.
The post-privatization performance of regulated firms is quite different. The profitability ofregulated firms grew after privatization. In fact, the ratio of net income over PPE (physical assets)rose substantially, while the ratio of income to sales also increased, but at a smaller rate. Thesefirms had efficiency gains after privatization, but these gains are not statistically significant. Sim-
76

ilarly, the cost per unit indicator shows a slight decrease, while the ratio of sales to PPE showsa timid increase. These results are consistent with efficiency gains due primarily to a more effi-cient use of capital (and probably a minor increase in regulated prices). There is some evidencethat prior to privatization, regulated SOEs had overinvested in physical assets. This implies thatprivatization should result in higher profits rates, as observed.
The implication is that Chile’s approach to incentive regulation has proven its worth, promot-ing efficiency in regulated firms. As we have shown, the efficiency improvements in the regulatedsectors that were privatized do not lag behind those of the non-regulated privatized sectors. Onthe other hand, regulators have been slow to shift these efficiency gains to consumers. This shouldnot come as a complete surprise. It is well known that regulation is an imperfect substitute forcompetition, and Chile is not an exception.1 Moreover, more recently the ability of regulation totransfers gains to consumers has improved substantially. However, there remain aspects of theChilean regulatory legislation and practice that should be improved.
In particular, the transparency of the tariff-setting process should increase. Currently, regu-lators in the electricity and telecommunications sectors can exchange the information used to setrates with the regulated companies; this prevents consumer organizations from countering thelobbying pressures of the regulated enterprises. The recent law for the water and waste treatmentsector takes the opposite approach: all the information used in setting rates must be made public.However, it is not clear that this new law has been effective in restraining lobbying while at thesame time limiting the possibility of regulatory takings.
The regulatory process requires improvement in access to information on the regulated firm.The regulatory process requires modelling an efficient firm, but this requires information that isuniquely available to the real firm, since costs depend, among other factors, on topography, geo-graphic density of customers, and demand. Regulators have had major problems in gaining accessto company data, because legislation does not provide specific penalties for failure to deliver orfor delivering false information. Currently, when a company refuses to hand over information,the regulator must go to the courts, where the process is lengthy and penalties are low.
Another lesson that may be learned from the Chilean experience is the importance of properlyregulating essential facilities. The 1982 law had required the dominant local telephone operatorsto provide interconnection access for other operators requesting it, with the cost of access to benegotiated by the parties. However, the negotiation of these charges led to prolonged lawsuitsthat made it difficult for new companies to enter the market. The 1994 law solved the problem byregulating all interconnection charges. Similarly, Chilean legislation guarantees power-generatingfirms’ access to the transmission system, but the fact that the largest power-generating companyowned the transmission system, combined with the fact that transmission tolls are negotiated,
1See also the results in section 2.3.1.
77
created some problems. In June 1997, the Anti-trust Commission ruled that the power generatingcompany should divest its transmission assets to an independent company.
Another type of natural monopolies was also privatized: those related to infrastructure. Inthese cases, the rate setting problem was solved by competition for the field (see Demsetz (1968)),auctioning the franchise to the firms that asked for the lowest user fee. It has been a successfulsystem. The main highways have been completely overhauled and their capacity has increasedsubstantially, reducing internal transportation costs and making the country as a whole more ef-ficient. There are only a few potential problems. First, we have unaccounted liabilities due to thetraffic guarantees offered by the government to successful bidders, and second, the possibility thatthe franchise holders are successful in lobbying the government for changes in the terms of theircontracts. In fact, many contracts have already been renegotiated because the highway projectswere awarded omitting important details and had to be changed through negotiation. This hasmeant a substantial (but not overwhelming) increase in the cost of the projects. On the other hand,the government was able to remain firm when Tribasa (A company that had received three impor-tant highway concessions) failed to complete one of its projects in time, and this is an encouragingsign.
Seaport franchises have also been successful so far: investment has increased, port efficiencyis higher and ships require much shorter periods for loading and unloading. There have beenno complaints from shipping companies that they are discriminated in the franchised ports, so itappears that the horizontal and vertical integration restrictions on the port operators have servedtheir purpose. It is too soon to have a fair evaluation of the port franchises despite these favorableresults.
Finally, we consider social services, where there is competition between providers, but Stateregulation is required due to information asymmetries. These sectors are also characterized bythe fact that the government either requires workers to buy their services, or finances them outof public funds, as is the case of education. There have been important benefits from the privati-zation of social services. In the case of the private pension system, the likelihood that politiciansbeing able to misuse pension funds is far smaller, increasing the security of pensions. In the caseof the health insurance and the private subsidized schools, competition from the private sectorhas increased the visibility of public sector inefficiencies, which is under pressure to improve itsperformance. This does not mean that privatization has been free of troubles. The main problemhas been the reluctance of private individuals to acquire the knowledge needed to make rationaldecisions.2 As a result many individuals do not understand some of the main aspects that areinvolved in the rational choice of a provider of these services,
Limited understanding in the part of consumers has led providers to focus more resources
2Of course, their decisions may be rational in a world where agents have limited rationality.
78

on marketing and sales efforts than on variables that are relevant from the point of view of anenlightened policy-maker (extent of coverage of a health plan in the case of the private healthinsurance system, net rate of return on a pension fund in the case of the private pension systemand quality of schooling in the case of the subsidized private schools). On the other hand, regula-tion has prevented full competition. In private pension funds, restrictions on portfolio investmentand rules that penalize administrators whose funds perform poorly (apart from the market pun-ishment due to the defection of affiliates from such a fund), imply that all administrators obtainsimilar performances from their fund investments. As a result, competition between administra-tors has focused in variables that are not relevant from the point of view of the objectives of theState. Similarly, beneficiaries of the private health insurance system may prefer plans with littlecoverage for expensive but infrequent diseases because they can always switch to the public sys-tem. In education, parents did not have objective measures of school quality until recently; onlysince 1995 were these results published at the school level, and individual student results are stillnot provided to the parents. The Teachers Statute has reduced flexibility in the public system. Onthe other hand, municipal schools have been shielded from competition. Hence the full gains fromprivatization have yet to be achieved.
To summarize, privatization has benefited the country, even in the case of regulated sectors.Due to market imperfections, it is not always easy to align the interests of private providers andsociety. However, regulation has partially succeeded in this intent. This achievement has requireda permanent fine-tuning of regulation. The full benefits of privatization in regulated sectors, how-ever, will be attained when citizens become more informed consumers.
79
Bibliography
Acuna, R. and Iglesias, A. (2000). La reforma a las pensiones. In F. Larraın and R. Vergara, edi-tors, La Transformacion Economica de Chile, pages 431–490. Centro de Estudios Publicos, Santiago,Chile.
Beard, T. R., Kaserman, D. L., and Mayo, J. W. (2001). Regulation, vertical integration and antitrust.Journal of Industrial Economics, XLIX(3), 319–333.
Beyer, H. (2000). Entre la autonomıa y la intervencion: La reformas a la educacion en Chile. InF. Larraın and R. Vergara, editors, La Transformacion Economica de Chile, pages 643–709. Centrode Esudios Publicos, Santiago, Chile.
Demsetz, H. (1968). Why regulate utilities? Journal of Law and Economics, 11, 55–66.
Engel, E., Fischer, R., and Galetovic, A. (2001). How to auction an essential facility when under-hand integration is possible. Working paper series 8146, NBER.
Engel, E. M. A., Fischer, R. D., and Galetovic, A. (To be published). Privatizing roads: An “old”new approach to infrastructure provision. Regulation.
Fischer, R. and Serra, P. (2000). Regulation of the electric market in Latin America. Economıa, 1(1),155–198.
Fischer, R. D. and Serra, P. (1996). Analisis economico del sistema de seguros de salud en chile.Revista de Analisis Economico.
Galetovic, A. (1998). Desatando a prometeo: Reformas microeconomicas en Chile 1973-1989. Per-spectivas en polıtica, economıa y gestion, 2(1), 131–156.
Gauri, V. (1998). School Choices in Chile: Two Decades of Educational Reform. University of Pittsburgh.
Gomez-Lobo, A. and Hinojosa, S. (2000). Broad roads in a thin country: Infrastructure concessionsin chile. Technical Report 2279, World Bank.
80

Gonzalez, P. (2002). Estructura institucional, recursos y gestion en el sistema escolar chileno.Proyecto: Alcance y resultados de las reformas educativas en Argentina, Chile y Uruguay.
Hachette, D. (2000). Privatizaciones: Reforma estructural pero inconclusa. In F. Larraın and R. Ver-gara, editors, La Transformacion Economica En Chile. CEP.
Hachette, D. and Luders, R. (1994). La Privatizacion En Chile. Centro Internacional para el Desar-rollo Economico, Santiago.
Hsie, C.-T. and Urquiola, M. (2001). When schools compete: How do they compete. An assesmentof Chile’s nationwide school voucher program. Princeton and Cornell University (mimeo).
La Porta, R. and Lopez-de Silanes, F. (1999). The benefits from privatization: Evidence from Mex-ico. The Quarterly Journal of Economics, pages 1193–1242.
Larraın, F. and Vergara, R. (1995). Macroeconomic Effects of Pivatization: Lessons from Chile and Ar-gentina. World Bank.
Larroulet, C. (1984). Reflexiones en torno al estado empresario en Chile. Estudios Publicos, (14),129–151.
Mamalakis, M. J. (1976). The Growth and Structure of the Chilean Economy: from Independence toAllende. Yale University Press, New Haven and London, first edition.
Meller, P. (1996). Un Siglo de Economıa Polıtica Chilena (1890-1990). Editorial Andres Bello, Santiago.
Mizala, A. and Romaguera, P. (2000). School performance and choice: The Chilean experience.Journal of Human Resources.
Mizala, A. and Romaguera, P. (2001). Factores socioeconomicos explicativos de los resultadosescolares en la educacion secundaria en Chile. El Trimestre Economico, LXVIII(4), 515–549.
Parry, T. (1996). Will pursuit of higher quality sacrifice equal opportunity in education? An anal-ysis of the education voucher system in Santiago. Social Science Quarterly, 77(4), 821–41.
Rodrıguez, J. and Tokman, M. (2000). Resultados y rendimiento del sector publico de salud enchile. Technical Report 106, CEPAL, Serie Financiamiento del Desarrollo.
Rosende, F. and Reinsten, A. (1986). Estado de avance del programa de reprivatizacion en chile.Estudios Publicos, (23), 251–274. Winter.
Saez, R. E. (1996). Las privatizaciones de empresas en Chile. In O. Munoz G., editor, Despues de lasPrivatizaciones: Hacia el Estado Regulador, pages 75–110. Dolmen-CIEPLAN, Santiago.
81

Sanfuentes, A. (1984). Los grupos economicos: Control y polıticas. Coleccion Estudios Cieplan, (15),131–170.
Valenzuela Silva, M. (1989). Reprivatizacion y capitalismo popular en Chile. Estudios Publicos,(33), 175–217.
Vergara, R. (1996). Privatizacion de la banca: La experiencia chilena. Estudios Publicos, (63), 335–345.
Williamson, O. (1976). Franchise bidding for natural monopoly–in general and with respect toCATV. Bell Journal of Economics, 7, 73–104. Spring.
82

Chapter 6
Appendix
83

Tabl
e6.
1:C
hang
esin
profi
tabi
lity
ofpr
ivat
ized
firm
s1
Mea
nbe
fore
Mea
naf
ter
T-st
atfo
rZ
-sta
tfor
Mea
nbe
fore
=0
Mea
naf
ter
=0
Var
iabl
eN
Med
ian
befo
reM
edia
naf
ter
chan
gein
mea
nch
ange
inm
edia
nM
edia
nbe
fore
=0
Med
ian
afte
r=
0
All
firm
sO
per.
inco
me
/sa
les
370.
1182
0.20
513.
6298
*-2
.545
9*
3.62
13*
7.62
1170
33*
0.08
350.
1512
0.00
00*
5.12
23E-
09*
Ope
r.in
com
e/
PPE
370.
0969
0.20
002.
5620
*-2
.978
4*
3.79
06*
4.71
2943
53*
0.06
240.
1269
0.00
00*
5.12
23E-
09*
Net
inco
me
/sa
les
370.
0172
0.13
033.
2708
*-3
.281
1*
0.60
743.
8679
6676
*0.
0192
0.14
590.
1620
5.42
2E-0
7*
Net
inco
me
/PP
E37
0.03
860.
1636
3.36
33*
-3.5
189
*2.
8923
*4.
7555
8994
*0.
0214
0.09
680.
0494
*6.
1656
E-08
*
Non
-Reg
ulat
edO
per.
inco
me
/sa
les
180.
1113
0.17
971.
2527
-0.9
808
1.86
823.
8725
5987
*0.
0763
0.12
940.
0038
*0.
0006
5613
*O
per.
inco
me
/PP
E18
0.12
060.
2139
0.93
45-0
.727
72.
4296
*2.
5125
7924
*0.
0711
0.07
880.
0038
*0.
0006
5613
*N
etin
com
e/
sale
s18
-0.0
331
0.04
610.
9706
-1.0
124
-0.7
044
0.76
8787
420.
0299
0.04
560.
2403
0.01
5441
89*
Net
inco
me
/PP
E18
0.05
100.
1273
0.90
72-0
.537
92.
1953
*2.
0011
6015
0.04
020.
0476
0.04
81*
0.00
3768
92*
Reg
ulat
edO
per.
inco
me
/sa
les
190.
1247
0.22
914.
7276
*-2
.846
5*
4.00
62*
7.96
5722
51*
0.08
720.
1726
0.00
04*
1.90
73E-
06*
Ope
r.in
com
e/
PPE
190.
0744
0.18
685.
8026
*-3
.634
7*
4.44
25*
8.29
4441
41*
0.05
490.
1649
0.00
04*
1.90
73E-
06*
Net
inco
me
/sa
les
190.
0649
0.21
015.
1091
*-3
.372
0*
2.16
87*
9.66
1910
41*
0.01
430.
2030
0.32
381.
9073
E-06
*N
etin
com
e/
PPE
190.
0268
0.19
814.
5417
*-4
.247
8*
1.92
316.
7673
0152
*0.
0019
0.16
070.
3238
1.90
73E-
06*
9 :In
this
and
the
follo
win
gta
bles
,ast
ar(*
)ind
icat
esa
stat
isti
cally
sign
ifica
ntva
lue.
84

Tabl
e6.
2:C
hang
esin
oper
atin
gef
ficie
ncy
ofpr
ivat
ized
firm
s
Mea
nbe
fore
Mea
naf
ter
T-st
atfo
rZ
-sta
tfor
Mea
nbe
fore
=0
Mea
naf
ter
=0
Var
iabl
eN
Med
ian
befo
reM
edia
naf
ter
chan
gein
mea
nch
ange
inm
edia
nM
edia
nbe
fore
=0
Med
ian
afte
r=
0
All
firm
sC
ostp
erun
it37
0.70
490.
6606
-1.8
235
1.25
9522
.856
9*
21.9
694
*0.
7769
0.71
490.
0000
*0.
0000
*Sa
les
/PP
E37
1.16
861.
1157
-0.2
074
-1.1
838
4.30
87*
7.24
98*
0.57
870.
7487
0.00
00*
0.00
00*
Sale
s/
Empl
oyee
s30
6928
4.48
7010
2795
.009
73.
9218
*-2
.129
0*
5.47
55*
6.53
59*
4201
3.60
9582
924.
2615
0.00
00*
0.00
00*
Ope
r.In
com
e/E
mpl
oyee
s30
1470
5.02
7525
088.
0736
2.80
42*
-2.7
795
*2.
9264
*4.
2550
*40
87.5
993
1378
8.98
670.
0000
*0.
0000
*
Non
-reg
ulat
edC
ostp
erun
it18
0.69
790.
6747
-0.4
239
0.37
9717
.406
1*
14.3
750
*0.
7234
0.69
780.
0000
*0.
0000
*Sa
les/
PPE
181.
7011
1.09
06-1
.035
9-5
.726
6*
3.24
01*
4.29
07*
0.60
830.
6532
0.00
00*
0.00
00*
Sale
s/Em
ploy
ees
1210
7647
.937
113
4806
.903
61.
3016
-0.4
041
4.01
10*
3.78
55*
8516
4.21
3610
7110
.777
80.
0002
*0.
0032
*O
per.
Inco
me/
Empl
oyee
s12
2948
3.46
5139
012.
3794
0.85
72-6
.235
4*
2.58
80*
2.84
87*
6807
.302
822
053.
4960
0.00
02*
0.01
93*
Reg
ulat
edC
ostp
erun
it19
0.71
160.
6473
-2.7
041
*1.
4159
14.9
651
*16
.547
0*
0.80
830.
7257
0.00
00*
0.00
00*
Sale
s/
PPE
190.
6641
1.13
941.
6805
-1.8
539
6.38
89*
6.14
65*
0.55
890.
8323
0.00
00*
0.00
00*
Sale
s/Em
ploy
ees
1843
708.
8536
8145
3.74
714.
0624
*-2
.910
8*
6.28
84*
8.62
17*
3494
0.32
4282
345.
8544
0.00
00*
0.00
00*
Ope
r.in
com
e/Em
ploy
ees
1848
52.7
357
1580
5.20
315.
8470
*-3
.891
5*
3.92
50*
6.88
93*
3448
.321
513
788.
9867
0.00
07*
0.00
00*
85
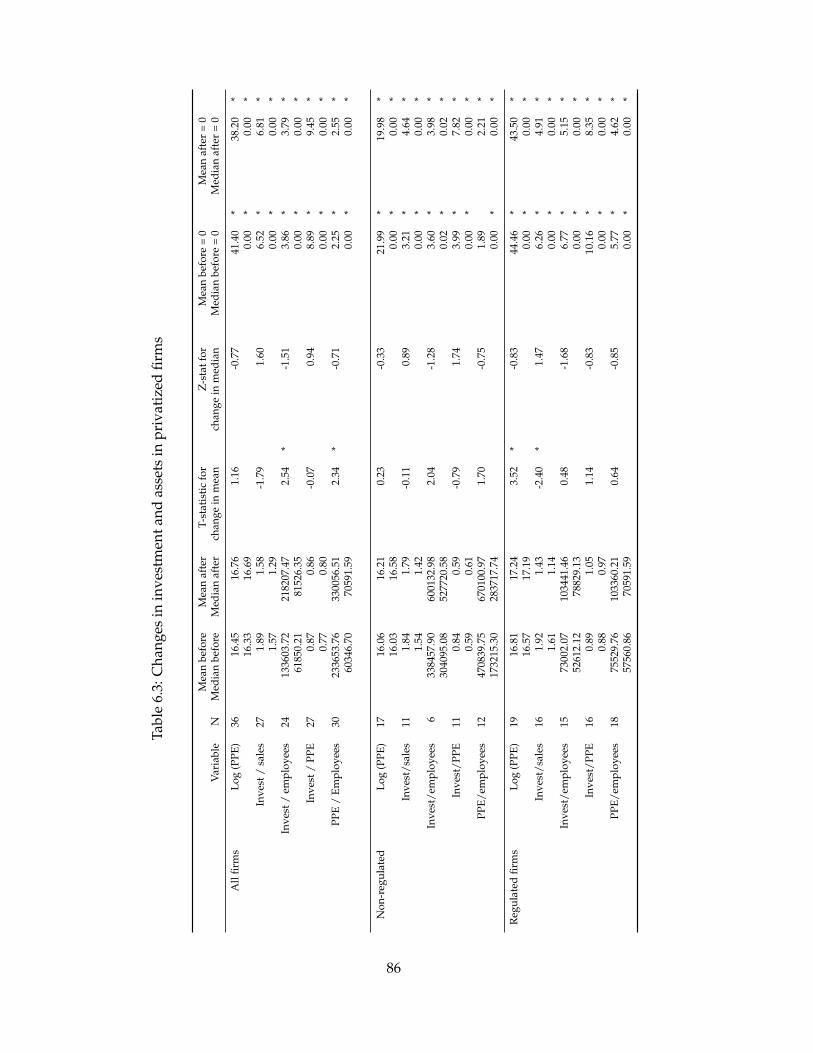
Tabl
e6.
3:C
hang
esin
inve
stm
enta
ndas
sets
inpr
ivat
ized
firm
s
Mea
nbe
fore
Mea
naf
ter
T-st
atis
tic
for
Z-s
tatf
orM
ean
befo
re=
0M
ean
afte
r=
0V
aria
ble
NM
edia
nbe
fore
Med
ian
afte
rch
ange
inm
ean
chan
gein
med
ian
Med
ian
befo
re=
0M
edia
naf
ter
=0
All
firm
sLo
g(P
PE)
3616
.45
16.7
61.
16-0
.77
41.4
0*
38.2
0*
16.3
316
.69
0.00
*0.
00*
Inve
st/
sale
s27
1.89
1.58
-1.7
91.
606.
52*
6.81
*1.
571.
290.
00*
0.00
*In
vest
/em
ploy
ees
2413
3603
.72
2182
07.4
72.
54*
-1.5
13.
86*
3.79
*61
850.
2181
526.
350.
00*
0.00
*In
vest
/PP
E27
0.87
0.86
-0.0
70.
948.
89*
9.45
*0.
770.
800.
00*
0.00
*PP
E/
Empl
oyee
s30
2336
53.7
633
0056
.51
2.34
*-0
.71
2.25
*2.
55*
6034
6.70
7059
1.59
0.00
*0.
00*
Non
-reg
ulat
edLo
g(P
PE)
1716
.06
16.2
10.
23-0
.33
21.9
9*
19.9
8*
16.0
316
.58
0.00
*0.
00*
Inve
st/s
ales
111.
841.
79-0
.11
0.89
3.21
*4.
64*
1.54
1.42
0.00
*0.
00*
Inve
st/e
mpl
oyee
s6
3384
57.9
060
0132
.98
2.04
-1.2
83.
60*
3.98
*30
4095
.08
5277
20.5
80.
02*
0.02
*In
vest
/PPE
110.
840.
59-0
.79
1.74
3.99
*7.
82*
0.59
0.61
0.00
*0.
00*
PPE/
empl
oyee
s12
4708
39.7
567
0100
.97
1.70
-0.7
51.
892.
21*
1732
15.3
028
3717
.74
0.00
*0.
00*
Reg
ulat
edfir
ms
Log
(PPE
)19
16.8
117
.24
3.52
*-0
.83
44.4
6*
43.5
0*
16.5
717
.19
0.00
*0.
00*
Inve
st/s
ales
161.
921.
43-2
.40
*1.
476.
26*
4.91
*1.
611.
140.
00*
0.00
*In
vest
/em
ploy
ees
1573
002.
0710
3441
.46
0.48
-1.6
86.
77*
5.15
*52
612.
1278
829.
130.
00*
0.00
*In
vest
/PPE
160.
891.
051.
14-0
.83
10.1
6*
8.35
*0.
880.
970.
00*
0.00
*PP
E/em
ploy
ees
1875
529.
7610
3360
.21
0.64
-0.8
55.
77*
4.62
*57
560.
8670
591.
590.
00*
0.00
*
86

Tabl
e6.
4:C
hang
esin
profi
tabi
lity
ofpr
ivat
ized
firm
s(a
dj.)
Mea
nbe
fore
Mea
naf
ter
T-st
atfo
rZ
-sta
tfor
Mea
nbe
fore
=0
Mea
naf
ter
=0
Var
iabl
eN
Med
ian
befo
reM
edia
naf
ter
chan
gein
mea
nch
ange
inm
edia
nM
edia
nbe
fore
=0
Med
ian
afte
r=
0
All
firm
sO
per.
inco
me/
sale
s36
-0.0
5703
177
-0.0
1289
242.
0203
0182
-1.1
3749
125
-2.0
9258
494
*-0
.588
5705
5-0
.057
6126
6-0
.031
3828
70.
0005
9662
*0.
1214
9248
Ope
r.in
com
e/PP
E36
0.02
2327
220.
1093
312
2.11
9894
56*
-1.9
9342
527
*1.
1384
6309
2.62
9782
03*
-0.0
0307
806
0.02
9605
450.
2025
1612
0.06
6249
08N
etin
com
e/sa
les
36-0
.062
1827
7-0
.035
5083
10.
8480
9775
-0.3
9418
014
-2.6
4896
279
*-1
.358
6581
4-0
.040
5541
6-0
.032
8887
50.
0326
2267
*0.
0326
2267
*N
etin
com
e/PP
E36
0.01
4941
550.
0964
6355
2.28
5812
07*
-1.6
5555
658
1.06
8283
353.
0114
5229
*-0
.011
098
0.01
4168
230.
3088
5966
0.12
1492
48
Non
-reg
ulat
edO
per.
inco
me/
sale
s18
-0.0
1700
443
0.03
0116
431.
0079
0419
-0.4
1130
18-0
.347
0785
70.
8091
0461
-0.0
0721
252
0.00
0520
80.
1189
4226
0.59
2735
29O
per.
inco
me/
PPE
180.
0408
5776
0.14
1045
71.
0144
9257
-1.0
1243
521.
1243
7947
1.77
2135
05-0
.003
0780
60.
0094
3712
0.40
7264
710.
2403
4119
Net
inco
me
/sa
les
18-0
.087
9832
1-0
.048
7300
20.
5670
5274
-0.1
8983
16-2
.049
4421
2-1
.015
0264
8-0
.015
0457
8-0
.024
2862
10.
2403
4119
0.11
8942
26N
etin
com
e/
PPE
180.
0211
6692
0.08
0470
980.
7612
7044
-0.2
2147
020.
8746
3926
1.41
8196
080.
0150
8835
-2.3
359E
-05
0.40
7264
710.
5927
3529
Reg
ulat
edO
per.
inco
me/
sale
s18
-0.0
9705
911
-0.0
5590
124
1.82
3570
58-1
.455
3755
94.
4782
0215
*2.
8959
9416
*-0
.108
5223
7-0
.071
4001
20.
0006
5613
*0.
0481
2622
*O
per.
inco
me/
PPE
180.
0037
9669
0.07
7616
73.
4631
732
*-1
.929
9545
90.
2543
1563
3.01
2150
02*
-0.0
0316
603
0.07
5601
60.
2403
4119
0.11
8942
26N
etin
com
e/
sale
s18
-0.0
3638
234
-0.0
2228
659
0.47
0545
54-0
.284
7474
1.95
1165
81.
0098
1806
-0.0
4427
092
-0.0
3686
474
0.04
8126
22*
0.11
8942
26N
etin
com
e/
PPE
180.
0087
1619
0.11
2456
122.
9345
1037
*-1
.993
2317
9*
0.59
4068
033.
6010
1665
*-0
.014
0226
50.
0783
1472
0.11
8942
260.
0481
2622
*
87

Tabl
e6.
5:C
hang
esin
oper
atin
gef
ficie
ncy
ofpr
ivat
ized
firm
s(a
dj)
Mea
nbe
fore
Mea
naf
ter
T-st
atfo
rZ
-sta
tfor
Mea
nbe
fore
=0
Mea
naf
ter
=0
Var
iabl
eN
Med
ian
befo
reM
edia
naf
ter
chan
gein
mea
nch
ange
inm
edia
nM
edia
nbe
fore
=0
Med
ian
afte
r=
0
All
firm
sC
ostp
erun
it36
-0.0
017
0.00
550.
2858
-0.1
126
-0.0
679
0.23
430.
0275
0.03
220.
4340
0.12
15Sa
les/
PPE
360.
6096
0.61
210.
0093
-1.0
812
2.35
61*
4.00
88*
0.19
220.
2864
0.30
890.
0662
Non
-reg
ulat
edC
ostp
erun
it18
-0.0
652
-0.0
419
0.43
96-0
.632
8-1
.732
8-1
.023
9-0
.044
1-0
.009
30.
1189
0.24
03Sa
les/
PPE
180.
8943
0.49
95-0
.609
6-0
.379
71.
7690
2.00
71-0
.060
00.
1074
0.40
730.
4073
Reg
ulat
edC
ostp
erun
it18
0.06
170.
0529
-0.3
107
0.82
262.
2441
*2.
8640
*0.
1164
0.05
480.
0481
*0.
0038
*Sa
les
/PP
E18
0.32
480.
7248
1.74
61-1
.423
73.
1721
*4.
0149
*0.
2820
0.47
870.
1189
0.04
81*
88

Tabl
e6.
6:C
hang
esin
inve
stm
enta
ndas
sets
inpr
ivat
ized
firm
s(a
dj)
Mea
nbe
fore
Mea
naf
ter
T-st
atfo
rZ
-sta
tfor
Mea
nbe
fore
=0
Mea
naf
ter
=0
Var
iabl
eN
Med
ian
befo
reM
edia
naf
ter
chan
gein
mea
nch
ange
inm
edia
nM
edia
nbe
fore
=0
Med
ian
afte
r=
0
All
firm
sLo
g(P
PE)
350.
7909
0.78
46-0
.474
40.
3230
39.4
821
*39
.084
5*
0.78
450.
7779
0.00
00*
0.00
00*
Inve
st/
sale
s27
-0.2
398
-0.1
365
0.57
300.
2854
-0.8
588
-0.6
548
-0.6
187
-0.3
016
0.22
100.
1239
Inve
st/
PPE
270.
1694
0.20
730.
3590
0.94
281.
8460
2.16
63*
0.14
400.
0430
0.06
100.
2210
Non
-reg
ulat
edLo
g(P
PE)
170.
7785
0.76
28-0
.464
40.
4650
23.5
227
*22
.618
8*
0.78
450.
7779
0.00
00*
0.00
00*
Inve
st/
sale
s11
0.06
150.
2138
0.31
880.
9521
0.11
590.
6322
0.03
040.
3522
0.50
000.
5000
Inve
st/
PPE
110.
1390
-0.0
889
-0.7
953
2.06
84*
0.73
72-1
.157
50.
1340
-0.1
016
0.50
000.
2744
Reg
ulat
edLo
g(P
PE)
180.
8026
0.80
520.
3869
-0.1
898
33.6
094
*35
.831
7*
0.78
660.
7699
0.00
00*
0.00
00*
Inve
st/
sale
s16
-0.4
470
-0.3
773
0.35
57-0
.490
01.
4753
1.47
81-0
.839
1-0
.592
50.
1051
0.03
84*
Inve
st/
PPE
160.
1903
0.41
101.
5583
-0.9
045
2.09
353.
1251
*0.
2159
0.28
700.
0384
*0.
0384
*
89

Tabl
e6.
7:Em
ploy
men
tin
priv
atiz
edfir
ms
Mea
nbe
fore
Mea
naf
ter
T-st
atis
tic
for
Z-s
tatf
orM
ean
befo
re=
0M
ean
afte
r=
0N
Med
ian
befo
reM
edia
naf
ter
chan
gein
mea
nch
ange
inm
edia
nM
edia
nbe
fore
=0
Med
ian
afte
r=
0
All
firm
s32
1193
1381
1.33
74-0
.188
03.
8391
*3.
4071
*38
036
00.
0000
*0.
0000
*N
on-r
egul
ated
1515
5717
640.
6502
-0.1
867
3.19
65*
2.76
35*
754
874
0.00
00*
0.00
00*
Reg
ulat
ed17
871
1044
1.20
49-0
.327
22.
2127
*2.
0096
179
236
0.00
01*
0.00
01*
90

Tabl
e6.
8:Ph
ysic
alpr
oduc
tivi
tyBe
fore
Aft
erPe
rcen
tvar
iati
on
NR
CA
P0.
0718
0.06
29-0
.123
3To
nela
das
deac
ero
term
inad
as[M
TM/w
orke
r]N
RC
olbu
n17
.073
3N
REl
ectr
oand
ina
12.4
271
NR
Ende
sa2.
6206
3.66
770.
3995
Ener
g’ia
gene
rada
[GW
h/tr
abaj
ador
es]
NR
Fepa
sa0.
4554
0.41
23-0
.094
7[M
illon
esde
tone
lada
skm
/tra
baja
dore
s]N
RFe
rron
or0.
2891
0.50
840.
7584
[Mill
ones
deto
nela
das
km/t
raba
jado
res]
NR
Gen
er5.
7859
4.73
88-0
.181
0En
erg’
iage
nera
da[G
Wh/
trab
ajad
ores
]N
RLa
bora
tori
osC
hile
1394
.542
1N
RLA
NC
hile
1.70
891.
0008
-0.4
144
[Pas
ajer
ospo
rki
l’om
etro
/tra
baja
dore
s]N
RPi
lmai
quen
7.19
058.
6277
0.19
99En
erg’
iage
nera
da[G
Wh/
trab
ajad
ores
]N
RTe
lex
39.0
387
NR
Mea
n0.
0778
Med
ian
-0.0
947
SD0.
4002
N7
RC
hile
ctra
1.34
121.
7036
0.27
02En
erg’
iaco
mpr
ada
[GW
h/tr
abaj
ador
es]
RC
hilq
uint
a0.
8038
1.61
521.
0093
Ener
g’ia
com
prad
a[G
Wh/
trab
ajad
ores
]R
CTC
69.3
534
151.
1731
1.17
97N
’um
ero
delin
eas
oper
ativ
as[u
nida
des/
trab
ajad
ores
]R
Edel
ayse
n0.
3208
REd
elm
ag0.
6296
0.86
110.
3676
Ener
g’ia
com
prad
a[G
Wh/
trab
ajad
ores
]R
Elec
da0.
9252
1.44
790.
5649
Ener
g’ia
com
prad
a[G
Wh/
trab
ajad
ores
]R
Eliq
sa1.
6372
2.02
880.
2391
Ener
g’ia
com
prad
a[G
Wh/
trab
ajad
ores
]R
Emec
1.79
571.
4135
-0.2
128
Ener
g’ia
com
prad
a[G
Wh/
trab
ajad
ores
]R
Emel
1.29
920.
8345
-0.3
577
Ener
g’ia
com
prad
a[G
Wh/
trab
ajad
ores
]R
Emel
ari
1.06
571.
6876
0.58
36En
erg’
iaco
mpr
ada
[GW
h/tr
abaj
ador
es]
REm
elat
1.51
761.
5749
0.03
77En
erg’
iaco
mpr
ada
[GW
h/tr
abaj
ador
es]
REm
os0.
1911
RIA
NSA
278.
0696
266.
4219
-0.0
419
Prod
.azu
car
por
trab
ajad
or[t
onel
adas
m’e
tric
as/t
raba
jado
res]
RSa
esa
0.60
550.
9196
0.51
88En
ergı
age
nera
da[G
Wh/
trab
ajad
ores
]R
Tele
foni
cade
lSur
39.0
387
RM
ean
0.34
66M
edia
n0.
3189
SD0.
4612
N12
All
firm
sM
ean
0.24
75M
edia
n0.
2391
SD0.
4485
N19
91

Figure 6.1: Cost per unit before and after privatization, adjusted and unadjusted
0,60
0,62
0,64
0,66
0,68
0,70
0,72
0,74
[t-5; t-3] [t-3; t-1] [t+1; t+3] [t+3; t+5]
All firms Non regulated firms Regulated firms
(a) Cost per unit (mean)
0,64
0,66
0,68
0,70
0,72
0,74
0,76
0,78
0,80
0,82
[t-5; t-3] [t-3; t-1] [t+1; t+3] [t+3; t+5]
All firms Non regulated firms Regulated firms
(b) Cost per unit (median)
-0,08
-0,06
-0,04
-0,02
0,00
0,02
0,04
0,06
0,08
[t-5; t-3] [t-3; t-1] [t+1; t+3] [t+3; t+5]
All firms Non regulated firms Regulated firms
(c) Cost per unit adjusted (mean)
-0,08
-0,06
-0,04
-0,02
0,00
0,02
0,04
0,06
0,08
[t-5; t-3] [t-3; t-1] [t+1; t+3] [t+3; t+5]
All firms Non regulated firms Regulated firms
(d) Cost per unit adjusted (median)
92

Figure 6.2: Investment as a fraction of physical assets (PPE) before and after privatization, adjustedand unadjusted
0,00
0,20
0,40
0,60
0,80
1,00
1,20
[t-5; t-3] [t-3; t-1] [t+1; t+3] [t+3; t+5]
All firms Non regulated firms Regulated firms
(a) Investment over PPE (mean)
0,00
0,20
0,40
0,60
0,80
1,00
1,20
[t-5; t-3] [t-3; t-1] [t+1; t+3] [t+3; t+5]
All firms Non regulated firms Regulated firms
(b) Investment over PPE (median)
-0,20
-0,10
0,00
0,10
0,20
0,30
0,40
0,50
[t-5; t-3] [t-3; t-1] [t+1; t+3] [t+3; t+5]
All firms Non regulated firms Regulated firms
(c) Investment over PPE adjusted (mean)
-0,20
-0,10
0,00
0,10
0,20
0,30
0,40
0,50
[t-5; t-3] [t-3; t-1] [t+1; t+3] [t+3; t+5]
All firms Non regulated firms Regulated firms
(d) Investment over PPE adjusted (median)
93

Figure 6.3: Investment as a fraction of sales before and after privatization, adjusted and unadjusted
0,00
0,50
1,00
1,50
2,00
2,50
[t-5; t-3] [t-3; t-1] [t+1; t+3] [t+3; t+5]
All firms Non regulated firms Regulated firms
(a) Investment over Sales (mean)
0,00
0,50
1,00
1,50
2,00
2,50
[t-5; t-3] [t-3; t-1] [t+1; t+3] [t+3; t+5]
All firms Non regulated firms Regulated firms
(b) Investment over Sales (median)
-0,60
-0,40
-0,20
0,00
0,20
0,40
0,60
[t-5; t-3] [t-3; t-1] [t+1; t+3] [t+3; t+5]
All firms Non regulated firms Regulated firms
(c) Investment over Sales adjusted (mean)
-1,00
-0,80
-0,60
-0,40
-0,20
0,00
0,20
0,40
0,60
[t-5; t-3] [t-3; t-1] [t+1; t+3] [t+3; t+5]
All firms Non regulated firms Regulated firms
(d) Investment over Sales adjusted (median)
94

Figure 6.4: Net income as a fraction of physical assets before and after privatization, adjusted andunadjusted
0,00
0,05
0,10
0,15
0,20
0,25
[t-5; t-3] [t-3; t-1] [t+1; t+3] [t+3; t+5]
All firms Non regulated firms Regulated firms
(a) Net income over PPE (mean)
0,00
0,05
0,10
0,15
0,20
0,25
[t-5; t-3] [t-3; t-1] [t+1; t+3] [t+3; t+5]
All firms Non regulated firms Regulated firms
(b) Net income over PPE (median)
-0,02
0,00
0,02
0,04
0,06
0,08
0,10
0,12
[t-5; t-3] [t-3; t-1] [t+1; t+3] [t+3; t+5]
All firms Non regulated firms Regulated firms
(c) Net income over PPE adjusted (mean)
-0,04
-0,02
0,00
0,02
0,04
0,06
0,08
0,10
0,12
0,14
[t-5; t-3] [t-3; t-1] [t+1; t+3] [t+3; t+5]
All firms Non regulated firms Regulated firms
(d) Net income over PPE adjusted (median)
95

Figure 6.5: Operating income as a fraction of physical assets before and after privatization, ad-justed and unadjusted
0,00
0,05
0,10
0,15
0,20
0,25
[t-5; t-3] [t-3; t-1] [t+1; t+3] [t+3; t+5]
All firms Non regulated firms Regulated firms
(a) Operating income over PPE (mean)
0,00
0,02
0,04
0,06
0,08
0,10
0,12
0,14
0,16
0,18
0,20
[t-5; t-3] [t-3; t-1] [t+1; t+3] [t+3; t+5]
All firms Non regulated firms Regulated firms
(b) Operating income over PPE (median)
0,00
0,02
0,04
0,06
0,08
0,10
0,12
0,14
0,16
0,18
0,20
[t-5; t-3] [t-3; t-1] [t+1; t+3] [t+3; t+5]
All firms Non regulated firms Regulated firms
(c) Operating income over PPE adjusted (mean)
-0,02
0,00
0,02
0,04
0,06
0,08
0,10
0,12
[t-5; t-3] [t-3; t-1] [t+1; t+3] [t+3; t+5]
All firms Non regulated firms Regulated firms
(d) Operating income over PPE adjusted (median)
96

Figure 6.6: Operating income as a fraction of sales before and after privatization, adjusted andunadjusted
0,00
0,05
0,10
0,15
0,20
0,25
[t-5; t-3] [t-3; t-1] [t+1; t+3] [t+3; t+5]
All firms Non regulated firms Regulated firms
(a) Operating income over sales (mean)
0,00
0,05
0,10
0,15
0,20
0,25
[t-5; t-3] [t-3; t-1] [t+1; t+3] [t+3; t+5]
All firms Non regulated firms Regulated firms
(b) Operating income over sales (median)
-0,14
-0,12
-0,10
-0,08
-0,06
-0,04
-0,02
0,00
0,02
0,04
[t-5; t-3] [t-3; t-1] [t+1; t+3] [t+3; t+5]
All firms Non regulated firms Regulated firms
(c) Operating income over sales adjusted (mean)
-0,12
-0,10
-0,08
-0,06
-0,04
-0,02
0,00
0,02
[t-5; t-3] [t-3; t-1] [t+1; t+3] [t+3; t+5]
All firms Non regulated firms Regulated firms
(d) Operating income over sales adjusted (median)
97