The effects of openness to experience on pair programming in a higher education context
10
The Effects of Openness to Experience on Pair Programming in a Higher Education Context Norsaremah Salleh Department of Computer Science International Islamic University Malaysia [email protected] Emilia Mendes Department of Computer Science University of Auckland New Zealand/ CAPES/UFRJ-Brazil [email protected] John Grundy Computer Science & Software Engineering Swinburne University of Technology, Australia [email protected] Abstract This paper describes a formal experiment carried out to investigate the effect of the personality factor Openness to experience on the academic performance of students who practiced pair programming (PP) in higher education. The experiment was carried out at the University of Auckland, using as subjects undergraduate students attending an introductory software programming course. Our results showed that differences in Openness level could significantly affect academic performance of students who pair programmed. In addition, our results also showed that most students gained higher satisfaction from the PP experience and their confidence level in solving programming exercises was also high. 1. Introduction Reviews of research evidence report some educational benefits that Pair Programming (PP) has to offer. For instance, that PP improves students’ learning [28]; increases satisfaction, enjoyment, and confidence in solving tasks ([16],[19]); and increases retention of students in computer science courses [19]. However, despite these benefits PP, which involves two people working together in solving programming or design tasks, was reported to be problematic most often when pairs are incompatible [16]. Such incompatibility issues might be related to psychosocial aspects such as personality, ethnicity or gender differences [27]. The present study is an extension of our previous work ([25],[26]) where we have investigated the effects of personality from the perspective of the Five-Factor personality model (FFM), with first year undergraduate students practicing PP in an introductory programming course. The main motivation behind that work was to look at the effect of FFM on PP, given that it had not yet been previously investigated at length particularly in teaching or academic settings. The study reported here investigated the possible effects of personality trait “Openness to experience” on the PP’s effectiveness (measured by academic success of students practicing PP). Openness to experience is one of the broad personality traits of the FFM that describes intellectual, cultural, or creative interest [7]. Personality research on team settings showed that there is a relationship between team composition based on personality and the team’s processes and outcomes ([4],[22],[3]). Thus, our study investigates whether such relationship exists within the context of PP teams. The objective of our research was to improve the effectiveness of PP as a pedagogical tool for CS/SE education by investigating the effects that Openness to experience of paired students may have on PP’s effectiveness. The main contribution of this paper is to add empirical evidence regarding the effects of the Openness personality trait towards paired students’ academic performance. This will increase our understanding on the potential effects
-
Upload
independent -
Category
Documents
-
view
4 -
download
0
Transcript of The effects of openness to experience on pair programming in a higher education context

The Effects of Openness to Experience on Pair Programming in aHigher Education Context
Norsaremah SallehDepartment of Computer
ScienceInternational IslamicUniversity Malaysia
Emilia MendesDepartment of Computer
ScienceUniversity of Auckland
New Zealand/CAPES/UFRJ-Brazil
John GrundyComputer Science &Software EngineeringSwinburne University
of Technology,Australia
Abstract
This paper describes a formal experiment carried out to investigate the effect of thepersonality factor Openness to experience on the academic performance of students whopracticed pair programming (PP) in higher education. The experiment was carried out at theUniversity of Auckland, using as subjects undergraduate students attending an introductorysoftware programming course. Our results showed that differences in Openness level couldsignificantly affect academic performance of students who pair programmed. In addition, ourresults also showed that most students gained higher satisfaction from the PP experience andtheir confidence level in solving programming exercises was also high.
1. Introduction
Reviews of research evidence report some educational benefits that Pair Programming (PP)has to offer. For instance, that PP improves students’ learning [28]; increases satisfaction,enjoyment, and confidence in solving tasks ([16],[19]); and increases retention of students incomputer science courses [19]. However, despite these benefits PP, which involves twopeople working together in solving programming or design tasks, was reported to beproblematic most often when pairs are incompatible [16]. Such incompatibility issues mightbe related to psychosocial aspects such as personality, ethnicity or gender differences [27].
The present study is an extension of our previous work ([25],[26]) where we haveinvestigated the effects of personality from the perspective of the Five-Factor personalitymodel (FFM), with first year undergraduate students practicing PP in an introductoryprogramming course. The main motivation behind that work was to look at the effect of FFMon PP, given that it had not yet been previously investigated at length particularly in teachingor academic settings. The study reported here investigated the possible effects of personalitytrait “Openness to experience” on the PP’s effectiveness (measured by academic success ofstudents practicing PP). Openness to experience is one of the broad personality traits of theFFM that describes intellectual, cultural, or creative interest [7]. Personality research on teamsettings showed that there is a relationship between team composition based on personalityand the team’s processes and outcomes ([4],[22],[3]). Thus, our study investigates whethersuch relationship exists within the context of PP teams.
The objective of our research was to improve the effectiveness of PP as a pedagogical toolfor CS/SE education by investigating the effects that Openness to experience of pairedstudents may have on PP’s effectiveness. The main contribution of this paper is to addempirical evidence regarding the effects of the Openness personality trait towards pairedstudents’ academic performance. This will increase our understanding on the potential effects

of personality towards PP’s effectiveness as a pedagogical tool. We also believe that thisstudy would be a useful addition to guide future research in PP team composition.
2. Motivation and related work
Based on our systematic literature review of PP in higher education, we found thatpersonality was one of the most common factors investigated in previous PP studies [24].Nonetheless, the results from these studies were inconsistent in terms of the effect orinfluence of personality towards PP’s effectiveness [24]. The list of studies investigatingpersonality in PP in higher education context is provided in [24]. The motivation of ourresearch was also driven by the fact that many existing PP studies employed the Myers-Briggs Type Indicator (MBTI) as a personality measurement [24]. Although MBTI wasfound to be very popular and widely used by researchers in the computing and businessdomain, there has been a rapid emerging consensus by personality psychologists on thevalue of the FFM or “big-five” as a parsimonious and comprehensive framework ofpersonality traits [6]. Such a growing acceptance of the FFM has motivated us toemploy this framework in our research. The FFM consists of five personalitydimensions known as Extraversion, Agreeableness, Conscientiousness, Neuroticism,and Openness to experience [7].
Of the five broad traits proposed in the FFM, the three major traits reported to be importanteducationally and relevant for higher education are: Conscientiousness, Neuroticism andOpenness to experience [8]. Conscientiousness relates to one’s achievement orientation wherehighly conscientious individuals are described as being diligent, hardworking, and organized.The level of Neuroticism determines one’s ability to remain calm and composed. People whoare emotionally stable (i.e. low Neuroticism) are better able to cope with stress and anxiety[7]. Conscientiousness was studied in our previous study because it is considered to be themost influential trait that can potentially affect academic success as well as team performanceas reported in the psychology literature ([8],[22],[3]). In our previous studies, personalitytraits Conscientiousness and Neuroticism were reported not to significantly affect pairedstudents’ academic performance ([25],[26]); however results indicate that there is asignificant positive correlation between performance and Openness to experience trait whenteams comprise pairs [25].
In this study, we focused our investigation on the Openness to experience trait. Opennessto experience (also known as Intellect) is the fifth factor of the FFM that relates to anindividual’s intellectual curiosity, need for variety, and aesthetic sensitivity according to theperson’s cognitive, affective and behavioral tendencies [7]. Someone who is high inOpenness to experience is described as being imaginative, intellectual, receptive to new ideas,and also broad-minded. Those at the opposite end of this spectrum usually show a lack ofaesthetic sensibilities, preference for routines, and favouring conservative values ([17],[7]).
Literature in personality psychology reports that Openness to experience facilitates the useof learning strategies, and that students with a relatively high level of Openness are describedas being foresighted, intelligent, and resourceful [8]. Within the context of teamwork,research showed that team’s performance could be impacted by the team personalitycomposition ([4],[3],[2]). These studies however, were conducted in the context of teamsconsisting of three to five members. For example, Acuna et al. [2] investigated therelationship between personality, team processes, and team’s effectiveness (measured bysoftware quality and team’s satisfaction) in students’ team practicing Agile and their findingsshowed a positive correlation between personality and software quality. Therefore, in thecontext of students practicing PP, personality factor such as Openness to experience may playa role in differentiating students’ performance. Different pairing of students practicing PP
according to their Openness trait may result in improved academic performance, poorerperformance or have no impact on performance. It may also impact their satisfaction and/orconfidence level with practicing PP and/or the programming tasks performed.
3. Research methodology
This Section details the formal experiment conducted during the first semester of 2010 atthe University of Auckland. The experiment was conducted in the tutorial labs of anintroductory undergraduate course – Principles of Programming (COMPSCI 101), whereparticipants were first year undergraduate students. The teaching component of this courseconsisted of ten weeks of lectures and nine weeks of compulsory tutorials. The main aim ofthis course was to provide students with the basic concepts of object-oriented programmingdevelopment in Java. Lectures were given three times a week, each lasting for an hour; inaddition, there was a two-hour tutorial session once per week, run by a tutor and a fewteaching assistants. During the tutorials, students worked with their allocated partners; dataabout the students’ pairing experience was gathered from every tutorial session. Studentswilling to participate in the experiment were required to sign a consent form to fulfill theethical requirements of the University of Auckland’s Human Participant Ethics Committee.
3.1. Hypothesis
Personality research on team settings reports that teams composed of highly open toexperience members are able to develop more diverse methods or alternatives in problem-solving tasks [17]. In addition, Openness to experience has been shown to be a strongpredictor of team performance because the team members who scored high on this trait aremore adaptable and capable of handling changes that occur in a dynamic environment [4]. Inan academic setting, Openness to experience has been positively correlated withundergraduate academic success, in particular to students’ final grades [10]. The findingsfrom our previous studies also showed a significant positive correlation between Openness toexperience and students’ academic achievement in the midterm test and in the final exam([23],[25]). Given this line of reasoning, we conjecture that paired students’ academicperformance may be influenced by their level of Openness to experience. Hence, thefollowing hypothesis was proposed:
H_O: Differences in the level of Openness to experience do not affect the effectivenessof students who pair programmed
which is contrasted by the following alternative hypothesis:
H_A: Differences in the level of Openness to experience affect the effectiveness ofstudents who pair programmed
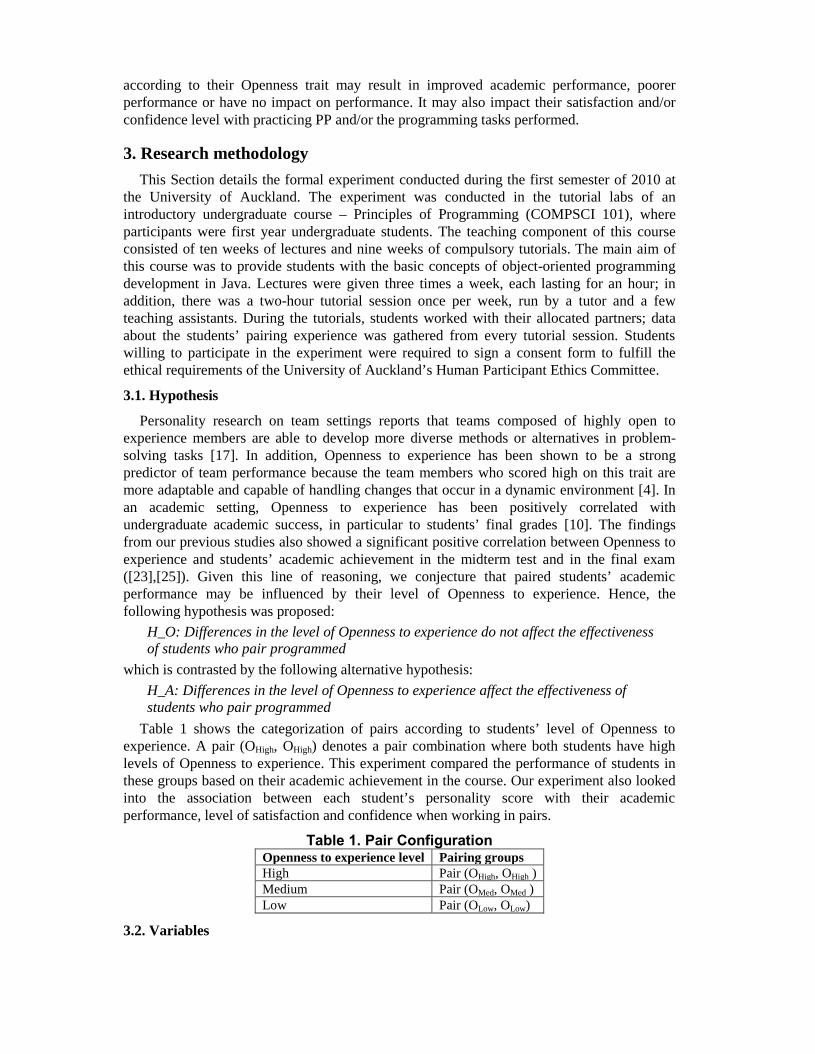
Table 1 shows the categorization of pairs according to students’ level of Openness toexperience. A pair (OHigh, OHigh) denotes a pair combination where both students have highlevels of Openness to experience. This experiment compared the performance of students inthese groups based on their academic achievement in the course. Our experiment also lookedinto the association between each student’s personality score with their academicperformance, level of satisfaction and confidence when working in pairs.
Table 1. Pair ConfigurationOpenness to experience level Pairing groupsHigh Pair (OHigh, OHigh )Medium Pair (OMed, OMed )Low Pair (OLow, OLow)
3.2. Variables

In this experiment, PP’s effectiveness was measured using students’ academic performancein assignments (14%), a midterm test (15%), and final exam (60%). Hence, PP’seffectiveness, satisfaction, and confidence were our dependent variables and level ofOpenness to experience (low, medium, and high) our independent variable. Level ofsatisfaction and confidence were measured using a questionnaire where all questionsemployed a five-point Likert-scale. We used the same set of instruments as in our previousexperiment [25].
3.3. Instrumentations and Materials
At the start of the academic semester, one of the authors provided the participants with anoverview of the experiment (including PP) in one of the course lectures. During that lecture,consent forms and participant information sheets (PIS) were distributed to the students forsigning. The PIS described important information regarding the experiment and highlightedits major purpose. Participants’ personality traits were measured using a short version of theIPIP-NEO (http://www.personal.psu.edu/j5j/IPIP/). The short version of the IPIP-NEO hasbeen reported to measure exactly the same traits and to also present acceptable measurementreliability [15]. It consists of 120 items which descriptions were authored by Johnson [15].The test produces personality scores in a numerical scale, with 0 being the lowest score, and99 the highest score for each personality factor, respectively. The grouping of participants perOpenness to experience was done based on the distribution of scores for the Openness toexperience trait (i.e. low – lowest 15%; medium – middle 20%, high – highest 65%). Thiswas done in order to provide a more balanced number of subjects within each group.
In addition to the personality test, participants were administered with a pre-testquestionnaire to gather their demographic information as well as their programmingcompetency level. Short questionnaires were given to the students during each of the PPsessions in order to measure their satisfaction and confidence level working with theirpartner. The statistical package to generate the results of our analysis was SPSS v. 17.
3.4. Experimental Procedure
We followed the same procedure carried out in our previous experiments ([25],[26]),where each of the tutorial sessions was treated as an independent formal experiment.Students’ personality and demographic data were gathered during the first week of thesemester. An online version of the IPIP-NEO inventory was used to measure students’personality against the FFM. The results of the personality profiling were then used toallocate partners. For this purpose, the scores on the Openness to experience trait were used toassign paired students in three possible groups: low, medium, and high.
In every tutorial, pairs were allocated randomly within each group (i.e. low, medium orhigh). A “single factor between-group design” was the research design we employed,allowing each subject to experience only one condition or group [20]. In a particular tutorial,a student was assigned to a pair of low Openness, medium Openness, or high Openness.
Every tutorial lasted for two hours where the first 45 minutes were used by the tutor toexplain the topic, and the remaining 75 minutes were allocated for students to solve theprogramming exercises in pairs. To allow for “pair-jelling”, students worked with theirpartners for an initial period of 30 minutes; and then swapped their roles every 15-20 minutes.Before the end of every tutorial, students provided feedback relating to working with thepartner by filling out a questionnaire. The exercises given during the tutorials were graded,thus contributing towards the students’ final grade. In addition, assignments and test werealso graded, however these were completed individually.
The outcomes measured from the experiment were the students’ academic performance intheir three assignments, in a midterm test and in a final exam. Since tutorial exercises varied

from week to week, the experiments were designed in such a way as to minimize theconfounding factor which might occur due to differences in tasks and level of complexity ofexercises. Therefore, the same set of exercises was given throughout a week.
4. Results
In this Section, the results of the formal experiment are presented, followed by adiscussion of results and the potential threats to the validity of our findings.
4.1 Subjects
A total of 488 students were enrolled in the COMPSCI 101 course during the firstsemester of 2010. Of these, 372 (76.2%) were male students, and 116 (23.8%) werefemale students. The subjects’ age ranged from 18 to 55 years old (the mode age = 19years). Of the 164 students who answered the demographic survey, 138 (84.1%) did nothave any work experience; however 55 (33.5%) students indicated that theirprogramming competency was above average. Of the 488 students, 154 (31.6%)students completed the personality test and have consented to participate in the study.Of these 154 students, only 137 students remained enrolled throughout the semester andsat the midterm test and the final exam. Therefore, the sample size used in our analysiswas 137 students.
4.2 Data Distribution
Figure 1a shows the distribution of assignment scores according to students’ level ofOpenness to experience. The box represents the middle 50% of the scores, with the upper andlower tails indicating the 75th and 25th percentiles, respectively. The distribution ofassignments’ scores for the high Openness group was more peaked than that for both low andmedium groups. Both low and medium Openness to experience groups showed a similarspread. The highest and lowest medians were shown for the high Openness and mediumOpenness group, respectively. The outliers indicate cases where the students did not completesome of their assignments.
Figure 1b show the distribution of the midterm test scores for each of the Openness toexperience levels. The dispersion of scores and median for both low and medium Openness toexperience groups were similar and differed from the high Openness group, which showed amore peaked distribution, and the highest median overall. Figure 1c shows the distribution ofscores for the final exam according to students’ level of Openness to experience. Thedispersion of scores and median for both low and medium Openness to experience groupswere similar, and differed from the high Openness group, which showed a more peakeddistribution, and the highest median overall.
(a) (b) (c)Figure 1. Comparison of academic performance between groups

4.3 Correlation Analysis
A correlation analysis using the Pearson’s correlation coefficient (α = 0.05) was performedto measure the strength of association between levels of Openness to experience and pairedstudents’ academic performance (see Table 2). The results showed a statistically significantpositive correlation between Openness to experience and the midterm test (r(137) = 0.18, p <0.05) and between Openness to experience and the final exam (r(135) = 0.17, p < 0.05).These findings corroborate the results from our previous experiments [23], [25]. In addition,there was also a significant positive correlation between Conscientiousness and allperformance measures (r (137) = 0.17, p < 0.05 for assignments; r(137) = 0.19, p < 0.05 forthe midterm test; r(135) = 0.18 for the final exam). These findings were partly consistent withthose from our previous experiment [26].
Table 2. Correlation between the academic performance and the FFM (N=137)1 2 3 E A C N
1 12 0.68** 13 0.69** 0.89** 1E -0.06 -0.07 -0.07 1A -0.01 0.08 0.08 -0.01 1C 0.17* 0.19* 0.18* 0.24** 0.42** 1N 0.04 -0.02 -0.00 -0.32** -0.27** -0.49** 1O 0.15 0.18* 0.17* 0.28** 0.07 -0.02 -0.13
1. Assignments 2. Test 3. Exam(E) Extraversion (A) Agreeableness (C) Conscientiousness (N) Neuroticism (O) Openness** Correlation is significant at the 0.01 (1-tailed)* Correlation is significant at the 0.05 (1-tailed)
4.4 Hypothesis Testing
The null hypothesis was tested using the one-way analysis of variance (ANOVA) test toanalyze whether there was any significant difference in academic performance between thethree levels of Openness to experience (low, medium, and high). ANOVA compares thevariance between the groups of low, medium and high Openness and produces the F ratio,which represents the variance between the groups [21].
Table 3 provides the mean and standard deviation values for academic performance foreach group. Overall mean values indicate that paired students of high Openness performedbetter in the assignments, midterm-test and exam than the other groups. The results from theLevene’s test for homogeneity of variances indicate that the variances of scores weresignificantly different for each group of Openness to experience (i.e. F(2,134) = 5.78, p<0.05,for assignments; F(2,134)=5.29, p<0.05, for midterm; F(2,132)=6.88, p<0.05 for exam). Inthis case, the homogeneity of variance assumption was violated and therefore instead ofreferring to the ordinary ANOVA, the Robust Tests of Equality of Means needed to beconsulted using either the Welch or Brown-Forsythe test [21].
Both tests (Welch and Brown-Forsythe) indicate that there was a statistically significantdifference between the three levels of Openness to experience relating to the mean scores ofpaired students’ academic performance (α = 0.05). Based on the p values, we had evidence toreject the null hypothesis and it can be concluded that at least one of the groups means issignificantly different from the others (i.e. W(2, 87.51) = 4.79, p < 0.05, for assignments;W(2, 88.81) = 7.43, p < 0.05, for the midterm test, and W(2, 86.72) = 7.65, p < 0.05, for thefinal exam).
Post-hoc comparisons were performed to further examine which groups means differed.For this purpose, we applied the Games-Howell procedure because it was reported to be the

appropriate procedure to be used when the assumption of equal variances was violated [20].The results from applying the Games-Howell test could be summarized as: i) Paired studentsof high Openness to experience achieved better performance in assignments, midterm test,and final exam when compared with their counterparts (p<0.05). ii) Paired students of lowerand medium Openness to experience had comparable performance in assignments, midtermtest, and final exam (p<0.05).
Table 3. Mean and Standard Deviation of Paired Students’ AcademicPerformance
Performance Measures Openness Level N Mean SDAssignments Low Openness 48 11.02 3.58(Range: 0 to 14) Medium Openness 47 10.24 3.41
High Openness 42 12.06 2.23Total 137 11.07 3.23
Midterm scores Low Openness 48 64.14 22.72(Range: 0 to 100) Medium Openness 47 57.97 26.53
High Openness 42 75.67 18.89Total 137 65.56 24.00
Exam scores Low Openness 48 66.83 26.46(Range: 0 to 100) Medium Openness 45 60.17 28.51
High Openness 42 79.30 19.35Total 135 68.49 26.23
We conducted a post hoc power analysis using the G*Power 3.1.2 to compute thestatistical power of the ANOVA test employed in our experiment [11]. A statisticalpower represents the likelihood that a treatment effect will be observed whenever thereis one. High power indicates greater ability to detect a difference between treatments ifa true difference exists, when compared with a study with low statistical power [9]. Ouranalysis indicates that this experiment demonstrates a reasonably high statistical power(between 0.70 and 0.88) with a medium effect size (ranging between 0.24 and 0.30).
5. Results on Satisfaction and Confidence
We analysed paired students’ levels of satisfaction and confidence based on data gatheredfrom a PP questionnaire distributed in each tutorial session. Data were gathered starting fromthe third week onwards to give students ample time to familiarize themselves with PP duringthe first two weeks of tutorials. The questionnaire’s response rate was initially 81.7% whengathered for the first time; however it decreased to 56.9% for the last week of tutorials.
Students indicated their level of satisfaction working with their partner by answering thequestion “Please rate how satisfied are you working with your partner”, measured on a scalefrom 1 (very dissatisfied) to 5 (very satisfied). On average 75 (87.2%), out of an average of86 students attending the tutorials, were satisfied working with their partner. The Kruskal-Wallis test was used to compare satisfaction levels between groups of different levels ofOpenness to experience. Table 4a shows the mean satisfaction rank of paired students, wherea higher mean rank indicates a higher satisfaction level. The results indicate that there wasonly one tutorial (i.e. tutorial 4) that showed a significant value (χ2 (2, 99) = 7.19, p = 0.03);therefore, overall our results demonstrated that the satisfaction level of paired students werenot affected by students’ level of Openness to experience.
Students reported their confidence level by answering the question “How do you rate yourlevel of confidence solving the exercises with your partner?”, measured on a scale from 1(very low) to 5 (very high). On average 73 (84.9%), out of an average of 86 studentsattending tutorials were highly confident in the correctness of their programming solutionswhen working in pairs. Table 4b presents the mean rank for paired students’ confidence level,showing only one tutorial with a statistically significant difference in confidence level across

the three groups (tutorial 4, χ2(2, 99) = 8.78, p=0.01). Overall findings indicate that pairedstudents’ confidence level was not affected by students’ Openness to experience level.
Table 4. Mean rank for satisfaction & confidence level(a) Satisfaction (b) Confidence
OpennessLevel
NMeanRank
Sig.(%) Satisfied/Very Satisfied
MeanRank
Sig. (%) HighConfidence
Tut. 3N=112
Low 37 49.270.19 87.5
50.15 0.2483Medium 37 59.35 61.91
High 38 60.76 57.42Tut. 4N=99
Low 33 48.260.03 81.8
49.020.01 78.8Medium 34 59.16 59.96
High 32 42.06 40.44Tut. 5N=97
Low 35 48.440.27 86.6
43.970.26 86.6Medium 34 54.10 54.22
High 28 43.50 48.95Tut. 6N=63
Low 18 29.310.08 87.3
28.060.18 85.7Medium 31 29.73 31.19
High 14 40.50 38.86Tut. 7N=70
Low 26 34.460.84 85.7
32.980.68 84.3Medium 19 37.58 37.50
High 25 35.00 36.60Tut. 8N=84
Low 28 46.950.33 95.2
47.820.23 91.6Medium 29 38.55 38.03
High 27 42.13 41.78Tut. 9N=78
Low 26 37.480.69 89.7
40.750.86 87.2Medium 24 42.40 40.10
High 28 38.89 37.82
In addition to measuring the satisfaction and confidence level, students’ feedback on thefollowing questions were also gathered: (Q1) “I felt that working with this partner was aproductive experience”; (Q2) “I enjoyed working with my partner”; (Q3) “My motivationlevel increased when working with my partner”.
Based on the students’ feedback, on average 78 out of 87 students (89.7%) indicated thattheir pairing experiences was productive (Q1). In terms of enjoyment, 78 out of 87 students(89.7%) agreed that working with partner was an enjoyable experience (Q2). PP also helpsincreased students’ motivation level (Q3). On average 73 out of 87 students (83.9%) agreedwith the statement mentioned in Q3.
6. Discussion
The findings from this experiment showed that paired students’ academic performanceappeared to be significantly affected by students’ Openness to experience level. Thesefindings corroborate some existing results reported in the personality-psychology literature.For example, Blickle [5] found Openness to experience to be positively associated withacademic performance. His findings indicate that the Openness to experience trait has acrucial effect on the learning strategies, which mediate the relationship between personalitytrait and performance [5].
Ackerman and Heggestad’s meta-analysis [1] revealed a substantial positive correlationbetween Openness to experience and intelligence, and “knowledge and achievement”.Matzler et al. [18] have shown in their study that the acquisition and dissemination ofknowledge are greater for teams scoring high on Openness to experience.
In the context of paired programming, students working collaboratively in solvingprogramming tasks can benefit from the elements of Openness to experience by being morewilling to engage in learning experiences. Studies’ findings report that the mean level of

Openness to experience in team compositions positively influences knowledge sharing amongteam members ([14],[18]). It means that a team composed of higher aggregate levels ofOpenness to experience resulted into higher levels of knowledge sharing [14]. LePine [17]stated that “In a team setting, open individuals should not only make more suggestions, butbecause they tend to be insightful, enthusiastic, and talkative, they should tend to build on theideas of other members” (p. 32).
Openness to experience is considered a better predictor when the situation involves novelor complex tasks [12]. Thus, it is also possible that paired students who are high on Opennessto experience were more inquisitive in solving complex issues such as programmingproblems. This is because open individuals tend to be more creative and receptive toideas/change and willing to try new thing or learning to do different things ([17],[13]). In ourexperiment, we found a positive correlation between Openness to experience and pairedstudents’ performance in the midterm test and final exam, a result which is consistent with thefindings from our previous experiments ([23],[25]). The findings from the present experimentalso showed that paired students of high Openness levels outperformed those who have lowand medium level Openness, thus confirming our supposition that differences in Openness toexperience levels affect the academic performance of students who pair programmed.
There are several potential threats to the validity of our findings. In our experiment,academic performance was used as our dependent variable and a surrogate measure of PP’seffectiveness. However, students’ academic performance may also be affected by otherfactors such as learning styles, self-motivation, and programming ability or competency. Inspite of being a surrogate measure, students regularly attend the tutorial and practicing PPthroughout an entire semester may have had an influence on their learning process whicheventually affected their performance in the test and exam.
Due to the limitation in the sample size employed in this study, we are able to account foronly a single personality factor (i.e. Openness to experience) and this prevents us fromcontrolling for the effects of other personality factors towards pairing effectiveness orstudents’ academic performance. For instance, students may perform well in this coursebecause of their conscientious behavior regardless of their high level of Openness toexperience. We suggest that future replication study should consider controlling the effects ofthese two major personality factors.
7. Conclusions and Future Work
The findings from the present experiment provide strong support to our alternativehypothesis regarding the effects of the Openness to experience factor on PP’seffectiveness (measured by students’ academic performance). We found evidence thatthe level of Openness to experience played a significant role in influencing students’academic performance where paired students of high Openness achieved betterperformance compared with their counterparts. The satisfaction and confidence level ofstudents who worked in pairs, however, were not affected by their level of Openness toexperience. Results showed that on average 87% of students indicated that theirsatisfaction level was high when working with their partner. Similarly, most students(85%) responded that they had high level of confidence in solving the programmingexercises collaboratively with their partner. As part of our future work, we willreplicate this experiment to confirm or refute this finding.
References[1] P.L. Ackerman, and E.D. Heggestad, “Intelligence, personality, and interests: Evidence for overlapping
traits,” Psychological Bulletin, vol. 121, no. 2, pp. 219-245, 1997.

[2] S.T. Acuna, M. Gomez, N. Juristo, “How do personality, team process, and task characteristics relate to jobsatisfaction and software quality?,” Information and Software Technology, vol. 51, pp. 627-639.
[3] M.R. Barrick, G.L. Stewart, M.J. Neubert, and M.K. Mount, “Relating member ability and personality towork-team processes and team effectiveness,” Journal of Applied Psychology, vol. 83, pp. 377-391, 1998.
[4] S.T. Bell, “Deep-level composition variables as predictors of team performance: A Meta-Analysis,” Journalof Applied Psychology, vol. 92, no. 3, pp. 595-615, 2007.
[5] G. Blickle, “Personality traits, learning strategies, and performance,” European Journal of Personality, vol.10, pp. 337-352, 1996.
[6] G. Burch and N. Anderson, “Personality as a Predictor of Work-related Behavior and Performance: RecentAdvances and Directions for Future Research” in Hodgkinson, G.P. and Ford, J.K. eds. Int’l Review ofIndustrial and Organizational Psychology, John Wiley & Sons, Ltd, 2008, pp. 261-305.
[7] P.T. Costa, and R.R. McCrae, “Domain and facets: Hierarchical personality assessment using the revisedNEO personality inventory,” Journal of Personality Assessment, vol. 64, pp. 21-50, 1995.
[8] B. De Raad and H.C. Schouwenburg, “Personality in learning and education”, Review. European Journal ofPersonality, 10. 303-336.
[9] T. Dyba, V.B. Kampenes, and D.I.L. Sjoberg, “A systematic review of statistical power in softwareengineering experiments,” Information and Software Technology, vol. 48, pp. 745 – 755, 2006.
[10] T. Farsides and R. Woodfield, “Individual Differences and Undergraduate Academic Success: The Roles ofPersonality, Intelligence, and Application,” Personality and Individual Differences, 2003, 34 (7), pp. 1225-1243.
[11] F. Faul, E. Erdfelder, A.-G. Lang, and A. Buchner, "G*Power 3: A flexible statistical power analysis programfor the social, behavioral, and biomedical sciences," Behavior Research Methods, vol. 39, pp. 175-191, 2007.
[12] B. Griffin, and B. Hesketh, “Why openness to experience is not a good predictor of job performance,”International Journal of Selection and Assessment, vol. 12, no. 3, pp. 243-251, 2004.
[13] J.A. Harris, “Measured intelligence, achievement, openness to experience, and creativity,” Personality andIndividual Differences, vol. 36, pp. 913-929, 2004.
[14] B.-F. Hsu, W.-L. Wu, and R.-S. Yeh, “Personality composition, afftective tie and knowledge sharing: A teamlevel analysis,” Proceedings of the Portland International Center for Management of Engineering andTechnology (PICMET 2007), pp. 2583-2592, 2007.
[15] J. Johnson, The IPIP-NEO Personality Assessment Tools. Available online:http://www.personal.psu.edu/j/5/j5j/IPI/ (accessed July 2008)
[16] L. Layman, “Changing students' perceptions: an analysis of the supplementary benefits of collaborativesoftware development”. Proc. 19th Conf. on Software Engin. Education & Training. IEEE Comp. Society,2006, pp. 159 – 166.
[17] J.A. LePine, “Team adaptation and postchange performance: Effects of team composition in terms ofmembers' cognitive ability and personality,” Journal of Applied Psychology, vol. 88, no. 1, pp. 27-39, 2003.
[18] K. Matzler, B. Renzl, J. Muller, S. Herting, and T. A. Mooradian, "Personality traits and knowledge sharing,"Journal Economic Psychology, vol. 29, pp. 301-313, 2008.
[19] C. McDowell, L. Werner, H. E. Bullock, and J. Fernald, "The impact of pair programming on studentperformance, perception and persistence," Proceedings of the 25th International Conference on SoftwareEngineering (ICSE'03), pp. 602-607, 2003
[20] G.A. Morgan, N.L. Leech, G.W. Gloeckner and K.C. Barrett, SPSS for Introductory Statistics. Use andInterpretation. Lawrence Erlbaum Associates, Inc., New Jersey, 2004.
[21] J.F. Pallant, SPSS Survival Manual: A step by step guide to data analysis using SPSS for Windows (Version15), 3rd ed., Crows Nest, N.S.W.: Allen & Unwin, 2007.
[22] M.A.G. Peeters, H.F.J.M.V. Tuijil, C.G. Rutte, and I.M.M.J. Reymen, “Personality and team performance: Ameta-analysis,” European Journal of Personality, vol. 20, pp. 377-396, 2006.
[23] N. Salleh, E. Mendes, J. Grundy, and G.S.J. Burch, "An empirical study of the effects of personality in pairprogramming using the five-factor model," Proceedings of the 3rd ACM-IEEE International Symposium onEmpirical Software Engineering & Measurement (ESEM 2009), pp. 214-225, October 2009 2009
[24] N. Salleh, E. Mendes, and J. Grundy, “Empirical studies of pair programming for CS/SE teaching in highereducation: A systematic literature review,” IEEE Transactions on Software Engineering vol. (to appear) DOI:10.1109/TSE.2010.59 2010.
[25] N. Salleh, E. Mendes, J. Grundy, and G.S.J. Burch., “An empirical study of the effects of conscientiousnessin pair programming using the five-factor personality model,” Proceedings of the 32nd ACM/IEEEInternational Conference on Software Engineering (ICSE 2010), vol. 1, pp. 577-586, May, 2010.
[26] N. Salleh, E. Mendes, J. Grundy, and G.S.J. Burch, “The effects of neuroticism on pair programming: Anempirical study in the higher education context,” Proceedings of the 4th ACM-IEEE International Symposiumon Empirical Software Engineering and Measurement (ESEM 2010), 2010.
[27] T. VanDeGrift, “Coupling pair programming and writing: learning about students' perceptions andprocesses,” ACM SIGCSE Bulletin, vol. 36, no. 1, pp. 2-6, 2004.
[28] L. Williams, R.R. Kessler, W. Cunningham, and R. Jeffries, “Strengthening the case for pair programming,”IEEE Software, vol. 17, no. 4, pp. 19-25, 2000.