new energy passenger vehicle market openness index ...
40
-1- NEW ENERGY PASSENGER VEHICLE MARKET OPENNESS INDEX RELEASE REPORT Innovation Center for Energy and Transportation (iCET) May 2018
-
Upload
khangminh22 -
Category
Documents
-
view
0 -
download
0
Transcript of new energy passenger vehicle market openness index ...

-1-
NEW ENERGY PASSENGER VEHICLE MARKET
OPENNESS INDEX RELEASE REPORT
Innovation Center for Energy and Transportation (iCET)
May 2018

-2-
In 2012, the State Council officially launched the “Energy-saving and
new-energy automotive industry development plan (2012-2020),”
stating that pure electric mobility is the main strategic direction for
China’s auto industry. EV and PHEV sales were targeted at 500,000
units by 2015 (which went down in 2016); by 2020, the target will
be 5 million units with estimated capacity to produce up to 2
million units per year.
The rapid development of China‘s new energy automotive
industry is one result of the pro-EV policies made at the
national and local levels. China is now transitioning from
pilot- and policy-directed development and a more
meaningful engagement with industry.
BACKGOUND
Over 1.5 million new energy vehicles (PEVs, PHEVs) have been sold in China so far, accounting for over 50% of the global market. Between 2015 and
2017, the number of NEV brands doubled and the number of NEV models available in the Chinese market tripled.
Note: As early as 2013, four ministries and committees specified in the “Notice on Continuing the Promotion and Application of New Energy
Vehicles” that no obstacles should be imposed on foreign NEVs.

-3-
GOAL
While challenges to NEV commercialization consist of phasing out of subsidies, improvement of product reliability, supply chain development,
and charging and after-sale services, this study focuses on local protectionism.
By identifying issues that curtail the diversity of NEV models and then issuing recommendations, it is our hope that some of the institutional
barriers to NEV commercialization may be lifted.

-4-
METHOD
◼ The NEV Market Openness Index was developed on the basis
of conventional diversity combined with penetration indexes,
both adopted from biological studies.
◼ Passenger NEVs are at the focus of this research, based on the
way urban diversity is evaluated and ranked.
◼ Data from 23 Cities and 20 provinces data was considered in
the ranking analysis.
◼ 2015 data is based on license plate registration while 2016-
2017 data is based on insurance registrations (cumulated
annual sales and production figures are presented in the figure
on the right).
14.7 16.225.7 26.3
46.8 47.8
6.07 6.26
7.9 8.1
11.1 11.4
0
10
20
30
40
50
60
Sale
s
Pro
duct
ion
Sale
s
Pro
duct
ion
Sale
s
Pro
duct
ion
2015 2016 2017
NEV Sales and production in 2015-2017
PHEV BEV

-5-
NEV MARKET AND SHARES DURING 2015-2017
➢ Shanghai, Beijing, and Guangdong province are ranked as the top three regions in NEV sales between 2015 and 2017, while northeast and northwest
regions are below average.
➢ China‘s NEV sales in 2017 were 579,000, of which 468,000 were PEVs and 111,000 were PHEVs.
Region*104
VolumeRegion *104 Volume Region
*104
Volume
Shanghai 14.14 Hubei 2.64 Hainan 0.63
Beijing 13.72 Shanxi 2.64 Guizhou 0.44
Guang-
dong12.52 Fujian 2.38 Liaoning 0.31
Shan-dong 10.60Chong-
qing1.85
Inner
Mengolia0.11
Zhejiang 9.96 Shaanxi 1.79 Jilin 0.11
Tianjin 5.46 Hebei 1.74 Xinjiang 0.05
Hunan 3.85 Sichuan 1.69Heilong-
jiang0.04
Henan 3.75 Yunnan 1.45 Ningxia 0.04
Anhui 2.97 Guangxi 1.42 Qinghai 0.02
Jiangxi 2.83 Gansu 0.82 Tibet 0.01
Jiangsu 2.75
NEV total sales per province/municipality (2015-2017)

-6-
➢ The number of NEV brands increased from 32 (2015) to 52 (2016) and, later, 68 (2017)
➢ The number of NEV models increased from 69 (2015) to 108 (2016) and, later, 210 (2017).
➢ The number of models sold per brand increased significantly (BAIC and BYD tripled their model sales during this period).
➢ Some NEV brands have 1-2 models ensuring technology advancements, e.g. Tesla
Brands 2015 2016 2017
BAIC 4 8 14
BYD 3 4 10
Zotye 7 5 7
Chang’an 1 2 7
Chery 2 5 6
SAIC 2 3 5
JAC 4 5 5
Geely 3 3 4
ZD 1 3 4
JMC 2 3 3
2015-2017 NEV MARKET TRENDS
69
108
210
32
5268
0
50
100
150
200
250
2015 2016 2017
NEV Brands and Models
Model Brand

-7-
NEV Market Openness Index
-8-
NEV MARKET OPENNESS INDEX
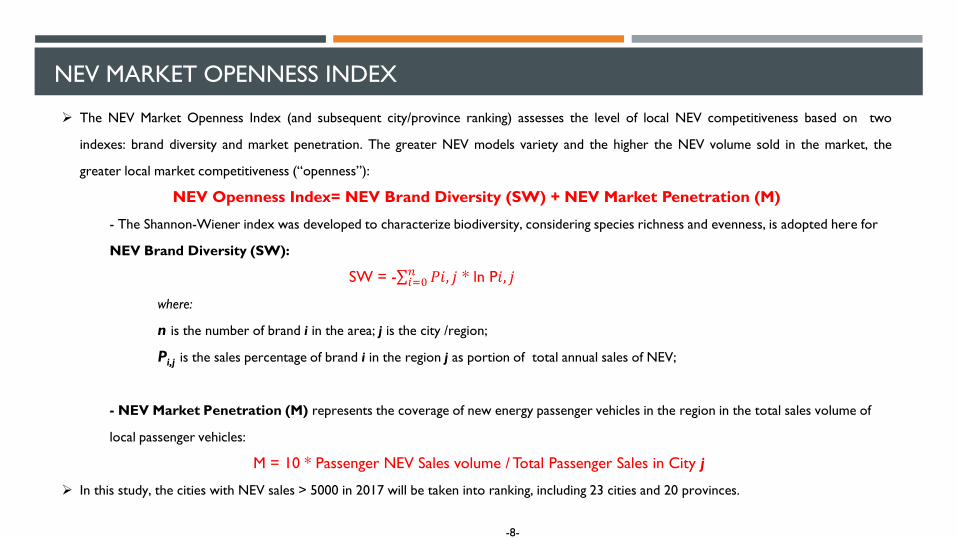
➢ The NEV Market Openness Index (and subsequent city/province ranking) assesses the level of local NEV competitiveness based on two
indexes: brand diversity and market penetration. The greater NEV models variety and the higher the NEV volume sold in the market, the
greater local market competitiveness (“openness”):
NEV Openness Index= NEV Brand Diversity (SW) + NEV Market Penetration (M)
- The Shannon-Wiener index was developed to characterize biodiversity, considering species richness and evenness, is adopted here for
NEV Brand Diversity (SW):
SW = -σ𝑖=0𝑛 𝑃𝑖, 𝑗 * ln P𝑖, 𝑗
where:
n is the number of brand i in the area; j is the city /region;
Pi,j is the sales percentage of brand i in the region j as portion of total annual sales of NEV;
- NEV Market Penetration (M) represents the coverage of new energy passenger vehicles in the region in the total sales volume of
local passenger vehicles:
M = 10 * Passenger NEV Sales volume / Total Passenger Sales in City j
➢ In this study, the cities with NEV sales > 5000 in 2017 will be taken into ranking, including 23 cities and 20 provinces.

-9-
2017 CITY INDEX
Level Rank City SW Score M Score NEV Index
1st Tier
1 Tianjin 2.56 1.24 3.80
2 Hangzhou 2.42 1.03 3.45
3 Beijing 2.13 1.10 3.23
2nd Tier
4 Guangzhou 2.31 0.39 2.70
5 Shanghai 1.76 0.94 2.70
6 Chengdu 2.49 0.16 2.65
7 Shenzhen 1.70 0.93 2.63
8 Zhengzhou 2.30 0.31 2.61
9 Wuhan 2.23 0.31 2.54
10 Xian 2.29 0.21 2.50
3rd Tier
11 Changsha 2.04 0.44 2.48
12 Jining 1.84 0.53 2.37
13 Xiamen 1.70 0.64 2.34
14 Nanjing 1.93 0.32 2.25
15 Weifang 1.28 0.97 2.25
16 Huzhou 1.48 0.64 2.12
17 Qingdao 1.43 0.66 2.09
4th Tier
18 Chongqing 1.77 0.21 1.98
19 Ningbo 1.66 0.31 1.97
20 Kunming 1.45 0.35 1.80
21 Hefei 0.85 0.37 1.22
22 Liuzhou 0.32 0.88 1.20
23 Nanchang 0.53 0.64 1.17
Note: The greater the SW score, the higher the brand diversity; the larger the M score, the deeper the local market penetration;

-10-
Level Rank City SW Score M Score NEV Index
1st Tier 1 Tianjin 2.56 1.24 3.80
2 Beijing 2.13 1.10 3.23
2nd Tier
3 Zhejiang 2.60 0.38 2.98
4 Hubei 2.57 0.15 2.72
5 Shanghai 1.76 0.94 2.70
6 Sichuan 2.54 0.09 2.63
7 Henan 2.34 0.17 2.51
3rd Tier
8 Fujian 2.20 0.27 2.47
9 Suzhou 2.31 0.11 2.42
10 Shaanxi 2.29 0.13 2.42
11 Guangdong 2.17 0.25 2.42
12 Shandong 2.03 0.32 2.35
13 Hebei 2.23 0.08 2.31
14 Hunan 2.11 0.19 2.30
15 Shanxi 2.07 0.09 2.16
4th Tier
16 Chongqing 1.77 0.21 1.98
17 Yunnan 1.63 0.16 1.79
18 Anhui 1.36 0.14 1.50
19 Guangxi 0.75 0.23 0.98
20 Jingxi 0.69 0.26 0.95
2017 PROVINCE INDEX
Note: The greater the SW index, the higher the brand diversity; the larger the M index, the deeper the local market penetration;

-11-
Category2015 2017
City Province City Province
1st Tier - - Tianjin, Hangzhou, Beijing Tianjin, Beijing
2nd Tier - -
Guangzhou, Shanghai, Chengdu,
Shenzhen, Zhengzhou, Wuhan,
Xi'an
Zhejiang, Hubei, Shanghai, Sichuan,
Henan
3rd TierShenzhen, Shanghai, Tianjin,
BeijingShanghai, Jiangsu, Tianjin, Beijing
Changsha, Jining, Xiamen, Nanjing,
Weifang, Huzhou, Qingdao
Fujian, Jiangsu, Shaanxi, Guangdong,
Shandong, Hebei, Hunan, Shanxi
4th Tier
Wuhan, Guangzhou, Chengdu,
Zhengzhou, Xiamen, Qingdao,
Nanjing, Chongqing,
Hangzhou, Xi'an, Ningbo,
Weifang, Hefei, Nanchang,
Kunming, Changsha, Huzhou,
Jining, Liuzhou
Hubei, Fujian, Henan, Zhejiang,
Sichuan, Zhejiang, Shandong,
Chongqing, Hebei, Guangxi, Jiangxi,
Hunan, Shaanxi, Anhui, Yunnan,
Shanxi
Chongqing, Ningbo, Kunming
Hefei, Liuzhou, Nanchang
Chongqing, Yunnan, Anhui,
Guangxi, Jiangxi
NEV MARKET OPENNESS INDEX
➢ In 2017, three cities and provinces were listed in the 1st tier. But in 2015, none were listed under the 1st or even the 2nd tier.

-12-
Brands in 2017 42 43 38 37 35 32 36 38 30 32 31 29 28 30 23 26 24 23 21 19 21 23 15
2017 NEV Market Openness Index
➢ A total of 23 cities with NEV sales volume > 5000 in 2017 were selected, covering over 75% of the total NEV sales for that year;
➢ 68 NEV brands were available for sale, while in 12 cities the number of available NEV brands reached just 30;
➢ Compared with 2015, the year 2017 saw development in NEV diversity, spearheaded by Tianjin, Hangzhou, Changsha, Xian, and Jining.
➢Tianjin and Hangzhou are the most open markets in China; while the two cities with most NEV sold, Beijing and Shanghai, ranked as 3rd and 5th. Hefei,
Liuzhou and Nanchang are the least open markets.
TianjinHangz
houBeijing
Guang
zhou
Shang
hai
Cheng
du
Shenz
hen
Zheng
zhou
Wuha
nXi'an
Chang
shaJining
Xiame
n
Nanjin
g
Weifa
ng
Huzho
u
Qingd
ao
Chong
qing
Ningb
o
Kunmi
ngHefei
Liuzho
u
Nanch
ang
2017NEV sales volume 2.92 3.63 5.62 1.83 6.01 0.89 3.35 1.73 0.98 0.76 1.37 0.72 0.88 0.73 1.53 0.54 1.52 1.05 0.73 0.97 0.91 0.91 0.98
2015NEV Sales Volume 0.48 1.12 1.78 0.76 3.66 0.24 1.32 0.26 0.55 0.14 1.01 0.01 0.12 0.12 0.10 0.18 0.91 0.38 0.35 0.22 0.07 0.00 0.11
NEV Index of 2017 3.80 3.45 3.23 2.70 2.70 2.65 2.63 2.61 2.54 2.50 2.48 2.37 2.34 2.25 2.25 2.12 2.09 1.98 1.97 1.80 1.22 1.20 1.17
NEV Index of 2015 2.07 1.73 2.04 1.83 2.42 1.53 2.43 1.51 1.76 0.88 0.80 0.36 1.65 1.49 0.99 0.49 1.58 1.17 0.87 0.61 0.66 0.64 0.59
0.0
1.0
2.0
3.0
4.0
5.0
6.0
7.0
0.0
0.5
1.0
1.5
2.0
2.5
3.0
3.5
4.0
NE
V I
nd
ex
NEV Index in City Level

-13-
➢ The greater the SW index, the higher the brand diversity will be; the larger the M index, the deeper the local market penetration;
➢ Cities have been divided into four tires, the cities in the 1st tier performed the best with both high grades on SW and M index; on the contrary, the 4th
tier cities were those that did not perform as well.
➢ In 2015, the selected cities were mostly distributed in the lower left, where the market is less open than the average; in 2017, there was a great shift to
the upper right, where the diversity index and market coverage rate all increased;
0.00
0.20
0.40
0.60
0.80
1.00
1.20
1.40
0.00 0.50 1.00 1.50 2.00 2.50 3.00
M
SW
2017 2015
Tianjin
HangzhouBeijing
Liuzhou
Nanchang
Hefei
Shanghai
Shanghai
Tianjin
Beijing
Shenzhen
ShenzhenHangzhou
Guangzhou
Guangzhou
Chengdu
ZhengzhouWuhan
Changsha
Nanjing
Jining
XiamenHuzhou
Qingdao
Weifang
Kunming
ChongqingNingbo
Qingdao
Zhengzhou
Changsha
Xi'anHuzhou
Hefei
NingboKunmingNanchang
Jining
ChongqingWuhan
XiamenChengdu
NanjingWeifang
Xi’anLiuzhou
2017 NEV Market Openness Index

-14-
➢ Tianjin is most open city for NEVs:
• Tianjin ranked 5th in NEV sales in 2017 (mainly A0/A00 models, e.g. ZD D1/D2, BAIC EC180, Zotye E200, Chery eQ; PHEV account for
only 12.4% of sales) .
• There are nine NEV manufacturers in Tianjin, including BAIC and BYD, a relatively high number.
• Tianjin puts no obstacles on NEV commercialization. The local directory of NEV models eligibility for tax purposes was only set up in
August 2017, requiring non-local auto manufacturers to form a legal local entity. Local government recently announced a plan to
convert the city’s entire taxi fleet to NEV by 2020.
2017 NEV Index Results Detailed-1st Tier
ZD 16%
BAIC13%
HAWTAI12%
ZOTYE11%
BYD10%
Chery9% JAC
8%YOGOMO, 3%
ROEWE, 3%
CHANA, 3%
others, 12%
Other21%
Tianjin

-15-
2017 NEV Index Results Detailed -1st Tier
➢ Hangzhou, the 2nd most open NEV market:
• From 2015 to 2017 the Hangzhou NEV brand diversity increased from 0.85 to 2.42.
NEV brands sells in Hangzhou are relatively evenly distributed, however, the local
brand Kandi and Geely still dominate market sales; PHEV account for 16.8% of the
NEV market.
• Hangzhou started promoting NEV in its early stages as one of the 13 pilot cities, and
Hangzhou initiated its local NEV market beginning in 2009.
• Hangzhou is one of the cities that launched a NEV business (including leasing business)
earlier than most cities in China. Non-private passenger vehicles (taxies and car sharing)
accounted for 28% of total NEV sales in 2017, mainly for rental and internet service,
such as Caocao Express by Geely; meanwhile, BEVs with battery renewal are also
available in Hangzhou.
➢ Beijing, the 3rd most open NEV market:
• The promotion of NEVs in Beijing was mainly driven by policies, primarily the license
registration limit policy enacted in 2010.
• In 2017, the diversity and market coverage of NEVs in Beijing increased significantly
compared to 2015 by 1.54 times. The number of NEV brands increased from 16 to 38,
and the diversity index increased by 32.5%.
• As a result of the subsidy policy, 89% of Beijing’s PEV market is dominated by five
brands: BYD 28%, BAIC 26%, Geely 10%, CHANA 10%, and Tesla 5%;
KANDI, 22%
Geely, 19%
BYD, 12%
DF, 12%ZOTYE
7%
CHANA, 5%
BAIC, 4% Tesla, 4%
ROEWE, 3%
DENZA, 2%
Other, 10%
Other, 19%
Hangzhou
BYD, 28%
BAIC, 26%
Geely, 11%
CHANA,
10%
Tesla, 5%
Roewe, 4%
JAC, 3% ZOTYE, 2%
Chery, 2%
BMW, 2%
Other, 7%
Other, 13%
Beijing

-16-
Roewe
46%
BYD
17%
BAIC
14%
Tesla
6%
JAC
5%
Other
12%
Shanghai
BAIC
22%
BYD
20%
ZOTYE
12%
Chery
10%
ZD
7%
Other
29%
Guangzhou
2017 NEV Index Results Detailed -2nd Tier
BAIC
18%
CHANA
17%
Chery
12%DF
11%
Tesla
9%
Other
33%
Chengdu
(* Reference: https://www.d1ev.com/kol/63328)
Guangzhou is one of the first pilot cities for new energy vehicles. It has gradually developed the new energy
automobile industry and is now home six NEV companies and a full supply chain of manufacturers. PHEV sales
accounted for 16.1%; commercial vehicles accounted for 15.2%. In 2017, the NEV brand diversity in Guangzhou
was significantly higher than it was in 2015. The number of brands increased from 14 to 36 while brand
distribution remained relatively even. The five brands with the highest sales volume were: BAIC 22%, BYD 20%,
Zotye 12%. Chery 10%, ZD 7% (sales for these top five brands accounted for 71% of the total).
Chengdu is the second largest city in terms of car ownership, but its NEV market coverage is relatively low, and
there is still much room for improvement in NEV marketing. In terms of brand diversity, Chengdu has performed
well and sales of brands have been relatively evenly distributed. In 2017, NEV top five brands were BAIC 18%,
CHANA 17%, Chery 12%, Dongfeng 11%, and Tesla 9%. The proportion of commercial vehicles is 12.6%,
dominated by CHANA, Denza and BAIC. Chengdu is actively developing its NEV industry, charging infrastructure
and new operating models, and has also introduced a series of incentives, such as purchase subsidies, parking fees,
and restrictions.
Shanghai has a local subsidy allocation quota, of which 72% was allocated to non-Shanghai local car companies.
However, the index is in the middle and lower levels. In 2017, there were 28 NEV brands in the Shanghai market,
with sales topping at 46% for SAIC Roewe, 17% for BYD, 14% for BAIC, 6% for Tesla, and 5% for JAC. Top five
brands accounted for 88% of total sales. Non-private passenger vehicles (taxies and car sharing) sales accounted
for 20% of the total, with BAIC 42%, SAIC Roewe 24%, and JAC 16%. The main operating platforms are
EVCARD and DiDi. As the largest PHEV market in China, Shanghai’s NEV vehicle products are mainly PHEVs. In
2017, PHEVs accounted for 60% of NEVs, 66% of which by Roewe and 29% by BYD.

-17-
2017 NEV Index Results Detailed -2nd Tier
BYD
57%Roewe
10%
ZD
9%
Tesla,
6%
BAIC,
3%
Other
15%
Shenzhen
DFFS
24%
BAIC
17%
ZD
12%
Chery
12%
Geely
10%
Other
25%
Wuhan
ZD
16%
BYD
16%
Chery
16%BAIC
14%
Geely
13%
Other
25%
Xi’an
Haima
27%
BAIC
19%
CHANA
9%
ZD
8%
ZOTYE
8%
Other
29%
Zhengzhou
Shenzhen ranked fourth in NEV sales in 2017, with 30 NEV brands. The top five selling companies were BYD 57%, Roewe 10%, and ZD 9%
respectively, Tesla 6%, BAIC 3%; these top five brands accounted for 85% of total sales; BYD’s dominance is related to local taxi fleets
operations. Preferential policies include purchase subsidies, and it is planned that all taxis will be replaced by pure electric vehicles by 2020
(likely BYD E6);
Zhengzhou NEV is dominated by electric buses, such as Yutong and Shaolin coaches; the development of passenger NEVs is relatively weak.
There were 37 NEV brands in Zhengzhou in 2017. On average, the five brands with the highest sales were Haima 27%, BAIC 19%, CHANA
9%, ZD 8%, Zotye 8%, all of which were dominated by A0/A00 models;
Wuhan has a robust traditional automotive industry base. BYD, JAC, Dongfeng, Honda, and NIO Automobile have announced the
establishment of a NEV production R&D, following several encouraging policies announced in support of the promotion of NEVs. In addition
to purchase subsidies, policies such as toll exemption, public charging exemption fees, and government procurement were introduced. There
were 32 NEV brands and although sale volumes weren’t high, the market distribution was relatively even. Top five selling companies were
Dongfeng Fengshen 24%, BAIC 17%, ZD 12%, Chery 12%, Geely 10% - accounting for 75% of the total sales;
Xi’an had 31 models in 2017, with the top five selling brands being ZD 16%, BYD 16%, Chery 16%, BAIC 14%, and Geely 13% - accounting for
75% of total sales; Adding to purchase subsidies, Xi'an has introduced incentives such as license fees exemption, exemption from the first-time
strong insurance, parking and other concessions.

-18-
JAC
48%
BAIC
31%
JMEV
15%
Other
6%
Weifang
BAIC
62%
ZD
17%
Chery
6%
SUZUKI
3%
JMC
2%Other
10%
Qingdao
ZOTYE
27%
ZD
24%BAIC
15%
JAC
11%
JMC
6%
Other
17%
Changsha
KANDI
52%
JMEV
20%
Geely
12%
ZOTYE
7%
ZD
4%Other
5%
Huzhou
Chery
27%
BAIC
27%
ZOTYE
16%
JMEV
14%
CHANA5%
Other
11%
Jining
2017 NEV Index Results Detailed-3rd Tier
BAIC
48%
BYD
22%
ZD
7%
DFYL6%
JAC4%
Other
13%
Xiamen
BAIC
32%
ZD
28%
Roewe
10%
JAC
8%
BYD
7%
Other
15%
Nanjing
Changsha NEV models are dominated by A0/A00, and NEV brands are 31. The top five sales are: Zotye 27%, ZD 24%, BAIC 15%, JAC 11%,
JMEV6%, total sales of top five brands reached 83% of sales; There are 26 Xiamen NEV brands. The sales volume in 2017 was relatively low. The
top two brands were BAIC 48% and BYD 22%;
Xiamen's operating vehicles accounted for 22%; BYD 70% and BAIC 15%; Fujian, as the location of the first battery supplier CATL, the largest
passenger car customer in the CATL was BAIC New Energy (approximately 1.54 million Kwh was installed in 2017);
Nanjing’s five highest-selling brands were BAIC 32%, ZD 28%, Roewe 10%, JAC 8%, BYD 7%, together accounting for 85% of the total sales.
Huzhou is one of Kandi's production bases, and Kandi sales accounted for 52% of the city's sales.
Huzhou proposes that the production or sales of new energy vehicles in this city can additionally enjoy municipal or district-level financial
subsidies*;
Shandong province’s NEV market (e.g. Jining, Qingdao, and Weifang) is dominated by A0/A00 models, such as BAIC EC180, ZD, Zotye E200,
etc.; 23 Jining NEV brands, the highest-selling brands are Chery 27%, BAIC 27%, Zotye 16%, JMEV14%, CHANA 5%, together accounting for 89%
of total sales; Qingdao had 24 NEV brands, dominated by BAIC 62%, followed by ZD17%; Weifang had 21 NEV brands, dominated by JAC 48%,
BAIC 31 %, and JMEV 15%.

-19-
ZD
57%BAIC
13%
Chery
8%
JMEV
5%
JAC
3%Other
14%
Ningbo
2017 NEV Index Results Detailed -4th TIER
Six cities are in the 4th tier of the NEV diversity index: Ningbo, Chongqing,
Kunming, Hefei, Nanchang, and Liuzhou – their market coverage and brand diversity
are all relatively low;
Ningbo had 30 NEV brands in 2017, and the highest sales volume was of ZD (57%),
with one-third for commercial use and lease; Local top five brands accounted for 86%
of total sales; Geely initiated a new base in Ningbo in 2015; In 2016, Geely launched a
NEV collaboration with Volvo.
Chongqing had 27 NEV brands, producing mainly A0/A00 models. The top five brands
sold were CHANA 32%, DF Xiaokang 26%, ZD 17%, Zotye 10% and BAIC 8 %,
accounting for 93% of sales. Chongqing’s NEV industry is mainly supported by
traditional infrastructure, such as manufacturers (CHANA and DF).
Kunming had 21 NEV brands with distributions of 45% for BAIC and 36% for
CHANA. Kunming was one of the NEV pilot cities; Kunming is planning to build up a
new base for JMEV in 2018.
CHANA
32%
DFXK
26%
ZD
17%
ZOTYE
10%
BAIC
8%
Other
7%
Chongqing
BAIC
45%
CHANA
36%
Cherry
4%
YOMOGO3%
ZD
3%
Other
9%
Kunming

-20-
Baojun
82%
Others18%
0
1000
2000
3000
4000
5000
2015 2016 2017
NEV Sales in Liuzhou
*refer to http://finance.china.com.cn/roll/20170222/4107804.shtml
2017 NEV Index Results Detailed -4th TIER
0%
20%
40%
60%
80%
100%
2015 2017
NEV distribution in Nanchang
Others
JMEV
0%
20%
40%
60%
80%
100%
2015 2017
NEV distribution in Hefei
Others
Chery
JAC
Hefei NEV sales in 2017 was dominated by brands JAC and Chery by 97%, while in 2015 JAC brand sales accounted for nearly 80%; JAC
Automobile is headquartered in Hefei and Chery Automobile is headquartered in Wuhu.
Nanchang city launched a series of policies for the development of new energy vehicles, such as unlimited number of driving and parking fees.
There are a series of preferential policies yet strong protectionism exists as well. In 2016, the Nanchang Finance Bureau announced the promotion
and application of provincial-level subsidies for new energy vehicles. 17.75 million yuan, of which Jiangling Motors Co., Ltd. received 17.29 million
yuan; Jingma Motor Co., Ltd, a subsidiary of Jiangling Motors Co., Group received a grant of 360,000 yuan.*
Liuzhou, one of the top five automobile cities in China, is the sole manufacturing base of FAW, Dongfeng, SAIC, and CNHTC. In 2015-2016, NEV
sales were scarce and only in 2017, under Guangxi Province plans, sales volume climbed to nearly 10,000 vehicles. The “government-enterprise
linkage” mechanism includes the construction of charging infrastructure and formation of favorable policies for NEVs yet does not create brand
diversity.

-21-
NEV DIVERSITY INDEX GEOGRAPHICAL TRENDS
Source:Insurance data collected and analyzed by iCET
➢ In this study, 20 provinces with sales of NEV passenger cars >5000 in 2017 were selected for analysis.
➢ The NEV market has been improving in its openness from 2015 to 2017, with the index increasing from 1.38 to 2.33;
➢ The level of diversity of NEVs in the western and northern regions is relatively low;
➢ Central region shows more rapid change, likely because of its well established NEV industrial clusters.

-22-
NEV Market Openness Index Trends 2015-2017
Tianj
in
Beiji
ng
Zheji
ang
Hub
ei
Shan
ghai
Sichu
an
Hena
n
Fujia
n
Jiang
su
Shan
xi
Gua
ngdo
ng
Shan
dong
Heb
ei
Huna
n
Shan
xi
Cho
ngqin
g
Yunn
an
Anh
ui
Gua
ngxi
Jiang
xi
NEV Sales Volume of 2017 2.92 5.62 5.92 1.31 6.01 1.02 2.84 1.71 1.98 0.87 5.79 5.63 1.37 1.67 0.58 1.05 1.08 1.23 1.35 1.56
NEV Index of 2015 2.07 2.04 1.23 1.69 2.42 1.69 1.50 1.98 2.11 0.87 1.86 1.15 0.96 0.88 0.58 1.17 0.58 0.70 1.40 0.79
NEV Index of 2016 3.35 3.27 2.55 2.39 2.71 2.01 1.83 2.29 2.68 1.10 1.91 2.08 2.02 1.99 1.93 1.05 1.70 1.02 1.79 0.69
NEV Index of 2017 3.80 3.23 2.98 2.72 2.70 2.63 2.51 2.47 2.42 2.42 2.42 2.35 2.31 2.30 2.16 1.98 1.79 1.50 0.98 0.95
0.0
1.0
2.0
3.0
4.0
5.0
6.0
7.0
0.0
0.5
1.0
1.5
2.0
2.5
3.0
3.5
4.0
NE
V I
nd
ex
NEV Index in Region level
➢ In 2015, the average index score was low; the provinces with the highest diversity index were Jiangsu, Guangdong, Shanghai, and Hubei.
➢ In 2016, scores have improved; provinces with the highest scores were Zhejiang, Jiangsu and Tianjin.
➢ In 2017, the diversity index continued to improve, with over six provinces suppressing 0.5: Zhejiang, Guangdong, Jiangsu, Tianjin, Henan, and Shandong;
➢ From 2015 to 2017, Hebei, Hunan, Shanxi and Zhejiang Provinces have all improved their NEV's diversity, which can be directly linked to policies.

-23-
NEV DOMINANT CLUSTERS
Beijing-TianjinRegion
Beijing:BAIC
Tianjin:BYD, etc.
Relatively complete and comprehensivesupply chain;
Dominant enterprise in the market.
Yangtze RiverDelta Region
Shanghai:SAIC
Jiangsu:BAIC
Zhejiang:GEELY,
ZD, KANDI
More complete supply chain;
Fully equipped enterprises;
Pearl RiverRegion
Guangzhou:GAC, BAIC
Shenzhen:BYD
Fujian:SOUEAST,
CALT
Monopoly situation in the OEM market and battery market. The trademark enterprise has a complete supply chain system.
South-westRegion
Chongqing: Chang’an, Lifan
The supply chain system is in
general level.
Central Region
Anhui: Chery, JAC
Hubei: DF
Relatively complete supply chain;
Dominant enterprise in the market.
Micro EVindustry
Henan, Hebei,Shandong
provinces-Yogomo, etc.
Uneven NEV industry;
More complete low speed EV industry.
Local protectionism is meant to promote local NEV development and protect local manufacturers. Although China’s NEV supply chain continuous to
grow, a regional concentration can be observed. Major NEV players can be clustered into the following groups:

-24-
Review of China’s NEV Policy Environment

-25-
NATIONAL POLICIES
Phase Period Aim Content
Blueprint 2007-2009 Recover economy Came up with blueprint for strategic industry in future 10 years.
TrialTest 2009-2010Support NEV development with
subsidiesInitiated via public service in 13 cities for NEVs promotion.
National
Promotion2011-2013
Control air pollution by stimulating
NEV development
Expand trial cities to the whole country for NEV promotion; launched
national subsidy strategy and tax waiver.
Fast
Development2013-2015
Continuation of NEV development,
along with consideration of size
effect and technology advancement;
subsidies begin to wane
Initiated the tax-free and subsidy waning strategy for the NEV industry.
Post-subsidy 2016-2020
Keep NEV industry development
stable. Policy was replaced by market
which became the dominant factor in
NEV development.
A new subsidy system was developed with the gradual decline of waivers
and subsidies for NEVs. Subsidy strategy turns to be refined in consideration
of manufacturing cost, size effect and technology advancement by 2020.
Market era 2017-presentEstablished market scheme and
encourage technology development
Established “Dual Credit Scheme,” led manufacturers to NEV production;
encouraged technology upgrades by drawing a blueprint for NEV
development.
China’s advocating for NEVS began in 2009 with the “Ten cities, Thousand cars” project. In 2014, the State Council, the Ministry of Science and
Technology, the National Development and Reform Commission, the Ministry of Industry and Information Technology, the Ministry of Transport, and the
State Administration of Taxation introduced policies that promoted the development of the NEV industry.

-26-
NATIONAL NEV MODEL PRODUCTION AND SALE ELIGIBILITY
Manufacture
•《Announcement of on-road automobile
manufacture and product》
•《Issue on corporative investment standard
and record management》
•《Issue on New-established NEV corporation
management》
Sale & Subsidy
•《Category of encouraged
NEV brands 》
•《Category of NEV with tax
waiver on purchase》
• Other local categories
Application of NEV manufacture will be
approved after publicity
Eligible for national NEV subsidy:
404 for passenger vehicles,361 for BEV,43 for PHEV;
Waiver for automobile purchase tax
593 in total,516 for BEV,87 for PHEV
《Beijing pilot NEV on record》《Shanghai NEV record information
table》…
Required to be deleted in the new
regulation released in 2018
Other requirements:《Standard of automobile dynamic battery》《Certificate of fossil fuel consumption》(PHEV required)…
NEVs can be sold in the market once they have met the following national requirements:

-27-
0
1
2
3
4
5
6
7
40 60 80 100 120 140 160 180 200 220 240 260 280 300 320
10*T
housa
nd
Yuan
R/km
Trends of national NEV Subsidy in China
2013 2014 2015 2016 2017
2013PHEV 2014PHEV 2015PHEV 2016PHEV 2017PHEV
SUBSIDY REVIEW
2018
PHEVs BEVs
➢ NEV subsidies in China are being phased out beginning in 2013.
➢ From 2017 onwards, specifications such as battery intensity and energy consumption have been required for subsidy eligibility.

-28-
local NEV strategy (part), refer to <Evaluation of local NEV incentive strategy in China> from ICCT
Local Strategies
Apart from national policies, there are local policies, including economic (subsidy on tax, charging, parking, etc.) and regulatory (local category,
limitation on traffic, etc.). These vary between cities, as this tables indicates.

-29-
Characteristics of Selected NEV Brands

-30-
0
20000
40000
60000
80000
100000
120000
BYD BAIC ROEWE ZD ZOTYE CHERY JMC CHANA JAC GEELY TESLA
Ranking of NEV Sales in 2017
ANALYSIS ON NEV SALES BY BRANDS
➢ NEV brands are categorized by various promotion strategies in different regions with local characteristics.
➢ 2017 sales data for 10 domestic and 1 imported brand were selected for analyzing characteristics of typical NEV branding development in light of
local policies.

-31-
0
5000
10000
15000
20000BYD Brand Shares in Each City in 2017
Tang
Song-EV300
Song-DM
QinEV
Qin
E6
E5
BYD
01000200030004000
Commercial NEV shares
Guangd
ong
33%
Beijing
22%
Shanghai
15%
Zhejiang
8%
Tianjin
4%
Fujian
3% Other
15%
BYD NEV Shares by
Province in 2017
➢ BYD is one of the earliest domestic NEV manufacturers, and has its own battery IP and manufacturing (the company got its start by producing
batteries).
➢ BYD ranked first in sales of domestic passenger cars in 2017, selling 7 models (3 PHEVs and 4 PEVs). 70% of the company’s sales are in Guangdong,
Beijing, and Shanghai.
➢ The company’s PEVs are mainly distributed in Beijing, led by the E5 and Qin EV300; PHEV were more common elsewhere, with the majority of
demand from Shanghai, Shenzhen, and Hangzhou.
➢ 15.7% of BYD's total vehicle sales are for leasing operations, of which 54% are in Shenzhen (e.g. E6).

-32-
0
2000
4000
6000
8000
10000
12000
14000
16000
TOP 10 BAIC NEV Model Shares in 2017
EX260 EX200 EV200 EU260 EU200 EC180
BAIC
010002000300040005000 Commercial Vehicle shares
➢ The distribution of BAIC’s 10 top selling models (>500 units) is illustrated in the below figure.
➢ EC180 was the flagship EV model of BAIC in 2017, accounting for 76.9% of the annual sales of BAIC’s EV segment.
➢ 12% of the total BAIC EV sales were for leased, with EC180 taking up to 73.5% of that total.
➢ EC180 eligibility for subsidies will be dramatically reduced in 2018 under the new subsidy rule.
Shandong, 22%
Beijing, 14%
Shanghai, 8%
Jiangsu
7%
Henan
6%
Fujian
6%
Guangdong
5%
Yunnan, 4%Tianjin, 4%
Zhejiang, 4%
Others, 20%
Other, 32%
BAIC NEV Shares by Province in
2017

-33-
SAIC & ZOTYE
➢ SAIC is also one of the earliest companies to manufacture NEVs.
➢ Roewe is SAIC’s leading NEV series, accounting for 68.5% of sales; 10.7%
of its sales are for rental business - mainly eRX5EV, PHEV models e550,
e950 and ei6.
➢ SAIC Roewe series includes 5 NEV models, of which 4 are PHEVs and 1
is BEV.
➢ eRX5BEV (PEV) is concentrated in the Beijing area, while cities such as
Shenzhen and Hangzhou are dominated by PHEV.
0
5000
10000
15000
20000
25000
30000
Shanghai Shenzhen Beijing Hangzhou Guangzhou Tianjin
TOP 6 Roewe’s Brand Share in 2017
eRX5-EV
eRX5
ei6
e950
e550
0
500
1000
1500
2000
2500
3000
3500
4000
TOP10 Zotye’s Brand Shares in 2017
Zhima
Yun-100
Jiangnan-T11
Z500
V10
E200
➢ Zotye is one of the earliest Chinese enterprises involved in the new
energy automotive industry, with manufacturing bases in various
locations (often through JVs e.g. Ford and Zhidou): Zhejiang, Hunan,
Jiangsu, and Shandong Province.
➢ Zotye plans for NEV to account for 60% of its manufacturing by
2020.
➢ Zotye’s flagship models in 2017 were Cloud (Yun) 100 and E200.
eRX5-EV
44%
eRX5
1%
e550
24%
ei6
17%
e950
14%
Commercial Vehicle

-34-
0
1000
2000
3000
4000
5000
6000
7000
TOP 10 Geely’s Brand Shares in 2017
Non-commercial
Commercial
GEELY & ZD
0
1000
2000
3000
4000
TOP 10 ZD’s Brand Shares in 2017
D2 D1
➢ The flagship brand of Geely in 2017 was Emgrand EV300, which accounted to 99.54% of its total sales in China. In Beijing, the EV300 is mainly
sold as a private vehicle models, while in Hangzhou it is sold for commercial services or taxi businesses.
➢ Caocao Express, a taxi-hailing app with investments by Geely, has used Hangzhou as its headquarter. By Jan. 2018, Caocao Express has
expanded to 17 cities in China, with 12,000+ Emgrand NEVs available through its platform.
➢ D1 and D2 are two flagship models promoted by ZD that entered the national NEV promotion catalogue in December 2017, however,
middle-size cities and towns make up the priority markets for these vehicles.
Emgrand
3%
Panda EV
97%

-35-
0
500
1000
1500
2000
2500
3000
TOP 10 Chery Brand Shares in 2017
Arrizo 7e Arrizo 5e Arrizo 5 QQ3 eQ1 eQ
CHERY & JMEV
➢ JMEV, China’s 7th NEV model to be domestically produced (in
2016), was established in 2015.
➢ A majority of JMEV models are for non-commercial use, and
are A0/A00-class vehicles for towns and small cities.
➢ JMEV is highly dependent on local policy and support,
therefore its sales are concentrated around Nanchang, where
the manufacturer is located.
Non-private
92%
0
1000
2000
3000
4000
5000
6000
7000
8000
9000
TOP 10 JMEV Brand Shares in 2017
E200 E160 E100
➢ Chery NEV, China’s 4th NEV model to be domestically produced, is
rather evenly distributed across different cities, with the eQ and the
eQ1 the most popular models in mid-size cities.
➢ 92% of Chery NEVs (mainly eQ and eQ1) are sold for commercial
purposes. For example, Xi’an (92% of rental) and Shanghai (79% of
time sharing, e.g. EVCARD and Gofun).

-36-
0
1000
2000
3000
4000
5000
6000
7000
8000
TOP 10 JAC Brand Shares in 2017
Heyue EV
iEV7S
iEV6E
iEV5
iEV4
0
1000
2000
3000
4000
5000
6000
TOP 10 CHANA Brand Shares in 2017
EADO Eulove Benben MINI Benben CS15
JAC & CHANA
67%33%
➢ JAC NEVs were sold in 11 provinces/cities in China by 2017.
➢ 67% of JAC NEVs are commercial vehicles sold in Shanghai. The
promoted models were adopted by several car-sharing platforms, such as
Gofun, EVCARD, etc.
➢ The flagship model of JAC in 2017 was iEV6E, accounting for 90% of total
sales, most of which were distributed in Weifang, Shandong province and
Hefei, Anhui province.
➢ CHANA New Energy Automobile produced primarily A0/A00-class NEV
models for private use; its flagship models of CHANA in 2017 were Benben
and Benben mini, mainly sold as private vehicles.
➢ As the headquarter of CHANA Auto, Chongqing’s NEV market was
dominated by CHANA’s models; Shanghai, Hangzhou and Chengdu are small
markets for the brand.
➢ CHANA released its Shangri-La Plan in 2017, aiming for NEV to be 100% of
its production by 2025.

-37-
TESLA
0
500
1000
1500
2000
2500
3000
3500
4000
Shanghai Beijing Shenzhen Hangzhou Guangzhou Chengdu Tianjin Xi'an
TOP 8 Tesla Brand Shares in 2017
Model X
Model S
License Plate Strategy:
•Beijing, Shanghai, Hangzhou, Guangzhou, Shenzhen, Tianjin
NEV Promotion Strategy:
•Beijing: no traffic limit
•Tianjin: no traffic limit
•Hangzhou: no traffic limit
•Wuhan: no traffic limit
•Chengdu: no traffic limit and special rate on parking
•Xi‘an: privilege on bus-only lane and special rate on parking
•Guiyang: no traffic limit
•Nanjing: special rate on parking
➢ Although Tesla is not eligible for national subsidies, it was ranked 12th in sales in 2017.
➢ One of the main reasons for Tesla’s success is its endorsement of local policies: Tesla models can be registered with NEV license plates in cities
where license plate are capped and expensive such as Beijing, Shanghai, and Shenzhen.
➢ By offering Tesla owners a life-long free charging service, there are a lot of benefits for private consumers. Furthermore, Tesla has planned to
match its vehicles with public charging pilots in the near future, echoing China’s recent national requirement.
➢ Tesla is set to start vehicle manufacturing in Shanghai.

-38-
NEV NEW PLAYERS
EV brands Aiways Byton Chehejia Dearcc Leapmotor NIO Qiantu
motor
Singulato Wm motor Xiaopeng Yundo
Base Shangrao,
Jiangxi
province
Changzhou,
Jiangsu
province
Shaoxing,
Zhejiang
province
Jinhua,
Zhejiang
province
Wuhan, Hubei
province
Suzhou,
Jiangsu
province
Tongling,
Anhui
Zhaoqing,
Guangdong
Putian, Fujian
province
Types
SUV、MPV
Middle size
SUV
400-500KM
short distance
& mini NEV
NEV155km Sport car
360km
ES8/EP9
SUV,
Sport car
355km
K50
300km
iS6 SUV
400km
EX5 SUV
600km
G3 SUV 300km SUV
200-300km
Projected
release
2018 2019 2018 2017.11 2019 2018 2018 Released in 2017,
expected in
2018
2018 2017/
2018
Partner CATL, Navinfo,
Starcharge
Battery pack;
Aimed for
sharing
transportation
in future
Affiliated to
LeEco Auto
Zhejiang
Dahua
Technology
co., Ltd.
Partnered with
JAC, GAC,
Changan
Subsidiary
to CH Auto
Subsidiary to
Zhicheauto
Technology
Haima Auto Was co-
founded by
Fujian Motors
Group, etc.
Qualification In process In process In process In process None Manufactured
by JAC
Acquired
qualification of
SUV/MPV by
taking over
Dalian Huanghai
Auto
Listed in national
category of
product,
acquired
qualification of
sales
Acquired
qualification of
NEV
manufacture

-39-
CONCLUSIONS
I. The study develops and employs a novel NEV Market Openness Index, comprised of brand diversity and market penetration, to
assess issues of NEV protectionism and evaluate their impact of China’s NEV commercialization: from 2015 to 2017, NEV
penetration increased in a majority of regions. Of the 23 sample cities selected (with sales >5000 units), the cities with the highest
openness score in 2017 were Tianjin, Hangzhou, and Beijing.The worst cities were Hefei, Nanchang, and Liuzhou.
II. Despite the increase in models, protectionism still strongly exists; Cities to date failed to meet the minimum 30% foreign NEV
brand target set by the national government in 2013; Regional clusters of supply chain in service of the growing NEV industry have
emerged, indicating local NEV market robustness. All protectionism-reducing efforts should include the abolishment of limitations or
barriers to supply chain and after-sales services development.
III. However, in 2018 the new policy of financial subsidies for the promotion and application of new energy vehicles emphasized the
need to “break down local protection and establish a unified market.” As China’s NEV policy landscape is changing, from economic
instruments that encourage production to regulatory and hybrid instruments that favor quality and sales, it is important to ensure
equal market entry is given to all manufacturers for increasing competitiveness, improving NEV quality, and increasing sales.
III. More research into the effects diversity issues have on market competitiveness may be needed to highlight the local benefits of
an open NEV market.

-40-
THANK YOU!
AcknowledgementWe highly appreciate the financial support provided by The Energy Foundation, as well as experts and colleagues who have made
invaluable efforts for this project. We would also like to express our sincere thanks for the invaluable advice and recommendations
provided by the following distinguished experts and colleagues: Prof. Hewu Wang, Prof. Xiaoyuan Wu, Dr. Jianhua Chen, Mr. Kaijun
Qiu, Mr. Hongyang Cui, Ms. Juan Zhang, and Mr. Baijie Zhang.
AuthorsEmma Wang, Feng An, Liping Kang, Maya Ben Dror
Disclaimer
This report is supported by The Energy Foundation. Content shall not be interpreted as the opinion of our sponsors.