Lisinopril LowersCardiac Adrenergic Driveand Increases ,8Receptor Density inthe Failing HumanHeart

The Effects of Failing to Include Hard-to-Reach Respondentsin Longitudinal SurveysDonna H. Odierna, DrPH, MS, and Laura A. Schmidt, PhD, MSW, MPH
Respondents who participate in all phases of
longitudinal studies are likely to differ from
those who are lost to follow-up.1–5 Differential
attrition, or nonrandom loss of respondents,
can lead to bias in a study’s findings by
changing the composition of the sample so
that it no longer represents the study popula-
tion, especially when response rates are low
and there are large differences between re-
sponders and nonresponders.6 Attrition also
reduces sample sizes, contributing to the risk of
type 2 error by decreasing statistical power to
detect effects.7
Although much is written about respondents
who are hard to reach and about ways to
increase response rates in hard-to-reach popu-
lations,2,8–19 an examination of the literature
uncovered few precise descriptions of follow-up
protocols in longitudinal studies.20 Descriptions
were often imprecise, and there was a good deal
of variation in the procedures and amount of
effort used to track populations considered diffi-
cult to reach.10,21–23 Nonetheless, the literature
provides recommendations for improving the
retention of respondents, including limiting sam-
ple sizes to allow for adequate follow-up, offering
incentives to study participants, implementing
tracking procedures with multiple contact
methods and flexible protocols, permitting file
sharing among interviewers, engaging the target
population at the outset of the project, and
allowing an open-ended number of contact at-
tempts.3,5,6,16,19,24
However, many of these methods are costly
and time consuming; researchers in a range of
US survey centers consistently report that
budgetary limitations, more than anything else,
determine how much effort is put into tracking
respondents.20 Moskowitz suggested that attri-
tion bias is endemic in public health research and
may be related to competition for funding and
publication.25 Funding agencies are often reluc-
tant to pay for costly extended follow-up efforts,
and investigators may contribute to the problem
by minimizing study weaknesses that result from
attrition.25
Groves26 wrote that although nonresponse
bias is a problem in survey research, low re-
sponse rates do not necessarily introduce bias.
He found that different estimates within sur-
veys may be subject to greater bias-related
variation than are estimates in surveys with
different response rates. Moreover, he warned
that ‘‘blind pursuit’’ of high response rates may
introduce measurement error and bias, in part
because reluctance to participate might affect
the validity of respondents’ answers. An anal-
ysis that examined this idea showed that
answers from reluctant respondents were
generally consistent with data found in rec-
ords. Although some measurement error was
apparent, overall bias was lower when hard-
to-reach and reluctant respondents were in-
cluded in the sample.27 Methods of increasing
response rates without increasing error rates are
still being developed,28 and it is unclear whether
findings on nonresponse bias in probability
sampling can be applied with confidence to
attrition bias in longitudinal research.
We empirically examined the effects on attri-
tion bias of retaining hard-to-reach respondents
in the Welfare Client Longitudinal Study
(WCLS),29,30 a longitudinal survey that used
particularly intensive tracking procedures. We
compared the characteristics of hard-to-reach
respondents with those who were more easily
found and examined the effects on response rates
andon study results of failure to retain the hard to
reach. To this end, we developed systematic
procedures for empirically identifying hard-to-
reach respondents within theWCLS sample.
To determine if the failure to locate hard-to-
reach respondents would have affected study
conclusions, we performed a nonresponse sim-
ulation based on the 2006 study by Lown et
al.31on violent victimization amongwomen in the
WCLS. That study found that female General
Assistance applicants, mostly single and without
children, were more likely to be victims of vio-
lence than were female Temporary Assistance to
Needy Families (TANF) applicants, who were
mostly young single mothers. These findings led
Lown et al. to conclude that it is misguided to
provide domestic violence prevention programs
nearly exclusively for women receiving TANF
and thus ignore the even more disenfranchised
Objectives. We sought to determine whether failure to locate hard-to-
reach respondents in longitudinal studies causes biased and inaccurate study
results.
Methods. We performed a nonresponse simulation in a survey of 498 low-
income women who received cash aid in a California county. Our simulation was
based on a previously published analysis that found that women without children
who applied for General Assistance experienced more violence than did women
with children who applied for Temporary Assistance to Needy Families. We
compared hard-to-reach respondents whom we reinterviewed only after ex-
tended follow-up effort 12 months after baseline with other respondents. We
then removed these hard-to-reach respondents from our analysis.
Results. Other than having a greater prevalence of substance dependence
(14% vs 6%), there were no significant differences between hard- and easy-to-
reach respondents. However, excluding the hard to reach would have decreased
response rates from 89% to 71% and nullified the findings, a result that did not
stem primarily from reduced statistical power.
Conclusions. The effects of failure to retain hard-to-reach respondents are not
predicable based on respondent characteristics. Retention of these respondents
should be a priority in public health research. (Am J Public Health. 2009;99:
1515–1521. doi:10.2105/AJPH.2007.111138)
RESEARCH AND PRACTICE
August 2009, Vol 99, No. 8 | American Journal of Public Health Odierna and Schmidt | Peer Reviewed | Research and Practice | 1515
women in poverty who are without children and
therefore not eligible for TANF.
METHODS
The WCLS provides an unusual opportunity
to examine the effects of extended case-tracking
efforts on attrition in a marginalized, low-income
population. The study population contained
many individuals who are generally considered
to be difficult to retain in longitudinal research,
including the homeless and unstably housed
and individuals with extremely low incomes,
chronic unemployment, and substance use
disorders.3–6,10,32,33
We used extended tracking efforts and suc-
cessfully located 439 of the 498 women for
follow-up interviews; this yielded a weighted
response rate of 89% at 1 year postbaseline.
The site is a large, relatively affluent California
countywithwide economic, geographic, and ethnic
diversity.34 Cash aid in the county is provided via
TANF, the federally funded welfare program for
poor families, and General Assistance, the
county’s locally funded aid program of last resort
for qualified adults who do not have custody of
minor children. Comprehensive descriptions and
findings of the WCLS may be found else-
where.29,29–36This studyuseddata from2waves
of the WCLS. Our analysis focused on variables
from thebaseline interviewandwas supplemented
by additional information fromwave 2,12months
later, that we used to identify respondents as
‘‘easily found,’’ ‘‘lost,’’ or ‘‘hard to reach.’’
Data Collection Procedures
In the summer of 2001, WCLS researchers
approached 1786 male and female applicants
for cash aid and successfully interviewed a
representative sample of adults (n=1510),
yielding a baseline response rate of 85%. For
the main survey cohort, the researchers ran-
domly selected applicants who received aid,
intentionally oversampling problem drinkers
and frequent drug users. They reinterviewed
respondents at the 1-year anniversary of the
baseline survey. Following Lown et al., we
focused on female WCLS respondents. The
women in our sample (N=498) included 108
General Assistance recipients and 390 TANF
recipients. One woman died before the second
wave of data collection was complete. She was
dropped from the analysis.
WCLS contracted a fieldwork agency to in-
terview respondents, with the expectation that all
cases would remain open until the respondents
were found. This agency returned cases with no
remaining viable leads to WCLS scientific staff
for further tracking. A survey tracker with private
investigator training was hired to locate the most
difficult cases, a strategy that is costly and un-
usual in public health research.19 Tracking con-
sisted of multiple mailings, telephone calls to
respondents and contacts, searches of public
databases, home visits, and visits to parks, street
corners, shelters, check cashing stores, soup
kitchens, jails, drug treatment programs, and
other promising sites. Interviewers shared files; at
times, more than 1 interviewer simultaneously
tracked a respondent. We did not place any
predetermined limits on the number of contact
attempts. As a result, respondents received up to
12 letters, 57 calls, and 28 visits before either we
found them or we ended the search. Cases
remained open for an average of 55 days.
Continuing respondents received cash incentives
of $40 to $50 at each wave of data collection.
Measures
To empirically identify individuals who were
hard to reach, we coded and analyzed field note
files maintained by the study team throughout
tracking for the 1-year follow-up. These files
contained complete logs of all contact attempts
for every respondent in the sample. Multiple
raters noted the details of each contact attempt.
We entered the data into a spreadsheet program
(Microsoft Excel 2000; Microsoft Corp, Red-
mond, WA), cleaned the data, and concatenated
them with the survey data files, matching by
respondent identification number. To assess
interrater reliability, a subsample of 94 files was
test-rated by 4 different raters. The raters agreed
on the final classification of hard-to-reach status
in 93 of the 94 cases.
Interviews with fieldwork experts in US
survey research centers20 and descriptions
of extended effort in the literature1,3,16,19,37 in-
formed our definition of ‘‘hard to reach.’’ Because
interviewers shared files and there was no strict
order for the methods used to track respondents,
we did not attempt to evaluate each tracking
method separately. Instead, we used a summary
measure. Respondents were classified as hard to
reach if extended effort was needed to contact
them—that is, if any of the following conditions
were met: (1) more than 14 telephone calls were
made to the respondent or her designated con-
tacts, (2) more than 3 residential visits or 1 or
more nonresidential visit was made, (3) more
than 5 letters were mailed to the respondent and
alternative contacts, (4) the duration of the search
lasted over 60 days, or (5) the fieldwork agency
turned the case back to the WCLS scientific staff.
We classified respondents who were contacted
without extended effort as easily found.
The outcome variable was participation sta-
tus 12 months postbaseline (i.e., easily found,
hard to reach, or lost). Of the 498 respondents
in this analysis, we classified 339 as easily
found and 100 as hard to reach. We classified
the 59 respondents the interviewers were un-
able to reach as lost. Because we were inter-
ested in researchers’ ability to find respondents
rather than in respondents’ willingness to be
interviewed once found, we considered 4 re-
spondents who were contacted but explicitly
refused to be interviewed to be successfully
located for the purposes of our study. Of these,
3 were easily found, and 1 was hard to reach.
Independent variables included race/
ethnicity, age, education, and marital or cohab-
itation status, social isolation (no close friends
or family members), current disability, episodes
of homelessness in the past year, long-term (>1
year) unemployment, and family income under
$10000. Other measures included program
type (General Assistance or TANF), self-
reported health status (4 categories collapsed
into 2: poor or fair, and good or excellent), and
previously used self-reported measures35,38–40
of past-year heavy drug use, problem drinking,
and substance dependence. In addition, the
nonresponse simulation comprised 8 summary
measures of violent victimization identical to
those developed by Lown et al. for their study.31
Data Analysis
We began by using the c2 test of associa-
tion to compare the baseline characteristics of
hard-to-reach and easily found respondents.
Next, we examined crude response rates in the
full sample and various subgroups, including
and excluding the hard-to-reach respondents.
We then performed a simulation based on the
study on women and violence of Lown et al. In
this simulation, we sequentially examined the
effect on findings from the baseline responses
of a cohort when excluding respondents who
RESEARCH AND PRACTICE
1516 | Research and Practice | Peer Reviewed | Odierna and Schmidt American Journal of Public Health | August 2009, Vol 99, No. 8

were lost at12months and also those who were
hard to reach at 12 months from the analysis.
In the simulation, we analyzed exposure to
violence among General Assistance and TANF
recipients through nested comparisons of (1)
the full baseline cohort sample of all aid recip-
ients, (2) the baseline cohort sample excluding
those lost at 12 months, and (3) the baseline
cohort sample excluding those lost and those
defined as hard to reach at 12 months. In
keeping with Lown et al., we used the c2 test to
compare General Assistance and TANF recip-
ients in terms of baseline variables. The final
steps in the simulation replicated the logistic
regression analyses of Lown et al. in the 3
nested comparisons.
Lown et al. examined associations among
variables in the WCLS applicant sample. Be-
cause we made no attempt to track applicants,
our simulation was limited to those applicants
who became aid recipients, participated in the
longitudinal study, and were tracked over time.
We analyzed baseline survey responses of aid
recipients in the cohort study for 2 reasons.
First, we wanted to include data from lost re-
spondents in our simulation; we interviewed
these respondents at baseline but not at 12
months. Second, Lown et al. used baseline data,
and we wanted our simulation to follow their
methods as closely as possible to approximate
the effect of an extended follow-up effort on
actual study results.
We applied poststratification weights to cor-
rect for sampling design (i.e., oversampling of
problem drinkers and drug users in TANF and
time spent recruiting participants in different
programs, locations, and offices) and baseline
nonresponse. Because our analysis focuses on
response status at wave 2, we did not weight for
nonresponse at 12 months. We considered
results significant if P was less than .05. We
conducted statistical analyses with the survey
commands in Stata versions 8 and 9 (StataCorp
LP, College Station, TX). These commands im-
plement a design-based F statistic to assess
associations between categorical variables.
RESULTS
Descriptive Analysis of Effects of
Extended Tracking
We expected to find that retaining hard-to-
reach respondents would substantially improve
response rates. Table 1 shows that excluding
the hard-to-reach group would have lowered
the overall 1-year follow-up response rate from
89% to 71% and decreased response rates in
some subgroups to well under 70%. Without
the extended tracking, it appears that the
WCLS would have failed to retain substantial
numbers of respondents who were African
American, in poor or fair health, homeless, or
heavy substance users or who had very low
incomes or were victims of violence.
Comparison of Hard-to-Reach and Easily
Found Respondents
We hypothesized that bivariate comparisons
would reveal many significant differences be-
tween respondents who were easily found and
those who were found but hard to reach at 12
TABLE 1—Response Rate Comparisons in the Full Sample and Subsamples of Female Cash Aid
Recipients After 12 Months Postbaseline, Including and Excluding Respondents Who Were
Hard to Reach for Reinterview: Welfare Client Longitudinal Study, California, 2001–2002
Baseline Characteristic
Baseline
No.
Achieved Response
Rate Including
Hard-to-Reach
Respondents, % (No.)
Estimated Response
Rate Excluding
Hard-to-Reach
Respondents, % (No.)
Full sample 498 89.4 (439) 70.5 (339)
Race
White 153 89.6 (137) 71.5 (108)
Black 196 88.6 (171) 67.7 (129)
Hispanic 83 90.3 (71) 74.5 (54)
Other 66 90.5 (60) 71.0 (48)
Age, y
18–24 153 93.9 (142) 71.3 (104)
25–34 170 84.3 (142) 71.4 (115)
‡35 172 90.9 (152) 68.8 (118)
Program type
General Assistance 108 83.1 (90) 64.6 (69)
Temporary Assistance for Needy Families 390 89.9 (349) 70.9 (270)
Health status
Poor/fair 173 87.5 (149) 67.2 (115)
Good/excellent 325 90.2 (290) 71.9 (224)
Married or cohabiting
Yes 88 91.2 (71) 75.4 (64)
No 410 89.0 (368) 69.2 (275)
Custodial parent
Yes 380 89.5 (336) 70.5 (259)
No 118 89.3 (103) 70.9 (80)
High school dropout 168 89.9 (153) 67.9 (115)
Severe housing instability 130 83.7 (108) 67.8 (83)
Family income<$10000 221 87.8 (195) 69.0 (148)
Disability 115 87.0 (104) 70.1 (86)
Unemployed>1 y 171 84.5 (144) 65.4 (114)
Problem drinking 82 80.7 (67) 56.1 (47)
Drug use‡1 time/wk 134 87.8 (117) 66.2 (88)
Substance dependence 81 80.5 (63) 48.1 (41)
Violent victimization (any) 156 90.9 (137) 75.1 (105)
Violent victimization (partner) 137 92.6 (121) 75.5 (92)
Note. Percentages are weighted, numbers are unweighted.
RESEARCH AND PRACTICE
August 2009, Vol 99, No. 8 | American Journal of Public Health Odierna and Schmidt | Peer Reviewed | Research and Practice | 1517
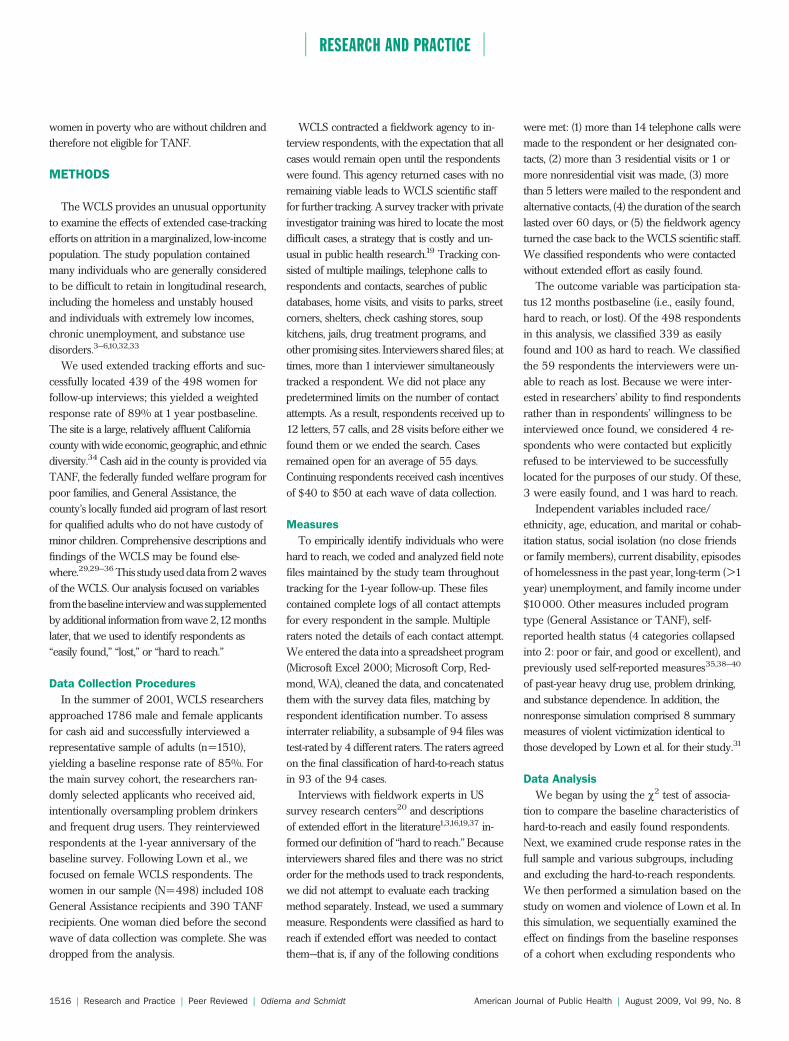
months. However, as shown in Table 2, the
only characteristic that was significantly asso-
ciated with being hard to reach was substance
dependence. There were no significant differ-
ences in race/ethnicity, age, education, marital
status, parental status, income, employment,
disability, housing stability, program type,
health status, problem drinking, frequent drug
use, or violent victimization.
Nonresponse Simulation Analysis
To simulate the effects of excluding hard-
to-reach respondents on the findings of
Lown et al. (i.e., women who applied for
General Assistance had more significant risk
factors for violent victimization—problem
drinking, divorce or separation, poverty, or
homelessness—than did women who applied
for TANF),31we compared sociodemographic,
health, and behavioral characteristics of the
General Assistance and TANF subsamples with
and without the hard-to-reach respondents. Be-
cause, as in the study by Lown et al., significant
differences between the General Assistance and
TANF groups remained even when the hard-to-
reach women were excluded from the analysis
(data not shown), this initial bivariate comparison
suggested that excluding the hard to reach would
not have a measurable impact on overall results.
However, as Table 3 illustrates, biasing effects
emerged when we compared violent victimiza-
tion among General Assistance and TANF
recipients.
Odds ratios and prevalence estimates in all
8 categories of violence in the General Assis-
tance and TANF groups were similar for the
full baseline cohort and for all recipients who
were found at the 12-month follow-up. How-
ever, excluding the hard-to-reach women from
the analysis produced substantially different
point estimates; odds ratios were biased down-
ward in 7 of 8 categories. In 2 of the categories,
confidence intervals widened, but differences
remained significant; in 6 of the categories,
between-group differences decreased below
the point of statistical significance; and in 5 of
the categories, confidence intervals narrowed.
This suggests that, in the absence of the ex-
tended tracking efforts, we would have seen
associations between violent victimization and
program type in only 2, rather than all 8, cate-
gories of violence and in no category of partner
violence.
DISCUSSION
In a 1996 analysis of longitudinal data on
victimized low-income women, Sullivan et al.
concluded that their study’s commitment to
sample retention and extended tracking efforts
was a key factor in achieving high response
rates and that it was worth the extra time and
money spent.1Our study here provides empirical
support for this conjecture by demonstrating that
extended tracking effort can have a significant
impact on increasing response rates and reducing
bias in findings on violent victimization among
low-income women.
Our investigations revealed that retaining
hard-to-reach respondents increased response
rates in the overall sample from 71% to 89%
and substantially raised response rates for im-
portant subgroups. More importantly, exclud-
ing hard-to-reach respondents would have
biased our estimates, leading to erroneous
conclusions. Although attrition-related reduc-
tions in sample sizes can increase the likelihood
of type 2 errors, we found that this did not have
a substantial effect on our findings. Overall,
excluding the lost and hard-to-reach individ-
uals decreased the prevalence of violence in
the General Assistance group and increased it
in the TANF group. As a result, in most of the
TABLE 2—Weighted Characteristics of Female Cash Aid Recipients Who Were
Easily Found or Hard to Reach for Reinterview, 12 Months Postbaseline:
Welfare Client Longitudinal Study, California, 2001–2002
Baseline Characteristic
Easily Found
(n = 339), No.
Hard to Reach
(n =100), No.
Easy vs Hard
Difference, P
Race .814
White 29.7 28.1
Black 37.1 42.6
Hispanic 19.7 15.6
Other 13.3 13.7
Age, y .177
18–24 33.2 39.5
25–34 38.1 25.9
‡35 28.7 34.6
Program type .808
General Assistance 5.7 6.1
Temporary Assistance for Needy Families 94.3 93.9
Health status .563
Poor/fair 30.2 26.8
Good/excellent 69.8 73.2
Married or cohabiting 23.5 18.4 .379
Custodial parent 89.0 88.7 .919
High school dropout 29.5 35.6 .325
Severe housing instability 19.0 16.6 .628
Family income<$10000 37.3 37.9 .929
Disability 20.9 17.3 .517
Unemployed>1 y 24.3 26.5 .704
Problem drinking 5.2 8.5 .086
Drug use‡1 time/wk 10.3 12.7 .364
Substance dependence 5.9 14.3 .006
Violent victimization (any) 28.3 22.3 .249
Violent victimization (partner) 21.0 25.0 .476
Note. Percentages are weighted; numbers are unweighted.
RESEARCH AND PRACTICE
1518 | Research and Practice | Peer Reviewed | Odierna and Schmidt American Journal of Public Health | August 2009, Vol 99, No. 8

categories of violence we looked at, the differ-
ence expressed in odds ratios was substantially
smaller.
We would have missed the evidence that
violence prevention services for the women
without children receiving General Assistance
are needed even more than are those currently
available to women with children receiving
TANF. This provocative finding suggests that
failure to retain hard-to-reach respondents can
bias study results even when simple bivariate
comparisons yield few significant differences
between easy- and hard-to-reach respondents.
The lack of consistency in results across 2
different phases of our analysis suggests that
comparing respondents to nonrespondents on
basic sociodemographic and health-related cri-
teria may be insufficient for dismissing con-
cerns about potential bias resulting from the
attrition of hard-to-reach respondents.
Although we found few differences between
women who were hard to reach and those who
were easily found, substance dependence at
baseline was significantly associated with being
hard to reach at 12 months. Among poor and
marginalized women, it is likely that substance
dependence adds to an already heavy burden
of disadvantage and stigma41–43 and may con-
tribute to both higher rates of violence and
difficulties in locating substance-dependent
women for reinterview. Thus, substance depen-
dence may provide an example of a type of
variable that contributes to attrition bias by in-
creasing the propensity for nonresponse while
affecting outcomes of interest.26
Strengths and Limitations
Our access to fieldwork files allowed us to
systematically document the extent of tracking
efforts for all study participants. Respondents
are usually defined a priori as ‘‘hard to reach’’
by virtue of their sociodemographic and life-
style characteristics. In this study, we used in-
terviewers’ field notes to empirically examine a
posteriori the characteristics of demonstrably
hard-to-reach respondents. However, the files
were working documents that WCLS scientific
staff and several interviewers used, sometimes
simultaneously, to track respondents. The
resulting complexity puts meaningful cost esti-
mations beyond the scope of this study. Future
studies of tracking procedures and level of
effort could be designed to provide data that
support cost effectiveness analyses.
Other limitations apply. The relatively nar-
row socioeconomic distribution of the WCLS
sample provided us with an opportunity for
detailed examination of a population that in-
cludes a large proportion of hard-to-reach
study participants. Yet findings for the exclu-
sively female welfare sample are not necessar-
ily generalizable to other poor populations in
other locales or to men living in poverty. We
included only baseline survey responses in our
simulation analysis, which sorted respondents
TABLE 3—Prevalence and Crude Odds Ratios of Violent Victimization in 3 Nested Samples
of Female General Assistance and TANF Recipients: Welfare Client Longitudinal Study,
California, 2001–2002
General Assistance,
No. or %
TANF,
No. or %
General Assistance and TANF
Difference, OR (95% CI)
Full cohort of cash aid recipients (N =498) 108 390
Cohort excluding lost recipients (n = 439) 90 349
Cohort excluding lost and hard-to-reach recipients (n = 339) 69 270
Type of Violence
Any violence, partner or nonpartner
Full cohort of cash aid recipients 41.7 25.6 2.1** (1.3, 3.3)
Cohort excluding lost recipients 41.0 26.2 2.0** (1.2, 3.2)
Cohort excluding lost and hard-to-reach recipients 36.0 28.3 1.5 (0.8, 2.6)
Severe violence, partner or nonpartner
Full cohort of cash aid recipients 33.5 14.9 2.9*** (1.7, 4.8)
Cohort excluding lost recipients 33.5 14.8 2.9*** (1.7, 5.0)
Cohort excluding lost and hard-to-reach recipients 30.5 15.7 2.4** (1.2, 4.5)
Physical assault, partner or nonpartner
Full cohort of cash aid recipients 38.2 24.4 1.9** (1.2, 3.1)
Cohort excluding lost recipients 36.8 24.8 1.8* (1.1, 2.9)
Cohort excluding lost and hard-to-reach recipients 33.3 26.3 1.3 (0.8, 2.6)
Sexual Assault, partner or nonpartner
Full cohort of cash aid recipients 11.6 4.1 3.1** (1.2, 4.0)
Cohort excluding lost recipients 11.9 4.4 3.0** (1.3, 6.8)
Cohort excluding lost and hard-to-reach recipients 12.5 4.2 3.3** (1.3, 8.5)
Partner Violence
Full cohort of cash aid recipients 37.6 22.4 2.1** (1.3, 3.3)
Cohort excluding lost recipients 35.6 23.4 1.8* (1.1, 3.1)
Cohort excluding lost and hard-to-reach recipients 30.2 25.0 1.3 (0.7, 2.5)
Physical Assault by Partner
Full cohort of cash aid recipients 35.3 21.7 2.0* (1.2, 3.2)
Cohort excluding lost recipients 33.3 22.6 1.7* (1.0, 2.9)
Cohort excluding lost and hard-to-reach recipients 28.9 23.6 1.3 (0.7, 2.9)
Moderate Physical Assault by Partner
Full cohort of cash aid recipients 34.6 21.3 1.9** (1.2, 3.2)
Cohort excluding lost recipients 32.0 22.2 1.6 (1.0, 3.9)
Cohort excluding lost and hard-to-reach recipients 28.8 23.3 1.3 (0.7, 2.5)
Severe Physical Assault by Partner
Full cohort of cash aid recipients 19.8 9.1 2.7** (1.4, 5.1)
Cohort excluding lost recipients 17.8 8.4 2.3* (1.2, 4.7)
Cohort excluding lost and hard-to-reach recipients 14.3 8.2 1.9 (0.8, 4.4)
Note. TANF = Temporary Assistance for Needy Families; CI = confidence interval; OR =odds ratio. Percentages are weighted,numbers are unweighted.*P< .05; **P< .01; ***P< .001.
RESEARCH AND PRACTICE
August 2009, Vol 99, No. 8 | American Journal of Public Health Odierna and Schmidt | Peer Reviewed | Research and Practice | 1519

by their participation status in the second wave
of data collection 12 months later. Differences
that exist at baseline may increase or decrease
over time. In addition, because we used only
self-reported responses and did not compare
them with medical or administrative records,
we are unable to address concerns about the
quality and validity of data provided by re-
spondents who were hard to reach.26
Future research should examine the effects of
retaining hard-to-reach respondents in general
population studies and in changes across multi-
ple waves of longitudinal data collection. Finally,
we looked at only the likely effects of failure to
retain hard-to-reach respondents on results for
violent victimization. Estimates for some varia-
bles may be more vulnerable to nonresponse
bias than others in the same survey.26,27
Implications
Attrition of hard-to-reach respondents can
be described as a form of exclusion, a separa-
tion of study respondents from research itself,
from the attention of service providers and
policymakers who use the results of research to
inform their decision-making processes, and
from social benefits that may arise as research
is translated into policy and practice.
Our findings underscore the importance of
retaining hard-to-reach respondents for accu-
racy and reliability in public health research.
Some investigators suggest the risk of attrition
bias may be reduced by oversampling respon-
dents with characteristics linked to being hard
to reach,4 by making postsurvey adjustments
based on carefully chosen auxiliary variables,26
or by including survey questions that make it
possible to identify respondents who are likely to
be hard to reach and then plan for the extended
tracking of these respondents.2 However, these
techniques may be of questionable value in
studies in which few measurable characteristics
differentiate hard-to-reach respondents from
others in the population.
The findings of this study suggest that even
when demographic and health-related differ-
ences appear to be small, the failure to retain
hard-to-reach respondents can substantially
affect study findings. Therefore, at the outset
of data collection, it may be difficult, perhaps
impossible, to predict if such failure would
introduce bias and affect the accuracy of the
final results. We have also shown that extended
follow-up efforts and protocols tailored for the
study population as a whole can be an important
factor in increasing response rates and limiting
bias in studies of poor populations such as this.
Groves warns that the risk of producing biased
and inaccurate results increases as thedifferences
between responders and non-responders
become larger6; in studies of more economically
and socially diverse populations, the effects of
retaininghard-to-reach respondentsmayprove to
be even more pronounced than those reported
here.
The results of this study suggest that attain-
ing high response rates should be a high
priority for public health researchers and their
funding agencies. Moreover, the findings pro-
vide justification for developing standard pro-
cedures for extended follow-up efforts to retain
hard-to-reach respondents in low-income and
marginalized populations. To the extent that
future research can empirically identify hard-
to-reach groups in a wider range of study
populations, researchers will be able to culti-
vate more-efficient strategies for tracking these
groups and for studying the extent to which
extended tracking effort affects response rates
and bias in results. Ultimately, such studies will
allow researchers to develop realistic standards
for careful, extended follow-up in key target
populations and in general population studies.
Only then will we be in a position to advocate
sufficient resources for including and retaining
members of hard-to-reach groups in all public
health research. j
About the AuthorsDonna H. Odierna is with the Philip R. Lee Institute forHealth Policy Studies at the University of California, SanFrancisco. At the time of the study, she was a doctoralcandidate at the University of California, Berkeley, and apredoctoral fellow at the Alcohol Research Group, Berkeley.Laura A. Schmidt is with the Philip R. Lee Institute forHealth Policy Studies and the Department of Anthropology,
History, and Social Medicine, School of Medicine, at theUniversity of California, San Francisco.Correspondence should be sent to Donna H. Odierna,
Department of Clinical Pharmacy, University of California,San Francisco, 3333 California St, Suite 420, SanFrancisco, CA 94118 (e-mail: [email protected] or
[email protected]). Reprints can be ordered at http://www.ajph.org by clicking on the ‘‘Reprints/Eprints’’ link.This article was accepted April 18, 2008.
ContributorsD.H. Odierna developed the concept for the article,
carried out the statistical analysis, and wrote versions of
the article. L.A. Schmidt contributed substantially to the
overall themes, writing, and editing at each stage; she
also originated the Welfare Client Longitudinal Study
(WCLS) and supervised all aspects of its implementation.
AcknowledgmentsWe give special thanks to E. Anne Lown for substantial
contributions to this study and for access to the summary
variables she created for her study. The authors are
grateful to Laurie Jacobs, Denise M. Zabkiewicz, James
Wiley, and theWCLS team for substantial assistance with
development of the article, to Lisa R. Hirsch for devel-
opmental and copy editing, and to Kim L. Serkes and
Matthew Zivot for research assistance. D.H. Odierna also
wishes to thank the chair of her dissertation committee,
William A. Satariano, and extends special thanks to
Maureen Lahiff for statistical and conceptual assistance
and to S. Leonard Syme for guidance through all phases
of the project. Both authors extend sincere thanks to their
colleagues in the Philip R. Lee Institute for Health Policy
Studies writing seminar at University of California, San
Francisco.
Human Participant ProtectionThe survey design, survey instrument, and consent doc-
uments were approved by the institutional review boards
at the University of California, San Francisco, and the
Public Health Institute. Participants were protected by a
federal Certificate of Confidentiality from the US De-
partment of Health and Human Services. This secondary
analysis was conducted after appropriate review and
exemption by the institutional review board at the Uni-
versity of California, Berkeley.
References1. Sullivan CM, Rumptz M, Campbell R, Eby K,
Davidson II WS. Retaining participants in longitudinal
community research: a comprehensive protocol. J ApplBehav Sci. 1996;32:262–276.
2. Lepkowski JM, Couer MP. Nonresponse in the
second wave of longitudinal household surveys. In:
Groves RM, Dillman D, Eltinge J, Little RJA, eds. Survey
Nonresponse. New York, NY: John Wiley & Sons; 2002:
259–272.
3. Mainieri T, Danziger S. Designing Surveys of WelfarePopulations: Report From the Workshop on Designing
Surveys of Welfare Recipients, March 15–16, 2001. AnnArbor, MI: Center on Poverty, Risk, and Mental Health,
Population Studies Center, Institute for Social Research,
University of Michigan; February 26, 2002. Report
number 02–509. Available at http://www.fordschool.
umich.edu/research/poverty/pdf/surveys-aspe-workshop2.
pdf. Accessed April 19, 2008.
4. Fitzgerald J, Gottschalk P, Moffit R. An analysis of
sample attrition in panel data: the Michigan Study of
Income Dynamics. J Hum Resources. 1998;33:251–299.
5. Hochstim JR. A critical comparison of three strate-
gies of collecting data from households. J Am Stat Assoc.1967;62:976–989.
6. Groves RM, Couper MP. Designing surveys ac-
knowledging nonresponse. In: Ver Ploeg M, Moffit RA,
Citro CF, eds. Studies of Welfare Populations: Data Col-lection and Research Issues. Washington, DC: National
Academies Press; 2001:13–54.
7. Jewell N. Statistics for Epidemiology. New York, NY:
Chapman & Hall; 2003.
RESEARCH AND PRACTICE
1520 | Research and Practice | Peer Reviewed | Odierna and Schmidt American Journal of Public Health | August 2009, Vol 99, No. 8

8. Zabel JE. An analysis of attrition in the Panel Study
of Income Dynamics and the Survey of Income and
Program Participation with an application to a model of
labor market behavior. J Hum Resources. 1998;33:479–507.
9. Thornberry TP, Bjerregaard B, Miles W. The con-
sequences of respondent attrition in panel studies: a
simulation based on the Rochester Youth Development
Study. J Quantitative Criminol. 1993;9:127–158.
10. Saranga Cohen A, Patrick DC, Shern D. Minimizing
attrition in longitudinal studies of special populations: an
integrated management approach. Eval Program Plann.1996;19:309–319.
11. Robles N, Flaherty DG, Day NL. Retention of
resistant subjects in longitudinal studies: description and
procedures. Am J Drug Alcohol Abuse. 1994;20:87–100.
12. Meyers K, Webb A, Frantz J, Randall M. What does
it take to retain substance-abusing adolescents in research
protocols? Delineation of effort required, strategies un-
dertaken, costs incurred, and 6-month post-treatment
differences by retention difficulty. Drug Alcohol Depend.2003;69:73–85.
13. Hough RL, Tarke H, Renker V, Shields P, Glatstein J.
Recruitment and retention of homeless mentally ill par-
ticipants in research. J Consult Clin Psychol. 1996;64:881–891.
14. Hudson SV, Leventhal H, Contrada R, Leventhal
EA, Brownlee S. Predicting retention for older African
Americans in a community study and a clinical study:
does anything work? J Ment Health Aging. 2000;6:67–78.
15. Hansten ML, Downey L, Rosengren DB, Donovan
DM. Relationship between follow-up rates and treatment
outcomes in substance abuse research: more is better but
when is ‘‘enough’’ enough? Addiction. 2000;95:1403–
1416.
16. Gallagher PM, Fowler Jr. FJ, Stringfellow VL. The
nature of nonresponse in a Medicaid survey: causes and
consequences. J Off Stat. 2005;21:73–87.
17. Cottler LB, Zipp JF, Robbins LN, Spitznagel EL.
Difficult-to-recruit respondents and their effect on prev-
alence in an epidemiologic survey. Am J Epidemiol. 1987;125:329–339.
18. Pape A. How Does Attrition Affect the Women’sEmployment Study Data? Available at: http://www.
fordschool.umich.edu/research/pdf/WES_Attrition-
oct-edit.pdf. Accessed April 19, 2008.
19. Anglin MD, Danila B, Ryan T, Mantius K. Staying inTouch: A Fieldwork Manual of Tracking Procedures forLocating Substance Abusers for Follow-Up Studies. Rock-ville, MD: National Evaluation Data and Technical As-
sistance Center, Substance Abuse and Mental Health
Services Administration. January 1996. NEEDTAC
Contract No. 270-94-0001.
20. Odierna DH. Learning to See the Invisible: Margin-
alization, Attrition, and Health Inequalities in a Study ofWelfare and Substance Use [dissertation]. Berkeley:School of Public Health, University of California; 2006.
21. Hauser RM. Survey response in the long run: the
Wisconsin Longitudinal Study. Field Methods. 2005;17:3–29.
22. Atrostic BK, Bates N, Burt G, Silberstein A. Nonre-
sponse in US government household surveys: consistent
measures, recent trends, and new insights. J Off Stat.2001;17:209–226.
23. Epstein JA, Botvin G. Methods to decrease attrition
in longitudinal studies with adolescents. Psychol Rep.2000;87:139–140.
24. Weiss C, Bailar BA. High response rates for in-
person surveys. In: Ver Ploeg M, Moffit R, Citro CF, eds.
Studies of Welfare Populations: Data Collection and Re-search Issues. Washington, DC: National Academies
Press; 2001:86–104.
25. Moskowitz JM. Why reports of outcome evaluations
are often biased or uninterpretable. Eval Program Plann.1993;16:1–9.
26. Groves RM. Nonresponse rates and nonresponse
bias in household surveys. Public Opin Q. 2006;70:646–675.
27. Olson K. Survey participation, nonresponse bias,
measurement error bias, and total bias. Public Opin Q.2006;70:737–758.
28. Singer E. Nonresponse bias in household surveys.
Public Opin Q. 2006;70:637–645.
29. Schmidt L, Wiley J, Dohan D, Zabkiewicz D, Jacobs
L, Zivot M. Changing patterns of addiction and public aid
receipt: tracking the unintended consequences of welfare
reform policy. J Health Polit Policy Law. 2006;31:945–
980.
30. Schmidt L, Zabkiewicz D, Jacobs L, Wiley J. Sub-
stance abuse and employment among welfare mothers:
from welfare to work and back again? Subst Use Misuse.
2007;42:1069–1087.
31. Lown EA, Schmidt L, Wiley J. Interpersonal vio-
lence among women seeking welfare: unraveling lives.
Am J Public Health. 2006;96:1409–1415.
32. BootsMiller BJ, Ribisi KM, Mowbray CT, Davidson
WS, Walton MA, Herman SE. Methods of ensuring high
follow-up rates: lessons from a longitudinal study of dual
diagnosed participants. Subst Use Misuse. 1998;33:2665–2685.
33. Bucholz KK, Shayka JJ, Marion SL, Lewis CE, Pribor
EF, Rubio DM. Is a history of alcohol problems or of
psychiatric disorders associated with attrition at 11-year
follow-up? Ann Epidmiol. 1996;6:228–234.
34. State of California Franchise Tax Board. State
reports on median income for 2001. Available at: http://
www.ftb.ca.gov/aboutFTB/press/Archive/2003/
03_22.html. Accessed April 19, 2008.
35. Schmidt L, Weisner C, Wiley J. Substance abuse and
the course of welfare dependency. Am J Public Health.1998;88:1616–1622.
36. Schmidt L, Dohan D, Wiley J, Zabkiewicz D. Addic-
tion and welfare dependency: interpreting the connec-
tion. Soc Probl. 2002;49:221–241.
37. Hartsough CS, Babinski LM, Lambert NM. Tracking
procedures and attrition containment in a long term
follow up of a community based ADHD sample. J ChildPsychol Psychiatry. 1996;37:705–713.
38. Weisner C, Schmidt L. Alcohol and drug problems
among diverse health and social service populations.Am J
Public Health. 1993;83:824–829.
39. Wilsnack S, Klassen A, Schur B, Wilsnack R.
Predicting onset and chronicity of women’s problem
drinking: a five-year longitudinal analysis. Am J PublicHealth. 1991;81:305–318.
40. Weisner C, Schmidt L. A Framework for HealthServices Research on Access and Utilization of Drug Abuse
Services. Washington, DC: National Institute on Drug
Abuse; 1995.
41. Fillmore KM. When angels fall. Women’s drinking
as cultural preoccupation, and as a reality. In: Willsnack
SC, Beckman LJ, eds. Alcohol Problems in Women. New
York, NY: The Guilford Press; 1984:7–37.
42. Reese E. The Backlash Against Welfare Mothers, Pastand Present. Berkeley: University of California Press;
2005.
43. Katz MB. The Undeserving Poor. New York, NY:
Pantheon Books; 1989.
RESEARCH AND PRACTICE
August 2009, Vol 99, No. 8 | American Journal of Public Health Odierna and Schmidt | Peer Reviewed | Research and Practice | 1521
Copyright © 2022 FDOKUMEN