Is sex-biased maternal care limited by total maternal expenditure in polygynous ungulates
Upload
khangminh22Category
view
2download
0
HAL Id: halshs-00727618https://halshs.archives-ouvertes.fr/halshs-00727618
Submitted on 4 Sep 2012
HAL is a multi-disciplinary open accessarchive for the deposit and dissemination of sci-entific research documents, whether they are pub-lished or not. The documents may come fromteaching and research institutions in France orabroad, or from public or private research centers.
L’archive ouverte pluridisciplinaire HAL, estdestinée au dépôt et à la diffusion de documentsscientifiques de niveau recherche, publiés ou non,émanant des établissements d’enseignement et derecherche français ou étrangers, des laboratoirespublics ou privés.
Distributed under a Creative Commons Attribution| 4.0 International License
The Effects of Biased Technological Change on TotalFactor Productivity. Empirical Evidence from a Sample
of OECD CountriesCristiano Antonelli, Francesco Quatraro
To cite this version:Cristiano Antonelli, Francesco Quatraro. The Effects of Biased Technological Change on Total FactorProductivity. Empirical Evidence from a Sample of OECD Countries. Journal of Technology Transfer,Springer Verlag, 2010, 35, pp.361-383. �halshs-00727618�

1
The Effects of Biased Technological Change on Total Factor
Productivity. Empirical Evidence from a Sample of OECD Countries1.
Cristiano Antonelli
BRICK (Bureau of Research in Innovation, Complexity and Knowledge) Collegio Carlo
Alberto & Dipartimento di Economia “S. Cognetti de Martiis” Università di Torino
and
Francesco Quatraro (contact author)
BRICK (Bureau of Research in Innovation, Complexity and Knowledge)
Collegio Carlo Alberto & Dipartimento di Economia “S. Cognetti de Martiis”
Università di Torino
JEL classification codes: O33
Keywords: Total Factor Productivity, Biased Technological Change, International
Technology Transfer
1 We wish to thank the participants to seminars held at the Politecnico of Milan, the Université Lyon
Lumière II, the Université Paris Sud-XI and the conference “Knowledge for growth: European strategies
in global economy” held in Toulouse, 7th – 9th July 2008, where preliminary versions of this paper have
been discussed.

2
The Effects of Biased Technological Change on Total Factor
Productivity. Empirical Evidence from a Sample of OECD Countries.
ABSTRACT.
Technological change is far from neutral. The empirical analysis of the rate and
direction of technological change in a significant sample of 12 major OECD countries
in the years 1970-2003 confirms the strong bias of new technologies. The paper
implements a methodology to identify and disentangle the effects of the direction of
technological change upon total factor productivity (TFP) and shows how the
introduction of new and biased technologies affects the actual levels of TFP according
to the relative local endowments. The empirical evidence confirms that the introduction
of biased technologies enhances TFP when its direction matches the characteristics of
local factor markets so that locally abundant inputs become more productive. When the
direction of technological change favours the intensive use of production factors that are
locally scarce, the actual increase of TFP is reduced.

3
1. Introduction
The historical evidence shows that technological change is strongly biased as it affects
asymmetrically the output elasticity of either input such as capital, labour or specific
intermediary inputs. Technological change can be capital-intensive, when it favours the
usage of capital via the increase of its output elasticity, and hence labour-saving, or
labour-intensive, or more specifically skill-intensive, when, on the opposite it favour the
use of labour and more specifically skilled labor, when it increases more the output
elasticity of labour than that of capital (Robinson, 1938).
A large cliometric evidence suggests that the bias or direction of technological change
differs across countries. As Habakkuk (1962) has shown, through the XIX century
technological change has been mainly capital-saving in UK and labour- and raw
material intensive in the US. Within the same country, different periods of economic
growth can be identified by the changes in the direction of technological change (David,
2004). New and convincing evidence has been provided recently about the strong skill-
bias of the gales of technological change based upon information and communication
technologies introduced in the last decades of the XXI century (Goldin and Katz, 2008).
This persistent and renewed evidence about the strong directionality of technological
change contrasts the basic methodology elaborated so far to assess its effects.
The conventional methodology for the measurement of total factor productivity (TFP)
assumes, in fact, the Hicks neutrality of technological change. Some methodological
innovations are requested in order to measure properly the overall effects of
technological change on productivity growth, when its directionality is acknowledged.
This is all the more necessary when inputs are not equally abundant and hence the slope
of the isocost differs from unity. When the introduction of biased technological change
(BTC) enables the more intensive use of the more abundant production factors, in fact
the consequent change in the slope of isoquants does affect output and hence
productivity growth.

4
As a consequence, countries with different factors‟ endowments will take advantage of
technological innovations that allow for a more intensive use of locally abundant
production factors. It follows that countries better able to introduce technologies that are
able to matching the local conditions of factor markets should show better productivity
performances than countries that have put less effort in shaping technologies according
to the relative scarcity of production factors. Standard TFP measurement à la Solow
does not allow for fully grasping this phenomenon. Such issue becomes even more
meaningful when one considers the distinction between innovation and creative
adoption (Antonelli, 2006a). Indeed, technologies originated in one country might well
be poorly suited to exploit the local conditions of factor markets of other countries.
Their productivity-enhancing effects would therefore be much reduced. The effective
adoption of those technologies in other countries, featured by different conditions for
factor markets, needs for creative efforts aiming at adapting them to the local
conditions. A new methodology measuring the effects of BTC on productivity could
therefore help investigating the appropriateness of innovation policies based on
international technology transfer in follower countries.
In this paper we propose an original methodology able to identify the effect on
productivity of such bias and disentangle from it the standard consequences of the shift
of the production function. We investigate the direction of technological change for a
sample of 12 OECD countries and explore its effects on TFP within a growth
accounting framework over the period 1970-2003. We show that: 1) the distinction
between biased and neutral technological change is empirically relevant, 2) a specific
methodology can identify and disentangle the effects of the rate of technological change
from the effects of its bias, 3) the matching between the bias of technological change
and the relative factor prices are important triggering factors of the actual change in the
efficiency of the production process.
The remainder of the paper is organized as follows. In Section 2 we recall the basic
elements about the relationship between changes in the production function and
technological innovations. In Section 3 we describe an original methodology to
appreciate the specific effects of BTC upon TFP measures. In Section 4 we present the

5
statistical evidence about the actual changes in output elasticities that have been taking
place in a large sample of representative countries in the years 1970-2003 and show the
results of our methodology to identify and disentangle the effects on TFP of
respectively the bias and the shift engendered by technological change. The concluding
remarks follow in Section 5.
2. Biased Technological Change and Productivity
Despite the revival of directionality, and its venerable origins, very few attempts may be
found in the literature addressing the implications of BTC on the measurement of TFP.
This is all the more surprising because Ferguson (1968 and 1969) and Nelson (1973)
had already shown that conventional methodologies for the measurement of TFP hold
only if technological change is Hicks-neutral and the elasticity of substitution is unitary.
This line of reasoning has been mostly neglected, and only recently it has inspired a few
empirical studies, aimed to understanding the sources of recent growth in Asian
countries relying upon alternative productivity indexes (Felipe and McCombie, 2001;
Fisher-Vanden and Jefferson, 2008) and to unveiling the effects of institutional regimes
on BTC (Armstrong et al., 2000).
The neglect of the effects of BTC on TFP dates back from the original contribution of
Solow (1957). As it is well known Solow allows the change in the output elasticity of
capital, as measured by its share on income, and does not account for its effects (Solow,
1957: p. 315, Table 1, col. 4). As a matter of the US case in the years 1909-1949, which
Solow analyzed using a Cobb-Douglas based growth accounting methodology, provides
clear evidence about the long term stability of factor shares and hence the substantial
neutrality of technological change. According to his evidence in the US, the share of
property on income did not exhibit significant variations when the starting year is
confronted with the end one: in 1909 it was 0.335 and 0.326 in 1949 with a negligible
change that might warrant the assumptions about the Hicks neutrality. In the short term,
however Solow‟s data exhibit significant changes: the share of property in income
decreased from 0.335 in 1909 to a minimum of 0.322 in 1927 and peaked a maximum
of 0.397 in 1932.

6
The international evidence suggests that the US evidence reported by Solow is quite a
special case. Technological change appears to be highly biased in most countries with
changing levels of output elasticity and hence high levels of both between and within
variance. The recent empirical evidence and the new debate on the relevance of BTC
revive the interest in the matter.
A variety of approaches have been considered in the literature on the measure of TFP
(Diliberto, Pigliaru, Mura, 2008). Little attention however has been paid to the effects of
BTC especially when local factor markets are characterized by significant difference sin
the relative abundance of inputs (Van Biesebroeck, 2007). Traditional growth
accounting actually keeps fixed the output elasticity of production factors at a given
level assuming typically a 0.30 and 0.70 for respectively capital and labor. Translog
production functions instead use data for wages and capital service costs that change
yearly (Jorgenson and Griliches, 1967). No approach, so far, has identified and
appreciated the effects of the changing output elasticity of production factors as a
specific form of technological change on TFP.
Within the growth accounting framework, Bernard and Jones (1996) acknowledge that
the standard TFP measure is not sufficient in contexts characterized by differences also
in factors‟ elasticities. They develop an index they call “total technology productivity”,
which accounts for both differences in the traditional “A” term and in factors‟
exponents. However such an index is sensitive to the level of capital intensity used as a
benchmark, and anyway it does not account separately for the effect of BTC2. Nelson
and Pack (1999) have highlighted the limits of conventional TFP growth and stressed
the implications in terms of underestimation of the role of capital accumulation in
economic growth. David (2004) has provided an outstanding study of the long-term
trends of the direction of technological change in the American economic history. The
author stresses that standard growth accounting exercises calculating the traditional
„residual‟ are mistaken in ignoring the effects of factors-deepening, and argues that the
2 More recently Carlaw and Kosempel (2004) have proposed a decomposition of TFP, by distinguishing
between investment-specific technology (IST) and residual-neutral technology (RNT), so as to show that
the traditional TFP measure is not sufficient to provide full account of the innovative process.

7
dynamics of US economic growth of XIX and XX centuries can be featured according
to the different directions of technological change in the two periods.
The basic assumption of the theory of production is that a two-way relationship exists
between the technology and the production function. All changes in technology affect
the production functions well as all changes in the production function reflect the
changes in technology. The changes in technology may engender both a shift of the
isoquants and a change in their slope. When technological change is neutral the effect
consists just in the shift of the map of isoquants towards the origin with no change in
their slope. When technological change is biased, the isoquants change both position
and slope. Clearly the changes in the values of the output elasticity of basic inputs, as
reflected in the changes in the slope of the isoquants, signal the introduction of BTC
(see Figure 1). Hence the changes in the levels of TFP can be considered as a reliable
indicator of the consequences of technological change only if both the effects on the
position (the shift) and on the slope (the bias) of the isoquants are accounted.
>>> INSERT FIGURE 1 ABOUT HERE <<<
Indeed the matching between the direction of technological change and the relative
levels of the endowments has powerful effects on the actual efficiency of the production
process. It is straightforward to see that the introduction of capital-intensive
technologies in a capital abundant country increases output, more than in a labour
abundant one (Appendix A illustrates this with a numerical example).
Let us consider the case of a neutral technological change taking place in the capital
abundant country Z that leads to the introduction of new superior capital-intensive, but
neutral, technology that enhances greatly A, the TFP index calculated with the
traditional Solow procedure. Let us now assume that the new superior technology is
adopted in the labor-abundant country T where labor-intensive technologies were at
work. With respect to the second country the new technology is far from neutral. It
should be clear that the increase in the output levels in country T is far lower than in
country Z. Adoption is profitable so far as the increase in TFP takes place. The relative
advantage of the adopting country however is far lower than that of the innovating

8
country. Actually firms may prefer to delay the adoption of new incremental but biased
technologies because of the mismatch between the relative factor prices and their
relative output elasticity. The negative effects of the bias can be larger than the small
positive effects of the shift of the isoquants. In such a case non-adoption is rational.
The traditional methodology to measure TFP would completely miss these important
effects. A new methodology, able to appreciate the change in the output elasticity of
production factors, is necessary to identify the effects of the directionality of
technological change. The traditional methodology introduced by Solow misses an
important dimension of technological change. This failure is all the more relevant when
the relative abundance of production factors differs sharply3. The introduction of BTC
cannot be accounted if the change in the output elasticity is not treated properly. At a
closer examination it seems clear that Solow‟s methodology is able to grasp the effects
of a neutral technological change, but not the effects of a biased one. The Solow‟s
methodology does not consider the introduction of BTC as a form of technological
change.
Only when the output elasticities are kept constant, in the calculation of the theoretical
output, so as to appreciate their change as a specific form of technological change, the
ratio of the expected output to the actual historic one can grasp the effects of the
introduction of BTC.
The change in the output elasticity of the production factors is by all means the result of
the introduction of a specific technological innovation. The standard theory of
production in fact tells us that all changes in the production function are the product of
the change in technology and viceversa all changes in technology do affect the
specification of the production function. The introduction of a new and BTC in turn
3 With respect to the numerical example in Appendix A it is clear in fact that the theoretical output –i.e.
the output levels that would be produced if the standard production theory applies- is estimated with the
new output elasticities and in fact there would be no discrepancy with respect to the historic output. The
residual would be 0 and the Solow‟s A would remain 1. According to the standard methodology to
measure TFP and hence the effects of technological change, the introduction of the biased technology
would not be appreciated.

9
engenders, for the given amount of total costs, with no changes in the unit costs of
production factors, a clear increase of the output.
3. Methodological Implementation
In order to single out an index for the effects of BTC on TFP, we elaborate upon the so-
called “growth accounting” methodology, which draws upon the seminal contribution
by Solow (1957) further implemented by Jorgenson (1995) and OECD (2001). In order
to confront directly our approach with the seminal contribution by Solow (1957), we
shall rely on a Cobb-Douglas production function.
Within this context, this paper applies a specific methodology to identify and
disentangle the effects of BTC on productivity growth, so as to separate out the sheer
effects of the shift of the production function, from the effects of the changes in
isoquants‟ slope, originally outlined in Antonelli (2003 and 2006b).
When technological change is biased towards the more intensive use of basic inputs that
are not evenly abundant, the matching between the output elasticities and the relative
factor prices has powerful effects on TFP. Such effects will be positive if the bias
favours the more intensive use of production factors that are locally abundant and the
effects will be negative if, on the opposite, the direction of technological change will
push towards the more intensive use of production factors that are locally scarce
(Bailey, Irz, Balcombe, 2004).
The appreciation of such an effect requires a new procedure articulated in two steps: the
first allows identifying the effects of the introduction of a technological bias as an
intrinsic factor of the actual TFP, the second enables to disentangle the effects of the
technological shift from the effects of the technological bias. Let us consider the two
steps in turn.
If the expected output is really and consistently calculated assuming that no form of
technological change has been taking place, the output elasticity of production factors

10
should not change. Such a „twice-theoretical output‟ assumes that the production
function has not changed neither with respect to the position of the isoquants nor with
respect to their slope. Next we can confront the historic output with the twice-theoretical
one: the result should measure the total twin effects of technological change consisting
both in the shift of the isoquants and in the changes in their slopes. If the changes in the
slope favour the more intensive use of locally abundant and hence cheaper factors, the
new methodology would identify a larger residual and hence a larger rate of increase of
TFP.
The next step consists in disentangling the effects of the introduction of the
technological bias from the effects of the technological shift. To obtain this result it is
sufficient to appreciate the Solow theoretical output -as calculated by Solow assuming
that output elasticities do change- as the specific measure of the introduction of a
technological shift. The difference, between the total twin effect of technological
change consisting both in its shift and bias effects, obtained in the previous step, and the
Solow-effect, will provide a clear measure of the effects of the introduction of a
technological bias.
Let us outline formally the main passages in what follows. The output Y of each country
i at time t, is produced from aggregate factor inputs, consisting of capital services (K)
and labour services (L), proxied in this analysis by total worked hours. TFP (A) is
defined as the Hicks-neutral augmentation of the aggregate inputs. Such a production
function has the following specification:
),(,,,, titititi
LKfAY (1)
The standard Cobb-Douglas takes the following format:
titi
tititiLKAY ,,
,,,
(2)
We can then write TFP as the ratio between the actual observed output and the output
that would have been produced through the sheer utilization of production factors:
titi
titi
ti
ti
LK
YA
,,
,,
,
,
(3)
Or in logarithmic form:

11
titititititiLKYA
,,,,,,lnlnlnln (4)
Where αi,t and βi,t represent respectively the output elasticity of capital and labour for
each country at each year. It is worth recalling that, according to Solow‟s formulation,
output elasticities of capital and labour are allowed to vary over time. In so doing the
effects of their change on productivity are completely neutralized.
Next, following Euler‟s theorem as in Solow (1957), we assume that output elasticities
equal the factors‟ shares in total income, as we assume perfect competition in both
factor and product markets. In view of this, the output elasticity of labour can be
expressed as follows:
ti
titi
tiY
Lw
,
,.
, (5)
If we also assume constant returns to scale, the output elasticity of capital can be
obtained as follows:
titi ,,1
The measure of A obtained in this way, accounts for “any kind of shift in the production
function” (Solow, 1957: 312), and it might be considered a rough proxy of
technological change (Link, 1987). By means of it Solow intended to propose a way to
“segregating shifts of the production function from movements along it”. Solow is right
if and when technological change is neutral, and/or factors are equally abundant.
Instead, the effects of biased technological innovations introduced in countries where
factors are not equally abundant, are made up of two elements. Indeed, the discussion
conducted in the previous sections suggests that besides the shift effect one should also
account for the bias effect, i.e. the direction of technological change.
Once we obtain the TFP accounting for the shift in the production function, we can
investigate the impact of the bias effect with a few passages. First of all we obtain a
measure of the TFP that accounts for the sum of both the bias and the shift effects (for
this reason we call it total-TFP or ATOT), by assuming output elasticities unchanged
with respect to the first year observed. This measure can be therefore written as follows:
0,0,
,,
,
,
titi
titi
ti
ti
LK
YATOT
(6)

12
The output elasticities for both labour and capital are frozen at time t=0, so that at each
moment in time the ATOT is equal to the ration between the actual output and the
output that would have been obtained by the sheer utilization of production factors, had
their elasticities been fixed over time. This index may be also expressed in logarithmic
form as follows:
titititititiLKYATOT
,0,,0,,,lnlnlnln
(7)
Next we get the bias effect (BIAS) as the difference between ATOT and A:
tititiAATOTBIAS
,,, (8)
The index obtained from Equation (11) is straightforward and easy to interpret. Indeed
its critical value is zero. When BIAS in one country is above (below) zero, then its
technological activity is characterized by the right (wrong) directionality, and the slope
of isocosts differs from unity.
4. Empirical Analysis
4.1 The Data
The methodological extension proposed in the previous Section clearly relies on the
traditional growth accounting approach. The data used for the analysis are mainly drawn
from the OECD datasets, and are related to 12 OECD countries, i.e. Austria, Canada,
Denmark, Finland, France, Ireland, Italy, Netherlands, Norway, Spain, UK and US. In
particular, the data about the GDP, the fixed capital stock and the GDP deflator are
provided by the OECD National Accounts series, while the figures concerning the wage
rate are drawn from the OECD Economic Outlook. Finally, we took data about
employment and total hours worked by the Groningen Growth and Development Centre
Total Economy Database.
The GDP, the wage rate and the total fixed capital have been deflated by using the GDP
deflator. We then calculated capital services as the two years moving average of capital
stock. Following Euler‟s the output elasticity is calculated as the product of the wage

13
rate and employment level, divided by the GDP. Finally, the productivity indexes have
been obtained by introducing total hours worked into equations (3) and (8) instead of
employment levels.
These data allow us to derive the BIAS index so as to appreciate the effects of the
introduction of BTC on productivity. In what follows we first provide evidence
concerning the dynamics of output elasticities, stressing its variation over time and
across different countries. Then we will provide the results of the calculations
conducted following the methodology presented in Section 3, showing the empirical
relevance of BTC in shaping productivity dynamics.
4.2 Directed Technological Change: The Changing Output Elasticity
of Labour
In order to show how much pervasive the issue is, it is worth looking at the data
concerning the output elasticity of labour. Indeed, should technological change consists
just of a shift in the production function, one would observe no change in output
elasticities, which clearly reflects the slope of the isoquant. On the other hand, it is clear
that according to the Euler theorem the share of revenue of each factor depends
exclusively upon its output elasticity (Solow, 1957; Ruttan, 2001). This, actually, makes
quite surprising the neglect of the dynamic implications of a change in output
elasticities. Table 1 provide clear evidence upon the strong bias of technological change
across 12 countries in the time interval of 32 years, from 1970 through 2003. This
evidence confirms that the claims about the stability of factor shares (Gollin, 2002) have
no empirical foundation even with respect to the US evidence4. The international
evidence, instead, confirms that the output elasticity of labour indeed varies over time,
and is also characterized by remarkable cross country and cross time differences.
>>>INSERT TABLE 1 ABOUT HERE<<<
4 In this respect, Keay (2000) derived a TFP index using a translog cost function, showing for the US and
the Canadian case a significant variance of factors’ shares across industries.

14
The data clearly show a common pattern. Output elasticities indeed are characterized by
a stable dynamics across most of the sampled countries along the 1970s with a
consistent increase. A discontinuity in the trend takes place since the mid 80s when
output elasticity starts declining. On the whole the rate of decrease seems to be more
pronounced between mid 1980s and mid 1990s, while it is milder in the late 1990s.
Within this common framework, important differences are found both with respect to
the relative levels of elasticities across the sampled countries and to the rate at which
they decreased in the last two observed decades. According to the latter, one may
roughly distinguish three groups of countries. The first group consists of countries
featured by a marked decrease of labour output elasticity. This is particularly evident in
the case of Ireland, where one can observe an average percent reduction of about 1,48
per year. This means that in 2003 the value of output elasticity was almost half the value
observed in 1971. The same applies also to Spain, Norway and Italy, where labour
output elasticity decreased at an average rate of respectively 0.96%, 0.90% and 0.85%
per year.
>>>INSERT FIGURE 2 ABOUT HERE<<<
A second group of countries is instead characterized by a softer decline after the late
1970s. Such countries are Austria, Denmark, the UK and the US. In these countries the
average rate of decline is around 0.45% per year. In particular, the output elasticity of
labour in UK underwent a slight decrease during the 1970s, remained stable during the
1980s and started decreasing again in the 1990s. On the whole, it fell of about 0.52% in
the thirty-two years considered. The elasticity for Austria and US diminishes of about
0.45%, while that for Denmark falls of 0.36% per year.
A last group of countries consists of Canada, France and the Netherlands, wherein
output elasticities are substantially stable over time. In the first two cases one may
observe an average decrease of about -0.2% per year, while in the latter there is an
increase of just 0.05%.

15
Looking at cross-country differences in output elasticity is indeed as much appealing.
Besides the generalized trend stressed above, one can note that only in a few countries
labour output elasticities stand around 0.5. Out of these, there are Spain and the UK, the
starting values of which are respectively 0.757 and 0.636, and Canada and Denmark,
where the starting values are respectively 0.549 and 0.568. The rest of the other sampled
countries show labour elasticities below 0.5. Ireland and Italy deserve a particular
mention in this respect, as labour shares are respectively 0.387 and 0.302 in 2003, i.e.
the lowest of the sampled countries.
From this preliminary evidence, it is clear that stability is just one of the possible
patterns that output elasticities exhibit over time. Moreover, countries differ both with
respect to the levels of relative efficiency of production factors, and to their evolution
over time. The empirical evidence confirms that not only the production function is
subject to shifts over time, but also to changes in its shape. This is true both
diachronically within the same country, and synchronically across different countries.
4.3 Biased Technological Change and TFP
Data show that output elasticities exhibit a great degree of variance both across
countries and over time. This evidence is quite clear and yet much overlooked, and
hence it makes the analysis of BTC imperative in order to gain a better understanding of
the causes and the effects of innovation patterns on productivity growth.
Tables 2 to 4 present the results of our calculations for the countries in the sample.
Table 2 reports the evolution of the standard TFP index à la Solow. Consistently with
the evidence about labour output elasticity, TFP exhibits quite a differentiated dynamics
across the sampled countries. Most of the European countries departs from relatively
low levels of productivity in 1971 and then follow specific paths. One may note that in
this picture Italy shows the lowest initial levels of TFP, and it is characterized by a
modest growth trend during the 1970s and the early 1980s. In the following years TFP
in Italy was quite stable, and a decreasing trend can be found only in the second half of
the 1990s. On the whole, productivity dynamics of Italy are therefore such that it

16
remained the worst off country out of the sampled ones, over the entire observed time
span. A number of factors may be responsible of such evidence. The Italian industrial
structure has indeed been characterized by a peculiar dynamics, according to which the
relative weight of manufacturing sectors has not followed the same path as in the rest of
most advanced countries that managed to trigger the development of service industries.
In view of this, one would expect innovation strategies to have a poor performance with
respect to the introduction of neutral technological change (Quatraro, 2009).
The initial TFP values for Finland are quite similar to the Italian ones, though it
experienced a somewhat steeper growth trend during the late 1970s and early 1980s. In
1987 the Finnish TFP began to fall down until 1991, providing and anticipation of the
strong recession that the country underwent in the period 1990-1993. Differently from
conventional GDP series, TFP in Finland started increasing again in 1990, i.e. in the
heart of the recession period. While this may result surprising, it is explained by the
dynamics of labour markets during that period, which were mostly hurt by the recession
(Dahlman et al., 2006). The data indeed show that both GDP and capital stock fell of
about the 10% in the period 1990-1993. This would mean that the productivity of
capital remained more or less stable. However, the figures about the total hours worked
exhibit a decrease of about the 20% in the same period. This is the reason why the
figures about TFP turn out to be increasing during the recession. In the following years
the productivity index appeared to be decreasing, as an effect of the recession, and then
it started increasing again at the turning of the century.
>>>INSERT TABLE 2 ABOUT HERE<<<
Austria and France seem to be characterized by very similar dynamics, according to
which TFP is increasing at an appreciable rate during the 1970s and the first half of the
1980s. Then it falls for a few years and it turns out to increase again along the 1990s. It
must be noted however that the French TFP is constantly above that of Austria. Within
the group of countries showing relatively low initial levels, Ireland and Netherlands
represent two interesting cases. The former indeed exhibit increasing productivity
figures until 1987, where it reaches the peak that is well above most of the sampled
countries. TFP then remains stable until 1993 and then it starts decreasing at an equally
rapid rate, so that at the end of the observed period it is third from last in the

17
productivity rankings. For what concerns Netherlands, despite an evident degree of
volatility, the TFP index is characterized by a sound growth trend until the first half of
the 1990s, and then it stabilizes. Differently from the previous country, the Netherlands
hence gained a good number of positions in the productivity rankings, arriving at the
same levels as the UK in 2003.
Two other groups may be identified, each consisting of two countries. The former
includes the US and Canada. These two countries are characterized by initial
productivity levels that are higher than those observed in the previous group. From a
dynamic viewpoint, one may clearly note a few cycles characterizing the two series.
First of all, there is an evident reduction of TFP at the end of the 1970s and the
beginning of the 1980s. This is the well-known productivity slowdown that worried US
economists during the early 1980s (Griliches, 1980). Along the 1980s there is a relative
upswing, more marked in Canada than in the US. In both cases the increasing trend of
TFP incurs a stop in the early 1990s, though it is less evident for the US, and then
started again in the second half of the 1990s, consistently with ICT-driven productivity
growth literature (Jorgenson and Lee, 2001).
The last group consists instead of two north-European countries, i.e. Denmark and
Norway, which exhibit the highest productivity levels.
The evidence about ATOT is reported in Table 3. It is interesting to note that the index
appears to be featured by a clear-cut growth dynamics in almost all of the sampled
countries. In particular, it would seem that ATOT follows the same paths as the
standard TFP, but magnifying the absolute levels. This is what one should expect,
should productivity growth consist not only of a shift component, but also of a bias one.
Indeed, particular attention has to be paid to those cases in which the ATOT
significantly departs from TFP. This happens in the case of Denmark, Ireland and
Norway to quite a great extent. Less marked, but still considerable differences can be
found in the case of Italy, the US, the UK and Spain. In the other cases the absolute
levels of ATOT are only slightly different from TFP.

18
>>>INSERT TABLE 3 ABOUT HERE<<<
It is clear that it is the change in output elasticities to determine the different behaviour
of the two indexes, and this is the reason why we argue that the effects of BTC on
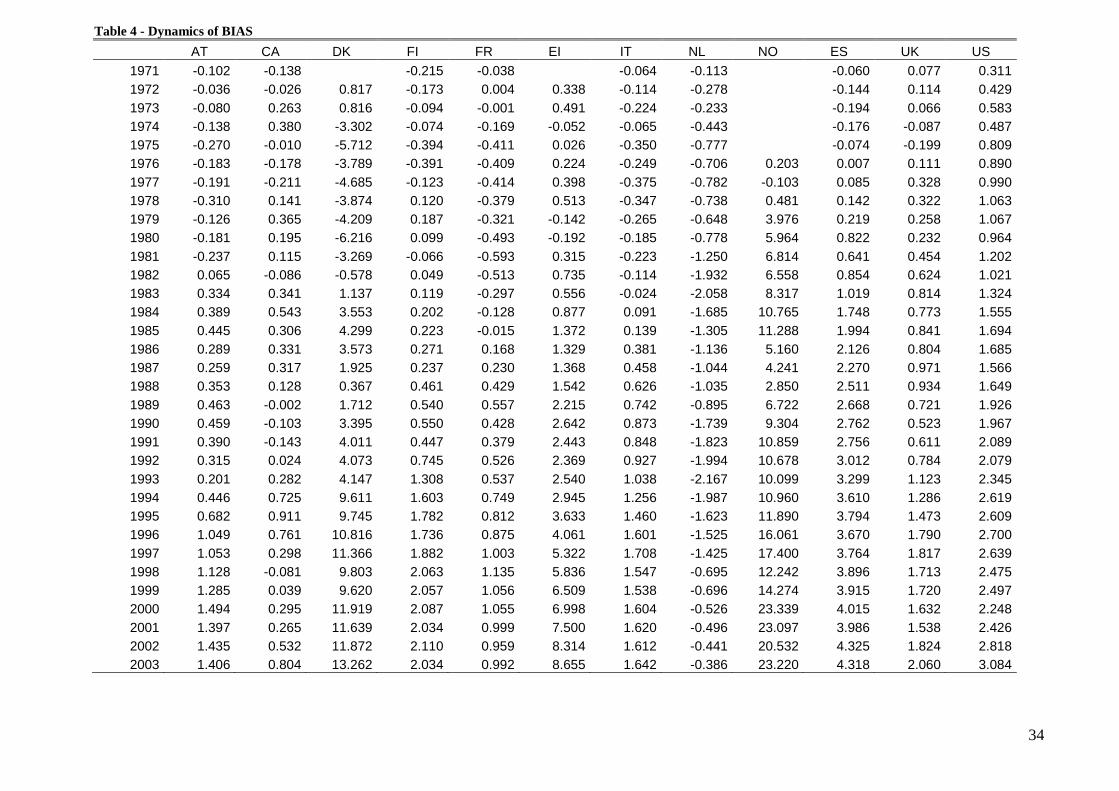
productivity growth deserve appropriate screening. Table 4 provides evidence of the
BIAS, combining TFP and ATOT following equation (8). Let us recall that positive
values for the BIAS index signal innovation efforts aimed at introducing technological
change that allows for better exploitation of idiosyncratic factor markets conditions,
while negative values are due to bad matches between technology and factors
endowments. It is straightforward that for values of the BIAS equal to zero, the
innovative activity is completely characterized by the introduction of neutral
technological change.
Let us analyze the empirical results also with the help of Figure 3. It seems that there is
a great deal of variety in the sample, both synchronic and diachronic. A particular case
is represented by the Netherlands, where the BIAS index is negative all over the
observed period. The values are significantly low in the middle of the 1980s and in the
middle of the 1990s, signalling the introduction of technologies that were definitely
biased towards the more intensive use of locally scarce resources. This is the only case
in which the index remains negative for the whole period. In some other cases the BIAS
is initially negative along the firs decade, and then it becomes positive in the following
years. This applies in particular to Austria, Canada, Denmark, Finland, France and Italy.
Out of these countries, the case of Denmark deserves to be mentioned, as therein the
BIAS becomes positive in the early 1980s and then starts growing at a very fast rate at
the beginning of the 1990s, so that it reaches quite remarkable values. Finland also
shows a rapid increase after the early 1990s recession, showing high values since the
second half of the 1990s. The evidence for Italy and Austria is characterized by a
somewhat marked growth in the second half of the 1990s, while in the cases of Canada
and France one can observe a very contained dynamics, so that one can maintain that
the BIAS component of technological change in those countries has been quite
negligible.

19
>>>INSERT TABLE 4 ABOUT HERE<<<
>>>INSERT FIGURE 3 ABOUT HERE<<<
The evidence about the US and the UK suggests that the BIAS index is positive since
the early observed years, and it increasing over the whole time span, though the levels
in the former case are higher than in the latter. Finally, Norway and Ireland are
characterized by steady growth dynamics. Norway in particular shows the highest
values of the whole sampled countries, and hence appears to be the country that has
been better able to combine the advantages of shift and BTC.
To gain better understanding of the relevance of the issue it may be useful to calculate
an alternative index that compares ATOT and TFP as follows:
AS
BIASAS
AS
ATOTSHIFTINT
ti
, (9)
This index may be characterized as a proxy of the shift intensity of technological
change, and the results of the calculations are reported in table 5 and Figure 4.
This evidence confirms that the matching between the specific direction of
technological change and the characteristics of local factor markets has a powerful
effect on the evolution of the actual levels of the general efficiency of the production
process. Such a relationship is characterized by a significant variance both cross-
countries and over time. Moreover, it is worth emphasizing that the new index of BTC
has significant implications in terms of country rankings based on productivity. Indeed,
countries showing low levels of traditional TFP levels, like Italy, turns out to show
better performances when looking at the BIAS index. On the contrary, countries with
relatively high levels of TFP, like France, are likely to shift backward in the ranking
when looking at the BIAS indexes. In countries like Denmark, Norway, Ireland and
Spain technological change exhibits a strong bias in favour of the increase of capital
intensity and has a powerful effect on the actual increase of ATOT that is far larger than
the TFP measured by the standard Solow indicator. It seems clear that the effects of

20
technological change on economic performance differ substantially from conventional
wisdom (Link and Siegel, 2003).
>>>INSERT TABLE 5 ABOUT HERE<<<
>>>INSERT FIGURE 4 ABOUT HERE<<<
The effects of technological change are much deeper and wider than currently
acknowledged as they consist both of a shift and a bias effect. The latter has been rarely
taken into account. The relation between the two effects can both additive and
substitutive. The bias effect can magnify the shift effect as well as reduce it. The
interaction between the bias of technological change and the characteristics of local
factor markets favours some countries and reduce the actual performances of others.
Our empirical evidence suggests that the OCED countries have introduced labour-
intensive technological innovations well beyond the relative endowments of labour
within their economic systems. The direction of technological change in the OECD
countries has been far from neutral and actually too much labour-intensive. The sharp
reduction of the ratio of the TFP index calculated with fixed output elasticities at the
beginning of the observation period and the Solow’s index calculated traditionally with
changing output elasticities, in countries like the US in the years 1996-1999 and the
constant value below unity of the Netherlands suggests that in these circumstances
technological change has taken a direction that is not consistent with the relative supply
of capital and labour.
In general, however, as the evidence summarized in table 5 suggests, the direction of
technological change matches the relative factor endowments so as to increase the TFP
growth.
The inclusion of this dimension into the framework of analysis of the effects of
technological change on economic performance seems to open a promising avenue for
empirical and theoretical research.

21
5. Conclusions and Policy Implications
The direction of technological change has powerful effects upon TFP. As such it
deserves much more attention than it currently receives. The literature has paid much
attention to the shift effects and almost ignored the bias effect. When the bias
introduced in the production function by the introduction of a non-neutral technology
favours the use of locally abundant production factors, the general efficiency of the
production process is enhanced. In some cases the productivity enhancing effects of the
bias are larger than the traditional shift effects. The introduction of new technologies
that favour the intensive use of locally scarce factors may reduce the potential for the
actual increase of efficiency.
The implications of these results are important both for economic analysis and for
economic policy. Because the direction of technological change has strong effects, both
positive and negative, on the real measure of TFP, it is most important to identify its
determinants.
Too much attention has been paid to the determinants of the shifts of the technological
frontier while it seems clear that an effort should be made to identify the determinants
of the directionality of technological change. The introduction of new biased
technologies that are able to take advantage of the local availability of cheap production
factors requires distinctive skills, competencies and hence resources that should be
identified and appreciated.
The application of this new accounting methodology at less aggregate levels of analysis,
and specifically at the regional, sectoral and possibly company level, should help
identifying which specific factors play a role in changing the direction of technological
change.
The introduction of a bias in technological change can be considered as the result of an
effective knowledge infrastructure that displays its effects in terms of technological
command only in the long term. As much as the rate of technological change is the
endogenous result of economic activity, the direction of the technological change

22
should be treated as the product of both the intentional design of innovators and of the
selection of market forces: in both cases the intensive use of locally abundant
production factors act as a sorting device that activates learning procedures and stirs
dedicated ingenuity and research efforts.
The increase in TFP that stems from the bias of technological change towards the
intense usage of locally abundant factors can take place as long as each country has an
advanced knowledge infrastructure that makes it possible to command the direction of
technological change (Antonelli et al., 2009).
This is even more relevant in countries less able to generate internally technological
knowledge that rely upon technological knowledge generated elsewhere. The access to
technological knowledge produced elsewhere requires substantial efforts of adaptation
to the local factor markets. Technology transfer from other countries can exert much
stronger effects when local adopters are able to adapt the foreign technology to the
specific conditions of their factor markets. Qualified user-producer interactions even
across borders are key to guiding innovation efforts towards the adaptation of new
foreign technologies to the conditions of local factor markets. The notion of creative
adoption is crucial in this context.
The implications for economic policy are clear. Several empirical and theoretical studies
have indeed provided evidence of the relevance of technological change to the process
of economic growth. The introduction of new technologies is the outcome of the
recombination of different knowledge inputs, both internal and external to economic
agents. The access to external sources of knowledge is key to this dynamics, in that it
allows economic agents to learn by interacting with other agents, so as to increase their
stock of competences. The emphasis on the biased nature of technological change may
provide a further qualification of the mechanisms of knowledge transfer, and identify
the likely conditions under which it is expected to yield appreciable results.
Most of the literature dealing with the systemic character of innovation processes, like
the national-regional innovation system literature, has mainly stressed the role of trust in

23
shaping the interactions within localized context. The quality of the institutional
endowment represents in that approach the basic element affecting the likelihood for
systemic interactions to emerge and progress. Furthermore, technological relatedness, in
terms of similarity of technology fields, is also important in favouring knowledge
transfer through the improvement of absorption capacity. While these aspects are
important, the evidence provided in this paper suggests that they are not sufficient to
guarantee the successful exploitation of external technological knowledge. The
idiosyncratic conditions of factor markets are likely to provide constraints that may be
difficult to overcome. The exchange of technologies between two economic agents
interacting within a conducive institutional endowment, and featured by similar
technological capabilities, may turn out not to yield productivity gains if the two agents
operate in areas where factor markets are dramatically different. Knowledge transfer
strategies should therefore pay appropriate attention to this issue, so as to activate
complementary adaptation efforts that would allow to successfully exploiting
technologies produced elsewhere. This argument is all the more relevant in the
assessment of the prospective stream of investments in environmental-friendly
technologies. Even in this case the empirical literature has already showed the key effect
of appropriate regulatory regimes (Costantini and Crespi, 2008), but this paper suggests
that policymakers should also gain knowledge about the relative endowment of
resources so as to properly shape the direction of research efforts. Technology policy
should indeed be aimed at favouring the introduction of biased technologies that favour
the intensive use of locally abundant factors. The design of technological platforms,
conceived as technology infrastructures operating strategically at the interface between
the public and the private sectors (Consoli and Patrucco, 2008), which take into account
such goals can improve substantially the positive effects of technological change.

24
6. References
Antonelli, C. (2003), The economics of innovation new technologies and structural
change, London, Routledge.
Antonelli, C. (2006a), Diffusion as a process of creative adoption, Journal of
Technology Transfer, 31, 211-226.
Antonelli, C. (2006b), Localized technological change and factor markets: Constraints
and inducements to innovation, Structural Change and Economic Dynamics 17, 224-
247.
Antonelli, C., Link, A.N., Metcalfe, J.S. (eds.) (2009), Technology infrastructure,
Routledge, London.
Armstrong, T.O., Goetz, M.L. and Leppel, K. (2000), Technological change bias in the
U.S. investor-owned electric utility industry following potential deregulation, Economics
of Innovation and Technological Change, 9, 559-572.
Bailey, A., Irz, X., Balcombe, K. (2004), Measuring productivity growth when
technological change is biased. A new index and an application to UK agriculture,
Agricultural Economics 31, 285- 295.
Bernard A. B., Jones C. J. (1996), Comparing apples to oranges: Productivity
convergence and measurement across industries and countries, American Economic
Review 86, 1216-1238.
Carlaw, K. and Kosempel, S. (2004), The sources of total factor productivity growth:
Evidence from Canadian data, Economics of Innovation and Technological Change, 13,
199-309.
Consoli, D. and Patrucco, P.P. (2008), Innovation platforms and the governance of
knowledge: Evidence from Italy and the UK, Economics of Innovation and
Technological Change, 17, 699-716.
Costantini V. and Crespi F. (2008), Environmental regulation and the export dynamics
of energy technologies, Ecological Economics 66 (2-3), pp. 447-460.
Dahlman et al. (2006), Finland as a knowledge economy: Elements of success and
lessons learned, The World Bank, Washington.
David, P. (2004), The tale of two traverses. Innovation and accumulation in the first two
centuries of U.S. economic growth, SIEPR Discussion Paper No 03-24, Stanford
University.
Diliberto, A., Pigliaru, F., Mura, R. (2008), How to measure the unobservable: A panel
technique for the analysis of TFP convergence, Oxford Economic Papers 60, 343-368.

25
Farrell, M.J. (1957), The measurement of productive efficiency, Journal of the Royal
Statistical Society, Series A, 120, 253-290.
Felipe J. and McCombie J.S.L. (2001), Biased technological change, growth
accounting, and the conundrum of the East Asian miracle, Journal of Comparative
Economics 29, 542-565.
Ferguson C.E. (1968), Neoclassical theory of technical progress and relative factor
share, Southern Economic Journal 34, 490-504.
Ferguson, C.E. (1969), Neoclassical theory of production and distribution, Cambridge
University Press, Cambridge.
Fisher-Vanden K. and Jefferson, G.H. (2008), Technology diversity and development:
Evidence from China’s industrial enterprises, Journal of Comparative Economics 36,
658-72.
Goldin, C. and Katz, L. (2008), The race between education and technology, Belknap
Press for Harvard University Press. Cambridge
Gollin, D. (2002), Getting income shares right, Journal of Political Economy 110, 458–
74.
Griliches, Z. (1980), R & D and the productivity slowdown, American Economic
Review 70, 343-48.
Griliches, Z., Mairesse, J. (1998), Production functions: The search for identification, in
Strom, S. (ed.), Econometrics and economic theory in the twentieth century: The
Ragnar Frisch symposium, Cambridge University Press, Cambridge, pp. 169-203.
Jorgenson, D., Griliches, Z. (1967), The explanation of productivity change, Review of
Economic Studies 34, 249-283.
Habakkuk, H.J. (1962), American and British technology in the nineteenth century,
Cambridge University Press, Cambridge.
Hicks, J.R. (1932), The theory of wages, London, Macmillan.
Jorgenson, D.W. (1995), Productivity Volume 1: Post-war US economic growth,
Cambridge, MA, MIT Press.
Jorgenson, D.W., Lee, F.C. (eds.) (2001), Industry-level productivity and international
competitiveness between Canada and the United States, Research Volumes of Industry
Canada, Ottawa (http://www.ic.gc.ca/eic/site/eas-aes.nsf/eng/ra01785.html).
Keay, I. (2000), Canadian manufacturers’ relative productivity performance, 1907-
1990, Canadian Journal of Economics 33, 1049-1068.

26
Link, A.N. (1987), Technological change and productivity growth, London, Harwood
Academic Publishers.
Link, A.N., Siegel, D.S. (2003), Technological change and economic performance,
London, Routledge.
Nelson, R.R., (1973), Recent exercises in growth accounting: New understanding or
dead end?, American Economic Review, 63, 462-468.
Nelson, R.R., Pack, H. (1999), The Asian miracle and modern economic growth theory,
Economic Journal 109, 416-436.
OECD, (2001), Measuring productivity. Measurement of aggregate and industry-level
productivity growth, Paris.
Quatraro F. (2009), Innovation, structural change and productivity growth: Evidence
from Italian regions, 1980-2003, Cambridge Journal of Economics, Advance Access
published January 2009, doi:10.1093/cje/ben063.
Robinson, J. (1938), The classification of inventions, Review of Economic Studies 5,
139-142.
Ruttan, V.W., (1997), Induced innovation evolutionary theory and path dependence:
Sources of technical change, Economic Journal 107, 1520-1529.
Ruttan, V.W. (2001), Technology growth and development. An induced innovation
perspective, Oxford University Press, Oxford.
Solow R. M. (1957), Technical change and the aggregate production function, The
Review of Economics and Statistics 39, 312-320.
Van Biesebroeck, J. (2007), Robustness of productivity estimates, Journal of Industrial
Economics 60, 529-569.

27
APPENDIX A – A numerical example
For the sake of clarity let us consider a simple numerical example that makes extreme
assumptions to grasping the basic point. Let us assume that in a region characterized by
an extreme abundance of capital and an extreme scarcity of labor, a firm uses a labor-
intensive technology:
Yt = Ka L
1-a where a= 0.25 (A1)
C = rK + wL where r=1 ; w=5 ; C = 100 (A2)
Standard optimization tells us that the firm will be able to produce at best Y=17.
Let us now assume that the firm, at time t+1, is able to introduce a radical technological
innovation with a strong capital-intensive bias so as to take advantage of the relative
abundance of capital and the relative scarcity of labor in the local factor markets.
Specifically let us assume that the new production function will be:
Yt+1 = Ka L
1-a , where a= 0.75 (A3)
C = rK + wL , where r=1 ; w=5 ; C = 100 (A4)
The introduction of a new biased capital-intensive technology, characterized by a much
larger output elasticity of capital and hence, assuming constant returns to scale, a much
lower output elasticity of labor, with the same budget and the same factor costs, will
now enable the output maximizing firm to increase its output to 38. The new technology
is 2.2 times as productive as the old one and yet technological change consists just of a
bias.
If we reverse the time arrow and we assume that the original technology was capital-
intensive with an output elasticity of capital 0.75 and hence a labor elasticity of 0.25 we
can easily understand that the introduction of a labor-intensive technology might
actually reduce output.

28
Figure 1 - Biased vs. Neutral Technological Change
C
B
K
L
t1
t2
Q=100
Q=100
A
1a) Capital-intensive technological change
C
B
K
L
t1
t2
Q=100
Q=100
A
1b) Labour-intensive technological change
The economy at time t1 is on the equilibrium point A. At time t2, the introduction of neutral
technological change makes the isoquant shift towards the origin in a parallel way, the new equilibrium
point being B. The introduction of biased technological change also causes a change in the slope of
isoquant, and the new equilibrium point is now C. The direction of technological change reflects the
structure of relative prices. The top diagram shows the case of capital-intensive technological change in
contexts characterized by relatively high wage levels. The top diagram shows the case of labour-
intensive technological change in contexts characterized by relatively low wage levels (Farrell, 1957).

29
Figure 2 - Evolution of Labour Output Elasticity
.3.4
.5.6
.7.8
Lab
ou
r O
utp
ut E
lasticity
1970 1980 1990 2000 2010Year
austria canada denmark finland
france ireland italy netherlands
norway spain united kingdom united states
Figure 3 - Evolution of Bias (absolute levels)
-10
01
02
03
0
Bia
s
1970 1980 1990 2000 2010Year
austria canada denmark finland
france ireland italy netherlands
norway spain united kingdom united states

30
Figure 4 - Evolution of Bias intensity
.81
1.2
1.4
1.6
1.8
1970 1980 1990 2000 2010Year
austria canada denmark finland
france ireland italy netherlands
norway spain united kingdom united states

31
Table 1 - Dynamics of Labour Output Elasticity
AT CA DK FI FR EI IT NL NO ES UK US
1971 0,486 0,549 0,514 0,466 0,406 0,438 0,757 0,631 0,569
1972 0,480 0,544 0,568 0,508 0,462 0,622 0,411 0,450 0,767 0,626 0,563
1973 0,483 0,530 0,568 0,499 0,462 0,610 0,420 0,446 0,770 0,634 0,557
1974 0,487 0,525 0,598 0,497 0,475 0,662 0,405 0,458 0,766 0,654 0,561
1975 0,498 0,543 0,612 0,524 0,493 0,655 0,430 0,476 0,755 0,668 0,546
1976 0,490 0,550 0,599 0,524 0,491 0,640 0,421 0,470 0,517 0,747 0,630 0,543
1977 0,490 0,552 0,604 0,500 0,491 0,629 0,430 0,474 0,520 0,740 0,604 0,540
1978 0,499 0,536 0,599 0,480 0,487 0,625 0,427 0,471 0,515 0,735 0,606 0,537
1979 0,485 0,526 0,600 0,475 0,483 0,666 0,420 0,466 0,488 0,729 0,615 0,537
1980 0,488 0,534 0,611 0,482 0,493 0,668 0,413 0,473 0,474 0,682 0,617 0,542
1981 0,492 0,537 0,594 0,495 0,498 0,640 0,416 0,500 0,467 0,700 0,592 0,532
1982 0,472 0,546 0,578 0,486 0,491 0,617 0,408 0,537 0,469 0,686 0,578 0,540
1983 0,455 0,528 0,567 0,482 0,479 0,626 0,401 0,539 0,455 0,677 0,563 0,527
1984 0,452 0,520 0,553 0,476 0,469 0,611 0,393 0,518 0,438 0,630 0,571 0,519
1985 0,449 0,530 0,548 0,475 0,463 0,584 0,390 0,497 0,437 0,623 0,567 0,514
1986 0,459 0,529 0,552 0,473 0,453 0,583 0,374 0,487 0,484 0,620 0,575 0,516
1987 0,461 0,530 0,563 0,475 0,450 0,584 0,370 0,482 0,491 0,616 0,565 0,522
1988 0,456 0,537 0,572 0,462 0,440 0,581 0,359 0,480 0,500 0,608 0,572 0,519
1989 0,451 0,542 0,565 0,459 0,434 0,554 0,352 0,473 0,476 0,606 0,590 0,508
1990 0,452 0,546 0,555 0,459 0,441 0,542 0,344 0,509 0,462 0,603 0,604 0,507
1991 0,456 0,548 0,552 0,465 0,444 0,535 0,346 0,512 0,455 0,605 0,597 0,502
1992 0,460 0,541 0,553 0,448 0,437 0,546 0,343 0,518 0,458 0,593 0,584 0,506
1993 0,466 0,532 0,553 0,417 0,437 0,537 0,337 0,524 0,462 0,581 0,561 0,496
1994 0,454 0,515 0,524 0,402 0,428 0,523 0,326 0,514 0,459 0,571 0,553 0,486
1995 0,444 0,508 0,523 0,394 0,426 0,499 0,315 0,499 0,455 0,564 0,543 0,486
1996 0,426 0,514 0,518 0,400 0,423 0,491 0,306 0,495 0,429 0,570 0,525 0,486
1997 0,430 0,532 0,514 0,395 0,418 0,458 0,301 0,490 0,419 0,567 0,526 0,490
1998 0,428 0,545 0,523 0,389 0,413 0,445 0,311 0,459 0,450 0,561 0,538 0,499
1999 0,423 0,541 0,524 0,392 0,417 0,429 0,313 0,459 0,441 0,559 0,540 0,500
2000 0,415 0,532 0,512 0,394 0,419 0,421 0,310 0,452 0,388 0,554 0,550 0,511
2001 0,420 0,534 0,513 0,398 0,422 0,409 0,310 0,450 0,395 0,554 0,556 0,507
2002 0,419 0,525 0,512 0,396 0,425 0,388 0,310 0,448 0,415 0,550 0,542 0,496
2003 0,420 0,516 0,505 0,402 0,424 0,387 0,307 0,446 0,402 0,552 0,531 0,490

32
Table 2 – Dynamics of Total Factor Productivity
AT CA DK FI FR EI IT NL NO ES UK US
1971 7.445 11.873 6.962 7.968 7.068 7.839 7.787 8.190 12.870
1972 7.300 12.008 33.296 7.109 8.073 8.729 7.343 8.469 8.239 8.458 12.705
1973 7.768 11.717 34.472 7.103 8.196 8.600 7.378 8.791 8.492 8.526 12.638
1974 7.993 11.389 39.124 7.049 8.404 9.489 7.131 9.451 8.671 8.558 12.837
1975 8.425 11.671 44.165 7.292 9.000 10.113 7.519 10.080 8.849 8.928 13.106
1976 8.648 12.065 41.812 7.707 9.240 9.749 7.763 10.594 27.211 9.250 8.880 13.101
1977 8.668 12.355 43.828 7.661 9.570 10.020 8.014 10.327 27.996 9.473 8.989 12.681
1978 9.137 12.074 43.786 8.010 9.799 9.971 8.195 10.304 30.189 9.880 9.218 12.303
1979 9.149 11.723 45.224 8.265 9.850 10.219 8.226 10.309 28.041 10.236 9.433 12.177
1980 9.163 11.866 48.708 8.156 9.927 10.891 7.967 10.384 28.132 10.029 9.532 12.559
1981 9.223 11.768 49.468 8.362 10.295 10.609 8.009 11.167 27.256 10.572 9.864 12.579
1982 9.583 12.663 46.457 8.358 10.752 10.843 8.203 12.038 27.561 10.667 9.992 13.045
1983 9.673 12.770 44.819 8.389 11.024 11.667 8.446 12.322 26.176 10.928 10.134 13.061
1984 9.776 13.036 42.137 8.699 11.142 12.220 8.577 11.984 25.628 11.124 10.015 12.705
1985 9.732 13.188 40.110 8.785 11.265 12.567 8.658 11.548 26.779 11.199 10.056 12.713
1986 10.013 13.000 39.477 9.074 11.150 12.751 8.686 11.301 30.969 11.191 10.409 13.003
1987 10.016 12.829 41.993 9.084 10.953 13.426 8.726 11.233 32.093 10.981 10.260 13.363
1988 9.940 12.850 45.714 8.756 10.638 13.674 8.532 11.146 33.343 10.621 10.010 13.488
1989 9.924 12.809 44.867 8.472 10.464 13.319 8.508 11.060 32.056 10.470 10.008 13.383
1990 10.044 13.343 44.343 8.725 10.621 12.924 8.360 12.056 33.586 10.480 10.475 13.765
1991 9.998 14.018 45.282 9.630 10.898 12.739 8.488 12.354 34.889 10.715 11.113 14.223
1992 10.231 14.426 46.920 10.461 11.203 13.347 8.698 12.618 36.495 11.098 11.648 14.578
1993 10.497 14.455 48.190 11.283 11.725 13.866 9.328 13.092 36.858 11.533 11.848 14.126
1994 10.362 13.848 44.234 11.496 11.707 13.343 9.392 13.214 36.724 11.592 11.867 13.724
1995 10.626 14.222 43.196 11.073 11.902 12.729 9.120 12.896 36.704 11.289 11.687 13.543
1996 10.313 14.278 42.554 11.058 11.949 12.232 9.022 12.638 32.932 11.419 11.523 13.515
1997 10.663 14.205 40.987 10.637 12.131 11.597 8.982 12.595 30.252 11.265 11.631 13.573
1998 10.727 14.779 41.511 10.481 11.963 11.018 9.040 11.947 32.554 10.865 11.589 13.727
1999 10.870 14.846 42.690 10.623 11.805 10.412 8.983 11.838 33.795 10.440 11.854 13.777
2000 10.665 14.963 40.555 10.682 11.775 10.345 8.800 11.917 29.829 10.069 12.269 14.142
2001 10.978 15.046 41.074 10.726 11.894 10.481 8.815 12.082 31.635 10.015 12.579 14.427
2002 11.496 14.924 41.306 11.207 12.396 10.420 8.616 12.447 34.997 10.200 12.576 14.793
2003 11.241 14.643 40.687 11.575 12.439 10.378 8.707 12.779 34.085 10.109 12.821 14.836

33
Table 3 - Dynamics of ATOT
AT CA DK FI FR EI IT NL NO ES UK US
1971 7.342 11.735 6.747 7.930 7.004 7.726 7.727 8.267 13.182
1972 7.264 11.982 34.113 6.936 8.078 9.067 7.229 8.191 8.095 8.572 13.134
1973 7.687 11.981 35.288 7.010 8.195 9.091 7.153 8.558 8.297 8.592 13.221
1974 7.856 11.769 35.822 6.975 8.235 9.437 7.065 9.008 8.494 8.471 13.324
1975 8.154 11.661 38.453 6.898 8.589 10.138 7.169 9.303 8.776 8.728 13.915
1976 8.465 11.888 38.022 7.316 8.831 9.973 7.514 9.888 27.414 9.258 8.991 13.991
1977 8.477 12.144 39.144 7.538 9.156 10.418 7.639 9.544 27.893 9.558 9.318 13.672
1978 8.828 12.215 39.912 8.130 9.420 10.484 7.848 9.566 30.670 10.022 9.541 13.365
1979 9.023 12.087 41.015 8.451 9.529 10.077 7.961 9.661 32.017 10.454 9.691 13.244
1980 8.982 12.061 42.492 8.255 9.434 10.700 7.782 9.606 34.096 10.851 9.765 13.523
1981 8.986 11.883 46.198 8.296 9.701 10.924 7.786 9.917 34.070 11.212 10.318 13.781
1982 9.648 12.577 45.879 8.407 10.239 11.578 8.089 10.106 34.119 11.521 10.616 14.066
1983 10.007 13.112 45.956 8.508 10.726 12.224 8.422 10.264 34.493 11.947 10.948 14.385
1984 10.164 13.579 45.690 8.901 11.015 13.098 8.668 10.299 36.394 12.873 10.788 14.260
1985 10.178 13.494 44.409 9.008 11.250 13.938 8.797 10.242 38.067 13.193 10.897 14.406
1986 10.302 13.331 43.050 9.345 11.318 14.080 9.067 10.165 36.128 13.317 11.213 14.688
1987 10.275 13.146 43.918 9.321 11.183 14.794 9.184 10.189 36.334 13.251 11.231 14.928
1988 10.293 12.978 46.082 9.217 11.067 15.216 9.158 10.110 36.193 13.132 10.944 15.137
1989 10.387 12.807 46.579 9.013 11.021 15.535 9.251 10.164 38.778 13.139 10.730 15.309
1990 10.503 13.239 47.738 9.275 11.049 15.566 9.233 10.317 42.891 13.241 10.998 15.732
1991 10.388 13.875 49.293 10.077 11.277 15.182 9.336 10.530 45.747 13.471 11.725 16.312
1992 10.547 14.450 50.993 11.206 11.729 15.715 9.625 10.625 47.173 14.110 12.433 16.656
1993 10.698 14.737 52.337 12.591 12.261 16.407 10.366 10.925 46.957 14.832 12.972 16.471
1994 10.809 14.573 53.846 13.100 12.456 16.288 10.648 11.227 47.684 15.202 13.153 16.344
1995 11.307 15.133 52.940 12.856 12.714 16.363 10.580 11.273 48.594 15.083 13.160 16.152
1996 11.361 15.038 53.370 12.794 12.824 16.292 10.624 11.113 48.993 15.089 13.313 16.215
1997 11.716 14.504 52.354 12.519 13.134 16.918 10.689 11.171 47.652 15.030 13.448 16.212
1998 11.856 14.698 51.314 12.544 13.098 16.854 10.587 11.252 44.796 14.762 13.302 16.203
1999 12.155 14.885 52.310 12.680 12.861 16.921 10.520 11.142 48.069 14.355 13.573 16.274
2000 12.159 15.258 52.474 12.769 12.830 17.343 10.403 11.391 53.168 14.083 13.902 16.390
2001 12.376 15.311 52.713 12.761 12.893 17.981 10.434 11.586 54.732 14.001 14.117 16.853
2002 12.931 15.456 53.178 13.317 13.355 18.735 10.228 12.006 55.529 14.525 14.400 17.611
2003 12.647 15.447 53.949 13.610 13.431 19.033 10.349 12.393 57.305 14.428 14.881 17.920
34
Table 4 - Dynamics of BIAS
AT CA DK FI FR EI IT NL NO ES UK US
1971 -0.102 -0.138 -0.215 -0.038 -0.064 -0.113 -0.060 0.077 0.311
1972 -0.036 -0.026 0.817 -0.173 0.004 0.338 -0.114 -0.278 -0.144 0.114 0.429
1973 -0.080 0.263 0.816 -0.094 -0.001 0.491 -0.224 -0.233 -0.194 0.066 0.583
1974 -0.138 0.380 -3.302 -0.074 -0.169 -0.052 -0.065 -0.443 -0.176 -0.087 0.487
1975 -0.270 -0.010 -5.712 -0.394 -0.411 0.026 -0.350 -0.777 -0.074 -0.199 0.809
1976 -0.183 -0.178 -3.789 -0.391 -0.409 0.224 -0.249 -0.706 0.203 0.007 0.111 0.890
1977 -0.191 -0.211 -4.685 -0.123 -0.414 0.398 -0.375 -0.782 -0.103 0.085 0.328 0.990
1978 -0.310 0.141 -3.874 0.120 -0.379 0.513 -0.347 -0.738 0.481 0.142 0.322 1.063
1979 -0.126 0.365 -4.209 0.187 -0.321 -0.142 -0.265 -0.648 3.976 0.219 0.258 1.067
1980 -0.181 0.195 -6.216 0.099 -0.493 -0.192 -0.185 -0.778 5.964 0.822 0.232 0.964
1981 -0.237 0.115 -3.269 -0.066 -0.593 0.315 -0.223 -1.250 6.814 0.641 0.454 1.202
1982 0.065 -0.086 -0.578 0.049 -0.513 0.735 -0.114 -1.932 6.558 0.854 0.624 1.021
1983 0.334 0.341 1.137 0.119 -0.297 0.556 -0.024 -2.058 8.317 1.019 0.814 1.324
1984 0.389 0.543 3.553 0.202 -0.128 0.877 0.091 -1.685 10.765 1.748 0.773 1.555
1985 0.445 0.306 4.299 0.223 -0.015 1.372 0.139 -1.305 11.288 1.994 0.841 1.694
1986 0.289 0.331 3.573 0.271 0.168 1.329 0.381 -1.136 5.160 2.126 0.804 1.685
1987 0.259 0.317 1.925 0.237 0.230 1.368 0.458 -1.044 4.241 2.270 0.971 1.566
1988 0.353 0.128 0.367 0.461 0.429 1.542 0.626 -1.035 2.850 2.511 0.934 1.649
1989 0.463 -0.002 1.712 0.540 0.557 2.215 0.742 -0.895 6.722 2.668 0.721 1.926
1990 0.459 -0.103 3.395 0.550 0.428 2.642 0.873 -1.739 9.304 2.762 0.523 1.967
1991 0.390 -0.143 4.011 0.447 0.379 2.443 0.848 -1.823 10.859 2.756 0.611 2.089
1992 0.315 0.024 4.073 0.745 0.526 2.369 0.927 -1.994 10.678 3.012 0.784 2.079
1993 0.201 0.282 4.147 1.308 0.537 2.540 1.038 -2.167 10.099 3.299 1.123 2.345
1994 0.446 0.725 9.611 1.603 0.749 2.945 1.256 -1.987 10.960 3.610 1.286 2.619
1995 0.682 0.911 9.745 1.782 0.812 3.633 1.460 -1.623 11.890 3.794 1.473 2.609
1996 1.049 0.761 10.816 1.736 0.875 4.061 1.601 -1.525 16.061 3.670 1.790 2.700
1997 1.053 0.298 11.366 1.882 1.003 5.322 1.708 -1.425 17.400 3.764 1.817 2.639
1998 1.128 -0.081 9.803 2.063 1.135 5.836 1.547 -0.695 12.242 3.896 1.713 2.475
1999 1.285 0.039 9.620 2.057 1.056 6.509 1.538 -0.696 14.274 3.915 1.720 2.497
2000 1.494 0.295 11.919 2.087 1.055 6.998 1.604 -0.526 23.339 4.015 1.632 2.248
2001 1.397 0.265 11.639 2.034 0.999 7.500 1.620 -0.496 23.097 3.986 1.538 2.426
2002 1.435 0.532 11.872 2.110 0.959 8.314 1.612 -0.441 20.532 4.325 1.824 2.818
2003 1.406 0.804 13.262 2.034 0.992 8.655 1.642 -0.386 23.220 4.318 2.060 3.084

35
Table 5 - Dynamics of Shift intensity
AT CA DK FI FR EI IT NL NO ES UK US
1970 1.000 1.000 1.000 1.000 1.000 1.000 1.000 1.000 1.000
1971 0.986 0.988 1.000 0.969 0.995 1.000 0.991 0.986 0.992 1.009 1.024
1972 0.995 0.998 1.025 0.976 1.001 1.039 0.985 0.967 0.982 1.013 1.034
1973 0.990 1.022 1.024 0.987 1.000 1.057 0.970 0.974 0.977 1.008 1.046
1974 0.983 1.033 0.916 0.990 0.980 0.994 0.991 0.953 0.980 0.990 1.038
1975 0.968 0.999 0.871 0.946 0.954 1.003 0.953 0.923 1.000 0.992 0.978 1.062
1976 0.979 0.985 0.909 0.949 0.956 1.023 0.968 0.933 1.007 1.001 1.013 1.068
1977 0.978 0.983 0.893 0.984 0.957 1.040 0.953 0.924 0.996 1.009 1.037 1.078
1978 0.966 1.012 0.912 1.015 0.961 1.051 0.958 0.928 1.016 1.014 1.035 1.086
1979 0.986 1.031 0.907 1.023 0.967 0.986 0.968 0.937 1.142 1.021 1.027 1.088
1980 0.980 1.016 0.872 1.012 0.950 0.982 0.977 0.925 1.212 1.082 1.024 1.077
1981 0.974 1.010 0.934 0.992 0.942 1.030 0.972 0.888 1.250 1.061 1.046 1.096
1982 1.007 0.993 0.988 1.006 0.952 1.068 0.986 0.839 1.238 1.080 1.062 1.078
1983 1.035 1.027 1.025 1.014 0.973 1.048 0.997 0.833 1.318 1.093 1.080 1.101
1984 1.040 1.042 1.084 1.023 0.989 1.072 1.011 0.859 1.420 1.157 1.077 1.122
1985 1.046 1.023 1.107 1.025 0.999 1.109 1.016 0.887 1.422 1.178 1.084 1.133
1986 1.029 1.025 1.091 1.030 1.015 1.104 1.044 0.900 1.167 1.190 1.077 1.130
1987 1.026 1.025 1.046 1.026 1.021 1.102 1.052 0.907 1.132 1.207 1.095 1.117
1988 1.036 1.010 1.008 1.053 1.040 1.113 1.073 0.907 1.085 1.236 1.093 1.122
1989 1.047 1.000 1.038 1.064 1.053 1.166 1.087 0.919 1.210 1.255 1.072 1.144
1990 1.046 0.992 1.077 1.063 1.040 1.204 1.104 0.856 1.277 1.264 1.050 1.143
1991 1.039 0.990 1.089 1.046 1.035 1.192 1.100 0.852 1.311 1.257 1.055 1.147
1992 1.031 1.002 1.087 1.071 1.047 1.177 1.107 0.842 1.293 1.271 1.067 1.143
1993 1.019 1.020 1.086 1.116 1.046 1.183 1.111 0.834 1.274 1.286 1.095 1.166
1994 1.043 1.052 1.217 1.139 1.064 1.221 1.134 0.850 1.298 1.311 1.108 1.191
1995 1.064 1.064 1.226 1.161 1.068 1.285 1.160 0.874 1.324 1.336 1.126 1.193
1996 1.102 1.053 1.254 1.157 1.073 1.332 1.177 0.879 1.488 1.321 1.155 1.200
1997 1.099 1.021 1.277 1.177 1.083 1.459 1.190 0.887 1.575 1.334 1.156 1.194
1998 1.105 0.995 1.236 1.197 1.095 1.530 1.171 0.942 1.376 1.359 1.148 1.180
1999 1.118 1.003 1.225 1.194 1.089 1.625 1.171 0.941 1.422 1.375 1.145 1.181
2000 1.140 1.020 1.294 1.195 1.090 1.676 1.182 0.956 1.782 1.399 1.133 1.159
2001 1.127 1.018 1.283 1.190 1.084 1.716 1.184 0.959 1.730 1.398 1.122 1.168
2002 1.125 1.036 1.287 1.188 1.077 1.798 1.187 0.965 1.587 1.424 1.145 1.191
2003 1.125 1.055 1.326 1.176 1.080 1.834 1.189 0.970 1.681 1.427 1.161 1.208
Copyright © 2022 FDOKUMEN