THE EFFECTIVENESS OF TEACHING VOCABULARY BY ...
92
THE EFFECTIVENESS OF TEACHING VOCABULARY BY USING INFOGRAPHIC (A Quasi-experimental Study at the Eight Grade Students’ of SMP Negeri 11 Kota Tangerang in the Academic Year 2019/2020) A “Skripsi” Presented to the Faculty of Educational in Partial Fulfillment of the Requirement for the Degree of S.Pd. (S-1) Andika Afrian 1113014000055 DEPARTMENT OF ENGLISH EDUCATION FACULTY OF EDUCATIONAL SCIENCES SYARIF HIDAYATULLAH STATE ISLAMIC UNIVERSITY OF JAKARTA 2019
-
Upload
khangminh22 -
Category
Documents
-
view
0 -
download
0
Transcript of THE EFFECTIVENESS OF TEACHING VOCABULARY BY ...

THE EFFECTIVENESS OF TEACHING VOCABULARY
BY USING INFOGRAPHIC
(A Quasi-experimental Study at the Eight Grade Students’ of SMP Negeri 11
Kota Tangerang in the Academic Year 2019/2020)
A “Skripsi”
Presented to the Faculty of Educational in Partial Fulfillment of the
Requirement for the Degree of S.Pd. (S-1)
Andika Afrian
1113014000055
DEPARTMENT OF ENGLISH EDUCATION
FACULTY OF EDUCATIONAL SCIENCES
SYARIF HIDAYATULLAH STATE ISLAMIC UNIVERSITY OF
JAKARTA
2019


iv
ABSTRACT
Andika Afrian (NIM: 1113014000055). The Effectiveness of Teaching
Vocabulary by Using Infographic (A Quasi-experimental Research at the
Eighth Grade Students of SMP Negeri 11 Kota Tangerang in the Academic
Year 2019/2020). Skripsi of English Education at Faculty of Educational Sciences
of State Islamic University of Syarif Hidayatullah Jakarta, 2019.
The aim of this research was to obtain the empirical evidence about the
effectiveness of teaching vocabulary using infographic. The method used in this
research was a quantitative method and the research design was a quasi-
experimental. The sample of this research was at eight grade students of SMP
Negeri 11 Kota Tangerang academic year 2019/2020. They were 8.2 class as the
experimental class, whereas 8.4 class as the control one. Each class consisted of 35
students. The researcher used purposive sampling. The instrument used in this
research was multiple choice test which consisted of 35 question for pre-test and 35
question for the post-test. Based on the calculation, the post-test mean scores of the
experimental class was 76.4 while that of the control class was 70.7. then the result
of statistical hypothesis testing by using independent sample t-test found that on
degree of significant 5% (α = 0.05), tobserve was 2.968 while ttable was 1.995 or tobserve >
ttable. Therefore, H0 was rejected and Ha was accepted. Furthermore, the Cohen’s formula
was used in order to know the effect size of infographic and the result was 0.70. it
proved that infographic gave moderate effect. So, we can concluded that there was a
moderate effect of infographic on students vocabulary learning at eight grade of
students SMP Negeri 11 Kota Tangerang in the academic year of 2019/2020.
Keywords: Infographic, Vocabulary.

v
ABSTRAK
Andika Afrian (NIM: 1113014000055). Pengaruh Infographic Terhadap
Pembelajaran Kosa Kata Siswa (Penelitian kuasi-eksperimental pada kelas
delapan SMP Negeri 11 Kota Tangerang Tahun Ajaran 2019/2020). Skripsi
Jurusan Pendidikan Bahasa Inggris Fakultas Ilmu Tarbiyah dan Keguruan
Universitas Islam Negeri Syarif Hidayatullah Jakarta tahun 2018.
Penelitian ini bertujuan untuk meneliti efek dari infographic terhadap pembelajaran
kosa kata siswa. Metode yang digunakan dalam penelitian ini adalah kuantitatif dan
desain penelitian yang digunakan adalah kuasi-eksperimen. Sampel pada penelitian
ini adalah siswa/siswi kelas delapan SMP Negeri 11 Kota Tangerang tahun ajaran
2019/2020. Mereka dari kelas 8.2 sebagai kelas eksperimen sedangkan dari kelas
8.4 adalah sebagai kelas kontrol. Masing – masing kelas terdiri dari 35 siswa.
Peneliti menggunakan Purposive sampling. Instrument yang digunakan adalah
bentuk tes pilihan ganda yang terdiri dari 35 soal untuk pra-tes dan 35 soal untuk
pos-tes. Derdasarkan perhitungan, rata – rata nilai pos-tes dari kelas eksperimen
adalah 76,4 sedangkan rata – rata nilai pos-tes kelas control adalah 70,7.
Selanjutnya, hasil hipotesis statistic tes dengan menggunakan independent sample
t-test menunjukan bahwa pada tingkat taraf 5% (α = 0.05), nilai untuk t count adalah
2,968 sedangkan nilai untuk t table adalah 1,995 atau t count > t table. Maka dari itu,
Ho ditolak dan Ha diterima. Lebih lagi, rumos Cohen’d digunakan untuk mengetahui
kisaran efek dari video tutorial dan hasilnya adalah 0.70. hal ini membuktikan bahwa
adanya efek yang moderate dari infographic. Jadi, dapat disimpulkan adanya dampak
yang moderate dari penggunaan infographic terhadap pembelajaran kosa kata siswa
pada kelas delapan SMP Negeri 11 kota Tangerang tahun ajaran 2019/2020.
Kata Kunci: Infographic, Kosa Kata.

vi
ACKNOWLEDGEMENT
In the name of Allah, The Beneficent, The Merciful
All praise be to Allah, the Lord of the universe and the best Creator, who
has given the writer His blessing and mercy to finish the last assignment in his
bachelor study. Peace and salutation be upon the prophet Muhammad, his family,
his companions, and his followers.
In this opportunity, the writer would like to express his profound gratitude
to his parents Mr. Muchtar and Mrs. Juju Juriyati for unconditional love, support,
patience and continuous encouragement throughout his years of study. This
accomplishment would not have been possible without them.
Next, the writer would like to express his gratitude to the special and
honorable advisors, Mrs. Dr. Nida Husna, MA. TESOL. and Mr. Dadan Nugraha,
M.Pd for all the support, uncountable time, constructive advice, and warm
encouragement during the process of doing the assignment. Without their guidance
and persistent help this assignment would not have been possible.
The writer would also like to express his gratitude and greatest appreciation
to the people who helped this assignment and his appreciation goes to:
1. Dr. Sururin, M.Ag., as the Dean of the Faculty of Educational Sciences.
2. Didin N. Hidayat, MA. TESOL., Ph.D. as the Head of Department of English
Education.
3. Zaharil Anasy, M.Hum. as the Secretary of Department of English Education.
4. All of the lectures especially those of Department of English Education who
have taught the writer precious knowledge and experience.
5. H. Marwan, S.Pd., MM. as the Headmaster of SMP Negeri 11 Kota Tangerang
who has given the chance and permission to conduct the research.

vii
6. Sri Ekawati Puspa, S.Pd. as the English teachers of eighth grade of SMP Negeri
11 Kota Tangerang for their guidance and motivation during the research.
7. The students of 8.2 and 8.4 for their contribution and participation in this
research.
8. All of friends in Department of English Education 2013 especially C class for
the generous support and all great moments.
9. All Seniors and junior in Students’ Association of Department of English
Education especially my BPH; Ridho Fourty, Zahra Siti Muslimah, Mentari,
Rofika Tiara Avisteva and Ismah Nurbaeti Al’ munawaroh who processing
together with me during my best or worst time there. You are the best.
10. All the members of Sukuners, especially Faiq Zamzami, Didit Radinal, Fanji
Muharam, Zezens Pratama, Rivki Surya Maulana, Putra Sudharma, Randy
Ragistha, Reza Naufal, Meylia Azurah, Novita Resti Utami, Mella Sarasyifa,
Mulhimah Riyadoh, and Yuni Triandini, for all the crazy moments.
11. All people who the names cannot be mentioned one by one for all their help
and kindness in finishing this ‘skripsi’.
Finally, the writer realizes that this thesis is far from being perfect; therefore
the writer would like to welcome and accept constructive comment and suggestion
from the reader in order to create a better research paper in the future. Hopefully
this thesis will have some values for his and the reader.
Tangerang, December 6th, 2019
The Writer
Andika Afrian

viii
TABLE OF CONTENTS
COVER………………………………………………………………………
APPROVAL SHEET……………………………………………………… i
ENDORSEMENT SHEET……………………………………………….. ii
STATEMENT OF ORIGINALITY……………………………………… iii
ABSTRACT……………………………………………………………… iv
ABSTRAK……………………………………………………………….. v
ACKNOWLEDGEMENT……………………………………………….. vi
TABLE OF CONTENTS………………………………………………… viii
LIST OF TABLES………………………………………………………. x
LIST OF FIGURES……………………………………………………… xi
LIST OF APPENDICES………………………………………………… xii
Chapter I: INTRODUCTION…………………………………………… 1
A. Background of the Study………………………………………… 1
B. Identification of the problem…………………………………….. 5
C. Limitation of the Study………………………………………….. 6
D. Formulation of the Study………………………………………... 6
E. Objectives of the Study…………………………………………. 6
F. Significant of the Study…………………………………………. 6
Chapter II: THEORITICAL FRAMEWORK…………………………... 8
A. Vocabulary……………………………………………………… 8
1. General Concept of Vocabulary……………………………. 8
2. Kinds of Vocabulary……………………………………….. 11
3. Problem in teaching Vocabulary…………………………… 12
B. Infographic……………………………………………………… 14
1. Definition…………………………………………………… 14
2. Kinds of Infographic………………………………………... 15
3. Advantages of Using Infographic…………………………… 17
C. Teaching Vocabulary Using Infographic……………………….. 18
D. Previous Related Study…………………………………………. 19
E. Thinking Framework…………………………………………… 21
Chapter III: RESEARCH METHODOLOGY…………………………. 22
A. Place and Time of The Research……………………………….. 22
B. Method and Research Design…………………………………... 22
C. Population and Sample…………………………………………. 23

ix
D. Research Instrument……………………………………………... 23
1. Validity……………………………………………………… 25
2. Reliability…………………………………………………… 25
E. Technique of Data Collection…………………………………… 27
F. Data Analysis Procedure………………………………………… 27
1. Normality Test……………………………………………… 27
2. Homogeneity Test…………………………………………... 28
3. Test of Hypothesis………………………………………….. 28
4. Effect Size Formulation…………………………………….. 28
G. Statistical Hypothesis……………………………………………. 29
Chapter IV: RESEARCH FINDINGS AND INTERPRETATION…….. 31
A. Research Findings……………………………………………….. 31
1. Description of The Data…………………………………….. 31
a) The Data of Experiment Class…………………………. 31
b) The Data of Control Class…………………………….. 32
2. Analysis Data……………………………………………….. 37
a) The Normality Test…………………………………….. 37
1) Pre-Test……………………………………………. 37
2) Post-Test…………………………………………… 38
b) The Homogeneity Test………………………………… 39
c) The Hypothesis Test…………………………………… 40
d) The Effect Size Test…………………………………… 44
B. Interpretation…………………………………………………….. 43
Chapter V: CONCLUSION AND SUGGESTION……………………… 46
A. Conclusion……………………………………………………….. 46
B. Suggestion………………………………………………………... 47
REFERENCES…………………………………………………………… 48
APPEDICES……………………………………………………………… 51

x
LIST OF TABLES
Table 3.1 Design of The Study……………………………………… 23
Table 3.2 Specification of Tests…………………………………….. 24
Table 3.3 The Result of Validity and Reliability of The Tests……… 26
Table 3.4 The Criteria of Size Effect………………………………... 29
Table 4.1 Students’ Pre-test and Post-test Scores of Experimental Class
………………………………………………………………………. 31
Table 4.2 Students’ Pre-test and Post-test Scores of Control Class
………………………………………………………………………. 33
Table 4.3 The Gained Score of Experimental Class………………… 34
Table 4.4 The Gained Score of Control Class………………………. 35
Table 4.5 Tests of Normality of Pre-Test…………………………… 38
Table 4.6 Tests of Normality of Post-Test…………………………... 38
Table 4.7 Homogeneity of Variances Test of Pre-test………………. 39
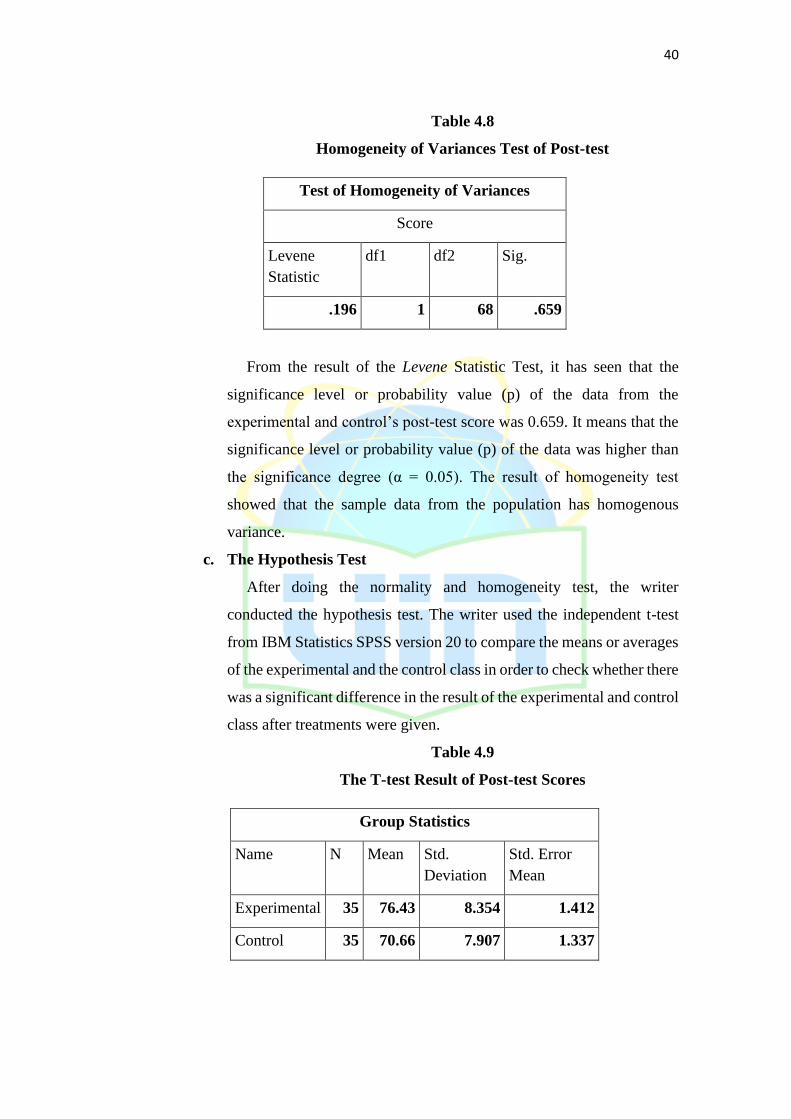
Table 4.8 Homogeneity of Variances Test of Post-test……………… 40
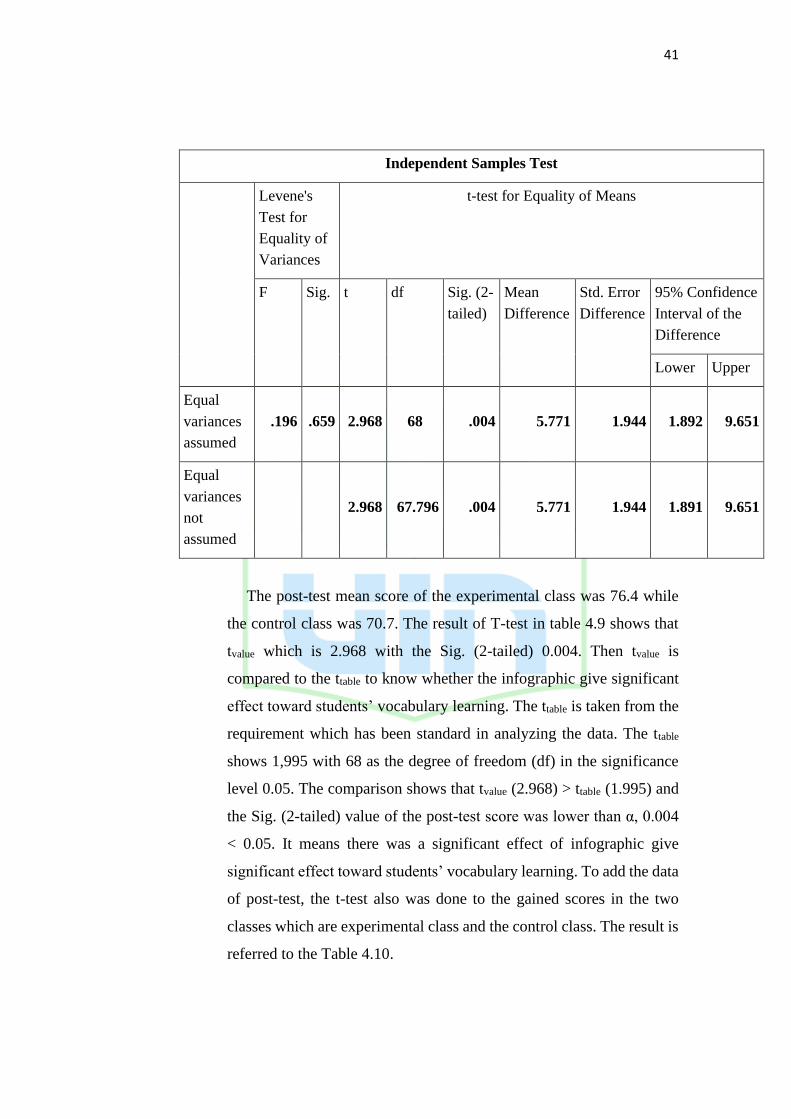
Table 4.9 The T-test Result of Post-test Scores……………………… 40
Table 4.10 The T-test Result of Gained Scores……………………… 42

xi
LIST OF FIGURES
Figure 2.1 Example of static infographic………………………………… 16
Figure 2.2 Example of animation infographic…………………………… 16
Figure 2.3 Example of interactive infographic…………………………… 17
Figure 4.1 The Difference between Students’ Score in Experimental and
Control Class……………………………………………………………… 37

xii
LIST OF APPENDICES
Appendix 1. Lesson Plan Experiment Class. …………………………….. 51
Appendix 2. Lesson Plan Control Class. ………………………………… 57
Appendix 3. Pre-Test Instrument. ……………………………………….. 62
Appendix 4. Post-Test Instrument. ……………………………………… 65
Appendix 5. The Gained Score of Experimental Class. ………………… 68
Appendix 6. The Gained Score of Control Class. ………………………. 69
Appendix 7. Secondary Data. …………………………………………… 70
Appendix 8. Surat Bimbingan Skripsi. ……………………………………… 73
Appendix 9. Surat Keterangan Melakukan Penelitian. …………………… 74
Appendix 10. Pictures of The Class Activities. ………………………… 75
Appendix 11. Teachers’ Made Infographic. …………………………… 76
Appendix 12. Students’ Made Infographic. …………………………… 77

1
CHAPTER I
INTRODUCTION
This chapter consists of the background of the study, identification of the
problem, limitation of the problem, formulation of the problem, objective of
the study and significance of the study
A. Background of the study
Language is a mean of communication, that is why language is very
important for human being in the world because it is a means of
communication. Dealing with definition of language, an American
anthropological linguist E. Sapir, he said that language is a human purely
method to communicate by means of system voluntarily produce symbol.1
Meanwhile, language by Hamied as cited by Ersan in his journal said that the
structure of the language is as the instrument to express a meaning.2
Based on the definition above, language will be very useful if we
communicate with others to get the meaning of the words in sentences itself;
on the contrary, it can be useless if we do not use it. To understand the language,
we have to understand the meaning of words as many as possible either in a
sentence or in whole texts. Language is a systematic communication tool that
may transfer ones' ideas or feeling through body language, signs, sounds and
gesture having understood meanings. On the other hands, by using language,
people can express his ideas, feeling or information either orally or written.
Because the definition of language refers to the expression of certain
meanings, of course, we could not separate it with the four language skills that
that have to be mastered by the students. The four language skills are listening,
speaking, reading and writing which prominent in teaching and learning
English. Besides the four language skills, there are also language components
1 E. Sapir, Language - An Introduction to The Study of Speech, (Harcourt: Brace. New York;
1921). P. 7.
2 Ersan Sanusi, The Techniques in Teaching Vocabularies, (Ittihad Jurnal Kopertis Wilayah
XI Kalimantan, Volume 7 No.11 Kalimantan; 2009). P.2.
2
that also need to be thought to and to be recognized by the students. One of
them is vocabulary. Both aspects are very important that need to be mastered
by the students to accomplish the basic language communication and the
students have to practice all those skills which cannot be separated from each
other. In expressing language, we may not forget the role of vocabulary chosen.
It plays an important role as means of understanding the meaning of words
correctly. Moreover, as cited by ersan journal, Wallace argues that "there is a
sense in which learning a foreign language is basically a matter of learning
vocabulary in target language." Hence, vocabulary is the basic aspect of
language in teaching learning process. It means that it is an important part of
the language components like grammar, pronunciation, spelling, etc.3
As quoted by Thornbury, “Without grammar very little can be conveyed,
without vocabulary nothing can be conveyed.”4 It tells us that if we want to
convey meaning they need vocabulary. It also supported by Nation in his
research, Nation and Hwang present evidence that students who want to learnt
English needed 2,000 most frequent words of English as the high frequency
words.5 Although someone has known sentence structure but if he/she does not
mastery vocabulary, he/she will remain unable to say or write anything and the
grammar knowledge will be useless. Thus, by improving the vocabulary,
someone has a better chance to be able to communicate what is in their mind
using the targeted language because they have more modality than the others
even though it is not perfect because they still need grammars.
Based on the situation above, Vocabulary learns an important and
indispensable part of any language learning process.6 It is already known that
to use a language, the important aspect that we have to know first is the
appropriate numbers vocabulary of the target languages. Vocabulary is used
3 Ibid., P. 2.
4 Thornbury, Scott. How to Teach Vocabulary. (Pearson Education Limited, London. 2002), p.
13. 5 Nation. Learning Vocabulary in Another Lamguage, (Cambridge University Press. 2001), p.
22
6 Joseph Mukoroli, Effective Vocabulary Teaching Strategies for the English for Academic
Puposes ESL Classroom. (SIT Graduate Institute, Vermont. 2011), p. 3.

3
when the learners want to listen, speak, read and also to write. Therefore it is
important for the students to have enough numbers of vocabularies so they can
understand and used the language to communicate well, However teaching and
learning vocabulary is a constant challenge for teachers as well as students
because based on the experiences when writer attended schools there is no
specific attention in learning vocabularies. It is supported by Ersan Sanusi in
his journal entitled The Techniques in Teaching Vocabularies he said many
teachers tend to stress teaching mostly on grammatical rules. In other sides,
they merely teach reading comprehension without giving clear explanation
about the techniques or methods on how to recognize the meaning of words
rather than on vocabulary in detail.7
The writer also found this case at SMP PGRI 01 Ciputat when the writer
did an observation at that school. The writer did teaching practices there last
year and most of the student have some difficultis that make their lack of
vocabulary and make the process of teaching and learning not going smoothly
because the teachers have to translate the words one by one. They said that there
do not know most of the words in the text because they do not have a subject
in class that tough them about vocabulary proficiencies. It seems these ideas,
the teaching of English vocabulary considered as a less important aspect in the
teaching-learning process. For this reason, Meara comment that if nowadays,
vocabulary is considered as a neglected aspect of language learning that has not
much change.8 In addition, it was revealed that many teachers assume that
vocabulary can be developed in teaching learning process.9 Due to this, an
increased emphasis on vocabulary development is crucial for the English
language learner in the process of language learning.10
7 Ersan Sanusi, The Techniques in Teaching Vocabularies, (Ittihad Jurnal Kopertis Wilayah
XI Kalimantan, Volume 7 No.11 Kalimantan; 2009). P.3.
8 Meara, Vocabulary acquisition: A neglected aspect of language learning. In V. Kinsella
(Ed.), Surveys I: Eight state-of-the-art articles on key areas in language teaching. (Cambridge:
Cambridge University Press: 1982). P.1.
9 Ersan Sanusi, loc. cit 10 Ibid., p. 3.

4
A lot of methods have been used to increased students proficiencies towards
vocabulary, such as crossword puzzles that been used by Yheni Silwi Utami in
her thesis.11 She said there were improvement in students vocabulary mastery.
Another method is using communicative language teaching by Erwan in his
thesis.12 He said there were slightly improvement in students’ vocabulary
mastery because there are some student that still can not respond to the
instruction that the teacher said. And the last is using Realia by Sulvi Maulidha
Fadillah.13 She said by using these techniques, students vocabulary mastery of
the experimental class was increased.
It can be stated that it is quite sensible to provide the students with teaching
of vocabulary as much attention as other aspects of language presented, such
grammar, pronunciation, and spelling. To solve these problems, English
teachers, of course, have to provide practical techniques on teaching vocabulary
that the students are able to develop their learning of new words independently.
The researcher has done literature review about the way to overcome the
problems. There are some ways that can be used to solve vocabulary problems.
So, the writer recommend this Visual material because this approach will be
implied in a fun ways and make the students enjoy their study. On a study that
was conducted by Dorela Kaçauni Konomi, “For each visual aid, Young
learners have different responses and expressions even because of their
different educational and cultural background. Using visual aids can help
learners understand the deep meaning of a topic and realize similarities and
differences between each topic.”14 Visual material itself means giving a visual
example to a word that will increase the understanding of the words. In a study
by Carpenter and Olson that was cited by Elisabeth in her article, “use of visuals
11 Yheni, Improving Students’ Vocabulary Mastery Using Crossword Puzzles for Grade VII
of SMP N 2 Srandakan in The Academic Year of 2013/2014 (Yogyakarta, UNY; 2014) 12 Erwan, The Teaching of Vocabulary Through Communicative Language Teaching
(Jakarta, UIN Jakarta; 2008) 13 Sulvi, The Influence of Using Realia on The Students’ Vocabulary Mastery at Junior High
School (Jakarta, UIN Jakarta; 2015)
14 Dorela, Using Visual Materials in Teaching Vocabulary in English as a Foreign Language
Classrooms with Young Learners (International Conference, New Perspective in Science
Educational) P.1.

5
such as pictures when teaching vocabulary in a foreign language was found to
be both effective and more easily remembered than independent use of
words”.15 While this particular study was used with adults, the strategy has been
applied to a wider population of learners, and has often been successful.
One of the media in visual materials to deliver the materials, teachers
can develop strategies and develop the use of media to teach vocabulary in the
classroom. With the development of technology, media that can be used by the
teacher as a teaching tool is also increasingly varied. One of those developed
materials is Infographic and it can be a new option for teachers to teach
vocabulary to students.
Infographic is an abbreviation of information and graphics. This media
present information in the image or graphic form. Infographic is the form of
data visualization that conveys complex information to the reader that can be
understood more easily and faster. An infographic is the visual display of any
data or information with the aim of presenting the information in a quick and
clear way. It may be named as data visualization, information design or
architecture of information depending on its aim.16 To make concise and clear
information in an infographic, an infographic maker should make the
information shorter and only choose a key point of information Considering
the importance of the words chosen and the problems that faced by students in
vocabulary learning, the researcher believes that the teacher can use a medium
to help them in teaching vocabulary and therefore students can practice using
the correct words. Due to this fact, the researcher wants to find the effect of
infographic on students vocabulary learning. In additional for the
implementation of infographic, the researcher will be using group discussion
15 Elisabet Pladevall Ballester, The Effects Of Using L1 Translation On Young Learners’
Foreign Language Vocabulary Learning. (Universidad Autónoma de Barcelona, Spain:2016) P.
114. 16 Pınar Nuhoğlu Kibar and Buket Akkoyunlu, A New Approach to Equip Students with
Visual Literacy Skills: Use of Infographics in Education (Hacettepe University, Turkey: 2014) P. 2.

6
to deliver the material. Group discussion is a flexible, peer-mediated strategy
that involves students serving as academic tutors and tutees.
B. The identification of the problem
Based on the background of the study above, there are some problem that
can be identified in this research such as;
1) Students were lack of vocabularies.
2) Students got difficulties in learning new vocabulary.
3) Teaching media for students in the classroom was insufficient.
C. Limitation of the problem
This study address to measure the effectiveness of using infographic to learn
vocabulary in 8th grade of SMP N 11 Tangerang year of 2019/2020.
D. Formulation of the study
The formulation of the study is in these following questions: First. Is it
effective to learn vocabulary using infographic? Second. to what extend
infographic effective for teaching vocabulary? At eight grade of SMP N 11
Tangerang year of 2019/2020.
E. Objectives of the study
The objective of the study is to find the effectiveness of teaching vocabulary
by using Infographic At eight grade of SMP N 11 Tangerang year of 2019/2020.
F. Significant of the study
This study may help the student to learn about vocabulary even though
there are no specific material for learning vocabulary
For teachers will be able to choose the alternatives way to teaching
vocabulary using visual material and give the information for English teacher
about the effectiveness of infographic in English teaching and learning process.
Because using infographic is expected to support and atract the students’

7
interest in learning English and make them easier to memorize English
vocabulary. Furthermore, this study is expected to be useful to support the
previous research and preferences for other researcher who are interested in
conducting the same research.

8
CHAPTER II
THEORITICAL FRAMEWORK
This chapter of theoretical framework reviews the theories about the
research. Then, it presents some previous studies related to the research,
thinking framework of the research and hypothesis of the research.
A. Vocabulary
1. General Concept of Vocabulary
To speak in English the students might not only master the structure
but also master the vocabulary. Vocabulary can not be conveyed correctly
without grammar in communication. To make a comprehensible
communication the students have to master both of them, vocabulary and
grammar.
Mastering vocabulary helps the students to express their ideas
clearly, obviously, and without repeating their ideas in conversation. When
the students learn about vocabulary, the first thing that they remember is a
word. But, everybody has different view of vocabulary; to have the same
view the writer tries to convey some definitions of vocabulary from some
experts.
According to Evelyn Hatch and Cheryl Brown, “Vocabulary is one
of language elements is considered as a list or set of words for a particular
language or a list or set words that individual speakers of language might
use”. 1 It means that vocabulary is a group of words that the speakers used
in their daily conversation. In the other word, vocabulary is the word that
is learned by the students in second language learning. Those words can be
a single word or more than single word. Words can be divided into four
types, they are: High frequency word, Academic word, Technical word and
Low frequency word.2 The further explanation as follows:
1 Evelyn Hatch and Cheryl Brown, Vocabulary, Semantic, And
Language Education,(Cambridge: Cambridge university press, 1995), p.1. 2 Nation. Learning Vocabulary in Another Lamguage, (Cambridge University
Press. 2001), P. 15-17.
9
a. High frequency word
These words are needed frequent words for formal and
informal uses. Basically, these words consist of function words
(a, at, four, etc) and content words (noun, verb, adjective etc).
b. Academic word
Academic words are the list of words that important for
learners who want use English in higher education.. The example
of academic word is word in academic writing such as in
geography text, laboratory manuals, academic article, etc.
c. Technical word
The text contains some words that are very closely related to
the topic and the subject area of the text. Some words with the
same meaning and some with different meaning. For example
by-pass and neck occur very frequently in medicine and are
technical words in that area. They also occur outside that area.
d. Low frequency word
Low frequency words are diverse group. They include (1)
words that are not quite frequent or wide range enough to be high
frequency word (abort, absorb, accelerate, acid, etc), (2)
technical word from other area (one person’s technical
vocabulary is another person’s low frequency vocabulary), (3)
word that just occur rarely
Usually, the students find those kinds of words in written or
spoken form depending on the topic that the students talk about. From all
those kind of words, the students have to know the usage of them in order
to create a comprehensible conversation among speakers. Good
understanding in vocabulary usage helps the learners to use the words in
speaking and writing correctly
Furthermore, as cited by Yulia in her research, Harmer said
10
“Vocabulary is more than merely a list of words. It is word, which
expresses meaning, but meaning is a slippery concept. Some words may
appear to be simple to refer to one thing and therefore, easy to teach, but
some words may also be difficult to teach because their meaning may
change depend on the words they are attached with”.3
Based on the definition above, it can be said that in English
each word has more than one meaning, it depends on the words which are
combined with. That’s why the students have to use the dictionary at first
to know the function of the words, such as whether it is functioned as noun,
verb, adverb etc.
Meanwhile, Huebener stated that “The subject matter of
language consists essentially of a stock of words and expressions and of
the rules that govern the syntax of its speech pattern that is vocabulary and
grammar”.4 Language is used to communicate among speaker, when the
communication is begun the speakers use the words in delivering their
ideas. Surely, it can be understood by the listener if the speakers use the
correct grammatical structure.
In conclusion, vocabulary is an important element of
language that consists of the information about meaning and the usage of
words in language. Those words are taught to create a comprehensible
communication among the speakers. Communication in foreign language
especially English the students not only have to master the grammatical
structure but also the vocabulary. Good vocabulary comes with learner’s
ability in thinking logically and in learning easily and quickly.
2. Kinds of Vocabulary
Here are the types of vocabulary in teaching English as a foreign
language in specific references in nation vocabulary divided such a word
3 Yulia Mawaddah, Using Games in Teaching Vocabulary, (State Islamic
University Syarif Hidayatullah, Jakarta. 2010) P.19.
4 Ibid, P.19.

11
as cited by Fauzan Azima in his journal.
a. Receptive Vocabulary: Knowing a word involves being able to
recognize it when it is heard (What is the sound like?) or when it seen
(What does it look like?) and having an expectation of what
grammatical pattern the word will occurrence. This includes being
able to distinguish it from word with a similar form and being able to
judge if the word form sounds right or look right.
b. Productive Vocabulary: Knowing a word involves being able to
pronounce the word, how to write and to spell it, how to use it in
grammatical pattern along with the word in usually collocates with it,
it also involves not using the word too often if it is typically a low
frequency word and using it in a suitable situation using the word to
stand for the meaning it represents and being able to think of suitable
substitutes for the word if there any.5 Aeborsold and Field Classified
vocabulary into two terms, there are:
a) Active Vocabulary refers to items the learner can use
appropriately in speaking or writing and it is also called as
productive vocabulary, although, in fact, it is more difficult to put
into practice. It means that to use the productive vocabulary, the
students are supposed to know how to pronounce it well, they
must know and be able to use grammar of the language target,
they are also hoped to familiar with collocation and understand
the connotation meaning of the words. This type is often used in
speaking and writing skill.
b) Passive Vocabulary refers to a language items that can be
recognizes and understood in the context of reading or listening
and also called asreceptive Vocabulary. Passive Vocabulary or
comprehension consists of the words comprehended by the
5 Fauzan Azima, Teaching Vocabulary Through Verbal Techniques,
(Sumatera, Bung Hatta University). P.3.

12
people, when they read and listen.
From the explanation above, we know that every expert in every
book is different in classifying the kinds of vocabulary, because every
person has their own different ways in showing and telling their opinions
and ideas. It means that vocabulary has two kinds of function and content
words.
Vocabulary is important in case it could help the students to enjoy
their classes. One who masters enough vocabulary will find fewer
difficulties than those who have fewer vocabularies. When they read a
certain text, they will easily get the information from it since they can
understand every word in the text. On the others hand, those who lack of
vocabulary will face a lot of problems. Mastering vocabulary will be useful
for the process of achieving language- teaching objectives. That is the
mastery of language skills (Listening, Speaking, Reading, and Writing). If
we want to communicate with others in certain language, we must master
the language they belong to especially to know enough vocabulary of those
languages. Without vocabulary, someone cannot communicate effectively
or express idea and having a limited vocabulary is also a barrier.
3. Problem in Teaching Vocabulary
When the teacher teaches vocabulary in the classroom, it is not easy
as somebody thinks; there are many problems occurred. According to
Penny Ur said as cited by Rahayu in her research, there are some problems
in teaching vocabulary namely, discipline, correcting written assignment,
interest, effective learning for all, material, individual awareness, and
participation. For further explanation as follows:6
“[a] Discipline: to control discipline problem in the class is very
6 Anggi Juwita, Problem in teaching vocabulary, retrieved on June 25th, 2019
from: https://anggijuwitarahayu.wordpress.com/assignment/ict-final-assignment/.

13
difficult. When vocabulary teaching learning activity begun many
students didn‟t care about the material. The teachers have to control this
condition in order to create effective teaching learning process. [b]
Correcting written assignment. The students should know the written
form of the word, in English a word with different written is different
meaning. When they do this mistake; it is a fatal mistake.That problem
should be solved by the teacher by providing the written form of the
words. [c] Interest. Some students sometime get bored in learning
vocabulary; it should be solved by delivering various methods in it. The
teacher should be creative in teaching vocabulary. [d] Material.
Sometime the teacher can not find a suitable material according to the
student‟s need. It is important to find suitable material in order to use
the time effectively by teaching the appropriate vocabulary. [e]
Individual awareness. There are many students in the classroom and
they are different each other. The teacher should know each
characteristic, as much as most of the students don‟t aware about the
material that should be learned by them. They don‟t care about it. It is
teacher‟s obligation to guide the learners to keep attentionin
learning vocabulary. [f]. Participation. In teaching learning process the
students are expected to be active in every single act. But in the fact
only some of them active in the classroom, most of them are shy, lazy,
bored, etc. it should be solve by using interesting method that increase
student‟s interest in learning vocabulary.”
Those problems usually occurred in teaching learning process, it must be
solved in order to create effective result of teaching learning activity. To solve
the problems the teacher should use the principle of vocabulary that mentioned
above. When the principle of vocabulary can be conducted well in the classroom,
teaching learning vocabulary can be more effective and fun for the students.

14
B. Infographic
1. Definition
The definition of pictures based on Wikipedia is a group of
coloured points on a flat surface that looks the same as something
else.7
While pictures according to Mariana Karim and Fatmi
Ahmad “are the visual aids, which can give information more clearly
than thing which are expressed by words.8 Moreover, pictures
according to Arief that was cited by Kharidi are the simplification
or imitation from the real things.”9
So, from the definitions above, it show that pictures are
imitation from the real things which can give a clear description
about the problem described. Visual media from its inception has
been frequently used by many people because the preparation is
usually easier than other media. Along with the development of
technology, visual media has been a significant progress. One of the
newest visual media is infographic.
Infographic is abbreviation form of information and graphic.
It means that the information has been presented in graphs form. The
infographic or information graphic is a visual representation of
information, data or knowledge. In infographic, a mark, a symbol or
visual element typically stand for quantitative information, data or
knowledge. Color, size, and shape usually provide the qualitative
aspect. Infographic uses text as labels and for short explanations to
make the data useful. Think of charts, diagrams, graphs, maps,
timelines and modern visualizations that are not yet named.10
7 Wikipedia, What is Picture, retrieved on June 25th, 2019 from:
https://simple.wikipedia.org/wiki/Picture
8 Khoridi, Learning Vocabulary Through Pictures Dictionary, (State Islamic
University Syarif Hidayatullah, Jakarta. 2009). P.14.
9 Ibid. P.14.
10 Connie, Infoposters are not infographics, (n.d.) Retrieved February 10th, 2019 from:

15
Another definition of the infographic is a picture in blend
form of data with a design that help individuals and organizations
concisely communicate the messages to their audience. More
formally, infographic is defined as a data or ideas visualization that
tries to convey complex information to the audience that can be
quickly consumed and easily understood.11
Based on several definitions about infographic above, it can
be concluded that infographic is information or data representation
in a visual graphic form that is used to make complex data or
information easy to understand quickly and clearly by the audience.
2. Kind of Infographic
There are some kinds of infographics that can be used depending
on the purpose of the infographic. The types are12
a. Static Infographic
The static infographic is infographic which presents in static
visual without any audio or animated concepts that can move.
This kind of infographic is arguably simplest than other kinds
of the infographic and mostly used by people in every need.
This is an example of static infographic13
http://understandinggraphics.com/visualizations/infoposters-are-not-infographics/
11 Mark Smiciklas, The Power of Infographic, (Indiana Polis: Que Publishing, 2012), p. 3
12 Maxmanroe, What is Infografik, Retrieved on February 10th, 2019 from:
https://www.maxmanroe.com/pengertian-infografis.html/
13 Praactical AAC, Example of static infographic, retrieved on February 10th, 2019 from:
https://praacticalaac.org/praactical/worth-repeating-big-ideas-in-teaching-aac-vocabulary/

16
Figure 2.1. Example of static infographic
b. Animation Infographic
Animation infographic is infographic in animation video
form, either 2D or 3D form. This kind of infographic can be
used on television or online media like YouTube.
This is an example of animation infographic14
Figure 2.2. Example of animation infographic
14 DigitalE, Example of animation infographic, retrieved on February 10th, 2019 from:
https://www.youtube.com/watch?v=ThiCMd5kGbE

17
c. Interactive Infographic
The interactive infographic is the most complex kind of
infographic. This kind infographic usually uses on a website.
The user can have interactions with the information which
shown through the user interface. With an interactive
infographic, the user explores the information according to
their purpose.
This is an example of interactive infographic15
Figure 2.3. Example of interactive infographic
3. Advantages of Using Infographic
Nowadays, people used infographic in many purposes such as
mass media, business, education, etc. In advertising, for example,
infographic usually used to made a poster that have a lot of information
in a peace of paper. Another example of the use of infographic is in
education interests. In education, infographic used to help the teacher
in delivering the subject matter to students. Some teachers see the
15 Animalz, Example of Interactive Infographic, retrieved on February 10th, 2019 from:
https://getdolphins.com/blog/15-interactive-infographic-examples/

18
infographic as a potential visual medium that can be used in the
teaching process.
There are many infographics for education purpose especially for
learning English that can be found easily on the internet. English
teacher can use the infographic for teaching such as grammar, writing,
vocabulary and other English skills.
C. Teaching Vocabulary Using Infographic
In teaching and learning process, a teacher needed a method to
be used in the teaching process. As we know, Infographic is a media
in teaching and learning process, it still needed a method to be applied
in the classroom. In this research, the writer will be using peer tutoring
method in teaching vocabulary using infographic media. Group
discussion is a teaching process that involves other students as the
tutor that helps the students to understand more about the topics that
are being tough.
These are the steps in applying the infographic in teaching process
by using group discussion method:
1) Divide the students in to a group consist of four people.
2) Choose a topic to be used in each group.
3) Ask the students to make infographic about a topic of their group
in their own version
4) Make sure the students choose the word that they already learn in
class to make it easier for their friends to understand.
5) In the next meeting, ask the students to present their infographic
to other group and ask the other to listen the other presentation
and write some information that they can get from their friends
in the group.
6) When all students finish their presentation, the teacher make a
little quiz to know their understanding about what their friends
presentation.

19
D. Previous Related Study
The first study came from Zeni Syafirah entitled improving
vocabulary mastery through vocabulary cards of grade vii students at
SMP Institut Indonesia yogyakarta in the 2015/ 2016 academic year.
The finding of this study is that the use of vocabulary cards to teach
vocabulary could improve the students’ vocabulary mastery at SMP
Institut Indonesia Yogyakarta. The results of the research show that
there is improvement of the students’ vocabulary mastery through the
use of vocabulary cards. By implementing vocabulary cards game the
students became more confident to speak up and easier to memorize
new words. It also made the students participate more in the learning
activities and get more chance to communicate. The improvement was
also supported by the students’ average score which increased to 68.8
from the average score of pre-test which was 49.3.16
The second came from Ahmad Fadhil entitled An Analysis of
Students’ Perception in Learning English Grammar through
Infographics. in this research, the researcher wants to know students
perception in learning grammar through this media. A quantitative
descriptive design was used in this study. In addition, purposive
sampling was used in this reseacher. Then, the data was collected
through questionnaire spreading to 32 English Department Students
who had taken Instructional Media class. After that, the data obtained
were analyzed by SPSS 25 Software. The result showed that the
infographics were very understandable in learning grammar answered
by high percentages of the respondent. In addition, the majority of the
respondent believed that the infographics helped them to remember
material easily. Moreover, it gave many advantages in the learning
16 Zeni Syafirah, improving vocabulary mastery through vocabulary cards of grade vii
students at SMP Institut Indonesia yogyakarta in the 2015/ 2016, (Yogyakarta State University,
Yogyakarya. 2016).

20
process and it was also more shareable than regular grammar textbook
based on the result of students’ perception. Therefore, it can be
concluded that Infographics is effective in learning English
grammar.17
And the last study come from Mahdah Ridaillah entitled The
Effect of Infographic on Students’ Writing Summary Skill: (A Quasi-
Experimental Study at Elevent Grade Students of MAN 2 Bogor
Academic Year 2017/2018). The aim of this research is to obtain the
empirical data about the effect of infographic on students’ writing
summary skill. The writer used Quasi-experimental research design
which classified as quantitative data method. The result of this
research analyzed using SPSS 20 program and the result shown that
infographic have positive effect on students’ writing skill. The
calculation of the effect size of this research was 0.27, which indicated
that this research has modest effect size. So, it can be concluded that
infographic shows the significant effect on students’ writing summary
skill at the eleventh grade of MAN 2 Bogor.18
There are similarities and differences that can be found based
on the previous studies above. The similarities are the purpose of the
studies are to find out whether there is an effect of the use of
infographic on some aspects.
The differences of Zeni Syafirah than Mahdah and Ahmah
Fadhil was in the method. Zeni used Class Action Research in other
hand Mahdah and Fadhil was using quantitative method. Eventhough
its different, they still have the same improvement on hteir reserch.
17 Ahmad Fadhil, An Analysis of Students’ Perception in Learning English Grammar
through Infographics. (Ar-Raniry State Islamic University Darussalam, Banda Aceh, 2018).
18 Mahdah Ridailah, The Effect of Infographic on Students’ Writing Summary Skill. (State
Islamic University Syarif Hidayatullah, Jakarta. 2018)

21
E. Thinking Framework
Vocabulary is part of language that support all language skill
such as speaking, writing, listening and also reading. even vocabulary
support grammatical capabilities. Students find it hard to study
English because they lack of vocabulary that they have to use in
English. Because of that, students always think English is difficult and
at the end they will lack interest in the English language itself.
Whereas, English subject is an important matter at school. Even
there is English test in national exam which mean if they are not study
it well, they will be difficult to achieve the good score. Furthermore,
English is a subject that need exposure which mean they have to repeat
it again and again in order to master it.
What make it worse was, at school there are no specific subject
or activity for the student to learn vocabulary. All they can do is self
learnt with some media. The teacher has to find a way to overcome
the problem. That why to support the media for students, the
researcher used this infographic as the media for students to learnt
vocabulary by themselves.
By using infographic as teaching media, students will
understand more vocabulary, and the learning material. In addition,
students also will understand more how to use vocabulary.
Infographic can attract students’ attention and help students with
visual learning style in teaching-learning process. Students can easily
understand the information and main idea on the infographic.
Therefore, infographic can give significant effect on students‟
learning vocabulary rather than students who do not use infograpic.
B. Research Hypothesis
Based on the theories, explanations, and thoughts above, therefore,
the writer assumes that infographic can give significant effect on
students‟ vocabulary learning.

22
CHAPTER III
RESEARCH METHODOLOGY
This chapter explains the method and research design, the place and time of
the research, the population and sample, the technique of data collection, also the
technique of data analysis.
A. Place and time of the research
The writer conducted the research at SMP Negeri 11 Tangerang, which is
located at Jl. Inpres 18 No.26, RT.002/RW.8, Kota Tangerang, Banten 15154.
The writer will do the study and take the data in the first semester of eighth
grade students. This study will start on August – September 2019
B. Method and research design
In this research, the researcher used a quantitative method. Why researcher
used this method because researcher need the statistical data to know the effect
of this research. In addition, the research design used in this research is a quasi-
experimental study. As Goddard and Melville’s view, experimental research is
primarily concerned with cause and effect that was did by Researchers to
identify the variables of interest and try to determine if changes in one variable
(called the independent variable, or cause) result changes in another (called the
dependent variable, or effect).1 The writer applied an experimental study which
used two groups of sample; control and experimental group to investigate the
effect of infographic on students’ writing of vocabulary learning. The
experimental group is the group that received the treatment using media tutorial
video, meanwhile the control group is the group that received the treatment
using teacher’s presentation. The writer also used pre-test before the treatment
and post-test after the treatment for two groups of sample.
1 Wayne Goddard & Stuart Melville, Research Methodology: An Introduction, (Lansdowne:
Juta, 2001), p.8.

23
Table 3.1
Design of the Study
Control Group P1 Y P2
Experimental Group P1 X P2
Explanation:
P1 : Pre-Test
P2 : Post-Test
X : Treatment with Infographic game
Y : Treatment with non-Infographic game
C. Population and sample
The population of this research was students at the eighth grade of SMPN
11 Kota Tangerang in the academic year of 2019/2020. There were 355
eighth grade in this school. The eighth grade was divided into ten classes
from 8.1, 8.2, 8.3, 8.4, 8.5, 8.6, 8.7, 8.8, 8.9, and 8.10.
The sampling technique which was used in this research was purposive
sampling. Purposive sampling was selected because there was a specific
purpose.2 The English teacher in SMPN 11 Kota Tangerang suggested
conducting the research in class 8.4 because in the previous test this class
got lower scores than class 8.2. Therefore, the experimental class was 8.4
and the controlled class was 8.2. Each class consisted of 35 students and the
total of the sample was 70 students.
D. Research instrument
In this research, researcher will be using an instrument that have been
used by another researcher in their research.3 Researcher choose this
2 Louis Cohen, Lawrence Manion, and Keith Morrison, Research Methods in Education,
sixth edition, (New York: Routledge, 2007), pp. 114 – 115. 3 Yuni Triandini, The Effect of Pictionary Game on Students’ Vocabulary Retention. (Jakarta,
UIN Syarif Hidayatullah, 2017).

24
instrument because it had the same grade with the population that researcher
want to test, and it also had the same topic and purpose.
The research instrument in this research was test. The test consisted of
30 multiple choices questions, with a, b, c, and d as choices. The chosen
vocabularies were adjusted to the students’ level. The score for the right
answer was 1, while the score for the wrong answer was 0.
Table 3.2
Specification of Tests
Variable Aspects Indicators Item Numbers Total
Vocabulary Noun Students are able to 1, 3, 5, 7, 9, 10
Retention identify and choose the 11, 13, 14, 15,
right concrete noun in the 30
right context
Verb Students are able to 2, 4, 17, 19, 8
identify and choose the 20, 22, 27, 28,
right verbs in the right
context
Adjective Students are able to 6, 8, 10, 16, 11
identify and choose the 18, 23, 24, 25,
right adjective in the right 26, 29
context
Adverb Students are able to 12, 21 2
identify and choose adverb
in the right context
Total 30

25
The criteria of a good test are valid and reliable. In order to find out
the tests that were used for the pre-test and post-test were valid and
reliable or not, piloting study was conducted in different class, not in the
controlled class or in the experimental class. After doing piloting study,
the test was analyzed its validity and reliability.
1. Validity
One of the criteria of a good test is validity. The validity of the
test means that it really measures what is intended to be measured.4
In this research, the test could be claimed that it was valid if it really
measured the students’ vocabulary retention. There was nothing else
that was measured in this test except vocabulary retention. In order to
see the validity ANATES program was used to know the validity of
the test. For the construct validity, it could be seen in Table 3.2, that
each number really measured certain kind of vocabularies, such as
the verb, adjective, noun, and adverb.
2. Reliability
Another criterion of an ideal test is reliability. Reliability of the
test means that the result of the test is consistent in different
occasion.5 Before administering the test in controlled and
experimental class, the test was done in another class to measure its
reliability. To know whether the test was reliable or not, ANATES
program was used in this research. According to Cohen, here is the
reliability coefficient:6
>0.90 very highly reliable
0.80–0.90 highly reliable
0.70–0.79 reliable
4 J.B. Heaton, Writing English Language Tests, (New York: Longman Inc., 1990), p. 159. 5 Ibid., p. 162. 6 Cohen., Op. Cit., p. 506.

26
0.60–0.69 marginally/minimally reliable
<0.60 unacceptably low reliability
Based on the piloting study that was done in the other class, the
result from piloting study was analyzed by using ANATES program.
The result from ANATES program of the validity and reliability of
the test could be seen as follows:
Table 3.3
The Result of Validity and Reliability of the Tests
Total Tested Items 70
Total Subject 20
Total Significance of the Items 60
Correlation XY 0.80
Reliability of the Test 0.89
Based on the description on Table 3.3, the total of tested items
for pre-test and post-test were 70, 35 items would be used for pre-test
and 35 others would be for post-test. However, the result showed that
there were only 60 items that were valid and reliable. The value of
validity of the test was 0.80, while the value of reliability of the test
was 0.89. Therefore, the items that were used for pre-test and post-test
were 30 items for pre-test and 30 items for post-test. The result of
ANATES program to see the validity and reliability could be seen in
Appendix 2.
As the secondary data to support the statistical data, researcher
would be using an interview. The researcher would randomly choose
two persons from experimental class to be interviewed with the
following question:

27
E. Technique of data collection
In this research, tests were conducted to measure the students’
vocabulary retention. The tests were done two times before the research
was conducted and after the research was conducted. Before conducting
the research, the pre-test was administered in order to find out the
students’ vocabulary achievement in both controlled class and
experimental class. The test consisted of 30 multiple choices questions,
with a, b, c, and d as choices. The chosen vocabularies were adjusted to
the students’ level. The score for the right answer was 1, meanwhile, the
score for the wrong answer was 0.
After conducting the research, the post-test was done in order to
know the students’ achievement in both controlled class and
experimental class. The test consisted of 30 multiple choices questions,
with a, b, c, and d as choices. The chosen vocabularies were different
from pre-test, but it had a similar level of difficulty.
F. Data analysis procedure
After obtaining the score of pre-test and post-test, the following
step that was done was analyzing the result of the test. Analyzing the data
was done by doing the normality test and homogeneity test by using
SPSS 20 program.
1. Normality test
In this research, the writer conducted the test of normality through
SPSS (Special Package for the Social Sciences) version 20. The test
of normality is need to be done in order to know whether the
distribution of data were normal or not. Kolmogorov Swirnnov and
Shapiro Wilk table was used in this test of normality. If the result of
normality test was above 0.05, then it could be said that the
distribution of data was normal. On the other hand, if the result
showed less than 0.05, then it could be said the distribution of data
were not normal.

28
2. Homogeneity test
After knowing the result of the normality test, the next step is to
be done is homogeneity test. Test of homogeneity is to be done in
order to know the similarity between two groups or classes. Levene’s
table was used in this test of homogeneity by using SPSS version 20
software.
3. Test of hypothesis
After the writer conducted the test of normality and homogeneity,
the writer needed to analyze the result of pre-test and post-test from
the experimental and control class by using SPSS version 20
software. In order to find out the difference between the experimental
class which taught by using tutorial video and the control class which
taught with teacher’s presentation or without tutorial video, the writer
used T-test to compare them.
4. Effect size formulation
Knowing the effect size formulation is needed and to know the effect
size, the writer used the theory of Cohen’s d. As stated by Muijs to
know whether the effect size is weak or strong the theory of Cohen’s
d can be used. The formula as follows:7
d = (Mean for group A—Mean for group B)
Pooled standard deviation
Explanation:
d : effect size
Mean for group A : Mean for experimental class
Mean for group B : Mean for controlled class
Pooled standard deviation : (Standard deviation of group 1 +
standard deviation of group 2) / 2
7 Daniel Muijs, Doing Quantitative Research in Education With SPSS, (London: Sage
Publications Ltd, 2004), p. 136.

29
After knowing the result, the data can be interpreted based on
some guidelines by Cohen.8 The guidelines showed in the table 3.4.
Table 3.4
The Criteria of Size Effect
The Criteria
0 – 0.20 Weak effect
0.21 – 0.50 Modest effect
0.51– 1.00 Moderate effect
> 1.00 Strong effect
G. Statistical hypothesis
Statistical analysis used as follows:
Ho = Null Hypothesis
Ha = Alternative Hypothesis
(H0): There is no significant effect of using infographic on students’
learning vocabularies at the eighth grade students of SMP Negeri 11
Kota Tangerang.
(Ha): There is significant effect of using infographic on students’
learning vocabularies at the eighth grade students of SMP Negeri 11
Kota Tangerang.
Then, the criteria of the hypothesis used as follows:
a. If t-test (t0) > t-table (tt) in the significant degree of 0.05, H0
(null hypothesis) was rejected. It meant the means score of
the experimental class are higher than the control class. The
infographic gave the effect on students’ vocabulary learning.
8 Ibid., p. 139

30
b. If t-test (t0) < t-table (tt) in the significant degree of 0.05, H0
(null hypothesis) was accepted. It meant the rates of the
means score of the experimental class are same as or lower
than control class. The infographic did not give the effect on
the students’ learning vocabulary.

31
CHAPTER IV
RESEARCH FINDINGS AND INTERPRETATION
This chapter presents the data description consisting of the score of pre-test,
post-test of the experimental class and the control class. Also, the discussion of the
research finding is explained in this chapter.
A. Research Findings
This part shows the result of the test given to the sample, the students of SMP
Negeri 11 Kota Tangerang. The result was used to get empirical evidence about the
effect of Infographic on students’ vocabulary learning at the eighth grade of SMP
Negeri 11 Kota Tangerang in academic year 2019/2020
1. Description of the data
a. The data of experiment class
The experimental class in this research was VIII-2 students of SMP
Negeri 11 Kota Tangerang which consisted of 35 students taught by
Infographic. The writer conducted the pre-test before the students got the
treatment using Infographic. The pre-test is used to measure students’
vocabulary learning before the treatment given. While post-test was
conducted after the students got the treatment. The data showed as follows:
Table 4.1
Students’ Pre-test and Post-test Scores of Experimental Class
Name Pre post
Student 1 53 83
Student 2 50 87
Student 3 60 77
Student 4 67 83
Student 5 53 87
Student 6 60 73
Student 7 50 73
Student 8 47 70
Student 9 50 70

32
Student 10 50 83
Student 11 53 73
Student 12 57 73
Student 13 70 93
Student 14 73 87
Student 15 63 70
Student 16 53 77
Student 17 57 77
Student 18 70 67
Student 19 67 70
Student 20 63 97
Student 21 63 77
Student 22 53 77
Student 23 47 83
Student 24 70 83
Student 25 70 85
Student 26 57 73
Student 27 57 67
Student 28 60 63
Student 29 47 67
Student 30 40 70
Student 31 63 67
Student 32 67 80
Student 33 60 70
Student 34 60 63
Student 35 73 80
Total 2053 2675
Mean 58,7 76,4
Based on the data above, the sum score of pre-test that achieved by
VIII-2 or experimental students is 2053 and the mean score of pre-test is
58.7. The lowest score of pre-test is 40 and the highest is 73. It means that
there are still many students who have a low understanding on the
vocabulary. Meanwhile, the sum score of post-test is 2675 and the mean
score is 76.4. The lowest score of post-test is 63 and the highest is 97. It can
be concluded that there is a difference in the pre-test and post-test score of
experimental class.

33
b. The data of control class
The control class was VIII-4 students of SMP Negeri 11 Kota
Tangerang which consisted of 35 students who did not get the treatment by
using Infographic or using teacher’s presentation. The data were collected
from student’s pre-test score and post-test score. The data is presented in
Table 4.2.
Table 4.2
Students’ Pre-test and Post-test Scores of Control Class
Name Pre Post
Student 1 57 63
Student 2 50 63
Student 3 60 67
Student 4 53 57
Student 5 53 63
Student 6 57 77
Student 7 60 77
Student 8 60 63
Student 9 60 73
Student 10 47 73
Student 11 50 70
Student 12 50 70
Student 13 60 73
Student 14 73 83
Student 15 70 80
Student 16 70 83
Student 17 63 67
Student 18 57 53
Student 19 50 53
Student 20 60 73
Student 21 60 77
Student 22 63 70
Student 23 67 67
Student 24 63 77
Student 25 70 77
Student 26 53 73
Student 27 53 70
Student 28 57 77

34
Student 29 47 67
Student 30 60 67
Student 31 73 83
Student 32 70 77
Student 33 70 80
Student 34 67 67
Student 35 53 63
Total 2086 2473
Mean 59.6 70.7
The data shows the score of 30 students in VIII-4, the sum score of
pre-test is 2086 and the mean score of pre-test is 59,6. The lowest score of
pre-test is 47 and the highest is 70. Meanwhile, the sum score of post-test is
2473 and the the mean score of post-test is 70.65714, the lowest score of
post-test is 53 and the highest score is 80.
Based on table 4.1 and 4.2, it can be seen that the post-test score of
the experimental class is higher than the control class. As mention before,
in analyzing the data from the result of pre-test and post-test, the writer
calculated the gained score to decide significance difference of students’
writing score before and after using Infographic. The gained score of
experimental and control class can be seen in Table 4.3 and 4.4.
Table 4.3
The Gained Score of Experimental Class
Name Pre Post Gained Score
Student 1 53 83 30
Student 2 50 87 37
Student 3 60 77 17
Student 4 67 83 16
Student 5 53 87 34
Student 6 60 73 13
Student 7 50 73 23
Student 8 47 70 23
Student 9 50 70 20
Student 10 50 83 33

35
Student 11 53 73 20
Student 12 57 73 16
Student 13 70 93 23
Student 14 73 87 14
Student 15 63 70 7
Student 16 53 77 24
Student 17 57 77 20
Student 18 70 67 -3
Student 19 67 70 3
Student 20 63 97 34
Student 21 63 77 14
Student 22 53 77 24
Student 23 47 83 36
Student 24 70 83 13
Student 25 70 85 15
Student 26 57 73 16
Student 27 57 67 10
Student 28 60 63 3
Student 29 47 67 20
Student 30 40 70 30
Student 31 63 67 4
Student 32 67 80 13
Student 33 60 70 10
Student 34 60 63 3
Student 35 73 80 7
Total 2053 2675 622
Mean 58,7 76,4 17,8
The table 4.3 shows the minimum gained score is -3 and the
maximum gained score is 37. The sum of gained score is 622 and the mean
of the gained score is 17,8
Table 4.4
The Gained Score of Control Class
Name Pre Post Gained Score
Student 1 57 63 6
Student 2 50 63 13
Student 3 60 67 7

36
Student 4 53 57 4
Student 5 53 63 10
Student 6 57 77 20
Student 7 60 77 17
Student 8 60 63 3
Student 9 60 73 13
Student 10 47 73 26
Student 11 50 70 20
Student 12 50 70 20
Student 13 60 73 13
Student 14 73 83 10
Student 15 70 80 10
Student 16 70 83 13
Student 17 63 67 4
Student 18 57 53 -4
Student 19 50 53 3
Student 20 60 73 13
Student 21 60 77 17
Student 22 63 70 7
Student 23 67 67 0
Student 24 63 77 14
Student 25 70 77 7
Student 26 53 73 20
Student 27 53 70 17
Student 28 57 77 20
Student 29 47 67 20
Student 30 60 67 7
Student 31 73 83 10
Student 32 70 77 7
Student 33 70 80 10
Student 34 67 67 0
Student 35 53 63 10
Total 2086 2473 387
Mean 59,6 70,7 11,1
Based on the data in table 4.4, it can be seen that the minimum
gained score is -4 and the maximum gained score is 20. Otherwise, the sum
of the gained score is 387 and the mean score of gained score is 11,1.

37
Based on the data, it shows the difference between students’ score
in experimental and control class. The score of the experimental class which
taught by infographic in their vocabulary learning was higher than the score
of control class which learned vocabulary with teacher presentation. The
progress of the experimental and the control class can be seen in Figure 4.1.
Figure 4.1
The Difference between Students’ Score in Experimental and Control Class
2. Analysis Data
a. The Normality test
The writer conducted the normality test before calculating the t-test.
It purposed to know whether the data from the two classes have been
normally distributed or not. The result of normality test on both the
experimental and control class either pre or post-test score were gained
from Kolmogorov-Smirnov and Shapiro-Wilk table using IBM
Statistics SPSS version 20. The result can be seen as follows:
1) Pre – Test
2053 2086
26752473
0
500
1000
1500
2000
2500
3000
Experimental Control
Pre-test Post test

38
Table 4.5
Tests of Normality
Tests of Normality
Kolmogorov-Smirnova Shapiro-Wilk
Statistic df Sig. Statistic df Sig.
Score Experimental .119 35 .200* .964 35 .309
Control .136 35 .099 .943 35 .069
*. This is a lower bound of the true significance.
a. Lilliefors Significance Correction
The result of the normality test showed that the
significance level of the experimental class was 0.200 and
0.309 and the control one was 0.099 and 0.069. It means that
the probability value (p) of both experimental and control
class was higher than (>) the degree of significance 5% (α =
0.05). Therefore, it is concluded that the data of both the
experimental and the control class’ pre-test was normally
distributed.
2) Post - Test
Table 4.6
Tests of Normality
Tests of Normality
Kolmogorov-Smirnova Shapiro-Wilk
Statistic df Sig. Statistic df Sig.
Score Experimental .145 35 .060 .957 35 .190
Control .132 35 .131 .951 35 .125

39
a. Lilliefors Significance Correction
The result of the normality test for the post-test
showed that the significance level of the experimental class
was 0.060 and 0.190 and the control one was 0.131 and
0.125. It means that the probability value (p) of both
experimental and control class was higher than (>) the
degree of significance 5% (α = 0.05). Therefore, it is
concluded that the data of both the experimental and the
control class was normally distributed.
b. The Homogeneity Test
After doing the normality test, the homogeneity test was also
required in order to test the similarity of the sample in the experimental
class and control class. To calculate homogeneity test, the researcher
used Levene Statistic Test from IBM Statistics SPSS version 20. The
following is the result which was obtained from the test:
Table 4.7
Homogeneity of Variances Test of Pre-test
Test of Homogeneity of Variances
Score
Levene
Statistic
df1 df2 Sig.
.736 1 68 .394
Based on table 4.7, the result of Levene Statistic Test showed that
the significance of pre-test between experimental class and control class
was 0.394. Therefore, the data of pre-test was homogenous because it
was higher than 0.05.
40
Table 4.8
Homogeneity of Variances Test of Post-test
Test of Homogeneity of Variances
Score
Levene
Statistic
df1 df2 Sig.
.196 1 68 .659
From the result of the Levene Statistic Test, it has seen that the
significance level or probability value (p) of the data from the
experimental and control’s post-test score was 0.659. It means that the
significance level or probability value (p) of the data was higher than
the significance degree (α = 0.05). The result of homogeneity test
showed that the sample data from the population has homogenous
variance.
c. The Hypothesis Test
After doing the normality and homogeneity test, the writer
conducted the hypothesis test. The writer used the independent t-test
from IBM Statistics SPSS version 20 to compare the means or averages
of the experimental and the control class in order to check whether there
was a significant difference in the result of the experimental and control
class after treatments were given.
Table 4.9
The T-test Result of Post-test Scores
Group Statistics
Name N Mean Std.
Deviation
Std. Error
Mean
Experimental 35 76.43 8.354 1.412
Control 35 70.66 7.907 1.337
41
Independent Samples Test
Levene's
Test for
Equality of
Variances
t-test for Equality of Means
F Sig. t df Sig. (2-
tailed)
Mean
Difference
Std. Error
Difference
95% Confidence
Interval of the
Difference
Lower Upper
Equal
variances
assumed
.196 .659 2.968 68 .004 5.771 1.944 1.892 9.651
Equal
variances
not
assumed
2.968 67.796 .004 5.771 1.944 1.891 9.651
The post-test mean score of the experimental class was 76.4 while
the control class was 70.7. The result of T-test in table 4.9 shows that
tvalue which is 2.968 with the Sig. (2-tailed) 0.004. Then tvalue is
compared to the ttable to know whether the infographic give significant
effect toward students’ vocabulary learning. The ttable is taken from the
requirement which has been standard in analyzing the data. The ttable
shows 1,995 with 68 as the degree of freedom (df) in the significance
level 0.05. The comparison shows that tvalue (2.968) > ttable (1.995) and
the Sig. (2-tailed) value of the post-test score was lower than α, 0.004
< 0.05. It means there was a significant effect of infographic give
significant effect toward students’ vocabulary learning. To add the data
of post-test, the t-test also was done to the gained scores in the two
classes which are experimental class and the control class. The result is
referred to the Table 4.10.

42
Table 4.10
The T-test Result of Gained Scores
Group Statistics
Name N Mean Std.
Deviation
Std. Error Mean
Experimental 35 17.77 10.407 1.759
Control 35 11.06 6.970 1.178
Independent Samples Test
Levene's Test
for Equality
of Variances
t-test for Equality of Means
F Sig. t Df Sig. (2-
tailed)
Mean
Difference
Std. Error
Difference
95% Confidence
Interval of the
Difference
Lower Upper
Equal
variances
assumed
5.014 .028 3.171 68 .002 6.714 2.117 2.490 10.939
Equal
variances
not assumed
3.171 59.395 .002 6.714 2.117 2.478 10.950
Based on the data t-test above, the result is t (68) = 2.968, ρ= 0.02.
It means that there was a significant difference between the
experimental class (M= 17.77, SD= 10.407) and the control class (M=
11.06, SD= 6.970). The result also shows that tvalue (2.968) > ttable
(1.995) and the Sig. (2-tailed) is 0.02 <0.05. Then, it can be concluded
that the infographic give significant effect toward students’ vocabulary
learning.

43
Therefore, it can be seen that ρ < α, which means that H0 was
rejected and Ha was accepted. It proves that the mean score of the
experimental class is higher than the control class. In other words, there
was a signifficant effect of infographic toward students’ vocabulary
learning.
d. The Effect Size Test
This formulation was adopted in order to see the effect size level of
this research.
d = Mean for group A – mean for group B
Pooled standard deviation
Pooled standard deviation = 8.354 + 7.907
= 8.13 2
d = 76.42 – 70.65
= 0.70
8.13
The Criteria
0 – 0.20 Weak effect
0.21 – 0.50 Modest effect
0.51– 1.00 Moderate effect
> 1.00 Strong effect
After knowing the result that showed, it can be seen that from
the calculation the effect size level of this study is moderate because
it shows that the result is 0.70 and therefore, there is a significant
effect of using infographic on students’ vocabulary learning.
B. Interpretation
In this description of the data which was taken from 35 students of
the experimental class, Table 4.1 showed the description of the experimental

44
class, the pre-test mean score which is 58,7 before the implementation of
infographic. Moreover, after the students were given the implementation of
infographic, the mean score of post-test is 76,4. Meanwhile, Table 4.2
showed the description of the control class, the pre-test mean score which is 59,6
and the post-test is 70,7. It can be seen from the mean score of pre-test in
experimental and control class, that students got very minimum scores for their
vocabulary test and the experimental got the lower scores than the control class. In
summary, in the pre-test the students in the experimental class got the lower scores
than the students in the control class. Whereas, in the post-test the students in the
experimental class got higher scores than the students in the control class.
During the treatments, Infographic as media were implemented in a
group discussion of the experimental class to improve their vocabulary
learning. On the other hand, the students in the control class were taught
with teacher’s power point’s slides as the media in a group discussion.
Based on the statistical analysis, the increasing point of the experimental
class was 17,8; from 58,7 to 76,4. As for the control class, it increased 11.1
points; from 59,6 to 70,7. It means that the experimental class had more
significantly increasing points rather than the control class.
Based on the t-test from the SPSS calculation, it can be proved that
p (sig. (2-tailed)) < α: 0.004 <0.05. it means that H0 – which is null
hypothesis that infographic did not give significant effect on students’
vocabulary learning at the eighth grade students of SMP Negeri 11 Kota
Tangerang was rejected and Ha – which is alternative hypothesis that
infographic gave significant effect on Students vocabularies at the eighth
grade students of SMP Negeri 11 Kota Tangerang was accepted. The effect
size of the tutorial video was 0.70. Therefore, the effect size level of this
research was effectively moderate.
The result of the interview as the secondary data was supporting the
statistical data. In the result we can find that the students said that
infographic help them in learning vocabulary, the illustration of the
vocabulary was helping them to get more understanding towards the

45
meaning of the words, even though students found it difficult to create the
infographic by themselves because of their lack of practiced to use the tolls.
From the data analysis of the research; it can be assumed that
Infographic can give moderate effect on students’ Vocabularies because the
score of students’ writing after being taught by using infographic is higher
than before the writer gave the treatment.
It can be summed up that using infographic gives moderate effect on
students’ vocabularies especially for the eighth-grade students at SMP
Negeri 11 Kota Tangerang academic year 2019/2020..

46
CHAPTER V
CONCLUSION AND SUGESSION
A. Conclusion
According to the findings in the previous chapter, it is concluded
that infographic has a significant effect on students’ vocabulary learning at
the eighth grade students of SMP Negeri 11 Kota Tangerang academic year
2019/2020. It can be seen from the data with the statistical hypothesis of
significance level 5% showed that the mean score of post-test in the
experimental class after implementing the treatment by using infographic
was 76,4. It was higher than the mean score of pre-test before the treatment,
which was 58.7. The data analysis, moreover, showed that in sig. 2-tailed
(ρ) < a, or 0.004 < 0.05. It means that null hypothesis (H0) was rejected and
alternative hypothesis (Ha) was accepted. Then, the result of statistical
hypothesis testing by using independent sample ttest found that on degree of
significance 5% (α = 0.05), tobserve was 2.968 while ttable was 1.995 or
tobserve > ttable. Therefore, H0 was rejected and Ha was accepted. It showed
that infographic gave moderate effect on students’ vocabulary learning and
it also shown that my hypothesis in chapter II was proved. Moreover, the
result of the effect size test which was calculated by using Cohen’d formula
gave the moderate effect with the result 0.70. It shown that, infographic gave
moderate effect on students’ vocabulary learning.
In conclusion, it is clear that the media – infographic can moderately
effect students’ vocabulary learning at the eighth grade students of SMP
Negeri 11 Kota Tangerang academic year 2019/2020 based on the statistical
data above where the hypothesis was proved and if we formulize it in to
Cohen theory, it shown that infographic shown moderate effect to students
vocabulary learning.

47
B. Suggestion
Based on the conclusion stated above, some suggestions can be
made for the teachers, the students, and future research. The suggestions as
follows:
1. For English teachers
The English teachers can use infographic to support
students’ vocabulary learning. Since infographic has many
advantages to grab students’ attention, it is surely recommended
to use that media in teaching and learning vocabulary.
2. For Students
a. The students are expected to learning vocabulary actively
by finding the infographic by themselves since in this era of
technology where infographic can easily found on many
platforms such as Pinterest and Instagram.
b. The students are expected to engage in all of the activities
offered, hence they can understand and learn the materials
from media and take part in the group to develop their ideas
and vocabularies.
c. The students are expected to be more confident in the
learning process and do not hesitate to ask the teacher if
they have difficulties with the materials.
3. For Further researchers
The result of this study can be used as basic information or
reference about implementing other media in teaching
vocabulary or implementing infographic for other skills.

48
REFERENCES
Ahmad, Fadhil. An Analysis of Students’ Perception in Learning English Grammar
through Infographics. Ar-Raniry State Islamic University Darussalam,
Banda Aceh, 2018
Anggi, Juwita. Problem in teaching vocabulary, retrieved on June 25th, 2019 from:
https://anggijuwitarahayu.wordpress.com/assignment/ict-final-assignment/
Animalz. Example of Interactive Infographic, retrieved on February 10th, 2019
from: https://getdolphins.com/blog/15-interactive-infographic-examples/
Cohen, Louis., Manion, Lawrence., and Morrison, Keith. Research Methods in
Education, 6th eds. New York: Routledge, 2007.
Connie. Infoposters are not infographics, (n.d.) Retrieved February 10th, 2019 from:
http://understandinggraphics.com/visualizations/infoposters-are-not-
infographics/
Digitale. Example of animation infographic, retrieved on February 10th, 2019 from:
https://www.youtube.com/watch?v=ThiCMd5kGbE
Dorela. Using Visual Materials in Teaching Vocabulary in English as a Foreign Language
Classrooms with Young Learners (International Conference, New Perspective in
Science Educational).
Erwan. The Teaching of Vocabulary Through Communicative Language Teaching
Jakarta, UIN Jakarta; 2008.
Fauzan, Azima. Fauzan Azima, Teaching Vocabulary Through Verbal Techniques,
Sumatera, Bung Hatta University
Goddart, Wayne, and Melville, Stuart. Research Methodology: An Introduction,
Lansdowne: Juta, 2001
Hatch, Evelyn, and Brown Cheryl. Vocabulary, Semantic, And Language
Education, Cambridge: Cambridge university press, 1995
Heaton, J.B. Writing English Language Tests, New York: Longman Inc., 1990
Khoridi. Learning Vocabulary Through Pictures Dictionary, State Islamic
University Syarif Hidayatullah, Jakarta. 2009
Mahdah, Ridailah. The Effect of Infographic on Students’ Writing Summary
Skill. State Islamic University Syarif Hidayatullah, Jakarta. 2018
Maxmanroe. What is Infografik, Retrieved on February 10th, 2019 from:
https://www.maxmanroe.com/pengertian-infografis.html/

49
Meara. Vocabulary acquisition: A neglected aspect of language learning. In V.
Kinsella (Ed.), Surveys I: Eight state-of-the-art articles on key areas in
language teaching. Cambridge: Cambridge University Press: 1982
Mujis, Daniel. Doing Quantitative Research in Education With SPSS, (London:
Sage Publications Ltd, 2004
Mukoroli, Joseph. Effective Vocabulary Teaching Strategies for the English for
Academic Puposes ESL Classroom. SIT Graduate Institute, Vermont. 2011
Nation, I.S.P. Learning Vocabulary in Another Lamguage, Cambridge University
Press. 2001
Nihoglu, Kibar Pinar. A New Approach to Equip Students with Visual Literacy
Skills: Use of Infographics in Education Hacettepe University, Turkey:
2014
Pladevall, Ballester Elisabet. The Effects Of Using L1 Translation On Young
Learners’ Foreign Language Vocabulary Learning. Universidad
Autónoma de Barcelona, Spain: 2016
Praactical. Example of static infographic, retrieved on February 10th, 2019 from:
https://praacticalaac.org/praactical/worth-repeating-big-ideas-in-
teaching-aac-vocabulary/
Sanusi, Ersan. The Techniques in Teaching Vocabularies, Ittihad Jurnal Kopertis
Wilayah XI Kalimantan, Volume 7 No.11 Kalimantan; 2009
Sapir, Edward. Language - an Introduction to The Study of Speech, Harcourt: Brace. New
York; 1921
Smiciklas, Mark. The Power of Infographic, (Indiana Polis: Que Publishing, 2012
Sulvi, Maulida Fadillah.
Thornbury, Scott. How to Teach Vocabulary. Essex: Longman, 2002.
Wikipedia. What is Picture, retrieved on June 25th, 2019 from:
https://simple.wikipedia.org/wiki/Picture
Yheni, Siwi Utami. Improving Students’ Vocabulary Mastery Using Crossword
Puzzles for Grade VII of SMP N 2 Srandakan in The Academic Year of
2013/2014 Yogyakarta, UNY; 2014
Yuni, Triandini. The Effect of Pictionary Game on Students’ Vocabulary Retention.
Jakarta, UIN Syarif Hidayatullah, 2017
Yulia, Mawaddah Using Games in Teaching Vocabulary, State Islamic University
Syarif Hidayatullah, Jakarta. 2010

50
Zeni, Syafirah. improving vocabulary mastery through vocabulary cards of
grade vii students at SMP Institut Indonesia yogyakarta in the 2015/
2016, Yogyakarta State University, Yogyakarya. 2016

51
APPENDIX 1
LESSON PLAN
EXPERIMENTAL CLASS
School : SMP N 11 Kota Tangerang
Curriculum : 2013 (K13)
Subject : Bahasa Inggris
Grade/Semester : VIII/I
Core Material : Recount Text
Time Allocation : 2 x 40 Menit (3 Pertemuan)
A. Kompetensi Inti
1. Menghargai dan menghayati ajaran agama yang dianutnya
2. Menghargai dan menghayati perilaku jujur, disiplin, tanggungjawab, peduli
(toleransi, gotong royong), santun, percaya diri, dalam berinteraksi secara efektif
dengan lingkungan sosial dan alam dalam jangkauan pergaulan dan
keberadaannya.
3. Memahami pengetahuan (faktual, konseptual, dan prosedural) berdasarkan rasa
ingin tahunya tentang ilmu pengetahuan, teknologi, seni, budaya, terkait fenomena
dan kejadian tampak mata.
4. Mencoba, menyaji dalam ranah konkret (menggunakan, mengurai, merangkai,
memodifikasi dan membuat) dan ranah abstrak (menulis, membaca, menghitung,
menggambar, dan mengarang) sesuai dengan yang dipelajari di sekolah dan sumber
lain yang sama dalam sudut pandang/teori.
B. Kompetensi Dasar

52
• 1.1 Mensyukuri kesempatan dapat mempelajari bahasa Inggris sebagai bahasa
pengantar komunikasi internasional yang diwujudkan dalam semangat belajar.
• 2.2 Menunjukkan perilaku jujur, disiplin, percaya diri, dan bertanggung jawab
dalam melaksanakan komunikasi transaksional dengan guru dan teman.
• 3.12 Menerapkan struktur teks dan unsur kebahasaan untuk melaksanakan fungsi
sosial teks recount dengan menyatakan dan menanyakan tentang kegiatan,
kejadian, dan peristiwa, pendek dan sederhana, sesuai dengan konteks
penggunaannya.
C. Indikator
1. Spiritual:
1.1.1 Di akhir pelajaran, siswa dapat bersyukur telah mempunyai kesempatan
belajar bahasa Inggris dengan membuat refleksi diri (manfaat dari belajar teks
recount dalam bahasa Inggris secara benar).
2. Social:
2.3.1 Melalui belajar materi teks recount, siswa dapat bertanggung jawab terhadap
pekerjaan yang diberikan secara bertahap.
2.3.2 Melalui belajar materi teks recount, siswa dapat menunjukkan kepedulian
lingkungan mereka selama proses belajar secara aktif.
2.3.3 Melalui belajar materi teks recount, siswa dapat bekerja bersama dengan yang
lain selama proses belajar secara gotong royong.
2.3.4 Melalui belajar materi teks recount, siswa dapat menunjukan rasa damai
secara konsisten
3. Knowledge:
3.3.1 Setelah belajar materi teks recount, siswa mampu mengidentifikasi fungi
sosial dari teks recount dalam bentuk orentation, event, dan reorientation.
3.3.2 Setelah belajar materi teks recount, siswa dapat After learning material on
asking and giving the name of times, days, and months in the form of numeric, date,
and year, students are able to identify language features of asking and giving the
name of times, days, and months in the form of numeric, date, and year in English
correctly.

53
3.3.3 Setelah belajar materi teks recount, siswa dapat mengidentifikasi struktur
umum dari teks recount dari contoh yang diberikan dalam bentuk teks tertulis
dalam bahasa Inggris secara benar.
4. Skills:
4.4.1 Setelah belajar materi teks recount, siswa dapat membaca teks tertulis
(reading) teks recount secara tepat.
4.4.2 Setelah belajar materi teks recount, siswa dapat membuat reks recount
(writing) dalam bentuk orientation, event dan reorientation secara teapat.
D. Material
RECOUNT TEXT
Recount adalah sebuah tulisan yang menceritakan peristiwa secara kronologis
yang urut. Teks recount sama seperti teks naratif. Ceritanya mungkin sebuah peristiwa
dalam satu tempat dan hari tertentu. Susunan peristiwanya sangat penting. Recount
dapat menghibur dan/atau menginformasi urutan kejadian yang terjadi.
Text Organization:
• Recounts Pribadi
• Orientation yaitu memperkenalkan siapa yang terlibat di dalam cerita, kapan,
dan di mana cerita ini terjadi.
• Events yaitu menceritakan peristiwa secara urut.
• Re-orientation (optional) yaitu menampilkan kesimpulan dari pengalaman;
komentar penulis tentang pengalamnnya.
• Recount Fakta
o Orientation memperkenalkan siapa yang terlibat di dalam cerita, kapan,
dan di mana cerita ini terjadi.
o Events menceritakan kejadian secara urut.
Contoh teks recount: laporan kecelakaan, laporan surat kabar, laporan polisi, artikel,
surat, jurnal, sejarah, buku harian.
1. Fungsi Sosial : Menceritakan kembali kejadian atau pengalaman di masa lalu.
2. Language Element :

54
• Nouns, e.g. man, journey, town, etc.
• Pronouns, e.g. it, he, him, his, etc
• Action verbs, e.g. wanted, decided, ate, etc.
• Past tenses, e.g. A rich man wanted to make a journey to another town.
• Time conjunction, e.g. before, finally, etc.
• Adverbs, e.g. cheerfully, quickly, etc.
• Adverbs of phrases, e.g. a few days ago, at the end of the journey, etc.
• Adjectives, e.g. old, clever, light, heavy, etc
E. Sources / Learning Media
1 Source:http://www.belajaringgris.net/time-vocabulary-3184.html MathIsFun.com
2 Learning Media : INFOGRAPHIC, slide, whiteboard, marker
F. Learning Method
1. Pendekatan : Alamiah (Scientific)
2. Metode : Communicative Language Teaching
3. Technique : Lecturing, Grouping, Individual Working
G. Learning Activity
Activity Description Teachers Activity Time Allocation
Learning Source
Opening • Start the lesson with praying
• Greeting the students
• Introduction
• Give some question: - Have you ever go
to the tourist object?
- What are you doing when holidays come?
- Dit you have experience related related to the event or certain place?
10 Menit
Main Activity
Observation/mengamati: a. Siswa Bersama –
sama menari mengikuti gerakan yang ditayangkan dalam video.
b. Siswa memperhatikan tayangan tantang tempat – tempat wisata dan contoh artikel teks recount
• Guru memutakan video “Tarian daerah”
• Guru membagikan lembar pengamatan dan menayangkan video tentang waktu dan kegiatan sehari - hari
10 menit Video Infographic

55
c. Siswa Bersama – sama membaca contoh teks recount dalam bentuk infographic.
Questioning/ mempertanakan
a. Siswa digiring umtuk bertanya jawab tentang Infographic yang diperlihatkan guru tentang tempat2 wisata dan contoh artikel teks recount dan cara membaca dalam Bahasa inggris
b. Siswa digiring untuk bertanya mengenai waktu dan nama kegiatannya sehari hari
• Guru membimbing siswa brtanya jawab tentang infographic yang telah diamati
• Guru membimbing siswa untuk bertanya jawab tentang waktu dan kegiatan sehari hari
5 menit
Associating/ menalar a. Siswa mengamati
tentang apa, kapan, mengapa dan bagaimana recount text digunakan.
b. Siswa mengaati contoh format membuat teks recount.
Guru menjelaskan maateri inti dari teks recount
15 menit
Eksperimen/ eksplorasi
a. Siswa membuat cerita tentang teks recount yang berkaitan dengan tempat tempat wisata kedalam infographic
Guru membagikan tempat tempat tujuan wisata. Guru memberikan contoh cara membuat infographic dengan menggunakan paint.
25 menit
Networking mengkomunikasikan
a. siswa menampilkan hasil kerjanya didepan kelas
• Guru meminta siswa untuk menampilkan tugas kerjanya didepan kelas
• Guru memotivasi siswa untuk mengkomunikasikan
10 menit

56
b. siswa mengungkapkan waktu dan kegiatan sehari hari kepada siapapun yang ditemuinya, seperti keluarga, teman, guru, dan lain lain.
waktu dan kegiatan sehari hari didalam dan diluar kelas
Closing • Guiding te students to make conclusion on what they have done
5 menit

57
APPENDIX 2
LESSON PLAN
CONTROL CLASS
School : SMP N 11 Kota Tangerang
Curriculum : 2013 (K13)
Subject : Bahasa Inggris
Grade/Semester : VIII/I
Core Material : Recount Text
Time Allocation : 2 x 40 Menit (3 Pertemuan)
D. Kompetensi Inti
1. Menghargai dan menghayati ajaran agama yang dianutnya
2. Menghargai dan menghayati perilaku jujur, disiplin, tanggungjawab, peduli
(toleransi, gotong royong), santun, percaya diri, dalam berinteraksi secara efektif
dengan lingkungan sosial dan alam dalam jangkauan pergaulan dan
keberadaannya.
3. Memahami pengetahuan (faktual, konseptual, dan prosedural) berdasarkan rasa
ingin tahunya tentang ilmu pengetahuan, teknologi, seni, budaya, terkait fenomena
dan kejadian tampak mata.
4. Mencoba, menyaji dalam ranah konkret (menggunakan, mengurai, merangkai,
memodifikasi dan membuat) dan ranah abstrak (menulis, membaca, menghitung,
menggambar, dan mengarang) sesuai dengan yang dipelajari di sekolah dan sumber
lain yang sama dalam sudut pandang/teori.
E. Kompetensi Dasar
• 1.1 Mensyukuri kesempatan dapat mempelajari bahasa Inggris sebagai bahasa
pengantar komunikasi internasional yang diwujudkan dalam semangat belajar.

58
• 2.2 Menunjukkan perilaku jujur, disiplin, percaya diri, dan bertanggung jawab
dalam melaksanakan komunikasi transaksional dengan guru dan teman.
• 3.12 Menerapkan struktur teks dan unsur kebahasaan untuk melaksanakan fungsi
sosial teks recount dengan menyatakan dan menanyakan tentang kegiatan,
kejadian, dan peristiwa, pendek dan sederhana, sesuai dengan konteks
penggunaannya.
F. Indikator
1. Spiritual:
1.1.1 Di akhir pelajaran, siswa dapat bersyukur telah mempunyai kesempatan
belajar bahasa Inggris dengan membuat refleksi diri (manfaat dari belajar teks
recount dalam bahasa Inggris secara benar).
2. Social:
2.3.1 Melalui belajar materi teks recount, siswa dapat bertanggung jawab terhadap
pekerjaan yang diberikan secara bertahap.
2.3.2 Melalui belajar materi teks recount, siswa dapat menunjukkan kepedulian
lingkungan mereka selama proses belajar secara aktif.
2.3.3 Melalui belajar materi teks recount, siswa dapat bekerja bersama dengan yang
lain selama proses belajar secara gotong royong.
2.3.4 Melalui belajar materi teks recount, siswa dapat menunjukan rasa damai
secara konsisten
3. Knowledge:
3.3.1 Setelah belajar materi teks recount, siswa mampu mengidentifikasi fungi
sosial dari teks recount dalam bentuk orentation, event, dan reorientation.
3.3.2 Setelah belajar materi teks recount, siswa dapat After learning material on
asking and giving the name of times, days, and months in the form of numeric, date,
and year, students are able to identify language features of asking and giving the
name of times, days, and months in the form of numeric, date, and year in English
correctly.
3.3.3 Setelah belajar materi teks recount, siswa dapat mengidentifikasi struktur
umum dari teks recount dari contoh yang diberikan dalam bentuk teks tertulis
dalam bahasa Inggris secara benar.
4. Skills:

59
4.4.1 Setelah belajar materi teks recount, siswa dapat membaca teks tertulis
(reading) teks recount secara tepat.
4.4.2 Setelah belajar materi teks recount, siswa dapat membuat reks recount
(writing) dalam bentuk orientation, event dan reorientation secara teapat.
D. Material
RECOUNT TEXT
Recount adalah sebuah tulisan yang menceritakan peristiwa secara kronologis
yang urut. Teks recount sama seperti teks naratif. Ceritanya mungkin sebuah peristiwa
dalam satu tempat dan hari tertentu. Susunan peristiwanya sangat penting. Recount
dapat menghibur dan/atau menginformasi urutan kejadian yang terjadi.
Text Organization:
• Recounts Pribadi
• Orientation yaitu memperkenalkan siapa yang terlibat di dalam cerita, kapan,
dan di mana cerita ini terjadi.
• Events yaitu menceritakan peristiwa secara urut.
• Re-orientation (optional) yaitu menampilkan kesimpulan dari pengalaman;
komentar penulis tentang pengalamnnya.
• Recount Fakta
o Orientation memperkenalkan siapa yang terlibat di dalam cerita, kapan,
dan di mana cerita ini terjadi.
o Events menceritakan kejadian secara urut.
Contoh teks recount: laporan kecelakaan, laporan surat kabar, laporan polisi, artikel,
surat, jurnal, sejarah, buku harian.
3. Fungsi Sosial : Menceritakan kembali kejadian atau pengalaman di masa lalu.
4. Language Element :
• Nouns, e.g. man, journey, town, etc.
• Pronouns, e.g. it, he, him, his, etc
• Action verbs, e.g. wanted, decided, ate, etc.
• Past tenses, e.g. A rich man wanted to make a journey to another town.
• Time conjunction, e.g. before, finally, etc.

60
• Adverbs, e.g. cheerfully, quickly, etc.
• Adverbs of phrases, e.g. a few days ago, at the end of the journey, etc.
• Adjectives, e.g. old, clever, light, heavy, etc
E. Sources / Learning Media
3 Source:http://www.belajaringgris.net/time-vocabulary-3184.html MathIsFun.com
4 Learning Media : picture, slide, whiteboard, marker
G. Learning Method
1. Pendekatan : Alamiah (Scientific)
2. Metode : Communicative Language Teaching
3. Technique : Lecturing, Grouping, Individual Working
G. Learning Activity
Activity Description Teachers Activity Time Allocation
Learning Source
Opening • Start the lesson with praying
• Greeting the students
• Introduction
• Give some question: - Have you ever
go to the tourist object?
- What are you doing when holidays come?
- Dit you have experience related related to the event or certain place?
10 Menit
Main Activity
Observation/mengamati: d. Siswa Bersama –
sama menari mengikuti gerakan yang ditayangkan dalam video.
e. Siswa memperhatikan tayangan tantang tempat – tempat wisata dan contoh artikel teks recount
f. Siswa Bersama – sama membaca contoh teks recount.
• Guru memutakan video “Tarian daerah”
• Guru membagikan lembar pengamatan dan menayangkan video tentang waktu dan kegiatan sehari - hari
10 menit Video
Questioning/ mempertanakan
• Guru membimbing siswa brtanya jawab
5 menit

61
c. Siswa digiring umtuk bertanya jawab tentang slide yang diperlihatkan guru tentang tempat2 wisata dan contoh artikel teks recount dan cara membaca dalam Bahasa inggris
d. Siswa digiring untuk bertanya mengenai waktu dan nama kegiatannya sehari hari
tentang slide yang telah diamati
• Guru membimbing siswa untuk bertanya jawab tentang waktu dan kegiatan sehari hari
Associating/ menalar c. Siswa mengamati
tentang apa, kapan, mengapa dan bagaimana recount text digunakan.
d. Siswa mengaati contoh format membuat teks recount.
Guru menjelaskan maateri inti dari teks recount
15 menit
Eksperimen/ eksplorasi c. Siswa membuat
cerita tentang teks recount yang berkaitan dengan tempat tempat wisata
Guru membagikan tempat tempat tujuan wisata.
20 menit
Networking mengkomunikasikan
b. siswa menampilkan hasil kerjanya didepan kelas
d. siswa mengungkapkan waktu dan kegiatan sehari hari kepada siapapun yang ditemuinya, seperti keluarga, teman, guru, dan lain lain.
• Guru meminta siswa untuk menampilkan tugas kerjanya didepan kelas
• Guru memotivasi siswa untuk mengkomunikasikan waktu dan kegiatan sehari hari didalam dan diluar kelas
10 menit
Closing • Guiding te students to make conclusion on what they have done
10 menit

62
APPENDIX 3
Pre-Test Instrument
Pre-test
1. A place where the criminals are put is…
a. Dispensary b. Prison c. Courthouse d. Stationery
2. Yesterday Anida …. to her friend’s house, because she wanted to borrow English book.
a. Went b. Came c. Visited d. Travelled
3. This place is a place where a defendant is trialed. This place is called as…
a. Courthouse b. Stationary c. Dispensary d. Prison
4. Nina wants to buy some breads in the bakery. The word in italic has similar meaning to…
a. Sell b. Pay c. Purchase d. Have
5. This is a place where you can see so many horses. This building is used to keep horses. This place is called as…
a. Warehouse b. Casino c. Stable d. Stadium
6. Riri looked so … when she finally found the book that she wanted to borrow in the
library yesterday.
a. Sad b. Curious c. Sleepy d. Happy
7. A structure that is built to make people remember an event in history or a famous person is called as…
a. Museum b. Tower c. Factory d. Monument
8. Last week Lisa and her family decided to go to the zoo, and Lisa was so happy. The
word in italic has similar meaning to…
a. Terrified b. Bored c. Sleepy d. Excited
9. A large, open area with seats around it, used for playing and watching sports is called
as…
a. Tower b. Field c. Factory d. Stadium
10. Two days ago Liza took her cousin to the airport and she feels sad because she could not meet her cousin again. The word in italic has similar meaning to…
a. Terrified b. Glad c. Joyful d. Miserable
11. Dina went to the ………. to change her money from Rupiah to Dollar yesterday.

63
a. Value b. Airport c. Monastery d. Currency Exchange
12. He is trying to find the book …. in the bookshelves, in order to get the book he wants
to buy in the bookstore.
a. Happily b. Sadly c. Eagerly d. Carefully
13. During the holiday, I spent my day in the …. since I didn’t like staying in the high building.
a. Cottage b. Hotel c. Dormitory d. Tunnel
14. Last night Uncle Jack wanted to borrow some money, so he went to … and gave his gold to the cashier. This month he will come back to that place to pay his debt and get his gold back.
a. Thrift shop b. Pawn Shop c. Haberdashery d. Courthouse
15. Last month Jim went to…. to sell second-handed clothes for charity.
a. Thrift shop b. Pawn Shop c. Haberdashery d. Courthouse
16. Warehouse is a … building for goods that are going to be sold.
a. Small b. tiny c. little d. large
17. All the daily needs can be … in the market.
a. Borrowed b. bought c. paid d. changed
18. Hospital is a building that provides medical and surgical treatment for ….. people.
a. Health b. Hopeless c. Helpless d. sick
19. Last holiday we went up stairs to the top of twin towers and … beautiful view there.
a. Visited b. realized c. took d. saw
20. Last week all moslems …. Eidl Fitr in the mosque.
a. Begged b. celebrated c. prayed d. visited
21. All the Christians celebrated Christmas …. in the church.
a. Happily b. sadly c. sincerely d. playfully
22. Shinta will go to the boutique to change the dress that she bought because it doesn’t fit in her. The word in italic has similar meaning to…
a. Move b. switch c. sell d. borrow
23. Adinda got … when she knew that she couldn’t go anywhere in her holiday.
a. Sad b. terrified c. enthusiast d. excited
24. The clown that she saw near the park looked so …
a. Sad b. cute c. nice d. funny
25. One of the most …. monuments in Indonesia is Monas, and it is located in Jakarta.

64
a. Short b. large c. big d. famous
26. She looked so …. spending her holiday in the hotel near the beach.
a. Bored b. incredible c. exhausted d. excited
27. Nia wanted to …. her aunt who lived in different country.
a. Come b. go c. visit d. stay
28. Nia’s house is far from the mosque. So, she … to walk for several kilometers.
a. wants b. needs c. likes d. enjoys
29. Bila enjoyed the … scenery from the top of the hot
a. Bad b. beautiful c. terrified d. glamorous
30. Lia preferred to buy vegetables in the … because it looks more fresh.
a. grocery b. market c. hospital d. court house

65
APPENDIX 4
Post-Test Instrument
Post-Test
1. Anna wants to buy books, pencils, and eraser. So, she decides to go to
the…
a. Courthouse b. Prison c. Monastery d. Stationery
2. Bob went to the library to … biology book yesterday.
a. Lend b. buy c. sell d. borrow
3. All the Hindis go to the … to pray.
a. Cathedral b. mosque c. monastery d. temple
4. Dian wants to buy a kilogram of meat in the butcher. The antonym of the word in italic is…
a. Bring b. break c. sell d. borrow
5. Today was Vaisakha day, so all the Buddhists went to the …….. to pray.
a. Church b. Mosque c. Chapel d. Vihara
6. During the holiday, I and my family spent it by staying in the … near the
beach.
a. Dormitory b. Hotel c. Port d. Thrift Shop
7. Last night Andy got sick, he needed some medicines, so he asked her brother to go to the...
a. Dispensary b. Stationary c. Library d. Grocery
8. Tomorrow Indah wants to go picnic to the zoo. On the next day, it is raining, so she can’t go anywhere and she feels so sad. The antonym of the
word in the italic is…
a. Glad b. Hesitated c. Excited d.
Disappointed
9. Last year Lorry often went to the …. to do exercises in order to have a
good body, but now he is lazy to do it.
a. Haberdashery b. Monastery c. Library d. Gymnasium
10. It was the first time Ann saw Monumen Nasional (Monas), for her it was a
… building.
a. Short b. Large c. Average d. Tall
11. Every Friday, Ali goes to the … to pray since he is a moslem.

66
a. Church b. Cathedral c. Temple d. Mosque
12. He walks into the lobby of the dormitory … since he really wants to meet his family.
a. Sadly b. helplessly c. carelessly d. eagerly
13. Bob wants to buy a bunch of flowers for his mother, so he goes to the…
a. Stationery b. dispensary c. butcher d. florist
14. Mia is on her way to the police station, but her car is out of gasoline, so she goes to the …
a. Airport b. market c. petrol station d. pawn shop
15. A building where things are made is called as…
a. Monastery b. market c. factory d. Harbor
16. One of the most popular places in Malang is musem angkut. The word in italic has the closest meaning to…
a. Large b. huge c. tiny d. well-known
17. Nada gets sick and she wants to go to the….
a. Pawn shop b. dormitory c. hospital d. port
18. All the fruits which is sold in the market looks so …
a. Pale b. dark c. rotten d. fresh
19. Hilda is a lecturer, so every day she … the students in University.
a. Claims b. teaches c. visits d. comes
20. I wish someday I could … to Paris to see Eiffel tower.
a. Visit b. live c. feel d. go
21. Liza goes to school … every day because she loves all her teachers and friends.
a. Peacefully b. extremely c. enthusiastically d. scornfully
22. Shinta is in the airport, the plane that she waits will take off at 6 p.m. The
word in italic has similar meaning to…
a. Come b. stay c. depart d. fly
23. Bill was …. when he knew that the missed the train last night.
a. Interested b. exhausted c. anxious d. annoyed
24. My campus has several … buildings and it has 2 hectares.
a. Small b. tiny c. medium d. large
25. I prefer go to the café than to the library because it is a comfortable place for me. the word in italic has the closest meaning to…

67
a. Dangerous b. safe c. peace d. cozy
26. She looks so … watching Harry Potter in the cinema that she does not even understand the plot.
a. Happy b. enthusiast c. hilarious d. bored
27. He likes to …. his weekend by doing all his homework.
a. Waste b. keep c. make d. spend
28. Henny’s office is near with restaurant that she can … her lunch there.
a. Pay b. achieve c. earn d. buy
29. The view in the top of National Monument is …, no wonder many people want to go to the top of it.
a. Terrible b. awful c. wonderful d. terrified
30. Mia wants to have a tame rabbit so she decides to go to the…
a. Market b. pet shop c. green grocery d. grocer

68

69

68
APPENDIX 5
The Gained Score of Experimental Class
Name Pre Post Gained Score
Student 1 53 83 30
Student 2 50 87 37
Student 3 60 77 17
Student 4 67 83 16
Student 5 53 87 34
Student 6 60 73 13
Student 7 50 73 23
Student 8 47 70 23
Student 9 50 70 20
Student 10 50 83 33
Student 11 53 73 20
Student 12 57 73 16
Student 13 70 93 23
Student 14 73 87 14
Student 15 63 70 7
Student 16 53 77 24
Student 17 57 77 20
Student 18 70 67 -3
Student 19 67 70 3
Student 20 63 97 34
Student 21 63 77 14
Student 22 53 77 24
Student 23 47 83 36
Student 24 70 83 13
Student 25 70 85 15
Student 26 57 73 16
Student 27 57 67 10
Student 28 60 63 3
Student 29 47 67 20
Student 30 40 70 30
Student 31 63 67 4
Student 32 67 80 13
Student 33 60 70 10
Student 34 60 63 3
Student 35 73 80 7
Total 2053 2675 622
Mean 58,7 76,4 17,8

69
APPENDIX 6
The Gained Score of Control Class
Name Pre Post Gained Score
Student 1 57 63 6
Student 2 50 63 13
Student 3 60 67 7
Student 4 53 57 4
Student 5 53 63 10
Student 6 57 77 20
Student 7 60 77 17
Student 8 60 63 3
Student 9 60 73 13
Student 10 47 73 26
Student 11 50 70 20
Student 12 50 70 20
Student 13 60 73 13
Student 14 73 83 10
Student 15 70 80 10
Student 16 70 83 13
Student 17 63 67 4
Student 18 57 53 -4
Student 19 50 53 3
Student 20 60 73 13
Student 21 60 77 17
Student 22 63 70 7
Student 23 67 67 0
Student 24 63 77 14
Student 25 70 77 7
Student 26 53 73 20
Student 27 53 70 17
Student 28 57 77 20
Student 29 47 67 20
Student 30 60 67 7
Student 31 73 83 10
Student 32 70 77 7
Student 33 70 80 10
Student 34 67 67 0
Student 35 53 63 10
Total 2086 2473 387
Mean 59,6 70,7 11,1
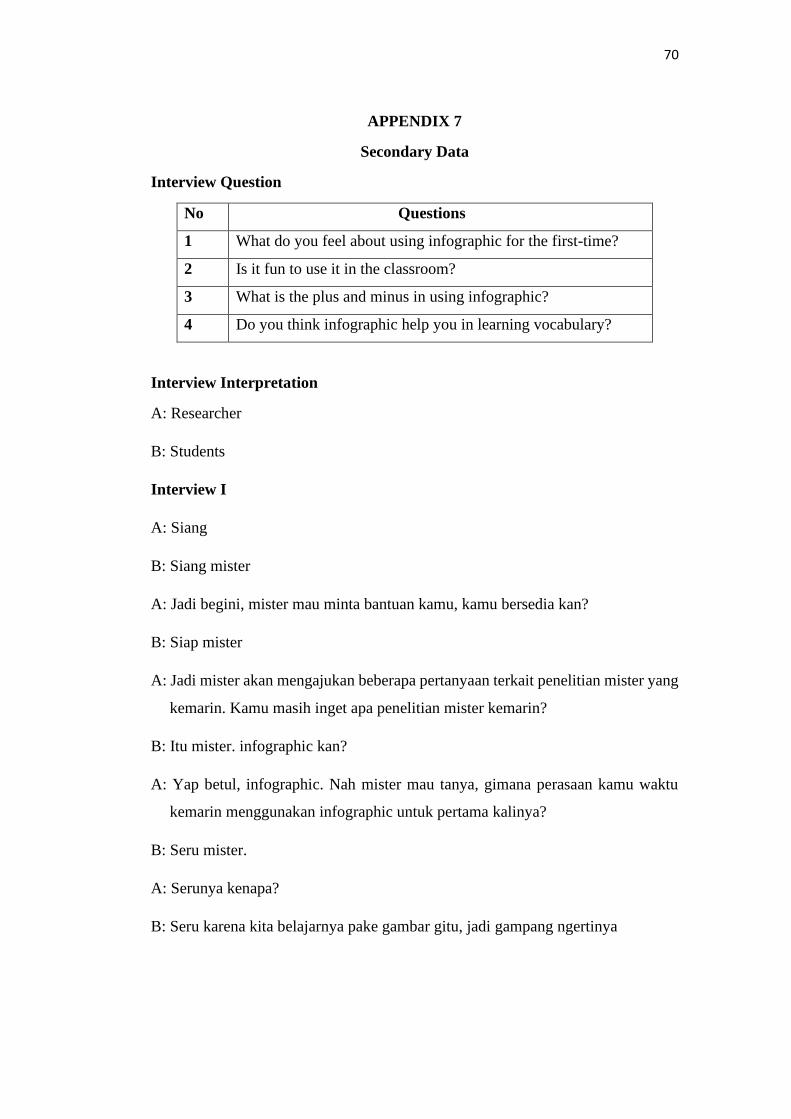
70
APPENDIX 7
Secondary Data
Interview Question
No Questions
1 What do you feel about using infographic for the first-time?
2 Is it fun to use it in the classroom?
3 What is the plus and minus in using infographic?
4 Do you think infographic help you in learning vocabulary?
Interview Interpretation
A: Researcher
B: Students
Interview I
A: Siang
B: Siang mister
A: Jadi begini, mister mau minta bantuan kamu, kamu bersedia kan?
B: Siap mister
A: Jadi mister akan mengajukan beberapa pertanyaan terkait penelitian mister yang
kemarin. Kamu masih inget apa penelitian mister kemarin?
B: Itu mister. infographic kan?
A: Yap betul, infographic. Nah mister mau tanya, gimana perasaan kamu waktu
kemarin menggunakan infographic untuk pertama kalinya?
B: Seru mister.
A: Serunya kenapa?
B: Seru karena kita belajarnya pake gambar gitu, jadi gampang ngertinya

71
A: Oh gitu, terus seneng gak pake infographic buat belajar gitu?
B: Seneng mister.
A: Menurut kamu, kelebihan sama kekurangan infographic dalam pengajaran apa
aja?
B: Kelebihannya itu gampang dimengerti, kekurangannya itu bikinnya susah mister
harus pake computer.
A: Oh gampang mengertinya, tapi susah buat bikinnya yak. Gimana kalo kamu
belajarnya pake infographic aja tanpa harus buat, mau gak?
B: Mau mister, lebih seru
A: Nah pertanyaan terakhir, menurut kamu infographic membantu kamu dalam
belajar vocabulary gak sih?
B: Membantu mister, apalagi gambarnya bias diliat di hanphone. Jadi bias belajar
dimana mana mister. Terus mudah dimengerti karena ada gambarnya mister.
A: Itu Namanya ilustrasi dari vocabularynya. Nah segitu aja, terima kasih udah mau
bantu mister.
B: Sama sama mister.
Interview II
A: Siang
B: Siang mister
A: Mister mau minta tolong boleh yah?
B: Boleh mister
A: Mister mau ngajuin beberapa pertanyaan tentang penelitian mister yang kemarin.
Masih inget gak kamu?

72
B: Inget mister, kemarin itu tentang infographic
A: Iya betul. Nah begini pertanyaannya, gimana perasaan kamu waktu kemarin
pertama kalinya menggunakan infographic? Coba cerita ke mister
B: Awalnya mah bingung mister, karena baru pertama kali denger yang Namanya
infographic. Tapi pas udah dijelasin mister saya tau sedikit sedikit karena mirip
poster.
A: Memang, memang mirip poster. Terus terus
B: Waktu belajarnya si seru mister, karena pakai gambar gitu.
A: Berarti menyenangkan lah yak cara beajarnya?
B Iya mister.
A: Terus menurut kamu kelebihan dan kekurangan dari infographic dalam
pembelajaran apa?
B: Susah mister bikinnya, tapi gampang dimengerti si kalo buat belajar materinya.
Karena ada gambarnya.
A: Pertanyaan terakhir nih, apakah infographic membantu kamu dalam belajar
vocabulary?
B: Membantu mister, karena kan disetiap vocab yang kita pelajarin ada gambarnya,
jadinya mudah ingetnya,
A: Nah gambar yang ada di vocabularynya itu Namanya ilustrasi. Ok begitu aja,
terima kasih udah mau bantu mister.
B: Sama sama mister.

73
APPENDIX 8
KEMENTERIAN
AGAMA
FORM (FR)
No.
Dokumen
: FITK-FR-
AKD-081
UIN JAKARTA Tgl. Terbit : 1 Maret 2010
FITK No. Revisi: : 01
Jl. Ir. H. Juanda No 95 Ciputat 15412
Indonesia Hal : 1/1
SURAT BIMBINGAN SKRIPSI
Nomor : Un.01/F.1/KM.01.3/0333/2018 Jakarta, 10 Juli 2018
Lamp. : -
Hal : Bimbingan Skripsi
Kepada Yth.
Dr. Nida Husna, M.Pd. MA. Tesol.
Pembimbing Skripsi
Fakultas Ilmu Tarbiyah dan Keguruan
UIN Syarif Hidayatullah
Jakarta.
Assalamu’alaikum wr.wb.
Dengan ini diharapkan kesediaan Saudara untuk menjadi pembimbing I
(materi/teknis) penulisan skripsi mahasiswa:
Nama : Andika Afrian
NIM : 1113014000055
Jurusan : Pendidikan Bahasa Inggris
Semester : Sepuluh (10)
Judul Skripsi : The Effectiveness of Teaching Vocabulary by Using Visual
Material (A Quasi-Experimental Study at the Tenth Grade of
SMAN 12 Kota Tangerang)
Judul tersebut telah disetujui oleh Jurusan yang bersangkutan pada tanggal 20 Januari
2017, abstraksi/outline terlampir. Saudara dapat melakukan perubahan redaksional pada
judul tersebut. Apabila perubahan substansial dianggap perlu, mohon pembimbing
menghubungi Jurusan terlebih dahulu.
Bimbingan skripsi ini diharapkan selesai dalam waktu 6 (enam) bulan, dan dapat
diperpanjang selama 6 (enam) bulan berikutnya tanpa surat perpanjangan.
Atas perhatian dan kerja sama Saudara, kami ucapkan terima kasih.
Wassalamu’alaikum wr.wb.
a.n. Dekan
Kajur Pendidikan Bahasa Inggris
Dr. Alek, M.Pd
NIP. 19690912 200901 1 008 Tembusan:
1. Dekan FITK
2. Mahasiswa ybs.

74
APPENDIX 9

75
APPENDIX 10
Pictures of The Class Activities

76
APPENDIX 11
Teachers’ Made Infographic

77
APPENDIX 12
Students’ Made Infographic