The effect of total replacement of fish oil with DHA-Gold® and ...
13
University of Nebraska - Lincoln DigitalCommons@University of Nebraska - Lincoln US Fish & Wildlife Publications US Fish & Wildlife Service 2016 e effect of total replacement of fish oil with DHA-Gold® and plant oils on growth and fillet quality of rainbow trout (Oncorhynchus mykiss) fed a plant-based diet O. C. Betiku USFWS F. T. Barrows USDA-ARS, [email protected] C. Ross Washington State University W. M. Sealey USFWS, [email protected] Follow this and additional works at: hp://digitalcommons.unl.edu/usfwspubs is Article is brought to you for free and open access by the US Fish & Wildlife Service at DigitalCommons@University of Nebraska - Lincoln. It has been accepted for inclusion in US Fish & Wildlife Publications by an authorized administrator of DigitalCommons@University of Nebraska - Lincoln. Betiku, O. C.; Barrows, F. T.; Ross, C.; and Sealey, W. M., "e effect of total replacement of fish oil with DHA-Gold® and plant oils on growth and fillet quality of rainbow trout (Oncorhynchus mykiss) fed a plant-based diet" (2016). US Fish & Wildlife Publications. 478. hp://digitalcommons.unl.edu/usfwspubs/478
-
Upload
khangminh22 -
Category
Documents
-
view
5 -
download
0
Transcript of The effect of total replacement of fish oil with DHA-Gold® and ...

University of Nebraska - LincolnDigitalCommons@University of Nebraska - Lincoln
US Fish & Wildlife Publications US Fish & Wildlife Service
2016
The effect of total replacement of fish oil withDHA-Gold® and plant oils on growth and filletquality of rainbow trout (Oncorhynchus mykiss) fed aplant-based dietO. C. BetikuUSFWS
F. T. BarrowsUSDA-ARS, [email protected]
C. RossWashington State University
W. M. SealeyUSFWS, [email protected]
Follow this and additional works at: http://digitalcommons.unl.edu/usfwspubs
This Article is brought to you for free and open access by the US Fish & Wildlife Service at DigitalCommons@University of Nebraska - Lincoln. It hasbeen accepted for inclusion in US Fish & Wildlife Publications by an authorized administrator of DigitalCommons@University of Nebraska - Lincoln.
Betiku, O. C.; Barrows, F. T.; Ross, C.; and Sealey, W. M., "The effect of total replacement of fish oil with DHA-Gold® and plant oils ongrowth and fillet quality of rainbow trout (Oncorhynchus mykiss) fed a plant-based diet" (2016). US Fish & Wildlife Publications. 478.http://digitalcommons.unl.edu/usfwspubs/478

158
doi: 10.1111/anu.12234 Aquaculture Nutrition 2016 22; 158-169 ...........................................................
The effect of total replacement of fish oil with DHA-Gold® and plant oils on growth and fillet quality of rainbow trout (Oncorhynchus mykiss) fed a plant-based diet
O.c. BETIKU!, F.T. BARROWS2, C. ROSS3 & W.M. SEALEY! I USFWS, Bozeman Fish Technology Center, Bozeman, Montana, USA; 2 USDA-ARS, Trout Grains Project, Bozeman Fish
Technology Center, Bozeman, Montana, USA; 3 Department oj" Food Science and Human Nutrition, Washington State University, Pullman, Washington, USA
Abstract
This study investigated the effect of the replacement of fish
oil (FO) with DRA-Gold (DRA-G)-supplemented plant oils
(PO) in rainbow trout fed plant-protein-based diets. Five
diets (450 mg g-I digestible protein and 150 mg g-I crude
lipid) were fed to rainbow trout (initial weight 37 ± 0.5 g)
for 12 weeks in a 15°C recirculating water system. The lipid
inclusion types and levels were FO, PO and PO with DRA
G supplemented at 30 mg g-I, 60 mg g-I or 90 mg g-I of the
diet replacement for corn oil. Fish fed 90 mg g-I DRA-G
were significantly larger and consumed more feed than fish
fed PO or FO (218 g and 2.6% bwd- 1 versus 181 g and
2.4% and 190 g and 2.3%, respectively). Feed conversion
ratio was significantly increased in fish fed 90 mg g-l DHA
G (0.99) as compared to fish-fed FO (0.90) and 30 mg g-I
DHA-G (0.91). Panellists found trout fillets from fish fed the
90 mg g-I OHA-G diet to have significantly fishier aroma
and flavour than fish fed the FO diet. Fatty acid analysis
demonstrated that 60 mg g-I or 90 mg g-I OHA-G supple
mentation increased PO fed fish fillet DRA to fatty acid lev
els equivalent or higher than those fish fed a FO diet.
KEY WORDS: aquaculture, docosahexaenoic acid, fatty acids,
fish oil, plant oil, rainbow trout
Received 4 April 2014; accepted 6 August 2014
Correspondence: W.M. Sealey, USFWS, Bozeman Fish Technology Cen/er, Bozeman, Montana 59715, USA. E-mail: [email protected]
Introduction
Feeding of carnivorous fish species like rainbow trout
(Oncorhynchus mykiss) requires substantial amounts of
dietary lipid for the supply of energy and for the produc
tion of a high quality fish fillet containing long-chain essen
tial fatty acids: polyunsaturated fatty acids (PUFA). Due
to the short-fall from wild-harvested marine fish stocks for
the production of fish oil (F AO 20 I 0), alternative lipid
sources for the production of fish feed are essential to meet
the demand of the growing aquaculture industry (Bureau
et al. 2008; Tacon & Metian 2008).
Changes in dietary lipid composition not only affect
growth and health, but also product quality in farmed fishes
(Tocher et al. 2004; Karalazos et al. 2011; Turchini et al.
2013a,b). Product quality of farmed fishes is defined by
customer's needs and expectations, and often includes the
long-chain n-3 PUFA content of the fillet (Liu et al. 2004;
Torstensen et al. 2005). In a recent study conducted with
brown trout (Salmo trutta) by Kenari et al. (2011), concen
trations of eicosapentaenoic acid (EPA) and docosahexae
noic acid (OHA) in the fish fillet were affected by dietary
lipid sources. Concentrations of serum glucose, total choles
terol, triglycerides, and very low-density lipoprotein were sig
nificantly higher in fish fed diets with lower concentrations
of n-3 PUFA. Studies in gilthead seabream (Benedito-Palos
et al. 2008), pikeperch (Kowalska et at. 2011) and Atlantic
salmon (Bell et al. 2003; Torstensen et al. 2004) reported
similar disorders of lipid metabolism and alterations in fatty
acid profiles of the fillets when diets containing fish oil-alter
native dietary lipid sources were fed. Studies examining
replacement of fish oil in diets of rainbow trout have not
always observed reduced growth but have documented
altered liver fatty acid metabolism and muscle n-3 PUFA
content (Caballero et at. 2002; Turchini et at. 2013a). Conse
quently, the fillet was deemed less acceptable by consumers
due to inability to supply substantial amounts of long-chain
n-3 PUFA (Caballero et at. 2002; Turchini et at. 2013b).
© 2015 John Wiley & Sons Ltd

To date, research indicates that up to 80–90% of fish oil can
be replaced by vegetable oils and other fat sources in rain-
bow trout diets without affecting growth. The fillet n-3
PUFA content, however, can be affected (Caballero et al.
2002; Turchini et al. (2013a), and thus, the fillet quality that
is of importance to consumers can be altered (Turchini et al.
2013b). For this reason, total replacement of fish oil with
vegetable oil for many species, including rainbow trout, is
still considered impossible due to the resultant modification
of the fatty acid composition of cultured fish. Previous stud-
ies have recommended the use of diets containing fish oil
during a finishing period to restore the fatty acid composi-
tion of the fish previously fed the alternative lipid sources
(Mourente & Bell 2006; Trushenski & Boesenberg 2009;
Thanuthong et al. 2011). However, restoration of muscle
fatty acid in carnivorous species requires large quantities of
fish oil due to the high dietary levels needed for market size
fish (Jobling 2004; Trushenski & Boesenberg 2009). Thus,
identification of suitable alternative oils is critical for sustain-
ability of the aquaculture industry.
DHA-Gold� is a dry algae powder containing 530 mg g�1
crude lipid on a dry-weight basis, 460 mg g�1 of which is
DHA, 22:6n-3. The benefit of this microalga (Crypthecodini-
um cohnii) in human and animal nutrition has been investi-
gated (Spolaore et al. 2006). In fish species, the potential of a
DHA-algae meal was investigated in juvenile cobia as com-
plete replacement for fishmeal and fish oil by Salze et al.
(2010). The authors reported that 94% replacement of fish-
meal is possible when DHA-algae meal is combined with soy
products. Subsequent studies recapitulated the beneficial
effects of DHA-algae meal supplementation when fish oil is
replaced with soy oil in cobia diets (Trushenski et al. 2012,
2013; Woitel et al. 2014). Improved growth and feeding
behaviour was also observed when DHA-algae meal was
included in juvenile barramundi diet (Glencross & Rutherford
2011). However, the potential of DHA-Gold� oil to maintain
growth and fillet quality in rainbow trout–fed fishmeal and
fish oil–free diets has not been previously investigated. There-
fore, the purpose of this study was to examine the effects of
DHA-Gold� (DHA-G) inclusion as a replacement for dietary
fish oil on rainbow trout growth characteristics, fillet fatty
acid profiles, texture and consumer acceptance.
The nutritional value of DHA-G was evaluated by deter-
mining the apparent digestibility coefficients (ADCs) of
protein, lipid and energy, as well as amino acid availability
(AACs) in extruded diets. Nutrient and energy availability
was determined using the methods described by Cho et al.
(1982) and Bureau et al. (1999) to estimate apparent digest-
ibility coefficients. All diets were double labelled using
chromic oxide and yttrium oxide as the inert markers. A
complete reference diet meeting or exceeding all known
nutritional requirements for rainbow trout was blended
with the test ingredients in a 70:30 ratio (dry-weight basis)
to form test diets (Table 1). This diet has been used suc-
cessfully in several digestibility trials (Gaylord & Barrows
2009; Barrows et al. 2011) with subsequent rainbow trout
growth trials supporting the digestibility trial results
(Barrows et al. 2008, 2010).
Diets were manufactured by cooking extrusion (DNDL-
44; Buhler AG, Uzwil, Switzerland) with an 18-s exposure
to an average of 127 °C in the extruder barrel sections.
Pressure at the die head was varied from 275 to 400 bar,
depending on test diet. Pellets of 3–4 mm were produced
and dried in a pulse-bed drier (CTW; Buhler AG) to
Table 1 Composition of digestibility reference diet (g kg�1 dry-
weight) fed to rainbow trout
Ingredients g kg�1
Wheat flour1 283
Squid meal2 250
Soy protein concentrate3 171
Fish oil4 134
Corn gluten meal5 83
Soybean meal6 43
Vitamin premix7 10
Chromic oxide8 10
Choline chloride8 06
Taurine9 05
Stay-C 3510 02
Trace mineral premix11 01
Yttrium oxide8 01
1 Archer Daniels Midland (Decatur, IL, USA) 4 g kg�1protein.2 Wilbur-Ellis, 723 g kg�1crude protein.3 Solae Profine VP (St. Louis, MO, USA) 693 g kg�1crude protein.4 Omega Proteins Inc., Virgina Prime Menhaden oil (Houston, TX,
USA).5 Cargill Animal Nutrition (Minneapolis, MN, USA),
601.0 g kg�1protein.6 Archer Daniels Midland (Decatur, IL, USA), 480 g kg�1protein.7 Contributed, per kg diet; vitamin A 9650 IU; vitamin D 6600 IU;
vitamin E 132 IU; vitamin K3 1.1 g: thiamin mononitrate 9.1 mg;
riboflavin 9.6 mg; pyridoxine hydrochloride 13.7 mg; pantothe-
nate DL-calcium 46.5; cyancobalamin 0.03 mg; nicotinic acid
21.8 mg; biotin 0.34 mg; folic acid 2.5; inostitol 600.8 Sigma-Aldrich Company (St Louis, MO, USA).9 Alliance Nutrition, Twin Falls, ID, USA.10 Stay-C, 350mg g�1, DSMNutritional Products (Boulder, CO, USA).11 Sigma-Aldrich Company (St Louis, MO, USA).Contributed in
mg/kg of diet; zinc 40; manganese 13; iodine 5; copper 9.
. . . . . . . . . . . . . . . . . . . . . . . . . . . . . . . . . . . . . . . . . . . . . . . . . . . . . . . . . . . . . . . . . . . . . . . . . . . . . . . . . . . . . . . . . . . . . .
Aquaculture Nutrition, 22; 158–169 ª 2015 John Wiley & Sons Ltd

<100 mg g�1 moisture, followed by a 20-min cooling period
at ambient temperature. Both diets were top coated with
fish oil using a vacuum coater (A.J. Mixing, Oakville,
Ontario, Canada) and 24-mm mercury pressure.
Diets were fed to 30 fish (average weight 600 g) per tank
in 500-L tanks with three replicate tanks per treatment.
Water temperature was maintained at 15 °C, and lighting
was maintained on a 13-h light/11-h dark regimen. Fish
were fed to satiation by hand twice daily. Faeces from fish
in each replicate tank were obtained by manual stripping
(Austreng 1978). In brief, all fish in each tank were netted,
anaesthetized with MS-222 (Tricane methane sulphonate;
Western Chemical Company, Ferndale, WA, USA), dried
and gentle pressure was applied to the lower abdominal
region to express faecal matter into a plastic weighing pan.
Care was taken to exclude urinary excretions from the col-
lection. Faecal samples for a given tank were freeze-dried,
ground with a mortar and pestle and stored at �20 °C
until chemical analyses were performed.
Apparent digestibility coefficients of each nutrient in the
test diet and DHA-G were calculated according to the
following equations (Kleiber 1961; Forster 1999):
ADCNdiet ¼ 100� ð%marker in diet
�%nutrient in faecesÞ=ð%marker in faeces�%nutrient in dietÞ
(1)
ADCNingredient ¼ fðaþ bÞADCNt � ðaÞADCNrgb�1 (2)
where, ADCNingredient = apparent digestibility coefficients
of the nutrient in the test ingredient; ADCNt = apparent
digestibility coefficients of the nutrient in the test diets;
ADCNr = apparent digestibility coefficients of the nutrient
in the reference diet; a = (1�p) 9 nutrient content of the
reference diet; b = p 9 nutrient content of the test ingredi-
ent; p = proportion of test ingredient in the test diet.
Experimental diets Five isonitrogenous and isolipidic
experimental diets, based on the digestibility data of DHA-
G, were formulated using the same basal ingredients and
varying only in their lipid sources (Table 2). The lipid
sources and their inclusion are fish oil: FO (100%), Plant oil:
PO (Corn oil and flax oil in a 2.5:1 ratio; 100%) and DHA-
G: DHA-G at 30 mg g�1, 60 mg g�1 or 90 mg g�1 supple-
mentation replacing only the corn oil portion of the PO
blend on an isolipidic basis). The experimental diets con-
tained soy protein concentrate, corn protein concentrate and
soybean meal as the protein sources. The FO and 60 mg g�1
DHA-G diets were formulated to ensure equivalent esti-
mated values of 13.8 mg g�1 dietary DHA; subsequently,
30 mg g�1 and 90 mg g�1 DHA-G diets contained lower and
higher values of this fatty acid, respectively.
Diets were manufactured (3-mm-diameter pellets) by
cooking extrusion using a twin-screw extruder (Buhler AG)
and dried in a pulse-bed drier to <100 mg g�1 moisture.
Lecithin and DHA-G were included in the mash prior to
extruding and fish oil, corn and flax oil were was top-
coated postextrusion using a vacuum coater (A.J. Mixing).
Feeding trial procedures Eggs were obtained from Trout-
lodge Inc., Sumner, WA, USA and raised on a commercial
trout grower diet until an average body weight of 37 � 0.5 g
was attained. The fish were stocked into 200-L tanks in a re-
circulating culture system at 15 fish per tank. Four tanks of
fish were randomly assigned to each dietary treatment. The
experimental diets were fed to apparent satiation twice daily
(at 8:00 am and 3:00 pm), 6 days a week, for 12 weeks.
Apparent satiation was defined as all the feed the fish would
consume in a 20-min period. During the experiment, the re-
circulating system was maintained at optimum levels for rain-
bow trout culture: 15 °C for water temperature, >6.0 mg L�1
dissolved O2, pH of 7.5, and <0.12 mg L�1 ammonia. After
12 weeks of feeding, fish were fasted for 24 h before collec-
tion of tissue samples for compositional analyses.
Feeding trial sampling and measurements Ten fish were
euthanized with tricane methane sulphonate (MS-222;
200 mg L�1 water) prior to the experiment and kept at
�20 °C for the determination of initial body composition.
Bulk tank weights of fish were measured at the beginning
of the experiment and every 2 weeks thereafter with feed
intake determined weekly. Three fish per tank were ran-
domly selected and euthanized with tricane methane sulph-
onate (MS-222; 200 mg L�1 water) at the end of 12-week
experiment. Individual fish weights, length, visera weight
and liver weight were determined for the calculation of
weight gain (WG), specific growth rate (SGR), feed conver-
sion ratio (FCR), protein retention efficiency (PRE),
energy retention efficiency (ERE), condition factor (CF),
hepatosomatic index (HSI) and viscerosomatic index (VSI).
Blood samples were obtained from each of the three fish
. . . . . . . . . . . . . . . . . . . . . . . . . . . . . . . . . . . . . . . . . . . . . . . . . . . . . . . . . . . . . . . . . . . . . . . . . . . . . . . . . . . . . . . . . . . . . .
Aquaculture Nutrition, 22; 158–169 ª 2015 John Wiley & Sons Ltd

using a 3-mL syringe fitted with 25 gauge, 3-mm needle.
Blood was transferred into a 1.5-mL heparinized centrifuge
tube and centrifuged at 83 Hz for 5 min. Plasma from
each of the tubes was withdrawn and stored in individually
coded microcentrifuge tubes at �80 °C until analyses. Fil-
let and liver samples were frozen with liquid nitrogen
immediately after collection and were transferred and
stored at �80 °C until proximate composition and fillet
fatty acid analyses. Fillets were obtained from the remain-
ing fish in the tanks following approved human food pro-
cessing protocols of slaughter and filleting; fillets were
skinned, rinsed with tap water, packed in ice and placed
into coded bags and stored at �20 °C prior to sensory
analysis and tenderness score determinations.
Feeding trial calculations The following equations were
used in calculating each of the body indexes parameters:
WG ¼ ðfinal weight � initial weightÞðinitial weightÞ
� �� 100 (3)
FCR ¼ kg body mass
kg diet consumed(4)
PRE ¼ ðfinal body mass� initial body massÞðamount of protein given)
� �� 100 (5)
ERE ¼ ðfinal body mass� initial body massÞðamount of energy given)
� �� 100 (6)
Table 2 Ingredients and proximate composition of the experimental plant-based diets with different lipid sources
Ingredients (g kg�1dry weight) PO 30 mg g�1 DHA-Gold 60 mg g�1 DHA-Gold 90 mg g�1 DHA-Gold FO
Fish oil 1 0.0 0.0 0.0 0.0 152.0
DHA-Gold2 0.0 30.0 60.0 90.0 0.00
Soy lecithin3 30.0 30.0 30.0 30.0 30.0
Flax oil 40.0 40.0 40.0 40.0 40.0
Corn oil 109.0 93.0 76.0 59.0 0.0
Soy protein concentrate4 236.4 236.4 236.4 236.4 236.4
Corn protein concentrate5 175.4 175.4 175.4 175.4 175.4
Soybean meal6 133.0 133.0 133.0 133.0 133.0
Wheat flour 188.5 174.8 160.8 151.8 185.8
Lysine HCL 20.5 20.5 20.5 20.5 20.5
Methionine 5.5 5.5 5.5 5.5 5.5
Threonine 3.0 3.0 3.0 3.0 3.0
Taurine 5.0 5.0 5.0 5.0 5.0
Magnesium Oxide 0.5 0.5 0.5 0.5 0.5
Sodium Chloride 2.8 2.8 2.8 2.8 2.8
Trace min premix6 1.0 1.0 1.0 1.0 1.0
Vitamin premix 7027 10.0 10.0 10.0 10.0 10.0
Natu-rose8 10.0 10.0 10.0 10.0 10.0
Guar gum 3.0 3.0 3.0 3.0 3.0
Ascorbic acid 2.0 2.0 2.0 2.0 2.0
Estimated DHA from DHA-G7 0.00 6.9 13.8 20.7 13.8
Analysed composition9
Protein (N* 6.25) (mg g�1) 452 � 0.1 447 � 0.4 451 � 0.1 461 � 0.2 439 � 0.4
Fat 164 � 0.3 182 � 0.3 191 � 0.2 175 � 0.1 154 � 0.4
Energy (kJ g�1) 22.5 � 0.2 22.8 � 0.1 22.6 � 0.1 22.4 � 0.1 22.2 � 0.2
1 Omega Proteins Inc., Virgina Prime Menhaden oil (Houston, TX, USA).2 DSM Nutritional Products Inc.3 ALCOLEC� S, 62% Acetone Insolubles, (American Lecithin Company, Oxford, CT, USA).4 Solae Profine VP 693 g kg�1crude protein.5 Cargill Corn Milling, Empyreal (Cargill, Inc., Blair, Nebraska, USA).6 Contributed in mg/kg of diet; zinc 40; manganese 13; iodine 5; copper 9.7 Contributed, per kg diet; vitamin A 9650 IU; vitamin D 6600 IU; vitamin E 132 IU; vitamin K3 1.1 g: thiamin mononitrate 9.1 mg; ribo-
flavin 9.6 mg; pyridoxine hydrochloride 13.7 mg; pantothenate DL-calcium 46.5; cyancobalamin 0.03 mg; nicotinic acid 21.8 mg; biotin
0.34 mg; folic acid 2.5; inostitol 600.8 Natu-rose, Cyanotech Corporation (Kona, HI, USA).9 Means of duplicate analyses of an as-fed basis.
. . . . . . . . . . . . . . . . . . . . . . . . . . . . . . . . . . . . . . . . . . . . . . . . . . . . . . . . . . . . . . . . . . . . . . . . . . . . . . . . . . . . . . . . . . . . . .
Aquaculture Nutrition, 22; 158–169 ª 2015 John Wiley & Sons Ltd

where protein and energy retention efficiencies were calcu-
lated as weight gain (kg) for each kg protein consumed and
kcal energy consumed, respectively.
%Heptatosomatic index ¼ ðliver mass=body massÞ � 100
(7)
%Viscerosomatic index ¼ ðgut mass=body massÞ � 100
(8)
%Survival rate
¼ ðfinal number of fish� initial number of fishÞðinitial number of fishÞ
� �� 100
(9)
Dry matter was determined according to AOAC (1995).
Crude Protein (N 9 6.25) values were determined by
Dumas method on a Leco TruSpec nitrogen determinator.
Gross energy was determined using isoperibol bomb calo-
rimetry (Parr 1281; Parr Instrument Co. Inc., Moline, IL,
USA). Lipid content was determined by petroleum ether
extraction using an Ankom XT 10 according to AOAC
(1995). Yttrium and phosphorus were determined in diets
and faeces by inductively coupled plasma atomic absorp-
tion spectrophotometry following nitric acid digestion
(Anderson 1996). Amino acids were quantified following
acid hydrolysis utilizing a Beckman 7300 amino acid analy-
ser and postcolumn derivitization with ninhydrin (AAA
Laboratory, Mercer Island, WA, USA).
The plasma samples were analysed for the concentrations
of triglyceride (TG), total cholesterol (TC) and activities of
lipase enzyme (LP) using Vitros chemistry system DT6011
(Rochester, NY, USA), a modified method of Rouser
(1970).
Fatty acid profiles were determined in triplicate for each of
the experimental diets. Frozen fillets were individually
thawed, homogenized, and fat was extracted from approxi-
mately 0.3 g samples using chloroform/ methanol accord-
ing to Bligh & Dyer (1959). Subsequently, 20 lL of a 1%
solution of pentadecanoic acid (15:0) in dissolved methanol
was added to each of the sample as an internal standard.
Folch organic extraction was performed by adding 3 mL
of 0.88% potassium chloride (KCl) and 5 mL of 2:1
dichloromethane (DCM) and centrifuging at 1500 g for
5 min. The DCM layer was removed and placed into a
new clean glass dram vial extraction. This step was
repeated thrice, and thereafter, the hydrophobic DCM
extract was dried with nitrogen. Fatty acid methyl ester
(FAME) analysis was performed by adding 0.5 mL of
boron trifluoride methanol (BF3) to the hydrophobic
extract and heating at 60 °C for 30 min, followed by addi-
tion of 0.5 mL of DDO2 water and 0.5 lL hexane. Fatty
acid methyl esters were separated and quantified by gas
chromatography–mass separation (GC–MS) (Donato et al.
2003). The FAMEs were quantified by the comparison of
retention time and peak area to those of reference stan-
dards (GLC-473b; Nu-Check Prep, Elysian, MN, USA).
Shear force measurements were conducted on frozen fillet
samples following the procedures of Boles et al. (2009). Sam-
ples initially stored at �20 °C were thawed at 4 °C, and
thereafter, three circle cores were removed parallel to the
fibre direction. Each raw sample was sheared once perpen-
dicular to the fibre direction with a TMS 30 Food Texturom-
eter (Food Technology Corporation, Sterling, VA, USA)
fitted with a Warner–Bratzler shear attachment using a
crosshead speed of 100 mm min�1 to obtain the shear force
(N), distance, and time required to calculate springiness,
stringiness, adhesiveness and cohesiveness for each sample.
The average of the three samples sheared per fillet was used
for statistical analysis. Connective tissue shear force was
obtained by measuring the connective tissue peak on the
shear deformation curve as described by Moller (1980).
Fillets were skinned and individually packaged in ‘Ziploc’
freezer bags and stored at �23 °C until analysis. Prior to
analysis, fillets were partially thawed, just enough to cut
with a knife; about 10 mm was removed from each side,
and then, 9.0 � 1.0 g serving portions were sliced across
the fillet from dorsal to ventral. Frozen fillet portions (six to
nine pieces) were placed in 25 9 30 cm boil-in pouches.
Samples in pouches were vacuum-packed using the Ultravac
250 sealer (Koch Equipment, Kansas City, MO, USA).
Vacuum-packed fillet samples were immediately returned to
�23 °C until sensory analysis. For sensory analyses,
. . . . . . . . . . . . . . . . . . . . . . . . . . . . . . . . . . . . . . . . . . . . . . . . . . . . . . . . . . . . . . . . . . . . . . . . . . . . . . . . . . . . . . . . . . . . . .
Aquaculture Nutrition, 22; 158–169 ª 2015 John Wiley & Sons Ltd

samples were poached at 74 °C for 6 min, then removed
from the boiling pouch and held under the radiant heat unit
at setting ‘6.5’ to maintain a temperature of not <60 °C for a
maximum of 15 min before serving to panellists. Samples
were randomly served hot in a consumer test to 25 panellists
who were asked to compare four unknown samples (repre-
senting each dietary treatment) with an identified control
(100% FO), in a room designed for sensory analysis.
Untrained sensory panellists were recruited from the Wash-
ington State University community. Panellists were from a
diverse ethnic background and ranged in age from 18 to 64.
Approximately, 50% of the test subjects were under age 35;
61% of test subjects were female. All participants signed an
informed consent form, and the project was approved by the
Washington State University Institutional Review Board.
Sensory testing was conducted over two test dates in the
WSU School of Food Science sensory laboratory. The FO
control was presented in a pair with each of the test treat-
ments. On Day 1, 24 panellists were presented with the FO
versus 30 mg g�1 DHA, and in a second tasting flight, FO
versus 90 mg g�1 DHA. On Day 2, the same 25 panellists
were presented with the FO versus 60 mg g�1 DHA and ver-
sus PO, respectively. Pair comparisons were presented in ran-
dom order under white light. Just prior to serving, each fillet
sample was transferred from the radiant warmer to a 4 oz
souffl�e cup identified with a 3-digit code, then sealed with a
cap to trap aroma. Panellists were provided with reagent
grade deionized water and unsalted-top saltine crackers for
cleansing the palate. A cuspidor was provided for expectora-
tion. Using a paired difference test and paired preference
test, panellists were asked to indicate which sample in a pair
had: (i) more fishy aroma, (ii) more fishy flavour, (iii) more
grassy flavour and (iv) firm texture, as well as which sample
was preferred. Panellists were asked to comment as to why
they preferred one sample over the other.
All data on growth characteristics, blood chemistry and
fatty acids profiles were subjected to one-way ANOVA with
the Proc GLM of SAS version 9.1 (SAS Institute Inc.,
Cary, NC, USA), significant difference was considered at
P < 0.05. Sensory analysis results were analysed using
Compusense� five software (Compusense Inc., Guelph,
ON, Canada) using Tukey’s HSD and the binomial distri-
bution tables for paired comparison (Roessler et al. 1978).
Significance is reported as P ≤ 0.05, ≤0.01 or ≤0.001, repre-senting minimum agreeing judgments of 18, 19 and 21 of
25 panellists.
The analysed proximate composition (g kg-1) of DHA-G
was 960 dry matter, 534 crude lipid, 151 crude protein and
28.6 kJ g�1. Calculated dry matter, protein, lipid and
energy apparent digestibility coefficients (ADCs) were 61%,
18%, 98% and 73%, respectively (Table 3). Amino acid
availability coefficients (AACs) of the DHA-G were low, as
were sum AACs.
Proximate analysis of the diets reflected formulation targets
(Table 2), while the dietary fatty acid profile reflected that
of the oils used in feed formulation (Table 4). The PO diet
had no detectable levels of 14:0, but algal DHA supple-
mentation increased 14:0 levels in a corresponding manner.
A similar trend was observed with 18:1n-9 as algal DHA
was supplemented in the PO diet. The FO diet was the only
diet with 20:5n-3, while inclusion of algal DHA in the PO
diet increased the level of 22:6n-3 in the DHA-G diets with
the exception of 30 mg g�1 DHA-G diet, which was below
the level of detection.
Table 3 Proximate composition, ADCs and AACs of DHA-
Gold�1
Analysed
composition mg g�1 ADCs and AACs (%)
Dry matter 960.0 61
Protein 151.1 18
Lipid 534.4 98
Energy kJ g�1 28.6 73
Phosphorus 2.0 100
Amino Acids (sum) 418.0 13
Ala 6.9 46
Arg 6.4 61
Asp 14.0 26
Glu 14.9 9
Gly 5.6 33
His 1.8 14
Ile 3.9 40
Leu 6.8 18
Lys 3.3 99
Met 2.3 48
Phe 4.4 36
Pro 4.0 1
Ser 3.0 0
Thr 4.1 29
Tyr 2.6 28
Val 5.7 55
1 Means of duplicate analyses on a dry matter basis (mg g�1
sample).
. . . . . . . . . . . . . . . . . . . . . . . . . . . . . . . . . . . . . . . . . . . . . . . . . . . . . . . . . . . . . . . . . . . . . . . . . . . . . . . . . . . . . . . . . . . . . .
Aquaculture Nutrition, 22; 158–169 ª 2015 John Wiley & Sons Ltd

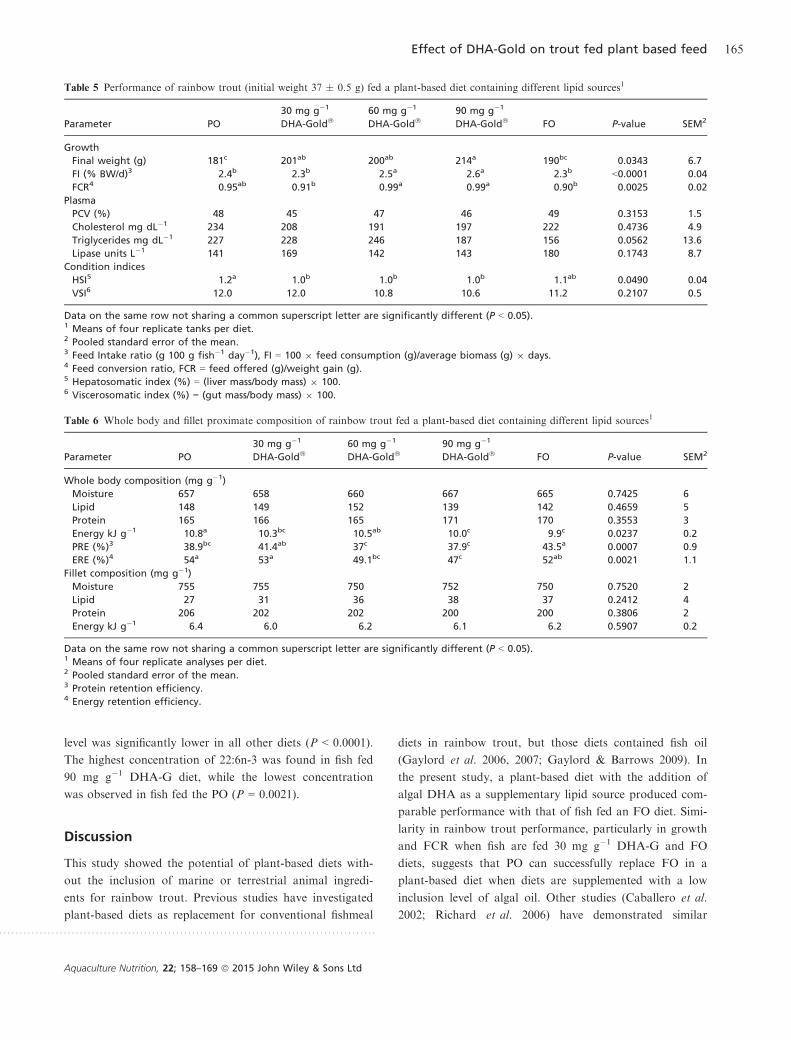
Dietary treatments significantly (P = 0.0343) affected the
weight of rainbow trout and the highest final weight was
observed in fish fed the 90 mg g�1 DHA-G diet (Table 5).
Feed intakes of fish fed the 60 mg g�1 and 90 mg g�1
DHA-G diets were significantly higher than all other treat-
ments (P < 0.0001) and FCR of fish fed the 60 mg g�1 and
90 mg g�1 DHA-G diets were significantly higher com-
pared to fish fed FO diet or 30 mg g�1 DHA-G diet
(P = 0.0025).
No significant effect of dietary lipid source on PCV,
cholesterol or lipase was observed (Table 5). There was a
tendency towards increased plasma triglyceride concentra-
tion in fish fed PO and DHA-G diets (P = 0.0562).
Hepatosomatic index observed in the DHA-G diets aver-
aged 1.0, which was significantly lower than the value
obtained from those fish fed the PO diet (P = 0.0490;
Table 5). However, viscerosomatic index and condition fac-
tor were not affected by dietary treatments (P = 0.2107
and 0.2389, respectively).
Whole body moisture (P = 0.7425), lipid (P = 0.4659) pro-
tein (P = 0.3553) were not affected by dietary treatments;
however, energy was significantly affected by diet
(P = 0.0237; Table 6). Whole-body energy composition of
fish fed the PO diet was significantly higher than in fish fed
the 90 mg g�1 DHA and FO diets. Both protein retention
efficiency (PRE) and energy retention efficiency (ERE) were
significantly lower in fish fed 90 mg g�1 DHA-G diet than
in fish fed FO diet (P = 0.0007, P = 0.0021, respectively).
In contrast, dietary treatments did not significantly alter fil-
let moisture, lipid, protein and energy levels (P = 0.7520,
P = 0.2412, P = 0.3806, and P = 0.5907, respectively).
Differences in consumer preference were noted when com-
paring each diet (PO, 30 mg g�1, 60 mg g�1 and 90 mg g�1
DHA-G) to the control diet (Fig. 1). Panellists found trout
fillets from the FO diet to have significantly more fishy
aroma (P < 0.001) and fishy flavour (P < 0.05) when com-
pared to fillets from fish fed the PO diet (Fig. 1a). Fillets
from fish fed the PO diet had more grassy flavour
(P < 0.01) when compared to fillets from fish fed the FO
diet (Fig. 1a). When fillets from fish fed the FO diet were
compared to fillets from fish fed the 30 mg g�1 DHA-G
diet, the fillets from fish fed the FO diet were found to
have more grassy flavour than fillets from fish fed the 30
mg g�1 DHA-G diet (P < 0.05; Fig. 1b). When fillets from
fish fed the FO diet were compared with fillets from fish
fed the 60 mg g�1 DHA-G diet, a significant difference in
preference was found for fillets from fish fed the FO diet
(P < 0.05; Fig. 1c). Fillets from trout fed the 90 mg g�1
DHA-G diet were perceived by panellists to have more
fishy flavour than the fillets from fish fed the FO diet
(P < 0.05; Fig. 1d).
Although there was a trend (P < 0.1) for fillets from FO
diet to be considered firmer than PO diet by panellists,
shear force analysis displayed no significant effect of die-
tary lipid source on fillet hardness (P = 0.4142) or fractura-
bility (P = 0.6277; Table 7). Similarly, other measures of
fillet texture including springiness, stringiness, adhesiveness
and cohesiveness were not altered by dietary lipid source.
The fatty acid profiles of the fillets reflected dietary fatty
acid concentrations (Table 8). The most abundant satu-
rated fatty acid was 16:0, the level of which was not altered
by dietary treatment (P = 0.0051). The 18:1n-9 level was
lower in fish fed the FO diet than those fed the PO and the
DHA-G diets (P = 0.0017). Moreover, 18:2n6 was signifi-
cantly higher in fish fed the PO diet than those fed the FO
diet. Inclusion of algal DHA in the PO diet inversely
affected the level of 18:2n6. Arachidonic acid was highest
in fish fed the PO diet (P = 0.0009). Eicosapentanoic acid
concentration was highest in fish fed the FO diet and the
Table 4 Selected fatty acid composition mg g�1 of the plant-based
diet containing different lipid sources1
Fatty acids PO
30 mg g�1
DHA-Gold�60 mg g�1
DHA-Gold�90 mg g�1
DHA-Gold� FO
9:0 3 3 2 2 2
14:0 – 15 30 37 99
15:0 21 19 16 20 22
16:0 281 282 285 296 303
16:1n-7 – – – – 62
17:0 – – – – 3
18:0 28 26 26 26 30
18:1n-9 141 157 141 126 96
16:2n-4 – – – – 07
18:2n-6 456 423 400 391 292
18:3n-3 71 75 77 62 32
18:3n-6 – – – – 8
18:4n-3 – – – – 5
20:4n-6 – – – – –
20:5n-3 – – – – 23
22:6n-3 – 4 24 39 17
1 Mean of triplicate analyses per diet.
. . . . . . . . . . . . . . . . . . . . . . . . . . . . . . . . . . . . . . . . . . . . . . . . . . . . . . . . . . . . . . . . . . . . . . . . . . . . . . . . . . . . . . . . . . . . . .
Aquaculture Nutrition, 22; 158–169 ª 2015 John Wiley & Sons Ltd
level was significantly lower in all other diets (P < 0.0001).
The highest concentration of 22:6n-3 was found in fish fed
90 mg g�1 DHA-G diet, while the lowest concentration
was observed in fish fed the PO (P = 0.0021).
This study showed the potential of plant-based diets with-
out the inclusion of marine or terrestrial animal ingredi-
ents for rainbow trout. Previous studies have investigated
plant-based diets as replacement for conventional fishmeal
diets in rainbow trout, but those diets contained fish oil
(Gaylord et al. 2006, 2007; Gaylord & Barrows 2009). In
the present study, a plant-based diet with the addition of
algal DHA as a supplementary lipid source produced com-
parable performance with that of fish fed an FO diet. Simi-
larity in rainbow trout performance, particularly in growth
and FCR when fish are fed 30 mg g�1 DHA-G and FO
diets, suggests that PO can successfully replace FO in a
plant-based diet when diets are supplemented with a low
inclusion level of algal oil. Other studies (Caballero et al.
2002; Richard et al. 2006) have demonstrated similar
Table 5 Performance of rainbow trout (initial weight 37 � 0.5 g) fed a plant-based diet containing different lipid sources1
Parameter PO
30 mg g�1
DHA-Gold�60 mg g�1
DHA-Gold�90 mg g�1
DHA-Gold� FO P-value SEM2
Growth
Final weight (g) 181c 201ab 200ab 214a 190bc 0.0343 6.7
FI (% BW/d)3 2.4b 2.3b 2.5a 2.6a 2.3b <0.0001 0.04
FCR4 0.95ab 0.91b 0.99a 0.99a 0.90b 0.0025 0.02
Plasma
PCV (%) 48 45 47 46 49 0.3153 1.5
Cholesterol mg dL�1 234 208 191 197 222 0.4736 4.9
Triglycerides mg dL�1 227 228 246 187 156 0.0562 13.6
Lipase units L�1 141 169 142 143 180 0.1743 8.7
Condition indices
HSI5 1.2a 1.0b 1.0b 1.0b 1.1ab 0.0490 0.04
VSI6 12.0 12.0 10.8 10.6 11.2 0.2107 0.5
Data on the same row not sharing a common superscript letter are significantly different (P < 0.05).1 Means of four replicate tanks per diet.2 Pooled standard error of the mean.3 Feed Intake ratio (g 100 g fish�1 day�1), FI = 100 9 feed consumption (g)/average biomass (g) 9 days.4 Feed conversion ratio, FCR = feed offered (g)/weight gain (g).5 Hepatosomatic index (%) = (liver mass/body mass) 9 100.6 Viscerosomatic index (%) = (gut mass/body mass) 9 100.
Table 6 Whole body and fillet proximate composition of rainbow trout fed a plant-based diet containing different lipid sources1
Parameter PO
30 mg g�1
DHA-Gold�60 mg g�1
DHA-Gold�90 mg g�1
DHA-Gold� FO P-value SEM2
Whole body composition (mg g�1)
Moisture 657 658 660 667 665 0.7425 6
Lipid 148 149 152 139 142 0.4659 5
Protein 165 166 165 171 170 0.3553 3
Energy kJ g�1 10.8a 10.3bc 10.5ab 10.0c 9.9c 0.0237 0.2
PRE (%)3 38.9bc 41.4ab 37c 37.9c 43.5a 0.0007 0.9
ERE (%)4 54a 53a 49.1bc 47c 52ab 0.0021 1.1
Fillet composition (mg g�1)
Moisture 755 755 750 752 750 0.7520 2
Lipid 27 31 36 38 37 0.2412 4
Protein 206 202 202 200 200 0.3806 2
Energy kJ g�1 6.4 6.0 6.2 6.1 6.2 0.5907 0.2
Data on the same row not sharing a common superscript letter are significantly different (P < 0.05).1 Means of four replicate analyses per diet.2 Pooled standard error of the mean.3 Protein retention efficiency.4 Energy retention efficiency.
. . . . . . . . . . . . . . . . . . . . . . . . . . . . . . . . . . . . . . . . . . . . . . . . . . . . . . . . . . . . . . . . . . . . . . . . . . . . . . . . . . . . . . . . . . . . . .
Aquaculture Nutrition, 22; 158–169 ª 2015 John Wiley & Sons Ltd

impact of total replacement of fish oil on growth perfor-
mance in a fishmeal-based diet.
Lack of consistent sensory characteristic differences
between fillets from FO and PO diets in this study indicate
the ability of PO, with the inclusion of DHA-G, to also
replace fish oil without detrimental effect on sensory prop-
erties. Previous studies have reported inconsistent organo-
leptic evaluation of fish fillets when fed plant ingredients
either as protein or as lipid sources (Turchini et al. 2009;
Stone et al. 2011). In this study, the panellists found fillets
from fish fed 90 mg g�1 DHA-G to have fishier flavour than
those fish that were actually fed FO diet. The reason for this
observation is likely the increased DHA levels in those
fillets. It has previously been reported that organoleptic
scores are highly significantly correlated with levels of EPA,
docosapentaenoic acid and DHA (Miller & Robisch 1969).
Higher dietary concentrations of 18:3n-3 and 18:2n-6
as compared to fillet concentrations is supported by ear-
lier findings in rainbow trout (Thanuthong et al. 2011)
and in salmon (Stubhaug et al. 2006, 2007). The authors
found that both fatty acids are abundantly used for fatty
acid b-oxidation when present in high quantities in fish
diets. Rinchard et al. (2007) reported that rainbow trout
only retain high proportion of 18:3n-3 in case of short-
age. Bioconversion pathways for the elongation of poly-
unsaturated fatty acids have been reported (Buzzi et al.
1997; Bell et al. 2001; Torstensen & Tocher 2010), where
elongases are proposed to be responsible such that 18:2n-
6, 18:3n-6, 18:3n-3 and 18:4n-3 are elongated to 20:2n-6,
20:3n-6, 20:3n-3 and 20:4n-6, respectively. However, in
this study, 20:2n-6 and 20:4n-6 were only detected in sig-
nificant amounts in fish fed the PO diet, and 20:3n-6
and 20:3n-3 were not detected at all. Although it has
been suggested that 18:3n-3 is a preferred substrate for
the elongases over that of 18:2n-6 and that the enzymes
activities are substrate-dependent, it is difficult to ascer-
tain if in the current study elongase was insufficient or
that the high contents of 18:2n-6 and 18:3n-3 in the diets
prevented the activities of these enzymes. The concentra-
tion of 18:3n-3 in the fillets of fish fed the PO diet was
not affected by supplementing the PO diet with DHA-G,
but fillet 18:2n-6 and 20:4n-6 levels decreased with
increased dietary inclusion of DHA-G. As adequate die-
tary DHA was supplied, it is possible that there was no
need for the D-6 desaturase to mobilize 18:2n-6 and
18:3n-3 for elongation as well as subsequent in vivo de-
saturation to 22:6n-3 (Thanuthong et al. 2011). Substrate
availability does not explain the low amounts of arachi-
donic acid detected in the fillets of fish fed FO or DHA-
0
5
10
15
20
25
FO PO
0
5
10
15
20
25
30 mg g–1DHA
0
5
10
15
20
25
60 mg g–1DHA
0
5
10
15
20
25
FO
FO
FO 90 mg g–1DHA
(a)
(b)
(c)
(d)
num
ber
of p
anel
ists
sel
ectin
g a
give
n sa
mpl
e (n
= 2
5)nu
mbe
r of
pan
elis
ts s
elec
ting
a gi
ven
sam
ple
(n =
25)
num
ber
of p
anel
ists
sel
ectin
g a
give
n sa
mpl
e (n
= 2
5)nu
mbe
r of
pan
elis
ts s
elec
ting
a gi
ven
sam
ple
(n =
25)
a b
b
b
b
c
Figure 1 Paired comparison sensory evaluation of fillets from rain-
bow trout fed a plant-based diet containing different lipid sources.
A paired comparison for a given attribute between the control diet
and treatment diet is denoted as significant, with “a” being signifi-
cant at p < 0.001, “b” being significant at p < 0.05 and “c” being
significant at p < 0.01.
. . . . . . . . . . . . . . . . . . . . . . . . . . . . . . . . . . . . . . . . . . . . . . . . . . . . . . . . . . . . . . . . . . . . . . . . . . . . . . . . . . . . . . . . . . . . . .
Aquaculture Nutrition, 22; 158–169 ª 2015 John Wiley & Sons Ltd

supplemented diets. Recent research by Emery et al.
(2013) suggests that, the activity of D-6 desaturase on
n-3 and n-6 substrates is independent of substrate
availability.
Taken together, these results appear to demonstrate that
supplementing a PO diet with algal DHA can meet the die-
tary requirement of trout for n-3 fatty (NRC, 2011) as no
apparent signs of n-3 deficiency such as poor growth or
shock syndrome were observed and plasma cholesterol and
triglyceride levels were within normal ranges (Kopp et al.
2011) and not significantly higher in fish fed diets with
lower concentrations of n-3 PUFA as has previously been
reported by Kenari et al. (2011). Algal DHA supplementa-
tion also provided an effective mechanism for increasing
long-chain PUFA in fillets of rainbow trout-fed plant pro-
teins and oil without fish meal or fish oil that still allowed
fillets to meet the recommended intake for long-chain
PUFA (Simopoulos et al. 1999). These results may be
beneficial to the aquafeed industry by providing effective
alternatives to reduce over-dependence on wild-harvested
fish products for formulation of fish feed. However, only
supplementation levels of 60 mg g�1 and 90 mg g�1 DHA-
G increased fillet DHA levels to levels that were compara-
ble or in excess of fillets from rainbow trout fed the FO
diet and at these levels some consumer preference effects
were noted. Thus, future studies should address both the
increased production cost associated with the high supple-
mentation levels necessary and the potential negative effects
of inclusion on consumer preference.
Table 7 Shear force (N) measurements of fillets from rainbow trout fed a plant-based diet containing different lipid sources
Parameters PO
30 mg g�1
DHA-Gold�60 mg g�1
DHA-Gold�90 mg g�1
DHA-Gold� FO P-value SEM2
Hardness 34.06 40.42 35.21 39.26 39.36 0.4142 5.2
Cohesiveness 0.13 0.16 0.46 0.09 0.05 0.6579 0.38
Adhesiveness 0.015 0.021 0.010 0.036 0.004 0.3201 0.02
Fracturability 18.50 22.83 21.28 22.62 27.0 0.6277 5.2
Springiness 0.63 0.92 0.20 0.81 0.18 0.1929 0.47
Stringiness 3.47 3.26 3.46 3.20 3.15 0.6149 0.15
1 Means of four replicate analyses per diet.2 Pooled standard error of the mean.
Table 8 Fillet fatty acid compositions (mg g�1) of rainbow trout fed a plant-based diet containing different lipid sources1
Fatty acid
Dietary treatments
Initial PO
30 mg g�1
DHA-Gold�60 mg g�1
DHA-Gold�90 mg g�1
DHA-Gold� FO P-value SEM2
14:0 167 13c 29c 50b 52b 105a <0.0001 06.1
15:0 52 57 73 74 66 76 0.5149 08.2
16:0 356 273b 342a 372a 344a 389a 0.0015 16.0
18:0 31 45 39 36 39 39 0.4589 03.4
16:1n-7 135 15b 13b 15b 12b 87a <0.0001 02.0
18:1n-9 96 199a 161b 147bc 139bc 116c 0.0017 11.3
16:2n-4 10 ND ND 3ab ND 6a 0.0359 01.5
18:2n-6 48. 273a 234b 203bc 185c 101d <0.0001 12.3
20:2n-6 ND 9a ND ND 3b ND 0.0129 01.7
20:4n-6 ND 11a 1b ND 4b ND 0.0009 01.6
18:3n-3 08 48a 45a 50a 45a 12b <0.0001 02.9
18:3n-6 ND 6a 1b ND ND ND <0.0001 00.4
18:4n-3 ND 6a ND ND ND ND <0.0001 00.5
20:5n-3 34 7b 5b 5b 4b 26a <0.0001 01.9
22:6n-3 66 21c 26bc 46a 60a 43ab 0.0021 06.0
Data on the same row not sharing a common superscript letter are significantly different (P < 0.05).1 Means of triplicate analyses of three fish per tank, four tanks per treatment.2 Pooled standard error of the mean.
. . . . . . . . . . . . . . . . . . . . . . . . . . . . . . . . . . . . . . . . . . . . . . . . . . . . . . . . . . . . . . . . . . . . . . . . . . . . . . . . . . . . . . . . . . . . . .
Aquaculture Nutrition, 22; 158–169 ª 2015 John Wiley & Sons Ltd

OC Betiku gratefully thanks African Women in Agricul-
tural Research and Development (AWARD) and William
Foss (TwoxSea Inc.) for financial support. The authors
also wish to acknowledge the assistance of Prof. Boles and
Prof. Dratz of Montana State University in shear force
and fatty acids analysis, respectively, and Jesse Peach and
Jesse Thomas for technical assistance on fatty acid analysis.
The authors also thank Jason Frost and Andy Lybeck for
their assistance with diet manufacturing, Matt Toner, Cal
Fraser, Jason Ilgen, Christopher Hooley and Blake Haupt-
man for their assistance in fish culture and sampling, and
Aaron Nistler, Eli Cureton and T. Gibson Gaylord for
their assistance with laboratory analyses.
Anderson, K.A. (1996) Micro-digestion and ICP-AES analysis for
the determination of macro and micro elements in plant tissues.
At. Spectrosc., 17, 30–33.Association of Official Analytical Chemists (AOAC). (1995) Offi-
cial Methods of Analysis, vol. 4, 16th edn. AOAC, Arlington,
VA.
Austreng, E. (1978) Digestibility determination in fish using
chromic oxide marking and analysis of contents from different
segments of the gastrointestinal tract. Aquaculture, 13, 265–272.Barrows, F.T., Gaylord, T.G., Sealey, W.M., Smith, C.E. &
Porter, L. (2008) The effect of vitamin premix in extruded plant
based and fish meal based diets on growth efficiency and health
of rainbow trout, Oncorhynchus mykiss. Aquaculture, 283,
148–155.Barrows, F.T., Gaylord, T.G., Sealey, W.M., Porter, L. & Smith,
C.E. (2010) Supplementation of plant-based diets for rainbow
trout (Oncorhynchus mykiss) with macro-minerals and inositol.
Aquacult. Nutr., 16, 654–661.Barrows, F.T., Gaylord, T.G., Sealey, W.M. & Rawles, S.D. (2011)
Database of nutrient digestiblity’s of traditional and novel feed
ingredients for trout and hybrid striped bass. USDA-ARS.
Accessed at http://www.ars.usda.gov/Main/docs.htm?docid=21905.
Bell, J.G., McEvoy, J., Tocher, D.R., McGhee, F., Campbell, P.J.
& Sargent, J.R. (2001) Replacement of fish oil with rapeseed oil
in diets of Atlantic salmon (Salmo salar) affects tissue lipid com-
positions and hepatocyte fatty acid metabolism. J. Nutr., 131,
1535–1543.Bell, J.G., Tocher, D.R., Henderson, R.J., Dick, J.R. & Crampton,
V.O. (2003) Altered fatty acid compositions in Atlantic salmon
(Salmo salar) fed diets containing linseed and rape seed oils can
be partially restored by a subsequent fish oil finishing diet. J.
Nutr., 133, 2793–2801.Benedito-Palos, L., Navarro, J.C., Sitj�a-Bobadilla, A., Bell, J.D.,
Kaushik, S. & P�erez-S�anchez, J. (2008) High levels of vegetable
oils in plant protein-rich diets fed to gilthead sea bream (Sparus
aurata L): growth performance, muscle fatty acid profiles and
histological alterations of target tissues. Br. J. Nutr., 100,
992–1003.Bligh, E.G. & Dyer, W.J. (1959) A rapid method for total lipid
extraction and purification. Can. J. Biochem. Physiol., 37,
911–917.
Boles, J.A., Boss, D.L., Neary, K.I., Davis, K.C. & Tess, M.W.
(2009) Growth implants reduced tenderness of steaks from steers
and heifers with different genetic potentials for growth and
marbling. J. Anim. Sci., 87, 269–274.Bureau, D.P., Harris, A.M. & Cho, C.Y. (1999) Apparent digest-
ibility of rendered animal protein ingredients for rainbow trout
(Oncorhynchus mykiss). Aquaculture, 180, 345–358.Bureau, D.P., Hua, K. & Harris, A.M. (2008) The effect of dietary
lipid and long-chain n-3 PUFA levels on growth, energy utiliza-
tion, carcass quality, and immune function of rainbow trout,
Ocorhynchus mykiss. Aquaculture, 214, 253–271.Buzzi, M., Henderson, R.J. & Sargent, J.R. (1997) Biosynthesis of
docosahexaenoic acid in trout hepatocytes proceeds via 24-car-
bon intermediates. Comp. Biochem. Physiol. B Biochem. Mol.
Biol., 116, 263–267.Caballero, M.J., Obach, A., Rosenlund, G., Montero, D., Gisvold,
M. & Izquierdo, M.S. (2002) Impact of different dietary lipid
sources on growth, lipid digestibility, tissue fatty acid composi-
tion and histology of rainbow trout, Oncorhynchus mykiss. Aqua-
culture, 214, 253–271.Cho, C.Y., Slinger, S.J. & Bayley, H.S. (1982) Bioenergetics of sal-
monid fishes: energy intake, expenditure and productivity. Comp.
Biochem. Physiol., 73, 25–41.Donato, M., Vilela, M.H. & Bandarra, N.M. (2003) Fatty acids,
sterols, alpha-tocopherol and total carotenoids of Diacronema
vlkianum. J. Food Lipids, 10, 267–276.Emery, J.A., Hermon, K., Hamin, N.K.A., Donald, J.A. & Turchi-
ni, G.M. (2013) Delta 6 desaturase substrate competition: dietary
linoleic acid has only trivial effects on linolenic acid bioconver-
sion in the teleost rainbow trout. PLoS ONE, 8, 1–14.Food and Agriculture Organisation of the United States (FAO)
(2010) The State of World Fisheries and Aquaculture 2009
(SOFIA). FAO Fisheries and Aquaculture Department, Rome.
Forster, I. (1999) A note on the method of calculating digestibility
coefficients of nutrients provided by single ingredients to feeds
of aquatic animals. Aquacult. Nutr., 5, 143–145.Gaylord, T.G. & Barrows, F.T. (2009) Multiple amino acid
supplementations to reduce dietary protein in plant-based rain-
bow trout, (Oncorhynchus mykiss) feeds. Aquaculture, 287,
180–184.Gaylord, T.G., Teague, A.M. & Barrows, F.T. (2006) Taurine
supplementation of all-plant protein diets for rainbow trout
(Oncorhynchus mykiss). J. World Aquacult. Soc., 37, 509–517.Gaylord, T.G., Barrows, F.T., Teague, A.M., Johansen, K.A.,
Overturf, K.E. & Shepherd, B. (2007) Supplementation of tau-
rine and methionine to all-plant protein diets for rainbow trout
(Oncorhynchus mykiss). Aquaculture, 269, 514–524.Glencross, B. & Rutherford, N. (2011) A determination of the
quantitative requirements for docosahexaenoic acid for juvenile
barramundi (Lates calcarifer). Aquacult. Nutr., 17, 536–548.Jobling, M. (2004) Finishing feeds for carnivorous fish and the
fatty acid dilution model. Aquacult. Res., 35, 706–709.Karalazos, V., Bendiksen, E.A. & Bell, J.G. (2011) Interactive
effects of dietary protein/lipid level and oil source on growth,
feed utilization and nutrient and fatty acid digestibility of Atlan-
tic salmon. Aquaculture, 311, 193–200.Kenari, A.B., Mozanzadeh, M.T. & Pourgholam, R. (2011) Effects
of total fish oil replacement to vegetable oils at two dietary lipid
levels on the growth, body composition, haemato-immunological
and serum biochemical parameters in Caspian brown trout (Salmo
trutta caspius Kessler, 1877). Aquacult. Res., 42, 1131–1144.Kleiber, M. (1961) The Fire of Life: An Introduction to Animal
Energetics. John Wiley and Sons Inc, New York, NY.
. . . . . . . . . . . . . . . . . . . . . . . . . . . . . . . . . . . . . . . . . . . . . . . . . . . . . . . . . . . . . . . . . . . . . . . . . . . . . . . . . . . . . . . . . . . . . .
Aquaculture Nutrition, 22; 158–169 ª 2015 John Wiley & Sons Ltd

Kopp, R., Mare�s, J., Lang, S., Brabec, T. & Zikova, A. (2011)
Assessment of ranges plasma indices in rainbow trout
(Oncorhynchus mykiss) reared under conditions of intensive aqua-
culture. Acta univ. agric. et silvic. Mendel. Brun., 6, 181–188.Kowalska, A., Zakes, Z., Jankowska, B. & Siwicki, A. (2011)
Substituting vegetable oil for fish in pikeperch diets: the impact
on growth, internal organ histology, blood biochemical parame-
ters, and proximate composition. Aquacult. Nutr., 17, 148–163.Liu, K.K.M., Barrows, F.T., Hardy, R.W. & Dong, F.M. (2004)
Body composition, growth performance and product quality of
rainbow trout (Oncorhynchus mykiss) fed diets containing poul-
try fat, soybean/corn lecithin or menhaden oil. Aquaculture, 238,
309–328.Miller, D. & Robisch, P. (1969) Comparative effect of herring,
menhaden, and safflower oils on broiler tissues fatty acid compo-
sition and flavor. Poult. Sci., 48, 2146–2157.Moller, A.J. (1980) Analysis of Warner-Bratzler shear pattern with
regard to myofibrillar and connective tissue components of ten-
derness. Meat Sci., 5, 247–260.Mourente, G. & Bell, J.G. (2006) Partial replacement of dietary
fish oil with blends of vegetable oils (rapeseed, linseed and palm
oils) in diets for European sea bass (Dicentrarchus labrax L.)
over a long term growth study: effects on muscle and liver
fatty acid composition and effectiveness of a fish oil finishing
diet. Comp. Biochem. Physiol. B Biochem. Mol. Biol., 145, 389–399.
National Research Council (NRC) (2011) Nutrient Requirements
of Fish. National Academy Press, Washington.
Richard, N., Kaushik, S., Larroquet, L., Panserat, S. & Corraze,
G. (2006) Replacing dietary fish oil by vegetable oils has little
effect on lipogenesis, lipid transport and tissue lipid uptake in
rainbow trout (Oncorhynchus mykiss). Br. J. Nutr., 96, 299–309.Rinchard, J., Czesny, S. & Dabrowski, K. (2007) Influence of lipid
class and fatty acid deficiency on survival, growth, and fatty acid
composition in rainbow trout juveniles. Aquaculture, 264,
363–371.Roessler, E.B., Pangborn, R.M., Sidel, J.L. & Stone, H. (1978)
Expanded statistical tables for estimating significance in paired
preference, paired difference, duo-trio and triangle tests. J. Food
Sci., 43, 940–943.Rouser, L. (1970) Estimation of phospholipids by phosphorous
assays. Lipids, 5, 494–496.Salze, G., McLean, E., Battle, P.R., Schwarz, M.H. & Craig, S.R.
(2010) Use of soy protein concentrate and novel ingredients in
the total elimination of fish meal and fish oil in diets for juvenile
cobia, Rachycentron canadum. Aquaculture, 298, 294–299.Simopoulos, A.P., Leaf, A. & Salem, N. (1999) Essentiality of and
recommended dietary intakes for omega-6 and omega-3 fatty
acids. Ann. Nutr. Metab., 43, 127–130.Spolaore, P., Joannis-Cassan, C., Duran, E. & Isambert, A. (2006)
Commercial applications of microalgae. J. Biosci. Bioeng., 101,
87–96.Stone, D.A.J., Oliveira, A.C.M., Ross, C.F., Plante, S., Smiley, S.,
Bechtel, P. & Hardy, R.W. (2011) The effects of phase-feeding
rainbow trout (Oncorhynchus mykiss) with canola oil and Alas-
kan pollock fish oil on fillet fatty acid composition and sensory
attributes. Aquacult. Nutr., 17, 521–529.Stubhaug, I., Lie, Ø. & Torstensen, B.E. (2006) b-oxidation capac-
ity in liver increases during parr-smolt transformation of
Atlantic salmon (Salmo salar L.) fed vegetable- and fish oil. J.
Fish Biol., 69, 504–517.
Stubhaug, I., Lie, Ø. & Torstensen, B.E. (2007) Fatty acid produc-
tive value and b-oxidation capacity in Atlantic salmon (Salmo
salar L.) fed different lipid sources along the whole growth per-
iod. Aquacult. Nutr., 13, 145–155.Tacon, A.G.J. & Metian, M. (2008) Global overview on the use of
fish meal and fish oil in industrially compounded aquafeeds:
trends and future prospects. Aquaculture, 285, 146–158.Thanuthong, T., Francis, D.S., Senadheera, S.D., Jones, P.L. &
Turchini, G.M. (2011) Fish oil replacement in rainbow trout
diets and total dietary PUFA content: I) Effects on feed effi-
ciency, fat deposition and the efficiency of a finishing strategy.
Aquaculture, 320, 82–90.Tocher, D.R., Fonseca-Madrigal, J., Dick, J.R., Ng, W., Bell, J.G.
& Campbell, P. (2004) Effects of water temperature and diets
containing palm oil on fatty acid desaturation and oxidation in
hepatocytes and intestinal enterocytes of rainbow trout
(Onchorhynchus mykiss). Comp. Biochem. Physiol. B Biochem.
Mol. Biol., 137, 49–63.Torstensen, B.E. & Tocher, D.R. (2010) The effects of fish oil
replacement on lipid metabolism of fish. In: Fish Oil Replace-
ment and Alternative Lipid Sources in Aquaculture Feeds
(Turchini, G.M., Ng, W.K. & Tocher, D.R. eds.), pp. 405–438.CRC Press, Taylor & Francis group, Boca Raton, FL.
Torstensen, B.E., Frbyland, L., Ornsrud, R. & Lie, Ø. (2004)
Tailoring of a cardioprotective muscle fatty acid composition of
Atlantic salmon (Salmo salar) fed vegetable oils. Food Chem.,
87, 567–580.Torstensen, B.E., Bell, J.G., Rosenlund, G., Henderson, R.J.,
Graff, I.E., Tocher, D.R., Lie, Ø. & Sargent, J.R. (2005) Tailor-
ing of Atlantic salmon (Salmo salar L.) flesh lipid composition
and sensory quality by replacing fish oil with a vegetable oil
blend. J. Agric. Food Chem., 53, 10166–10178.Trushenski, J.T. & Boesenberg, J. (2009) Influence of dietary fish
oil concentration and finishing duration on beneficial fatty acid
profile restoration in sunshine bass Morone chrysops ♀ x M.
saxatilis ♂. Aquaculture, 296, 277–283.Trushenski, J.T., Schwarz, M., Bergman, A., Rombenso, A. &
Delbos, B. (2012) DHA is essential, EPA appears largely
expendable, in meeting the n-3 long-chain polyunsaturated fatty
acid requirements of juvenile cobia Rachycentron canadum.
Aquaculture, 326, 81–89.Trushenski, J.T., Woitel, F., Schwarz, M. & Yamato, F. (2013)
Saturated fatty acids limit the effects of replacing fish oil with
soybean oil with or without phospholipid supplementation in
feeds for juvenile cobia. N. Am. J. Aquacult., 75, 316–328.Turchini, G.M., Torstensen, B.E. & Ng, W.K. (2009) Fish oil
replacement in finfish nutrition. Rev. Aquacult., 1, 10–57.Turchini, G.M., Hermon, K., Cleveland, B.J., Emery, J.A.,
Rankin, T. & Francis, D.S. (2013a) Seven fish oil substitutes
over a rainbow trout grow-out cycle: I) Effects on performance
and fatty acid metabolism. Aquacult. Nutr., 19, 82–94.Turchini, G.M., Hermon, K., Moretti, V.M., Caprino, F., Buset-
to, M.L., Bellagamba, F., Rankin, T. & Francis, D.S.
(2013b) Seven fish oil substitutes over a rainbow trout grow-
out cycle: II) Effects on final eating quality and a tentative
estimation of feed related production costs. Aquacult. Nutr.,
19, 95–109.Woitel, F.R., Trushensiki, J.T., Schwarz, M.H. & Jahncke, M.L.
(2014) More judichious use of fish oil in cobia feeds: I. Assessing
the relative merits of alternative lipids. N. Am. J. Aquacult., 76,
222–231.
. . . . . . . . . . . . . . . . . . . . . . . . . . . . . . . . . . . . . . . . . . . . . . . . . . . . . . . . . . . . . . . . . . . . . . . . . . . . . . . . . . . . . . . . . . . . . .
Aquaculture Nutrition, 22; 158–169 ª 2015 John Wiley & Sons Ltd