The effect of teacher followership styles on achievement of school vision and mission
26
Transcript of The effect of teacher followership styles on achievement of school vision and mission


researcher has chosen the International Islamic University Malaysia to conduct this study asthe researcher is a staff of the particular University.
Statement of the Problem
Education is the responsibility of every government in every country as to ensure that itspeople are well equipped with quality education. Federal government of Malaysia iscommitted.in providing the best quality education to the children in this country. In theprevious 9'n Malaysian Plan (2006-2010), it emphasized on how important education is as alifelong learning process. The establishment of the National Education Development Plan2001-2010 which is addressed in 9'h Malaysian Plan is to increase the equity and qualityeducation besides to improve the effectiveness of quality education management. Eventhough, the national development plan is up to year 2010, the Federal Govemment stillcontinues its eflort to increase the development of education in lOth Malaysian Plan (2011-2015). It shows that Malaysia government has allocated a huge amount of budget for theexpenditure of education and training development. In line with the national educationdevelopment plan after Malaysia independence, Malaysia government also has establishedthe national education system aiming at restructuring the society to ethics and values citizens.
Managing educational institutions in the global competitive is becoming crucial as moreuniversities and colleges have been established to offer education to the students. That iswhy, most of the educational institutions are pulling their effort to give best quality ofeducation to the students. Like any other organizations that use QMS to produce qualitystandard of its businesses' products or services, educational institutions also have the sameaims at their objective to produce better quality of education which focus on stakeholders astheir product and provide good services to their stakeholders.
Admission and Records Department (A&R) is one of a crucial Department in Centre forFoundation Studies (CFS) of International Islamic University Malaysia (IIIIM). Its majorfunction is to manage, select and evaluate applications for admission into the CFS whilemaintaining and updating students' personal files. Another function is to coordinates andconducts the examinations, including placement tests, processing the results and facilitatingappeals for the recheck of answer scripts and re-admissions.
Even though A&R Department has carried out all the activities for the students, however, theDepartment is still do not know whether the students are satisfied with its service quality ornot. In fact, there is not survey has been carried out to measure the students' satisfactionstoward the service quality management provided by the Department. Moreover, the A&RDepartment does not know the sfudents' needs or requirements because it has not beenseriously taking into consideration by the Department. Thus, the researcher has made aneffort to investigate the students' satisfactions toward service quality in A&R Department,CFS of International Islamic Universitv Malavsia.
Purpose of the study
The purpose of this study is to find out whether the students satisfied with the service qualitymanagement provided bythe A&R Department.
Research Objective
100

The research objectives are addressed as follows:
To examine whether all service qualities provided by the A&R Department met withthe five SERVQUAL dimensions i.e. tangibility, reliability, responsiveness,assurance and empathy
To examine the service quality gaps for five SERVQUAL dimensions i.e. tangibility,reliability, responsiveness, assurance and empathy
To propose the augmentation of improvement of service quality management for theA&R Department in order to provide better services to CFS students of IIUM
Significance of the Study
This study attempts to find out whether the students are satisfied with the service qualitymanagement provided by the A&R Department. It is also an opportunity to improve thequality of education for the teaching and learning process not only to Centre for FoundationStudies particularly but also to International Islamic University Malaysia as a whole.
Research Questions
The following research questions are used in this study:Does overall service quality of A&R meet the students' satisfactions?Are the students satisfied with the university's department service qualityaccording to the demographic respondentsIs there any significance difference with service quality according to thegender?
Delimitation of the Study
This research was focused on the students' satisfactions toward service quality in Centre forFoundation Studies at IIUM Petaling Jaya and Nilai Campus. The respondents that involvedin this study were students both Campuses.
Literature Review n
Importance of customers' satisfaction in businesses is as vital as air for human being. A11business seek long life customers, which is the fundamental essence of customer satisfaction(Ali, Aminul & Halim, 20lI). As mentioned earlier in the Chapter One, customers'satisfactions can be measured in service quality. The service quality in the institutions ofhigher learning become a need in the literature as many studies being reviewed providebenefit to the higher education to improve their achievement or performance in giving a bestservice quality to their customers. According to Ali, Aminul & Halim (2011), as studentswere considered to be the primary customers of a university (Hill, 1995), being the directrecipients of the service provided, student perceived service quality has turned out to be anextremely important issue for universities and their management.
Education in Malaysia
Malaysia's Vision 2020 is aimed in gaining the status of a fully developed counffy by year2020. The former Prime Minister. Tun Mahathir did mention about the definition of
101.

Malaysia as a fully develop country by is : "By the year 2020, Malaysia can be united nation,with a confident society, infused by strong moral and ethical values, living in a society that isdemocratic, liberal and tolerant, caring, economically just and equitable, progressive andprosperous and in full possession of an economy that is competitive and dynamic. This visionis reflected in the mission of the Ministry of Education, that is: "To develop a world classquality education system which will realize the full potential of the individual and fuIfilI theaspiration of the Malaysian nation."
Education has provided a solid platform for country's political as well as economic stabilitywith a view to establishing Malaysia as a regional center for academic excellence and turningeducation into a top quality export commodity. The Malaysian education system hasequipped its young people with a level of competence and skills which is hope that can putthem on par with the top students in some of the world's best universities.
The Malaysian Education System entered an important phase by creating the NationalPhilosophy of Education. The foundation for the development of the national educationsystem rests on the National Philosophy of Education, which states that:
"Education in Malaysia is an on-going effort towards further developing the potential ofindividuals in a holistic and integrated menner, so as to produce individuals who areintellectually, spiritually, emotionally and physically balanced and harmonious, based on a
firm belief in and devotion to God. Malaysia being a multi-religious country, spiritual,religious and moral characteristics of the individuals are highly emphasized and encouraged,which is clear from the national philosophy as well. Such an effort is designed to produceMalaysian citizens who are lcnowledgeable and competent, who possess high moralstandards, and who are responsible and capable of achieving high level of personal well-being as well as able to contribute to the harmony and betterment of the family, the societyand the nation at large".
With NEP, education in Malaysia possesses a sharper vision for the future (Sidek Baba, n.d.).The NPE is a base point for knowledge, teaching and learning from the early educationalprocess till the end of life. Education was given a central role in the development strategyformulated by the NEP because educational development affects the nation in many vitalaspects. It was regarded as a vehicle for modernization of society (Lafaye, 1997).
S tud en t s' S at i sfa c t ion s
Institution of higher learning should focus on all aspects of students' satisfaction whenoffering the service quality to the students. According to Banwet & DatLa (2003), servicesare delivered to people by people and the moments of truth can make or break a University'sreputation. In order to deliver total student satisfaction, the staff of the higher educationshould adhere to the principles of quality of customer service, whether they be front-linecontact staff involved in teaching or administration, or non-contact staff in management ofadministrative roles (Gold, 2001 ; Low, 2000, Banwet & Datta,2003).
to2

A survey done by the researcher, Sohail & Shaikh (2004) mentioned that 310 male studentsof Saudi Arabia attending the Fahd University of Petroleum and Minerals found that contactpersonnel was the most influencing factor in student's evaluation of service quality. Inadditioru the physical environment, layouto lighting, classrooms, appearance of building andground and the overall cleanliness also significantly contributed to the students' satisfactionstoward service quality provided in that University. Another survey done by Galloway (1989)as mentioned by the researchers Ali, Aminul and Halim (2011) in their research was toidentify the role of the faculty administration office in the United Kingdom University onstudent perception of service quality. The researcher found that it impacted directly onstudents and influenced their perceptions of service quality. The most important factor ofquality were found to be the office has a professional appearance, staff dresses smartly andare willing to help the students and also the operating hours are personally convenient.
Service Quality Measured in Higher Education
A survey of the services marketing literature reveals two main approaches to measure servicequality: SERVQUAL (Parasuraman et al., 1988) and SERVPERF (Cronin and Taylor, 1992).However, in this study, the researcher only user SERVQUAL to measure the students'satisfactions towards service quality in A&R Department. SERVQUAL is one of the mostpopular methods and has its theoretical foundations in the gaps model and defines servicequality in terms of the difference between customer expectations and performanceperceptions on a number of 22 items.
Customer expectations are "beliefs about service delivery that serve as standards or referencepoints against which performance is judged", whereas customer perceptions are "subjectiveassessments of actual services experiments" through interaction with the providers (Zeithamlet al,2006, p. 49).These authors identify some factors that can influence expectations, asword of mouth communications, personal needso past experience of the service and externalcommunications from the service provider.
The SERVQUAL scale conceptualizes service quality as containing five dimensronsmeasured through the 22 items under five headings, namely tangibles, reliability,responsiveness, assurance and empathy. In the context of Higher Education, thesedimensions include the appearance of the univelsity's physical facilities, equipment,personnel, and communication materials (tangibles), the ability of the universityto performthe promised service dependably and accurately (reliability), the willingness of the universityto help students and provide prompt service (responsiveness), the knowledge and courtesy ofteachers and their ability to convey trust and confidence (assurance) and the caring,individualized attention the university provides its students with (empathy).
The SERVQUAI instrument, "despite criticisms by a variety of authors, still seems to be themost practical model for the measurement of service quality available in the literature" andthus expectations should be considered when assessing service quality in Higher Education(Cuthbert, 1996b, p. 34). Regarding the stability of expectations and perceptions of servicequality over time, in the scope of Higher Education, it was empirically concluded thatstudent's perceptions of service experienced proved less stable over time than expectations(Hill, 1995). There are a lot of empirical applications of the SERVQUAL paradigm tomeasure service quality in Higher Education (Hill, 1995; Anderson, 1995; Sohail and Shaikh,2004; O'Neil and Wright, 2002; Sahney et al., 2004; Kettinger and Lee, 1995; Finn and
L03

Lamb, l99I; Lam & Woo, 1997; Jabnoun and Khalifa, 2005). Therefore, a theoreticalframework was developed based on the SERVQUAL which has been shown in Figure 1.
Tangibi l i ty
Rel iabi l i ty
Customers'Sati sfacti ons
Service Quality
Figure 1 : Theoretical Framework
Research Methodology
Research methodology is the method, means or approach to be used in order to achieve theobjectives of the research. A research method is also said to be a technique for collectinginformation or data mentioned by Buchanan and Huczlnski (1997).
This chapter explains about the procedure of conducting research. It also explains theresearch frameworlg research design, ethical considerations, instrument, data collectionmethods, analyze the data and document the result.
Research Framework
Based on the figure 2, it describes about the research framework of students' satisfactions.The researcher will categorize the framework into two categories i.e. literature review andtheoretical study. ln the theoretical study, some literature reviews on service quality andstudents' satisfactions will be reviewed in the institution of higher education based on sourcesfrom journals, research papers, bulletin, case studies, internet and theses. In the theoreticalstudy, the researcher will formulate the questions to be distributed to the communities ofCentre for foundation Studies of International Islamic University Malaysia for both campusesi.e. Petaling Jaya Campus and Nilai Campus. The questionnaires then will be gathered andarnlyzed to get the result and some and some recommendations were made to improvequality of service of Admission and Records Department.
LO4

Students' Satisfactions toward Service Quality in Admission and Records Department,Centre for Foundation Studies, Intemational Islamic University Malaysia
r Formulation-Identify problem statement-Devel op theoretical framework-Formulate Questionnaires
. Data Collection-Conduct survey students
r Analysis-Statistical analysis based on thesurvey done
. Report Documentation-Findings based on analysisdone-Recommendation for furtherResearch
Literature Review
Figure 2 : Research FrameworkResearch Design
Research design is created by the researcher by the method and it is responsive to the contextand the participants (Richards & Morse, 2007). Aecording to Grajiano and Raulin (2000),"Research design is supposed to ensure that the study is relevant to the problem and make useof economical procedures. There are three broad tlpe of research design used: experimentcase study, survey structured questionnaires and document collection. This approach enablesthe researcher to test a form ofcontrol over the independent variable at the analysis stage assuch both qualitative and quantitative".
The research design that has been used in this study is a survey research design anddescriptive research. Survey research is a popular survey design in education. According toCreswell (2008), survey research designs are procedures in quantitative research in whichinvestigators administer a survey to a sample or to the entire population of people in order todescribe attitudes, opinions, behaviours or characteristics of the population. In this procedure,survey researcher will collect quantitative numbered data using questionnaires andstatistically arnlyzed the data to describe trends about responses to questions and to testresearch questions.
105
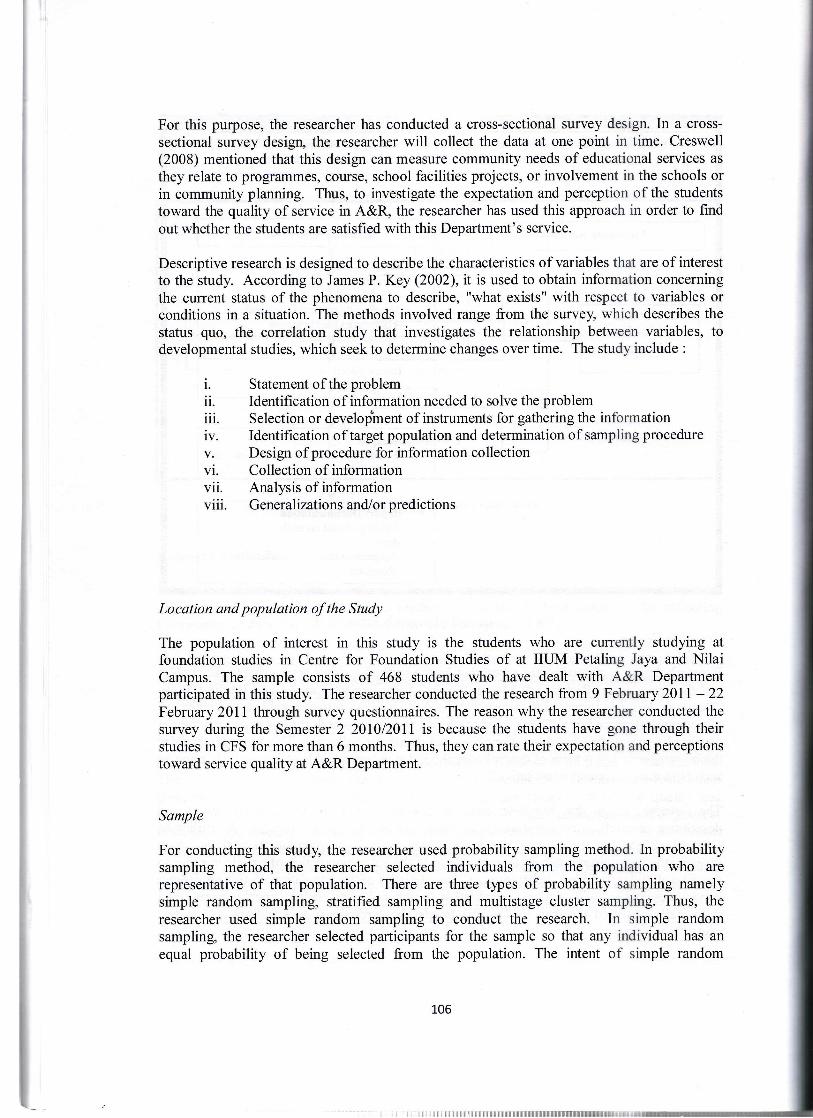
For this purpose, the researcher has conducted a cross-sectional survey design. In a cross-sectional survey design, the researcher will collect the data at one point in time. Creswell(2008) mentioned that this design can measure community needs of educational services asthey relate to programmes, course, school facilities projects, or involvement in the schools orin community planning. Thus, to investigate the expectation and perception of the studentstoward the quality of service in A&R, the researcher has used this approach in order to findout whether the students are satisfied with this Department's service.
Descriptive research is designed to describe the characteristics of variables that are of interestto the study. According to James P. Key (2002), it is used to obtain information concerningthe current status of the phenomena to describe, "what exists" with respect to variables orconditions in a situation. The methods involved range from the survey, which describes thestatus quo, the correlation study that investigates the relationship between variables, todevelopmental studies, which seek to determine changes over time. The study include :
Statement of the problemIdentification of information needed to solve the problemSelection or develop-miment of iinstruments for gathering the informationIdentification of target population and determination of sampling procedure
v. Design of procedure for information collectionvi. Collection of informationvii. Analysis of informationviii. Generalizations and/orpredictions
Location and population of the Srudy
The population of interest in this study is the students who are currently studying atfoundation studies in Centre for Foundation Studies of at IIUM Petaling Jaya and NilaiCampus. The sample consists of 468 students who have dealt with A&R Deparhnentparticipated in this study. The researcher conducted the research from 9 February 2011 - 22February 2011 through survey questionnaires. The reason why the researcher conducted thesurvey during the Semester 2 201012011 is because the students have gone through theirstudies in CFS for more than 6 months. Thus, they canrate their expectation and perceptionstoward service quality at A&R Department.
Sample
For conducting this study, the researcher used probability sampling method. In probabilitysampling method, the researcher selected individuals from the population who aterepresentative of that population. There are three types of probability sampling namelysimple random sampling, stratified sampling and multistage cluster sampling. Thus, theresearcher used simple random sampling to conduct the research. In simple randomsampling, the researcher selected participants for the sample so that any individual has anequal probability of being selected from the population. The intent of simple random
106

sampling is to choose individuals to be sampled that will be representative of the population(Creswell, 2005).
The larger the sample, the less the potential error that the sample will be different from thepopulation. Therefore, the researcher has used the sampling error to make a differencebetween the sample estimate and the true population score. The population of the students atCFS consists of 5462 students which comprise 16 Academic Departments. The margin oferror that can be accepted for this study would be *5% while the level of confidence thatwould be needed is 95o/o. Since the population size for this study is 5462, therefore thesample size used for this study is 425 respondents.
Data Collection Method
The instrument for this research was based on questionnaires. The questionnaires designedare based on SERVQUAL instrument. SERVQUAL was developed by Parasuraman tomeasure the service quality which includes five dimensions namely tangibility, reliability,responsiveness, assurance and empathy. Many researchers used this SERVQUAL scale toselect the items against which to assess customers' satisfactions. (Arena, Amaboldi &Azzone, 2010). The questionnaires contain three sections. The first section is about therespondents' demographic details such as gender, age, programme of study, level of studyand citizenship. In the second section, the survey deals with the students' expectation onA&R Department offering the services to the students of CFS. In the third section, the surveydeals with students' perceptions which relate to the students' feelings about A&R Departmentand their experiences in dealing with this Departrnent.
In this section II and section III, the researcher used Likert-t1pe for all items in the construct.which means each item has seven possible responses ranging from Strongly Disa-uree toStrongly Agree. The response that indicates lowest, receive a score of 1 (Strongly Disa,eree)whereas the response that indicates highest receive a score of 7 (Strongly Agree).
Below is the breakdown of the question sets and the number of questions for each set:
Table 3.1 Dimensions of SERVQUAL and number of Items
Dimensions Definition of dimensions Number of ItemsTangibility
Reliability
Responsiveness
The ability to perform the promisedservide dependable and accurately
The knowledge and courtesy ofemployees and their ability to conveytrust and confidence
The appearance of physical facilities,equipment, personnel andcommunication materials
The provision of caring, individualizedattention to customers
Assurance
to7

Empathy o The willingness to help customers and toprovide prompt service
Source : Adapted from Buttle (1996)
Data Analysis Method
For the purpose of this research, the data collected through survey questionnaire have beenanalyzed using the quantitative method. Since the research uses quantitative analysis, scalesof measurement of the data were formed. The researcher has used the Likert Scale in herquestionnaires. Likert Scale is a type of psychometric response scale used in thequestionnaires. (Wikipedia,2007). Likert Scale was developed by Rensis Likert (1932) whopublished a report describing its use in his book entitled "A Technique for the Measurementof Attitudes". The applied scales would be as follows :
strongly disagreedisagreedisa'greenot sureagteeaglee
7 : strongly disagreeFor the purpose of this research, the data that have been collected will be analyzed using theStatistical Package for the Social Sciences (SPSS). SPSS is a comprehensive and flexiblestatistical analysis and data management system (Samuel, 2006). SPSS can take data fromalmost any tlpe of file and use them to generate tabulated reports, charts, and plots ofdistributions and trends, descriptive statistics, and conduct complex statistical analyses.SPSS is the popular and widely available software package for preparing and executing,computerized data analysis.
Accordingto Green & Salkind (2005), SPSS is designed especiallyforthe analysis of socialscience data and contains most of the routines social scientists employ. In particular, socialscientists value the programme's capacity to handle with ease the recurring needs of dataanalysis. For instance, SPSS enables the researcher to recode variables : to deal with missingvalues; to sample, weigh and select cases; and to compute new variables and effectpermanent or temporary transformation.
Using SPSS saves a lot of time, create good and impressive report containing charts andanalysis using the variable from data editor. First, all data will be put in the data editor, e.g.gender, then male or female will be assigned at the variable view, then the researcher can useany tlpe of analysis, from bar chart to pie charts to get the percentage of each questions. Thisis how many researchers have used SPSS in general (Green & Salkind, 2005)
A one-way MANOVA analysis has been carried out in the study to investigate the genderdifferences toward the Dependent Variables i.e. tangibility, reliability, responsiveness,assurance and empathy. Multivariate Analysis of variance (MANOVA) is an extension ofanalysis of variance for use when there are more than one dependent variables. MANOVAcompares the groups and tell whether the mean differences between the groups on thecombination of dependent variables are likelyto have occurred by chance (Pallant, 2007).
l :. | -L_
3-A_T_
5-6-
108

E th ical Con siderations
Participants in this study were assured of anonymity, privacy and that the results would notaffect their courses, grades and position. They were also guaranteed that the results would notbe used for other pulposes other than this study.
tr/alidity and Reliability of the Instrument
The information or the data from the questionnaires should have the validity and reliability sothat the analysis of the data and the result analysis could be obtained accurately. All theinformation obtained from the websites i.e. the journals and article should be accurate.Moreover, the researcher obtained the clarification about the information on students'satisfaction or perception sources from academician and practitioners in other institutions ofpublic higher learning in Malaysia. The validity focused on internal and external.
The researcher used the original version of SERVQUAL without any amendments. Anotherresearch has been conducted using the same instrument in IIUM Gombak Campus to measurethe customers' satisfactions toward the service quality by two academicians of Institute ofEducation. Therefore, the researcher also used the same instrument to examine the students'satisfactions at IIUM Petaling Jaya and Nilai Campus. Moreover, several studies have beenconducted by other researchers using the same instrument and the evidence provides generalsupport for the validity and reliability of the insffument (Kettinger and Lee, 1995; Finn andLamb, 1991;Lam & Woo, 1997;Jabnoun and Khalifa, 2005).
Research Findings
This chapter will discuss the findings of the study. The findings presented in this stud)'arebased on the information gathered through survey questionnaires. 468 students participatedin this survey and all data were recorded so that the researcher would be able to revies. andmake analysis for the findings. The descriptive analysis will be discussed at the beginning ofthis chapter and followed by statistical analysis on each part of the survey questionnaire.
Reliability Test
Reliability comes to the forefront when variables developed from summated scales are usedas predictor components in objective models. Since summated scales are an assembly ofinterrelated items designed to measure underlying constructs, it is very important to knowwhether the same set of items would elicit the same responses if the same questions are recastand re-administered to the same respondents. Variables derived from test instruments aredeclared to be reliable only when they provide stable and reliable responses over a repeatedadministration of the test. Reliability refers to the extent to which the constructs are free fromerror and yield consistent results (Santos, 1999).
Cronbach's alpha is an index of reliability associated with the variation accounted for by thetrue score of the "underlying construct." Construct is the hlpothetical variable that is beingmeasured (Hatcher, 1994). The ALPHA option in SPSS provides an effective tool formeasuring Cronbach's alpha, which is a numerical coefficient of reliability. Computation ofalpha is based on the reliability of a test relative to other tests with same number of items, andmeasuring the same consffuct of interest (Hatcher, 1994). Cronbach's alpha measures howwell a set of items (or variables) measures a single one-dimensional latent construct.
109

Alpha coefficient ranges in value from 0 to 1 and may be used to describe the reliability offactors extracted from dichotomous (that is, questions with two possible answers) and/ormulti-point formatted questionnaires or scales (i.e., rating scale: I :poor, 5 : excellent). Thehigher the score, the morereliable the generated scale is. Nunnally (l-978)has indicated 0.7 tobe an acceptable reliability coeffrcient but lower thresholds are sometimes used in theliterature.
In this study, before the result can be analyzed, the reliability of the survey questionnairemust be tested. The researcher used a Cronbach's alpha coefficient to test reliability. TheCronbach's alpha (see Table 4.1) for each of the factori after the questionnaires was collectedand it was much higher than the alpha threshold level of 0.7 (Nunnally, l97g). Table 4.1summarizes the result on Quality Service Expectation Statistics.
Table 4.1: SERVQUAL : Service Expecration Statisrics
Dimensions No of ltems . Mean SD Cronbach AlnhaTangibility I 5.0899 1.3618
2 5.143s 1.23734 5.3833 1.28084 5.2719 1.3155
(20.864) s.2r6Reliability 5
6789
5.24155.27 145.220r5.29705.2051
r.4660r.43t21.3839r.40341,.2860
(26.23s) s.247l01ll2l3
5.320s5.3r4r5.39965.2201
r.34681.309s1.3525r.4415
(2r.2s4) s.3r4T4l5t6l7
s.36775.38925.38285.4409
1.3913r.26161.49131.2921
(21.s806) s.39sl8t9202I22
5.25915.31915.25055.22485.3276
1.3535r.33741.35821.48771.4582
(26.38r) s.276
110

From the table 4.1, Cronbach's alpha scores are between 0.8978 and 0.9281. This shows thatthe instrument for measuring all five dimensions has a strong reliability. Table 4.2summarizes the result on Quality Service Perception Statistics.
From the table 4.1, Cronbach's alpha scores are between0.7945 and0.9254. This shows thatthe instrument for measuring all five dimensions has a strong reliability.
Demographic Details
Dimensions No of Items Mean SD Cronbach AlphaTangibility I
244
4.77304.70244.9t434.8030
(r9.r93) 4.798
3.073s1.15501.1906r.2753
0.794s
Reliability 56789
4.820s4.81624.86114.87394.7286
1.27481.3588r.2874r.2870r.2945
0.9254
(24.100) r.692Responsiveness 10
l1t213
4.83734.86084.96794.8287
(re. es) 4.874
1.25811.2395t.28591.2467
0.9139
Assurance I415t6t7
4.8223 ,5.04284.94865.0321
(re.846) 4.e62
IIII
2688309525742691
0.9121
Empathy 18t9202l22
4.94434.93364.75594.67454.8180
(24.126)4.82s
3.07931.38271.35551.3901r.3676
0.8636
ttt

Table 4.3 tabulates the respondent's profile i.e. gender, age, tlpe of programme, Department,level of study and citizenship. Summarily, there are 568 respondents who responded to thissurvey in which Il3 (24.2%) were male and 355 (75.9%) were female. It shows that thepercentage of the population was contributed by female. The data also showed that the ArtsProgrammes represented 58.5% of the survey compared to Sciences Programme (41.5%).99.4% of the respondents were Malaysian whereas only 0.6% were Non-Malaysia. Basicallythe foundation programmes is a programme for Malaysian only. However a few foreignstudents were sent bythe IIUM Gombak campus to complete their English programme beforethey can proceed to study at Gombak campus. In general, the demographic background ofthe study was considered fairly well represented.
Table 4.3: Summary of respondent's demographic details
Variables Category Frequency Percent0\)
Gender MaleFemale
113355
24.r75.9
Age 18l9202l22
5l260139T62
10.955.629.73.40.4
Type of Programme SciencesArts
194274
4r.558.s
Department AEDBIOSCALLHSPHSCPMACYICTBARBENIRKHSECONSLAWSENGINNUSMEDICDENTI
173625232815324574484629231098
3.67.75.34.96.03.26.89.615.810.39.86.24.92.r1.91.7
Level ofStudy 1" Years2nd YearOthers
301 64.334.80.9
r634
Citizenship MalaysiaNon-Malaysia
4653
99.40.6
112

.IUNOVA Analysis
A one-way between-groups multivariate analysis of variance was performed to investigategender differences between male and female. Four dependent variables were used :tangibility, reliability, responsiveness, assurance and empathy. The independent variable wasgender. Preliminary assumption testing was conducted to check for normality, linearity,univariate and multivariate outliners, homogeneity of variance-covariance matrices, andmulticollinearity. However, the researcher found out that there is a slightly violatedassumption on box's test of equality of covariance matrices. Nevertheless, the analysis iscarried out as other assumption testing conducted were no serious violations noted. It meansthat the analysis is acceptable. There was a statistically significant difference between malesand females on the combined dependent variables, F(5,460): 1.86, p:.099; Wilks' Lambda= .98; partial eta squared : .02 An inspection of the mean score indicated that male reportedslightly that male reported slightly higher level of reliability (M :24.47, SD: 5.80) thanfemale (M:23.94, SD:5.66). However, female reported slightly higher level of empathy(M:24.24, SD:6.74) than male (M:23.66, SD:6.39).
Gaps Score of Service fuality
One of the research objectives of this study is to determine the service quality gap score forfive SERVQUAL dimensions i.e. tangibility, reliability, responsiveness, assurance andempathy in A&R Department. Table 4.3 below exhibits the five dimensions of SERVQUALgap score of service quality. The result shows that the total Mean of gap score for servicequality for five dimensions is -7.8224 and the average of the total mean is -1.564. It showsthat the students were not satisfied with the service quality provided by the A&R Department.The result also shows that there are still huge rooms for service quality improvement to A&RDepartment.
Table 4.3 : Gap score of service quality I
Conclusion
Education is a lifelong learning process and it is a never ending process of life. It is a processof teaching, training and learning in order to improve knowledge and develop skills. Qualitycan be understood as something that can be improved to the organization whether for itsproducts or services. ln education, quality is the skill of creating the mechanisms to fulfill thecustomers' satisfactions by implementing the quality management systems based on ISO
Dimensions Mean- 1.6910-2.r3460.0000-t.7478-2.249
SD5.326.290.004.726.68
TangibilityReliabilityResponsivenessAssuranceEm
113

9000. Quality management system in education has been implemented in the educationalinstitutions as to provide the best service quality of education which focus on customers astheir product and provide good services to them. ISO 9000 in education has been discussedas could be the quality standard to irnprove whatever procedures that have been carried out tothe organizational through continual improvement besides of improving the decision makingprocess.
The importance of service quality has become a need to the institutions of higher education asit can determine the level of customers' satisfactions toward its service quality. Thus, theresearcher has made an effort to study on the customer's satisfactions toward service qualityin Admission & Records Department and from the study, a few recommendations orproposals have been made in order to improve the service quality or quality managementsystem of A&R Deparlment.
In chapter one, the researcher has listed out the objective of this study in which to investigatethe students' satisfactions toward service quality in A&R Deparhnent. It is also stated in theobjective of this study in which to identify score gap of service quality between theexpectation and perception of 'service quality which comprises of five dimensions i.e.tangibility, reliability, responsiveness, assurance and empathy. The study was focused at theCentre for Foundation Studies of III-IM at Petaling Jaya and Nilai Campus. ln chapter two,the researcher has explained about the service quality, quality management system and ISO9000 which are relevant of measuring the service quality in the literature review. Theresearcher also has discussed the studies on customers' satisfactions done by otherresearchers in order to support this study. In Chapter three, the researcher has explained aboutthe methodology that has been used for this study. To conduct the study, the researcherdistributed the survey questionnaires based on the SERVQUAL instrument which is relatedto the research questions.
The findings of the study have shown that the study managed to fulfill the research objectiveswhere the study confrmed the evidence of customized SERVQUAL instrument use in thisstudy. The Cronbach's Alpha test indicated high reliability. The findings also show thenegative SERVQUAL gaps scores of service quality which indicates poor service quality asperceived by the students at both Campuses. Therefore, the A&R Department should face thechallenge and provide the mechanism on how to ensure the customers' satisfactions in future.Even though majority of the students did not satisfied with the service quality provided by theA&R Department, however if we examine on the gender's perception towards servicequality, there is significance different between male and female on service quality providedby A&R Department. It is reported that male students believe the ability of A&R Departmentto perform the promised service consistently and accurately (reliability) compared to femalestudents. Nevertheless, female students slightly believe that A&R Department can giveindividual attention and understand the students' needs (empathy) compared to male students.
Thus, ffom the findings, the researcher believes that the A&R Department could augment itsservice quality even though the result of the findings show that the majority of the studentsdid not satisfied with the service quality. Several mechanisms can be made in order toimprove its services. A&R should send its staff undergo for internal or external training eitheron academic affairs or administrative matters. This is essential to upgrade their knowledgeand skills and could improve their ability to perform their duties at workplace. Moreover, thefacilities or systems provided by A&R Department such as Examination Menu System andAdmission Menu System should be upgraded in which could give ability to its staff to
11.4

perform promptly in entertaining the students' need such as providing the accurateinformation data to the students.
In addition, it is recommended to the staff of A&R to attend shortly to the students and alsogive a prompt feedback to them. Most of the students rated in the survey that they did notsatisfied with the staff who did not attend or give feedback to them promptly. Therefore, it isessential for staff to entertain the students shortly and be able to solve the students' problemsregarding their academic matters when dealing with staff of A&R Department.
Recommendation for further research
Based on the literature and the results of this studv. the followins are recommended forfurther research in this area.
The number of respondents in this study should be increased in order to havethe better result of knowing the perceptions of IIUM community about level ofsatisfaction toward service quality. . The sample should be extended to thewhole of IIUM community which could get the feedback from differentKulliyyahs and Administration Offices of IIUM and not only to A&RDepartment and Centre for Foundation Studies.
The study should be focused to all levels of IIUM community, not only to thestudents but also to academic and administrative staff in order to identify theperception of service quality provided in IIUM for the process of teaching andlearning.
The researcher could extend the study by using other method such asconducting the qualitative approach involving the individual, focus group andalso do the observation to a group of members who are using the serviceoffered by Kulliyyahs.
The study on perceptions of serviie quality should be extended betweenacademic offices and administrative offices so that comparison can be made toidentify which offices provide a good service quality in terms of level ofcustomers' satisfactions.
The study on perceptions of service quality should be extended to the publicand private institutions in Malaysia so that the researcher could makecomparison between those universities.
The study uses other insffument than SERVQUAL insffument. The currentstudy shows that the student might do not understand how to rate thequestionnaires because the questionnaires were divided into two sections i.e.expectation and perception. There were some respondents who rated low orequal on expectation whereas the expectation section is supposed to be rated inhigh score. Therefore, it is recommended to use the easier instrument so that
1r5

the respondents are easy to understand and be able answer the surveyquestionnaires.
The result of the study can be analyzed using two-way MANOVA. In thecurrent study, only one-way MANOVA is carried out. By using the two-wayMANOVA, the researcher can identify the relationship or interaction betweentwo lndependent Variables toward Dependant Variables.
BIBLIOGRAPIIY
Ali, Aminul & Halim (2011). Service satisfaction: The case of a higher learning institution inMalaysia. International Education Studies. 4(l), 182-192.
Anderson, E. (1995). High tech v. high touch: A case study of TQM implementation inhigher education. Managing Service Quality. 5(2),48-56.
Arena, M., Arnaboldi, M., & Azzone, G. (2010). Student perceptions and centraladministrative services: the case of higher education in ltaly. Studies in HigherEducation. 35(5), 941-959.
Banwet, D.K. & Datta, B. (2003). A study of the effect of perceived lecture quality onpost-lecture intentions. Work Sndy. 52(5).
Buchanan, D., & Huczynski, A. (1997). Organizational behavior: An introductory text.3'd.edition. London: Prentice-Hall. Pp. 276-280.
Buttle, F. (1996). SERVQUAL: Review, critique, research agenda. Europmn Journal ofMarketing. 30(1 ), 8-32.
Creswell, J.W. (2008). Educational research: Planning, conducfing, and evaluatingquantitative and qualitative researcft. 3'o Edition. New Jersey: Pearson Prentice Hall.
Finn, D.W. & Lamb, C.W. (1991). An evaluation of the SERVQUAL scale in retail setting inSolomon, R.H. (Ed). Advances in Consumer Research. Association of ConsumerResearch, Provo. UT. 18.
Gol4 E. (2001). Customer service: A key unifyingforcefor today's campus. Cited in Banwet,D.K. & Datta, B. (2003). A study of the effect of perceived lecture quality onpost-lecture intentions. Work Study. 52(5).
Green, S.8., & Salkind, N.J. (2005). Using SPSS for windows and macintosh: Analyzing andunderstandingdata. 4'n Edition. New Jersey: Pearson Prentice Hall.
Gueorguiev, T. (2006). Quality management in higher education.Education 2006. Retrieved January 18"http ://qedu.ru.acad.bg/2006/bg/accpapers/gu eorgu iev.pdf
Quality of Higher2010 from
116

Hill, F.M. (1995). Managing service quality in higher education: the role of the student asprimary consumer. fuality Assltrance in Education. ll(l).
Jabnoun, N. & Khalifa, A. (2005). A customized measure of service quality in the UAE.Managing Service Quality. I5(4), 37 4-388.
Juran, J.M. & Gryna, F.M. (1988). Juran's quality control handbook. New Youk: McGrawhill
Key, J..P. (2002). Research design in occupational education, Oklahoma State University.Retrieved February a 20r0 fromhttp ://www. okstate. edr.r/ agl agedcm4h/academic I aged59 80 a
Kettinger, W.J., Lee, C.C & Lee, S. (1995). Global measures of information service quality: across national study. D ec is io n S ci en c e s. 26(5), 5 69- 5 8 8.
Lafaye (1997). The role of educational policy in overcoming ethnic divisions and buildingMalaysia's nation. Oxford International Conference, 11-15 September 1997.
Lam, S.S.K. & Woo, K.S. (1997). Measuring service quality: a test-retest reliabilityinvestigation of SERVQUAL. Journal of the Market Research Society. 39(22),381-396.
Likert, R. (1932). A technique for the measurement of attitudes.
Low, L. (2000). Are college students satisfied? Cited in Banwet, D.K. & Datta, B. (2003). Astudy of the effect of perceived lecture quality onpost-lecture intentions. ll'ork Study.s2(s\.
\{ichalska-Cwiek, J. (2009). The quality management system in education - implementationand certification. Journal of Achievements in Materials and ManufacturingEngineering, 37 (2), 7 43-7 50 .
\ajib, Rahim, Johari & Ali. (2011). Integrated curriculum concepts in Malaysia : Knowledgeand application differentiation. European Jodrnal of Social Sciences.l9(2).
\unnally ( 1 98 8). P sycho metric th eory. NY:McGraw-Hill.
\euman, W.L. (2009). Understanding researcl2. Boston : Pearson Education, Inc.
O'\eil. M. & Wright, C. (2002). Service quality evaluation in the higher education sector, anempirical investigation of student perceptions. Higher Education Research andDevelopment. 2l (1), 23 -40.
tlniiordkers.
Pallant.
Advanced Leamers Dictionary. (2005). 7'n Edition. Oxford : Oxford University
J. (2007). SPSS survival manual: A step by step guide to data analysis using SPSS forv'indows.3'o Edition. New York: McGraw Hill.
L17

Santos. J.R.A., (1999). Cronbach's alpha: A tool for assessing the reliability of scales. Journalof Extension.37(2).
Sidek Baba(n.d). The integrated approach in Malaysian Education; The International IslamicUniversity Malaysia as a model.
Sohail, M.S. & ShaiklU N.M. (2004). Quest for excellence in business education: a study ofstudent impressions of service quality. The International Journal of EducationalManagement. l8(l).
Vlasic, S., Vale, S., & Puhar, D.K., (2009). Quality management in education.Interdisciplinary Management Research, 5, 5 65 -57 3.
Wikipedia, the free encyclopedia. (2011). Refrieved January 24, 2010 fromhtp : //en. wikipedia. org/wiki/Likert_scale

ISBN t7A-36?-qIA-01e-h
il[ilrutililltlill|lJtl