the effect of make a match technique on students' reading ...
257
THE EFFECT OF MAKE A MATCH TECHNIQUE ON STUDENTS’ READING COMPREHENSION AT XI GRADE OF MAN 1 PADANGSIDIMPUAN A THESIS Submitted to the State Institute for Islamic Studies Padangsidimpuan as a Partial Fulfillment of the Requirement for the Graduate Degree of Education (S.Pd) in English Written by: ANNISA NUR HABIBIE A.R. HARAHAP Reg. Number. 13 340 0006 ENGLISH EDUCATION DEPARTMENT TARBIYAH AND TEACHER TRAINING FACULTY STATE INSTITUTE FOR ISLAMIC STUDIES PADANGSIDIMPUAN 2017
-
Upload
khangminh22 -
Category
Documents
-
view
3 -
download
0
Transcript of the effect of make a match technique on students' reading ...

THE EFFECT OF MAKE A MATCH TECHNIQUE
ON STUDENTS’ READING COMPREHENSION
AT XI GRADE OF MAN 1 PADANGSIDIMPUAN
A THESIS
Submitted to the State Institute for Islamic Studies Padangsidimpuan as
a Partial Fulfillment of the Requirement for the Graduate Degree of
Education (S.Pd) in English
Written by:
ANNISA NUR HABIBIE A.R. HARAHAP Reg. Number. 13 340 0006
ENGLISH EDUCATION DEPARTMENT
TARBIYAH AND TEACHER TRAINING FACULTY
STATE INSTITUTE FOR ISLAMIC STUDIES
PADANGSIDIMPUAN
2017


viii
Name : Annisa Nur Habibie A.R. Harahap
Reg. Number : 13 340 0006
Faculty : Tarbiyah and Teacher Training
Department : English Education (TBI-1)
Title of Thesis : The Effect of Make a Match Technique on Students’ Reading
Comprehension at XI Grade of MAN 1 Padangsidimpuan
ABSTRACT
This research focused on the effect of Make a Match technique on students’
reading comprehension at XI grade of MAN 1 Padangsidimpuan. The students’ problems in
reading comprehension were: 1) Most of the students still get low grade with averages was
60. 2) Most of students did not understand the text that the students read. They just read the
text without comprehending the text. 3) Most of students easy to feel bored when they
learnt about the English text. Beside the students’ problem, teacher’s technique also became
a problem in learning English. The teacher still used the conventional teaching and did not
have variation in teaching reading. The purpose of this research was to know whether there
is the significant effect of Make a Match technique on students’ reading comprehension at
XI grade of MAN 1 Padangsidimpuan.
The method used in this research was experimental research. Two classes were
chosen randomly as the sample. They were XI MIA 3 as experimental class that consisted
of 40 students and XI MIA 4 as control class that consisted of 40 students. It was taken
after conducting normality and homogeneity test. The data was derived from pre-test and
post-test. To analyze the data, the researcher used t-test formula.
After analyzing the data, the researcher found that mean score of experimental
class after using Make a Match technique was higher than control class. Mean score of
experimental class before using Make a Match technique was 64.13 and mean score after
using Make a Match technique was 75.23 and it had gain 11.10. The effect of Make a
Match technique on students’ reading comprehension was 3.009 with tcount was higher than
ttable (3.009 > 2.000). It meant that Ha was accepted and H0 was rejected. It was concluded
that there was a significant effect of Make a Match technique on students’ reading
comprehension at XI grade of MAN 1 Padangsidimpuan.
Key Words: Make a Match Technique, Reading Comprehension

ACKNOWLEDGEMENT
Praised be to Allah swt., the most Creator and Merciful who has given me both
pain to teach me about patience and pleasure to lead her to thank Him. He also has given
love, health, time, knowledge, strength, and supporters to me to finish the thesis entitled
“The Effect of Make a Match Technique on Students’ Reading Comprehension at XI
Grade of MAN 1 Padangsidimpuan”. Besides, Shalawat and Salam be upon to the
prophet Muhammad saw., that has brought the human from the darkness era into the
lightness era.
It is a pleasure to acknowledgement the help and contribution to all of lecturers,
institution, family, and friends who have contributed in different ways, hence this thesis
is processed until it becomes a complete writing. Therefore, in this chance I would like to
express the deepest gratitude to the following people:
1. Dr. Fitriadi Lubis, M.Pd., as the first advisor and Sojuangon Rambe, S.S., M.Pd., as
the second advisor that had guided, supported, advised, suggested, and helped me in
different ways with great patience to finish this thesis as well.
2. The Rector of IAIN Padangsidimpuan, Prof. Dr. H. Ibrahim Siregar, MCL., who has
given chance and time. Therefore, I could learn and got some knowledge from IAIN
Padangsidimpuan.
3. Hj. Zulhimma, S.Ag., M.Pd., as the Dean of Tarbiyah and Teacher Training Faculty.
4. Rayendriani Fahmei Lubis, M.Ag., as the Chief of English Education Department
who always support me and also all of her students in finishing the thesis.
ix


TABLE OF CONTENTS
Page
INSIDE TITLE PAGE ......................................................................................... i
LEGALIZATION ADVISORS SHEET ............................................................ ii
AGREEMENT ADVISORS SHEET ................................................................. iii
DECLARATION OF SELF THESIS COMPLETION .................................... iv
AGREEMENT PUBLICATION OF FINAL TASK FOR
ACADEMIC CIVITY ........................................................................................... v
SCHOLAR MUNAQOSYAH EXAMINATION .............................................. vi
LEGALIZATION OF DEAN OF TARBIYAH AND TEACHER
TRAINING FACULTY ....................................................................................... vii
ABSTRACT ........................................................................................................... viii
ACKNOWLEDGEMENT ................................................................................... ix
TABLE OF CONTENTS ..................................................................................... xi
LIST OF TABLES ............................................................................................... xiii
LIST OF FIGURES ............................................................................................. xiv
LIST OF APPENDIXES ..................................................................................... xv
CHAPTER I INTRODUCTION
A. The Background of the Problem ........................................... 1
B. The Identification of the Problem .......................................... 5
C. The Limitation of the Problem ............................................... 6
D. The Formulation of the Problem .............................................. 7
E. The Purpose of the Research .................................................. 7
F. The Significances of the Research ......................................... 8
G. The Outline of the Thesis ....................................................... 8
CHAPTER II LITERATURE REVIEW
A. Theoretical Description ........................................................... 10
1. Reading Comprehension .. .............................................. . 10
a. Definition of Reading Comprehension .................... . 10
b. The Aims of Reading Comprehension ..................... 11
c. The Principle of Teaching Reading Comprehension.. 12
d. The Process of Reading Comprehension ................... 14
e. The Levels of Comprehension ................................. . 15
f. Assessment of Reading Comprehension .................. 17
g. Materials of Reading Comprehension ...................... 19

2. Make a Match Technique ................................................ 22
a. Definition of Make a Match Technique ................... 22
b. The Purpose of Make a Match Technique ............... 23
c. The Procedures of Make a Match Technique .......... 24
d. The Advantages and Disadvantages of Make
a Match Technique ................................................... 27
3. Conventional Technique ................................................ 29
a. Definition of Conventional Technique .................... 29
b. The Purpose of Conventional Technique ................ 30
c. The Procedures of Conventional Technique ........... 31
d. The Advantages and Disadvantages of
Conventional Technique .......................................... 33
B. Review of Related Findings ................................................... 35
C. Framework of Thinking ......................................................... 37
D. Hypothesis of Research ......................................................... 38
CHAPTER III RESEARCH METHODOLOGY
A. The Place and Time of the Research ..................................... 40
B. The Research Design .............................................................. 40
C. The Population and Sample ................................................... 41
D. The Definition of Operational Variables ............................... 45
E. The Instrument for Collecting Data ....................................... 46
F. The Validity and Reliability of Instrument ............................ 48
G. The Procedures of the Research ............................................ 50
H. The Technique of Data Analysis ........................................... 53
CHAPTER IV RESEARCH RESULT
A. Description of Data ............................................................... 55
B. Data Analysis .................................................. ...................... 72
C. Discussion ............................................................................... 74
D. Limitation of the Research ...................................................... 77
CHAPTER V THE CONCLUSION AND SUGGESTION
A. Conclusion .............................................................................. 79
B. Suggestion ............................................................................... 79
REFERENCES
CURRICULUM VITAE
APPENDIXES

LIST OF TABLES
Table Page
Table 1 Research Design ..................................................................... 41
Table 2 The Population of the Grade XI MIA Students of MAN 1
Padangsidimpuan ................................................................... 42
Table 3 Sample of the Research ......................................................... 45
Table 4 Indicators of Reading Comprehension for Pre-test ................. 46
Table 5 Indicators of Reading Comprehension for Post-test ............... 47
Table 6 The Score of Experimental Class in Pre-test ........................... 55
Table 7 Frequency Distribution of Experimental Class (Pre-test) ........ 56
Table 8 The Score of Control Class in Pre-test ..................................... 58
Table 9 Frequency Distribution of Control Class (Pre-test) ................. 58
Table 10 The Score of Experimental Class in Post Test ......................... 60
Table 11 Frequency Distribution of Experimental Class (Post-test) ....... 61
Table 12 The Score of Control Class in Post-test ................................... 62
Table 13 Frequency Distribution of Control Class (Post-test) ................ 63
Table 14 The Comparison Score of Students' Reading Comprehension
in Pre-test and Post-test (Experimental Class) ........................... 64
Table 15 The Comparison Score of Students' Reading Comprehension
in Pre-test and Post-test (Control Class) .................................... 67
Table 16 The Comparison Score of Students’ Reading Compehension
in Experimental and Control Class (Post-test) .......................... 69
Table 17 Normality and Homogeneity in Pre-Test .................................. 72
Table 18 Normality and Homogeneity in Post-Test ................................ 72
Table 19 Result of T-test from the Both Averages .................................. 74

LIST OF FIGURES
Figure Page
Figure 1 : The Result Score of Students’ Reading Comprehension
in Experimental Class (Pre Test) .................................................... 57
Figure 2 : The Result Score of Students’ Reading Comprehension
in Control Class (Pre Test) ............................................................... 59
Figure 3 : The Result Score of Students’ Reading Comprehension
in Experimental Class (Post Test) ..................................................... 61
Figure 4 : The Result Score of Students’ Reading Comprehension
in Control Class (Post Test) .............................................................. 63
Figure 5 : The Comparison Data of Students’ Reading Comprehension
in Pre Test and Post Test (Experimental Class) ................................ 65
Figure 6 : The Comparison Data of Students’ Reading Comprehension
in Pre Test and Post Test (Control Class) ......................................... 68
Figure 7 : The Comparison of Description Data between Students’ Reading
Comprehension in Experimental and Contol Class (Post Test) ........ 70
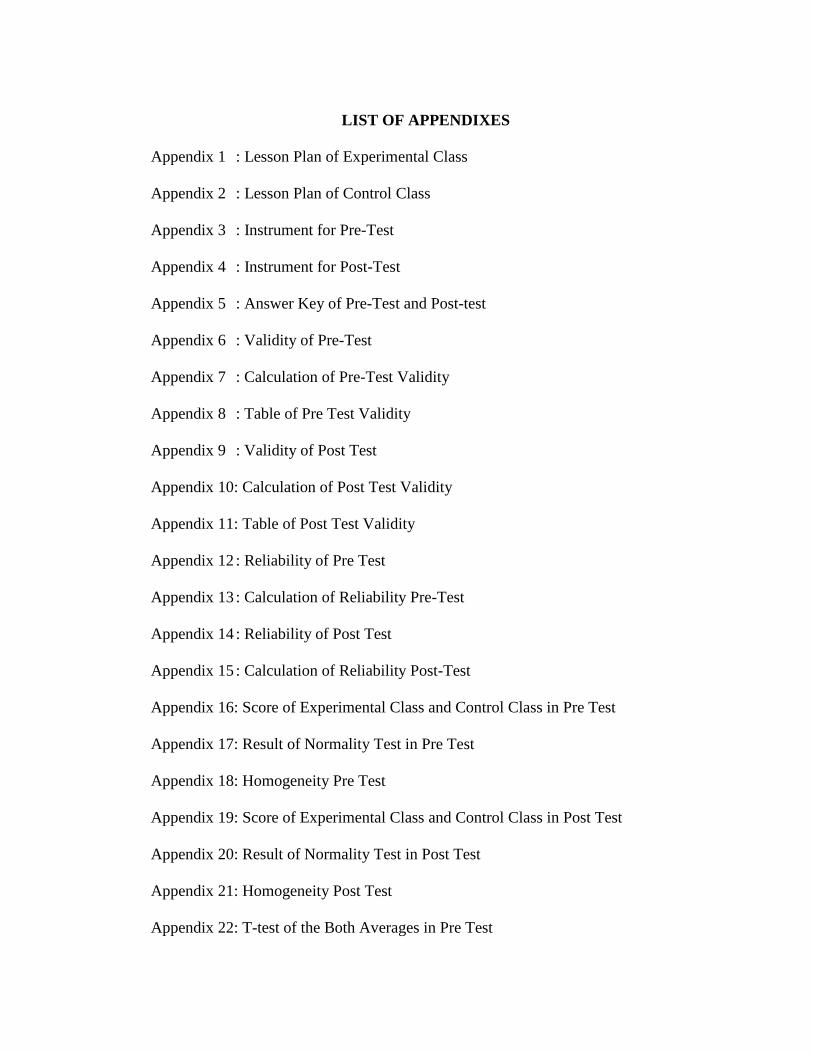
LIST OF APPENDIXES
Appendix 1 : Lesson Plan of Experimental Class
Appendix 2 : Lesson Plan of Control Class
Appendix 3 : Instrument for Pre-Test
Appendix 4 : Instrument for Post-Test
Appendix 5 : Answer Key of Pre-Test and Post-test
Appendix 6 : Validity of Pre-Test
Appendix 7 : Calculation of Pre-Test Validity
Appendix 8 : Table of Pre Test Validity
Appendix 9 : Validity of Post Test
Appendix 10: Calculation of Post Test Validity
Appendix 11: Table of Post Test Validity
Appendix 12 : Reliability of Pre Test
Appendix 13 : Calculation of Reliability Pre-Test
Appendix 14 : Reliability of Post Test
Appendix 15 : Calculation of Reliability Post-Test
Appendix 16: Score of Experimental Class and Control Class in Pre Test
Appendix 17: Result of Normality Test in Pre Test
Appendix 18: Homogeneity Pre Test
Appendix 19: Score of Experimental Class and Control Class in Post Test
Appendix 20: Result of Normality Test in Post Test
Appendix 21: Homogeneity Post Test
Appendix 22: T-test of the Both Averages in Pre Test

Appendix 23: T-test of the Both Averages in Post Test
Appendix 24: Chi-Square Table
Appendix 25: Z-Table
Appendix 26: Percentage Points of the t Distribution
Appendix 27: Documentation

1
CHAPTER I
INTRODUCTION
A. The Background of the Problems
Reading comprehension is an ability to understand what the readers
read where words have context and text have meaning. If the readers can read
the words of a text, but they do not understand what they are reading, they are
not really reading. Reading comprehension is an essential skill for English
learners.
In Indonesian curriculum, reading comprehension has a position as
one of the aspect ability for students to master English. It can be seen from
English syllabus that place reading comprehension in almost every subject of
English material. For example, when the material is about text, the lesson is
not only about vocabulary, but also about related contents of the text. So, the
reading material can not be separated from reading comprehension, because
reading comprehension is one of the aspect ability in English lesson.
The importance of reading comprehension has known by people in
educational institution, especially English teachers and learners. Reading
comprehension is one of the aspect ability for students to master English text.
Without good reading comprehension, students will not understand what they
have read and what information that must be taken when they are reading the
English material. It means the readers also do understand what they are
reading. Besides that, reading comprehension teaches students about the world
1

2
around them. Through reading, student learn about peoples, places, and events
outside their own experience. They are exposed to ways of life, ideas and
beliefs about the world which may be different from those which surround
them. This learning is important for its own sake however it also builds a store
of background knowledge which helps student learn to read confidently and
well. Then, reading comprehension can develops a reader’s imagination. This
is because when the reader reads, their brains translate the descriptions the
reader reads of people, places, and things into pictures. When they are
enganged in a story, they are also imagining how the characters are feeling.
They use their own experiences to imagine how they would feel in the same
situation. So, without good reading comprehension, a learner will not master
the English lesson perfectly, especially about the material of English text.
There are some ways to increase students’ reading comprehension.
Mrs. Afnita Warni, S.Pd as English teacher of MAN 1 Padangsidimpuan had
made efforts to increase students’ reading comprehension, through giving task
to students to translate a text, to answer reading questions, to discuss, and to
memorize at least ten words in a week. Besides that, teacher also used media
such as laboratorium of language that had been prepared by the headmaster.1
So, from the teacher efforts, students are hoped to be able comprehend text
well and have enough reading comprehension ability.
1Afnita Warni, English Teacher in MAN 1 Padangsidimpuan, Private Interview, October 01
st
2016, at 11.00 a.m., in MAN 1 Padangsidimpuan.

3
Based on the information from Mrs. Afnita Warni, S.Pd as English
teacher of MAN 1 Padangsidimpuan as the place of this research, the students
in this school are poor ability in reading comprehension. It makes them bad in
understanding English text and difficult to recall the information that needed
from the text. The students have some problems in reading comprehension,
such as difficult to understand of English text, bad pronunciation, spend many
times to find out the meaning of word by word, getting bored and tired in
reading comprehension. The problems are caused by several reasons such as
students’ educational background, lack vocabularies, their less practice,
interesting and motivation, their bad mindset about English, their less
technique to learn reading comprehension and teacher’s less technique in
teaching.2 The researcher thinks that it is a big problem.
There are some factors in students reading comprehension, such as
media and technique. Technique is teacher’s way to teach a material or
everything teachers do or should do in order to help their learners learn with
systematic procedure. A teacher must use various techniques in teaching
reading comprehension in order to take students’ attention and make a
learning process become fun. The application of techniques is important in
teaching reading comprehension. Besides that, the existence of media such as
picture, audio, video, cards, and other also gives good effect in reading
comprehension. So, the students’ good reading comprehension also depends
on teacher’s policy to apply some techniques and use suitable media.
2Ibid.

4
The techiques give big supply in teaching reading comprehension. By
applying various technique in teaching reading comprehension, the good
result is not only in students’ attention, but also in teaching and learning
process. Teacher’s good class management and the application of suitable
technique will give good effect in classroom atmosphere. The application of
technique will make students pay attention to the lesson. The various
techniques will also avoid students from bored, feel tired, and bad mindset
about English. On the contrary, the learning process will be fun and enjoyable.
So, reading comprehension teaching techniques is the important role in
teaching reading comprehension.
There are many techniques that can be applied in teaching reading
comprehension. Some of the popular techniques are Jigsaw technique, Silent
reading, Semantic mapping, Skimming, Scanning, Make a match technique
and anothers. Those various techniques are suitable and good for enjoyable
teaching learning process in reading comprehension classes.
One of the technique to teach reading comprehension is Make a Match
technique. This reading comprehension teaching technique uses some cards.
The cards consist of questions and answer cards. The question and answer
cards connected by the material and suitable with the topic or material that
taught by researcher or teacher.

5
Make a Match technique is one of simple cooperative learning
technique. This technique is adaptable to most all subject and grade level.3
Then, Make a Match technique can motivate students to encourage help each
other master skill presented by the teacher, an effective technique for teaching
material and students more active study, make a learning become fun and
learning material to understand easily.4 So, this technique can help students in
reading comprehension.
Based on the explanation above, the reseracher is interested to
introduce Make a Match technique to teach reading comprehension in the
school. The researcher wants to know whether Make a Match technique give
significant effect on students’ reading comprehension or not. So, this
technique can be used for the next time by researcher herself or other teachers
if it gives positive effect for students. This reason finally guides the researcher
to formulate the title “The Effect of Make a Match Technique on Students’
Reading Comprehension at XI Grade of MAN 1 Padangsidimpuan”.
B. The Identification of the Problem
Based on the background of problems above, reading comprehension
is an important ability in language teaching, in teaching comprehend about
text, and has role as one of the aspect ability of language competence. The
importance of reading comprehension has known by people in educational
3Anita Lie, Cooperative Learning, (Jakarta: PT. Grasindo, 2008), p. 55.
4Istarani, 58 Model Pembelajaran Inovatif, (Medan: Media Persada, 2014), p.65.

6
institution, especially English teachers and learners. Reading comprehension
is one of the aspect ability for students to master English text.
There are some factors that give effect on reading comprehension,
such as media, students’ interesting, material, and technique. Technique is
everything teachers do or should do in order to help their learners learn with
systematic procedure. As Linda and Mary say, “Research seems to indicate
that many efficient techniques for learning reading comprehension are
available for use.”5 It means that technique is one of the factors that affect
reading comprehension. The technique means here is Make a Match
technique.
C. The Limitation of the Problem
Based on the identification above, there are some factors that affect
students’ reading comprehension, such as media, students’ interesting,
material, and technique. Here, the researcher does not discuss all the factors
but the researcher chooses one factor, namely technique. The technique means
here is Make a Match technique. Researcher chooses this technique because it
can help students to learn and understand the material easily and make a
learning become fun.
5Mary M. Dupuis and Linda H. Merchant, Reading Across the Curriculum: A Research
Report for Teachers, (Bloomington, Indiana: Edinfo Press, 1993), p.17.

7
D. The Formulation of the Problem
The formulation of the problem in this research are:
1. How is the students’ reading comprehension before using Make a
Match technique at XI grade of MAN 1 Padangsidimpuan?
2. How is the students’ reading comprehension after using Make a
Match technique at XI grade of MAN 1 Padangsidimpuan?
3. Is there any significant effect of Make a Match technique on
students’ reading comprehension at XI grade of MAN 1
Padangsidimpuan?
E. The Purpose of the Research
From the formulation of the problem above, the purpose of this
research are:
1. To examine the reading comprehension before using Make a
Match technique on students’ reading comprehension at XI grade
of MAN 1 Padangsidimpuan.
2. To examine the reading comprehension after using Make a Match
technique on students’ reading comprehension at XI grade of
MAN 1 Padangsidimpuan.
3. To examine whether there is or there is not any significant effect of
using Make a Match technique on students’ reading
comprehension at XI grade of MAN 1 Padangsidimpuan.

8
F. The Significances of the Research
The significances of this research are:
1. The result of this research is expected to be useful for the English
teachers in MAN 1 Padangsidimpuan as their infomation or their
source in teaching reading comprehension. This research is also
expected to be able to become motivation for the teachers to
always make an interesting and fun techniques in teaching reading
comprehension.
2. The result of this research is expected to be useful for the
headmaster as one domain measurement of teaching progress.
3. The result of this research is expected to be the information for the
others researchers to make the further research.
G. The Outline of the Thesis
The systematic of this research is divided into five chapters. Each
chapter consist of many sub chapters with detail as follow:
In chapter one, it consist of background of the problems, identification
of the problems, limitation of the problem, formulation of the problem,
purpose of the research, significances of the research, and the outline of the
thesis.
In chapter two, it consist of the theoritical descriptions, which the sub
chapters consist of the theoritical description of reading comprehension and
Make a Match Technique. Then, review of related findings, framework of
thinking and hypothesis.

9
In chapter three, it consist of research methodology which consist of
place and time of the research, research design, population and sample,
definition of operational variables, instruments of collecting data, validity and
reliability of instrument, procedures of research, and the techniques of
analyzing data.
In chapter four, it consist of the result of the research, it explains about
the analysis of data. It is consist of description of the data, data analysis,
discussion of the research and threats of research.
Finally, in chapter five consist of the conclusion that given conclusion
the result of research and suggestions for students, teachers, school, and other
researchers that want to do researches related to this research.

10
CHAPTER II
LITERATURE REVIEW
A. Theoritical Description
1. Reading Comprehension
a. Definition of Reading Comprehension
Reading is comprehension. If students can read the words of a
text, but do not understand what they are reading, they are not really
reading.1 As Hornby says, “comprehension is the power of
understanding”2. It is the ability to understand a language. Richard
says that comprehension is the process by which a person
understanding the meaning of written or spoken language clearly.3
Besides that, Roebl says that reading comprehension is an ability to
understand what the readers read where words have context and texts
have meaning.4 In addition, David Nunan says that reading
comprehension is the instruction program, more emphasis and time
may be placed on testing reading comprehension than on teaching
reader how to comprehend.5 From the definitions, it can be concluded
that reading comprehension is mental process in which the readers try
1Ellen McIntyre, Nancy Hulan, and Vicky Layne, Reading Instruction for Diverse Classroom,
(New York: The Guilford Press, 2011), p. 113-114. 2A.S. Hornby, Oxford Advanced Learner’s Dictionary, (New York: Oxford University Press,
1995), p. 324. 3Richard A. Renandya, Language Teaching Methodology, (Cambridge: Cambridge
University, 2000), p.54. 4K.M. Roebl, Developing Reading Comprehension Skill in EFL University Level Student,
(Taiwan: St. Jhon‟s University, 2003), p. 177. 5David Nunan, Design Task for the Communicative Classroom, (United Kingdom:
Cambridge University Press, 1988), p. 69.
10

11
to understand the meaning in the text by interpreting what have been
read in order to find the idea given by the writers.
b. The Aims of Reading Comprehension
The aims of reading comprehension are to get and find
information include content and meaning of the text based on the
purpose. William Grabe states that the aims of reading comprehension
as follows:
1) Reading to search for information (scanning and skimming)
2) Reading for quick understanding (skimming)
3) Reading to learn
4) Reading to integrate information
5) Reading to evaluate, critique, and use information
6) Reading for general compehension (in many cases, reading
for interest or reading to entertain)6
Besides that, Henry Guntur Tarigan states that the aims of
reading comprehension as follows:
1) Reading is for identifying important information
2) Reading is for main ideas
3) Reading is for finding the specific information
4) Reading is for underlining the important information
5) Reading is to classify the difficult word
6) Reading is to evaluate
7) Reading is to compare or contrast7
Based on the quotations above, the aims of reading
comprehension divided into seven importance, they were reading to
search for information (scanning and skimming), reading is for main
6William Grabe, Reading in a Second Language, (Cambridge:Cambridge University Press), p.
8. 7Henry Guntur Tarigan, Membaca Sebagai Keterampilan Berbahasa, (Bandung: Aksara,
1990), p. 9-10.
12
ideas, reading to learn, reading to evaluate, critique, and use
information, reading is to classify the difficult word, reading is to
compare or contrast and reading for general comprehension.
Meanwhile, in curriculum of MAN 1 Padangsidimpuan, the
aims of reading comprehension are to identify topic from the text,
identify important or specific information from the text, main ideas of
a text, reference to a word and word contextual meaning.8 So, the aims
of teaching reading comprehension relates with students‟ learning
activities where teaching reading comprehension increases the
students‟ understanding of text or subject matter.
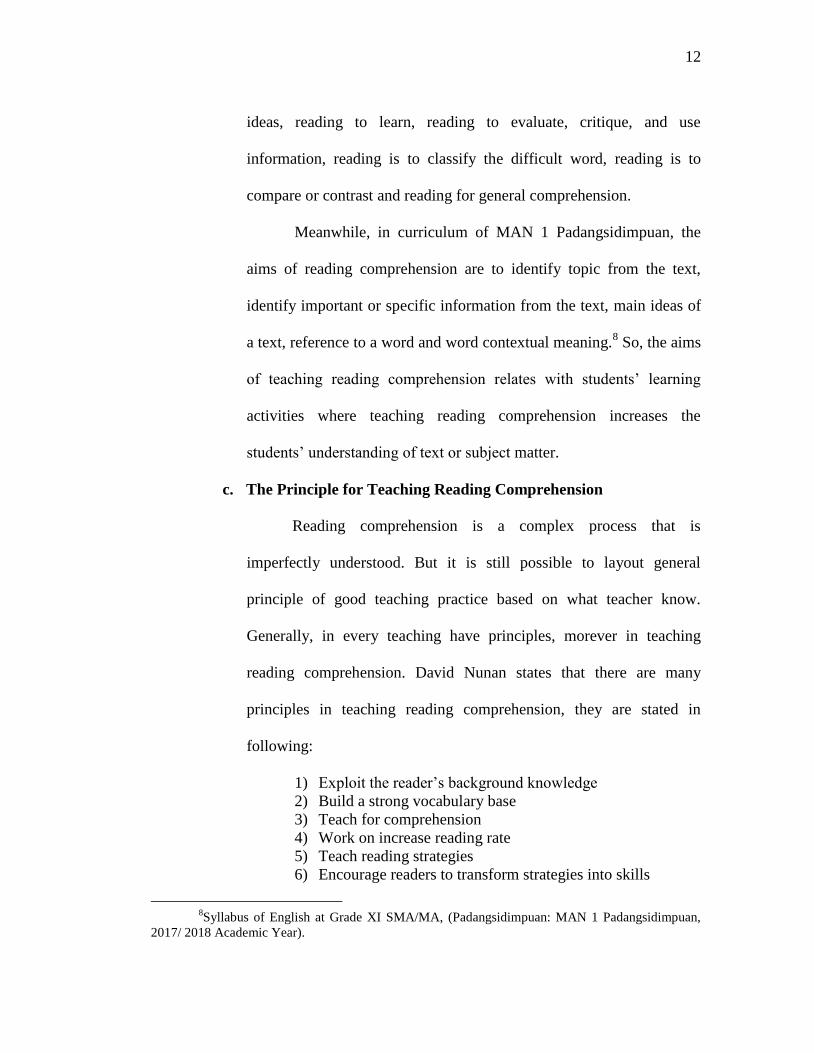
c. The Principle for Teaching Reading Comprehension
Reading comprehension is a complex process that is
imperfectly understood. But it is still possible to layout general
principle of good teaching practice based on what teacher know.
Generally, in every teaching have principles, morever in teaching
reading comprehension. David Nunan states that there are many
principles in teaching reading comprehension, they are stated in
following:
1) Exploit the reader‟s background knowledge
2) Build a strong vocabulary base
3) Teach for comprehension
4) Work on increase reading rate
5) Teach reading strategies
6) Encourage readers to transform strategies into skills
8Syllabus of English at Grade XI SMA/MA, (Padangsidimpuan: MAN 1 Padangsidimpuan,
2017/ 2018 Academic Year).
13
7) Build assessment and evaluation into your teaching
8) Strive for continuous improvement as a reading teacher9
Besides that, H. Douglas Brown states that the principle of
teaching reading comprehension as follows:
1) Identify your purpose in reading a text.
2) Apply spelling rules and conventions for bottom-up
decoding.
3) Use lexical analysis (prefixes, roots, suffixes, and other) to
determine meaning.
4) Guess at meaning (of words, idioms, and other) when you
are not certain.
5) Skim the text for the gist and for main ideas.
6) Scan the text for specific information (names, dates, key
words).
7) Use silent reading techniques for rapid processing.
8) Use marginal notes, outlines, charts, or semantic map for
understanding and retaining information.
9) Distinguish between literal and implied meanings.
10) Capitalize on discourse markers to process relationships.10
The quotations above show that there are ten principles for
teaching reading comprehension, they were exploit the reader‟s
background knowledge, build a strong vocabulary base, teach for
comprehension, work on increase reading rate, teach reading
strategies, encourage readers to transform strategies into skills, build
assessment and evaluation into your teaching, strive for continuous
improvement as a reading teacher, use lexical analysis to determine
meaning, and distinguish between literal and implied meanings. They
were an important skill in English to get an idea of the text and
9David Nunan, Practical English Language Teaching,( New York: McGraw Hill Inc, 2003),
p. 74-77. 10
H. Douglas Brown, Language Assessment: Principles and Classroom Practices, (United
States of America: Longman, 2004), p. 188-189.

14
increase students‟ knowledge and experience through reading
comprehension.
d. The Process of Reading Comprehension
Reading comprehension is an important skill in academic
achievement. However, the readers also have to know what their
purpose is in reading a text, the technique for accomplishing that
purposes, and how to retain the information. So, before accomplishing
the readers‟ purpose, they should to know how the process of reading
comprehension. The process of reading comprehension can be divided
in to three categories, they are:
1) Bottom-up models
2) Top-down models
3) Interactive models11
Besides that, William Grabe also states that the process of
reading comprehension can be divided in to three categories, they are:
1) Bottom up models
2) Top down models
3) Interactive Models12
The quotations above show that there are three categories as
the process of reading comprehension, they are Bottom-up models,
Top-down models, and Interactive models. Which is the Bottom-up
models as the models traditionally depict reading as a mechanical
process in which the reader decodes the on going text letter by letter,
11
David Nunan, Op.Cit., p. 70-73. 12
William Grabe, Op.Cit., p. 89.

15
word by word, sentence by sentence. Top-down models as the models
assume that the reader actively controls the comprehension process,
directed by reader goals, expectations, and strategic processing. Then,
Interactive models as the models are the typical compromise solution.
The basic assumption is that useful elements from bottom up and top
down views can be combined in some massively interactive set of
processes. So, it can be concluded that reading comprehension is a
process to understand of written text or printed material. Which is the
process of reading use some factors, such as; intellegence, skill in
language, background knowledge, and others.
e. The Levels of Comprehension
Comprehension is reading specially for getting the content of
message, the meaning of the words, inferring implied meaning or
another has variety of skills. It must be had by the reader to
comprehend it easily or may be quickly. Otto suggests that the level
of reading comprehension may be divides into four categorize, they
are:
1) Literal Comprehension
2) Interpretation
3) Critical Reading
4) Creative Reading13
Besides that, Westwood also says a thing same with Otto,
which is the levels of comprehension as below:
13
Wayne Otto, How to Teach Reading, (USA: Wesley Publishing Company, 1979), p. 163.
16
1) Literal level
2) Inferential level
3) Critical level
4) Creative level14
The quotations above showed that the level of reading
comprehension is divided into four categorizes, they are: Literal level
for getting the direct meaning that has been explicitly stated,
Interpretation/Inferential level for identifying ideas not explicit stated,
Critical level for evaluating what is read or bias, and Creative level for
applying ideas read to new situation.
Based on four levels above, it can be seen these levels reader to
the kind respons required by the reader. It can be as what the reader do
in reading a text. The reader infers, interprets, critics and be creative in
reading the witen form or printed material. Building these skill is
important part of early education and will help students in their
understanding of harder texts.
f. Assessment of Reading Comprehension
Assessment is a tool to measure how far the students ability and
comprehension of the material.15
Wadswoth states that there are five
types of assessment of reading comprehension. They are:
1) Literal comprehension, entails understanding the
information that is explicit in the reading material.
14
Peter Westwood, Reading and Learning Difficulties: Approach to Teaching and Assessment,
(Australia: National Library of Australia, 2001), p. 21-22. 15
J. Michael O‟ Malley and Lorraine Valdez Pierce, Autentic Assessment for English
Language Learners, (America: Addision-Wesley Publishing Company, 1996), p. 98.

17
2) Inferential comprehension, means interpreting,
synthesizing, or extending the information that is explicit in
the reading material.
3) Critical comprehension, requires analyzing, evaluating, and
making judgments responses to the material read.
4) Affective comprehension, involves a reader‟s personal and
emotional responses to the reading material.
5) Lexical comprehension, means knowing the meaning of key
vocabulary words.16
Besides that, Nuttall says that there are five aspects of reading
which the students should understand to comprehend a text well, they
are determining main idea, finding specific information, reference,
inference, and vocabulary. Comprehension can be regarded as a
condition where certainly exist. Beside a pleasure activity that can
increase the reader‟s knowledge about the information from the text, in
language class reading can also consolidate and extend the reader‟s
knowledge and skill in language.17
Based on the quotations, it can be
inferred that when the reader is reading a text, he/she becomes the
most important thing in reading activity. Comprehension will make the
reader able to determine the essence of the sentence or text and receive
the main purpose of reading process. It is necessary for the readers
because by comprehension the readers can get the aim of reading text.
In addition, by comprehending the text the students will find
the gist of the text such as an important message or information from
16
Wadsworth, Assessment: In Special and Inclusive Education, Eleventh Edition, ( USA:
Cengage Learning Press, 2010), p. 196. 17
Christine Elizabeth Nuttall, Teaching Reading Skills in a Foreign Language, (London:
Heinemann Educational Books, 1982), p. 234.

18
the text. As defined by Djuharie, reading comprehension is
understanding of written text meaning to get the information which is
needed from the text as efficiently as possible.18
When the students
find the difficulties in reading, the teacher should be able to solve this
problems.
So, in assessing reading comprehension, there are some
indicators. The indicators are students able to:
1) Identify the topic from the text
2) Identify the main ideas from the text
3) Identify information that needed from the text
4) Understand the vocabulary from the text
5) Give conclusion from the text
There are some techniques to test reading comprehension, like;
multiple choice, short answer questions, cloze task, fill-in-the-blank,
and so on, to measure students‟ reading comprehension. But, in this
research, the researcher choose the multiple choice question.
A multiple choice question test item is usually set out in such a
way that candidate is required to select the answer from a number of
given options, only one of which is correct. The marking process is
totally objective because the marker is not permitted to exercise
judgment when marking the candidate‟s answer, agreement has
18
Otong Setiawan Djuharie, Intensive Reading Bottom-Up Reading. (Bandung: Yrama Widya,
2008), p. 112.

19
already been reached as to the correct answer to each item.19
So, in
advantages of multiple choice test are the answer have a clear because
just there is one the answer of the question, save a time to correct, and
easy to give a score of students based on true or false answer, whereas
the disadvantages difficult to make a multiple choice answering and
generally students just make a guess to answer the question.
g. Material of Reading Comprehension
There are many materials in teaching reading comprehension.
One of them is genre text. So, the English learner can learn or
understand of subject matter while reading a passage, listening to a
spoken English, and produce it when do speaking or writing activities.
There are some kinds of genre text in reading comprehension. They
are:
1) Descriptive Text
2) Report Text
3) Narrative Text
4) Recount Text
5) Spoof Text
6) Exposition Text
7) Anecdote Text
8) Discussion Text
9) Explanation Text20
Based on the some kinds of genre text above, it is relevant with
English lesson syllabus of Indonesian curriculum that places these four
activities within it. The book uses in MAN 1 Padangsidimpuan is Look
19
Cyrill J. Weir, Communicative Language Testing, (New York: Prentice Hall, 1990), p. 43. 20
Otong Setiawan Djuharie, Genre, Dilengkapi 700 Soal Uji Pemahaman, (Bandung: CV.
Yrama Widya, 2007), p. 26.

20
Ahead Book 2. This book consist of many reading comprehension
buildings, such as genre text, they are Report text, Narrative, and
Exposition text (Analytical-Hortatory).21
So, in this research the
researcher uses two kinds of genre text and the two kinds that
appropriate with material of students‟ English book in first semester at
grade XI of MAN 1 Padangsidimpuan. They are Report text, and
Narrative text. There are some examples of material reading
comprehension in MAN 1 Padangsidimpuan, they are:
1) Example of Report Text
Read the situation below and choose the best answer for the
questions. Sometimes, more than one answer is possible.
It was the first day of the English class and the teacher was
introducing himself. He wrote his full name, Allan Jones, on
the board and said, “My name is Alan Jones. If you like, you
can use „Mr‟ with my name. Now I‟d like you to tell me your
names. Let‟s start with you,” he said, indicating a young girl in
the front row.
“My name is Liliana Castro, but you can call me Lily,
Teacher.”
Then the teacher said, “OK. I‟ll call you Lily, but please
don‟t call me „Teacher‟. Please call me Alan or Mr. Jones.”
Lily looked confused, but the teacher ignored her and
continued to ask the students to introduce themselves.
1. What is the topic of text?
a. Social Behavior
b. Classroom Behavior
c. Behavior
d. Teacher
2. Why did Liliana call Alan Jones „Teacher‟?
a. She didn‟t know his name
b. She was trying to show respect
21
Th. M. Sudarwati and Eudia Grace, Look Ahead Book 2; An English Course for Senior High
School Students Year XI, (Jakarta: Erlangga, 2007), p. 2-154.

21
c. She couldn‟t pronounce his name
d. She felt confused
3. Why did Alan Jones ask Liliana not to call him
„Teacher‟?
a. He didn‟t really like being a teacher
b. He wanted to be friendly
c. In his country, only very young pupils call their
teacher “Teacher‟
d. He thought Liliana was being rude22
2) Example of Narrative Text
Read carefully the following tetx!
The Lion and the Mouse
One, when a lion was asleep, a little mouse began running
up and down upon him; this soon awakened the lion, who
placed his huge paw upon him, and opened his big jaws to
swallow him. “Pardon, O king,” cried the little mouse, “Forgive
me this time, I shall never forget it; who knows but what I may
be able to do you a turn some of these days?”
The lion was so tickled at the idea of the mouse being able
to help him, that he lifted up his paw and let him go.
Some time after, the lion was caught in a trap and the
hunters, who desired to carry him alive to the king, tied him to
a tree while they went in search of a wagon to carry him on.
Just then the little mouse happened to pass by and see the
sad plight in which the lion was. He went up to the lion and
soon gnawed away the ropes that bound the king of the beasts.
“Wasm‟t I right?”, said the little mouse.
Answer the question based on the text you have read!
1) What was the lion doing when the mouse tran up and
down upon him?
2) What happened to the lion some time after?
3) What is the message of the story?
4) Who are the main participants of the story?
5) How did he overcome his problem?23
Based on the explanations above, reading comprehension is
understanding the meaning of text, and consequence associated with
22
Ibid., p. 20. 23
Ibid., p. 135.

22
the act of reading, students know that reading comprehension is very
important, cause comprehension is the process by which a person
understanding the meaning of written or spoken language. In
conclusion, reading comprehension is the ability of the reader to
understanding of the text and comprehend the meaning of the text.
2. Make a Match Technique
a. Definition of Make a Match Technique
Make a Match is a technique to teach all subject matter by
using cards. The cards consist of question and answer form that
appropriate with a topic or subject matter in learning process. Make a
Match technique was developed by Lorna Curran in 1994s. One of the
profits of this technique is the students look for their partner while
learning a concept or topic in interesting situation. This technique can
be applied in all of the subject matter and grade level.24
Besides it,
Arifah and Kusumarasdyati states that Make a Match is one of the
teaching techniques which can be used in cooperative learning. The
Make a Match technique is a kind of game where students have to find
their partner.25
In addition, Make a Match technique is interesting
technique which used to review the material given before. But, the
new material can also be taught in this technique with note, the
24
Anita Lie, Cooperative Learning, (Jakarta: PT. Grasindo, 2008), p. 55. 25
Arifah and Kusumarasdyati, The Effectiveness of Make a Match Technique for Teaching
Writing Descriptive Text to the Seventh Graders of SMP N 1 Karangbinangun Lamongan, retrieved
from http://www.ejournal.unesa.ac.id/article/3061/58/article/pdf., on May 24th
, 2017 at 05.30 am.

23
students given exercise to study the topic that will be taught first, so
when enter the class they have had knowledge.26
From these
explanations, it can be concluded that Make a Match technique is a
kind of technique to teach reading comprehension that uses cards
which contains question and answer card about a topic or material of
learning process. This technique can be taught in groups, pairs or in
individual activities. Thus, this technique assumes that the students can
more active and enjoy to study by using Make a Match technique.
b. The Purpose of Make a Match Technique
The aims of reading comprehension are to get and find
information include content and meaning of the text based on the
purpose. In teaching reading comprehension, Make a Match technique
is considered as one appropriate technique. It can be seen based on the
purpose of Make a Match technique.
The are four purposes of Make a Match technique, they are:
1) To help students with cards representation for
understanding of subject matter/ material in learning
process.
2) To help students have personal association with terms
when create a joyful learning and become the class more
active.
3) To help increase students‟ motivation in learning.
4) To help avoid students being bored during the teaching-
learning process.27
26
Asri Pratiwiningsih, The Effectiveness of Make a Match Technique in Teaching Reading
Comprehension Report Text at XI Grade SMA Negeri 1 Ngimbang Lamonan, retrieved from
http://www.ejournal.stkipjb.ac.id/index.php/AS/article/download/225/ 161/pdf., on October 14th
, 2016
at 04.20 pm. 27
Istarani, 58 Model Pembelajaran Inovatif, (Medan: Media Persada, 2014), p. 63.

24
In addition, there are three goals/objectives of Make a Match
technique as below:
1) To help students of thinking critically in learning process.
2) To create a students‟ active and creative.
3) To help students building of their personality to be
democratic from interacting with their friends in learning
process.28
Based on the quotations above, it can be conluded that the
purpose of Make a Match technique are to help students with cards
representation for understanding of subject matter in learning process,
to create a students‟ active and creative, to help increase students‟
motivation in learning, for thinking critically, to create joyful learning
and become the class more active.
So, this technique requires students to find a material that is not
known before, or a word that is not familiar, so it will introduce
students with a new knowledge. This technique is also easy in the
application to motivate students or activate their interesting, because
Make a Match technique is presented with cards and like a game.
c. The Procedures of Make a Match Technique
Technique is a way of teaching a language which is based on
systematic principle and procedure.29
Many teacher used technique
when they teach. One of them is Make a Match technique. Make a
28
Agus Suprijono, Cooperative Learning, Teori dan Aplikasi PAIKEM, (Yogyakarta: Pustaka
Pelajar, 2012), p. 5. 29
H. Douglas Brown, Teaching by Principle: An Interactive Approach to Language
Pedagogy, (USA: Prentice Hall Inc, 1994), p.126.

25
Match is technique of teaching and learning technique to find partner
while learning a topic or material. When a teacher want to apply Make
a Match technique, they should use systematic procedure that suitable
with the technique.
There are some produres of Make a Match technique, they are:
1) The teacher provides some cards that contains of topics is
that match with review session or prepare to final
examination.
2) Each of students will be given a card.
3) Each of students looking for a match that suitable with
his/her card. Example: SBY match with the students got
PRESIDEN RI card.
4) The students join with his/her friends that get a suitable
card.30
In addition, Hanafiah says that the procedure of Make a Match
technique as below:
1) Teacher set up some cards that contain some concept of
review session, otherwise the part of card about question
and the card other answer.
2) Each student receives a one card hand
3) Each student think of an answer or a question of card held.
4) Each students seeking a partner who has a card that
matches the card (about the answer).
5) Any the student who can match his/her card before the
deadline given points.
6) After one round of cards, shuffled again, so each students
get a different card than before.
7) So forth.
8) Conclusion or closing.31
It is important to know that do not all students of both for
personating of handle of questions and answer card know and
30
Miftahul Huda, Cooperative Learning, (Yogyakarta: Pustaka Pelajar, 2012), p. 135 31
Nanang Hanafiah, Konsep Strategi Pembelajaran, (Bandung: PT. Refika Aditama, 2009), p.
46.

26
comprehend surely whether what correct of card which they pair have
compatible. Based on this condition, teacher should to facilitate the
students‟ activities in learning process and to give the opportunity to
all of students to confirm which they have done that is pair the
questions-answer cards. In other words, teacher should evaluate result
from all of the students task and give the conclusion.32
Based on the
quotations, there are some procedures of applying Make a Match in
the classroom. So, it can be concluded that the procedures of Make a
Match technique they are:
1) The teacher provides some cards that contains of some
topics is that match with the subject matter of English in
the classroom.
2) Each students receives a text.
3) Each student receives a one card hand.
4) Each student think of an answer or a question of card held.
5) Each students seeking a partner who has a card that
matches the card (about the answer).
6) Any the student who can match his/her card before the
deadline given points.
7) After one round of cards, shuffled again, so each students
get a different card than before. So forth.
8) Conclusion or closing.
32
Agus Suprijono, Op.Cit., p. 96.

27
The procedures must be applied by teacher step by step to
reach the good final result. The procedure is not difficult to be applied,
so the learning process will be fun and enjoying.
d. The Advantages and Disadvantages of Make a Match Technique
Istarani suggests that if a teacher wants to teach the students
using the Make a Match technique, he/she should prepare some cards,
each with a question realted to a topic or material and some other cards
each one with an answer to one of the questions. Istarani adds that the
Make a Match technique has several advantages and disadvantages.33
The advantages of Make a Match technique as follow:
1) It can increase student‟s learning activity for their cognitive
and physic.
2) It can create a joyful learning because it is like a game.
3) It can increase student‟s comprehension about the material,
because the materials of teaching are easy.
4) It can increase student‟s motivation in learning.
5) It can increase the students‟ creativity through matching the
cards.
6) It can help avoid students being bored during the teaching
learning process.
7) All of students in the class more active.34
In addition, Ibrahim and Muslimin say that the advantages of
Make a Match technique as follow:
1) Teacher can motivate and encourage their students to be
more interested and enthusiastic in learning English.
2) It can increase students‟ concentrate and participate more
actively in the class.
3) The students will not feel so bored nor be afraid of making
a mistake in pronoucing a word or sentences.
33
Istarani, Op.Cit., p. 64. 34
Ibid., p. 65.
28
4) Delivered learning materials more attrative for students.
5) Cooperation among the students realized the dynamic.35
Based on the quotations above, the advantages of Make a
Match technique are can increase students‟ learning activity for their
cognitive and physic, can create a joyful learning and the students will
not feel so bored or be afraid of making a mistake in pronouncing a
word or sentence, can increase students‟ comprehension about the
material because the material of teaching become easy, and all of
students in the class more active.
Besides that, there are some disadvantages of Make a Match
technique, they are:
1) Each students have a different ability, so they cannot
deliver their ideas fluently.
2) The situation of this class is noisy.36
As the additional, Ibrahim and Muslimin say that the
disadvantages of Make a Match as follow:
1) Deeded guidance for the teachers to do activities.
2) Limited time available to students do not get to much play
in the learning process.
3) Teacher need to prepare adequate materials and
equipment.37
From combining explanations above, it can be concluded that
there are four the disadvantages of Make a Match technique, they are:
the situation of the class is noisy, deeded guidance for the teachers to
35
Ibrahim and Muslimin, Pembelajaran Kooperatif, (Surabaya: Unesa-University Press,
2000), p. 4. 36
Istarani, Op.Cit., p. 66. 37
Ibrahim and Muslimin, Op.Cit., p. 5.

29
do activities, limited time available to students do not get to much play
in the learning process, and the teacher need to prepare adequate
materials and equipment.
So, related to the advantages and disadvantages above, there
were some advantages when a teacher used Make a Match technique
in their teaching activities. It was gave for strong reason to teacher
used this technique to teach reading comprehension. So, Make a
Match is a kind of technique that computable to be used in English
classroom.
3. Conventional Technique
a. Definition of Conventional Technique
Conventional technique is needed to compare it with treatment.
Here is Make a Match technique. Conventional technique is the
technique or the way that usually used by the teachers to teach the text
to students.38
Hudson states that “conventional teaching is a technique
that used by the teachers based mutual agreement in a school.39
From
those definitions, it can be defined that the Coventional teaching
technique is a way that usually used by teachers to teach the material
to students based mutual agreement in a school. Conventional also
means something that considered acceptable by society and perhaps
38
Jhon Deriden, Conventional Technique, retrieved from http://www.britania.com/Ebchecked/
topic/421797/nnucler-strategy/52993/conventional-strategy, on December 24th
, 2016 at 10.00 p.m. 39
Hudson, The Meaning of Conventional Teaching (Online), retrieved from
http://www.conventional-strategy/topic/54372-strategy., on October, 02nd
2016 at 11.30 am.
30
not very interesting. The teacher will use traditional way in teaching
and learning. Conventional or traditional teaching is concerned with
the teacher being the controller of the learning environment. The
teacher actually is the leader in the class. So, conventional technique is
the technique used by teacher in common ways or lecture technique.
b. The Purpose of Conventional Technique
Conventional technique is the technique or the way that usually
used by the teachers to teach the material or text to students. It means
that the teacher usually gives all of the explanation of the materials or
it is a teacher centered in classroom.
There are two purposes of Conventional (Lecture) technique,
they are:
1) To convey a subject matter is logically arranged, and
irrelevant material or subject matter is avoided.
2) As the curriculum is design by the teacher, it become easy
to achieve the desired goals by teacher.40
The two purposes above is the first importance in lecture
technique or teacher-centered. In this technique, the teacher is centered
in learning process. This technique requires students to find a subject
matter through a teacher.
In addition, Gattegno says that there are three purposes of
Conventional (Lecture) technique, they are:
1) To convey the information or material in teaching learning
process.
40
Ibid., retrieved on October, 02nd
2016.

31
2) To increase the students‟ knowledge and language from
teaching learning process in classroom.
3) To explain the subject matter or material based on design
by teacher in clearly.41
Based on the quotations above, it can concluded that the
purpose of Conventional technique are to convey a subject matter is
logically arranged, and avoided irrelevant material in learning process,
to achieve the desired goals based on curriculum is design by teacher,
to increase the students‟ knowledge and language from explaining by
teacher or teaching learning process in classrom. The Conventional or
Lecture teaching technique is the oldest (traditional) teaching
technique applied in educational Institution. This teaching technique is
one way to communicate the information or subject matter by teacher
with lecturing in teaching learning process.
c. The Procedures of Conventional Technique
There are many technique that we can used in teaching and
learning process. One of them is conventional or traditional technique.
Conventional technique can be divided into some technique, such as:
lecture technique, problem solving, homework, recitation,
demonstration, and so on.42
So, there is a technique that is often used
by the teacher, such as lecture technique or teacher-centered. It is a
traditional technique because it has been used for a long time in
41
Caleb Gattegno, Teaching Foreign Languages in Schools, (New York: Educational
Solutions, 1972), p. 136. 42
Syaiful Bahri Djamarah, Strategy Belajar-Mengajar, (Jakarta: PT. Asdi Mahasatya, 2006),
p. 83-97.

32
teaching and learning process. In this technique, the teacher usually
gives all of the explanation of the materials or it is a teacher centered.
This traditional technique sometimes will make the students be easier
to feel bored and difficult to understand the material in learning
process.
There are some procedures of Conventional (Lecture)
technique, they are:
1) Preparation Phase
a. Created the students‟ learn condition
2) Implementing Phase
a. Presentation; teacher explains the material.
b. Association; teacher give a time/ chance for students to
respond, connecting and comparing the material that taught
with question-answer section.
c. Generalization/ conclusion; give a task for students to make
conclusion based on the material that have been explained
by the teacher.
3) Closing (Evaluating) Phase
a. Evaluate for students‟ comprehension about the material
that have been learned.43
In another source, said that there are three steps that procedure of
Conventional (Lecture) technique classroom, they are:
1) Opening Phase
a. Formulate goals to be achieved.
b. Determine the main points of the material to be explain.
c. Prepare tools.
2) Presentation Phase
a. Maintain continuous eye contact with students.
b. Present learning materials in systematic, no bounding to be
easily captured by the students.
c. Respond to immediate students reponses.
d. Keep the class conducive and exciting to learn.
43
Ibid., 99.

33
3) Closing Phase
a. Giving conclusion of subject matter
b. Evaluate the students‟ ability in learning process by given
a test based on the subject matter that have been learned.44
Based on the explanations above, there are three steps
procedure of Conventional (Lecture) technique, they are: Preparation/
Opening phase, Implementing Phase, and Closing (Evaluating) Phase.
The first, in preparation phase a teacher open the class with formulate
the objectives to be achieved, determine the main points of the
material will be explain, and preparing tool and class condition. The
second, in implementing phase a teacher gives and explain the
material. The third, in ending or closing phase a teacher gives a task or
exercise for evaluating the students‟ comprehension or ability about
the material that have been learned by the teacher.
d. The Advantages and Disadvantages of Conventional Technique
Conventional or traditional teaching is concerned with the
teacher being the controller of the learning environment. The teacher
actually is the leader in the class. Actually, using conventional
(Lecture) technique are many advantages and disadvantages in
teaching and learning process.
The advantages of Conventional (Lecture) technique as follow:
1) In short time, teacher is able to convey the material as
many as possible.
44
Umar Farooq, The Procedures of Teaching Lecture Technique, retrieved from
http://www.study lecturenotes.com /social- education/382-lecture-method-of-teaching-definiton-steps-
html., retrieved on April, 27th
2017 at 09.05 am.

34
2) The organization of class more simple.
3) Teacher an handle overall of the class.
4) Teacher easy in prepare the material and convey it to the
student.45
In addition, Thihanh Pham says that the advantages of
Conventional or Lecture technique are:
1) Teachers feel comfortable and confident in the classroom
activities.
2) It become easy to achieve the desired goals as the
curriculum is design by the teacher.
3) Subject matter or material is logically arranged. Irrelevant
material or subject matter is avoided.
4) Democracy is encouraged.46
Based on the quotations above, the Conventional (Lecture)
technique had many advantages in teaching learning process. The
advantages of Conventional (Lecture) technique were; teacher was
able to convey the material as many as possible in short time, the
organizations of class more simple, teacher easy to prepared the
material, to achieved the desired goals as the curriculum is design by
the teacher become easy.
The disadvantages of Conventional (Lecture) technique as
follow:
1) Teacher is difficult to know the students‟ comprehension
about the material that had been given.
2) This technique can make the students become passive
students.
3) This technique can make the students easy to feel bored.47
45
Syaiful Bahri Djamarah, Op.Cit., p. 97. 46
Thihanh Pham, Learners’ and Teachers’ Preference for Classroom Activities, (Colchester:
Essex University Press, 2005), p. 136. 47
Syaiful Bahri Djamarah, Op.Cit., p. 97-98.

35
In another source, said that the disadvantages of Conventional
or Lecture technique as follow:
1) Language using in the teacher is above the standard of the
students. They are not able get full advantage of the
teacher.
2) Attention level is not the same while student listening the
teacher.
3) Lack sources and resources.
4) It will become difficult to maintain a common standared in
various institutions.
5) The existing curriculum for teaching training institutions is
not suitable for the teacher centered approach.
6) It is very difficult for a student to sit for a long time and
listen to a teacher drone on about a topic or material in
learning process. So, the condition of class is noisy.48
If combine both of expert opinion, there are six the
disadvantages of Conventional (Lecture) technique. They are teacher
is difficult to know the students‟ comprehension about the material
that had been given, this technique can make the students become
passive students, easy to feel bored, language used by the teacher has
above the standard of students, lack sources and resources, attention
level is not same while students listening the teacher.
B. Review of Related Findings
Many researcher were talking about students‟ reading comprehension
and there were some researches that have been used Make a Match
Technique. Related to this research, some researches had been done as follow:
First, Sri Wahyuni, the concluding of her research, there was the effect
of Make a Match technique on students‟ reading comprehension, where the
48
Thihanh Pham, Op.Cit., p. 137.

36
mean score of experimental class is 74.67 and control class is 64.40 with tcount
higher than ttable (3.002 > 2.000).49
So, the application of Make a Match
technique is better, effective and efficient than conventional technique.
Second, Asri Pratiwiningsih, the concluding of her research, there is
effect of Make a Match Technique in Teaching Reading Comprehension
Report Text, where the mean score of experimental class 74.25 and control
class 68.97 with tcount higher than ttable (2.787 > 2.021). So, the implication of
Make a Match technique is better achievement in teaching reading
comprehension than conventional technique.50
It meant that the hypothesis
alternative (Ha) was accepted.
Third, Sri Alvera Ayu, the concluding of her research, there was the
effect of Make a Match technique on students‟ reading comprehension, where
the mean score of experimental class is 74.38 and control class is 66.64 with
tcount higher than ttable (2.618 > 2.021).51
So, the implication of Make a Match
technique is better achievement in teaching reading comprehension than
conventional technique.
49
Sri Wahyuni, The Effectiveness of Using Make a Match Technique in Teaching Reading
Comprehension to the First Grade Students of SMP Negeri 2 Sulang, Rembang, retrived from
http://www.lib.unnes.ac.id., on October 28th
, 2017 at 10.00 a.m. 50
Asri Pratiwiningsih, The Effectiveness of Make a Match Technique in Teaching Reading
Comprehension Report Text at XI Grade SMA Negeri 1 Ngimbang Lamonan, retrived from
http://www.ejournal.stkipjb.ac.id/index.php/AS/article/download/225/161/pdf., on October 14th
, 2016
at 04.20 p.m. 51
Sri Alvera Ayu, The Effect of Using Make a Match Technique on Students‟ Reading
Comprehension of Recount Text at the Tenth Grade SMA Xaverius 2 Jambi, retrieved from
http://www.ejournal.unja.ac.id., on October 28th
, 2017 at 10.50 a.m.

37
Based on descriptions above, the researcher hopes the Make a Match
Technique can increase the students‟ reading comprehension and can
complete the previous research. So, the researcher wants to research about
“The Effect of Make a Match Technique on Students‟ Reading
Comprehension at XI Grade of MAN 1 Padangsidimpuan”.
C. Framework of Thinking
Technique in teaching reading comprehension is the important thing
must be considered by the teacher to succeed the learning reading
comprehension. The teacher must choose the suitable technique for the
students, so they are not easy to feel bored when following the reading
comprehension lesson. For Senior High School‟s students, the teacher can
choose the technique which does not only ask them to learn but also they can
play. By mixing learning and playing, the students will be more enthusiasm in
learning reading comprehension.
Make a Match is one of the technique that can be applied in teaching
reading comprehension. By using Make a Match technique will make the
students easier to get information from the text. They will be divided into two
groups, pairs, or in individually. So, they can enjoy and share their knowledge
about the concept or subject matter to each other. Thus, the researcher
assumed that with using of good technique students can understand about the
text easily and quickly. So, the researcher conducts a research based on the
framework as below:

38
D. Hypothesis
The hypothesis has purpose to answer a certain specific question.
Based on formulation of the problem above. L.R. Gay says that a hypothesis
is a tentative prediction result of the research findings.52
While, Suharsimi
Arikunto states that hypothesis is a provisional answer of result problem in a
52
L.R. Gay and Peter Airasian, Educational Research: Competencies for Analysis and
Application, (America: Prentice Hall, 2000), p. 71.
Make a Match Technique
Pre-test
Control class with
Conventional Technique
Experimental class with
Make a Match Technique
H0 = Rejected Ha = Accepted
Post-test
Hypothesis
The students are difficult to comprehend the text, easy to feel
bored and also did not know the technique reading comprehension
when they are reading

39
research.53
So, it can be concludes that hypothesis is provisional answer of
prediction result in a research. The hypothesis of this research are:
1. There is the significant effect of Make a Match technique on
students‟ reading comprehension at XI grade of MAN 1
Padangsidimpuan (Ha).
2. There is no the significant effect of Make a Match technique on
students‟ reading comprehension at XI grade of MAN 1
Padangsidimpuan (H0).
53
Suharsimi Arikunto, Prosedur Penelitian Suatu Pendekatan Praktik, (Jakarta: PT. Rineka
Cipta, 2006), p.110.

40
CHAPTER III
RESEARCH METHODOLOGY
A. The Place and Time of the Research
The research was done at MAN 1 Padangsidimpuan. It is located on
Sutan Soripada Mulia Street, No. 31 C Padangsidimpuan Utara.
Then, The time of the research was from October 03rd
, 2016 until
September 25th
, 2017.
B. The Research Design
The kind of this research was quantitative research with experimental
method. Experimental research is the type of research that can test hypotheses
to establish cause and effect relationships.1 It meant that the experimental
research has purpose to find out the significant effect of a treatment on
dependent variable. Dependent variable here was reading comprehension and
the treatment is Make a Match technique.
The researcher used two classes in this research. One of the class was
taught with Make a match technique and called as Experimental class.
Meanwhile the other class was not (be taught with conventional technique)
and called as Control class. It was done to know the effect of using treatment
in experimental class.
1L.R Gay and Peter Airasian, Educational Research: Competencies for Analysis and
Application, (America: Prentice Hall, 2000), p. 367.
40

41
Based on using control and experimental class, the research design that
was used „true experimental design‟. The design which used was Pretest-
Posttest Control Group Design. It meant there were two classes chosen
randomly, then gave pre-test to know the basic condition of the two classes.
Next, after teaching reading comprehension with different implementation,
the both of classess were given post test. The result of the test was compared
to know the different effect of treatment to experimental class. The research
design of this research can be seen in the following table:
Table 1. Research Design
(Pretest-Posttest Control Group Design)
Where:
R = The sample of the research
O1 = Pretest in experimental class
O2 = Posttest in experimental class
X = Treatment
O3 = Pretest in control class
O4 = Posttest in control class2
C. The Population and Sample
1. Population
Gay and Airasian stated that population is the group of interest to
the researcher, the group to which she or he would like the results of the
study to be generalizable. Generalizability is the extent to which the result
2Sugiyono, Metode Penelitian Pendidikan; Pendekatan Kuantitatif, Kualitatif, dan R&D,
(Bandung: Alfabeta, 2008), p. 112-113.
R O1 X O2
R O3 O4

42
of the study can be applied to other populations or situations.3 In addition,
population is the universe of people to which the study could be
generalized.4 It meant that the population of this research was all of the XI
MIA class of MAN 1 Padangsidimpuan. It consisted of 8 classes with
students. It can be seen in the following table:
Table 2. The Population of the grade XI MIA students
of MAN 1 Padangsidimpuan
No. Class Students
1 XI MIA 1 40
2 XI MIA 2 42
3 XI MIA 3 40
4 XI MIA 4 40
5 XI MIA 5 42
6 XI MIA 6 40
7 XI MIA 7 42
8 XI MIA 8 42
Total 328
Sources: Total of students at XI MIA Grade of MAN 1
Padangsidimpuan T.A 2017-2018
2. Sample
Sample is representative whole of population. According to Gay
and Airasian, a sample comprises the individuals, items or events selected
from a larger group referred to as a population.5 In addition, sample is the
subset of people from the population who will participate in the current
3L.R Gay and Peter Airasian, Op.Cit., p. 122.
4Scott W. Vanderstoep and Deirdre D. Johnston, Research Methods for Everyday Life:
Blending Qualitative and Quantitative Approaches, (San Fransisco: Jossey Bass, 2009), p. 26. 5L.R Gay and Peter Airasian, Op.Cit., p. 121.

43
study.6 So, it can be concluded that sample was the representation and
image of the population.
In this research, the researcher chose two classes as a sample. They
were divided into experimental class and control class. To take the
representative sample from the populations, researcher used simple
random sampling. As explained in research design that in Pretest-Posttest
Control Group Design, the researcher took the sample randomly.
Sugiyono said that simple random sampling is a technique to take sample
from the population that is done randomly without paying attention to the
strata in the population. This way is done when the members of population
is homogenous.7 To know the homogeneity of the samples, researcher did
homogeneity and normality test.
In this research, the researcher used simple random sampling.
Before use simple random sampling, the researcher used normality and
homogeneity test, as follow:
a. Normality test
Normality test used to know whether the data of research
is normal or not. The researcher used normality test with using
Chi-Quadrate, as follow:
(
)2
6Scott W. Vanderstoep and Deirdre D. Johnston, Op.Cit., p. 26.
7Sugiyono, Op.Cit., p. 120.

44
Where:
x2 = Chi-Quadrate
f0 = Frequency is gotten from the sample/result of
observation (questioner)
fh = Frequency is gotten from the sample as image
from frequency is hoped from the population8
To calculate the result of Chi-Quadrate, it was used
significant level 5% (0,05) and degree of freedom as big as
total of interval class is lessened 1 (df=k-1). If result x2count <
x2
table. So, it can be concluded that data is distributed normal.
b. Homogeneity test
Homogeneity test used to know whether control class and
experimental class have the same variant or not. If both of
classes are same, it was can be called homogeneous.
Homogeneity is the similarity of variance of the group will be
compared. So, the homogeneity test has function to find out
whether the data homogent or not. It used Harley test, as follow:
F =
Where:
n1 = Total of the data that bigger variant
n2 = Total of the data that smaller variant9
Hypothesis is rejected if F ≤ F
a(n1-1) (1=n2-1), while
if Fcount > Ftable hypothesis is accepted. It determined with
8Anas Sudjiono, Pengantar Statistik Pendidikan, (Jakarta: PT. Raja Grafindo Persada, 1995),
p. 353. 9Sugiyono, Op.Cit., p. 275.

45
significant level 5% (0.05) and dk numerator was (n1-1), while
dk deminators is (n2-1).
Based on the explanation above, the researcher had given
pre-test to three classes (XI MIA 2, XI MIA 3, and XI MIA 4),
to know whether the samples are homogenous and normal or
not. After calculating the data, the researcher had found that the
three classes were homogenous and normal (see appendix 17
and 18). So, the researcher chose two classes as the sample.
These two classes had same total of students. They were XI
MIA 3 and XI MIA 4. The both classes consisted of 40
students. Here was the sample:
Table 3. Sample of the Research
Sample Class Total
Experimental Class XI MIA 3 40
Control Class XI MIA 4 40
Total 80
D. The Definition of Operational Variables
The terms were used in this research were as follow:
1. Reading Comprehension
Reading comprehension is a process in which the readers try to
understand the meaning in the text by interpreting what have been read in
order to find the information or idea given by the writer.

46
2. Make a Match Technique
Make a Match technique is a teacher‟s way to teach subject matter
that use cards which contains question and answer form with suitable topic
in teaching learning process.
E. The Instrument of Collecting Data
Instrument is very important to support every research. This research
makes test as the instrument to collect the data of students‟ reading
comprehension. The researcher used multiple choice test. According to
Brown, multiple choice items, “which may on the surface appear to be simple
items to construct”10
It meant that multiple choice test is suitable to test
reading comprehension. In this research the test consisted of 100 questions,
which consisted of 50 questions for Pre test and 50 questions for Post test. The
test gave for each student to find out the scores of each students answer. The
researcher gave 2 scores for each items and maximum score of test was 100.
Here was the indicators of the instrument:
Table 4. The Indicators of Reading Comprehension Pre-Test
No Indicators Items Number of
Items Score
Total
Score
1
Students are able to
identify the topic
from the text
3 1, 21, 35 2 6
2
Students are able to
identify main idea
from the text
5 4, 15, 23, 38,
46 2 10
10
H. Douglas Brown, Language Assessment Practical and Language Practice, (San Francisco:
Longman, 2003), p. 67.

47
3
Students are able to
identify information
that needed
20
2, 6, 7, 10, 12,
14, 18, 20, 25,
26, 27, 30, 32,
34, 37, 41, 42,
44, 47, 50
2
40
4
Students are able to
identify vocabulary
from the text
19
3, 5, 8, 9, 11,
13, 17, 19, 22,
24, 28, 29, 31,
36, 39, 40, 43,
45, 49
2
38
5
Students are able to
identify conclusion
from the text
3 16, 33, 48 2
6
Total 100
Table 5. The Indicators of Reading Comprehension Post-Test
No Indicators Items Number of
Items Score
Total
Score
1
Students are able to
identify the topic
from the text
3 1, 18, 33 2 6
2
Students are able to
identify main idea
from the text
5 2, 11, 27, 41,46 2 10
3
Students are able to
identify information
that needed
20
4, 6, 7, 8, 9, 12,
14, 20, 22, 25,
26, 28, 30, 37,
38, 40, 42, 45,
48, 49
2
40
4
Students are able to
identify vocabulary
from the text
19
3, 5, 10, 13, 16,
17, 19, 21, 23,
24, 29, 32, 34,
35, 36, 39, 43,
44, 47
2
38
5
Students are able to
identify conclusion
from the text
3 15, 31, 50 2
6
Total 100

48
F. The Validity and Reliability of Instrument
1. Validity of Instrument
Validity is the most important quality of a test. It is the degree to
which a test measures what it is supposed to measure and consequently
permits appropriate interpretations of the test. Scott and Deirdre stated that
a measure shows validity if it actually measures what it claims or intended
to measure.11
Validity also concerns the extent to which the uses that are
made of assessment are appropriate. So, in testing students‟ reading
comprehension, the instrument must be valid.
This research used item validity. Item validity is a part of the test as
a totality to measure the test by items. The kind of test is multiple choice
test. The test consist of 140 items that was divided into two groups. They
were 70 for pre-test and 70 for post-test.
To know the validity of the each question, it refered to list r biserial
with r in 5% significant: 0.413 and 1% significant: 0.526. So, if rcount >
rtable the test is classified valid.
So, to get the validity of test, the formula of r pointbiserial used was
as follow:
rpbi
√
Where:
rpbi = Coefficient item validity
Mp = Mean score of the total score of the students answer correctly
Mt = Mean score of the total score that achieved success by
member of the test
11
Scott W. Vanderstoep and Deirdre D. Johnston, Op.Cit., p. 59.
49
SDt = Standard deviation of the total score
p = Presentation of the right answer of the item tested validity
q = Presentation of the wrong answer of the item tested validity12
Based on the calculation result of the validity test for pre test, 57
items were valid, and 13 items was invalid. Meanwhile, from the post test
validity the researcher got 54 items with result valid, and there were 16
invalid items. From the both, the researcher took 50 items each for pre
test and post test. (See appendix 8 and 11).
2. Reliability of Instrument
Besides validity, reliability of instrument is also very important in a
research. An instrument of the research must be reliable. Reliability is the
degree to which a test consistently measures whatever it measures.
Reliability is express numerically, usually as a coefficient ranging from
0.0 to 1.0; a high coefficient ranging indicates high reliability.13
To get reliability of the test, the researcher used K-R.20 formula.
The formula was as follow:
R11 = (
) (
)
Where:
R11 = Reliability of the instrument
k = Total of question
St = Variants total
∑pq = Total of the result times p and q
p = Proportion of subject who is right answer
12
Hartono, Statistik Untuk Penelitian, (Yogyakarta: Pustaka Pelajar , 2004), p. 113. 13
L.R. Gay and Peter Airasian, Op.Cit., p. 155.

50
q = Proportion of subject who is wrong answer14
Reliability is good character of the test that refers to the consistency
of the measurement. The test is reliable if rcount > rtable by using
formulation K-R. 20 with rtable 0.70. (See appendix 13 and 15).
G. The Procedures of Research
In collecting data the researcher used to test for students. The kind of
the test was multiple choice test. The test divided into two kind; pre-test and
post test. The procedures as bellow:
1. Pre-test
It was a test that gave before doing the treatment to the
students. It was needed to know the students‟ ability in experiment
and control class before the researcher gave the treatment to
experiment class. It was also used to find out the homogenity and
normality level of the sample. The researcher used some steps in
giving pre-test. They were:
a. Prepared 50 items of the multiple choice test.
b. Distributed the test paper to both of classes; experiment and
control class.
c. Explained what the students need to do.
d. Gave the time to the students to answer the questions.
14
Suharsimi Arikunto, Dasar-dasar Evaluasi Pendidikan, Edisi 2, (Jakarta: Bumi Aksara,
2012), p.115.

51
e. Collected the students‟ test paper.
f. Checked the answer of students and counts the students‟
score.
2. Treatment
After giving the pre-test, the students gave the treatment. The
experimental class taught by using Make a Match technique, while
the control class taught by conventional strategy. The researcher
had some procedure in treatment class. They were:
a. For the beginning, researcher started the learning activity
with greeting. Then, asked students to take a pray. Next,
explained the indicators and gave them motivation.
b. Gave the text to students.
c. Announced the rules in Make a match technique.
d. Gave the cards which contains of material about texts.
Then, asksed each of students to take one card for one
person/ student to act out.
e. Each students reading the text and think of an answer or
question of card held.
f. Each of students act out to match that suitable with his/her
card.

52
g. The students join with his/her friends that get a suitable
card. Then, each of students can checking for what is their
answer the question in card is matching or not.
h. If their guessing is correct and before time is over, then
they got score a point.
i. Made summaries or conclusion about important
information from the text and the lesson.
3. Post-test
After giving treatment, the researcher conducted a post-test. It
was different test with the pre-test. This post-test was the final test
in the research, especially measuring the treatment, whether was an
effect or not of Make a match technique on students‟ reading
comprehension. After conducting the post-test, the researcher
analyzed the data. The researcher had some procedure. They were:
a. Prepared multiple choice test 50 items.
b. Distributed the paper of the test to students of experimental
class and control class.
c. Explained what the students need to do.
d. Gave the time to the students to answer the questions.
e. Collected the students‟ test paper.
f. Checked the answer of students and counts the students‟
score.

53
H. The Technique of Analyzing Data
The techniques of analyzing data that was used by the researcher were:
1. Requirement test
a. Normality Test
To know the normality, the researcher used Chi-Quadrate
formula. The formula is as follow:
(
)2
Where:
x2 = Chi-Quadrate
f0 = Frequency is gotten from the sample/result of
observation (questioner)
fh = Frequency is gotten from the sample as image
from frequency is hoped from the
population15
b. Homogeneity Test
To find the homogeneity, the researcher used Harley test.
The formula is as follow:
F =
Where:
n1 = Total of the data that bigger variant
n2 = Total of the data that smaller variant16
Hypothesis is rejected if F ≤ F
a(n1-1) (1=n2-1), while
if Fcount > Ftable hypothesis is accepted. It determined with
15
Anas Sudjiono, Op.Cit., p. 353. 16
Sugiyono, Op.Cit., p. 276.

54
significant level 5% (0.05) and dk numerator was (n1-1), while
dk deminators is (n2-1).
2. Hypothesis test
Hypothesis is the provisional result of the research. So, the
researcher needs to analyze the data which have been divided into
two groups: experimental class and control class. The data have
been analyzed by using t-test formula. The formula is as follow:
√(( )
( )
) ( )
Where:
Tt = t-test
M1 = The mean score of the experimental class
M2 = The mean score of the control class
n12 = Total number of the experimental class
n22 = Total number of the control class
S12 = Variant of experimental class
S22 = Variant of control class
17
17
Ibid., p. 273.

55
CHAPTER IV
THE RESEARCH RESULT
To analyze the data, the researcher has collected data through pre test and
post test in the both classes, experimental class and control class. To find out the
effect of Make a Match technique on students’ reading comprehension, the researcher
has calculated the data by using quantitative analysis. The researcher used the
formulation of t-test to test the hypothesis. Next, the researcher described the data as
follow:
A. Description of Data
1. Description of Data before Using Make a Match Technique
a. Score of Pre-test Experimental Class
As the experimental class, the researcher took class XI MIA 3.
Based on students’ answers in pre-test the researcher has calculated the
students’ score in appendix 17 and 18. Then, the researcher drawn the
table sum in the following:
Table 6. The Score of Experimental Class in Pre-test
Total 2542
Highest score 84
Lowest score 32
Mean 64.13
Median 64.73
Modus 64.22
Range 52
Interval 9
Standard deviation 12.11
Variant 138.36
55

56
Based on the table above, the total score of experimental class in
pre-test was 2542, mean was 64.13, median was 64.73, modus was 64.22,
range was 52, interval was 9, standard deviation was 12.11, and variant
was 138.36. The researcher got the highest score was 84 and the lowest
score was 32. Then, the calculation of the frequency distribution of the
students’ score in experimental class can be applied into table frequency
distribution as follow:
Table 7. Frequency Distribution of Experimental Class (Pre-test)
No Interval Mid Point F Percentages
1 32 – 40 36 2 5%
2 41 – 49 45 3 7.5%
3 50 – 58 54 6 15%
4 59 – 67 63 13 32.5%
5 68 – 76 72 9 22.5%
6 77 – 85 81 7 17.5%
i=9 - 40 100%
From the table above, it can be concluded that the most students
are in interval 59–67 (13 students/32.5%). The least of students is 32-40
(2 students/5%). Clear description of the data is presented in histogram on
the following figure:

57
Frequency
20
16
12
8
4
0
36 45 54 63 72 81 score
Figure 1. Histogram the Result Score of Students’ Reading
Comprehension in Experimental Class (Pre-test)
Based on the figure above, the frequency of students’ score from
32 up to 40 was 2; 41 up to 49 was 3; 50 up to 58 was 6; 59 up to 67 was
13; 68 up to 76 was 9; 77 up to 85 was 7. The histogram shows that the
highest interval (77-85) was 7 students, and the lowest interval (32-40)
was 2 students.
b. Score of Pre-Test Control Class
In pre-test of control class, the researcher calculated the result that
had been gotten by the students in answering multiple choice test. The
score of pre-test control class can be seen in the following table:

58
Table 8. The Score of Control Class in Pre-Test
Total 2480
Highest score 82
Lowest score 30
Mean 62.13
Median 62.73
Modus 62.22
Range 52
Interval 9
Standard deviation 12.16
Variant 153.44
Based on the table above, the total score of control class in pre-test
was 2480, mean was 62.13, median was 62.73, and modus was 62.22,
range was 52, interval was 9, standard deviation was 12.16, and variant
was 153.44. The researcher got the highest score was 82 and the lowest
score was 30. It can be seen on appendix 17. Then, the calculation of the
frequency distribution of the students’ score in control class can be
applied into table frequency distribution as follow:
Table 9. Frequency Distribution of Control Class (Pre-Test)
No Interval Mid Point Frequency Percentages
1 30 – 38 34 2 5%
2 39 – 47 43 3 7.5%
3 48 – 56 52 6 15%
4 57 – 65 61 13 32.5%
5 66 – 74 70 9 22.5%
6 75 – 83 79 7 17.5%
i = 9 - 40 100%
From the table above, it can be concluded that the middle interval
(57–65) had the biggest frequency (13 students/32.5%). The highest

59
interval (75–83) had 7 students and the lowest interval was (30 – 38) with
2 students.
In order to get description of the data clearly and completely, the
researcher presents them in histogram on the following figure:
Frequency
20
16
12
8
4
0
34 43 52 61 70 79 score
Figure 2. Histogram the Result Score of Students’ Reading
Comprehension in Control Class (Pre-test)
Based on the figure above, the frequency of students’ score from
30 up to 38 was 2; 39 up to 47 was 3 ; 48 up to 56 was 6; 57 up to 65 was
13; 66 up to 74 was 9; 75 up to 83 was 7.

60
2. Description of Data After Using Make a Match Technique
a. Score of Post-Test Experimental Class
The calculation of the result that had been gotten by the students
in answering the question (test) after the researcher did the treatment by
using Make a Match technique can be seen in the following table:
Table 10. The Score of Experimental Class in Post Test
Total 3046
Highest score 90
Lowest score 50
Mean 75.23
Median 75.75
Modus 75.19
Range 40
Interval 7
Standard deviation 9.63
Variant 94.85
Based on the table above, the total score of experimental class in
post-test was 3046, mean was 75.23, median was 75.75, modus was
75.19, range was 40, interval was 7, standard deviation was 9.63, and
variant was 94.85. The students’ highest score was 90 and the lowest
score was 50. It can be seen on appendix 20. Then, the calculation of the
frequency distribution of the students’ score in experiment class can be
applied into table frequency distribution as follow:

61
Table 11. Frequency Distribution of Students’ Score
No Interval Mid Point Frequency Percentages
1 50 – 56 53 2 5%
2 57 – 63 60 3 7.5%
3 64 – 70 67 6 15%
4 71 – 77 74 12 30%
5 78 – 84 81 9 22.5%
6 85 – 91 88 8 20%
i = 7 - 40 100%
From the table above, it can be concluded that the middle interval
(71–77) had the biggest frequency (12 students/30%). The highest
interval (85–91) had 8 students/20%, and the lowest interval was (50–56)
with 2 students/5%.
The researcher presents them in histogram as follow:
Frequency
20
16
12
8
4
0
53 60 67 74 81 88 score
Figure 3. Histogram the Result Score of Students’ Reading
Comprehension in Experimental Class (Post-test)

62
Based on the figure above, the frequency of students’ score from 50
up to 56 was 2; 57 up to 63 was 3; 64 up to 70 was 6; 71 up to 77 was 12;
78 up to 84 was 9; 85 up to 91 was 8. Then, the interval which had
highest frequency was 71-77 (12 students), and the interval which had
lowest frequency was 50-56 (2 students).
b. Score of Post-Test Control Class
As the control class, the researcher took class XI MIA 4. The result
that had been gotten by the students in answering the question (test) after
the researcher taught the reading comprehension by using conventional
technique can be seen in the following table:
Table 12. The Score of Control Class in Post-Test
Total 2756
Highest score 82
Lowest score 42
Mean 68.98
Median 69.01
Modus 68.31
Range 40
Interval 7
Standard deviation 8.11
Variant 77.73
Based on the above table the total score of control class in post-test
was 2756, mean was 68.98, median was 69.01, modus was 68.31, range
was 40, interval was 7, standard deviation was 8.11, and variant was
77.73. The researcher got the highest score was 82 and the lowest score
was 42. It can be seen on appendix 20. Then, the computed of the

63
frequency distribution of the students’ score in control class can be
applied into table frequency distribution as follow:
Table 13. Frequency Distribution of Students’ Score
No Interval Mid Point Frequency Percentages
1 42 – 48 45 1 2.5%
2 49 – 55 52 2 5%
3 56 – 62 59 4 10%
4 63 – 69 66 14 35%
5 70 – 76 73 12 30%
6 77 – 83 80 7 17.5%
i = 7 - 40 100%
From the table above, it can be concluded that the middle interval
(63–69) had the biggest frequency (14 students/35%). The highest
interval (77–83) had 7 students/17.5% and the lowest interval was (42–
48) with 1 student/2.5%.
For the clear description of the data, the researcher presents them in
histogram on the following figure:
Frequency
20
16
12
8
4
0
45 52 59 66 73 80 score
Figure 4. Histogram the Result Score of Students’ Reading
Comprehension in Control Class (Post-test)
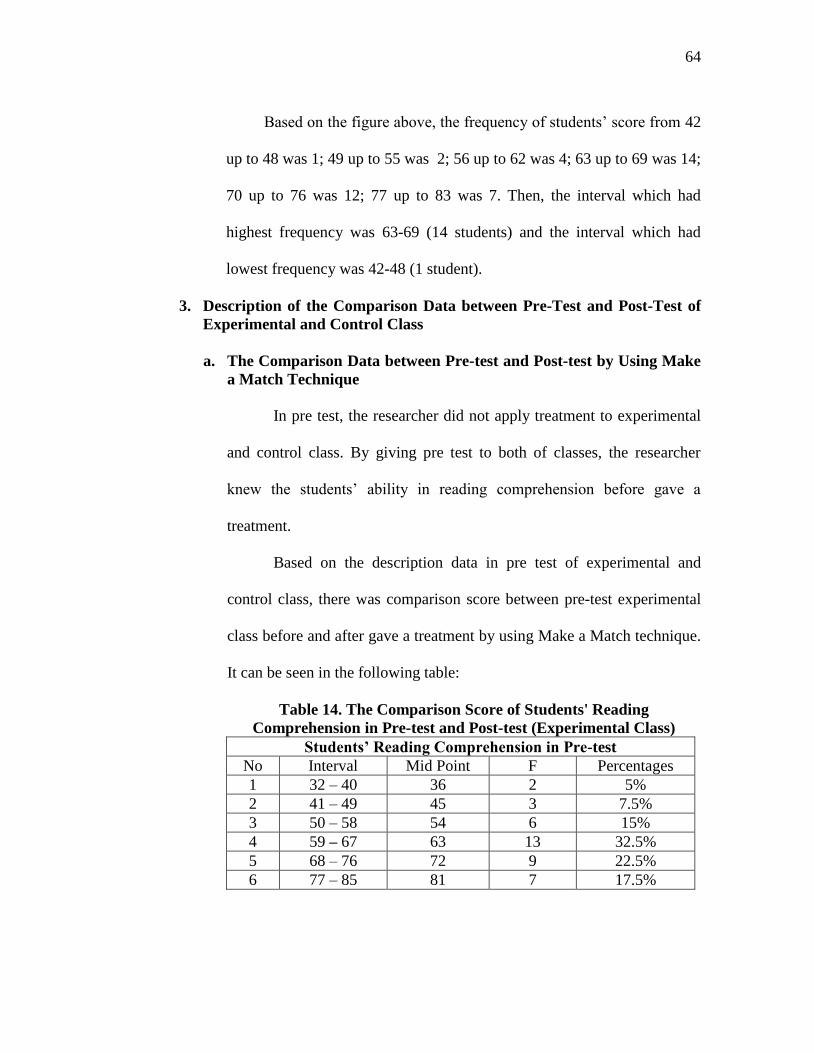
64
Based on the figure above, the frequency of students’ score from 42
up to 48 was 1; 49 up to 55 was 2; 56 up to 62 was 4; 63 up to 69 was 14;
70 up to 76 was 12; 77 up to 83 was 7. Then, the interval which had
highest frequency was 63-69 (14 students) and the interval which had
lowest frequency was 42-48 (1 student).
3. Description of the Comparison Data between Pre-Test and Post-Test of
Experimental and Control Class
a. The Comparison Data between Pre-test and Post-test by Using Make
a Match Technique
In pre test, the researcher did not apply treatment to experimental
and control class. By giving pre test to both of classes, the researcher
knew the students’ ability in reading comprehension before gave a
treatment.
Based on the description data in pre test of experimental and
control class, there was comparison score between pre-test experimental
class before and after gave a treatment by using Make a Match technique.
It can be seen in the following table:
Table 14. The Comparison Score of Students' Reading
Comprehension in Pre-test and Post-test (Experimental Class)
Students’ Reading Comprehension in Pre-test
No Interval Mid Point F Percentages
1 32 – 40 36 2 5%
2 41 – 49 45 3 7.5%
3 50 – 58 54 6 15%
4 59 – 67 63 13 32.5%
5 68 – 76 72 9 22.5%
6 77 – 85 81 7 17.5%

65
Students’ Reading Comprehension in Post-test
No Interval Mid Point Frequency Percentages
1 50 – 56 53 2 5%
2 57 – 63 60 3 7.5%
3 64 – 70 67 6 15%
4 71 – 77 74 12 30%
5 78 – 84 81 9 22.5%
6 85 – 91 88 8 20%
From the table above, it can be concluded that the highest interval
score in pre-test experimental class was 77-85 (7 students/17.5%) and the
lowest interval score was 32-40 (2 students/5%), meanwhile the highest
interval score in post-test was 85-91 (12 students/30%) and the lowest
score was 50-56 (2 students/5%).
In order to get description of the data clearly and completely, the
researcher presents them in histogram on the following figure:
Frequency
Pre-test
Post-test
8
36 53 45 60 54 67 63 74 72 81 81
Figure 5. Histogram the Comparison Data of Students’ Reading
Comprehension in Pre-test and Post-test (Experimental Class)
16
20
12
score 88
0
4

66
Based on the figure above, the frequency of students’ score of
experimental class from 32 up to 40 (2 students/5%) in pre-test, and 50 up
to 56 (2 students/5%) in post-test; 41 up to 49 (3 students/7.5%) in pre-
test, and 57 up to 63 (3 students/7.5%) in post-test; 50 up to 58 (6
students/15%) in pre-test, and 64 up to 70 (6 students/15%) in post-test;
59 up to 67 (13 students/32.5%) in pre-test, and 71 up to 77 (12
students/30%) in post-test; 68 up to 76 (9 students/22.5%) in pre-test, and
78 up to 84 (9 students/22.5%) in post-test; 77 up to 85 (7
students/17.5%) in pre-test, and 85 up to 91 (8 students/20%) in post-test.
Then, the interval which had highest frequency in pre test was 59-
67 (13 students/32.5%) and the interval which had lowest frequency was
32-40 (2 students/5%). In post test of experimental class, the interval
which had highest frequency was 71-77 (12 students/30%) and the
interval which had lowest frequency was 50-56 (2 students/5%).
b. The Comparison Data between Pre-test and Post-test by Using
Conventional Technique
Based on the description data in pre-test and post-test of control
class, there was the comparison score between pre-test control class
before and after gave a treatment by using Conventional technique. It can
be seen in the following table:

67
Table 15. The Comparison Score of Students’
Reading Comprehension in Pre-test and Post-test (Control Class)
Students’ Reading Comprehension in Pre-test
No Interval Mid Point Frequency Percentages
1 30 – 38 34 2 5%
2 39 – 47 43 3 7.5%
3 48 – 56 52 6 15%
4 57 – 65 61 13 32.5%
5 66 – 74 70 9 22.5%
6 75 – 83 79 7 17.5%
Students’ Reading Comprehension in Post-test
No Interval Mid Point Frequency Percentages
1 42 – 48 45 1 2.5%
2 49 – 55 52 2 5%
3 56 – 62 59 4 10%
4 63 – 69 66 14 35%
5 70 – 76 73 12 30%
6 77 – 83 80 7 17.5%
From the table above, it can be concluded that the highest interval
score in pre-test control class was 77-83 (7 students/17.5%) and the
lowest interval score was 30-38 (2 students/5%), meanwhile the highest
interval score in post-test was 77-83 (7 students/17.5%), and the lowest
score was 42-48 (1 student/2.5%).
For the clear description of the data, the researcher presents them
in histogram on the following figure:

68
Frequency
Pre-test
Post-test
8
0
34 45 43 52 52 59 61 66 70 73 79
Figure 6. Histogram the Comparison Data of Students’ Reading
Comprehension in Pre-test and Post-test (Control Class)
Based on the figure above, the frequency of students’ score of
contol class from 30 up to 38 (2 students/5%) in pre test, and 42 up to 48
(1 student/2.5%) in post-test; 39 up to 47 (3 students/7.5%) in pre-test,
and 49 up to 55 (2 students/5%) in post-test; 48 up to 56 (6 students/15%)
in pre-test, and 56 up to 62 (4 students/10%) in post-test; 57 up to 65 (13
students/32.5%) in pre-test, and 63 up to 69 (14 students/35%) in post-
test; 66 up to 74 (9 students/22.5%) in pre-test, and 70 up to 76 (12
students/30%) in post-test; 75 up to 83 (7 students/17.5%) in pre-test, and
77 up to 83 (7 students/17.5%) in post-test.
Then, the interval which had highest frequency in pre test was 57-
65 (13 students/32.5%)) and the interval which had lowest frequency was
30-38 (2 students/5%). In post test of contol class, the interval which had
16
20
12
80 score
4

69
highest frequency was 63-69 (14 students/35%) and the interval which
had lowest frequency was 42-48 (1 student/2.5%).
c. The Comparison Data between Using Make a Match and
Conventional Technique in Post-test
By giving pre test to both of classes (XI MIA 3 as experimental
class and XI MIA 4 as control class), the researcher knew the students’
ability in reading comprehension before gave a treatment. In pre test, the
researcher did not apply treatment to experimental and control class. After
that, the researcher gave a treatment to one of class as experimental class
and other class was not gave a treatment as control class. The
experimental class by using Make a Match technique and control class by
using Conventional technique. The researcher got the comparison data
between post-test score an experimental and control class after gave a
treatment. The comparison data it can be seen in the following table:
Table 16. The Comparison Score of Students’ Reading Compehension
in Experimental and Control Class (Post-test)
Students’ Reading Comprehension in Post-test (Experimental Class)
No Interval Mid Point Frequency Percentages
1 50 – 56 53 2 5%
2 57 – 63 60 3 7.5%
3 64 – 70 67 6 15%
4 71 – 77 74 12 30%
5 78 – 84 81 9 22.5%
6 85 – 91 88 8 20%
Students’ Reading Comprehension in Post-test (Control Class)
No Interval Mid Point Frequency Percentages
1 42 – 48 45 1 2.5%
2 49 – 55 52 2 5%
3 56 – 62 59 4 10%

70
4 63 – 69 66 14 35%
5 70 – 76 73 12 30%
6 77 – 83 80 7 17.5%
From the table above, it can be concluded that the highest interval
score in post test of experimental class was 85-91 (12 students/30%) and
the lowest interval score was 50-56 (2 students/5%), meanwhile the
control class was 77-83 (7 students/17.5%), and the lowest interval score
was 42-48 (1 student/2.5%).
For the clear description of the data is presented in the histogram
comparison between description data post test of experimental and control
class on the following figure:
Frequency
Experimental Class
Control Class
8
4
0
53 45 60 52 67 59 74 66 81 73 88
Figure 7. Histogram the Comparison Data of Students’ Reading
Comprehension in Experimental and Control Class (Post-test)
16
20
12
80 score

71
Based on the figure above, it can be concluded that the frequency
of students’ score in post test from 50 up to 56 (2 students/5%) for
experimental class, and 42 up to 48 (1 student/2.5%) for control class; 57
up to 63 (3 students/7.5%) for experimental class, and 49 up to 55 (2
students/5%) for control class; 64 up to 70 (6 students/15%) for
experimental class, and 56 up to 62 (4 students/10%) for control class; 71
up to 77 (12 students/30%) for experimental class, and 63 up to 69 (14
students/35%) for control class; 78 up to 84 (9 students/22.5%) for
experimental class, and 70 up to 76 (12 students/30%) for control class;
85 up to 91 (8 students/20%) for experimental class, and 77 up to 83 (7
students/17.5%) for control class.
Then, the interval which had highest frequency in post test of
experimental class was 71-77 (12 students/30%) and the interval which
had lowest frequency was 50-56 (2 students/5%). In post test of contol
class, the interval which had highest frequency was 63-69 (14
students/35%) and the interval which had lowest frequency was 42-48 (1
student/2.5%).
From the description of comparison data above, it can be conluded
that the students’ scores of experimental class by using Make a Match
technique was higher than the students’ score of control class by using
Conventional technique.

72
B. Data Analysis
1. Requirement Test
a. Normality and Homogeneity of Experimental and Control Class in Pre-
Test
Table 17. Normality and Homogeneity in Pre-Test
Class Normality Test Homogeneity Test
x2
count x2
table fcount ftable
Experimental Class 1.027 11.070 1.12 < 4.10
Control Class 1.694 11.070
Based on the table above, the score of experiment class Lo = 1.027<
Lt = 11.070 with n = 40 and control class Lo = 1.694< Lt = 11.070 with n =
40, and real level 0.05. Cause Lo < Lt in the both class. So, Ha was
accepted. It means that experiment class and control class were distributed
normal. It can be seen in appendix 17.
The coefficient of Fcount = 1.12 was compared with Ftable. Where Ftable
was determined at real α 0.05, and the different numerator dk = N-1 = 40-1 =
39 and denominator dk N-1 = 40–1 = 39. So, by using the list of critical
value at F distribution is got F0.05 = 4.10. It showed that Fcount 1.12 < Ftable
4.10. It shows that both experimental and control class were homogeneous.
The calculation can be seen on the appendix 18.
b. Normality and Homogeneity of Experimental and Control Class in Post-
Test
Table 18. Normality and Homogeneity in Post-Test
Class Normality Test Homogeneity Test
x2
count x2
table fcount ftable
Experimental Class 1.324 11.070 1.22 < 4.10
Control Class 0.783 11.070

73
The previous table shows that the score of experimental class Lo =
1.324 < Lt = 11.070 with n = 40 and control class Lo = 0.783< Lt = 11.070
with n = 40, and real level 0.05. Because Lo < Lt in the both class, it
means Ha was accepted. It meant that experiment class and control class
were distributed normal. The calculation can be seen in appendix 20.
The coefficient of Fcount= 1.22 was compared with Ftable. Where Ftable
was determined at real α 0.05, and the different numerator dk = N-1 = 40-1 =
39 and denominator dk N-1 = 40-1 = 39. So, by using the list of critical
value at F distribution is got F0.05 = 4.10. It showed that Fcount 1.22 < Ftable
4.10. So, the researcher concluded that the variant from the data of the
students’ reading comprehension at XI grade of MAN 1 Padangsidimpuan in
experimental and control class was homogenous. The calculation can be seen
on the appendix 21.
2. Hypothesis Testing
After calculating the data of post-test, researcher has found that post-test
result of experimental and control class is normal and homogenous. The data
would be analyzed to prove the hypothesis. It used formula of t-test. Hypothesis
of the research was “Make a Match technique has significant effect on reading
comprehension at XI grade of MAN 1 Padangsidimpuan”. The calculation can
be seen on the appendix 22 and 23. The result of t-test was as follow:

74
Table 19. The Result of T-test from the Both Averages
Pre-test Post-test
tcount ttable tcount ttable
0.740 2.000 3.009 2.000
The test hypothesis have two criteria. First, if tcount < ttable, H0 is accepted.
Second, tcount > ttable, Ha is accepted. Based on researcher calculation in pre
test, researcher found that tcount 0.740 while ttable 2.000 with opportunity (1 –
α ) = 1 - 5% = 95% and dk = n1 + n2 – 2 = 40 + 40 – 2 = 78. Cause tcount < ttable
(0.740 < 2.000), it meant that hypothesis Ha was rejected and H0 was accepted.
So, in pre test, the two classes were same. There is no difference in the both
classes. But, in post test, researcher found that tcount 3.009 while ttable 2.000
with opportunity (1 – α ) = 1 - 5% = 95% and dk = n1 + n2 – 2 = 40 + 40 – 2 =
78. Cause tcount > ttable (3.009 > 2.000), it meant that hypothesis Ha was
accepted and H0 was rejected. The calculation can be seen on the appendix 23.
In this case, the mean score of experimental class by using Make a Match
technique was 75.23 and mean score of control class was 68.98 that was
taught by using conventional technique. So, there was the significant effect of
Make a Match technique on students’ reading comprehension at XI grade of
MAN 1 Padangsidimpuan.
C. Discussion
The researcher discussed the result of this research and compared with the
related findings. It also discussed with the theory that has been stated by the
researcher. Related to the theory from Roebl, definition of reading

75
comprehension is an ability to understand what the readers read where words
have context and texts have meaning.1 Then, Anita Lie stated that Make a Match
is one of simple cooperative learning technique. This technique is adaptable to
most all subject and grade level. This technique was a teacher’s way to teach
subject matter by using cards.2 Besides it, this technique can also give advantages
for students. They are; it can develop understanding of material or subject matter
because the materials of teaching are easy, can motivate students to encourage
help each other master skill presented by the teacher, an effective technique in
teaching reading comprehension because the students more active study and
make a learning process become fun and learning material to understand easily.3
So, it has proven that the Make a Match technique was suitable to teach students’
reading comprehension and has significant effect on students’ reading
comprehension.
Based on the related findings, Sri Wahyuni said that Make a Match
technique suitable to teach reading comprehension, Make a Match teaching
technique can increase students’ reading comprehension because teaching
learning process in the classroom become fun. So, it was make the class more
active study and the students to undestand material easily.4 It meant that the
1K.M. Roebl, Developing Reading Comprehension Skill in EFL, (Taiwan: St. Jhon’s University,
2003), p.177. 2Anita Lie, Cooperative Learning,(Jakarta: PT. Grasiondo, 2008), p. 55.
3Istarani, 58 Model Pembelajaran Inovatif, (Medan: Media Persada, 2014), p.65.
4Sri Wahyuni, The Effectiveness of Using Make a Match Technique in Teaching Reading
Comprehension to the First Grade Students of SMP Negeri 2 Sulang, Rembang, retrived from
http://www.lib.unnes.ac.id., on October 28th
, 2017 at 10.00 a.m.

76
application of Make a Match technique was suitable to teach the students’
reading comprehension.
Next, Asri Pratiwiningsih said that used Make a Match technique can
increase the students’ reading comprehension. It can be seen that the students
ability in identifying information from the text more easily because they are
learning by using several cards and the class more enjoyable. So, the score of
students’ reading comprehension after using Make a Match technique was higher
than before using Make a Match technique.5 It meant that the Make a Match
technique suitable to teach students’ reading comprehension in Report text.
Then, Sri Alvera Ayu, said that Make a Match technique suitable to teach
reading comprehension. The students became easier in understanding a text,
remembering words or sentence and they also knew the deep meaning of the
words that have been learned. Besides it, the students were so enthusiastic to
follow in reading comprehension lesson because it was presented with those
several cards.6 So, the implication of Make a Match technique was suitable to
teach students’ reading comprehension and give a positive effect on students’
reading comprehension.
5Asri Pratiwiningsih, The Effectiveness of Make a Match Technique in Teaching Reading
Comprehension Report Text at XI Grade SMA Negeri 1 Ngimbang Lamonan, retrived from
http://www.ejournal.stkipjb.ac.id /indexphp/AS/article/download/225/161/pdf., on October 14th
, 2016
at 04.20 p.m. 6Sri Alvera Ayu, The Effect of Using Make a Match Technique on Students’ Reading
Comprehension of Recount Text at the Tenth Grade SMA Xaverius 2 Jambi, retrieved from
http://www.ejournal.undiksha.ac.id., on October 28th
, 2017 at 10.50 a.m.

77
The research result and the theory has proven that this technique is good
where the students were so enthusiastic to follow in reading comprehension
lesson because it was presented with those several cards. The students directly
had spirit when they were asked to find out their partner that match with their
each card. They didn’t mind to translate all of word or sentences in the text, feel
bored when they were asked to read full text and answer the questions. So, it was
a proud while looking them think hard, but still enthutiastic, to find out some
answer from the questions about the topic from the text, main idea, information,
meaning from the vocabulary, and conclusion from the text related to cards that
they hold on. They became easier in understanding a text, remembering words or
sentence and they also knew the deep meaning of the words that have been
learned.
This proofs show that Make a Match technique is suitable to be applied in
teaching reading comprehension. So, Make a Match technique has given the
effect to the research that has been done by the researcher or the other researcher
who mentioned in related findings.
D. Limitation of the Research
The research was limited in some situations. It was the problems in the
class that appeared during doing the research, but the researcher couldn’t hold or
improve those things. The limitation of the research was as follow:

78
1. The researcher was not sure whether all of students in the experimental class
and control class did the test honestly. There was a possibility that some of
them answered the test by copying or imitating their friends’ answer.
2. The students were noisy while in learning process. They were not
concentrating in following the learning process. Some of them talked to their
friends and some of them did something outside the teacher’s rule. Of course
it made them can not get the teacher’s explanation well and gave the impact
to the post-test answer.
3. It was also a possibility that some of students were not too serious in
answering the pre-test and post-test. It may caused by the test, because they
knew before that the test would not influence their score in the school. It
made them answer the test without thinking hard and the answer of the test
was not pure because they did not do it seriously.

79
CHAPTER V
CONCLUSION AND SUGGESTION
A. Conclusion
Based on the result of the research, the conclusions of this research are:
1. Before using Make a Match technique, the students’ mark in reading
comprehension was unsatisfied. The mean score of pre-test for the
experimental class that used Make a Match technique was 64.13.
2. After using Make a Match technique, the mean score of experimental
class was higher than before using Make a Match technique. The
mean score of post-test for the experimental class was 75.23.
3. The researcher found the research result of t-test where t0 was higher
than tt. t0 was 3.009 and tt was 2.000 (3.009 > 2.000). It meant that
there was a significant effect of Make a Match technique on students’
reading comprehension at XI grade of MAN 1 Padangsidimpuan
where Ha was accepted and H0 was rejected.
B. Suggestion
After finishing the research, the reseracher got many informations in
English teaching and learning. Therefore, from that experience, the researcher
saw some things need to be improved. It makes the researcher give some
suggestions, as follow:
79

80
1. From the research result it can be seen that the students’ score were
unsatisfied. So, the researcher hopes to the English teacher of MAN 1
Padangsidimpuan to apply various innovative technique in teaching
English. It also can be supported by choosing right media and good class
management. Besides it, it is also important for students to follow learning
process seriously, because the success of learning is in students’ result.
2. From the second conclusion, it can be seen that the experimental class
which was taught by using Make a Match technique, got the improvement
from 64.13 to 75.23 meanwhile the control class which was not taught by
Make a Match technique got the improvement from 62.13 to 68.98. So, the
researcher suggests to the English teacher of MAN 1 Padangsidimpuan to
use this technique in teaching reading comprehension.
3. From the last conclusion, it can be seen that score of experimental class
was higher than control class. The researcher suggests to use Make a Match
technique in the both classes. So, the control class will have same result.
Besides it, it is also hoped to be used in another classes, or in different
grade, even in another schools, because of the improvement that has been
made by using this technique. So, it is hoped, that Make a Match technique
can increase students’ reading comprehension in larger area. Besides, the
teacher and the other researcher who wants to apply this technique are
hoped to manage the class well during the application of Make a Match
technique. For the other researchers, to develop the findings of this

81
research largely by adding variables, enlarging sample, or making
combination in research approach.
82
REFERENCES
Afnita, Warni. Private Interview. recorded on October 1st 2016, at 11.00 a.m.,
in MAN 1 Padangsidimpuan.
Agus, Suprijono. Cooperative Learning, Teori dan Aplikasi PAIKEM.
Yogyakarta: Pustaka Pelajar. 2012.
Anas, Sudjiono. Pengantar Statistik Pendidikan. Jakarta: PT. Raja Grafindo
Persada. 1995.
Anita, Lie. Cooperative Learning. Jakarta: PT. Grasindo. 2008.
Arifah and Kusumarasdyati. The Effectiveness of Make a Match Technique
for Teaching Writing Descriptive Text to the Seventh Graders of SMP N
1 Karangbinangun Lamongan. Retrived from http://www.ejournal.
unesa.ac.id/article/3061/58/article /pdf., on May 24th
, 2017 at 05.30 am.
Asri, Pratiwiningsih. The Effectiveness of Make a Match Technique in
Teaching Reading Comprehension Report Text at XI Grade SMA
Negeri 1 Ngimbang Lamonan. Retrieved from
http://www.ejournal.stkipjb.ac.id/index.php/AS/ article/download/
225/161/pdf.,(Published thesis), on October 11, 2016 at 04.20 pm.
Brown, H. Douglas. Teaching by Principle: An Interactive Approach to
Language Pedagogy. USA: Prentice Hall.
Deriden, Jhon. Conventional Technique. Retrieved from http://www.britania.
com/Ebchecked/topic/421797/nnucler-strategy/52993/conventional-
strategy. on December 24th
, 2016 at 10.00 p.m.
Dupuis, Mary M. And Linda H. Merchant. Reading Across the Curriculum: A
Research Refort for Teachers. Bloominton, Indiana: Edinfo Press. 1993.
Gattegno, Caleb. Teaching Foreign Languages in Schools. New York:
Educational Solutions. 1972.
Gay, L.R. and Peter Airasian. Educational Research: Competencies for
Analysis and Application. America: Prentice Hall. 2000.
Grabe, William. Reading in a Second Language. Cambridge: Cambridge
University Press. 2009.
83
Hartono. Statistik Untuk Penelitian. Yogyakarta: Pustaka Pelajar. 2004.
Hudson. The Meaning of Conventional Teaching (Online). Retrieved from
http://www.conventional-strategy/topic/54372-strategy., on October,
02nd
2016 at 11.30 am.
Hornby, A.S. Oxford Advanced Learner’s Dictionary of Current English.
New York: Oxford University Press. 1995.
Ibrahim and Muslimin. Pembelajaran Kooperatif. Surabaya: Unesa-
University Press. 2000.
Istarani. 58 Model Pembelajaran Inovatif. Medan: Media Persada. 2014.
Miftahul, Huda. Cooperative Learning. Yogyakarta: Pustaka Pelajar. 2012.
McIntyre, Ellen Nancy Hulan, and Vicky Layne. Reading Instruction for
Diverse Classroom. New York: The Guilford Press. 2011.
Nanang, Hanafiah. Konsep Strategi Pembelajaran. Bandung: PT. Refika
Aditama. 2009.
Nunan, David. Practical English Language Teaching, First Edition. New
York: McGraw Hill Inc. 2003.
.. Design Task For the Communicative Classroom. United
Kingdom: Cambridge University Press. 1988.
Nuttall, Christine Elizabeth. Teaching Reading Skills in a Foreign Language.
London: Heinemann Educational Books. 1982.
Otong Setiawan, Djuharie. Genre, Dilengkapi 700 Soal Uji Pemahaman.
Bandung: CV. Yrama Widya. 2007.
. Intensive Reading Bottom-Up Reading. Bandung:
CV. Yrama Widya. 2008.
Otto, Wayne. How to Teach Reading. USA: Wesley Publishing Company.
1979.

84
O’Malley, J. Michael and Lorraine Valdez Pierce. Autentic Assessment for
English Language Learners. America: Addision-Wesley Publishing
Company. 1996.
Pham, Thihanh. Learners’ and Teachers’ Preference for Classroom Activities.
Colchester: Essex University Press. 2005.
Renandya, Richard A. Language Teaching Methodology. Cambridge:
Cambridge University. 2006.
Roebl, K.M. Developing Reading Comprehension Skill in EFL University
Level Student. Taiwan: St. Jhon’s University. 2003.
Syaiful Bahri, Djamarah. Strategy Belajar-Mengajar. Jakarta: PT. Asdi
Mahasatya. 2006.
Suharsimi, Arikunto. Dasar-dasar Evaluasi Pendidikan, Edisi 2. Jakarta:
Bumi Aksara. 2012.
. Prosedur Penelitian Suatu Pendekatan Praktik. Jakarta:
PT. Rineka Cipta. 2006.
Sugiyono. Metode Penelitian Pendidikan; Pendekatan Kuantitatif, Kualitatif,
dan R&D. Bandung: Alfabeta. 2008.
Sri, Wahyuni. The Effectiveness of Using Make a Match Technique in
Teaching Reading Comprehension to the First Grade Students of SMP
Negeri 2 Sulang Rembang. Retvieved from http://www.lib.unnes.ac.id.,
on October 28th
, 2017 at 10.00 a.m.
Sri, Alvera Ayu. The Effect of Using Make a Match Technique in Students’
Reading Comprehension of Recount Text at the Tenth Grade SMA
Xaverius 2 Jambi. Retvieved from http://www.ejournal.unja.ac.id., on
October 28th
, 2017 at 10.00 a.m.
Tarigan, Henry Guntur. Membaca Sebagai Keterampilan Berbahasa.
Bandung: Aksara. 1990.
Th. M., Sudarwati. and Eudia Grace. Look Ahead Book 2; An English Course
for Senior High School Students Year XI. Jakarta: Erlangga. 2007.

85
Umar, Farooq. The Procedures of Teaching Lecture Technique. Retrieved
from http://www.study.lecturenotes.com/social-education/382-lecture-
method-of-teaching-definiton-steps-html., on April, 27th
2017 at 09.05
a.m.
Vanderstoep, Scott W. and Deirdre D. Johnston. Research Methods for
Everyday Life: Blending Qualitative and Quantitative Approaches. San
Fransisco: Jossey Bass. 2009.
Wadsworth. Assessment: In Special and Inclusive Education, Eleventh
Edition. USA: Cengage Learning Press. 2010.
Weir, Cyrill J. Communicative Language Testing. New York: Prentice Hall.
1990.
Westwood, Peter. Reading and Learning Difficulties: Approach to Teaching
and Assessment. Australia: National Library of Australia. 2001.

CURRICULUM VITAE
A. Identity
Name : Annisa Nur Habibie A.R. Harahap
Nim : 13 340 0006
Place and Birthday : Padangsidimpuan, 31st March 1996
Sex : Female
Religion : Moslem
Address : Jl. Kapten Koima No.70 Kota Padangsidimpuan Utara
B. Parents
1. Father‟s name : Ir. Abdul Rahman Harahap
2. Mother‟s name : Sari Pannur Tarihoran S.P.
C. Educational Background
1. Kindergarden : TK „Aisyiyah Bustanul Athfal Padangsidimpuan (2001)
2. Elementary School : SD Negeri 200104 Padangsidimpuan (2007)
3. Junior High School : Mts. Muhammadiyah 22 Padangsidimpuan (2010)
4. Senior High School : MAN 1 Padangsidimpuan (2013)
5. Institute : IAIN Padangsidimpuan (2017)

Appendix 1
Experimental Class
RENCANA PELAKSANAAN PEMBELAJARAN
(RPP)
Nama Sekolah : Madrasah Aliyah Negeri (MAN) 1 Padangsidimpuan
Kelas/Semester : XI/1
Subjek : Bahasa Inggris
Jenis Teks : Text Fungsional
Aspek/Skill : Membaca/ Reading
Alokasi Waktu : 4 x 45 menit (2x pertemuan)
A. Standar Kompetensi
1. Memahami makna dalam esei pendek sederhana untuk berinteraksi dengan
lingkungan sekitar
B. Kompetensi Dasar
1.1 Merespon makna dan langkah retorika dalam esei pendek sederhana secara
akurat, lancar, dan berterima yang berkaitan dengan lingkungan sekitar.
C. Indikator
1. Siswa mampu menentukan topic dari teks
2. Siswa mampu menentukan main idea dari teks
3. Siswa mampu mengambil informasi penting dari teks
4. Siswa mampu memahami makna-makna tertentu dari sebuah kata
5. Siswa mampu membuat kesimpulan dari teks
D. Tujuan Pembelajaran
1. Siswa dapat lebih mudah memahami teks bacaan
2. Siswa dapat memprediksi apa yang akan dihadapi oleh mereka dalam teks
bacaan
Karakter siswa yang diharapkan: Dapat dipercaya (Trustworthiness)
Rasa hormat dan perhatian (Respect)
Tekun (Diligence)

E. Materi Pembelajaran
- Text fungsional
F. Metode Pembelajaran
- Make a Match Technique
G. Langkah-Langkah Kegiatan Pembelajaran
Pertemuan 1
- Kegiatan Pendahuluan
1. Guru membuka kelas dengan mengucapkan basmalah dan salam
2. Absensi dan mempersilahkan siswa untuk membaca do‟a belajar sesuai
agama dan kepercayaan masing-masing
3. Guru menjelaskan tujuan pembelajaran yang akan dicapai
- Kegiatan Inti
1. Guru memberikan teks berbentuk teks fungsional kepada siswa.
2. Guru menyiapkan beberapa kartu yang berisi tentang materi atau
beberapa topik teks berbentuk teks esei.
3. Guru menjelaskan aturan permainan dari tehnik yang akan diajarkan
(Make a Match Technique).
4. Guru menginstruksikan kepada masing-masing siswa untuk
mengambil satu buah kartu dari beberapa kartu yang telah disediakan.
5. Masing-masing siswa mendapatkan 1 buah kartu. Kemudian, siswa
membaca teks.
6. Setiap siswa mencari pasangan yang mempunyai kartu yang cocok
dengan kartunya (soal-jawaban), sesuai dengan teks.
7. Siswa bisa bergabung dengan siswa lain yang memegang kartu yang
berhubungan dan dapat mencocokkan kartunya sebelum batas waktu
yang diberikan.
8. Guru memberikan poin kepada setiap siswa.

- Kegiatan Penutup
1. Guru mengumpulkan hasil kerja siswa
2. Guru dan/atau beserta siswa membuat kesimpulan tentang materi yang
sudah dipelajari
3. Guru menutup pertemuan dengan hamdalah dan salam
Pertemuan 2
- Kegiatan Pendahuluan
1. Salam
2. Absensi
3. Do‟a
- Kegiatan Inti
1. Mengingatkan kembali materi/teks yang sudah dipelajari
2. Siswa menjawab soal yang diberikan guru
- Kegiatan Penutup
1. Guru mengumpulkan hasil kerja siswa
2. Guru menutup pertemuan dengan hamdalah dan salam
H. Media dan Sumber Belajar
1. Media
a. Boardmarker
b. Whiteboard
c. Cards
2. Sumber Belajar
a. Buku yang relevan
b. Kamus
c. Internet


LEARNING MATERIAL
Text 1
Read the text below and answer the question!
For many years people believed that the cleverest animals after man were the
chimpanzees. Now, however, there is proof that dolphins may be even clever than
these big apes.
Although a dolphin lives in the sea it is not a fish. It is a mammal. It is in
many ways, therefore, like a human being.
Dolphins have a simple language. They are able to talk to one another. It may
be possible for man to learn how to talk to dolphins. But this will not be easy because
dolphins cannot hear the kind of sounds man can make. If man wants to talk to
dolphins, therefore, he will have to make a third language which both he and the
dolphins can understand.
Dolphins are also very friendly toward man. They often follow ships. There
are many stories about dolphins guiding ships through difficult and dangerous waters.
Text 2
Read the text below and answer the question!
Long, long ago, mosquitoes didn‟t buzz, they talked and talked.
One day a mosquito was talking to an Iguana. Telling him about his vacation,
about every minute of his vacation. A mosquito would not let the Iguana say one
word. The Iguana was so annoyed that he walked away leaving the mosquito still
talking the Iguana grumble and waved her tail. She was still grumbling when she
passsed her friend the snake, and forgot all about saying hello. The snake was feeling
hurt. He felt so sad that he slithered down. A rabbit hole help yelled. A rabbit as she
scurried out of the hole terrified of the snake what‟s wrong cawed. A crow monkey
heard crow‟s warning and took off through the treetops leaping branch to branch.
When the monkey landed on owl‟s branch high up in a leafy tree. An owl‟s nest

tipped off the branch and fell to the ground breaking the owl‟s eggs. The owl was
heartbroken so much that she didn‟t hoot for the sun to come up and when it did the
mosquito lost his voice all. He could do was buzzing in everyone‟s ears zzzzz! Is
everyone still mad at me ?

Content of cards (Questions-answer)
Text 1
The cleverest animals What is the topic of the text? (Text 1)
What kind of animal is dolphins?
(Text 1)
Dolphins have a simple language What is the main ideas of third paragraph?
(Text 1)
A mammal
Why talking to dolphins not easy? (Text
1)
In the sea Where is dolphin‟s lives ? (Text 1)
Because dolphins cannot hear the
kind of sounds man can make
It is a mammal (in paragraph 2). “It”
refers to? (Text 1)
Dolphins
Difficult The antonym of „easy‟ is ....

Dolphins have a simple language, able
to talk to one another and also very
friendly toward man.
What is the characteristic of dolphin?
(Based on the text 1)
Chimpanzees were the cleverest
animals after man. And Dolphins is
one of them.
What is the conclusion of the text ?
(Text 1)
Dolphins They often follow ships (in paragraph 4).
“They” refers to ...? (Text 1)
Man
....,therefore, he will have to make a third
language which both he and the dolphins
can understand. (in paragraph 3). “He”
refers to ....? (Text 1)
The synonym of „friendly‟ is ..... Familiar
The antonym of „clever‟ is .... Stupid
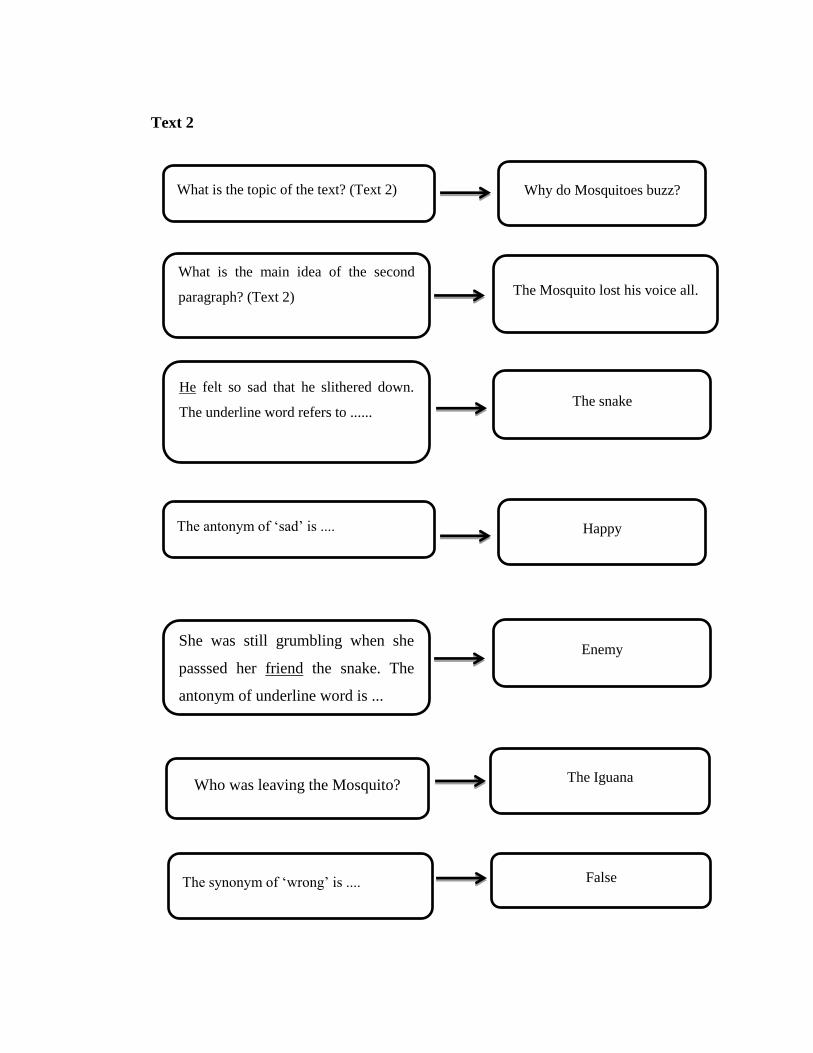
Text 2
Why do Mosquitoes buzz?
What is the main idea of the second
paragraph? (Text 2)
What is the topic of the text? (Text 2)
The snake He felt so sad that he slithered down.
The underline word refers to ......
The Mosquito lost his voice all.
Enemy She was still grumbling when she
passsed her friend the snake. The
antonym of underline word is ...
The Iguana Who was leaving the Mosquito?
Happy The antonym of „sad‟ is ....
The synonym of „wrong‟ is .... False

The Mosquito
He could do was buzzing in
everyone‟s ears zzzz!
The word „he‟ refers to ....
Who lost his voice all ? The Mosquito
Why the Iguana let the Mosquito? Because the Iguana was so annoyed
about all of Mosquitoes‟ story.
What is the conclusion of the text?
The Mosquito lost his voice all, and
he could do was buzzing in
everyone‟s.
The antonym of ‘high’ is ..... Low
When did this story happen? Long, long ago

Appendix 2
Control Class
RENCANA PELAKSANAAN PEMBELAJARAN
(RPP)
Nama Sekolah : Madrasah Aliyah Negeri (MAN) 1 Padangsidimpuan
Kelas/Semester : XI/1
Subjek : Bahasa Inggris
Jenis Teks : Text Fungsional
Aspek/Skill : Membaca/ Reading
Alokasi Waktu : 4 x 45 menit (2x pertemuan)
A. Standar Kompetensi
1. Memahami makna dalam esei pendek sederhana untuk berinteraksi dengan
lingkungan sekitar
B. Kompetensi Dasar
1.1 Merespon makna dan langkah retorika dalam esei pendek sederhana secara
akurat, lancar, dan berterima yang berkaitan dengan lingkungan sekitar.
C. Indikator
1. Siswa mampu menentukan topic dari teks
2. Siswa mampu menentukan main idea dari teks
3. Siswa mampu mengambil informasi penting dari teks
4. Siswa mampu memahami makna-makna tertentu dari sebuah kata
5. Siswa mampu membuat kesimpulan dari teks
D. Tujuan Pembelajaran
1. Siswa dapat lebih mudah memahami teks bacaan
2. Siswa dapat memprediksi apa yang akan dihadapi oleh mereka dalam teks
bacaan
Karakter siswa yang diharapkan: Dapat dipercaya (Trustworthiness)
Rasa hormat dan perhatian (Respect)
Tekun (Diligence)

E. Materi Pembelajaran
- Text fungsional
F. Metode Pembelajaran
- Conventional Technique
G. Langkah-Langkah Kegiatan Pembelajaran
Pertemuan 1
- Kegiatan Pendahuluan
1. Guru membuka kelas dengan mengucapkan basmalah dan salam
2. Absensi dan mempersilahkan siswa untuk membaca do‟a belajar sesuai
agama dan kepercayaan masing-masing
- Kegiatan Inti
1. Guru menyampaikan topik yang akan dipelajari
2. Guru memberikan teks berbentuk teks fungsional kepada siswa
3. Guru meminta siswa untuk membaca teks yang akan dipelajari
4. Guru memberikan penjelasan mengenai teks fungsional yang telah
dibaca
5. Guru meminta siswa menerjemahkan teks ke dalam bahasa Indonesia
6. Guru meminta siswa menuliskan kosakata dari teks dan menghafalnya
7. Guru meminta siswa untuk menjawab beberapa pertanyataan/soal
latihan dari teks tersebut
- Kegiatan Penutup
1. Guru mengumpulkan hasil kerja siswa
2. Guru dan/atau beserta siswa membuat kesimpulan tentang materi yang
sudah dipelajari
3. Guru menutup pertemuan dengan hamdalah dan salam
Pertemuan 2
- Kegiatan Pendahuluan
1. Salam
2. Absensi

3. Do‟a
- Kegiatan Inti
1. Mengingatkan kembali materi/teks yang sudah dipelajari
2. Menyimak hafalan kosakata siswa
3. Siswa menjawab soal yang diberikan guru
- Kegiatan Penutup
1. Guru mengumpulkan hasil kerja siswa
2. Guru menutup pertemuan dengan hamdalah dan salam
H. Media dan Sumber Belajar
1. Media
a. Boardmarker
b. Whiteboard
c. Students’ worksheet
2. Sumber Belajar
a. Buku yang relevan
b. Kamus
c. Internet
I. Penilaian
Indikator Pencapaian
Kompetensi
Teknik
Penilaian
Bentuk
Instrumen Instrumen Soal
The topic of the text
The main idea
Finding the Information
Vocabulary
Deciding the conclusion
Tes Tulis Multiple
Choice
Read the text.
Then answer
the question!


LEARNING MATERIAL
Text 1
Read the text below and answer the question!
For many years people believed that the cleverest animals after man were the
chimpanzees. Now, however, there is proof that dolphins may be even clever than
these big apes.
Although a dolphin lives in the sea it is not a fish. It is a mammal. It is in
many ways, therefore, like a human being.
Dolphins have a simple language. They are able to talk to one another. It may
be possible for man to learn how to talk to dolphins. But this will not be easy because
dolphins cannot hear the kind of sounds man can make. If man wants to talk to
dolphins, therefore, he will have to make a third language which both he and the
dolphins can understand.
Dolphins are also very friendly toward man. They often follow ships. There
are many stories about dolphins guiding ships through difficult and dangerous waters.
Questions !
1. What is the topic of the text?
2. The main idea of third paragraph is ....
3. What kind of animal is dolphins?
4. Where is dolphin‟s lives ?
5. It is a mammal (in paragraph 2). The word „it‟ refers to ...
6. Why talking to dolphins not easy?
7. The antonym of „easy‟ is ....
8. What is the characteristic of dolphin? (Based on the text above)
9. The synonym of „friendly‟ is .....
10. ....,therefore, he will have to make a third language which both he and the
dolphins can understand. (in paragraph 3). “He” refers to ....

11. They often follow ships (in paragraph 4). “They” refers to ...
12. The antonym of „clever‟ is ....
13. What is the conclusion of the text?
Text 2
Read the text below and answer the question!
Long, long ago, mosquitoes didn‟t buzz, they talked and talked.
One day a mosquito was talking to an Iguana. Telling him about his vacation,
about every minute of his vacation. A mosquito would not let the Iguana say one
word. The Iguana was so annoyed that he walked away leaving the mosquito still
talking the Iguana grumble and waved her tail. She was still grumbling when she
passsed her friend the snake, and forgot all about saying hello. The snake was feeling
hurt. He felt so sad that he slithered down. A rabbit hole help yelled. A rabbit as she
scurried out of the hole terrified of the snake what‟s wrong cawed. A crow monkey
heard crow‟s warning and took off through the treetops leaping branch to branch.
When the monkey landed on owl‟s branch high up in a leafy tree. An owl‟s nest
tipped off the branch and fell to the ground breaking the owl‟s eggs. The owl was
heartbroken so much that she didn‟t hoot for the sun to come up and when it did the
mosquito lost his voice all. He could do was buzzing in everyone‟s ears zzzzz! Is
everyone still mad at me ?
Questions !
1. What is the topic of the text?
2. What is the main idea of the second paragraph?
3. He felt so sad that he slithered down. The underline word refers to ...
4. The antonym of „sad‟ is .....
5. She was still grumbling when she passsed her friend the snake. The antonym
of underline word is ...
6. Who was leaving the Mosquito?

7. The synonym of „wrong‟ is ....
8. He could do was buzzing in everyone‟s ears zzzz! The word „he‟ refers to ....
9. Who lost his voice all ?
10. When did this story happen?
11. The antonym of „high‟ is .....
12. Why the Iguana let the Mosquito?
13. What is the conclusion of the text?

Appendix 3
INSTRUMENT FOR PRE-TEST
Choose the best answer based on the text!
Reading passage 1 for number 1-20
The Island of Wingo is by the island of Singa. In the water around Wingo
Island, there are hundreds of sharks. They are so many that the water bubbles like a
whirlpool. People can only get to Wingo Island by boat. The boat has a rocket on it.
The rocket takes people over the sharks and into the Island.
Wingo Island has no sand but it has green moss. At night the moss sparkles
like stars. Tall stars called Fruji grow everywhere. The Fruji tress have purple leaves
at the top and yellow fruit all over them. When a fruit fall off, another tree grows in a
minute.
The weather on Wingo Island is very hot but at twelve o‟clock, everyday, it
rains. Sometimes, there are windstorms. They happen when too many animals fly
around at the same time.
People who stay on Wingo Island sleep in a bingglo. It is like an iglo but it is
on long poles. It has a ladder to get up and a slide to come down. The bigglo has a
moss bed, chairs, and tables that are made of Fruji trees.
There is no television on Wingo Island. So is the telephone and computer. It is
place to listen to the leaves whispering. It is a place to lie on soft green moss and look
at the clounds. It is really a place to dream.
1. What is the topic of the text?
a. A river
b. Lake
c. An island
d. Valley
2. According to passage, which of the following is not true?
a. Many sharks are in Wingo island
b. Wingo is an island

c. The weather in Wingo island is tropic all the time
d. Wingo is really a place to dream
3. “It is place to listen to the leaves whispering.” (last paragraph)
The closest meaning of the underlined word is ?
a. Singing
b. Laughing
c. Speaking loudly
d. Makes a soft sound
4. What is the main idea of the last paragraph?
a. There is no television on Wingo island
b. The weather on Wingo island is very hot
c. The island of Wingo is by the island of Singa
d. Wingo island has no sand
5. “It is really a place to dream.” (in paragraph 4)
The word “It” refers to?
a. The television
b. The weather
c. The Wingo island
d. The clouds
6. People can only get to Wingo Island by?
a. Boat
b. Car
c. Airplane
d. Horse
7. Where are the people‟s sleep on Wingo Island?
a. In a kitchen
b. In a house
c. In a bigglo
d. In a room

8. It is place to listen to the leaves whispering. The word “it” refers to?
a. Boat
b. Television
c. Wingo island
d. Computer
e. Bigglo
9. They are so many that the water bubbles like a whirlpool. The underlined
word refers to ...
a. Boat
b. Water
c. Wingo island
d. Sharks
10. The Wingo island called .....
a. Island of Lion
b. Island of Singa
c. Island of Crocodile
d. Island of Bird
11. It is like an iglo but it is on long poles. Who is „it‟ in the underline word?
a. People
b. A bigglo
c. An island
d. Fruji tress
12. When fall rains on Wingo Island?
a. Everyday
b. At twelve o‟clock everyday
c. At twelve half everyday
d. At ten everyday
13. The weather on Wingo Island is very hot but at twelve o‟clock, everyday, it
rains. The antonym of underlined word is ...
a. Rains

b. Hot
c. Cold
d. Summer
14. Tall stars called ....
a. Fruji flower
b. Fruji grow
c. Purple leaves
d. Yellow fruit
15. The main idea of the third paragraph is ....
a. There is no television on Wingo island
b. The weather on Wingo island is very hot
c. The weather on Wingo island is cold
d. Wingo island has no sand
16. What is the conclusion of the passage?
a. Wingo island has green moss
b. There are hundreds of sharks in Wingo island
c. The weather on Wingo island is very hot
d. Wingo island is really a place to dream
17. People can only get to Wingo island by boat. The clostest meaning of the
underlined word is ...
a. Achieve
b. Go
c. Can
d. Arrive
18. What is nothing on Wingo island ? (Based on last paragraph?
a. Television, telephone, computer
b. Sand, telephone, computer
c. Television, telephone, green moss
d. Telephone, computer, water

19. Sometimes, there are windstorm. The underlined word refers to...
a. The Wingo island
b. The weather on Wingo island
c. The bingglo
d. The weather on island
20. Wingo island is a place to ...
a. Lie on hard green moos and look at the sky
b. Lie on soft green moss and look at the water
c. Lie on soft green moss and look at the clounds
d. Lie on soft green moss and look at the boat
Reading passage 2 for number 21-34
Snakes are reptiles. They belong to the same group as lizards (the scaled
group, Squamata) but for asub group of their own (Serpentes).
Snakes have two legs but a long time ago they had claws to help them slither
along. Snakes are not slimy. They are covered in scales which are just bumps on the
skin. Their skin is hard and glossy to reduce friction as the snake slither along the
ground.
Most snakes lives in the country. Some types of snakes live in tress, some live
in water, but most usually consist of frogs, lizard, and mice and other snakes. The
Anaconda can eat small crocodile and even wild boards.
Many snakes protect themselves with their fangs. Boa Constrictors can give
you a bear hug which is so powerful, it can crush every sinle bone in your body.
Some snakes are protected by scaringtheir enemies away like the Cobra. The flying
snakes glided away from danger. Their ribs spread apart and the skin stretches out. Its
technique is just like sugar fliders.
21. What is the topic of the text?
a. Snakes
b. Snake in the Bath
c. Types of snakes
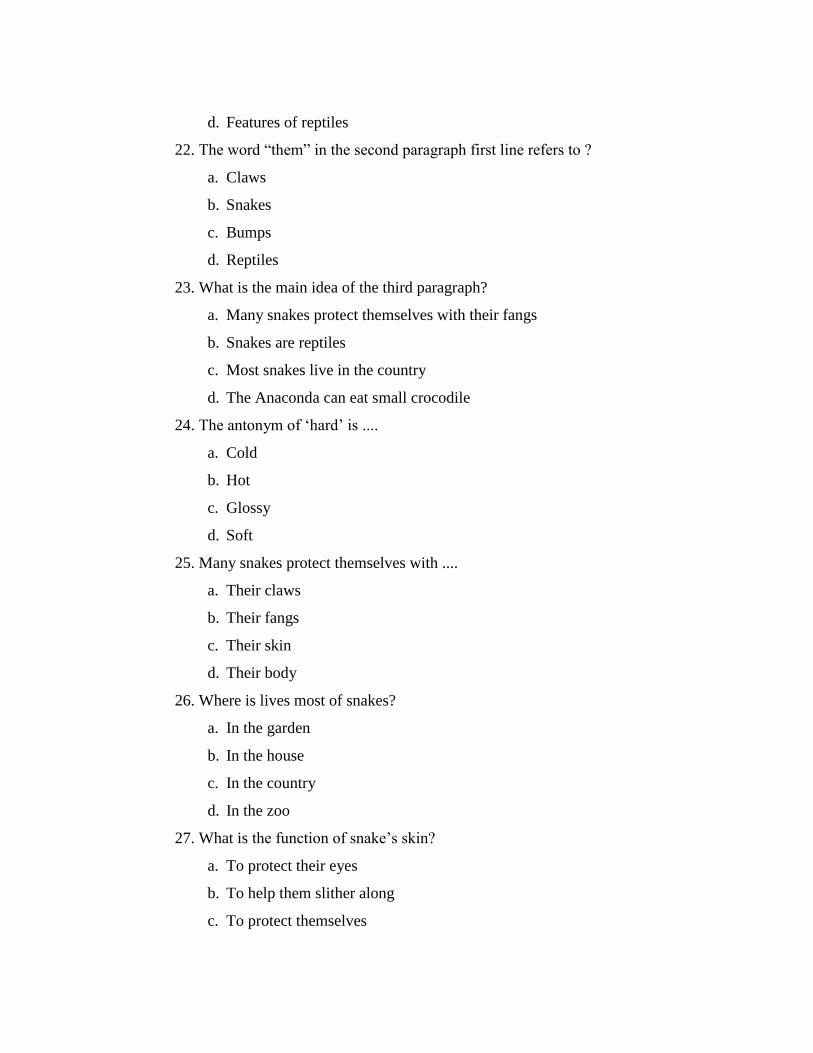
d. Features of reptiles
22. The word “them” in the second paragraph first line refers to ?
a. Claws
b. Snakes
c. Bumps
d. Reptiles
23. What is the main idea of the third paragraph?
a. Many snakes protect themselves with their fangs
b. Snakes are reptiles
c. Most snakes live in the country
d. The Anaconda can eat small crocodile
24. The antonym of „hard‟ is ....
a. Cold
b. Hot
c. Glossy
d. Soft
25. Many snakes protect themselves with ....
a. Their claws
b. Their fangs
c. Their skin
d. Their body
26. Where is lives most of snakes?
a. In the garden
b. In the house
c. In the country
d. In the zoo
27. What is the function of snake‟s skin?
a. To protect their eyes
b. To help them slither along
c. To protect themselves

d. To reduce friction
28. A snakes diet usually consists of frogs, lizards, and mice, and other snakes
(paragraph 3). The word “diet” has the same meaning as ?
a. Enemy
b. Predator
c. Prey
d. Friend
29. Their ribs spread apart and the skin stretches out. The word “their” in the
sentence refers to?
a. Reptiles
b. Crocodiles
c. Snakes
d. Frogs
30. How is the snakes‟ skin?
a. Soft and hard
b. Hard and glossy
c. Hard and soft
d. Soft and glossy
31. They are covered in scales which are just bumps on the skin. Who is „they‟ in
the underline word?
a. Anaconda
b. Snakes
c. Reptile
d. Frogs
32. What is the function of snakes‟ claws?
a. To help them slither along
b. To help them flying along
c. To help them run
d. To help them protect from their enemies
33. What is the conclusion of the text?

a. Snakes are reptiles and live in the country
b. Snakes are reptiles
c. Snakes are not slimy
d. Snakes live in the country
34. What were claws of snakes for a long time ago?
a. To help them slither along
b. In order to live in scaled group
c. To be able to eat small crocodile
d. In order to protect from their enemies
Reading passage 3 for number 35-50
One upon a time, a hawk fell in love with a hen. The hawk flew down from
the sky and asked the hen, “Will you marry me?”
The hen loved the brave, strong hawk and wished to marry him. But she said,
“I cannot fly as high as you can. If you give me time, I may learn to fly as high as
you. Then we can fly together.”
The hawk agreed. Before he went away, he gave the hen a ring. “This is to
show that you have promised to marry me,” said the hawk.
It so happened that the hen had already promised to marry a rooster. So, when
the rooster saw the ring, he became very angry. “Throw that ring away at once!”
shouted the rooster. The hen was so frightened at the rooster‟s anger that she threw
away the ring immediately.
When the hawk came a few months later, the hen told him the truth. The hawk
was so furious that he cursed the hen, “Why didn‟t you tell me earlier? Now, you‟ll
always be scratching the earth, and I‟ll always be flying above to catch your
children,” said the hawk.
35. What is the topic of the text?
a. Why do hawk help chicks?
b. Why do hawk love chicks?
c. Why do hawk hunt rooster?

d. Why do hawk hunt chicks?
36. The antonym of „brave‟ is ...
a. Afraid
b. Strong
c. Smart
d. Beautiful
37. Who fell in love to the hen?
a. Rooster
b. Hawk
c. Chicken
d. Cat
38. The second paragraph tell about?
a. The hen gave a request before they married
b. The hen gave a ring to the hawk
c. The hen learn to fly
d. The hawk gave a ring to the hen
39. The antonym of „strong‟ is ....
a. Brave
b. Pretty
c. Weak
d. Deligent
40. If you give me time. The antonym of underline word is .....
a. Gave
b. Receive
c. Throw
d. Save
41. When did this story happen?
a. Last week
b. Last year
c. Once upon a time

d. Last month
42. Who was angry when saw the ring‟s hen?
a. Hawk
b. Hen
c. Cat
d. Rooster
43. What is the meaning of „ring‟?
a. Gelang
b. Perhiasan
c. Cincin
d. Sepatu
44. What did rooster says to hen?
a. Will you marry me?
b. I‟ll always be flying above to catch your children!
c. Throw that ring away at once!
d. I can not fly as high as you can.
45. The hawk was so furious that he cursed the hen. The word „he‟ refers to?
a. Hawk
b. Hen
c. Rooster
d. Children
46. The third paragraph tell about ...
a. The hawk fell in love to the hen
b. The hawk gave a ring to the hen
c. The hawk agreed request from the hen
d. The hawk promise to marry hen
47. What is the curse from hawk?
a. I‟ll always be flying above to help your children!
b. You‟ll always be scratching the earth, and I‟ll always be flying above to
catch your children!


Appendix 4
INSTRUMENT FOR POST-TEST
Choose the best answer based on the text!
Reading passage 1 for number 1-17
Antibiotic is a drug produced by certain microbes. Antibiotics destroy other
microbes that damage human tissues. They are used to treat a wide variety of
diseases, including gonorrhea, tonsillitis and tuberculosis. Antibiotics are sometimes
called „wonder drugs‟ because they can cure diseases such as meningitis, pneumonia
and scarlet fever. But when the antibiotics are overused, or misused, these drugs
make a person sensitive being attacked by a superbug.
Antibiotics do not always distinguish between harmless and dangerous
microbes. If a drug destroys too many harmless micro-organism, the pathogenic ones
-the dangerous microbes will have a greater chance to multiply. This situation often
leads to the development of a new infection called superinfection. Extensive use of
some antibiotics may damage organs and tissues. For example, streptomycin, which
is used to treat tuberculosis, has caused kidney damage and deafness.
Resistance to antibiotics may be acquired by pathogenic microbes. The
resistant microbes transfer genetic material to non-resistant microbes and cause them
to become resistant. During antibiotic treatment, non-resistant microbes are
destroyed, but resistant types survive and multiply.
To avoid the side effect of antibiotics, you'd better not urge your doctor to
prescribe antibiotics. Keep in mind that antibiotics are only useful for bacterial
infections and have no effect on viruses, so they cannot be used for children pox,
measles, and other viral diseases.
1. What is the topic of the text?
a. Magic bullet
b. Antibiotics
c. Drug
d. Microbes

2. What is the main idea of the second paragraph?
a. Antibiotics is a compound
b. Antibiotics is good for medication
c. Antibiotics is not good for fungi
d. Antibiotics kill without injuring its suffers
3. The antonym of „wide‟ is ...
a. Large
b. Light
c. Narrow
d. Dark
4. Choose one from the following which is not the effect of using antibiotics
improperly?
a. New infection which is called super infection develops
b. Harmiess microorganism are destroyed
c. The pathogenic microbes multiply
d. Pathogenic microbes become non-resistant
5. The antonym of „new‟ is ...
a. Wide
b. Smart
c. Old
d. Beautiful
6. Which diseases cannot be cured by antibiotics?
a. Scarlet fever
b. Meningitis
c. Tuberculosis
d. Chicken pox
7. What is used to treat tuberculosis ?
a. Diseases
b. Drugs
c. Antibiotics

d. Streptomycin
8. Antibiotic is .....
a. A drug produced by certain microbes
b. A drug produced by mushroom
c. A drug produced by tuberculosis
d. A drug produced by certain streptomycin
9. Resitance to antibiotics may be acquired by ....
a. Pathogenic
b. Pathogenic microbes
c. Microbes
d. Pathogenic mushroom
10. Extensive use of some antibiotics may damage organs and tissues. The
antonym of underline word is ....
a. Intensive
b. External
c. Internal
d. Damage
11. The main idea of the third paragraph is ...
a. Resistance to antibiotics may be acquired by viruses
b. Resistance to antibiotics may be acquired by pathogenic microbes
c. The effects of misusing antibiotics can damage organs and tissue
d. Antibiotic is drug produced by certain microbes
12. Antibiotics are sometimes called .....
a. Microbes
b. Diseases
c. Wonder drugs
d. Wonder microbes
13. “They are used to treat a wide variety of diseases, including gonorrhea,
tonsillitis and tuberculosis” (in paragraph 1). The word “they” refers to?
a. Drugs

b. Microbes
c. Humans
d. Antibiotics
e. Pathogenic microbes
14. Antibiotics do not always distinguish between ...
a. Dangerous and benefit microbes
b. Harmless and benefit microbes
c. Harmless and dangerous pneumonia
d. Harmless and dangerous microbes
15. What is the conclusion of the text?
a. Antibiotics are only useful for bacterial infections and have not effect
on viruses
b. Antibiotics do not always distinguish between harmless and dangerous
microbes
c. Antibiotics called wonder drugs
d. Antibiotics acquired by pathogenic microbes
16. Why an antibiotics called wonder drugs?
a. Because they can damage
b. Because they can benefit
c. Because they can cure diseases
d. Because they can destroy other microbes
17. Antibiotics destroy other microbes that damage human tissues. The
antonym of underline word is ....
a. Built
b. Damage
c. Develop
d. Save

Reading passage 2 for number 18-32
Whales are sea-living mammals. They therefore breathe air but can not
survive on land.
Some species are very large the black whales and the blue whales, which can
exceed 30 meters in length, is the largest animal to have lived on earth. Superfically,
the whales looks rather like a fish, but there are important differences in its body
structure; its tail consist of a pair of broad, flat horizontal paddles (the tail of a fish is
vertical) and it has a single nostril on top of its large, broad head. The skin is smooth
and shiny and beneath it lies a layer of fat (blubber). It can be up to 30 meters in
thickness and serves to conserve heat and body whales.
18. What is the text about?
a. Sea-living mammals
b. The description of mammals
c. The difference between whales and fish
d. Whales
e. How whales survive themselves
19. The word “They” in second sentence refers to?
a. Mammals
b. Whales
c. Species
d. Animal
e. The skin of whales
20. How length is a whale‟s body?
a. 30 meters
b. 3 meters
c. 300 meters
d. 3000 meters
21. It can be up to 30 meters in thickness and serves to conserve heat and
body whales. The word „it‟ refers to ?
a. Whales

b. The skin
c. The body
d. The species
22. Where is can not whale‟s survive?
a. On sea
b. On air
c. On land
d. On beach
23. The antonym of „large‟ is ...
a. Bright
b. Strong
c. Narrow
d. Dirty
24. The skin is smooth and shiny and beneath it lies a layer of fat (blubber).
The synomym of underline word is ....
a. Hard
b. Soft
c. Coarse
d. Clean
25. How thickness is a whale‟s skin?
a. 3 meters
b. 30 meters
c. 35 meters
d. 3 centimeters
e. 300 meters
26. Based on the text, some species of Whales. They are ?
a. Black and pink Whales
b. Black and blue Whales
c. Blue and green Whales
d. Black and yellow Whales

27. The second paragraph tell about ...
a. Charateristics of Whales
b. Spesies of Whales
c. Benefit of Whales
d. The skin of Whales
28. How is the Whale‟s skin ?
a. Smooth and shiny
b. Dark and smooth
c. Shiny and dark
d. Hard and shiny
29. The skin is smooth and shiny. The antonym of underlined word is....
a. Bright
b. Hard
c. Beautiful
d. Pallid
30. How is the whale‟s tail?
a. The tail consist a pair of broad, and flat vertical paddles
b. The tail consist a pair of broad, and flat horizontal paddles
c. The tail is vertical and single
d. The tail is horizontal and single
31. What is the conclusion of the text?
a. The skin of whales is smooth and shiny
b. Whale looks rather like a fish
c. Whales are sea-living mammals
d. Whales can exceed 300m in length
e. Tail of whales consist of a pair of broad
32. It can be up to 30 meters in thickness and serves to conserve heat and
body whales. The antonym of underline word is ...
a. Highest
b. Thinness
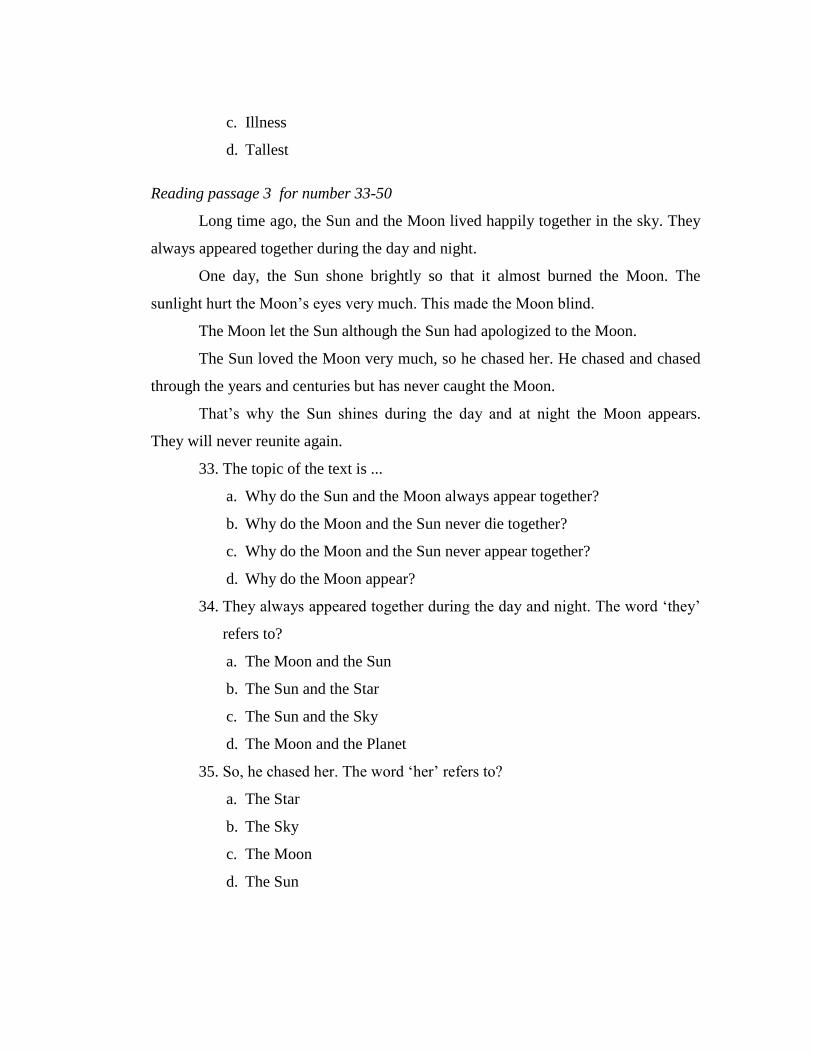
c. Illness
d. Tallest
Reading passage 3 for number 33-50
Long time ago, the Sun and the Moon lived happily together in the sky. They
always appeared together during the day and night.
One day, the Sun shone brightly so that it almost burned the Moon. The
sunlight hurt the Moon‟s eyes very much. This made the Moon blind.
The Moon let the Sun although the Sun had apologized to the Moon.
The Sun loved the Moon very much, so he chased her. He chased and chased
through the years and centuries but has never caught the Moon.
That‟s why the Sun shines during the day and at night the Moon appears.
They will never reunite again.
33. The topic of the text is ...
a. Why do the Sun and the Moon always appear together?
b. Why do the Moon and the Sun never die together?
c. Why do the Moon and the Sun never appear together?
d. Why do the Moon appear?
34. They always appeared together during the day and night. The word „they‟
refers to?
a. The Moon and the Sun
b. The Sun and the Star
c. The Sun and the Sky
d. The Moon and the Planet
35. So, he chased her. The word „her‟ refers to?
a. The Star
b. The Sky
c. The Moon
d. The Sun

36. He chased and chased through the years and centuries but has never
caught the Moon. Who is „he‟ in the sentence ?
a. The Moon
b. The Sun
c. The Sky
d. The Hawk
37. Who chased the Moon?
a. Sun
b. Earth
c. Sky
d. Clouds
38. Who was apologized to the Moon?
a. The Moon
b. The Sun
c. The Star
d. The Night
39. They will never reunite again. Who is „they‟ in the underline word?
a. The Sun and the Sky
b. The Moon and the Star
c. The Sun and the Moon
d. The Sun and the Moon‟s eyes
40. Who shines during at the day?
a. Moon
b. Star
c. Planet
d. Sun
41. The main idea of the fourth paragraph is ...
a. The Moon loved the Sun very much
b. The Sun shone brightly so that it almost burned the Moon
c. The Sun apoloziged to the Moon
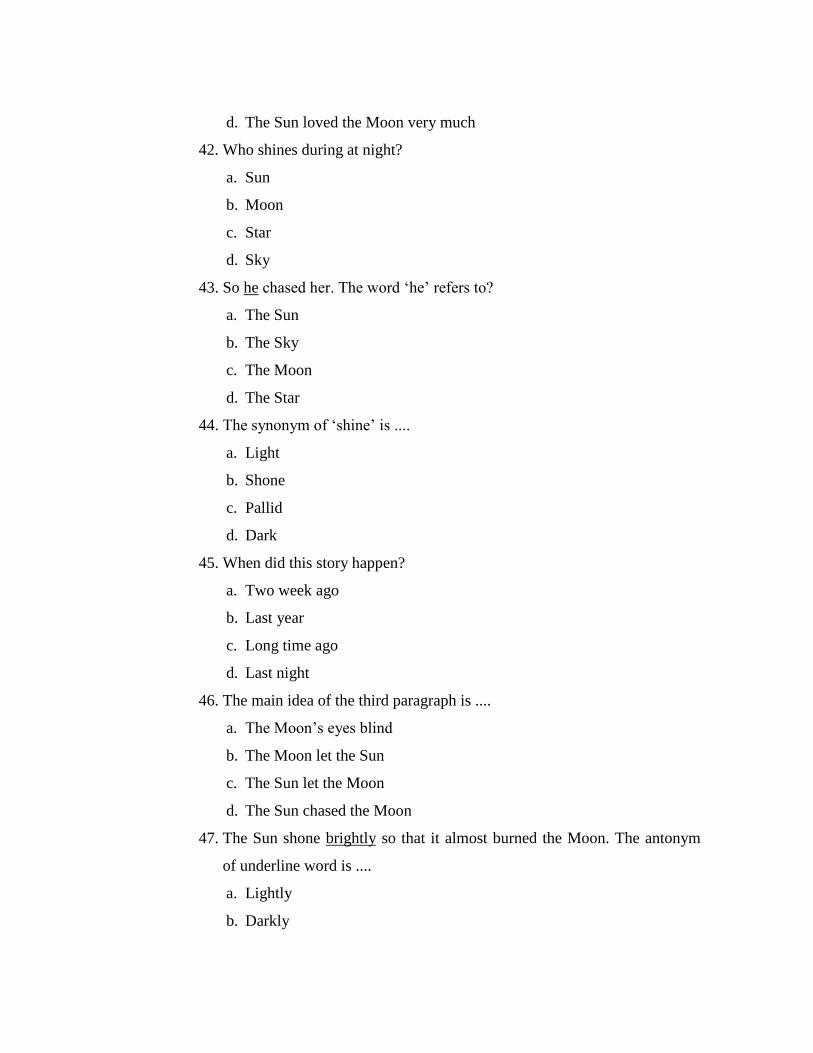
d. The Sun loved the Moon very much
42. Who shines during at night?
a. Sun
b. Moon
c. Star
d. Sky
43. So he chased her. The word „he‟ refers to?
a. The Sun
b. The Sky
c. The Moon
d. The Star
44. The synonym of „shine‟ is ....
a. Light
b. Shone
c. Pallid
d. Dark
45. When did this story happen?
a. Two week ago
b. Last year
c. Long time ago
d. Last night
46. The main idea of the third paragraph is ....
a. The Moon‟s eyes blind
b. The Moon let the Sun
c. The Sun let the Moon
d. The Sun chased the Moon
47. The Sun shone brightly so that it almost burned the Moon. The antonym
of underline word is ....
a. Lightly
b. Darkly

c. Brightness

Appendix 5
ANSWER KEY
PRE TEST
1. C 11. B 21. A 31. B 41. C
2. C 12. B 22. B 32. A 42. D
3. D 13. C 23. C 33. B 43. C
4. A 14. B 24. D 34. A 44. B
5. C 15. B 25. B 35. D 45. A
6. A 16. D 26. C 36. A 46. C
7. C 17. B 27. D 37. B 47. B
8. C 18. A 28. C 38. A 48. A
9. D 19. B 29. C 39. C 49. B
10. B 20. C 30. B 40. B 50. B
POST TEST
1. B 11. B 21. B 31. C 41. D
2. B 12. C 22. C 32. B 42. B
3. C 13. D 23. D 33. C 43. A
4. C 14. D 24. B 34. A 44. A
5. C 15. A 25. B 35. C 45. C
6. D 16. C 26. B 36. B 46. B
7. D 17. A 27. A 37. A 47. B
8. A 18. D 28. A 38. B 48. C
9. B 19. B 29. D 39. C 49. B
10. A 20. A 30. B 40. D 50. C

Appendix 6
Validity of Pre Test
No
NUMBER OF ITEMS
1 2 3 4 5 6 7 8 9 1
0
1
1
1
2
1
3
1
4
1
5
1
6
1
7
1
8
1
9
2
0
2
1
2
2
2
3
2
4
2
5
2
6
2
7
2
8
2
9
3
0
3
1
3
2
3
3
3
4
3
5
3
6
3
7
3
8
3
9
40
1 1 1 0 1 1 1 0 1 1 1 1 1 0 1 1 1 1 0 1 0 1 1 1 0 1 1 1 0 1 1 1 1 0 1 1 1 0 0 1 1
2 1 1 0 1 1 1 0 1 0 1 1 0 0 1 1 0 1 0 1 0 1 1 1 1 1 1 1 0 1 0 1 0 0 1 1 1 1 0 0 0
3 0 0 0 1 1 1 1 1 1 1 1 1 0 1 1 1 1 0 1 1 0 1 1 1 1 1 1 0 1 1 1 1 0 0 1 1 1 0 1 1
4 1 1 0 1 1 1 1 1 1 1 1 1 0 1 1 1 1 0 1 1 1 1 0 0 1 1 1 0 1 1 1 1 0 1 1 1 1 0 1 1
5 1 1 0 1 0 1 0 1 1 1 0 1 0 1 0 1 0 0 0 1 0 0 1 1 1 0 1 0 0 0 1 1 1 0 0 1 1 0 0 1
6 1 1 1 0 1 1 1 1 0 1 1 1 1 1 0 1 1 0 1 1 0 1 1 1 1 1 1 0 0 0 1 1 0 0 1 1 1 1 1 1
7 1 1 0 1 1 1 0 1 1 1 0 1 0 1 1 1 1 0 1 1 0 1 1 1 1 1 1 1 1 1 1 0 1 0 0 1 1 0 1 1
8 1 0 1 1 1 0 1 1 1 1 1 1 0 1 1 0 0 0 1 1 1 1 0 1 1 1 1 0 1 1 1 1 1 1 1 1 1 0 1 1
9 1 1 0 1 1 1 1 1 1 1 1 0 1 1 0 1 1 1 1 0 1 1 1 1 1 1 1 0 1 1 0 1 0 1 0 1 1 0 1 0
10 0 1 1 0 0 1 0 1 1 1 0 1 0 0 1 1 0 1 0 1 1 1 1 1 1 1 0 0 1 1 1 1 1 1 1 0 1 1 0 1
11 0 0 0 0 1 1 0 0 0 0 1 0 0 0 0 0 0 0 1 0 0 0 0 0 1 1 1 0 0 0 0 1 0 0 0 1 0 0 1 0
12 0 1 0 1 0 1 1 1 1 1 1 1 1 1 1 1 1 0 1 1 1 1 1 1 1 1 1 0 1 1 1 0 0 1 1 1 1 0 1 1
13 1 0 0 1 1 1 1 1 0 0 0 1 0 1 1 0 0 0 1 0 1 1 0 0 1 0 1 0 1 1 1 1 0 1 1 1 0 0 1 0
14 1 1 0 1 0 0 1 0 1 1 1 1 1 0 0 1 1 0 1 1 1 1 1 1 0 1 1 1 1 0 0 1 0 1 1 1 1 0 0 1
15 1 1 0 1 1 1 1 1 1 1 1 1 0 1 1 1 1 1 1 1 1 0 1 1 1 0 1 0 0 1 1 1 1 1 0 1 1 0 1 1
16 1 0 0 1 1 0 1 1 1 1 1 0 0 1 1 0 0 0 1 1 0 1 1 1 1 1 0 0 0 1 0 1 0 0 1 1 1 0 1 1
17 1 1 0 1 1 0 1 0 1 0 1 1 1 1 1 1 1 1 1 1 1 1 0 1 0 1 1 0 1 0 1 1 0 1 1 1 0 1 1 1
18 0 0 1 1 0 1 0 1 0 0 1 1 0 1 1 1 1 0 1 0 1 1 1 1 1 1 1 0 0 1 1 1 0 1 1 1 0 0 0 0
19 1 1 0 1 0 1 1 1 1 1 1 1 1 0 1 0 0 1 0 1 1 1 0 1 1 0 1 1 0 0 1 1 0 1 0 0 1 1 1 1
20 1 1 1 1 1 1 1 0 0 0 1 0 0 1 1 1 1 0 0 1 0 1 1 1 0 1 0 0 0 1 1 1 0 0 1 0 1 0 0 1
21 1 1 0 0 1 0 1 1 0 1 1 1 0 1 1 1 1 0 0 1 1 0 1 1 1 1 1 0 1 1 0 1 0 1 0 1 1 0 1 0
22 0 0 0 1 1 0 1 1 1 1 1 1 1 1 0 1 1 0 0 1 0 0 1 0 1 1 0 1 0 0 1 1 1 0 1 0 0 1 1 1
23 0 0 1 0 0 0 0 0 0 1 0 1 1 1 0 0 0 1 0 0 1 1 0 1 1 0 1 1 0 0 0 0 1 1 1 0 0 1 0 0
N
=
23
1
6
1
5 6
1
8
1
6
1
6
1
5
1
8
1
5
1
8
1
8
1
8 8
1
9
1
6
1
6
1
5 6
1
6
1
6
1
5
1
8
1
6
1
8
2
0
1
8
1
8 5
1
3
1
4
1
7
1
9 7
1
5
1
6
1
8
1
6 6
1
6 16
P
0
,
7
0
,
7
0
,
2
0
,
8
0
,
7
0
,
7
0
,
7
0
,
8
0
,
7
0,
8
0,
8
0,
8
0,
3
0,
8
0,
7
0,
7
0,
7
0,
3
0,
7
0,
7
0,
7
0,
8
0,
7
0,
8
0,
9
0,
8
0,
8
0,
2
0,
6
0,
6
0,
8
0,
8
0,
3
0,
7
0,
7
0,
8
0,
7
0,
3
0,
7
0,
7
Q
0
,
3
0
,
3
0
,
8
0
,
2
0
,
3
0
,
3
0
,
3
0
,
2
0
,
3
0,
2
0,
2
0,
2
0,
7
0,
2
0,
3
0,
3
0,
3
0,
7
0,
3
0,
3
0,
3
0,
2
0,
3
0,
2
0,
1
0,
2
0,
2
0,
8
0,
4
0,
4
0,
2
0,
2
0,
7
0,
3
0,
3
0,
2
0,
3
0,
7
0,
3
0,
3
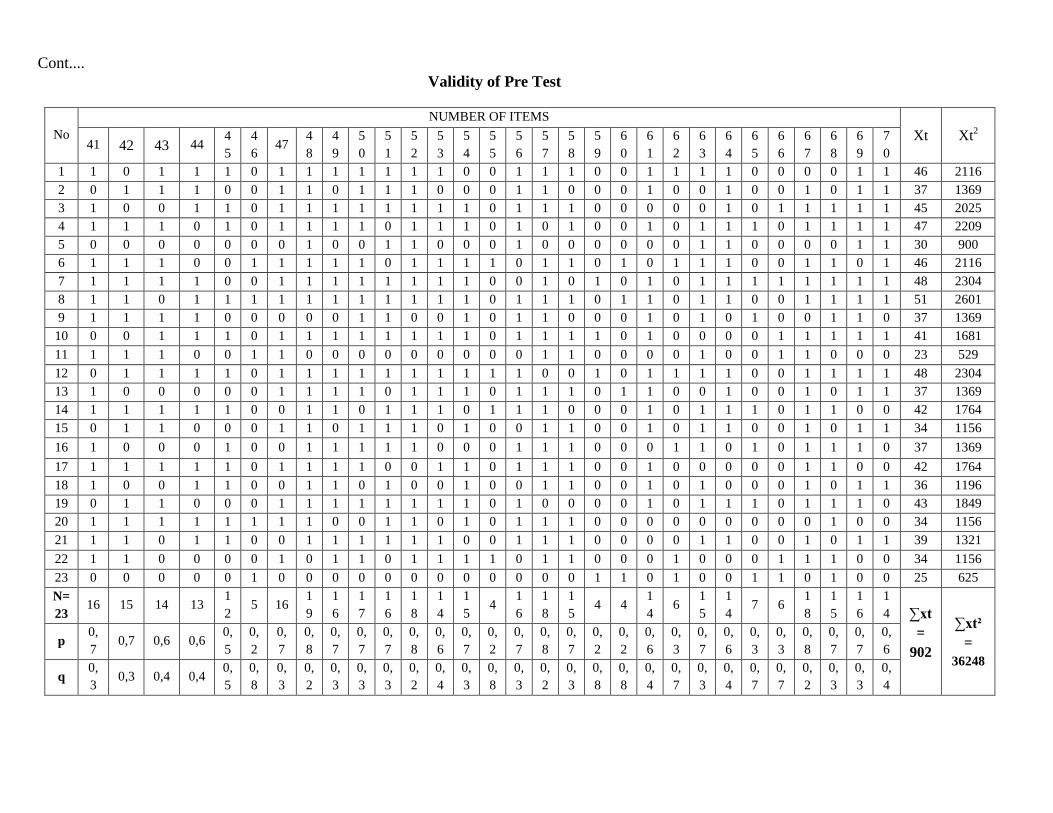
Cont....
Validity of Pre Test
No
NUMBER OF ITEMS
Xt Xt2
41 42 43 44 4
5
4
6 47
4
8
4
9
5
0
5
1
5
2
5
3
5
4
5
5
5
6
5
7
5
8
5
9
6
0
6
1
6
2
6
3
6
4
6
5
6
6
6
7
6
8
6
9
7
0
1 1 0 1 1 1 0 1 1 1 1 1 1 1 0 0 1 1 1 0 0 1 1 1 1 0 0 0 0 1 1 46 2116
2 0 1 1 1 0 0 1 1 0 1 1 1 0 0 0 1 1 0 0 0 1 0 0 1 0 0 1 0 1 1 37 1369
3 1 0 0 1 1 0 1 1 1 1 1 1 1 1 0 1 1 1 0 0 0 0 0 1 0 1 1 1 1 1 45 2025
4 1 1 1 0 1 0 1 1 1 1 0 1 1 1 0 1 0 1 0 0 1 0 1 1 1 0 1 1 1 1 47 2209
5 0 0 0 0 0 0 0 1 0 0 1 1 0 0 0 1 0 0 0 0 0 0 1 1 0 0 0 0 1 1 30 900
6 1 1 1 0 0 1 1 1 1 1 0 1 1 1 1 0 1 1 0 1 0 1 1 1 0 0 1 1 0 1 46 2116
7 1 1 1 1 0 0 1 1 1 1 1 1 1 1 0 0 1 0 1 0 1 0 1 1 1 1 1 1 1 1 48 2304
8 1 1 0 1 1 1 1 1 1 1 1 1 1 1 0 1 1 1 0 1 1 0 1 1 0 0 1 1 1 1 51 2601
9 1 1 1 1 0 0 0 0 0 1 1 0 0 1 0 1 1 0 0 0 1 0 1 0 1 0 0 1 1 0 37 1369
10 0 0 1 1 1 0 1 1 1 1 1 1 1 1 0 1 1 1 1 0 1 0 0 0 0 1 1 1 1 1 41 1681
11 1 1 1 0 0 1 1 0 0 0 0 0 0 0 0 0 1 1 0 0 0 0 1 0 0 1 1 0 0 0 23 529
12 0 1 1 1 1 0 1 1 1 1 1 1 1 1 1 1 0 0 1 0 1 1 1 1 0 0 1 1 1 1 48 2304
13 1 0 0 0 0 0 1 1 1 1 0 1 1 1 0 1 1 1 0 1 1 0 0 1 0 0 1 0 1 1 37 1369
14 1 1 1 1 1 0 0 1 1 0 1 1 1 0 1 1 1 0 0 0 1 0 1 1 1 0 1 1 0 0 42 1764
15 0 1 1 0 0 0 1 1 0 1 1 1 0 1 0 0 1 1 0 0 1 0 1 1 0 0 1 0 1 1 34 1156
16 1 0 0 0 1 0 0 1 1 1 1 1 0 0 0 1 1 1 0 0 0 1 1 0 1 0 1 1 1 0 37 1369
17 1 1 1 1 1 0 1 1 1 1 0 0 1 1 0 1 1 1 0 0 1 0 0 0 0 0 1 1 0 0 42 1764
18 1 0 0 1 1 0 0 1 1 0 1 0 0 1 0 0 1 1 0 0 1 0 1 0 0 0 1 0 1 1 36 1196
19 0 1 1 0 0 0 1 1 1 1 1 1 1 1 0 1 0 0 0 0 1 0 1 1 1 0 1 1 1 0 43 1849
20 1 1 1 1 1 1 1 1 0 0 1 1 0 1 0 1 1 1 0 0 0 0 0 0 0 0 0 1 0 0 34 1156
21 1 1 0 1 1 0 0 1 1 1 1 1 1 0 0 1 1 1 0 0 0 0 1 1 0 0 1 0 1 1 39 1321
22 1 1 0 0 0 0 1 0 1 1 0 1 1 1 1 0 1 1 0 0 0 1 0 0 0 1 1 1 0 0 34 1156
23 0 0 0 0 0 1 0 0 0 0 0 0 0 0 0 0 0 0 1 1 0 1 0 0 1 1 0 1 0 0 25 625
N=
23 16 15 14 13
1
2 5 16
1
9
1
6
1
7
1
6
1
8
1
4
1
5 4
1
6
1
8
1
5 4 4
1
4 6
1
5
1
4 7 6
1
8
1
5
1
6
1
4 ∑xt
=
902
∑xt²
=
36248
p 0,
7 0,7 0,6 0,6
0,
5
0,
2
0,
7
0,
8
0,
7
0,
7
0,
7
0,
8
0,
6
0,
7
0,
2
0,
7
0,
8
0,
7
0,
2
0,
2
0,
6
0,
3
0,
7
0,
6
0,
3
0,
3
0,
8
0,
7
0,
7
0,
6
q 0,
3 0,3 0,4 0,4
0,
5
0,
8
0,
3
0,
2
0,
3
0,
3
0,
3
0,
2
0,
4
0,
3
0,
8
0,
3
0,
2
0,
3
0,
8
0,
8
0,
4
0,
7
0,
3
0,
4
0,
7
0,
7
0,
2
0,
3
0,
3
0,
4

Appendix 7
Calculation of rpbi =
√
in Pre Test
A. Calculation of Pre-Test
1. Means score from score total (Mt)
Mt =
Mt =
= 39.21
2. Standard Deviation (SDt)
SDt = √
(
)
SDt = √
(
)
SDt = √
SDt = √ = √ = 6.21
3. Means Score (Mp)
Item 1 Mp1=
Mp1 =
Mp1 =
= 41.31
Item 2 Mp2=
Mp2 =
Mp2 =
= 40.93
Item 3 Mp3 =
Mp3==
Mp3 =
= 38.83
Item 4 Mp4 =
Mp4 =
Mp4 =
= 40.72
Item 5 Mp5 =
Mp5 =
Mp5=
= 41.37

Item 6 Mp6 =
Mp6 =
Mp6=
= 41.25
Item 7 Mp7 =
Mp7 =
Mp7=
= 41.06
Item 8 Mp8 =
Mp8=
Mp8 =
= 40.88
Item 9 Mp9=
Mp9=
Mp9=
= 41.66
Item 10 Mp10 =
Mp10 =
Mp10 =
= 40.56
Item 11 Mp11 =
Mp11 =
Mp11 =
= 41.05
Item 12 Mp12 =
Mp12 =
= 40.77
Item 13Mp13 =
Mp13 =
= 39.62
Item 14 Mp14 =

Mp14 =
Item 15 Mp15 =
Mp15 =
= 41.56
Item 16 Mp16 =
Mp16 =
Item 17 Mp17 =
Mp17 =
Item 18 Mp18 =
Mp18 =
Item 19 Mp19 =
Mp19 =
Item 20 Mp20 =
Mp20 =
Item 21 Mp21 =
Mp21 =
Item 22 Mp22 =
Mp22 =
Item 23 Mp23 =
Mp23 =
Item 24 Mp24 =
Mp24 =

Item 25 Mp25 =
Mp25 =
Item 26 Mp26=
Mp26 =
Item 27 Mp27=
Mp27 =
Item 28 Mp28=
Mp28 =
Item 29 Mp29=
Mp29 =
Item 30 Mp30=
Mp30 =
Item 31 Mp31=
Mp31 =
Item 32 Mp32=
Mp32 =
Item 33 Mp33=
Mp33 =
Item 34 Mp34=
Mp34 =
Item 35 Mp35=
Mp35 =

Item 36 Mp36=
Mp36 =
Item 37 Mp37=
Mp37 =
Item 38 Mp38=
Mp38 =
Item 39 Mp39=
Mp39 =
Item 40 Mp40=
Mp40 =
Item 41 Mp41=
Mp41 =
Item 42 Mp42=
Mp42 =
Item 43 Mp43=
Mp43 =
Item 44 Mp44=
Mp44 =
Item 45 Mp45=
Mp45 =
Item 46 Mp46=
Mp46 =
Item 47 Mp47=

Mp47 =
Item 48 Mp48=
Mp48 =
Item 49 Mp49=
Mp49 =
Item 50 Mp50=
Mp50 =
Item 51 Mp51=
Mp51 =
Item 52 Mp52=
Mp52 =
Item 53 Mp53=
Mp53 =
Item 54 Mp54=
Mp54 =
Item 55 Mp55=
Mp55 =
Item 56 Mp56=
Mp56 =
Item 57 Mp57=
Mp57 =
Item 58 Mp58=
Mp58 =

Item 59 Mp59=
Mp59 =
Item 60 Mp60=
Mp60 =
Item 61 Mp61=
Mp61 =
Item 62 Mp62=
Mp62 =
Item 63 Mp63=
Mp63 =
Item 64 Mp64=
Mp64 =
Item 65 Mp65=
Mp65 =
Item 66 Mp66=
Mp66 =
Item 67 Mp67=
Mp67 =
Item 68 Mp68=
Mp68 =
Item 69 Mp69=
Mp69 =

Item 70 Mp70=
Mp70 =

4. Calculation of the Formulation
√
Item 1 rpbi =
√
r =
√
r = 0.338 x 1.52 = 0.5137
Item 2 rpbi =
√
r =
√
r = 0.277 x 1.52 = 0.421
Item 3 rpbi =
√
r =
√
r = -0.061 x 0.5 = -0.0305
Item 4 rpbi =
√
r =
√
r = 0.243 x 2 = 0.486
Item 5 rpbi =
√
r =
√
r = 0.348 x 1.52 = 0.528
Item 6 rpbi =
√
r =
√
r = 0.329 x 1.52 = 0.500
Item 7 rpbi =
√
r =
√
r = 0.298 x 1.52 = 0.452
Item 8 rpbi =
√
r =
√

r = 0.269 x 2 = 0.538
Item 9 rpbi =
√
r =
√
r = 0.395 x 1.52 = 0.6004
Item 10 rpbi =
√
r =
√
r = 0.217 x 2 = 0.434
Item 11 rpbi =
√
r =
√
r = 0.296 x 2 = 0.592
Item 12 rpbi =
√
r =
√
r = 0.251 x 2 = 0.502
Item 13 rpbi =
√
r =
√
r = 0.066 x 0.64 = 0.042
Item 14 rpbi =
√
r =
√
r = 0.237 x 2 = 0.474
Item 15 rpbi =
√
r =
√
r = 0.379 x 1.52 = 0.576
Item 16 rpbi =
√
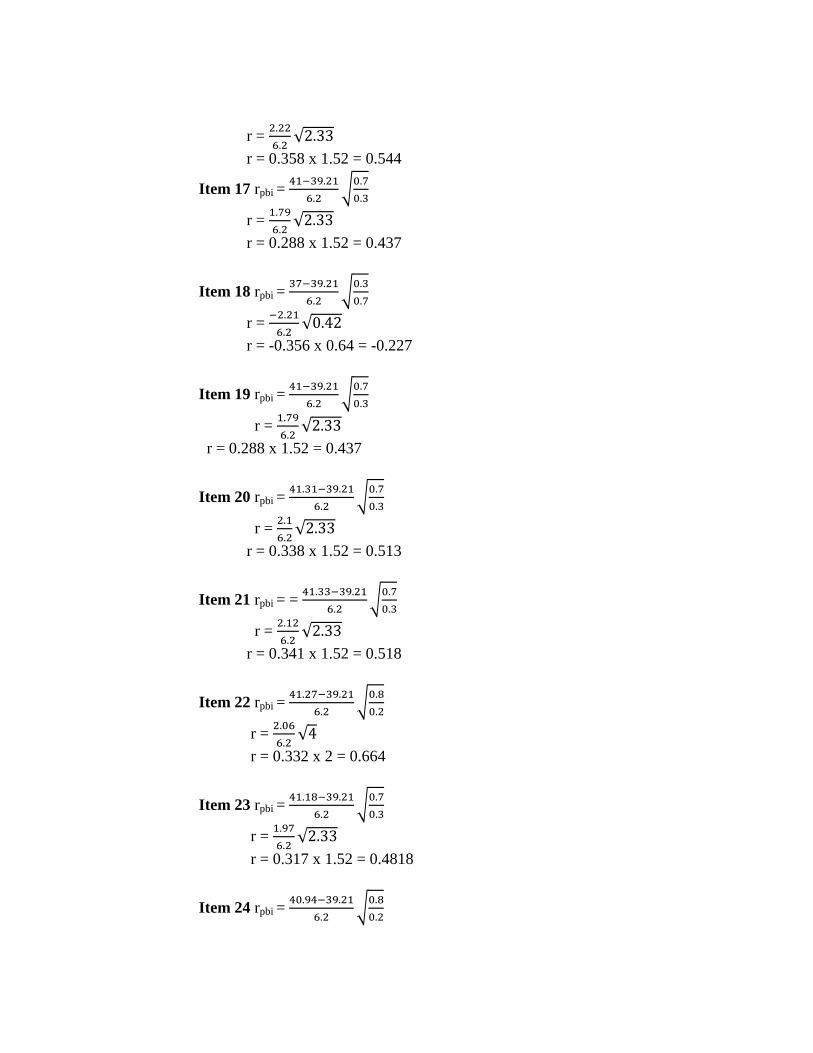
r =
√
r = 0.358 x 1.52 = 0.544
Item 17 rpbi =
√
r =
√
r = 0.288 x 1.52 = 0.437
Item 18 rpbi =
√
r =
√
r = -0.356 x 0.64 = -0.227
Item 19 rpbi =
√
r =
√
r = 0.288 x 1.52 = 0.437
Item 20 rpbi =
√
r =
√
r = 0.338 x 1.52 = 0.513
Item 21 rpbi = =
√
r =
√
r = 0.341 x 1.52 = 0.518
Item 22 rpbi =
√
r =
√
r = 0.332 x 2 = 0.664
Item 23 rpbi =
√
r =
√
r = 0.317 x 1.52 = 0.4818
Item 24 rpbi =
√

r =
√
r = 0.279 x 2 = 0.558
Item 25 rpbi =
√
r =
√
r = 0.151 x 3 = 0.454
Item 26 rpbi =
√
r =
√
r = 0.243 x 2 = 0.487
Item 27 rpbi =
√
r =
√
r = 0.225 x 2 = 0.45
Item 28 rpbi =
√
r =
√
r = -0.1306 x 0.5 = -0.065
Item 29 rpbi =
√
r =
√
r = 0.622 x 1.2 = 0.746
Item 30 rpbi =
√
r =
√
r = 0.517 x 1.2 = 0.621
Item 31 rpbi =
√
r =
√
r = 0.306 x 1.52 = 0.465
Item 32 rpbi =
√

r =
√
r = 0.262 x 2 = 0.524
Item 33 rpbi =
√
r =
√
r = -0.264 x 0.64 = -0.168
Item 34 rpbi =
√
r =
√
r = 0.288 x 1.52 = 0.4388
Item 35 rpbi = =
√
r =
√
r = 0.348 x 1.52 = 0.529
Item 36 rpbi = =
√
r =
√
r = 0.208 x 2 = 0.416
Item 37 rpbi =
√
r =
√
r = 0.317 x 1.52 = 0.4818
Item 38 rpbi =
√
r =
√
r = -0.114 x 0.64 = -0.073
Item 39 rpbi =
√
r =
√
r = 0.298 x 1.52 = 0.4529
Item 40 rpbi =
√
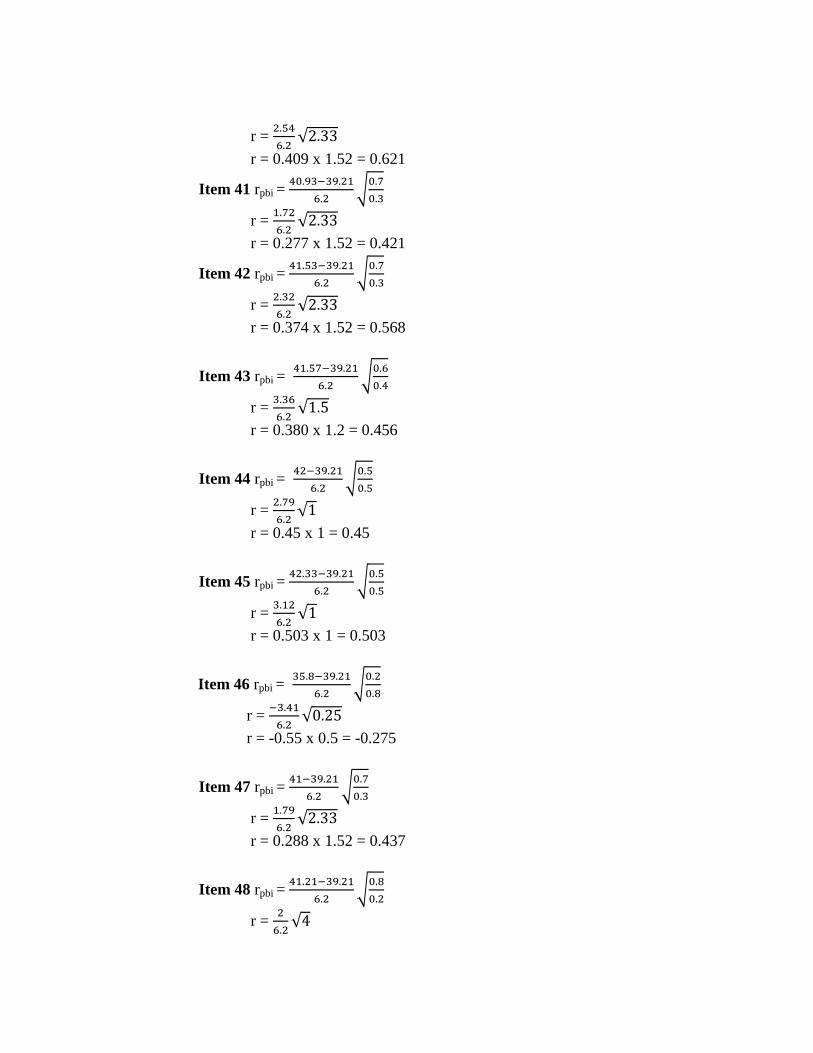
r =
√
r = 0.409 x 1.52 = 0.621
Item 41 rpbi =
√
r =
√
r = 0.277 x 1.52 = 0.421
Item 42 rpbi =
√
r =
√
r = 0.374 x 1.52 = 0.568
Item 43 rpbi =
√
r =
√
r = 0.380 x 1.2 = 0.456
Item 44 rpbi =
√
r =
√
r = 0.45 x 1 = 0.45
Item 45 rpbi =
√
r =
√
r = 0.503 x 1 = 0.503
Item 46 rpbi =
√
r =
√
r = -0.55 x 0.5 = -0.275
Item 47 rpbi =
√
r =
√
r = 0.288 x 1.52 = 0.437
Item 48 rpbi =
√
r =
√

r = 0.322 x 2 = 0.644
Item 49 rpbi =
√
r =
√
r = 0.55 x 1.52 = 0.836
Item 50 rpbi =
√
r =
√
r = 0.430 x 1.52 = 0.653
Item 51 rpbi =
√
r =
√
r = 0.308 x 1.52 = 0.468
Item 52 rpbi =
√
r =
√
r = 0.296 x 2 = 0.592
Item 53 rpbi =
√
r =
√
r = 0.691 x 1.2 = 0.829
Item 54 rpbi =
√
r =
√
r = 0.374 x 1.52 = 0.568
Item 55 rpbi =
√
r =
√
r = 0.530 x 0.5 = 0.265
Item 56 rpbi =
√
r =
√
r = 0.288 x 1.52 = 0.437
Item 57 rpbi =
√
r =
√
r = 0.251 x 2 = 0.502

Item 58 rpbi =
√
r =
√
r = 0.309 x 1.52 = 0.469
Item 59 rpbi =
√
r =
√
r = 0.208 x 0.5 = 0.104
Item 60 rpbi =
√
r =
√
r = 0.087 x 0.5 = 0.0435
Item 61 rpbi =
√
r =
√
r = 0.461 x 1.2 = 0.553
Item 62 rpbi =
√
r =
√
r = 0.0193 x 0.64 = 0.0123
Item 63 rpbi =
√
r =
√
r = 0.395 x 1.52 = 0.6004
Item 64 rpbi =
√
r =
√
r = 0.506 x 1.2 = 0.6072
Item 65 rpbi =
√
r =
√
r = 0.1032 x 0.64 = 0.0660
Item 66 rpbi =
√
r =
√
r = -0.517 x 0.64 = -0.3308
Item 67 rpbi =
√
r =
√

r = 0.216 x 2 = 0.432
Item 68 rpbi =
√
r =
√
r = 0.341 x 1.52 = 0.518
Item 69 rpbi =
√
r =
√
r = 0.288 x 1.52 = 0.437
Item 70 rpbi =
√
r =
√
r = 0.414 x 1.2 = 0.496

Appendix 8
Table of Pre Test Validity
Number of
Item P Q
√
on 5%
significant Interpretation
1 41.31 39.21 6.21 0.7 0.3 0.513 0.413 Valid
2 40.93 39.21 6.21 0.7 0.3 0.421 0.413 Valid
3 48.83 39.21 6.21 0.2 0.8 -0.0305 0.413 Invalid
4 40.72 39.21 6.21 0.8 0.2 0.486 0.413 Valid
5 41.37 39.21 6.21 0.7 0.3 0.528 0.413 Valid
6 41.25 39.21 6.21 0.7 0.3 0.500 0.413 Valid
7 41.06 39.21 6.21 0.7 0.3 0.452 0.413 Valid
8 40.88 39.21 6.21 0.8 0.2 0.538 0.413 Valid
9 41.66 39.21 6.21 0.7 0.3 0.6004 0.413 Valid
10 40.56 39.21 6.21 0.8 0.2 0.434 0.413 Valid
11 41.05 39.21 6.21 0.8 0.2 0.592 0.413 Valid
12 40.77 39.21 6.21 0.8 0.2 0.502 0.413 Valid
13 39.62 39.21 6.21 0.3 0.7 0.042 0.413 Invalid
14 40.68 39.21 6.21 0.8 0.2 0.474 0.413 Valid
15 41.56 39.21 6.21 0.7 0.3 0.576 0.413 Valid
16 41.43 39.21 6.21 0.7 0.3 0.544 0.413 Valid
17 41 39.21 6.21 0.7 0.3 0.437 0.413 Valid
18 37 39.21 6.21 0.3 0.7 -0.227 0.413 Invalid
19 41 39.21 6.21 0.7 0.3 0.437 0.413 Valid
20 41.31 39.21 6.21 0.7 0.3 0.513 0.413 Valid
21 41.33 39.21 6.21 0.7 0.3 0.518 0.413 Valid
22 41.27 39.21 6.21 0.8 0.2 0.664 0.413 Valid
23 41.18 39.21 6.21 0.7 0.3 0.481 0.413 Valid
24 40.94 39.21 6.21 0.8 0.2 0.558 0.413 Valid
25 40.15 39.21 6.21 0.9 0.1 0.454 0.413 Valid
26 40.72 39.21 6.21 0.8 0.2 0.487 0.413 Valid
27 40.61 39.21 6.21 0.8 0.2 0.45 0.413 Valid
28 38.4 39.21 6.21 0.2 0.8 -0.065 0.413 Invalid
29 43.07 39.21 6.21 0.6 0.4 0.746 0.413 Valid
30 42.42 39.21 6.21 0.6 0.4 0.621 0.413 Valid
31 41.11 39.21 6.21 0.8 0.2 0.465 0.413 Valid
32 40.84 39.21 6.21 0.8 0.2 0.524 0.413 Valid
33 37.57 39.21 6.21 0.3 0.7 -0.168 0.413 Invalid
34 41 39.21 6.21 0.7 0.3 0.438 0.413 Valid
35 41.37 39.21 6.21 0.7 0.3 0.529 0.413 Valid
36 40.5 39.21 6.21 0.8 0.2 0.416 0.413 Valid
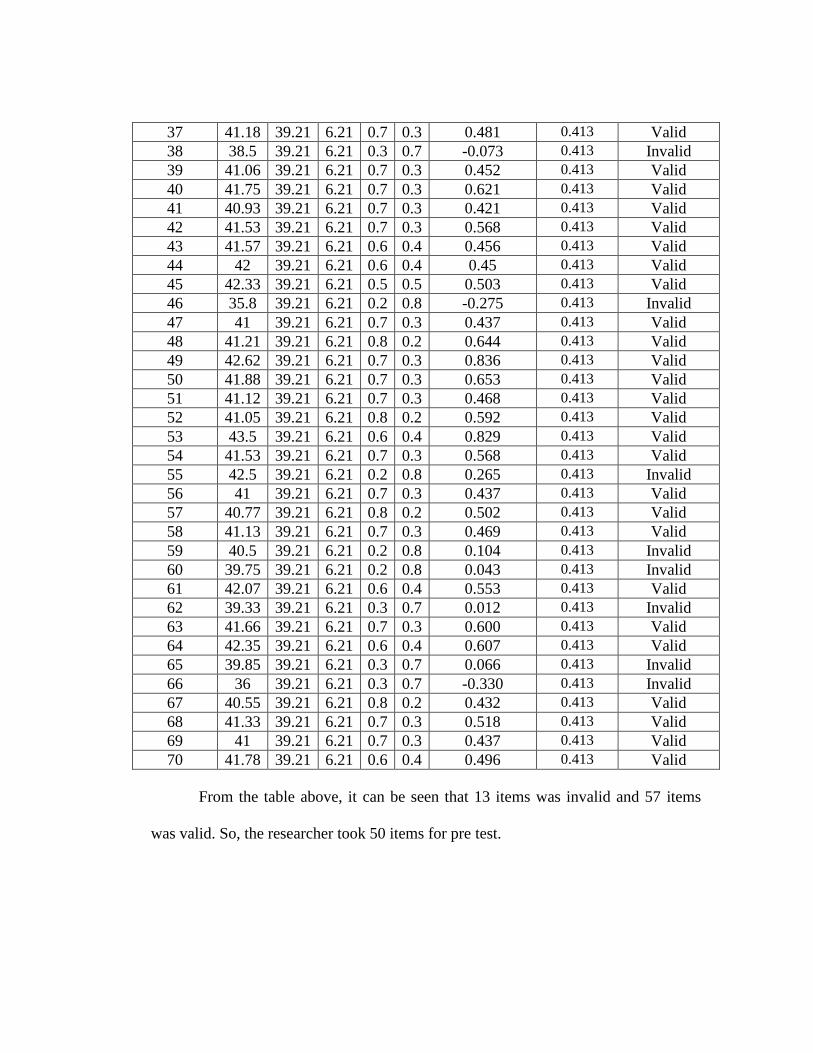
37 41.18 39.21 6.21 0.7 0.3 0.481 0.413 Valid
38 38.5 39.21 6.21 0.3 0.7 -0.073 0.413 Invalid
39 41.06 39.21 6.21 0.7 0.3 0.452 0.413 Valid
40 41.75 39.21 6.21 0.7 0.3 0.621 0.413 Valid
41 40.93 39.21 6.21 0.7 0.3 0.421 0.413 Valid
42 41.53 39.21 6.21 0.7 0.3 0.568 0.413 Valid
43 41.57 39.21 6.21 0.6 0.4 0.456 0.413 Valid
44 42 39.21 6.21 0.6 0.4 0.45 0.413 Valid
45 42.33 39.21 6.21 0.5 0.5 0.503 0.413 Valid
46 35.8 39.21 6.21 0.2 0.8 -0.275 0.413 Invalid
47 41 39.21 6.21 0.7 0.3 0.437 0.413 Valid
48 41.21 39.21 6.21 0.8 0.2 0.644 0.413 Valid
49 42.62 39.21 6.21 0.7 0.3 0.836 0.413 Valid
50 41.88 39.21 6.21 0.7 0.3 0.653 0.413 Valid
51 41.12 39.21 6.21 0.7 0.3 0.468 0.413 Valid
52 41.05 39.21 6.21 0.8 0.2 0.592 0.413 Valid
53 43.5 39.21 6.21 0.6 0.4 0.829 0.413 Valid
54 41.53 39.21 6.21 0.7 0.3 0.568 0.413 Valid
55 42.5 39.21 6.21 0.2 0.8 0.265 0.413 Invalid
56 41 39.21 6.21 0.7 0.3 0.437 0.413 Valid
57 40.77 39.21 6.21 0.8 0.2 0.502 0.413 Valid
58 41.13 39.21 6.21 0.7 0.3 0.469 0.413 Valid
59 40.5 39.21 6.21 0.2 0.8 0.104 0.413 Invalid
60 39.75 39.21 6.21 0.2 0.8 0.043 0.413 Invalid
61 42.07 39.21 6.21 0.6 0.4 0.553 0.413 Valid
62 39.33 39.21 6.21 0.3 0.7 0.012 0.413 Invalid
63 41.66 39.21 6.21 0.7 0.3 0.600 0.413 Valid
64 42.35 39.21 6.21 0.6 0.4 0.607 0.413 Valid
65 39.85 39.21 6.21 0.3 0.7 0.066 0.413 Invalid
66 36 39.21 6.21 0.3 0.7 -0.330 0.413 Invalid
67 40.55 39.21 6.21 0.8 0.2 0.432 0.413 Valid
68 41.33 39.21 6.21 0.7 0.3 0.518 0.413 Valid
69 41 39.21 6.21 0.7 0.3 0.437 0.413 Valid
70 41.78 39.21 6.21 0.6 0.4 0.496 0.413 Valid
From the table above, it can be seen that 13 items was invalid and 57 items
was valid. So, the researcher took 50 items for pre test.

Appendix 9
Validity of Post Test
No
NUMBER OF ITEMS
1 2 3 4 5 6 7 8 9 1
0
1
1
1
2
1
3
1
4
1
5
1
6
1
7
1
8
1
9
2
0
2
1
2
2
2
3
2
4
2
5
2
6
2
7
2
8
2
9
3
0
3
1
3
2
3
3
3
4
3
5
3
6
3
7
3
8
3
9
4
0
1 1 1 1 1 1 1 0 1 0 1 0 1 1 1 1 1 1 1 1 0 1 1 1 0 0 0 1 0 1 1 1 1 1 1 1 1 0 1 1 1
2 1 1 1 1 1 1 1 1 0 1 0 0 1 1 0 0 1 1 1 0 1 1 1 1 0 0 1 0 1 0 1 0 1 1 1 1 1 0 0 0
3 0 0 1 1 1 1 0 1 1 1 1 1 1 1 0 1 1 1 1 1 0 1 0 1 0 1 1 1 1 1 1 1 1 0 1 1 1 1 1 1
4 1 1 1 0 1 1 1 1 1 1 0 1 1 1 0 1 1 1 1 1 1 1 1 0 0 0 1 1 1 0 1 1 1 1 1 1 1 1 1 1
5 0 0 1 0 0 0 0 1 0 1 0 0 0 0 0 0 1 1 0 1 0 0 1 1 1 0 1 0 0 1 1 1 1 0 0 1 1 0 0 1
6 1 1 1 0 1 1 1 1 0 1 0 1 1 1 0 1 1 1 1 1 0 1 1 1 0 0 1 0 0 0 1 1 0 0 1 1 1 1 1 1
7 1 1 0 1 1 1 0 1 1 1 0 1 1 1 0 1 1 1 1 0 0 1 1 1 0 0 1 1 1 1 1 0 1 0 0 1 1 1 1 1
8 1 0 1 1 1 0 1 1 0 1 1 1 0 1 0 0 0 1 1 1 1 1 0 1 0 1 1 0 1 1 1 1 1 1 1 1 1 1 1 1
9 1 1 1 1 1 1 1 1 0 1 0 0 1 1 0 1 1 1 1 0 1 1 1 1 0 0 1 0 1 1 0 0 0 1 0 1 1 0 1 0
10 0 1 1 0 0 1 0 1 0 1 0 1 1 0 1 1 0 1 0 1 1 1 1 1 0 0 0 0 1 1 1 1 1 1 1 1 1 1 0 1
11 0 1 0 0 1 1 0 0 0 0 0 0 0 0 0 0 0 0 1 0 0 0 0 0 0 0 1 0 0 0 1 1 1 0 0 1 0 0 1 0
12 1 1 1 1 0 1 1 1 0 1 1 1 1 1 0 1 1 1 1 1 1 1 1 1 0 1 1 0 1 1 0 0 1 1 1 1 1 1 1 1
13 0 0 1 1 1 1 1 1 0 0 0 1 1 1 0 0 0 1 1 1 1 1 0 0 1 0 1 0 1 1 1 1 1 1 1 1 0 1 1 0
14 1 1 0 1 0 0 1 0 1 1 0 1 1 0 0 1 1 1 1 0 1 1 1 1 0 0 1 1 1 0 1 1 1 1 1 1 1 1 0 1
15 1 1 0 1 1 1 1 1 0 1 0 1 1 1 0 1 1 1 1 1 1 0 1 1 0 0 1 0 1 1 1 1 1 1 0 1 1 0 1 1
16 0 0 1 1 1 0 1 1 0 1 0 0 0 1 0 0 0 1 1 1 0 1 1 1 1 0 0 0 0 1 1 1 1 0 1 1 1 0 1 1
17 1 1 1 1 1 0 0 0 0 0 0 1 1 1 0 1 1 1 1 1 1 1 0 1 0 0 1 0 1 0 1 1 1 1 1 1 0 1 1 1
18 0 0 1 1 0 1 0 1 0 0 1 1 0 1 0 1 1 1 1 0 1 1 1 1 0 1 1 0 1 1 1 1 1 1 1 1 0 0 0 0
19 1 1 0 1 0 1 1 1 1 1 0 1 1 0 1 0 0 1 0 1 1 1 1 1 1 0 1 1 1 0 1 1 1 1 0 1 1 1 1 1
20 1 1 1 1 1 1 1 0 0 0 0 0 1 1 0 1 1 1 0 1 0 1 0 1 0 0 0 0 0 1 1 1 0 0 1 1 1 0 0 1
21 1 0 0 0 1 0 1 1 0 1 0 1 1 1 0 0 1 1 0 1 1 0 1 1 1 0 1 0 1 1 1 1 1 1 0 1 0 1 1 0
22 1 0 0 1 1 1 1 1 1 1 0 1 1 1 0 1 1 1 0 1 0 1 1 0 0 0 0 1 0 1 1 1 0 0 1 0 1 1 1 1
23 0 0 1 1 1 0 1 0 0 1 0 1 1 1 0 1 0 1 0 0 1 0 1 1 0 0 1 0 1 1 1 1 1 1 1 1 1 1 1 0
N=
23
1
5
1
4
1
8
1
6
1
7
1
5
1
5
1
8 6
1
8 4
1
7
1
7
1
8 3
1
5
1
6
2
2
1
5
1
4
1
5
1
8
1
7
1
9 5 4
1
9 6
1
7
1
5
2
1
1
9
1
6
1
5
1
6
2
2
1
7
1
5
1
7
1
6
P
0
,
7
0
,
6
0
,
8
0
,
7
0
,
7
0
,
7
0
,
7
0
,
8
0
,
2
0,
8
0,
2
0,
7
0,
7
0,
8
0,
1
0,
7
0,
7
0,
9
0,
7
0,
6
0,
7
0,
8
0,
7
0,
8
0,
2
0,
2
0,
8
0,
2
0,
7
0,
7
0,
9
0,
8
0,
7
0,
7
0,
7
0,
9
0,
7
0,
7
0,
7
0,
7
Q
0
,
3
0
,
4
0
,
2
0
,
3
0
,
3
0
,
3
0
,
3
0
,
2
0
,
8
0,
2
0,
8
0,
3
0,
3
0,
2
0,
9
0,
3
0,
3
0,
1
0,
3
0,
4
0,
3
0,
2
0,
3
0,
2
0,
8
0,
8
0,
2
0,
8
0,
3
0,
3
0,
1
0,
2
0,
3
0,
3
0,
3
0,
1
0,
3
0,
3
0,
3
0,
3

Cont....
Validity of Post Test
No
NUMBER OF ITEMS
Xt Xt2
41 42 43 44 4
5
4
6 47
4
8
4
9
5
0
5
1
5
2
5
3
5
4
5
5
5
6
5
7
5
8
5
9
6
0
6
1
6
2
6
3
6
4
6
5
6
6
6
7
6
8
6
9 70
1 1 0 1 0 0 1 1 1 1 1 0 1 1 0 1 1 1 1 1 0 1 1 1 1 1 1 0 0 0 0 50 2500
2 0 1 1 0 0 1 1 1 0 1 0 1 0 0 0 0 1 0 1 0 1 0 0 1 1 0 1 0 0 0 40 1600
3 1 0 0 0 1 1 1 1 1 1 1 1 1 1 1 0 1 1 1 1 0 0 0 1 0 1 1 1 0 0 51 2601
4 1 1 1 0 0 1 1 1 1 1 0 1 1 1 1 0 0 1 1 1 1 0 1 1 1 1 1 1 0 0 52 2704
5 0 0 0 1 0 0 0 1 0 0 0 1 0 0 1 0 0 0 1 1 0 0 1 1 1 0 0 0 1 0 33 1089
6 1 1 1 0 0 1 1 1 1 1 0 1 1 1 1 0 1 1 0 1 0 1 1 1 0 0 1 1 0 0 47 2209
7 1 1 1 0 0 1 1 1 1 1 0 1 1 1 1 0 1 0 1 0 0 0 1 1 1 1 1 1 0 1 49 2401
8 1 1 0 0 1 1 0 1 1 1 1 1 1 1 1 0 1 1 1 1 1 0 1 1 1 1 1 1 0 0 54 2916
9 1 1 1 0 0 1 1 0 0 1 0 0 0 1 1 0 1 0 1 0 1 0 1 0 1 0 0 1 0 0 42 1764
10 0 0 1 0 0 0 1 1 1 1 0 1 1 0 1 1 1 1 1 1 1 0 0 0 0 1 1 1 0 0 44 1936
11 1 1 1 0 0 1 1 1 0 0 0 1 0 0 0 0 1 1 0 1 0 0 1 0 1 1 1 0 0 0 30 900
12 0 1 1 0 1 0 1 0 1 1 1 1 1 1 1 0 0 0 1 1 1 1 1 1 1 1 0 1 0 0 51 2601
13 1 0 0 0 0 1 1 1 1 1 0 0 1 1 0 0 1 1 1 1 1 0 0 1 0 1 1 0 1 0 44 1936
14 1 1 1 0 0 0 0 1 1 0 0 1 1 0 1 0 1 0 1 0 1 0 1 1 1 1 1 1 0 0 45 2025
15 0 1 1 0 0 1 1 1 0 1 0 1 0 1 1 0 1 1 0 1 1 0 1 1 1 0 1 0 0 1 47 2209
16 1 0 0 0 0 1 0 1 1 1 0 1 0 0 1 0 1 1 0 1 0 1 1 0 1 1 1 1 0 0 41 1681
17 1 1 1 0 0 1 0 1 1 1 0 0 1 1 0 0 1 1 1 1 1 0 0 0 0 0 1 1 0 0 44 1936
18 1 0 0 0 1 0 1 1 1 0 1 0 0 1 0 0 1 1 1 0 1 0 1 0 1 1 1 0 0 1 42 1764
19 0 1 1 0 0 0 1 1 1 1 0 1 1 1 1 1 0 0 1 1 1 0 1 1 1 1 1 1 1 0 51 2601
20 1 1 1 0 0 1 1 1 0 0 0 1 0 1 1 0 1 1 0 0 0 0 0 0 0 0 0 1 0 0 38 1444
21 1 1 0 1 0 1 0 1 1 1 0 0 1 0 0 0 1 1 1 1 1 0 1 1 1 1 1 0 0 1 43 1849
22 1 1 0 0 0 1 1 1 1 1 0 1 1 1 1 0 1 1 1 1 0 1 0 0 0 0 1 1 0 0 44 1936
23 0 0 0 0 0 1 0 1 0 1 0 1 1 1 0 0 0 0 1 1 1 0 1 1 1 0 1 1 0 0 40 1600
N=
23 17 15 15 2 4
1
7 16
2
1
1
6
1
8 4
1
7
1
5
1
5
1
6 3
1
8
1
5
1
7
1
5
1
5 5
1
6
1
7
1
6
1
4
1
8
1
5 3 4
∑xt=
1022
∑xt²
=
46202
p 0,7 0,7 0,7 0,1 0,
1
0,
7
0,
7
0,
9
0,
7
0,
8
0,
1
0,
7
0,
7
0,
7
0,
7
0,
1
0,
8
0,
7
0,
7
0,
7
0,
7
0,
2
0,
7
0,
7
0,
7
0,
6
0,
8
0,
7
0,
1
0,
1
q 0,3 0,3 0,3 0,9 0,
9
0,
3
0,
3
0,
1
0,
3
0,
2
0,
9
0,
3
0,
3
0,
3
0,
3
0,
9
0,
2
0,
3
0,
3
0,
3
0,
3
0,
8
0,
3
0,
3
0,
3
0,
4
0,
2
0,
3
0,
9
0,
9

Appendix 10
Calculation of rpbi =
√
in Post Test
A. Calculation of Post-Test
1. Means score from score total (Mt)
Mt =
Mt =
= 44.43
2. Standard Deviation (SDt)
SDt = √
(
)
SDt = √
(
)
SDt = √
SDt = √ = √ = 5.89
3. Means Score (Mp)
Item 1 Mp1=
Mp1 =
Mp1 =
= 46.46
Item 2 Mp2=
Mp2 =
Mp2 =
= 46.62
Item 3 Mp3 =
Mp3=
Mp3 =
= 46.29
Item 4 Mp4 =
Mp4 =
Mp4 =
= 46.43
Item 5 Mp5 =

Mp5 =
Mp5 =
= 46.29
Item 6 Mp6 =
Mp6 =
Mp6 =
= 46.13
Item 7 Mp7 =
Mp7 =
Mp7 =
= 46.25
Item 8 Mp8 =
Mp8 =
Mp8 =
= 45.83
Item 9 Mp9 =
Mp9 =
Mp9 =
= 48.66
Item 10 Mp10 =
Mp10 =
Mp10 =
= 45.78
Item 11 Mp11 =
Mp11 =
Mp11 =
= 49.5
Item 12 Mp12 =
Mp12 =
Mp12 = 49.29

Item 13 Mp13 =
Mp13 =
Mp13 = 46.29
Item 14 Mp14 =
Mp14 =
Item 15 Mp15 =
Mp15 =
= 48.33
Item 16 Mp16 =
Mp16 =
Item 17 Mp17 =
Mp17 =
Item 18 Mp18 =
Mp18 =
Item 19 Mp19 =
Mp19 =
Item 20 Mp20 =
Mp20 =
Item 21 Mp21 =
Mp21 =
Item 22 Mp22 =
Mp22 =
Item 23 Mp23 =

Mp23 =
Item 24 Mp24 =
Mp24 =
Item 25 Mp25 =
Mp25 =
Item 26 Mp26=
Mp26 =
Item 27 Mp27=
Mp27 =
Item 28 Mp28=
Mp28 =
Item 29 Mp29=
Mp29 =
Item 30 Mp30=
Mp30 =
Item 31 Mp31=
Mp31 =
Item 32 Mp32=
Mp32 =
Item 33 Mp33=
Mp33 =
Item 34 Mp34=

Mp34 =
Item 35 Mp35=
Mp35 =
Item 36 Mp36=
Mp36 =
Item 37 Mp37=
Mp37 =
Item 38 Mp38=
Mp38 =
Item 39 Mp39=
Mp39 =
Item 40 Mp40=
Mp40 =
Item 41 Mp41=
Mp41 =
Item 42 Mp42=
Mp42 =
Item 43 Mp43=
Mp43 =
Item 44 Mp44=
Mp44 =
Item 45 Mp45=
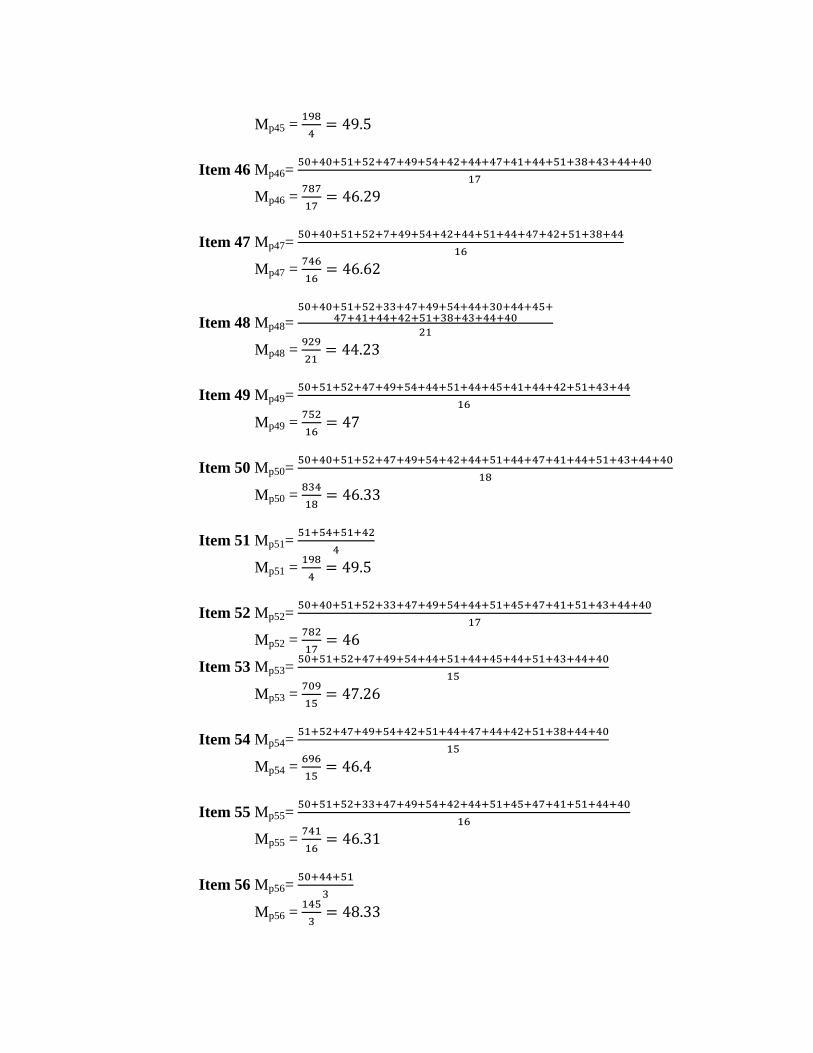
Mp45 =
Item 46 Mp46=
Mp46 =
Item 47 Mp47=
Mp47 =
Item 48 Mp48=
Mp48 =
Item 49 Mp49=
Mp49 =
Item 50 Mp50=
Mp50 =
Item 51 Mp51=
Mp51 =
Item 52 Mp52=
Mp52 =
Item 53 Mp53=
Mp53 =
Item 54 Mp54=
Mp54 =
Item 55 Mp55=
Mp55 =
Item 56 Mp56=
Mp56 =

Item 57 Mp57=
Mp57 =
Item 58 Mp58=
Mp58 =
Item 59 Mp59=
Mp59 =
Item 60 Mp60=
Mp60 =
Item 61 Mp61=
Mp61 =
Item 62 Mp62=
Mp62 =
Item 63 Mp63=
Mp63 =
Item 64 Mp64=
Mp64 =
Item 65 Mp65=
Mp65 =
Item 66 Mp66=
Mp66 =
Item 67 Mp67=
Mp67 =
Item 68 Mp68=

Mp68 =
Item 69 Mp69=
Mp69 =
Item 70 Mp70=
Mp70 =

4. Calculation of the Formulation
√
Item 1
√
rpbi =
√
r =
√
r = 0.334 x 1.52 = 0.522
Item 2 rpbi =
√
r =
√
r = 0.38 x 1.2 = 0.456
Item 3 rpbi =
√
r =
√
r = 0.32 x 1.52 = 0.486
Item 4 rpbi =
√
r =
√
r = 0.34 x 1.52= 0.516
Item 5 rpbi =
√
r =
√
r = 0.32 x 1.52= 0.486
Item 6 rpbi =
√
r =
√
r = 0.288 x 1.52 = 0.437
Item 7 rpbi =
√
r =
√
r = 0.31 x 1.52 = 0.471

Item 8 rpbi =
√
r =
√
r = 0.24 x 2 = 0.48
Item 9 rpbi =
√
r =
√
r = 0.71 x 0.5 = 0.355
Item 10 rpbi =
√
r =
√
r = 0.229 x 2 = 0.458
Item 11 rpbi =
√
r =
√
r = 0.86 x 0.3 = 0.258
Item 12 rpbi =
√
r =
√
r = 0.825 x 1.52 = 0.542
Item 13 rpbi =
√
r =
√
r = 0.315 x 1.52 = 0.4788
Item 14 rpbi =
√
r =
√
r = 0.303 x 2 = 0.606
Item 15 rpbi =
√
r =
√
r = 0.662 x 0.33 = 0.2184

Item 16 rpbi =
√
r =
√
r = 0.368 x 1.52 = 0.5593
Item 17 rpbi =
√
r =
√
r = 0.334 x 1.52 = 0.507
Item 18 rpbi =
√
r =
√
r = 0.112 x 3 = 0.336
Item 19 rpbi =
√
r =
√
r = 0.368 x 1.52 = 0.5593
Item 20 rpbi =
√
r =
√
r = 0.351 x 1.22 = 0.428
Item 21 rpbi =
√
r =
√
r = 0.300 x 1.52= 0.456
Item 22 rpbi =
√
r =
√
r = 0.275 x 2 = 0.55
Item 23 rpbi =
√
r =
√
r = 0.266 x 2 = 0.532

Item 24 rpbi =
√
r =
√
r = 0.187 x 3 = 0.561
Item 25 rpbi =
√
r =
√
r = -0.344 x 0.3= -0.103
Item 26 rpbi =
√
r =
√
r = 0.86 x 0.3= 0.258
Item 27 rpbi =
√
r =
√
r = 0.266 x 2 = 0.532
Item 28 rpbi =
√
r =
√
r = 0.718 x 0.5 = 0.359
Item 29 rpbi =
√
r =
√
r = 0.266 x 2 = 0.532
Item 30 rpbi =
√
r =
√
r = 0.322 x 1.52 = 0.4894
Item 31 rpbi =
√
r =
√
r = -0.033 x 3 = -0.1018

Item 32 rpbi =
√
r =
√
r = 0.266 x 2 = 0.532
Item 33 rpbi =
√
r =
√
r = 0.186 x 3 = 0.5093
Item 34 rpbi =
√
r =
√
r = 0.378 x 1.52 = 0.5745
Item 35 rpbi =
√
r =
√
r = 0.308 x 1.52 = 0.4681
Item 36 rpbi =
√
r =
√
r = 0.0034 x 3 = 0.0102
Item 37 rpbi =
√
r =
√
r = 0.232 x 2 = 0.465
Item 38 rpbi =
√
r =
√
r = 0.480 x 1.52 = 0.7296
Item 39 rpbi =
√
r =
√
r = 0.246 x 2 = 0.492
Item 40 rpbi =
√

r =
√
r = 0.319 x 1.52 = 0.4848
Item 41 rpbi =
√
r =
√
r = 0.436 x 1.52 = 0.662
Item 42 rpbi =
√
r =
√
r = 0.276 x 1.52 = 0.4206
Item 43 rpbi =
√
r =
√
r = 0.368 x 1.52 = 0.559
Item 44 rpbi =
√
r =
√
r = -1.09 x 0.33 = -0.359
Item 45 rpbi =
√
r =
√
r = 0.860 x 0.33 = 0.2838
Item 46 rpbi =
√
r =
√
r = 0.315 x 1.52 = 0.4788
Item 47 rpbi =
√
r =
√
r = 0.371 x 1.52 = 0.5639
Item 48 rpbi =
√
r =
√
r = -0.033 x 3 = -0.099

Item 49 rpbi =
√
r =
√
r = 0.436 x 1.52 = 0.6627
Item 50 rpbi =
√
r =
√
r = 0.322 x 2 = 0.644
Item 51 rpbi =
√
r =
√
r = 0.860 x 0.5 = 0.532
Item 52 rpbi =
√
r =
√
r = 0.276x 1.52 = 0.419
Item 53 rpbi =
√
r =
√
r = 0.480 x 1.2 = 0.576
Item 54 rpbi =
√
r =
√
r = 0.334 x 1.52 = 0.507
Item 55 rpbi =
√
r =
√
r = 0.319 x 1.52 = 0.4848
Item 56 rpbi =
√
r =
√
r = 0.662 x 0.33 = 0.218
Item 57 rpbi =
√

r =
√
r = 0.237 x 2 = 0.474
Item 58 rpbi =
√
r =
√
r = 0.436 x 1.52 = 0.662
Item 59 rpbi =
√
r =
√
r = 0.266 x 2 = 0.532
Item 60 rpbi =
√
r =
√
r = 0.334 x 1.52 = 0.5076
Item 61 rpbi =
√
r =
√
r = 0.27 x 1.52 = 0.414
Item 62 rpbi =
√
r =
√
r = 0.368 x 0.5 = 0.184
Item 63 rpbi =
√
r =
√
r = 0.361 x 1.52 = 0.548
Item 64 rpbi =
√
r =
√
r = 0.344 x 1.52 = 0.522
Item 65 rpbi =
√

r =
√
r = 0.293 x 1.52 = 0.445
Item 66 rpbi =
√
r =
√
r = 0.398 x 1.52 = 0.6049
Item 67 rpbi =
√
r =
√
r = 0.275 x 2 = 0.55
Item 68 rpbi =
√
r =
√
r = 0.3005 x 1.52 = 0.4567
Item 69 rpbi =
√
r =
√
r = -0.300 x 0.33 = -0.099
Item 70 rpbi =
√
r =
√
r = 0.139 x 0.5 = 0.0695

Appendix 11
Table of Post Test Validity
Number of
Item P Q
√
on 5%
significant Interpretation
1 46.46 44.43 5.89 0.7 0.3 0.522 0.413 Valid
2 46.62 44.43 5.89 0.6 0.4 0.456 0.413 Valid
3 46.29 44.43 5.89 0.8 0.2 0.486 0.413 Valid
4 46.43 44.43 5.89 0.6 0.4 0.516 0.413 Valid
5 46.29 44.43 5.89 0.7 0.3 0.486 0.413 Valid
6 46.13 44.43 5.89 0.7 0.3 0.437 0.413 Valid
7 46.25 44.43 5.89 0.7 0.3 0.471 0.413 Valid
8 45.83 44.43 5.89 0.8 0.2 0.48 0.413 Valid
9 46.88 44.43 5.89 0.2 0.8 0.355 0.413 Invalid
10 45.78 44.43 5.89 0.8 0.2 0.458 0.413 Valid
11 49.5 44.43 5.89 0.2 0.8 0.258 0.413 Invalid
12 49.29 44.43 5.89 0.8 0.2 0.542 0.413 Valid
13 46.29 44.43 5.89 0.7 0.3 0.478 0.413 Valid
14 46.22 44.43 5.89 0.8 0.2 0.606 0.413 Valid
15 48.33 44.43 5.89 0.1 0.9 0.218 0.413 Invalid
16 46.6 44.43 5.89 0.7 0.3 0.559 0.413 Valid
17 46.4 44.43 5.89 0.7 0.3 0.507 0.413 Valid
18 45.09 44.43 5.89 0.9 0.1 0.336 0.413 Invalid
19 46.6 44.43 5.89 0.7 0.3 0.559 0.413 Valid
20 46.5 44.43 5.89 0.6 0.4 0.428 0.413 Valid
21 46.2 44.43 5.89 0.7 0.3 0.456 0.413 Valid
22 46.05 44.43 5.89 0.8 0.2 0.55 0.413 Valid
23 46 44.43 5.89 0.7 0.3 0.532 0.413 Valid
24 45.53 44.43 5.89 0.8 0.2 0.561 0.413 Valid
25 42.4 44.43 5.89 0.2 0.8 -0.103 0.413 Invalid
26 49.5 44.43 5.89 0.2 0.8 0.258 0.413 Invalid
27 46 44.43 5.89 0.8 0.2 0.532 0.413 Valid
28 48.66 44.43 5.89 0.2 0.8 0.359 0.413 Invalid
29 46.41 44.43 5.89 0.7 0.3 0.532 0.413 Valid
30 46.33 44.43 5.89 0.7 0.3 0.489 0.413 Valid
31 46.23 44.43 5.89 0.9 0.1 -0.101 0.413 Invalid
32 46 44.43 5.89 0.8 0.2 0.532 0.413 Valid
33 45.53 44.43 5.89 0.7 0.3 0.509 0.413 Valid
34 46.66 44.43 5.89 0.7 0.3 0.574 0.413 Valid
35 46.25 44.43 5.89 0.7 0.3 0.468 0.413 Valid
36 44.45 44.43 5.89 0.9 0.1 0.010 0.413 Invalid

37 45.8 44.43 5.89 0.7 0.3 0.465 0.413 Valid
38 47.26 44.43 5.89 0.7 0.3 0.729 0.413 Valid
39 45.88 44.43 5.89 0.7 0.3 0.492 0.413 Valid
40 46.31 44.43 5.89 0.7 0.3 0.484 0.413 Valid
41 47 44.43 5.89 0.7 0.3 0.662 0.413 Valid
42 46.06 44.43 5.89 0.7 0.3 0.420 0.413 Valid
43 46.6 44.43 5.89 0.7 0.3 0.559 0.413 Valid
44 38 44.43 5.89 0.1 0.9 -0.359 0.413 Invalid
45 49.5 44.43 5.89 0.1 0.9 0.283 0.413 Invalid
46 46.29 44.43 5.89 0.7 0.3 0.478 0.413 Valid
47 46.62 44.43 5.89 0.7 0.3 0.563 0.413 Valid
48 44.23 44.43 5.89 0.9 0.1 -0.099 0.413 Invalid
49 47 44.43 5.89 0.7 0.3 0.662 0.413 Valid
50 46.33 44.43 5.89 0.8 0.2 0.644 0.413 Valid
51 49.5 44.43 5.89 0.1 0.9 0.532 0.413 Valid
52 46 44.43 5.89 0.7 0.3 0.419 0.413 Valid
53 47.26 44.43 5.89 0.7 0.3 0.576 0.413 Valid
54 46.4 44.43 5.89 0.7 0.3 0.507 0.413 Valid
55 46.31 44.43 5.89 0.7 0.3 0.484 0.413 Valid
56 48.33 44.43 5.89 0.1 0.9 0.218 0.413 Invalid
57 45.83 44.43 5.89 0.8 0.2 0.474 0.413 Valid
58 47 44.43 5.89 0.7 0.3 0.662 0.413 Valid
59 46 44.43 5.89 0.7 0.3 0.532 0.413 Valid
60 46.4 44.43 5.89 0.7 0.3 0.507 0.413 Valid
61 45.93 44.43 5.89 0.7 0.3 0.414 0.413 Valid
62 46.6 44.43 5.89 0.2 0.8 0.184 0.413 Invalid
63 46.56 44.43 5.89 0.7 0.3 0.548 0.413 Valid
64 46.46 44.43 5.89 0.7 0.3 0.522 0.413 Valid
65 46.12 44.43 5.89 0.7 0.3 0.445 0.413 Valid
66 46.78 44.43 5.89 0.6 0.4 0.604 0.413 Valid
67 46.05 44.43 5.89 0.8 0.2 0.55 0.413 Valid
68 46.2 44.43 5.89 0.7 0.3 0.456 0.413 Valid
69 42.66 44.43 5.89 0.1 0.9 -0.099 0.413 Invalid
70 45.25 44.43 5.89 0.1 0.9 0.069 0.413 Invalid
From the table above, it can be seen that 16 items was invalid and 54 items
was valid. So, the researcher took 50 items for post test.

Appendix 12
Reliabilty of Pre Test
No
NUMBER OF ITEMS
1 2 3 4 5 6 7 8 9 1
0
1
1
1
2
1
3
1
4
1
5
1
6
1
7
1
8
1
9
2
0
2
1
2
2
2
3
2
4
2
5
2
6
2
7
2
8
2
9
3
0
3
1
3
2
3
3
3
4
3
5
3
6
3
7
3
8
3
9
40
1 1 1 0 1 1 1 0 1 1 1 1 1 0 1 1 1 1 0 1 0 1 1 1 0 1 1 1 0 1 1 1 1 0 1 1 1 0 0 1 1
2 1 1 0 1 1 1 0 1 0 1 1 0 0 1 1 0 1 0 1 0 1 1 1 1 1 1 1 0 1 0 1 0 0 1 1 1 1 0 0 0
3 0 0 0 1 1 1 1 1 1 1 1 1 0 1 1 1 1 0 1 1 0 1 1 1 1 1 1 0 1 1 1 1 0 0 1 1 1 0 1 1
4 1 1 0 1 1 1 1 1 1 1 1 1 0 1 1 1 1 0 1 1 1 1 0 0 1 1 1 0 1 1 1 1 0 1 1 1 1 0 1 1
5 1 1 0 1 0 1 0 1 1 1 0 1 0 1 0 1 0 0 0 1 0 0 1 1 1 0 1 0 0 0 1 1 1 0 0 1 1 0 0 1
6 1 1 1 0 1 1 1 1 0 1 1 1 1 1 0 1 1 0 1 1 0 1 1 1 1 1 1 0 0 0 1 1 0 0 1 1 1 1 1 1
7 1 1 0 1 1 1 0 1 1 1 0 1 0 1 1 1 1 0 1 1 0 1 1 1 1 1 1 1 1 1 1 0 1 0 0 1 1 0 1 1
8 1 0 1 1 1 0 1 1 1 1 1 1 0 1 1 0 0 0 1 1 1 1 0 1 1 1 1 0 1 1 1 1 1 1 1 1 1 0 1 1
9 1 1 0 1 1 1 1 1 1 1 1 0 1 1 0 1 1 1 1 0 1 1 1 1 1 1 1 0 1 1 0 1 0 1 0 1 1 0 1 0
10 0 1 1 0 0 1 0 1 1 1 0 1 0 0 1 1 0 1 0 1 1 1 1 1 1 1 0 0 1 1 1 1 1 1 1 0 1 1 0 1
11 0 0 0 0 1 1 0 0 0 0 1 0 0 0 0 0 0 0 1 0 0 0 0 0 1 1 1 0 0 0 0 1 0 0 0 1 0 0 1 0
12 0 1 0 1 0 1 1 1 1 1 1 1 1 1 1 1 1 0 1 1 1 1 1 1 1 1 1 0 1 1 1 0 0 1 1 1 1 0 1 1
13 1 0 0 1 1 1 1 1 0 0 0 1 0 1 1 0 0 0 1 0 1 1 0 0 1 0 1 0 1 1 1 1 0 1 1 1 0 0 1 0
14 1 1 0 1 0 0 1 0 1 1 1 1 1 0 0 1 1 0 1 1 1 1 1 1 0 1 1 1 1 0 0 1 0 1 1 1 1 0 0 1
15 1 1 0 1 1 1 1 1 1 1 1 1 0 1 1 1 1 1 1 1 1 0 1 1 1 0 1 0 0 1 1 1 1 1 0 1 1 0 1 1
16 1 0 0 1 1 0 1 1 1 1 1 0 0 1 1 0 0 0 1 1 0 1 1 1 1 1 0 0 0 1 0 1 0 0 1 1 1 0 1 1
17 1 1 0 1 1 0 1 0 1 0 1 1 1 1 1 1 1 1 1 1 1 1 0 1 0 1 1 0 1 0 1 1 0 1 1 1 0 1 1 1
18 0 0 1 1 0 1 0 1 0 0 1 1 0 1 1 1 1 0 1 0 1 1 1 1 1 1 1 0 0 1 1 1 0 1 1 1 0 0 0 0
19 1 1 0 1 0 1 1 1 1 1 1 1 1 0 1 0 0 1 0 1 1 1 0 1 1 0 1 1 0 0 1 1 0 1 0 0 1 1 1 1
20 1 1 1 1 1 1 1 0 0 0 1 0 0 1 1 1 1 0 0 1 0 1 1 1 0 1 0 0 0 1 1 1 0 0 1 0 1 0 0 1
21 1 1 0 0 1 0 1 1 0 1 1 1 0 1 1 1 1 0 0 1 1 0 1 1 1 1 1 0 1 1 0 1 0 1 0 1 1 0 1 0
22 0 0 0 1 1 0 1 1 1 1 1 1 1 1 0 1 1 0 0 1 0 0 1 0 1 1 0 1 0 0 1 1 1 0 1 0 0 1 1 1
23 0 0 1 0 0 0 0 0 0 1 0 1 1 1 0 0 0 1 0 0 1 1 0 1 1 0 1 1 0 0 0 0 1 1 1 0 0 1 0 0

Cont....
Reliabilty of Pre Test
N
o
NUMBER OF ITEMS
Xt Xt2
41 42 43 44 4
5
4
6
4
7
4
8
4
9
5
0
5
1
5
2
5
3
5
4
5
5
5
6
5
7
5
8
5
9
6
0
6
1
6
2
6
3
6
4
6
5
6
6
6
7
6
8
6
9
7
0
1 1 0 1 1 1 0 1 1 1 1 1 1 1 0 0 1 1 1 0 0 1 1 1 1 0 0 0 0 1 1 46 2116
2 0 1 1 1 0 0 1 1 0 1 1 1 0 0 0 1 1 0 0 0 1 0 0 1 0 0 1 0 1 1 37 1369
3 1 0 0 1 1 0 1 1 1 1 1 1 1 1 0 1 1 1 0 0 0 0 0 1 0 1 1 1 1 1 45 2025
4 1 1 1 0 1 0 1 1 1 1 0 1 1 1 0 1 0 1 0 0 1 0 1 1 1 0 1 1 1 1 47 2209
5 0 0 0 0 0 0 0 1 0 0 1 1 0 0 0 1 0 0 0 0 0 0 1 1 0 0 0 0 1 1 30 900
6 1 1 1 0 0 1 1 1 1 1 0 1 1 1 1 0 1 1 0 1 0 1 1 1 0 0 1 1 0 1 46 2116
7 1 1 1 1 0 0 1 1 1 1 1 1 1 1 0 0 1 0 1 0 1 0 1 1 1 1 1 1 1 1 48 2304
8 1 1 0 1 1 1 1 1 1 1 1 1 1 1 0 1 1 1 0 1 1 0 1 1 0 0 1 1 1 1 51 2601
9 1 1 1 1 0 0 0 0 0 1 1 0 0 1 0 1 1 0 0 0 1 0 1 0 1 0 0 1 1 0 37 1369
10 0 0 1 1 1 0 1 1 1 1 1 1 1 1 0 1 1 1 1 0 1 0 0 0 0 1 1 1 1 1 41 1681
11 1 1 1 0 0 1 1 0 0 0 0 0 0 0 0 0 1 1 0 0 0 0 1 0 0 1 1 0 0 0 23 529
12 0 1 1 1 1 0 1 1 1 1 1 1 1 1 1 1 0 0 1 0 1 1 1 1 0 0 1 1 1 1 48 2304
13 1 0 0 0 0 0 1 1 1 1 0 1 1 1 0 1 1 1 0 1 1 0 0 1 0 0 1 0 1 1 37 1369
14 1 1 1 1 1 0 0 1 1 0 1 1 1 0 1 1 1 0 0 0 1 0 1 1 1 0 1 1 0 0 42 1764
N=
23
1
6
1
5 6
1
8
1
6
1
6
1
5
1
8
1
5
1
8
1
8
1
8 8
1
9
1
6
1
6
1
5 6
1
6
1
6
1
5
1
8
1
6
1
8
2
0
1
8
1
8 5
1
3
1
4
1
7
1
9 7
1
5
1
6
1
8
1
6 6
1
6 16
P
0
,
7
0
,
7
0
,
2
0
,
8
0
,
7
0
,
7
0
,
7
0
,
8
0
,
7
0
,
8
0
,
8
0
,
8
0
,
3
0
,
8
0
,
7
0
,
7
0
,
7
0
,
3
0
,
7
0
,
7
0
,
7
0
,
8
0
,
7
0
,
8
0
,
9
0
,
8
0
,
8
0
,
2
0
,
6
0
,
6
0
,
8
0
,
8
0
,
3
0
,
7
0
,
7
0
,
8
0
,
7
0
,
3
0
,
7
0,
7
Q
0
,
3
0
,
3
0
,
8
0
,
2
0
,
3
0
,
3
0
,
3
0
,
2
0
,
3
0
,
2
0
,
2
0
,
2
0
,
7
0
,
2
0
,
3
0
,
3
0
,
3
0
,
7
0
,
3
0
,
3
0
,
3
0
,
2
0
,
3
0
,
2
0
,
1
0
,
2
0
,
2
0
,
8
0
,
4
0
,
4
0
,
2
0
,
2
0
,
7
0
,
3
0
,
3
0
,
2
0
,
3
0
,
7
0
,
3
0,
3

15 0 1 1 0 0 0 1 1 0 1 1 1 0 1 0 0 1 1 0 0 1 0 1 1 0 0 1 0 1 1 34 1156
16 1 0 0 0 1 0 0 1 1 1 1 1 0 0 0 1 1 1 0 0 0 1 1 0 1 0 1 1 1 0 37 1369
17 1 1 1 1 1 0 1 1 1 1 0 0 1 1 0 1 1 1 0 0 1 0 0 0 0 0 1 1 0 0 42 1764
18 1 0 0 1 1 0 0 1 1 0 1 0 0 1 0 0 1 1 0 0 1 0 1 0 0 0 1 0 1 1 36 1196
19 0 1 1 0 0 0 1 1 1 1 1 1 1 1 0 1 0 0 0 0 1 0 1 1 1 0 1 1 1 0 43 1849
20 1 1 1 1 1 1 1 1 0 0 1 1 0 1 0 1 1 1 0 0 0 0 0 0 0 0 0 1 0 0 34 1156
21 1 1 0 1 1 0 0 1 1 1 1 1 1 0 0 1 1 1 0 0 0 0 1 1 0 0 1 0 1 1 39 1321
22 1 1 0 0 0 0 1 0 1 1 0 1 1 1 1 0 1 1 0 0 0 1 0 0 0 1 1 1 0 0 34 1156
23 0 0 0 0 0 1 0 0 0 0 0 0 0 0 0 0 0 0 1 1 0 1 0 0 1 1 0 1 0 0 25 625
N
=
23
16 15 14 13 1
2 5
1
6
1
9
1
6
1
7
1
6
1
8
1
4
1
5 4
1
6
1
8
1
5 4 4
1
4 6
1
5
1
4 7 6
1
8
1
5
1
6
1
4
∑xt
=
902
∑xt²
=
36248
p 0,
7 0,7 0,6 0,6
0
,
5
0
,
2
0,
7
0
,
8
0
,
7
0
,
7
0
,
7
0
,
8
0
,
6
0
,
7
0
,
2
0
,
7
0
,
8
0
,
7
0
,
2
0
,
2
0
,
6
0
,
3
0
,
7
0
,
6
0
,
3
0
,
3
0
,
8
0
,
7
0
,
7
0,
6
q 0,
3 0,3 0,4 0,4
0
,
5
0
,
8
0,
3
0
,
2
0
,
3
0
,
3
0
,
3
0
,
2
0
,
4
0
,
3
0
,
8
0
,
3
0
,
2
0
,
3
0
,
8
0
,
8
0
,
4
0
,
7
0
,
3
0
,
4
0
,
7
0
,
7
0
,
2
0
,
3
0
,
3
0,
4
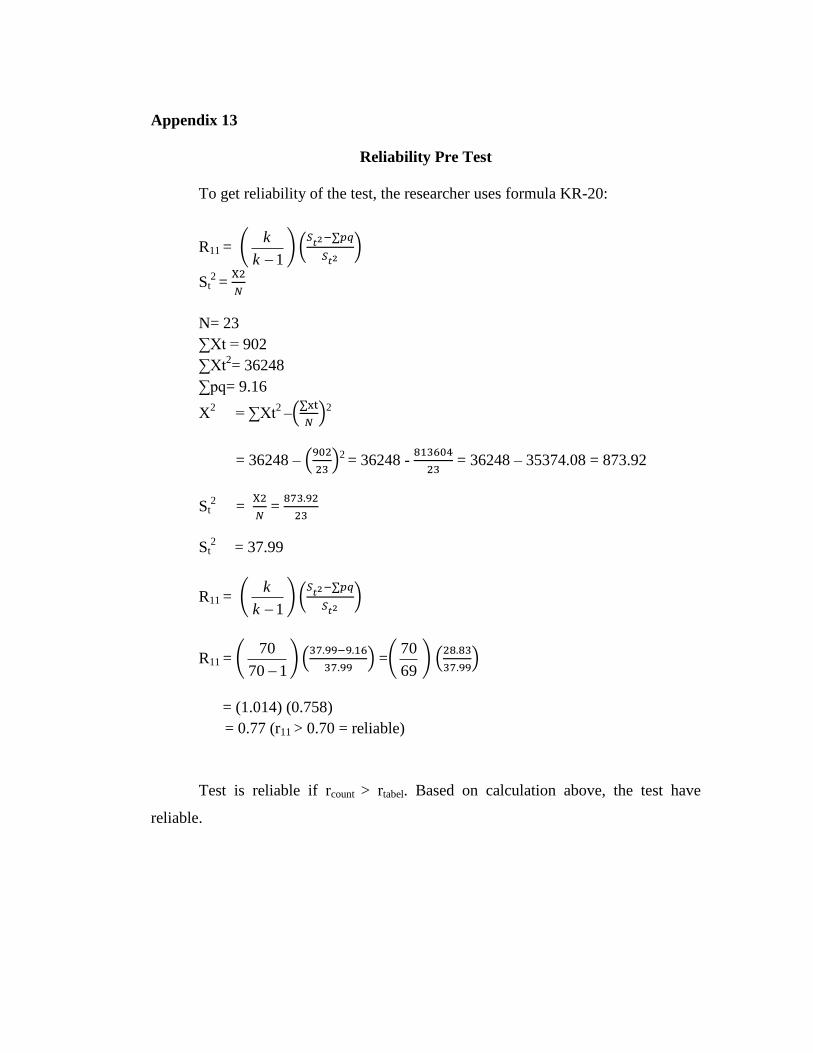
Appendix 13
Reliability Pre Test
To get reliability of the test, the researcher uses formula KR-20:
R11 = (1k
k) (
)
St2
=
N= 23
∑Xt = 902
∑Xt2= 36248
∑pq= 9.16
X2 = ∑Xt
2 –(
)2
= 36248 – (
)2
= 36248 -
= 36248 – 35374.08 = 873.92
St2 =
=
St2
= 37.99
R11 = (1k
k) (
)
R11 = (170
70
) (
) =(
69
70) (
)
= (1.014) (0.758)
= 0.77 (r11 > 0.70 = reliable)
Test is reliable if rcount > rtabel. Based on calculation above, the test have
reliable.

Appendix 14
Reliability of Post Test
No
NUMBER OF ITEMS
1 2 3 4 5 6 7 8 9 1
0
1
1
1
2
1
3
1
4
1
5
1
6
1
7
1
8
1
9
2
0
2
1
2
2
2
3
2
4
2
5
2
6
2
7
2
8
2
9
3
0
3
1
3
2
3
3
3
4
3
5
3
6
3
7
3
8
3
9
40
1 1 1 1 1 1 1 0 1 0 1 0 1 1 1 1 1 1 1 1 0 1 1 1 0 0 0 1 0 1 1 1 1 1 1 1 1 0 1 1 1
2 1 1 1 1 1 1 1 1 0 1 0 0 1 1 0 0 1 1 1 0 1 1 1 1 0 0 1 0 1 0 1 0 1 1 1 1 1 0 0 0
3 0 0 1 1 1 1 0 1 1 1 1 1 1 1 0 1 1 1 1 1 0 1 0 1 0 1 1 1 1 1 1 1 1 0 1 1 1 1 1 1
4 1 1 1 0 1 1 1 1 1 1 0 1 1 1 0 1 1 1 1 1 1 1 1 0 0 0 1 1 1 0 1 1 1 1 1 1 1 1 1 1
5 0 0 1 0 0 0 0 1 0 1 0 0 0 0 0 0 1 1 0 1 0 0 1 1 1 0 1 0 0 1 1 1 1 0 0 1 1 0 0 1
6 1 1 1 0 1 1 1 1 0 1 0 1 1 1 0 1 1 1 1 1 0 1 1 1 0 0 1 0 0 0 1 1 0 0 1 1 1 1 1 1
7 1 1 0 1 1 1 0 1 1 1 0 1 1 1 0 1 1 1 1 0 0 1 1 1 0 0 1 1 1 1 1 0 1 0 0 1 1 1 1 1
8 1 0 1 1 1 0 1 1 0 1 1 1 0 1 0 0 0 1 1 1 1 1 0 1 0 1 1 0 1 1 1 1 1 1 1 1 1 1 1 1
9 1 1 1 1 1 1 1 1 0 1 0 0 1 1 0 1 1 1 1 0 1 1 1 1 0 0 1 0 1 1 0 0 0 1 0 1 1 0 1 0
10 0 1 1 0 0 1 0 1 0 1 0 1 1 0 1 1 0 1 0 1 1 1 1 1 0 0 0 0 1 1 1 1 1 1 1 1 1 1 0 1
11 0 1 0 0 1 1 0 0 0 0 0 0 0 0 0 0 0 0 1 0 0 0 0 0 0 0 1 0 0 0 1 1 1 0 0 1 0 0 1 0
12 1 1 1 1 0 1 1 1 0 1 1 1 1 1 0 1 1 1 1 1 1 1 1 1 0 1 1 0 1 1 0 0 1 1 1 1 1 1 1 1
13 0 0 1 1 1 1 1 1 0 0 0 1 1 1 0 0 0 1 1 1 1 1 0 0 1 0 1 0 1 1 1 1 1 1 1 1 0 1 1 0
14 1 1 0 1 0 0 1 0 1 1 0 1 1 0 0 1 1 1 1 0 1 1 1 1 0 0 1 1 1 0 1 1 1 1 1 1 1 1 0 1
15 1 1 0 1 1 1 1 1 0 1 0 1 1 1 0 1 1 1 1 1 1 0 1 1 0 0 1 0 1 1 1 1 1 1 0 1 1 0 1 1
16 0 0 1 1 1 0 1 1 0 1 0 0 0 1 0 0 0 1 1 1 0 1 1 1 1 0 0 0 0 1 1 1 1 0 1 1 1 0 1 1
17 1 1 1 1 1 0 0 0 0 0 0 1 1 1 0 1 1 1 1 1 1 1 0 1 0 0 1 0 1 0 1 1 1 1 1 1 0 1 1 1
18 0 0 1 1 0 1 0 1 0 0 1 1 0 1 0 1 1 1 1 0 1 1 1 1 0 1 1 0 1 1 1 1 1 1 1 1 0 0 0 0
19 1 1 0 1 0 1 1 1 1 1 0 1 1 0 1 0 0 1 0 1 1 1 1 1 1 0 1 1 1 0 1 1 1 1 0 1 1 1 1 1
20 1 1 1 1 1 1 1 0 0 0 0 0 1 1 0 1 1 1 0 1 0 1 0 1 0 0 0 0 0 1 1 1 0 0 1 1 1 0 0 1
21 1 0 0 0 1 0 1 1 0 1 0 1 1 1 0 0 1 1 0 1 1 0 1 1 1 0 1 0 1 1 1 1 1 1 0 1 0 1 1 0
22 1 0 0 1 1 1 1 1 1 1 0 1 1 1 0 1 1 1 0 1 0 1 1 0 0 0 0 1 0 1 1 1 0 0 1 0 1 1 1 1
23 0 0 1 1 1 0 1 0 0 1 0 1 1 1 0 1 0 1 0 0 1 0 1 1 0 0 1 0 1 1 1 1 1 1 1 1 1 1 1 0

Cont....
Reliability of Post Test
N=
23
1
5
1
4
1
8
1
6
1
7
1
5
1
5
1
8 6
1
8 4
1
7
1
7
1
8 3
1
5
1
6
2
2
1
5
1
4
1
5
1
8
1
7
1
9 5 4
1
9 6
1
7
1
5
2
1
1
9
1
6
1
5
1
6
2
2
1
7
1
5
1
7 16
P 0,
7
0
,
6
0
,
8
0
,
7
0
,
7
0
,
7
0
,
7
0
,
8
0
,
2
0
,
8
0
,
2
0
,
7
0
,
7
0
,
8
0
,
1
0
,
7
0
,
7
0
,
9
0
,
7
0
,
6
0
,
7
0
,
8
0
,
7
0
,
8
0
,
2
0
,
2
0
,
8
0
,
2
0
,
7
0
,
7
0
,
9
0
,
8
0
,
7
0
,
7
0
,
7
0
,
9
0
,
7
0
,
7
0
,
7
0,
7
Q 0,
3
0
,
4
0
,
2
0
,
3
0
,
3
0
,
3
0
,
3
0
,
2
0
,
8
0
,
2
0
,
8
0
,
3
0
,
3
0
,
2
0
,
9
0
,
3
0
,
3
0
,
1
0
,
3
0
,
4
0
,
3
0
,
2
0
,
3
0
,
2
0
,
8
0
,
8
0
,
2
0
,
8
0
,
3
0
,
3
0
,
1
0
,
2
0
,
3
0
,
3
0
,
3
0
,
1
0
,
3
0
,
3
0
,
3
0,
3
No
NUMBER OF ITEMS
Xt Xt2
41 42 43 44 4
5
4
6
4
7
4
8
4
9
5
0
5
1
5
2
5
3
5
4
5
5
5
6
5
7
5
8
5
9
6
0
6
1
6
2
6
3
6
4
6
5
6
6
6
7
6
8
6
9 70
1 1 0 1 0 0 1 1 1 1 1 0 1 1 0 1 1 1 1 1 0 1 1 1 1 1 1 0 0 0 0 50 2500
2 0 1 1 0 0 1 1 1 0 1 0 1 0 0 0 0 1 0 1 0 1 0 0 1 1 0 1 0 0 0 40 1600
3 1 0 0 0 1 1 1 1 1 1 1 1 1 1 1 0 1 1 1 1 0 0 0 1 0 1 1 1 0 0 51 2601
4 1 1 1 0 0 1 1 1 1 1 0 1 1 1 1 0 0 1 1 1 1 0 1 1 1 1 1 1 0 0 52 2704
5 0 0 0 1 0 0 0 1 0 0 0 1 0 0 1 0 0 0 1 1 0 0 1 1 1 0 0 0 1 0 33 1089
6 1 1 1 0 0 1 1 1 1 1 0 1 1 1 1 0 1 1 0 1 0 1 1 1 0 0 1 1 0 0 47 2209
7 1 1 1 0 0 1 1 1 1 1 0 1 1 1 1 0 1 0 1 0 0 0 1 1 1 1 1 1 0 1 49 2401
8 1 1 0 0 1 1 0 1 1 1 1 1 1 1 1 0 1 1 1 1 1 0 1 1 1 1 1 1 0 0 54 2916
9 1 1 1 0 0 1 1 0 0 1 0 0 0 1 1 0 1 0 1 0 1 0 1 0 1 0 0 1 0 0 42 1764
10 0 0 1 0 0 0 1 1 1 1 0 1 1 0 1 1 1 1 1 1 1 0 0 0 0 1 1 1 0 0 44 1936
11 1 1 1 0 0 1 1 1 0 0 0 1 0 0 0 0 1 1 0 1 0 0 1 0 1 1 1 0 0 0 30 900
12 0 1 1 0 1 0 1 0 1 1 1 1 1 1 1 0 0 0 1 1 1 1 1 1 1 1 0 1 0 0 51 2601
13 1 0 0 0 0 1 1 1 1 1 0 0 1 1 0 0 1 1 1 1 1 0 0 1 0 1 1 0 1 0 44 1936
14 1 1 1 0 0 0 0 1 1 0 0 1 1 0 1 0 1 0 1 0 1 0 1 1 1 1 1 1 0 0 45 2025
15 0 1 1 0 0 1 1 1 0 1 0 1 0 1 1 0 1 1 0 1 1 0 1 1 1 0 1 0 0 1 47 2209

16 1 0 0 0 0 1 0 1 1 1 0 1 0 0 1 0 1 1 0 1 0 1 1 0 1 1 1 1 0 0 41 1681
17 1 1 1 0 0 1 0 1 1 1 0 0 1 1 0 0 1 1 1 1 1 0 0 0 0 0 1 1 0 0 44 1936
18 1 0 0 0 1 0 1 1 1 0 1 0 0 1 0 0 1 1 1 0 1 0 1 0 1 1 1 0 0 1 42 1764
19 0 1 1 0 0 0 1 1 1 1 0 1 1 1 1 1 0 0 1 1 1 0 1 1 1 1 1 1 1 0 51 2601
20 1 1 1 0 0 1 1 1 0 0 0 1 0 1 1 0 1 1 0 0 0 0 0 0 0 0 0 1 0 0 38 1444
21 1 1 0 1 0 1 0 1 1 1 0 0 1 0 0 0 1 1 1 1 1 0 1 1 1 1 1 0 0 1 43 1849
22 1 1 0 0 0 1 1 1 1 1 0 1 1 1 1 0 1 1 1 1 0 1 0 0 0 0 1 1 0 0 44 1936
23 0 0 0 0 0 1 0 1 0 1 0 1 1 1 0 0 0 0 1 1 1 0 1 1 1 0 1 1 0 0 40 1600
N=
23 17 15 15 2 4
1
7
1
6
2
1
1
6
1
8 4
1
7
1
5
1
5
1
6 3
1
8
1
5
1
7
1
5
1
5 5
1
6
1
7
1
6
1
4
1
8
1
5 3 4
∑xt=
1022
∑xt²
=
46202
p 0,
7 0,7 0,7 0,1
0
,
1
0
,
7
0,
7
0
,
9
0
,
7
0
,
8
0
,
1
0
,
7
0
,
7
0
,
7
0
,
7
0
,
1
0
,
8
0
,
7
0
,
7
0
,
7
0
,
7
0
,
2
0
,
7
0
,
7
0
,
7
0
,
6
0
,
8
0
,
7
0
,
1
0,1
q 0,
3 0,3 0,3 0,9
0
,
9
0
,
3
0,
3
0
,
1
0
,
3
0
,
2
0
,
9
0
,
3
0
,
3
0
,
3
0
,
3
0
,
9
0
,
2
0
,
3
0
,
3
0
,
3
0
,
3
0
,
8
0
,
3
0
,
3
0
,
3
0
,
4
0
,
2
0
,
3
0
,
9
0,9

Appendix 15
Reliability Post-Test
To get reliability of the test, the researcher uses formula KR-20:
R11 = (1k
k) (
)
St2
=
N= 23
∑Xt = 1022
∑Xt2
= 46202
∑pq = 8.41
X2 = ∑Xt
2 – (
)2
= 46202 – (
)2
= 46202 -
= 46202 - 45412.34 = 789.66
St2 =
=
St2 = 27.66
R11 = (1k
k) (
)
R11 = (170
70
) (
) = (
69
70) (
)
= (1.014) (0.75)
= 0.76 (r11 > 0.70 = reliable)
Test is reliable if rcount > rtabel. Based on calculation above, the test have
reliable.

Appendix 16
Score of Experimental Class and Control Class on Pre Test
1. PRE TEST
a. Pre Test Score of Experimental Class
No. The Initial Name of Students Score Pre-Test
1 AQ 64
2 AA 40
3 AR 32
4 ASR 52
5 DAL 60
6 DZ Hsb 46
7 DA 52
8 EA 56
9 ES 64
10 FP 56
11 FK 78
12 HR 80
13 HSY 58
14 IM 56
15 IA 64
16 IK 70
17 IHB 64
18 KAK 64
19 KM 52
20 LT 64
21 LK 78
22 MA 44
23 MK 64

24 MM 66
25 MS Nst 68
26 MDR 82
27 MR 68
28 MZ 80
29 MRi 68
30 N Hsb 64
31 NF 70
32 RAS 84
33 RI 72
34 R Hrp 46
35 SH 78
36 S Harahap 66
37 SW Hrp 68
38 SR 80
39 SW 68
40 YN Hrp 72
Total 2542

b. Pre Test Score of Control Class
No. The Initial Name of Students Score Pre-Test
1 AM 60
2 AR Nst 32
3 AS 78
4 AA 66
5 A Nst 46
6 AP 62
7 AR 50
8 AP 50
9 FYS 62
10 FA 60
11 H 56
12 HH 58
13 HA 62
14 KK 58
15 LS 60
16 LAR 56
17 MS 30
18 M Hrp 62
19 M. Shoddiq 48
20 NI 62
21 NUS 80
22 NA 58
23 NS 78
24 N. Ainun 62
25 N 46
26 NK 66

27 PM 74
28 RN 82
29 RA 66
30 RK 72
31 RM 78
32 SRA 66
33 SN 74
34 US 72
35 WS 62
36 YR 46
37 YA 78
38 YH 60
39 Y. Annisah 56
40 NMN 66
Total 2480

Appendix 17
RESULT OF NORMALITY TEST IN PRE-TEST
A. Result of Normality Test of XI MIA 2
1. The score of grade XI MIA 2 in pre-test from low score to high score:
30 38 40 46 50 52 52 52 58 60
60 60 62 62 62 62 64 64 64 64
64 64 64 66 66 66 68 68 68 70
70 72 72 72 72 76 76 76 76 78
80 82
2. High = 82
Low = 30
Range = High – Low
= 82 – 30
= 52
3. Total of classes = 1 + 3,3 log (n)
= 1 + 3,3 log (42)
= 1 + 3,3 (1.62)
= 1 + 5.35
= 6.35 / 6
4. Length of classes =
=
= 8.67 = 9
5. Mean
Interval Class F X x‟
fx‟ x
‟2 fx
‟2
75 – 83 7 79 +2 14 4 28
66 – 74 12 70 +1 12 1 12
57 – 65 15 61 0 0 0 0
48 – 56 4 52 -1 -4 1 4
39 – 47 2 43 -2 -4 4 8
30 – 38 2 34 -3 -6 9 18
i = 9 42 - - 12 - 70

N
fxiMMx
11
= 61 + 9 (
)
= 61 + 9 (0.286)
= 61 + (2.574)
= 63.57
SDt = √
(
)
= √
(
)
= √ ( )
= √
= 9√
= 9 x 1.259
= 11.33
Table of Normality Data Test with Chi Kuadrad Formula
Interval
of Score
Real Upper
Limit
Z –
Score
Limit of
Large of the
Area
Large
of area fh f0
(f0-fh)2
fh
75 – 83
66 – 74
57 – 65
48 – 56
39 – 47
30 – 38
83.5
74.5
65.5
56.5
47.5
38.5
29.5
1.76
0.96
0.17
0.62
-1.42
-2.13
-3.01
0.4608
0.3315
0.0675
0.2324
0.7780
0.01659
0.00131
0.13
0.26
-0.16
0.15
0.06
0.02
5.46
10.92
-6.72
6.3
2.52
0.84
7
12
15
4
2
2
0.282
0.099
-1.232
-0.365
-0.206
1.381
X2
-0.041

Based on the table above,the reseracher found that x2count= -0.041
while x2
table= 11.070. Because x2
count < x2
table (-0.041 < 11.070) with degree
of freedom (dk) = 6–1 = 5 and significant level = 5%, distribution of XI
MIA 2 class (pre-test) is normal.
6. Median
No Interval F Fk
1 30-38 2 2
2 39-47 2 4
3 48-56 4 8
4 57-65 15 23
5 66-74 12 35
6 75-83 7 42
Position of Me in the interval of classes is number 4, that:
Bb = 56.5
F = 8
fm = 15
i = 9
n = 42
1/2n = 21
So :
Me = Bb + i
fm
Fn2
= 56.5 + 9 (
)
= 56.5 + 9 (
)
= 56.5+ 9 (0.87)
= 56.5 + 7.83
= 64.33

7. Modus
No Interval F Fk
1 30-38 2 2
2 39-47 2 4
3 48-56 4 8
4 57-65 15 23
5 66-74 12 35
6 75-83 7 42
L = 56.5
d1 = 11
d2 = 3
i = 9
So,
Mo =
= 56.5 +
= 56.5 +
= 56.5 + 0.79 (9)
= 56.5 + 7.11
= 63.61

RESULT OF NORMALITY TEST IN PRE TEST
A. Result of the Normality Test of XI MIA 3 in Pre-Test
1. Score of XI MIA 3 class in pre-test from low to high score
32 40 44 46 46 52 52 52 56 56
58 60 60 60 64 64 64 64 64 64
64 64 66 66 68 68 68 68 68 70
70 72 72 78 78 78 80 80 82 84
2. High = 84
Low = 32
Range = High – Low
= 84 – 32
= 52
3. Total of Classes = 1 + 3,3 log (n)
= 1 + 3,3 log (40)
= 1 + 3,3 (1.60)
= 1 + 5.28
= 6.28 / 6
4. Length of Classes =
=
= 8.67 = 9
5. Mean
Interval Class F X x‟
fx‟ x
‟2 fx
‟2
77 – 85 7 81 +2 14 4 28
68 – 76 9 72 +1 9 1 9
59 – 67 13 63 0 0 0 0
50 – 58 6 54 -1 -6 1 6
41 – 49 3 45 -2 -6 4 12
32 – 40 2 36 -3 -6 9 18
i = 9 40 - - 5 - 73

N
fxiMMx
11
= 63 + 9 (
)
= 63 + 9 (0.125)
= 63 + (1.125)
= 64.13
SDt = √
(
)
= √
(
)
= √ ( )
= √
= 9√
= 9 x 1.345
= 12.11
Table of Normality Data Test with Chi Kuadrad Formula
Interval
of Score
Real Upper
Limit
Z –
Score
Limit of
Large of the
Area
Large
of area fh f0
(f0-fh)2
fh
77 – 85
68 – 76
59 – 67
50 – 58
41 – 49
32 – 40
85.5
76.5
67.5
58.5
49.5
40.5
31.5
1.76
1.02
0.28
-0.47
-1.21
-1.95
-2.69
0.4608
0.3461
0.1103
0.31918
0.11314
0.02559
0.00357
0.11
0.24
-0.21
0.21
0.09
0.02
4.4
9.6
-8.4
8.4
3.6
0.8
7
9
13
6
3
2
0.591
-0.063
-0.548
-0.286
-0.167
1.5
X2
1.027

Based on the table above, the reseracher found that x2
count= 1.027
while x2
table= 11.070. Because x2
count < x2table (1.027 < 11.070) with degree
of freedom (dk) = 6–1 = 5 and significant level = 5%, distribution of XI
MIA 3 class (pre-test) is normal.
6. Median
No Interval F Fk
1 32-40 2 2
2 41-49 3 5
3 50-58 6 11
4 59-67 13 24
5 68-76 9 33
6 77-85 7 40
Position of Me in the interval of classes is number 4, that:
Bb = 58.5
F = 11
fm = 13
i = 9
n = 40
1/2n = 20
So :
Me = Bb + i
fm
Fn2
= 58.5 + 9 (
)
= 58.5 + 9 (
)
= 58.5+ 9 (0.692)
= 58.5 + 6.228
= 64.73

7. Modus
No Interval F Fk
1 32-40 2 2
2 41-49 3 5
3 50-58 6 11
4 59-67 13 24
5 68-76 9 33
6 77-85 7 40
L = 58.5
d1 = 7
d2 = 4
i = 9
So,
Mo =
= 58.5 +
= 58.5 +
= 58.5 + 0.636 (9)
= 58.5 + 5.724
= 64.22
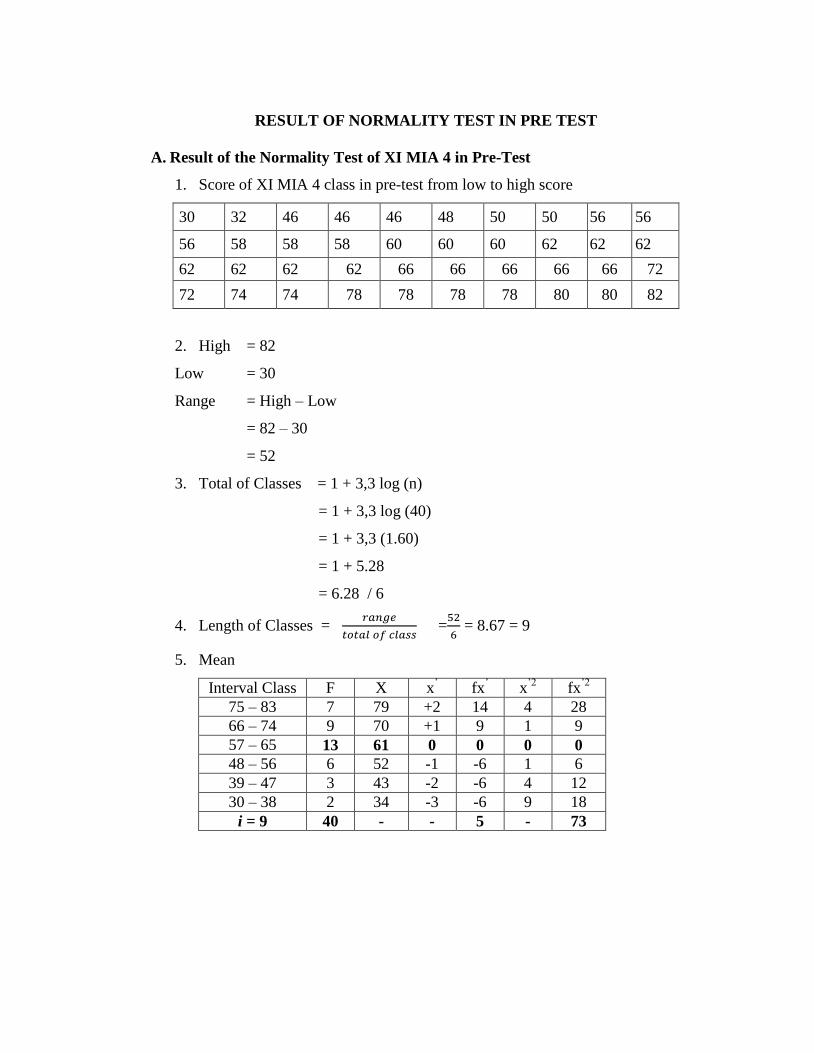
RESULT OF NORMALITY TEST IN PRE TEST
A. Result of the Normality Test of XI MIA 4 in Pre-Test
1. Score of XI MIA 4 class in pre-test from low to high score
30 32 46 46 46 48 50 50 56 56
56 58 58 58 60 60 60 62 62 62
62 62 62 62 66 66 66 66 66 72
72 74 74 78 78 78 78 80 80 82
2. High = 82
Low = 30
Range = High – Low
= 82 – 30
= 52
3. Total of Classes = 1 + 3,3 log (n)
= 1 + 3,3 log (40)
= 1 + 3,3 (1.60)
= 1 + 5.28
= 6.28 / 6
4. Length of Classes =
=
= 8.67 = 9
5. Mean
Interval Class F X x‟
fx‟ x
‟2 fx
‟2
75 – 83 7 79 +2 14 4 28
66 – 74 9 70 +1 9 1 9
57 – 65 13 61 0 0 0 0
48 – 56 6 52 -1 -6 1 6
39 – 47 3 43 -2 -6 4 12
30 – 38 2 34 -3 -6 9 18
i = 9 40 - - 5 - 73

N
fxiMMx
11
= 61 + 9 (
)
= 61 + 9 (0.125)
= 61 + (1.125)
= 62.13
SDt = √
(
)
= √
(
)
= √ ( )
= √
= 9√
= 9 x 1.345
= 12.16
Table of Normality Data Test with Chi Kuadrad Formula
Interval
of Score
Real Upper
Limit
Z –
Score
Limit of
Large of the
Area
Large
of area fh f0
(f0-fh)2
fh
75 – 83
66 – 74
57 – 65
48 – 56
39 – 47
30 – 38
83.5
74.5
65.5
56.5
47.5
38.5
29.5
1.76
1.02
0.28
-0.46
-1.20
-1.94
-2.69
0.4608
0.3461
0.1103
0.32276
0.11507
0.02619
0.00357
0.11
0.24
-0.21
0.21
-0.15
0.02
4.4
9.6
-8.4
8.4
-6
0.8
7
9
13
6
3
2
0.591
-0.063
-0.548
-0.286
0.5
1.5
X2
1.694

Based on the table above, the reseracher found that x2
count= 1.694
while x2
table= 11.070. Because x2
count < x2table (1.694 < 11.070) with degree
of freedom (dk) = 6–1 = 5 and significant level = 5%, distribution of XI
MIA 4 class (pre-test) is normal.
6. Median
No Interval F Fk
1 30-38 2 2
2 39-47 3 5
3 48-56 6 11
4 57-65 13 24
5 66-74 9 33
6 75-83 7 40
Position of Me in the interval of classes is number 4, that:
Bb = 56.5
F = 11
fm = 13
i = 9
n = 40
1/2n = 20
So :
Me = Bb + i
fm
Fn2
= 56.5 + 9 (
)
= 56.5 + 9 (
)
= 56.5+ 9 (0.692)
= 56.5 + 6.228
= 62.73

7. Modus
No Interval F Fk
1 30-38 2 2
2 39-47 3 5
3 48-56 6 11
4 57-65 13 24
5 66-74 9 33
6 75-83 7 40
L = 56.5
d1 = 7
d2 = 4
i = 9
So,
Mo =
= 56.5 +
= 56.5 +
= 56.5 + 0.636 (9)
= 56.5 + 5.724
= 62.22

Appendix 18
HOMOGENEITY TEST (PRE-TEST)
Calculation of parameter to get variant of the first class as experimental
class sample and variant of the second class as control class sample are used
homogeneity test by using formula:
S 2 =
1
2
nn
xixin
Hypotheses:
H0 : 2
2
2
1
H1 : 2
2
2
1
A. Variant of XI MIA 2 class is:
No Xi Xi2
1 30 900
2 38 1444
3 40 1600
4 46 2116
5 50 2500
6 52 2704
7 52 2704
8 52 2704
9 58 3364
10 60 3600
11 60 3600
12 60 3600
13 62 3844
14 62 3844
15 62 3844

16 62 3844
17 64 4096
18 64 4096
19 64 4096
20 64 4096
21 64 4096
22 64 4096
23 64 4096
24 66 4356
25 66 4356
26 66 4356
27 68 4624
28 68 4624
29 68 4624
30 70 4900
31 70 4900
32 72 5184
33 72 5184
34 72 5184
35 72 5184
36 76 5776
37 76 5776
38 76 5776
39 76 5776
40 78 6084
41 80 6400
42 82 6724
Total 2420 160872
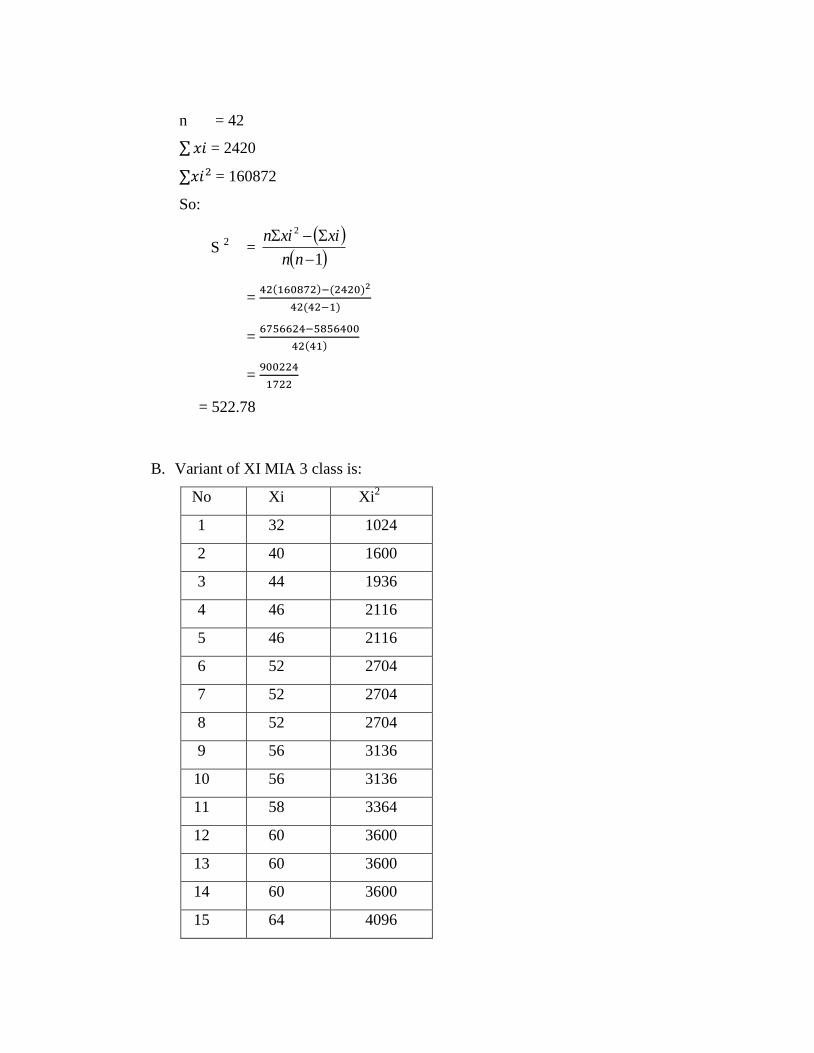
n = 42
= 2420
= 160872
So:
S 2 =
1
2
nn
xixin
= ( ) ( )
( )
=
( )
=
= 522.78
B. Variant of XI MIA 3 class is:
No Xi Xi2
1 32 1024
2 40 1600
3 44 1936
4 46 2116
5 46 2116
6 52 2704
7 52 2704
8 52 2704
9 56 3136
10 56 3136
11 58 3364
12 60 3600
13 60 3600
14 60 3600
15 64 4096
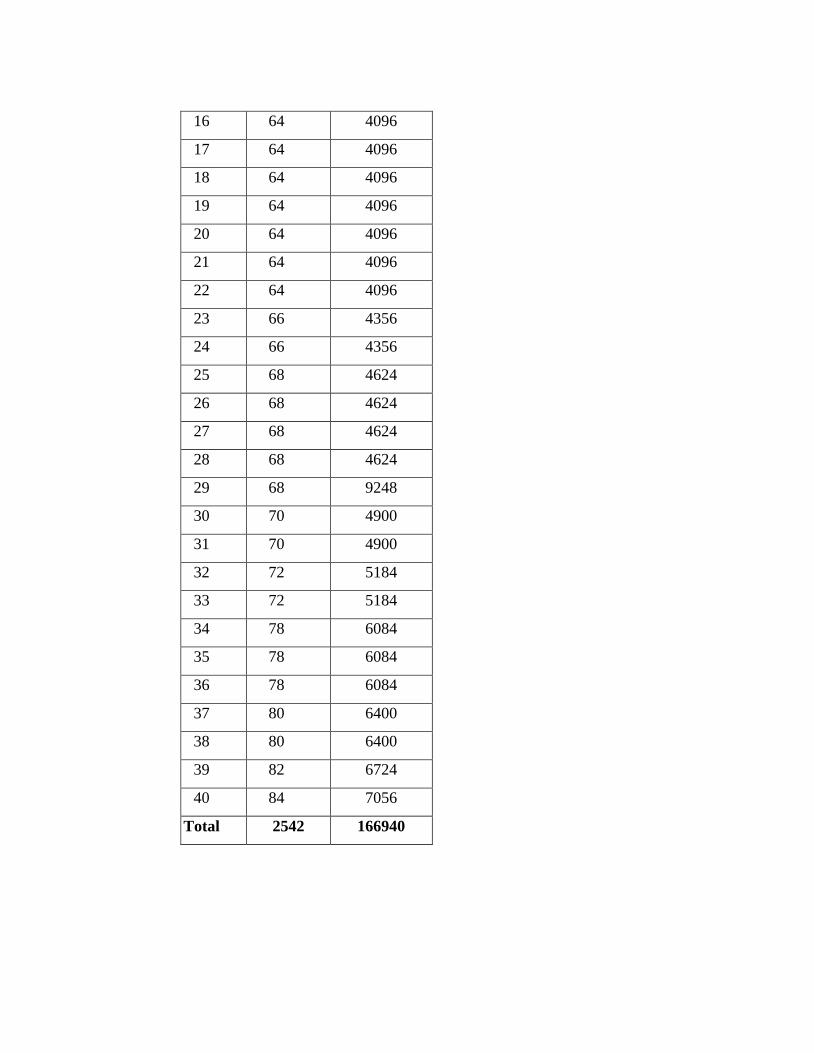
16 64 4096
17 64 4096
18 64 4096
19 64 4096
20 64 4096
21 64 4096
22 64 4096
23 66 4356
24 66 4356
25 68 4624
26 68 4624
27 68 4624
28 68 4624
29 68 9248
30 70 4900
31 70 4900
32 72 5184
33 72 5184
34 78 6084
35 78 6084
36 78 6084
37 80 6400
38 80 6400
39 82 6724
40 84 7056
Total 2542 166940

n = 40
= 2542
= 166940
So:
S 2 =
1
2
nn
xixin
= ( ) ( )
( )
=
( )
=
= 138.36
C. Variant of XI MIA 4 class is:
No Xi Xi2
1 30 900
2 32 1024
3 46 2116
4 46 2116
5 46 2116
6 48 2304
7 50 2500
8 50 2500
9 56 2704
10 56 3136
11 56 3136
12 58 3364
13 58 3364
14 58 3364
15 60 3600

16 60 3600
17 60 3600
18 62 3844
19 62 3844
20 62 3844
21 62 3844
22 62 3844
23 62 3844
24 62 3844
25 66 4356
26 66 4356
27 66 4356
28 66 4356
29 66 4356
30 72 5184
31 72 5184
32 74 5476
33 74 5476
34 78 6084
35 78 6084
36 78 6084
37 78 6084
38 80 6400
39 80 6400
40 82 6724
Total 2480 159744
n = 40
= 2480

= 159744
So:
S 2 =
1
2
nn
xixin
= ( ) ( )
( )
=
( )
=
= 153.44
The formula was used to test hypothesis was:
1. XI MIA 2 and XI MIA 3
F =
So:
F =
= 3.78
After doing the calculation, researcher found that Fcount = 3.78 with 5%
and dk = 42 and 40 from the distribution list F, researcher found that Ftable =
4.08 and 4.10, cause Fcount< Ftable (3.78 < 4.08 and 4.10). So, there is no
difference in variant between the XI MIA 2 class and XI MIA 3 class. It
means that the variant is homogenous.
2. XI MIA 2 and XI MIA 4
F =
So:
F =
= 3.41

After doing the calculation, researcher found that Fcount = 3.41 with 5%
and dk = 42 and 40 from the distribution list F, researcher found that Ftable =
4.08 and 4.10, cause Fcount < Ftable (3.41 < 4.08 and 4.10). So, there is no
difference in variant between the XI MIA 2 class and XI MIA 4 class. It
means that the variant is homogenous.
3. XI MIA 3 and XI MIA 4
F =
So:
F =
= 1.12
After doing the calculation, researcher found that Fcount = 1.12 with 5%
and dk = 40 from the distribution list F, researcher found that Ftable= 4.10,
cause Fcount< Ftable (1.12 < 4.10). So, there is no difference in variant between
XI MIA 3 class and XI MIA 4 class. It means that the variant is homogenous.

Appendix 19
Score of Experimental Class and Control Class on Post Test
1. Score of Experimental Class Post test using Make a Match Technique
No. The Initial Name of Students Score Post Test
1 AQ 74
2 AA 56
3 AR 76
4 ASR 70
5 DAL 88
6 DZ Hsb 70
7 DA 84
8 EA 88
9 ES 70
10 FP 68
11 FK 84
12 HR 72
13 HSY 74
14 IM 84
15 IA 74
16 IK 76
17 IHB 74
18 KAK 90
19 KM 74
20 LT 76
21 LK 76
22 MA 60
23 MK 62
24 MM 78

25 MS Nst 74
26 MDR 78
27 MR 84
28 MZ 74
29 MRi 50
30 N Hsb 84
31 NF 84
32 RAS 90
RI Rona Indah 86
34 R Hrp 62
35 SH 68
36 S Harahap 88
37 SW Hrp 88
38 SR 90
39 SW 78
40 YN Hrp 90
Total 3046

2. Score of Control Class Post test using Conventional Technique
No. The Initial Name of Students Score Post Test
1 AM 42
2 AR Nst 58
3 AS 54
4 AA 50
5 A Nst 62
6 AP 66
7 AR 68
8 DP 68
9 FYS 64
10 FA 66
11 H 62
12 HH 68
13 HA 70
14 KK 64
15 LS 76
16 LAR 66
17 MS 68
18 M Hrp 76
19 M. Shoddiq 66
20 NI 66
21 NUS 72
22 NA 68
23 NS 76
24 N. Ainun 70
25 N 68
26 NK 80
27 PM 68

28 RN 80
29 RA 70
30 RK 82
31 RM 70
32 SRA 58
33 SN 72
34 US 82
35 WS 70
36 YR 82
37 YA 72
38 YH 82
39 Y. Annisah 72
40 NMN 82
Total 2756

Appendix 20
RESULT OF NORMALITY TEST IN POST TEST
A. Result of Normality Test of XI MIA 3 in Post Test
8. Score of XI MIA 3 class in post-test from low to high score
50 56 60 62 62 68 68 70 70 70
70 72 74 74 74 74 74 74 74 76
76 76 76 78 78 78 84 84 84 84
84 86 86 88 88 88 88 90 90 90
9. High = 90
Low = 50
Range = High – Low
= 90 – 50
= 40
10. Total of Classes = 1 + 3,3 log (n)
= 1 + 3,3 log (40)
= 1 + 3,3 (1.60)
= 1 + 5.28
= 6.28 / 6
11. Length of Classes =
=
= 6.67 = 7
12. Mean
Interval Class F X x‟
fx‟ x
‟2 fx
‟2
85 – 91 8 88 +2 16 4 32
78 – 84 9 81 +1 9 1 9
71 – 77 12 74 0 0 0 0
64 – 70 6 67 -1 -6 1 6
57 – 63 3 60 -2 -6 4 12
50 – 56 2 53 -3 -6 9 18
i = 7 40 - - 7 - 77
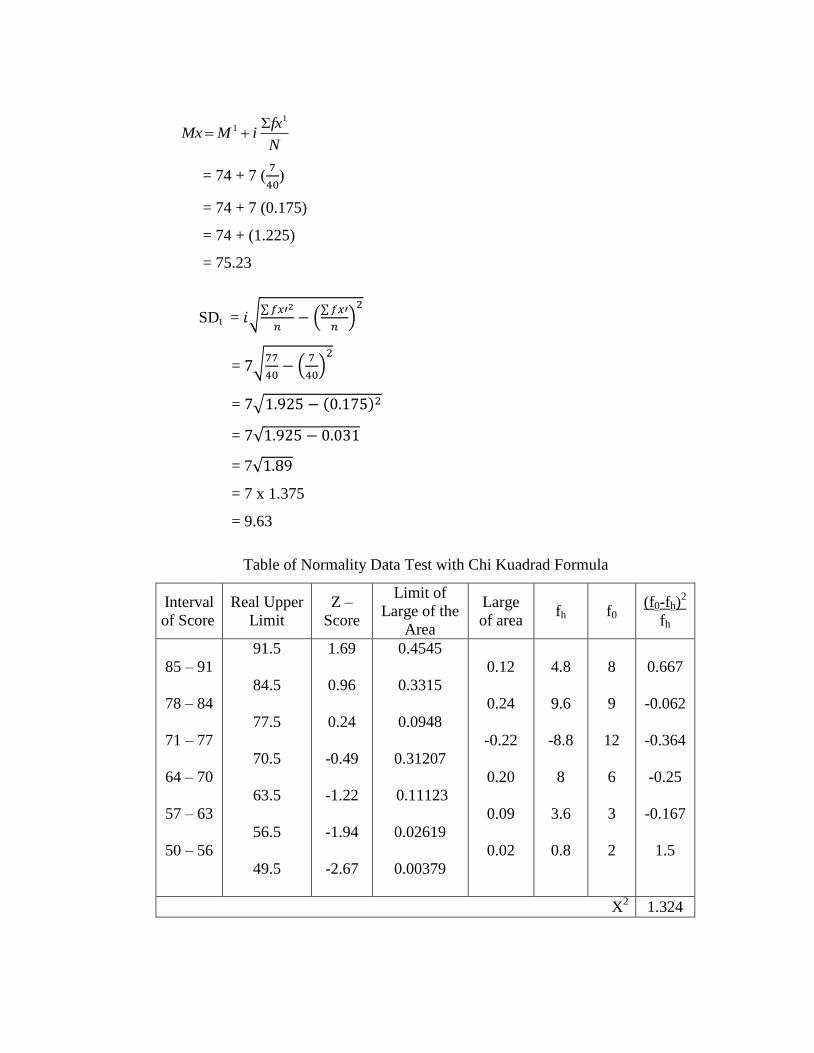
N
fxiMMx
11
= 74 + 7 (
)
= 74 + 7 (0.175)
= 74 + (1.225)
= 75.23
SDt = √
(
)
= √
(
)
= √ ( )
= √
= 7√
= 7 x 1.375
= 9.63
Table of Normality Data Test with Chi Kuadrad Formula
Interval
of Score
Real Upper
Limit
Z –
Score
Limit of
Large of the
Area
Large
of area fh f0
(f0-fh)2
fh
85 – 91
78 – 84
71 – 77
64 – 70
57 – 63
50 – 56
91.5
84.5
77.5
70.5
63.5
56.5
49.5
1.69
0.96
0.24
-0.49
-1.22
-1.94
-2.67
0.4545
0.3315
0.0948
0.31207
0.11123
0.02619
0.00379
0.12
0.24
-0.22
0.20
0.09
0.02
4.8
9.6
-8.8
8
3.6
0.8
8
9
12
6
3
2
0.667
-0.062
-0.364
-0.25
-0.167
1.5
X2
1.324

Based on the table above, the reseracher found that x2
count= 1.324
while x2
table= 11.070. Because x2
count < x2table (1.324 < 11.070) with degree
of freedom (dk) = 6–1 = 5 and significant level = 5%, distribution of XI
MIA 3 class (post-test) is normal.
13. Median
No Interval F Fk
1 50-56 2 2
2 57-63 3 5
3 64-70 6 11
4 71-77 12 23
5 78-84 9 32
6 85-91 8 40
Position of Me in the interval of classes is number 4, that:
Bb = 70.5
F = 11
fm = 12
i = 7
n = 40
1/2n = 20
So :
Me = Bb + i
fm
Fn2
= 70.5 + 7 (
)
= 70.5 + 7 (
)
= 70.5+ 7 (0.75)
= 70.5 + 5.25
= 75.75

14. Modus
No Interval F Fk
1 50-56 2 2
2 57-63 3 5
3 64-70 6 11
4 71-77 12 23
5 78-84 9 32
6 85-91 8 40
L = 70.5
d1 = 6
d2 = 3
i = 7
So,
Mo =
= 70.5 +
( )
= 70.5 +
( )
= 70.5 + 0.67 (7)
= 70.5 + 4.69
= 75.19

RESULT OF NORMALITY TEST IN POST TEST
B. Result of the Normality Test of XI MIA 4 in Post Test
1. Score of XI MIA 4 class in post-test from low to high score
42 50 54 58 58 62 62 64 64 66
66 66 66 66 68 68 68 68 68 68
68 70 70 70 70 70 72 72 72 72
76 76 76 80 80 82 82 82 82 82
2. High = 82
Low = 42
Range = High – Low
= 82 – 42
= 40
3. Total of Classes = 1 + 3,3 log (n)
= 1 + 3,3 log (40)
= 1 + 3,3 (1.60)
= 1 + 5.28
= 6.28 / 6
4. Length of Classes =
=
= 6.67 = 7
5. Mean
Interval Class F X x‟
fx‟ x
‟2 fx
‟2
77 – 83 7 80 +2 14 4 28
70 – 76 12 73 +1 12 1 12
63 – 69 14 66 0 0 0 0
56 – 62 4 59 -1 -4 1 4
49 – 55 2 52 -2 -2 4 8
42 – 48 1 45 -3 -3 9 9
i = 7 40 - - 17 - 61

N
fxiMMx
11
= 66 + 7 (
)
= 66 + 7 (0.425)
= 66 + (2.975)
= 68.98
SDt = √
(
)
= √
(
)
= √ ( )
= √
= 7√
= 7 x 1.159
= 8.11
Table of Normality Data Test with Chi Kuadrad Formula
Interval
of Score
Real Upper
Limit
Z –
Score
Limit of
Large of the
Area
Large
of area fh f0
(f0-fh)2
fh
77 – 83
70 – 76
63 – 69
56 – 62
49 – 55
42 – 48
83.5
76.5
69.5
62.5
55.5
48.5
41.5
1.79
0.93
0.06
-0.80
-1.66
-2.53
-3.39
0.4633
0.3238
0.0239
0.21186
0.04846
0.00570
0.00035
0.14
0.30
-0.19
0.16
0.04
0.01
5.6
12
-7.6
6.4
1.6
0.4
7
12
14
4
2
1
0.25
0
-0.842
-0.375
0.25
1.5
X2
0.783

Based on the table above, the reseracher found that x2
count= 0.783
while x2
table= 11.070. Because x2
count < x2table (0.783 < 11.070) with degree
of freedom (dk) = 6–1 = 5 and significant level = 5%, distribution of XI
MIA 4 class (post-test) is normal.
6. Median
No Interval F Fk
1 42-48 1 1
2 49-55 2 3
3 56-62 4 7
4 63-69 14 21
5 70-76 12 33
6 77-83 7 40
Position of Me in the interval of classes is number 4, that:
Bb = 62.5
F = 7
fm = 14
i = 7
n = 40
1/2n = 20
So :
Me = Bb + i
fm
Fn2
= 62.5 + 7 (
)
= 62.5 + 7 (
)
= 62.5+ 7 (0.93)
= 62.5 + 6.51
= 69.01

7. Modus
No Interval F Fk
1 42-48 1 1
2 49-55 2 3
3 56-62 4 7
4 63-69 14 21
5 70-76 12 33
6 77-83 7 40
L = 62.5
d1 = 10
d2 = 2
i = 7
So,
Mo =
= 62.5 +
= 62.5 +
= 62.5 + 0.83 (7)
= 62.5 + 5.81
= 68.31

Appendix 21
HOMOGENEITY TEST (POST-TEST)
Calculation of parameter to get variant of the first class as experimental class
sample by using Make a Match technique and variant of the second class as control
class sample by using conventional technique are used homogeneity test by using
formula:
S 2 =
1
2
nn
xixin
Hypotheses:
H0 : 2
2
2
1
H1 : 2
2
2
1
D. Variant of XI MIA 3 class is:
No Xi Xi2
1 50 2500
2 56 3136
3 60 3600
4 62 3844
5 62 3844
6 68 4624
7 68 4624
8 70 4900
9 70 4900
10 70 4900
11 70 4900
12 72 5184
13 74 5476
14 74 5476
15 74 5476

16 74 5476
17 74 5476
18 74 5476
19 74 5476
20 76 5776
21 76 5776
22 76 5776
23 76 5776
24 78 6084
25 78 6084
26 78 6084
27 84 7056
28 84 7056
29 84 7056
30 84 7056
31 84 7056
32 84 7056
33 86 7396
34 88 7744
35 88 7744
36 88 7744
37 88 7744
38 90 8100
39 90 8100
40 90 8100
Total 3046 235652
n = 40
= 3046

= 235652
So:
S 2 =
1
2
nn
xixin
= ( ) ( )
( )
=
( )
=
= 94.85
E. Variant of XI MIA 4 class is:
No Xi Xi2
1 42 1764
2 50 2500
3 54 2916
4 58 3364
5 58 3364
6 62 3844
7 62 3844
8 64 4096
9 64 4096
10 66 4356
11 66 4356
12 66 4356
13 66 4356
14 66 4356
15 68 4624
16 68 4624
17 68 4624
18 68 4624

19 68 4624
20 68 4624
21 68 4624
22 70 4900
23 70 4900
24 70 4900
25 70 4900
26 70 4900
27 72 5184
28 72 5184
29 72 5184
30 72 5184
31 76 5776
32 76 5776
33 76 5776
34 80 6400
35 80 6400
36 82 6724
37 82 6724
38 82 6724
39 82 6724
40 82 6724
Total 2756 192920
n = 40
= 2756
= 192920

So:
S 2 =
1
2
nn
xixin
= ( ) ( )
( )
=
( )
=
= 77.73
The Formula was used to test hypothesis was:
1. XI MIA 3 and XI MIA 4 :
F =
So:
F =
= 1.22
After doing the calculation, researcher found that Fcount = 1.22 with 5% and
dk = 40 and 40 from the distribution list F, researcher found that Ftable = 4.10
cause Fcount < Ftable (1.22 < 4.10). So, there is no difference in variant between the
XI MIA 3 class and XI MIA 4 class. It means that the variant is homogenous.

Appendix 22
Ttest OF THE BOTH AVERAGES IN PRE-TEST
The formula was used to analyze homogeneity test of the both averages was t-
test, that:
So:
√(( )
( )
)(
)
√(( ) ( )
) (
)
√( ( ) ( )
) ( )
√(( ) ( )
) ( )
√(
) ( )
√( )( )
√
0.740
Based on researcher calculation result of the homogeneity test of the both
averages, researcher found that tcount = 0.740 with opportunity (1- ) = 1 – 5% = 95%

and dk = n1 + n2 -2 = 40 + 40 – 2 = 78, reseracher found that ttable = 2.000, because
tcount < ttable (0.740 < 2.000). So, Ha was rejected, it means that there is no difference
in average between experimental class and control class in pre test.

Appendix 23
Ttest OF THE BOTH AVERAGES IN POST – TEST
The formula was used to analyse homogeneity test of the both averages in
post test was t-test, as below:
√(( )
( )
)(
)
√(( ) ( )
) (
)
√( ( ) ( )
) ( )
√( ( )
) ( )
√(
) ( )
√( )( )
√
3.009
Based on calculation above, the result of the homogeneity test of the both
averages, it was found that tcount= 3.009 with opportunity (1- ) = 1 – 5% = 95% and

dk = n1 + n2 -2 = 40 + 40 – 2 = 78, reseracher found that ttable = 2.000, cause tcount >
ttable (3.009 > 2.000). It means that Ha was accepted, it means there was the difference
average between experimental class and control class in post test. It can be concluded
that there was the significant effect of Make a Match technique on students‟ reading
comprehension at XI grade of MAN 1 Padangsidimpuan.

Appendix 24
Chi-Square Table
dk Significant level
50% 30% 20% 10% 5% 1%
1 0,455 1,074 1,642 2,706 3,841 6,635
2 1,386 2,408 3,219 4,605 5,991 9,210
3 2,366 3,665 4,642 6,251 7,815 11,341
4 3,357 4,878 5,989 7,779 9,488 13,277
5 4,351 6,064 7,289 9,236 11,070 15,086
6 5,348 7,231 8,558 10,645 12,592 16,812
7 6,346 8,383 9,803 12,017 14,067 18,475
8 7,344 9,524 11,030 13,362 15,507 20,090
9 8,343 10,656 12,242 14,684 16,919 21,666
10 9,342 11,781 13,442 15,987 18,307 23,209
11 10,341 12,899 14,631 17,275 19,675 24,725
12 11,340 14,011 15,812 18,549 21,026 26,217
13 12,340 15,119 16,985 19,812 22,362 27,688
14 13,339 16,222 18,151 21,064 23,685 29,141
15 14,339 17,222 19,311 22,307 24,996 30,578
16 15,338 18,418 20,465 23,542 26,296 32,000
17 16,338 19,511 21,615 24,769 27,587 33,409
18 17,338 20,601 22,760 25,989 28,869 34,805
19 18,338 21,689 23,900 27,204 30,144 36,191
20 19,337 22,775 25,038 28,412 31,410 37,566
21 20,337 23,858 26,171 29,615 32,671 38,932
22 21,337 24,939 27,301 30,813 33,924 40,289
23 22,337 26.018 28,429 32,007 35,172 41,638
24 23,337 27,096 29,553 33,196 35,415 42,980
25 24,337 28,172 30,675 34,382 37,652 44,314
26 25,336 29,246 31,795 35,563 38,885 45,642
27 26,336 30,319 32,912 36,741 40,113 46,963
28 27,336 31,391 34,027 37,916 41,337 48,278
29 28,336 32,461 35,139 39,087 42,557 49,588
30 29,336 33,530 36,250 40,256 43,773 50,892

Appendix 25
Z-Table
Z 0.00 0.01 0.02 0.03 0.04 0.05 0.06 0.07 0.08 0.09
-3.9 0.00005 0.00005 0.00004 0.00004 0.00004 0.00004 0.00004 0.00004 0.00003 0.00003
-3.8 0.00007 0.00007 0.00007 0.00006 0.00006 0.00006 0.00006 0.00005 0.00005 0.00005
-3.7 0.00011 0.00010 0.00010 0.00010 0.00009 0.00009 0.00008 0.00008 0.00008 0.00008
-3.6 0.00016 0.00015 0.00015 0.00014 0.00014 0.00013 0.00013 0.00012 0.00012 0.00011
-3.5 0.00023 0.00022 0.00022 0.00021 0.00020 0.00019 0.00019 0.00018 0.00017 0.00017
-3.4 0.00034 0.00032 0.00031 0.00030 0.00029 0.00028 0.00027 0.00026 0.00025 0.00024
-3.3 0.00048 0.00047 0.00045 0.00043 0.00042 0.00040 0.00039 0.00038 0.00036 0.00035
-3.2 0.00069 0.00066 0.00064 0.00062 0.00060 0.00058 0.00056 0.00054 0.00052 0.00050
-3.1 0.00097 0.00094 0.00090 0.00087 0.00084 0.00082 0.00079 0.00076 0.00074 0.00071
-3.0 0.00135 0.00131 0.00126 0.00122 0.00118 0.00114 0.00111 0.00107 0.00104 0.00100
-2.9 0.00187 0.00181 0.00175 0.00169 0.00164 0.00159 0.00154 0.00149 0.00144 0.00139
-2.8 0.00256 0.00248 0.00240 0.00233 0.00226 0.00219 0.00212 0.00205 0.00199 0.00193
-2.7 0.00347 0.00336 0.00326 0.00317 0.00307 0.00298 0.00289 0.00280 0.00272 0.00264
-2.6 0.00466 0.00453 0.00440 0.00427 0.00415 0.00402 0.00391 0.00379 0.03680 0.00357
-2.5 0.00621 0.00604 0.00587 0.00570 0.00554 0.00539 0.00523 0.00508 0.00494 0.00480
-2.4 0.00820 0.00798 0.00776 0.00755 0.00734 0.00714 0.00695 0.00676 0.00657 0.00639
-2.3 0.01072 0.01044 0.01017 0.00990 0.00964 0.00939 0.00914 0.00889 0.00866 0.00842
-2.2 0.01390 0.01355 0.01321 0.01287 0.01255 0.01222 0.01191 0.01160 0.01130 0.01101
-2.1 0.01786 0.01743 0.01700 0.01659 0.01618 0.01578 0.01539 0.01500 0.01463 0.01426
-2.0 0.02275 0.02222 0.02169 0.02118 0.02068 0.02018 0.01970 0.01923 0.01876 0.01831
-1.9 0.02872 0.02807 0.02743 0.02680 0.02619 0.02559 0.02500 0.02442 0.02385 0.02330
-1.8 0.03593 0.03515 0.03438 0.03362 0.03288 0.03216 0.03144 0.03074 0.03005 0.02938
-1.7 0.04457 0.04363 0.04272 0.04182 0.04093 0.04006 0.03920 0.03836 0.03754 0.03673

-1.6 0.05480 0.05370 0.05262 0.05155 0.05050 0.04947 0.04846 0.04746 0.04648 0.04551
-1.5 0.06681 0.06552 0.06426 0.06301 0.06178 0.06057 0.05938 0.05821 0.05705 0.05592
-1.4 0.08076 0.07927 0.07780 0.07636 0.07493 0.07353 0.07215 0.07078 0.06944 0.06811
-1.3 0.09680 0.09510 0.09342 0.09176 0.09012 0.08851 0.08691 0.08534 0.08379 0.08226
-1.2 0.11507 0.11314 0.11123 0.10935 0.10749 0.10565 0.10383 0.10204 0.10027 0.09853
-1.1 0.13567 0.13350 0.13136 0.12924 0.12714 0.12507 0.12302 0.12100 0.11900 0.11702
-1.0 0.15866 0.15625 0.15386 0.15151 0.14917 0.14686 0.14457 0.14231 0.14007 0.13786
-0.9 0.18406 0.18141 0.17879 0.17619 0.17361 0.17106 0.16853 0.16602 0.16354 0.16109
-0.8 0.21186 0.20897 0.20611 0.20327 0.20045 0.19766 0.19489 0.19215 0.18943 0.18673
-0.7 0.24196 0.23885 0.23576 0.23270 0.22965 0.22663 0.22363 0.22065 0.21770 0.21476
-0.6 0.27425 0.27093 0.26763 0.26435 0.26109 0.25785 0.25463 0.25143 0.24825 0.24510
-0.5 0.30854 0.30503 0.30153 0.29806 0.29460 0.29116 0.28774 0.28434 0.28096 0.27760
-0.4 0.34458 0.34090 0.33724 0.33360 0.32997 0.32636 0.32276 0.31918 0.31561 0.31207
-0.3 0.38209 0.37828 0.37448 0.37070 0.36693 0.36317 0.35942 0.35569 0.35197 0.34827
-0.2 0.42074 0.41683 0.41294 0.40905 0.40517 0.40129 0.39743 0.39358 0.38974 0.38591
-0.1 0.46017 0.45620 0.45224 0.44828 0.44433 0.44038 0.43644 0.43251 0.42858 0.42465
-0.0 0.50000 0.49601 0.49202 0.48803 0.48405 0.48006 0.47608 0.47210 0.46812 0.46414

Z-Table
z 0.00 0.01 0.02 0.03 0.04 0.05 0.06 0.07 0.08 0.09
0.0 0.0000 0.0040 0.0080 0.0120 0.0160 0.0199 0.0239 0.0279 0.0319 0.0359
0.1 0.0398 0.0438 0.0478 0.0517 0.0557 0.0596 0.0636 0.0675 0.0714 0.0753
0.2 0.0793 0.0832 0.0871 0.0910 0.0948 0.0987 0.1026 0.1064 0.1103 0.1141
0.3 0.1179 0.1217 0.1255 0.1293 0.1331 0.1368 0.1406 0.1443 0.1480 0.1517
0.4 0.1554 0.1591 0.1628 0.1664 0.1700 0.1736 0.1772 0.1808 0.1844 0.1879
0.5 0.1915 0.1950 0.1985 0.2019 0.2054 0.2088 0.2123 0.2157 0.2190 0.2224
0.6 0.2257 0.2291 0.2324 0.2357 0.2389 0.2422 0.2454 0.2486 0.2517 0.2549
0.7 0.2580 0.2611 0.2642 0.2673 0.2704 0.2734 0.2764 0.2794 0.2823 0.2852
0.8 0.2881 0.2910 0.2939 0.2967 0.2995 0.3023 0.3051 0.3078 0.3106 0.3133
0.9 0.3159 0.3186 0.3212 0.3238 0.3264 0.3289 0.3315 0.3340 0.3365 0.3389
1.0 0.3413 0.3438 0.3461 0.3485 0.3508 0.3531 0.3554 0.3577 0.3599 0.3621
1.1 0.3643 0.3665 0.3686 0.3708 0.3729 0.3749 0.3770 0.3790 0.3810 0.3830
1.2 0.3849 0.3869 0.3888 0.3907 0.3925 0.3944 0.3962 0.3980 0.3997 0.4015
1.3 0.4032 0.4049 0.4066 0.4082 0.4099 0.4115 0.4131 0.4147 0.4162 0.4177
1.4 0.4192 0.4207 0.4222 0.4236 0.4251 0.4265 0.4279 0.4292 0.4306 0.4319
1.5 0.4332 0.4345 0.4357 0.4370 0.4382 0.4394 0.4406 0.4418 0.4429 0.4441
1.6 0.4452 0.4463 0.4474 0.4484 0.4495 0.4505 0.4515 0.4525 0.4535 0.4545
1.7 0.4554 0.4564 0.4573 0.4582 0.4591 0.4599 0.4608 0.4616 0.4625 0.4633
1.8 0.4641 0.4649 0.4656 0.4664 0.4671 0.4678 0.4686 0.4693 0.4699 0.4706
1.9 0.4713 0.4719 0.4726 0.4732 0.4738 0.4744 0.4750 0.4756 0.4761 0.4767
2.0 0.4772 0.4778 0.4783 0.4788 0.4793 0.4798 0.4803 0.4808 0.4812 0.4817
2.1 0.4821 0.4826 0.4830 0.4834 0.4838 0.4842 0.4846 0.4850 0.4854 0.4857
2.2 0.4861 0.4864 0.4868 0.4871 0.4875 0.4878 0.4881 0.4884 0.4887 0.4890
2.3 0.4893 0.4896 0.4898 0.4901 0.4904 0.4906 0.4909 0.4911 0.4913 0.4916
2.4 0.4918 0.4920 0.4922 0.4925 0.4927 0.4929 0.4931 0.4932 0.4934 0.4936
2.5 0.4938 0.4940 0.4941 0.4943 0.4945 0.4946 0.4948 0.4949 0.4951 0.4952
2.6 0.4953 0.4955 0.4956 0.4957 0.4959 0.4960 0.4961 0.4962 0.4963 0.4964

2.7 0.4965 0.4966 0.4967 0.4968 0.4969 0.4970 0.4971 0.4972 0.4973 0.4974
2.8 0.4974 0.4975 0.4976 0.4977 0.4977 0.4978 0.4979 0.4979 0.4980 0.4981
2.9 0.4981 0.4982 0.4982 0.4983 0.4984 0.4984 0.4985 0.4985 0.4986 0.4986
3.0 0.4987 0.4987 0.4987 0.4988 0.4988 0.4989 0.4989 0.4989 0.4990 0.4990
3,1 0,4990 0,4991 0,4991 0.4991 0,4992 0,4992 0,4992 0,4992 0,4993 0,4993
3,2 0,4993 0,4993 0,4994 0,4994 0,4994 0,4994 0,4994 0,4995 0,4995 0,4995
3,3 0,4995 0,4995 0,4995 0,4996 0,4996 0,4996 0,4996 0,4996 0,4997 0,4997
3,4 0,4997 0,4997 0,4997 0,4997 0,4997 0,4997 0,4997 0,4997 0,4997 0,4998
3,5 0,4998 0,4998 0,4998 0,4998 0,4998 0,4998 0,4998 0,4998 0,4998 0,4998
3,6 0,4998 0,4998 0,4999 0,4999 0,4999 0,4999 0,4999 0,4999 0,4999 0,4999
3,7 0,4999 0,4999 0,4999 0,4999 0,4999 0,4999 0,4999 0,4999 0,4999 0,4999
3,8 0,4999 0,4999 0,4999 0,4999 0,4999 0,4999 0,4999 0,4999 0,4999 0,4999
3,9 0,5000 0,5000 0,5000 0,5000 0,5000 0,5000 0,5000 0,5000 0,5000 0,5000

Appendix 26
Percentage Points of the t Distribution
Two Tail Test
0,50 0,20 0,10 0,05 0,02 0,01
One Tail Test
Dk 0,25 0,10 0, 005 0,025 0,01 0,05
1
2
3
4
5
6
7
8
9
10
11
12
13
14
15
16
17
18
19
20
21
22
23
24
25
26
27
28
29
30
40
60
120
∞
1,000
0,816
0,765
0,741
0,721
0,718
0,711
0,706
0,703
0,700
0,697
0,695
0,692
0,691
0,690
0,689
0,688
0,688
0,687
0,687
0,686
0,686
0,685
0,685
0,684
0,684
0,684
0,683
0,683
0,683
0,681
0,679
0,677
0,674
3,078
1,886
1,638
1,533
1,486
1,440
1,415
1,397
1,383
1,372
1,363
1,356
1,350
1,345
1,341
1,337
1,333
1,330
1,328
1,325
1,323
1,321
1,319
1,318
1,316
1,315
1,314
1,313
1,311
1,310
1,303
1,296
1,289
1,282
6,314
2,920
2,353
2,132
2,015
1,943
1,895
1,860
1,833
1,812
1,796
1,782
1,771
1,761
1,753
1,746
1,743
1,740
1,729
1,725
1,721
1,717
1,714
1,711
1,708
1,706
1,703
1,701
1,699
1,697
1,684
1,671
1,658
1,645
12,706
4,303
3,182
2,776
2,571
2,447
2,365
2,306
2,262
2,228
2,201
2,178
2,160
2,145
2,132
2,120
2,110
2,101
2,093
2,086
2,080
2,074
2,069
2,064
2,060
2,056
2,052
2,048
2,045
2,042
2,021
2,000
1,980
1,960
31,821
6,965
4,541
3,747
3,365
3,143
2,998
2,896
2,821
2,764
2,718
2,681
2,650
2,624
2,623
2,583
2,567
2,552
2,539
2,528
2,518
2,508
2,500
2,492
2,485
2,479
2,473
2,467
2,462
2,457
2,423
2,390
2,358
2,326
63,657
9,925
5,841
4,604
4,032
3,707
3,499
3,355
3,250
3,165
3,106
3.055
3.012
2,977
2,947
2,921
2,898
2,878
2,861
2,845
2,831
2,819
2,807
2,797
2,787
2,779
2,771
2,763
2,756
2,750
2,704
2,660
2,617
2,576

Appendix 27
DOCUMENTATION