The effect of liquid anhydrous ammonia in the structure and morphology of cotton cellulose
17
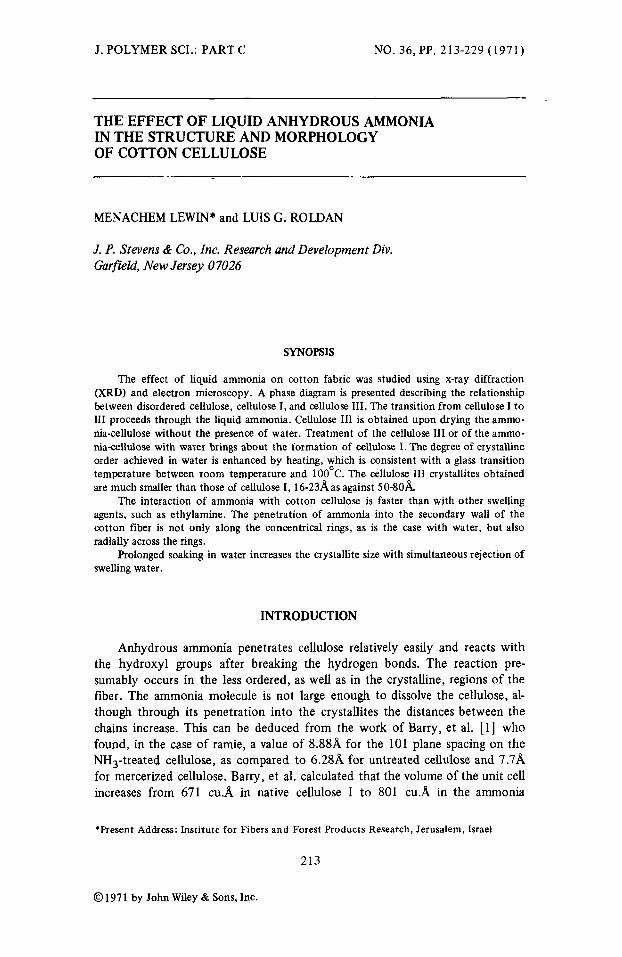
J. POLYMER SCI.: PART C NO. 36, PP. 213-229 (1971) THE EFFECT OF LIQUID ANHYDROUS AMMONIA IN THE STRUCTURE AND MORPHOLOGY OF COTTON CELLULOSE MENACHEM LEWIN* and LUIS G. ROLDAN J. P. Stevens & Co., Inc. Research and Development Div. Garfield, New Jersey 0 7026 SYNOPSIS The effect of liquid ammonia on cotton fabric was studied using x-ray diffraction (XRD) and electron microscopy. A phase diagram is presented describing the relationship between disordered cellulose, cellulose I, and cellulose 111. The transition from cellulose I to I11 proceeds through the liquid ammonia. Cellulose I11 is obtained upon drying the ammo- nia-cellulose without the presence of water. Treatment of the cellulose 111 or of the ammo- nia-cellulose with water brings about the formation of cellulose I. The degree of crystalline order achieved in water is enhanced by heating, which is consistent with a glass transition temperature between room temperature and 1 OOOC. The cellulose I11 crystallites obtained are much smaller than those of cellulose I, 16-23Aas against 50-80A The interaction of ammonia with cotton cellulose is faster than with other swelling agents, such as ethylamine. The penetration of ammonia into the secondary wall of the cotton fiber is not only along the concentrical rings, as is the case with water, but also radially across the rings. Prolonged soaking in water increases the crystallite size with simultaneous rejection of swelling water. INTRODUCTION Anhydrous ammonia penetrates cellulose relatively easily and reacts with the hydroxyl groups after breaking the hydrogen bonds. The reaction pre- sumably occurs in the less ordered, as well as in the crystalline, regions of the fiber. The ammonia molecule is not large enough to dissolve the cellulose, al- though through its penetration into the crystallites the distances between the chains increase. This can be deduced from the work of Barry, et al. [I] who found, in the case of ramie, a value of 8.88A for the 101 plane spacing on the NH3-treated cellulose, as compared to 6.28A for untreated cellulose and 7.7A for mercerized cellulose. Barry, et al. calculated that the volume of the unit cell increases from 671 cu.A in native cellulose I to 801 cu.A in the ammonia *Present Address: Institute for Fibers and Forest Products Research, Jerusalem, Israel 213 @ 1971 by John Wiley & Sons, Inc.
-
Upload
independent -
Category
Documents
-
view
1 -
download
0
Transcript of The effect of liquid anhydrous ammonia in the structure and morphology of cotton cellulose
J. POLYMER SCI.: PART C NO. 36, PP. 213-229 (1971)
THE EFFECT OF LIQUID ANHYDROUS AMMONIA IN THE STRUCTURE AND MORPHOLOGY OF COTTON CELLULOSE
MENACHEM LEWIN* and LUIS G. ROLDAN
J. P. Stevens & Co., Inc. Research and Development Div. Garfield, New Jersey 0 7026
SYNOPSIS
The effect of liquid ammonia on cotton fabric was studied using x-ray diffraction (XRD) and electron microscopy. A phase diagram is presented describing the relationship between disordered cellulose, cellulose I, and cellulose 111. The transition from cellulose I to I11 proceeds through the liquid ammonia. Cellulose I11 is obtained upon drying the ammo- nia-cellulose without the presence of water. Treatment of the cellulose 111 or of the ammo- nia-cellulose with water brings about the formation of cellulose I. The degree of crystalline order achieved in water is enhanced by heating, which is consistent with a glass transition temperature between room temperature and 1 OOOC. The cellulose I11 crystallites obtained are much smaller than those of cellulose I , 16-23Aas against 50-80A
The interaction of ammonia with cotton cellulose is faster than with other swelling agents, such as ethylamine. The penetration of ammonia into the secondary wall of the cotton fiber is not only along the concentrical rings, as is the case with water, but also radially across the rings.
Prolonged soaking in water increases the crystallite size with simultaneous rejection of swelling water.
INTRODUCTION
Anhydrous ammonia penetrates cellulose relatively easily and reacts with the hydroxyl groups after breaking the hydrogen bonds. The reaction pre- sumably occurs in the less ordered, as well as in the crystalline, regions of the fiber. The ammonia molecule is not large enough to dissolve the cellulose, al- though through its penetration into the crystallites the distances between the chains increase. This can be deduced from the work of Barry, et al. [ I ] who found, in the case of ramie, a value of 8.88A for the 101 plane spacing on the NH3-treated cellulose, as compared to 6.28A for untreated cellulose and 7.7A for mercerized cellulose. Barry, et al. calculated that the volume of the unit cell increases from 671 cu.A in native cellulose I to 801 cu.A in the ammonia
*Present Address: Institute for Fibers and Forest Products Research, Jerusalem, Israel
213
@ 197 1 by John Wiley & Sons, Inc.
214 LEWIN AND ROLDAN
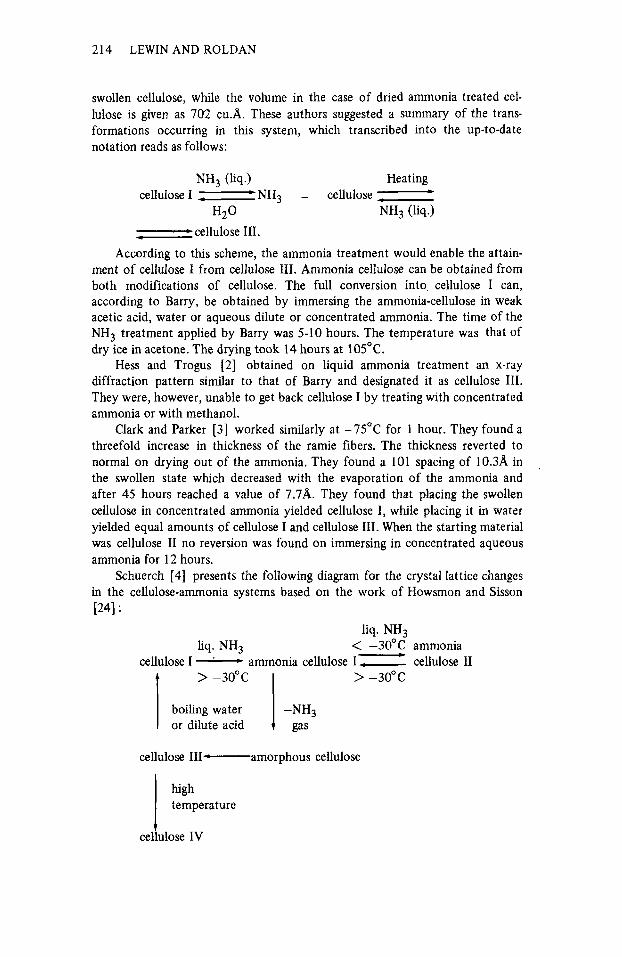
swollen cellulose, while the volume in the case of dried ammonia treated cel- lulose is given as 702 cu.A. These authors suggested a summary of the trans- formations occurring in this system, which transcribed into the up-to-date notation reads as follows:
NH3 (liq.) Heating cellulose I :NH3 - cellulose 7
H2O NH3 (liq.) 7 cellulose 111.
According to this scheme, the ammonia treatment would enable the attain- ment of cellulose I from cellulose 111. Ammonia cellulose can be obtained from both modifications of cellulose. The full conversion into, cellulose I can, according to Barry, be obtained by immersing the ammonia-cellulose in weak acetic acid, water or aqueous dilute or concentrated ammonia. The time of the NH3 treatment applied by Barry was 5-10 hours. The temperature was that of dry ice in acetone. The drying took 14 hours at 105°C.
Hess and Trogus [2] obtained on liquid ammonia treatment an x-ray diffraction pattern similar to that of Barry and designated it as cellulose 111. They were, however, unable to get back cellulose I by treating with concentrated ammonia or with methanol.
Clark and Parker [3] worked similarly at -75°C for 1 hour. They found a threefold increase in thickness of the ramie fibers. The thickness reverted to normal on drying out of the ammonia. They found a 101 spacing of 10.3A in the swollen state which decreased with the evaporation of the ammonia and after 45 hours reached a value of 7.7A. They found that placing the swollen cellulose in concentrated ammonia yielded cellulose I , while placing it in water yielded equal amounts of cellulose I and cellulose 111. When the starting material was cellulose I1 no reversion was found on immersing in concentrated aqueous ammonia for 12 hours.
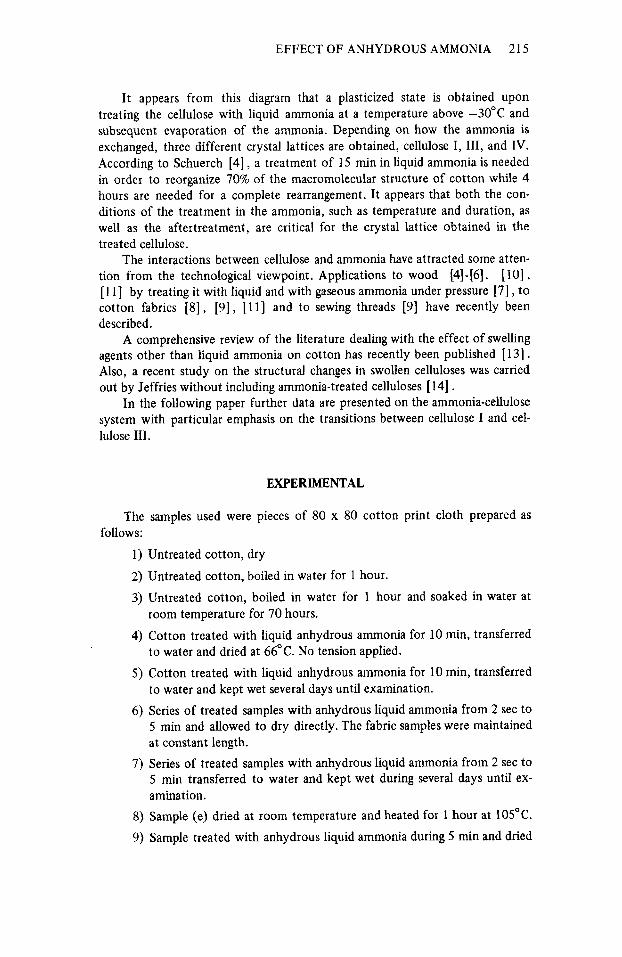
Schuerch [4] presents the following diagram for the crystal lattice changes in the cellulose-ammonia systems based on the work of Howsmon and Sisson [24] :
,
liq. NH3 < -30°C ammonia
> -30°C
L liq. NH,
cellulose I - ammonia cellulose I -- cellulose I1 1 boiling >-30"c water I -NH3
or dilute acid gas
cellulose 111-amorphous cellulose 1 E p e r a t u r e
cellulose IV
EFFECT OF ANHYDROUS AMMONIA 21 5
It appears from this diagram that a plasticized state is obtained upon treating the cellulose with liquid ammonia at a temperature above -30°C and subsequent evaporation of the ammonia. Depending on how the ammonia is exchanged, three different crystal lattices are obtained, cellulose I , 111, and IV. According to Schuerch [4] , a treatment of 15 min in liquid ammonia is needed in order to reorganize 70% of the macromolecular structure of cotton while 4 hours are needed for a complete rearrangement. It appears that both the con- ditions of the treatment in the ammonia, such as temperature and duration, as well as the aftertreatment, are critical for the crystal lattice obtained in the treated cellulose.
The interactions between cellulose and ammonia have attracted some atten- tion from the technological viewpoint. Applications to wood [4]-[6]. [lo] , [ 1 11 by treating it with liquid and with gaseous ammonia under pressure [7] , to cotton fabrics [S] , [9], [l 11 and to sewing threads [9] have recently been described.
A comprehensive review of the literature dealing with the effect of swelling agents other than liquid ammonia on cotton has recently been published [ 131 . Also, a recent study on the structural changes in swollen celluloses was carried out by Jeffries without including ammonia-treated celluloses [ 141 .
In the following paper further data are presented on the ammonia-cellulose system with particular emphasis on the transitions between cellulose I and cel- lulose 111.
EXPERIMENTAL
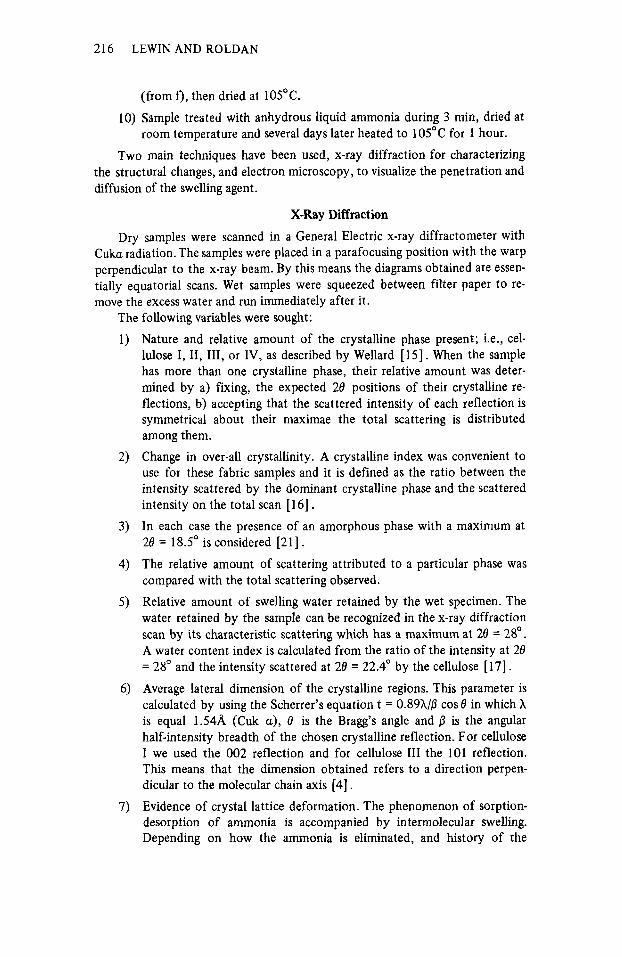
The samples used were pieces of 80 x 80 cotton print cloth prepared as follows:
1) Untreated cotton, dry
2) Untreated cotton, boiled in water for 1 hour.
3) Untreated cotton, boiled in water for 1 hour and soaked in water at room temperature for 70 hours.
4) Cotton treated with liquid anhydrous ammonia for 10 min, transferred to water and dried at 66°C. No tension applied.
5) Cotton treated with liquid anhydrous ammonia for 10 min, transferred to water and kept wet several days until examination.
6) Series of treated samples with anhydrous liquid ammonia from 2 sec to 5 min and allowed to dry directly. The fabric samples were maintained at constant length.
7) Series of treated samples with anhydrous liquid ammonia from 2 sec to 5 min transferred to water and kept wet during several days until ex- aminat ion.
8) Sample (e) dried at room temperature and heated for 1 hour at 105°C.
9) Sample treated with anhydrous liquid ammonia during 5 min and dried
216 LEWIN AND ROLDAN
(from 0, then dried at 105°C.
10) Sample treated with anhydrous liquid ammonia during 3 min, dried at room temperature and several days later heated to 105°C for 1 hour.
Two main techniques have been used, x-ray diffraction for characterizing the structural changes, and electron microscopy, to visualize the penetration and diffusion of the swelling agent.
X-Ray Diffraction
Dry samples were scanned in a General Electric x-ray diffractometer with Cuka radiation. The samples were placed in a parafocusing position with the warp perpendicular to the x-ray beam. By this means the diagrams obtained are essen- tially equatorial scans. Wet samples were squeezed between filter paper to re- move the excess water and run immediately after it.
The following variables were sought:
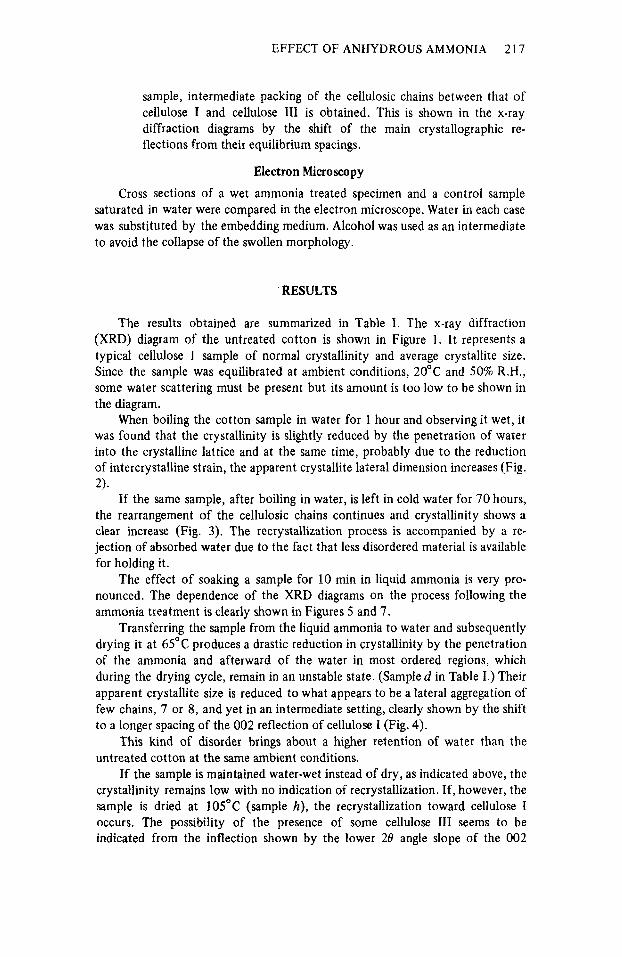
Nature and relative amount of the crystalline phase present; i.e., cel- lulose I, 11, 111, or IV, as described by Wellard [ 151 . When the sample has more than one crystalline phase, their relative amount was deter- mined by a) fming, the expected 28 positions of their crystalline re- flections, b) accepting that the scattered intensity of each reflection is symmetrical about their maximae the total scattering is distributed among them.
Change in over-all crystallinity. A crystalline index was convenient to use for these fabric samples and it is defined as the ratio between the intensity scattered by the dominant crystalline phase and the scattered intensity on the total scan [ 161 . In each case the presence of an amorphous phase with a maximum at 28 = 18.5" is considered [21].
The relative amount of scattering attributed to a particular phase was compared with the total scattering observed.
Relative amount of swelling water retained by the wet specimen. The water retained by the sample can be recognized in the x-ray diffraction scan by its characteristic scattering which has a maximum at 28 = 28". A water content index is calculated from the ratio of the intensity at 28 = 28" and the intensity scattered at 28 = 22.4" by the cellulose [ 171 . Average lateral dimension of the crystalline regions. This parameter is calculated by using the Scherrer's equation t = 0.89h/O cos 8 in which X is equal 1.54A (Cuk a), 8 is the Brag's angle and is the angular half-intensity breadth of the chosen crystalline reflection. For cellulose I we used the 002 reflection and for cellulose I11 the 101 reflection. This means that the dimension obtained refers to a direction perpen- dicular to the molecular chain axis [4].
Evidence of crystal lattice deformation. The phenomenon of sorption- desorption of ammonia is accompanied by intermolecular swelling. Depending on how the ammonia is eliminated, and history of the
EFFECT OF ANHYDROUS AMMONIA 21 7
sample, intermediate packing of the cellulosic chains between that of cellulose I and cellulose 111 is obtained. This is shown in the x-ray diffraction diagrams by the shift of the main crystallographic re- flections from their equilibrium spacings.
Electron Microscopy
Cross sections of a wet ammonia treated specimen and a control sample saturated in water were compared in the electron microscope. Water in each case was substituted by the embedding medium. Alcohol was used as an intermediate to avoid the collapse of the swollen morphology.
RESULTS
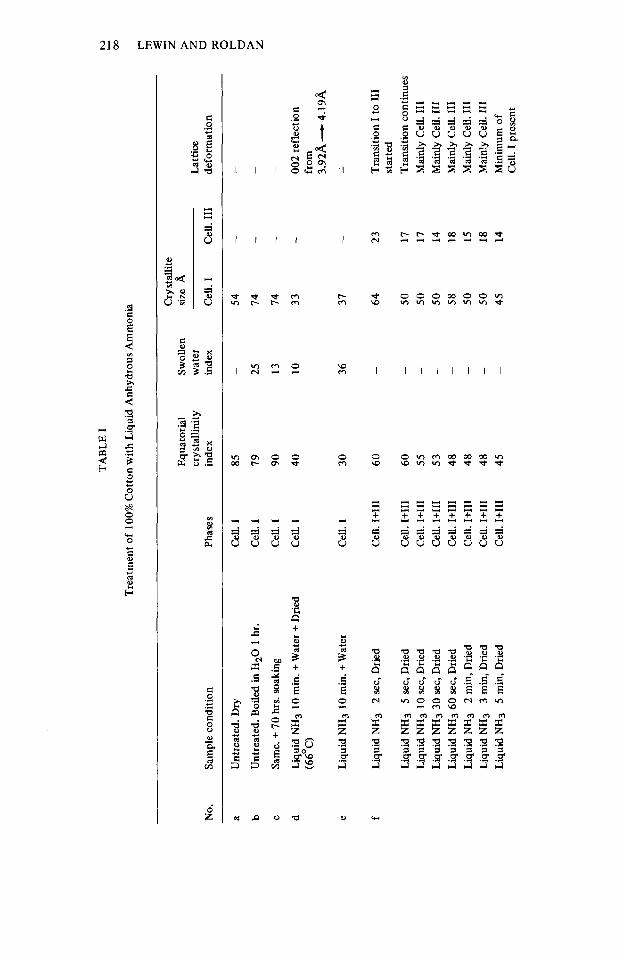
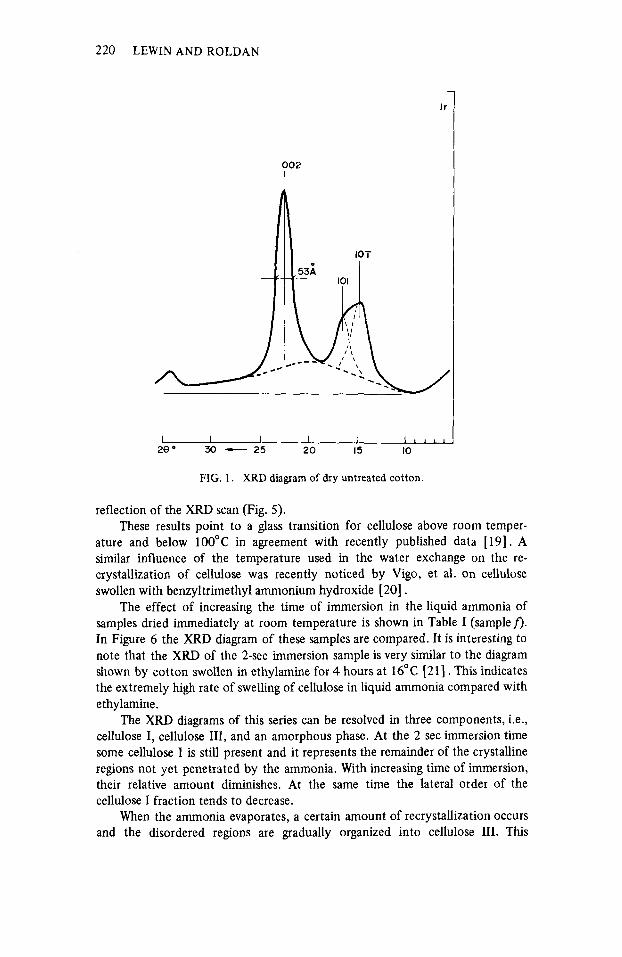
The results obtained are summarized in Table I . The x-ray diffraction (XRD) diagram of the untreated cotton is shown in Figure 1. It represents a typical cellulose I sample of normal crystallinity and average crystallite size. Since the sample was equilibrated at ambient conditions, 20°C and 50% R.H., some water scattering must be present but its amount is too low to be shown in the diagram.
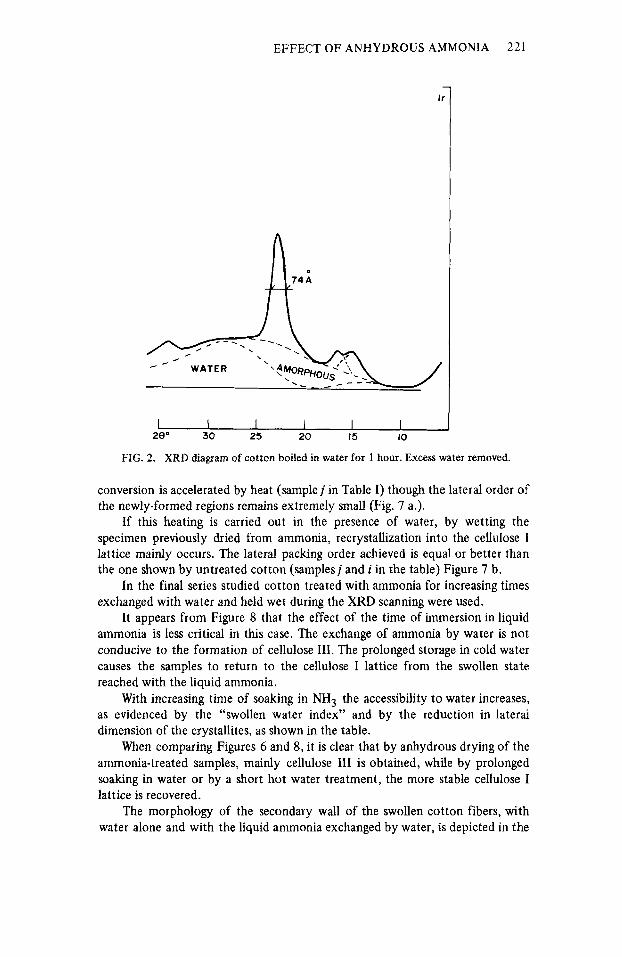
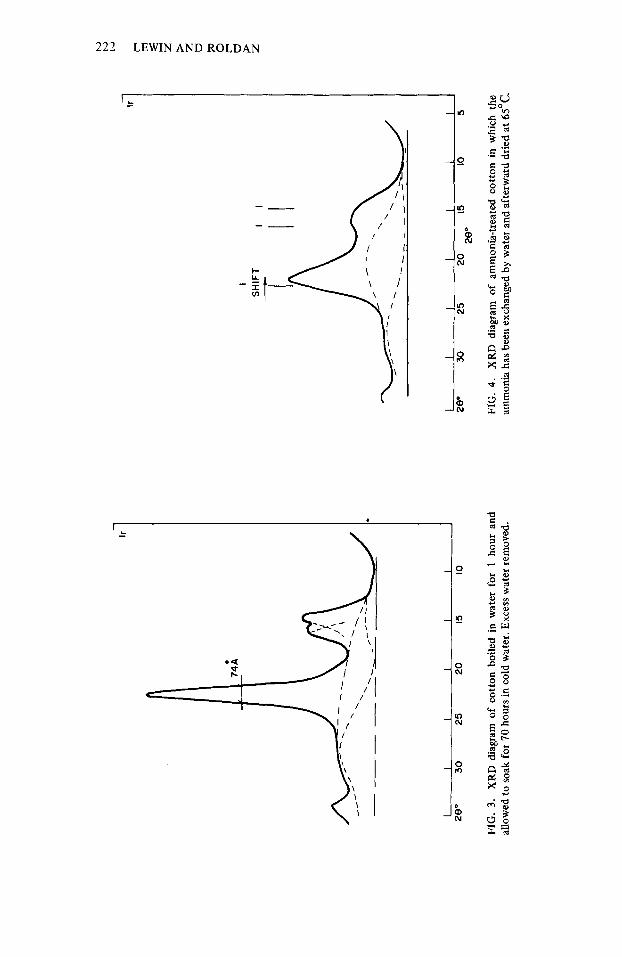
When boiling the cotton sample in water for 1 hour and observing it wet, it was found that the crystallinity is slightly reduced by the penetration of water into the crystalline lattice and at the same time, probably due to the reduction of intercrystalline strain, the apparent crystallite lateral dimension increases (Fig.
If the same sample, after boiling in water, is left in cold water for 70 hours, the rearrangement of the cellulosic chains continues and crystallinity shows a clear increase (Fig. 3). The recrystallization process is accompanied by a re- jection of absorbed water due to the fact that less disordered material is available for holding it.
The effect of soaking a sample for 10 min in liquid ammonia is very pro- nounced. The dependence of the XRD diagrams on the process following the ammonia treatment is clearly shown in Figures 5 and 7.
Transferring the sample from the liquid ammonia to water and subsequently drying it at 65°C produces a drastic reduction in crystallinity by the penetration of the ammonia and afterward of the water in most ordered regions, which during the drying cycle, remain in an unstable state. (Sample d in Table I.) Their apparent crystallite size is reduced to what appears to be a lateral aggregation of few chains, 7 or 8, and yet in an intermediate setting, clearly shown by the shift to a longer spacing of the 002 reflection of cellulose I (Fig. 4).
This kind of disorder brings about a higher retention of water than the untreated cotton at the same ambient conditions.
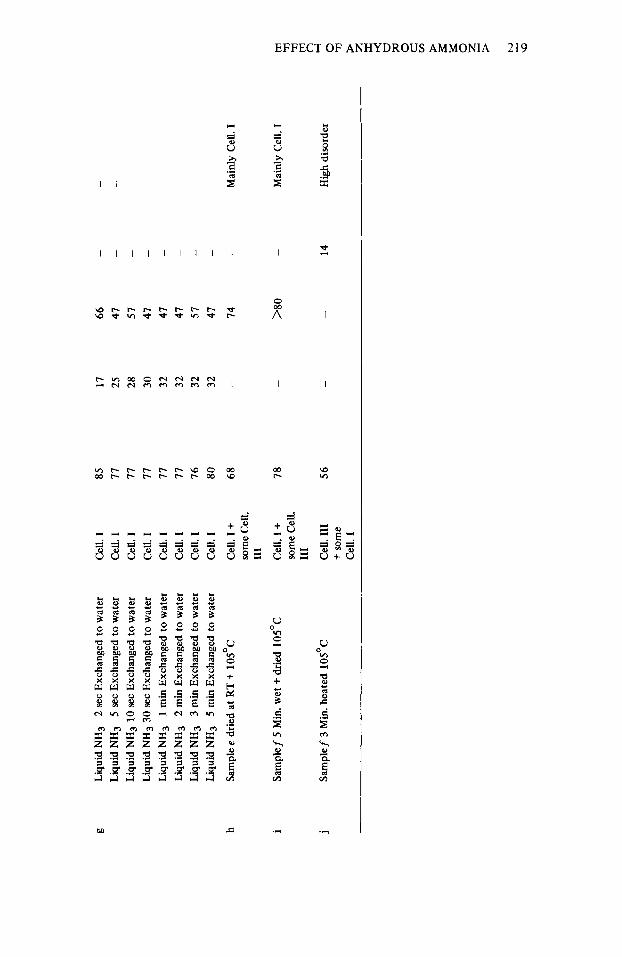
If the sample is maintained water-wet instead of dry, as indicated above, the Crystallinity remains low with no indication of recrystallization. If, however, the sample is dried at 105°C (sample h) , the recrystallization toward cellulose I occurs. The possibility of the presence of some cellulose I11 seems to be indicated from the inflection shown by the lower 20 angle slope of the 002
2).
TAB
LE I
Tre
atm
ent o
f 10
0% C
otto
n w
ith
Liqu
id A
nhyd
rous
Am
mon
ia
c! oc
Cry
stal
lite
Equ
ator
ial
Swol
len
size
A
cry s
t alli
nit y
w
ater
L
attic
e N
o.
Sam
ple
cond
ition
Ph
ases
in
dex
inde
x C
ell.
1 C
ell.
I11
defo
rmat
ion
a -
-
Unt
reat
ed.
Dry
C
ell.
I 85
-
54
b U
ntre
ated
. B
oile
d in
H,O
1
hr.
Cel
l. I
79
25
74
Sam
e. +
70
hrs.
soak
ing
Cel
l. I
90
13
74
- -
C
-
-
d Li
quid
NH
3 10 m
in. +
Wat
er +
Drie
d C
ell.
I 40
10
33
- 00
2 re
flec
tion
(66O
C)
from
3.
92A
- 4.1
9A
e -
-
Liqu
id N
H3
10 min.
+Wat
er
Cel
l. 1
30
36
37
f Li
quid
NH
3 2
sec,
Drie
d
Liqu
id N
H3
5 se
c, D
ried
Liqu
id N
H3
10 se
c, D
ried
Liqu
id N
H3 30 s
ec, D
ried
Liqu
id N
H3
60 se
c, D
ried
Liqu
id N
H3
2 m
in, D
ried
Liqu
id N
H3
3 m
in, D
ried
Liqu
id N
H3
5 rn
in, D
ried
Cel
l. I+
III
60
Cel
l. I+
III
60
Cel
l. I+
III
55
Cel
l. I+
III
53
Cel
l. I+
III
48
Cel
l. I+
III
48
Cel
l. I+
III
48
Cel
l. I+
III
45
64
50
50
50
58
50
50
45
23
17
17
14
18
15
18
14
Tra
nsiti
on I
to I1
1 st
arte
d T
rans
ition
con
tinue
s M
ainl
y C
ell.
111
Mai
nly
Cel
l. 11
1 M
ainl
y C
ell.
I11
Mai
nly
Cel
l. 11
1 M
ain!y
Cel
l. 11
1 M
inim
um o
f C
ell.
I pre
sent
g Li
quid
NH
3 2
sec
Exch
ange
d to
wat
er
Liqu
id N
H3
5 se
c Ex
chan
ged
to w
ater
Li
quid
NH
3 10
sec
Exch
ange
d to
wat
er
Liqu
id N
H3
30 s
ec E
xcha
nged
to
wat
er
Liqu
id N
H3
1 m
in E
xcha
nged
to
wat
er
Liqu
id N
H3
2 m
in E
xcha
nged
to
wat
er
Liqu
id N
H3
3 m
in E
xcha
nged
to
wat
er
Liqu
id N
H3
5 m
in E
xcha
nged
to
wat
er
Sam
ple e
dri
ed a
t RT
+ 10
5OC
h i Sa
mpl
ef 5
Min. w
et +
drie
d 10
5OC
j Sa
mpl
ef 3
Min. h
eate
d 10
5OC
cell.
1
Cel
l. I
Cel
l. I
Cel
l. I
Cel
l. I
Cel
l. I
Cel
l. I
Cel
l. I
Cel
l. I +
so
me
Cel
l. 11
1
Cel
l. I +
so
me
Cel
l. 11
1
Cel
l. 11
1 +
som
e ce
ll. I
85
I1
I1
I1
I1
I1
16
80
68
18
56
11
25
28
30
32
32
32
32
- -
-
66
-
41
-
51
-
41
-
41
-
41
-
51
-
41
-
14
-
>80
-
-
14
Mai
nly
Cel
l. I
Mai
nly
Cel
l. I
m
Hig
h di
sord
er
220 LEWIN AND ROLDAN
Ir
02
I \
I I I I I L P l l L
28' 30 - 25 20 15 10
FIG. 1. XRD diagram of dry untreated cotton.
reflection of the XRD scan (Fig. 5). These results point to a glass transition for cellulose above room temper-
ature and below 100°C in agreement with recently published data [19]. A similar influence of the temperature used in the water exchange on the re- crystallization of cellulose was recently noticed by Vigo, et al. on cellulose swollen with benzyltrimethyl ammonium hydroxide [20] .
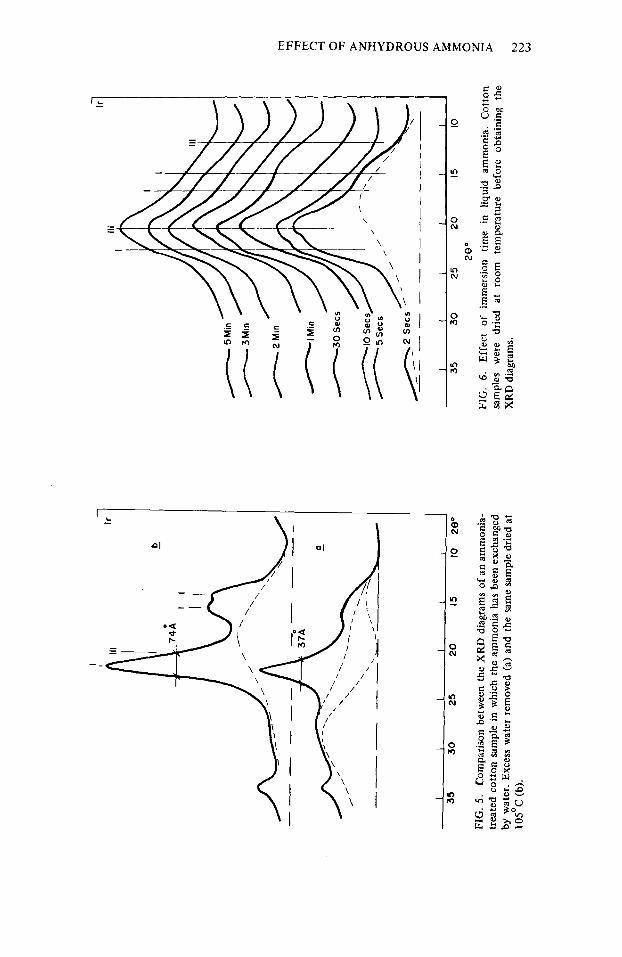
The effect of increasing the time of immersion in the liquid ammonia of samples dried immediately at room temperature is shown in Table I (samplef). In Figure 6 the XRD diagram of these samples are compared. It is interesting to note that the XRD of the 2-sec immersion sample is very similar to the diagram shown by cotton swollen in ethylamine for 4 hours at 16°C [21]. This indicates the extremely high rate of swelling of cellulose in liquid ammonia compared with ethylamine.
The XRD diagrams of this series can be resolved in three components, Le., cellulose I, cellulose 111, and an amorphous phase. At the 2 sec immersion time some cellulose I is still present and it represents the remainder of the crystalline regions not yet penetrated by the ammonia. With increasing time of immersion, their relative amount diminishes. At the same time the lateral order of the cellulose I fraction tends to decrease.
When the ammonia evaporates, a certain amount of recrystallization occurs and the disordered regions are gradually organized into cellulose 111. This
EFFECT OF ANHYDROUS AMMONIA 221
1 I 1 1 I I 280 30 25 20 15 10
FIG. 2. XRD diagram of cotton boiled in water for 1 hour. Excess water removed.
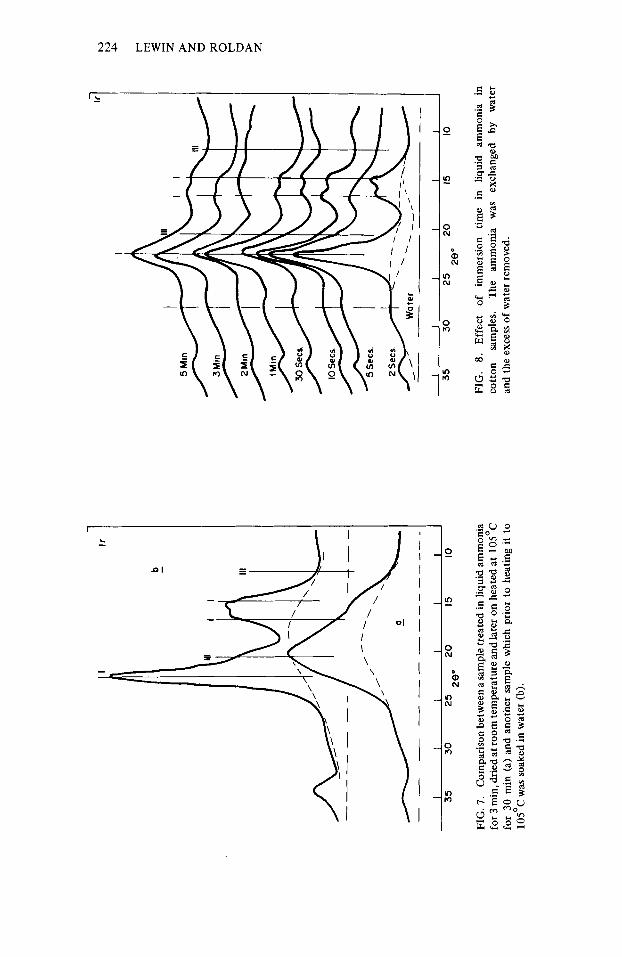
conversion is accelerated by heat (sample j in Table I) though the lateral order of the newly-formed regions remains extremely small (Fig. 7 a.).
If this heating is carried out in the presence of water, by wetting the specimen previously dried from ammonia, recrystallization into the cellulose I lattice mainly occurs. The lateral packing order achieved is equal or better than the one shown by untreated cotton (samples j and i in the table) Figure 7 b.
In the final series studied cotton treated with ammonia for increasing times exchanged with water and held wet during the XRD scanning were used.
It appears from Figure 8 that the effect of the time of immersion in liquid ammonia is less critical in thls case. The exchange of ammonia by water is not conducive to the formation of cellulose 111. The prolonged storage in cold water causes the samples to return to the cellulose I lattice from the swollen state reached with the liquid ammonia.
With increasing time of soaking in NH, the accessibility to water increases, as evidenced by the “swollen water index” and by the reduction in laterd dimension of the crystallites, as shown in the table.
When comparing Figures 6 and 8, it is clear that by anhydrous drying of the ammonia-treated samples, mainly cellulose 111 is obtained, while by prolonged soaking in water or by a short hot water treatment, the more stable cellulose I lattice is recovered.
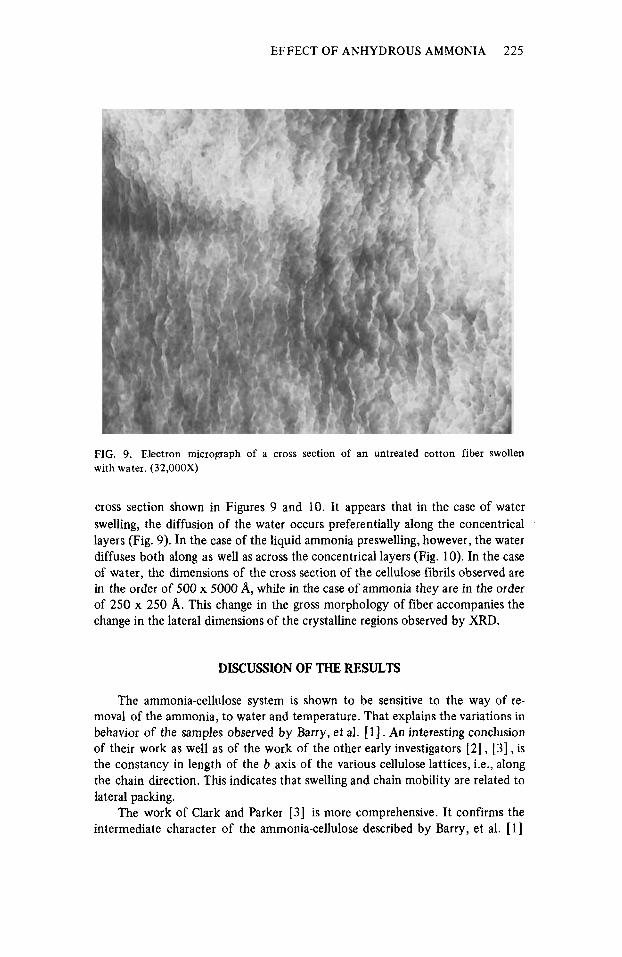
The morphology of the secondary wall of the swollen cotton fibers, with water alone and with the liquid ammonia exchanged by water, is depicted in the
Ir
I I
I I
I I
28
0
30
25
20
15
10
FIG
. 3.
XRD d
iagr
am o
f co
tton
boi
led
in w
ater
for
1 h
our
and
allo
wed
to
soak
for
70 h
ours
in c
old
wat
er. E
xces
s w
ater
rem
oved
.
Ir
I
SH
IFT
I
I
-t
I I
I I
I 1
I 28
' 30
25
20
15
10 5
280
FIG
. 4.
X
RD
dia
gram
of
amm
onia
-tre
ated
cot
ton
in w
hich
the
am
mon
ia h
as b
een
exch
ange
d by
wat
er a
nd a
fter
war
d dri
ed a
t 6S
0c.
I Ir
I I
I I
1 I
30
25
20
15
10
28
0 35
FIG
. 5.
Com
pari
son
betw
een
the
XR
D d
iagr
ams
of a
n am
mon
ia-
trp
>te
d r
ntt
nn
e~
rn
nle
in w
hi,
-h
tho
nm
m-n
io
hn
n k
en
- --
-Ln
-,.,
.l
by w
ater
. Exc
ess
wat
er r
emov
ed (
a) a
nd t
he s
ame
sam
ple
drie
d at
10
5OC
(b).
I I
I I
I I
35
30
25
20
15
10
FIG
. 6.
Eff
ect of
imm
ersi
on t
ime
in
liqui
d am
mon
ia.
Cot
ton
sam
ples
w
ere
drie
d at
roo
m
tem
pera
ture
bef
ore
obta
inin
g th
e X
RD
dia
gram
s.
28"
I Ir
- - - -
--
I I
1 I
I I
35
30
20
15
10
25 2
80
FIG
. 7.
Com
pari
son
betw
een
a sa
mpl
e tr
eate
d in
liqu
id a
mm
onia
fo
r 3 m
in, d
ried
at r
oom
tem
pera
ture
and
late
r on
hea
ted
at 1
05O
C
for
30 m
in (
a) a
nd a
noth
er s
ampl
e w
hich
pri
or t
o he
atin
g it
to
105O
C w
as s
oake
d in
wat
er (
b).
FIG
. 8.
E
ffec
t of
im
mer
sion
tim
e in
liq
uid
amm
onia
in
co
tton
sa
mpl
es.
The
am
mon
ia
was
ex
chan
ged
by
wat
er
and
the
exce
ss o
f w
ater
rem
oved
.
h)
EFFECT OF ANHYDROUS AMMONIA 225
FIG. 9. Electron micrograph of a cross section of an untreated cotton fiber swollen with water. (32,OOOX)
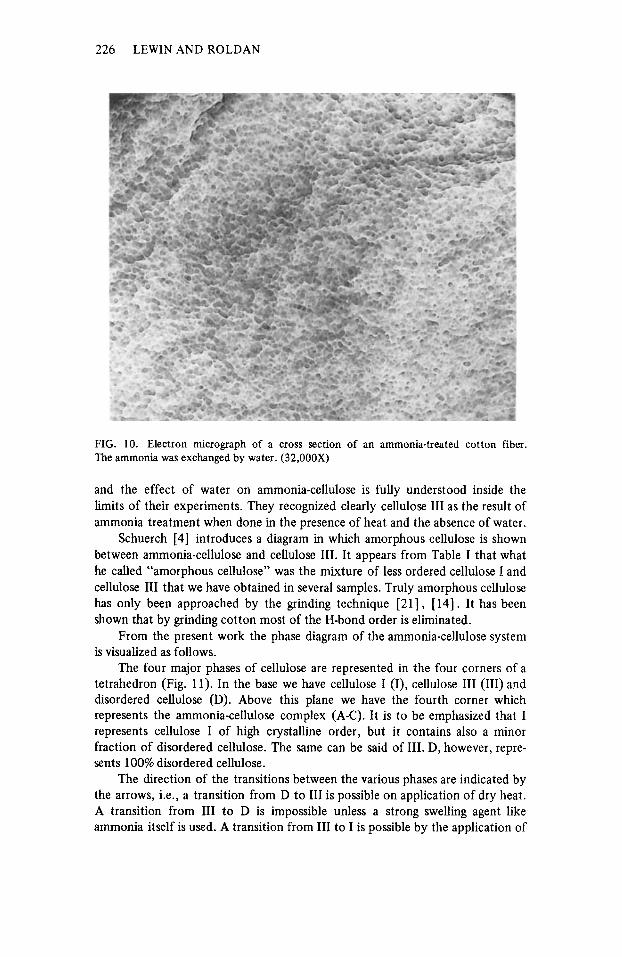
cross section shown in Figures 9 and 10. It appears that in the case of water swelling, the diffusion of the water occurs preferentially along the concentrical layers (Fig. 9). In the case of the liquid ammonia preswelling, however, the water diffuses both along as well as across the concentrical layers (Fig. 10). In the case of water, the dimensions of the cross section of the cellulose fibrils observed are in the order of 500 x 5000 A, while in the case of ammonia they are in the order of 250 x 250 A. This change in the gross morphology of fiber accompanies the change in the lateral dimensions of the crystalline regions observed by XRD.
DISCUSSION OF THE RESULTS
The ammonia-cellulose system is shown to be sensitive to the way of re- moval of the ammonia, to water and temperature. That explains the variations in behavior of the samples observed by Barry, et al. [ I ] . An interesting conclusion of their work as well as of the work of the other early investigators [2] , [3] , is the constancy in length of the b axis of the various cellulose lattices, i.e., along the chain direction. This indicates that swelling and chain mobility are related to lateral packing.
The work of Clark and Parker [3] is more comprehensive. It confirms the intermediate character of the ammonia-cellulose described by Barry, et al. [ 11
226 LEWIN AND ROLDAN
FIG. 10. Electron micrograph of a cross section of an ammonia-treated cotton fiber. The ammonia was exchanged by water. (32,OOOX)
and the effect of water on ammonia-cellulose is fully understood inside the limits of their experiments. They recognized clearly cellulose 111 as the result of ammonia treatment when done in the presence of heat and the absence of water.
Schuerch [4] introduces a diagram in which amorphous cellulose is shown between ammonia-cellulose and cellulose 111. It appears from Table I that what he called “amorphous cellulose” was the mixture of less ordered cellulose I and cellulose 111 that we have obtained in several samples. Truly amorphous cellulose has only been approached by the grinding technique [21], [14]. It has been shown that by grinding cotton most of the H-bond order is eliminated.
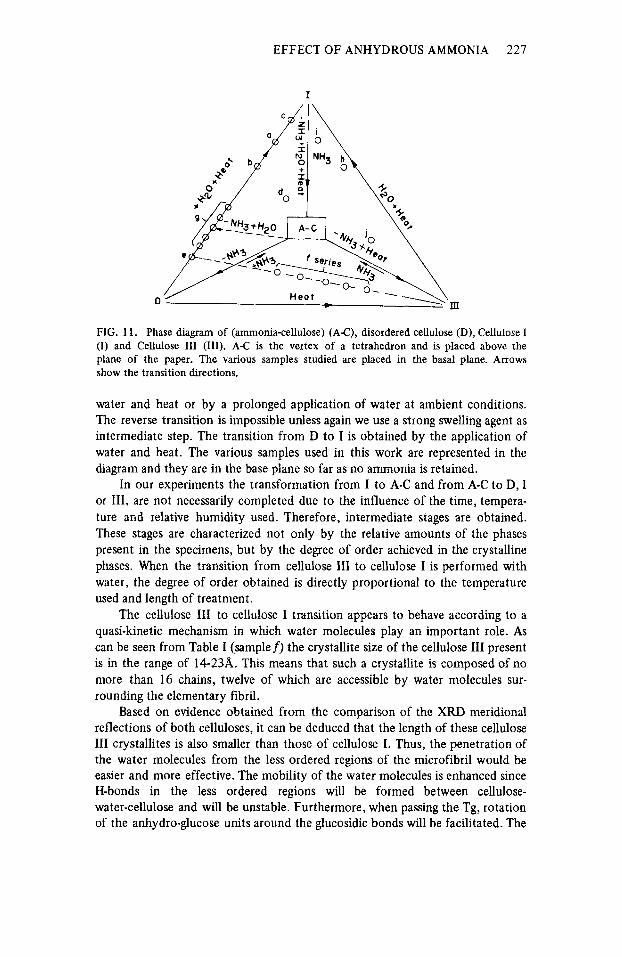
From the present work the phase diagram of the ammonia-cellulose system is visualized as follows.
The four major phases of cellulose are represented in the four corners of a tetrahedron (Fig. 11). In the base we have cellulose I (I), cellulose I11 (111) and disordered cellulose (D). Above this plane we have the fourth corner which represents the ammonia-cellulose complex (A-C). It is to be emphasized that I represents cellulose I of high crystalline order, but it contains also a minor fraction of disordered cellulose. The same can be said of 111. D, however, repre- sents 100% disordered cellulose.
The direction of the transitions between the various phases are indicated by the arrows, i.e., a transition from D to 111 is possible on application of dry heat. A transition from I11 to D is impossible unless a strong swelling agent like ammonia itself is used. A transition from I11 to I is possible by the application of
EFFECT OF ANHYDROUS AMMONIA 227
rn D
FIG. 11. Phase diagram of (ammonia-cellulose) (A€), disordered cellulose (D), Cellulose I (I) and Cellulose I11 (111). A€ is the vertex of a tetrahedron and is placed above the plane of the paper. The various samples studied are placed in the basal plane. Arrows show the transition directions.
water and heat or by a prolonged application of water at ambient conditions. The reverse transition is impossible unless again we use a strong swelling agent as intermediate step. The transition from D to I is obtained by the application of water and heat. The various samples used in this work are represented in the diagram and they are in the base plane so far as no ammonia is retained.
In our experiments the transformation from I to A-C and from A-C to D, I or 111, are not necessarily completed due to the influence of the time, tempera- ture and relative humidity used. Therefore, intermediate stages are obtained. These stages are characterized not only by the relative amounts of the phases present in the specimens, but by the degree of order achieved in the crystalline phases. When the transition from cellulose 111 to cellulose I is performed with water, the degree of order obtained is directly proportional to the temperature used and length of treatment.
The cellulose 111 to cellulose I transition appears to behave according to a quasi-kinetic mechanism in which water molecules play an important role. As can be seen from Table I (samplef) the crystallite size of the cellulose I11 present is in the range of 14-23A. This means that such a crystallite is composed of no more than 16 chains, twelve of wluch are accessible by water molecules sur- rounding the elementary fibril.
Based on evidence obtained from the comparison of the XRD meridional reflections of both celluloses, it can be deduced that the length of these cellulose 111 crystallites is also smaller than those of cellulose I. Thus, the penetration of the water molecules from the less ordered regions of the microfibril would be easier and more effective. The mobility of the water molecules is enhanced since H-bonds in the less ordered regions will be formed between cellulose- water-cellulose and will be unstable. Furthermore, when passing the Tg, rotation of the anhydro-glucose units around the glucosidic bonds will be facilitated. The
228 LEWIN AND ROLDAN
formation of cellulose I crystallites along the elementary fibrils in the less ordered regions should produce an additional strain in the H-bonds of the small cellulose I11 crystallites, thus enhancing their disappearance.
The small crystallite size of cellulose I11 is an important aspect of the system. This can be understood in the light of the fact that cellulose 111 is formed from the high swollen state of the ammonia-cellulose complex. The drying step which involves a rapid evaporation of the ammonia is similar to an imperfect quenching which produces small and short crystalline regions. A parallel case has been observed in polycaprolactam (nylon 6). The quenching of nylon 6 melt, slightly above the Tg, creates along with the amorphous, the short-range order crystal of the gamma phase [ 161 . The nylon 6 gamma phase behaves in strikingly similar way to cellulose 111. Water and heat effect a transi- tion to the stable highly ordered alpha phase which is irreversible,except through me1 ting .
The influence of the time of soaking in ammonia is evident by the decrease in crystallinity and crystallite size observed (samples f and g in Table I), when the time of soaking increases. If it is assumed that the penetration of the ammonia is effected by a migration from less ordered regions in the elementary fibrils toward the crystalline regions, it is to be expected that the longer time in ammonia, the shorter the remaining crystallites would be.
A similar picture was presented by Sharples [22] in explaining the hydrolysis of celluloses and by Lewin [23] for alkaline and acid swellings.
It is realized that the phase-diagram presented is incomplete and the re- lationship between the discussed phases and cellulose I1 and IV have not been considered.
Acknowledgment
The authors wish to acknowledge the help of MI. R. Wondra and Dr. J. J. Willard for the sample preparation and helpful discussions, and to Dr. F. X. Werber and J. P. Stevens & Co., lnc. for permission to publish this work.
REFERENCES
1 . A. J. Barry, F. C. Peterson, and A. J. King,J. Amer. Chem. Soc., 58, 333 (1936). 2. K. Hess and C. Trogus,Ber., 68B, 1986 (1935). 3. C. L. Clark and E. A. Parker,J. Phys. Chem., 41,777 (1937). 4. C. Schuerch, Forest Prod. J., 14, 317 (1964). 5. C. Schuerch, Ind. Eng. Chem., 55 , 139 (1963). 6. C. Schuerch, U. S. Patent 3,282,313, 1966. 7. R. W. Davidson, Plasticizing Wood with Anhydrous Ammonia, School of Forestry,
8. Norweigian Patent 152,995,1964. 9. J. Coats, and P. Coats, British Patent 1,136,417,1967.
SyrdCUSe, 1966.
10. C. Schuerch, M. P. Budrick, and M. Mahdalic, I & E. C. Prod. Res. Develop., 5 , 101
11. R. C. Pentoney, Z & E.C. Prod. Res. Develop., 5 , 105 (1966). 12. C. Y. Cogek, W. F. Olds, E. I . Valko, and E. S. Shanley, Textile Res. J., 39, 543 (1969). 13. J. 0. Warwicker, R. Jeffries, R. L. Colbran, and R. N. Robinson, Shirley Institute
14. R. Jeffries, J. Appl. Polymer Sci.. 12,425 (1968).
(1966).
Pamphlet No. 93, December 1966.

EFFECT OF ANHYDROUS AMMONIA 229
15. H. J. Wellard,J. Polymer Sci., 13,471 (1954). 16. L. G. Roldan, F. Rahl, and A. R. Paterson,J. Polymer Sci. C, No. 8, 145 (1965). 17. S. Nomura, S. Kawabata, and H. Kawai, J. Polymer Sci. A-2, 7 , 325 (1969). 18. I. Nieduszynski and R. D. Preston,Nature, 225.274 (1970). 19. J. Kubat, M. Sverker, L. Soremark, and Ch. Soremark, Svensk Pupperstid., 7 2 , 731
20. T. L. Vigo, D. Mitcham, and C. M. Welch, Polymer Letters, 8, 385-393 (1970). 21. K. J. Heritage, J. Mann, and L. G. Roldan,J. Polymer Sci. A-1, 671 (1963). 22. A. Sharples, l h n s . Famalay Soc., 54,913 (1958). 23. M. Lewin, Mild Oxidation of Cotton, Project FG-Is-169, Final Report submitted to
24. J. A. Howsmon and W. A. Sisson, in Cellulose and Cellulose Derivatives, E. Ott, H. M.
(1969).
Agricultural Research Service, U.S.D.A., Jerusalem, Israel, 1968.
Spurlin and M. W. Grafflin, eds., New York, Interscience.