Excretion, Metabolism, and Tissue Distribution of Gelsemium ...
3105
J. Dairy Sci. 94 :3105–3118doi: 10.3168/jds.2010-4059 © American Dairy Science Association®, 2011 .
ABSTRACT
High-sugar grass varieties have received considerable attention for their potential to reduce nitrogen (N) excretion and increase milk yield in cattle. However, considerable variation exists in the magnitude of re-sponse in published results. The purpose of this study is to explain the variation in response using a dynamic mechanistic model to predict observed N and milk yield results from the literature, and from simulated data. Examined effects were (1) water-soluble carbohydrate [WSC; g/kg of dry matter (DM)] increase; (2) change in crude protein (CP) and neutral detergent fiber (NDF) content of the plant with WSC increase; and (3) the level of N fertilization. The database for evaluation of model N and milk yield predictions consisted of 4 published studies with 28 treatment means for which high-sugar grasses were being evaluated. Water-soluble carbohydrate content of the diets ranged from 95 to 248 g/kg of DM, CP content ranged from 115 to 263 g/kg of DM, and the NDF content ranged from 400 to 568 g/kg of DM. Urine N, milk N, and total N excretion were predicted well by the model and followed the di-rectional pattern of observed values within each study. Simulation results showed that the N utilization ratio increased as the WSC content of the diet increased, but to varying degrees depending on the grass scenario examined. The greatest benefit in terms of N utiliza-tion ratio and urine N levels were seen when the WSC content of grass increased at the expense of CP, fol-lowed by a 50:50 CP and NDF mix, followed by a trade for NDF. Simulated milk yield decreased slightly when WSC increased at the expense of CP, increased slightly when it increased at the expense of a CP and NDF
mix, and increased most when WSC increased at the expense of NDF. Results were amplified slightly under conditions of low-N fertilization and in the absence of grain feeding. Overall, modeling is useful as an explana-tory tool. The variation from results in the literature with high-WSC grass feeding may be, at least in part, the result of the level of WSC (g/kg of DM) increase, concurrent changes occurring within the CP and NDF fractions of the plant, and the plane of nutrition of the diet (grain feeding and N fertilization levels). Key words: high-sugar grass, nitrogen, milk yield, modeling
INTRODUCTION
Feeding high-sugar grass varieties to pastured cattle is proposed as a means to reduce N excretion in urine and feces, lessen the environmental impact of pastured cattle, and potentially increase milk yield. The total amount of N excreted by cattle can be significantly reduced by reducing the dietary CP content (Castillo et al., 2000; Kebreab et al., 2002), but N excretion is not exclusively determined in this way. The proposed mechanism of the high-sugar grass mitigation strategy is that for a high-producing animal on pasture, rumen microbes lack adequate supply of energy (carbon) for microbial growth relative to the large amount of avail-able protein N in the diet. This nutrient asynchrony results in large amounts of N being lost from the rumen as ammonia instead of being incorporated into micro-bial protein, most of which is subsequently excreted as urea in the urine. It has been proposed that increasing the sugar content of grasses could rectify the imbal-ance of carbon and N being delivered to the rumen microbes, thereby making N utilization by the microbes more efficient, decreasing N loss from the animal and increasing the supply of CP to the ruminant (Miller et al., 2001a,b).
Edwards et al. (2007) produced a comprehensive re-view of the trials conducted to date by the 3 main groups
The effect of high-sugar grass on predicted nitrogen excretion and milk yield simulated using a dynamic model J. L. Ellis ,*†1 J. Dijkstra ,† A. Bannink , A. J. arsons , S. Rasmussen , . R. Ed ards , E. e rea , and J. France* *Centre for Nutrition Modelling, Department of Animal and Poultry Science, University of Guelph, Guelph, ON, Canada N1G 2W1 †Animal Nutrition Group, Wageningen University, 6700 HB Wageningen, the Netherlands ‡Wageningen UR Livestock Research, 8200 AB Lelystad, the Netherlands §AgResearch, Palmerston North 4442, New Zealand #Faculty of Agriculture and Life Sciences, Lincoln University, Lincoln 7647, New Zealand
Received December 3, 2010. Accepted February 8, 2011. 1 Corresponding author: [email protected]
3106 ELLIS ET AL.
Journal of Dairy Science Vol. 94 No. 6, 2011
that have been participating in sugar grass research: the UK studies (Miller et al., 2000, 2001a,b; Moorby et al., 2006), the Dutch studies (Tas et al., 2005, 2006a,b; Taweel et al., 2005a,b, 2006), and the New Zealand studies (Tavendale et al., 2006; Cosgrove et al., 2007). Edwards et al. (2007) concluded that the lack of re-sponse in terms of N excretion to high-sugar grasses in some trials could be that despite large differences in the water-soluble carbohydrate (WSC) content of tested forages, only small differences in the ratio of the WSC content:CP content in dietary dry matter (WSC:CP) actually existed. Compiling and graphing the results showed that only high WSC:CP ratios (>0.7) led to a decrease in the proportion of N intake excreted from the animal. However, this reduction could be achieved by an increase in the WSC content or by a decrease in the CP content of the diet. These 2 scenarios may have very different effects on digestibility and milk yield. Other claims of the potential benefits of feeding high-WSC grasses include increasing grass palatability, DMI, and milk production (Miller et al., 2001a; Lee et al., 2002; Abrahamse et al., 2009).
The purpose of this study was, therefore, to attempt an explanation for the variation in N excretion and milk yield responses to high-WSC grasses reported in the literature by (1) using a dynamic mechanistic model to evaluate the capacity of the model to repro-duce observed variation in N excretion and milk yield results; and (2) performing a model behavioral analysis, keeping DMI constant, and evaluating a wide variety of high-WSC grass compositions and feeding scenarios. With respect to the latter, the WSC fraction of grass (g/kg of DM) was increased by 3 levels: 20, 60, and 90 g/kg of DM at the expense of CP, NDF, or a 50:50 split of CP and NDF; high and low N levels of the grass were simulated representing high and normal N fertilization levels; and simulations were performed with and with-out grain as a supplement to the diet.
MATERIALS AND METHODS
The Model
A modified version of the rumen model of Dijkstra et al. (1992) was used to simulate effects of high-WSC grasses on N excretion and milk yield. The model simu-lates the digestion, absorption, and outflow of nutrients in the rumen and hindgut, and represents N, carbohy-drate, lipid, microbial, and VFA transactions. Modifi-cations to the original model of Dijkstra et al. (1992) include an updated pH-dependent VFA stoichiometry of Bannink et al. (2008) instead of the original stoichi-ometry of Murphy et al. (1982), a hydrogen balance
sub-model and hindgut fermentation model developed by Mills et al. (2001), and calculations for N excretion developed by Reijs (2007). The empirical equations of Seo et al. (2006) were used for the fractional passage rate in the rumen. The original model, as well as the modifications and additions made to the model in the subsequent publications, has been tested on indepen-dent data in those publications. The original Dijkstra model, plus the subsequent series of additions and Reijs excretion equations, will be referred to as the “modified Dijkstra model” in this publication.
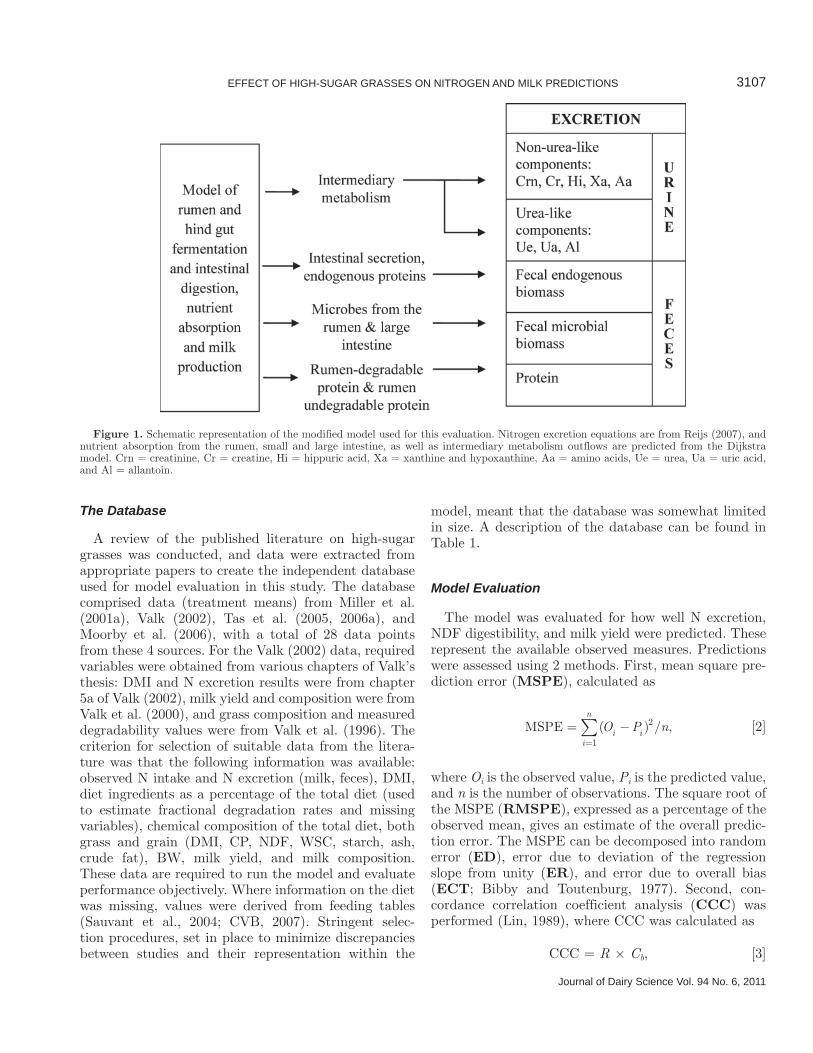
Nitrogen Excretion. The equations on N excre-tion developed by Reijs (2007) were included in the model so that the outputs from the digestion part of the model become the inputs required for the Reijs ex-cretion equations. A schematic representation of the N excretion part of the model is shown in Figure 1. The Dijkstra model is used to predict outflow of undigested feed and microbial material from the rumen and intes-tine. Sources of fecal N include (1) endogenous N, (2) microbial N, and (3) potentially degradable and unde-gradable feed protein, with assumptions on N content in each component.
Urinary N (g/d) was calculated according to
Nurine = Nfeed – Nmilk – Nfeces – Nretention, [1]
where Nretention (g/d) is calculated assuming 22.1 g of N for every 1 kg of BW change per day for dairy cattle (AFRC, 1993). Urea N is calculated as the difference between Nurine and the sum of N in other urinary con-stituents. The non-urea-like urinary N components were calculated based on values found in the literature and are given in Reijs (2007). From these equations, total N excretion can be estimated, as well as dividing it into its components.
Milk Yield. Nutrients absorbed from the gastroin-testinal tract can be classified as glucogenic, lipogenic, or aminogenic nutrients. The amount of ME available for absorption is calculated from these nutrients and their respective energy contents. Calculated milk yield is determined by the most limiting supply among glucogenic nutrients, aminogenic nutrients, lipogenic nutrients, and ME (Dijkstra et al., 1996). If the sup-ply of glucogenic nutrients is first limiting, aminogenic nutrients in excess may be used for gluconeogenesis, assuming 0.6 g/g of the absorbed AA to be glucogenic (Dijkstra et al., 2008).
Fat- and protein-corrected milk yield (3.5% fat and 3.2% protein; kg/d) was calculated as 0.3246 × milk yield (kg/d) + 12.86 × milk fat (kg/d) + 7.04 × milk protein (kg/d) (Bernard, 1997).
Journal of Dairy Science Vol. 94 No. 6, 2011
EFFECT OF HIGH-SUGAR GRASSES ON NITROGEN AND MILK PREDICTIONS 3107
The Database
A review of the published literature on high-sugar grasses was conducted, and data were extracted from appropriate papers to create the independent database used for model evaluation in this study. The database comprised data (treatment means) from Miller et al. (2001a), Valk (2002), Tas et al. (2005, 2006a), and Moorby et al. (2006), with a total of 28 data points from these 4 sources. For the Valk (2002) data, required variables were obtained from various chapters of Valk’s thesis: DMI and N excretion results were from chapter 5a of Valk (2002), milk yield and composition were from Valk et al. (2000), and grass composition and measured degradability values were from Valk et al. (1996). The criterion for selection of suitable data from the litera-ture was that the following information was available: observed N intake and N excretion (milk, feces), DMI, diet ingredients as a percentage of the total diet (used to estimate fractional degradation rates and missing variables), chemical composition of the total diet, both grass and grain (DMI, CP, NDF, WSC, starch, ash, crude fat), BW, milk yield, and milk composition. These data are required to run the model and evaluate performance objectively. Where information on the diet was missing, values were derived from feeding tables (Sauvant et al., 2004; CVB, 2007). Stringent selec-tion procedures, set in place to minimize discrepancies between studies and their representation within the
model, meant that the database was somewhat limited in size. A description of the database can be found in Table 1.
Model Evaluation
The model was evaluated for how well N excretion, NDF digestibility, and milk yield were predicted. These represent the available observed measures. Predictions were assessed using 2 methods. First, mean square pre-diction error (MSPE), calculated as
MSPE /= −=∑( ) ,O P nii
n
i1
2 [2]
where Oi is the observed value, Pi is the predicted value, and n is the number of observations. The square root of the MSPE (RMSPE), expressed as a percentage of the observed mean, gives an estimate of the overall predic-tion error. The MSPE can be decomposed into random error (ED), error due to deviation of the regression slope from unity (ER), and error due to overall bias (ECT; Bibby and Toutenburg, 1977). Second, con-cordance correlation coefficient analysis (CCC) was performed (Lin, 1989), where CCC was calculated as
CCC = R × Cb, [3]
Figure 1. Schematic representation of the modified model used for this evaluation. Nitrogen excretion equations are from Reijs (2007), and nutrient absorption from the rumen, small and large intestine, as well as intermediary metabolism outflows are predicted from the Dijkstra model. Crn = creatinine, Cr = creatine, Hi = hippuric acid, Xa = xanthine and hypoxanthine, Aa = amino acids, Ue = urea, Ua = uric acid, and Al = allantoin.
3108 ELLIS ET AL.
Journal of Dairy Science Vol. 94 No. 6, 2011
where R is the Pearson correlation coefficient and Cb is a bias correction factor. The R variable gives a measure of precision, whereas Cb is a measure of accuracy. An associated variable μ gives an indication of bias, where a positive value indicates under-prediction, and a nega-tive value indicates over-prediction (Lin, 1989).
Model Behavior Analysis
To evaluate the behavior of the model given a wide variety of high-WSC grass compositions and feeding scenarios, the following simulations were performed. High-WSC grass simulations are presented in Table 2 and represent inputs for the model. The WSC fraction of grass (g/kg of DM) was increased by 3 levels: 20, 60, and 90 g/kg of DM at the expense of CP, NDF, or a 50:50 split of CP and NDF. High and low basal N levels of the grass were simulated, representing high and low N fertilization levels, with 50 g of CP/kg of DM difference between the N content of the grasses, roughly representing N fertilization levels of 300 and 450 kg of N/ha per year (e.g., see Valk et al., 2000). Dry matter intake was increased by 300 g/d with the high N fertilized grass, to represent the observed rela-tionship between N fertilization of grass and DMI (Valk et al., 2000). Simulations were done on 100% grass diets and an 89% grass diet (with the addition of 2 kg/d of concentrate). Simulated concentrate composition was as follows: 19.5% wheat, 15% soybean meal, 15% sugar
beet pulp, 13% palm kernel meal, 11% rapeseed meal, 9% maize gluten, 8% molasses, 7% sunflower meal, 1% vegetable oil, and 1% trace mineral mixture, on a DM basis. Chemical compositions of feed ingredients were derived from feed tables (Sauvant et al., 2004; CVB, 2007).
It was assumed that simulated cows had a BW of 596 kg, produced milk with 4.21% fat, 3.31% protein, and 4.53% lactose, and had a DMI in the range of 16.0 to 18.3 kg/d (see Table 2 for details). Values were based on the average of the literature database. Milk compo-sition values were held constant based on the observa-tion that in the literature data, milk composition did not differ significantly between high and low WSC diets (see Edwards et al., 2007 for a review). Degradation characteristics of the NDF and CP content of grasses, required for the model, were determined by simple re-gression analysis of the data of Valk et al. (1996), where
kpCP = [9.57 × (CP/NDF) + 3.9]/100 (R2 = 0.507), [4]
sCP = 0.0179 × (CP/NDF) + 0.158 (R2 = 0.002), [5]
uCP = −0.216 × (CP/NDF) + 0.236 (R2 = 0.694), [6]
kpNDF = (−0.0175 × NDF + 11.8)/100 (R2 = 0.334), [7]
Table 1. Summary of literature database
Variable Mean1 Minimum Maximum
Animal Milk yield2 (kg/d) 25.6 (±0.78) 13.5 33.6 BW (kg) 596 (±6.1) 546 652Diet DMI (kg/d) 18.2 (±0.34) 14.2 21.5 Roughage % diet 85 (±1.0) 75 92 CP (g/kg of DM) 180 (±6.9) 115 263 WSC (g/kg of DM) 179 (±8.9) 95 252 Starch (g/kg of DM) 38 (±4.1) 11 67 NDF (g/kg of DM) 478 (±9.9) 400 578 Lipid (g/kg of DM) 24 (±0.2) 23 26 Ash (g/kg of DM) 101 (±2.5) 63 120 WSC:CP ratio 1.1 (±0.08) 0.36 1.91Nitrogen N intake (g/d) 525 (±22.2) 279 817 Total N excretion (g/d) 380 (±18.9) 181 557 Fecal N (g/d) 132 (±4.1) 101 179 Milk N (g/d) 123 (±3.4) 68 147 Urine N (g/d) 248 (±16.9) 71 393 Milk N:intake N ratio 0.236 (±0.0082) 0.173 0.3101Mean ± standard error of the mean, from 28 data points from 4 sources: Moorby et al. (2006), Tas et al. (2005, 2006a), Miller et al. (2001a), and Valk (2002), and where diet variables represent the whole diet (grass + grain) and composition of grass and grain are adjusted so that CP, water-soluble carbohydrates (WSC), starch, NDF, lipid, and ash sum to 1,000 g/kg of DM by dividing the unknown fraction between WSC and NDF for grass and between starch and NDF for grain.2Corrected to 3.5% milk fat and 3.2% milk protein.
Journal of Dairy Science Vol. 94 No. 6, 2011
EFFECT OF HIGH-SUGAR GRASSES ON NITROGEN AND MILK PREDICTIONS 3109
uNDF = 0.000367 × NDF − 0.0162 (R2 = 0.453), [8]
where kpCP and kpNDF are the degradation rates (/h) of CP and NDF, respectively; sCP is the washout CP fraction; uCP is the undegradable CP fraction; and uNDF is the undegradable NDF fraction; CP and NDF are in grams per kilogram of DM.
RESULTS AND DISCUSSION
Model Evaluation
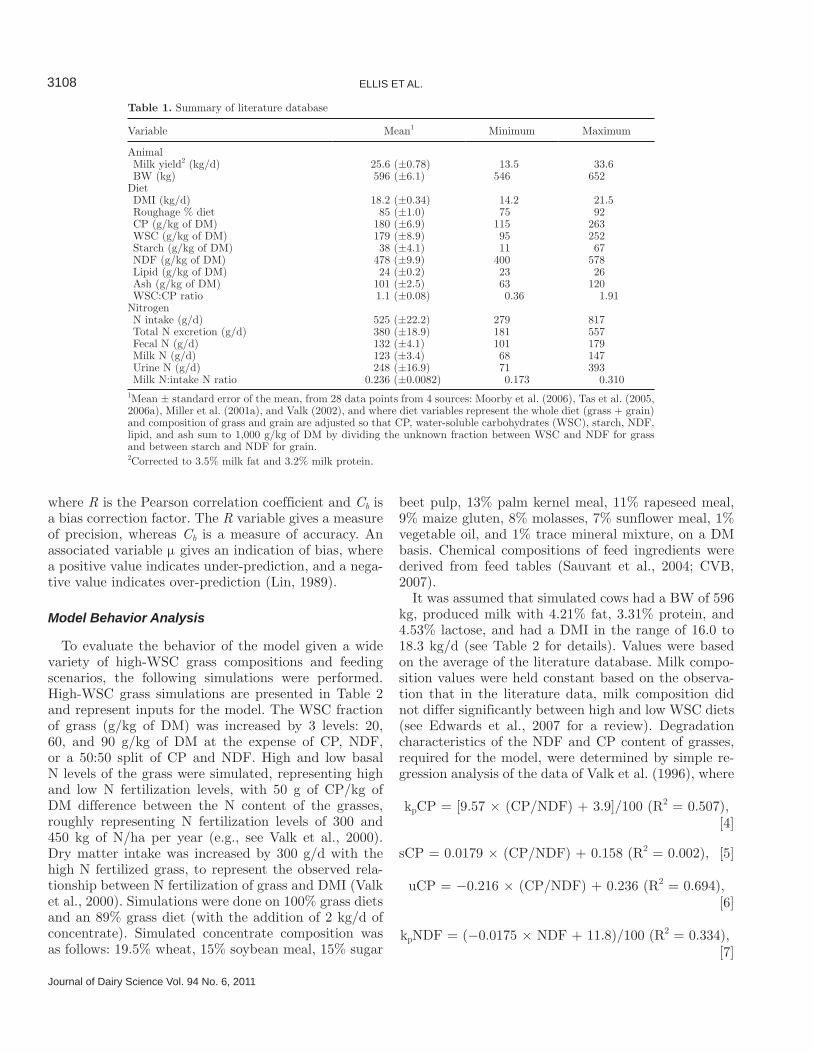
Nitrogen Excretion. Results of MSPE and CCC analysis of N predictions on the literature database are presented in Table 3, and plots of the predicted versus observed N outputs are presented in Figure 2. Results of MSPE and CCC analysis show that urine N, milk N, and total N excretion (g/d) were predicted adequately by the model (RMSPE = 19.9, 8.4, and 10.4%, respectively, and CCC = 0.866, 0.868, 0.926, respectively). Examination of the MSPE decomposition reveals that the error was divided between ECT, ER, and ED, but that the majority of error was due to ED. From CCC analysis and visual examination of Figure 2, fecal N prediction contained substantially more random variation. Although the RMSPE value was comparable
to that of urine N prediction, the CCC value was sub-stantially lower (CCC = 0.173).
The negative μ values in Table 3 for urine N, fecal N, and total N excretion indicate that the model has a tendency (herein tendency is used to describe a pattern or direction in the results, with no statistical implica-tion) to over-predict these values, and the positive μ value for milk N indicates a tendency of the model to slightly under-predict this value. These trends are con-firmed by examination of the observed and predicted means in Table 3. Overall, N excretion was predicted well by the model in terms of both the mean values and the slope within study.
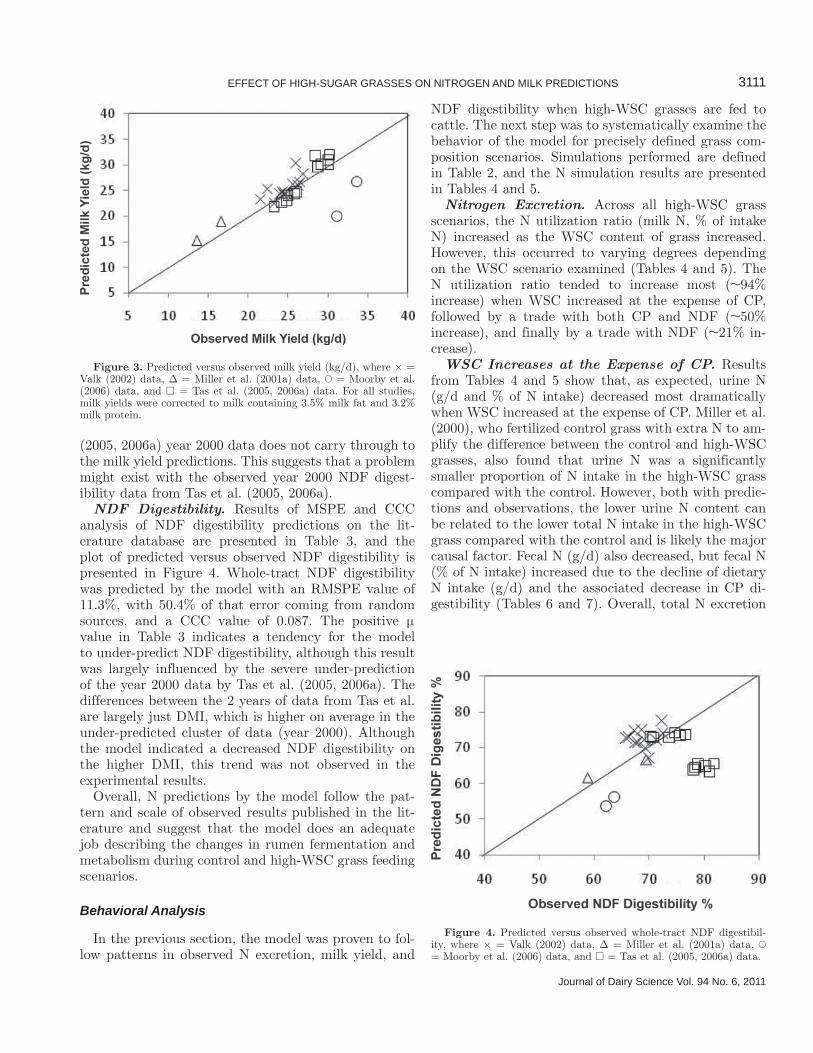
Milk Yield. Results of MSPE and CCC analysis of milk yield predictions on the literature database are presented in Table 3, and the plot of predicted versus observed milk yield is presented in Figure 3. Results show that the model predicted fat- and protein-cor-rected milk yield well, with an RMSPE value of 11.5% and a CCC value of 0.728. Predictions were generally good, except for a tendency for under-prediction on the Moorby et al. (2006) data. Under-prediction of milk yield in the Moorby et al. (2006) data can be partly at-tributed to the slight under-prediction of NDF digest-ibility for these data (Figure 4). However, the apparent under-prediction of NDF digestibility for the Tas et al.
Table 2. Summary of simulations
Simulation ID1 Description2
Grass WSC (g/kg of DM)
Grass CP (g/kg of DM)
Grass NDF (g/kg of DM) WSC:CP3
DMI (kg/d)4
1, 21 LN/B/0, /G 171 200 501 0.86, 0.81 16.0, 18.02, 22 LN/CP/20, /G 191 180 501 1.06, 0.98 16.0, 18.03, 23 LN/CP/60, /G 231 140 501 1.65, 1.45 16.0, 18.04, 24 LN/CP/90, /G 261 110 501 2.37, 1.99 16.0, 18.05, 25 LN/NDF/20, /G 191 200 481 0.96, 0.90 16.0, 18.06, 26 LN/NDF/60, /G 231 200 441 1.16, 1.07 16.0, 18.07, 27 LN/NDF/90, /G 261 200 411 1.31, 1.20 16.0, 18.08, 28 LN/CN/20, /G 191 190 491 1.01, 0.94 16.0, 18.09, 29 LN/CN/60, /G 231 170 471 1.36, 1.23 16.0, 18.010, 30 LN/CN/90, /G 261 155 456 1.68, 1.50 16.0, 18.011, 31 HN/B/0, /G 121 250 501 0.48, 0.48 16.3, 18.312, 32 HN/CP/20, /G 141 230 501 0.61, 0.60 16.3, 18.313, 33 HN/CP/60, /G 181 190 501 0.95, 0.89 16.3, 18.314, 34 HN/CP/90, /G 211 160 501 1.32, 1.20 16.3, 18.315, 35 HN/NDF/20, /G 141 250 481 0.56, 0.55 16.3, 18.316, 36 HN/NDF/60, /G 181 250 441 0.72, 0.70 16.3, 18.317, 37 HN/NDF/90, /G 211 250 411 0.84, 0.81 16.3, 18.318, 38 HN/CN/20, /G 141 240 491 0.59, 0.58 16.3, 18.319, 39 HN/CN/60, /G 181 220 471 0.82, 0.78 16.3, 18.320, 40 HN/CN/90, /G 211 205 456 1.03, 0.96 16.3, 18.31Simulations 1–20 are 100% grass diets with DMI of 16.0 or 16.3 kg of DM/d; simulations 21–40 are using the same grass as diets 1–20 but have an additional 2 kg of DM of concentrate fed per day. The concentrate composition, g/kg of DM, was 195 wheat, 150 soybean meal, 150 sugar beet pulp, 130 palm kernel meal, 110 rapeseed meal, 90 maize gluten, 80 molasses, 70 sunflower meal, 10 vegetable oil, and 10 trace mineral mixture; CP = 225, NDF = 336, fat = 41, water-soluble carbohydrate (WSC) = 107, starch = 222 and ash = 69.2Simulations 1–10 and 21–30 represent low N fertilized grass (LN), and simulations 11–20 and 31–40 represent high N fertilized grass (HN); B = basal WSC levels, and WSC increases at the expense of CP, NDF, or a 50:50 split of CP and NDF (CN); 20, 60, and 90 represent the level (g/kg of DM) of trade with WSC as WSC of the grass increases; grain (G) is fed in simulations 21–40.3WSC:CP ratio of the whole diet; corresponds to simulation ID information in footnotes 1 and 2.4Corresponds to simulation ID information in footnotes 1 and 2.
3110 ELLIS ET AL.
Journal of Dairy Science Vol. 94 No. 6, 2011
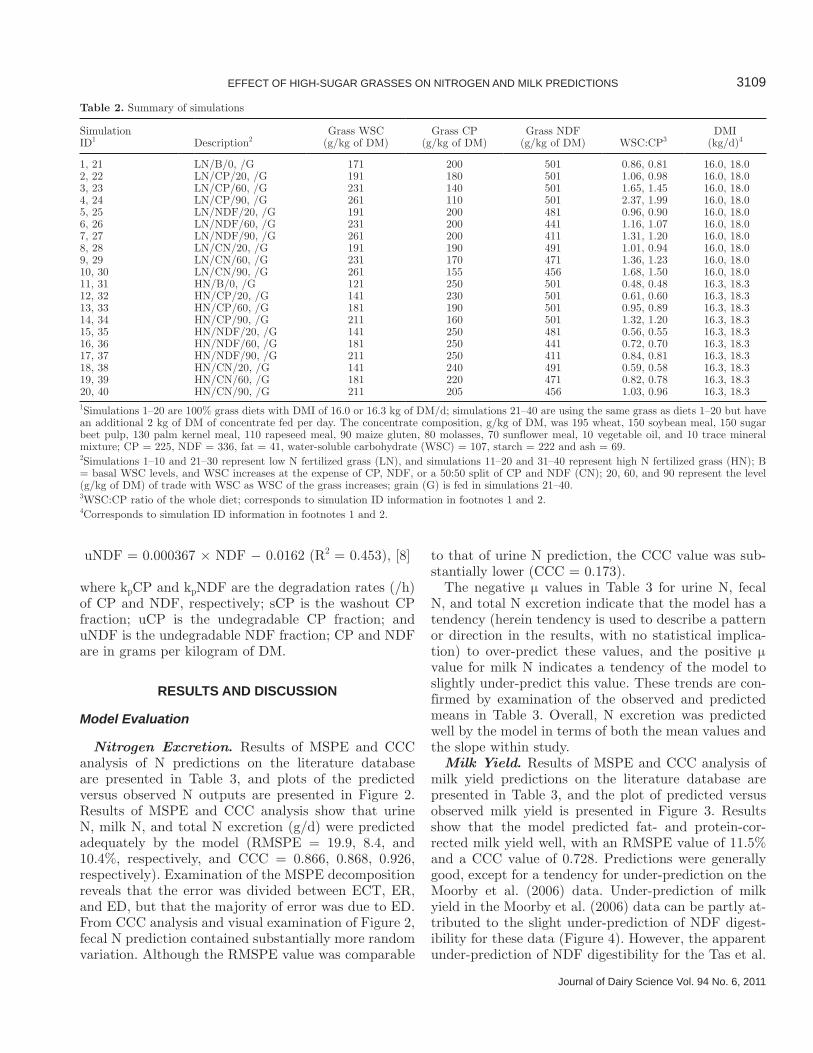
Table 3. Mean square prediction error and concordance correlation coefficient analysis results for N excretion, milk yield, and NDF digestibility, as predicted by the modified Dijkstra model
VariableObserved
meanPredicted
mean
Parameter1
RMSPE (%)
ECT (%)
ER (%)
ED (%) CCC R Cb μ
Urine N (g/d) 248 (±16.9) 261 (±19.4) 19.9 7.2 22.7 70.1 0.866 0.882 0.981 −0.140Fecal N (g/d) 132 (±4.1) 143 (±3.2) 20.2 18.5 21.1 60.4 0.173 0.210 0.823 −0.610Milk N (g/d) 123 (±3.4) 121 (±4.3) 8.4 2.6 38.4 59.0 0.868 0.893 0.971 0.084Total N excretion (g/d) 380 (±18.9) 404 (±20.1) 10.4 38.9 7.34 53.7 0.926 0.955 0.969 −0.244Milk yield2 (kg/d) 25.6 (±0.77) 25.5 (±0.76) 11.5 0.1 11.0 88.9 0.728 0.729 0.999 0.028NDF digestibility (%) 71.5 (±1.1) 69.2 (±1.1) 11.3 7.6 42.0 50.4 0.087 0.094 0.931 0.3861RMSPE = root mean square prediction error expressed as a percentage of the observed mean; ECT = error due to bias (% of total MSPE); ER = error due to regression (% of total MSPE); ED = error due to disturbance (% of total MSPE); CCC = concordance correlation coefficient, where CCC = R × Cb, and R = Pearson correlation coefficient and Cb = bias correction factor; and μ = location shift.2Corrected to 3.5% milk fat and 3.2% milk protein.
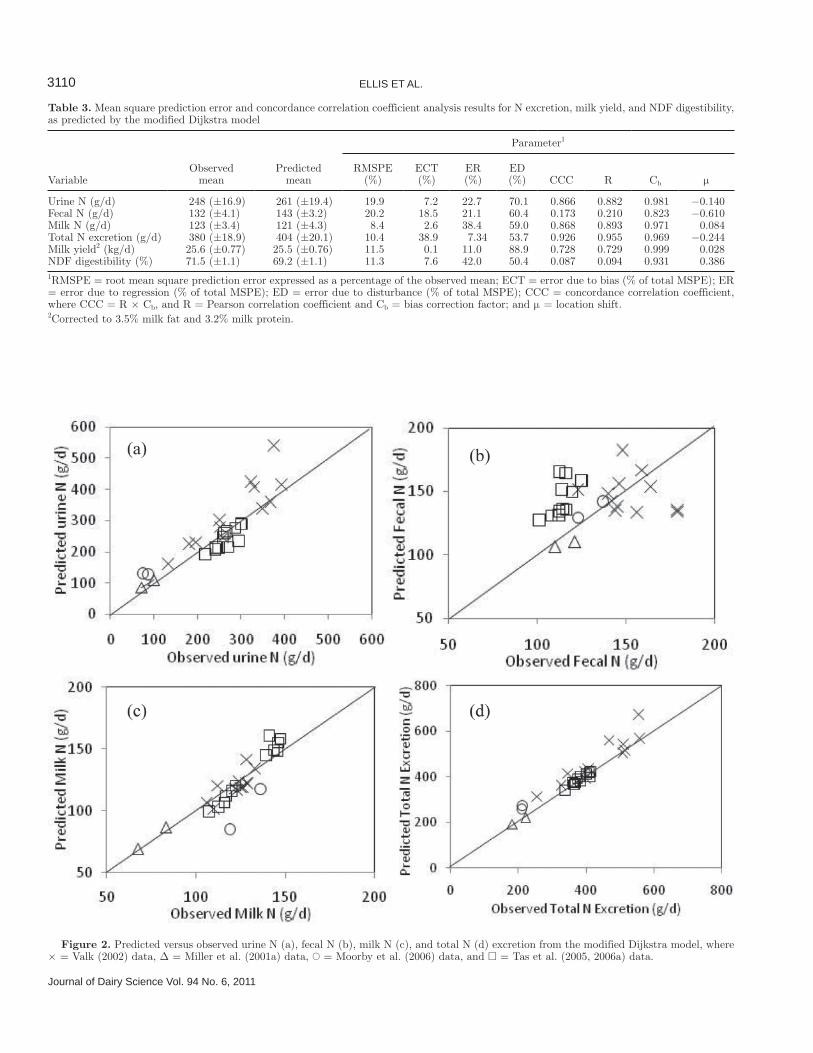
Figure 2. Predicted versus observed urine N (a), fecal N (b), milk N (c), and total N (d) excretion from the modified Dijkstra model, where × = Valk (2002) data, Δ = Miller et al. (2001a) data, � = Moorby et al. (2006) data, and □ = Tas et al. (2005, 2006a) data.
Journal of Dairy Science Vol. 94 No. 6, 2011
EFFECT OF HIGH-SUGAR GRASSES ON NITROGEN AND MILK PREDICTIONS 3111
(2005, 2006a) year 2000 data does not carry through to the milk yield predictions. This suggests that a problem might exist with the observed year 2000 NDF digest-ibility data from Tas et al. (2005, 2006a).
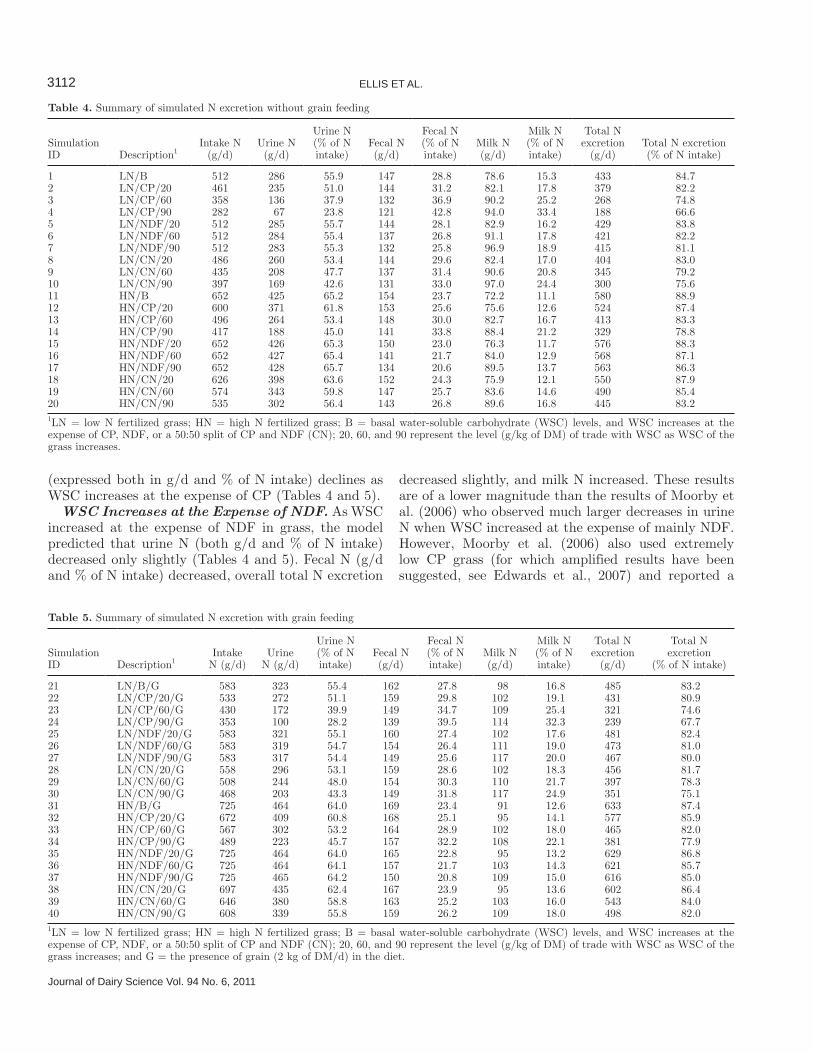
NDF Digestibility. Results of MSPE and CCC analysis of NDF digestibility predictions on the lit-erature database are presented in Table 3, and the plot of predicted versus observed NDF digestibility is presented in Figure 4. Whole-tract NDF digestibility was predicted by the model with an RMSPE value of 11.3%, with 50.4% of that error coming from random sources, and a CCC value of 0.087. The positive μ value in Table 3 indicates a tendency for the model to under-predict NDF digestibility, although this result was largely influenced by the severe under-prediction of the year 2000 data by Tas et al. (2005, 2006a). The differences between the 2 years of data from Tas et al. are largely just DMI, which is higher on average in the under-predicted cluster of data (year 2000). Although the model indicated a decreased NDF digestibility on the higher DMI, this trend was not observed in the experimental results.
Overall, N predictions by the model follow the pat-tern and scale of observed results published in the lit-erature and suggest that the model does an adequate job describing the changes in rumen fermentation and metabolism during control and high-WSC grass feeding scenarios.
Behavioral Analysis
In the previous section, the model was proven to fol-low patterns in observed N excretion, milk yield, and
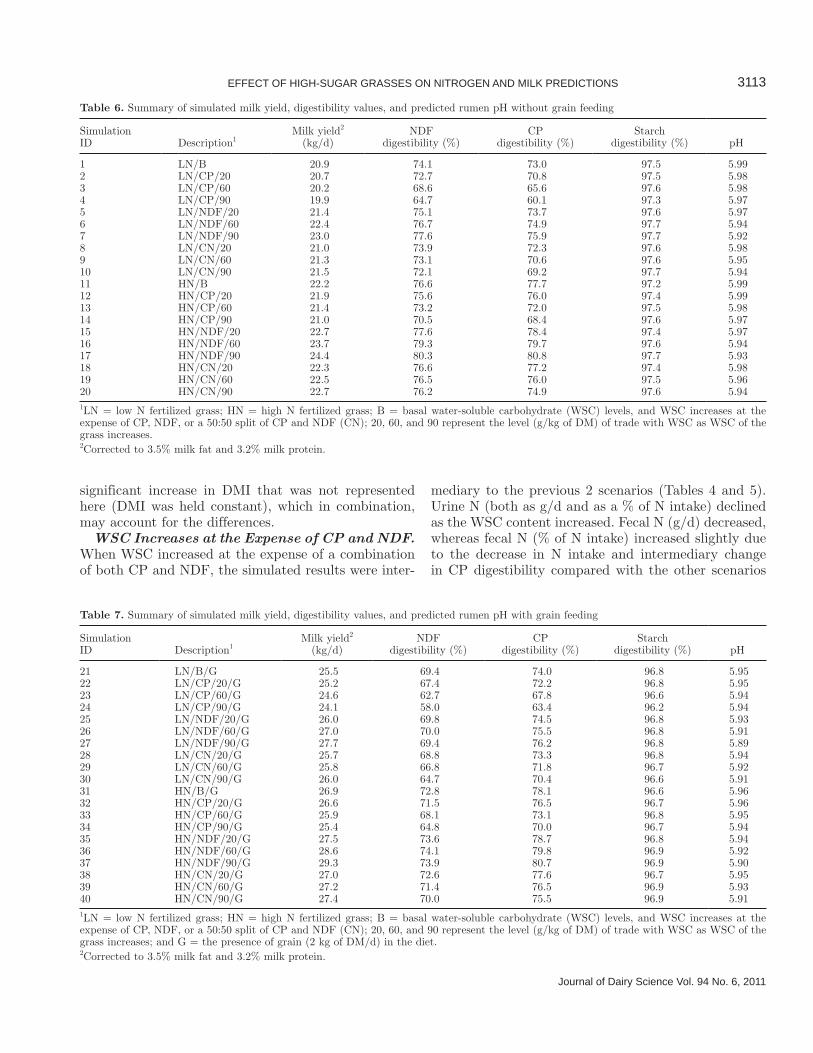
NDF digestibility when high-WSC grasses are fed to cattle. The next step was to systematically examine the behavior of the model for precisely defined grass com-position scenarios. Simulations performed are defined in Table 2, and the N simulation results are presented in Tables 4 and 5.
Nitrogen Excretion. Across all high-WSC grass scenarios, the N utilization ratio (milk N, % of intake N) increased as the WSC content of grass increased. However, this occurred to varying degrees depending on the WSC scenario examined (Tables 4 and 5). The N utilization ratio tended to increase most (~94% increase) when WSC increased at the expense of CP, followed by a trade with both CP and NDF (~50% increase), and finally by a trade with NDF (~21% in-crease).
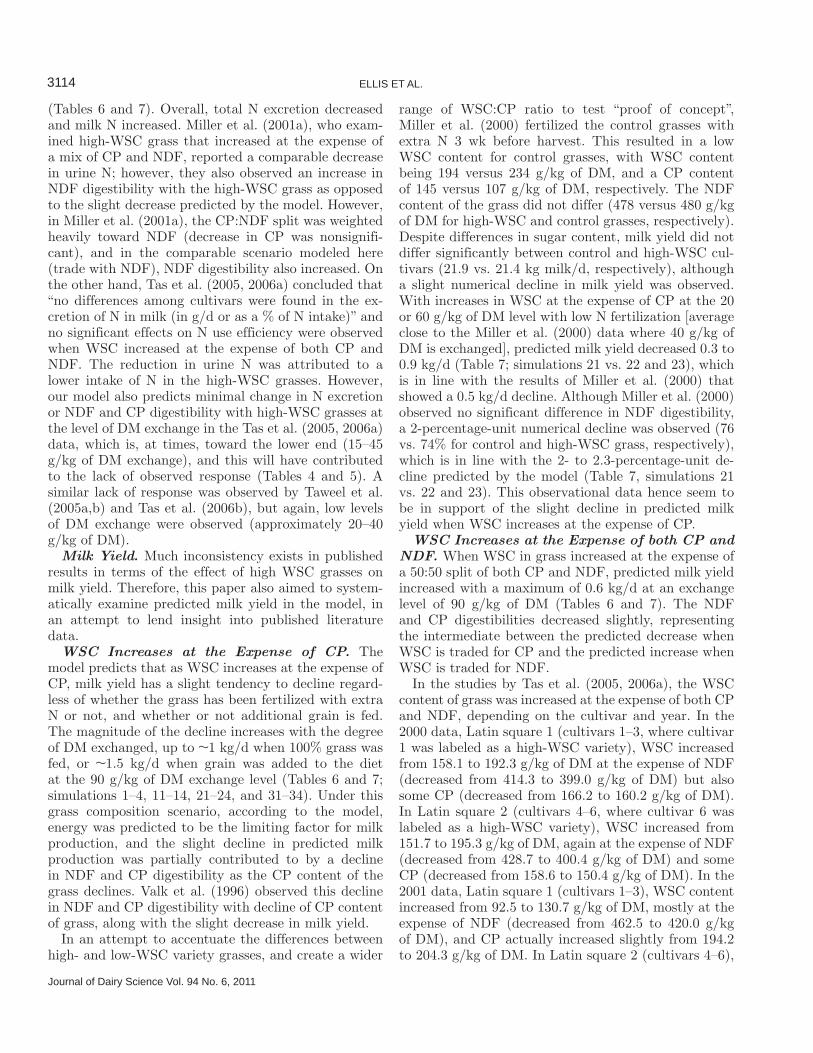
WSC Increases at the Expense of CP. Results from Tables 4 and 5 show that, as expected, urine N (g/d and % of N intake) decreased most dramatically when WSC increased at the expense of CP. Miller et al. (2000), who fertilized control grass with extra N to am-plify the difference between the control and high-WSC grasses, also found that urine N was a significantly smaller proportion of N intake in the high-WSC grass compared with the control. However, both with predic-tions and observations, the lower urine N content can be related to the lower total N intake in the high-WSC grass compared with the control and is likely the major causal factor. Fecal N (g/d) also decreased, but fecal N (% of N intake) increased due to the decline of dietary N intake (g/d) and the associated decrease in CP di-gestibility (Tables 6 and 7). Overall, total N excretion
Figure 3. Predicted versus observed milk yield (kg/d), where × = Valk (2002) data, Δ = Miller et al. (2001a) data, � = Moorby et al. (2006) data, and □ = Tas et al. (2005, 2006a) data. For all studies, milk yields were corrected to milk containing 3.5% milk fat and 3.2% milk protein.
Figure 4. Predicted versus observed whole-tract NDF digestibil-ity, where × = Valk (2002) data, Δ = Miller et al. (2001a) data, � = Moorby et al. (2006) data, and □ = Tas et al. (2005, 2006a) data.
3112 ELLIS ET AL.
Journal of Dairy Science Vol. 94 No. 6, 2011
(expressed both in g/d and % of N intake) declines as WSC increases at the expense of CP (Tables 4 and 5).
WSC Increases at the Expense of NDF. As WSC increased at the expense of NDF in grass, the model predicted that urine N (both g/d and % of N intake) decreased only slightly (Tables 4 and 5). Fecal N (g/d and % of N intake) decreased, overall total N excretion
decreased slightly, and milk N increased. These results are of a lower magnitude than the results of Moorby et al. (2006) who observed much larger decreases in urine N when WSC increased at the expense of mainly NDF. However, Moorby et al. (2006) also used extremely low CP grass (for which amplified results have been suggested, see Edwards et al., 2007) and reported a
Table 4. Summary of simulated N excretion without grain feeding
Simulation ID Description1
Intake N (g/d)
Urine N (g/d)
Urine N (% of N intake)
Fecal N (g/d)
Fecal N (% of N intake)
Milk N (g/d)
Milk N (% of N intake)
Total N excretion
(g/d)Total N excretion (% of N intake)
1 LN/B 512 286 55.9 147 28.8 78.6 15.3 433 84.72 LN/CP/20 461 235 51.0 144 31.2 82.1 17.8 379 82.23 LN/CP/60 358 136 37.9 132 36.9 90.2 25.2 268 74.84 LN/CP/90 282 67 23.8 121 42.8 94.0 33.4 188 66.65 LN/NDF/20 512 285 55.7 144 28.1 82.9 16.2 429 83.86 LN/NDF/60 512 284 55.4 137 26.8 91.1 17.8 421 82.27 LN/NDF/90 512 283 55.3 132 25.8 96.9 18.9 415 81.18 LN/CN/20 486 260 53.4 144 29.6 82.4 17.0 404 83.09 LN/CN/60 435 208 47.7 137 31.4 90.6 20.8 345 79.210 LN/CN/90 397 169 42.6 131 33.0 97.0 24.4 300 75.611 HN/B 652 425 65.2 154 23.7 72.2 11.1 580 88.912 HN/CP/20 600 371 61.8 153 25.6 75.6 12.6 524 87.413 HN/CP/60 496 264 53.4 148 30.0 82.7 16.7 413 83.314 HN/CP/90 417 188 45.0 141 33.8 88.4 21.2 329 78.815 HN/NDF/20 652 426 65.3 150 23.0 76.3 11.7 576 88.316 HN/NDF/60 652 427 65.4 141 21.7 84.0 12.9 568 87.117 HN/NDF/90 652 428 65.7 134 20.6 89.5 13.7 563 86.318 HN/CN/20 626 398 63.6 152 24.3 75.9 12.1 550 87.919 HN/CN/60 574 343 59.8 147 25.7 83.6 14.6 490 85.420 HN/CN/90 535 302 56.4 143 26.8 89.6 16.8 445 83.21LN = low N fertilized grass; HN = high N fertilized grass; B = basal water-soluble carbohydrate (WSC) levels, and WSC increases at the expense of CP, NDF, or a 50:50 split of CP and NDF (CN); 20, 60, and 90 represent the level (g/kg of DM) of trade with WSC as WSC of the grass increases.
Table 5. Summary of simulated N excretion with grain feeding
Simulation ID Description1
Intake N (g/d)
Urine N (g/d)
Urine N (% of N intake)
Fecal N (g/d)
Fecal N (% of N intake)
Milk N (g/d)
Milk N (% of N intake)
Total N excretion
(g/d)
Total N excretion
(% of N intake)
21 LN/B/G 583 323 55.4 162 27.8 98 16.8 485 83.222 LN/CP/20/G 533 272 51.1 159 29.8 102 19.1 431 80.923 LN/CP/60/G 430 172 39.9 149 34.7 109 25.4 321 74.624 LN/CP/90/G 353 100 28.2 139 39.5 114 32.3 239 67.725 LN/NDF/20/G 583 321 55.1 160 27.4 102 17.6 481 82.426 LN/NDF/60/G 583 319 54.7 154 26.4 111 19.0 473 81.027 LN/NDF/90/G 583 317 54.4 149 25.6 117 20.0 467 80.028 LN/CN/20/G 558 296 53.1 159 28.6 102 18.3 456 81.729 LN/CN/60/G 508 244 48.0 154 30.3 110 21.7 397 78.330 LN/CN/90/G 468 203 43.3 149 31.8 117 24.9 351 75.131 HN/B/G 725 464 64.0 169 23.4 91 12.6 633 87.432 HN/CP/20/G 672 409 60.8 168 25.1 95 14.1 577 85.933 HN/CP/60/G 567 302 53.2 164 28.9 102 18.0 465 82.034 HN/CP/90/G 489 223 45.7 157 32.2 108 22.1 381 77.935 HN/NDF/20/G 725 464 64.0 165 22.8 95 13.2 629 86.836 HN/NDF/60/G 725 464 64.1 157 21.7 103 14.3 621 85.737 HN/NDF/90/G 725 465 64.2 150 20.8 109 15.0 616 85.038 HN/CN/20/G 697 435 62.4 167 23.9 95 13.6 602 86.439 HN/CN/60/G 646 380 58.8 163 25.2 103 16.0 543 84.040 HN/CN/90/G 608 339 55.8 159 26.2 109 18.0 498 82.01LN = low N fertilized grass; HN = high N fertilized grass; B = basal water-soluble carbohydrate (WSC) levels, and WSC increases at the expense of CP, NDF, or a 50:50 split of CP and NDF (CN); 20, 60, and 90 represent the level (g/kg of DM) of trade with WSC as WSC of the grass increases; and G = the presence of grain (2 kg of DM/d) in the diet.
Journal of Dairy Science Vol. 94 No. 6, 2011
EFFECT OF HIGH-SUGAR GRASSES ON NITROGEN AND MILK PREDICTIONS 3113
significant increase in DMI that was not represented here (DMI was held constant), which in combination, may account for the differences.
WSC Increases at the Expense of CP and NDF. When WSC increased at the expense of a combination of both CP and NDF, the simulated results were inter-
mediary to the previous 2 scenarios (Tables 4 and 5). Urine N (both as g/d and as a % of N intake) declined as the WSC content increased. Fecal N (g/d) decreased, whereas fecal N (% of N intake) increased slightly due to the decrease in N intake and intermediary change in CP digestibility compared with the other scenarios
Table 6. Summary of simulated milk yield, digestibility values, and predicted rumen pH without grain feeding
Simulation ID Description1
Milk yield2 (kg/d)
NDF digestibility (%)
CP digestibility (%)
Starch digestibility (%) pH
1 LN/B 20.9 74.1 73.0 97.5 5.992 LN/CP/20 20.7 72.7 70.8 97.5 5.983 LN/CP/60 20.2 68.6 65.6 97.6 5.984 LN/CP/90 19.9 64.7 60.1 97.3 5.975 LN/NDF/20 21.4 75.1 73.7 97.6 5.976 LN/NDF/60 22.4 76.7 74.9 97.7 5.947 LN/NDF/90 23.0 77.6 75.9 97.7 5.928 LN/CN/20 21.0 73.9 72.3 97.6 5.989 LN/CN/60 21.3 73.1 70.6 97.6 5.9510 LN/CN/90 21.5 72.1 69.2 97.7 5.9411 HN/B 22.2 76.6 77.7 97.2 5.9912 HN/CP/20 21.9 75.6 76.0 97.4 5.9913 HN/CP/60 21.4 73.2 72.0 97.5 5.9814 HN/CP/90 21.0 70.5 68.4 97.6 5.9715 HN/NDF/20 22.7 77.6 78.4 97.4 5.9716 HN/NDF/60 23.7 79.3 79.7 97.6 5.9417 HN/NDF/90 24.4 80.3 80.8 97.7 5.9318 HN/CN/20 22.3 76.6 77.2 97.4 5.9819 HN/CN/60 22.5 76.5 76.0 97.5 5.9620 HN/CN/90 22.7 76.2 74.9 97.6 5.941LN = low N fertilized grass; HN = high N fertilized grass; B = basal water-soluble carbohydrate (WSC) levels, and WSC increases at the expense of CP, NDF, or a 50:50 split of CP and NDF (CN); 20, 60, and 90 represent the level (g/kg of DM) of trade with WSC as WSC of the grass increases.2Corrected to 3.5% milk fat and 3.2% milk protein.
Table 7. Summary of simulated milk yield, digestibility values, and predicted rumen pH with grain feeding
Simulation ID Description1
Milk yield2 (kg/d)
NDF digestibility (%)
CP digestibility (%)
Starch digestibility (%) pH
21 LN/B/G 25.5 69.4 74.0 96.8 5.9522 LN/CP/20/G 25.2 67.4 72.2 96.8 5.9523 LN/CP/60/G 24.6 62.7 67.8 96.6 5.9424 LN/CP/90/G 24.1 58.0 63.4 96.2 5.9425 LN/NDF/20/G 26.0 69.8 74.5 96.8 5.9326 LN/NDF/60/G 27.0 70.0 75.5 96.8 5.9127 LN/NDF/90/G 27.7 69.4 76.2 96.8 5.8928 LN/CN/20/G 25.7 68.8 73.3 96.8 5.9429 LN/CN/60/G 25.8 66.8 71.8 96.7 5.9230 LN/CN/90/G 26.0 64.7 70.4 96.6 5.9131 HN/B/G 26.9 72.8 78.1 96.6 5.9632 HN/CP/20/G 26.6 71.5 76.5 96.7 5.9633 HN/CP/60/G 25.9 68.1 73.1 96.8 5.9534 HN/CP/90/G 25.4 64.8 70.0 96.7 5.9435 HN/NDF/20/G 27.5 73.6 78.7 96.8 5.9436 HN/NDF/60/G 28.6 74.1 79.8 96.9 5.9237 HN/NDF/90/G 29.3 73.9 80.7 96.9 5.9038 HN/CN/20/G 27.0 72.6 77.6 96.7 5.9539 HN/CN/60/G 27.2 71.4 76.5 96.9 5.9340 HN/CN/90/G 27.4 70.0 75.5 96.9 5.911LN = low N fertilized grass; HN = high N fertilized grass; B = basal water-soluble carbohydrate (WSC) levels, and WSC increases at the expense of CP, NDF, or a 50:50 split of CP and NDF (CN); 20, 60, and 90 represent the level (g/kg of DM) of trade with WSC as WSC of the grass increases; and G = the presence of grain (2 kg of DM/d) in the diet.2Corrected to 3.5% milk fat and 3.2% milk protein.
3114 ELLIS ET AL.
Journal of Dairy Science Vol. 94 No. 6, 2011
(Tables 6 and 7). Overall, total N excretion decreased and milk N increased. Miller et al. (2001a), who exam-ined high-WSC grass that increased at the expense of a mix of CP and NDF, reported a comparable decrease in urine N; however, they also observed an increase in NDF digestibility with the high-WSC grass as opposed to the slight decrease predicted by the model. However, in Miller et al. (2001a), the CP:NDF split was weighted heavily toward NDF (decrease in CP was nonsignifi-cant), and in the comparable scenario modeled here (trade with NDF), NDF digestibility also increased. On the other hand, Tas et al. (2005, 2006a) concluded that “no differences among cultivars were found in the ex-cretion of N in milk (in g/d or as a % of N intake)” and no significant effects on N use efficiency were observed when WSC increased at the expense of both CP and NDF. The reduction in urine N was attributed to a lower intake of N in the high-WSC grasses. However, our model also predicts minimal change in N excretion or NDF and CP digestibility with high-WSC grasses at the level of DM exchange in the Tas et al. (2005, 2006a) data, which is, at times, toward the lower end (15–45 g/kg of DM exchange), and this will have contributed to the lack of observed response (Tables 4 and 5). A similar lack of response was observed by Taweel et al. (2005a,b) and Tas et al. (2006b), but again, low levels of DM exchange were observed (approximately 20–40 g/kg of DM).
Milk Yield. Much inconsistency exists in published results in terms of the effect of high WSC grasses on milk yield. Therefore, this paper also aimed to system-atically examine predicted milk yield in the model, in an attempt to lend insight into published literature data.
WSC Increases at the Expense of CP. The model predicts that as WSC increases at the expense of CP, milk yield has a slight tendency to decline regard-less of whether the grass has been fertilized with extra N or not, and whether or not additional grain is fed. The magnitude of the decline increases with the degree of DM exchanged, up to ~1 kg/d when 100% grass was fed, or ~1.5 kg/d when grain was added to the diet at the 90 g/kg of DM exchange level (Tables 6 and 7; simulations 1–4, 11–14, 21–24, and 31–34). Under this grass composition scenario, according to the model, energy was predicted to be the limiting factor for milk production, and the slight decline in predicted milk production was partially contributed to by a decline in NDF and CP digestibility as the CP content of the grass declines. Valk et al. (1996) observed this decline in NDF and CP digestibility with decline of CP content of grass, along with the slight decrease in milk yield.
In an attempt to accentuate the differences between high- and low-WSC variety grasses, and create a wider
range of WSC:CP ratio to test “proof of concept”, Miller et al. (2000) fertilized the control grasses with extra N 3 wk before harvest. This resulted in a low WSC content for control grasses, with WSC content being 194 versus 234 g/kg of DM, and a CP content of 145 versus 107 g/kg of DM, respectively. The NDF content of the grass did not differ (478 versus 480 g/kg of DM for high-WSC and control grasses, respectively). Despite differences in sugar content, milk yield did not differ significantly between control and high-WSC cul-tivars (21.9 vs. 21.4 kg milk/d, respectively), although a slight numerical decline in milk yield was observed. With increases in WSC at the expense of CP at the 20 or 60 g/kg of DM level with low N fertilization [average close to the Miller et al. (2000) data where 40 g/kg of DM is exchanged], predicted milk yield decreased 0.3 to 0.9 kg/d (Table 7; simulations 21 vs. 22 and 23), which is in line with the results of Miller et al. (2000) that showed a 0.5 kg/d decline. Although Miller et al. (2000) observed no significant difference in NDF digestibility, a 2-percentage-unit numerical decline was observed (76 vs. 74% for control and high-WSC grass, respectively), which is in line with the 2- to 2.3-percentage-unit de-cline predicted by the model (Table 7, simulations 21 vs. 22 and 23). This observational data hence seem to be in support of the slight decline in predicted milk yield when WSC increases at the expense of CP.
WSC Increases at the Expense of both CP and NDF. When WSC in grass increased at the expense of a 50:50 split of both CP and NDF, predicted milk yield increased with a maximum of 0.6 kg/d at an exchange level of 90 g/kg of DM (Tables 6 and 7). The NDF and CP digestibilities decreased slightly, representing the intermediate between the predicted decrease when WSC is traded for CP and the predicted increase when WSC is traded for NDF.
In the studies by Tas et al. (2005, 2006a), the WSC content of grass was increased at the expense of both CP and NDF, depending on the cultivar and year. In the 2000 data, Latin square 1 (cultivars 1–3, where cultivar 1 was labeled as a high-WSC variety), WSC increased from 158.1 to 192.3 g/kg of DM at the expense of NDF (decreased from 414.3 to 399.0 g/kg of DM) but also some CP (decreased from 166.2 to 160.2 g/kg of DM). In Latin square 2 (cultivars 4–6, where cultivar 6 was labeled as a high-WSC variety), WSC increased from 151.7 to 195.3 g/kg of DM, again at the expense of NDF (decreased from 428.7 to 400.4 g/kg of DM) and some CP (decreased from 158.6 to 150.4 g/kg of DM). In the 2001 data, Latin square 1 (cultivars 1–3), WSC content increased from 92.5 to 130.7 g/kg of DM, mostly at the expense of NDF (decreased from 462.5 to 420.0 g/kg of DM), and CP actually increased slightly from 194.2 to 204.3 g/kg of DM. In Latin square 2 (cultivars 4–6),
Journal of Dairy Science Vol. 94 No. 6, 2011
EFFECT OF HIGH-SUGAR GRASSES ON NITROGEN AND MILK PREDICTIONS 3115
WSC increased from 98.4 to 112.8 g/kg of DM at the expense of CP (decreased from 203.0 to 190.0 g/kg of DM), and NDF actually increased from 437.4 to 456.8 g/kg of DM. Across cultivar and year, DMI and milk yield were largely not affected by increasing the WSC content of grass in the Tas et al. (2005, 2006a) data. Similarly, DM, OM, NDF, and CP digestibility did not differ in the Tas data, although they did increase in cul-tivars 1 to 3 in 2001 with the increase in WSC content, which is contradictory to the model results but could be due to the fact that CP actually increased as WSC increased in these specific cultivars.
The 2000 Tas data (Tas et al., 2005, 2006a), in which both NDF and CP are decreasing as WSC increases, most closely match simulations 28 and 29 (Table 7), in which WSC increases at the expense of a 50:50 split of NDF and CP between the range of 20 to 60 g/kg of DM exchange. In these simulations, milk yield largely stayed the same (increases 0.2–0.3 kg/d) and NDF digestibility decreased slightly (0.6–2.4%), as did CP digestibility (0.7–2.2%).
Miller et al. (2001a) observed a significant 2.7 kg/d increase in milk (and no significant effect on milk com-position) when the WSC content of grass was increased from 126 to 165 g/kg of DM (39 g/kg of DM) at the expense of a small decline in CP (14 g/kg of DM; not significantly different in N intake) relative to a larger decline in NDF (45 g/kg of DM). In this study total DMI did not differ significantly between high WSC and control grass cultivars, similar to the simulations results in the present study, but DM digestibility was signifi-cantly higher in the high WSC cultivar (71 vs. 64%), and Miller et al. (2001a) concluded that the higher milk yield arose from an increased DM digestibility. Model predictions indicated an increased milk yield of 0.5 to 1.5 kg/d for WSC increasing at the expense of NDF at the 20 and 60 g/kg of DM exchange level (simula-tions 25 and 26). The extreme increase in digestibility observed was not reproduced by the model. The much larger increase in observed DM digestibility accounts for the proportionally higher increase in observed milk yield compared with the more conservative model pre-dictions. The background for such a large increase in DM digestibility is not clear but could be attributed to a specific cultivar effect. It has not been observed in other studies.
WSC Increases at the Expense of NDF. With an increase of WSC at the expense of NDF, predicted milk yield increased up to 2.4 kg/d, and NDF and CP digestibility increased marginally (Tables 6 and 7).
Moorby et al. (2006) achieved an elevated WSC con-tent grass by cutting the control grass in the morning and the high-WSC grass in the afternoon, resulting in WSC contents of 161 and 243 g/kg of DM (82 g/
kg of DM difference), respectively. The WSC content increased largely at the expense of NDF (83 g/kg of DM decline) accompanied by an increase of CP content (104 vs. 99 g/kg of DM). Milk yield was not significant-ly affected by dietary treatment despite higher DMI and DM digestibility. However, milk yield did increase numerically from 30.4 to 32.7 kg/d for the control and high-WSC grasses, respectively, which is consistent with the simulation results in Tables 6 and 7.
Evaluation of the apparently inconsistent effects of high-WSC grasses on milk yield in the literature, taken in context of the simulations performed here, shows that the relationship is sensitive to DM (g/kg of DM) composition of the plant, whether WSC is increasing at the expense of CP (e.g., such as would be achieved by altering N fertilization levels), NDF (e.g., due to specific cultivar breeding), or a combination of the 2 (e.g., due to a dilution effect, see Rasmussen et al., 2009). Simulation results suggest that only when WSC increases at the expense of NDF are large increases in milk yield seen, whereas smaller increases will be seen when both NDF and CP decrease at the expense of an increase in WSC, and that milk yield may decrease slightly when CP decreases as WSC increases.
Level of DM Exchange. It is evident from the results simulated here, as well as from data reported in the literature, that the level of DM exchanged between WSC, CP, and NDF are of vital importance to the magnitude of the results obtained. In the simulations and in the literature, marginal effects are obtained for an increase of WSC at a level of approximately 20 g/kg of DM or less, whereas larger effects are seen at higher exchange levels. The present study may be used as a rough guide for the level of response to be expected for increases in WSC content in grass, and for targeting plant WSC levels and compositions.
High Versus Low Basal N Content of Grass. The proposed mode of action for high-WSC grasses is that the increased supply of energy should enhance the capture of N in the rumen, thereby increasing the sup-ply of protein to the ruminant. The most promising results in terms of milk yield were observed by Miller et al. (2001a), who also had substantially lower DM digestibility values compared with some of the other studies mentioned (e.g., Tas et al., 2005, 2006a). Ed-wards et al. (2007) suggested that greater responses in animal performance might be expected in systems where the ruminant is protein limited, rather than in those where the ruminant is energy limited. Protein could be limited due to low digestibility values or low N content in grass. Because of this, 2 scenarios were considered in this study, representing high (simulations 11–20 and 31–40) and low (simulations 1–10 and 21–30) N fertilization levels of simulated grasses. Results
3116 ELLIS ET AL.
Journal of Dairy Science Vol. 94 No. 6, 2011
are compared for the no-grain (simulations 1–10 and 21–30) scenarios as they represent the lowest CP diets.
In terms of milk yield, across all simulations, the average increase in milk yield for the low N grasses was 1.7% (0.35 kg/d) compared with the basal diet. The average increase for the high N grasses was 1.5% (0.34 kg/d) compared with the basal diet. These values are low because they are averages of scenarios where pre-dicted milk yield increased as well as scenarios where it decreased. Therefore, a very slight advantage is seen in the low N data in terms of milk yield, which would probably not be significantly different with observa-tional data.
In terms of N excretion, average urine N (% of N intake) decreased by 15.9% for the low N simulations as a result of WSC increase, and by 8.6% for the high N simulations. Similarly, the N utilization ratio increased by 38.7% for the low N simulations and by 32.6% for the high N simulations, and total N excretion (% of N intake) decreased by 19.3% for the low N simulations compared with 14.6% for the high N simulations. These results seem to confirm the statement of Edwards et al. (2007) that a greater effect will be seen in terms of N excretion when N intake or diet digestibility is low.
Grain Feeding. As some studies in the literature feed supplemental grain and others do not, simulations were performed here with and without 2 kg/d of grain feeding (Tables 4 and 6 vs. Tables 5 and 7). Similar to altering the N fertilization level of grass, adding grain to the diet in the simulations increased N and energy intake. Averaged across the grain-fed and across the no-grain-fed simulations, milk yield increased 1.59% without grain feeding compared with 1.09% with grain feeding with increased WSC content of grass. In terms of N excretion, urine N (% of N intake) decreased by 12.3% without grain feeding compared with 11.2% with grain feeding, the N utilization ratio decreased by 35.7% without grain feeding compared with 29.2% with grain feeding, and total N excretion (% of N intake) decreased by 16.9% without grain feeding compared with 15.3% with grain feeding. Again, results show a tendency for higher levels of improvement on lower quality diets, and this may be another source of varia-tion for the data in the literature. This variation may also depend on the composition of the grain fraction and level of grain intake.
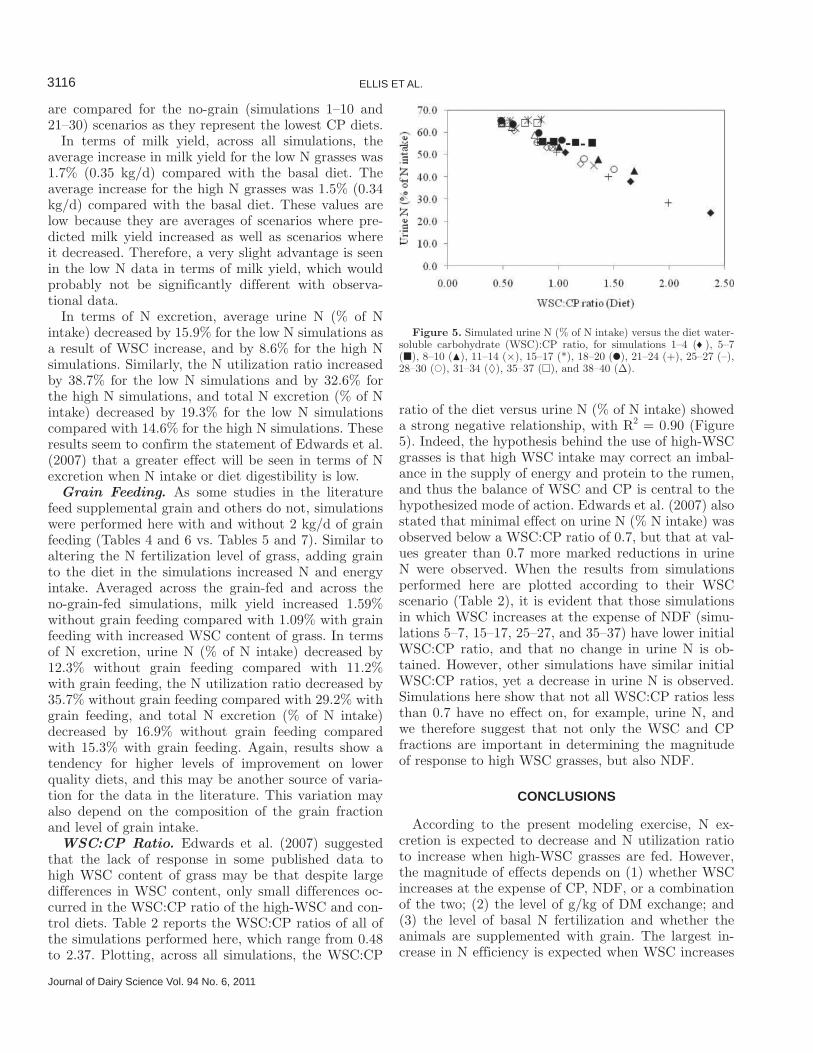
WSC:CP Ratio. Edwards et al. (2007) suggested that the lack of response in some published data to high WSC content of grass may be that despite large differences in WSC content, only small differences oc-curred in the WSC:CP ratio of the high-WSC and con-trol diets. Table 2 reports the WSC:CP ratios of all of the simulations performed here, which range from 0.48 to 2.37. Plotting, across all simulations, the WSC:CP
ratio of the diet versus urine N (% of N intake) showed a strong negative relationship, with R2 = 0.90 (Figure 5). Indeed, the hypothesis behind the use of high-WSC grasses is that high WSC intake may correct an imbal-ance in the supply of energy and protein to the rumen, and thus the balance of WSC and CP is central to the hypothesized mode of action. Edwards et al. (2007) also stated that minimal effect on urine N (% N intake) was observed below a WSC:CP ratio of 0.7, but that at val-ues greater than 0.7 more marked reductions in urine N were observed. When the results from simulations performed here are plotted according to their WSC scenario (Table 2), it is evident that those simulations in which WSC increases at the expense of NDF (simu-lations 5–7, 15–17, 25–27, and 35–37) have lower initial WSC:CP ratio, and that no change in urine N is ob-tained. However, other simulations have similar initial WSC:CP ratios, yet a decrease in urine N is observed. Simulations here show that not all WSC:CP ratios less than 0.7 have no effect on, for example, urine N, and we therefore suggest that not only the WSC and CP fractions are important in determining the magnitude of response to high WSC grasses, but also NDF.
CONCLUSIONS
According to the present modeling exercise, N ex-cretion is expected to decrease and N utilization ratio to increase when high-WSC grasses are fed. However, the magnitude of effects depends on (1) whether WSC increases at the expense of CP, NDF, or a combination of the two; (2) the level of g/kg of DM exchange; and (3) the level of basal N fertilization and whether the animals are supplemented with grain. The largest in-crease in N efficiency is expected when WSC increases
Figure 5. Simulated urine N (% of N intake) versus the diet water-soluble carbohydrate (WSC):CP ratio, for simulations 1–4 ( ), 5–7 (�), 8–10 (�), 11–14 (×), 15–17 (*), 18–20 (�), 21–24 (+), 25–27 (–), 28–30 (�), 31–34 (◊), 35–37 (□), and 38–40 (Δ).
Journal of Dairy Science Vol. 94 No. 6, 2011
EFFECT OF HIGH-SUGAR GRASSES ON NITROGEN AND MILK PREDICTIONS 3117
at the expense of CP, followed by a combination of CP and NDF, followed by NDF. When WSC increases at the expense of CP, milk yield is expected to decline slightly (up to –1.5 kg/d), but is expected to increase when WSC increases at the expense of a combination of CP and NDF (up to +0.6 kg/d), and more so when WSC increases at the expense of NDF alone (up to +2.4 kg/d). In general, simulated effects were amplified under conditions of a lower plane of nutrition (e.g., low grass N fertilization levels or the absence of grain feed-ing). These results are generally in line with observa-tional data, and explain at least some of the variation observed. High-WSC grasses may indeed increase the efficiency of N utilization and milk yield, but results will depend on the composition of the grass and the diet under consideration.
ACKNOWLEDGMENTS
Funding for this project was provided by the Canada Research Chairs Program and the Natural Sciences and Engineering Research Council’s Strategic Grants Program. The Sesnon Endowed Chair Program (UC Davis) is also acknowledged. J. L. Ellis received a Wa-geningen Institute of Animal Sciences (WIAS) research fellowship in 2008, as well as funding from the Animal Sciences Group (Wageningen UR, Lelystad, the Neth-erlands). Authors Parsons, Rasmussen, and Edwards were partly funded by FRST (NZ) “Novel Traits” pro-gramme (C10X0903) and FRST/DairyNZ programme P21.
REFERENCES
Abrahamse, P. A., S. Tamminga, and J. Dijkstra. 2009. Effect of daily movement of dairy cattle to fresh grass in morning or afternoon on intake, grazing behaviour, rumen fermentation and milk produc-tion. J. Dairy Sci. 71:1178–1188.
AFRC. 1993. Energy and Protein Requirements of Ruminants. CAB International, Wallingford, UK.
Bannink, A., J. France, S. López, W. J. J. Gerrits, E. Kebreab, S. Tamminga, and J. Dijkstra. 2008. Modelling the implications of feeding strategy on rumen fermentation and functioning of the ru-men wall. Anim. Feed Sci. Technol. 143:3–26.
Bernard, J. K. 1997. Milk production and composition responses to the source of protein supplements in diets containing wheat mid-dlings. J. Dairy Sci. 80:938–942.
Bibby, J., and T. Toutenburg. 1977. Prediction and Improved Estima-tion in Linear Models. John Wiley & Sons, Chichester, UK.
Castillo, A. R., E. Kebreab, D. E. Beever, and J. France. 2000. A review of efficiency of nitrogen utilisation in dairy cows and its relationship with the environmental pollution. J. Anim. Feed Sci. 9:1–32.
Centraal Veevoederbureau (CVB). 2007. CVB Table Ruminants 2007, series nr 32. CVB, The Hague, the Netherlands.
Cosgrove, G. P., J. L. Burke, A. F. Death, M. J. Hickey, D. Pacheco, K. Fraser, and G. A. Lane. 2007. Ryegrass with increased water soluble carbohydrate: Evaluating the potential for grazing dairy cows in New Zealand. Proc. N.Z. Grassl. Assoc. 69:179–185.
Dijkstra, J., J. France, A. G. Assis, H. D. St. C. Neal, O. F. Campos, and L. J. M. Aroeira. 1996. Simulation of digestion in cattle fed sugarcane: Prediction of nutrient supply for milk production with locally available supplements. J. Agric. Sci. Camb. 127:247–260.
Dijkstra, J., E. Kebreab, A. Bannink, L. A. Crompton, S. Lopez, P. A. Abrahamse, P. Chilibroste, J. A. N. Mills, and J. France. 2008. Comparison of energy evaluation systems and a mechanistic model for milk production by dairy cattle offered fresh grass-based diets. Anim. Feed Sci. Technol. 143:203–219.
Dijkstra, J., D. St. C. Neal, D. E. Beever, and J. France. 1992. Simula-tion of nutrient digestion, absorption and outflow in the rumen: Model description. J. Nutr. 122:2239–2256.
Edwards, G. R., A. J. Parsons, and S. Rasmussen. 2007. High sugar ryegrasses for dairy systems. Pages 307–334 in Meeting the Chal-lenges for Pasture-Based Dairying. Proceedings of the Austral-asian Dairy Science Symposium. D. F. Chapman, D. A. Clark, K. L. MacMillan and D. P. Nation, ed. University of Melbourne, National Dairy Alliance, Melbourne, Australia.
Kebreab, E., J. France, J. A. Mills, R. Allison, and J. Dijkstra. 2002. A dynamic model of N metabolism in the lactating dairy cow and an assessment of impact of N excretion on the environment. J. Anim. Sci. 80:248–259.
Lee, M. R. F., L. J. Harris, J. M. Moorby, M. O. Humphreys, M. K. Theodorou, J. C. MacRae, and N. D. Scollan. 2002. Rumen me-tabolism and nitrogen flow to the small intestine in steers offered Lolium perenne containing different levels of water-soluble carbo-hydrate. Anim. Sci. 74:587–596.
Lin, L. I. K. 1989. A concordance correlation coefficient to evaluate reproducibility. Biometrics 45:255–268.
Miller, L. A., D. H. Baker, M. K. Theodorou, J. C. MacRae, M. O. Humphreys, N. D. Scollan, and J. M. Moorby. 2001b. Efficiency of nitrogen use in dairy cows grazing ryegrass with different water soluble carbohydrate concentrations. Pages 377–378 in Grassland Ecosystems: An Outlook into the 21st Century. Proc. 19th Int. Grassl. Congr. J. A. Gomide, W. R. S. Mattos, and S. Carneiro da Silva, ed. Sao Paulo, Brazil.
Miller, L. A., J. M. Moorby, D. R. Davies, M. O. Humphreys, N. D. Scollan, J. C. MacRae, and M. K. Theodorou. 2001a. Increased concentration of water-soluble carbohydrate in perennial ryegrass (Lolium perenne L.): Milk production from late-lactation dairy cows. Grass Forage Sci. 56:383–394.
Miller, L. A., M. K. Theodorou, J. C. MacRae, R. T. Evans, M. O. Humphreys, N. D. Scollan, and J. M. Moorby. 2000. Efficiency of nitrogen use by dairy cows offered perennial ryegrass with high water soluble carbohydrate concentrations. Pages 37–38 in Proc. 6th Res. Conf. Br. Grassl. Soc., Aberdeen, UK.
Mills, J. A. N., J. Dijkstra, A. Bannink, S. B. Cammell, E. Kebreab, and J. France. 2001. A mechanistic model of whole-tract digestion and methanogenesis in the lactating dairy cow: Model develop-ment, evaluation and application. J. Anim. Sci. 79:1584–1597.
Moorby, J. M., R. T. Evans, N. D. Scollan, J. C. MacRae, and M. K. Theodorou. 2006. Increased concentration of water-soluble carbo-hydrate in perennial ryegrass (Lolium perenne L.). Evaluation in dairy cows in early lactation. Grass Forage Sci. 61:52–59.
Murphy, M. R., R. L. Baldwin, and L. J. Koong. 1982. Estimation of stoichiometric parameters for rumen fermentation of roughage and concentrate diets. J. Anim. Sci. 55:411–421.
Rasmussen, S., A. J. Parsons, H. Xue, and J. A. Newman. 2009. High sugar grasses—Harnessing the benefits of new cultivars through growth management. Proc. N.Z. Grassl. Assoc. 71:167–175.
Reijs, J. W. 2007. Improving slurry by diet adjustments. A novelty to reduce N losses from grassland based dairy farms. PhD Thesis. Wageningen University, Wageningen, the Netherlands.
Sauvant, D., J.-M. Perez, and G. Tran, ed. 2004. Tables of composi-tion and nutritional value of feed materials. Wageningen Academic Publishers, Wageningen, the Netherlands, and Institut National de la Recherche Agronomique, Paris, France.
Seo, S., L. O. Tedeschi, C. Lanzas, C. G. Schwab, and D. G. Fox. 2006. Development and evaluation of empirical equations to predict feed passage rate in cattle. Anim. Feed Sci. Technol. 128:67–83.
3118 ELLIS ET AL.
Journal of Dairy Science Vol. 94 No. 6, 2011
Tas, B. M., H. Z. Taweel, H. J. Smit, A. Elgersma, J. Dijkstra, and S. Tamminga. 2005. Effects of perennial ryegrass cultivars on in-take, digestibility and milk yield in dairy cows. J. Dairy Sci. 88:3240–3248.
Tas, B. M., H. Z. Taweel, H. J. Smit, A. Elgersma, J. Dijkstra, and S. Tamminga. 2006a. Utilisation of N in perennial ryegrass cultivars by stall-fed lactating dairy cows. Livest. Sci. 100:159–168.
Tas, B. M., H. Z. Taweel, H. J. Smit, A. Elgersma, J. Dijkstra, and S. Tamminga. 2006b. Effects of perennial ryegrass cultivars on milk yield and nitrogen utilisation in grazing dairy cows. J. Dairy Sci. 89:3494–3500.
Tavendale, M. H., D. Pacheco, G. A. Lane, K. Fraser, A. F. Death, J. L. Burke, M. J. Hickey, and G. P. Cosgrove. 2006. The effects of ryegrass varieties differing in soluble sugar content on the ru-men fermentation of amino acids and consequences for milk flavor chemistry. Proc. N.Z. Grassl. Assoc. 68:267–273.
Taweel, H. Z., B. M. Tas, H. J. Smit, A. Elgersma, J. Dijkstra, and S. Tamminga. 2005a. Effects of feeding perennial ryegrass with an elevated concentration of water-soluble carbohydrate on intake, rumen function and performance of dairy cows. Anim. Feed Sci. Technol. 121:243–256.
Taweel, H. Z., B. M. Tas, H. J. Smit, A. Elgersma, J. Dijkstra, and S. Tamminga. 2005b. Improving the quality of perennial ryegrass (Lolium perenne L.) for dairy cows by selecting for fast clearing and/or degradable neutral detergent fiber. Livest. Prod. Sci. 96:239–248.
Taweel, H. Z., B. M. Tas, H. J. Smit, A. Elgersma, J. Dijkstra, and S. Tamminga. 2006. Grazing behaviour, intake, rumen function and milk production of dairy cows offered Lolium perenne contain-ing different levels of water-soluble carbohydrates. Livest. Sci. 102:33–41.
Valk, H. 2002. Nitrogen and phosphorus supply of dairy cows. PhD Thesis. Wageningen University, Wageningen, the Netherlands.
Valk, H., I. E. Kappers, and S. Tamminga. 1996. In sacco degradation characteristics of organic matter, neutral detergent fibre and crude protein of fresh grass fertilized with different amounts of nitrogen. Anim. Feed Sci. Technol. 63:63–87.
Valk, H., I. E. Leusink-Kappers, and A. M. van Vuuren. 2000. Ef-fect of reducing nitrogen fertilizer on grassland on grass intake, digestibility and milk production of dairy cows. Livest. Prod. Sci. 63:27–38.
Copyright © 2022 FDOKUMEN