The effect of heat setting on the structure and mechanical properties of poly (ethylene...
12
The Effect of Heat Setting on the Structure and Mechanical Properties of Poly(ethy1ene Terephthalate) Fiber. I. Structural Changes V. B. GUPTA and SATISH KUMAR,* Textile Technology Department, Indian Institute of Technology, Delhi, New Delhi 110016, India Synopsis We report structural changes in commercial multifilament poly(ethy1ene terephthalate) (PET) yarn when it is heat set in silicone oil over a range of temperatures between 100 and 220°C for times ranging from 1 min to 1 hr, while the yarn was (1) free to relax, and (2) held taut at constant length. In one case, viz., a sample heat treated for 1 hr, the cooling time was also varied to study the effect of rate of cooling. The free-annealed and taut-annealed samples showed considerable differences. The predominant role of the temperature of heat setting on structure is discussed in detail. There are considerable changes in the amount and orientation of the amorphous phase, and these will be shown to have important influence on mechanical properties in subsequent reports. INTRODUCTION There have been a number of studies on the changes in the structure of poly(ethy1ene terephthalate) (PET) fibers on heat setting.l-17 In most of these studies, the PET fibers were heat set in the slack ~0ndition.l-l~ A limited amount of work has been done on PET fibers heat set under tension or at con- stant length.13-16 The results of these studies have been used extensively for structure-property correlations.12-16.18 The present study represents a systematic attempt to understand the structure property correlation in PET fibers. The generally accepted values of intrinsic birefringence have been shownlg to result in several anomalies, and new values have been proposed. While the results on free-annealed samples are essentially similar to those observed by other authors, the taut-annealed samples show a very different behavior. An integrated approach to explain the structure- property correlation in both sets of fibers has been made for the first time in this report and has resulted in highlighting some new aspects of this interesting subject. EXPERIMENTAL Sample Preparation The starting material was a drawn commercial multifilament PET yarn 76/ 36/0, i.e., 76 denier, 36 filaments, and zero twist. This sample will be referred to as the control. It was produced from PET chips with a titanium dioxide content of 0.40% and a melting point of 258°C. Its molecular weight; R,, was 19,040. * Present address: Polymer Research Institute, University of Massachusetts, Amherst, MA 01003. Journal of Applied Polymer Science, Vol. 26,1865-1876 (1981) 0 1981 John Wiley & Sons, Inc. CCC 0021-8995/81/061865-12$01.20
-
Upload
independent -
Category
Documents
-
view
6 -
download
0
Transcript of The effect of heat setting on the structure and mechanical properties of poly (ethylene...
The Effect of Heat Setting on the Structure and Mechanical Properties of Poly(ethy1ene
Terephthalate) Fiber. I. Structural Changes
V. B. GUPTA and SATISH KUMAR,* Textile Technology Department, Indian Institute of Technology, Delhi, New Delhi 110016, India
Synopsis
We report structural changes in commercial multifilament poly(ethy1ene terephthalate) (PET) yarn when it is heat set in silicone oil over a range of temperatures between 100 and 220°C for times ranging from 1 min to 1 hr, while the yarn was (1) free to relax, and (2) held taut a t constant length. In one case, viz., a sample heat treated for 1 hr, the cooling time was also varied to study the effect of rate of cooling. The free-annealed and taut-annealed samples showed considerable differences. The predominant role of the temperature of heat setting on structure is discussed in detail. There are considerable changes in the amount and orientation of the amorphous phase, and these will be shown to have important influence on mechanical properties in subsequent reports.
INTRODUCTION
There have been a number of studies on the changes in the structure of poly(ethy1ene terephthalate) (PET) fibers on heat setting.l-17 In most of these studies, the PET fibers were heat set in the slack ~0ndition.l-l~ A limited amount of work has been done on PET fibers heat set under tension or at con- stant length.13-16 The results of these studies have been used extensively for structure-property correlations.12-16.18
The present study represents a systematic attempt to understand the structure property correlation in PET fibers. The generally accepted values of intrinsic birefringence have been shownlg to result in several anomalies, and new values have been proposed. While the results on free-annealed samples are essentially similar to those observed by other authors, the taut-annealed samples show a very different behavior. An integrated approach to explain the structure- property correlation in both sets of fibers has been made for the first time in this report and has resulted in highlighting some new aspects of this interesting subject.
EXPERIMENTAL
Sample Preparation
The starting material was a drawn commercial multifilament PET yarn 76/ 36/0, i.e., 76 denier, 36 filaments, and zero twist. This sample will be referred to as the control. It was produced from PET chips with a titanium dioxide content of 0.40% and a melting point of 258°C. Its molecular weight; R,, was 19,040.
* Present address: Polymer Research Institute, University of Massachusetts, Amherst, MA 01003.
Journal of Applied Polymer Science, Vol. 26,1865-1876 (1981) 0 1981 John Wiley & Sons, Inc. CCC 0021-8995/81/061865-12$01.20
1866 GUPTA AND KUMAR
The polymer chips were spun at 290°C at a pressure of 1400 psi and quenched at 20°C in an atmosphere of 97% relative humidity. The take-up speed was 800 m/min, and the molecular weight M,, of the spun filament was 17,820.
The spun multifilament yarns were stretched on a draw twister with a top godet temperature of 95°C and a plate temperature at 140°C. The winding speed was 642 m/min. The draw ratio was 3.92, and the drawing was done in a room maintained at 25°C and 70% relative humidity.
This yarn was heat set in a silicone oil bath maintained at a fixed temperature within f2"C. The heat setting was done at 100,140,160,180, and 220°C under two conditions, viz., when the yarn was (1) held at constant length (designated TA, or taut-annealed in the figures), and (2) free to relax (FA, or free-annealed in the figures) a t each temperature. The yarn was heat set for various times, viz., for 1, 15, 30, and 60 min. After holding the sample in the constant tem- perature bath for a designated time, it was taken out of the bath and allowed to reach ambient temperature. Another set of samples was prepared by heat setting the yarn for 60 min in the bath and then allowing it to cool in the bath itself over a period of about 12 hr-the time taken by the bath to reach room temperature after the heating unit was switched off. The heat-set samples were first blotted and then washed in carbon tetrachloride and dried in air. The amorphous standard was a Mylar film-an undrawn cast film of PET supplied by du Pont, USA. X-ray scan of this film confirmed that it was amorphous.
Shrinkage
By measuring the length before (LO) and after ( L ) heat setting, the percentage shrinkage of the free-annealed samples was obtained using the expression
Lo - L shrinkage (%) = 7 x 100
Denier
For measurement of denier, a pretension of 5 g was applied to the multifilament yarn and a fixed length cut out. From the weight of this length, the weight of 9000 m was calculated to give the denier.
Density
Density of the samples was measured on a Davenport Density Gradient Col- umn maintained at 23 f 2"C, using a mixture of n-heptane and carbon tetra- chloride.
Birefringence
Birefringence was measured using a Leitz polarizing microscope and a com- pensator. An average of ten readings on different fibers was taken. It was en- sured that the birefringence values are accurate within f0.003.
HEAT-SETTING OF PET. I 1867
Crystallinity
The multifilament yarn was cut with the help of scissors, and fine powder was collected in a sieve of mesh size 50 per inch. Using a Philips x-ray diffractometer and taking the powder in the form of a small compressed specimen, a radial in- tensity scan was obtained. A similar intensity scan was obtained for a standard amorphous sample. The crystallinity was determined by proportionately fitting the amorphous intensity in the intensity scan for the sample and taking the ratio of the area of the crystalline region to the total area.20*21 Mass fraction of crys- tallinity (0) from density was determined using the following expression:
where pa , p c , and p are the densities of the amorphous, the crystalline, and the unknown samples, respectively. For PET, the density values were taken to be 1.455 and 1.333 g/cm3 for the crystalline and amorphous regions, respectively.22 Other values of density that have been postulated were also tried, and it was observed that they do not lead to any significant difference in the relative values of crystallinity and thus do not affect the arguments.
Crystallite Orientation
A well-paralleled bundle of about 20 multifilament yarns was mounted on the texture goniometer of a Philips x-ray diffractometer and the (i05) plane, which is an off-meridional reflection at 28 = 43O, was scanned along the azimuth. If I(4) if the intensity of this plane at an azimuthal angle 4 from the meridian, then
- J O cos2 d = ~ (3)
Hermans' orientation factor for the crystallites, f c , which is given by
fc = '/2(3 C O S ~ 8 - 1) (4)
where 8 is the angle which the molecular chain axis makes with the fiber axis and which cannot be determined directly from the (i05) plane since it is off the me- ridian. An expression, derived elsewhere,23 to take into account the off-me- ridional nature of this plane was therefore used:
(5)
where y is the angle which the (i05) plane normal makes with the c axis. The value of y changes with the draw ratio as reported by Bhatt et al.24 with the heat-setting temperature as reported in this article. These changes were taken into account to determine the value of f c .
C O G cos2 8 = -
cos2 y
1868 GUPTA AND KUMAR
Amorphous Orientation Factor
For a uniaxially oriented, polycrystalline polymer (assuming a two-phase model of crystalline and amorphous regions), the measured birefringence An may be defined as
(6)
where Aic is the intrinsic birefringence of the perfectly oriented crystalline phase, A:, is the intrinsic birefringence of the perfectly oriented amorphous phase, /3 is the degree of crystallinity of the fiber, and fc and fa are the crystalline and amorphous orientation factors for the fiber respectively. The values of A:, = 0.29 and A:, = 0.20 were used.lg
An = P G c f c + (1 - P)Aia fa
Crystallite Size
The half-width B of the (010) and (100) scans were used to obtain the crystal size from the following equation:
0.89X t = B COS dhkl
(7)
where X is the wavelength of the x-rays, t is the crystal dimension perpendicular to the (hkl) plane, and $hkl is the Bragg angle for this plane. Corrections due to instrumental broadening were calculated and found to be negligible.
RESULTS AND DISCUSSION
Shrinkage
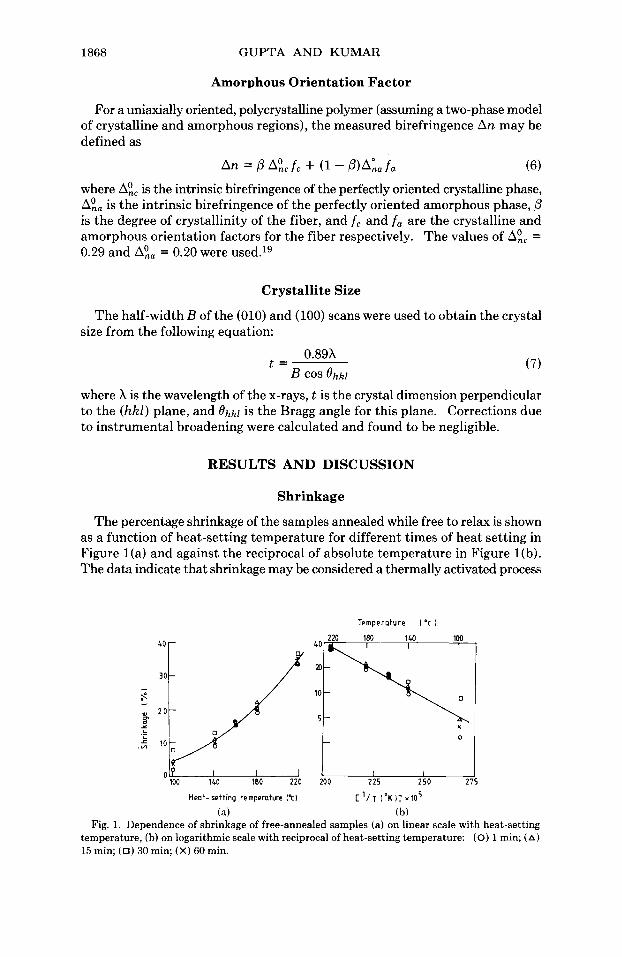
The percentage shrinkage of the samples annealed while free to relax is shown as a function of heat-setting temperature for different times of heat setting in Figure l(a) and against the reciprocal of absolute temperature in Figure l(b). The data indicate that shrinkage may be considered a thermally activated process
Temperoture I *c 1
40 r
5 - x
0 -
I I 20 0 225 250 2
Heot- setting temperature ( O C ) C 1 / T l o K 1 1 ~ 1 O 5
(a) (b) Fig. 1. Dependence of shrinkage of free-annealed samples (a) on linear scale with heat-setting
temperature, (h) on logarithmic scale with reciprocal of heat-setting temperature: (0) 1 min; (A) 15 min; (0) 30 min; (X) 60 min.
HEAT-SETTING OF PET.. I 1869
following an Arrhenius-type relationship, as has been shown14 for nylon 66. It is interesting to note that a t low heat-setting temperatures, the time of heat setting has a relatively larger effect on shrinkage. Such shrinkage in fibers is usually attributed to the rubberlike retractive forces present in the amorphous regions in the drawn commercial fibers and to the chain-folding effect.14J7
Denier
The dependence of denier on the heat-setting temperature for various times is similar to that for shrinkage.
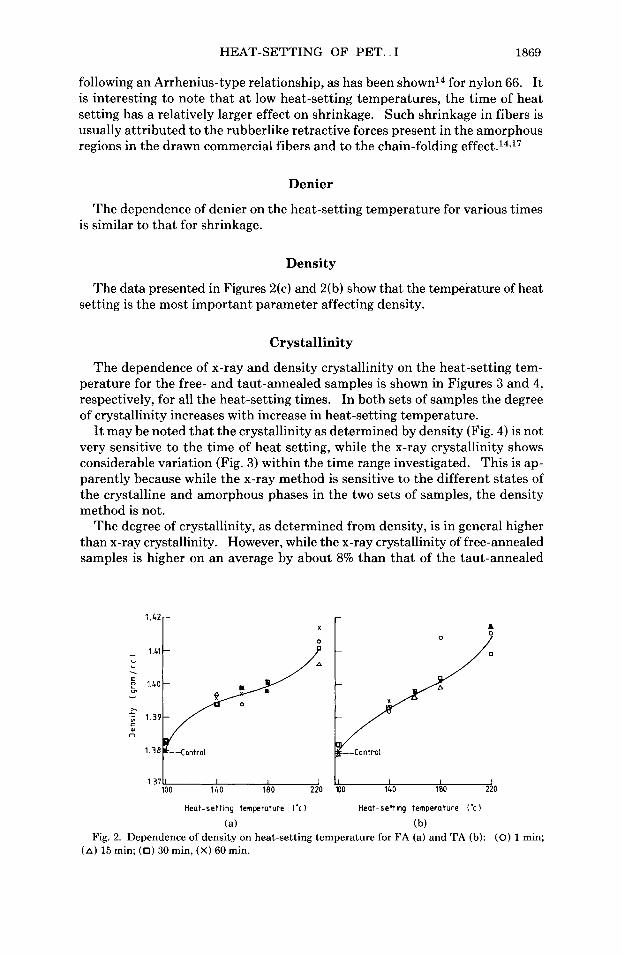
Density
The data presented in Figures 2(c) and 2(b) show that the temperature of heat setting is the most important parameter affecting density.
Crystallinity
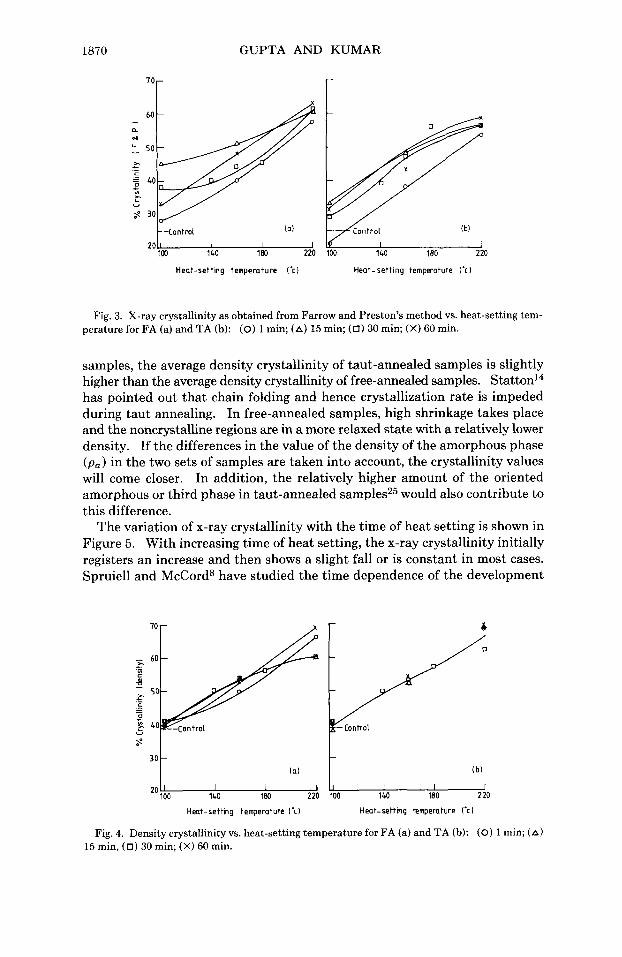
The dependence of x-ray and density crystallinity on the heat-setting tem- perature for the free- and taut-annealed samples is shown in Figures 3 and 4, respectively, for all the heat-setting times. In both sets of samples the degree of crystallinity increases with increase in heat-setting temperature.
It may be noted that the crystallinity as determined by density (Fig. 4) is not very sensitive to the time of heat setting, while the x-ray crystallinity shows considerable variation (Fig. 3) within the time range investigated. This is ap- parently because while the x-ray method is sensitive to the different states of the crystalline and amorphous phases in the two sets of samples, the density method is not.
The degree of crystallinity, as determined from density, is in general higher than x-ray crystallinity. However, while the x-ray crystallinity of free-annealed samples is higher on an average by about 8% than that of the taut-annealed
1.37- 100 140 i a o 220 a0 140 180 220
Heat-setting temperature l'c 1 Heat-setting temperature I'c
(a) (b) Fig. 2. Dependence of density on heat-setting temperature for FA (a) and TA (b): (0) 1 min;
(A) 15 min; (0) 30 min, (X) 60 min.
1870 GUPTA AND KUMAR
' O r
-Control 2 0 I I 1
100 140 180 220
Heat-setting temperature (-0
F n t r o , (b l
30 140 180 220 I I J
Heat-setting ternpwature ('cl
Fig. 3. X-ray crystallinity as obtained from Farrow and Preston's method vs. heat-setting tem- perature for FA (a) and TA (b): (0) 1 min; (A) 15 min; (0) 30 min; (X) 60 min.
samples, the average density crystallinity of taut-annealed samples is slightly higher than the average density crystallinity of free-annealed samples. Statton14 has pointed out that chain folding and hence crystallization rate is impeded during taut annealing. In free-annealed samples, high shrinkage takes place and the noncrystalline regions are in a more relaxed state with a relatively lower density. If the differences in the value of the density of the amorphous phase ( p a ) in the two sets of samples are taken into account, the crystallinity values will come closer. In addition, the relatively higher amount of the oriented amorphous or third phase in taut-annealed samples25 would also contribute to this difference.
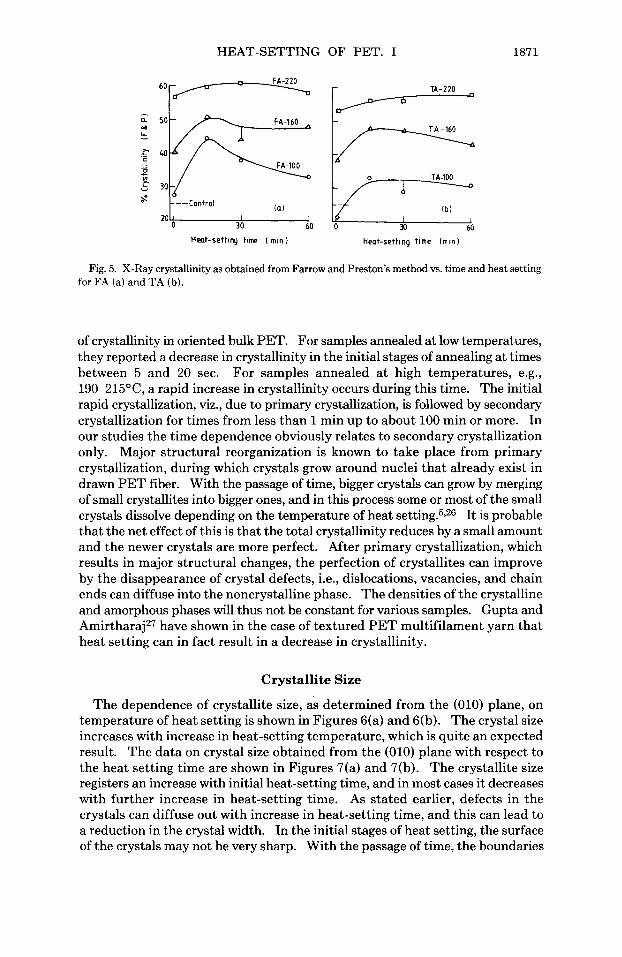
The variation of x-ray crystallinity with the time of heat setting is shown in Figure 5. With increasing time of heat setting, the x-ray crystallinity initially registers an increase and then shows a slight fall or is constant in most cases. Spruiell and McCord8 have studied the time dependence of the development
- I b l
Heat-setting temperature ('0 Heat-setting temperature (*cl
Fig. 4. Density crystallinity vs. heat-setting temperature for FA (a) and TA (b): (0) 1 min; (A) 15 min, (0) 30 min; (X) 60 min.
HEAT-SETTING OF PET. I 1871
FA-220
, O r - = FA-160
30 60
Heat-settirq time ( min) Heat-setting time I m i n )
Fig. 5. X-Ray crystallinity as obtained from Farrow and Preston’s method vs. time and heat setting for FA (a) and TA (b).
of crystallinity in oriented bulk PET. For samples annealed at low temperatures, they reported a decrease in crystallinity in the initial stages of annealing at times between 5 and 20 sec. For samples annealed at high temperatures, e.g., 190-215°C, a rapid increase in crystallinity occurs during this time. The initial rapid crystallization, viz., due to primary crystallization, is followed by secondary crystallization for times from less than 1 min up to about 100 min or more. In our studies the time dependence obviously relates to secondary crystallization only. Major structural reorganization is known to take place from primary crystallization, during which crystals grow around nuclei that already exist in drawn PET fiber. With the passage of time, bigger crystals can grow by merging of small crystallites into bigger ones, and in this process some or most of the small crystals dissolve depending on the temperature of heat ~ e t t i n g . ~ ? ~ ~ It is probable that the net effect of this is that the total crystallinity reduces by a small amount and the newer crystals are more perfect. After primary crystallization, which results in major structural changes, the perfection of crystallites can improve by the disappearance of crystal defects, i.e., dislocations, vacancies, and chain ends can diffuse into the noncrystalline phase. The densities of the crystalline and amorphous phases will thus not be constant for various samples. Gupta and Amirtharaj27 have shown in the case of textured PET multifilament yarn that heat setting can in fact result in a decrease in crystallinity.
Crystallite Size
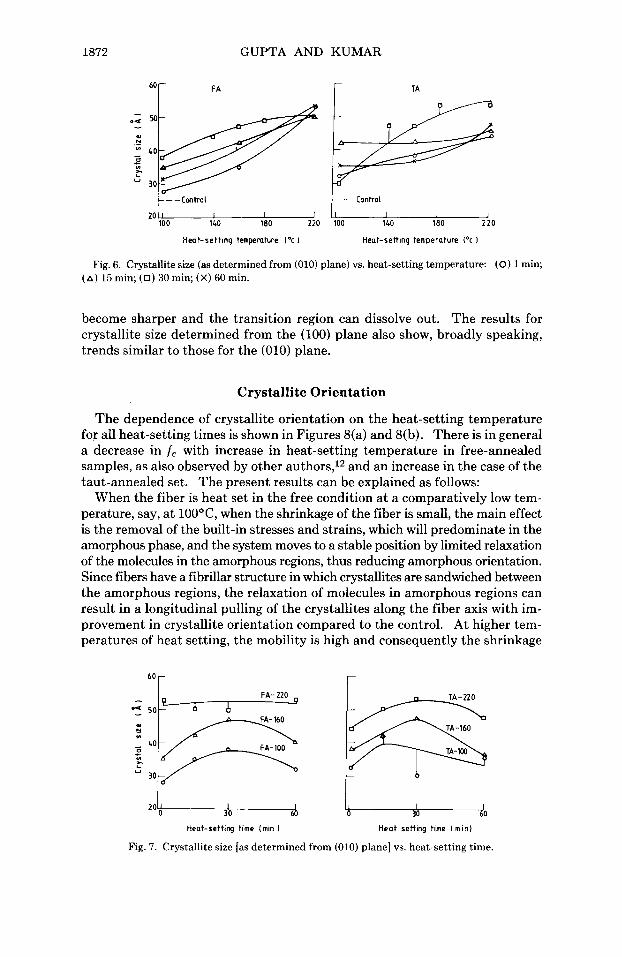
The dependence of crystallite size, as determined from the (010) plane, on temperature of heat setting is shown in Figures 6(a) and 6(b). The crystal size increases with increase in heat-setting temperature, which is quite an expected result. The data on crystal size obtained from the (010) plane with respect to the heat setting time are shown in Figures 7(a) and 7(b). The crystallite size registers an increase with initial heat-setting time, and in most cases it decreases with further increase in heat-setting time. As stated earlier, defects in the crystals can diffuse out with increase in heat-setting time, and this can lead to a reduction in the crystal width. In the initial stages of heat setting, the surface of the crystals may not be very sharp. With the passage of time, the boundaries
1872
FA 60 -
: E
30
- -Control
20
GUPTA AND KUMAR
- TA
--Control Ffi become sharper and the transition region can dissolve out, The results for crystallite size determined from the (100) plane also show, broadly speaking, trends similar to those for the (010) plane.
Crystallite Orientation
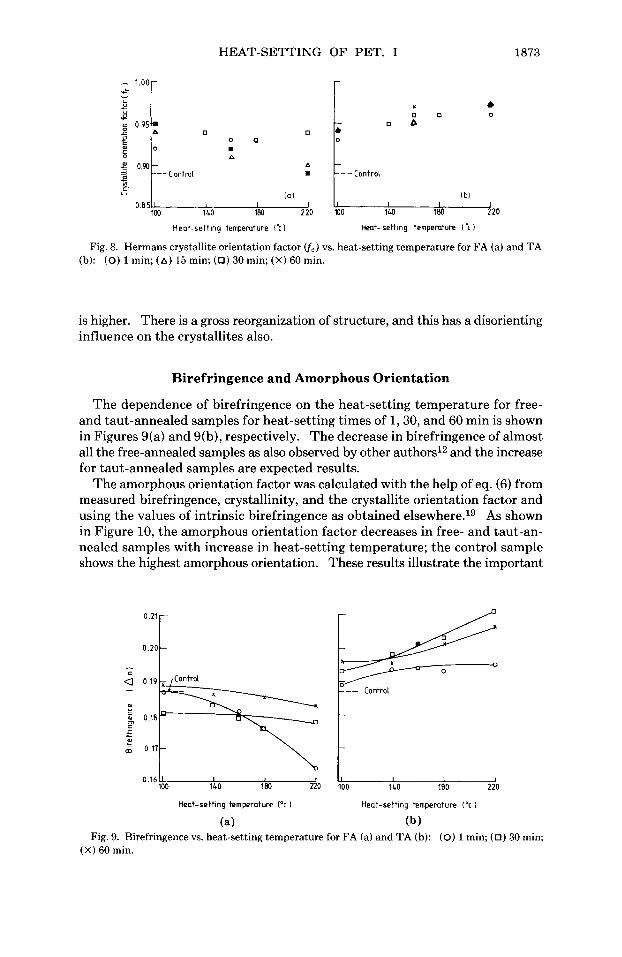
The dependence of crystallite orientation on the heat-setting temperature for all heat-setting times is shown in Figures 8(a) and 8(b). There is in general a decrease in f c with increase in heat-setting temperature in free-annealed samples, as also observed by other authors,12 and an increase in the case of the taut-annealed set. The present results can be explained as follows:
When the fiber is heat set in the free condition at a comparatively low tem- perature, say, a t 100°C, when the shrinkage of the fiber is small, the main effect is the removal of the built-in stresses and strains, which will predominate in the amorphous phase, and the system moves to a stable position by limited relaxation of the molecules in the amorphous regions, thus reducing amorphous orientation. Since fibers have a fibrillar structure in which crystallites are sandwiched between the amorphous regions, the relaxation of molecules in amorphous regions can result in a longitudinal pulling of the crystallites along the fiber axis with im- provement in crystallite orientation compared to the control. A t higher tem- peratures of heat setting, the mobility is high and consequently the shrinkage
6o r FA- 220
"_ 50
FA-I00
30
r
2 o 1,, 0 1,. Heat-setting time lmin 1 Heat setting time i m i n )
Fig. 7. Crystallite size [as determined from (010) plane] vs. heat-setting time.
HEAT-SETTING OF PET. I 1873
- 1.00
0 D b
b P
f 0.90
P v
4 D 0
l bl . -. I I I
0.8511 100 140 180 220 ,220 XI0 1LO
Heat-setting tempemture l'cl Heat- setting temperature [ t )
Fig. 8. Hermans crystallite orientation factor ( f c ) vs. heat-setting temperature for FA (a) and T A (b): (0) 1 min; (A) 15 min; (0) 30 min; (X) 60 min.
is higher. There is a gross reorganization of structure, and this has a disorienting influence on the crystallites also.
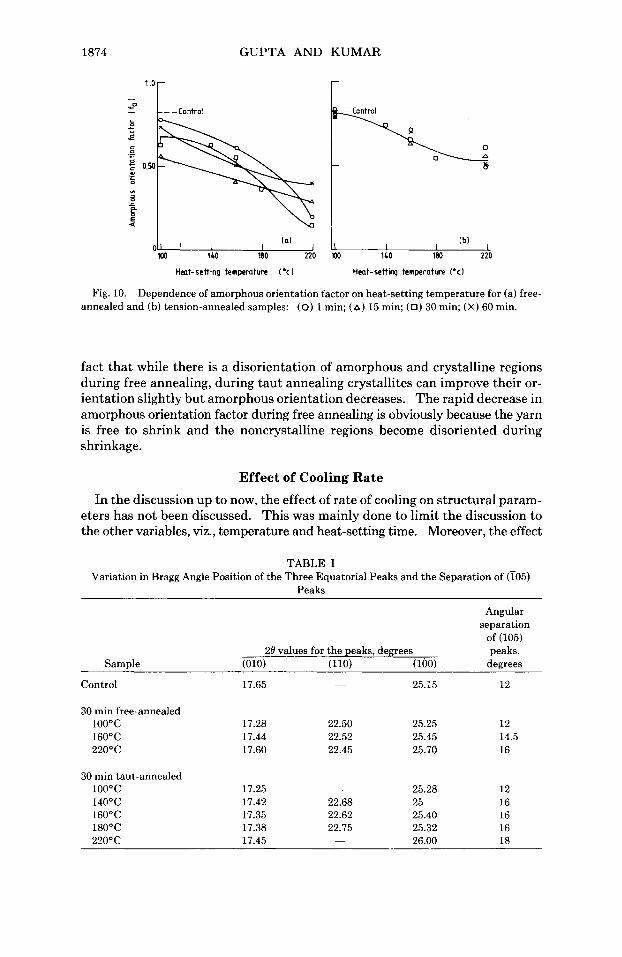
Birefringence and Amorphous Orientation
The dependence of birefringence on the heat-setting temperature for free- and taut-annealed samples for heat-setting times of 1,30, and 60 min is shown in Figures 9(a) and 9(b), respectively. The decrease in birefringence of almost all the free-annealed samples as also observed by other authors12 and the increase for taut-annealed samples are expected results.
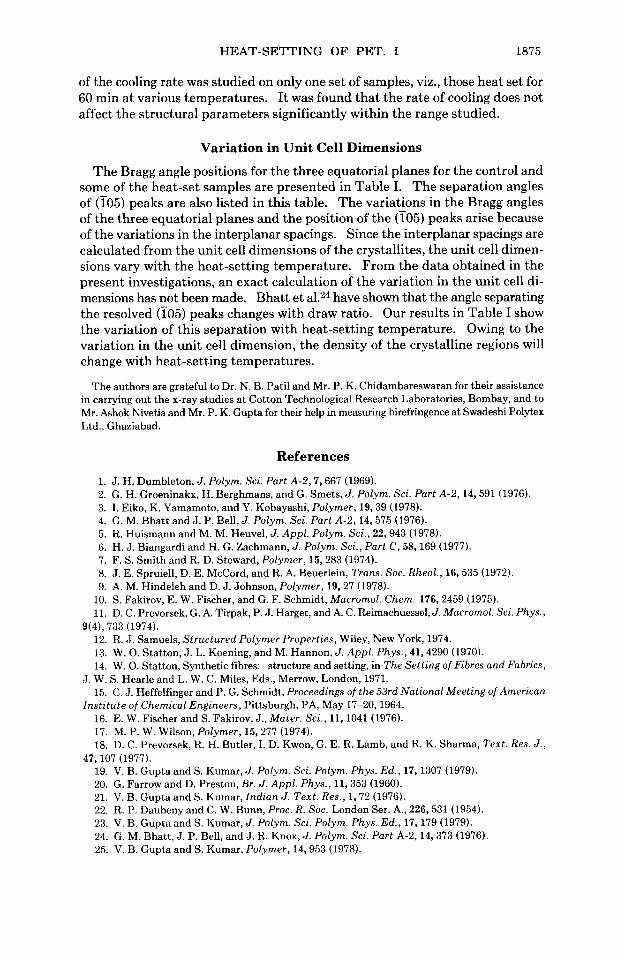
The amorphous orientation factor was calculated with the help of eq. (6) from measured birefringence, crystallinity, and the crystallite orientation factor and using the values of intrinsic birefringence as obtained e1~ewhere.l~ As shown in Figure 10, the amorphous orientation factor decreases in free- and taut-an- nealed samples with increase in heat-setting temperature; the control sample shows the highest amorphous orientation. These results illustrate the important
0.16b I I 1- 100 140 180 no 100 140 180 220
Heat-setting temperoture 1°C I Heot-setting temperature 1°C 1
( a ) (b) Fig. 9. Birefringence vs. heat-setting temperature for FA (a) and TA (b): (0) 1 min; (0) 30 min;
(X) 60 min.
1874 GUPTA AND KUMAR
I
(a1 ( b l I I I XI) 1w) 180 220 xx) 140 180 220
Hat-setting temperature ( ' c I Heat-setting temperature ( O c l
Fig. 10. Dependence of amorphous orientation factor on heat-setting temperature for (a) free- annealed and (b) tension-annealed samples: (0) 1 min; (A) 15 min; (0) 30 min; (x) 60 min.
fact that while there is a disorientation of amorphous and crystalline regions during free annealing, during taut annealing crystallites can improve their or- ientation slightly but amorphous orientation decreases. The rapid decrease in amorphous orientation factor during free annealing is obviously because the yarn is free to shrink and the noncrystalline regions become disoriented during shrinkage.
Effect of Cooling Rate In the discussion up to now, the effect of rate of cooling on structural param-
eters has not been discussed. This was mainly done to limit the discussion to the other variables, viz., temperature and heat-setting time. Moreover, the effect
TABLE I Variation in Bragg Angle Position of the Three Equatorial Peaks and the Separation of (i05)
Peaks
Angular separation
peaks, Sample (010) (110) (100) degrees
of (io5) 20 values for the peaks, degrees
Control 17.65
30 min free-annealed 100°C 17.28 16OOC 17.44 220oc 17.60
30 min taut-annealed 100°C 17.25 14OOC 17.42 160°C 17.35 180°C 17.38 220oc 17.45
22.50 22.52 22.45
22.68 22.62 22.75
25.15
25.25 25.45 25.70
25.28 25 25.40 25.32 26.00
12
12 14.5 16
12 16 16 16 18
HEAT-SETTING OF PET. I 1875
of the cooling rate was studied on only one set of samples, viz., those heat set for 60 min at various temperatures. It was found that the rate of cooling does not affect the structural parameters significantly within the range studied.
Variation in Unit Cell Dimensions
The Bragg angle positions for the three equatorial planes for the control and some of the heat-set samples are presented in Table I. The separation angles of (705) peaks are also listed in this table. The variations in the Bragg angles of the three equatorial planes and the position of the (i05) peaks arise because of the variations in the interplanar spacings. Since the interplanar spacings are calculated from the unit cell dimensions of the crystallites, the unit cell dimen- sions vary with the heat-setting temperature. From the data obtained in the present investigations, an exact calculation of the variation in the unit cell di- mensions has not been made. Bhatt et al.24 have shown that the angle separating the resolved (105) peaks changes with draw ratio. Our results in Table I show the variation of this separation with heat-setting temperature. Owing to the variation in the unit cell dimension, the density of the crystalline regions will change with heat-setting temperatures.
The authors are grateful t o Dr. N. B. Patil and Mr. P. K. Chidambareswaran for their assistance in carrying out the x-ray studies a t Cotton Technological Research Laboratories, Bombay, and to Mr. Ashok Nivetia and Mr. P. K. Gupta for their help in measuring birefringence at Swadeshi Polytex Ltd., Ghaziabad.
References
1. J. H. Dumbleton, J . Polym. Sci. Part A-2,7,667 (1969). 2. G. H. Groeninakx, H. Berghmans, and G. Smets, J. Polym. Sci. Part A-2, 14,591 (1976). 3. I. Eiko, K. Yamamoto, and Y. Kobayashi, Polymer, 19,39 (1978). 4. G. M. Bhatt and J. P. Bell, J . Polym. Sci. Part A-2 , 14,575 (1976). 5. R. Huismann and M. M. Heuvel, J . Appl. Polym. Sci., 22,943 (1978). 6. H. J. Biangardi and H. G. Zachmann, J . Polym. Sci., Part C , 58,169 (1977). 7. F. S. Smith and R. D. Steward, Polymer, 15,283 (1974). 8. J . E. Spruiell, D. E. McCord, and R. A. Beuerlein, Trans. SOC. Rheol., 16,535 (1972). 9. A. M. Hindeleh and D. J. Johnson, Polymer, 19,27 (1978).
10. S. Fakirov, E. W. Fischer, and G. F. Schmidt, Macromol. Chem. 176,2459 (1975). 11. D. C. Prevorsek, G. A. Tirpak, P. J. Harget, and A. C. Reimachuessel, J . Macromol. Sci. Phys.,
12. R. J. Samuels, Structured Polymer Properties, Wiley, New York, 1974. 13. W. 0. Statton, J. L. Koening, and M. Hannon, J . Appl. Phys., 41,4290 (1970). 14. W. 0. Statton, Synthetic fibres: structure and setting, in The Setting of Fibres and Fabrics,
J . W. S. Hearle and L. W. C. Miles, Eds., Merrow, London, 1971. 15. C. J. Heffelfinger and P. G. Schmidt, Proceedings of the 53rd National Meeting of American
Institute of Chemical Engineers, Pittsburgh, PA, May 17-20, 1964. 16. E. W. Fischer and S. Fakirov, J., Mater. Sci., 11,1041 (1976). 17. M. P. W. Wilson, Polymer, 15,277 (1974). 18. D. C. Prevorsek, R. H. Butler, I. D. Kwon, G. E. R. Lamb, and R. K. Sharma, Text . Res. J . ,
19. V. B. Gupta and S. Kumar, J . Polym. Sci. Polym. Phys. Ed., 17,1307 (1979). 20. G. Farrow and D. Preston, Br. J . Appl. Phys., 11,353 (1960). 21. V. B. Gupta and S. Kumar, Indian J . Text. Res., 1,72 (1976). 22. R. P. Daubeny and C. W. Bunn, Proc. R. SOC. London Ser. A,, 226,531 (1954). 23. V. B. Gupta and S. Kumar, J . Polym. Sci. Polym. Phys. Ed., 17,179 (1979). 24. G. M. Bhatt, J. P. Bell, and J. R. Knox, J . Polym. Sci. Part A-2, 14,373 (1976). 25. V. B. Gupta and S. Kumar, Polymer, 14,953 (1978).
9(4), 733 (1974).
47,107 (1977).
1876 GUPTA AND KUMAR
26. D. E. Bosley, J. Polyrn. Sci. Part C , 20,77 (1967). 27. V. B. Gupta and J. Amirtharaj, Text. Res. J . , 46,785 (1976).
Received December 14,1979 Accepted November 13,1980