Effect of drawing temperature on mesomorphic transitions of oriented poly(ethylene terephthalate)...
11
ORIGINAL PAPER Effect of drawing temperature on mesomorphic transitions of oriented poly(ethylene terephthalate) fibers exposed to supercritical CO 2 Somayeh Baseri & Mohammad Karimi & Mohammad Morshed & Mostafa Youssefi Received: 4 December 2010 / Accepted: 8 April 2011 / Published online: 3 May 2011 # Springer Science+Business Media B.V. 2011 Abstract Samples of partially oriented yarn (POY) PET fibers were uniaxially drawn at 23, 68 °C (cold drawing) and 100 °C (hot drawing) and then exposed to the supercritical carbon dioxide (scCO 2 ) without tension at a temperature of 80 °C and a pressure of 220 bar. The effect of drawing temperature on the evolution of mesomorphic phases and the structural changes under exposure to scCO 2 were investigated by differential scanning calorimetry (DSC), Fourier transform infrared (FTIR), and wide-angle X-ray diffraction. The orientation factor of the samples was measured using a polarizing microscope. A good correlation was obtained between the results of various analyses. The results illustrate that evolution of structure strongly depends on both process temperature and post-treatment by scCO 2 exposure. The latter process leads to plasticization and reduced glass transition temperature of the samples, thus inducing structural changes in the fibers. Keywords Poly(ethylene therephthalate) . Supercritical CO 2 . Drawing temperature . Mesomorphic transformation Introduction Poly(ethylene terephthalate) (PET) is one of the most commercially important thermoplastic materials that is mostly used as fibers and films of different levels of thickness and crystallinity and different degrees of orienta- tion in textiles and numerous other technical applications. PET has a high glass transition temperature and a slow chain dynamics, which allow its microstructure and final morphology to be easily controlled [1–3]. Application of PET in the form of fibers and films is based on the mechanical orientation of its macromolecular chains and its subsequent crystallization by annealing [4]. Mechanical deformation and thermal history may greatly change the degree of polymer orientation and its crystal- linity, as a result of which the internal morphology of PET changes and its mechanical and physical properties are improved [5–7]. Mechanical drawing of the amorphous PET can be carried out at temperatures below, near, or above its glass transition temperature involving uniaxial or multi-axial deformations which can have major effects on the final structure and properties of PET [1, 8–11]. As the control of polymer processing requires information about its structural formation, especially with regards to its orientation and crystallization, it will be interesting to know how the polymer structure changes during the drawing process. Lu et al. [6] found that PET presented a strain- induced crystallization at a critical degree of chain segment orientation and that its deformability was affected by the level of strain-induced crystallization. Gorlier et al. [12] reported that strain-induced crystallization began once a minimum strain had been achieved and that it was an incremental process possibly taking place over a number of intermediate stages or phases. They also found that the crystallization rate of PET was highly affected by its molecular orientation and that the total strain-induced microstructure remained sensitive to thermal treatment. Mahendrasingam et al. [13] studied the strain-induced crystallization process occurring at fast draw rates and S. Baseri : M. Morshed : M. Youssefi Department of Textile Engineering, Isfahan University of Technology, Isfahan 84156–83111, Iran M. Karimi (*) Department of Textile Engineering, Amirkabir University of Technology, Tehran( 15914, Iran e-mail: [email protected] J Polym Res (2011) 18:2033–2043 DOI 10.1007/s10965-011-9612-8
-
Upload
independent -
Category
Documents
-
view
1 -
download
0
Transcript of Effect of drawing temperature on mesomorphic transitions of oriented poly(ethylene terephthalate)...

ORIGINAL PAPER
Effect of drawing temperature on mesomorphic transitionsof oriented poly(ethylene terephthalate) fibers exposedto supercritical CO2
Somayeh Baseri & Mohammad Karimi &Mohammad Morshed & Mostafa Youssefi
Received: 4 December 2010 /Accepted: 8 April 2011 /Published online: 3 May 2011# Springer Science+Business Media B.V. 2011
Abstract Samples of partially oriented yarn (POY) PETfibers were uniaxially drawn at 23, 68 °C (cold drawing) and100 °C (hot drawing) and then exposed to the supercriticalcarbon dioxide (scCO2) without tension at a temperature of80 °C and a pressure of 220 bar. The effect of drawingtemperature on the evolution of mesomorphic phases and thestructural changes under exposure to scCO2 were investigatedby differential scanning calorimetry (DSC), Fourier transforminfrared (FTIR), and wide-angle X-ray diffraction. Theorientation factor of the samples was measured using apolarizing microscope. A good correlation was obtainedbetween the results of various analyses. The results illustratethat evolution of structure strongly depends on both processtemperature and post-treatment by scCO2 exposure. The latterprocess leads to plasticization and reduced glass transitiontemperature of the samples, thus inducing structural changesin the fibers.
Keywords Poly(ethylene therephthalate) . SupercriticalCO2
. Drawing temperature . Mesomorphic transformation
Introduction
Poly(ethylene terephthalate) (PET) is one of the mostcommercially important thermoplastic materials that is
mostly used as fibers and films of different levels ofthickness and crystallinity and different degrees of orienta-tion in textiles and numerous other technical applications.PET has a high glass transition temperature and a slowchain dynamics, which allow its microstructure and finalmorphology to be easily controlled [1–3].
Application of PET in the form of fibers and films isbased on the mechanical orientation of its macromolecularchains and its subsequent crystallization by annealing [4].Mechanical deformation and thermal history may greatlychange the degree of polymer orientation and its crystal-linity, as a result of which the internal morphology of PETchanges and its mechanical and physical properties areimproved [5–7]. Mechanical drawing of the amorphousPET can be carried out at temperatures below, near, orabove its glass transition temperature involving uniaxial ormulti-axial deformations which can have major effects onthe final structure and properties of PET [1, 8–11]. As thecontrol of polymer processing requires information aboutits structural formation, especially with regards to itsorientation and crystallization, it will be interesting to knowhow the polymer structure changes during the drawingprocess. Lu et al. [6] found that PET presented a strain-induced crystallization at a critical degree of chain segmentorientation and that its deformability was affected by thelevel of strain-induced crystallization. Gorlier et al. [12]reported that strain-induced crystallization began once aminimum strain had been achieved and that it was anincremental process possibly taking place over a number ofintermediate stages or phases. They also found that thecrystallization rate of PET was highly affected by itsmolecular orientation and that the total strain-inducedmicrostructure remained sensitive to thermal treatment.Mahendrasingam et al. [13] studied the strain-inducedcrystallization process occurring at fast draw rates and
S. Baseri :M. Morshed :M. YoussefiDepartment of Textile Engineering,Isfahan University of Technology,Isfahan 84156–83111, Iran
M. Karimi (*)Department of Textile Engineering,Amirkabir University of Technology,Tehran( 15914, Irane-mail: [email protected]
J Polym Res (2011) 18:2033–2043DOI 10.1007/s10965-011-9612-8
reported that crystallization rate was insensitive to drawtemperature. They also claimed that strain-induced crystal-lization is involved through the local segment reorientationin PET. Lu et al. [6] uniaxially drew PET films attemperatures below and above its glass transition temper-ature and reported that orientation and strain-inducedcrystallization increased with increasing draw ratio andelongation. They also found the two latter parameters todecrease when temperature rose to a range of 75–85 °C.This phenomenon was attributed to the relaxation ofmolecular chains that mainly occurred in the non-crystalline domain.
Drawing may affect macromolecular chains at differ-ent structural levels. Some of the most important factorsaffecting the final properties of PET are temperature,strain rate, elongation and molecular weight [6, 14]. PETcan be drawn at room temperature or at a temperature inthe vicinity of the glass transition temperature (Tg≈70 °C)in order to avoid crystallization (cold drawing). Colddrawing with the transition of the neck through thematerial can present a highly oriented structure exhibitingno crystalline order. This structure is commonly designatedas “mesophase”.
A number of researchers have investigated structuralchanges that occur with the mesophase formation as anintermediate stage [2, 7, 15–18]. Ran et al. [15] studied thestrain-induced crystallization in an amorphous PET filmand reported that the strain-induced crystallization occurredmainly in the mesophase. Keum et al. [16] proposed a two-stage crystallization process in oriented PET fibers, inwhich extraordinarily oriented chains in the mesophasewere responsible for the first stage of crystallization.
It is well known that oriented chains in the mesomorphicphase can be preserved stable at temperatures below theglass transition. This, however, depends on temperature andthe magnitude of internal stress. Mesomorphic phase ishighly unstable at temperatures above Tg and sensitive tothermal and mechanical loading. Under specific conditions,such processes as relaxation or crystallization may takeplace in the mesophase [17]. Crystallization of highlyoriented chains in the mesophase can be investigated boththermodynamically and kinetically [2]. From a thermody-namic viewpoint, the entropy of extraordinarily orientedchain conformation is lower than that of unoriented chainconformation. As a result, the highly oriented chains in thetransient structure have a less free energy barrier forprimary nucleation than the slightly ordered or non-ordered chains. From a kinetic viewpoint, the conformationof an oriented chain is closer to that of a crystal, thuspresenting a lower kinetic barrier to prevail compared to theslightly ordered or non-oriented chain. Consequently,crystallization develops first by the highly oriented chainsin the mesophase to be followed by the crystallization of
the remaining chains. Mahendrasingam et al. [7] studied thestrain-induced crystallization in PET films and observed notransient structure at draw temperatures above 90 °C (hotdrawing). It was reported that PET drawn below its glasstransition temperature exhibited a higher degree of molec-ular orientation than when hot drawn [18].
It should be emphasized that mechanical loading,thermal, and solvent treatments of PET fibers and filmsas well as their supercritical fluid exposure havesignificant effects on the structure of the fibers [3–5, 8–11, 19, 20]. ScCO2 has found several promising applica-tions in polymer processing and has been widely investi-gated [19, 21–23]. ScCO2 offers a number of advantagesover conventional techniques. For example, at temper-atures and pressures close to CO2 critical conditions, CO2
is soluble in many polymers. The solubility can beadjusted over a wide range by changing temperature andpressure [19]. ScCO2 has a strong plasticizing effect andits application for decreasing the glass transition temper-ature of various polymers has been vastly studied [19, 21–23]. The studies suggest that scCO2 increases crystalliza-tion rate, has a tremendous ability to induce morpholog-ical change, and enhances crystallinity without adverseenvironmental effects.
A thorough knowledge of the structural changes inducedby scCO2 is essential for designing polymer processes. Asmentioned earlier, a vast number of studies are reported inthe literature on the transient structures in oriented PETmaterials [15–17]. However, no in-depth study has beenreported on the influence of scCO2 on the mesomorphictransitions in oriented PET fibers. While exposure of fibersto scCO2 allows for tailoring desirable structural changes inthem without any environmental hazards, improvement oftheir ultimate properties can only be achieved by exactlyknowing the mechanism of microstructure development andthe mesomorphic transitions in the oriented PET fibersexposed to scCO2. The present study aims to investigate thestructural changes that take place in POY PET fibers drawnat temperatures above, below, and equal to its glasstransition temperature followed by exposure to scCO2. Itis also the aim of this study to investigate for the firsttime the role of mesomorphic transitions in the develop-ment of crystalline phase by studying the structuralchanges induced by scCO2. For this purpose, samples ofpartially oriented yarn (POY) PET fibers are uniaxiallydrawn at temperatures below, near, and above the glasstransition temperature at a constant draw ratio and thenexposed to scCO2. Differential scanning calorimetry(DSC), Fourrier transform infrared spectroscopy (FTIR),X-ray diffraction (XRD), and birefringence measurementsare used to investigate the effects of drawing temperatureand scCO2 exposure on the evolution of mesomorphicphase and structural changes.
2034 S. Baseri et al.

Experimental
Materials
Samples of partially oriented yarn (POY) of PET fiberswith an average diameter of 23 μm were supplied by theZagros Co., Iran. The samples were uniaxially drawn at23 °C and 28% relative humidity at several differenttemperatures below, above, and near Tg (i.e., 23, 68, and100 °C) at a draw ratio of 1.8 on the Zinser-drawn-twistingmachine 520–2. The samples thus drawn were labeled asDT23, DT68, and DT100, respectively.
Treatment with scCO2
Exposure of the fibers to scCO2 and depressurization werecarried out in a pilot–scale SFE system (101–300 AF (M);SITEC-Sieber Engineering, Switzerland). For the experi-ments, the samples were then loaded into the cell via acartridge that allowed the samples to shrink freely but notto fly inside the cell. All the samples were exposed toscCO2 at 80 °C and 220 bars for 2.5 h. These exposedsamples were labeled by EDT23, EDT68 and EDT100,respectively. To avoid a solid state foaming process, thepressure was reduced isothermally at a constant rate toatmospheric pressure over a period of 2.5 h. The specifi-cations of the samples are presented in Table 1.
Characterization
Differential scanning calorimetry
To investigate the structural changes of the exposed fibers,a TA Instrument DSC 2010 was applied to determine thethermal characteristics of structures. For this purpose,samples with the same weight (4.5 mg) were heated from0 °C to 350 °C at a heating rate of 10 °C/min undernitrogen atmosphere.
Fourier transform infrared
Changes in conformation of the polymer chainsinduced by drawing and scCO2 treatment were studied
by Fourier transform infrared (FTIR). FTIR measure-ments were carried out in absorption mode using aNICOLET Nexus 670 with a resolution of 4 cm−1. Anaverage of 40 scans was accumulated for each spectrum.The absorption bands in FTIR spectra were analyzed byOmnic software.
Birefringence measurements and orientation factor
The overall orientation of the samples was measured bybirefringence measurements at room temperature using aZeiss polarizing microscope equipped with a 30th ordertilting compensator. The orientation factor (f0) of thesamples was determined using the following equation:
fO ¼ Δn
Δn0að1Þ
where, Δn is the measured birefringence of the samples andΔn0a is the intrinsic birefringence of the amorphous phasethat is proposed to be 0.20 for PET fibers [24].
Wide-angle X-ray diffraction
Wide-angle X-ray diffraction patterns were determinedusing a Philips X-ray diffractometer model Xpert MPDwith CuKα radiation. The CuKα radiation operated at40 kV amd 40 mA. The scattering intensities were recordedevery 0.02°/s in the range of 2θ=1–50°. To analyze the X-ray scattering intensity distribution of the sample, it isnecessary to separate crystalline scattering from theamorphous one. For this purpose the scattering curves wereanalyzed by curve-fitting procedures using commercialsoftware PEAKFIT™.
Results and discussion
Thermal analysis
Figure 1 shows the region of cold crystallization for theunexposed PET fibers as compared with the POY samples.These fibers were drawn at different temperatures.
Samples Draw ratio Drawing temperature Exposure to scCO2
DT23 1.8 23 °C No
DT68 1.8 68 °C No
DT100 1.8 100 °C No
EDT23 1.8 23 °C Yes
EDT68 1.8 68 °C Yes
EDT100 1.8 100 °C Yes
Table 1 Specifications of thesamples
Effect of drawing temperature on mesomorphic transitions 2035

As seen, a significant cold-crystallization and glasstransition region appeared for POY fibers, while the othercases did not show any such regions. A broad crystalliza-tion region is assigned for the drawn PET samples, whichhas been referred to as intermediate structures in theliterature [25]. Since development of the transient meso-phase structure strongly depends on process temperature,the broader exothermic peaks with a lower onset temper-ature for the samples drawn at a temperature above theglass transition compared to those of the samples drawn attemperatures below or near the glass transition indicate adifferent state of intermediate structures.
The structure of PET fibers is prone to change whenexposed to scCO2. As seen in Fig. 1, the region of coldcrystallization broadens but its area decreases with increas-ing temperature of the drawing process. Another importantpoint to note in Fig. 1 is the temperature of coldcrystallization which shifts to lower temperatures whenthe sample is exposed to scCO2. This can be explained bythe fact that penetration of CO2 into PET fibers leads toincreased mobility of the chain segments followed byswelling of the samples, which initiates a rearrangement ofmolecular chains in the structure. This is the reason whycrystallization may take place and why it may be con-strained under scCO2 exposure.
Figure 1 also shows that a second melting peak appearsat about 135 °C for the PET fibers exposed to scCO2,which is a rather low melting temperature compared to thecrystalline melting temperature of PET. It can, therefore, beclaimed that the effect of exposure to scCO2 is twofold: amesomorphic transition in the oriented PET fibers and asecond melting peak at around 135 °C. This second meltingpeak is probably due to the melting of thin crystallitesgenerated by contribution of both the rigid amorphousregion (so-called mesomorphic phase) and the less orderedor non-ordered amorphous region (so-called unorientedamorphous phase). Consequently, the PET fibers drawn atdifferent temperatures and exposed to scCO2 have twoendothermic peaks in the DSC curves. The first one, at atemperature range of 220–270 °C, is related to themelting of the primary crystals developed during themelting process, post-heat-treatment, and scCO2 expo-sure. The second one is due to the melting of secondarycrystals, thinner than primary crystals, formed underscCO2 exposure.
Table 2 shows the enthalpy of fusion for the secondmelting peak. It is clear that the enthalpy of fusiondecreases as drawing temperature increases. This can beexplained by the fact that the degree of molecularorientation in the amorphous region and the volume of theextended chains in both the rigid amorphous and unorientedamorphous phases are responsible for creating the new thincrystals. It can, therefore, be said that the amount of thincrystalline phase depends on the volume of the rigidamorphous phase formed during the drawing process. Asthe drawing temperature decreases, more transient struc-tures are formed in the samples. This result is consistentwith those reported in the literature [7, 18].
Figure 2 shows the melting peaks of unexposed PETfibers drawn at different temperatures compared withthose of the POY samples. Evidently, a broad meltingpeak is observed for POY fibers which changes to asemi-bimodal shape for the DT23 and DT68 samples. Anarrow melting peak is observed for DT100. The semi-bimodal distribution of the melting peak is related to twokinds of crystal thickness developed during the processof drawing at temperatures below or near the glasstransition temperature. Crystals with a low melting
Fig. 1 DSC curves for PET fibers drawn at different temperaturesbefore and after exposure to scCO2
Table 2 Thermal parameters obtained by DSC curves of PET fibers
Samples POY DT23 DT68 DT100 EPOY EDT23 EDT68 EDT100
Heat of cold crystallization (ΔHC) (J/g) 25.30 15.55 21.47 13.57 4.648 6.615 2.713 2.039
Fusion heat of imperfect crystallite (ΔHf1) (J/g) – – – – 4.901 4.280 3.823 3.050
Fusion heat of Perfect crystallite (ΔHf2) (J/g) 47.23 55.30 52.88 58.98 34.60 55.69 54.24 48.53
Crystallinity (%) 15.65 28.37 22.42 32.41 24.87 38.08 39.50 35.36
2036 S. Baseri et al.

temperature can be grown in the direction of thickness ifthere is enough heat energy to allow chain mobility as isobserved at a temperature of 100 °C.
Considering cold crystallization occurring with increas-ing temperature in the DSC measurement [26], the degreeof crystallinity can be calculated from the followingequation:
XC ¼ ΔHf �ΔHC
ΔH0f
� 100 ð2Þ
Where, XC is crystallinity percentage, ΔHf is theenthalpy of fusion, ΔH0
f is the enthalpy of fusion of100% crystalline PET (ΔH0
f ¼ 140:1 J=g) [3], and ΔHC isthe enthalpy of cold-crystallization observed during theheating process. The results are summarized in Table 2.
As seen in Table 2, the degree of crystallinity for PETfibers does not proportionally increase with increasingtemperature of the drawing process; indeed, the highestvalue is obtained at a temperature of 100 °C while thelowest is observed at a temperature of 68 °C which is nearthe glass transition temperature. Table 2 also shows that theDT23 sample has a higher value of crystallinity than doesthe DT68 sample. It seems that two crystallizationmechanisms, i.e. strain-induced and thermal-induced crys-tallization, are involved that are frequently used to explainthe structural changes during fiber deformation. The formermainly occurs in PET fibers drawn at temperatures belowTg. It is suggested that as the drawing temperatureincreases, the mobility of molecular chains in the amor-phous region increases so that the strain-induced crystalli-zation is of less effect on structural changes. As the drawingtemperature nears that of Tg, the enhanced mobility of thepolymer chains will be too high to reduce the effectivenessof stress in orienting the chains and both crystallizationmechanisms will thus have minimum effects on the
structural changes. As the drawing temperature increasesto above Tg, the role of strain-induced crystallization in thestructural changes diminishes and only thermal-inducedcrystallization prevails.
Figure 3 shows the melting region of the exposed PETfibers in the DSC thermogram. It is seen that a melting peakwith two shoulders on both sides appears for both theEDT23 and EDT68 samples. The appearance of this triplemelting peak is relatively similar in both samples. However,both shoulders have disappeared and a single melting peakhas appeared in the thermogram in the case of EDT100,verifying a simple distribution of crystals developed in thestructure.
Here the following equation was used for calculatingdegree of crystallinity:
XC ¼ ΔHf 1 þΔHf 2 �ΔHC
ΔH0f
� 100 ð3Þ
Where, ΔHf1 and ΔHf2 are measured enthalpies offusion for the thin crystalline and perfect crystallineregions, respectively. The other parameters are similar tothose in Eq. (2). The results are presented in Table 2.
It is concluded from Table 2 that exposure to scCO2
significantly increases the degree of crystallinity in PETfibers drawn at 23 and 68 °C while only a slight increase incrystallinity is observed in those drawn at 100 °C. Asmentioned earlier, no transient structure has been observedin samples drawn at temperatures higher than 90 °C [7].However, PET fibers drawn at temperatures below theglass transition temperature, i.e. 23 and 68 °C (colddrawn PET fibers), have been found to obtain a transientstructure with mesophasic order acting as a precursor tocrystallization [2, 16]. Depending on sample conditions(with or without tension), either relaxation or crystalliza-tion may occur in samples since exposure to scCO2 greatly
Fig. 3 Melting peaks in DSC curves for the PET fibers drawn atdifferent temperatures followed by exposure to scCO2
Fig. 2 Melting peaks in DSC curves for PET fibers drawn at differenttemperatures and POY samples
Effect of drawing temperature on mesomorphic transitions 2037
decreases their glass transition temperature and alsobecause the transient structure becomes highly unstableabove Tg. For the conditions used in our experiments,exposing the cold drawn samples to scCO2 led to two-stage crystallization.
1. Some of the oriented chains in the mesophase first causedcrystallization to take place while the remaining meso-phase transformed into an unoriented amorphous phase.
2. The unoriented amorphous phase then was crystallizedin a later stage.
The above results suggest that exposure to scCO2
had a strong effect on the transformation of themesophase structure into a crystalline phase in the caseof cold drawn samples (EDT23 and EDT68) while ithad no effect in the case of the hot drawn sample(EDT100).
Orientation factor
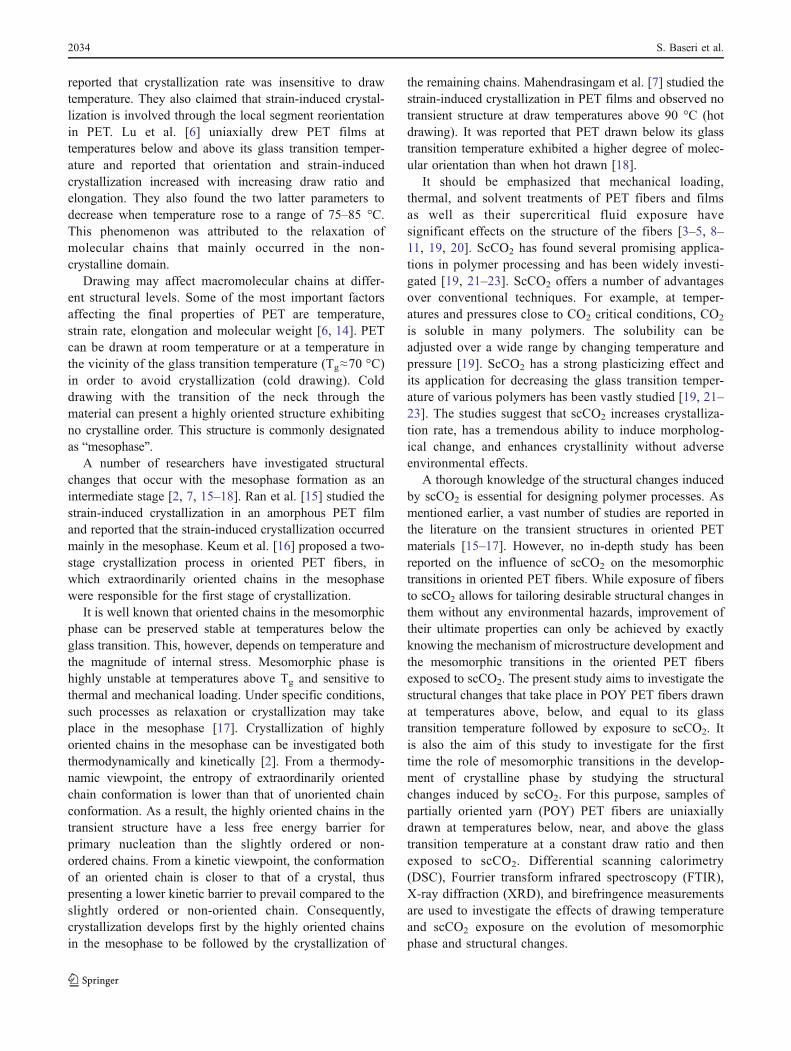
The birefringence and orientation factors of the unexposedand exposed PET fibers are listed in Table 3.
As observed for degree of crystallinity as a functionof drawing temperature, it is evident from Table 3 thatthe DT68 sample has lower values of birefringence andorientation factor than the DT23 and DT100 samples do.Indeed, increasing temperature from 23 °C to 68 °C priorto exposure leads to slight decreases in the degree oforientation and crystallinity. Hence, it may be claimedthat increasing the drawing temperature leads to anincrease in both the mobility of chain segments and therelaxation rate of molecular chains. This will, conse-quently, decrease the effective stress required to orientthe chains for the crystallization process to proceed. Onthe other hand, drawing at temperatures above the glasstransition temperature (100 °C) improves orientation todevelop crystalline domains which act as cross-links inthe non-crystalline region and hinder the relaxation ofmacromolecule chains.
Exposure to scCO2 causes PET fibers to shrink, aprocess which depends on the drawing temperature. Asseen in Table 3, the birefringence and orientation factors ofthe oriented PET fibers decreased as a result of exposure toscCO2. In the case of oriented chains without tension, if the
bonding between chains breaks as a result of heat or solventtreatment, macromolecular chains will shrink and transforminto an amorphous phase [27]. It may then be said thatexposure to scCO2 of oriented PET fibers without tensionleads to a reduction in the total orientation of themacromolecular chains, a situation which is characterizedby decreasing values of birefringence and orientation factor.
FTIR investigation
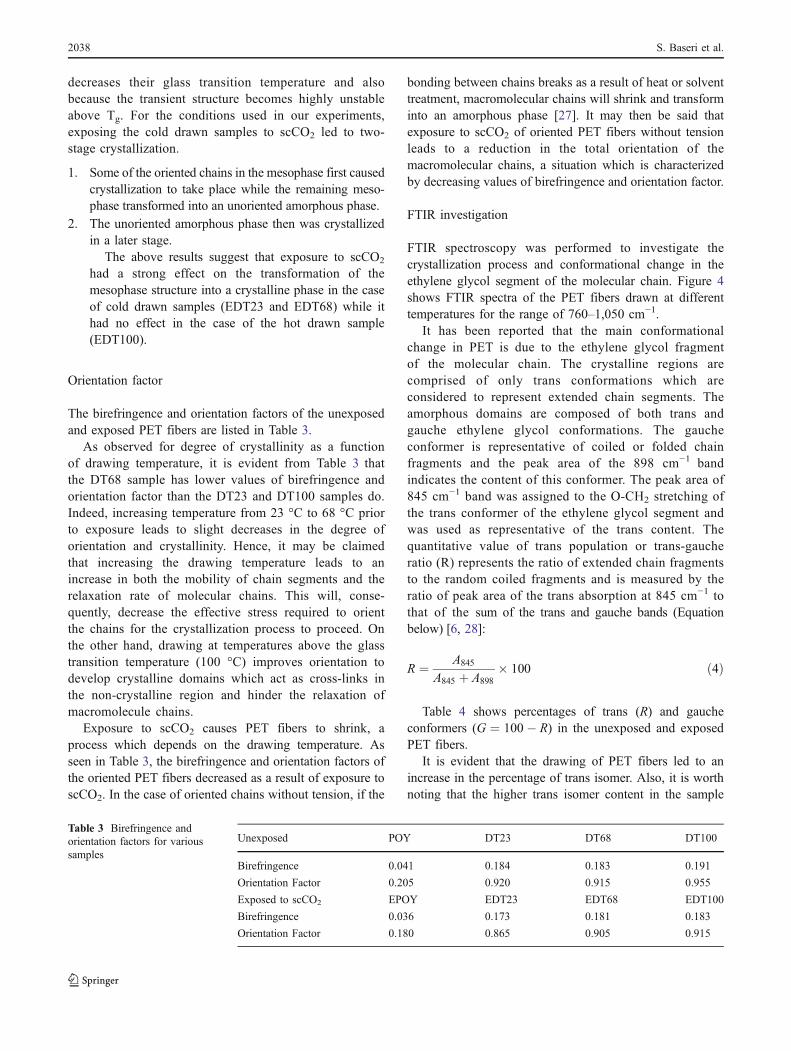
FTIR spectroscopy was performed to investigate thecrystallization process and conformational change in theethylene glycol segment of the molecular chain. Figure 4shows FTIR spectra of the PET fibers drawn at differenttemperatures for the range of 760–1,050 cm−1.
It has been reported that the main conformationalchange in PET is due to the ethylene glycol fragmentof the molecular chain. The crystalline regions arecomprised of only trans conformations which areconsidered to represent extended chain segments. Theamorphous domains are composed of both trans andgauche ethylene glycol conformations. The gaucheconformer is representative of coiled or folded chainfragments and the peak area of the 898 cm−1 bandindicates the content of this conformer. The peak area of845 cm−1 band was assigned to the O-CH2 stretching ofthe trans conformer of the ethylene glycol segment andwas used as representative of the trans content. Thequantitative value of trans population or trans-gaucheratio (R) represents the ratio of extended chain fragmentsto the random coiled fragments and is measured by theratio of peak area of the trans absorption at 845 cm−1 tothat of the sum of the trans and gauche bands (Equationbelow) [6, 28]:
R ¼ A845
A845 þ A898� 100 ð4Þ
Table 4 shows percentages of trans (R) and gaucheconformers (G ¼ 100� R) in the unexposed and exposedPET fibers.
It is evident that the drawing of PET fibers led to anincrease in the percentage of trans isomer. Also, it is worthnoting that the higher trans isomer content in the sample
Unexposed POY DT23 DT68 DT100
Birefringence 0.041 0.184 0.183 0.191
Orientation Factor 0.205 0.920 0.915 0.955
Exposed to scCO2 EPOY EDT23 EDT68 EDT100
Birefringence 0.036 0.173 0.181 0.183
Orientation Factor 0.180 0.865 0.905 0.915
Table 3 Birefringence andorientation factors for varioussamples
2038 S. Baseri et al.

drawn at 23 °C compared to that in the sample drawn at68 °C is a consequence of different states of intermediatestructures. An increase in the trans isomer content corre-sponds to an increase in the degree of crystallinity and thequantity of extended macromolecule chains in both therigid and unoriented amorphous phases. These results areconsistent with those observed in the DSC analysis,showing that more crystallites are formed in fibers drawnat a temperature above the glass transition temperature. Inthe case of samples drawn at a temperature below the glasstransition temperature, the DT23 sample exhibits moreextended macromolecule chains in the amorphous phasesthan the DT68 sample does, indicating more intermediatestructures in DT23 than in DT68 under identical conditions.The development of transient mesophase structure must,therefore, strongly depend on the process temperature.Similar investigations have been made by Geil [17] andMahendrasingam [7] who reported that, for an identicaldraw ratio, PET fibers drawn at 23 °C were significantlymore oriented than those drawn at 68 °C. They observed notransient structures at draw temperatures higher than 90 °C.So, it can be maintained that crystallization is responsiblefor the increasing percentage of trans isomers when samplesare drawn at a temperature above the glass transitiontemperature but for temperatures below or near Tg, thedevelopment of the transient mesophase structure isresponsible for the increase in the trans isomer content.
Figure 5 shows FTIR spectra of the PET fibers drawn atdifferent temperatures and exposed to scCO2 for the rangeof 760–1,050 cm−1.
It is evident from Table 4 that the trans-gauche ratio (R)increased by exposing the oriented PET fibers to scCO2. Asalready mentioned an increase in the trans-gauche ratio isrelated to the increases in the degree of crystallinity andextended macromolecule chains in both rigid and unor-iented amorphous phases. Consequently, by exposing theoriented PET fibers to scCO2, more crystallites are formedin the samples and a part of the unoriented amorphousphase transforms into extended macromolecule chains inthe mesophase. This result is consistent with that observedin DSC analysis, indicating structural changes in theexposed oriented PET samples.
WAXD analysis
The X-ray diffraction patterns were measured for theunexposed and exposed samples. The results are presentedin Fig. 6a and b, respectively.
Figure 6a shows that no resolved peaks can beobserved in the equatorial scans of unexposed samples.Only a broad halo pattern derived from the amorphouschain interactions is detected in the WAXD spectra for theunexposed POY sample. This indicates that the samplemay have a very low value of crystallinity which could notbe detected in X-ray measurements. In the oriented PETsamples drawing at temperature of 23, 68, and 100 °C(DT23, DT68, and DT100), the same diffraction patternswere obtained as seen for POY sample (Fig. 6a), whereasan increasing in the crystallinity of the drawn sampleswere detected by DSC measurements. We think thisindicates that drawing PET fibers leads to an increase inthe oriented chain segments with a wide distribution ofvarious inter lamella spaces in the amorphous domains.This implies that drawing PET samples can densify thepacking of extended chains in the amorphous regions,suggesting a progressive improvement of the crystallinestructure. Therefore it is expected a wide distribution ofposition of scattering planes at which no resolved peaksare observed in the equatorial scans of these samples. As aresult, it did not permit us to take quantitative analysisfrom X-ray scattering of the unexposed samples. In
Fig. 4 FTIR spectra of POY and PET fibers drawn at differenttemperatures
Unexposed POY DT23 DT68 DT100
R 42.45 60.57 54.47 68.35
G 57.55 39.43 45.52 31.65
Exposed to scCO2 EPOY EDT23 EDT68 EDT100
R 55.36 75.92 78.79 77.88
G 44.64 24.08 21.20 22.12
Table 4 Percentages of transand gauche configurations inunexposed and exposed PETfibers
Effect of drawing temperature on mesomorphic transitions 2039
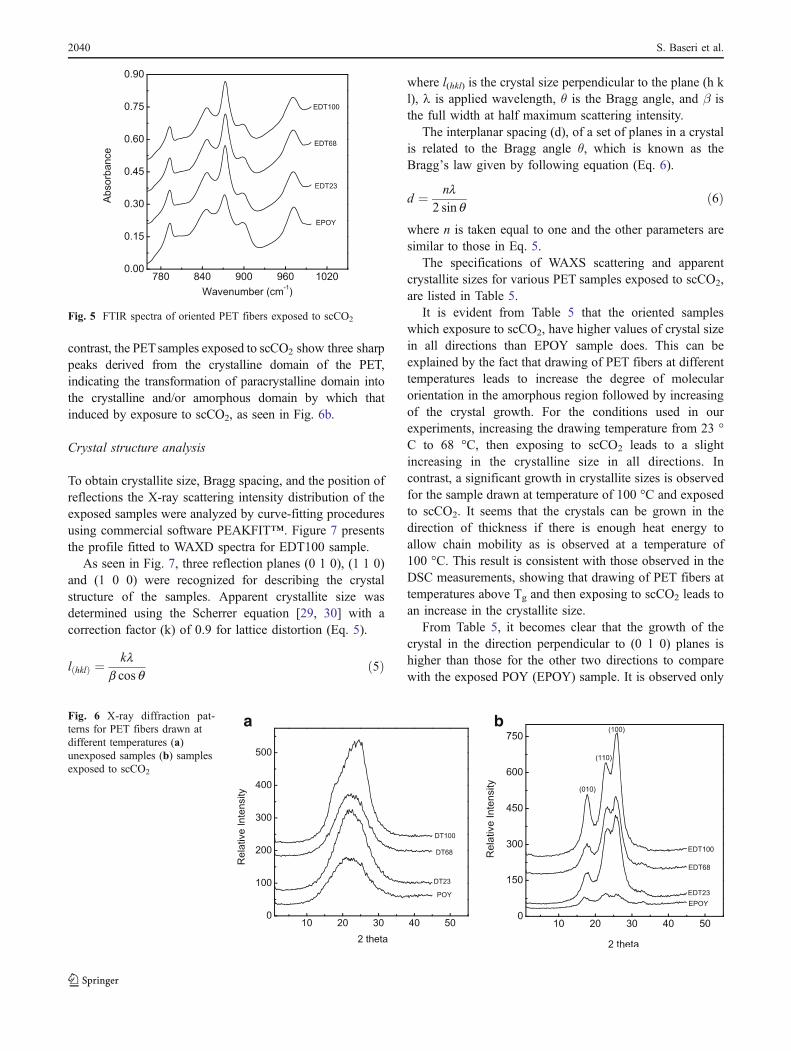
contrast, the PETsamples exposed to scCO2 show three sharppeaks derived from the crystalline domain of the PET,indicating the transformation of paracrystalline domain intothe crystalline and/or amorphous domain by which thatinduced by exposure to scCO2, as seen in Fig. 6b.
Crystal structure analysis
To obtain crystallite size, Bragg spacing, and the position ofreflections the X-ray scattering intensity distribution of theexposed samples were analyzed by curve-fitting proceduresusing commercial software PEAKFIT™. Figure 7 presentsthe profile fitted to WAXD spectra for EDT100 sample.
As seen in Fig. 7, three reflection planes (0 1 0), (1 1 0)and (1 0 0) were recognized for describing the crystalstructure of the samples. Apparent crystallite size wasdetermined using the Scherrer equation [29, 30] with acorrection factor (k) of 0.9 for lattice distortion (Eq. 5).
lðhklÞ ¼ klb cos q
ð5Þ
where l(hkl) is the crystal size perpendicular to the plane (h kl), 1 is applied wavelength, θ is the Bragg angle, and β isthe full width at half maximum scattering intensity.
The interplanar spacing (d), of a set of planes in a crystalis related to the Bragg angle θ, which is known as theBragg’s law given by following equation (Eq. 6).
d ¼ nl2 sin q
ð6Þ
where n is taken equal to one and the other parameters aresimilar to those in Eq. 5.
The specifications of WAXS scattering and apparentcrystallite sizes for various PET samples exposed to scCO2,are listed in Table 5.
It is evident from Table 5 that the oriented sampleswhich exposure to scCO2, have higher values of crystal sizein all directions than EPOY sample does. This can beexplained by the fact that drawing of PET fibers at differenttemperatures leads to increase the degree of molecularorientation in the amorphous region followed by increasingof the crystal growth. For the conditions used in ourexperiments, increasing the drawing temperature from 23 °C to 68 °C, then exposing to scCO2 leads to a slightincreasing in the crystalline size in all directions. Incontrast, a significant growth in crystallite sizes is observedfor the sample drawn at temperature of 100 °C and exposedto scCO2. It seems that the crystals can be grown in thedirection of thickness if there is enough heat energy toallow chain mobility as is observed at a temperature of100 °C. This result is consistent with those observed in theDSC measurements, showing that drawing of PET fibers attemperatures above Tg and then exposing to scCO2 leads toan increase in the crystallite size.
From Table 5, it becomes clear that the growth of thecrystal in the direction perpendicular to (0 1 0) planes ishigher than those for the other two directions to comparewith the exposed POY (EPOY) sample. It is observed only
Fig. 5 FTIR spectra of oriented PET fibers exposed to scCO2
a bFig. 6 X-ray diffraction pat-terns for PET fibers drawn atdifferent temperatures (a)unexposed samples (b) samplesexposed to scCO2
2040 S. Baseri et al.

for EDT100 sample. This can be explained by the fact thatthe interactions between molecules of PET are different invarious directions. Indeed, it was reported that the strongdipole-dipole interactions between adjacent ester groupsworking along the b-axis, while the relatively weakinteraction between the aromatic π—electrons acting inthe a-direction [31].
In consequence, it may be claimed that when orientedPET fibers are exposed to scCO2, CO2 molecules areabsorbed into the amorphous phase in the samples.Dissolved CO2 molecules act like a molecular lubricant todecrease the glass transition temperature of the sample. Asa result, molecular rearrangement in the amorphousdomains takes place because of increasing the segmentalmotion, at which it does with lower free energies into themore ordered conformations domains.
Determination of crystallinity
The crystallinity of polymers, Xcr, is traditionallydefined in terms of its total mass, M, and the respectivemasses of the crystalline and amorphous regions, Mcr andMam, by
xcr ¼ Mcr
M;where M ¼ Mcr þMam ð7Þ
It can be obtained by differentiating between crystal-line and amorphous scattering in coherent scattering. Butit has been recognized that the crystallinity valueobtained in this way are suspect, depending as one doupon how the amorphous scattering curve is drawn. Inthis respect, we used the crystallinity determination byapplication of the paracrystal theory. It does take intoaccount formally the structural distortion that is acharacteristic feature of high polymers. This is animportant method of paracrystal analysis which isproposed by Ruland and Kilian [29], giving the distortionfactor as well as an estimate of the crystallinity. Thescattering energy of the coherent X-ray scattered over allspace by the sample is expressed by the followingequation.
Z 1
0b2IðbÞdb ¼
Z 1
0b2 < f 2 > db ð8Þ
b ¼ 2 sin ql
ð9Þ
Fig. 7 Specifications of the WAXD scattering for various PETsamples exposed to scCO2
Samples Reflections index Crystalline reflections
(0 1 0) (1 1 0) (1 0 0)
EPOY 2θ (degrees) 17.00 22.60 26.10
Intensity (a.u) 47.61 62.41 59.29
Interplanar spacing (°A) 5.21 3.93 3.41
Crystallite size (°A) 22.953 33.206 22.163
EDT23 2θ (degrees) 17.40 23.10 26.00
Intensity (a.u) 132.25 313.29 368.64
Interplanar spacing (°A) 5.09 3.85 3.42
Crystallite size (°A) 25.928 35.258 26.304
EDT68 2θ (degrees) 17.50 23.10 26.00
Intensity (a.u) 132.24 282.24 324.00
Interplanar spacing (°A) 5.06 3.85 3.42
Crystallite size (°A) 25.043 37.199 27.090
EDT100 2θ (degrees) 17.60 22.96 25.93
Intensity (a.u) 262.44 396.01 524.41
Interplanar spacing (°A) 5.03 3.87 3.43
Crystallite size (°A) 34.067 38.791 31.973
Table 5 Specifications of theWAXD scattering and apparentcrystallite sizes for various PETsamples exposed to scCO2
Effect of drawing temperature on mesomorphic transitions 2041

< f 2 >¼P
nj fj2P
njð10Þ
where fj is the scattering factor of the atom j, nj is thenumber of atoms j in the unit cell, and < f 2 > is the meanscattering intensity of the atoms.
For the crystalline regions, the portion of scattering isZ 1
0b2IcrðbÞdb ¼ xcr:
Z 1
0b2 < f 2 > Dt
2db ð11Þ
D2t in Eq. 11 is a distortion factor, which is expressed
by exp(-Bb2), where B is a coefficient depending on thestructure. Well-describe of the method have been givenby Kakudo and Kasai [29]. From Eqs. 8 and 11 weobtain
xcr ¼R b2b1
b2IcrdbR b2b1
b2Idb:
R b2b1
b2 < f 2 > dbR b2b1
b2 < f 2 > Dt2db
¼ x0cr:K ð12Þ
x0cr ¼R b2b1
b2IcrdbR b2b1
b2Idbð13Þ
Kðb1; b2;Dt2; < f 2 >Þ ¼
R b2b1
b2 < f 2 > dbR b2b1
b2 < f 2 > Dt2db
ð14Þ
Figure 8 shows the b2.I(b)-b curve obtained from thediffraction intensity distribution of EDT100 sample. Thebroken line is the curve joining the minima between thecrystalline diffractions. Above this curve is crystallinecontribution (
Rb2:IcrðbÞdb). Various range of integration
was applied to create a set of x0cr. Since the crystallinity (xcr)is independent of the integration limits, various value of Bwere chosen to produced different K values (Eq. 14). Thisis used to find the value of K such that xcr is constant andindependent of the integration range b1 ~ b2. A similarresolving procedure was applied for all exposed samples.The results are shown in Table 6.
As seen in Table 6, the estimated amount of crystal-linity of the exposed samples is relatively similar to thoseof value obtained from DSC measurements (Table 2). Theslight discrepancy between the results obtained fromquantitative measurements of crystallinities could beexplained by several limitations belong into the crystal-lography of high polymer such as defining the universalunit cell parameters [17], difficulty of finding the realbackground and amorphous halo [31], and etc. Thisdiscrepancy between the results of crystallinities fromvarious characterization techniques has also been previ-ously reported [22, 31, 32].
According to the portion of crystallinity and theamorphity, the portion of paracrystallinity (mesophase)is extracted and then listed in Table 6. As seen, thepercentage of amorphity and paracrystallinity is similarin EDT23 and EDT68 samples. So, a significant point isthat a relatively similar crystalline structure develops inthe samples drawing at the temperature of 23 and 68 °Cwhen they are exposed to scCO2. Besides, more transientstructure has been remained into these samples tocompare with the other samples. However, a loweramount of transient structure is observed in the sampledrawn at temperature of 100 °C when it is exposed toscCO2 in while no transient structures are observed byMahendrasingam and et al., at draw temperatures higherthan 90 °C [7]. Hence, it can be claimed that by exposingDT100 sample to scCO2, a part of the unorientedamorphous phase transforms into the extended chains inthe mesophase domain. This result is consistent with thatobserved in FTIR analysis. The above results can confirmthe hypothesis that exposure to scCO2 leads to structuralchanges in the materials.
Fig. 8 Diffraction intensity distribution (b2 I(b)) vs. b for EDT100sample
Samples EPOY EDT23 EDT68 EDT100
Percentage of crystallinity (%) 27 33 33 38
Percentage of amorphity (%) 59 43 43 44
Percentage of paracrystallinity (%) 14 24 24 18
Table 6 Relative percentage ofcrystalline, paracrystalline andamorphous domains in theexposed PET samples
2042 S. Baseri et al.
Conclusions
We have investigated structural changes of PET fibersdrawn at different temperatures and then exposed to scCO2.By drawing PET fibers at different temperatures, a broadcrystallization peak appeared where no significant coldcrystallization and glass transition peaks were observed inDSC thermographs. Development of a transient mesophasestructure was shown to strongly depend on the processtemperature. The results showed that exothermic peakswere smaller for samples drawn at temperatures above theglass transition temperature than for those drawn attemperatures below or near the glass transition. This is anindication of different states of intermediate structures. Itmay be concluded that exposure of oriented PET samples toscCO2 leads to the following results:
1. CO2 molecules are absorbed into the amorphous phase ofthe fibers where they reduce the inter-chain interactionsand act like a molecular lubricant to causes swelling ofthe samples. Thus, they can plasticize the samples andinduce crystallization at lower temperatures. This, in turn,leads to decreases in the values of birefringence andorientation factor of the samples without tension.
2. When exposing the samples to scCO2, not only aremesomorphic transitions observed in PET fibers, butalso a second melting peak appears at a temperaturenear 135 0C which causes its fusion enthalpy todecrease as the temperature of drawing increases.
3. For the cold drawn and scCO2 exposed samples(EDT23 and EDT68), the transformation of themesophase structure into the crystalline phase isstrongly affected by exposure to scCO2, while thiseffect is negligible for the hot drawn sample (EDT100).
4. The structural changes in the exposed PET fibers areconfirmed by the shaper diffraction patterns in the X-ray diffraction diagram for these samples compared tounexposed ones.
5. A relatively similar crystalline structure develops in thesamples drawing at the temperature of 23 and 68 °C whenthey are exposed to scCO2. This is clarify when theparacrystalline portion (mesophase domain) of exposedsamples were estimated by considering the latticedistortion factor as suggested by paracrystal theory.
6. Exposure to scCO2 gives rise to such structural changesas crystallization, orientation, and mesomorphic tran-sitions. Hence, this method is promising for tailoringstructural changes in PET materials.
Acknowledgements The authors wish to acknowledge IsfahanUniversity of Technology, Semnan University, and Amirkabir Uni-versity of Technology for their financial support of this work.
References
1. Rastogl R, Vellinga WP, Rastogl S, Schick C, Meijer HEH (2004)J Polym Sci, B, Polym Phys 42:2092
2. Keum JK, Jeon HJ, Song HH, Choi JI, Son YK (2008) Polymer49:4882
3. Ajji A, Chapleau N (2002) J Mater Sci 37:38934. Fischer EW, Fakirov S (1976) J Mater Sci 11:10415. Ren M, Zhang Z, Wu S, Wei J, Xiao C (2006) J Polym Res 13:96. Lu XF, Hay JN (2001) Polymer 42:80557. Mahendrasingam A, Martin C, Fuller W, Blundell DJ, Oldman RJ,
MacKerron DH, Harvie JL, Riekel C (2000) Polymer 41:12178. Kawakami D, Hsiao BS, Ran Sh, Burger Ch FuB, Sics I, Chu B,
Kikutani T (2004) Polymer 45:9059. Saunders LS, Ward IM, Cail JI, Stepto RFT (2007) Polymer
48:136010. Rao IJ (2003) Int J Non Linear Mech 38:66311. Mahendrasingam A, Blundell DJ, Martin C, Fuller W, Mackerron
DH, Harvie JL, Oldman RJ, Riekel C (2000) Polymer 41:780312. Gorlier E, Haudin JM, Billon N (2001) Polymer 42:954113. Mahendrasingam A, Martin C, Fuller W, Blundell DJ, Oldman RJ,
Harvie JL, MacKerron DH, Riekel C, Engstrom P (1999) Polymer40:5553
14. Fernandez JO, Swallowe GM (2000) J Mater Sci 35:440515. Ran Sh, Wang Zh, Burger Ch, Chu B, Hsiao BS (2002)
Macromolecules 35:1010216. Keum JK, Kim J, Lee SM, Song HH, Son YK, Choi JI, Im SS
(2003) Macromolecules 36:987317. Geil PH (2002) Structure development and mechanical behavior
during unaxial drawing of PET. In: Fakirov S (ed) Handbook ofthermoplastic polyesters, vol 1. Wiley-VCH, Weinheim, p 105
18. Uchiyama T, Suyama M, Alam MM, Asano T, Henning S, FloresA, Balta Calleja FJ, Mina MF (2007) Polymer 48:542
19. Hobbs T, Lesser AJ (2000) Polymer 41:622320. Keating MY, Malone LB, Saunders WD (2002) J Therm Anal
Calorim 69:3721. Yılmaz M, Eğri S, Yıldız N, Çalımlı A, Pişkin E (2010) J Polym
Res. doi:10.1007/s10965-010-9497-y22. Hou A, Xie K, Dai J (2004) J Appl Polym Sci 92:200823. Shieh YT, Su JH et al (1996) J Appl Polym Sci 59:69524. Zhang Z, Wu Sh, Ren M, Xiao Ch (2004) Polymer 45:436125. Bartolotta A, Di Marco G, Farsaci F, Lanza M, Pieruccini M
(2003) Polymer 44:577126. Wellen RMR, Rabello MS (2005) J Mater Sci 40:609927. Keum JK, Song HH (2005) Polymer 46:93928. Middleton AC, Duckett RA, Ward IM, Mahendrasingam A,
Martin C (2001) J Appl Polym Sci 79:182529. Kakudo M, Kasai N (1972) X-ray diffraction by polymers.
Elsevier publishing company, New York30. Klug PH, Alexander LE (1974) X-ray diffraction procedures.
Wiley, New York31. Youssefi M, Morshed M, Kish MH (2007) J Appl Polym Sci
106:270332. Sharma V, Desai P, Abhiraman AS (1995) J Appl Polym Sci 65:2603
Effect of drawing temperature on mesomorphic transitions 2043