The Effect of Breed, Parity, and Stage of Lactation on Conjugated Linoleic Acid (CLA) in Milk Fat...
10
J. Dairy Sci. 86:2588–2597 American Dairy Science Association, 2003. The Effect of Breed, Parity, and Stage of Lactation on Conjugated Linoleic Acid (CLA) in Milk Fat from Dairy Cows 1 J. A. Kelsey,* ,2 B. A. Corl,* R. J. Collier,† and D. E. Bauman* *Department of Animal Science, Cornell University, Ithaca, NY 14853 †Department of Animal Science, University of Arizona, Tucson, AZ 85721 ABSTRACT Dairy products are the main source of conjugated linoleic acid (CLA), a functional food component with health benefits. The major source of cis-9, trans-11 CLA in milk fat is endogenous synthesis via ∆ 9 -desaturase from trans-11 18:1, with the remainder from incomplete rumen biohydrogenation of linoleic acid. Diet has a ma- jor influence on milk fat CLA; however, effects of physio- logical factors have received little attention. Our objec- tives were to examine milk fat content of CLA and the CLA-desaturase index with regard to: 1) effect of breed, parity, and stage of lactation, and 2) variation among individuals and the relationship to milk and milk fat. Holstein (n = 113) and Brown Swiss (n = 106) cows were fed a single diet and milk sampled on the same day to avoid confounding effects of diet and season. Frequency distributions demonstrated that milk fat content of CLA and CLA-desaturase index varied over threefold among individuals, and this needs to be considered in the design of experiments. Holsteins had a higher milk fat content of CLA and CLA-desaturase index, but breed differences were minor. Parity and days in milk also had little or no relationship to the individual varia- tion for these two CLA variables. Breed, parity, and days in milk accounted for <0.1, <0.3, and <2.0% of total variation in CLA concentration in milk fat, respectively. Milk fat content of CLA and CLA-desaturase index were essentially independent of milk yield, milk fat percent, and milk fat yield. We speculate that the basis for the genetic variation among individuals is related to rumen output of trans-11 18:1 and to a lesser extent cis-9, trans-11 CLA, and to the tissue amount and activity of ∆ 9 -desaturase. Received January 28, 2003. Accepted March 18, 2003. Corresponding author: Dale E. Bauman; e-mail: [email protected]. 1 Supported in part by Cornell Agricultural Experiment Station. JAK was supported by the Cornell Presidential Research Scholars Program. 2 Present address: Department of Animal and Veterinary Science, 316 Agriculture Biotechnology Bldg., University of Idaho, Moscow, ID 83844. 2588 (Key words: breed, conjugated linoleic acid, desatur- ase index, milk fat) Abbreviation key: CLA = conjugated linoleic acid. INTRODUCTION Conjugated linoleic acid (CLA) is a term representing a mixture of positional and geometric isomers of octade- cadienoic acid with a conjugated double bond system. Conjugated linoleic acid has been shown to possess a number of health benefits based on biomedical studies across a variety of animal models. These include anti- carcinogenic, anti-atherogenic, anti-obesity, anti-dia- betic and immune system enhancement [see reviews: McGuire and McGuire (2000), Belury (2002)]. These effects may be related to specific CLA isomers, and this is an active area of research. cis-9, trans-11 Conjugated linoleic acid is the major CLA isomer found in dairy products accounting for 75 to 90% of the total CLA in milk fat (Bauman et al., 2003). This CLA isomer has been established as having anti-carcinogenic properties when included as a dietary supplement or consumed as a natural component of foods (Ip et al., 1999). The cis-9, trans-11 CLA in milk fat is primarily a product of endogenous synthesis via the enzyme ∆ 9 -desaturase, with the substrate being trans-11 18:1, an intermediate formed in rumen biohy- drogenation of linoleic and linolenic acids [see reviews: Bauman et al. (2001, 2003)]. A CLA-desaturase index can be calculated from the product-substrate relation- ship between cis-9, trans-11 CLA and trans-11 18:1 and this serves as a proxy for ∆ 9 -desaturase (Bauman et al., 2001). Conjugated linoleic acid is also an intermedi- ate in the rumen biohydrogenation of linoleic acid, and some escapes complete biohydrogenation and provides the remainder of the CLA in milk fat. Diet has a major influence on milk fat CLA, and this has been extensively investigated [see reviews: Bau- man et al. (2001), Chilliard et al. (2001)]. By manipulat- ing the diet of dairy cows, the CLA content of milk fat can be varied over fivefold. In contrast, effects of physiological factors such as breed, stage of lactation, and parity on the CLA in milk fat and the CLA-desatur-
Transcript of The Effect of Breed, Parity, and Stage of Lactation on Conjugated Linoleic Acid (CLA) in Milk Fat...
J. Dairy Sci. 86:2588–2597 American Dairy Science Association, 2003.
The Effect of Breed, Parity, and Stage of Lactation on ConjugatedLinoleic Acid (CLA) in Milk Fat from Dairy Cows1
J. A. Kelsey,*,2 B. A. Corl,* R. J. Collier,† and D. E. Bauman**Department of Animal Science, Cornell University, Ithaca, NY 14853†Department of Animal Science, University of Arizona, Tucson, AZ 85721
ABSTRACT
Dairy products are the main source of conjugatedlinoleic acid (CLA), a functional food component withhealth benefits. The major source of cis-9, trans-11 CLAin milk fat is endogenous synthesis via ∆9-desaturasefrom trans-11 18:1, with the remainder from incompleterumen biohydrogenation of linoleic acid. Diet has a ma-jor influence on milk fat CLA; however, effects of physio-logical factors have received little attention. Our objec-tives were to examine milk fat content of CLA and theCLA-desaturase index with regard to: 1) effect of breed,parity, and stage of lactation, and 2) variation amongindividuals and the relationship to milk and milk fat.Holstein (n = 113) and Brown Swiss (n = 106) cows werefed a single diet and milk sampled on the same day toavoid confounding effects of diet and season. Frequencydistributions demonstrated that milk fat content ofCLA and CLA-desaturase index varied over threefoldamong individuals, and this needs to be considered inthe design of experiments. Holsteins had a higher milkfat content of CLA and CLA-desaturase index, butbreed differences were minor. Parity and days in milkalso had little or no relationship to the individual varia-tion for these two CLA variables. Breed, parity, anddays in milk accounted for <0.1, <0.3, and <2.0% of totalvariation in CLA concentration in milk fat, respectively.Milk fat content of CLA and CLA-desaturase index wereessentially independent of milk yield, milk fat percent,and milk fat yield. We speculate that the basis for thegenetic variation among individuals is related to rumenoutput of trans-11 18:1 and to a lesser extent cis-9,trans-11 CLA, and to the tissue amount and activity of∆9-desaturase.
Received January 28, 2003.Accepted March 18, 2003.Corresponding author: Dale E. Bauman; e-mail: [email protected] in part by Cornell Agricultural Experiment Station.
JAK was supported by the Cornell Presidential Research ScholarsProgram.
2Present address: Department of Animal and Veterinary Science,316 Agriculture Biotechnology Bldg., University of Idaho, Moscow,ID 83844.
2588
(Key words: breed, conjugated linoleic acid, desatur-ase index, milk fat)
Abbreviation key: CLA = conjugated linoleic acid.
INTRODUCTION
Conjugated linoleic acid (CLA) is a term representinga mixture of positional and geometric isomers of octade-cadienoic acid with a conjugated double bond system.Conjugated linoleic acid has been shown to possess anumber of health benefits based on biomedical studiesacross a variety of animal models. These include anti-carcinogenic, anti-atherogenic, anti-obesity, anti-dia-betic and immune system enhancement [see reviews:McGuire and McGuire (2000), Belury (2002)]. Theseeffects may be related to specific CLA isomers, and thisis an active area of research.
cis-9, trans-11 Conjugated linoleic acid is the majorCLA isomer found in dairy products accounting for 75to 90% of the total CLA in milk fat (Bauman et al.,2003). This CLA isomer has been established as havinganti-carcinogenic properties when included as a dietarysupplement or consumed as a natural component offoods (Ip et al., 1999). The cis-9, trans-11 CLA in milkfat is primarily a product of endogenous synthesis viathe enzyme ∆9-desaturase, with the substrate beingtrans-11 18:1, an intermediate formed in rumen biohy-drogenation of linoleic and linolenic acids [see reviews:Bauman et al. (2001, 2003)]. A CLA-desaturase indexcan be calculated from the product-substrate relation-ship between cis-9, trans-11 CLA and trans-11 18:1 andthis serves as a proxy for ∆9-desaturase (Bauman etal., 2001). Conjugated linoleic acid is also an intermedi-ate in the rumen biohydrogenation of linoleic acid, andsome escapes complete biohydrogenation and providesthe remainder of the CLA in milk fat.
Diet has a major influence on milk fat CLA, and thishas been extensively investigated [see reviews: Bau-man et al. (2001), Chilliard et al. (2001)]. By manipulat-ing the diet of dairy cows, the CLA content of milkfat can be varied over fivefold. In contrast, effects ofphysiological factors such as breed, stage of lactation,and parity on the CLA in milk fat and the CLA-desatur-
CONJUGATED LINOLEIC ACID IN MILK FAT 2589
Table 1. Ingredient and chemical composition of experimental diet.
Composition Content
Ingredients, % of DMAlfalfa hay 36.85Steam flaked corn 28.16Whole cottonseed 6.94Soybean hulls 6.94Fat bran, 20% tallow 6.94Corn distillers grain 5.93Vitamin and mineral supplement1 4.07Molasses 3.18Energy II 0.97
Chemical composition,2 % of DMCP 17.16NDF 28.17ADF 18.95EE 6.88Ca 1.10P 0.42
NEl (Mcal/kg of DM) 1.85
1Composition (%) of the supplement: blood meal, 35.27; sodiumbicarbonate, 19.60; calcium 38%, 10.20; mono-dical 21%, 10.20; men-haden fishmeal (ruminant grade), 9.80; magnesium oxide, 6.80; salt,2.55; tallow, 2.50; yeast culture, 0.86; MTB 100 binder, 0.85; tracemineral proteinates, 0.62; zinc sulfate, 0.25; manganese sulfate, 0.21;vitamin E, 0.08; copper sulfate 27, 0.08; vitamin A (39,382 IU/kg),0.07; bran, 0.05; sodium selenite 4.5%, 0.02; cobalt carbonate, 0.01;and potassium iodine, 0.0025.
2Wet chemistry analysis of the diet was performed by ChandlerAnalytical Laboratories (Chandler, AZ). Dry matter averaged 58.14%.
ase index have received little attention. Therefore, ob-jectives of the present study were to examine the milkfat content of CLA and the CLA-desaturase index withregard to: 1) effect of breed, parity, and stage of lacta-tion, and 2) the variation among individuals and rela-tionship to milk yield and milk fat.
MATERIALS AND METHODS
Lactating Holstein (n = 113; 49 primiparous and 64multiparous) and Brown Swiss (n = 106; 47 primiparousand 59 multiparous) dairy cows, from the Universityof Arizona herd were used. All cows were fed an identi-cal TMR (Table 1) formulated to meet or exceed nutrientrequirements (NRC, 2001). Milk samples were obtainedfrom the daily milkings on January 30, 2001, and acomposite milk sample was formed for each cow. Onealiquot was sent to the Arizona DHIA (Tempe, AZ)where milk fat and true protein were analyzed usingAOAC approved infrared analysis equipment and pro-cedures. Equipment and procedures are also certifiedeach year by National DHIA. Another aliquot of themilk composite was centrifuged at 17,800 × g for 30min at 8°C, and 300 to 350 mg of the fat cake wasremoved, frozen, and shipped to Cornell University. Thefat cake was stored at −20°C until fatty acid analysis.
Journal of Dairy Science Vol. 86, No. 8, 2003
Fatty Acid Analysis and Calculations
Lipid extraction of milk fat was performed accordingto Hara and Radin (1978) as described by Chouinardet al. (1999). Milk fatty acids were transesterified withsodium methoxide according to the method of Christie(1982) with modifications. Hexane was added to 40 mgof butter oil followed by 40 �l of methyl acetate. Themixture was vortexed and 40 �l methylation reagent(1.75 ml of methanol: 0.4 ml of 5.4 M sodium methylate)was added. The mixture was vortexed, allowed to reactfor 10 min, and then 60 �l of termination reagent (1 gof oxalic acid/30 ml of diethyl ether) was added. Severalgrains of anhydrous CaCl2 were added and the solutionincubated at room temperature for 1 h. The sample wasthen centrifuged for 5 min at 2400 × g at 4°C, andthe hexane layer was removed and used directly forchromatographic determination.
Fatty acid methyl esters were analyzed by gas chro-matography (Hewlett Packard GC system 6890+ witha flame-ionization detector) using a SP-2560 capillarycolumn (100 m × 0.25 mm i.d. with 0.2-µm film thick-ness; Supelco Inc., Bellefonte, PA). The analysis in-volved a programmed run with temperature ramps un-der conditions and temperatures as described byBaumgard et al. (2001). Each peak was identified andquantified using pure methyl-ester standards (NuChekPrep, Elysian, MN). A butter reference standard (CRM164; Commission of the European Communities, Com-munity Bureau of Reference, Brussels, Belgium) wasanalyzed at regular intervals for quality control pur-poses and was also used to determine recoveries andcorrection factors for individual fatty acids.
The fatty acid composition of milk fat is expressedas amount of each individual fatty acid per total fattyacids present. This involved transforming the data fromgas chromatographic analysis (fatty acid methyl esters)to a fatty acid basis. Conjugated linoleic acid concentra-tions are generally expressed as milligrams per gramof fatty acids as is typical for scientific literature onCLA. The desaturase index was also calculated for fourpairs of fatty acids that represent products and sub-strates for ∆9-desaturase. These fatty acid pairs werecis-9 14:1/14:0, cis-9 16:1/16:0, cis-9 18:1/18:0, and cis-9,trans-11 CLA/trans-11 18:1. We defined the desaturaseindex as follows: [product of ∆9-desaturase]/[product of∆9-desaturase + substrate of ∆9-desaturase]. For exam-ple, the CLA-desaturase index would be calculated as:
[cis-9, trans-11 CLA]/[cis-9, trans-11 CLA + trans-11 18:1]
Statistical Analysis
The general linear model procedure (PROC GLM) ofSAS (2000) was used to develop a regression model for
KELSEY ET AL.2590
Table 2. Performance of lactating dairy cows on the day of sampling.1
Holstein Brown Swiss
Variable Mean Range Mean Range
Parity 2.5 1–10 2.1 1–8Days in milk 176 13–533 182 8–624Milk yield, kg/d 38.0 ± 0.8 16.5–61.5 31.5 ± 0.8 11.2–57.4Milk protein2
% 3.03 ± 0.02 2.50–3.80 3.46 ± 0.02 2.60–4.10kg/d 1.13 ± 0.02 0.53–1.82 1.08 ± 0.02 0.40–1.67
Milk fat% 3.41 ± 0.06 2.00–6.10 3.86 ± 0.06 1.90–5.70kg/d 1.28 ± 0.03 0.54–2.28 1.21 ± 0.03 0.31–2.12
1Milk samples were taken from Holstein (n = 113) and Brown Swiss (n = 106) dairy cows on the sameday, while all cows were consuming the same diet. Performance variables represent means ± SE for respectivebreeds after accounting for the effects of parity and days in milk.
2True protein.
analyzing these data. Categorical predictors of breed(Holstein and Brown Swiss) and parity (primiparous:lactation = 1 and multiparous: lactation ≥ 2) were in-cluded in the model. To evaluate the effect of stage oflactation, the general linear test was used to test forpolynomials of DIM up to DIM6 and significant interac-tions. Polynomials beyond the quadratic term for DIMwere not significant and none of the tested interactionswere significant. Based on these tests, the final modelutilized was:
Yijk = βo + β1Bi + β2Pj + β3Dk + β3D2k + εijk,
where Yijk is the response variable, Bi is the ith breed,Pj is the jth parity, Dk is the kth DIM, and εijk is theresidual error term. Correlation of ratios for the fattyacid pairs representing the desaturase index were de-termined using the correlation procedure (PROCCORR) of SAS (2000).
RESULTS AND DISCUSSION
General Characteristics and Milk Composition
Characteristics, milk production, and milk composi-tion averages are presented in Table 2. Average parityand DIM were similar for the two breeds. In general,milk production and milk composition were characteris-tic of each breed. Holstein cows had greater milk pro-duction, whereas Brown Swiss cows on average hadhigher milk content of fat and protein. As a result, dailyyields of milk fat and milk protein were similar betweenthe two breeds. Earlier studies demonstrated similarpatterns between Holstein and Brown Swiss in milkyield and the content and yield of fat and protein (seereview by Jenness, 1985).
Journal of Dairy Science Vol. 86, No. 8, 2003
Milk fatty acid composition is presented in Table 3.Of total fatty acids (weight basis), short- and medium-chain length fatty acids (<16 carbons) represented21.4% for Holsteins and 23.2% for Brown Swiss. Similarvalues for 16 carbon fatty acids were 29.4 and 29.5%for the two breeds and longer-chain fatty acids (>16carbons) represented 49.2% and 47.4% of total fattyacids for Holstein and Brown Swiss cows, respectively.Similarities in milk fatty acid composition between Hol-stein and Brown Swiss have been observed previouslyby DePeters et al. (1995). Jensen (2002) authored anextensive review of the fatty acid composition of bovinemilk, and he pointed out that data are limited wheremodern analytical methods and large sample sets wereutilized. The present study represents a large datasetthat illustrates the pattern and individual variation inthe fatty acid composition of milk fat, but it is limitedto a single herd and a single diet.
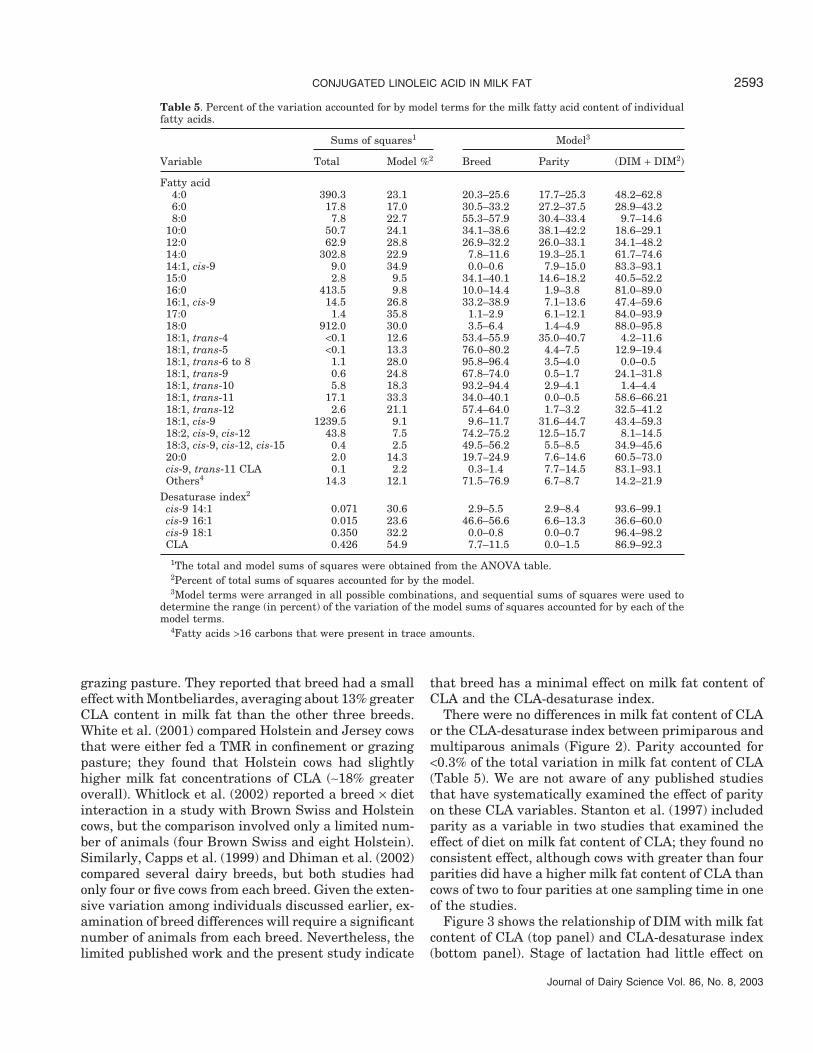
One objective was to evaluate the effect of breed,parity, and DIM on milk fat content of CLA. This samemodel was applied to all fatty acids, and Table 4 pres-ents the significance level for the model terms for indi-vidual fatty acids. Breed, parity, and DIM had signifi-cant effects on many of the fatty acids. Total variationfor each fatty acid and the proportion of variation ac-counted for by the model and specific model terms areshown in Table 5. In general, the model accounted forless than 25% of total variation. Thus, breed, parity,and DIM accounted for only a small proportion of thetotal variation that existed for individual fatty acids.
Milk Fat Conjugated Linoleic Acid
The cis-9, trans-11 CLA in milk fat originates fromthe incomplete biohydrogenation of polyunsaturatedfatty acids, and diet can have a major impact on themilk fat content [see reviews by Bauman et al. (2001),
CONJUGATED LINOLEIC ACID IN MILK FAT 2591
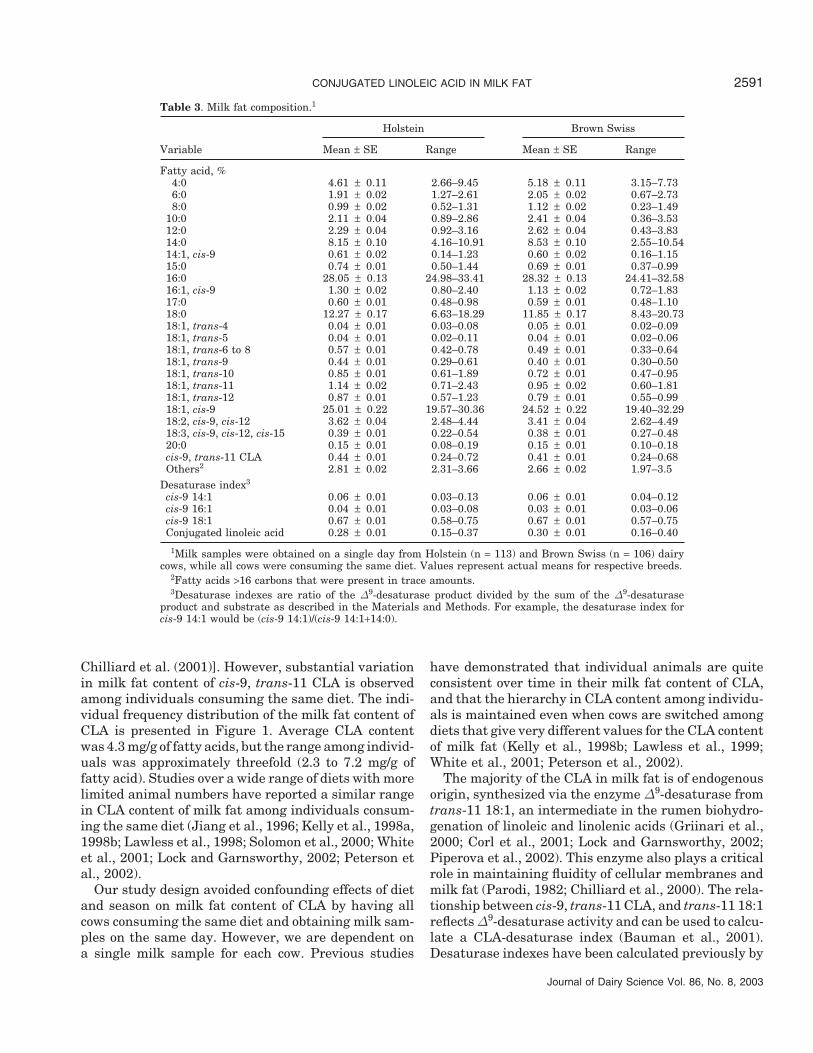
Table 3. Milk fat composition.1
Holstein Brown Swiss
Variable Mean ± SE Range Mean ± SE Range
Fatty acid, %4:0 4.61 ± 0.11 2.66–9.45 5.18 ± 0.11 3.15–7.736:0 1.91 ± 0.02 1.27–2.61 2.05 ± 0.02 0.67–2.738:0 0.99 ± 0.02 0.52–1.31 1.12 ± 0.02 0.23–1.49
10:0 2.11 ± 0.04 0.89–2.86 2.41 ± 0.04 0.36–3.5312:0 2.29 ± 0.04 0.92–3.16 2.62 ± 0.04 0.43–3.8314:0 8.15 ± 0.10 4.16–10.91 8.53 ± 0.10 2.55–10.5414:1, cis-9 0.61 ± 0.02 0.14–1.23 0.60 ± 0.02 0.16–1.1515:0 0.74 ± 0.01 0.50–1.44 0.69 ± 0.01 0.37–0.9916:0 28.05 ± 0.13 24.98–33.41 28.32 ± 0.13 24.41–32.5816:1, cis-9 1.30 ± 0.02 0.80–2.40 1.13 ± 0.02 0.72–1.8317:0 0.60 ± 0.01 0.48–0.98 0.59 ± 0.01 0.48–1.1018:0 12.27 ± 0.17 6.63–18.29 11.85 ± 0.17 8.43–20.7318:1, trans-4 0.04 ± 0.01 0.03–0.08 0.05 ± 0.01 0.02–0.0918:1, trans-5 0.04 ± 0.01 0.02–0.11 0.04 ± 0.01 0.02–0.0618:1, trans-6 to 8 0.57 ± 0.01 0.42–0.78 0.49 ± 0.01 0.33–0.6418:1, trans-9 0.44 ± 0.01 0.29–0.61 0.40 ± 0.01 0.30–0.5018:1, trans-10 0.85 ± 0.01 0.61–1.89 0.72 ± 0.01 0.47–0.9518:1, trans-11 1.14 ± 0.02 0.71–2.43 0.95 ± 0.02 0.60–1.8118:1, trans-12 0.87 ± 0.01 0.57–1.23 0.79 ± 0.01 0.55–0.9918:1, cis-9 25.01 ± 0.22 19.57–30.36 24.52 ± 0.22 19.40–32.2918:2, cis-9, cis-12 3.62 ± 0.04 2.48–4.44 3.41 ± 0.04 2.62–4.4918:3, cis-9, cis-12, cis-15 0.39 ± 0.01 0.22–0.54 0.38 ± 0.01 0.27–0.4820:0 0.15 ± 0.01 0.08–0.19 0.15 ± 0.01 0.10–0.18cis-9, trans-11 CLA 0.44 ± 0.01 0.24–0.72 0.41 ± 0.01 0.24–0.68Others2 2.81 ± 0.02 2.31–3.66 2.66 ± 0.02 1.97–3.5
Desaturase index3
cis-9 14:1 0.06 ± 0.01 0.03–0.13 0.06 ± 0.01 0.04–0.12cis-9 16:1 0.04 ± 0.01 0.03–0.08 0.03 ± 0.01 0.03–0.06cis-9 18:1 0.67 ± 0.01 0.58–0.75 0.67 ± 0.01 0.57–0.75Conjugated linoleic acid 0.28 ± 0.01 0.15–0.37 0.30 ± 0.01 0.16–0.40
1Milk samples were obtained on a single day from Holstein (n = 113) and Brown Swiss (n = 106) dairycows, while all cows were consuming the same diet. Values represent actual means for respective breeds.
2Fatty acids >16 carbons that were present in trace amounts.3Desaturase indexes are ratio of the ∆9-desaturase product divided by the sum of the ∆9-desaturase
product and substrate as described in the Materials and Methods. For example, the desaturase index forcis-9 14:1 would be (cis-9 14:1)/(cis-9 14:1+14:0).
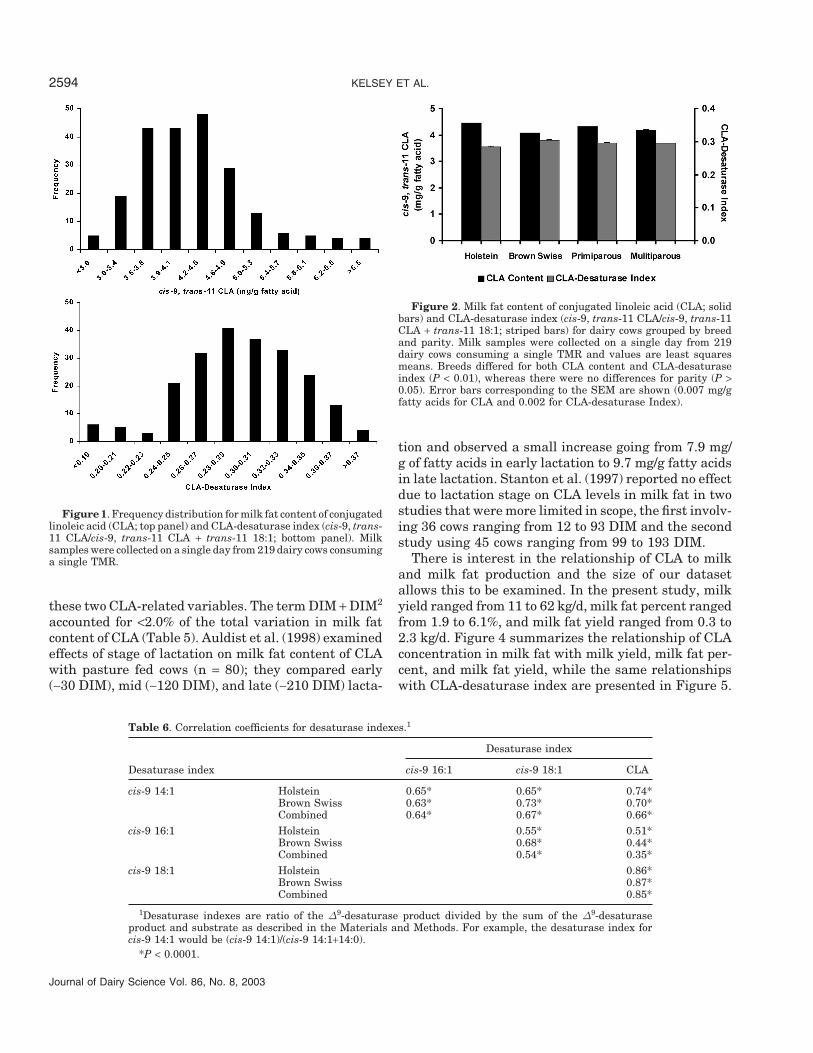
Chilliard et al. (2001)]. However, substantial variationin milk fat content of cis-9, trans-11 CLA is observedamong individuals consuming the same diet. The indi-vidual frequency distribution of the milk fat content ofCLA is presented in Figure 1. Average CLA contentwas 4.3 mg/g of fatty acids, but the range among individ-uals was approximately threefold (2.3 to 7.2 mg/g offatty acid). Studies over a wide range of diets with morelimited animal numbers have reported a similar rangein CLA content of milk fat among individuals consum-ing the same diet (Jiang et al., 1996; Kelly et al., 1998a,1998b; Lawless et al., 1998; Solomon et al., 2000; Whiteet al., 2001; Lock and Garnsworthy, 2002; Peterson etal., 2002).
Our study design avoided confounding effects of dietand season on milk fat content of CLA by having allcows consuming the same diet and obtaining milk sam-ples on the same day. However, we are dependent ona single milk sample for each cow. Previous studies
Journal of Dairy Science Vol. 86, No. 8, 2003
have demonstrated that individual animals are quiteconsistent over time in their milk fat content of CLA,and that the hierarchy in CLA content among individu-als is maintained even when cows are switched amongdiets that give very different values for the CLA contentof milk fat (Kelly et al., 1998b; Lawless et al., 1999;White et al., 2001; Peterson et al., 2002).
The majority of the CLA in milk fat is of endogenousorigin, synthesized via the enzyme ∆9-desaturase fromtrans-11 18:1, an intermediate in the rumen biohydro-genation of linoleic and linolenic acids (Griinari et al.,2000; Corl et al., 2001; Lock and Garnsworthy, 2002;Piperova et al., 2002). This enzyme also plays a criticalrole in maintaining fluidity of cellular membranes andmilk fat (Parodi, 1982; Chilliard et al., 2000). The rela-tionship between cis-9, trans-11 CLA, and trans-11 18:1reflects ∆9-desaturase activity and can be used to calcu-late a CLA-desaturase index (Bauman et al., 2001).Desaturase indexes have been calculated previously by
KELSEY ET AL.2592
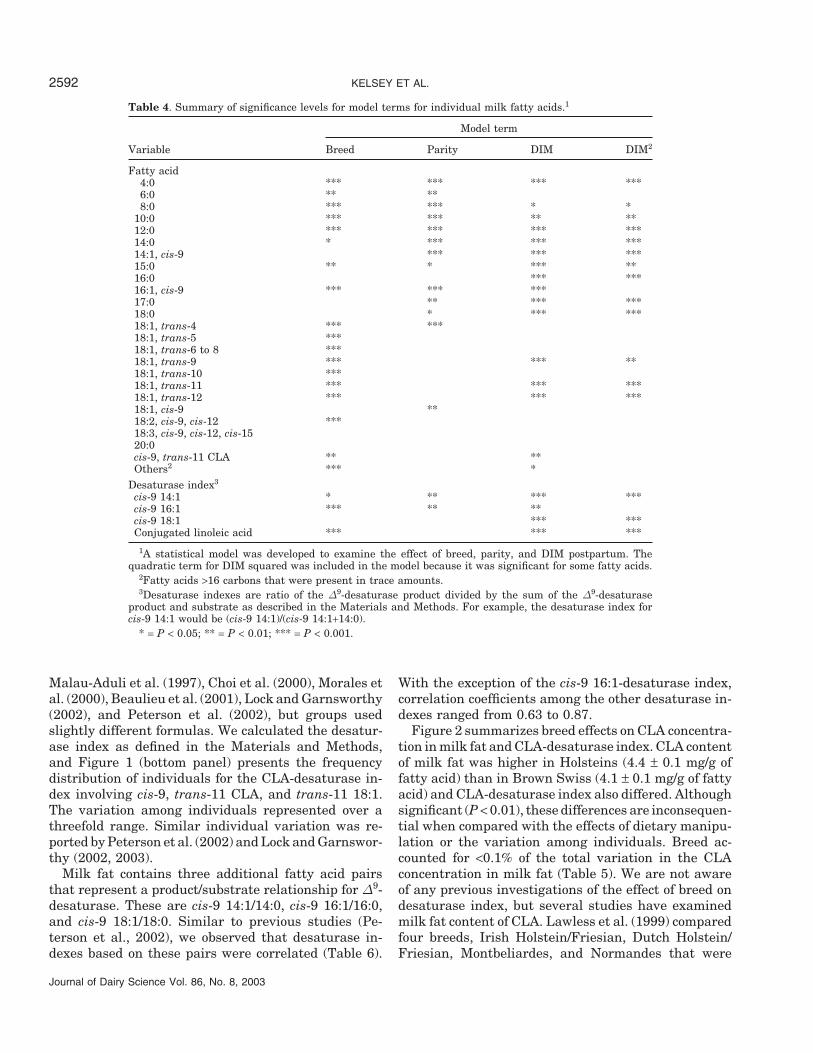
Table 4. Summary of significance levels for model terms for individual milk fatty acids.1
Model term
Variable Breed Parity DIM DIM2
Fatty acid4:0 *** *** *** ***6:0 ** **8:0 *** *** * *
10:0 *** *** ** **12:0 *** *** *** ***14:0 * *** *** ***14:1, cis-9 *** *** ***15:0 ** * *** **16:0 *** ***16:1, cis-9 *** *** ***17:0 ** *** ***18:0 * *** ***18:1, trans-4 *** ***18:1, trans-5 ***18:1, trans-6 to 8 ***18:1, trans-9 *** *** **18:1, trans-10 ***18:1, trans-11 *** *** ***18:1, trans-12 *** *** ***18:1, cis-9 **18:2, cis-9, cis-12 ***18:3, cis-9, cis-12, cis-1520:0cis-9, trans-11 CLA ** **Others2 *** *
Desaturase index3
cis-9 14:1 * ** *** ***cis-9 16:1 *** ** **cis-9 18:1 *** ***Conjugated linoleic acid *** *** ***
1A statistical model was developed to examine the effect of breed, parity, and DIM postpartum. Thequadratic term for DIM squared was included in the model because it was significant for some fatty acids.
2Fatty acids >16 carbons that were present in trace amounts.3Desaturase indexes are ratio of the ∆9-desaturase product divided by the sum of the ∆9-desaturase
product and substrate as described in the Materials and Methods. For example, the desaturase index forcis-9 14:1 would be (cis-9 14:1)/(cis-9 14:1+14:0).
* = P < 0.05; ** = P < 0.01; *** = P < 0.001.
Malau-Aduli et al. (1997), Choi et al. (2000), Morales etal. (2000), Beaulieu et al. (2001), Lock and Garnsworthy(2002), and Peterson et al. (2002), but groups usedslightly different formulas. We calculated the desatur-ase index as defined in the Materials and Methods,and Figure 1 (bottom panel) presents the frequencydistribution of individuals for the CLA-desaturase in-dex involving cis-9, trans-11 CLA, and trans-11 18:1.The variation among individuals represented over athreefold range. Similar individual variation was re-ported by Peterson et al. (2002) and Lock and Garnswor-thy (2002, 2003).
Milk fat contains three additional fatty acid pairsthat represent a product/substrate relationship for ∆9-desaturase. These are cis-9 14:1/14:0, cis-9 16:1/16:0,and cis-9 18:1/18:0. Similar to previous studies (Pe-terson et al., 2002), we observed that desaturase in-dexes based on these pairs were correlated (Table 6).
Journal of Dairy Science Vol. 86, No. 8, 2003
With the exception of the cis-9 16:1-desaturase index,correlation coefficients among the other desaturase in-dexes ranged from 0.63 to 0.87.
Figure 2 summarizes breed effects on CLA concentra-tion in milk fat and CLA-desaturase index. CLA contentof milk fat was higher in Holsteins (4.4 ± 0.1 mg/g offatty acid) than in Brown Swiss (4.1 ± 0.1 mg/g of fattyacid) and CLA-desaturase index also differed. Althoughsignificant (P < 0.01), these differences are inconsequen-tial when compared with the effects of dietary manipu-lation or the variation among individuals. Breed ac-counted for <0.1% of the total variation in the CLAconcentration in milk fat (Table 5). We are not awareof any previous investigations of the effect of breed ondesaturase index, but several studies have examinedmilk fat content of CLA. Lawless et al. (1999) comparedfour breeds, Irish Holstein/Friesian, Dutch Holstein/Friesian, Montbeliardes, and Normandes that were
CONJUGATED LINOLEIC ACID IN MILK FAT 2593
Table 5. Percent of the variation accounted for by model terms for the milk fatty acid content of individualfatty acids.
Sums of squares1 Model3
Variable Total Model %2 Breed Parity (DIM + DIM2)
Fatty acid4:0 390.3 23.1 20.3–25.6 17.7–25.3 48.2–62.86:0 17.8 17.0 30.5–33.2 27.2–37.5 28.9–43.28:0 7.8 22.7 55.3–57.9 30.4–33.4 9.7–14.6
10:0 50.7 24.1 34.1–38.6 38.1–42.2 18.6–29.112:0 62.9 28.8 26.9–32.2 26.0–33.1 34.1–48.214:0 302.8 22.9 7.8–11.6 19.3–25.1 61.7–74.614:1, cis-9 9.0 34.9 0.0–0.6 7.9–15.0 83.3–93.115:0 2.8 9.5 34.1–40.1 14.6–18.2 40.5–52.216:0 413.5 9.8 10.0–14.4 1.9–3.8 81.0–89.016:1, cis-9 14.5 26.8 33.2–38.9 7.1–13.6 47.4–59.617:0 1.4 35.8 1.1–2.9 6.1–12.1 84.0–93.918:0 912.0 30.0 3.5–6.4 1.4–4.9 88.0–95.818:1, trans-4 <0.1 12.6 53.4–55.9 35.0–40.7 4.2–11.618:1, trans-5 <0.1 13.3 76.0–80.2 4.4–7.5 12.9–19.418:1, trans-6 to 8 1.1 28.0 95.8–96.4 3.5–4.0 0.0–0.518:1, trans-9 0.6 24.8 67.8–74.0 0.5–1.7 24.1–31.818:1, trans-10 5.8 18.3 93.2–94.4 2.9–4.1 1.4–4.418:1, trans-11 17.1 33.3 34.0–40.1 0.0–0.5 58.6–66.2118:1, trans-12 2.6 21.1 57.4–64.0 1.7–3.2 32.5–41.218:1, cis-9 1239.5 9.1 9.6–11.7 31.6–44.7 43.4–59.318:2, cis-9, cis-12 43.8 7.5 74.2–75.2 12.5–15.7 8.1–14.518:3, cis-9, cis-12, cis-15 0.4 2.5 49.5–56.2 5.5–8.5 34.9–45.620:0 2.0 14.3 19.7–24.9 7.6–14.6 60.5–73.0cis-9, trans-11 CLA 0.1 2.2 0.3–1.4 7.7–14.5 83.1–93.1Others4 14.3 12.1 71.5–76.9 6.7–8.7 14.2–21.9
Desaturase index2
cis-9 14:1 0.071 30.6 2.9–5.5 2.9–8.4 93.6–99.1cis-9 16:1 0.015 23.6 46.6–56.6 6.6–13.3 36.6–60.0cis-9 18:1 0.350 32.2 0.0–0.8 0.0–0.7 96.4–98.2CLA 0.426 54.9 7.7–11.5 0.0–1.5 86.9–92.3
1The total and model sums of squares were obtained from the ANOVA table.2Percent of total sums of squares accounted for by the model.3Model terms were arranged in all possible combinations, and sequential sums of squares were used to
determine the range (in percent) of the variation of the model sums of squares accounted for by each of themodel terms.
4Fatty acids >16 carbons that were present in trace amounts.
grazing pasture. They reported that breed had a smalleffect with Montbeliardes, averaging about 13% greaterCLA content in milk fat than the other three breeds.White et al. (2001) compared Holstein and Jersey cowsthat were either fed a TMR in confinement or grazingpasture; they found that Holstein cows had slightlyhigher milk fat concentrations of CLA (∼18% greateroverall). Whitlock et al. (2002) reported a breed × dietinteraction in a study with Brown Swiss and Holsteincows, but the comparison involved only a limited num-ber of animals (four Brown Swiss and eight Holstein).Similarly, Capps et al. (1999) and Dhiman et al. (2002)compared several dairy breeds, but both studies hadonly four or five cows from each breed. Given the exten-sive variation among individuals discussed earlier, ex-amination of breed differences will require a significantnumber of animals from each breed. Nevertheless, thelimited published work and the present study indicate
Journal of Dairy Science Vol. 86, No. 8, 2003
that breed has a minimal effect on milk fat content ofCLA and the CLA-desaturase index.
There were no differences in milk fat content of CLAor the CLA-desaturase index between primiparous andmultiparous animals (Figure 2). Parity accounted for<0.3% of the total variation in milk fat content of CLA(Table 5). We are not aware of any published studiesthat have systematically examined the effect of parityon these CLA variables. Stanton et al. (1997) includedparity as a variable in two studies that examined theeffect of diet on milk fat content of CLA; they found noconsistent effect, although cows with greater than fourparities did have a higher milk fat content of CLA thancows of two to four parities at one sampling time in oneof the studies.
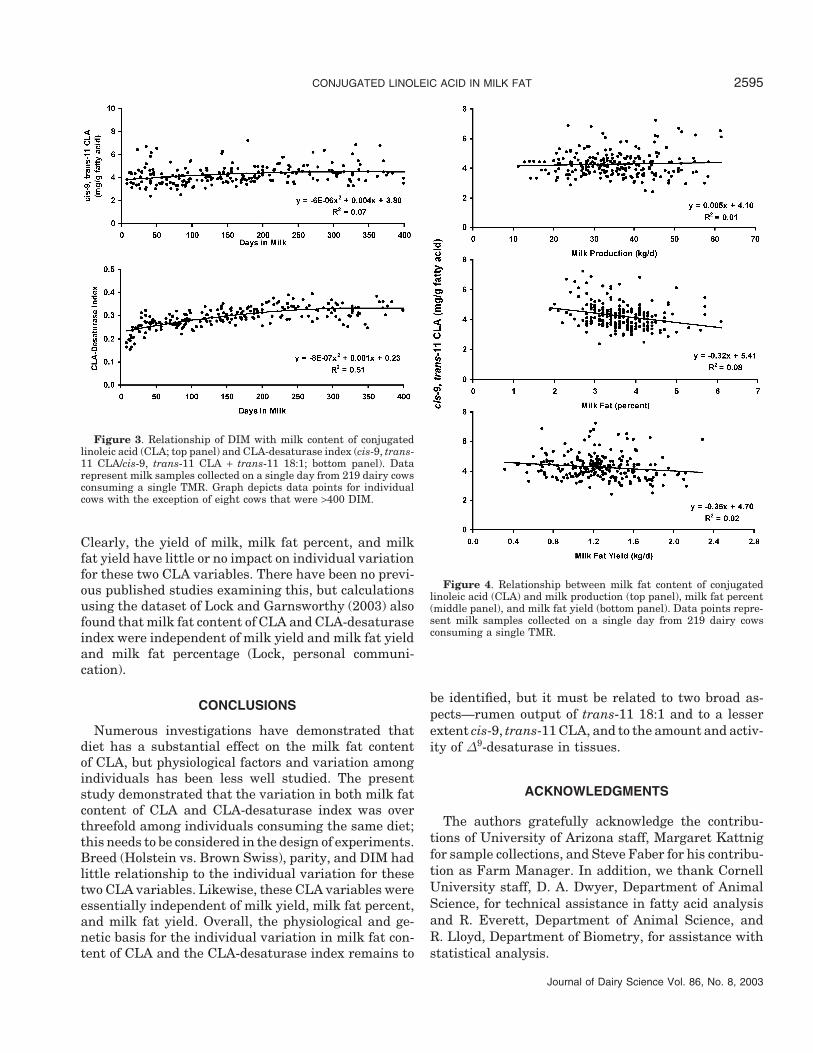
Figure 3 shows the relationship of DIM with milk fatcontent of CLA (top panel) and CLA-desaturase index(bottom panel). Stage of lactation had little effect on
KELSEY ET AL.2594
Figure 1. Frequency distribution for milk fat content of conjugatedlinoleic acid (CLA; top panel) and CLA-desaturase index (cis-9, trans-11 CLA/cis-9, trans-11 CLA + trans-11 18:1; bottom panel). Milksamples were collected on a single day from 219 dairy cows consuminga single TMR.
these two CLA-related variables. The term DIM + DIM2
accounted for <2.0% of the total variation in milk fatcontent of CLA (Table 5). Auldist et al. (1998) examinedeffects of stage of lactation on milk fat content of CLAwith pasture fed cows (n = 80); they compared early(∼30 DIM), mid (∼120 DIM), and late (∼210 DIM) lacta-
Table 6. Correlation coefficients for desaturase indexes.1
Desaturase index
Desaturase index cis-9 16:1 cis-9 18:1 CLA
cis-9 14:1 Holstein 0.65* 0.65* 0.74*Brown Swiss 0.63* 0.73* 0.70*Combined 0.64* 0.67* 0.66*
cis-9 16:1 Holstein 0.55* 0.51*Brown Swiss 0.68* 0.44*Combined 0.54* 0.35*
cis-9 18:1 Holstein 0.86*Brown Swiss 0.87*Combined 0.85*
1Desaturase indexes are ratio of the ∆9-desaturase product divided by the sum of the ∆9-desaturaseproduct and substrate as described in the Materials and Methods. For example, the desaturase index forcis-9 14:1 would be (cis-9 14:1)/(cis-9 14:1+14:0).
*P < 0.0001.
Journal of Dairy Science Vol. 86, No. 8, 2003
Figure 2. Milk fat content of conjugated linoleic acid (CLA; solidbars) and CLA-desaturase index (cis-9, trans-11 CLA/cis-9, trans-11CLA + trans-11 18:1; striped bars) for dairy cows grouped by breedand parity. Milk samples were collected on a single day from 219dairy cows consuming a single TMR and values are least squaresmeans. Breeds differed for both CLA content and CLA-desaturaseindex (P < 0.01), whereas there were no differences for parity (P >0.05). Error bars corresponding to the SEM are shown (0.007 mg/gfatty acids for CLA and 0.002 for CLA-desaturase Index).
tion and observed a small increase going from 7.9 mg/g of fatty acids in early lactation to 9.7 mg/g fatty acidsin late lactation. Stanton et al. (1997) reported no effectdue to lactation stage on CLA levels in milk fat in twostudies that were more limited in scope, the first involv-ing 36 cows ranging from 12 to 93 DIM and the secondstudy using 45 cows ranging from 99 to 193 DIM.
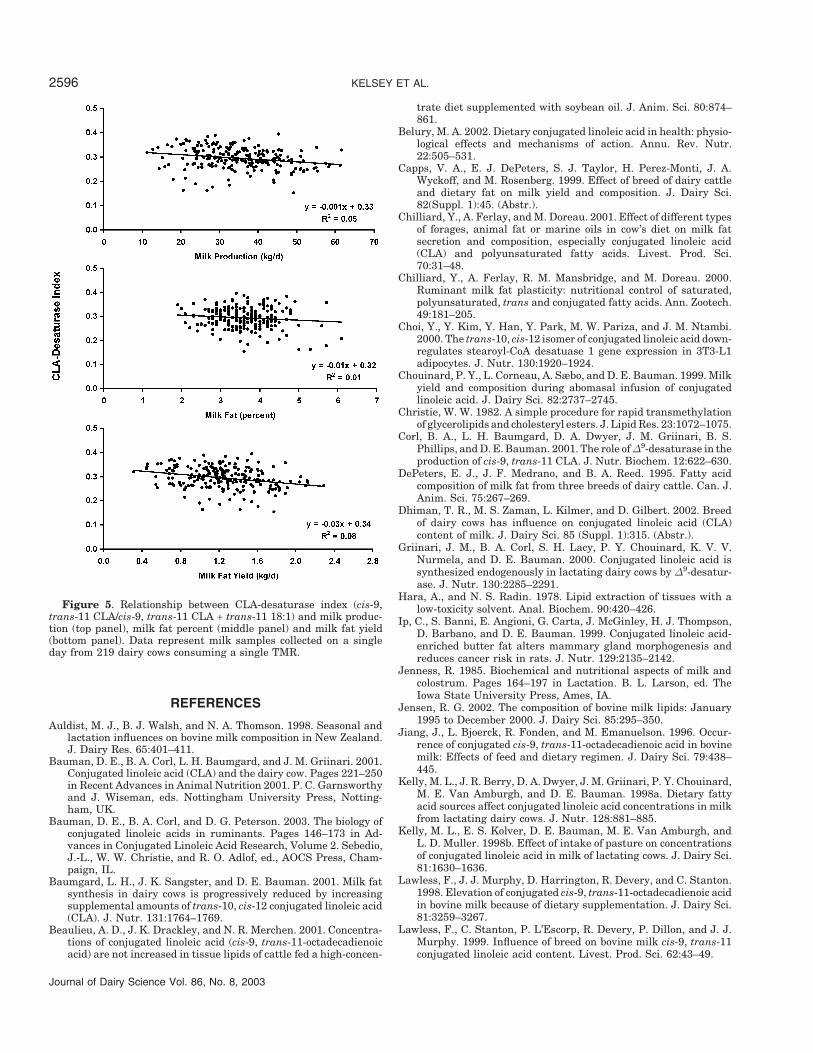
There is interest in the relationship of CLA to milkand milk fat production and the size of our datasetallows this to be examined. In the present study, milkyield ranged from 11 to 62 kg/d, milk fat percent rangedfrom 1.9 to 6.1%, and milk fat yield ranged from 0.3 to2.3 kg/d. Figure 4 summarizes the relationship of CLAconcentration in milk fat with milk yield, milk fat per-cent, and milk fat yield, while the same relationshipswith CLA-desaturase index are presented in Figure 5.
CONJUGATED LINOLEIC ACID IN MILK FAT 2595
Figure 3. Relationship of DIM with milk content of conjugatedlinoleic acid (CLA; top panel) and CLA-desaturase index (cis-9, trans-11 CLA/cis-9, trans-11 CLA + trans-11 18:1; bottom panel). Datarepresent milk samples collected on a single day from 219 dairy cowsconsuming a single TMR. Graph depicts data points for individualcows with the exception of eight cows that were >400 DIM.
Clearly, the yield of milk, milk fat percent, and milkfat yield have little or no impact on individual variationfor these two CLA variables. There have been no previ-ous published studies examining this, but calculationsusing the dataset of Lock and Garnsworthy (2003) alsofound that milk fat content of CLA and CLA-desaturaseindex were independent of milk yield and milk fat yieldand milk fat percentage (Lock, personal communi-cation).
CONCLUSIONS
Numerous investigations have demonstrated thatdiet has a substantial effect on the milk fat contentof CLA, but physiological factors and variation amongindividuals has been less well studied. The presentstudy demonstrated that the variation in both milk fatcontent of CLA and CLA-desaturase index was overthreefold among individuals consuming the same diet;this needs to be considered in the design of experiments.Breed (Holstein vs. Brown Swiss), parity, and DIM hadlittle relationship to the individual variation for thesetwo CLA variables. Likewise, these CLA variables wereessentially independent of milk yield, milk fat percent,and milk fat yield. Overall, the physiological and ge-netic basis for the individual variation in milk fat con-tent of CLA and the CLA-desaturase index remains to
Journal of Dairy Science Vol. 86, No. 8, 2003
Figure 4. Relationship between milk fat content of conjugatedlinoleic acid (CLA) and milk production (top panel), milk fat percent(middle panel), and milk fat yield (bottom panel). Data points repre-sent milk samples collected on a single day from 219 dairy cowsconsuming a single TMR.
be identified, but it must be related to two broad as-pects—rumen output of trans-11 18:1 and to a lesserextent cis-9, trans-11 CLA, and to the amount and activ-ity of ∆9-desaturase in tissues.
ACKNOWLEDGMENTS
The authors gratefully acknowledge the contribu-tions of University of Arizona staff, Margaret Kattnigfor sample collections, and Steve Faber for his contribu-tion as Farm Manager. In addition, we thank CornellUniversity staff, D. A. Dwyer, Department of AnimalScience, for technical assistance in fatty acid analysisand R. Everett, Department of Animal Science, andR. Lloyd, Department of Biometry, for assistance withstatistical analysis.
KELSEY ET AL.2596
Figure 5. Relationship between CLA-desaturase index (cis-9,trans-11 CLA/cis-9, trans-11 CLA + trans-11 18:1) and milk produc-tion (top panel), milk fat percent (middle panel) and milk fat yield(bottom panel). Data represent milk samples collected on a singleday from 219 dairy cows consuming a single TMR.
REFERENCES
Auldist, M. J., B. J. Walsh, and N. A. Thomson. 1998. Seasonal andlactation influences on bovine milk composition in New Zealand.J. Dairy Res. 65:401–411.
Bauman, D. E., B. A. Corl, L. H. Baumgard, and J. M. Griinari. 2001.Conjugated linoleic acid (CLA) and the dairy cow. Pages 221–250in Recent Advances in Animal Nutrition 2001. P. C. Garnsworthyand J. Wiseman, eds. Nottingham University Press, Notting-ham, UK.
Bauman, D. E., B. A. Corl, and D. G. Peterson. 2003. The biology ofconjugated linoleic acids in ruminants. Pages 146–173 in Ad-vances in Conjugated Linoleic Acid Research, Volume 2. Sebedio,J.-L., W. W. Christie, and R. O. Adlof, ed., AOCS Press, Cham-paign, IL.
Baumgard, L. H., J. K. Sangster, and D. E. Bauman. 2001. Milk fatsynthesis in dairy cows is progressively reduced by increasingsupplemental amounts of trans-10, cis-12 conjugated linoleic acid(CLA). J. Nutr. 131:1764–1769.
Beaulieu, A. D., J. K. Drackley, and N. R. Merchen. 2001. Concentra-tions of conjugated linoleic acid (cis-9, trans-11-octadecadienoicacid) are not increased in tissue lipids of cattle fed a high-concen-
Journal of Dairy Science Vol. 86, No. 8, 2003
trate diet supplemented with soybean oil. J. Anim. Sci. 80:874–861.
Belury, M. A. 2002. Dietary conjugated linoleic acid in health: physio-logical effects and mechanisms of action. Annu. Rev. Nutr.22:505–531.
Capps, V. A., E. J. DePeters, S. J. Taylor, H. Perez-Monti, J. A.Wyckoff, and M. Rosenberg. 1999. Effect of breed of dairy cattleand dietary fat on milk yield and composition. J. Dairy Sci.82(Suppl. 1):45. (Abstr.).
Chilliard, Y., A. Ferlay, and M. Doreau. 2001. Effect of different typesof forages, animal fat or marine oils in cow’s diet on milk fatsecretion and composition, especially conjugated linoleic acid(CLA) and polyunsaturated fatty acids. Livest. Prod. Sci.70:31–48.
Chilliard, Y., A. Ferlay, R. M. Mansbridge, and M. Doreau. 2000.Ruminant milk fat plasticity: nutritional control of saturated,polyunsaturated, trans and conjugated fatty acids. Ann. Zootech.49:181–205.
Choi, Y., Y. Kim, Y. Han, Y. Park, M. W. Pariza, and J. M. Ntambi.2000. The trans-10, cis-12 isomer of conjugated linoleic acid down-regulates stearoyl-CoA desatuase 1 gene expression in 3T3-L1adipocytes. J. Nutr. 130:1920–1924.
Chouinard, P. Y., L. Corneau, A. Sæbo, and D. E. Bauman. 1999. Milkyield and composition during abomasal infusion of conjugatedlinoleic acid. J. Dairy Sci. 82:2737–2745.
Christie, W. W. 1982. A simple procedure for rapid transmethylationof glycerolipids and cholesteryl esters. J. Lipid Res. 23:1072–1075.
Corl, B. A., L. H. Baumgard, D. A. Dwyer, J. M. Griinari, B. S.Phillips, and D. E. Bauman. 2001. The role of ∆9-desaturase in theproduction of cis-9, trans-11 CLA. J. Nutr. Biochem. 12:622–630.
DePeters, E. J., J. F. Medrano, and B. A. Reed. 1995. Fatty acidcomposition of milk fat from three breeds of dairy cattle. Can. J.Anim. Sci. 75:267–269.
Dhiman, T. R., M. S. Zaman, L. Kilmer, and D. Gilbert. 2002. Breedof dairy cows has influence on conjugated linoleic acid (CLA)content of milk. J. Dairy Sci. 85 (Suppl. 1):315. (Abstr.).
Griinari, J. M., B. A. Corl, S. H. Lacy, P. Y. Chouinard, K. V. V.Nurmela, and D. E. Bauman. 2000. Conjugated linoleic acid issynthesized endogenously in lactating dairy cows by ∆9-desatur-ase. J. Nutr. 130:2285–2291.
Hara, A., and N. S. Radin. 1978. Lipid extraction of tissues with alow-toxicity solvent. Anal. Biochem. 90:420–426.
Ip, C., S. Banni, E. Angioni, G. Carta, J. McGinley, H. J. Thompson,D. Barbano, and D. E. Bauman. 1999. Conjugated linoleic acid-enriched butter fat alters mammary gland morphogenesis andreduces cancer risk in rats. J. Nutr. 129:2135–2142.
Jenness, R. 1985. Biochemical and nutritional aspects of milk andcolostrum. Pages 164–197 in Lactation. B. L. Larson, ed. TheIowa State University Press, Ames, IA.
Jensen, R. G. 2002. The composition of bovine milk lipids: January1995 to December 2000. J. Dairy Sci. 85:295–350.
Jiang, J., L. Bjoerck, R. Fonden, and M. Emanuelson. 1996. Occur-rence of conjugated cis-9, trans-11-octadecadienoic acid in bovinemilk: Effects of feed and dietary regimen. J. Dairy Sci. 79:438–445.
Kelly, M. L., J. R. Berry, D. A. Dwyer, J. M. Griinari, P. Y. Chouinard,M. E. Van Amburgh, and D. E. Bauman. 1998a. Dietary fattyacid sources affect conjugated linoleic acid concentrations in milkfrom lactating dairy cows. J. Nutr. 128:881–885.
Kelly, M. L., E. S. Kolver, D. E. Bauman, M. E. Van Amburgh, andL. D. Muller. 1998b. Effect of intake of pasture on concentrationsof conjugated linoleic acid in milk of lactating cows. J. Dairy Sci.81:1630–1636.
Lawless, F., J. J. Murphy, D. Harrington, R. Devery, and C. Stanton.1998. Elevation of conjugated cis-9, trans-11-octadecadienoic acidin bovine milk because of dietary supplementation. J. Dairy Sci.81:3259–3267.
Lawless, F., C. Stanton, P. L’Escorp, R. Devery, P. Dillon, and J. J.Murphy. 1999. Influence of breed on bovine milk cis-9, trans-11conjugated linoleic acid content. Livest. Prod. Sci. 62:43–49.
CONJUGATED LINOLEIC ACID IN MILK FAT 2597
Lock, A. L., and P. C. Garnsworthy. 2002. Independent effects ofdietary linoleic and linolenic fatty acids on the conjugated linoleicacid content of cows’ milk. Anim. Sci. 74:163–176.
Lock, A. L., and P. C. Garnsworthy. 2003. Seasonal variation in milkconjugated linoleic acid and ∆9-desaturase activity in dairy cows.Livest. Prod. Sci. 79:47–59.
Malau-Aduli, A. E. O., B. D. Siebert, C. D. K. Bottema, and W. S.Pitchford. 1997. A comparison of the fatty acid composition oftriacylglycerols in adipose tissue from Limousin and Jersey cattle.Aust. J. Agric. Res. 48:715–722.
McGuire, M. A., and M. K. McGuire. 2000. Conjugated linoleic acid(CLA): A ruminant fatty acid with beneficial effects on humanhealth. Proc Am. Soc. Anim. Sci. 1999. Available at: http://www.a-sas.org/jas/symposia/proceedings/0938.pdf.
Morales, M. S., D. L. Palmquist, and W. P. Weiss. 2000. Effects offat source and copper on unsaturation of blood and milk triacyl-glycerol fatty acids in Holstein and Jersey cows. J. Dairy Sci.83:2105–2111.
National Research Council. 2001. Nutrient requirements of dairycattle, 7th rev. ed. National Academy of Sciences, Washington,DC.
Parodi, P. W. 1982. Positional distribution of fatty acids in the triglyc-eride classes of milk fat. J. Dairy Res. 49:73–80.
Peterson, D. G., J. A. Kelsey, and D. E. Bauman. 2002. Analysis ofvariation in cis-9, trans-11 conjugated linoleic acid (CLA) in milkfat of dairy cows. J. Dairy Sci. 85:2164–2172.
Journal of Dairy Science Vol. 86, No. 8, 2003
Piperova, L. S., J. Sampugna, B. B. Teter, K. F. Kalscheur, M. P.Yurawecz, Y. Ku, K. M. Morehouse, and R. A. Erdman. 2002.Duodenal and milk trans octadecenoic acid and conjugated lino-leic acid (CLA) isomers indicate that postabsorptive synthesis isthe predominant source of cis-9-containing CLA in lactating dairycows. J. Nutr. 132:1235–1241.
SAS Institute, Inc. 2000. Release 8.1. Cary, NC.Solomon, R., L. E. Chase, D. Ben-Ghedalia, and D. E. Bauman. 2000.
The effect of nonstructural carbohydrate and addition of full fatextruded soybeans on the concentration of conjugated linoleicacid in the milk fat of dairy cows. J. Dairy Sci. 83:1322–1329.
Stanton, C., F. Lawless, G. Kjellmer, D. Harrington, R. Devery, J.F. Connolly, and J. Murphy. 1997. Dietary influences on bovinemilk cis-9, trans-11 conjugated linoleic acid content. J. Food Sci.62:1083–1086.
White, S. L., J. A. Bertrand, M. R. Wade, S. P. Washburn, J. T. Green,Jr., and T. C. Jenkins. 2001. Comparison of fatty acid content ofmilk from Jersey and Holstein cows consuming pasture of a totalmixed ration. J. Dairy Sci. 84:2295–2301.
Whitlock, L. A., D. J. Schingoethe, A. R. Hippen, K. F. Kalscheur, R.J. Baer, N. Ramaswamy, and K. M. Kasperson. 2002. Fish oiland extruded soybeans fed in combination increase conjugatedlinoleic acid in milk of dairy cows more than when fed separately.J. Dairy Sci. 85:234–243.