The effect of biogeographic and phylogeographic barriers on gene flow in the brown smoothhound...
16
The effect of biogeographic and phylogeographic barriers on gene flow in the brown smoothhound shark, Mustelus henlei, in the northeastern Pacific Chris L. Chabot 1 , Mario Espinoza 2 , Ismael Mascare ~ nas-Osorio 3 & Axay acatl Rocha-Olivares 4 1 Department of Biology, California State University, Northridge, Northridge, California 91330 2 Unidad de Investigaci on Pesquera y Acuicultura (UNIP), Centro de Investigaci on en Ciencias del Mar y Limnolog ıa (CIMAR), Universidad de Costa Rica, 11501–2060 San Jos e, Costa Rica 3 Centro para la Biodiversidad Marina y la Conservaci on A.C., 23090 La Paz, B.S.S., M exico 4 Molecular Ecology Laboratory, Department of Biological Oceanography, CICESE, Carretera Ensenada-Tijuana 3918, Ensenada, Baja California 22860, M exico Keywords Microsatellite, mitochondria, phylogeography, shark, Triakidae. Correspondence Chris L. Chabot, The California State University, Northridge, 18111 Nordhoff St., Northridge, CA 91330. Tel: 818-677-3356; Fax: 818-677-2034; E-mail: [email protected] Funding Information The UCLA Department of Ecology and Evolutionary Biology Student Research Award and the California Academy of Sciences Kristina Louie Memorial Fund provided funding for this project. Received: 23 January 2015; Revised: 13 February 2015; Accepted: 16 February 2015 doi: 10.1002/ece3.1458 Abstract We assessed the effects of the prominent biogeographic (Point Conception and the Peninsula of Baja California) and phylogeographic barriers (Los Angeles Region) of the northeastern Pacific on the population connectivity of the brown smoothhound shark, Mustelus henlei (Triakidae). Data from the mitochondrial control region and six nuclear microsatellite loci revealed significant population structure among three populations: northern (San Francisco), central (Santa Barbara, Santa Catalina, Punta Lobos, and San Felipe), and southern (Costa Rica). Patterns of long-term and contemporary migration were incongruent, with long-term migration being asymmetric and occurring in a north to south direction and a lack of significant contemporary migration observed between localities with the exception of Punta Lobos that contributed migrants to all localities within the central population. Our findings indicate that Point Con- ception may be restricting gene flow between the northern and central popula- tions whereas barriers to gene flow within the central population would seem to be ineffective; additionally, a contemporary expansion of tropical M. henlei into subtropical and temperate waters may have been observed. Introduction Biogeographic and phylogeographic barriers are known to disrupt population connectivity and are produced by cur- rents, changes in sea surface temperature (SST), physical barriers, upwelling, and resource availability (Palumbi 1994; Dawson 2001; Dawson et al. 2001; Jacobs et al. 2004). The eastern Pacific is an area comprising numer- ous biogeographic and phylogeographic barriers, the most prominent being located at Cape Mendocino, Point Con- ception, the Los Angeles Region (LAR), Punta Eugenia, the Peninsula of Baja California, the Sinaloan Gap, the Central American Gap, the Isthmus of Panama, and the Equator (Rawson et al. 1999; Stepien et al. 2000; Dawson 2001; Dawson et al. 2001, 2006; Jacobs et al. 2004; Rob- ertson and Cramer 2009). The impact of these barriers on population connectivity can vary in magnitude depending on their age and degree of obstruction. For example, the Isthmus of Panama, which is relatively recent (~3.5–3.1 million years ago), has altered current patterns, increased tidal amplitudes, affected upwelling, and severed gene flow between eastern Pacific, western Atlantic, and Carib- bean taxa (Coates and Obando 1996; Dick et al. 2003; Coates et al. 2004; Duncan et al. 2006; Keeney and Heist 2006). Barriers can also produce population structure along latitudinal gradients. Chabot and Allen (2009) have demonstrated significant population structure among populations of the soupfin shark, Galeorhinus galeus, ª 2015 The Authors. Ecology and Evolution published by John Wiley & Sons Ltd. This is an open access article under the terms of the Creative Commons Attribution License, which permits use, distribution and reproduction in any medium, provided the original work is properly cited. 1
Transcript of The effect of biogeographic and phylogeographic barriers on gene flow in the brown smoothhound...

The effect of biogeographic and phylogeographic barrierson gene flow in the brown smoothhound shark, Mustelushenlei, in the northeastern PacificChris L. Chabot1, Mario Espinoza2, Ismael Mascare~nas-Osorio3 & Axay�acatl Rocha-Olivares4
1Department of Biology, California State University, Northridge, Northridge, California 913302Unidad de Investigaci�on Pesquera y Acuicultura (UNIP), Centro de Investigaci�on en Ciencias del Mar y Limnolog�ıa (CIMAR), Universidad de Costa
Rica, 11501–2060 San Jos�e, Costa Rica3Centro para la Biodiversidad Marina y la Conservaci�on A.C., 23090 La Paz, B.S.S., M�exico4Molecular Ecology Laboratory, Department of Biological Oceanography, CICESE, Carretera Ensenada-Tijuana 3918, Ensenada, Baja California
22860, M�exico
Keywords
Microsatellite, mitochondria, phylogeography,
shark, Triakidae.
Correspondence
Chris L. Chabot, The California State
University, Northridge, 18111 Nordhoff St.,
Northridge, CA 91330.
Tel: 818-677-3356; Fax: 818-677-2034;
E-mail: [email protected]
Funding Information
The UCLA Department of Ecology and
Evolutionary Biology Student Research Award
and the California Academy of Sciences
Kristina Louie Memorial Fund provided
funding for this project.
Received: 23 January 2015; Revised: 13
February 2015; Accepted: 16 February 2015
doi: 10.1002/ece3.1458
Abstract
We assessed the effects of the prominent biogeographic (Point Conception and
the Peninsula of Baja California) and phylogeographic barriers (Los Angeles
Region) of the northeastern Pacific on the population connectivity of the brown
smoothhound shark, Mustelus henlei (Triakidae). Data from the mitochondrial
control region and six nuclear microsatellite loci revealed significant population
structure among three populations: northern (San Francisco), central (Santa
Barbara, Santa Catalina, Punta Lobos, and San Felipe), and southern (Costa
Rica). Patterns of long-term and contemporary migration were incongruent,
with long-term migration being asymmetric and occurring in a north to south
direction and a lack of significant contemporary migration observed between
localities with the exception of Punta Lobos that contributed migrants to all
localities within the central population. Our findings indicate that Point Con-
ception may be restricting gene flow between the northern and central popula-
tions whereas barriers to gene flow within the central population would seem
to be ineffective; additionally, a contemporary expansion of tropical M. henlei
into subtropical and temperate waters may have been observed.
Introduction
Biogeographic and phylogeographic barriers are known to
disrupt population connectivity and are produced by cur-
rents, changes in sea surface temperature (SST), physical
barriers, upwelling, and resource availability (Palumbi
1994; Dawson 2001; Dawson et al. 2001; Jacobs et al.
2004). The eastern Pacific is an area comprising numer-
ous biogeographic and phylogeographic barriers, the most
prominent being located at Cape Mendocino, Point Con-
ception, the Los Angeles Region (LAR), Punta Eugenia,
the Peninsula of Baja California, the Sinaloan Gap, the
Central American Gap, the Isthmus of Panama, and the
Equator (Rawson et al. 1999; Stepien et al. 2000; Dawson
2001; Dawson et al. 2001, 2006; Jacobs et al. 2004; Rob-
ertson and Cramer 2009). The impact of these barriers on
population connectivity can vary in magnitude depending
on their age and degree of obstruction. For example, the
Isthmus of Panama, which is relatively recent (~3.5–3.1million years ago), has altered current patterns, increased
tidal amplitudes, affected upwelling, and severed gene
flow between eastern Pacific, western Atlantic, and Carib-
bean taxa (Coates and Obando 1996; Dick et al. 2003;
Coates et al. 2004; Duncan et al. 2006; Keeney and Heist
2006). Barriers can also produce population structure
along latitudinal gradients. Chabot and Allen (2009) have
demonstrated significant population structure among
populations of the soupfin shark, Galeorhinus galeus,
ª 2015 The Authors. Ecology and Evolution published by John Wiley & Sons Ltd.
This is an open access article under the terms of the Creative Commons Attribution License, which permits use,
distribution and reproduction in any medium, provided the original work is properly cited.
1

straddling the Equator, hypothesizing that the species
affinity for cool temperate waters limits its ability to
cross-warm equatorial waters.
Within the eastern Pacific, the brown smoothhound
shark, Mustelus henlei (Gill, 1863) (Triakidae) (Fig. 1),
has the greatest distribution of any Mustelus within the
region. The species is commonly encountered in temper-
ate to tropical coastal waters at depths ranging from the
shallow intertidal to 200 m (Ebert 2003) with a geo-
graphic range spanning Coos Bay, Oregon (North Amer-
ica) to Peru and Ecuador (South America) (Compagno
1984; Eschmeyer et al. 1999) and a recent discovery of
the species off the coast of Washington (North America)
(D. Ebert, pers. comm.). Although M. henlei is considered
to occur primarily in the northeastern Pacific, observa-
tions of this species off the coasts of Peru and Ecuador
(Compagno 1984) may indicate the ability of this species
to cross-warm equatorial waters. Estimates of maximum
total length and age are reported as 100 cm and 13 years
(Yudin and Cailliet 1990; Smith et al. 1998) with esti-
mates of age at first maturity occurring between 2 and
3 years (Yudin and Cailliet 1990). Reproduction is
through placental viviparity with periods of gestation last-
ing ~1 year and each female capable of producing
between 1 and 20 pups depending on geographic locality
(n = 1–10 in Central California vs. 1–21 in the northern
Gulf of California) (Yudin 1987; P�erez Jim�enez and Sosa
Nishizaki 2008). During the winter, M. henlei from San
Francisco Bay are known to migrate out of the Bay when
salinity decreases due to increased rainfall and have been
observed offshore from November to April (Compagno
1984; Yudin and Cailliet 1990). However, it is currently
unknown where these sharks migrate to or the extent of
their migration.
In order to determine the impact of eastern Pacific bi-
ogeographic and phylogeographic barriers on gene flow
within the Triakidae, both nuclear (microsatellite) and
mitochondrial (control region) genetic markers were used
to reconstruct the phylogeographic history of M. henlei as
well as to elucidate contemporary gene flow within the
distribution of the species. The matrilineally transmitted,
noncoding, mitochondrial control region (mtCR) is con-
sidered a selectively neutral marker that lacks recombina-
tion and mutates at a relatively high rate, making it
effective for detecting historic or evolutionary structure
among populations (Avise 2004; Wang 2010). Due to
their relatively high mutation rates and bi-parental mode
of transmission, microsatellites are also ideal for testing
gene flow among populations and provide a more con-
temporary glimpse into the gene flow of species (Avise
2004; Wang 2010). The purpose of this study was to
determine the patterns of population connectivity among
sample localities of M. henlei throughout its northeastern
Pacific distribution and to identify biogeographic and
phylogeographic barriers that may be responsible for
shaping these patterns.
Materials and Methods
Sample acquisition and DNA extraction
Adult specimens of both male and female M. henlei were
collected from throughout the species’ distribution by
trawling, beach seine, and gill netting. An adult M. henlei
from 2012 was deposited at the Scripps Institute of Ocean-
ography as a voucher specimen (SIO 13–25). In total, 169
tissue samples were collected from six geographic locations:
31 from San Francisco Bay, CA (37.7750° N, 122.4183° W),
34 from Santa Barbara, CA (34.4208° N, 119.6972° W), 30
from Santa Catalina Island, CA (33.3749° N, 118.4199° W),
30 from Punta Lobos, Baja California Sur, Mexico
(26.9841667° N, 113.9994° W), 12 from the Upper Gulf of
California (G.O.C.) at San Felipe, Baja California, Mexico
(31.0275° N, 114.8353° W) and 32 from Costa Rica
(9.9500° N, 84.0000° W). Fin clips (1 cm2) were taken
from the first dorsal fin, placed in 95% ethanol, and stored
at �20°C at UCLA for long-term storage until DNA could
be extracted. DNA was extracted using the DNeasy Blood
and Tissue Kit (Qiagen, Valencia, CA) following the manu-
facturer’s protocols.
Mitochondrial DNA (mtDNA) sequencing
The mitochondrial control region was amplified as
described in Chabot and Allen (2009) using universal
shark mitochondrial control region primers. BigDye 3.1
(Life Technologies, New York, NY) dye-termination
sequencing was carried out using sequencing primers
designed for M. henlei: MhenFSeqPrimer 50- TGC TAC
GAC GCG CAA AAG CC and MhenRSeqPrimer 50-CGTCGG CCC TCG TTT TAG GGG. Sequencing reactions
were performed in an Applied Biosystems GeneAmp 9700
thermocycler (Life Technologies) for 35 cycles of 90°C for
10 sec, 50°C for 10 sec, and 60°C for 4 min, followed by
direct sequencing in an Applied Biosystems 3130X
Genetic Analyzer (Life Technologies). Sequencing prod-
ucts were validated by eye in GENEIOUS PRO 5.1.4 (Bio-
matters Ltd., Auckland, New Zealand) and aligned usingFigure 1. Mustelus henlei.
2 ª 2015 The Authors. Ecology and Evolution published by John Wiley & Sons Ltd.
Brown Smoothhound Phylogeography C. L. Chabot et al.

CLUSTALW (Thompson et al. 1994) within GENEIOUS
PRO.
mtDNA genetic diversity and female-mediated gene flow
ARLEQUIN 3.5.1.2 (Excoffier and Lischer 2010) was used
to estimate haplotype diversity (h), mean nucleotide
diversity (p), mean pairwise difference, and the popula-
tion mutation parameter hs (based on the number of seg-
regating sites, sample size, and h for a sample of non-
recombining DNA). Effective female population size, Nef,
was estimated for each sample locality and based on the
equation hs = 2Nefu (u = 2 lk, where l is the mutation
rate and k is the number of nucleotides). The mutation
rate, l, of 0.0067 sequence divergence per million years
based on lemon sharks, Negaprion (Schultz et al. 2008),
was used in all calculations of Nef. An analysis of molecu-
lar variance (AMOVA) (Excoffier et al. 1992) was per-
formed in GENALEX 6.501 (Peakall and Smouse 2006) to
calculate the divergence estimator ΦST for all sample
localities and all estimates were tested nonparametrically
(9999 bootstrapped replicates). Pairwise estimates of ΦST
were generated for all pairs of sample localities in GEN-
ALEX, and significance was tested via permutation. Sig-
nificance was adjusted to correct for multiple tests using
the sequential Bonferroni correction of Rice (1989). Spa-
tial autocorrelation was tested using an isolation by dis-
tance model in GENALEX and statistical significance was
determined by permutation (9999 replicates). As the
Costa Rican sample locality has the greatest geographic
distance from all localities due to a lack of sampling along
the Mexican coast between Costa Rica and the northern
localities, a significant pattern of isolation by distance
may be observed solely due to a lack of sampling along
the Mexican coast. To account for this, analyses were per-
formed both with and without Costa Rica. Coalescent-
based estimates of long-term gene flow among the six
sample localities were generated in MIGRATE-N 3.2.7
(Beerli and Felsenstein 2001) and based on M (where
M = m/l and m is the migration rate per generation and
l is the mutation rate). For the MIGRATE-N analysis, an
initial analysis under the default parameters was used to
estimate h for all populations as well as migration rates
for all population pairwise comparisons. Following this,
two subsequent runs with different starting seeds using
these estimates as priors were performed and averaged to
generate h and M. A median-joining network of haplo-
types was constructed in NETWORK 4.6.1 (Bandelt et al.
1999; www.fluxus-engineering.com) to visualize haplotype
clustering and diversity. Following the generation of an
initial median-joining network, the MP option (Polzin
and Daneshmand 2003) was used to calculate and screen
the network to delete superfluous median vectors and
links that are not contained in the shortest trees.
Female population expansion
Tajima’s D (Tajima 1989, 1993, 1996) and Fu’s FS (Fu
1997) were calculated in ARLEQUIN and used to detect
historic demographic expansions. Tajima’s D compares two
estimators of the population parameter h (hS based on the
number of segregating sites and hp based on the mean
number of pairwise differences between haplotypes) (Taj-
ima 1989, 1996). Under the infinite sites model, both
estimates should be equal indicating a population at equi-
librium and a D of ~0. In contrast, significantly negative
values of D (P ≤ 0.05) are indicative of populations not in
equilibrium due possibly to a recent range expansion or
recovery from a population bottleneck (Tajima 1989, 1993,
1996; Aris-Brosou and Excoffier 1996). Similar to Tajima’s
D, Fu’s FS statistic is also sensitive to population expansion
under the infinite sites model with significantly negative FSvalues (P ≤ 0.02) indicating an excess of novel haplotypes
and a departure from equilibrium (Fu 1997). Population
expansion times were estimated from Tau (s) values, the
amount of mutational time in which all lineages within a
sample coalesce, derived from mismatch distributions (Rog-
ers and Harpending 1992) calculated in ARLEQUIN. Gen-
erations since divergence, t, were estimated by the equation
s = 2lt (with t = the number of generations and l = the
mutation rate) (Rogers and Harpending 1992). Expansion
time, T, was estimated by multiplying t by 4.7, the average
generation time of M. henlei (Cortes 2002).
Microsatellite genotyping and analyses
Six nuclear microsatellite loci from Chabot (2012) (Mh1,
Mh6, Mh13, Mh25, Mh34, and Mh36) were used to
genotype individuals of M. henlei from all sample locali-
ties following the procedures of Chabot (2012). MICRO-
CHECKER 2.2.3 (van Oosterhout et al. 2004) was used to
detect the presence of null alleles, large allele dropout,
and stuttering. Departures from Hardy–Weinberg equilib-
rium (HWE), observed heterozygosity (HO), and expected
heterozygosity (HE) were estimated in GENEPOP 4.0
(Raymond and Rousset 1995; Rousset 2008). FSTAT
2.9.3.2 (Goudet 2003) was used to test linkage disequilib-
rium (LD), provide the total number of alleles, and esti-
mate allelic richness (AR).
Genetic divergence and populationstructure
STRUCTURE 2.3.3 (Pritchard et al. 2000; Falush et al.
2003, 2007) was used to estimate population subdivision
ª 2015 The Authors. Ecology and Evolution published by John Wiley & Sons Ltd. 3
C. L. Chabot et al. Brown Smoothhound Phylogeography

in M. henlei. Number of subpopulations (K) was esti-
mated with five independent runs of K = 1–10, each was
performed with 106 MCMC repetitions and a burn-in of
105 steps under the admixture model with correlated
allele frequencies. The optimal number of subpopulations
was estimated using DK of Evanno et al. (2005) as
implemented in STRUCTURE HARVESTER 0.6.94 (Earl
and vonHoldt 2012). Overall population structure was
estimated by AMOVA as implemented in GENALEX.
Estimates were tested nonparametrically (9,999 boot-
strapped replicates). Pairwise population estimates of FSTwere generated for all pairs of sample localities in GEN-
ALEX, and significance was tested via permutation. The
sequential Bonferroni correction of Rice (1989) was used
to correct for multiple testing. Spatial autocorrelation
was tested using an isolation by distance model in
GENALEX (Peakall and Smouse 2006), and statistical
significance was determined by permutation (9999
replicates).
FST is commonly used to assess population subdivi-
sion; however, due to the high mutation rate of micro-
satellites, FST may underestimate population subdivision
(Rousset 1996). Therefore, Hedrick0s G’ST (Hedrick
2005; Meirmans and Hedrick 2011) and Jost’s (2008)
were estimated in GENALEX and statistical significance
was evaluated by permutation (9999 replicates). Both
estimators produce values between 0 and 1 with 0 indi-
cating complete panmixia and 1 being indicative of a
lack of migration.
Biparental gene flow
Historic and contemporary estimates of gene flow were
generated in MIGRATE-N and BAYESASS 3.0.3 (Wilson
and Rannala 2003). For the MIGRATE-N analysis, an
initial analysis under the default parameters was used to
estimate h for all populations as well as rates of gene
flow for all population pairwise comparisons. Following
this, five subsequent runs with different starting seeds
using these estimates as priors were performed and aver-
aged to generate h and M. For BAYESASS, five analyses
were performed with different starting seeds and were
averaged to produce a single estimate of migration with
95% credible sets for each pairwise comparison. Each
analysis consisted of twenty million iterations with the
first two million iterations discarded as burn-in and DA,
DF, and DM set to 0.3, 0.6, and 0.1, respectively. To
determine the convergence of runs, mean log-probabili-
ties were compared among runs and total log-likelihood
was plotted versus iteration in TRACER 1.5 (Rambaut
and Drummond 2007) to determine whether runs con-
sisted of regular oscillations (i.e., no persistent peaks and
valleys).
Population bottleneck
When populations undergo recent declines in effective
population sizes (Ne) due to bottlenecks, observed hetero-
zygosity at neutral loci is generally greater than that
expected by the number of alleles. To detect recent
declines in Ne within populations of M. henlei, BOTTLE-
NECK 1.2.02 (Piry et al. 1999) was used under the
two-phase model (TPM) with 20,000 replications, 5% of
multistep mutations, and variance among multiple steps of
12 as recommended for microsatellites (Piry et al. 1999).
The significance of any observed heterozygote excess was
assessed by a one-tailed Wilcoxon’s signed rank test; a test
considered to be the most informative and robust for mi-
crosatellites (Piry et al. 1999). To further investigate the
possibility of bottlenecked populations of M. henlei, the M
ratio test of Garza and Williamson (2001) was calculated
for each population in M_P_val GLO.3 (Garza and Wil-
liamson 2001) and a critical value of MC was estimated by
CRITICAL_M (Garza and Williamson 2001). The M ratio
test calculates the ratio of the number of alleles at a given
locus and the range of allele sizes with the expectation that
the number of alleles in a population that has experienced
a bottleneck will be reduced faster than the range of allele
sizes (Garza and Williamson 2001). Parameters for the M
ratio test h, ps (proportion of single-step mutations), and
Dg (average size of non-single-step mutations) were
obtained from MIGRATE-N (h) and Garza and William-
son (2001) (Ps = 0.88 and Dg = 2.8). Prebottleneck values
of h for CRITICAL_M were estimated from equilibrium
heterozygosities (He) (Table 1B) and the equation 1-He =1/1 + h. Conservative values recommended by Garza and
Williamson (2001) for Ps = 0.9 and Dg = 3.5 were used for
CRITICAL_M.
Results
Mitochondrial data
Nucleotide and haplotype diversity
PCR and sequencing were attempted for all 169 samples;
however, of these samples, 126 yielded high-quality con-
trol region sequences of approximately 700 bp that were
used for this study. Within all localities (excluding San
Felipe), a minimum of at least 20 individuals were ampli-
fied successfully and sequenced. Nucleotide composition
of control region sequences was as follows: cytosine,
19.00%, thymine, 35.84%, adenine, 30.14%, and guanine,
15.01%. Overall, 28 polymorphic sites were observed in
control region sequences of M. henlei consisting of 16
transitions, 11 transversions, and a single insertion/dele-
tion defining 27 haplotypes (GenBank Accession Numbers
KC208467–KC208482 and KJ530691–KJ530703). Of the
4 ª 2015 The Authors. Ecology and Evolution published by John Wiley & Sons Ltd.
Brown Smoothhound Phylogeography C. L. Chabot et al.

27 haplotypes, 20 were unique to their sample locality
(San Francisco = SF1; Santa Barbara = SB4, SB17, SB28;
Punta Lobos = PL1, PL10, PL27, PL30, PL39; San Felipe
= GOC11; Costa Rica = CR1, CR2, CR6, CR11, CR16,
CR20, CR26, CR38, CR40, CR43). Of the remaining seven
haplotypes, SB15 was observed in all localities (excluding
Costa Rica) with frequencies ranging from 0.39 to 0.95;
SB11, SB14, and PL18 were observed at Santa Barbara,
Punta Lobos, and San Felipe, and SB19 was observed at
Santa Barbara and Punta Lobos. Although the Costa Rica
sample was composed almost entirely of unique haplo-
types, haplotype SB14 was observed at this locality as well.
Of the sampled localities, only Santa Catalina lacked any
unique haplotypes and was dominated by haplotypes
SB15 (0.95) and SB23 (0.05).
mtDNA divergence and female gene flow
Observed sequence divergences of M. henlei ranged
between 0.10% and 0.60% (Table 1A) and average pair-
wise nucleotide differences ranged between 0.48 and 4.27
among localities (Table 1A). Effective female population
sizes ranged between 12,586 and 179,849 (Table 1A). Sig-
nificant mtDNA genetic structure was observed with
34.61% (P < 0.00001) of the variation being observed
among sampled localities (Table 2A). Pairwise ΦST values
ranged between 0 and 0.51 with San Francisco and Costa
Rica demonstrating significant pairwise divergences
(P ≤ 0.0033) between all other localities (Table 3). Over-
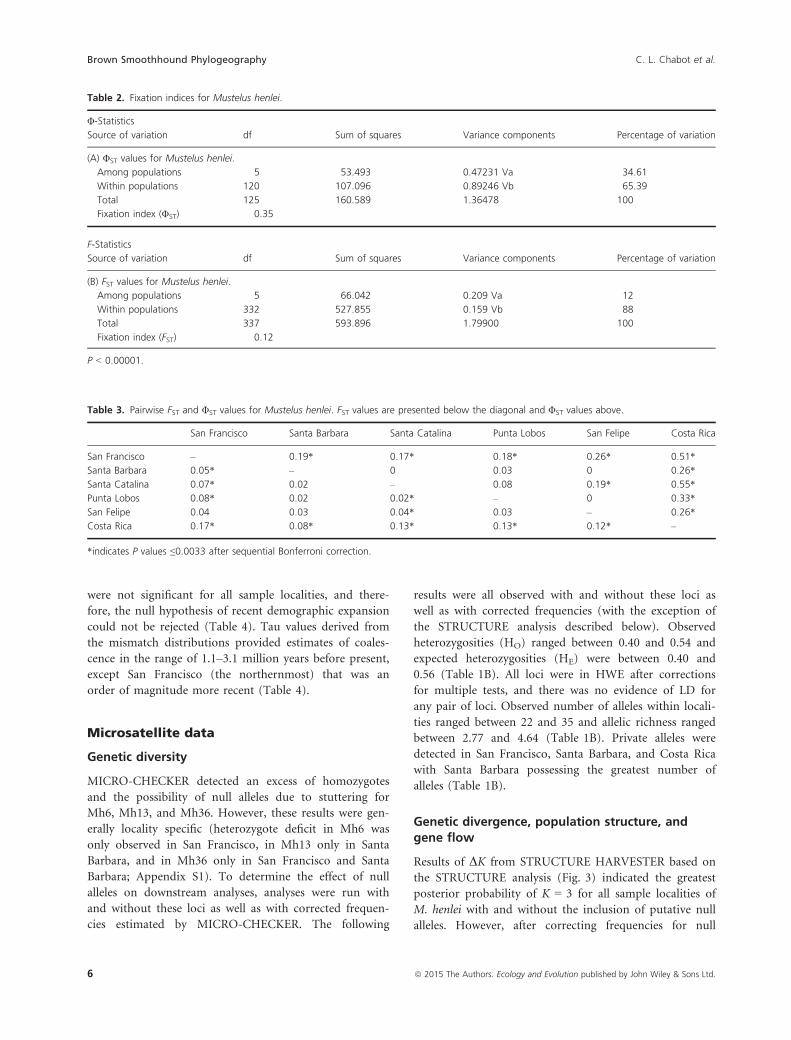
all, migration rates determined by MIGRATE-N were
asymmetric with gene flow occurring predominantly in a
southward direction (Fig. 4; Appendix S2A). On regional
scales, migration between Santa Catalina and Santa Bar-
bara demonstrated asymmetric rates with Santa Barbara
receiving immigrants from Santa Catalina and the three
southern localities (Punta Lobos, San Felipe, and Costa
Rica) demonstrating a complete lack of emigration into
neighboring localities (Appendix S2A). Significant isola-
tion by distance was observed (r = 0.22, P < 0.00001)
when all sample localities were analyzed together. When
Costa Rica was excluded from the analysis, nonsignificant
isolation by distance (P = 0.451) was observed. The med-
ian-joining network demonstrated a general lack of diver-
gence among localities with many of the haplotypes
diverging from the most frequently observed haplotype,
SB15, by a single mutation (Fig. 2).
Female population expansion
Of the localities, Santa Barbara, Santa Catalina, Punta
Lobos, and Costa Rica demonstrated negative Tajima’s D
values with significance (P ≤ 0.05) being observed in all
but Costa Rica (Table 1A). Negative FS values were
observed in Santa Barbara, Punta Lobos, and Costa Rica
with only Santa Barbara and Costa Rica being significant
(P ≤ 0.02) (Table 1). Results of mismatch distributions
Table 1. Genetic diversity of Mustelus henlei. (A) N, haplotype number; haplotype diversity (h); mean nucleotide diversity (p); mean pairwise dif-
ference (MPD); coancestry coefficient (hS); effective female population size (Nef); * indicates significant P values for Tajima’s D and Fu’s F < 0.05
and 0.02, respectively. (B) N, number of individuals, HO avg. observed heterozygosity; HE avg. expected heterozygosity; B, Wilcoxon’s test proba-
bility of heterozygote excess under the two-phase model (TPM); GW, avg. Garza–Williamson M ratio (* indicates M ratios less than MC); A, num-
ber of alleles; AR, avg. allelic richness; PA, private alleles.
Locality N h p MPD hS Nef Tajima’s D Fu’s F
(A) Summary of mtDNA statistics for Mustelus henlei.
Overall 126 0.77 � 0.04 0.004 � 0.003 2.94 � 1.55 4.81 2,45,408 �1.53* �10.34*
San Francisco 27 0.48 � 0.05 0.001 � 0.001 0.48 � 0.43 0.26 12,586 1.40 1.51
Santa Barbara 20 0.83 � 0.08 0.005 � 0.003 3.41 � 1.80 3.38 1,72,449 �0.60* �2.23*
Santa Catalina 21 0.10 � 0.80 0.001 � 0.001 0.86 � 0.60 1.11 56,633 �1.39* 2.59
Punta Lobos 23 0.83 � 0.07 0.006 � 0.004 4.27 � 2.20 3.52 1,79,849 �0.79* �0.93
San Felipe 11 0.80 � 0.11 0.004 � 0.003 2.69 � 1.55 1.71 87,370 0.01 �0.80
Costa Rica 24 0.87 � 0.05 0.004 � 0.003 2.26 � 1.29 2.41 1,50,474 �0.21 �3.31*
Locality N HO HE A AR PA B GW
(B) Summary microsatellite statistics for Mustelus henlei.
Overall 169 0.45 0.56 44 4.11 – – –
San Francisco 31 0.45 0.49 28 2.77 4 NS 0.56*
Santa Barbara 34 0.45 0.56 35 4.64 5 NS 0.79
Santa Catalina 30 0.47 0.54 26 3.73 0 NS 0.76
Punta Lobos 30 0.45 0.52 28 4.04 0 NS 0.76
San Felipe 12 0.54 0.52 22 3.44 0 NS 0.74
Costa Rica 32 0.40 0.40 22 2.82 3 NS 0.83
ª 2015 The Authors. Ecology and Evolution published by John Wiley & Sons Ltd. 5
C. L. Chabot et al. Brown Smoothhound Phylogeography
were not significant for all sample localities, and there-
fore, the null hypothesis of recent demographic expansion
could not be rejected (Table 4). Tau values derived from
the mismatch distributions provided estimates of coales-
cence in the range of 1.1–3.1 million years before present,
except San Francisco (the northernmost) that was an
order of magnitude more recent (Table 4).
Microsatellite data
Genetic diversity
MICRO-CHECKER detected an excess of homozygotes
and the possibility of null alleles due to stuttering for
Mh6, Mh13, and Mh36. However, these results were gen-
erally locality specific (heterozygote deficit in Mh6 was
only observed in San Francisco, in Mh13 only in Santa
Barbara, and in Mh36 only in San Francisco and Santa
Barbara; Appendix S1). To determine the effect of null
alleles on downstream analyses, analyses were run with
and without these loci as well as with corrected frequen-
cies estimated by MICRO-CHECKER. The following
results were all observed with and without these loci as
well as with corrected frequencies (with the exception of
the STRUCTURE analysis described below). Observed
heterozygosities (HO) ranged between 0.40 and 0.54 and
expected heterozygosities (HE) were between 0.40 and
0.56 (Table 1B). All loci were in HWE after corrections
for multiple tests, and there was no evidence of LD for
any pair of loci. Observed number of alleles within locali-
ties ranged between 22 and 35 and allelic richness ranged
between 2.77 and 4.64 (Table 1B). Private alleles were
detected in San Francisco, Santa Barbara, and Costa Rica
with Santa Barbara possessing the greatest number of
alleles (Table 1B).
Genetic divergence, population structure, andgene flow
Results of DK from STRUCTURE HARVESTER based on
the STRUCTURE analysis (Fig. 3) indicated the greatest
posterior probability of K = 3 for all sample localities of
M. henlei with and without the inclusion of putative null
alleles. However, after correcting frequencies for null
Table 2. Fixation indices for Mustelus henlei.
Φ-Statistics
Source of variation df Sum of squares Variance components Percentage of variation
(A) ΦST values for Mustelus henlei.
Among populations 5 53.493 0.47231 Va 34.61
Within populations 120 107.096 0.89246 Vb 65.39
Total 125 160.589 1.36478 100
Fixation index (ΦST) 0.35
F-Statistics
Source of variation df Sum of squares Variance components Percentage of variation
(B) FST values for Mustelus henlei.
Among populations 5 66.042 0.209 Va 12
Within populations 332 527.855 0.159 Vb 88
Total 337 593.896 1.79900 100
Fixation index (FST) 0.12
P < 0.00001.
Table 3. Pairwise FST and ΦST values for Mustelus henlei. FST values are presented below the diagonal and ΦST values above.
San Francisco Santa Barbara Santa Catalina Punta Lobos San Felipe Costa Rica
San Francisco – 0.19* 0.17* 0.18* 0.26* 0.51*
Santa Barbara 0.05* – 0 0.03 0 0.26*
Santa Catalina 0.07* 0.02 – 0.08 0.19* 0.55*
Punta Lobos 0.08* 0.02 0.02* – 0 0.33*
San Felipe 0.04 0.03 0.04* 0.03 – 0.26*
Costa Rica 0.17* 0.08* 0.13* 0.13* 0.12* –
*indicates P values ≤0.0033 after sequential Bonferroni correction.
6 ª 2015 The Authors. Ecology and Evolution published by John Wiley & Sons Ltd.
Brown Smoothhound Phylogeography C. L. Chabot et al.

alleles, a K = 2 demonstrated the greatest DK with San
Francisco clustering with the central population. Overall,
AMOVA demonstrated significant structure among sam-
pled localities (FST = 0.12; P < 0.00001) (Table 2B). Sig-
nificant genetic structure based on pairwise FST values
was detected between San Francisco, Santa Catalina, and
Costa Rica and all other localities after Bonferroni correc-
tions, with the exception of San Felipe and Santa Barbara
that were not significantly different from San Francisco
and Santa Catalina, respectively (Table 3). Pairwise G00ST
and estimates of Jost’s D recovered the same pattern of
genetic divergence as those of pairwise FST presented
above (Table 5). Significant isolation by distance was
observed (r = 0.21 P < 0.00001) when all sample localities
were analyzed together. However, when Costa Rica was
excluded from the analysis, significant, yet reduced isola-
tion by distance was observed. (r = 0.08, P = 0.002)
Long-term estimates of gene flow among population pairs
were asymmetric with the predominant direction of gene
flow being in a north–south direction (Fig. 4; Appendix
S2B). Interestingly, the opposite pattern is observed in
Costa Rica as the direction of gene flow is from the south
to the north (Fig. 4; Appendix S2B). Overall, estimates of
contemporary gene flow demonstrated a lack of signifi-
cant gene flow among sample localities (Appendix S3).
However, Punta Lobos did contribute significantly to
Santa Barbara, Santa Catalina, and San Felipe but not to
San Francisco and Costa Rica (Fig. 4; Appendix S3). Of
note, algorithm bounds in BAYESASS limit the propor-
tion of nonmigrants and migrants to 0.67 and 0.33,
respectively and values in these ranges may not be indica-
tive of actual migration proportions. As the estimates of
migration (0.138–0.186; Appendix S3) and 95% credible
sets (0.007–0.318; Appendix S3) from Punta Lobos to
Santa Barbara, Santa Catalina, and San Felipe are less
than the lower model bound, these estimates are not rep-
resentative of the limitations imposed by the model.
Population bottleneck
BOTTLENECK did not reveal any significant heterozygote
excess in any of the populations of M. henlei (Table 1B).
Garza–Williamson M ratio values were all between 0.74
and 0.83 and above critical values of MC with the excep-
tion of San Francisco (Table 1B).
Discussion
Biogeographic and phylogeographic barriers
This is the first range-wide genetic investigation of gene
flow of a member of Mustelus in the northeastern Pacific.
Significant structure was observed among sample localities
of M. henlei based on mitochondrial control region
sequences and nuclear microsatellite data (Tables 2 and 3,
and Fig. 3). Three distinct populations can be described:
a northern population made up entirely of individuals
from San Francisco, a central population composed of
individuals from Santa Barbara, Santa Catalina, Punta
Lobos, and San Felipe, and a southern population com-
posed entirely of individuals from Costa Rica. These pop-
ulations correspond to the biogeographic provinces of the
Oregonian, a blending of the San Diegan and Cortez
Provinces, and the Panamic Provinces (Horn et al. 2006;
Stephens et al. 2006; Robertson and Cramer 2009).
Throughout these provinces, there are several biogeo-
graphic and phylogeographic barriers that have been
described for various taxa with Point Conception, the Los
Angeles Region (LAR), and the Peninsula of Baja Califor-
nia exerting the most influence on the population con-
nectivity of northeastern Pacific temperate taxa (Rawson
Figure 2. Median-joining network of mtCR haplotypes for Mustelus
henlei. Circles represent individual haplotypes with size proportional
to frequency, branches indicate mutations, and black circles are
hypothetical ancestors. Localities are as follows: San Francisco Bay
(Blue), Santa Barbara (Yellow), Santa Catalina Island (Green), Punta
Lobos (Gray), San Felipe (Red), and Costa Rica (White). Numbers of
samples per circle size are represented at bottom right.
ª 2015 The Authors. Ecology and Evolution published by John Wiley & Sons Ltd. 7
C. L. Chabot et al. Brown Smoothhound Phylogeography

et al. 1999; Stepien et al. 2000; Dawson 2001; Dawson
et al. 2001; Bernardi et al. 2003; Jacobs et al. 2004; Hyde
and Vetter 2009).
The classification of Point Conception as a biogeo-
graphic barrier (Briggs 1974) and the LAR as a phylogeo-
graphic barrier (Dawson 2001; Dawson et al. 2001) is
generally based on the patterns of observed disjunctions
between populations of relatively small-sized taxa with
limited adult dispersal that rely on currents to distribute
larvae. However, as further studies of taxa with distribu-
tions spanning, this area have demonstrated varying
degrees of disjunction across the barrier, Point Concep-
tion has been reclassified as a gradual transition zone
between northern and southern lineages (Horn et al.
2006; Pelc et al. 2009; Briggs and Bowen 2013). Species
with large, actively dispersing adults such as the leopard
shark, Triakis semifasciata (Triakidae), and the California
halibut, Paralichthys californicus, from the northeastern
Pacific with distributions spanning the LAR and Point
Conception have revealed similar patterns of gene flow
across Point Conception but contrasting patterns across
the LAR. Craig et al. (2011) used mitochondrial data to
reveal an overall lack of structure among populations of
P. californicus sampled from throughout the northeastern
Pacific and a lack of structure specifically across the LAR
and Point Conception and concluded that the species is
comprised of a single panmictic population, at least over
evolutionary time scales. Lewallen et al. (2007) observed
significant structure among sample localities of T. semi-
fasciata based on mitochondrial data and reduced nuclear
genetic variation among sample localities between Elk-
horn Slough (Monterey Bay, CA) and the LAR. Based on
these observations, Lewallen et al. (2007) concluded that
the LAR provided a diffuse barrier to gene flow and acted
as a transition zone between populations North and
South of the LAR and that Point Conception had no
effect on population connectivity.
Along the California coast, P. californicus, T. semifasci-
ata, and M. henlei are commonly encountered together.
Commercial halibut trawlers commonly encounter
M. henlei during trawls (M. McCorkle, pers. comm.) and
leopard sharks have been observed among aggregations of
M. henlei (Ebert 2003) and share various life-history char-
acteristics including preferences in habitat (Love 1996)
and food (Haeseker and Cech 1993; Webber and Cech
1998). Based on co-occurrence and shared life-history
characteristics among the three species, it follows that
M. henlei could also be influenced by the same barrier to
dispersal (LAR but not Point Conception). Instead, our
data show that the northern population of San Francisco
is significantly differentiated from the central population.
Hence, unlike P. californicus and T. semifasciata, Point
Conception may be acting as a barrier to dispersal in
M. henlei. In regards to the LAR, patterns of population
connectivity throughout this area among localities of
M. henlei (Table 3 and Fig. 3) are similar to those of
Craig et al. (2011) and Lewallen et al. (2007) and indicate
that this phylogeographic barrier is not effective at reduc-
ing gene flow among localities within the central popula-
tion of M. henlei.
The Peninsula of Baja California is a tectonically active
region that has undergone plate spreading, uplifting, and
subduction as the Gulf of California has expanded in size
over the past 3.5–12 million years (Holt et al. 2000). As a
result, it has been hypothesized that ephemeral seaways
have existed between the Pacific and the Gulf of Califor-
nia over this time period with the most recent occurring
Table 4. Estimates of Tau, h0, h1, and expansion times (T) for sample
localities of Mustelus henlei. SSD is the sum of squared differences
from mismatch distributions with significant values (P ≤ 0.05 table-
wide) indicated by *.
Locality Lower Bound Mean Upper Bound
San Francisco
SSD = 0.019
Tau 0 0.70 1.38
h0 0 0 0.49
h1 9.37 99,999 99,999
T 0 3,17,569 6,26,454
Santa Barbara
SSD = 0.028
Tau 0.28 6.70 12.35
h0 0 0 1.83
h1 1.42 4.34 99,999
T 1,27,597 30,39,575 56,04,398
Santa Catalina
SSD = 0.013
Tau 0.63 3.00 3.00
h0 0 0 0
h1 0 0.05 99,999
T 2,85,318 13,61,003 13,61,003
Punta Lobos
SSD = 0.032
Tau 1.10 6.90 11.65
h0 0 0 3.00
h1 4.67 8.89 99,999
T 4,99,742 31,30,308 52,79,825
San Felipe
SSD = 0.024
Tau 0.12 5.40 30.38
h0 0 0 3.33
h1 0.96 4.26 99,999
T 54,934 24,49,809 1,37,82,821
Costa Rica
SSD = 0.003
Tau 0.31 2.00 5.81
h0 0 0.21 1.07
h1 2.69 5.93 99,999
T 1,74,577 11,10,375 6,85,910
8 ª 2015 The Authors. Ecology and Evolution published by John Wiley & Sons Ltd.
Brown Smoothhound Phylogeography C. L. Chabot et al.

in the La Paz region during the Pleistocene (Walker
1960). This seaway would have allowed for the migration
of marine species across the Peninsula, while maintaining
the barrier produced by the warm surface waters of the
Cape (Bernardi et al. 2003). Population disjunction has
been observed in numerous species with distributions
spanning both sides of the Cape including spotted sand-
bass, Paralabrax maculatofasciatus, (Tranah and Allen
1999; Stepien et al. 2000), opaleye, Girella nigricans, (Ber-
nardi et al. 2003), grunion, Leuresthis tenuis/sardina (Ber-
nardi et al. 2003), sargo, Anisotremus davidsonii (Bernardi
et al. 2003), longjaw mudsucker, Gillichthys mirabilis
(Bernardi et al. 2003), shovelnose guitarfish, Rhinobatos
productus (Sandoval-Castillo et al. 2004), golden cownose
ray, Rhinoptera steindachneri (Sandoval-Castillo and
Rocha-Olivares 2011), and banded guitarfish, Zapteryx ex-
asperata (Castillo-P�aez et al. 2014). As demonstrated by
the variety of species listed above, this barrier is effective
at inhibiting gene flow among species with varying size,
vagility, and reproductive strategies including but not
limited to broadcast spawners or internal fertilizers fol-
lowed by either bipartite life-history stages that utilize
planktonic larval dispersal or highly vagile neonates as
observed in sharks, skates, and rays. The generally
accepted mechanism associated with the lack of gene flow
observed between Pacific and Baja California populations
at the Peninsula is the convergence of Pacific and Gulf
Currents at the Cape where cold-temperate species are
unable to round the Cape due to elevated sea surface
temperatures (Bernardi et al. 2003). Although this mecha-
nism may be effective at impeding gene flow in the
majority of observed species, this barrier may not exert as
much of an influence on taxa capable of swimming
beneath warmer surface waters such as the California
sheephead, Semicossyphus pulcher, and the round stingray,
Urobatis halleri, species that have been collected at depths
greater than 50 m within this region (Bernardi et al.
2003) and have demonstrated gene flow between the Paci-
fic and the Gulf of California (Bernardi et al. 2003; Plank
et al. 2010). Similar to S. pulcher and U. halleri, M. henlei
is commonly collected at depths between 60 m and
200 m throughout its distribution (Ebert 2003), a range
of depths that may allow the species to swim beneath the
warm surface waters of the Cape and to disperse around
Figure 3. Population assignment of Mustelus
henlei as estimated by STRUCTURE. Each
individual is represented as a single histogram
with percentage of ancestry on the y-axis and
populations on the x-axis (SF = San Francisco,
SB = Santa Barbara, SC = Santa Catalina, PL =
Punta Lobos, GOC = San Felipe, and CR =
Costa Rica). Spaces have been inserted
between sample localities.
Table 5. Average G0 0ST and Jost’s D for Mustelus henlei. G0 0
ST values are presented below the diagonal and Jost’s D values above.
San Francisco Santa Barbara Santa Catalina Punta Lobos San Felipe Costa Rica
San Francisco – 0.10* 0.15* 0.15* 0.04 0.31*
Santa Barbara 0.17* – 0.02 0.03 0.03 0.15*
Santa Catalina 0.25* 0.03 – 0.03* 0.06* 0.26*
Punta Lobos 0.25* 0.06 0.06* – 0.03 0.24*
San Felipe 0.08 0.05 0.11* 0.06 – 0.21*
Costa Rica 0.50* 0.27* 0.42* 0.41* 0.36* –
*indicates P values ≤0.0033 after sequential Bonferroni correction.
ª 2015 The Authors. Ecology and Evolution published by John Wiley & Sons Ltd. 9
C. L. Chabot et al. Brown Smoothhound Phylogeography
the Cape of the Baja California Peninsula resulting in the
population connectivity observed in the present study
between sample localities on both sides of the Peninsula
(Table 3 and Fig. 3).
The observation of a distinct southern population of
M. henlei at Costa Rica in the present study correspond-
ing to the Panamic Province may be the result of various
biogeographic barriers distributed along the coast of Cen-
tral America that have acted in concert to isolate popula-
tions (Robertson and Cramer 2009). Of these, the
Sinaloan Gap has been associated with the southern
boundary of the Cortez Province for soft-bottomed spe-
cies (Robertson and Cramer 2009). Based on the affinity
of M. henlei for soft-bottomed habitat (Compagno 1984;
Castro 2011), this region may indicate a possible location
as to where the disjunction between the central and
southern populations occurs. Aside from the barriers
described above, distance may also be responsible for the
lack of connectivity between the central and southern
populations of M. henlei. Significant isolation by distance
was observed in the present study; driven primarily by
the divergence between Costa Rica and all other sampled
localities. As the Costa Rican population is the greatest
distance from all other populations (>5000 km to the
nearest localities of San Felipe and Punta Lobos), this
finding is not surprising based on a tagging study of
M. henlei in which an individual traveled a maximum
distance of ~150 km over a three-month period (Ebert
2003). Regardless of isolating mechanism, several lines of
evidence including genetic, phenotypic, and ecological
suggest that the southern population of M. henlei has
most likely been isolated from northern populations for
some time and may be undergoing incipient speciation.
Evidence is that in fish from Costa Rica, virtually all of
the mitochondrial haplotypes are unique to that popula-
tion; the existence of private microsatellite alleles; a smal-
ler TL and size at maturity when compared to M. henlei
in higher latitudes (Clarke et al. 2014); and an observed
shift in the preferred diet of the species when compared
to northern and central populations (fish and cephalo-
pods versus crustaceans, respectively) (Espinoza et al.
2012).
Demographic expansions and bottlenecks
Historic changes in the intensity of upwelling, varying sea
surface temperatures, and repeated glaciations have
resulted in a climatically dynamic coastline throughout
the northeastern Pacific that has affected the distributions
of numerous marine taxa (Hickerson and Ross 2001;
Dawson et al. 2006). One expected effect of oscillating
climate cycles along the coastline is the expansion or con-
traction (i.e., population bottleneck) of marine popula-
tions. Expansion times for M. henlei based on mean Tau
values support an expansion from the central population
of M. henlei to the north and to the south (Table 4). Spe-
cifically, Punta Lobos and Santa Barbara have expansion
times well into the Pliocene followed by San Felipe in the
Plio–Pleistocene, Santa Catalina, and Costa Rica in the
early to mid-Pleistocene, and San Francisco within the
mid to late Pleistocene (Table 4). Demographic expan-
sions or population bottlenecks can leave a mark on the
genetic diversity of populations by either generating novel
genetic variants as a result of rapidly expanding effective
population sizes (Rogers and Harpending 1992) or signifi-
cantly reducing genetic diversity due to severe reductions
in population sizes (Cornuet and Luikart 1996; Piry et al.
1999; Garza and Williamson 2001). BOTTLENECK and
M ratio tests did not detect any significant excesses in
heterozygosity or reductions in the number of alleles rela-
Figure 4. Long-term and contemporary patterns of gene flow (Nem)
for Mustelus henlei. Localities are labeled as follows: San Francisco
(SF), Santa Barbara (SB), Santa Catalina (SC), Punta Lobos (PB), San
Felipe (GC), and Costa Rica (CR). Thin lines depict the results of
MIGRATE-N analyses and the general direction of gene flow as
averaged across localities from the point of origin. Estimates of Nem
with credible sets (CS) not overlapping 0 are provided on either side
of lines (mtCR to the left and microsatellites to the right). Bold lines
depict the direction of gene flow as estimated by BAYESASS with
Nem values with CS’s not including 0 provided.
10 ª 2015 The Authors. Ecology and Evolution published by John Wiley & Sons Ltd.
Brown Smoothhound Phylogeography C. L. Chabot et al.

tive to the range of allele sizes that would be indicative of
bottlenecks for sample localities of M. henlei with the
exception of San Francisco (Table 1B). The value of M
for San Francisco was well below the 0.69 threshold estab-
lished for populations that have undergone a historic bot-
tleneck as described by Garza and Williamson (2001).
However, BOTTLENECK did not detect the signature of
a bottleneck for this locality. It has been noted by Wil-
liamson-Natesan (2005) that the two methods are gener-
ally better for detecting bottlenecks over different time
scales as well as under different mutation rates and pre-
bottleneck population sizes. Generally, detecting a bottle-
neck using heterozygote excess was more effective when
the bottleneck occurred recently, mutation rates were low,
and the prebottleneck population sizes were small (Wil-
liamson-Natesan 2005). In contrast, using the range in
allele size conditioned on the number of alleles worked
best when bottlenecks occurred over several generations,
mutation rates were high, and prebottleneck population
sizes were large (Williamson-Natesan 2005). Therefore,
the observed incongruence between the two methods in
the sample from San Francisco would seem to indicate a
historic population bottleneck that may be due to a foun-
der’s event associated with the expansion of the species’
range during periods of climate change.
Of the sampled localities, San Francisco and Santa Cat-
alina demonstrated the lowest mtDNA diversity
(Table 1A) as both were composed of only two haplo-
types with the majority being the most frequent haplotype
observed in the present study. In San Francisco, this
apparent reduction in diversity may be due to a historic
range expansion northward into the area that would later
become San Francisco Bay followed by the subsequent
colonization of the bay after its formation ~10,000 years
before present (ybp) (Cohen 2000) at the end of the last
glacial maximum. However, mean coalescent times for
M. henlei from San Francisco are well in excess of the for-
mation of San Francisco Bay <10,000 ybp (Table 4). This
apparent lack of concordance could be due to the use of
a mutation rate in the present study that is not specific to
the species or genus. Therefore, caution must be used
when interpreting expansion times as they may be under/
overestimates and are only used here to describe the mag-
nitude of divergence among expansion estimates. Similar
to the present study, a cline of genetic variation in the
northeastern Pacific has also been observed in the acorn
barnacle, Balanus glandula, by Sotka et al. (2004). Sotka
et al. (2004) suggested that one explanation for the
genetic pattern that they observed was that populations
on both sides of the observed cline might have been iso-
lated historically during glacial periods followed by range
expansions and secondary contact once glacial ice
retreated.
In regards to Santa Catalina, it is possible that during
the early Pleistocene gene flow may have been relatively
uninterrupted between this locality and coastal localities
(e.g., Santa Barbara) due to lowered sea levels and shal-
lower coastal basins. However, as sea level began to rise
and coastal basins became deeper, population connectivity
may have been reduced resulting in the more recent
expansion estimate for Santa Catalina in the early to mid-
Pleistocene and the observation of relatively low mito-
chondrial diversity (e.g., only two haplotypes). Deep-
water basins have been shown to be effective barriers to
population connectivity among the northern Channel
Islands (Bernardi 2000) and in taxa distributed on both
sides of the San Pedro Basin within the Southern Califor-
nia Bight (e.g., between Santa Catalina Island and the
southern California coastline) (Gaida 1997; Bernardi
2000; Plank et al. 2010). However, the nonsignificant
population divergence and estimates of long-term gene
flow observed in the present study between Santa Catalina
and Santa Barbara (Table 3 and Appendix S2) do not
support the role of deep-water basins as barriers to popu-
lation connectivity in M. henlei within the Southern Cali-
fornia Bight.
Historic and contemporary gene flow
The North Pacific has been described as an “evolutionary
engine that produces flora and fauna capable of trans-
gressing biogeographic boundaries and become estab-
lished elsewhere” (Briggs and Bowen 2013). These
interhemispheric dispersals generally occur from north to
south (Briggs and Bowen 2013). Extirpations during the
Pleistocene may have allowed northeastern Pacific lineages
to invade South American waters and establish popula-
tions within the region (Jacobs et al. 2004). Results of the
MIGRATE analyses in the present study support a general
pattern of long-term north to south dispersal (Fig. 4;
Appendix S2) that may have led to the establishment of
M. henlei in South America. As populations of M. henlei
are known from Peru and Ecuador (Compagno 1984;
Eschmeyer et al. 1999) and this region comprises the
southern limit of the species’ distribution, it would be
expected that this region would have reduced genetic
diversity and a more recent expansion time when com-
pared to the populations in the North. Further investiga-
tion of this region is needed to confirm this hypothesis
and elucidate the patterns of gene flow within the termi-
nus of the southern distribution of M. henlei.
Contemporary migration estimates from BAYESASS
would seem to paint a different picture from those based
on long-term migration. Overall, a lack of significant
migration was observed to localities such as San Fran-
cisco, Santa Barbara, Santa Catalina, San Felipe, and
ª 2015 The Authors. Ecology and Evolution published by John Wiley & Sons Ltd. 11
C. L. Chabot et al. Brown Smoothhound Phylogeography

Costa Rica (Fig. 4; Appendix S3). However, significant
migration was observed within the central population
with Punta Lobos contributing migrants to all localities
(Fig. 4; Appendix S3). This south to north pattern, with
the exception of the Upper Gulf of California, may be
indicative of the expansion of tropical M. henlei into sub-
tropical and temperate waters. Although the Upper Gulf
of California is separated from the temperate waters of
the San Diegan Province, the Upper Gulf of California is
considered to have a temperate climate as well as temper-
ate taxa associated with California (Robertson and
Cramer 2009).
Conservation
As a family, the Triakidae has been the subject of global
exploitation for greater than 80 years with members being
exploited by commercial fisheries for their large vitamin-
A-rich livers (e.g., Galeorhinus galeus), by artisanal and
recreational fisheries for consumption, and by the aquar-
ium trade (e.g., M. henlei, M. californicus, and T. semifas-
ciata) (Yudin and Cailliet 1990; Ebert 2003; Compagno
et al. 2005; Lewallen et al. 2007). Fishery pressure on
M. henlei is regionally variable with interest in U.S. waters
north of Mexico being minimal and the majority of land-
ings of M. henlei being attributed to by-catch or by recre-
ational anglers as a commercial fishery no longer exists in
these waters (P�erez-Jimen�ez and Carlisle 2009). However,
in the northern waters of the Gulf of California, M. henlei
is still of considerable commercial and artisanal impor-
tance and has been the most abundant species of shark
caught during fall and winter months as landings have
been in excess of 150 kg per hour (P�erez-Jimen�ez and
Carlisle 2009). Furthermore, fishing pressure by artisanal
and semi-industrial fisheries (trawling, long-lines, and gill
nets) is high in Costa Rica and there is currently no man-
agement or regulations on catch limits of M. henlei (M.
Espinoza, pers. obs.). Currently, the IUCN Red List has
listed M. henlei with the threat category Least Concern
due to the observed lack of overfishing of the species, its
fast growth-rate coupled with a relatively low longevity,
an early age at first maturity with a relatively high fecun-
dity, and a lack of evidence of catch declines (P�erez-Ji-
men�ez and Carlisle 2009). Estimated female effective
population sizes (Nef) for M. henlei observed in this study
were all relatively high ranging from ~13,000 to 180,000
(Table 1A). As Nef is generally considered to be ~10% of
the female census size of a population (Frankham et al.
2010), estimated census sizes of sample localities from this
study would be expected to be rather large and would
support the threat category assigned by the IUCN. How-
ever, the generalization of Frankham et al. (2010) is based
on an average obtained from many studies with a huge
range in both effective population and census sizes and
may not be generalizable to sharks. Recent observations
in the sandbar shark, Carcharhinus plumbeus, have dem-
onstrated that the effective population size within a popu-
lation can approximate the census size (Portnoy et al.
2009). Therefore, based on the observation of Portnoy
et al. (2009), it is possible that the estimates of effective
female population size obtained in the present study may
approximate the census size of female populations of
M. henlei. Aside from estimates of effective population
size, the significant gene flow observed among localities,
at least within the central population, detected in this
study along with the observed genetic variation observed
in Santa Barbara (greatest observed genetic diversity with
several locality-specific haplotypes and private alleles) and
Punta Lobos (several locality-specific haplotypes) would
be expected to genetically buffer M. henlei from short-
term population declines of small effect.
Conclusion
As this study is the first range-wide investigation into the
gene flow and population connectivity of a member of
the northeastern Pacific Mustelus, three patterns have
been observed. First, throughout the range of M. henlei,
there exist three distinct populations with the northern
(Northern California) and southern (Costa Rica) popula-
tions demonstrating significant divergence from the
central population (Central-Southern California and Mex-
ico). Second, traditional biogeographic and phylogeo-
graphic barriers within the central population appear to
have little effect on the population connectivity of
M. henlei. And third, contemporary expansion of M. hen-
lei from the tropics to subtropical and temperate regions
may have been revealed. As always, further sampling from
different localities would be expected to bolster the results
of any population genetic study of a species in the wild.
With this in mind, the further sampling of M. henlei from
Washington, Humboldt Bay, CA, Tomales Bay, CA,
Morro Bay, CA, Peru, and Ecuador would seem appropri-
ate in order to elucidate patterns of gene flow among
localities within the northern and southern limits of the
species’ range. Finally, when these findings are integrated
with those of other nearshore, northeastern Pacific taxa,
the effect of biogeographic and phylogeographic barriers
on population connectivity within the region will be
made far clearer and our ability to predict and manage
marine resources will be greatly improved.
Acknowledgments
This work would not have been possible without the help
of everyone who provided and collected samples for this
12 ª 2015 The Authors. Ecology and Evolution published by John Wiley & Sons Ltd.
Brown Smoothhound Phylogeography C. L. Chabot et al.
project, especially Brent Haggin, Dan Pondella II, Jona-
than Williams, Mike McCorkle, Tracy Larinto, Kathy
Hieb, Jennifer Messineo, Felipe Galv�an-Maga~na, Juan
Carlos P�erez Jim�enez, Oscar Sosa-Nishizaki, Susanne
Plank, Andrew Nosal, Natalie Martinez-Takeshita, Mike
Takeshita, Corinne Paterson, and Mike Schram. The labo-
ratory and analytical assistance of Sarah L. Martinez and
John Pollinger were instrumental in completing this work.
Robert K. Wayne provided laboratory space for all of the
genetic aspects of this project. Genotyping was performed
at the UCLA Genotyping and Sequencing Core and
sequencing was performed at the California State Univer-
sity, Northridge, Sequencing Core. Donald G. Buth, Paul
H. Barber, V. Reggie Edgerton, David K. Jacobs, Larry G.
Allen, and Edward J. Heist’s comments greatly improved
an earlier version of this manuscript. The UCLA Depart-
ment of Ecology and Evolutionary Biology Student
Research Award and the California Academy of Sciences
Kristina Louie Memorial Fund provided funding for this
project. We would also like to thank Jose Fabricio Vargas
for providing the illustration of M. henlei used for Fig-
ure 1 and Larry G. Allen for illustrating Figures 2 and 4.
Conflict of Interest
None declared.
References
Aris-Brosou, S., and L. Excoffier. 1996. The impact of
population expansion and mutation rate heterogeneity on
DNA sequence polymorphism. Mol. Biol. Evol. 13:494–504.
Avise, J. C. 2004. Molecular markers, natural history, and
evolution, 2nd ed. Sinauer Associates, Sunderland, MA.
Bandelt, H. J., P. Forster, and A. R€ohl. 1999. Median-joining
networks for inferring intraspecific phylogenies. Mol. Biol.
Evol. 16:37–48.Beerli, P., and J. Felsenstein. 2001. Maximum likelihood
estimation of a migration matrix and effective population
sizes in n subpopulations by using a coalescent approach.
Proc. Natl Acad. Sci. USA 98:4563–4568.Bernardi, G. 2000. Barriers to gene flow in Embiotoca jacksoni,
a marine fish lacking a pelagic larval stage. Evolution
54:226–237.
Bernardi, G., L. Findley, and A. Rocha-Olivares. 2003.
Vicariance and dispersal across Baja California in disjunct
marine fish populations. Evolution 57:1599–1609.Briggs, J. C. 1974. Marine zoogeography. McGraw-Hill, New
York, NY.
Briggs, J. C., and B. W. Bowen. 2013. Marine shelf habitat:
biogeography and evolution. J. Biogeogr. 40:1023–1035.Castillo-P�aez, A., O. Sosa-Nishizaki, J. Sandoval-Castillo, F.
Galv�an-Maga~na, and A. Rocha-Olivares. 2014. Strong
population structure and shallow mitochondrial phylogeny
in the banded guitarfish, Zapteryx exasperata (Jordan y
Gilbert, 1880) from the northern Mexican Pacific. J. Hered.
105:91–100.Castro, J. I. 2011. The sharks of north America, 1st ed. Oxford
Univ. Press, New York, NY.
Chabot, C. L. 2012. Characterization of 11 microsatellite loci
for the brown smooth-hound shark, Mustelus henlei
(Triakidae), discovered with next-generation sequencing.
Conserv. Genet. Resour. 4:23–25.
Chabot, C. L., and L. G. Allen. 2009. Global population
structure of the tope (Galeorhinus galeus) inferred by
mitochondrial control region sequence data. Mol. Ecol.
18:545–552.
Clarke, T. M., M. Espinoza, and I. S. Wehrtmann. 2014.
Reproductive ecology of demersal elasmobranchs from a
data-deficient fishery, Pacific of Costa Rica, Central
America. Fish. Res. 157:96–105.
Coates, A. G., and J. A. Obando. 1996. The geologic evolution
of the Central American Isthmus. Pp. 21–56 in J. B. C.
Jackson, A. F. Budd and A. G. Coates, eds. Evolution and
Environment in Tropical America. The Univ. of Chicago
Press, Chicago, IL.
Coates, A. G., L. S. Collins, M.-P. Aubry, and W. A. Berggren.
2004. The geology of the Darien, Panama, and the late
Miocene-Pliocene collision of the Panama arc with
northwestern South America. Geol. Soc. Am. Bull.
116:1327–1344.
Cohen, A. 2000. An Introduction to the San Francisco Estuary,
p. 41. Save the Bay, San Francisco Estuary Project, San
Francisco Estuary Institute.
Compagno, L. J. V. 1984. FAO species catalogue, vol. 4: sharks
of the world, an annotated and illustrated catalogue of shark
species known to date: pt. 2: Carcharhiniformes. FAO Fish.
Synopsis 4:251–655.
Compagno, L. J. V., M. Dando, and S. Fowler. 2005. Sharks of
the world. Princeton Univ. Press, Princeton, NJ.
Cornuet, J. M., and G. Luikart. 1996. Description and power
analysis of two tests for detecting recent population
bottlenecks from allele frequency data. Genetics
144:2001–2014.
Cortes, E. 2002. Incorporating uncertainty into demographic
modeling: application to shark populations and their
conservation. Conserv. Biol. 16:1048–1062.Craig, M. T., F. J. Fodrie, L. G. Allen, L. A. Chartier, and
R. J. Toonen. 2011. Discordant phylogeographic and
biogeographic breaks in California halibut. Bull. Southern
California Acad. Sci. 110:141–151.Dawson, M. N. 2001. Phylogeography in coastal
marine animals: a solution from California? J. Biogeogr.
28:723–736.
Dawson, M. N., J. L. Staton, and D. K. Jacobs. 2001.
Phylogeography of the tidewater goby, Eucyclogobius
newberryi (Teleostei, Gobiidae), in coastal California.
Evolution 55:1167–1179.
ª 2015 The Authors. Ecology and Evolution published by John Wiley & Sons Ltd. 13
C. L. Chabot et al. Brown Smoothhound Phylogeography
Dawson, M. N., R. S. Waples, and G. Bernardi. 2006.
Phylogeography. Pp. 670 in L. G. Allen, D. J. Pondella II
and M. H. Horn, eds. The ecology of marine fishes:
California and adjacent waters. Univ. of California Press,
Berkeley and Los Angeles.
Dick, M. H., A. Herrera-Cubilla, and J. B. C. Jackson. 2003.
Molecular phylogeny and phylogeography of free-living
Bryozoa (Cupuladriidae) from both sides of the Isthmus of
Panama. Mol. Phylogenet. Evol. 27:355–371.
Duncan, K. M., A. P. Martin, B. W. Bowen, and H. G. De
Couet. 2006. Global phylogeography of the scalloped
hammerhead shark (Sphyrna lewini). Mol. Ecol.
15:2239–2251.
Earl, D. A., and B. M. vonHoldt. 2012. STRUCTURE
HARVESTER: a website and program for visualizing
STRUCTURE output and implementing the Evanno
method. Conserv. Genet. Resour. 4:359–361.
Ebert, D. A. 2003. Sharks, rays, and chimaeras of California.
Univ. of California Press, Berkeley and Los Angeles, CA.
Eschmeyer, W. N., E. S. Herald, and H. Hammann. 1999. A
field guide to pacific coast fishes: north America. Houghton
Mifflin Company, Boston and New York.
Espinoza, M., T. Clarke, F. Villalobos Rojas, and I.
Wehrtmann. 2012. Ontogenetic dietary shifts and feeding
ecology of the rasptail skate Raja velezi and the brown
smoothhound shark Mustelus henlei along the Pacific coast
of Costa Rica, Central America. J. Fish Biol. 81:1578–1595.
Evanno, G., S. Regnaut, and J. Goudet. 2005. Detecting the
number of clusters of individuals using the software
STRUCTURE: a simulation study. Mol. Ecol. 14:2611–2620.Excoffier, L., and H. E. L. Lischer. 2010. Arlequin suite ver 3.5:
a new series of programs to perform population genetics
analyses under Linux and Windows. Mol. Ecol. Resour.
10:564–567.Excoffier, L., P. E. Smouse, and J. M. Quattro. 1992. Analysis
of molecular variance inferred from metric distances among
DNA haplotypes: application to human mitochondrial DNA
restriction data. Genetics 131:479–491.Falush, D., M. Stephens, and J. Pritchard. 2003. Inference of
population structure using multilocus genotype data:
linked loci and correlated allele frequencies. Genetics
164:1567.
Falush, D., M. Stephens, and J. K. Pritchard. 2007. Inference
of population structure using multilocus genotype data:
dominant markers and null alleles. Mol. Ecol. Notes 7:574.
Frankham, R., J. D. Ballou, and D. A. Briscoe. 2010.
Introduction to conservation genetics. Cambridge Univ.
Press, New York, New York, USA.
Fu, Y. X. 1997. Statistical tests of neutrality of mutations
against population growth, hitchhiking and background
selection. Genetics 147:915–925.Gaida, I. H. 1997. Population structure of the Pacific angel
shark, Squatina californica (Squatiniformes: Squatinidae),
around the California Channel Islands. Copeia 1997:738–744.
Garza, J., and E. Williamson. 2001. Detection of reduction in
population size using data from microsatellite loci. Mol.
Ecol. 10:305–318.Goudet, J. 2003. FSTAT version 2. 9. 4: a program to estimate
and test population genetics parameters. Updated from
Goudet [1995]. Available at http://www.unil.ch/izea/
softwares/fstat.html. (accessed 4/1/2009).
Haeseker, S., and J. Jr Cech. 1993. Food habits of the brown
smoothhound shark (Mustelus henlei) from two sites in
Tomales Bay. California Fish Game 79:89–95.Hedrick, P. W.. 2005. A standardized genetic differentiation
measure. Evolution 59:1633–1638.
Hickerson, M. J., and J. R. P. Ross. 2001. Post-glacial
population history and genetic structure of the northern
clingfish (Gobbiesox [SIC] maeandricus), revealed from
mtDNA analysis. Mar. Biol. 138:407–419.Holt, J. W., E. W. Holt, and J. M. Stock. 2000. An age
constraint on Gulf of California rifting from the Santa
Rosalia Basin, Baja California Sur, Mexico. Geol. Soc. Am.
Bull. 112:540–549.Horn, M. H., L. G. Allen, and R. Lea. 2006. Biogeography. Pp.
670 in L. G. Allen, D. J. Pondella and M. H. Horn, eds. The
ecology of marine fishes: California and adjacent waters.
Univ. of California Press, Berkeley and Los Angeles.
Hyde, J. R., and R. D. Vetter. 2009. Population genetic structure
in the redefined vermilion rockfish (Sebastes miniatus)
indicates limited larval dispersal and reveals natural
management units. Can. J. Fish Aquat. Sci. 66:1569–1581.Jacobs, D. K., T. A. Haney, and K. D. Louie. 2004. Genes,
diversity, and geologic process on the Pacific Coast. Annu.
Rev. Earth Planet. Sci. 32:601–652.
Jost, L. 2008. GST and its relatives do not measure
differentiation. Mol. Ecol. 17:4015–4026.
Keeney, D. B., and E. J. Heist. 2006. Worldwide
phylogeography of the blacktip shark (Carcharhinus
limbatus) inferred from mitochondrial DNA reveals isolation
of western Atlantic populations coupled with recent Pacific
dispersal. Mol. Ecol. 15:3669–3679.Lewallen, E. A., T. W. Anderson, and A. J. Bohonak. 2007.
Genetic structure of leopard shark (Triakis semifasciata)
populations in California waters. Mar. Biol. 152:599–609.Love, M. 1996. Probably more than you want to know about
the fishes of the pacific coast. Really Big Press, Santa
Barbara, CA.
Meirmans, P. G., and P. W. Hedrick. 2011. Assessing
population structure: FST and related measures. Mol. Ecol.
Resour. 11:5–18.van Oosterhout, C., W. Hutchinson, D. Wills, and P. Shipley.
2004. MICRO-CHECKER: software for identifying and
correcting genotyping errors in microsatellite data. Mol.
Ecol. Notes 4:535–538.Palumbi, S. R. 1994. Genetic divergence, reproductive
isolation, and marine speciation. Annu. Rev. Ecol. Syst.
25:547–572.
14 ª 2015 The Authors. Ecology and Evolution published by John Wiley & Sons Ltd.
Brown Smoothhound Phylogeography C. L. Chabot et al.

Peakall, R., and P. E. Smouse. 2006. GENALEX 6: genetic
analysis in Excel. Population genetic software for teaching
and research. Mol. Ecol. Notes 6:288–295.Pelc, R., R. Warner, and S. Gaines. 2009. Geographical
patterns of genetic structure in marine species with
contrasting life histories. J. Biogeogr. 36:1881–1890.P�erez Jim�enez, J., and O. Sosa Nishizaki. 2008. Reproductive
biology of the brown smoothhound shark Mustelus henlei,
in the northern Gulf of California, Mexico. J. Fish Biol.
73:782–792.P�erez-Jimen�ez, J. C., and A. B. Carlisle. 2009. IUCN Red List
threat assessment of Mustelus henlei. Availablt at http://
www.iucnredlist.org/details/161648/0. (accessed 7/2/2010).
Piry, S., G. Luikart, and J. Cornuet. 1999. Computer note.
BOTTLENECK: a computer program for detecting recent
reductions in the effective size using allele frequency data.
J. Hered. 90:502.
Plank, S., C. Lowe, K. Feldheim, R. Wilson, and J. Brusslan.
2010. Population genetic structure of the round stingray
Urobatis halleri (Elasmobranchii: Rajiformes) in southern
California and the Gulf of California. J. Fish Biol. 77:329–340.
Polzin, T., and S. V. Daneshmand. 2003. On Steiner trees and
minimum spanning trees in hypergraphs. Oper. Res. Lett.
31:12–20.Portnoy, D. S., J. R. McDowell, C. T. McCandless, J. A.
Musick, and J. E. Graves. 2009. Effective size closely
approximates the census size in the heavily exploited
western Atlantic population of the sandbar shark,
Carcharhinus plumbeus. Conserv. Genet. 10:1697–1705.
Pritchard, J. K., M. Stephens, and P. Donnelly. 2000. Inference
of population structure using multilocus genotype data.
Genetics 155:945–959.Rambaut, A., and A. J. Drummond. 2007. Tracer v1.5.
Available at http://beast.bio.ed.ac.uk/Tracer. (accessed 10/19/
2013).
Rawson, P. D., V. Agrawal, and T. J. Hilbish. 1999.
Hybridization between the blue mussels Mytilus
galloprovincialis and M. trossulus along the Pacific coast of
North America: evidence for limited introgression. Mar.
Biol. 134:201–211.
Raymond, M., and F. Rousset. 1995. GENEPOP (version 1.2):
population genetics software for exact tests and
ecumenicism. J. Hered. 86:248–249.Rice, W. R. 1989. Analyzing tables of statistical tests. Evolution
43:223–225.Robertson, D. R., and K. L. Cramer. 2009. Shore fishes and
biogeographic subdivisions of the Tropical Eastern Pacific.
Mar. Ecol. Prog. Ser. 380:1–17.
Rogers, A. R., and H. Harpending. 1992. Population growth
makes waves in the distribution of pairwise genetic
differences. Mol. Biol. Evol. 9:552–569.Rousset, F. 1996. Equilibrium values of measures of
population subdivision for stepwise mutation processes.
Genetics 142:1357.
Rousset, F. 2008. Genepop’007: a complete reimplementation
of the Genepop software for Windows and Linux. Mol.
Ecol. Resour. 8:103–106.Sandoval-Castillo, J., and A. Rocha-Olivares. 2011. Deep
mitochondrial divergence in Baja California populations of
an aquilopelagic elasmobranch: the golden cownose ray.
J. Hered. 102:269–274.
Sandoval-Castillo, J., A. Rocha-Olivares, C. Villavicencio-
Garayzar, and E. Balart. 2004. Cryptic isolation of Gulf of
California shovelnose guitarfish evidenced by mitochondrial
DNA. Mar. Biol. 145:983–988.
Schultz, J., K. Feldheim, S. Gruber, et al. 2008. Global
phylogeography and seascape genetics of the lemon sharks
(genus Negaprion). Mol. Ecol. 17:5336–5348.Smith, S. E., D. W. Au, and C. Show. 1998. Intrinsic rebound
potentials of 26 species of Pacific sharks. Mar. Freshw. Res.
49:663–678.
Sotka, E. E., J. P. Wares, J. A. Barth, R. K. Grosberg, and
S. R. Palumbi. 2004. Strong genetic clines and
geographical variation in gene flow in the rocky intertidal
barnacle Balanus glandula. Mol. Ecol. 13:
2143–2156.Stephens, J. S. Jr, R. J. Larson, and D. J. II Pondella.
2006. Rocky reefs and kelp beds. Pp. 673 in L. G.
Allen, D. J. Pondella II and M. H. Horn, eds. The
ecology of marine fishes: California and adjacent
waters. Univ. of California Press, Berkely and Los Angeles,
CA.
Stepien, C. A., A. K. Dillon, and A. K. Patterson. 2000.
Population genetics, phylogeography, and systematics of the
thornyhead rockfishes (Sebastolobus) along the deep
continental slopes of the North Pacific Ocean. Can. J. Fish
Aquat. Sci. 57:1701–1717.
Tajima, F. 1989. Statistical method for testing the neutral
mutation hypothesis by DNA polymorphism. Genetics
123:585–595.Tajima, F. 1993. Measurement of DNA polymorphism. Pp.
37–59 in A. G. Takahata and N. Takahata, eds. Mechanisms
of molecular evolution. Introduction to molecular
paleopopulation biology. Japan Scientific Societies Press,
Sinauer Associates, Inc, Sunderland, MA.
Tajima, F. 1996. The amount of DNA polymorphism
maintained in a finite population when the neutral
mutation rate varies among sites. Genetics 143:
1457–1465.Thompson, J. D., D. G. Higgins, and T. J. Gibson.
1994. CLUSTAL W: improving the sensitivity of
progressive multiple sequence alignment through sequence
weighting, position-specific gap penalties and weight
matrix choice. Nucleic Acids Res. 22:
4673–4680.Tranah, G. J., and L. G. Allen. 1999. Morphologic and genetic
variation among six populations of the spotted sand bass,
Paralabrax maculatofasciatus, from southern California to
ª 2015 The Authors. Ecology and Evolution published by John Wiley & Sons Ltd. 15
C. L. Chabot et al. Brown Smoothhound Phylogeography

the upper Sea of Cortez. Bull. Southern California Acad. Sci.
98:103–118.
Walker, B. W. 1960. The distribution and affinities of the
marine fish fauna of the Gulf of California. Syst. Zool.
9:123–133.Wang, I. J. 2010. Recognizing the temporal distinctions
between landscape genetics and phylogeography. Mol. Ecol.
19:2605–2608.Webber, J., and J. Jr Cech. 1998. Nondestructive diet
analysis of the leopard shark from two sites in Tomales
Bay, California. California Fish Game 84:
18–24.Williamson-Natesan, E. G. 2005. Comparison of methods for
detecting bottlenecks from microsatellite loci. Conserv.
Genet. 6:551–562.
Wilson, G. A., and B. Rannala. 2003. Bayesian inference of
recent migration rates using multilocus genotypes. Genetics
163:1177–1191. http://www.fluxus-engineering.comYudin, K. G. 1987. Age, growth and aspects of the
reproductive biology of two sharks, the gray smoothhound
Mustelus californicus and the brown smoothhound
M. henlei, from central California. [Unpublished M.A.
Thesis], San Francisco State University.
Yudin, K. G., and G. M. Cailliet. 1990. Age and growth of the
gray smoothhound, Mustelus californicus and the brown
smoothhound, M. henlei, sharks from central California.
Copeia 1990:191–204.
Supporting Information
Additional Supporting Information may be found in the
online version of this article:
Appendix S1. Summary statistics for 6 loci from within
6 localities of Mustelus henlei: San Francisco (SF), Santa
Barbara (SB), Santa Catalina (SC), Punta Lobos (PL),
San Felipe (GOC), and Costa Rica (CR). N, number of
samples; A, number of alleles; AR, allelic richness; HO,
observed heterozygosity; HE, expected heterozygosity; FIS,correlation of alleles within individuals compared to
their subpopulation; p, FIS p values (significant FIS p
values ≤ 0.00167 indicated by *).Appendix S2. Avergage long-term migration rates
between sample localities of Mustelus henlei as estimated
by MIGRATE-N.
Appendix S3. Average contemporary migration rates
(Nem) between sample localities of Mustelus henlei and
self-recruitment (e.g., from donor locality San Francisco
into recipient locality San Francisco) as estimated by
BAYESASS. Bold values with a credible set (CS) not
including 0 are provided below each pairwise population
estimate and self-recruitment estimates are in the diago-
nal with corresponding CS values in italics below.
16 ª 2015 The Authors. Ecology and Evolution published by John Wiley & Sons Ltd.
Brown Smoothhound Phylogeography C. L. Chabot et al.