ASPECTS OF SHARK SWIMMING PERFORMANCE DETERMINED USING A LARGE WATER TUNNEL
18
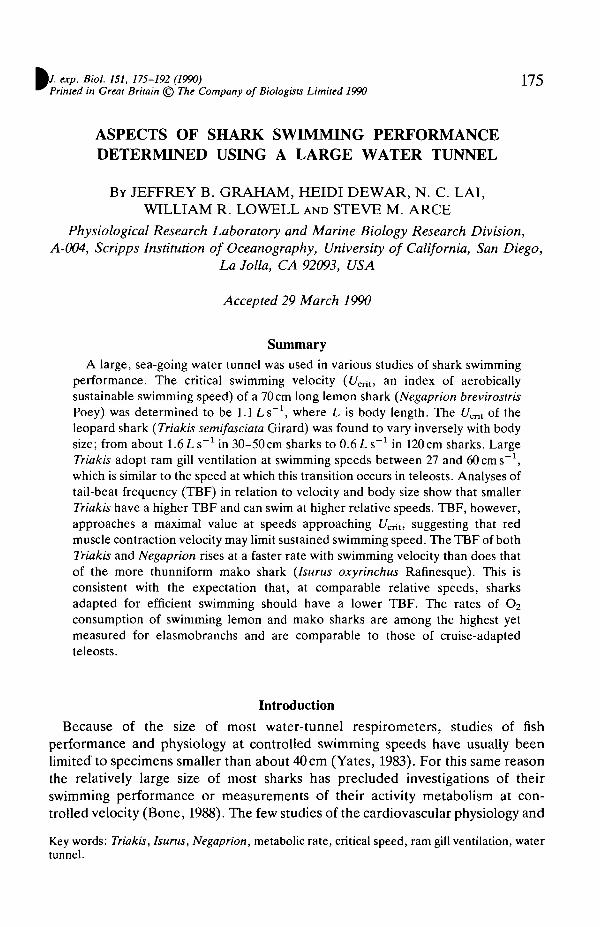
fj. exp. Biol. 151, 175-192 (1990) 175 Printed in Great Britain © The Company of Biologists Limited 1990 ASPECTS OF SHARK SWIMMING PERFORMANCE DETERMINED USING A LARGE WATER TUNNEL BY JEFFREY B. GRAHAM, HEIDI DEWAR, N. C. LAI, WILLIAM R. LOWELL AND STEVE M. ARCE Physiological Research Laboratory and Marine Biology Research Division, A-004, Scripps Institution of Oceanography, University of California, San Diego, La Jolla, CA 92093, USA Accepted 29 March 1990 Summary A large, sea-going water tunnel was used in various studies of shark swimming performance. The critical swimming velocity (U CT i l , an index of aerobically sustainable swimming speed) of a 70 cm long lemon shark (Negaprion brevirostris Poey) was determined to be 1.1 L s " 1 , where L is body length. The U mt of the leopard shark {Triakis semifasciata Girard) was found to vary inversely with body size; from about 1.6Ls -1 in 30-50cm sharks to 0.6LS" 1 in 120cm sharks. Large Triakis adopt ram gill ventilation at swimming speeds between 27 and 60cms" 1 , which is similar to the speed at which this transition occurs in teleosts. Analyses of tail-beat frequency (TBF) in relation to velocity and body size show that smaller Triakis have a higher TBF and can swim at higher relative speeds. TBF, however, approaches a maximal value at speeds approaching U^, suggesting that red muscle contraction velocity may limit sustained swimming speed. The TBF of both Triakis and Negaprion rises at a faster rate with swimming velocity than does that of the more thunniform mako shark (Isurus oxyrinchus Rafinesque). This is consistent with the expectation that, at comparable relative speeds, sharks adapted for efficient swimming should have a lower TBF. The rates of O 2 consumption of swimming lemon and mako sharks are among the highest yet measured for elasmobranchs and are comparable to those of cruise-adapted teleosts. Introduction Because of the size of most water-tunnel respirometers, studies of fish performance and physiology at controlled swimming speeds have usually been limited to specimens smaller than about 40 cm (Yates, 1983). For this same reason the relatively large size of most sharks has precluded investigations of their swimming performance or measurements of their activity metabolism at con- trolled velocity (Bone, 1988). The few studies of the cardiovascular physiology and Key words: Triakis, Isurus, Negaprion, metabolic rate, critical speed, ram gill ventilation, water tunnel.
Transcript of ASPECTS OF SHARK SWIMMING PERFORMANCE DETERMINED USING A LARGE WATER TUNNEL
fj. exp. Biol. 151, 175-192 (1990) 175Printed in Great Britain © The Company of Biologists Limited 1990
ASPECTS OF SHARK SWIMMING PERFORMANCEDETERMINED USING A LARGE WATER TUNNEL
BY JEFFREY B. GRAHAM, HEIDI DEWAR, N. C. LAI,WILLIAM R. LOWELL AND STEVE M. ARCE
Physiological Research Laboratory and Marine Biology Research Division,A-004, Scripps Institution of Oceanography, University of California, San Diego,
La Jolla, CA 92093, USA
Accepted 29 March 1990
Summary
A large, sea-going water tunnel was used in various studies of shark swimmingperformance. The critical swimming velocity (UCTil, an index of aerobicallysustainable swimming speed) of a 70 cm long lemon shark (Negaprion brevirostrisPoey) was determined to be 1.1 Ls"1 , where L is body length. The Umt of theleopard shark {Triakis semifasciata Girard) was found to vary inversely with bodysize; from about 1.6Ls- 1 in 30-50cm sharks to 0.6LS"1 in 120cm sharks. LargeTriakis adopt ram gill ventilation at swimming speeds between 27 and 60cms"1,which is similar to the speed at which this transition occurs in teleosts. Analyses oftail-beat frequency (TBF) in relation to velocity and body size show that smallerTriakis have a higher TBF and can swim at higher relative speeds. TBF, however,approaches a maximal value at speeds approaching U^, suggesting that redmuscle contraction velocity may limit sustained swimming speed. The TBF of bothTriakis and Negaprion rises at a faster rate with swimming velocity than does thatof the more thunniform mako shark (Isurus oxyrinchus Rafinesque). This isconsistent with the expectation that, at comparable relative speeds, sharksadapted for efficient swimming should have a lower TBF. The rates of O2
consumption of swimming lemon and mako sharks are among the highest yetmeasured for elasmobranchs and are comparable to those of cruise-adaptedteleosts.
Introduction
Because of the size of most water-tunnel respirometers, studies of fishperformance and physiology at controlled swimming speeds have usually beenlimited to specimens smaller than about 40 cm (Yates, 1983). For this same reasonthe relatively large size of most sharks has precluded investigations of theirswimming performance or measurements of their activity metabolism at con-trolled velocity (Bone, 1988). The few studies of the cardiovascular physiology and
Key words: Triakis, Isurus, Negaprion, metabolic rate, critical speed, ram gill ventilation, watertunnel.
176 J. B . GRAHAM AND OTHERS
metabolism of sharks during exercise were made without benefit of control ofeither swimming duration or speed (Piiper et al. 1977; Brett and Blackburn, 1978;Bushnell et al. 1982, 1989; Gruber, 1986; Scharold and Gruber, 1990).
Recent development of a large seagoing water-tunnel respirometer at ScrippsInstitution of Oceanography (SIO) has enabled examination of various aspects ofshark swimming performance including O2 consumption rate (VO2) and criticalswimming velocity (t/cnt)- The objectives of this paper are to describe the SIOwater tunnel, to present data comparing aspects of the swimming performance ofthree shark species, and to compare the swimming capacity of sharks with certaincontinuous-swimming teleosts. Although limited in scope, investigations of sharkswimming performance conducted to date (Piiper et al. 1977; Brett and Blackburn,1978; Bushnell et al. 1982) suggest that these animals have low metabolic ratescompared with bony fishes and that they have little or no capacity for sustainedaerobic swimming. To examine this and to quantify some aspects of therelationship between shark body shape and swimming proficiency proposed byThomson and Simanek (1977), we carried out detailed studies with the Californialeopard shark Triakis semifasciata, as well as selected observations on a singlelemon shark Negaprion brevirostris that was shipped to La Jolla from Florida, andspecimens of the mako shark Isurus oxyrinchus captured and experimented with atsea. By obtaining metabolic data for the lemon shark, a species adapted forcontinuous swimming and the subject of recent study (Gruber, 1986; Bushnellet al. 1982, 1989; Scharold and Gruber, 1990), we have verified that the SIO watertunnel can be used to make measurements in agreement with other publisheddata, although at faster swimming speeds. In addition, our paper reports the firstdata on the U^ and ram gill ventilation of the leopard shark, a coastal, bottom-feeding species, and the first measurements of swimming VO2
ar>d tail-beatfrequency of the mako shark, a pelagic species and member of the familyLamnidae which is specialized for continuous, thunniform swimming.
Materials and methodsThe water tunnel
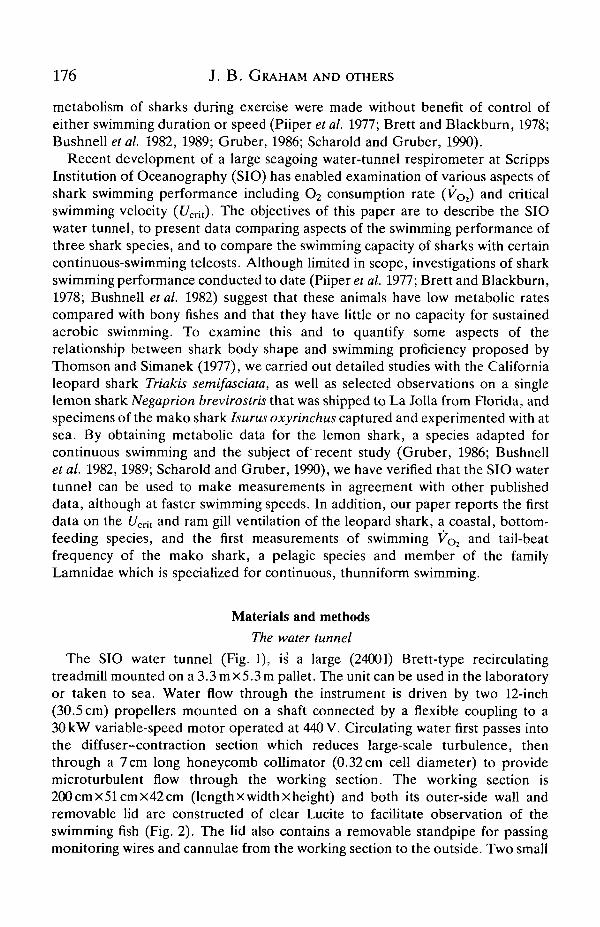
The SIO water tunnel (Fig. 1), is a large (24001) Brett-type recirculatingtreadmill mounted on a 3.3 m x5.3 m pallet. The unit can be used in the laboratoryor taken to sea. Water flow through the instrument is driven by two 12-inch(30.5 cm) propellers mounted on a shaft connected by a flexible coupling to a30 kW variable-speed motor operated at 440 V. Circulating water first passes intothe diffuser-contraction section which reduces large-scale turbulence, thenthrough a 7 cm long honeycomb collimator (0.32 cm cell diameter) to providemicroturbulent flow through the working section. The working section is200cmx51cmx42cm (length x width x height) and both its outer-side wall andremovable lid are constructed of clear Lucite to facilitate observation of theswimming fish (Fig. 2). The lid also contains a removable standpipe for passingmonitoring wires and cannulae from the working section to the outside. Two small
Shark swimming performance 111
Fig. 1. Plan view of the SIO water tunnel showing positions of the working section(WS), diffuser-contraction section (D), propeller (Pr), water filter (F), chiller (C),holding tank (HT), motor (M), gas analyser (G) and filter pump (P). Arrows indicateflow direction.
ports on the side wall permit water shunting for analysis of chemical properties andrespiratory gases. A metal grating at the downstream end of the working sectionprevents the fish from being swept back into the 30.5 cm polyvinylchloride pipeleading to the propellers. A 0.75 kW pump draws some of the system waterthrough a six-element pool filter and a 2.9kWh chiller (Fig. 1).
Working-section velocity calibrations were made with a flow meter (GeneralOceanics Inc. model 2035-mk III) mounted mid-channel and mid-depth and half-way back in the section. In the present configuration, the maximum workingsection velocity is 2.0ms"1, but most experimental data have been obtained atspeeds up to 1.3 ms"1. The motions of attached threads and injected dye streamsindicate a uniform field of laminar flow through the first half of the workingsection. Observation of particle motion shows flow along the edges to be smoothbut slower than in mid-channel.
Animal care and maintenance
Leopard sharks were captured in Elkhorn Slough, Moss Landing, California,USA, and transported by truck to holding facilities at SIO. Sharks were held infour 700-1 circular fibreglass tanks continually supplied with fresh, aerated seawater and maintained at ambient temperature (14-24°C) and photoperiod. Allsharks were regularly fed either squid or mackerel but fasted for 1 week prior toexperiments.
A 70cm long lemon shark was captured by dip net in the Marquesas Keys,Florida, USA, and transported to SIO by air. This fish was held in a heated tank
178 J. B. GRAHAM AND OTHERS
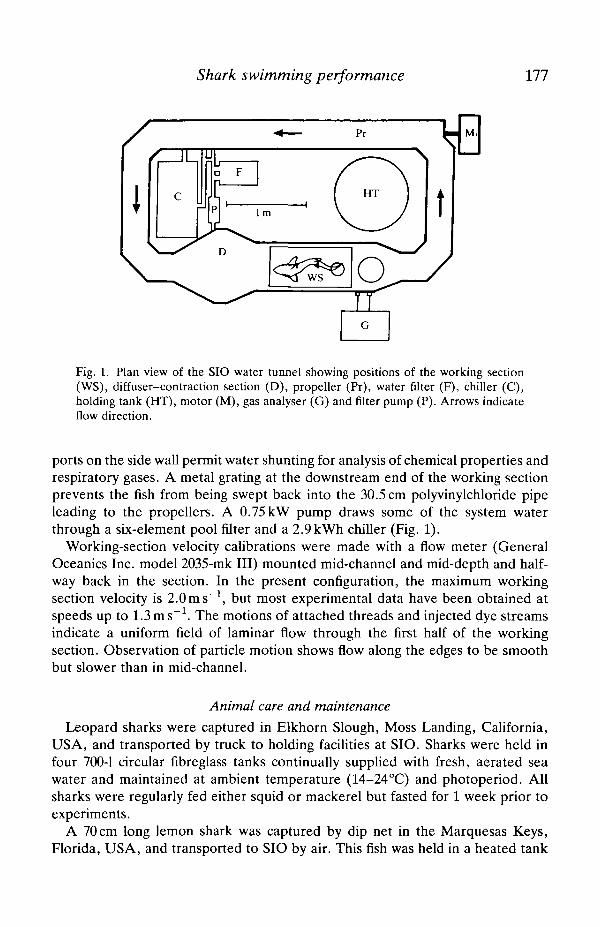
Fig. 2. Isurus oxyrinchus (82 cm long, 3.9 kg) swimming in the working section of theSIO water tunnel. Trailing wires are for recording electrocardiogram. Squares on backwall of working section are lOcmxlOcm.
(21-26 °C) which was aerated and supplied with a slow but continuous flow of freshsea water, and was fed mackerel or squid several times weekly.
Mako sharks were captured by surface long line off the coast of southernCalifornia during seagoing operations aboard the SIO R/V R. G. Sproul in July,1987. Captured sharks were placed in a holding tank or directly into the workingsection and held there, without feeding, for the duration of the study.
Experimental procedures
Work with makos was done opportunistically as they were collected at sea andplaced in the water tunnel. Laboratory tests involving leopard and lemon sharkspermitted repeated use of the same specimens in the water tunnel; this allowedthem to become accustomed to the confines of the working section and to learn toswim within its boundaries. The mass (kg) and length (L in cm) of all fish studiedwere determined upon completion of water-tunnel tests. Unless indicated other-wise, all tests and observations were performed at specified ambient temperaturesand at or near O2 saturation levels.
Shark swimming performance 179
The critical swimming speeds (£4™) of leopard sharks (35-121 cm in length) andthe one lemon shark were determined using the method described by Beamish(1978), in which fish were forced to swim for set periods at specific velocities untilthey could no longer maintain position in the flow. Fish were placed in the workingsection and acclimated to it by slow swimming. Tests were begun when the fishswam steadily and continuously at velocities between 22 and 43cms"1. After30min, water velocity was raised by 9cms"1 and another 30-min test periodobserved. This was followed by another 9cms"1 velocity increase and a 30-mintest and so on, until the fish became exhausted, as indicated by its inability to swimand maintain position off the metal grating. Critical speed was calculated using theequation (Brett, 1964):
where Uc is the last speed at which the shark swam for the entire 30-min period, Tf
is the time the shark swam at the final test speed, T; is the time interval at eachspeed (30min), and U\ is the velocity increment (9cms~1).
Estimates of the VOl for each of the three shark species during swimming wereobtained by measuring the rate of decline in the O2 content of water in therespirometer during periods when fish were swimming steadily and factors such astemperature did not fluctuate. Detailed procedures for this are contained inGraham etal. (1989) and Scharold et al. (1989). Measurements with Triakis andNegaprion were made on individuals that were post-absorptive and habituated tothe water tunnel by replicate testing and were carried out between 3 and 7 h afterhandling. Isurus respirometry (see Results) was performed on a freshly collectedfish over a period extending from several to nearly 48h after capture. Water O2
tension was monitored with a temperature-compensated probe (YSI5450/5758)and meter (YSI 54A) interfaced to a computerized data-logging system (KeithleyDAS series 500). The probe was calibrated in air and water before each run andwas mounted in a flow-through cuvette connected to the working section by aperistaltic pump. All VQ2 data were corrected for background respirationdetermined by blank runs soon after removal of the test fish.
Tail-beat and gill-ventilation frequencies of swimming fish were measured in afew fish using impedance monitors and whenever possible in non-instrumentedfish by making replicated counts over 1 min.
ResultsCritical swimming velocity
Table 1 shows U^n values, expressed in terms of both absolute (cms"1) andlength-specific (Ls"1) speed, for 18 leopard sharks and one lemon shark. Theranges of water temperature and O2 level determined during each test are alsoindicated. Replicate runs on two leopard sharks and the lemon shark did notdemonstrate any temporal effects and the cooler water temperature used in someof the lemon shark tests did not affect its U^i- Fig. 3 shows the significant

180 J. B. GRAHAM AND OTHERS
Table 1. Critical speeds of Triakis semifasciata and Negaprion brevirostris inrelation to body size and ambient temperature and O2 concentration
Totallength(cm)
Triakis353636383839475256586871717177
103103*110110*121
Mass(kg)
0.150.140.180.180.180.210.530.410.700.721.081.281.261.261.453.953.954.854.855.18
Temperature(°C)
21-2221-2320-2319-2319-2019-2319-2322-2421-2422-2519-2020-2321-2220-2319-22
2020-21
2020-2318-21
o2concentration
(mgr1)
6.8-7.1
6.0-6.86.7-7.06.1-6.57.4-8.3
6.5-7.26.7-7.27.0-7.25.7-65.6-6.26.4-6.55.3-6.15.7-6.6
Negaprionf (Arrival at SIO, 2 November 1988)70 1.65
23-2524-2624-2520-2217-18
* Second trial after 24 h.t Replicate runs on specified date.
6.0-7.06.2-6.56.1-6.87.1-7.27.6-7.8
(cms"1)
65.054-546.843.257.848.449.690.590.296.996.349.969.289.389.089.377.365.977.376.4
72.865.990.886.665.9
Ucri,
(Ls-1)
1.861.561.301.141.521.241.061.741.611.671.420.700.981.261.160.870.750.600.700.63
1.040.941.301.240.94
xl.09S.E. 0.08
Date
4 Nov 19888 Nov 1988
10 Nov 198815 Nov 198817 Nov 1988
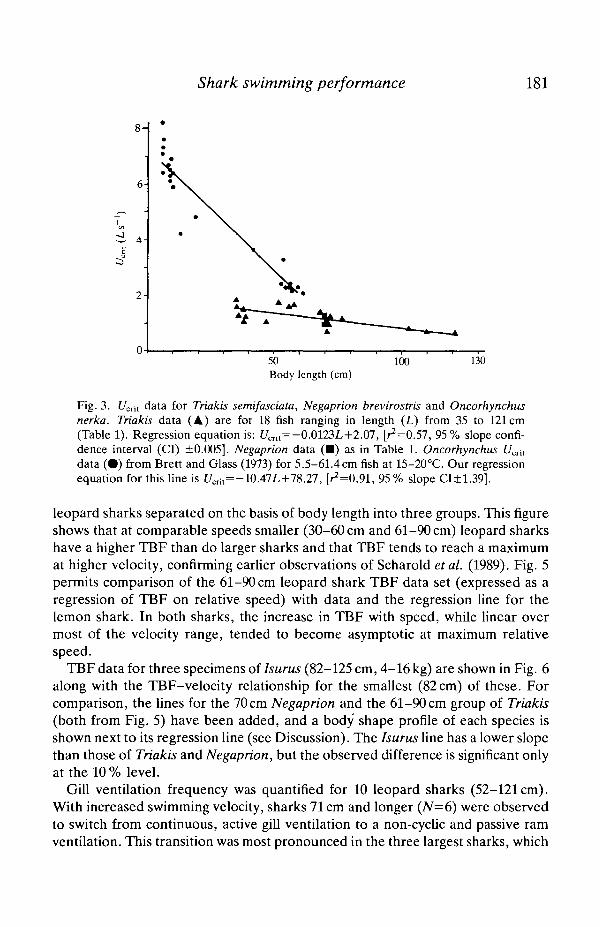
(P<0.05) inverse relationship between U^ (Ls 1) and body length for leopardsharks and data for the lemon shark. For comparative purposes, C/Cri, data for thesockeye salmon (Oncorhynchus nerka, Brett and Glass, 1973), ranging in lengthfrom 5.5 to 61.4 cm, are also shown in Fig. 3. It is apparent that the £7^, of leopardsharks between 50 and 60cm in length is about 0.7Ls"1 less than that of thesockeye.
Tail-beat frequency and gill ventilation
Fig. 4 shows tail-beat frequency (TBF) in relation to absolute velocity for 15
Shark swimming performance 181
6-
4-
2-
V A
50Body length (cm)
100 130
Fig. 3. L^nt data for Triakis semifasciata, Negaprion brevirostris and Oncorhynchusnerka. Triakis data (A) are for 18 fish ranging in length (L) from 35 to 121cm(Table 1). Regression equation is: Umt= -0.0123L+2.07, [^=0.57, 95% slope confi-dence interval (CI) ±0.005]. Negaprion data (•) as in Table 1. Oncorhynchus £7^,data (•) from Brett and Glass (1973) for 5.5-61.4cm fish at 15-20°C. Our regressionequation for this line is [/crit=-10.47L+78.27, [^=0.91, 95% slope CI±1.39].
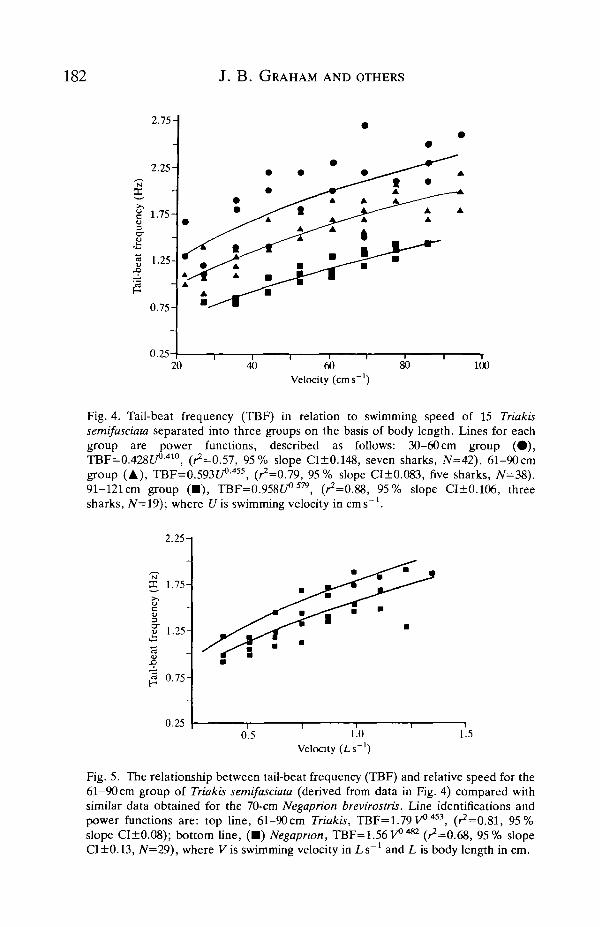
leopard sharks separated on the basis of body length into three groups. This figureshows that at comparable speeds smaller (30-60 cm and 61-90 cm) leopard sharkshave a higher TBF than do larger sharks and that TBF tends to reach a maximumat higher velocity, confirming earlier observations of Scharold et al. (1989). Fig. 5permits comparison of the 61-90 cm leopard shark TBF data set (expressed as aregression of TBF on relative speed) with data and the regression line for thelemon shark. In both sharks, the increase in TBF with speed, while linear overmost of the velocity range, tended to become asymptotic at maximum relativespeed.
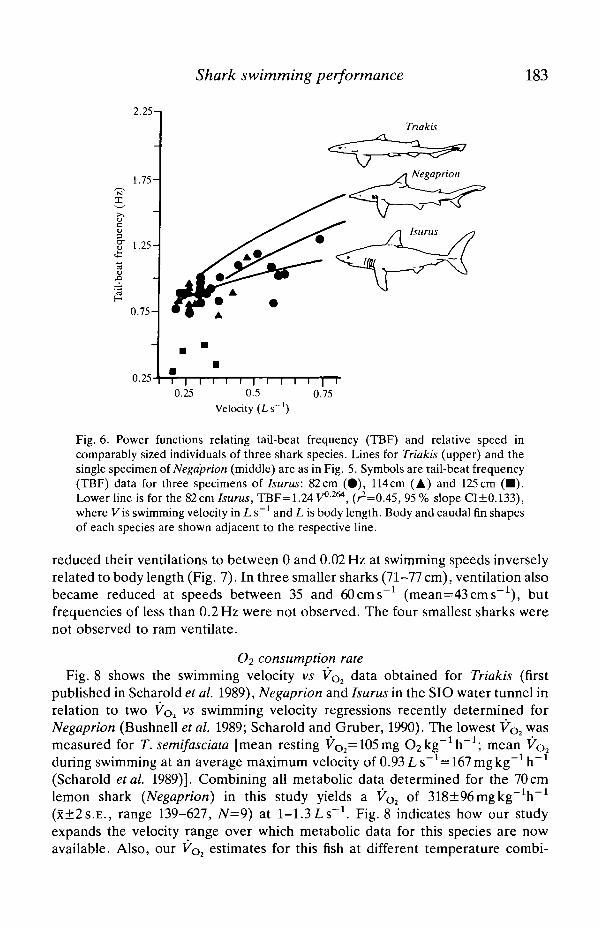
TBF data for three specimens of Isurus (82-125 cm, 4-16 kg) are shown in Fig. 6along with the TBF-velocity relationship for the smallest (82cm) of these. Forcomparison, the lines for the 70cm Negaprion and the 61-90cm group of Triakis(both from Fig. 5) have been added, and a body shape profile of each species isshown next to its regression line (see Discussion). The Isurus line has a lower slopethan those of Triakis and Negaprion, but the observed difference is significant onlyat the 10% level.
Gill ventilation frequency was quantified for 10 leopard sharks (52-121 cm).With increased swimming velocity, sharks 71 cm and longer (N=6) were observedto switch from continuous, active gill ventilation to a non-cyclic and passive ramventilation. This transition was most pronounced in the three largest sharks, which
182 J. B. GRAHAM AND OTHERS
2.75-
2.25-
g 1.75
1.25-
0.75-
0.25-20 40 60
Velocity (cms"1)80 100
Fig. 4. Tail-beat frequency (TBF) in relation to swimming speed of 15 Triakissemifasciata separated into three groups on the basis of body length. Lines for eachgroup are power functions, described as follows: 30-60 cm group ( • ) ,TBF=0.428tA410, (^=0.57, 95% slope CI±0.148, seven sharks, 7V=42). 61-90cmgroup (A), TBF=0.593f/°-455, (^=0.79, 95% slope CI±0.083, five sharks, N=38).91-121 cm group ( • ) , TBF=0.958C/°579, (^=0.88, 95% slope CI±0.106, threesharks, iV=19); where Uis swimming velocity in cms"1.
2.25-1
1.75-
3cr 1.25-
0.75H
0.250.5 1.0
Velocity (Ls"')1.5
Fig. 5. The relationship between tail-beat frequency (TBF) and relative speed for the61-90 cm group of Triakis semifasciata (derived from data in Fig. 4) compared withsimilar data obtained for the 70-cm Negaprion brevirostris. Line identifications andpower functions are: top line, 61-90cm Triakis, TBF=1.79v°A53, (^=0.81, 95%slope CI±0.08); bottom line, ( • ) Negapnon, TBF=1.56V0482 (^=0.68, 95% slopeCI±0.13, N=29), where Vis swimming velocity in Ls"1 and L is body length in cm.
Shark swimming performance 183
2.25-1
1.75-
1.25-
0.75-
0.25-
Tnakis
r I r I0.25
I0.5 0.75
Velocity (Ls~')
Fig. 6. Power functions relating tail-beat frequency (TBF) and relative speed incomparably sized individuals of three shark species. Lines for Triakis (upper) and thesingle specimen of Negdprion (middle) are as in Fig. 5. Symbols are tail-beat frequency(TBF) data for three specimens of Isurus: 82cm (•) , 114cm (A) and 125cm (• ) .Lower line is for the 82cm Isurus, TBF=1.24 V0264, (^=0.45, 95 % slope CI±0.133),where Vis swimming velocity in L s"1 and L is body length. Body and caudal fin shapesof each species are shown adjacent to the respective line.
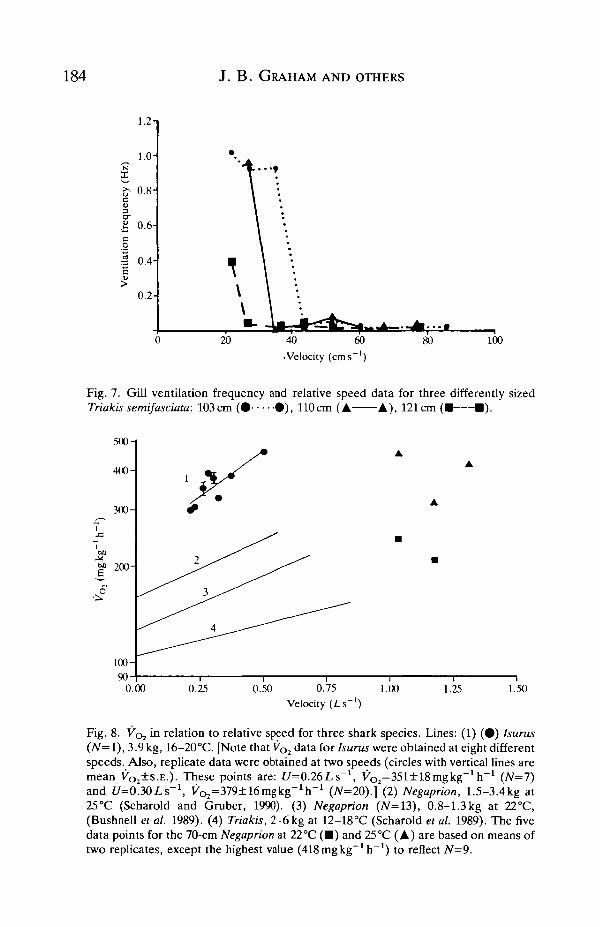
reduced their ventilations to between 0 and 0.02 Hz at swimming speeds inverselyrelated to body length (Fig. 7). In three smaller sharks (71-77 cm), ventilation alsobecame reduced at speeds between 35 and 60cms"1 (mean=43cms-1), butfrequencies of less than 0.2 Hz were not observed. The four smallest sharks werenot observed to ram ventilate.
O2 consumption rateFig. 8 shows the swimming velocity vs VOl data obtained for Triakis (first
published in Scharold et al. 1989), Negaprion and Isurus in the SIO water tunnel inrelation to two VOi vs swimming velocity regressions recently determined forNegaprion (Bushnell et al. 1989; Scharold and Gruber, 1990). The lowest V^ wasmeasured for T. semifasciata [mean resting ^02=105 mg O2kg~1h~1; mean VQduring swimming at an average maximum velocity of 0.93Ls~1=167mgkg~1h~(Scharold et al. 1989)]. Combining all metabolic data determined for the 70 cmlemon shark (Negaprion) in this study yields a VOl of 318±96mgkg~1h~1
(X±2S.E . , range 139-627, N=9) at 1-1.3Ls"1. Fig. 8 indicates how our studyexpands the velocity range over which metabolic data for this species are nowavailable. Also, our VOl estimates for this fish at different temperature combi-
184 J. B. GRAHAM AND OTHERS
40 60
•Velocity (cms"1)
100
Fig. 7. Gill ventilation frequency and relative speed data for three differently sizedTriakis semifasciata: 103cm ( • • ) , 110cm (A A), 121cm ( • • ) .
M J U -
400-
300-
200-
100-
90-
y AA
^ •
.
1 1 1
0.00 0.25 0.50 0.75
Velocity (Z.s"')
1.00 1.25 1.50
Fig. 8. Koj in relation to relative speed for three shark species. Lines: (1) ( • ) Isurus(N=l), 3.9 kg, 16-20°C. [Note that V^ data for Isurus were obtained at eight differentspeeds. Also, replicate data were obtained at two speeds (circles with vertical lines aremean K O 2 ±S.E. ) . These points are: t/=0.26Ls~1, VO2
=351±18mgkg~1h~1 (N=7)and U=0.30Ls'\ Vr
O2=379±16mgkg-1h-1 (7V=20).] (2) Negaprion, 1.5-3.4kg at25°C (Scharold and Gruber, 1990). (3) Negaprion (N=13), 0.8-1.3kg at 22°C,(Bushnell et al. 1989). (4) Triakis, 2-6 kg at 12-18°C (Scharold et al. 1989). The fivedata points for the 70-cm Negaprion at 22°C ( • ) and 25°C (A) are based on means oftwo replicates, except the highest value (418mgkg~1h"1) to reflect iV=9.
Shark swimming performance 185
nations (22 °C and 25 °C) and swimming speed lie reasonably in the extrapolatedpath of regression lines determined by other investigators.
At sea an 82 cm, 3.9 kg mako shark swam in the water tunnel for 96h (3-7 July,1987). During a 41-h period that began 4h after capture and placement in thewater tunnel, 36 h of metabolic data were obtained (Table 2). During thesemeasurements, the shark's speed ranged between 0.2 and 0.5 L s " 1 and tempera-ture from 16 to 20°C. Table 2 shows little effect of 'time since capture' onmetabolism and combining all estimates yields a mean swimming VOl of369±llmgkg~1h~1. The Vo2 of this mako varied steeply over the range ofvelocities tested (Fig. 8). Because numerous measurements were made at speedsof 0.26 and 0.30LS"1 (Table 2), mean (±S .E . ) VOl values are shown for thesespeeds in Fig. 8.
Discussion
Water-tunnel utility
As reviewed by Yates (1983), nearly all studies of fish swimming performance(excluding tunas, Graham et al. 1989) have been made with specimens smallerthan 40 cm in length. The present study shows that the SIO tunnel will allow workwith somewhat larger fishes. For example, the cross-sectional area of the 82cmmako shark (95 cm2) amounted to only 4.5% that of the working section(2100 cm2) and thus was too small (less than 10%) to require a solid blockingcorrection factor. The height (42 cm) and width (51 cm) of the working section alsoexceed the dimensions of the large fish. The 82cm mako, for example, had apectoral span of 31 cm and a maximum vertical expanse (at the dorsal fin) of 19 cm.Thus, and provided that swimming occurs in the centre of the section (which wasnot always the case), wall effects are also not a continuous problem for largerfishes in the SIO tunnel.
Studies with larger animals also reduce some surgical and instrumentationproblems and permit investigations of aspects of fish metabolic performance andphysiology (for example, close-order regional electromyography) previously notfeasible. Working-section features, such as the standpipe and transparent lid andside wall, permit physiological and kinematic studies, and data presented hereshow that the increase in water-tunnel volume caused by inclusion of the speciallydesigned diffuser-contraction section has not hampered its utility as a respir-ometer. Finally, because it can be taken to sea, the SIO water tunnel enables first-time research with pelagic fishes, such as the mako shark, that could not otherwisebe studied. Pelagic fishes are generally too large for other swimming tunnelsystems and do not survive well enough in captivity to permit study in a land-basedlaboratory.
Shark swimming performance
Critical speed
Interspecific Ucnt comparisons must be made cautiously because values are

186 J. B. GRAHAM AND OTHERS
Table 2. WOl of the 82 cm, 3.9 kg Isurus oxyrinchus in relation to time since captureand placement in the working section, respirometer water temperature and
. swimming speed (3-5 July, 1987)
Time since Temperature U VO2
capture ( h ) ( ° Q ( L s " 1 ) ^ 1
5678910121314151617181920222324252627282930323334353638394041434445
18.118.118.117.017.017.518.018.018.1
18.518.819.018.518.117.818.018.018.218.719.519.419.518.518.318.017.016.016.018.018.518.519.019.920.020.0
0.370.370.370.300.260.260.300.300.260.210.280.300.260.260.260.300.230.300.320.300.300.300.300.320.300.300.300.300.300.300.300.260.300.500.300.30
397415342427336427458336275299372366378336342330305366366336427336348287500214427384262397366366366458507421
x=369S.E. = 11N=36
affected by fish body size, by ambient conditions, and by the combination ofduration and velocity increment used in their determination (Beamish, 1978). Thet/cnt of the sockeye was chosen for comparison with Triakis because fishes fromboth studies overlap in body size. The inverse relationship between UCTit and body
Shark swimming performance 187
size (Fig. 3) seen for both species probably reflects the disproportionate scaling offactors affecting performance (e.g. cardiac output, red muscle amounts) andfactors influencing surface drag (e.g. body size and shape, surface area and finplacement) in larger fishes (Brett and Glass, 1973; Beamish, 1978; Yates, 1983;Bone, 1988).
Interpretation of the actual [ 7 ^ differences between Triakis and Oncorhynchnsis complicated by differences in experimental time increment used in the twostudies (30min tests for Triakis vs 60min for sockeye). Two facts, however,persuade us that the time effect is sufficiently small to warrant this comparison.First, Beamish (1978) found the Umx of another salmonid (the rainbow trout,Salmo gairdneri) was not affected by test durations ranging between 20 and 60 min.Also, 30-min £7^ determinations for two marine teleosts by Freadman (1979)(3.3 L s " 1 for 24-29 cm striped bass, Morone saxatilus; 4.6 Ls" 1 for 18-25 cmbluefish, Pomatomus saltatrix), while higher than that of Triakis, are very close tothe Ucnt expected for a comparably sized Oncorhynchus on the basis of Fig. 3.
Recognizing that L^t is an index of aerobic swimming capacity, the lower L^tof Triakis relative to that of Oncorhynchus may be partly related to anatomicaland physiological differences in red muscle function in sharks and teleosts (Bone,1988). Both sharks and teleosts have similar amounts of red muscle (Bone, 1978)and the aerobic capacity of this tissue seems comparable in both groups (Bone,1988; Dickson et al. 1988). An important difference affecting sustained perform-ance by shark red muscle may be the strong division of labour that exists betweenthe red and white muscle in this group. Electromyography has demonstrated thatthe focally innervated white fibres found in sharks are active only during burstswimming (Bone, 1966). This differs from many higher teleosts in which the whitefibres are multiply innervated and can work simultaneously with red fibres inpowering sustained swimming (Bone, 1966, 1978, 1988). Thus, while both sharksand teleosts have similar amounts of red muscle, the ability of teleosts to recruitdifferent groups of white muscle fibres during sustained swimming may affordthem a higher £/cnt-
Differences in the swimming capacity of teleosts and sharks have doubtlesslyinfluenced, and been influenced by, their life histories. Small teleosts, forexample, can attain high relative speeds (Fig. 3 shows that a 10-cm long sockeyesalmon has a L^t between 6 and 8 L s - 1 ) , which is thought to be important inescaping predators (Brett, 1964; Beamish, 1978). The shape of the f/mt function ofTriakis also extrapolates to a higher value with smaller size, but the increase ismuch less than for the sockeye. Because sharks are often 20 cm or longer at thetime of birth or hatching, small sharks would require less of the predator-avoidingcapability, afforded by a high [/„,,, than do small teleosts.
Tail-beat frequency and swimming speed
Examination of TBF in relation to velocity and body size (Fig. 4) shows thatsmaller (30-60 cm) Triakis had a higher TBF and attained a greater relative speed

188 J. B . GRAHAM AND OTHERS
than did either gToup of larger fish. The finding that maximal TBF is size-dependent, although not previously documented for sharks, is similar to thesituation in teleosts (Bainbridge, 1958). Previous studies with both teleosts andelasmobranchs reveal a generally linear relationship between TBF and velocity,although the shark data are limited (Hunter and Zweifel, 1971; Webb and Keyes,1982). Our data show that the TBF of Triakis and Negaprion tended to plateaunear U^i (Fig. 4). One interpretation of this could be that exhaustion curtailed thesharks' ability to sustain a high TBF. However, we and Scharold et al. (1989) foundsimilar relationships between TBF and velocity for Triakis swum for shorterperiods. This again suggests that the slow contraction velocity of red muscle andthe time required for red fibres to recover their resting length before contractingmay limit maximum sustainable TBF.
The maximum TBF recorded for sharks in this study is lower than that of(generally smaller) teleosts at similar velocities. This is consistent with differencesin myotomal organization described above and supports the idea that, in theabsence of white fibre augmentation, the maximum contraction-relaxation cycleof red muscle may limit TBF and therefore velocity. In addition, the tendency forTBF to reach a maximum suggests that other factors affecting swimming thrust,such as propulsive wavelength and caudal amplitude, may be important at nearmaximal sustained velocities and as the faster-contracting white fibres arerecruited. Kinematic and electromyographic studies are needed to determine this.Webb and Keyes (1982) observed a specimen of Carcharhinus melanopterus tochange both wavelength and amplitude when (burst) swimming at 3.9 Ls" 1 .
Interspecific comparisons by Webb and Keyes (1982) indicate that sharksadapted for sustained swimming have a lower relative TBF and greater stridelength (distance travelled per tail beat). This is consistent with our findings forTriakis, Negaprion and Isurus, members respectively of groups 3, 2 and 1 of theThomson and Simanek (1977) classification of body form in relation to swimmingproficiency. Although the slope of the TBF-velocity function presented for Isurusin Fig. 6 differs from that of the other two genera only at the 10% level ofsignificance, this figure does suggest that there might be functional differencesamong these genera (and groups 1, 2 and 3) in factors affecting propulsion anddrag, such as body profile and caudal fin shape and surface areas. From its bodyshape and caudal morphology, Triakis (Fig. 6) appears better adapted forunsteady swimming and periodic resting on the bottom, which is consistent with itsnormal behaviour in shallow coastal waters. Also, the implication of Fig. 6 thatTriakis has a higher TBF than either Negaprion or Isurus at the same relativespeed suggests either a greater thrust requirement or less thrust generation per tailbeat. By contrast, the morphologies of Negaprion and especially Isurus are moresuited to cruising. Additional data for both Negaprion and Isurus are needed toquantify factors affecting drag and thrust generation (e.g. body shape andstreamlining, surface area, and caudal fin shape and area) and to determinewhether functional morphological features such as stride length and caudalamplitude also affect aerobic swimming efficiency.

Shark swimming performance 189
Shark ventilation and VO2 during swimming
Ram gill ventilation
Our findings for Triakis agree with observations on ram ventilation in a similarlysized group of T. scyllia by Kabasawa and Clark (1974-1975). Ram ventilation, arespiratory mode in which the forward movement of the fish is sufficient to developthe pressure head necessary to force water through the gills, is commonly seenamong teleosts adapted for cruise swimming and is thought to reduce metaboliccosts by as much as 15% (Roberts, 1975, 1978; Freadman, 1979). The range ofspeeds (27-60 cm s~1) over which the larger Triakis adopted ram ventilationagrees with the range seen for two teleosts {Pomatomus and Morone,33-65cms"1; Roberts, 1975; Freadman, 1979). However, whereas Freadman(1979) found only a slight effect of body size on the ram-transition velocity ofPomatomus and Morone, our observations with Triakis ranging from 50 to 120 cmin length revealed that ram ventilation did not occur in smaller (less than 70 cm)sharks and that the speed at which it began in larger sharks was inversely related tobody length (Fig. 7). Thus, ram ventilation in Triakis is restricted to largerspecimens and is absent in fish comparable in size to most of the teleosts(15-35 cm) for which this phenomenon has been documented. Additional studiesare needed to determine factors affecting the ram-transition velocity in differentlysized Triakis and to determine why this activity occurs in small teleosts but not insmall Triakis.
Shark VO2
Including data reported here, swimming velocity vs metabolism estimates arenow available for five shark species. Prior to our work, only the VOl of Squalus,Scyliorhinus and Negaprion had been measured, but in no cases had swimmingspeed been controlled. Brett and Blackburn (1978) could not induce Squalusacanthias to swim in a respirometer but measured VOl at different activity states,reporting the following mean rates (2 kg fish at 10°C): resting 32, routine 49 andactive 88 mg O2kg~1h~1. Piiper etal. (1977) found that the resting Vo2 ofScyliorhinus stellaris (2.5 kg at 19°C) was 92 mg O2kg~1h~1 and increased to162mgkg~1h~1 during spontaneous swimming at 0.27 Ls" 1 for 1-22min. Theyalso reported that fish swimming for 10 min or longer acquired an O2 debt.
In a review based primarily on data for docile species, Brett and Blackburn(1978) concluded that the metabolic rates of elasmobranchs are 'among the lowestof all fishes', but allowed that active sharks probably had higher metabolic rates.This is now verified in work with Negaprion brevirostris (Gruber, 1986; Scharoldand Gruber, 1990; Bushnell etal. 1989). Our study with the 70-cm Negaprionadditionally demonstrates that this species can sustain swimming speeds abovel L s " 1 and metabolic estimates at this speed (mean ^02=318 mg kg"1 h"1) lie inthe extrapolated path of regression values obtained at slower speeds (Fig. 8). Thehigh metabolic rate of swimming elasmobranchs is further documented by our VOl
190 J. B. GRAHAM AND OTHERS
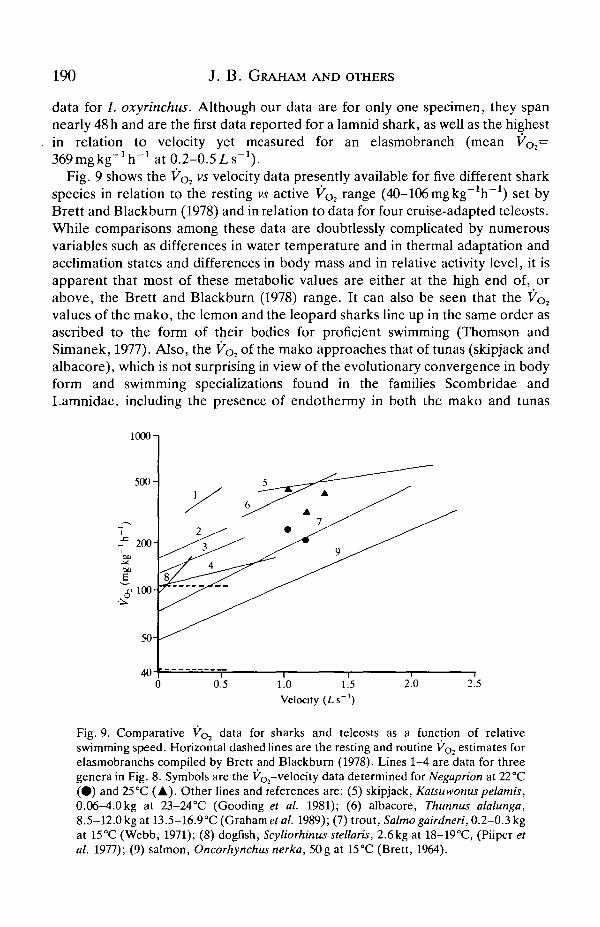
data for /. oxyrinchus. Although our data are for only one specimen, they spannearly 48 h and are the first data reported for a lamnid shark, as well as the highestin relation to velocity yet measured for an elasmobranch (mean VO2=369mgkg"1h-1 at 0.2-0.5Ls"1).
Fig. 9 shows the V ^ vs velocity data presently available for five different sharkspecies in relation to the resting vs active VOl range (40-106 mgkg~1h~1) set byBrett and Blackburn (1978) and in relation to data for four cruise-adapted teleosts.While comparisons among these data are doubtlessly complicated by numerousvariables such as differences in water temperature and in thermal adaptation andacclimation states and differences in body mass and in relative activity level, it isapparent that most of these metabolic values are either at the high end of, orabove, the Brett and Blackburn (1978) range. It can also be seen that the Vo2
values of the mako, the lemon and the leopard sharks line up in the same order asascribed to the form of their bodies for proficient swimming (Thomson andSimanek, 1977). Also, the Vo2 of the mako approaches that of tunas (skipjack andalbacore), which is not surprising in view of the evolutionary convergence in bodyform and swimming specializations found in the families Scombridae andLamnidae, including the presence of endothermy in both the mako and tunas
1000-1
500-
- 200-
550-
40-0.5 1.0 1.5
Velocity ( i s" 1 )
2.0 2.5
Fig. 9. Comparative VQJ data for sharks and teleosts as a function of relativeswimming speed. Horizontal dashed lines are the resting and routine V^ estimates forelasmobranchs compiled by Brett and Blackburn (1978). Lines 1-4 are data for threegenera in Fig. 8. Symbols are the VOl-velocity data determined for Negaprion at 22 °C(•) and 25°C (A). Other lines and references are: (5) skipjack, Katsuwonuspelamis,0.06-4.0 kg at 23-24°C (Gooding et al. 1981); (6) albacore, Thunnus alalunga,8.5-12.0 kg at 13.5-16.9°C (Graham etal. 1989); (7) trout, Salmo gairdneri, 0.2-03kgat 15°C (Webb, 1971); (8) dogfish, Scyliorhinus stellaris, 2.6kg at 18-19°C, (Piiper etal. 1977); (9) salmon, Oncorhynchus nerka, 50g at 15°C (Brett, 1964).

Shark swimming performance 191
(Graham, 1983). Fig. 9 also suggest that sharks have a smaller cruising velocityrange than teleosts. This may be an artefact of the relatively few shark studies todate, but there are few accounts of sharks cruising much faster than 1 L s"1, whichmay reflect both their optimal velocity and the limitations on cruising imposed bythe division of labour between red and white myotomal muscle.
This work was supported by NSF DCB84-16852, DCB87-18449 andDMB85-00261. Ship time was provided by the University of California, UC-10,1987. We thank the captain and crew of R/V Robert Gordon Sproul for assistanceand support. Appreciation is expressed to R. Dotson, J. Scharold, T. Okey,D. Schonick, S. Sutton, D. Ticaett, A. Escandon, E. Bliase and D. Ward for theirtechnical assistance at sea and in the laboratory. We thank Drs John Hunter,Sergey Kashin and Paul Webb for their comments and suggestions on earlymanuscript drafts.
ReferencesBAINBRIDGE, R. (1958). The speed of swimming fish as related to size and to the frequency and
amplitude of the tail beat. /. exp. Biol. 35, 109-133.BEAMISH, F. W. H. (1978). Swimming capacity. In Fish Physiology, vol. 7 (ed. W. S. Hoar and
D. J. Randall), pp. 101-187. New York: Academic Press.BONE, Q. (1966). On the function of the two types of myotomal muscle fibre in elasmobranch
fish. /. mar. Biol. 46, 321-349.BONE, Q. (1978). Locomotor muscle. In Fish Physiology, vol. 7 (ed. W. S. Hoar and D. J.
Randall), pp. 361-424. New York: Academic Press.BONE, Q. (1988). Muscles and locomotion. In Physiology of Elasmobranch Fishes (ed. T. J.
Shuttleworth), pp. 99-141. Berlin: Springer-Verlag.BRETT, J. R. (1964). The respiratory metabolism and swimming performance of young sockeye
salmon. / . Fish. Res. Bd Can. 21,1183-1226.BRETT, J. R. AND BLACKBURN, J. M. (1978). Metabolic rate and energy expenditure of the spiny
dogfish, Squalus acanthias. J. Fish. Res. Bd Can. 35, 816-821.BRETT, J. R. AND GLASS, N. R. (1973). Metabolic rates and critical swimming speeds of sockeye
salmon (Oncorhynchus nerka) in relation to size and temperature. J. Fish. Res. Bd Can. 30,379-387.
BUSHNELL, P. G., LUTZ, P. L. AND GRUBER, S. H. (1989). The metabolic rate of an active,tropical elasmobranch, the lemon shark (Negaprion brevirostris). Exp. Biol. 48, 279-283.
BUSHNELL, P. G., LUTZ, P. L., STEFFENSEN, J. F., OIKARI, A. AND GRUBER, S. H. (1982).Increases in arterial blood oxygen during exercise in the lemon shark {Negaprion brevirostris).J. comp. Physiol. 147, 41-47.
DICKSON, K. A., DALL, A. V., EISMAN, J. M., MCDONNELL, E. T. AND HENDRZAK, A. M.(1988). Biochemical indices of aerobic and anaerobic capacity in red and white myotomalmuscle of active pelagic sharks: Comparison between endothermic and ectothermic species./. Penns. Acad. Sci. 62, 147-151.
FREADMAN, M. A. (1979). Swimming energetics of striped bass {Morone saxatilis) and bluefish(Pomatomus saltatrix): gill ventilation and swimming metabolism. J. exp. Biol. 83, 217-230.
GOODING, R. M., NEILL, W. H. AND DIZON, A. E. (1981). Respiration rates and low-oxygentolerance limits in skipjack tuna, Katsuwonus pelamis. Fish. Bull. 79, 31-48.
GRAHAM, J. B. (1983). Heat transfer. In Fish Biomechanics (ed. P. W. Webb and D. Weihs), pp.248-279. New York: Praeger Publishers.
GRAHAM, J. B., LOWELL, W. R., LAI, N. C. AND LAURS, R. M. (1989). O2 tension, swimming-velocity, and thermal effects on the metabolic rate of the Pacific albacore Thunnus alalunga.Exp. Biol. 48, 89-94.
192 J. B. GRAHAM AND OTHERS
GRUBER, S. H. (1986). Bioenergetics of the lemon shark, Negaprion brevirostris (Poey) underlaboratory and field conditions. In Indo-Pacific Fish Biology (ed. T. Uyeno, R. Arai,T. Taniuchi and K. Matsuura). Ichthyol. Soc. Japan, p. 927.
HUNTER, J. R. AND ZWEIFEL, J. R. (1971). Swimming speed, tail beat frequency, tail beatamplitude, and size in jack mackerel, Trachurus symmetricus, and other fishes. Fish. Bull. 69,253-256.
KABASAWA, H. AND CLARK, E. (1974-1975). Respiration rates and activity patterns of the shark,dochizame {Triakis scyllia), in a large circular tank. Scientific Report of the Keikyu AburatsuboMarine Park Aquarium, 7.8, pp. 27-39.
PIIPER, J., MEYER, M., WORTH, H. AND WILLMER, H. (1977). Respiration and circulation duringswimming activity in the dogfish Scyliorhinus stellaris. Respir. Physiol. 30, 221-239.
ROBERTS, J. L. (1975). Active branchial and ram gill ventilation in fishes. Biol. Bull. mar. Biol.Lab., Woods Hole 148, 85-105.
ROBERTS, J. L. (1978). Ram gill ventilation in fish. In The Physiological Ecology of Tuna (ed.G. D. Sharp and A. E. Dizon), pp. 83-88. New York: Academic Press.
SCHAROLD, J. AND GRUBER, S. H. (1990). Telemetered heart rate as a measure of metabolic ratein the lemon shark, Negaprion brevirostris. Copeia (in press).
SCHAROLD, J., LAI, N. C , LOWELL, W. R. AND GRAHAM, J. B. (1989). Metabolic rate, heart rate,and tailbeat frequency during sustained swimming in the leopard shark Triakis semifasciata.Exp. Biol. 48, 223-230.
THOMSON, K. S. AND SIMANEK, D. E. (1977). Body form and locomotion in sharks. Am. Zool.17, 343-354.
WEBB, P. W. (1971). The swimming energetics of trout. II. Oxygen consumption and swimmingefficiency. J. exp. Biol. 55, 521-540.
WEBB, P. W. AND KEYES, R. S. (1982). Swimming kinematics of sharks. Fish. Bull. 80, 803-812.YATES, G. T. (1983). Hydromechanics. In Fish Biomechanics (ed. P. W. Webb and D. Weihs),
pp. 177-213. New York: Praeger Publishers.