The effect of a miscible and an immiscible polymeric modifier on the mechanical and rheological...
15
The eect of a miscible and an immiscible polymeric modifier on the mechanical and rheological properties of PVC R. Herna´ndez a, * ,1 , J.J. Pen˜a b , L. Irusta a , A. Santamarı´a a a Departamento de Ciencia y Tecnologı´a de Polı´meros, Facultad de Ciencias Quimicas, Universidad del Paı´s Vasco, Apartado de Correos 1072, Basque Country, E-20080 San Sebastia ´n, Spain b Departamento de Fı´sica de Materiales, Facultad de Ciencias Quı´micas, Universidad del Paı´s Vasco, Apartado de Correos 1072, Basque Country, E-20080 San Sebastia ´n, Spain Received 24 September 1998; received in revised form 30 March 1999; accepted 14 May 1999 Abstract PVC/copoly(ester-urethane) (Baymod PU 1 ) and PVC/EVA copolymer blends have been analysed from the point of view of the eect of miscibility on the mechanical and rheological properties. The FTIR and NMR analysis of Baymod PU modifier leads to the conclusion that its miscibility with PVC (determined by dynamic mechanical analysis) is due to the presence of 31.9% poly(e-caprolactone) and 38.4% adipates in the main chain of the copoly(ester-urethane) polymer. However the PVC/EVA system considered in this work results in an immiscible blend, due to the low content of vinyl acetate, 33 wt%. The comparison of the mechanical and rheological properties of both blends with those of a PVC plasticised with a low molecular weight common plasticiser (PVC/ DOP system), reveals that compatibility is not a determinant point in what some ultimate properties are concerned. The molecular weight (related to the viscosity of pure polymers, which is similar for both polymeric modifiers) seems to play a more important role than the miscibility. The stress–strain curves of both PVC/copoly(ester- urethane) (PU) miscible blends and PVC/EVA immiscible blends resemble each other and are very dierent with respect to PVC/DOP curves. The PVCs plasticised with DOP show a considerably higher elongation at break and a lower Young’s modulus than PVC mixed with polymeric modifiers. Miscible systems, PVC/PU and PVC/DOP, show similar values of the stress at break, slightly higher than those of immiscible PVC/EVA blends. The results of the latter two-phase system are well fitted to a two-parameter equivalent box model developed by Kolarik, considering a value very close to zero for the parameter, which accounts for the adhesion in between the phases. The reduction of the viscosity, induced by PU and EVA polymeric modifiers, with respect to that of pure PVC, is remarkable at shear rates such as those involved in calendering and milling, but is less significant at shear rates above 1000 s 1 which correspond to injection moulding processes. A better performance is obtained with DOP plasticiser at such high shear rates. For immiscible PVC/EVA blends the variation of the viscosity with composition has been adjusted using an adaptation of the Kolarik model, being this a novel approach to relate the viscous and mechanical behaviour of immiscible but in some way compatible blends [1]. As expected miscible PVC/PU blends viscosity data follow a free volume additivity model. # 2000 Elsevier Science Ltd. All rights reserved. European Polymer Journal 36 (2000) 1011–1025 0014-3057/00/$ - see front matter # 2000 Elsevier Science Ltd. All rights reserved. PII: S0014-3057(99)00146-9 1 Present address: Lea-Artibai Teknik Ikastetxea, Xemein etorbidea, 19, E-48270 Markina, Basque Country (Spain). * Corresponding author. Fax: +349-4616-9160. E-mail address: [email protected] (R. Herna´ndez).
-
Upload
independent -
Category
Documents
-
view
2 -
download
0
Transcript of The effect of a miscible and an immiscible polymeric modifier on the mechanical and rheological...

The e�ect of a miscible and an immiscible polymericmodi®er on the mechanical and rheological properties of
PVC
R. Herna ndeza,*, 1, J.J. PenÄ ab, L. Irustaa, A. Santamarõ aa
aDepartamento de Ciencia y TecnologõÂa de PolõÂmeros, Facultad de Ciencias Quimicas, Universidad del PaõÂs Vasco, Apartado de
Correos 1072, Basque Country, E-20080 San SebastiaÂn, SpainbDepartamento de FõÂsica de Materiales, Facultad de Ciencias QuõÂmicas, Universidad del PaõÂs Vasco, Apartado de Correos 1072,
Basque Country, E-20080 San SebastiaÂn, Spain
Received 24 September 1998; received in revised form 30 March 1999; accepted 14 May 1999
Abstract
PVC/copoly(ester-urethane) (Baymod PU1) and PVC/EVA copolymer blends have been analysed from the point
of view of the e�ect of miscibility on the mechanical and rheological properties. The FTIR and NMR analysis ofBaymod PU modi®er leads to the conclusion that its miscibility with PVC (determined by dynamic mechanicalanalysis) is due to the presence of 31.9% poly(e-caprolactone) and 38.4% adipates in the main chain of the
copoly(ester-urethane) polymer. However the PVC/EVA system considered in this work results in an immiscibleblend, due to the low content of vinyl acetate, 33 wt%. The comparison of the mechanical and rheologicalproperties of both blends with those of a PVC plasticised with a low molecular weight common plasticiser (PVC/
DOP system), reveals that compatibility is not a determinant point in what some ultimate properties are concerned.The molecular weight (related to the viscosity of pure polymers, which is similar for both polymeric modi®ers)seems to play a more important role than the miscibility. The stress±strain curves of both PVC/copoly(ester-urethane) (PU) miscible blends and PVC/EVA immiscible blends resemble each other and are very di�erent with
respect to PVC/DOP curves. The PVCs plasticised with DOP show a considerably higher elongation at break and alower Young's modulus than PVC mixed with polymeric modi®ers. Miscible systems, PVC/PU and PVC/DOP,show similar values of the stress at break, slightly higher than those of immiscible PVC/EVA blends. The results of
the latter two-phase system are well ®tted to a two-parameter equivalent box model developed by Kolarik,considering a value very close to zero for the parameter, which accounts for the adhesion in between the phases.The reduction of the viscosity, induced by PU and EVA polymeric modi®ers, with respect to that of pure PVC, is
remarkable at shear rates such as those involved in calendering and milling, but is less signi®cant at shear ratesabove 1000 sÿ1 which correspond to injection moulding processes. A better performance is obtained with DOPplasticiser at such high shear rates. For immiscible PVC/EVA blends the variation of the viscosity with composition
has been adjusted using an adaptation of the Kolarik model, being this a novel approach to relate the viscous andmechanical behaviour of immiscible but in some way compatible blends [1]. As expected miscible PVC/PU blendsviscosity data follow a free volume additivity model. # 2000 Elsevier Science Ltd. All rights reserved.
European Polymer Journal 36 (2000) 1011±1025
0014-3057/00/$ - see front matter # 2000 Elsevier Science Ltd. All rights reserved.
PII: S0014-3057(99 )00146-9
1 Present address: Lea-Artibai Teknik Ikastetxea, Xemein
etorbidea, 19, E-48270 Markina, Basque Country (Spain).
* Corresponding author. Fax: +349-4616-9160.
E-mail address: [email protected] (R. Herna ndez).

1. Introduction
The migration of common plasticisers such as di(2-ethylhexyl)phthalate (DOP), used in PVC compoundsto allow good processability, is a very important sub-
ject because it can make the ®nal product unsuitablefor many applications. Polymeric modi®ers, usedinstead of low molecular weight plasticisers, represent
a reasonable option because they can act as processingaids and do not involve migration problems. Howeverthe obtention of compatible blends of PVC with other
polymers or copolymers gives rise not only to a vari-ation of the rheological properties, but it can producealso a crucial change in some ultimate properties likeelongation and stress at break. In general, miscibility is
a key factor that determines the mechanical and rheo-logical properties of the polymer blend. Since in thecase of PVC compounds, polymeric modi®ers depend-
ing on their nature, can be either miscible or immisci-ble, the analysis of the properties of the blends referredto their miscibility is a topic of both academic and
technological interest (the terminology immiscible/mis-cible and compatible/noncompatible used in this workis taken from Utracki [1]).In this paper we compare the mechanical and rheo-
logical properties of PVC/copoly(ester-urethane) (PU)and PVC/EVA copolymer blends relating the beha-viour to the morphology of the blend, one single phase
for miscible blends, and multiple phases for immiscibleblends. We have taken PVC plasticised with DOP as areference of an industrial performing material.
2. Experimental
2.1. Materials characterisation
Fourier Transform Infrared Spectroscopic analysis(FTIR) has been carried out using a Nicolet 5DXC
with a resolution of 4 cmÿ1. Pyrolysis Gas Chromatog-raphy-Fourier Transform Infrared (Py-GCIR) spec-troscopy experiments were performed using a
Pyrojector SGE at 7008C. This was attached to theinjector of a gas chromatographic system, ShimadzuGC-14A with a 30 m capillary column. The conditionsfor the experiments were those stated by Weber et al.
[2]: Injector temperature 2508C and a starting tempera-ture in the column chamber of 508C which is main-tained 2 min after injection proceeding to 3008C at a
heating rate of 108C/min. The detector temperaturewas maintained at 2508C. The FTIR spectra were donein the previously mentioned equipment with a wave-
number resolution of 8 cmÿ1 and using four interfero-grams for each spectrum. Both pieces of equipmentwere attached to each other by a Nicolet interface.
1H and 13C NMR spectra have been accomplished ina Varian VXR 300 equipment in deuterated trichloro-
methane.A commercial grade poly(vinyl chloride), Etinox1
650 produced by Aiscondel S.A. (Spain), was used as
the basic polymer in this study. It has been mixed withdi(2-ethylhexyl) phthalate as the reference for plasti-cised PVC, and with two di�erent polymers that can
act as polymeric plasticisers for PVC, a copoly(ester-urethane) Baymod PU1 and an ethylene-vinyl acetatecopolymer (EVA) Alcudia 4611 with 33 wt% vinyl
acetate supplied by Repsol S.A., Spain.All the materials used in this study have been
characterised by FTIR. In order to con®rm the weightpercentage of vinyl acetate in the copolymer a further
study by 1H-NMR was accomplished, arriving to theconclusion that the 33 wt% vinyl acetate stated by theproducer is accurate. The copoly(ester-urethane) Bay-
mod PU1 is an industrial sample which composition isunknown; the only information on the technical paperis that it has traces of poly(vinyl chloride), so in order
to explain the phase behaviour of this PVC modi®erits chemical structure was studied. This is presented inthe Section 3.
The molecular weight of the di�erent materials canplay an important role on the miscibility, and so allpolymers have been characterised by size exclusionchromatography using a Waters 150-C ALC/GPC
equipment and THF as solvent. The universal cali-bration method with narrow polystyrene standards hasbeen used, but not having the Mark±Houwink±Sakur-
ada constants for the copoly(ester-urethane). The datagiven in Table 1 are polystyrene equivalent molecularweights for all compounds.
2.2. Blending
Three di�erent proportions of PVC and DOP, from100/40 to 100/115 parts in weight were mixed in aF.H. Papenmeier ESK 80 intensive mixer at a ro-
tational speed that varies from 500 to 2500 rpm. Therotation was maintained 30 minutes during which thetemperature did not reach 1008C.The resulting powder, as well as pure poly(vinyl
Table 1
Number � �Mn� and weight average molecular weight � �Mw� andpolydispersity index (ID) obtained by size exclusion chroma-
tography (SEC)
Polymer �Mn�Mw ID
PVC 50,800 127,20 0 2.50
EVA 33% 14,100 57,900 4.11
PU 43,700 64,400 1.47
R. HernaÂndez et al. / European Polymer Journal 36 (2000) 1011±10251012

chloride) and PVC/PU, PVC/EVA blends, have beenmilled in a counter-rotating Guix GX-207 Two Roll
Mill at 1708C for 5 min. To obtain the blends with thepolymeric modi®er, the pure PVC was milled ®rst untilit was melted, and then the necessary amount of the
second component was added; a sheet of 11 mmthickness was obtained.
2.3. Dynamic mechanical thermal analysis
Loss tangent values as a function of temperaturehave been determined in a Polymer Laboratories MarkI Dynamic Mechanical Analyser. These measurements
have been carried out in bending mode at a heatingrate of 48C/min and 1 Hz, and the peaks maximumvalues have been used to evaluate the glass transitiontemperature, Tg.
2.4. Continuous ¯ow techniques
Continuous ¯ow measurements were accomplishedin an extrusion rheometer, GoÈ ttfert Rheograph 2002,in the capillary mode, with a capillary diameter of 1
mm and a length of 30 mm. The melt pressure in thereservoir was measured using a transducer in front ofthe ¯at entrance (1808) die. A set of transducers
(Dynisco quality 1: measuring error 0.5%) with ranges0±2000 bar, 0±500 bar and 0±100 bar were used. All
measurements were obtained in steady state ¯ow andwith a tolerance <1%.
2.5. Mechanical measurements
Tensile measurements have been made in an Instron4301 Universal testing machine coupled to a computerand according to ASTM standard D638. The type Vprobes were cut from the previously obtained ®lms.
The crosshead speed was 20 mm/min and the distancein between clamps 25.4 mm. A minimum of ®vesamples was analysed in order to obtain every result.
The temperature in the testing room was maintained at23228C.
3. Results and discussion
3.1. Chemical structure of Baymod PU1 copoly(ester-urethane)
As stated in Section 2.1, little information is givenby the technical brochure on the chemical compositionof Baymod PU1. Being the chain composition a key
Fig. 1. Gram±Schmidt reconstruction obtained from the pyrolysis gas chromatography performed to the copoly(ester-urethane).
R. HernaÂndez et al. / European Polymer Journal 36 (2000) 1011±1025 1013

factor on the miscibility±immiscibility of polymer
blends, a chemical characterisation of the product has
been conducted.
As a ®rst approach to the nature of the polymer,
FTIR spectra were studied. The FTIR spectrum shows
no absorption due to unsaturation in the area over
3000 cmÿ1, therefore both diisocyanate and ¯exible
segments are aliphatic. Near 1100 cmÿ1 there is no
absorption due to the ether-urethane bonding, so it
can be inferred that it must be an ester-urethane.
From the position of the peak due to the carbonyl
group 1684 cmÿ1 the diisocyanate seems to be hexam-
ethylene diisocyanate. Studying the C±O stretching
area the peaks look very much like those of esters of
an adipic acid [3].
As this information was not enough to have this
polymer perfectly characterised, some directly coupled
Pyrolysis Gas Chromatography-Fourier Transform In-
frared spectroscopic experiments (Py-GCIR) were car-
ried out. Taking into consideration the works by
Weber et al. [2], we obtain ®ve main peaks (Fig. 1). In
the ®rst one (retention time 1.5±5 min) there is
methane as well as ethylene; the second one (about 10
min retention time) is due to naphthalene; the third
one (nearly 14 min retention time) is produced by the
tetradecanethiol; the fourth peak in between 15 and 16
min retention time seems to be due to the ethyl-ester
of the oleic acid, and the last peak in the Gram±
Schmidt reconstruction looks like the dipropylic-ester
of the adipic acid (retention time 17 min).
The main conclusion that we can infer from these
experiments and the works by Weber et al. [2], is that
the ethylene in peak one must come from the ethylene-
glycol segments in the polyurethane. From the other
peaks the only possible conclusions are that there are
at least two di�erent esters, and that one of them
seems to be a compound of the adipic acid which is a
result in accordance with the conclusions obtained
from the study of the transmission FTIR spectra.
This information as well as that obtained from the
transmission FTIR spectroscopy gives us a clue on
what to look for in our 1H-NMR and 13C-NMR spec-
tra.
In 1H-NMR spectra (Fig. 2) we have identi®ed nine
major peaks which we assign to the following com-
pounds [4]:
R. HernaÂndez et al. / European Polymer Journal 36 (2000) 1011±10251014

The ®rst peak must be due to protons that are bonded
to a carbon atom that is already bonded to a quatern-
ary carbon atom. The position in the spectra, about 1
ppm, indicates that it should be a methyl group
(labelled 5 '). Looking at the seventh peak in between
3.8 and 3.9 ppm, that being a single peak should be
bonded to a quaternary carbon atom, we conclude
that it must be the methylene labelled 4 ' on both sides
of the Neopentylglycol, which is a very common chain
extender for rigid segments in segmented polyurethanes
[3].
From peaks 2, 3 and 6 we can con®rm the existence
of hexamethylene diisocyanate. The second peak is due
to the central methylene groups (labelled 3); the third
peak is due to those protons bonded to the carbon
atom just immediately bonded to the central methylene
groups (labelled 2). The sixth peak at 3.2 ppm corre-
sponds to protons bonded to the carbon atom bonded
to the nitrogen atom in the urethane group (labelled
1).
The results from Py-GCIR seem to indicate the
existence of ethyleneglycol in the ester groups. This is
con®rmed by peak nine at 4.3 ppm, which is a single
peak due to the identical CH2 groups of the ethylene-
glycol bonded to an ester group (labelled 3 ').As stated previously there are at least two major
ester groups, one of them is an ester formed from the
adipic acid, con®rmed by the position of peaks four
and ®ve that belong to the methylene groups labelled
2 ' and 1 ', respectively. Nevertheless there is something
else in peak ®ve than it should in case the only ester
group was an adipate. The possibility of poly(e-capro-
lactone) was considered because it is a very soft polye-
ster and is miscible with PVC in case there is no
crystallinity [5±13]. It looks like the methylene labelled
10 should be included in peak ®ve, whereas the groups
labelled 20 and 40 should be included in peak 3. The
central methylene group (labelled 30) is enclosed in
peak 2, and ®nally the methylene right bonded to the
oxygen atom (labelled 50) is the main component of
peak eight, although there must be some contribution
of the methylene groups labelled 4 which are the ones
attached to the oxygen of the urethane groups.
A further study by 13C-NMR con®rms the existence
of the previously reported substances, and so there are
16 major peaks (Fig. 3) which we assign as follows.
The ®rst peak at 22 ppm is assigned to the methyl
carbon in the neopentylglycol. The second one is due
to the carbon labelled 20 of poly(e-caprolactone). Thethird peak is assigned to the central carbon atoms in
the adipate (labelled 2 '). The fourth peak comes from
the central methylene in poly(e-caprolactone) labelled
30. The ®fth and seventh peaks are due to the methyl-
ene, labelled 3 and 2, respectively in hexamethylenedii-
socyanate. The sixth peak comes from the methylene
labelled 40 in poly(e-caprolactone). The eighth and
ninth peaks are assigned to the methylene groups
bonded to the carbonyl carbon atom in adipate (peak
8 label 1 ') and in poly(e-caprolactone) (peak 9 label
10). Peak ten is due to the quaternary carbon atom in
neopentylglycol (label 7 '). The eleventh peak is
assigned to the methylene groups bonded to the nitro-
gen atoms in hexamethylenediisocyanate (labelled 1).
In between 62 and 72 ppm there are three peaks
Fig. 2. 1H-NMR spectra of the copoly(ester-urethane).
R. HernaÂndez et al. / European Polymer Journal 36 (2000) 1011±1025 1015

labelled 12, 13 and 14, which correspond to carbon
atoms, bonded to oxygen. The former is assigned to
methylene groups of ethyleneglycol (labelled 3 '). The
second one to the methylene labelled 50 in poly(e-caprolactone), and the latter to the methylene bonded
to oxygen in neopentylglycol (labelled 4 ') and all the
methylene groups bonded to the oxygen of the
urethane group.
Finally, there are another two peaks at low ®elds
which are assigned to the carbonyl carbon atoms due
to urethane groups the one at 158 ppm and to the car-
bonyl carbon atom of ester groups (labelled 6 ' and 60)the one at 174 ppm.
There seems to be another two peaks, very little in
fact, centred at about 46 and 57 ppm that could be
due to the poly(vinyl chloride), that is stated to be pre-
sent in the formulation of the copolymer in between 3
and 5 wt% according to the technical brochure.
Once the peak assignment was done we still needed toknow the amount of each compound in the polymer,so thanks to the peak integration method for 1H-NMR
and knowing how many hydrogen atoms are there ineach peak, we can have an accurate idea (with an errorless than 10 wt%) of the composition in the polymer
(see Table 2). Solving the equation system we can con-clude that there is a 38.4% adipate, 9.4% neopentyl-glycol, 31.9% poly(e-caprolactone), 11.9%
hexamethylenediisocyanate and 8.4% ethyleneglycol inthe copoly(ester-urethane) PU compound.
3.2. Blend miscibility
Our dynamic viscoelastic measurements show asingle Tg for all the blends involving PVC/DOP, whichis used as a reference for plasticised PVC compounds.
Table 21H-NMR peak integration used to determine the content of each group in the copoly(ester urethane)a
Peaks 1 2, 3 and 4 5 6 7 8 9
Integral value 21.6 171.7 70.6 13.4 19.5 37.7 34.1
H atoms 6 Npg 6 I + 8 e + 4 Ad 2 e + 4 Ad 4 I 4 Npg 2 e + 4 I 4 Eg
a Npg: Neopentylglycol, I: Hexamethylenediisocyanate, e: Poly(e-caprolactone), Ad: Adipate, Eg: Ethyleneglycol.
R. HernaÂndez et al. / European Polymer Journal 36 (2000) 1011±10251016

These results agree well with those in literature for the
same system [14±16]. Our results (not shown here) in-
dicate that the variation of the maximum loss tangent
and width of the peak with concentration is not only
due to a dilution e�ect, but probably due to certain
variations in crystallinity [17±20].
The results obtained for the blends involving the
EVA copolymer are very di�erent. All the blends show
two Tg's near to those corresponding to each com-
ponent. These results were expected because in a pre-
vious work [20] it was demonstrated that the blends of
PVC with an EVA copolymer with 33 wt% acetate
were immiscible. This result is in accordance with the
reported miscibility window for PVC and EVA copoly-
mers that is located in between 45 and 87 wt% acetate
in the copolymer [21±26].
PVC/Baymod PU1 blends show complete miscibility
(Fig. 4) at the scale measured by dynamic mechanical
analysers. Single Tg is observed for every composition,
and the temperature shift is that expected for a misci-
ble blend. Nevertheless there is an increase in the
width of the peak as the content in PVC is decreased.
The reported miscibility was expected due to the
31.9% composition of poly(e-caprolactone) in the poly-
urethane. What is more this miscibility is enhanced by
the rupture of the crystallinity in the polyester due to
the polymerisation of di�erent components [5±7].
This statement is con®rmed by the results reported
by Ajjl and Renaud [8] or Hubbel and Cooper [9] who
prepared cast blends of PVC/PCL from THF. These
works among others [10,11] indicate that this system ismiscible in the amorphous or molten state throughout
the entire composition range 10±90% poly(e-caprolac-tone), although in solid state the PCL crystalline phaseis not interfered by the PVC. Anyway PVC rich con-centrations (higher than 60%) in the blend avoid the
formation of the crystalline phase due to the poly(e-caprolactone) and a single Tg appears. Further studiesinvolving techniques such as FTIR and ESCA have
been accomplished by Coleman et al. [12] or Clark etal. [13] leading to the same conclusions: a blend incor-porating less than a 40% of PCL will not be able to
crystallise in presence of a PVC rich phase.As reported above, the rest of the components of
Baymod PU1 are: neopentylglycol, ethyleneglycol and
an adipate. The adipates are common plasticisers forPVC [14±16,27±29], so the fact that a 38% of BaymodPU1 is based in an adipate makes it rather logical tothink that this copoly(ester-urethane), mainly com-
posed by poly(e-caprolactone) and an adipate, must becompatible with PVC.
3.3. Mechanical properties
Mechanical properties are used as indicators both ofthe material or formulation quality and service per-formance. Among other important properties, the
most widely tested properties include tensile strengthand elongation, which can be obtained from thestress±strain curve. The aim of such experiences is to
Fig. 3. 13C-NMR spectra of the copoly(ester-urethane).
R. HernaÂndez et al. / European Polymer Journal 36 (2000) 1011±1025 1017

give an idea of the performance an object produced
with such a formulation will have when is subject toordinary life stresses, and to give engineers a ®gure for
stress analysis calculations.As commonly known the addition of some plastici-
sers to a rigid PVC gives rise to a change in the soft-ness of the product [14±16]. This change will suppose adecrease in the tensile strength as well as an increase in
the elongation at break, depending the amount of bothchanges in the level of plasticisation and the nature of
the plasticiser.As has been exposed in Section 3.2, there are
two miscible PVC/DOP and PVC/PU systems, andan immiscible PVC/EVA blend. Therefore we willnot be able to explain every e�ect involved in the
change of properties of pure PVC due to the ad-dition of the second component only in terms of a
softening e�ect of the latter. In Fig. 5 we can seethe tensile stress±strain curves for PVC and similar
compositions of the second component. As can beseen from the ®gure the addition of about 30% involume of the second component leads to a
decrease in the ultimate strength, as well as a re-duction on the elongation at break of all the
samples except the DOP plasticised formulation.
Anyway, the shape of the curves is di�erent fromthat of pure PVC. There is no yielding, neither
necking, which is much more like the performanceof a rubbery compound. The stress±strain data for
other compositions are presented in Table 3.If we consider the elongation at break of the
samples obtained by plasticising PVC with DOP,
they have nothing to do with those obtained blend-ing the PVC resin with the polymeric modi®ers.
The elongation at break is in the most favourablecase at least 5 times lower than that of a common
use plasticiser. Nevertheless Young's modulus areconsiderably higher when both polymeric modi®ersare used.
The ultimate stress data are shown in Fig. 6. Itis observed that miscible systems give rise to slightly
higher values. For both polymeric modi®ers a shal-low minimum can be noticed. The results of the
two phase PVC/EVA blend can be ®tted to aTakayanagi's model modi®ed by Kolarik [30±33] orTomlins and Read [34] and described as an Equiv-
alent Box Model. In this model the cocontinuity ofthe di�erent phases is considered as a parallel con-
Fig. 4. Dynamic mechanical spectra of PVC/PU blends: loss tangent vs. temperature. r nEVA � 1:0, W nPVC � 0:38, Q nPVC � 0:71,w nPVC � 0:88 and R nPVC � 1:0: Heating rate 48C/min 1 Hz.
R. HernaÂndez et al. / European Polymer Journal 36 (2000) 1011±10251018

tribution of each of them, plus a series model inparallel to the cocontinuous phases.
tb �"X
i
niptib
#� Atb minns �1�
where tb is the stress at break of the sample; tib is
the stress at break of each of the components; nipis the volume fraction of component i in parallel
(cocontinuous). tb min is the minimum stress at
break of the components considered; ns is the total
volume fraction in series, and A is a term related
Fig. 5. Stress±strain curves of PVC R, PVC/DOP �nPVC � 0:5�W, PVC/EVA �nPVC � 0:4� * and PVC/PU �nPVC � 0:45�w blends,
and pure EVA Q and PU q. Tests performed at a crosshead speed of 20 mm/min and a temperature of 23228C.
Table 3
Young's modulus (E ), tensile strength �tb� and elongation at break �eb� as a function of the composition (see Section 2)
PVC volume fraction �n) E (MPa) tFUNCb (MPa) eb (%)
PVC 1.0 2439.0 46.2 29.7
PVC/DOP 0.63 74.8 25.8 223.0
0.50 9.0 14.6 353.0
0.38 2.7 7.7 422.0
PVC/PU 0.88 2263.0 42.6 4.9
0.71 1150.0 24.0 14.4
0.45 73.4 9.5 80.1
0.00 35.5 11.3 1060.0
PVC/EVA 0.86 1721.0 32.9 13.1
0.67 778.2 14.0 6.5
0.40 700.5 4.3 39.7
0.00 7.5 8.0 995.0
R. HernaÂndez et al. / European Polymer Journal 36 (2000) 1011±1025 1019
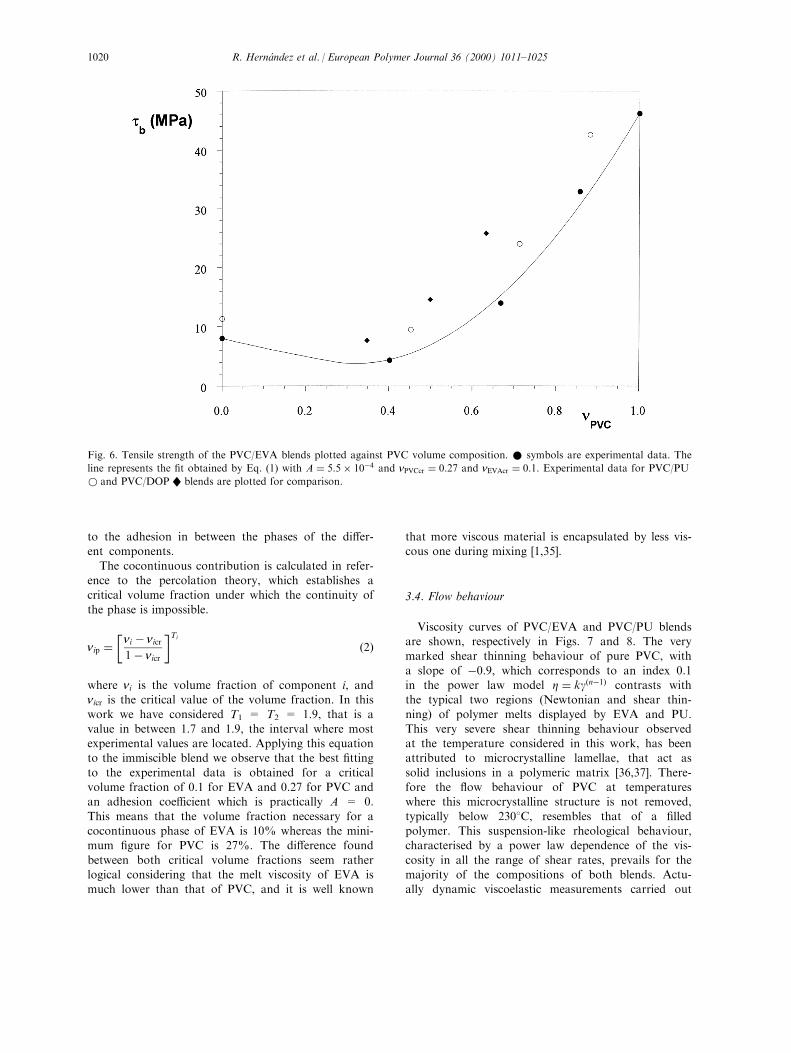
to the adhesion in between the phases of the di�er-ent components.
The cocontinuous contribution is calculated in refer-ence to the percolation theory, which establishes acritical volume fraction under which the continuity of
the phase is impossible.
nip ��ni ÿ nicr
1ÿ nicr
�Ti
�2�
where ni is the volume fraction of component i, andnicr is the critical value of the volume fraction. In this
work we have considered T1 = T2 = 1.9, that is avalue in between 1.7 and 1.9, the interval where mostexperimental values are located. Applying this equationto the immiscible blend we observe that the best ®tting
to the experimental data is obtained for a criticalvolume fraction of 0.1 for EVA and 0.27 for PVC andan adhesion coe�cient which is practically A = 0.
This means that the volume fraction necessary for acocontinuous phase of EVA is 10% whereas the mini-mum ®gure for PVC is 27%. The di�erence found
between both critical volume fractions seem ratherlogical considering that the melt viscosity of EVA ismuch lower than that of PVC, and it is well known
that more viscous material is encapsulated by less vis-cous one during mixing [1,35].
3.4. Flow behaviour
Viscosity curves of PVC/EVA and PVC/PU blendsare shown, respectively in Figs. 7 and 8. The verymarked shear thinning behaviour of pure PVC, with
a slope of ÿ0.9, which corresponds to an index 0.1in the power law model Z � kg�nÿ1� contrasts withthe typical two regions (Newtonian and shear thin-
ning) of polymer melts displayed by EVA and PU.This very severe shear thinning behaviour observedat the temperature considered in this work, has beenattributed to microcrystalline lamellae, that act as
solid inclusions in a polymeric matrix [36,37]. There-fore the ¯ow behaviour of PVC at temperatureswhere this microcrystalline structure is not removed,
typically below 2308C, resembles that of a ®lledpolymer. This suspension-like rheological behaviour,characterised by a power law dependence of the vis-
cosity in all the range of shear rates, prevails for themajority of the compositions of both blends. Actu-ally dynamic viscoelastic measurements carried out
Fig. 6. Tensile strength of the PVC/EVA blends plotted against PVC volume composition. * symbols are experimental data. The
line represents the ®t obtained by Eq. (1) with A � 5:5� 10ÿ4 and nPVCcr � 0:27 and nEVAcr � 0:1: Experimental data for PVC/PU
w and PVC/DOP W blends are plotted for comparison.
R. HernaÂndez et al. / European Polymer Journal 36 (2000) 1011±10251020

with PVC/DOP systems [20] have revealed that
microcrystals are still present in plasticised PVC.
Therefore is not surprising to ®nd the rheological
behaviour associated with microcrystallinity in a
compatible system such as PVC/PU.
In both compatible and incompatible blends the
reduction of the viscosity with respect to that of
pure PVC is more signi®cant at low shear rates (10±
100 sÿ1) as those produced in processes like calender-
ing and milling. At high shear rates viscosity curves
tend to come closer as in the case of suspension rheol-
ogy [35]. The resistance to ¯ow found in extrusion and
injection moulding, which gives rise respectively to
shear rate ranges 100±1000 and 1000±10,000 sÿ1, is
not, therefore, so drastically improved. Notwithstand-
ing slightly better results are found for miscible PVC/
PU blends than for incompatible PVC/EVA blends,
the improvement of the rheological conditions,
specially in injection moulding, is not so relevant as
for PVC plasticised by DOP, as can be seen in Figs. 7
and 8 (continuous lines for a volume fraction
nPVC � 0:38).
Plots of the viscosity taken at 30 and 1000 sÿ1, as a
function of composition are given in Figs. 9 and 11 for
PVC/EVA and PVC/PU blends. In the case of immis-
cible system good ®ts are obtained adapting, to vis-
cosity results, the model of Kolarik (Eq. (1)) used toadjust the ultimate strength (Fig. 6). In this case the
adjustable parameter A does not have the same ad-hesive physical meaning considered for mechanicalblends. It is a term that represents the increase of vis-cosity su�ered by the discontinuous phase due to the
existence of a discrete phase in it [38].
log Zb �"X
i
nip log Zi
#� Ans log Zmin �3�
In Fig. 9 viscosity data of PVC/EVA at shear rates 30and 1000 sÿ1 are shown. Good ®ts to the experimentalresults are obtained using the critical volume fractions
obtained from tensile experiments, with a value of 1.2for the adjustable parameter A.For compatible PVC/PU system we consider a
model based on the additivity of molecular weight andfree volume [39], which gives rise to the equation:
Z ��n1A1�M�1=a�n2A2�M�1=a
�aexp
1
n1f1 � n2f2 � Kn1n2�4�
Where ni is the volume fraction of component i, Ai isan adjustable parameter related to the average molecu-lar weight (M ) of each component, fi is the free
Fig. 7. Viscosity as a function of shear rate at 1608C for PVC/EVA blends. Symbols are as follows: R nPVC � 1, ^ nPVC � 0:86, qnPVC � 0:67, w nPVC � 0:40 and * nPVC � 0: The full line ÐÐÐ states for PVC/DOP nPVC � 0:38 system as a reference for com-
mon plasticised blends.
R. HernaÂndez et al. / European Polymer Journal 36 (2000) 1011±1025 1021

Fig. 9. Viscosity at 1608C vs. volume fraction of EVA for PVC/EVA blends for a constant shear rate. The lines represent the ®ts
obtained applying Eq. (3) with nicr values from Fig. 6. * 30 sÿ1 data, ®tted with A=1.21. R 1000 sÿ1 data, ®tted with A � 1:25:
Fig. 8. Viscosity as a function of shear rate at 1608C for PVC/PU blends. Symbols are as follows: R nPVC � 1, ^ nPVC � 0:88, qnPVC � 0:71, w nPVC � 0:45 and * nPVC � 0: The full line ÐÐÐ states for PVC/DOP nPVC � 0:38 system as a reference for com-
mon plasticised blends.
R. HernaÂndez et al. / European Polymer Journal 36 (2000) 1011±10251022

volume of component i and K is a constant that stands
for the modi®cations of the free volume due to mixing[39,40].The contribution of K can be measured considering
the variation of the glass transition temperature of the
blends against composition (Fig. 10), ®tting the data tothe following expression, which is derived from theadditivity of the free volume [40].
Tgb � n1af1Tg1 � n2af2Tg2 � Kn1n2n1af1 � n2af2
�5�
Where ni is the volume fraction of component i, afi isthe thermal expansion coe�cient of free volume of
component i [20], Tgi is the glass transition tempera-ture of the component i, and K has the same meaningas in Eq. (4). As can be seen in Fig. 10 we obtain agood ®t for K � ÿ0:2, and that is the value used in
Eq. (4) to adjust the viscosity data of PVC/PU blends.A negative value of K implies a reduction of freevolume during mixing, and is related to a strong inter-
action in between components, which should beexpected in a miscible polymer blend. In Fig. 11 plotsof PVC/PU blends viscosity against composition are
shown. The curve ®ts are obtained using the freevolume parameters fi calculated as explained in aprevious work [20]. It is observed that as strain rate
increases the exponent a decreases, being this a com-
mon tendency related to the polymer solutions the-ory, in which it is explained as a result of thedisentanglement of the molecules at high strain rates[41].
4. Conclusions
Stress±strain curves and viscosity versus shear rate
data of both miscible PVC/PU and immiscible PVC/EVA blends resemble each other but di�er consider-ably from the results obtained with PVC/DOP systems.
The PVC plasticised with common DOP plasticisershows a considerable higher elongation at break and alower Young modulus than PVC mixed with polymericmodi®ers. A remarkable reduction in the viscosity of
the polymer blends is observed, which make thesecompounds worthy of attention from a technologicalpoint of view.
The polymeric modi®ers were selected because therange of viscosities is similar in both of them, andallows the study of the e�ect of miscibility on the
processability improvement when Baymod PU1 orEVA copolymers are added to PVC. The reduction ofthe viscosity, induced by the polymeric modi®ers,
Fig. 10. Data of glass transition temperatures Tg against volume fraction of PU for PVC/PU blends. The data have been ®tted by
Eq. (5), using afPVC � 3:8� 10ÿ3 and afPU � 8:8� 10ÿ4 obtained as explained in Ref. [20] and K � ÿ0:2:
R. HernaÂndez et al. / European Polymer Journal 36 (2000) 1011±1025 1023

with respect to that of pure PVC, is remarkable at
shear rates such as those involved in calendering andmilling, but is less signi®cant at shear rates above1000 sÿ1 which correspond to injection moulding pro-
cesses.These results reveal that miscibility does not seem
to play a relevant role in the ultimate properties con-sidered in this work. Another goal of this study is the
simultaneous adjustment of the mechanical and steadystate viscous data of immiscible polymer blends bymeans of an equivalent box model developed by
Kolarik.
Acknowledgements
This research was supported by Aiscondel S.A.(Monzo n, Spain), Ministerio de Industria, Madrid
(C.D.T.I. program) and the Exma. Diputacio n Foralde Gipuzkoa (Basque Country, Spain). We thank Pro-fessor M.J. Ferna ndez-Berridi and Dr. S. Bastida for
help and encouragement in Baymod PU1 chemicalanalysis and mechanical testing of the materials, re-spectively.
References
[1] Utracki LA. Polymer alloys and blends. Munich:
Hanser, 1989.
[2] Weber D, FuÈ loÈ p G, Hummel DO. Makromol Chem,
Macromol Symp 1991;52:151.
[3] Hepburn C. Polyurethane elastomers. London: Elsevier,
1992.
[4] Phan QT, Petiaud R, Waton H, France M, Darricades
L. Proton and carbon NMR spectra of polymers.
London: Penton Press, 1991.
[5] Bandyopadhyay PK, Shaw MT. J Vinyl Technol
1982;4:142.
[6] Bandyopadhyay PK, Shaw MT. J Appl Polym Sci
1982;27:4323.
[7] Ma DZ, Prud homme RE. Polymer 1990;31:917.
[8] Ajjl A, Renaud MC. J Appl Polym Sci 1991;42:335.
[9] Hubbell DS, Cooper SL. J Polym Sci: Polym Phys Ed
1977;15:1143.
[10] Koleske JV, Lundberg RD. J Polym Sci 1969;A-2:7.
[11] Runt JP, Barron CA, Zhang XF, Kumar SK.
Macromolecules 1991;24:3466.
[12] Coleman MM, Zarian J. J Polym Sci: Polym Phys De
1979;17:837.
[13] Clark MB, Burkhardt CA, Gardella JA. Macromolecules
1989;22:4495.
Fig. 11. Viscosity at 1608C vs. volume fraction of PU for PVC/PU blends, for a constant shear rate. The lines represent the ®ts
obtained applying Eq. (4) with K � ÿ0:20, fPVC = 0.334 and fPU = 0.195 obtained as explained in Ref. [20]. * 30 sÿ1 data, ®tted
with a � 0:28: R 1000 sÿ1 data, ®tted with a � 0:21:
R. HernaÂndez et al. / European Polymer Journal 36 (2000) 1011±10251024

[14] Titow WV. PVC plastics properties, processing and ap-
plications. New York: Elsevier, 1990.
[15] Hammer CF. In: Paul DR, Newman S, editors. Polymer
blends, vol. 2. New York: Academic Press, 1978.
[16] Meier L. In: GaÈ chter R, MuÈ ller H, editors. Plastics addi-
tives handbook. Munich: Hanser/Gardner, 1993.
[17] Pezzin G, Ajroldi G, Garbuglio C. J Appl Polym Sci
1967;11:2553.
[18] Murayama T. Dynamic mechanical analysis of polymeric
materials. New York: Elsevier, 1978.
[19] Guerrero SJ. Macromolecules 1989;22:3480.
[20] Herna ndez R, Del Agua JA, PenÄ a JJ, Santamarõ a A.
Polym Eng Sci 1996;36:2570.
[21] Hammer CF. Macromolecules 1971;4:69.
[22] RaÊ mby BG. J Polym Sci: Symp 1975;51:89.
[23] Coleman MM, Serman CJ, Bhagwagar DE, Painter PC.
Polymer 1990;31:1187.
[24] Feldman D, Rusu M. Eur Polym J 1974;10:41.
[25] Shur YJ, RaÊ mby BG. J Appl Polym Sci 1975;19:1337.
[26] Cruz Ramos CA, Paul DR. Macromolecules
1989;22:1289.
[27] Fried JR, Lai SY. J Appl Polym Sci 1982;27:2869.
[28] Beirnes KJ, Burns C. J Appl Polym Sci 1986;31:2561.
[29] Brydson JA. Plastic materials. New York: Wiley, 1992.
[30] Kolarik J. Polymer 1994;35:3631.
[31] Kolarik J. Polymer 1996;37:887.
[32] Kolarik J. Polym Eng Sci 1996;36:2518.
[33] Kolarik J. Eur Polym J 1998;34:585.
[34] Tomlins PE, Read BE. Plast Rubber Compos Process
Appl 1991;16:17.
[35] Han CD. Multiphase ¯ow in polymer processing. New
York: Academic Press, 1981.
[36] Bonnebat C, De Vries AJ. Polym Eng Sci 1978;18:824.
[37] Ferguson J, Kemblowski Z. Applied ¯uid rheology.
London and New York: Elsevier, 1991.
[38] Utracki LA. J Rheol 1991;35:1615.
[39] MunÄ oz Escalona A, Lafuente P, Vega JF, MunÄ oz ME,
SantamarõÂ a A. Polymer 1997;38:589.
[40] Ferry JD. Viscoelastic properties of polymers. New
York: Wiley, 1980.
[41] Porter RS, Johnson JF. Chem Rev 1966;66:1.
R. HernaÂndez et al. / European Polymer Journal 36 (2000) 1011±1025 1025