The Ecology Of Marine Top Predators At The Easter Island ...
158
THE ECOLOGY OF MARINE TOP PREDATORS AT THE EASTER ISLAND ECOREGION: A BASELINE FOR MANAGEMENT AND CONSERVATION Doctorado en Biología y Ecología Aplicada Programa cooperativo entre la Universidad Católica del Norte y la Universidad de la Serena by Naití Andrea Morales Serrano Supervisors: Dr. Carlos F. Gaymer and Dr. Alan M. Friedlander Coquimbo, 2020
-
Upload
khangminh22 -
Category
Documents
-
view
0 -
download
0
Transcript of The Ecology Of Marine Top Predators At The Easter Island ...

THE ECOLOGY OF MARINE TOP PREDATORS AT THE EASTER
ISLAND ECOREGION: A BASELINE FOR MANAGEMENT AND
CONSERVATION
Doctorado en Biología y Ecología Aplicada
Programa cooperativo entre la Universidad Católica del Norte y la Universidad de la Serena
by
Naití Andrea Morales Serrano
Supervisors: Dr. Carlos F. Gaymer and Dr. Alan M. Friedlander
Coquimbo, 2020

ii
FACULTAD DE CIENCIAS DEL MAR UNIVERSIDAD CATÓLICA DEL NORTE
DOCTORADO EN BIOLOGÍA Y ECOLOGÍA APLICADA
“THE ECOLOGY OF MARINE TOP PREDATORS AT THE EASTER ISLAND ECOREGION: A
BASELINE FOR MANAGEMENT AND CONSERVATION”
por: Naití Andrea Morales Serrano
Departamento Biología Marina
Fecha: 17 de noviembre de 2020
Aprobado Comisión de Calificación
______________________________ ______________________________
Juan Macchiavello Armengol Carlos F. Gaymer Decano Facultad Ciencias del Mar Profesor Guía
______________________________ ______________________________
Alan M. Friedlander Marcelo Rivadeneira Profesor Guía Comité tutorial
______________________________ ______________________________
Guillermo Luna-Jorquera David Véliz Comité Tutorial Profesor Externo
Tesis entregada como un requisito para obtener el título de Doctor en Biología y Ecología Aplicada
en la Facultad de Ciencias del Mar. Universidad Católica del Norte. Sede Coquimbo.

iii
FACULTAD DE CIENCIAS DEL MAR UNIVERSIDAD CATÓLICA DEL NORTE
DOCTORADO EN BIOLOGÍA Y ECOLOGÍA APLICADA
Departamento de Biología Marina
“THE ECOLOGY OF MARINE TOP PREDATORS AT THE EASTER ISLAND ECOREGION: A
BASELINE FOR MANAGEMENT AND CONSERVATION”
Actividad de Titulación presentada
para optar al Título de Doctor en
Biología y Ecología Aplicada
NAITÍ ANDREA MORALES SERRANO
Coquimbo, noviembre de 2020

i
FACULTAD DE CIENCIAS DEL MAR UNIVERSIDAD CATÓLICA DEL NORTE
DOCTORADO EN BIOLOGÍA Y ECOLOGÍA APLICADA
DECLARACIÓN DEL AUTOR
Se permiten citas breves sin permiso especial de la Institución o autor, siempre y cuando se
otorgue el crédito correspondiente. En cualquier otra circunstancia, se deberá solicitar permiso
de la Institución o el autor.
Naití Andrea Morales Serrano
Firma
2020

ii
ABSTRACT
Top predators are a key component of marine ecosystems and play an important role in top-down
ecosystem regulation of lower trophic levels. The continuing decline of their populations has
increased the concern about their conservation and the possible effects on the entire ecosystem.
To develop effective management and conservation strategies for these predators, it is imperative
to better understand their ecology, from community-level (e.g., species assemblage composition
and their interactions) to individual species-specific aspects (e.g., abundance, distribution, and
spatial dynamics).
Rapa Nui (Easter Island) and Salas y Gómez Island are considered the most isolated islands and
the south-eastern coral most reefs in the Pacific Ocean. The marine ecosystems in this area have
been understudied in comparison to other locations in the Pacific. Previous studies showed
contrasting top-predator assemblages between the two islands. Rapa Nui displays signs of
historical overfishing and the reef fish assemblage is dominated by smaller planktivorous species.
In contrast, at Salas y Gómez Island species such as the Galapagos shark (Carcharhinus
galapagensis) and jacks (Seriola lalandi, Caranx lugubris, and Pseudocaranx dentex) are
abundant and dominate the ecosystem. However, despite its remoteness, Salas y Gómez Island
has not escaped from anthropogenic impacts. Sharks at Salas y Gómez Island are small and
cautious. Some individuals have been observed with fishing hooks in their mouths, suggesting
that recent illegal fishing is likely occurring in the area.
Using multiple approaches, this thesis provides the basic information needed for developing
science-based management strategies across top predator species within the Easter Island
ecoregion. A general introduction, including background and specific aims is presented in
CHAPTER 1, following by four chapters which used different approaches to answer a variety of
ecological questions:

iii
CHAPTER 2.- To characterize the assemblage of top predator species around Rapa Nui, a baited
remote underwater video system (BRUVS) was used for one year. I found significant spatial and
seasonal differences in the fish assemblage around the island. The southern coast of Rapa Nui,
which is the most exposed to large swells, was different in fish assemblage structure from the
other sites and concentrated more top predator species. Winter season was distinct from the other
seasons, probably associated to the strong oceanic swells and winds coming from the south
during that time of year. Weather conditions also limits fishing pressure which could contribute to
the higher concentration of these predators. These findings are essential in the implementation
of conservation and management strategies, such as the newly created Rapa Nui multiple uses
coastal marine protected areas (MUMPA).
CHAPTER 3.- To determinate the trophic position and to define the trophic interaction of sympatric
species, δ13C and δ15N isotopic signatures of large fishes inhabiting Rapa Nui were used. The
results suggest that not all large fishes sampled should be considered as top predator species,
and that there is a high degree of overlap among the isotopic niche of four of these species,
suggesting potential interspecific competition. This chapter contributes to correctly identifying the
role of large fishes inhabiting Rapa Nui in order to create a wider understanding of how these
species interact in an isolated and species-poor ecosystem.
CHAPTER 4.- To study the movement patterns of the two more abundant two predator species
and then shed lights about the effectiveness of the borders of the Motu Motiro Hiva Marine Park
(MMHMP) around Salas y Gómez Island, I studied the movement patterns of the two most
abundant top predators: the Galapagos shark, Carcharhinus galapagensis, and the yellowtail
amberjack, Seriola lalandi. Specimens from both species were tagged around Salas y Gómez
Island using miniPAT satellite tags. The results showed that most of the satellite geolocations
come from inside the MMHMP. However, all the individuals crossed the park borders at some
point during the tracking time. These findings, thus, endorse the expansion of the current border

iv
to the west in order to protect mobile species. Additionally, a female Galapagos shark travelled a
maximum linear distance of 236 km extending the maximum distance previously reported for
juveniles of this species (< 50 km). These results raise the question whether adults are
maintaining genetic connectivity between Rapa Nui and Salas y Gómez Island through long
distance movements.
CHAPTER 5.- To determine the levels of genetic connectivity of the Galapagos shark between
Rapa Nui and Salas y Gómez Island, a genome-wide neutral Single Nucleotide Polymorphism
(13496 neutral SNP) and a section of the mtDNA (636 pb) markers were used. The results
suggested that individuals inhabiting both islands belong to the same population and could be
considered as one conservation unit. This study highlights the importance of the MMHMP, a non-
take zone, in preserving the local populations of the Galapagos shark. In addition, the
comparatively low genetic diversity found at the Easter Island Ecoregion suggests the occurrence
of few colonization events due to the isolation of the area.
CHAPTER 6.- In this section I discussed the most significant results found through the thesis in
a general context. Additionally, I discussed the limitation of the study, and the importance of
comparative studies between Rapa Nui and Salas y Gómez Island. Finally, I included
recommendations for future studies regarding top predator biodiversity and their protection at the
Easter Island Ecoregion.

v
RESUMEN
Los depredadores topes son un componente clave de los ecosistemas marinos y desempeñan
un papel fundamental en la regulación del ecosistema top-down de los niveles tróficos inferiores.
El continuo declive de sus poblaciones ha generado una creciente preocupación por su
conservación y por los posibles efectos en el ecosistema. Para desarrollar estrategias efectivas
de manejo y conservación para estas especies, es imperativo comprender mejor su ecología,
desde el nivel de comunidad (por ejemplo, la composición del conjunto de especies y sus
interacciones) hasta los aspectos específicos de cada especie (por ejemplo, abundancia,
distribución y dinámica espacial).
Rapa Nui (también conocida como Isla de Pascua) y la Isla Salas y Gómez albergan los arrecifes
de coral más al sureste del Océano Pacífico. Estudios previos dan cuenta de una gran diferencia
en la abundancia de depredadores topes entre ambas islas. Rapa Nui por su parte muestra
signos de una sobrepesca histórica y donde el ensamble de peces de arrecife está dominado por
especies planctívoras. En contraste, el ecosistema de Salas y Gómez está dominado por
especies como el tiburón de Galápagos (Carcharhinus galapagensis) y carángidos (Seriola
lalandi, Caranx lugubris y Pseudocaranx dentex). Sin embargo, y a pesar de su lejanía, la isla
Salas y Gómez también se ha visto afectada con impactos antropogénicos. Los tiburones de la
isla Salas y Gómez son pequeños y cautelosos. Se ha observado a algunos individuos con
anzuelos en la boca, lo que sugiere la ocurrencia de pesca ilegal reciente en el área.
Utilizando múltiples enfoques, esta tesis proporciona la información básica necesaria para
desarrollar estrategias de manejo basadas en conocimiento científico de las principales especies
de depredadores topes dentro de la ecorregión de Isla de Pascua. En el CAPÍTULO 1 se presenta
una introducción general, que incluye antecedentes y objetivos específicos, seguida de cuatro

vi
capítulos que utilizan diferentes enfoques para responder a una variedad de preguntas
ecológicas:
CAPÍTULO 2.- Para caracterizar el ensamblaje de los peces pelágicos de Rapa Nui, se utilizó un
sistema de video submarino remoto con carnada (BRUVS) durante un periodo de un año. Dentro
de los resultados principales se destaca la presencia de diferencias espaciales y estacionales
significativas alrededor de la isla. La costa sur de Rapa Nui fue diferente en la estructura del
ensamble de peces con respecto a los otros sitios y concentró más especies de depredadores
topes. La temporada de invierno también fue estadísticamente diferente a las otras temporadas,
probablemente debido a las fuertes marejadas oceánicas y los vientos provenientes del sur
durante esa época del año. Las condiciones climáticas también limitan la presión de pesca, lo
que podría contribuir a una mayor concentración de estos depredadores en la costa sur. Estos
hallazgos son esenciales para la implementación de estrategias de conservación y manejo, como
el área marina protegida costeras de múltiples usos de Rapa Nui (MUMPA) recientemente
creada.
CAPÍTULO 3.- Para determinar la posición trófica y definir las interacciones tróficas de los
grandes peces que habitan Rapa Nui, se analizaron sus señales isotópicas de δ13C y δ15N. Los
resultados sugieren que no todas las especies muestreadas deben considerarse depredadores
topes. Los resultados también sugieren un alto grado de superposición de nicho isotópico entre
Thunnus albacares y Katsuwonus pelamis, lo que podría significar una competencia
interespecífica. Este capítulo contribuye a identificar correctamente el papel de grandes peces
que habitan en Rapa Nui con el fin de crear una comprensión más amplia de cómo estas especies
interactúan en un ecosistema aislado y pobre en recursos.
CAPÍTULO 4.- En este capítulo busqué investigar los patrones de movimiento del tiburón de
Galápagos, Carcharhinus galapagensis, y la vidriola, Seriola lalandi para evaluar la efectividad
vii
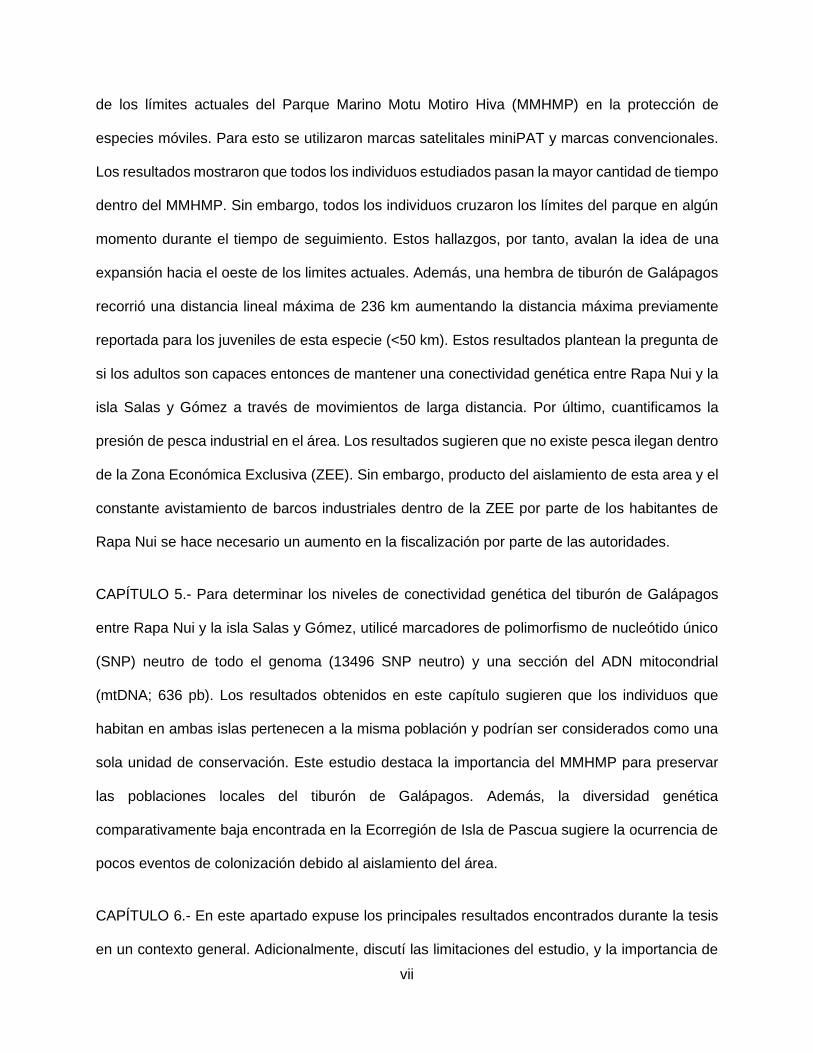
de los límites actuales del Parque Marino Motu Motiro Hiva (MMHMP) en la protección de
especies móviles. Para esto se utilizaron marcas satelitales miniPAT y marcas convencionales.
Los resultados mostraron que todos los individuos estudiados pasan la mayor cantidad de tiempo
dentro del MMHMP. Sin embargo, todos los individuos cruzaron los límites del parque en algún
momento durante el tiempo de seguimiento. Estos hallazgos, por tanto, avalan la idea de una
expansión hacia el oeste de los limites actuales. Además, una hembra de tiburón de Galápagos
recorrió una distancia lineal máxima de 236 km aumentando la distancia máxima previamente
reportada para los juveniles de esta especie (<50 km). Estos resultados plantean la pregunta de
si los adultos son capaces entonces de mantener una conectividad genética entre Rapa Nui y la
isla Salas y Gómez a través de movimientos de larga distancia. Por último, cuantificamos la
presión de pesca industrial en el área. Los resultados sugieren que no existe pesca ilegan dentro
de la Zona Económica Exclusiva (ZEE). Sin embargo, producto del aislamiento de esta area y el
constante avistamiento de barcos industriales dentro de la ZEE por parte de los habitantes de
Rapa Nui se hace necesario un aumento en la fiscalización por parte de las autoridades.
CAPÍTULO 5.- Para determinar los niveles de conectividad genética del tiburón de Galápagos
entre Rapa Nui y la isla Salas y Gómez, utilicé marcadores de polimorfismo de nucleótido único
(SNP) neutro de todo el genoma (13496 SNP neutro) y una sección del ADN mitocondrial
(mtDNA; 636 pb). Los resultados obtenidos en este capítulo sugieren que los individuos que
habitan en ambas islas pertenecen a la misma población y podrían ser considerados como una
sola unidad de conservación. Este estudio destaca la importancia del MMHMP para preservar
las poblaciones locales del tiburón de Galápagos. Además, la diversidad genética
comparativamente baja encontrada en la Ecorregión de Isla de Pascua sugiere la ocurrencia de
pocos eventos de colonización debido al aislamiento del área.
CAPÍTULO 6.- En este apartado expuse los principales resultados encontrados durante la tesis
en un contexto general. Adicionalmente, discutí las limitaciones del estudio, y la importancia de

viii
los estudios comparativos entre Rapa Nui e Isla Salas y Gómez. Finalmente, incluí
recomendaciones para estudios futuros sobre la biodiversidad de las principales especies de
depredadores topes y su protección en la Ecorregión de Isla de Pascua.

ix
PUBLICATIONS FROM THIS THESIS
Published chapters
Chapter 2.- Morales NA, Easton EE, Friedlander AM, Harvey ES, Garcia R, Gaymer CF. 2019.
Spatial and seasonal differences in the top predators of Rapa Nui: Essential data for implementing
the new Rapa Nui multiple‐uses marine protected area. Aquatic Conserv: Mar Freshw Ecosyst.29:
118-129; 1–12. https://doi.org/10.1002/aqc.3068
Chapter 4.- Morales NA, Heidemeyer M, Bauer R, Hernandez S, Acuña E, Friedlander AM,
Gaymer CF. In press. Residential movements of top predators at Chile’s most isolated Marine
Protected Area: implications for the conservation of the Galapagos shark, Carcharhinus
galapagensis, and the yellowtail amberjack, Seriola lalandi. Aquatic Conserv: Mar Freshw
Ecosyst.
Related articles
Morales NA, Coghlan AR, Hayden G, Guajardo P. First sighting of a tropical benthic reef shark
species at Rapa Nui: chance dispersal or a sign of things to come? J Fish Biol. 2019; 95: 642–
646. https://doi.org/10.1111/ jfb.13977.
Thiel Martin, Guillermo Luna-Jorquera, Rocio Álvarez-Vargas, Camila Gallardo, Ivan A Hinojosa,
Nicolás Luna, Diego Miranda-Urbina, Naiti Morales, Nicolas Ory, Aldo Pacheco, Matias Portflitt-
Toro, Carlos Zavalaga. 2018. Impacts of marine plastic pollution from continental coasts to
subtropical gyres – Fish, seabirds and other vertebrates in the SE Pacific. Frontiers in Marine
Science. 5(238).

x
Easton EE, Sellanes J, Gaymer CF, Morales NA, Gorny M & Berkenpas E. 2017. Diversity of
deep-sea fishes of the Easter Island Ecoregion. Deep Sea Research Part II: Topical Studies in
Oceanography, 137, 78-88.

xi
Esta tesis está dedicada a todos los amantes del mar, especialmente
a mi abuelo Raúl y a mis dos amores, Chris y Lukas…

xii
AGRADECIMIENTOS
Esta tesis no podría haberse llevado a cabo sin el constante apoyo de muchas personas e
instituciones. Me gustaría partir agradeciendo a mi familia, especialmente a mis padres quienes
siempre han apoyado mis sueños. Mis amigos de la vida y los nuevos que hice durante estos
años alrededor del mundo quienes han tenido la paciencia para escucharme hablar por horas del
mar. Un agradecimiento especial a Francisco Concha quien desde pequeña me inspiró en el
amor por los tiburones.
Esta tesis de investigación forma parte del Núcleo Milenio de Ecología y Manejo Sustentable de
Islas Oceánicas (ESMOI) y tiene como objetivo contribuir a brindar la información necesaria para
apoyar las estrategias de manejo y conservación marina para la Ecorregión de Isla de Pascua.
Por lo que me gustaría agradecer a todos los integrantes de la casita ESMOI quienes me
ayudaron en la toma de muestras y el planeamiento de los diferentes capítulos de esta tesis.
Además, agradecer el compañerismo y la buena onda que sin duda hicieron de este proceso uno
mucho más fácil y entretenido. Mas que compañeros muchos de ellos se transformaron en
amigos y familia. Agradecer también a todos aquellos que me ayudaron en la Isla: Michel Garcia,
Orca Dive Center, Alex Tuki, entre muchos otros.
Agradecer por supuesto a mis profesores tutores Carlos Gaymer y Alan Friedlander quienes
siempre estuvieron disponibles para cualquier problema o consulta que tuviera y supieron guiar
esta tesis de manera ejemplar. Gracias también a la comisión por las grandes contribuciones que
hicieron en cada uno de los capítulos.
Finalmente me gustaría agradecer al Gobierno de Chile quien mediante las Becas de Doctorado
Nacional financio todos estos años de estudio. A Save Our Seas Foundation e Idea Wild por
creer en mis locuras y financiar el primer capítulo de la tesis que dio origen a todos los demás.

xiii
TABLE OF CONTENTS
DECLARACIÓN DEL AUTOR ..................................................................................................... i
ABSTRACT ................................................................................................................................. ii
RESUMEN .................................................................................................................................. v
PUBLICATIONS FROM THIS THESIS....................................................................................... ix
AGRADECIMIENTOS ............................................................................................................... xii
LIST OF FIGURES .................................................................................................................. xvi
LIST OF TABLES .................................................................................................................... xvii
LIST OF ACRONYMS ............................................................................................................. xviii
CHAPTER 1. Background .......................................................................................................... 1
1.1 Introduction ...................................................................................................................... 1
1.1.1 Research questions ................................................................................................... 2
1.2 Specific Aims ................................................................................................................... 4
1.2.1 Diversity, abundance, and distribution of top predators around Rapa Nui .................. 4
1.2.2 Species trophic position and interaction among sympatric species top predator species
at Rapa Nui ......................................................................................................................... 4
1.2.3 Movement patterns and connectivity of top predators inhabiting the Easter Island
Ecoregion ........................................................................................................................... 5
CHAPTER 2. Spatial and Seasonal Differences in the Top Predators of Rapa Nui: Essential Data
Used as a Key Tool for Implementing the New Rapa Nui Multiple-Uses MPA ............................ 8
2.1 Abstract............................................................................................................................ 8
2.2 Introduction ....................................................................................................................... 9
2.3 Methods ..........................................................................................................................12
2.3.1 Study area .................................................................................................................12
2.3.2 Sample collection ......................................................................................................13
2.3.3 Data analyses ............................................................................................................15
2.3.4 Environmental data collection and analysis ...............................................................16
2.4 Results ............................................................................................................................17
2.4.1 Spatial differences .....................................................................................................19
2.4.2 Seasonal differences .................................................................................................20
2.4.3 Environmental analysis ..............................................................................................21
2.5 Discussion ......................................................................................................................21

xiv
2.5.1 Spatial and temporal patterns ....................................................................................21
2.5.2 Conservation actions .................................................................................................26
CHAPTER 3. The Trophic Role of Large Fishes Inhabiting the Easter Island Ecoregion ...........28
3.1 Abstract...........................................................................................................................28
3.2. Introduction .....................................................................................................................28
3.3 Methods ..........................................................................................................................30
3.3.1 Sample collection ......................................................................................................30
3.3.2 Sample preparation and stable isotopes analysis ......................................................31
3.3.3 Trophic positions estimations.....................................................................................31
3.3.4 Trophic structure and isotopic niche .........................................................................32
3.4 Results ............................................................................................................................33
3.4.1 Trophic position ........................................................................................................35
3.4.2 Isotopic niche............................................................................................................36
3.5. Discussion ..................................................................................................................39
3.5.1 Stable isotope signatures .........................................................................................39
3.5.2 Trophic position ........................................................................................................40
3.5.3 Isotopic niche............................................................................................................42
3.5.4 Conservation aspects ...............................................................................................44
CHAPTER 4. Residential Movements of Top Predators at Chile’s Most Isolated Marine Protected
Area: Implications for the Conservation of the Galapagos Shark, Carcharhinus galapagensis, and
the Yellowtail Amberjack, Seriola lalandi. ..................................................................................46
4.1 Abstract...........................................................................................................................46
2.2 Introduction .....................................................................................................................47
4.3 Methods ..........................................................................................................................51
4.3.1 Study area ................................................................................................................51
4.3.2 Capture and tagging .................................................................................................52
4.3.4 Analysis of vertical behaviour ...................................................................................56
4.4 Results ............................................................................................................................57
4.4.1 Horizontal behaviour .................................................................................................57
4.4.2 Vertical behaviour .....................................................................................................60
4.5 Discussion ......................................................................................................................65
4.5.1 Horizontal and vertical migratory behaviour...............................................................65
4.5.2 Fishing activities around Rapa Nui and Salas y Gómez ............................................66
4.5.3 Future Perspectives of the MMHMP .........................................................................69
CHAPTER 5. Genetic Connectivity of the Galapagos Shark, Carcharhinus galapagensis, in the
Easter Island Ecoregion. ...........................................................................................................73
5.1 Abstract...........................................................................................................................73
5.3 Methods ..........................................................................................................................77
5.3.1 Sample collection .....................................................................................................77
5.3.2 DNA extraction and sequencing for SNP ..................................................................77

xv
5.3.3 SNPs filtering and Outlier detection ..........................................................................78
5.3.4 Genetic structure analysis.........................................................................................78
5.3.5 Mitocondrial (mtDNA) extraction, amplification, sequencing, and alignment ..............79
5.4 Results ............................................................................................................................80
5.4.1 SNPs analysis ..........................................................................................................80
5.4.2 Mitochondrial DNA analysis ......................................................................................80
5.5 Discussion ......................................................................................................................82
5.5.1 Connectivity within the Easter Island Ecoregion ........................................................82
5.5.3 Implication for the conservation of the species ..........................................................86
CHAPTER 6. Conclusions ........................................................................................................88
6.1 Main findings and conservation implications ...................................................................88
6.2 Limitation of the Study and Suggestions for Future Research Directions ........................91
REFERENCES .........................................................................................................................94
APPENDIXES ......................................................................................................................... 117

xvi
LIST OF FIGURES
Figure 1.1: Flow diagram outlining the background and general structure of the thesis. ............ 3
Figure 2.2: Map of Rapa Nui (Easter Island) and Salas y Gómez Island showing sampling locations....................................................................................................................................14
Figure 2.2. Canonical analysis of principal coordinates (CAP) ordination of the variation in fish assemblage ..............................................................................................................................20
Figure 3.1. δ13C and δ15N signatures of large fishes inhabiting Rapa Nui. ..............................34
Figure 3.2. Isotopic niche space of four species sampled during the study and density plots showing the credibility interval of Bayesian standard ellipses areas. .........................................38
Figure 4.1. Bathymetry of the Easter Island Ecoregion. ................ ¡Error! Marcador no definido.
Figure 4.2. Temporal coverage data per deployed tag ..............................................................58
Figure 4.3. Geolocations of each individual combined and kernel densities ..............................59
Figure 4.4. Distance between geolocations and their distance from Salas y Gómez per species .................................................................................................................................................60
Figure 4.5. Diel vertical movement patterns of the five fish tagged. ...........................................61
Figure 4.6. Vertical behaviour patterns for the vertical behaviour clusters and their spatial distribution ................................................................................................................................62
Figure 5.1. Location of Rapa Nui and Salas y Gómez Island .....................................................75
Figure 5.2. Principal Coordinates Analysis ................................... ¡Error! Marcador no definido.
Figure 5.3. Number of cluster (k) suggested by BIC values .......... ¡Error! Marcador no definido.
Figure 5.4. Haplotype network based on the informative mtDNA control region ........................81

xvii
LIST OF TABLES
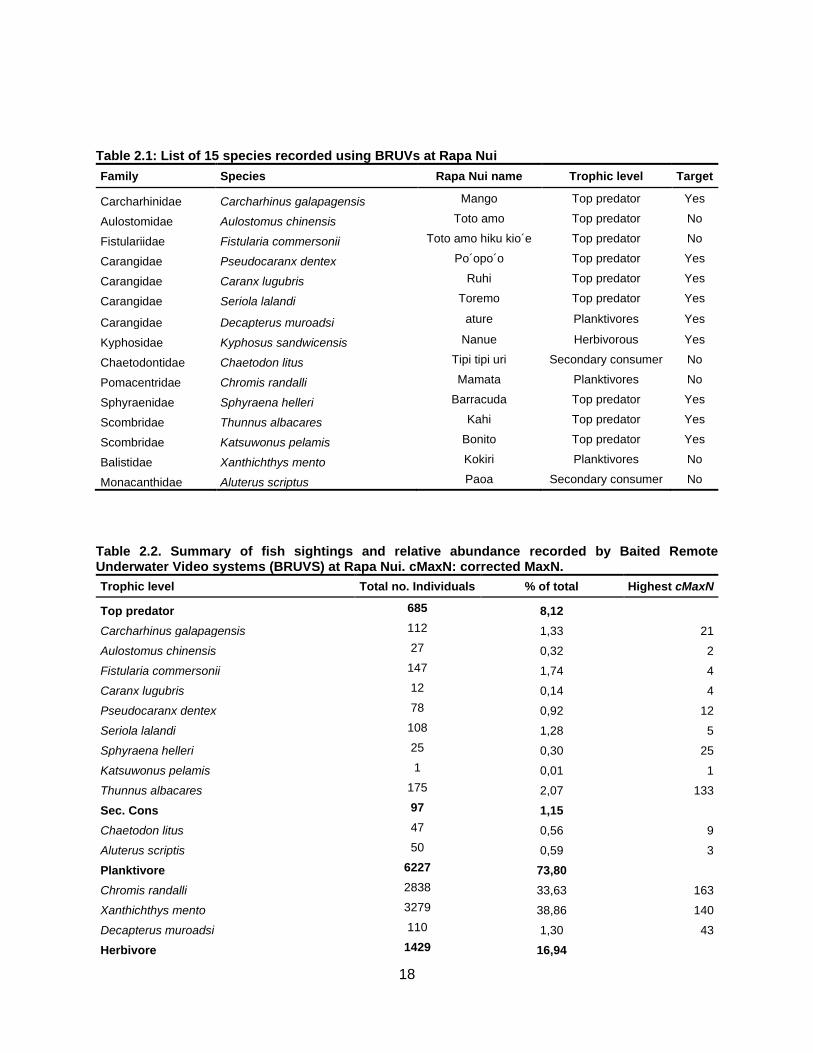
Table 2.1: List of 15 species recorded using BRUVS at Rapa Nui.............................................18
Table 2.2. Summary of fish sightings and relative abundance. ..................................................18
Table 3.1. Summary of mean and standard deviation (SD) of stable isotopes (δ13C and δ15N) composition of large fishes included in this study. .....................................................................35
Table 3.2. Summary of outputs from trophic positions (TP) models (model-1: “oneBaseline” and model-2: “twoBaseline”). ...........................................................................................................36
Table 3.3 Isotopic niche area ....................................................................................................37
Table 4.1. Metadata of the individual tagged during this study. .... ¡Error! Marcador no definido.
Table 5.1. Genetic diversity determinate by mtDNA Control Region ..........................................81

xviii
LIST OF ACRONYMS
CAP: Analysis of Principal Coordinates
BRUVS: Baited Remote Underwater Video Systems
BIC: Bayesian Information Criterion
CR: Control Region
cMax: Corrected Maxn
Seac: Corrected Version of Standard Ellipse Area
DistLM: Distance-Based Linear Modelling
dbRDA: Distance-Based Redundancy Analysis
EEZ: Economic Exclusive Zone
EBM: Ecosystem-Based Management
FDR: False Discovery Rate
HWE: Hardy–Weinberg Equilibrium
IUU: Illegal, Unreported, And Unregulated Fishing
LD: Linkage Disequilibrium
MPAs: Marine Protected Areas
Maxn: Maximum Number of Individuals
CD: Mean Distance to the Centroid
MAF: Minor Allele Frequencies
MtDNA: Mitochondrial DNA
PERMANOVA: Permutational Multivariate Analysis of Variance
PAT: Pop-Up Archiving Tags
PCA: Principal Component Analyses
PDT: Profiles of Depth at Temperature
Rapa Nui MUMPA: Rapa Nui Multiple Uses Coastal Marine Protected Areas
SST: Sea Surface Temperature
SNP: Single Nucleotide Polymorphisms
SIA: Stable Isotope Analysis
SDNND: Standard Deviation of Nearest Neighbour Distance

xix
SEA: Standard Ellipse Area
TAD: Time-At-Depth
TAT: Time-At-Temperature
TA: Total Area
TL: Total Length
TEF: Trophic Enrichment Factor
TP: Trophic Position
UVC: Underwater Visual Census

1
CHAPTER 1. BACKGROUND
1.1 INTRODUCTION
Top predators, species that represent the highest trophic level in a community, are a key
component of marine ecosystems and play an important role in top-down ecosystem regulation
(Stevens et al., 2000; Roff et al. 2016). For example, top predators (e.g., sharks, jacks, groupers,
and tunas) have been found to be efficient in controlling demography, life history, and behaviour
(risk effect) of organisms from lower trophic levels (Steven et al., 2000; Shears et al., 2002;
Daskalov et al., 2007; Heithaus et al., 2008; Ruttenberg et al., 2011). This control can have
profound impacts on the structure of marine communities by increasing ecosystem stability and
preventing phase shifts in fragile ecosystems such as coral reefs (Hughes et al., 2010) or algal
forests (Estes & Duggins, 1995; Shears et al., 2002).
The continuing decline of top-predator populations, principally due to overfishing and habitat
degradation (Myers et al., 2003; Robbins et al., 2006; Daskalov et al., 2007; Ferretti et al., 2010;
Dulvy et al., 2014), has led to concerns about both predator conservation and possible effects on
the ecosystem as a whole (Myers et al., 2003; Daskalov et al., 2007; Myers et al., 2007; Sandin
et al., 2008; 2010; Dulvy et al., 2014). In this context, several authors have suggested that the
effective management and conservation of top predators relies in part on a more thorough
understanding of their ecology from a community level (e.g., species composition and species
interaction) to individual species-specific aspects (e.g., abundance, distribution, and spatial
dynamics) (Garla et al., 2006; Dale et al., 2010; Simpfendorfer et al., 2010; Vaudo et al., 2017).

2
1.1.1 Research questions
Little is known about the marine biodiversity and the marine ecosystem health of the Easter Island
Ecoregion (Friedlander et al., 2013). Only a few recent surveys have examined the fishes from
Rapa Nui and the associated seamounts, with most of these studies focusing on benthic, rather
than pelagic species (Fernandez et al., 2014). Moreover, virtually no information is available on
the ecology of pelagic top predator fishes at the ecosystem scale making it difficult to understand
the dynamic of reef communities and to predict the ecological consequences of common threats,
such as fishing. Nowadays, multispecies studies are needed to implement ecosystem-based
management, because it gives a more comprehensive understanding of the ecosystem, which
can lead to better management (Toonen et al., 2011).
Therefore, the general objective of this thesis was to study some important ecological aspects of
the marine top predator assemblage needed for developing science-based management and
effective conservation strategies across species within the Easter Island Ecoregion. Here, I
present the specific aims that are addressed in subsequent chapters (Fig. 1.1). Each chapter is
written as a stand-alone manuscript to facilitate publication; thus, chapters have their specific
introduction sections and consequently may include some elements of the background
information presented here.

3
Figure 1.1. Flow diagram outlining the background and general structure of the thesis.

4
1.2 SPECIFIC AIMS
1.2.1 Diversity, abundance, and distribution of top predators around Rapa Nui
Precise and accurate information on the diversity and abundance of fish populations is important
for studying most aspects of their ecology, and therefore is widely sought after for management
and conservation purposes (Pita et al., 2014). Moreover, changes in these parameters usually
indicate alteration in the community structure in response to ecological, climatic, or
anthropological changes (Schlosser, 1990; Westera et al., 2003; Jeppesen et al., 2010; Dale et
al., 2011). In Chapter 2, I characterized the top predator assemblage of Rapa Nui throughout a
year around the island of Rapa Nui using a novel and non-lethal technique (Baited Remote
Underwater Video System [BRUVS]). This technique has been widely used in the study of fish
assemblage structure in a variety of environments including both temperate and tropical reefs
(Harvey et al., 2012, Langlois et al., 2010). BRUVS increase the number of sampled species,
(Stobart et al., 2007, Willis & Babcock, 2000), since the bait attracts the fishes into the field of
view of a camera so they can be identified and counted (Dorman et al. 2012; Hardinge et al.
2013), and therefore, are especially effective in the study of cryptic and rare predators, such as
sharks and fishery-target species (Harvey et al., 2012). Determining which species inhabit Rapa
Nui and how they are distributed will contribute to the identification of priority conservation areas
within the recently created Rapa Nui multiple use marine protect area (Rapa Nui MUMPA).
1.2.2 Species trophic position and interaction among sympatric species top predator
species at Rapa Nui
The estimation of trophic levels has become increasingly useful in the analysis of marine food
webs (Stergiou & Karpouzi, 2002, Young et al., 2010) because it facilitates the understanding of
ecosystem function and the relation among sympatric species (Frisch et al., 2016). For instance,

5
trophic interactions are known to influence the larger patterns of community dynamics, such as
species composition, abundance, biomass, distribution, and others (Polovina et al., 2001;
DeMartini & Friedlander 2006; Dale et al., 2011, Speed et al., 2012). Large fishes are usually
considered as top predators because their size and behaviour; however, it is well known that is
not always the case (Frisch et al., 2016), and that the trophic role of species can change (e.g.,
among habitats; Ferreira et al., 2017). The misclassification of the trophic level and their relation
within other sympatric species can lead to erroneous conclusions about ecosystem dynamics,
and therefore, ineffective management strategies may be implemented (Heithaus et al., 2008;
Frisch et al., 2016). In Chapter 3, I used stable isotope analysis to determine the trophic position
and the isotopic niche of large fishes inhabiting Rapa Nui. The study of trophic relationships will
clarify the ecological role of large predatory fishes previously classified as top predators, while
the isotopic niche will provide insights of how resources are being partitioned among sympatric
species.
1.2.3 Movement patterns and connectivity of top predators inhabiting the Easter Island
Ecoregion
Oceanic islands and seamounts often aggregate highly mobile species (Holland et al., 1999;
Worm et al., 2003; Morato et al., 2010; Garrigue et al., 2015). They facilitate the dispersion of
organisms between distant areas (Wilson & Kaufman, 1987; Friedlander et al., 2013) by serving
as navigational marks for resting and/or feeding areas (Rogers, 1994; Garrigue et al., 2015). Rapa
Nui and Salas y Gómez Island are connected, by several dozen seamounts that could play the
role of stepping-stones (Newman & Foster 1983; Friedlander et al., 2013), and thus creating a
biological corridor. Despite their potential, little is known about the connectivity between these two
neighbouring islands.

6
Marine protected areas (MPAs) have become an effective tool for the protection of biodiversity
(Botsford et al., 2003; Lubchenco & Grorud-Colvert, 2015; Sala et al., 2018); however, many of
these MPAs were implemented without sufficient empirical knowledge of the species inhabiting
the area (Botsford et al., 2003; Pasmiño et al. 2017). Therefore, understanding the association
between species and their habitat requirements is crucial to create MPAs that include appropriate
habitat types, and are large enough to provide effective, long-term protection for the species of
concern (Botsford et al., 2003; Friedlander et al., 2007; Meyer et al., 2007). Additionally, the
clarification of complex processes, such as ecosystem connectivity (e.g., source-sink dynamics),
are becoming increasingly recognized in the protection of key species and in the implementation
of effective MPAs (Wilson et al., 2006; Simpfendorfer et al., 2010; Papastamatiou et al., 2010;
Espinoza et al., 2014; Vaudo et al., 2017).
To study the connectivity of large predators between both islands, I used two different
approaches, each one corresponding to a different chapter. In Chapter 4, I studied the horizontal
and vertical movement patterns of two abundant top predator species in the Easter Island
Ecoregion, the Galapagos shark (Carcharhinus galapagensis) and the yellowtail amberjack
(Seriola lalandi) using satellite tags. Pop-up archiving tags (PAT) record horizontal and vertical
movements, through depth and time, plus positional water temperature (Brill et al., 2002; Luo et
al., 2006). PAT pop-up tags have been widely used to address questions of large-scale
movements and behaviour of species that do not spend enough time at the surface (e.g., Wilson
et al., 2006; Holmes et al., 2014). Moreover, I examined if the MMHMP´s borders were appropriate
for protecting these species from fishing pressure outside of the MPA.
Finally, in Chapter 5, I studied the population genetic of the Galapagos shark using single
nucleotide polymorphisms (SNP) and mitochondrial DNA (mtDNA). SNPs have proven to be
informative markers for Galapagos shark population structure (Pazmiño et al., 2017; 2018).
Determining the degree of population connectivity among geographic areas, with the estimated

7
location of genetic breaks, enables assessing the appropriate scale at which management
strategies for marine species should be applied to continue demographic exchange and prevent
local extinctions (Crowder & Norse, 2008; Toonen et al., 2011). In this context, the establishment
of a synergistic source-sink relationship between the marine ecosystems of Rapa Nui and Salas
y Gómez Island would increase the value of the existing MMHMP for the health and sustainability
of the entire ecosystem.

8
CHAPTER 2. SPATIAL AND SEASONAL DIFFERENCES IN THE TOP PREDATORS
OF RAPA NUI: ESSENTIAL DATA USED AS A KEY TOOL FOR IMPLEMENTING
THE NEW RAPA NUI MULTIPLE-USES MPA
2.1 ABSTRACT
Reef fishes are an important component of marine biodiversity and changes in the composition
of the assemblage structure may indicate ecological, climatic, or anthropogenic disturbances. To
examine spatial differences in the reef fish assemblage structure around Rapa Nui, we sampled
eight sites during autumn and summer 2016-2017 with Baited Remote Underwater Video systems
(BRUVs). To determine seasonal changes, we conducted quarterly seasonal sampling at five of
those eight sites. A total of 15 pelagic species of fishes were recorded during this study, some of
which have not previously been recorded in SCUBA surveys, including the Galapagos shark
(Carcharhinus galapagensis) and tunas (Scombridae). Significant spatial and seasonal
differences were found in the fish assemblage. Fish assemblages from the south coast differed
significantly from those along the west and the east coasts, mainly due the occurrence of top
predators. Winter differed from other seasons, especially along the south coast were the island is
more exposed to large oceanic swells and winds from Antarctica. Due to the variety and high
relative abundance of species recorded during this survey, BRUVs seemed to be an effective
method for studying top predators at Rapa Nui. Future studies should examine deeper zones
around the island and the surrounded seamounts. The identification of priority zones for the
protection of top predator species represent an important contribution of this study, in order to
develop management and conservation strategies to be implemented in the newly created Rapa
Nui multiple uses coastal marine protected areas (Rapa Nui MUMPA).

9
2.2 INTRODUCTION
Reef fishes play an important role in ecosystem function (Stevens et al., 2000), and are the target
of recreational, commercial, and subsistence fisheries in many coastal locations (Henry & Lyle,
2003; Kingsford et al., 1991). Precise and accurate information on the diversity and abundance
of fish populations is important for understanding their ecology and is critical for developing
effective management and conservation strategies (Pita et al., 2014). Changes in the fish
assemblage composition usually indicate alteration in the community structure in response to
ecological, climatic, or anthropogenic drivers (Jeppesen et al., 2010; Schlosser, 1990; Westera
et al., 2003).
Reef fish assemblages vary spatially and temporally in response to biotic variables, such as food
availability (Tickler et al., 2017), predation or competition (Almany, 2004), and abiotic variables,
such as habitat complexity and environmental characteristics like wave exposure and temperature
(Anderson & Millar, 2004; Coles & Tarr, 1990; Curley et al., 2003; Friedlander & Parrish, 1998).
For example, spatial variation in reef fish assemblages can occur on scales of meters to
kilometers (Connell & Jones, 1991; Curley et al., 2003; Malcolm et al., 2007), and are usually
associated with habitat complexity and the environmental conditions that structure that habitat
(Asher et al., 2017; Coles & Tarr, 1990; Friedlander & Parrish, 1998). Seasonal changes are more
evident in reef ecosystems from sub-tropical latitudes because of greater environmental variability
(Coles & Tarr, 1990; Friedlander & Parrish, 1998). However, these influences differ by location.
For example, Coles & Tarr (1990) found that the large variation in temperature between winter
and summer (about 20ºC) in the Western Arabian Gulf determines the richness and abundance
of inshore species. In Hawaii, Friedlander & Parrish (1998) observed that fish assemblages
responded to high wind and wave energy during winter by taking refuge at deeper depths and in
more complex habitats. Understanding the natural variations in the fish assemblage provides
essential baseline information for designing and evaluating the effectiveness of marine protected

10
areas (MPA) (Charton et al., 2000). Having accurate information of where to protect is especially
valuable in highly urbanized areas, where area protection is constrained owing to conflicts among
multiple users (Curley et al., 2003).
Marine Protected Areas (MPAs) have been shown to be a highly effective means of conserving
biodiversity and managing fisheries, while also restoring and preserving overall ecosystem
functions (Gaines et al., 2010; Lubchenco & Grorud-Colvert, 2015). Through the establishment of
fishing regulations such as minimum size, effort control and/or regulation of total catches (Botsford
et al., 2003; Hilborn et al., 2006), MPAs are usually associated with the increase of abundance,
biomass and size of focal species (Micheli et al., 2004) as well as catch-per-unit-effort (CPUE) in
adjacent areas (Roberts et al., 2000). In Chile, 23 MPAs have been created in the last decade,
protecting over 41% of its economic exclusive zone (EEZ) (Petit et al., 2017). The most recent
three MPAs were announced during the 2017 International Marine Protected Areas Congress
(IMPAC4 2017): Islas Diego Ramirez-Paso Drake, Juan Fernandez archipelago and Rapa Nui.
The Rapa Nui Multiple Uses Coastal Marine Protected Area (MUMPA) covers the entire Easter
Island Ecoregion and extends from the Rapa Nui coastline to the limit of the EEZ, embracing
~579,000 km2.
Easter Island, also known by its Polynesian name Rapa Nui, is the most south-eastern coral reef
ecosystem in the Pacific Ocean and harbours a unique fish assemblage with a high level of
endemism (Randall & Cea, 2011). Rapa Nui is one of the most isolated inhabited islands in the
Pacific Ocean; yet, long-term overfishing has dramatically reduced the abundance of targeted
species (Aburto et al., 2015; Friedlander et al., 2013; Randall & Cea, 2011; Zylich et al., 2014).
Modern fishing equipment and the demand for local fish from increasing tourism has compounded
the effects of overfishing (Randall & Cea, 2011; Zylich et al., 2014). There have been a limited
number of surveys of fishes around Rapa Nui (e.g., Easton et al., 2018; Fernández et al., 2014;
Friedlander et al., 2013), with most of these studies focusing on reef fishes, rather than pelagic

11
species. Using underwater visual census (UVC), Friedlander et al. (2013) found contrasting reef
fish assemblages between Rapa Nui and its nearest neighbour, Salas y Gómez, a small island
located ~390 km to the northeast. Salas y Gómez is one of the most isolated islands in the Pacific
Ocean and is fully protected from fishing as part of the Motu Motiro Hiva Marine Park. Sharks,
primarily the Galapagos shark (Carcharhinus galapagensis), and jacks account for more than
40% of the fish biomass around Salas y Gómez, whereas Rapa Nui is dominated by smaller
planktivorous species, with top predators virtually absent (Friedlander et al., 2013).
In the past, ecological studies of fishes at Rapa Nui have relied on fishery-dependent data from
commercial fisheries and UVC, performed by scuba divers (Acuña et al., 2018). The use of
fishery-dependent sampling is destructive (Skomal, 2007) and inefficient due to sampling biases
from gear selectivity and different fishing effort between species, habitats, seasons, and vessels
(Bishop, 2006; Murphy & Jenkins, 2010; Thorson & Simpfendorfer; 2009). Additionally, this
technique is less effective in locations with insufficient and inaccurate landing information, like
Rapa Nui (Aburto & Gaymer, 2018). UVC is the most-used observational technique for reef
ecosystems (Medley et al., 1993; Samoilys & Carlos, 2000). However, it also has several well-
documented limitations and problems, including intra- and inter-observer variability (Thompson &
Mapstone, 1997) and the effect of divers on the species behaviour (Chapman et al., 1974; Cole,
1994; Emslie et al., 2018; Gray et al., 2016; Kulbicki, 1998; Lindfield et al., 2014). In contrast,
remote underwater video systems, such as Baited Remote Underwater Video Systems (BRUVs),
are effective, non-destructive fishery-independent techniques used to sample fish assemblages
without these diver-associated problems.
BRUVs attract a wide range of marine species from different trophic groups into the field of view
of a camera so that they can be identified and counted (Dorman et al., 2012; Hardinge et al.,
2013). BRUVs increase the number of sampled species (Stobart et al., 2007; Willis & Babcock,
2000), and are especially effective in the detection of cryptic and rare predators, such as sharks

12
and fishery-targeted species, that are not well sampled using UVC (Brooks et al., 2011a; Harvey
et al., 2012; Malcolm et al., 2007; Watson et al., 2005). Pelagic BRUVs are even more novel than
traditional BRUVs, allowing the study of species that inhabit the water column, including highly
mobile species (Santana-Garcon et al., 2014; Santana‐Garcon et al., 2014a). Pelagic species are
ecologically important to marine ecosystems (Freon et al., 2005) and highly valuable for the
fishing industry (Pauly, 2002; Worm et al., 2006). Despite their importance and that they are
constantly threatened by multiple factors, such as pollution, climate change, and overfishing (see
Game et al., 2009), the pelagic ecosystems, at a community scale, are still data poor worldwide.
Given the lack of quantitative data on the pelagic fish assemblages of Rapa Nui, the fragility of
the marine ecosystem, and the importance of baseline information for the implementation of
conservation strategies, the general objective of this study was to characterize the assemblage
of marine top predator inhabiting Rapa Nui. The specific objectives were: (1) to assess spatial
and seasonal variability in the pelagic fishes around Rapa Nui using BRUVs; (2) to determine
which environmental factors best explain the observed differences; and (3) to provide key data
for advising management and conservation of the coastal areas, with particular emphasis on
zoning the recently created MUMPA.
2.3 METHODS
2.3.1 Study area
Rapa Nui (27°13´S and 109°37´W) has a land area of 166 km2 and ~5600 inhabitants. Located
2250 km east from Pitcairn Island and 3760 km south-west from mainland Chile, it is one of the
most isolated places on earth. The nearest island is Salas y Gomez Island (26º28`S and
105º21`W), which is an uninhabited volcanic island with a total area of 0.15 km2. Both islands
and more than several dozen seamounts are part of the Salas y Gómez Ridge, which extends

13
2232 km before reaching the Nazca Ridge in the south-eastern Pacific Ocean (Randall & Cea,
2011; Friedlander et al., 2013).
2.3.2 Sample collection
Mid-water BRUVs were constructed according to Santana-Garcon et al. (2014b). Each BRUVs
was constructed using a single GoPro Hero 4 camera (mono-camera) held in their own
underwater housing. GoPros were set to record a wide-angle of view and 1080p. A mix of fresh
local fishes (~300 gr) and one can of Chilean jack mackerel (Trachurus murphyi) were used as
bait. Deployments were carried out during daylight hours, avoiding dusk and dawn. Four
simultaneous 1-h deployments (replicates), having a minimum separation of 500 m to avoid plume
dispersion overlap (Santana-Garcon et al., 2014b), were conducted at a depth of ~25 m at each
site; a minimum of six deployments were conducted per site. Local knowledge, previous studies
and limitations related to weather conditions were used to guide the spatial coverage of sites.
Date, hour and location (latitude and longitude) were recorded during every deployment. To study
spatial differences around Rapa Nui, eight sites were sampled during autumn and summer 2017
(Fig. 2.1). To determine seasonal changes in the fish assemblage, quarterly seasonal sampling
was undertaken at five of those sites during 2016-2017.

14
Figure 2.1: Map of Rapa Nui (Easter Island) and Salas y Gómez Island showing sampling locations (a) Map of Rapa Nui (Easter Island) and Salas y Gómez Island in relation to South America. Dark lines
represent the exclusive economic zone. (b) Sampling locations around Rapa Nui for seasonal variability
(yellow dots). Purple dots represent the 3 extra sites used for assessing spatial variability during summer
and autumn.
Every BRUVs was deployed for a minimum of 70 minutes. Following the recommendations of
Acuña -Marrero et al. (2018), we discarded the first and the last 5 minutes from every video to
avoid any potential influence caused by the presence of the boat. Species assignments were
made following Randall & Cea, (2011), FishBase (ver. 02/2018, R. Froese & D. Pauly, see
www.fishbase.org, accessed 2018), and consultations with world fish specialists. Each species

15
was assigned to a functional group (herbivores, planktivores, secondary consumers, and top
predators) following Friedlander et al. (2013) and FishBase (ver. 02/2018, R. Froese & D. Pauly,
see www.fishbase.org, accessed 2018). Additionally, all the species were classified as “Target
Species” or “Not Target Species” according to Zylich et al. (2014) and discussions by the first
author with local fishermen. The maximum number of individuals of the same species appearing
in a video frame at the same time (MaxN), plus any other individual that was uniquely and clearly
distinguishable from the other individuals, was used as an estimate of relative abundance or a
corrected MaxN (cMaxN; see Acuña-Marrero et al., 2018). MaxN is a conservative measurement
of relative abundance that avoids any error associated with recounting the same fish (Cappo et
al., 2003; Priede et al., 1994; Willis et al., 2003); however, it usually underestimates the real
abundance in a single deployment (Kilfoil et al., 2017). By including any other individual that was
undoubtedly distinguishable within the deployment and that was not already included in the MaxN
calculation, cMaxN tends to solve, in part, the underestimation problem of sampled species.
cMaxN per hour was used to standardize effort across deployments of different soak times, as
suggested by Santana-Garcon et al. (2004a). Measurement of length was not considered during
this study; therefore, a biomass calculation could not be included in the analysis.
2.3.3 Data analyses
All statistical analyses were conducted in PRIMER v. 7.0.13 software package (Clarke & Gorley,
2006) with the PERMANOVA+ add-on (Anderson et al., 2008), unless otherwise specified. A
Bray–Curtis similarity matrix was created on the 4th-root transformed cMaxN data. All
permutational multivariate analysis of variance (PERMANOVA) tests were run with default
settings and 9999 permutations to obtain p-values (Anderson et al., 2008). Statistically significant
(p < 0.05) interactions were further explored with appropriate post hoc pairwise tests. To test
spatial variance around Rapa Nui, cMaxN data of each site were analyzed using “Sites” as a fixed
factor in a PERMANOVA. To test seasonal difference on fish assemblage, data were analyzed

16
using seasons (winter, spring, summer and autumn) and five sites as fixed factors. A canonical
analysis of principal coordinates (CAP) was used as a general test to evaluate structural
differences in overall fish assemblage. CAP maximizes group differences finding the axis that
best separates each group (Anderson et al., 2008). CAP analyses were run on the resemble
matrix of average values between sites and seasons.
2.3.4 Environmental data collection and analysis
To determine the role of seasonal and spatial environmental variation on the fish assemblage
structure, sea surface temperature (SST), long-term and recent wave energy, distance of each
deployment site from the shore, and shelf width were considered. For each site, SST MUR (Multi-
scale Sea Surface Temperature) satellite data at a 1 km spatial resolution
(https://mur.jpl.nasa.gov) were used after we verified the accuracy of these satellite data with in
situ SST data collected at Omohi, Motu Tautara, Ovahe and Kari Kari sites by Dr. Evie Wieters
(unpublished data) from deployed temperature sensors (Onset, tidbit) set to record SST every ten
minutes at 12-15 m depth. Long-term and recent wave energy were computed from NOAA’s Wave
Watch III (WWIII; http://polar.ncep.noaa.gov/waves), were binned into 16 discrete sectors each
spanning 22.5 degrees. The long-term wave energy ranged from Jan 2010 to Jul 2015, meanwhile
recent wave energy was calculated using mean values corresponding to the month each
deployment was made. Distance from shore and shelf width were calculated for each site using
Google Earth Pro (http://earth.google.com) (Table S2.1). For seasonal analysis, only wave
energy, long-term wave energy, and SST were considered. Environmental and biological data
were analysed using distance-based linear modelling (DistLM) and a distance-based redundancy
analysis (dbRDA). DistLM is a routine for analysing and modelling the relationship between a
multivariate data cloud, as described by a resemblance matrix, and one or more predictor
variables. The dbRDA analysis was used to visualize the given model in a multi-dimensional

17
space (Anderson et al., 2008). Environmental values used in the DistLM-dbRDA are shown in
Table S2.2.
2.4 RESULTS
Fifteen species were recorded during the study (Table 2.1). Planktivores and herbivores were the
largest components of the pelagic fish assemblage at Rapa Nui, accounting for 73.8% and 16.9%,
respectively (Table 2.2). The most abundant species around Rapa Nui were Xanthichthys mento
and Chromis randalli. Both occurred at every site-season combination, except at Vaihu during
spring. Top predators, while having the highest species richness (9 species), were not well
represented in abundance except at Vaihu. Fistularia commersonii was the most abundant
species among top predators, followed by Seriola lalandi (Table 2.2). Some species such as
Aulostomus chinensis and Caranx lugubris showed seasonal occurrence and other species such
as Carcharhinus galapagensis and Pseudocaranx dentex displayed more site-specific
occurrences. Nine target species were recorded, seven of which were top predators. The most
abundant and well distributed was Kyphosus sandwicensis, which was abundant along the east
and west coasts of Rapa Nui year-round; however, low abundances were reported at Vinapu, and
it was absent at Vaihu. The black trevally C. lugubris was rare during the entire study.
18
Table 2.1: List of 15 species recorded using BRUVs at Rapa Nui
Family Species Rapa Nui name Trophic level Target
Carcharhinidae Carcharhinus galapagensis Mango Top predator Yes
Aulostomidae Aulostomus chinensis Toto amo Top predator No
Fistulariidae Fistularia commersonii Toto amo hiku kio´e Top predator No
Carangidae Pseudocaranx dentex Po´opo´o Top predator Yes
Carangidae Caranx lugubris Ruhi Top predator Yes
Carangidae Seriola lalandi Toremo Top predator Yes
Carangidae Decapterus muroadsi ature Planktivores Yes
Kyphosidae Kyphosus sandwicensis Nanue Herbivorous Yes
Chaetodontidae Chaetodon litus Tipi tipi uri Secondary consumer No
Pomacentridae Chromis randalli Mamata Planktivores No
Sphyraenidae Sphyraena helleri Barracuda Top predator Yes
Scombridae Thunnus albacares Kahi Top predator Yes
Scombridae Katsuwonus pelamis Bonito Top predator Yes
Balistidae Xanthichthys mento Kokiri Planktivores No
Monacanthidae Aluterus scriptus Paoa Secondary consumer No
Table 2.2. Summary of fish sightings and relative abundance recorded by Baited Remote Underwater Video systems (BRUVS) at Rapa Nui. cMaxN: corrected MaxN.
Trophic level Total no. Individuals % of total Highest cMaxN
Top predator 685 8,12
Carcharhinus galapagensis 112 1,33 21
Aulostomus chinensis 27 0,32 2
Fistularia commersonii 147 1,74 4
Caranx lugubris 12 0,14 4
Pseudocaranx dentex 78 0,92 12
Seriola lalandi 108 1,28 5
Sphyraena helleri 25 0,30 25
Katsuwonus pelamis 1 0,01 1
Thunnus albacares 175 2,07 133
Sec. Cons 97 1,15
Chaetodon litus 47 0,56 9
Aluterus scriptis 50 0,59 3
Planktivore 6227 73,80
Chromis randalli 2838 33,63 163
Xanthichthys mento 3279 38,86 140
Decapterus muroadsi 110 1,30 43
Herbivore 1429 16,94

19
Kyphosus sandwicensis 1429 16,94 241
Total 8438 100
2.4.1 Spatial differences
PERMANOVA revealed that the fish assemblages differed significantly among sites (Pseudo-F =
4.795, p < 0.001). Sites along the south-east side of Rapa Nui, Ana hukahu, Vaihu and Vinapu,
were significantly different from all the other sites around the island (Table S3). CAP illustrates
the difference in the fish assemblage found using PERMANOVA (Fig. 2.2a). The size of the first
two axes were δ1 = 0.9823 and δ2 = 0.9339, respectively, over 5 (m) principal coordinate axes.
The estimation of misclassification error indicates low allocation success (31%); however, most
of the misclassifications occurred within two groups (Fig. 2.2a): (1) Vinapu-Vaihu-Ana hukahu,
and (2) Ovahe-Omohi-Poike-Kari Kari-Motu Tautara (Table S2.2). Vaihu was the only site with
100% allocation success. Vector length and direction from CAP revealed that the abundance of
a few species such as C. galapagensis, F. commersonii and P. dentex drove the differences
between Vaihu-Vinapu-Ana hukahu, and all the other sites (Fig. 2.2a). The occurrence of Thunnus
albacares and Decapterus muroadsi distinguished Poike from other sites (Fig. 2.2a), meanwhile
the occurrence of Katsuwonus pelamis was a consequence of the differences at Omohi.

20
Figure 2.2. Canonical analysis of principal coordinates (CAP) ordination of the variation in fish assemblage among (a) sites and (c) seasons. (b) and (d) CAP loadings shown graphically.
2.4.2 Seasonal differences
Highest richness and abundances were found in autumn and summer. Fish assemblages during
winter significantly differed from the other seasons (Pseudo-F = 3.366, p < 0.001, Table S2.3).
Principal axes values from CAP were δ1 = 0.909 and δ2 = 0.546, over m = 3 principal coordinate
axes (Fig. 2.2b). The overall estimation of misclassification error showed an allocation success of
only 60%. Winter had the highest allocation success with 80%, while success for autumn (60%),

21
summer (60%), and spring (40%) were lower. In general, the occurrence and abundance of
species such as X. mento, A. chinensis and S. lalandi, were associated with winter, while Aluterus
scriptus and C. lugubris were associated with the summer season.
2.4.3 Environmental analysis
DistLM-dbRDA ordination showed that shelf width explained 26.6% of the spatial variation in the
fish assemblage around Rapa Nui (p = 0.002). Recent wave energy and distance from the coast,
when considered alone, explained 15.4 %, (p=0.028) and 14.5% (p= 0.039) of the variation,
respectively. Long-term wave energy was the only variable explaining significant seasonal
variability (~ 17.2% of the variation, p = 0.031) (Table S2.4).
2.5 DISCUSSION
2.5.1 Spatial and temporal patterns
This study is the first on spatial and temporal patterns of the pelagic fish assemblage at Rapa Nui,
highlighting the importance of specific areas of occurrence and abundance. We found the pelagic
fish assemblage at Rapa Nui to be dominated numerically by two small planktivore species, C.
randalli and X. mento, followed by the herbivorous K. sandwicensis. The numerical dominance of
planktivorous and herbivorous species observed in our study is consistent with Friedlander et al.
(2013) findings that these two trophic groups accounted for 40% and 31% of the total reef fish
biomass, respectively. Top predator species, although less abundant, constituted the richest
trophic group in our study (nine species). In contrast, Friedlander et al. (2013) only observed six
species of this trophic group, and with lower abundances. These differences in richness and
abundance of top predator species might be explained by differences in sampling methods. UVCs
is a reliable observational technique (Medley et al., 1993; Samoilys & Carlos, 2000), and it is
widely used for sampling reef-associated species at shallow, nearshore habitats. However, the
effect of divers on animal behaviour has led to the underestimation of some species abundance,

22
such is the case of cryptic and fishery-target species within fishing areas (Chapman et al., 1974;
Cole, 1994; Gray et al., 2016; Kulbicki, 1998; Lindfield et al., 2014), especially pelagic species
(De Girolamo & Mazzoldi, 2001; Stanley & Wilson, 1995). The higher occurrence of rare species
and species undersampled by UVCs, such as C. galapagensis, K. pelamis, T. albacare and C.
lugubris, during our study proved the effectiveness of BRUVs in studying the pelagic fish
assemblages at Rapa Nui, especially top predators.
Top predators play an important role in the top-down ecosystem regulation (Stevens et al., 2000),
yet these species are the most vulnerable to overfishing and their removal could lead to
environmental changes affecting ecosystem function in fragile ecosystems (Hughes et al., 2010;
Shears & Babcock, 2002). The continued decline of top-predator populations at Rapa Nui has
likely caused a phase shift from a healthy community dominated by large top predators, such as
at Salas y Gómez, to a disturbed community dominated by smaller planktivorous species
(Friedlander et al., 2013). Seven of the nine species of top predators recorded in this study are
targeted by fisheremen at Rapa Nui. Together with the herbivorous Pacific rudderfish, K.
sandwicensis, top predators like S. lalandi, S. helleri and T. albacares are the most targeted
pelagic fishes at Rapa Nui (Zylich et al., 2014). Subsistence catches are also dominated by K.
sandwicensis and other jacks such as C. lugubris and P. dentex (Zylich et al., 2014). According
to local residents, C. lugubris was abundant in the past, but now is uncommon. Similarly, the
Galapagos shark, which is currently classified as Near Threatened on the IUCN Red List, has
been reported by local residents to have declined considerably around Rapa Nui, possibly as a
result of direct and indirect fishing impacts (Zylich et al., 2014; N. Morales, pers. obs), although
the overfishing of prey may also be contributing to this decline (DiSalvo et al., 1988). Even though
fishermen on Rapa Nui do not directly target C. galapagensis, they seem to be susceptible to
bycatch in coastal and offshore fisheries. Likewise, their population has declined considerably in

23
Central America (Bennett et al., 2003), where the major threat comes from bait-fishing activities
around islands and seamounts (Bennett et al., 2003; Zylich et al., 2014).
Carcharhinus galapagensis is the most common coastal shark around Rapa Nui (Randall & Cea,
2011; Zylich et al., 2014), and it was the only species of shark observed during the current study.
A similar BRUVs study in the Galapagos Archipelago found that the C. galapagensis was also
the most abundant among 12 species of sharks in the area (Acuña-Marrero et al., 2018). In that
study, C. galapagensis showed a similar mean cMaxN (0.52) per deployment to our observations
(0.58), despite the fact that the highest cMaxN found in the Galapagos (8) was almost three times
lower than in the current study (21). Total number of individuals observed was 334 in the
Galapagos Archipelago, and 112 in the current study. These contrasting numbers could be a
result of a higher local (i.e., site) concentration of this species but a lower regional (i.e., island)
abundance at Rapa Nui than at the Galapagos Archipelago.
Spatial and seasonal differences in the composition of pelagic fish species were found during this
study. Species composition along the south coast (Ana hukahu, Vaihu and Vinapu) was
significantly different from the east and west coasts of the island. Spatial differences in
assemblage structure were driven by the occurrence and abundance of the top predators such
as C. galapagensis, F. commersonii, and P. dentex, which showed more site specificity,
suggesting the presence of specific habitat characteristics unique to certain areas. Habitat
structure and complexity have been indicated as important characteristics in the composition of
fish assemblages, e.g., more complex habitats provide greater food availability and refuge
(Anderson & Millar, 2004; Asher et al., 2017; Coles & Tarr, 1990; Curley et al., 2003; Heupel &
Hueter, 2002). Shelf width was the most influential pelagic fish assemblage driver. Along the
southern coast of the island, the shelf break (30 m) occurs further from the coastline creating an
extended shallow platform (Table S2.2). The sharks observed during this study were likely
juveniles (less than 200 cm TL; Wetherbee et al., 1996), based on size estimates of those sharks

24
that closely approached bait canisters (used for scale), suggesting juveniles have an apparent
strong association with that shallow shelf habitat. Our observations suggests that the south-east
coast of Rapa Nui could be serving as a nursery area for juvenile Galapagos sharks, which is
consistent with nursery areas for Carcharhinus species often occurring in shallow waters
(Springer, 1967) with a low-predation environment and ample prey availability (Branstetter, 1990;
Heupel & Hueter, 2002; Simpfendorfer & Milward, 1993).
Abiotic (environmental) variables also influence the abundance of fish species within an area,
leading to spatial variability within the ecosystem (Felley & Felley, 1986). Wave energy has been
noted as an important driver of reef habitats and benthic communities at Rapa Nui where the
dominance of different coral species depends on the degree of exposure (Easton, et al., 2018;
Friedlander et al., 2013). Wave energy came mainly from the south-west (202°) (Table S2.1);
however, it only explained a small amount of the spatial variability in the pelagic fish assemblage.
These results may be explained by the low resolution of the satellite data for each site, which
probably did not reflect the real effect of wave energy in the total area. Furthermore, in situ
measurement of this environmental variable may provide finer resolution and explanatory power.
Although, top predator species are often associated with high-energy environments, the
occurrence of top predators and target species at the south-easternmost part of the island (From
Vinapu to Poike) could be also explained by the effect of adverse weather conditions (e.g., wind,
currents, and wave energy) on the local fishing effort, forcing fishing into more sheltered areas.
Conversely, the most abundant target species K. sandwicensis was rare on the south coast and
virtually absent between Vaihu and Ana hukahu. The nanue (Rapanui name for the K.
sandwicensis) is an herbivore species that feeds primarily on red algae. At Rapa Nui, the
occurrence of algae is concentrated at the most protected sites (north-east) of the island (see
Easton et al., 2018). On the other hand, this species is one of the most prized species on Rapa
Nui and is considered over-exploited by local people (Gaymer et al., 2013). According to Acuña

25
et al. (2018), nanue are usually caught by traditional shoreline fishing and spearfishing, especially
from Vinapu to Hanga Nui, where shoreline access is easier and fishing pressure is higher. The
heavy fishing pressure together with the species habitat preference could explain the localized
depletion in these areas.
Seasonal variability in pelagic fish assemblage structure was evident during this study, with winter
been significantly different from the other seasons. Autumn and spring are transition seasons, as
has been described from other subtropical areas (Friedlander & Parrish, 1998). Sites located
along the coasts most exposed to winter swells and winds (Ana hukahu, Vaihu and Vinapu)
showed higher variability among seasons in comparison with more protected sites. Similar results
were found by Coles & Tarr (1990) in the western Arabian Gulf, and by Friedlander & Parrish
(1998) in the Hawaiian Archipelago. In both cases, the authors noticed that some mobile fishes
seem to migrate from exposed to more protected and deeper locations that provide refuge from
high wave energy during winter. In contrast, more protected sites seem to have more stable
assemblages throughout the year. Asher et al. (2017) also found an increase in abundance of
jacks and sharks in shallow and mesophotic reefs in the Hawaiian Archipelago with increasing
depth, due probably to the avoidance of environmental (e.g., wave energy) and anthropogenic
factors (e.g., fishing) in shallow waters. Rapa Nui has been understudied in comparison to other
islands in the Pacific Ocean, and studies at deeper depths are even more limited (Easton et al.,
2017). Seriola lalandi and P. dentex were recorded at ~280 m and ~170 m, respectively, using
ROV (remotely operated vehicle) and Drop-Cams around Rapa Nui and the surrounding
seamounts (Easton et al., 2017). The occurrence of inshore species at deeper depths could also
suggest that deeper habitats are being used as a refuge from natural and anthropogenic
influences. The presence of particular species during certain seasons and at certain sites could
be explored by expanding the survey area in order to include mesophotic zones and incorporate
surrounding seamounts in future designs.

26
2.5.2 Conservation actions
Randall & Cea (2011) proposed the establishment of marine reserves around Rapa Nui to allow
resident fishes to grow until they reached full reproductive maturity. Some of the areas suggested
for reserves were Motu Nui and Motu Iti (in front of Kari-Kari), Ovahe, Motu Tautara, Hanga Nui,
and Motu Marotiri. The last two areas correspond to the southeast side of the island, close to
where the greatest abundance of top predators was recorded and a possible nursery area for C.
galapagensis was identified. Carcharhinus galapagensis show ontogenetic segregation, where
juveniles are more likely to inhabit shallow coastal waters, meanwhile adults occur in deeper
waters away from the coast (Acuña-Marrero et al., 2018; Kohler et al., 1998; Wetherbee et al.,
1996). Areas used by early life stages are vital for population stability and recovery (Bonfil, 1997),
and therefore, their protection is necessary.
Several initiatives have proposed other strategies to protect marine coastal and offshore
ecosystems at Rapa Nui. An effort has been made in the last seven years to raise awareness and
capacity building in the Rapanui community (Aburto et al. 2017; Gaymer et al., 2013). These
efforts ultimately resulted in a participatory process that lead to the creation of a Multiple Uses
coastal Marine Protected Area, MUMPA, around the entire EEZ of Easter and Salas and Gómez
islands, completing the protection initially provided by the MMHMP in 2010. In order to implement
this large-scale MPA, a participatory management plan has to be built, which includes the zoning
of the MUMPA in both the coastal and offshore areas. Zoning will include establishing fully no-
take coastal areas that could allow recovery of some over-exploited target fishes, but also to
protect areas were top predators (such as C. galapagensis) are concentrated. Top predators play
a crucial role in ecosystem function (Friedlander & DeMartini, 2002), thus their protection is
necessary for maintaining ecological processes and ecosystem services. The current study is an
important contribution for planning the management and conservation strategies to be
implemented in the newly created Rapa Nui MUMPA. A Marine Council, with a majority of

27
Rapanui-elected members, will place the administration of this area under a co-management
strategy, in which is an unprecedented model of MPA administration in Chile (Aburto et al., 2017)
Over the last decades, there has been an increasing awareness of the added value that
ecosystem services and sustainable management can offer to small human communities that
inhabit coastal areas (Arkema et al., 2006). Biodiversity has been recently recognized as an
economic resource (Admiraal et al. 2013), enhancing ecotourism and helping local inhabitants
shift from non-sustainable practices (overfishing) to a broader array of sustainable activities with
added value such as community-based ecotourism. In this sense, the year-round occurrence of
the Galapagos shark in one specific area of the island could be considered a shark-based
ecotourism spot, where local operators benefit from long-lived animals ensuring decades of
incomes. Thus, not only the protection of the Galapagos shark, but also its potential for ecotourism
(e.g., shark-watching by SCUBA divers), should be key elements for taking into account for the
zoning of the Rapa Nui MUMPA, that will allow activities such as traditional fishing practices,
ecotourism, scientific research and others that should be defined in the management plan.
28
CHAPTER 3. THE TROPHIC ROLE OF LARGE FISHES INHABITING THE EASTER
ISLAND ECOREGION
3.1 ABSTRACT
Large fishes are culturally and economically valuable in the remote island of Rapa Nui.
Nonetheless, historical overfishing resulting in the removal of top predators could affect the
abundance and distribution of other species from lower trophic position within the ecosystem due
to top-down regulation. Large fishes are usually assumed to be top predators; however, their
trophic role needs to be evaluated on each location where they occurred. Here, we used δ13C and
δ15N isotopic signatures of large reef fishes previously listed as top predator species to: (1)
determine the trophic position of large fishes and highlight their role in the ecosystem; and to (2)
define the trophic niche of these species to evaluate the potential for dietary overlap. Our results
indicate that not all large fishes inhabiting Rapa Nui can be considered as top predator species.
It is also shown that there is a high overlap in isotopic signatures among studied species,
suggesting the potential for interspecific competition. The current study highlights the needed for
multispecies studies to elucidate the tropho-dynamics of this isolated and understudied
ecosystem.
3.2. INTRODUCTION
Top predators exert strong top-down influences on communities, controlling the demography of
other organisms (Steven et al., 2000; Heithaus et al., 2008; Ruttenberg et al., 2011). The
continued decline of these predators has led to increased concerns about how flow-on effects
could impact the abundance and distribution of other species from lower trophic position (Stevens
et al., 2000; Myers et al., 2003; Dulvy et al., 2014; Myers et al., 2007).

29
Since the emergence of stable isotope technology, stable isotope analysis (SIA) are been
increasingly used to investigate the tropho-dynamics within food webs (Cherel et al., 2008). The
stable isotope signatures of carbon (δ13C) and nitrogen (δ15N) reflects nutrients assimilated over
many feeding events (Futuyma & Moreno 1988). As the isotopic signature of carbon (δ13C)
undergoes very little enrichment as trophic position increases, it is a useful indicator of the source
of primary production (Harrigan et al 1989; Sweeting et al., 2007), whereas nitrogen (δ15N)
signatures increase by 3-4 ‰ from prey to predator providing an index of trophic position (Vander
Zanden et al., 1997; Sweeting et al., 2007; Frisch et al., 2014). Using this technique, relevant
information on trophic interaction such as trophic position, trophic niche, and intra- or inter-specific
competition can be easily achieved (Post 2002; Papastamatiou et al., 2006). Reef sharks and
larger bony fishes are typically assumed to have the highest trophic position in their food webs
(Sandin et al., 2008; Roff et al., 2016), mainly because of their relatively large body size and
predatory behaviour (Frisch et al., 2014; 2016). The misclassification of a species trophic position
has the potential to result in erroneous conclusions on the food web dynamic of coral reefs, and
therefore, inappropriate management decisions (Heithaus et al., 2008; Frisch et al., 2016). The
trophic niche in a food web provides insight into how a community is structured within an
ecosystem (Layman et al., 2007), and how the available resources are partitioned among
sympatric species (Papastamatiou et al., 2006). Niche dynamics are susceptible to environmental
and biotic changes such as intra- and inter-specific competition and prey abundance (Bearhop et
al., 2004). This information is especially relevant in ecosystems where anthropogenic stressors
impact community structure (Layman et al., 2007).
Rapa Nui is one of the most isolated islands in the Pacific Ocean. Due to its geological age, small
size, and high latitude location, this island is characterized by a low number of shore species
compared to other islands in the Pacific Ocean (Randall & Cea, 2011). Fishes at Rapa Nui are
culturally and economically valuable for the rapanui people. However, historical local overfishing

30
has led to a decline of commercially important fishes over the pass years (Aburto et al. 2015;
Friedlander et al., 2013; Zylich et al., 2014). Fisheries landings predominately consist of large
pelagic fishes like tunas, jacks, and swordfishes, among others, although the herbivorous
rudderfish Kyphosus sandwicensis is also an important and culturally valued inshore species
(Zylich et al., 2014; Easton et al., 2017; Friedlander, 2018). Species like the Galapagos shark,
Carcharhinus galapagensis, are not commercially targeted; however, its population is also
decreasing mainly due to incidental fisheries take (Zylich et al., 2014). In addition, some (legal)
catches of large pelagic fishes such as swordfishes, oceanic sharks, and marlins commonly occur
inside (Vega et al., 2009) and outside (Morales unpublished data) the EEZ of the Easter Island
Ecoregion. As a result, large species are either absent or in extremely low abundance around the
island, raising questions about the health of the entire ecosystem (Friedlander et al., 2013).
Trophic interactions can have a strong influence on certain aspects of community ecology such
as demography (Myers et al., 2007). Therefore, determining tropho-dynamics is an important step
in understanding ecosystem functioning (Cherel et al., 2008). Here, we used stable isotope
signatures of δ13C and δ15N to: (1) determine trophic position of large fishes and clarify their role
within the Rapa Nui ecosystem; and (2) define the trophic niche of sympatric species, evaluate
the potential for dietary overlap and hypothesize about potential competition for food in this
nutrient poor ecosystem.
3.3 METHODS
3.3.1 Sample collection
Muscle samples were collected from specimens caught by local fishermen around Rapa Nui from
2016-2019. Our study focused on the top predator species described by Friedlander et al., (2013),
and those observed in Morales et al. (2019a). Muscle samples were labelled and stored at -20°C

31
after collection. Body size could not be measured for each individual therefore, were not
considerate in the analyses.
3.3.2 Sample preparation and stable isotopes analysis
Approximately 10 mg of wet muscle tissue was dissected, washed with milli-Q water, and placed
in pre-combusted vials. All samples were oven-dried (60º C for 48 h) and then ground to a fine
power in an agate mortar. Lipids, which can affect isotopic composition, were dissolved with
cyclohexane according to Lorrain et al., (2011). Approximately 0.5 mg were transferred to tin
capsules (5 x 9 mm) and stored in a desiccator until analysed for stable isotopes.
Analyses of carbon (δ 13C) and nitrogen (δ15N) stable isotope ratios were conducted at the School
of Biological Sciences, Washington State University, using a Eurovector elemental analyzer,
coupled to a Micromass Isoprime isotope ratio mass spectrometer. Stable isotope ratios were
reported in the δ notation as the deviation relative to international standards (Vienna Pee Dee
Belemnite for δ 13C and atmospheric N 2 for δ 15N), so δ 13C or δ 15N = [(R sample /R standard) – 1] ×
10 3, where R is 13C/12C or 15N/14N, respectively. Typical precision of the analyses was ± 0.1 ‰
for both δ 15N and δ 13C.
3.3.3 Trophic positions estimations
Calculations of trophic positions of consumers were performed using “oneBaseline” (model 1) and
“twoBaseline” (model 2) models, based on the trophic enrichment factor (TEF) for nitrogen
detailed by Post (2002). We then incorporated uncertainty through Bayesian inference using the
tRophicPosition package in R software v0.98.977 (R Core Team 2019; Quezada-Romegialli et
al., 2018):
(Model 1-oneBaseline):
δ15Nc = δ15Nb1 + ΔN (TP – λ)

32
(Model 2-twoBaseline):
δ15Nc = ΔN (TP + λ) + α (δ15Nb1 + δ15Nb2) – δ15Nb2
α = (δ13Cc – δ13Cb2) / (δ13Cb1 – δ13Cb2)
Where δ15Nc and δ13Cc refer to the δ15N and δ13C values of consumers, respectively. ΔN
corresponds to the trophic enrichment factor (TEF) for nitrogen and λ is the trophic position of the
baseline. The δ15Nb1 and δ13Cb1 are the nitrogen and carbon signatures for baseline 1 and
δ15Nb2 and δ13Cb1 for baseline 2. α is the proportion of nitrogen derived from baseline 1. The
models were run with 2 chains, 20.000 adapting samplings and 20.000 iterations.
Assuming that the Rapa Nui marine ecosystem could be supported by both pelagic and benthic
N2-fixation pathways (e.g., N2-fixing pelagic cyanobacteria and diazotrophic symbiont in corals,
respectively), a two-baseline model based in nitrogen signatures was used. (Zapata et al.
unpublished data). The δ15Nb1 signature was estimated as the average from three herbivorous
zooplankton taxa (i.e., calanoid and cyclopoid copepods and euphausids) (baseline 1) and the
coralivorous gastropod Coraliophilla violacea (baseline 2). The ΔN and ΔC were taken from global
meta-analyses and correspond to muscle tissue signatures (ΔN=2.9‰ ±0.3 and ΔC=1.3+0.3‰)
(McCutchan et al., 2003).
3.3.4 Trophic structure and isotopic niche
To determine the trophic diversity between marine assemblages, a sample-size corrected version
of standard ellipse area (SEAc) was utilized as a measure of the mean core of the isotopic niche
occupied by different taxa in each assemblage (Jackson et al., 2011). This metric represents a
measure of the total amount of niche occupied in the isotopic space and allows for robust
statistical comparisons between data sets with different sample sizes and corrects for bias when
sample sizes are small (Jackson et al., 2011). Moreover, this metric allowed for calculating the

33
overlapping area of the standard ellipses (and their respective %) between assemblages
(employing 95% of data) and was used as a measure of trophic partitioning between different
assemblages. Additionally, other measurements of isotopic niche widths and trophic structure
proposed by Layman et al., (2007), were calculated for each assemblage: (1) the total area (TA)
occupied was calculated as the area of the convex hull that incorporated all individuals and
represents a measure of niche width and reflects the isotopic diversity of a group (Vaudo &
Heithaus, 2011); (2) mean distance to the centroid (CD) represents the average degree of trophic
diversity within the species. CD is calculated by determining the Euclidean distance of each
individual to the δ13C and δ15N centroid of all individual; and (3) standard deviation of nearest
neighbour distance (SDNND) giving a measure of evenness of spatial density and packing. These
metrics were estimated using the SIBER package in R (Jackson et al., 2011).
3.4 RESULTS
In total, 105 individuals from 10 large fish species were sampled and analyzed for isotopic
composition (Table 3.1). Mean δ15N and δ13C signatures for all fish species are shown on a
bivariate plot in Figure 3.1. Thunnus albacares had the largest range of δ13C (6 ‰), while
Acanthocybium solandri and Pseudocaranx dentex had the largest ranges of δ15N (7.5 ‰).
Species-specific mean δ13C signatures ranged from -18.40 ± 1.29 ‰ (Katsuwonus pelamis) to
16.45 ± 0.67‰ (Carcharhinus galapagensis), and mean signatures of δ15N range from 13.85 ±
1.75‰ (Pseudocaranx dentex) to 17.53 ± 0.93‰ (Coryphaena hippurus), although the single
sample of Alustomus chinensis measured 11.6‰. Statistical comparisons showed significant
differences between species (Pseudo-F = 5.148; df = 9; P< 0.001). The most significant
differences were from P. dentex and C. galapagensis to the other species inhabiting the island
(Table S3.1).

34
Figure 3.1. δ13C and δ15N signatures of large fishes inhabiting Rapa Nui. Data points are group means, and error bars are standard deviations. Open symbols represent species with less than five samples. Species abbreviations are defined in Table 3.1.

35
Table 3.1. Summary of mean and standard deviation (SD) of stable isotopes (δ13C and δ15N) composition of large fishes included in this study. Abbreviation (Abb), sampling size (n).
Taxón Abb
δ13C δ15N
n
Mean SD Range Mean SD Range
Acanthocybium solandri AS -17.77 0.97 4.2 16.03 1.58 7.5 31
Aulostomus chinensis AC - - - - - - 1
Carcharhinus galapagensis CG -16.45 0.67 1.5 15.62 1.26 2.9 6
Coryphaena hippurus CH -17.79 0.93 2.4 17.53 0.93 2.4 7
Katsuwonus pelamis KP -18.40 1.29 5.5 15.94 1.65 6.6 19
Pseudocaranx dentex PD -17.20 1.32 4.8 13.85 1.75 7.5 19
Seriola lalandi SL -18.10 0.34 0.7 14.15 2.51 5.3 4
Kajikia audax KA -17.28 0.44 0.9 15.74 1.30 3 5
Thunnus albacares ThA -18.38 1.06 6 16.01 1.67 6.3 36
Thyrsites atun TyA -18.16 1.09 3.3 16.21 0.84 2.2 7
3.4.1 Trophic position
Large fishes inhabiting Rapa Nui encompassed three trophic positions: secondary (3.0-3.9),
tertiary (4.0-4.9), and quaternary (≥5.0) consumers. Only one species was recoded as a
secondary consumer, seven as tertiary, and one as quaternary (Table 3.2). Within the tertiary
consumers, Pseudocaranx dentex and Seriola lalandi had the lowest trophic positions (4.2 and
4.4, respectively), while Katsuwonus pelamis, Thunnus albacares, Thyrsites atun, and
Acanthocybium solandri had the highest signatures, nearly approximating quaternary consumers.
Only one species, Coryphaena hippurus, encompassed the quaternary group.

36
Table 3.2. Summary of outputs from trophic position (TP) models (model-1: “oneBaseline” and model-2: “twoBaseline”). Mode signatures and 95% Bayesian confidence interval are presented. TP from Fishbase are based on food items.
Taxon TP-model 1 TP-model 2 TP from
Fishbase Mode Lower Upper Mode Lower Upper
Acanthocybium solandri 5.0 4.3 6.0 4.9 4.2 5.9 4.3 ± 0.2
Aulostomus chinensis 3.4 2.0 9.3 3.3 2.0 9.3 4.2 ± 0.7
Carcharhinus
galapagensis 4.8 4.0 6.0 4.6 3.9 5.7 4.2 ± 0.4
Coryphaena hippurus 5.4 4.6 6.8 5.4 4.5 6.5 4.4 ± 0.0
Katsuwonus pelamis 4.9 4.2 6.0 4.8 4.1 5.8 4.4 ± 0.5
Pseudocaranx dentex 4.2 3.6 5.0 4.1 3.6 5.0 3.9 ± 0.6
Seriola lalandi 4.3 2.6 6.5 4.1 2.3 6.1 4.2 ± 0.1
Kajikia audax 4.8 4.0 6.2 4.8 3.8 6.1 4.5 ± 0.7
Thunnus albacares 4.9 4.2 5.9 4.8 4.2 5.7 4.4 ± 0.4
Thyrsites atun 4.9 4.3 6.2 4.9 4.2 5.9 3.6 ± 0.3
3.4.2 Isotopic niche
The isotopic niche of large fishes inhabiting Rapa Nui differed in size but not much in position,
indicating a low to moderate degree of trophic diversity (Fig. 3.2). The ellipse areas (SEAc) was
smaller for Acanthocybium solandri (4.16) and larger for Pseudocaranx dentex (7.4). Except for
A. solandri, all groups had similar CD signatures. NND ranged from 0.46 (T. albacares) to 0.82
(K. pelamis and P. dentex), and SDNND ranged from 0.49 (T. albacares) to 1.21 (K. pelamis)
(Table 3.3).
The niche overlap was high (≥50%) between A. solandri, K. pelamis, and T. albacares.
Pseudocaranx dentex was the only species that showed less overlap with the others, suggesting
that this species feeds on different prey than the other species examined (Table 3.3; Fig.3.2a).

37
Table 3.3. Isotopic niche area described by Standard Ellipse Area (SEA), corrected SEA (SEAc), total area of the convex hull (TA) and sample size (n) for the four species with sample size over 10 as was recommended by Jackson et al. (2011). Acanthocybium solandri (AC); Katsuwonus pelamis (KP); Pseudocaranx dentex (PD); Thunnus albacares (ThA). Other abbreviations are defined in methods.
Metrics AS KP PC ThA
SEA 4.01 6.55 6.99 5.58
SEAc 4.16 6.93 7.40 5.75
TA 17.65 23.70 22.75 21.03
CD 1.27 1.55 1.84 1.74
NND 0.49 0.82 0.82 0.46
SDNND 0.55 1.21 0.72 0.49
n 31 19 19 36
Ellipse overlap (%) Species 1
Species 2 AS KP PD ThA
AS - 49.9 10.0 51.6
KP 83.2 - 15.2 98.4
PD 17.8 16.3 - 17.5
ThA 71.3 81.5 13.5 -
*Data are the percentage of SEAc of species 1 that is occupied by the SEAc of species 2.

38
Figure 3.2. Isotopic niche space of four species sampled during the study and density plots showing the credibility intervals of Bayesian standard ellipses areas. (a) Isotopic niche space of four species sampled during the study. (b) Density plots showing the credibility interval of Bayesian standard ellipses areas (SEA). Black circles and red crosses indicate mode SEAB and small sample size corrected (SEAC), respectively. Shaded boxes indicate the 50, 75, and 95% credibility intervals for each species. We only considered species with > 10 samples for these analyses. Acanthocybium solandri (AS); Katsuwonus pelamis (KP); Pseudocaranx dentex (PD); Thunnus albacares (ThA).

39
3.5. DISCUSSION
3.5.1 Stable isotope signatures
Large fishes from Rapa Nui are broadly distributed throughout δ13C - δ15N space (Fig. 3.1),
indicating a broad range of trophic diversities. In general, it is well established that inshore
(benthic) and offshore (pelagic) systems have enriched and depleted δ13C, respectively (Speed
et al., 2012). The δ13C signatures found in this study suggests that most of the studied species
are more related to a planktonic (pelagic) rather than benthic food source. Only Pseudocaranx
dentex and Carcharhinus galapagensis appeared to be more closely related with the benthic coral
reef resource.
Thunnus albacares displayed the largest range of δ13C (6‰), suggesting a broad carbon source.
The wide range and high mean signature could be explained by its migratory behaviour (Bearhop
et al., 2004), and high trophic position, due to the integration of different carbon sources along
their movement routes (Hecky & Hesslein, 1995; Estrada et al., 2003). During these migrations,
T. albacares may consume both benthic prey from islets and seamounts, in addition to pelagic
prey from the open ocean. Moreover, the latitudinal variation in food carbon signatures to which
this species encounters during their migrations can also explain the wide range of δ13C found
here (Kelly et al., 2006; Cherel & Hobson, 2007). In contrast, Acanthocybium solandri and P.
dentex showed the largest range of δ15N (7.5 ‰), which indicates that they feed over a broad
range of trophic positions (Table 3.1; Fig. 3.1). Large ranges of δ15N signatures are more common
on inshore species due to the higher availability of prey from different trophic positions (Link 2002;
Estrada et al., 2003). On Rapa Nui, P. dentex is a benthic feeder that feeds primarily on bivalves,
gastropods, and small fishes (Randal & Cea, 2011). However, personal observations by divers in
our study area indicate that P. dentex also eats the feces (coprophagia) of larger fishes, like the
Galapagos sharks. This interaction could explain the broad range of δ15N values despite its low

40
mean. Coryphaena hippurus showed the highest δ15N signatures (17.53 ± 0.93) suggesting that
this species is at the top of the food web and feeds on high trophic position prey.
3.5.2 Trophic position
Derived trophic position (TP) from δ15N signatures showed that most large fishes at Rapa Nui
have high positions in the trophic web (TP= 4.1 – 5.4). Only Aulostomus chinensis, which was
previously reported as a top predator at Rapa Nui (Friedlander et al., 2013), was not a top predator
based on trophic position (TP= 3.4). However, this should be interpreted with caution since we
only analysed one sample of this species. Even though, the TP of A. chinensis (and the size of
its mouth) seems consistent since they are much smaller than the other fishes sampled here
(maximum size = ~76 cm total length; Randall & Cea, 2011), and therefore are limited to smaller
prey, which are generally low-level consumers. Pseudocaranx dentex and Seriola lalandi had a
TP of 4.2 and 4.3, respectively. Frisch et al., (2016) suggest that species with TP between 4.0
and 4.5 should be considerate more as high-level mesopredators, an alternative trophic group
that better fits their trophic role. The highest trophic positions in our study correspond to C.
hippurus (TP = 5.4) indicating that in the South Pacific it feeds on prey with a high trophic position,
such as pelagic fishes and epipelagic cephalopods (Olson & Galván-Magaña, 2002).
Nevertheless, Teffer et al., (2015) suggested that C. hippurus and other species such as tuna
have similar diets and might be competing for available resources. The differences between C.
hippurus and the other top predators studied here may be a result of their foraging habits (e.g.,
vertical migration and maximum depth, feeding hours, etc.; Moteki et al., 2001). Menard et al.,
(2007) also suggested that sympatric species with similar diets, but slightly different TP´s might
be results of one species feeding over larger specimens of the same prey species. The two
species of tuna (Katsuwonus pelamis and T. albacares) displayed close δ15N signatures, and
therefore TP´s suggesting a similar diet. These two species are mainly piscivorous with similar
feeding behaviour, which could be explaining our results and those findings by Koladinovic et al.,

41
(2008). Even though we could not sample other large species inhabiting the area, such as
Prionace glauca (blue shark) and Isurus oxyrinchus (Mako shark), we hypothesize that these
large roving sharks might also be occupying the role of apex predators in the area as has been
suggested for other locations (Estrada et al. 2003; Bugoni et al., 2010)
The differences found between our TP estimates and those from Fishbase could be explained by
different hypothesis: (1) a close relationship between body size and d15N enrichment has been
proposed (Estrada et al., 2006; Papastamatiou et al., 2010; Speed et al., 2012), meaning that
larger individuals eat higher trophic position prey. We were unable to collect the length
measurements of our fishes which may explain these differences since some specimens were
already processed when landed; (2) different habitats could also have different prey, and thus
display different isotopic signatures within the same species. Ferreira et al., (2017) found that
Galeocerdo cuvier (tiger shark), a widely distributed species occupies different trophic position
according to the habitat (offshore vs. inshore) due to different prey availability; and (3) TPs from
Fishbase were calculated using stomach content, and therefore, they might be showing different
time-frames than our results. Stomach content analysis usually underestimates the presence of
rapidly digested prey such as pelagic species (clupeids and engraulids; Frisk et al., 2016)
resulting in a possible underestimation of TP (Hussey et al., 2012). That said, our results are
consistent with other TPs from stable isotope surveys, such as for T. albacares (TP= 4.8; Graham
2010, and TP= 4.7; Bugoni et al., 2010).
Carcharhinus galapagensis appears to have a high TP in the Rapa Nui ecosystem (TP = 4.8)
even though only juveniles were sampled. According to our results, its presence is important and
should be considered a priority for the health and stability of the entire ecosystem, especially
considering that it is the only resident shark species inhabiting the area (Morales et al., 2019a).
Several studies have noted the influence of reef shark species on the structure of different
ecosystems. For example, Barley et al., (2017), found that on shark-depleted reefs, mesopredator

42
species were more abundant and consumed a different diet (fishes and squids), than those
inhabiting shark-rich reefs. In the latter situation, mesopredators were less abundant and
consumed mainly benthic invertebrates. It is worth remembering that sharks sampled during this
study were juveniles and most likely young-of-year. Juvenile elasmobranchs keep their mothers
isotopic signal during their first year of life (and up to two years; Matchi et al., 2010), especially
when slow incorporation rate tissues (e.g., muscle) are sampled (Matich et al., 2010; Olin et al.,
2011). As a result, our findings were most likely the signature of the mother’s isotopic signal and
not the juveniles. Additionally, most of elasmobranchs maintain high levels of urea in their tissues
as a response to osmoregulation processes (Olson 1999). These nitrogenous waste products
could interfere when comparing δ15N signatures between individuals or taxa (Frisch et al., 2012)
by creating lower δ15N signatures (0.1-1.4‰; Hussey et al., 2012), and therefore, lower trophic
position (-0.2 TL; Churchill et al., 2015) than expected. This may mean that C. galapagensis could
eventually occupy an even higher TP in the Rapa Nui ecosystem.
3.5.3 Isotopic niche
Katsuwonus pelamis and P. dentex showed the widest isotopic niche (TA and SEAc) among the
study species suggesting a more generalist diet than T. albacares and A. solandri. If other
conditions remain the same, trophic generalist species seem to be less susceptible to extinction,
and therefore, more resilient to environmental changes due to their ability to change prey (Layman
et al., 2007). Nevertheless, the utilization of TA (convex hull area) to describe the isotopic niche
width should be used with caution, since wider niches are usually related with larger populations
(Bond et al., 2016) and/or larger sample sizes (Jackson et al., 2011). Our results suggest that P.
dentex and K. pelamis have the widest isotopic niches despite their low sample sizes among the
study species (Table 3.3). Pseudocaranx dentex is a species frequently inhabiting nearshore
areas and feeds mainly on benthic prey (Randal & Cea, 2011), but interacts with larger fishes as
mention above, and therefore, we expect this species to have a wider isotopic niche. Katsuwonus

43
pelamis and T. albacares are sympatric species that frequently occur in mixed pelagic schools
(Sardenne et al., 2016). Adults of T. albacares usually displays a deeper vertical distribution than
K. pelamis and preys upon a larger size range of prey (Graham & Dickson, 2004). However,
during our study, we sampled T. albacares of small size (~ 10 kg) called “pitufos” (smurfs in
english) by the rapanui and only a few large individuals (~ 40 kg) were sampled. The diving ability
of T. albacares increases with size, and therefore, we would expect that larger T. albacares to
display wider isotopic niches than K. pelamis.
The high isotopic overlap found between the studied species could be a result of feeding on
species from similar TPs and sources of production (Frisk et al., 2014), and does not necessarily
suggests interspecific competition. Usually, species partition (spatially and temporally) available
resources in order to avoid competition and enable coexistence (Frisch et al., 2014; 2016; Kinney
et al., 2011; Layman et al., 2012). Muscle tissue of pelagic bony fishes only reveals the diet from
3-4 months (Maruyama et al., 2001) up to 6 months for the stable isotope rations of a fish to reflect
consuming prey within a specific area (e.g., Rapa Nui) giving insights into past diet but not the
current one. In this sense, highly migratory species with high niche overlap are not necessarily
competing for food, but instead might have consumed prey from similar TPs or even the same
species at different location.
Nevertheless, Rapa Nui is an impoverished ecosystem in terms of habitat types and species
number compared to other oceanic island in the Pacific Ocean (Randall & Cea, 2011; Friedlander
et al., 2013), with fewer prey species. In this sense, our results might suggest a degree of
interspecific competition between taxa. A high degree of interspecific competition is especially
concerning at Rapa Nui since the depletion of important species populations such as the nanue
(Kyphosus sandwicensis; Friedlander et al., 2013) could trigger a shift in the ecosystem due a
bottom-up regulation. For example, Myers et al., (2007) suggested that after a reduction of
primary prey, the consumer could display a decrease in the breeding performance and a reduction

44
in their population size. Additionally, the occurrence of new species in the ecosystem, such as
Triaenodon obesus (Morales et al., 2019b) and Seriola rivoliana (N. Morales in prep.), could
eventually cause a change in the ecosystem structure through a niche expansion or “ecological
release”. Bolnick et al., (2010) suggested that niche expansion occurs when invading species
arrive in species–poor habitats, such as oceanic islands. Invading species access resources that
were previously monopolized by former competitors, forcing them to expand their niche and diet.
Thus, future studies should include different turn-over tissues and stomach contents studies in
order to elucidate if migratory and resident species are effectively competing for resources at
Rapa Nui. Tagging programs also would help to determinate important ecological aspects that
could explain the coexistence of sympatric species such as feeding areas, feeding time, and
depth, among others.
3.5.4 Conservation aspects
Coral reef ecosystems are at risk due to the effects of both local stressors such as overfishing
and habitat lost (Wilson et al. 2010), and global stressors such as global warming and ocean
acidification (Hoegh-Guldberg et al., 2007). The biodiversity at Rapa Nui is especially susceptible
to global changes. Its subtropical location makes tropical species vulnerable to extended periods
of cool sea temperature, while subtropical species are vulnerable to long periods of warm sea
temperature (Randall & Cea, 2011). Moreover, historical high fishing pressure on large fishes is
putting pelagic stocks at risk, causing a drastic decline of their population (Myers & Worm 2003).
Thus, the decrease of both high and low trophic position species could cause both a bottom-up
and/or top-down shift with unexpected consequences for the entire ecosystem.
Understanding the role of co-occurring species and how those species use inshore areas is
crucial to implementing effective strategies to manage and conserve both the habitats and the
species inhabiting them (Gallagher et al., 2016). This current study contributes to the

45
understanding of the role of large fishes at Rapa Nui, how they interact, and the relationships
occurring within this isolated and understudied area. Moreover, this information could be used to
improve conservation actions such as the implementation of no-take areas where key species
occur, or the implementation of management strategies for economically important species.
Finally, future studies should concentrate on comparing both Rapa Nui, a shark-depleted
ecosystem, and Salas y Gómez island, a nearly pristine ecosystem full of reef sharks (Friedlander
et al., 2013; Morales pers. obs.), in order to determine if Rapa Nui corresponds to a “new” state
of organization of food web caused by anthropogenic pressure.

46
CHAPTER 4. RESIDENTIAL MOVEMENTS OF TOP PREDATORS AT CHILE’S
MOST ISOLATED MARINE PROTECTED AREA: IMPLICATIONS FOR THE
CONSERVATION OF THE GALAPAGOS SHARK, CARCHARHINUS
GALAPAGENSIS, AND THE YELLOWTAIL AMBERJACK, SERIOLA LALANDI.
4.1 ABSTRACT
Marine Protected Areas (MPAs) are becoming a widely used tool for the conservation of
biodiversity and fishery management. However, most of these areas are designed without
knowledge of the basic ecological aspects of the species they are trying to protect. This study
investigated the movement of two top predators: Galapagos shark, Carcharhinus galapagensis,
and the yellowtail amberjack, Seriola lalandi in and around the Motu Motiro Hiva Marine Park
(MMHMP) using miniPAT satellite tags to determine the effectiveness of this MPA for the
protection of these species. The Galapagos sharks (n = 4) spent most of their tag deployment
periods inside the MMHMP. However, high intraspecific variability was observed in their
movement dynamics. Daily individual maximum movements ranged from 17 to 58 km and the
maximum distance from Salas y Gómez Island, the only emergent island within the MMHMP, was
31 to 139 km. The maximum linear distance travelled for a female juvenile Galapagos shark (152
cm TL) was 236 km, which is greater than the maximum distance previously documented for
juveniles of this species (< 50 km). For yellowtail amberjack (n = 1), 91% of the satellite
geolocations were within the MMHMP, with a maximum daily distanced travelled of 6 km.
Maximum distance travelled between points was 111 km and the maximum distance from Salas
y Gómez Island was 62 km. All archival-tagged fish spent most of their time at depths <50 m and
never left the epipelagic zone. Day vs night-time differences were pronounced in all individuals
but showed high inter-individual variability. This study provides a baseline on the movement of

47
these two top predators in the MMHMP and provides valuable insights for the creation of MPAs
in the region and elsewhere.
2.2 INTRODUCTION
The establishment of Marine Protected Areas (MPAs) has become a widely applied tool for the
conservation of biodiversity and fishery management (Botsford, Micheli, & Hastings, 2003;
Pendleton et al., 2018). Numerous studies have demonstrated their capacity to protect a variety
of marine fauna, including mobile species (e.g., White et al. 2017), while restoring and preserving
overall ecosystem functions (Gaines et al., 2010; Lubchenco & Grorud-Colvet, 2015). Features
such as isolation, size (> 100 km2), age, enforcement, and the establishment of fully protected
no-take zones have been shown to be key features for the success of MPAs (Edgar et al., 2014).
However, at least 94% of the world’s MPAs allow some form of fishing activity (Costello &
Ballantine, 2015), which negatively impacts biodiversity within these MPAs and the fisheries
benefits due the reduced reproductive output and adult spillover (Boonzaier & Pauly, 2015;
Hilborn, 2016; Klein et al., 2016).
Fishing activities outside an MPA may also negatively affect populations and biodiversity inside
the MPA (Moffitt, Botsford, Kaplan, & O'Farrell, 2009). This particularly applies to mobile species
such as tunas and sharks that are wide-ranging and can move between national and international
boundaries. As a result, many mobile species within MPAs are considered to be overfished
because of poorly managed fisheries operating in international waters (Sala et al., 2018), and
within national boundaries (Agnew et al., 2010). Evaluating the efficacy of MPAs thus becomes
imperative for the long-term conservation of marine ecosystems. For this to occur, it is imperative
to have an in-depth knowledge of species habitat utilization patterns, habitat requirements
(Roberts, 2000; Field et al., 2011), and the degree of overlap between the habitat and the area
under protection (Knip, Heupel, & Simpfendorfer, 2012).

48
With the rapid technological advancement of remote tracking applications, it is now possible to
gain insights into the movement patterns of marine organisms and its relevance for marine
conservation. Satellite tagging studies on whales, sea turtles, and sharks have significantly
improved our understanding of their migratory routes and habitat use, revealing specific areas
and corridors as biodiversity hotspots (Block et al., 2011; Robinson et al., 2016). Furthermore,
satellite telemetry has been employed to develop management strategies that minimize
anthropogenic impacts, such as incidental mortalities in high-seas fisheries (Shillinger et al., 2011;
Poisson et al., 2016), vulnerability of species to certain fishing gears (Cortés et al., 2010), and the
effectiveness of modified gears by tracking the survival of released fisheries bycatch (Moyes et
al., 2006; Swimmer et al., 2006). With the increase in available information, satellite data have
allowed us to evaluate the effectiveness of established MPAs for the protection of top predator
species. For example, White et al. (2017) overlaid the habitat utilization of grey reef sharks
(Carcharhinus amblyrhynchos) at Palmyra Atoll MPA with the boundaries of the no-take U.S
Pacific Remote Island Marine National Monument and found that while the MPA was somewhat
effective, it did not cover the species’ entire home range. This highlights the need for much larger
MPAs to guarantee the conservation of highly migratory species. In a similar study by Queiroz et
al., (2016), tracking data of coastal and pelagic shark species, including critically endangered
(Sphyrna mokarran and S. lewini), endangered (Isurus oxyrinchus), and near-threatened species
(Galeocerdo cuvier, Prionace glauca) overlapped so extensively with the fishing efforts of longline
vessels fishing in international waters, that the creation of effective MPAs in the high seas was
considered infeasible due to socio-economic reasons.
Chile is among the top ten fish producers globally and has among the most productive waters
worldwide (Daneri et al., 2000). However, the overall conservation of Chile’s marine biodiversity
is at risk, especially along its coastline, where anthropogenic impacts are greatest and often
conflict with established or planned MPAs (Tognelli, Fernández, & Marquet, 2009; Cárcamo et

49
al., 2011). To confront the fishing pressure imposed on Chile’s marine biodiversity and to protect
critical ecosystems, in 2010 the Chilean government created the Motu Motiro Hiva Marine Park
(MMHMP), a large-scale (150,000 km2) no-take marine protected area surrounding Salas y
Gómez Island (Figure 4.1). It is considered one of the most isolated islands in the world, with the
south-easternmost distribution of coral reef systems (Randall & Cea, 2011; Friedlander et al.,
2013; Arana, 2014). This ecosystem is dominated by top predator species such as the Galapagos
shark (Carcharhinus galapagensis) and three species of jacks (Seriola lalandi, Caranx lugubris,
and Pseudocaranx cheilio). The marine ecosystem surrounding Salas y Gómez Island is in sharp
contrast to Rapa Nui (Easter Island) where historical overfishing has depleted these top predator
species (Friedlander et al., 2013).
Figure 4.1. Bathymetry of the Easter Island Ecoregion. Rapa Nui, Salas y Gómez Island, Motu Motiro Hiva Marine Park (violet), Exclusive Economic Zone (white).

50
Top predators, such as sharks, jacks, groupers, and tunas are key elements for the maintenance
of ecosystem health, as they regulate the demography and behaviour of organisms from lower
trophic levels (Myers et al., 2007; Heithaus et al., 2008; Ferretti et al., 2010; Ruttenberg et al.,
2011). However, these large predators are becoming increasingly scarce in coral reef and pelagic
ecosystems, largely due to overfishing and habitat degradation (Steven et al., 2000; Myers &
Worm, 2003; Dulvy et al., 2014).
Carcharhinus galapagensis, is one of the most abundant reef sharks inhabiting the Tropical Indo-
Pacific Ocean (Duffy, 2016). It has a circumglobal, albeit patchy, distribution and is associated
with warm and temperate waters and oceanic islands (Wetherbee Crow, & Lowe, 1996; Kohler,
Casey, & Turner, 1998; Meyer, Papastamatiou, & Holland, 2010; Duffy, 2016). Their slow growth,
fragmented geographical distributions, and unknown levels of local connectivity have likely
contributed to their population declines in areas of high fishing pressure in the Pacific and Atlantic
oceans (Kyne et al. 2019). Carcharhinus galapagensis was recently reassigned as “Least
concern” by the IUCN Red List; however, the habitat specificity of this species make it susceptible
to localized depletion (Kyne et al. 2019). Major threats to this species come from fishing activities
around islands and seamounts (Zylich et al., 2014; Kyne et al. 2019). Carcharhinus galapagensis
accounts for 26% of the biomass at Salas y Gómez Island (Friedlander et al., 2013). At Rapa Nui,
their population has declined as a result of direct and indirect fisheries impacts (Zylich et al.,
2014), although a resident population still inhabits the area (Morales et al., 2019a). Another
important predator in the Easter Island Ecoregion is the yellowtail amberjack Seriola lalandi, a
coastal pelagic species restricted to subtropical waters (Randall & Cea, 2011; Martinez-Takeshita
et al., 2015). It is currently classified as ‘Least Concern’ (IUCN, 2018), with no apparent population
declines (Smith-Vaniz & Williams, 2015). In total, Seriola lalandi together with Caranx lugubris
and Pseudocaranx cheilio account for 19% of the total biomass at Salas y Gómez Island, and as

51
with C. galapagensis, their populations around Rapa Nui are virtually absent (Friedlander et al.,
2013).
Despite being the most common top predators within MMHMP, little information is currently
available for C. galapagensis and S. lalandi within the Easter Island Ecoregion. Ecological
information, such as spatial dynamics, habitat use, and connectivity, are essential in generating
realistic and effective conservation plans for the protection of these species. Therefore, this
current study aims to investigate the movement patterns and habitat use of both species within
MMHMP in order to give some insights into the effectiveness of the current MMHMP borders for
the protection of these key species. Additionally, industrial fishing pressure in the area was
examined and compared with the current MPA borders and predator movement patterns to
explore the potential impact of fishing on these species.
4.3 METHODS
4.3.1 Study area
Salas y Gómez Island (26°27'S, 105°28'W) is a 0.15 km2 small, emergent rocky outcrop located
400 km east of Rapa Nui (Easter Island), and ~ 3,300 km from the Chilean coast (Figure 1).
Together, both islands are the only two exposed landmasses of the numerous submerged
volcanic seamounts that make up the 2,232 km long Salas y Gómez Ridge (Ray et al. 2012;
Friedlander et al., 2013). Even though both islands are part of the Chilean territory, Rapa Nui and
Salas y Gómez Island are very different from continental Chile in terms of marine ecosystems
and species composition (Aburto, Gaymer, & Cundill, 2017). Located at the eastern limit of the
South Pacific Gyre (Figure 1), this area belongs to the Easter Island Province and Ecoregion,
which is characterized by oligotrophic waters (Pizarro et al., 2006; Andrade, Hormazábal, &
Correa-Ramírez, 2014).
52
4.3.2 Capture and tagging
Fishes were caught and tagged in November 2015 and 2017, during two research trips to Salas
y Gómez Island (during the CIMAR 21 cruise organized by the Chilean Navy and a research trip
of ESMOI,). During each trip, approximately six handlines were equipped with #14/0 circle hooks,
baited with chub mackerel (Scomber japonicus), and set between 15 to 30 m deep for ~ 10 min.
Sharks were secured head-forward alongside an inflatable boat and immobilised for less than five
minutes, following common tagging practice of pelagic sharks (Brooks et al., 2011). Each
individual shark was sexed and measured from snout to the tip of the tail in horizontal position to
determine the animal’s total length (TL). Seriola were measured (TL) and tagged inside the
inflatable boat.
Two types of tags were used during this study. To facilitate the identification of the fish after
potential recapture, each individual was tagged with conventional dart tags with a stainless-steel
metal blade anchor (model FH-69 SS, Floy Tag & Mfg., Inc.) inserted into the musculature at the
base of the dorsal fin between the pterygiophores. To study the movements and habitat use of
these top predators in the area, six large fishes (five C. galapagensis > 140 cm TL and one S.
lalandi, measuring 124 cm TL) were equipped with antifouling coated pop-up satellite archival
tags (model MiniPAT, Wildlife Computers, Redmond, Washington, USA), which were tethered to
the fish next to the conventional tags, using either a plastic Domeier Dart or a stainless-steel metal
blade anchor (Bradford et al., 2009; Table 4.1).

53
Table 4.1. Metadata of each fish tagged during this study. Female (F), male (M), total length (TL), deployment and pop-up latitude (Lat.), longitude (Long.), total number of position estimated per individual (TNPE), resolution (Resol.), and percentage of position estimates inside the MMHMP (EGP) as well as the average overlap of the 50%, 95% and 99% likelihood areas with the MMHMP. We assumed ID 154066 died shortly after tagging and therefore it was not included in the analysis.
Species Tag ID Anchor type Sex TL (cm)
Deployment TNPE per
ind.
Pop-up Model % inside MMHMP Max linear distance (km)
Date Lat. Long. Duration
(days)
Date Lat. Long. Resol. Speed
(km/h) Score
EGP 50% 95% 99% From Salas
y Gómez
per
day
between all
geolocations
Seriola lalandi 154061 Plastic Dart - 124 04 Nov 15 -26,43 -105,38 148 296 31 Mar 16 -27,27 -105,53 600 3 87,48 91,3 84.1 73.4 70.2 62,2 6,2 111,3
Carcharhinus
galapagensis 154062 Plastic Dart F 160 02 Nov 15 -26,45 -105,35 35
69 07 Dec 15 -26,35 -105,22 600 3,5 79,26
72,2 68.6 63.6 62.6 31,3 29,6 47,6
Carcharhinus
galapagensis 154064 Plastic Dart M 160 03 Nov 15 -26,38 -105,39 28
56 01 Dec 15 -26,46 -105,12 600 3 82,05
69 61.8 62.3 62.1 98,9 58 172,4
Carcharhinus
galapagensis 154065 Plastic Dart F 170 05 Nov 15 -26,45 -105,39 18
37 23 Nov 15 -26,4 -105,4 600 3,5 79,07
42,1 54.6 52.9 53.2 35,4 17,5 32,5
Carcharhinus
galapagensis 154066 Plastic Dart M 145 03 Nov 15 -26,62 -105,39 1
7 04 Nov 15 -26,62 -105,42 300 - -
- - - - - - -
Carcharhinus
galapagensis 173480 Steel blade F 152 21 Nov 17 -26,33 -105,39 95
190 24 Feb 18 -26,17 -105,43 600 3,5 73,49
79,2 79.0 79.9 78.6 138,6 45 235,8

54
By default, MiniPATs record depth (1 – 1700 m, 0.5 m ± 1.0%), water temperature (−40 to +60°C;
0.05 ± 0.1°C), and light level (10-2- 10-10W/cm2 at 440 nm) time series data throughout their
deployment period. The sampling interval thereby depends on the deployment duration, which in
this case was every 15 sec for 365 days. If selected for transmission, only a subset of this time
series data, as well as other user-specified (summary) data products, were transferred to the
ARGOS satellite system. Depth and temperature time series data at a temporal resolution of 10
min were transmitted to facilitate a fine-scale analysis of vertical behaviour (Bauer et al., 2017),
and thus their potential vulnerability to commercial fisheries (e.g., longliners; Tolotti et al., 2017).
Long deployment durations can result in transmission gaps, especially in the transmitted depth
time series data, due to the limited transmission capacity of the tag (Bauer, Forget, & Fromentin,
2015). Time-at-depth (TAD) and time-at-temperature (TAT) profiles (histogram data) represent a
summary data product that can complement depth time series data analyses and can be
transmitted in fewer messages. For this purpose, archived depth and temperature time series
data from user-specified time intervals were aggregated by the tag into user specified bins. Here,
a 24h TAD and TAT data with the following depth and temperature bins were selected: Depth
bins: 0, 1, 5, 15, 30, 50, 70, 100, 200, 300, 500, >1000 m; Temperature bins: 0, 6, 9, 12, 15, 21,
24, 27, 30, >33°C. Other selected data products included daily Profiles of Depth at Temperature
(PDT), daily light curves, as well as minimum and maximum depth records. Given the long
deployment duration programmed, it was decided that the summary and depth time series data
should be transmitted on duty cycle (2 days of data to be transmitted, followed by 3 days of data
gaps), in order to increase battery life during data transmission. In the event of premature release,
transmission was programmed to initiate upon the tag being at the surface or remaining at depths
of > 1800m (indicating death of the animal) for more than three days.

55
4.3.3 Analysis of horizontal behaviour
Geolocation analysis was performed using the manufacturer’s proprietary Hidden Markov Model
(HMM, WC-GPE3, Wildlife Computers) to estimate positions. This approach uses a gridded HMM
that computes posterior probability distributions to estimate the most likely state (positions,
hereafter referred as geolocations) at each time point using light levels, sea-surface temperature
(SST), and bathymetric data. The model allows the user to define a typical travelling speed,
deployment and pop-up locations of the tags. Travelling speeds are thereby used by the model
to define the allowable distance moved per day, which restricts the daily diffusion kernels.
Different travelling speeds (1.9, 2.5, 3, and 3.5 km/h) were tested based on available literature
values (Holland, Meyer, & Dagorn, 2009; Meyer et al., 2010; Palstra et al., 2015). First transmitted
geolocations of each tag were thereby used as pop-up locations. The selection of the optimal
speed and model was done based on the model score produced by the GPE3 software, with
higher scores indicating better fits to the transmitted data. Transmitted data from all MiniPAT tags
were de-coded with the manufacturer’s cloud-based portal software and analysed using the
Rchival Package (Bauer, 2020a) in the R Statistical Environment (v. 3.5; R Core Team, 2018).
Likelihood areas were generated from the netcdf files in the GPE3 model runs using the
get_geopos function in the R-package RchivalTag (Bauer, 2020a). This function is based on a
transformation suggested by Wildlife Computers (2015). In order to identify species-specific high-
use areas within the study regions, kernel densities were calculated per species based on the
daily geolocations of all related individuals, using the “kde2d”-function from the R-package
“MASS” with a search radius of 1 degree to account for the uncertainty in the geolocations
(Venables & Ripley, 2002; Teo et al., 2004).

56
4.3.4 Analysis of vertical behaviour
Time-at-Depth and depth time series data, transmitted on duty cycle (two days of data to be
transmitted, followed by three days of data gaps), facilitated a vertical behaviour analysis of the
tagged fish. A preliminary analysis of the transmitted data sets revealed additional gaps in the
Time-at-Depth (and Time-at-Temperature) data of the amberjack (ID 154061) and one shark (ID
154065). By contrast, the depth time series data showed good data coverage with only some
minor additional transmission gaps (Figure 2). Given this, as well as its higher informational value,
further analysis focused on the depth time series data. To analyse the diel vertical behaviour of
the tagged fish with respect to the time of sunrise and sunset, these moments were first estimated
based on the “get_DayTimeLimits” and “classify_DayTime” functions in the R-package
RchivalTag (Bauer, 2020a), which uses daily geolocation estimates from the tags as input data.
To determine the general patterns of diel vertical behaviour per fish, their hourly changes in depth
via boxplots were analysed. To assess regional differences in the dive patterns during daytime
and night-time, daily geolocation estimates were mapped in relation to the maximum dive depths
per day and night, the bathymetry of the study area, and the borders of the EEZ and MPA
(MMHMP), using the v-function in the R-Package “oceanmap” (Bauer, 2020b).
In order to identify species-specific dive behaviour patterns from the different Galapagos sharks,
the average depth per hour of each deployment day and fish was first estimated, and then
clustered the combined data matrix from all individuals using the k-means clustering method.
Cluster selection was done based on 30 different clustering indices that were provided by the
NbClust function of the same-named R-package (Charrad et al., 2014).
Finally, the distance of the clusters’ geolocations was estimated to the shore by applying the
distHaversine function in the R-package “geosphere” (Hijmans, 2017).

57
4.3.5. Commercial fishing pressure
Commercial fishing activities were calculated around the Easter Island Ecoregion (117°5´-
97°5´E, 32°5´-17°5´S) during the period 2012- 2016 using Automatic Identification System (AIS).
Daily data of vessel flagged nationality, type of fishing, and fishing hours were obtained from
Global Fishing Watch (www.globalfishingwatch.org). Finally, fishing hours were summed by 5°
resolution according to flagged nationality and gear type.
4.4 RESULTS
Over both campaigns, 48 C. galapagensis and 18 S. lalandi (Table S4.1; Figure S4.1) were
captured. Six MiniPATs were deployed on five C. galapagensis and one S. lalandi (Table 4.1;
Table S4.1). One of the five C. galapagensis (ID: 154066) died shortly after tagging and was
therefore not included in the analysis. The five remaining MiniPAT had premature releases, due
to unknown reasons, resulting in relatively short deployment periods of 18-148 days (Table 4.1).
None of the conventionally or archival-tagged fish have been recaptured to date; however, some
sharks tagged in 2015 were observed swimming with the tags during a dive survey in 2017.
4.4.1 Horizontal behaviour
The GPE3 models yielded best fits for the 3 km/h (IDs 154061 and 154064) and 3.5 km/h (IDs
154062, 154065 and 173480) travelling speeds (Table 4.1). Thus, derived daily geolocations
indicated that all fish left MMHMP at least once throughout the tag deployment period but
remained within the EEZ (Figures 4.2, 4.3, S4.2-4.6), even taking in account different likelihood
areas (Table 4.1, Figure S4.7-4.9) . For C. galapagensis (IDs 154062, 154064, 154065 and
173480), 42-79% of the estimated geolocation points were inside the MMHMP (Table 4.1), whilst
91% of the single S. lalandi track remained within the MMHMP. The range of all 99% likelihood
area within the MMHMP, the most conservative estimate (large) of occurrence, was 53.2-78.6%,

58
whereas the 95% likelihood was 52.9-79.9% and the 50% was 54.6-79% (Table 4.1). The
maximum linear distance per geolocations for S. lalandi (ID 154061) was 6.2 km, and 17.5-58 km
for C. galapagensis (Table 4.1; Figure 4.4).
Figure 4.2. Temporal coverage of available (green) Depth, TS data per deployed tag. Data gaps due to transmission failure or duty cycle are shown in red. Blue bars indicate the periods spent inside the Motu Motiro Hiva Marine Park.
The maximum linear distance from Salas y Gómez Island was 62 km for S. lalandi and 31-139
km for the Galapagos sharks. The maximum linear distance between distant points was 111 km
for the S. lalandi and 235.8 km for C. galapagensis (Table 4.1; Figure 4.4). The kernel density
analysis indicated a common high-use area for both species, which surrounded Salas y Gómez
Island but exceeded the western limits of the MMHMP (Figure 4.3).

59
Figure 4.3. Geolocations of each individual combined (upper panel) and kernel densities (lower panel) indicating areas of high use for the four Galapagos sharks (left) and one amberjack (right). The borders of the EEZ and MMHMP are indicated in white and violet, respectively.

60
Figure 4.4. Distance between subsequent geolocations (left) as well as their distance from Salas y Gómez (right) per species (amberjack indicated in grey).
4.4.2 Vertical behaviour
All archival-tagged fishes spent most of their time at depths <50 m (average depth <60 m) and
never left the epipelagic zone (0-200 m; Table S4.2; Figure S4.10). Even though all fishes reached
depths of ~100 m, only one C. galapagensis (ID 154064) descended to a depth of 195.5 m. The
remaining fishes stayed within 0-131.5 m throughout the deployment period of their tags (18-148
days). The one Seriola lalandi (ID 154061) maximum depth was 100.5 m during night-time (Table
S4.2).
Day vs. night-time differences were pronounced in all individuals but showed high inter-individual
variability (Figures 4.5 and S4.10). Clear diel vertical behaviour patterns were evident for S.
lalandi (ID 154061) and two C. galapagensis (IDs 154062 and 173480), with the amberjack and
one shark (ID 154062) staying in deeper waters during the night compared with the daytime. The
vertical data from shark 173480 showed an opposite pattern. Strong fluctuations were observed
in the diel vertical behaviour of sharks 154064 and 154065, leading to the assumption of changes
in the diel vertical behaviour. The maximum dive depths per day and night, as a proxy for such

61
changes and the species vulnerability to longline gear, showed no relation to local bathymetry or
diel vertical patterns (Figures S4.2-4.6).
Cluster analysis of the hourly depth averages of the different C. galapagensis revealed two distinct
vertical behaviour patterns (Figure 4.6; Table S4.3). Cluster 1 indicated a continuous descent of
sharks from twilight until the end of the subsequent day. This cluster was infrequent, accounting
for 16.5% of the data, but was limited to the vicinity of Salas y Gómez Island (Figures 4.6 and
S4.11). Cluster 2 showed periodical descents to deeper depths both during the day and night-
time, with an occupation of shallower water during the twilight periods. This behaviour pattern
occurred at higher frequencies (83.5%) both in coastal and offshore areas.
Figure 4.5. Diel vertical movement patterns of the five fish tagged with MiniPat tags. Average night and twilight periods are indicated in dark and light grey, respectively.

62
Figure 4.6. Behaviour patterns (upper panel) for the vertical behaviour clusters and their spatial distribution (lower panel) in relation to the bathymetry of the study area. The EEZ and MMHMP borders are shown by white and violet lines, respectively. Clusters are based on the hourly depth averages of all available deployment days from the Galapagos sharks.
4.4.3 Fishing activities within the Easter Island Ecoregion
Analysis of fishing effort from AIS data showed a total of 194,541 detections in the area, of which
118,086 (60.7%) corresponded to active fishing activities. Virtually no fishing was detected within
the EEZ around Rapa Nui and Salas y Gómez Island (only 17 detection; 0.014%) (Figure 4.7).

63
However, high fishing pressure occurred in the surrounding waters outside of the EEZ, which
consisted of longliners from China, Vanuatu, and Spain (60.3%, 28.3%, and 11.2%, respectively).
China and Spain fishing effort were mainly recorded in the northern and southern limits of the
EEZ, meanwhile Vanuatu fishing effort was concentrated towards the south-western limit of the
MPA.

64
Figure 4.7. Commercial fishing effort by all as well as by each of the three major fishing nations (representing together 99.9% of all fishing detections in the area) between 2012-01-03 and 2016-12-31 in the study region as well as the borders of the EEZ (orange) and the MMHMP (violet). Fishing locations are based on daily AIS derived vessel positions with fishing hours > 0 at a 10th degree resolution that were gridded at a 5th degree resolution to illustrate effort densities (https://globalfishingwatch.org).

65
4.5 DISCUSSION
The current study is the first archival tagging study on C. galapagensis and S. lalandi in the Easter
Island Ecoregion. The insights gained on the habitat use and migratory behaviour of these top
predators will help to address the potential vulnerability of these species in the MMHMP.
4.5.1 Horizontal and vertical migratory behaviour
The geolocation estimates from the archival tagging data indicated that C. galapagensis and S.
lalandi remained largely in the waters around Salas y Gómez Island, even considering the
uncertainty in the estimated positions. This is consistent with earlier findings from the Hawaiian
Archipelago where top predators, such as jacks and sharks, were site-attached to islands or atolls
(Dale, Meyer, & Clark, 2011). However, all fish left the MMHMP at least once over the tracking
periods, travelling into unprotected waters. Although such excursions were not frequent and many
fish returned later to the island, we cannot exclude the possibility that this “homing behaviour” is
weaker during other seasons due to the limited time period of the current study (November-
February). In fact, one C. galapagensis (ID: 173480) travelled up to 139 km away from Salas y
Gómez Island, and 235.8 km between distant geolocations points. While sharks in this study were
only juveniles (< 200 cm TL; Wetherbee et al., 1996), such a behaviour has previously been
observed to be common in adults that are known to migrate into deeper oceanic waters
(Compagno, 1984; Wetherbee et al., 1996; Kohler et al., 1998; Lizardi et al. 2020). In this context,
the seamount chain along the Salas y Gómez Ridge may serve as stepping-stones for these
mobile predators as well as for other species (Friedlander et al., 2013). Significant genetic
differences have been detected for Galapagos sharks at both small and large scales (Pazmiño et
al., 2017; Pazmiño et al., 2018). Rapa Nui and Salas y Gómez Island are the southernmost remote
coral reef in the southern hemisphere, so further studies using genetic tools should be employed

66
to address the potential connectivity between Rapa Nui, Salas y Gómez Island and other islands
in the Pacific Ocean where these species are distributed.
Vertical behaviour data revealed that C. galapagensis and S. lalandi remained within the
epipelagic layer (0-200 m) but showed distinct diel vertical migration patterns during day and
night-time. These patterns were particularly consistent in the case of the yellowtail amberjack.
The one S. lalandi tagged during this study remained close to the surface during the daytime but
descended to deeper waters during night. Carcharhinus galapagensis showed a similar behaviour
as S. lalandi during night-time, but then either returned to the surface waters and then descended
during daytime or descended immediately at dawn to even deeper waters until twilight.
It is interesting to note that similar behaviour patterns have been found for other epipelagic
species such as oceanic whitetip sharks (Carcharhinus longimanus; Tolotti et al., 2017). This
similarity might be related to comparable feeding habits of pelagic species that are foraging on
epi- and mesopelagic prey. Although the type of habitat use remains unclear due the low sample
size and short duration of the study, these findings contribute to the development of management
strategies to minimize the fishing mortality of these species (e.g., by altering the timing and depth
of longline sets). For instance, hook depth of commercial tuna fishing fleets can be adjusted to
reduce the bycatch of sharks and other predators critical to local ecosystems (Beverly et al., 2008;
Zhu et al., 2012). Based on the vertical movements of C. galapagensis, longlines should be set
at depth deeper than 200 m to reduce incidental mortality outside the MMHMP and other oceanic
areas.
4.5.2 Fishing activities around Rapa Nui and Salas y Gómez
These results support previous findings that seamounts and oceanic islands attract and aggregate
highly migratory pelagic species (Holland et al., 1999; Worm, Lotze, & Myers, 2003; Garrigue et
al., 2015; Morato et al., 2010). Therefore, these areas are frequently exploited by commercial

67
fishing fleets (Pitcher et al., 2008; Morato et al., 2010). Analysis of fishing effort from AIS data
showed that fishing activities (longliners) concentrates in the surrounding waters outside of
Chile´s EEZ. However, it is important to note that AIS does not include data from the “dark fleet”,
small artisanal vessels, and other vessels that are not equipped with AIS technology (FAO, 2016;
Kroodsma et al., 2018). In addition, vessels may intentionally turn off their transponders, falsifying
position data or transmitting inadequate identification data in order to escape detection (McCauley
et al., 2016). While there are no means to verify the correct functioning of the vessel transponders
that fish around Chile’s EEZ at Rapa Nui and Salas y Gómez Island, from our AIS analysis it is
evident that they precisely identify the EEZ borders and with only a few exceptions do not enter
it. However, fishing effort is concentrated along the EEZ border, and among the highest fishing
hours registered are located south-east and south-west of MMHMP, with some Chinese vessels
apparently entering the EEZ to a limited extent (Figure 4.7). China and Spain are the most
prominent fishing nations in this area. These two countries have been recently characterized as
poor performing countries based on traceable fishing scores (Macfadyen et al., 2019). These poor
performances together with the limited surveillance in the area, and anecdotal observations by
locals regarding industrial vessels nearby the islands, make it questionable to what extent the AIS
data reflects the true fishing positions of these industrial fleets. The Easter Island Ecoregion also
has been described as an area where trans-shipment activities may be occurring (Boerder, Miller,
& Worm, 2018; Miller et al., 2018). Trans-shipment vessels are known to be associated with
longliners fishing on highly migratory species, such as, tunas, billfishes, and sharks in the high
seas (Miller et al., 2018). These practices increase the efficiency of fishing, especially on the high
seas; however, they can also contribute to illegal fishing and other criminal activities (Miller et al.,
2018; Rezac, 2018).
Illegal, unreported, and unregulated (IUU) fishing (which includes catches taken within an EEZ
and unreported catches) have a strong effect on stocks and their dependent ecosystem (Agnew

68
et al., 2010). Illegal fishing, vessels in violation of national laws or international obligations (FAO,
2001), usually occur along the borders of established MPAs (known as the “border effect”; Gribble
& Robertson, 1998) or at locations with weak fisheries management and control, where a small
number of patrol vessels are available (Agnew et al., 2010; Petrossian, 2015). In this regard, the
rapanui people regularly mention seeing the lights of industrial vessels at night close to Rapa Nui
and report longline fishing gear frequently washing up on the shores of Rapa Nui (Yáñez et al.,
2007; Hernández Mares, 2016; Thiel et al., 2018). A few incidents of illegal fishing within the
MMHMP have been documented (Muñoz, 2011; Friedlander et al., 2013). While there is a limited
capacity for naval patrol vessels and planes to enforce the MMHMP, it is clear that the protection
of this important refuge for oceanic species requires an effective ecosystem-based management
plan that implements strict controls on IUU fishing (Agnew et al., 2010). Countries with less
effective fisheries management measures and those with poor patrol capacity are more likely to
suffer from IUU fishing (Petrossian, 2015). Even though IUU fishing is a complex matter because
it involves international waters, several international measures have been adopted, such as The
International Plan of Action on Illegal, Unreported and Unregulated Fishing (Edeson, 2001), the
Agreement on Port State Measures (Flothmann et al., 2010), and The Project Catch (Detsis et
al., 2012), among others (see Lindley & Techera, 2017). Nevertheless, the distance of Salas y
Gómez Island from mainland Chile (~3600 km), and the virtual absence of Chilean industrial
fishing vessels inside the EEZ of Rapa Nui, limits the amount of IUU fishing from smaller
continental fishing boats. For example, the Juan Fernandez MPA is located only ~700 km from
mainland Chile and has significant legal and illegal fishing pressure inside the EEZ and around
the MPAs borders, much of it coming from Chilean vessels (Friedlander et al., 2017). Therefore,
while isolated areas seem more protected from IUU fishing because of their remoteness, they
also create the opportunity for larger fishing fleets to go undetected when entering MPAs, because
of the absence or limited surveillance and enforcement at these distant areas. This paradox has
recently been debated, pointing out the political advantages of closing isolated marine areas,

69
where little participation of local communities is anticipated and whose commercial interest is
outnumbered by foreign fishing vessels (Devillers et al., 2015; Jones & De Santo, 2016). Despite
being less susceptible to IUU fisheries than nearshore MPAs, isolated areas also account for
much higher biomass of sharks and jacks (Edgar et al., 2014), highlighting the need for accurate
ecological evaluations of the effectiveness of these remote MPAs.
4.5.3 Future Perspectives of the MMHMP
The implementation of management actions, such as MPAs, that do not reflect ecological patterns
and processes are destined to fail (Crowder & Norse, 2008). To achieve a realistic approach,
scientists and resource managers need to have a broad understanding of the movement
dynamics and habitat requirements when planning the spatial protection of a given species (Dale
et al., 2010, Carlisle et al. 2018). This study provides the first insights into the habitat use and
migratory behaviour of C. galapagensis and S. lalandi in one of the most isolated and
understudied areas of the Southeast Pacific Ocean. However, the small sample size, the inclusion
of only juvenile sharks, and the short duration of this study limits the ability to make broader
inferences about the application of this work. These limitations are common in electronic tagging
studies due to premature release and transmission failures (Williams, Nicol & Leroy, 2010;
Domingo et al., 2018; Hagihara et al. 2018). The high cost of satellite archival tags, which is
reflected in small sample sizes, and the logistical challenges associated with expeditions to
remote locations further constrain the number of animals that can be tagged and tracked (Carlisle
et al. 2018). Hence, future studies should attempt to obtain larger sample sizes, which include
individuals of different sizes and sexes to define the complete extent of species home ranges.
Additionally, sampling through the year should also be performed to avoid seasonal bias. For
instance, due to the premature release of the tags it is not possible to assure that the patterns
found here (horizontal and vertical movements) are repeated throughout the year or if they only
occur during the austral summer, as observed here. This is an important issue in determining their

70
entire home ranges since sharks shift their movement patterns seasonally in response to current
exposure, storms, and temperatures throughout the year (Lizardi et al. 2020), or for biological
reasons such as feeding and reproduction (e.g., Bessudo et al. 2011; Acuna et al. 2017). In this
sense, the intraspecific variability found in habitat use also requires larger sample sizes (Carlisle
et al., 2018).
Despite the limitations described above, the information generated by this study is essential for
the management of these species. Movement dynamics should be considered not only for MPA
implementation, but also for planning and designation of other MPAs, in order to define proper
limits and buffer zones to ensure effective protection of large mobile predators. The results
presented here show that top predators at Salas y Gómez have a strong fidelity to the island and
the surrounding seamounts. However, the home range of the juveniles C. galapagensis tagged
during this study, was larger than previously reported (up to 235.8 km vs. < 50 km, Wetherbee et
al., 1996), and extended beyond the boundaries of the MMHMP. The only S. lalandi tagged here
also extended beyond these borders over the tracking period. Based on these findings, the mayor
deficiency of the existing MMHMP is not the size of the protected area (150.000 km2), but the
location of the western border due to its close proximity to Salas y Gómez Island. This island has
been described as the biological hotspot in the area and the core of the MMHMP (Friedlander et
al. 2013). MPAs boundaries should be designed to reduce exposure of conservation targeted
species (edge porosity; Roberts, 2000). By knowing the movement patterns of these species, the
limits can easily be adapted (Kramer & Chapman, 1999).
Originally, the MMHMP borders were established to avoid conflict with the Rapa Nui EEZ
boundaries (SUBPESCA, 2010), and therefore with the local artisanal fishing activities coming
from Rapa Nui. In 2012, an initiative to expand the MMHMP from 150,000 km2 to 411,000 km2
to the west was intended to provide better protection for Salas y Gómez Island and the
surrounding seamounts. The enlarged no-take zone would have encompassed most of the EEZ

71
around Salas y Gómez Island and part of the EEZ of Rapa Nui. However, this initiative never
happened due to negative reactions from the local fishing community (Gaymer et al., 2013).
Finally, in 2017 an unprecedented participatory initiative conducted by the Chilean Government
and the Rapa Nui Development Commission, promoted the creation of a Multiple Uses Coastal
Marine Protected Area (MUMPA) around the entire EEZ of the Easter Island Ecoregion,
expanding the protection initially provided by the MMHMP. However, this new MPA did not
change the existing boundaries of the MMHMP; and while the MUMPA regulations permit
artisanal fishing, it strictly prohibits industrial fishing activities from both foreign and Chilean
vessels within its boundaries. It is hoped that the zoning process for the MUMPA that is currently
underway will adopt a precautionary approach, which accounts for the movement patterns of the
top predators identified here. A no-take zone west of the MMHMP is a possible way forward in
this regard.
The Salas y Gómez Ridge connects the fully protected MMHMP with unprotected Rapa Nui. At
Rapa Nui, individuals of C. galapagensis are caught periodically by fishermen who still use coastal
nets during night-time. Sharks are caught as bycatch and usually used as baits for economically
important species such as the endemic lobster Panulirus pascuensis. However, the last large
shark catch event that we know of occurred in early 2020, where more than 30 juvenile sharks
were caught and killed because, according to the fishermen, they represented a risk to tourists.
Even though the sharks tagged during this study did not leave the Salas y Gómez area, we believe
adults are capable of reaching Rapa Nui and near seamounts, probably using the ridge as
stepping-stones (Friedlander et al. 2013). Therefore, it is imperative that fishing regulations are
implemented at Rapa Nui to ensure the survival of this key species within the entire area.
Moreover, Lizardi et al. (2020) suggested the need for cooperation between countries due to the
occurrence of movement corridors (swimways) that connect the different populations of C.
galapagensis. Future studies should therefore focus on the current swimways that connect this

72
southeast hotspot with other islands (countries) in the Pacific Ocean, especially in light of the
recent arrival of new pelagic species to the area such as Triaenodon obesus (Morales et al.
2019b), Seriola rivoliana and Rhincodon typus (N. Morales unpublished data).
Despite their isolation, remote islands such as Salas y Gómez are becoming increasingly exposed
to a variety of anthropogenic stressors, such as overfishing and IUU fishing. This remoteness also
poses governance and enforcement challenges, especially for countries with limited resources
(Game et al., 2009). Despite these challenges, the MMHMP remains a healthy ecosystem with
an abundance of top predators that deserves maximum protection so as to preserve what is one
of the last relatively pristine areas in the world.

73
CHAPTER 5. GENETIC CONNECTIVITY OF THE GALAPAGOS SHARK,
CARCHARHINUS GALAPAGENSIS, IN THE EASTER ISLAND ECOREGION.
5.1 ABSTRACT
The Galapagos shark Carcharhinus galapagensis is the only resident species of shark inhabiting
Rapa Nui and Salas y Gómez Island, and therefore should be a priority for conservation. Recent
studies have suggested a genetic relationship between both islands. Determining the degree of
genetic connectivity between locations is important for developing effective conservation and
management strategies that aims to ensure gene flow, and thus prevent local extinctions. We
determined the degree of population connectivity of this species between Rapa Nui and Salas y
Gómez islands using variability of both genome-wide neutral Single Nucleotide Polymorphism
(13496 neutral SNP), and a section of the mitochondrial DNA (636 pb). The results showed no
evidence for genetic structure, thus suggesting only one genetic population occurring within the
Easter Island Ecoregion. Our findings were consistent with previous tagging data in the area
where individuals seemed capable of migrating between both islands. The results of the mtDNA
showed also a low genetic diversity in the Easter Island Ecoregion population when compared to
others in the Indo-Pacific Ocean, which may be a result of only a few colonization events due to
the isolation of this area. Ongoing studies in a global context will identify structure and global
patterns of colonization in the central-south Pacific. Our results also highlight the importance of
the Motu Motiro Hiva Marine Park (MMHMP) within the ecosystem, thus, future studies should
also be conducted on more species to determine the genetic relationship between these two very
isolated islands.

74
5.2 Introduction
Oceanic islands and seamounts are usually used as resting and/or feeding areas for mobile
species (Rogers 1994; Holland et al., 1999; Worm et al., 2003; Morato et al., 2010; Garrigue et
al., 2015), and thus facilitating the dispersion of organisms and connecting communities between
distant areas (Wilson & Kaufman 1987; Friedlander et al., 2013).
The Salas y Gómez Ridge extends 2232 km eastwards to the Nazca Seamount, where it merges
with the Nazca Ridge (Gálvez-Larach, 2009). Rapa Nui (Easter Island) and Salas y Gómez Island
are the only two places where this seamount chain rises above sea level (Ray et al., 2012). These
two islands are connected by several dozen seamounts, which can act as stepping-stones
(Newman & Foster 1983; Friedlander et al., 2013). Rapa Nui is one of the most isolated islands
in the Pacific Ocean (Fig. 5.1). Its historical overfishing, together with geographic characteristics
such as limited habitats, small size, and sub-tropical location has resulted in a low number of
shore species compared to other islands in the Pacific Ocean (Randall & Cea, 2011). In contrast,
Salas y Gómez Island is a small rocky island (0.15 km2) located 400 km east of Rapa Nui. The
waters of Salas y Gómez Island together with dozens of seamounts are currently part of the Motu
Motiro Hiva Marine Park (MMHMP), a 150,000 km2 no-take area that is characterized by a healthy
ecosystem dominated by top predator species (Friedlander et al., 2013).

75
Figure 5.1. Location of Rapa Nui and Salas y Gómez Island in relation to other islands in the Pacific Ocean. The pink polygon represents the Motu Motiro Hiva Marine Park (MMHMP) borders. Black circles represent the EEZ.
The Galapagos shark, Carcharhinus galapagensis, is one of the most common top predatory
species and the only resident shark species in both Rapa Nui and Salas y Gómez Island (Morales
et al., 2019a). It has a circumglobal but patchy distribution associated with warm and temperate
water and oceanic islands (Duffy, 2016; Kohler et al., 1998; Meyer et al., 2010; Wetherbee et al.,
1996). This species was recently assessed as a Least Concern species on the IUCN Red List,
since its population is suspected to be stable in large part of its distribution in the Pacific Ocean.
However, the habitat specificity of this species and their limited biological productivity make it
susceptible to local population reduction, especially at places where it has been under fishing
pressure (Kyne et al., 2020)

76
Studies on the genetic structure along its distribution suggest that this widely distributed species
shows at least two genetically discrete geographic groups (subpopulations): the east central
pacific (Mexico, and the east and west Galapagos Islands), and the west central pacific (Lord
Howe Island, Middleton Reef, Norfolk Island, Elizabeth Reef, Kermadec, Hawaii, and Southern
Africa) (Pazmiño et al., 2018). The study did not include samples from what is thought to be a
third subpopulation from the Atlantic Ocean (Kyne et al. 2020), and neither from the South-eastern
Pacific islands (Pazmiño et al., 2018). Using Baited Remote Underwater Videos System
(BRUVS), Morales et al. (2019a) identified a resident population inhabiting the Easter Island
Ecoregion, which is likely to be at risk due to direct and indirect fishing pressure (Friedlander et
al., 2013; Zylich et al., 2014). According to the rapanui, sharks used to be abundant in the past,
while they are hardly seen today. In comparison, at Salas y Gómez Island, C. galapagensis
accounts for 26% of the total biomass (Friedlander et al., 2013). Recent studies at Salas y Gómez
Island showed that even though this species is usually classified as reef associated (Compagno
1984; Kohler et al., 1988), juveniles are capable of traveling longer distances (up to 236 km,
Morales et al., in press; Chapter 4). This new record together with the recent finding of Lizardi et
al. (2020) that described a 3,000 km migration through the eastern tropical Pacific raises the
question about the genetic connectivity between Rapa Nui and Salas y Gómez Island.
Connectivity between these two islands has been poorly studied. Using genetic analysis and
oceanographic modelling, Meerhoff et al. (2018) and Valencia et al. (in press) found a lack of
genetic population structure but low connectivity in two benthic species, the endemic rapanui
lobster Panulirus pascuensis and the rudderfish Kyphosus sandwicensis, respectively. The low
levels of genetic connectivity were attributed to the low dispersal capacity of both adults and
larvae. However, further studies using more species are needed in order to reveal the connection
between these two isolated islands.

77
Therefore, the aim of this study was to determine the degree of population connectivity of C.
galapagensis between Rapa Nui and Salas y Gómez Island using two different genetic markers,
mitochondrial DNA (mtDNA) and Single Nucleotide Polymorphism (SNPs). Mitochondrial
genomes are based on maternity inheritance, which tells us about the historic population structure
of the species (Heuter et al., 2005). SNPs, on the other hand, provides both historic and
contemporary evidence including bi-parental inheritance (Allendorf et al., 2010). Determining the
degree of population connectivity among geographic areas, with the estimated location of genetic
breaks, allows determining an appropriate scale at which conservation and management
strategies should be applied to continue demographic exchange and prevent local extinctions
(Crowder & Norse 2008; Toonen et al., 2011). Additionally, estimating connectivity at these spatial
scales will allow us to determine the relevance of current marine protected areas like MMHMP,
and to recommend conservation strategies to manage important components of the marine
ecosystem in a sustainable way.
5.3 METHODS
5.3.1 Sample collection
Samples from Galapagos sharks were collected between 2015 and 2017 at Rapa Nui (muscle)
and Salas y Gómez (fin clip). Samples from Salas y Gómez were collected during two research
cruises in November 2015 (CIMAR 21) and 2017 (ESMOI-Save Our Seas Foundation). Samples
were labelled and stored in 95% ethanol.
5.3.2 DNA extraction and sequencing for SNP
Samples from Rapa Nui (n=24) and Salas y Gómez (n=29) were sent to the Diversity Arrays
Technology Pty Ltd (DArT, Canberra-Australia) (https://www.diversityarrays.com/) for DNA
extraction and sequencing using protocols available in Ren et al., (2015) and Marie et al., (2019).
78
5.3.3 SNPs filtering and Outlier detection
The genotype dataset was filtered to retain only the highly informative SNPs. We filtered data
according to the following criteria: Minor Allele Frequencies (MAF) > 1%, Hardy–Weinberg
Equilibrium (HWE), Linkage disequilibrium (LD), discarding monomorphic markers, and a call rate
threshold for both loci and individual of 90% using the dartR package in R software v0.98.977 (R
Core Team 2019; Jombart & Collins 2015).
To identify putative loci under selection and removal for demographic connectivity analyses, two
genome scan analysis based on the distribution of FST were run: OUTFLANK (Whitlock &
Lotterhos, 2015) and BayeScan v.2.1 (Foll & Gaggiotti, 2008) software using a false discovery
rate (FDR) of 0.05.
5.3.4 Genetic structure analysis
Pairwise FST was calculated using the package adegenet implemented in R software v0.98.977
(Jombart & Collins 2015) on neutral SNP loci to determine the level of gene flow and subdivision
between populations (Wright, 1965; Schneider et al., 2000). A Discriminant Analysis of Principal
Component (DAPC) was used to estimate the number of cluaters k with high probability in the
data pool. The function find.cluster on the adegent library was used to estimate the probable
number of clusters (k) within the samples. The calculation of k optimizes the variability between
groups and minimizes the variability within groups, thus exacerbating the occurrence of different
groups. The calculated different clustering solutions were then compared using Bayesian
Information Criterion (BIC) and the best solutions correspond to the lowest BICs. All analyses
were run using the adegenet package.

79
5.3.5 Mitocondrial (mtDNA) extraction, amplification, sequencing, and alignment
Samples from Rapa Nui (n=28) and Salas y Gómez (n=46) were analysed. DNA was extracted
with the Wizard Genomics DNA Purification Kit (PROMEGA®, Promega Inc., Madison, WI). The
control region (CR) was amplified through polymerase chain reaction (PCR), using species-
specific primers designed for Carcharhinidae using Primer3 software (Rozen & Skalersky, 2000)
based on the reference sequences of Carcharhinus leucas (NC_023522; Chen et al.,
2015) and Galeocerdo cuvier (KX858828; Bustamante et al, unpublished data). The CR
for Carcharhinus galapagensis was amplified with the primers: 41F 5’-ATT CTG CCT AAA CTG
CCC CC-3’ and 1190R 5’-AGC ATC TTC AGT GCC ATG CT-3’. An initial denaturing step was
carried out at 94°C for 2 minutes, followed by 30 cycles with an optimized profile of 30 seconds
at 94°C, 30 seconds at 59°C, and 1 minute at 72°C, followed by a final extension step of 2 minutes
at 72°C. The PCR products were sent to the Molecular Cloning Laboratory (MCLAB) in the USA
for Sanger 3730 XL sequencing with both the forward and reverse primers. The sequences were
edited and aligned using the GENEIOUS v10.0.8 software. The BLASTn tool was used in
GenBank to confirm the correct genetic identification of each species.
5.3.6 Haplotype & nucleotide diversities
Haplotype (h) and nucleotide (π) diversities were estimated as an indicator of genetic diversity of
the mitochondrial DNA. Both indices (h and π) and pairwise FST were calculated in Arlequin v3.5
(Excoffier et al., 2010). h and π where calculated following Nei (1989) and Nei & Li (1979)
equations, respectively.
80
5.4 RESULTS
5.4.1 SNPs analysis
A total of 32,660 SNPs were genotyped from the 53 individuals. After filtering, a total of 13,496
SNPs and 52 individuals were retained for analyses. Candidate loci under selection were not
detected with the software used and none of the loci showed significant departures from HWE.
Population genetic structure assessed by the FST index showed statistical significances (FST =
0.006; p < 0.0001). The DAPC analysis showed k= 1 as with the lowest BIC value, suggesting
the occurrence of only one population (Figure S5).
5.4.2 Mitochondrial DNA analysis
Mitochondrial control region sequences (636 pb) were analysed and four mtDNA haplotypes were
found in total. Haplotype 1 (H1) was the dominant in both locations and occurred in 64 individuals.
H3 was also shared between locations but it only occurred in 7 individuals. H2 and H4 were
unique to Salas y Gómez Island and Rapa Nui, respectively (Table 5.1; Fig. 5.2). Pairwise FST
values showed no evidence of population differences (FST = 0.00909; p-value = 0.29) suggesting
the presence of one population inhabiting both islands. Haplotype (h) and nucleotide (π)
diversities values are showed in Table 5.1.

81
Figure 5.2. Haplotype network based on the informative mtDNA control region. Each circle represents a different haplotype. Haplotype frequencies are relative to the size of the circles. The number of branches reflects the mutations between haplotypes. Red correspond to Rapa Nui and blue to Salas y Gómez.
Table 5.1. Genetic diversity parameters determined by mtDNA Control Region for Rapa Nui and Salas y Gómez Island.
Rapa Nui Salas y Gómez
Sample size (n) 24 29
Number of Haplotypes (H) 3 3
Polymorphic sites 4 3
Nucleotide diversity (π) 0.468 0.295
Haplotypes diversity (h) 0.315 0.204

82
5.5 DISCUSSION
The current study is the first use of genome-wide technology to investigate the genetic
connectivity of C. galapagensis within the Easter Island Ecoregion. The results suggest a high
genetic flow between islands, resulting in low genetic differentiation. These findings are also
consistent with the migratory capacity of C. galapagensis in the area (Morales et al., in press;
Chapter 4). The occurrence of only one population within the ecoregion has conservation and
management significance. Additionally, the absence of outlier loci in our samples could be the
result of the homogeneous conditions within the ecoregion, since outliers usually reflect local
adaptation (Candy et al., 2015).
5.5.1 Connectivity within the Easter Island Ecoregion
The main results obtained from SNPs suggest that individuals sampled at both islands belong to
the same population. This result is surprising and unexpected considering previous studies on
this species at smaller scales. Using SNPs, Pazmiño et al. (2017) found clear population structure
for Galapagos sharks within the Galapagos Archipelago. They suggested that the genetic
structure found there was the result of oceanic currents that created five bioregions within the
archipelago. Glynn et al. (2007) suggested that lower levels of differentiation between distant
locations was attributed to large dispersal capacities together with a lack of physical barriers.
Unlike the Galapagos Archipelago, Rapa Nui and Salas y Gómez Island share similar
oceanographic conditions, and therefore are part of the same ecoregion (Friedlander et al., 2013;
Andrade et al., 2014). With no mayor oceanic currents or any other oceanographic condition that
could divide the Easter Island Ecoregion, the only evident biogeographical barrier between both
islands is distance (~400 km). However, geographical distance by its own is a poor predictor of

83
genetic breaks (Tonnen et al. 2011). Moreover, the seamount chain between Rapa Nui and Salas
y Gómez Island, as part of the Salas y Gómez Ridge, might be efficiently acting as a corridor for
mobile species as previously suggested by Newman & Foster (1983) and Friedlander et al.,
(2013). Stepping-stone dispersal on this species has been suggested by Green et al. (2014).
Based on mtDNA, the authors analysed four locations within the south-west Pacific and found an
increase in the genetic differentiation over geographic distance.
The lack of genetic structure using mtDNA was also found for C. galapagensis in the southwest
Pacific (Green et al. 2014) and the Galapagos Archipelago (Pazmiño et al. 2017). These results
were attributed mainly to a low mutation rate in elasmobranch mtDNA (Martin et al. 1992),
together with a short distance between sampling sites (250 km max.) relative to the dispersion
capacity of this species (Kohler 1998). Usually, female Galapagos sharks display higher levels of
site-fidelity to shallower water, while males are less resident to reef systems (Kohler et al 1998;
Meyer et al 2010). However, in a recent study (Chapter 4) a juvenile female C. galapagensis was
documented travelling a lineal distance of 236 km, which greatly exceeded the previous estimate
of the movement for juveniles of this species (~50 km; Kohler et al 1998). In this sense, the low
genetic differentiation found here using both SNPs and mtDNA analysis might suggest a sufficient
rate of gene flow coming from both sexes, supporting the idea of a female exchange between
sites. Also, the low FST found in the mtDNA analyses, a valid indicator for female philopatry when
high (Heuter et al., 2005), supports the lack of genetic structure.
Genetic and spatial approaches are complementary in the study of population connectivity of
mobile species (Boulet et al., 2007). Genetic connectivity is defined as the degree to which gene
flow affect evolutionary processes within population (Lowe & Allendorf, 2010), and where only a
few migrants per generation are required to maintain apparent panmixia (Planes & Fauvelot,

84
2002). Demographic connectivity, on the other hand, is when intrinsic parameter of a single
population, such as population growth rates, are affected by migration (Lowe & Allendorf, 2010).
However, directionally biased movement can produce asymmetrical rates of interpopulation
dispersal (source vs. sink). According to Kawecki & Holt (2002), “sources” are those locations that
generate migrants, and “sinks” are the recipients of those migrants. The demographic contribution
of immigrates will depend among others on local density and competition for recruitment. When
these components are high in a population, we could expect a low contribution from immigrants,
and vice versa (Lowe & Allendorf, 2010). Salas y Gómez Island is a healthy ecosystem were the
Galapagos sharks and other top predator species are abundant. On the contrary, Rapa Nui has
experienced historical overfishing that has depleted top predator populations, including the
Galapagos shark (Friedlander et al., 2013). Due to the higher population density of Galapagos
sharks at Salas y Gómez Island, we could expect a higher dispersal rate going from there to Rapa
Nui. Meerhoff et al. (2018) and Valencia et al. (in review) identified a higher genetic flow rate for
the endemic rapanui lobster Panulirus pascuensis and the rudderfish Kyphosus sandwicensis,
from Salas y Gómez Island to Rapa Nui, caused mainly by currents direction. These findings
corresponded to the first real evidence of the MMHMP seeding Rapa Nui’s unprotected waters.
A similar patterns of gene flow from east to west was also described in the Hawaiian Archipelago
(Rivera et al. 2011). However, a broader and longer study is needed to address connectivity rates
properly. For instance, using satellite and telemetry tags placed at Rapa Nui and Salas y Gómez
Island we could determine if immigrants are moving between islands and define the direction of
its movement. Using a similar approach Lizardi et al. (2020) studied the dispersal of the
Galapagos shark between the oceanic islands in the central east Pacific. Additionally, studies that
include other species, should be conducted to determinate the genetic relationship of species

85
inhabiting the Easter Island Ecoregion and the importance of the MMHMP in the health of the
entire ecosystem.
5.5.2. Genetic diversity within the Easter Island Ecoregion
In terms of genetic diversity parameters, Galapagos sharks display high overall genetic diversity
(Pazmiño et al., 2018). Rapa Nui and Salas y Gómez Island have a genetic diversity similar to
west Galapagos and Mexico in terms of number of haplotypes. However, the haplotype (h) and
nucleotide (π) diversity are much lower than the ones recorded along its distribution in the Indo-
Pacific Ocean (see Pazmiño et al., 2018). The low genetic diversity found in this study might be
the result of only a few colonization events due to the isolation of this region (Fig. 5.1). The
opposite scenario occurred in the Hawaiian Archipelago where several probable events have
occurred from neighbouring locations, providing the Hawaiian population a higher genetic
diversity (Pazmiño et al., 2018). Therefore, future studies should examine the relationship of the
single population inhabiting the Easter Island Ecoregion with other locations in the Pacific Ocean
where Galapagos sharks occur. Such studies could also shed lights into the more probable route
from where Galapagos sharks and other mobile species colonized this area. For example, using
neutral and outlier SNPs, Pazmiño et al. (2018) suggested that the central-west Pacific population
of the Galapagos shark was colonized westward via Mexico. This route (from the Eastern Pacific)
is feasible due to the relatively shallow seamounts along the Nazca and Salas y Gómez Ridges
(Glynn et al., 2007). Oceanic islands and seamounts are important in connecting distant locations
for the Galapagos shark (Pazmiño et al., 2018). Additionally, the low genetic diversity found here,
when compared to other locations (see Pazmiño et al., 2018), implies that the Rapa Nui population
is younger than the others. Grant & Bowen (1998) suggest that populations with low h (< 0.5) and
low π (<0.5) might correspond to recent founder events by a single or a few mtDNA lineages.
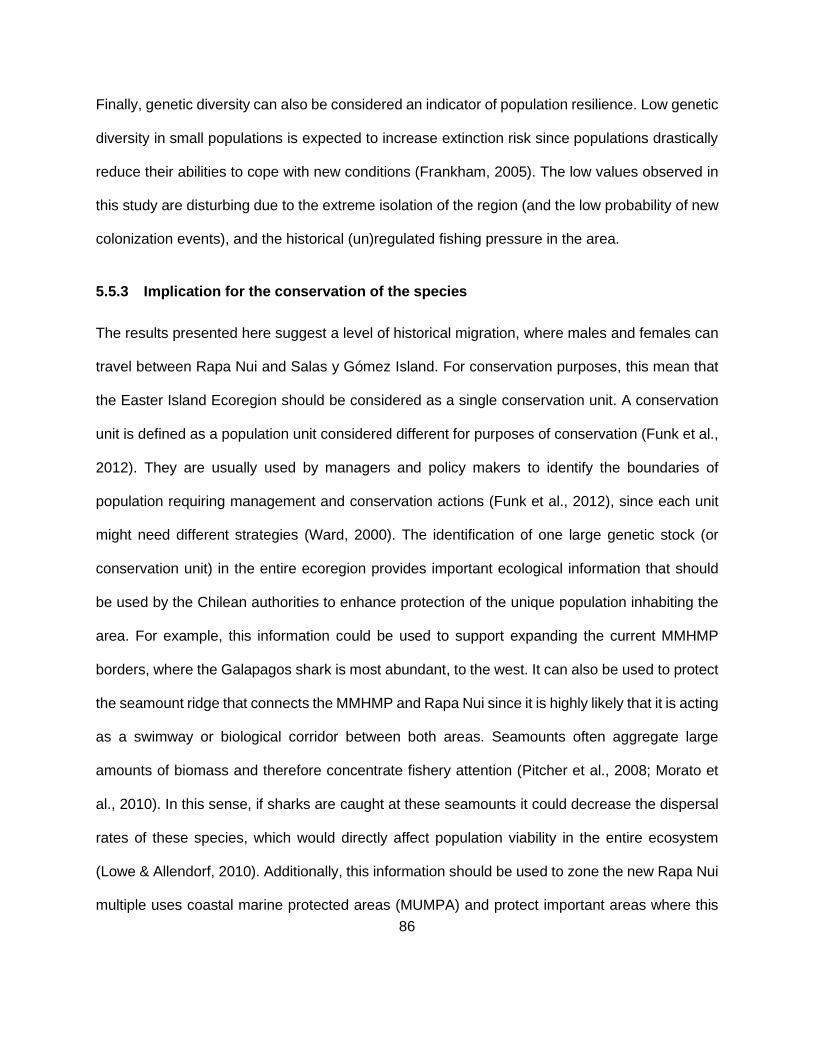
86
Finally, genetic diversity can also be considered an indicator of population resilience. Low genetic
diversity in small populations is expected to increase extinction risk since populations drastically
reduce their abilities to cope with new conditions (Frankham, 2005). The low values observed in
this study are disturbing due to the extreme isolation of the region (and the low probability of new
colonization events), and the historical (un)regulated fishing pressure in the area.
5.5.3 Implication for the conservation of the species
The results presented here suggest a level of historical migration, where males and females can
travel between Rapa Nui and Salas y Gómez Island. For conservation purposes, this mean that
the Easter Island Ecoregion should be considered as a single conservation unit. A conservation
unit is defined as a population unit considered different for purposes of conservation (Funk et al.,
2012). They are usually used by managers and policy makers to identify the boundaries of
population requiring management and conservation actions (Funk et al., 2012), since each unit
might need different strategies (Ward, 2000). The identification of one large genetic stock (or
conservation unit) in the entire ecoregion provides important ecological information that should
be used by the Chilean authorities to enhance protection of the unique population inhabiting the
area. For example, this information could be used to support expanding the current MMHMP
borders, where the Galapagos shark is most abundant, to the west. It can also be used to protect
the seamount ridge that connects the MMHMP and Rapa Nui since it is highly likely that it is acting
as a swimway or biological corridor between both areas. Seamounts often aggregate large
amounts of biomass and therefore concentrate fishery attention (Pitcher et al., 2008; Morato et
al., 2010). In this sense, if sharks are caught at these seamounts it could decrease the dispersal
rates of these species, which would directly affect population viability in the entire ecosystem
(Lowe & Allendorf, 2010). Additionally, this information should be used to zone the new Rapa Nui
multiple uses coastal marine protected areas (MUMPA) and protect important areas where this

87
species occurs (e.g., south coast; Morales et al. 2019a). Due to the unlikeliness of establishing
large no-take areas at Rapa Nui, we believe that the best approach for the conservation of the
Galapagos shark should be a mix of small no-take areas (e.g., nursery areas; Bonfil, 1997)
combined with conventional management strategies (e.g., fishing regulation) where the catch of
juveniles, and ideally adult sharks (Kinney & Simpfendorfer, 2008), is strictly prohibited. Similar
actions were taken in the Galapagos Archipelagos after a severe population reduction of sharks
(Wolff et al., 2012), which has recently led to one of the largest recorded shark biomasses
estimates anywhere (Salinas-de-León et al., 2016).
Sharks usually exert a top-down regulation in the ecosystem where they occur by controlling the
demography and behaviour of lower trophic levels (Roff et al., 2016). Even though there are
several shark species found around the Easter Island Ecoregion (Randal & Cea, 2011), the
Galapagos shark is the only resident species recorded in the area (Morales et al. 2019a).
Considering the occurrence of only one population within the Easter Island Ecoregion, and the
limited reproductive capacity of this species (Kyne et al. 2020), its rapid decline at Rapa Nui is
extremely disturbing and could have catastrophic consequences for the health of the entire
ecosystem if conservation actions are not taken in the near future.

88
CHAPTER 6. CONCLUSIONS
6.1 MAIN FINDINGS AND CONSERVATION IMPLICATIONS
The development of effective strategies for the management and conservation of key species
requires a broad knowledge of their ecology. This thesis represents the first investigation focused
on top predator species inhabiting the Easter Island Ecoregion. The use of BRUVS in Chapter 2
allowed me to determine which species inhabit Rapa Nui, what is their relative abundance, and
their general distribution. In this chapter I found that the south coast of the island is the main
habitat for top predators, where species such as jacks, tunas, and the Galapagos shark are
abundant year-round, and a possible nursery area for the Galapagos shark. I hypothesized that
the main reason for these differences is the exposure to high swells and winds coming from
Antarctica, and as a result, lower fishing pressure in this area. BRUVS also confirmed the
occurrence of a resident population of Galapagos sharks around Rapa Nui, which was thought to
be missing due to historical overfishing. This information is crucial for the establishment of the
new Rapa Nui MUMPA and the identification of priority areas for conservation (e.g., no-take
areas).
In Chapter 3, I determined the trophic role and defined the isotopic niche of predator species
observed in Chapter 2 and other species described in the area (Acanthocybium solandri,
Aulostomus chinensis, Carcharhinus galapagensis, Coryphaena hippurus, Katsuwonus pelamis,
Pseudocaranx dentex, Seriola lalandi, Kajikia audax, Thunnus albacares, Thyrsites atun). Using
δ13C and δ15N isotopic signatures, I discovered that not all large fishes should be classified as top
predators. The correct identification of top predator species contributes to the understanding of
Rapa Nui ecosystem dynamics and the identification of important conservation areas (e.g., within
the Rapa Nui MUMPA). My results also showed a high isotopic overlap between four species

89
(Acanthocybium solandri, Katsuwonus pelamis, Pseudocaranx dentex, and Thunnus albacares),
suggesting potential for interspecific competition of trophic resources. This chapter highlights the
need for multispecies studies to elucidate the tropho-dynamics of this isolated and largely
understudied ecosystem.
Identifying movement patterns of fish populations is essential for interpreting results of catch data
and underwater visual surveys, and to develop effective managements plans. These may be used
to infer changes in populations of reef fishes. In Chapter 4 I studied the movement patterns of the
most abundant top predators within the MMHMP, the Galapagos shark and the yellowtail
amberjack. Results showed that even though all individuals spent most of the time within the limits
of the marine park, all of them crossed the borders during portions of the tracking period. My
results also indicated that the travel distance of juvenile Galapagos sharks in open waters is much
higher than noted in previous studies. This means that the Galapagos shark may not be a strictly
reef-associated species as previously thought, which could also explain its wide distribution.
Additionally, I used data from the Automatic Identification System (https://globalfishingwatch.org)
to study fishing activities within Chile’s Exclusive Economic Zone (EEZ) and to put into
perspective the potential threat that mobile species are exposed to from these fishing activities.
No fishing activities were recorded inside the Chilean EEZ from 2012 to 2016. However, it is
evident that fishing vessels accurately identified the EEZ border, but it is unclear to what extent
they adhered to these boundaries. Summarizing, these results supports the idea of expanding
the current borders of the MMHMP to the west in order to improve protection of highly mobile
species. I also suggest the implementation of a better fisheries monitoring program within the
MMHMP, since the remoteness of this area increases the opportunity for illegal fishing without
punishment. Currently, only one local patrol boat “Tokerau” is available in the area. Unfortunately,
this patrol boat does not have the capacity to intercept vessels engaged in suspicious activities

90
or to reach, and therefore protect, the MMHMP. Further, even though the Chilean navy runs two
oceanic fishing enforcement operations twice a year, including an offshore patrol vessel and a
radar equipped plane, this is not enough to have a dissuasive presence in the region.
It is well known that connectivity studies should include both tracking and genetic studies. While
tracking studies provide information on where species move, genetic studies determine if those
species are reproducing (gene flow) within those areas. In Chapter 5 I studied the genetic
connectivity of the Galapagos shark between Rapa Nui and Salas y Gómez islands. Genetic
markers (SNPs and mtDNA) suggest that individuals at both islands are part of the same
population. These results are unexpected since genetic structure has been demonstrated in
smaller scales (e.g., within the Galapagos Archipelago; Pazmiño et al. 2017) for this species.
However, the lack of geographic barriers and the occurrence of a seamount chain between
islands, which may serve as stepping-stones, could help to explain my results. Additionally,
results from Chapter 5 were consistent with the findings of Chapter 4, suggesting that both female
and male Galapagos sharks can travel between islands. My results highlight the important role of
the MMHMP in keeping the entire ecosystem healthy.
Three additional papers have been published (Easton et al., 2016; Thiel et al., 2018; and Morales
et al., 2019b), and two more are being prepared regarding large fishes of Rapa Nui. In Easton et
al. (2016), we described the biodiversity of deeper areas, including the top predator species
around Rapa Nui. In Thiel et al. (2018), we showed how marine species interact with marine
plastic pollution and demonstrated how plastic pollution threatens top predator species. Finally,
in Morales et al. (2019b), we recorded the first observation of the whitetip reef shark Triaenodon
obesus at Rapa Nui. Additionally, two other publication are being prepared on the first records of
Seriola rivoliana, and Rhincodon typus on Rapa Nui. The increasing new records in the area

91
highlights the scarce knowledge of the local biodiversity and the need for longer monitoring
programs in the entire region.
6.2 LIMITATION OF THE STUDY AND SUGGESTIONS FOR FUTURE RESEARCH
DIRECTIONS
The most important limitation of working at the Easter Island Ecoregion is the isolation of the area.
Its remoteness from the mainland increases the general costs of research, which at the same
time is reflected in a limited sampling effort. For example, in Chapter 3 a more constant sampling
effort would have increased the low n of some species and allowed me to examine more specific
patterns such as seasonal differences in trophic dynamics. However, the chapter most affected
by economic constrains was Chapter 4. The extreme remoteness of Salas y Gómez Island (~ 400
km from Rapa Nui) limited the field investigation to only two short campaigns, which allowed for
the sampling of only a few individuals (see discussion of Chapter 4 for more details). Another
reason for the limited sampling effort is the exposure of the study area to unfavorable weather
conditions. This resulted in a constant uncertainty in field work and in the ability of meeting my
objectives. For example, in Chapter 2, the sampling effort was affected by the weather, as certain
areas could not be sampled during winter months due to strong wind and sea conditions.
Despite the limitations described above, this thesis represents a baseline for the development of
more effective management and conservation strategies for the protection of top predator species
in the Easter Island Ecoregion. However, it is worth emphasizing that this baseline does not
represent the pristine state of the Rapa Nui ecosystem. On the contrary, what we see now
corresponds to a highly impacted state or a “shifted baseline” as defined by Pauly (1995) and
Pinnegar & Engelh (2008). In this sense, if the Rapa Nui ecosystem has shifted due to historical
overfishing, then perhaps we need to focus our attention on a less impacted “control” system such

92
as the Salas y Gómez ecosystem as a reference for a past ecological state. “There (Salas y
Gómez Island) you will see how Rapa Nui used to be before the first settlement arrived here
(Rapa Nui) … You will see how the world was 2,000 years ago” (Edmundo Edwards from The
Lost Sharks of Rapa Nui National Geographic documentary). That said and based on the results
and the conclusion described above, I propose:
• A long-term monitoring programs should occur at Rapa Nui and Salas y Gómez Island. In
Chapter 2 BRUVS are shown as a reliable technique to study the marine biodiversity in
the area. In this regard, longer-term temporal and spatial surveys should include
mesophotic zones and seamounts to understand the patchy occurrence and distribution
of some of the species described in Chapter 2.
• A tropho-dynamic comparison between Rapa Nui and Salas y Gómez should be
conducted. Due to the large differences in the fish assemblages (e.g., top predator
abundance), considerable variations in how these ecosystems are structured might be
found.
• An extensive tagging (satellite and telemetry tags) program that includes adults of the
Galapagos shark and other mobile species at both islands should be implemented. The
use of a mix of tagging studies together with a monitoring program would provide important
short- and long-term information on the habitat use of key species. That information could
be then used to design more effective conservation measures on the MPAs.
• The expansion westward of the current borders of the MMHMP to better protect the mobile
species of Salas y Gómez Island. In this regard, a more constant and efficient surveillance
of these distant areas is imperative to prevent illegal fishing within the EEZ and the
MMHMP. Chapter 4 shows that even though no fishing activity inside the MMHMP or the

93
EEZ was recorded, fishing vessels could go undetected since the legal borders are an
obstacle easy to circumvent and vessel monitoring systems can be turned off.
A broad genetic study to compare present results with other locations where Galapagos
sharks occurs is needed. This will allow for a better understanding of how colonization
processes occurred in this isolated area. Easter Island ecoregion can be considered as an
oasis of life in the middle of the Pacific Ocean. Most probably due to its isolated location, this
area is widely understudied, when compared to other Polynesian islands. Overall, this thesis
lays the foundation for top predator species research, development of science-based
management approaches and effective conservation strategies in the Easter Island
ecoregion. Knowing the species composition of this ecologically important trophic group,
together with the understanding of how these species use the few available habitats in the
ecoregion, is essential for identifying important areas for conservation. This research also
provides scientific evidence for the existence of a single widespread population of the
Galapagos shark within the area, which would result in a single conservation unit for
management purposes. I hope that these findings encourage other researchers to explore
some of the several related topics that remain unsolved in the area.

94
REFERENCES
Aburto, J. A., & Gaymer, C. F. (2018). Struggling with social-ecological mismatches in marine management
and conservation at Easter Island. Marine Policy, 92: 21-29.
Aburto, J. A., Gaymer, C. F., & Cundill, G. (2017). Towards local governance of marine resources and
ecosystems on Easter Island. Aquatic Conservation: Marine and Freshwater Ecosystems, 27: 353-371.
Aburto, J. A., Gaymer, C. F., Haoa, S., & González, L. (2015). Management of marine resources through a
local governance perspective: Re-implementation of traditions for marine resource recovery on Easter
Island. Ocean & Coastal Management, 116: 108-115.
Acuña, E., Gaymer, C., Hinojosa, I., Aburto, J., Cortes, A., Sfeir, R., … Canales, C. (2018). Informe Pre-
final. Proyecto FIPA 2016-35. Estudio biológico pesquero y evaluación del estado de situación de las
pesquerías costeras de importancia para Isla de Pascua. 360 pp.
Acuna-Marrero, D., Smith, A. N., Hammerschlag, N., Hearn, A., Anderson, M. J., Calich, H., … Salinas-de-
León, P. (2017). Residency and movement patterns of an apex predatory shark (Galeocerdo cuvier) at the
Galapagos Marine Reserve. PLOS ONE, 12: e0183669.
Acuña-Marrero, D., Smith, A. N., Salinas-de-León, P., Harvey, E. S., Pawley, M. D., & Anderson, M. J.
(2018). Spatial patterns of distribution and relative abundance of coastal shark species in the Galapagos
Marine Reserve. Marine Ecology Progress Series, 593: 73-95.
Admiraal, J. F., Wossink, A., de Groot, W. T., & de Snoo, G. R. (2013). More than total economic value:
How to combine economic valuation of biodiversity with ecological resilience. Ecological Economics, 89:
115-122.
Agnew, D. J., Pearce, J., Pramod, G., Peatman, T., Watson, R., Beddington, J. R., & Pitcher, T. J. (2010).
Estimating the worldwide extent of illegal fishing. PLOS ONE, 4(2), e4570.
Allendorf, F. W., Hohenlohe, P. A., & Luikart, G. (2010). Genomics and the future of conservation genetics.
Nature Reviews Genetics, 11: 697–709. doi:10.1038/nrg2844
Almany, G. R. (2004). Does increased habitat complexity reduce predation and competition in coral reef
fish assemblages? Oikos, 106: 275-284.
Anderson, M. J., Gorley, R. N., & Clarke, K. R. (2008). PERMANOVA+ for Primer. Plymouth, UK: Primer-
E.
Anderson, M.J., & Millar, R.B. (2004). Spatial variation and effects of habitat on temperate reef fish
assemblages in northeastern New Zealand. Journal of Experimental Marine Biology and Ecology, 305:
191–221

95
Andrade, I., Hormazábal, S., & Correa-Ramírez, M. (2014). Time-space variability of satellite chlorophyll-a
in the Easter Island Province, southeastern Pacific Ocean. Latin American Journal of Aquatic Research,
42: 871-887.
Andrew, N. L., & Mapstone, B. D. (1987). Sampling and the description of spatial pattern in marine ecology.
Oceanography and Marine Biology, 25: 39–90.
Arana, P. M. (2014). Actividades pesqueras realizadas en la antigüedad en la Isla de Pascua. Latin
American Journal of Aquatic Research, 42: 673-689.
Arkema, K. K., Abramson, S. C., & Dewsbury, B. M. (2006). Marine ecosystem‐based management: from
characterization to implementation. Frontiers in Ecology and the Environment, 4: 525-532.
Asher, J., Williams, I. D., & Harvey, E. S. (2017). An Assessment of Mobile Predator Populations along
Shallow and Mesophotic Depth Gradients in the Hawaiian Archipelago. Scientific Reports, 7.
Barley, S. C., Meekan, M. G., & Meeuwig, J. J. (2017). Diet and condition of mesopredators on coral reefs
in relation to shark abundance. PLOS ONE, 12: e0165113.
Bauer R. (2018a) RchivalTag: Analyzing Archival Tagging Data. R package version 0.0.8. https://cran.r-
project.org/package=RchivalTag
Bauer, R. K, Forget, F., & Fromentin, J. M. (2015) Optimizing PAT data transmission: Assessing the
accuracy of temperature summary data to estimate environmental conditions. Fisheries Oceanography, 24:
533–539.
Bauer, R. K., Fromentin, J. M., Demarcq, H., & Bonhommeau, S. (2017). Habitat use, vertical and horizontal
behaviour of Atlantic bluefin tuna (Thunnus thynnus) in the Northwestern Mediterranean Sea in relation to
oceanographic conditions. Deep Sea Research Part II: Topical Studies in Oceanography, 141: 248-261.
Bauer, R.K. (2020a). RchivalTag: Analyzing Archival Tagging Data. R package version 0.1.2. https://cran.r-
project.org/package=RchivalTag.
Bauer, RK. (2018b) oceanmap: Data. A Plotting Toolbox for 2D Oceanographic Data. R package version
0.1.0. https://cran.r-project.org/package=oceanmap
Bearhop, S., Adams, C. E., Waldron, S., Fuller, R. A., & MacLeod, H. (2004). Determining trophic niche
width: a novel approach using stable isotope analysis. Journal of Animal Ecology, 73: 1007-1012.
Bennett, M.B., Gordon, I. & Kyne, P.M. (SSG Australia & Oceania Regional Workshop, March 2003) 2003.
Carcharhinus galapagensis. The IUCN Red List of Threatened Species 2003: e.T41736A10550977.
http://dx.doi.org/10.2305/IUCN.UK.2003.RLTS.T41736A10550977.en. Downloaded on 07 July 2019.
Bessudo, S., Soler, G. A., Klimley, P. A., Ketchum, J., Arauz, R., Hearn, A. et al. (2011). Vertical and
horizontal movements of the scalloped hammerhead shark (Sphyrna lewini) around Malpelo and Cocos

96
Islands (Tropical Eastern Pacific) using satellite telemetry. Boletín de Investigaciones Marinas y Costeras-
INVEMAR, 40: 91-106.
Beverly, S., Curran, D., Musyl, M., & Molony, B. (2009). Effects of eliminating shallow hooks from tuna
longline sets on target and non-target species in the Hawaii-based pelagic tuna fishery. Fisheries Research,
96: 281-288.
Bishop, J. (2006). Standardizing fishery-dependent catch and effort data in complex fisheries with
technology change. Reviews in Fish Biology and Fisheries, 16: 21-38.
Block, B. A., Jonsen, I. D., Jorgensen, S. J., Winship, A. J., Shaffer, S. A., Bograd, S. J., … Costa, D. P.
(2011). Tracking apex marine predator movements in a dynamic ocean. Nature, 475: 86.
Boerder, K., Miller, N. A., & Worm, B. (2018). Global hot spots of transshipment of fish catch at sea. Science
Advances, 4: eaat7159.
Bolnick, D. I., Ingram, T., Stutz, W. E., Snowberg, L. K., Lau, O. L., & Paull, J. S. (2010). Ecological release
from interspecific competition leads to decoupled changes in population and individual niche width.
Proceedings of the Royal Society B: Biological Sciences, 277: 1789-1797.
Bond, A. L., Jardine, T. D., & Hobson, K. A. (2016). Multi‐tissue stable‐isotope analyses can identify dietary
specialization. Methods in Ecology and Evolution, 7: 1428-1437.
Bonfil, R. (1997). Status of shark resources in the southern Gulf of Mexico and Caribbean: implications for
management. Fishery Research, 29: 101–117
Boonzaier, L., & Pauly, D. (2016). Marine protection targets: An updated assessment of global progress.
Oryx, 50: 27–35. doi:10.1017/S0030605315000848
Botsford, L. W., Micheli, F., & Hastings, A. (2003). Principles for the design of marine reserves. Ecological
Applications, 13: 25-31.
Boulet, M., Couturier, S., Cote, S. D., Otto, R. D., & Bernatchez, L. (2007). Integrative use of spatial, genetic,
and demographic analyses for investigating genetic connectivity between migratory, montane, and
sedentary caribou herds. Molecular Ecology, 16: 4223-4240.
Bradford, R., Hobday, A. J., Evans, K., & Lansdell, M. (2009). CMAR code of practice for tagging marine
animals. CSIRO Marine and Atmospheric Research.
Branstetter, S. (1990). Early life-history implications of selected carcharhinoid and lamnoid sharks of the
northwest Atlantic. NOAA Tech. Rep. NMFS 90: 17-28.
Brill, R., Lutcavage, M., Metzger, G., Bushnell, P., Arendt, M. D., Lucy, J., ... Foley, D. (2002). Horizontal
and vertical movements of juvenile bluefin tuna (Thunnus thynnus), in relation to oceanographic conditions
of the western North Atlantic, determined with ultrasonic telemetry. Fishery Bulletin, 100: 155.

97
Brooks, E. J., Sloman, K. A., Liss, S., Hassan-Hassanein, L., Danylchuk, A. J., Cooke, S. J., … Suski, C.
D. (2011b). The stress physiology of extended duration tonic immobility in the juvenile lemon shark,
Negaprion brevirostris (Poey 1868). Journal of Experimental Marine Biology and Ecology,409: 351–360.
doi:10.1016/j.jembe.2011.09.017
Brooks, E. J., Sloman, K. A., Sims, D. W., & Danylchuk, A. J. (2011a). Validating the use of baited remote
underwater video surveys for assessing the diversity, distribution and abundance of sharks in the Bahamas.
Endangered Species Research, 13: 231-243.
Bugoni, L., McGill, R. A., & Furness, R. W. (2010). The importance of pelagic longline fishery discards for
a seabird community determined through stable isotope analysis. Journal of Experimental Marine Biology
and Ecology, 391: 190-200.
Candy, J. R., Campbell, N. R., Grinnell, M. H., Beacham, T.D., Larson, W.A., & Narum, S. R. (2015).
Population differentiation determined from putative neutral and divergent adaptive genetic markers in
Eulachon (Thaleichthys pacificus, Osmeridae), an anadromous Pacific smelt. Molecular Ecology
Resources, 15:1421–1434.
Cappo, M., Harvey, E., Malcom, H., & Speare, P. (2003). Potential of video techniques to monitor diversity,
abundance and size of fish in studies of Marine Protected Areas. In: Beumer, J., Grant, A., Smith, D. (Eds.),
Aquatic Protected Areas — What Works Best and How do We Know? World Congress on Aquatic Protected
Areas. Australian Society for Fish Biology, Cairns, Australia. 455–464.
Cárcamo, P. F., Cortéz, M., Ortega, L., Squeo, F. A., & Gaymer, C. F. (2011). Crónica de un conflicto
anunciado: Tres centrales termoeléctricas a carbón en un hotspot de biodiversidad de importancia mundial.
Revista Chilena de Historia Natural. 84: 171-180.
Carlisle, A. B., Tickler, D., Dale, J. J., Ferretti, F., Curnick, D. J., Chapple, T. K. et al. (2019). Estimating
space use of mobile fishes in a large marine protected area with methodological considerations in acoustic
array design. Frontiers in Marine Science, 6, 256.
Carr, L. A., Stier, A. C., Fietz, K., Montero, I., Gallagher, A. J., & Bruno, J. F. (2013). Illegal shark fishing in
the Galapagos Marine Reserve. Marine Policy, 39: 317-321.
Chapman, C. J., Johnston, A. D. F., Dunn, J. R., & Creasey, D. J. (1974). Reactions of fish to sound
generated by diver’s open-circuit underwater breathing apparatus. Marine Biology, 27: 357–366.
Charrad, M., Ghazzali, N., Boiteau, V., & Niknafs, A. (2014). NbClust: An R Package for Determining the
Relevant Number of Clusters in a Data Set. Journal of Statistical Software, 61: 1–36. Retrieved from
http://www.jstatsoft.org/v61/i06/
Charton, J. G., Williams, I. D., Ruzafa, A. P., Milazzo, M., Chemello, R., Marcos, C ... & Riggio, S. (2000).
Evaluating the ecological effects of Mediterranean marine protected areas: habitat, scale and the natural
variability of ecosystems. Environnemental Conservation, 27: 159-178.

98
Chen, X., Liu, M., Peng, Z., & Shi, X. (2015). Mitochondrial genome of the bull shark Carcharhinus leucas
(Carcharhiniformes: Carcharhinidae). Mitochondrial DNA, 26: 813-814.
Cherel Y, Hobson KA (2007) Geographical variation in carbon stable isotope signatures of marine
predators: a tool to investigate their foraging areas in the Southern Ocean. Molecular Ecology Resource,
329: 281–287.
Cherel, Y., Ducatez, S., Fontaine, C., Richard, P., & Guinet, C. (2008). Stable isotopes reveal the trophic
position and mesopelagic fish diet of female southern elephant seals breeding on the Kerguelen Islands.
Marine Ecology Progress Series, 370: 239-247.
Churchill, D. A., Heithaus, M. R., & Grubbs, R. D. (2015). Effects of lipid and urea extraction on δ15N
signatures of deep-sea sharks and hagfish: Can mathematical correction factors be generated?. Deep Sea
Research Part II: Topical Studies in Oceanography, 115: 103-108.
Clarke, K. R., & Gorley, R. N. (2006). PRIMER V6: user manual-tutorial. Plymouth Marine Laboratory.
Cole, R. G. (1994). Abundance, size structure, and diver-oriented behaviour of three large benthic
carnivorous fishes in a marine reserve in northeastern New Zealand. Biology Conservation, 70: 93–99.
Coles, S. L., & Tarr, B. A. (1990). Reef fish assemblages in the western Arabian Gulf: a geographically
isolated population in an extreme environment. Bulletin of Marine Science, 47: 696-720.
Compagno, L. J. (1984). Sharks of the world: an annotated and illustrated catalogue of shark species known
to date (No. QL 638.9. C65).
Connell, S.D., & Jones, G.P. (1991). The influence of habitat complexity on postrecruitment processes in a
temperate reef fish population. Journal of Experimental Marine Biology and Ecology, 151: 271–294
Cortés, E., Arocha, F., Beerkircher, L., Calvalho, F., Domingo, A., Heupel, M., … Simpfendorfer, C. (2010).
Ecological risk assessment of pelagic sharks caught in Atlantic pelagic longline fisheries. Aquatic Living
Resources, 23: 25–34. doi: 10.1051/alr/2009044
Costello, M. J., & Ballantine, B. (2015). Biodiversity conservation should focus on no-take Marine Reserves:
94% of Marine Protected Areas allow fishing. Trends in Ecology and Evolution, 30: 507–509.
doi:10.1016/j.tree.2015.06.011
Crowder, L., & Norse, E. (2008). Essential ecological insights for marine ecosystem-based management
and marine spatial planning. Marine policy, 32: 772-778.
Curley, B. G., Kingsford, M. J., & Gillanders, B. M. (2003). Spatial and habitat-related patterns of temperate
reef fish assemblages: implications for the design of Marine Protected Areas. Marine and Freshwater
Research, 53: 1197-1210.

99
Dale, J. J., Meyer, C. G., & Clark, C. E. (2011). The ecology of coral reef top predators in the
Papahānaumokuākea Marine National Monument. Journal of Marine Biology. 14 pp.
doi:10.1155/2011/725602.
Daneri, G., Dellarossa, V., Quiñones, R., Jacob, B., Montero, P., & Ulloa, O. (2000) Primary production and
community respiration in the Humboldt Current System off Chile and associated oceanic areas. Marine
Ecology Progress Series. 197: 41–49.
Daskalov, G. M., Grishin, A. N., Rodionov, S., & Mihneva, V. (2007). Trophic cascades triggered by
overfishing reveal possible mechanisms of ecosystem regime shifts. Proceedings of the National Academy
of Sciences, 104: 10518-10523.
De Girolamo, M., & Mazzoldi, C. (2001). The application of visual census on Mediterranean rocky habitats.
Marine Environmental Research, 51: 1-16.
DeMartini, E. E., & Friedlander, A.M. (2006). Predation, endemism, and related processes structuring
shallow-water reef fish assemblages of the NWHI. Atoll Research Bulletin, 543: 237–256.
Detsis, E., Brodsky, Y., Knudtson, P., Cuba, M., Fuqua, H., & Szalai, B. (2012). Project catch: a space
based solution to combat illegal, unreported and unregulated fishing: Part I: vessel monitoring system. Acta
Astronautica, 80: 114-123.
Devillers, R., Pressey, R. L., Grech, A., Kittinger, J.N., Edgar, G.J., Ward, T., & Watson, R. (2015).
Reinventing residual reserves in the sea: are we favouring ease of establishment over need for protection?
Aquatic Conservation: Marine and Freshwater Ecosystems,25: 480–504.
http://dx.doi.org/10.1002/aqc.2445.
DiSalvo, L.H., Randall, J.E., & Cea, A., (1988). Ecological reconnaissance of the Easter Island sublittoral
marine environment. National Geographic Research, 4: 451-473.
Domingo, A., Casaca Santos, C., Carlson, J., Natanson, L., Cortés, E., Mas, F., … Coelho, R. (2018). Post-
release mortality of shortfin mako in the Atlantic using satellite telemetry: preliminary results.
Dorman, S. R., Harvey, E. S., & Newman, S. J. (2012). Bait effects in sampling coral reef fish assemblages
with stereo-BRUVS. PLOS ONE, 7: e41538.
Duffy, C. A. (2016). Misidentification of Carcharhinus galapagensis (Snodgrass & Heller, 1905) in the
Southwest Pacific Ocean. Zootaxa, 4132: 97-106.
Dulvy, N. K., Fowler, S. L., Musick, J. A., Cavanagh, R. D., Kyne, P. M., Harrison, L. R., ... Pollock, C. M.
(2014). Extinction risk and conservation of the world’s sharks and rays. Elife,3: e00590.
Easton, E. E., Gaymer, C. F., Friedlander, A. M., & Herlan, J. J. (2018). Effects of herbivores, wave
exposure and depth on benthic coral communities of the Easter Island ecoregion. Marine and Freshwater
Research, 69: 997-1006. doi.org/10.1071/MF17064

100
Easton, E. E., Sellanes, J., Gaymer, C. F., Morales, N., Gorny, M., & Berkenpas, E. (2017). Diversity of
deep-sea fishes of the Easter Island Ecoregion. Deep Sea Research Part II: Topical Studies in
Oceanography, 137: 78-88.
Edeson, W. (2001). The international plan of action on illegal unreported and unregulated fishing: The legal
context of a non-legally binding instrument. The international journal of marine and coastal law, 16: 603-
623.
Edgar, G. J., Stuart-Smith, R. D., Willis, T. J., Kininmonth, S., Baker, S. C., Banks, S., … Thomson, R. J.
(2014). Global conservation outcomes depend on marine protected areas with five key features. Nature,
506, 216–220. doi:10.1038/nature13022
Emslie, M. J., Cheal, A. J., MacNeil, M. A., Miller, I. R., & Sweatman, H. P. (2018). Reef fish communities
are spooked by SCUBA surveys and may take hours to recover. PeerJ, 6: e4886.
Espinoza, M., Cappo, M., Heupel, M. R., Tobin, A. J., & Simpfendorfer, C. A. (2014). Quantifying shark
distribution patterns and species-habitat associations: implications of marine park zoning. PLOS ONE, 9:
e106885.
Estrada, J. A., Rice, A. N., Lutcavage, M. E., & Skomal, G. B. (2003). Predicting trophic position in sharks
of the north-west Atlantic Ocean using stable isotope analysis. Journal of the Marine Biological Association
of the United Kingdom, 83: 1347-1350.
Estrada, J. A., Rice, A. N., Natanson, L. J., & Skomal, G. B. (2006). Use of isotopic analysis of vertebrae in
reconstructing ontogenetic feeding ecology in white sharks. Ecology, 87: 829-834.
FAO, 2001. International Plan of Action to Prevent, Deter and Eliminate Illegal, Unreported and Unregulated
Fishing. FAO, Rome, pp. 1–24
FAO. (2016). The State of World Fisheries and Aquaculture 2016. Contributing to food security and nutrition
for all. Rome.200 pp.
FAO. (2018). The State of World Fisheries and Aquaculture. (SOFIA): Meeting the sustainable development
goals, Rome: Food and Agriculture Organization, 2018.
Felley, J. D., & Felley, S. M. (1986). Habitat partitioning of fishes in an urban, estuarine bayou. Estuaries,
9: 208–18.
Fernández, M., Pappalardo, P., Rodríguez-Ruiz, M.C. & Castilla, J.C., (2014). Síntesis del estado del
conocimiento sobre la riqueza de especies de macroalgas, macroinvertebrados y peces en aguas costeras
y oceánicas de Isla de Pascua e Isla Salas y Gómez. Latin American Journal of Aquatic Research, 42: 760-
802.
Ferreira, L. C., Thums, M., Heithaus, M. R., Barnett, A., Abrantes, K. G., Holmes, B. J., ... Vaudo, J. (2017).
The trophic role of a large marine predator, the tiger shark Galeocerdo cuvier. Scientific Reports, 7: 1-14.

101
Ferretti, F., Worm, B., Britten, G. L., Heithaus, M. R., & Lotze, H. K. (2010). Patterns and ecosystem
consequences of shark declines in the ocean. Ecology Letters, 13: 1055-1071.
Field, I. C., Meekan, M. G., Speed, C. W., White, W., & Bradshaw, C. J. A. (2011). Quantifying movement
patterns for shark conservation at remote coral atolls in the Indian Ocean. Coral Reefs, 30: 61-71.
Flothmann, S., von Kistowski, K., Dolan, E., Lee, E., Meere, F., & Album, G. (2010). Closing loopholes:
getting illegal fishing under control. Science, 328: 1235-1236.
Foll, M., & Gaggiotti, O. (2008). A genome-scan method to identify selected loci appropriate for both
dominant and codominant markers: a bayesian perspective. Genetics, 180: 977–993. doi:
10.1534/genetics.108.092221.
Frankham, R. (2005). Genetics and extinction. Biological Conservation, 126: 131–140.
doi:10.1016/j.biocon.2005.05.002
Fréon, P., Cury, P., Shannon, L., & Roy, C. (2005). Sustainable exploitation of small pelagic fish stocks
challenged by environmental and ecosystem changes: a review. Bulletin of Marine Science, 76(2): 385-
462.Friedlander, A. M., & Parrish, J. D. (1998). Temporal dynamics of fish communities on an exposed
shoreline in Hawaii. Environmental Biology of Fishes, 53: 1-18.
Friedlander, A.M., 2018. Marine conservation in Oceania: Past, present, and future. Marine Pollution
Bulletin, 135: 139-149.
Friedlander, A. M., & DeMartini, E. E. (2002). Contrasts in density, size, and biomass of reef fishes between
the northwestern and the main Hawaiian Islands: the effects of fishing down apex predators. Marine
Ecology Progress Series, 230: 253-264.
Friedlander, A. M., & Parrish, J. D. (1998). Temporal dynamics of fish communities on an exposed shoreline
in Hawaii. Environmental Biology of Fishes, 53: 1-18.
Friedlander, A. M., Ballesteros, E., Beets, J., Berkenpas, E., Gaymer, C. F., Gorny, M., & Sala, E. (2013).
Effects of isolation and fishing on the marine ecosystems of Easter Island and Salas y Gómez, Chile.
Aquatic Conservation: Marine and Freshwater Ecosystems, 23: 515-531
Friedlander, A. M., Ballesteros, E., Berkenpas, E., Betz, J., Giddens, J., Gorny, M., … Sala, E. (2017).
Informe Científico Archipiélago de Juan Fernandez: Biodiversidad marina y necesidad de conservación.
NATIONAL GEOGRAPHIC. 83 pp.
Frisch A. J, Cole A. J, Hobbs J. A, Rizzari J. R, & Munkres K. P. (2012). Effects of spearfishing on reef fish
populations in a multi-use conservation area. PLOS ONE, 7: e51938
Frisch, A. J., Ireland, M., & Baker, R. (2014). Trophic ecology of large predatory reef fishes: energy
pathways, trophic level, and implications for fisheries in a changing climate. Marine Biology, 161: 61-73.

102
Frisch, A. J., Ireland, M., Rizzari, J. R., Lönnstedt, O. M., Magnenat, K. A., Mirbach, C. E., & Hobbs, J. P.
A. (2016). Reassessing the trophic role of reef sharks as apex predators on coral reefs. Coral Reefs, 35:
459-472.
Funk WC, McKay JK, Hohenlohe PA, Allendorf FW. (2012). Harnessing genomics for delineating
conservation units. Trends in Ecology & Evolution, 27:489–496.
Futuyma, D.J. & Moreno, G. (1988). The evolution of ecological specialization. Annual Review of Ecology
and Systematics, 19: 207-233.
Gaines, S. D., White, C., Carr, M. H., & Palumbi, S. R. (2010). Designing marine reserve networks for both
conservation and fisheries management. Proceedings of the National Academy of Sciences of the United
States of America, 107: 18286–18293. https://doi.org/10.1073/
Gallagher, A. J., Shiffman, D. S., Byrnes, E. E., Hammerschlag-Peyer, C. M., & Hammerschlag, N. (2017).
Patterns of resource use and isotopic niche overlap among three species of sharks occurring within a
protected subtropical estuary. Aquatic Ecology, 51: 435-448.
Game, E. T., Grantham, H. S., Hobday, A. J., Pressey, R. L., Lombard, A. T., Beckley, L. E., ... Richardson,
A. J. (2009). Pelagic protected areas: the missing dimension in ocean conservation. Trends in Ecology &
Evolution, 24: 360-369.
Garla, R. C., Chapman, D. D., Wetherbee, B. M., & Shivji, M. (2006). Movement patterns of young
Caribbean reef sharks, Carcharhinus perezi, at Fernando de Noronha Archipelago, Brazil: the potential of
marine protected areas for conservation of a nursery ground. Marine Biology, 149: 189-199.
Garrigue, C., Clapham, P. J., Geyer, Y., Kennedy, A. S., & Zerbini, A. N. (2015). Satellite tracking reveals
novel migratory patterns and the importance of seamounts for endangered South Pacific humpback whales.
Royal Society Open Science, 2: 150489.
Gaymer, C., Aburto, J., Acuña, E., Bodini, A., Cárcamo, F., Stotz, W., & Tapia, C. (2013). Base de
conocimiento y construcción de capacidades para el uso sustentable de los ecosistemas y recursos
marinos de la ecorregión de Isla de Pascua. Licitación 4728-33-le12. Subsecretaría Pesca.
Glynn, P. W., Wellington, G. M., Riegl, B., Olson, D. B., Borneman, E., & Wieters, E. A. (2007). Diversity
and Biogeography of the Scleractinian Coral Fauna of Easter Island (Rapa Nui). Pacific Science, 61: 67–
90. doi:10.1353/psc.2007.0005
Graham, B. S., Koch, P. L., Newsome, S. D., McMahon, K. W., & Aurioles, D. (2010). Using isoscapes to
trace the movements and foraging behaviour of top predators in oceanic ecosystems. In Isoscapes (pp.
299-318). Springer, Dordrecht.
Graham, N. A., Spalding, M. D., & Sheppard, C. R. (2010). Reef shark declines in remote atolls highlight
the need for multi‐faceted conservation action. Aquatic Conservation: Marine and Freshwater Ecosystems,
20: 543-548.

103
Grant, W. A. S., & Bowen, B. W. (1998). Shallow population histories in deep evolutionary lineages of
marine fishes: insights from sardines and anchovies and lessons for conservation. Journal of Heredity, 89:
415-426.
Gray, A. E., Williams, I. D., Stamoulis, K. A., Boland, R. C., Lino, K. C., Hauk, B. B., ... & Kosaki, R. K.
(2016). Comparison of reef fish survey data gathered by open and closed circuit SCUBA divers reveals
differences in areas with higher fishing pressure. PLOS ONE, 11: e0167724.
Green, M. E. (2014). A mitochondrial and genome wide genetic investigation of Galapagos shark
(Carcharhinus galapagensis) populations in the southwest Pacific Ocean (Honours dissertation). Retrieved
from James Cook University Library Database.
Hagihara, R., Jones, R. E., Sobtzick, S., Cleguer, C., Garrigue, C., & Marsh, H. (2018). Compensating for
geographic variation in detection probability with water depth improves abundance estimates of coastal
marine megafauna. PLOS ONE, 13: e0191476.
Hardinge, J., Harvey, E. S., Saunders, B. J., & Newman, S. J. (2013). A little bait goes a long way: the
influence of bait quantity on a temperate fish assemblage sampled using stereo-BRUVS. Journal of
Experimental Marine Biology and Ecology, 449: 250-260.
Harrigan, P., Zieman, J. C., & Macko, S. A. (1989). The base of nutritional support for the gray snapper
(Lutjanus griseus): an evaluation based on a combined stomach content and stable isotope analysis.
Bulletin of Marine Science, 44: 65-77.
Harvey, E. S., Newman, S. J., McLean, D. L., Cappo, M., Meeuwig, J. J., & Skepper, C. L. (2012).
Comparison of the relative efficiencies of stereo-BRUVs and traps for sampling tropical continental shelf
demersal fishes. Fisheries Research, 125: 108-120.
Hecky, R. E., & Hesslein, R. H. (1995). Contributions of benthic algae to lake food webs as revealed by
stable isotope analysis. Journal of the North American Benthological Society, 14: 631-653.
Heithaus, M. R., Frid, A., Wirsing, A. J., & Worm, B. (2008). Predicting ecological consequences of marine
top predator declines. Trends in Ecology & Evolution, 23: 202-210.
Henry, G. W. & Lyle, J. M. (2003). The national recreational and indigenous fishing survey. FDRC Project
No 99/158, Tasmanian Aquaculture Fisheries Institute, Hobart.
Hernández Mares, P. (2016). Illegal fishing threatens Easter Island’s natural resources. Mongbay.com, 2
November 2016. https://news.mongabay.com/2016/11/illegal-fishing-threatens-easter-islands-natural-
resources/
Heupel, M. R., & Hueter, R. E. (2002). The importance of prey density in relation to the movement patterns
of juvenile sharks within a coastal nursery area. Marine and Freshwater Research, 53: 543–550.
Heupel, M. R., Simpfendorfer, C. A., & Hueter, R. E. (2004). Estimation of shark home ranges using passive
monitoring techniques. Environmental Biology of Fishes, 71: 135-142.

104
Hijmans, R. J. (2017) geosphere: Spherical Trigonometry. R package version 1.5-7. https://cran.r-
project.org/package=geosphere.
Hilborn, R. (2016). Policy: Marine biodiversity needs more than protection. Nature, 535 : 224–226.
doi:10.1038/535224a.
Hilborn, R., Micheli, F., & De Leo, G. A. (2006). Integrating marine protected areas with catch regulation.
Canadian Journal of Fisheries and Aquatic Sciences, 63: 642-649.
Hoegh-Guldberg O., Mumby P.J., Hooten A.J., Steneck R.S., Greenfield P., Gomez E., … Hatziolos M.E.
(2007). Coral reefs under rapid climate change and ocean acidification. Science, 318: 1737–1742.
Holland, K. N., Meyer, C. G., & Dagorn, L. C. (2009). Inter-animal telemetry: results from first deployment
of acoustic ‘business card’tags. Endangered Species Research, 10: 287-293.
Holland, K. N., Wetherbee, B. M., Lowe, C. G., & Meyer, C. G. (1999). Movements of tiger sharks
(Galeocerdo cuvier) in coastal Hawaiian waters. Marine Biology, 134: 665-673.
Holmes, B. J., Pepperell, J. G., Griffiths, S. P., Jaine, F. R., Tibbetts, I. R., & Bennett, M. B. (2014). Tiger
shark (Galeocerdo cuvier) movement patterns and habitat use determined by satellite tagging in eastern
Australian waters. Marine Biology, 161: 2645-2658.
Hueter, R. E., Heupel, M. R., Heist, E. J., & Keeney, D. B. (2005). Evidence of philopatry in sharks and
implications for the management of shark fisheries. Journal of northwest Atlantic fishery Science, 35: 239-
247.
Hughes, T. P., Graham, N. A., Jackson, J. B., Mumby, P. J., & Steneck, R. S. (2010). Rising to the challenge
of sustaining coral reef resilience. Trends in Ecology & Evolution, 25: 633-642.
Hussey, N. E., MacNeil, M. A., Olin, J. A., McMeans, B. C., Kinney, M. J., Chapman, D. D., & Fisk, A. T.
(2012). Stable isotopes and elasmobranchs: tissue types, methods, applications and assumptions. Journal
of Fish Biology, 80: 1449-1484.
Jackson, A. L., Inger, R., Parnell, A. C., & Bearhop, S. (2011). Comparing isotopic niche widths among and
within communities: SIBER–Stable Isotope Bayesian Ellipses in R. Journal of Animal Ecology, 80: 595-602.
Jeppesen, E., Meerhoff, M., Holmgren, K., González-Bergonzoni, I., Teixeira-de Mello, F., Declerck, S. A.,
… Lazzaro, X. (2010). Impacts of climate warming on lake fish community structure and potential effects
on ecosystem function. Hydrobiologia, 646: 73-90.
Jombart T. & Ahmed I. (2011). Adegenet 1.3-1: new tools for the analysis of genome-wide SNP data.
Bioinformatics.
Jones, P. J. S., & De Santos, E. M. (2016). Viewpoint – Is the race for remote, very large marine protected
areas (VLMPAs) taking us down the wrong track? Marine Policy, 73: 231-234.

105
Kawecki, T. J., & Holt, R. D. (2002). Evolutionary consequences of asymmetric dispersal rates. American
Naturalist, 160, 333– 347.
Kelly, B., Dempson, J. B., & Power, M. (2006). The effects of preservation on fish tissue stable isotope
signatures. Journal of Fish Biology, 69: 1595-1611.
Ketchum, J. T., Hearn, A., Klimley, A. P., Peñaherrera, C., Espinoza, E., Bessudo, S., ... Arauz, R. (2014).
Inter-island movements of scalloped hammerhead sharks (Sphyrna lewini) and seasonal connectivity in a
marine protected area of the eastern tropical Pacific. Marine Biology, 161: 939-951.
Kilfoil, J.P., Wirsing, A.J., Campbell, M.D., Kiszka, J.J., Gastrich, K.R., Heithaus, M.R., & Zhang, Y., Bond,
M.E., (2017). Baited remote underwater video surveys undercount sharks at high densities: insights from
full-spherical camera technologies. Marine Ecology Progress Series, 585: 113-121.
Kingsford, M. J., Underwood, A. J., & Kennelly, S. J. (1991). Humans as predators on rocky reefs in New
South Wales, Australia. Marine Ecology Progress Series. Oldendorf, 72: 1-14.
Kinney, M. J., Hussey, N. E., Fisk, A. T., Tobin, A. J., & Simpfendorfer, C. A. (2011). Communal or
competitive? Stable isotope analysis provides evidence of resource partitioning within a communal shark
nursery. Marine Ecology Progress Series, 439: 263–276.
Kinney, M. J., & Simpfendorfer, C. A. (2009). Reassessing the value of nursery areas to shark conservation
and management. Conservation Letters, 2: 53-60.
Klein, C. J., Brown, C. J., Halpern, B. S., Segan, D. B., McGowan, J., Beger, M., & Watson, J. E. M. (2015).
Shortfalls in the global protected area network at representing marine biodiversity. Scientific Reports,5: 1–
7. doi:10.1038/srep17539.
Knip, D. M., Heupel, M. R., & Simpfendorfer, C. A. (2012). Evaluating marine protected areas for the
conservation of tropical coastal sharks. Biological Conservation, 148: 200-209.
Kohler, N. E., Casey, J. G., & Turner, P. A. (1998). NMFS cooperative shark tagging program, 1962-93: an
atlas of shark tag and recapture data. Marine Fisheries Review, 60: 1-1.
Koladinovic, J., Ménard, F., Bustamante, P., Cosson, R. P., & Le Corre, M. (2008). Trophic ecology of
marine birds and pelagic fishes from Reunion Island as determined by stable isotope analysis. Marine
Ecology Progress Series, 361: 239-251.
Kramer, D. L. & Chapman, M. R. (1999). Implications of fish home range size and relocation for marine
reserve function. Environmental Biology of Fishes, 55: 65–79.
Kritzer, J. P. (2004). Effects of noncompliance on the success of alternative designs of marine protected‐
area networks for conservation and fisheries management. Conservation Biology, 18: 1021-1031.
Kroodsma, D. A., Mayorga, J., Hochberg, T., Miller, N. A., Boerder, K., Ferretti, F., ... Woods, P. (2018).
Tracking the global footprint of fisheries. Science, 359: 904-908.

106
Kulbicki, M. (1998). How the acquired behaviour of commercial reef fishes may influence the results
obtained from visual censuses. Journal of Experimental Marine Biology and Ecology, 222: 11-30.
Kyne, P.M., Barreto, R., Carlson, J., Fernando, D., Fordham, S., Francis, M.P. et al. 2019. Carcharhinus galapagensis. The IUCN Red List of Threatened Species 2019: e.T41736A2954286.
Langlois, T. J., Harvey, E. S., Fitzpatrick, B., Meeuwig, J. J., Shedrawi, G., & Watson, D. L. (2010). Cost-
efficient sampling of fish assemblages: comparison of baited video stations and diver video transects.
Aquatic Biology, 9: 155-168.
Layman, C. A., Quattrochi, J. P., Peyer, C. M., & Allgeier, J. E. (2007). Niche width collapse in a resilient
top predator following ecosystem fragmentation. Ecology Letters, 10: 937-944.
Lindfield, S. J., Harvey, E. S., McIlwain, J. L., & Halford, A. R. (2014). Silent fish surveys: bubble‐free diving
highlights inaccuracies associated with SCUBA‐based surveys in heavily fished areas. Methods in Ecology
and Evolution, 5: 1061-1069.
Lindley, J., & Techera, E. J. (2017). Overcoming complexity in illegal, unregulated and unreported fishing
to achieve effective regulatory pluralism. Marine Policy, 81: 71-79.
Link, J., (2002). Does food web theory work for marine ecosystems? Marine Ecology Progress Series, 230:
1-9.
Lizardi, F. L., Hoyos-Padilla, M., Hearn, A., Klimley, A. P., Galván-Magaña, F., Arauz, R. et al. (2020). Shark
movements in the Revillagigedo Archipelago and connectivity with the Eastern Tropical Pacific. bioRxiv.
doi: https://doi.org/10.1101/2020.03.02.972844.
López-Garro, A., Zanella, I., Martínez, F., Golfín-Duarte, G., & Pérez-Montero, M. (2016). La pesca ilegal
en el Parque Nacional Isla del Coco, Costa Rica. Revista de Biología Tropical, 64: 249-261.
Lorrain, A., Argüelles, J., Alegre, A., Bertrand, A., Munaron, J. M., Richard, P., & Cherel, Y. (2011).
Sequential isotopic signature along gladius highlights contrasted individual foraging strategies of jumbo
squid (Dosidicus gigas). PLOS ONE, 6: e22194.
Lowe, W. H., & Allendorf, F. W. (2010). What can genetics tell us about population connectivity?. Molecular
Ecology, 19: 3038-3051.
Lubchenco, J., & Grorud‐Colvert, K. (2015). Making waves: The science and politics of ocean protection.
Science, 350: 382–383. https://doi.org/10.1126/science.aad5443
Luo, J., Prince, E. D., Goodyear, C. P., Luckhurst, B. E., & Serafy, J. E. (2006). Vertical habitat utilization
by large pelagic animals: a quantitative framework and numerical method for use with pop‐up satellite tag
data. Fisheries Oceanography, 15: 208-229.
Macfadyen, G., Hosch, G., Kaysser, N. & Tagziria, L. (2019). The IUU Fishing Index, 2019. Poseidon
Aquatic Resource Management Limited and the Global Initiative Against Transnational Organized Crime.

107
MacKeracher, T., Diedrich, A., & Simpfendorfer, C.A. (2019). Sharks, rays and marine protected areas: A
critical evaluation of current perspectives. Fish and Fisheries, 20: 255– 267.
https://doi.org/10.1111/faf.12337.
Malcolm, H. A., Gladstone, W., Lindfield, S., Wraith, J., & Lynch, T. P. (2007). Spatial and temporal variation
in reef fish assemblages of marine parks in New South Wales, Australia—baited video observations. Marine
Ecology Progress Series, 350: 277-290.
Marie, A. D., Herbinger, C., Fullsack, P. M., & Rico, C. (2019). First reconstruction of kinship in a scalloped
hammerhead shark aggregation reveals the mating patterns and breeding sex ratio. Frontiers in Marine
Science. 6: 676. doi: 10.3389/fmars.2019.00676.
Martin, A. P., Naylor, G. J. P., & Palumbi, S. R. (1992). Rates of mitochondrial DNA evolution in sharks are
slow compared with mammals. Nature, 357: 153–155.
Martinez-Takeshita, N., Purcell, C. M., Chabot, C. L., Craig, M. T., Paterson, C. N., Hyde, J. R., & Allen, L.
G. (2015). A tale of three tails: cryptic speciation in a globally distributed marine fish of the genus Seriola.
Copeia, 103: 357-368.
Matich, P., Heithaus, M. R., & Layman, C. A. (2010). Size-based variation in intertissue comparisons of
stable carbon and nitrogen isotopic signatures of bull sharks (Carcharhinus leucas) and tiger sharks
(Galeocerdo cuvier). Canadian Journal of Fisheries and Aquatic Sciences, 67: 877-885.
McCauley, D. J., Woods, P., Sullivan, B., Bergman, B., Jablonicky, C., Roan, A., ... Worm, B. (2016). Ending
hide and seek at sea. Science, 351: 1148-1150.
McCutchan, J. H., Lewis, W. M., Kendall, C., & McGrath, C. C. (2003). Variation in trophic shift for stable
isotope ratios of carbon, nitrogen, and sulfur. Oikos, 102: 378–390.
Medley, P. A., Gaudian, G., & Wells, S. (1993). Coral reef fisheries stock assessment. Reviews in Fish
Biology and Fisheries, 3: 242–285.
Meerhoff, E., Yannicelli, B., Dewitte, B., Díaz-Cabrera, E., Vega-Retter, C., Ramos, M., ... Véliz, D. (2018).
Asymmetric connectivity of the lobster Panulirus pascuensis in remote islands of the southern Pacific:
importance for its management and conservation. Bulletin of Marine Science, 94: 753-774.
Menard, F., Lorrain, A., Potier, M., & Marsac, F. (2007). Isotopic evidence of distinct feeding ecologies and
movement patterns in two migratory predators (yellowfin tuna and swordfish) of the western Indian Ocean.
Marine Biology, 153: 141–152. doi:10.1007/s00227-007-0789-7.
Meyer, C. G., Holland, K. N., & Papastamatiou, Y. P. (2007). Seasonal and diel movements of giant trevally
Caranx ignobilis at remote Hawaiian atolls: implications for the design of marine protected areas. Marine
Ecology Progress Series, 333: 13-25.

108
Meyer, C. G., Papastamatiou, Y. P., & Holland, K. N. (2010). A multiple instrument approach to quantifying
the movement patterns and habitat use of tiger (Galeocerdo cuvier) and Galapagos sharks (Carcharhinus
galapagensis) at French Frigate Shoals, Hawaii. Marine Biology, 157: 1857-1868.
Micheli, F., Halpern, B. S., Botsford, L. W., & Warner, R. R. (2004). Trajectories and correlates of community
change in no-take marine reserves. Ecology Applied, 14: 1709–1723.
Miller, N. A., Roan, A., Hochberg, T., Amos, J., & Kroodsma, D. A. (2018). Identifying global patterns of
trans-shipment behaviour. Frontiers in Marine Science, 5: 240.
Moffitt, E. A., Botsford, L. W., Kaplan, D. M., & O'Farrell, M. R. (2009). Marine reserve networks for species
that move within a home range. Ecological applications,19: 1835-1847.
Morales, N. A., Easton, E. E., Friedlander, A. M., Harvey, E. S., Garcia, R., & Gaymer, C. F. (2019a). Spatial
and seasonal differences in the top predators of Easter Island: Essential data for implementing the new
Rapa Nui multiple‐uses marine protected area. Aquatic Conservation: Marine and Freshwater
Ecosystems, 29, 118-129.
Morales, N., Coghlan, A. R., Hayden, G., & Guajardo, P. (2019b). First sighting of a tropical benthic reef
shark species at Rapa Nui: chance dispersal or a sign of things to come?. Journal of Fish Biology, 95: 642-
646.
Morales NA, Heidemeyer M, Bauer R, Hernandez S, Acuña E, Friedlander AM, Gaymer CF. (In press).
Residential movements of top predators at Chile’s most isolated Marine Protected Area: implications for
the conservation of the Galapagos shark, Carcharhinus galapagensis, and the yellowtail amberjack, Seriola
lalandi. Aquatic Conserv: Mar Freshw Ecosyst.
Morato, T., Hoyle, S. D., Allain, V., & Nicol, S. J. (2010). Seamounts are hotspots of pelagic biodiversity in
the open ocean. Proceedings of the National Academy of Sciences, 107: 9707-9711.
Moteki M, Arai M, Tsuchiya K, Okamoto H (2001) Composition of piscine prey in the diet of large pelagic
fish in the eastern tropical Pacific Ocean. Fisheries Science, 67: 1063–1074.
Moyes, C.D., Fragoso, N., Musyl, M.K. & Brill, R.W. (2006). Predicting postrelease survival in large pelagic
fish. Transactions of the American Fisheries Society, 135:1389–1397. doi: 10.1577/T05-224.1
Muñoz, A. (2011). Confronting illegal fishing in Salas y Gomez. [https://usa.oceana.org/blog/confronting-
illegal-fishing-sala-y-gomez]. Reviewed: 20 June 2019
Murphy, H. M., & Jenkins, G. P. (2010). Observational methods used in marine spatial monitoring of fishes
and associated habitats: a review. Marine and Freshwater Research, 61: 236-252.
Myers, R. A., & Worm, B. (2003). Rapid worldwide depletion of predatory fish communities. Nature, 423:
280-283.

109
Myers, R. A., Baum, J. K., Shepherd, T. D., Powers, S. P., & Peterson, C. H. (2007). Cascading effects of
the loss of apex predatory sharks from a coastal ocean. Science, 315: 1846-1850.
Newman, W. A., & Foster, B. A. (1983). The Rapanuian fauna district (Easter and Sala y Gomez): in search
of ancient archipelagos. Bulletin of Marine Science, 33: 633–644.
Olin, J. A., Hussey, N. E., Fritts, M., Heupel, M. R., Simpfendorfer, C. A., Poulakis, G. R., & Fisk, A. T.
(2011). Maternal meddling in neonatal sharks: implications for interpreting stable isotopes in young
animals. Rapid Communications in Mass Spectrometry, 25: 1008-1016.
Olson, K. R., (1999). Rectal gland and volume homeostasis. In: Hamlett, W.C.(Ed.), Sharks, Skates, and
Rays: The Biology of Elasmobranch Fishes. The John Hopkins University Press, Baltimore, Maryland, USA,
pp. 329–352.
Olson, R. J., & Galván-Magaña, F. (2002). Food habits and consumption rates of common dolphinfish
(Coryphaena hippurus) in the eastern Pacific Ocean. Fishery Bulletin, 100: 279-298.
Palstra, A. P., Mes, D., Kusters, K., Roques, J. A., Flik, G., Kloet, K., & Blonk, R. J. (2015). Forced sustained
swimming exercise at optimal speed enhances growth of juvenile yellowtail kingfish (Seriola lalandi).
Frontiers in Physiology, 5: 11.
Papastamatiou, Y. P., Friedlander, A. M., Caselle, J. E., & Lowe, C. G. (2010). Long-term movement
patterns and trophic ecology of blacktip reef sharks (Carcharhinus melanopterus) at Palmyra Atoll. Journal
of Experimental Marine Biology and Ecology, 386: 94-102.
Papastamatiou, Y. P., Lowe, C. G., Caselle, J. E., & Friedlander, A. M. (2009). Scale‐dependent effects of
habitat on movements and path structure of reef sharks at a predator‐dominated atoll. Ecology, 90: 996-
1008.
Papastamatiou, Y. P., Wetherbee, B. M., Lowe, C. G., & Crow, G. L. (2006). Distribution and diet of four
species of carcharhinid shark in the Hawaiian Islands: evidence for resource partitioning and competitive
exclusion. Marine Ecology Progress Series, 320: 239-251.
Pauly, D. (1995). Anecdotes and the shifting baseline syndrome of fisheries. Trends in Ecology & Evolution,
10: 430.
Pauly, D., Christensen, V., Guénette, S., Pitcher, T. J., Sumaila, U. R., Walters, C. J., ... Zeller, D. (2002).
Towards sustainability in world fisheries. Nature, 418: 689.
Pazmiño, D. A., Maes, G. E., Green, M. E., Simpfendorfer, C. A., Hoyos-Padilla, E. M., Duffy, C. J., ... van
Herwerden, L. (2018). Strong trans-Pacific break and local conservation units in the Galapagos shark
(Carcharhinus galapagensis) revealed by genome-wide cytonuclear markers. Heredity, 120: 407-421.
Pazmiño, D. A., Maes, G. E., Simpfendorfer, C. A., Salinas-de-León, P., & van Herwerden, L. (2017).
Genome-wide SNPs reveal low effective population size within confined management units of the highly
vagile Galapagos shark (Carcharhinus galapagensis). Conservation Genetics, 18: 1151-1163.

110
Pendleton, L. H., Ahmadia, G. N., Browman, H. I., Thurstan, R. H., Kaplan, D. M., & Bartolino, V. (2017).
Debating the effectiveness of marine protected areas. ICES Journal of Marine Science, 75: 1156-1159.
Petit, I. J., Campoy, A. N., Hevia, M. J., Gaymer, C. F., & Squeo, F. A. (2018). Protected areas in Chile: are
we managing them?. Revista Chilena de Historia Natural, 91: 1.
Petrossian, G. A. (2015). Preventing illegal, unreported and unregulated (IUU) fishing: A situational
approach. Biological Conservation, 189: 39-48.
Pinnegar, J. K., & Engelhard, G. H. (2008). The ‘shifting baseline’phenomenon: a global perspective.
Reviews in Fish Biology and Fisheries, 18: 1-16.
Pita, P., Fernández-Márquez, D., & Freire, J. (2014). Short-term performance of three underwater sampling
techniques for assessing differences in the absolute abundances and in the inventories of the coastal fish
communities of the Northeast Atlantic Ocean. Marine and Freshwater Research, 65: 105-113.
Pitcher, T. J., Morato, T., Hart, P. J. B., Clark, M., Haggan, N., & Santos, R. S. (2008). Seamounts: ecology,
fisheries and conservation. Oxford, UK: Blackwell Publishing Ltd.
Pizarro, G., Montecino, V., Astoreca, R., Alarcón, G., Yuras, G., & Guzmán, L. (2006). Variabilidad espacial
de condiciones bio-ópticas de la columna de agua entre las costas de Chile insular y continental, primavera
1999 y 2000. Ciencia y Tecnologia del Mar, 29: 45-58.
Planes S. & Fauvelot C (2002) Isolation by distance and vicariance drive genetic structure of a coral reef
fish in the Pacific Ocean. Evolution: An International Journal of Organic Evolution, 56: 378–399.
Poisson, F., Crespo, F. A., Ellis, J. R., Chavance, P., Pascal, B., Santos, M. N., ... Murua, H. (2016).
Technical mitigation measures for sharks and rays in fisheries for tuna and tuna-like species: turning
possibility into reality. Aquatic Living Resources, 29: 402.
Polovina, J. J., Howell, E., Kobayashi, D. R., & Seki, M. P. (2001). The transition zone chlorophyll front, a
dynamic global feature defining migration and forage habitat for marine resources. Progress in
Oceanography, 49: 469-483.
Post, D.M. (2002) Using stable isotopes to estimate trophic position: models, methods and assumptions.
Ecology, 83:703–718.
Priede, I. G., Bagley, P. M., Smith, A., Creasey, S., & Merrett, N. R. (1994). Scavenging deep demersal
fishes of the Porcupine Seabight, Northeast Atlantic — observations by baited camera, trap and trawl.
Journal of the Marine Biological Association of the UK, 74: 481–498.
Queiroz, N., Humphries, N. E., Mucientes, G., Hammerschlag, N., Lima, F. P., Scales, K. L., … Sims, D.
W. (2016). Ocean-wide tracking of pelagic sharks reveals extent of overlap with longline fishing hotspots.
Proceedings of the National Academy of Sciences, 113: 1582–1587. doi:10.1073/pnas.1510090113.

111
Quezada-Romegialli, C., Jackson, A.L., Hayden, B., Kahilainen, K.K., Lopes, C., & Harrod, C. (2018).
TROPHICPOSITION, an R package for the Bayesian estimation of trophic position from consumer stable
isotope ratios. Methods in Ecology and Evolution. DOI: 10.1111/2041-210X.13009.
Randall, J. E., & Cea, A. (2011). Shore fishes of Easter Island. University of Hawai'i Press. 176 pp.
Ray, J.S., Mahoney, J.J., Duncan, R.A., Ray, J., Wessel, P. & Naar, D.F., (2012). Chronology and
geochemistry of lavas from the Nazca Ridge and Easter Seamount Chain: an∼ 30 Myr hotspot record.
Journal of Petrology, 53: 1417-1448.
Ren, R., Ray, R., Li, P., Xu, J., Zhang, M., Liu, G., et al. (2015). Construction of a high-density DArTseq
SNP-based genetic map and identification of genomic regions with segregation distortion in a genetic
population derived from a cross between feral and cultivated-type watermelon. Molecular Genetics and
Genomics 290: 1457–1470. doi: 10.1007/s00438-015-0997-7.
Rezac, J. (2018). Transshipment Reform Needed to Ensure Legal, Verifiable Transfer of Catch. The Pew
Charitable Trusts. 12 pp.
Robbins, W. D., Hisano, M., Connolly, S. R., & Choat, J. H. (2006). Ongoing collapse of coral-reef shark
populations. Current Biology, 16: 2314-2319.
Roberts, C. M. (2000). Selecting marine reserve locations: optimality versus opportunism. Bulletin of Marine
Science, 66: 581-592.
Roberts, C. M., Bohnsack, J. A., Gell, F., Hawkins, J. P., & Goodridge, R. (2001). Effects of marine reserves
on adjacent fisheries. Science, 294: 1920–1923.
Robinson, N. J., Morreale, S. J., Nel, R., & Paladino, F. V. (2016). Coastal leatherback turtles reveal
conservation hotspot. Scientific reports, 6: 1-9. doi:10.1038/srep37851.
Roff, G., Doropoulos, C., Rogers, A., Bozec, Y. M., Krueck, N. C., Aurellado, E., ... & Mumby, P. J. (2016).
The ecological role of sharks on coral reefs. Trends in Ecology & Evolution, 31: 395-407.
Rogers, A. D. (1994). The biology of seamounts. In Advances in marine biology (Vol. 30, pp. 305-350).
Academic Press.
Rozen, S., Skalersky, H.J., (2000). Primer3 on the WWW for general users and for biologist programmers.
In:Krawetz, S., Misener, S.(Eds.), Bioinformatics Methods and Protocols: Methods in Molecular Biology.
Humana Press, Totowa, pp. 365–386.
Ruttenberg, B. I., Hamilton, S. L., Walsh, S. M., Donovan, M. K., Friedlander, A., DeMartini, E., Sala, E., &
Sandin, S. A. (2011). Predator-induced demographic shifts in coral reef fish assemblages. PLOS ONE, 6:
e21062. doi:10.1371/journal.pone.0021062.
Sala, E., Mayorga, J., Costello, C., Kroodsma, D., Palomares, M. L., Pauly, … Zeller, D. (2018). The
economics of fishing the high seas. Science Advances, 4: eaat2504.

112
Salinas-de-León P, Acuña-Marrero D, Rastoin E et al (2016) Largest global shark biomass found in the
northern Galápagos Islands of Darwin and Wolf. PeerJ, 4: e1911. doi:10.7717/peerj.1911.
Samoilys, M. A., & Carlos, G. (2000). Determining methods of underwater visual census for estimating the
abundance of coral reef fishes. Environmental Biology of Fishes, 57: 289–304.
Sandin, S. A., Smith, J. E., DeMartini, E. E., Dinsdale, E. A., Donner, S. D., Friedlander, A. M., ... Pantos,
O. (2008). Baselines and degradation of coral reefs in the Northern Line Islands. PLOS ONE, 3: e1548.
Sandin, S. A., Walsh, S. M., & Jackson, J. B. (2010). Prey release, trophic cascades, and phase shifts in
tropical nearshore ecosystems. Trophic Cascades: Predators, Prey, and the Changing Dynamics of Nature,
71-90 pp.
Santana‐Garcon, J., Braccini, M., Langlois, T. J., Newman, S. J., McAuley, R. B., & Harvey, E. S. (2014a).
Calibration of pelagic stereo‐BRUVs and scientific longline surveys for sampling sharks. Methods in
Ecology and Evolution, 5: 824-833.
Santana-Garcon, J., Newman, S. J., Langlois, T. J., & Harvey, E. S. (2014b). Effects of a spatial closure on
highly mobile fish species: an assessment using pelagic stereo-BRUVS. Journal of Experimental Marine
Biology and Ecology, 460: 153-161.
Sardenne, F., Bodin, N., Chassot, E., Amiel, A., Fouché, E., Degroote, M., ... Ménard, F. (2016). Trophic
niches of sympatric tropical tuna in the Western Indian Ocean inferred by stable isotopes and neutral fatty
acids. Progress in oceanography, 146: 75-88.
Savolainen, O., Lascoux, M., & Merilä, J. (2013). Ecological genomics of local adaptation. Nature Reviews
Genetics, 14: 807–20.
Schlosser, I. J. (1990). Environmental variation, life history attributes, and community structure in stream
fishes: implications for environmental management and assessment. Environmental Management, 14: 621-
628.
Schneider, S., Roessli, D., and Excoffier, L. (2000). Arlequin Ver. 2.0: A Software for Population Genetics
Data Analysis. Switzerland: Genetics and Biometry Laboratory.
Shears, N.T. & Babcock, R.C. (2002). Marine reserves demonstrate top-down control of community
structure on temperate reefs. Oecologia, 132: 131-142.
Shillinger, G. L., Swithenbank, A. M., Bailey, H., Bograd, S. J., Castelton, M. R., Wallace, B. P., … Block,
B. A. (2011). Vertical and horizontal habitat preferences of post-nesting leatherback turtles in the South
Pacific Ocean. Marine Ecology Progress Series, 422: 275-289.
Simpfendorfer, C. A., & Milward, N. E. (1993). Utilization of a tropical bay as a nursery area by sharks of
the families Carcharhinidae and Sphyrnidae. Environmental Biology of Fishes, 37: 337–45.

113
Simpfendorfer, C. A., Wiley, T. R., & Yeiser, B. G. (2010). Improving conservation planning for an
endangered sawfish using data from acoustic telemetry. Biological Conservation, 143: 1460-1469.
Skomal, G. (2007). Evaluating the physiological and physical consequences of capture on post release
survivorship in large pelagic fishes. Fishing and Managing Ecology, 14: 81–89
Smith-Vaniz, W.F. & Williams, I. (2015). Seriola lalandi. The IUCN Red List of Threatened Species 2015:
e.T195097A43155921. http://dx.doi.org/10.2305/IUCN.UK.2015-4.RLTS.T195097A43155921.en.
Downloaded on 07 July 2019.
Speed, C. W., Meekan, M. G., Field, I. C., McMahon, C. R., Abrantes, K., & Bradshaw, C. J. A. (2012).
Trophic ecology of reef sharks determined using stable isotopes and telemetry. Coral Reefs, 31: 357-367.
Springer, S. (1967). Social organisation of shark populations. pp. 149-174. In: Gilbert, RF. Mathewson &
D.P Rall (ed.) Sharks, Skates and Rays, John Hopkins University Press, Baltimore.
Stanley, D. R., & Wilson, C. A. (1995). Effect of SCUBA divers on fish density and target strength estimates
from stationary dual-beam hydroacoustics. Transactions of the American Fisheries Society, 124: 946-949.
Stergiou, K. I., & Karpouzi, V. S. (2002). Feeding habits and trophic levels of Mediterranean fish. Reviews
in Fish Biology and Fisheries, 11: 217-254.
Stevens, J. D., Bonfil, R., Dulvy, N. K., & Walker, P. A. (2000). The effects of fishing on sharks, rays, and
chimaeras (chondrichthyans), and the implications for marine ecosystems. ICES Journal of Marine Science:
Journal du Conseil, 57: 476-494.
Stobart, B., García-Charton, J. A., Espejo, C., Rochel, E., Goñi, R., Reñones, O., ... Planes, S. (2007). A
baited underwater video technique to assess shallow-water Mediterranean fish assemblages:
Methodological evaluation. Journal of Experimental Marine Biology and Ecology, 345: 158-174.
SUBPESCA (Subsecretaria de Pesca). (2010). Fundamentos para establecer Parque Marino Salas y
Gómez. Informe tecnico (R.PESQ.) N° 81/2010. 21 pp.
Sweeting CJ, Barry JT, Barnes C, Polunin NVC, Jennings S (2007) Effects of body size and environment
on diet-tissue δ15N fractionation in fishes. Journal of Experimental Marine Biology and Ecology, 340:1–10.
Swimmer, Y., Arauz, R., McCracken, M., McNaughton, L., Ballestero, J., Musyl, M., … Brill, R. (2006).
Diving behaviour and delayed mortality of olive ridley sea turtles Lepidochelys olivacea after their release
from longline fishing gear. Marine Ecology Progress Series, 323: 253–261. doi:10.3354/meps323253
Teffer, A. K., Staudinger, M. D., & Juanes, F. (2015). Trophic niche overlap among dolphinfish and co-
occurring tunas near the northern edge of their range in the western North Atlantic. Marine Biology, 162:
1823–1840. doi:10.1007/s00227-015-2715-8

114
Teo, S. L. H., Boustany, A., Blackwell, S., Walli, A., Weng, K. C., & Block, B. A. (2004). Validation of
geolocation estimates based on light level and sea surface temperature from electronic tags. Marine
Ecology Progress Series, 283: 81−98
Thiel, M., Luna-Jorquera, G., Álvarez-Varas, R., Gallardo, C., Hinojosa, I. A., Luna, N., … Zavalaga, C.
(2018). Impacts of Marine Plastic Pollution from Continental Coasts to Subtropical Gyres—Fish, Seabirds,
and Other Vertebrates in the SE Pacific. Frontiers in Marine Science, 5: 238. doi:
10.3389/fmars.2018.00238.
Thompson, A. A., & Mapstone, B. D. (1997). Observer effects and training in underwater visual surveys of
reef fishes. Marine Ecology Progress Series, 154: 53-63.
Thorson, J.T., & Simpfendorfer, C.A. (2009). Gear selectivity and sample size effects on growth curve
selection in shark age and growth studies. Fisheries Research, 98: 75-84.
Tickler, D.M., Letessier, T.B., Koldewey, H.J., & Meeuwig, J.J. (2017). Drivers of abundance and spatial
distribution of reef-associated sharks in an isolated atoll reef system. PLOS ONE, 12: e0177374.
Tognelli, M. F., Fernández, M., & Marquet, P. A. (2009). Assessing the performance of the existing and
proposed network of marine protected areas to conserve marine biodiversity in Chile. Biological
Conservation, 142: 3147-3153.
Tolotti, M., Bauer, R., Forget, F., Bach, P., Dagorn, L., & Travassos, P. (2017). Fine-scale vertical
movements of oceanic whitetip sharks (Carcharhinus longimanus). Fishery Bulletin, 115: 380-402.
Toonen, R. J., Andrews, K. R., Baums, I. B., Bird, C. E., Concepcion, G. T., Daly-Engel, T. S., ... Puritz, J.
B. (2011). Defining boundaries for ecosystem-based management: a multispecies case study of marine
connectivity across the Hawaiian Archipelago. Journal of Marine Biology, 2011: 460173.
Vander Zanden, M. J., Cabana, G. & Rasmussen, J. B. (1997) Comparing trophic position of freshwater
fish calculated using stable nitrogen isotope ratios (δ15N) and literature dietary data. Canadian Journal of
Fisheries and Aquatic Sciences, 54: 1142– 1158.
Vaudo, J. J., & Heithaus, M. R. (2011). Dietary niche overlap in a nearshore elasmobranch mesopredator
community. Marine Ecology Progress Series, 425: 247-260.
Vaudo, J. J., Byrne, M. E., Wetherbee, B. M., Harvey, G. M., & Shivji, M. S. (2017). Long‐term satellite
tracking reveals region‐specific movements of a large pelagic predator, the shortfin mako shark, in the
western North Atlantic Ocean. Journal of Applied Ecology, 54: 1765-1775.
Vega, R., Licandeo, R., Rosson, G., & Yáñez, E. (2009). Species catch composition, length structure and
reproductive indices of swordfish (Xiphias gladius) at Easter Island zone. Latin American Journal of Aquatic
Research, 37: 83-95.

115
Valencia E., Meerhoff E., Díaz-Cabrera E., Vega-Retter C., & Veliz D. Weak population connectivity in a
fish inhabiting remote Oceanic Islands”. Aquatic conservation Marine and Freshwater Ecosystems. In
review.
Venables, W. N., & Ripley, B. D. (2002). Modern Applied Statistics with S, 4th Edition. Statistics and
Computing. Springer, New York, NY.
Ward, R. D. (2000). Genetics in fisheries management. Hydrobiologia, 420: 191-201.
Watson, D. L., Harvey, E. S., Anderson, M. J., & Kendrick, G. A. (2005). A comparison of temperate reef
fish assemblages recorded by three underwater stereo-video techniques. Marine Biology, 148: 415–425.
Westera, M., Lavery, P., & Hyndes, G. (2003). Differences in recreationally targeted fishes between
protected and fished areas of a coral reef marine park. Journal of Experimental Marine Biology and Ecology,
294: 145-168.
Wetherbee, B. M., Crow, G. L., & Lowe, C. G. (1996). Biology of the Galapagos shark, Carcharhinus
galapagensis, in Hawai'i. Environmental Biology of Fishes, 45: 299-310.
White, T. D., Carlisle, A. B., Kroodsma, D. A., Block, B. A., Casagrandi, R., De Leo, G. A., ... McCauley, D.
J. (2017). Assessing the effectiveness of a large marine protected area for reef shark conservation.
Biological Conservation, 207: 64-71.
Wildlife Computers (2015) Data Portal’s Location Processing (GPE3 & FastLoc-GPS) User Guide, 25 pp.
Williams, A., Nicol, S., & Leroy, B. (2010). South Pacific albacore tagging project: 2010 summary report.
Report for the Western and Central Fisheries Commission, Scientific Committee Sixth Regular Session,
Nuku’alofa, Tonga.
Willis, T. J., & Babcock, R. C. (2000). A baited underwater video system for the determination of relative
density of carnivorous reef fish. Marine and Freshwater Research, 51: 755-763.
Willis, T. J., Millar, R. B., & Babcock, R. C. (2003). Protection of exploited fish in temperate regions: high
density and biomass of snapper Pagrus auratus (Sparidae) in northern New Zealand marine reserves.
Journal of Applied Ecology, 40: 214-227.
Wilson Jr, R. R., & Kaufmann, R. S. (1987). Seamount biota and biogeography. Seamounts, islands, and
atolls, 43, 355-377.
Wilson, S. G., Polovina, J. J., Stewart, B. S., & Meekan, M. G. (2006). Movements of whale sharks
(Rhincodon typus) tagged at Ningaloo Reef, Western Australia. Marine Biology, 148: 1157-1166.
Wolff, M., Ruiz, D.J., & Taylor, M. (2012). El Niño induced changes to the bolivar channel ecosystem
(Galapagos): comparing model simulations with historical biomass time series. Marine Ecology Progress
Series, 448: 7–22. doi:10.3354/meps09542

116
Worm, B., Barbier, E. B., Beaumont, N., Duffy, J. E., Folke, C., Halpern, B. S., ... & Sala, E. (2006). Impacts
of biodiversity loss on ocean ecosystem services. Science, 314: 787-790.
Worm, B., Lotze, H. K., & Myers, R. A. (2003). Predator diversity hotspots in the blue ocean. Proceedings
of the National Academy of Sciences, 100: 9884-9888.
Wright, S. (1965). The interpretation of population structure by F-statistics with special regard to systems
of mating. Evolution: 395-420.
Yáñez, E., Silva, C., Trujillo, H., González, E., Álvarez, L., Manutomatoma, L., & Romero, P. (2007).
Diagnóstico del sector pesquero de la Isla de Pascua. Pontificia Universidad Católica de Valparaíso,
Valparaíso, 154 pp.
Young, J. W., Lansdell, M. J., Campbell, R. A., Cooper, S. P., Juanes, F., & Guest, M. A. (2010). Feeding
ecology and niche segregation in oceanic top predators off eastern Australia. Marine Biology, 157: 2347-
2368.
Zhu, J., Xu, L., Dai, X., Chen, X., & Chen, Y. (2012). Comparative analysis of depth distribution for
seventeen large pelagic fish species captured in a longline fishery in the central-eastern Pacific Ocean.
Scientia Marina, 76: 149-157.
Zylich, K., Harper, S., Licandeo, R., Vega, R., Zeller, D., & Pauly, D. (2017). Fishing in Easter Island, a
recent history (1950-2010). Latin American Journal of Aquatic Research, 42: 845-856.

117
APPENDIXES
Figure S4.1. Length frequency distribution per species of all fish caught during the tagging cruises CIMAR 21 in 2015 and the SOSF 380 campaign of 2017.

118
Figure S4.2. Daily geolocations and maximum diving depths during daytime (left) and night periods (right) of tag 154061 (amberjack) in relation to bathymetry (Deployment duration: 148 days). Empty symbols indicate geolocations for which depth time series data is missing due to the duty cycle configuration. Violet lines indicate the border of the MMHMP area.

119
Figure S4.3. Daily geolocations and maximum diving depths during daytime (left) and night periods (right) of tag 154062 (Galapagos shark) in relation to bathymetry (Deployment duration: 35 days). Empty symbols indicate geolocations for which depth time series data is missing due to the duty cycle configuration. Violet lines indicate the border of the MMHMP area.

120
Figure S4.4. Daily geolocations and maximum diving depths during daytime (left) and night periods (right) of tag 154064 (Galapagos shark) in relation to bathymetry (Deployment duration: 28 days). Empty symbols indicate geolocations for which depth time series data is missing due to the duty cycle configuration. Violet lines indicate the border of the MMHMP area.

121
Figure S4.5. Daily geolocations and maximum diving depths during daytime (left) and night periods (right) of tag 154065 (Galapagos shark) in relation to bathymetry (Deployment duration: 18 days). Empty symbols indicate geolocations for which depth time series data is missing due to the duty cycle configuration. Violet lines indicate the border of the MMHMP area.

122
Figure S4.6. Daily geolocations and maximum diving depths during daytime (left) and night periods (right) of tag 173480 (Galapagos shark) in relation to bathymetry (Deployment duration: 95 days. Empty symbols indicate geolocations for which depth time series data is missing due to the duty cycle configuration. Violet lines indicate the border of the MMHMP area.

123
Figure S4.7. 50% likelihood areas of each tag. Different colour represents different days.
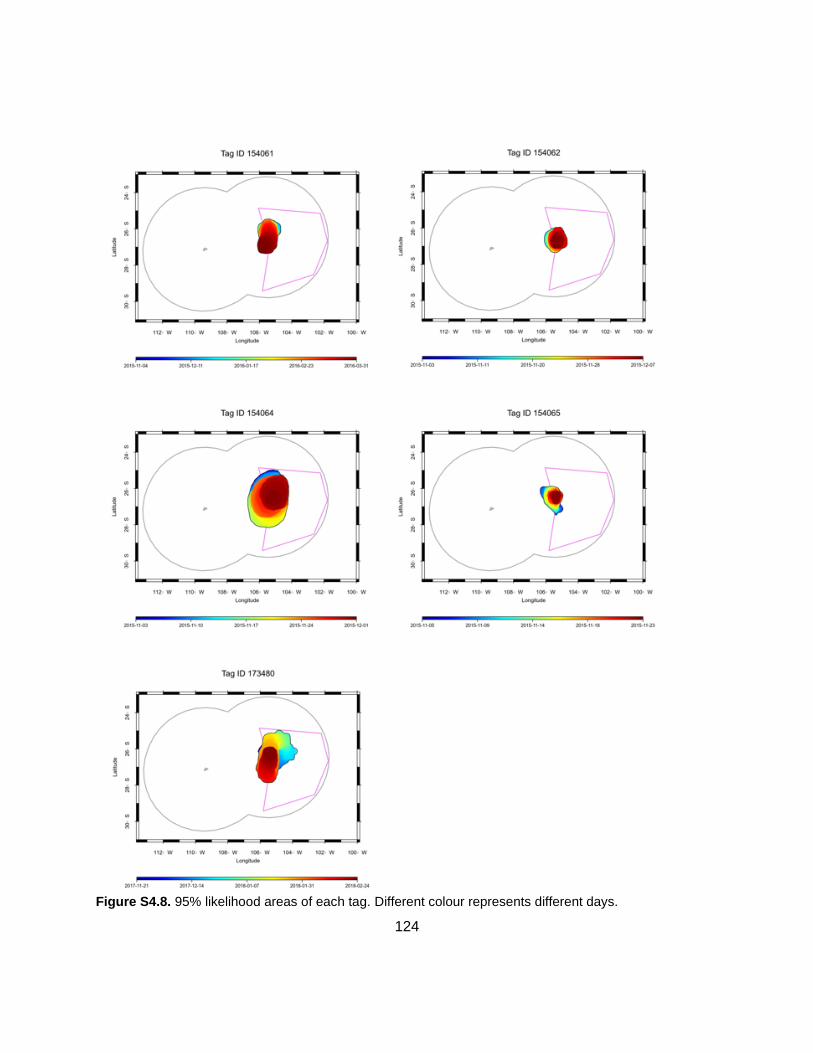
124
Figure S4.8. 95% likelihood areas of each tag. Different colour represents different days.

125
Figure S4.9. 99% likelihood areas of each tag. Different colour represents different days.

126
Figure S4.10. Time at different depths during night and daytime periods per individual. Female (F) and male (M).

127
Figure S4.11. Distance of daily geolocations to Salas y Gómez islet per vertical behaviour cluster of all archivally-tagged Galapagos sharks.

128
Figure S5.1. Number of cluster (k) suggested by BIC values.

129
Table S2.1. Mean wave energy values (kW/m) and percentage of occurrence from every (360° degree) direction. Autumn (March- June); winter (June-September); spring (September-December); summer (December -March).
Direction
(degree)
Mean Power
Percentage occurrence
Mean Power
Percentage occurrence
Mean Power
Percentage occurrence
Mean Power
Percentage occurrence
Long-term Wave Energy (2005-2015) Autumn Winter Spring Summer 0 45.996 0.1 49.817 0.08 29.23 0.08 15.169 0.03 22.5 0 0.01 47.896 0.18 51.586 0.16 0 0 45 0 0 30.633 0.87 32.205 0.87 20.171 0.15 67.5 22.668 0.3 38.359 2.08 29.567 2.34 18.31 1.4 90 41.308 1.34 64.37 1.8 29.915 1.68 19.312 0.61 112.5 41.924 0.78 59.407 2.02 51.097 0.6 26.563 0.55 135 80.406 1 48.923 2.2 38.107 0.34 26.459 0.44 157.5 68.59 1.15 60.981 5.15 39.376 1.24 60.248 0.19 180 68.195 18.65 68.696 14.95 53.093 9.01 37.128 4.34 202.5 61.698 53.63 77.077 44.38 54.84 52.7 36.6 41.38 225 59.686 15.53 70.942 23.24 47.086 22.07 32.513 20.93 247.5 38.733 3.16 56.676 1.55 31.134 2.9 30.431 6.21 270 36.067 1.55 44.103 0.69 32.888 1.21 32.583 5 292.5 43.165 2.07 52.508 0.54 26.892 2.34 34.588 12.62 315 42.979 0.73 54.927 0.28 35.519 2.46 38.798 6.14 337.5 0 0 0 0 0 0 0 0 Recent Wave Energy (2016-2017)
Autumn Winter Spring Summer 0 0 0 0 0.42 0 0 0 0 22.5 0 0 15.471 2.51 0 0 0 0 45 0 0 14.976 1.26 0 0 0 0 67.5 18.433 15.83 0 0 0 0 0 0 90 0 0 0 0 0 0 0 0 112.5 0 0.42 0 0 0 0 0 0 135 67.318 9.17 14.243 3.35 0 0 0 0 157.5 70.302 7.92 0 0.42 0 0 0 0 180 58.7 12.92 28.605 10.04 15.983 6.05 26.789 7.66 202.5 40.651 45.42 48.94 76.99 28.868 51.21 32.747 72.18 225 32.686 8.33 50.62 3.77 29.566 16.13 31.654 16.53 247.5 0 0 0 0 24.626 7.66 26.55 1.21 270 0 0 0 0 24.761 6.45 22.706 0.81 292.5 0 0 20.776 0.84 19.917 7.66 25.284 1.61 315 0 0 0 0.42 31.161 4.84 0 0 337.5 0 0 0 0 0 0 0 0

130
Table S2.2. Environmental variables used in the DistLM analysis for every site and season. Sample sites are showed in Figure 2.1.
Season/ Site Temperature (°C)
Historical wave energy
(kW/m)
Specific wave energy (kW/m)
Distance from shore (m)
Shelf width (m)
Winter Ana hukahu - - - - - Ovahe 20.669 30.633 14.976 392.875 250 Omohi - - - - - Kari Kari 20.69 56.676 0 324.25 250 Motu tautara 19.285 44.103 20.776 202.5 0 Poike 22.668 18.433 395.5 250 Vaihu 20 60.981 28.605 463.75 1000 Vinapu 20 77.077 48.94 311.75 750 Spring Ana hukahu - - - - - Ovahe 23.746 32.205 0 392.875 250 Omohi - - - - - Kari Kari 23.463 31.134 24.626 324.25 250 Motu tautara 23.149 32.888 19.917 202.5 0 Poike - - - - - Vaihu 22 39.376 15.963 463.75 1000 Vinapu 22 54.84 28.868 311.75 750 Summer Ana hukahu 26 26.563 0 386.5 1000 Ovahe 26.758 20.171 0 392.875 250 Omohi 26.247 38.798 0 255.25 0 Kari Kari 26.59 30.431 26.55 324.25 250 Motu tautara 26.38 32.583 25.284 202.5 0 Poike 26.43 18.31 0 395.5 250 Vaihu 26 60.248 26.789 463.75 1000 Vinapu 26 36.6 32.747 311.75 750 Autumn Ana hukahu 22.683 0 0 392.875 250 Ovahe 22.708 42.979 0 255.25 0 Omohi 22.84 38.733 0 324.25 250 Kari Kari 22.773 36.067 0 202.5 0 Motu tautara 22 22.668 18.433 395.5 250 Poike 22 68.59 58.7 463.75 1000 Vaihu 22 61.698 40.651 311.75 750 Vinapu 22 41.924 67.318 386.5 1000

131
Table S2.3. PERMANOVA test for all the pelagic fish species. Figures in bold indicate significant results.
Level Type Pseudo-F P(perm) Unique perms
MAIN TEST Site 5 Fixed 4.9648 0.0001 9943 Season 4 Fixed 8.274 0.0001 9924 Season x Site 1.3362 0.0881 9887 PAIR-WISE TEST Sites Ovahe. Kari Kari 0.1441 9964 Ovahe. Motu Tautara 0.0978 9977 Ovahe. Vaihu 0.0001 9951 Ovahe. Vinapu 0.0158 9956 Kari Kari. Motu Tautara 0.2019 9947 Kari Kari. Vaihu 0.0001 9948 Kari Kari. Vinapu 0.0047 9956 Motu Tautara. Vaihu 0.0001 9956 Motu Tautara. Vinapu 0.0005 9954 Vaihu. Vinapu 0.001 9943 Season Autumn. Spring 0.4036 9960 Autumn. Summer 0.1654 9954 Autumn. Winter 0.0001 9956 Spring. Summer 0.1402 9952 Spring. Winter 0.0001 9945 Summer. Winter 0.0001 9965
Table S2.4. DistLM test for all the pelagic fish species. Figures in bold indicate significant results.
Variable SS(trace) Pseudo-F P Prop.
Site Temperature (ºC) 913.69 1.9302 0.085 0.12117 Historical WE (kW/m) 1008.9 2.1624 0.052 0.13379 Specific WE (kW/m) 1162.3 2.5512 0.032 0.15414 Distance from shore (m) 1093.5 2.3746 0.043 0.14502 Shelf width (m) 2004.5 5.0691 0.001 0.26583 Season Temperature (ºC) 639.58 1.1143 0.3476 0.058295 Historical WE (kW/m) 1887 3.7986 0.0308 0.17199 Specific WE (kW/m) 462.36 0.92675 0.437 0.042142

132
Table S3.1. PERMANOVA test for all the large fish species. Numbers in bold indicate significant results. AC, Aulostomus chinensis; AS, Acanthocybium solandri; CG, Carcharhinus galapagensis; CH, Coryphaena hippurus; KP, Katsuwonus pelamis; PD, Pseudocaranx dentex; SL, Seriola lalandi; TeA, Kajikia audax; KA, Thunnus albacares; TyA, Thyrsites atun.
AC AS CG CH KP PD SL TeA KA
AS 0.124
CG 0.238 0.08
CH 0.197 0.08 0.039
KP 0.175 0.297 0.039 0.08
PC 0.383 0.011 0.083 0.011 0.011
SL 0.857 0.08 0.174 0.049 0.23 0.615
TeA 0.242 0.565 0.449 0.08 0.369 0.126 0.329
ThA 0.08 0.238 0.045 0.08 0.982 0.011 0.127 0.304
TyA 0.236 0.795 0.037 0.08 0.886 0.036 0.174 0.314 0.886

133
Table S4.1. Complete data of the entire catch during both expeditions 2015 and 2017. Time of deployment; No data (ND); Conv. (Conventional) Tag ID (identification number); MiniPAT (satellite tag) ID (identification number).
Species Date Time Expedition Gear type
Conv. Tag ID
Total length (cm)
Sex MiniPAT
ID
Seriola lalandi 2015-11-02 16:50 CIMAR 21 Longline 01V 75 ND
Carcharhinus
galapagensis 2015-11-02 16:50 CIMAR 21 Longline 02V 76 F
Seriola lalandi 2015-11-02 16:50 CIMAR 21 Longline 03V 75 ND
Carcharhinus
galapagensis 2015-11-02 16:50 CIMAR 21 Longline 04V 160 F 154062
Seriola lalandi 2015-11-02 16:50 CIMAR 21 Longline 1 ND ND
Seriola lalandi 2015-11-02 16:50 CIMAR 21 Longline 06V 77 ND
Carcharhinus
galapagensis 2015-11-02 16:50 CIMAR 21 Longline 05VB 145 M 154066
Carcharhinus
galapagensis 2015-11-02 16:50 CIMAR 21 Longline 07V 160 M 154064
Carcharhinus
galapagensis 2015-11-02 16:50 CIMAR 21 Longline 08V 114 F
Seriola lalandi 2015-11-03 10:10 CIMAR 21 Longline 09V 75 ND
Carcharhinus
galapagensis 2015-11-03 10:10 CIMAR 21 Longline 10V 87 F
Seriola lalandi 2015-11-03 17.35 CIMAR 21 Longline 65A 86 ND
Seriola lalandi 2015-11-03 17.35 CIMAR 21 Longline 62A 81.5 ND
Carcharhinus
galapagensis 2015-11-03 17.35 CIMAR 21 Longline 68A 81.5 M
Carcharhinus
galapagensis 2015-11-03 17.35 CIMAR 21 Longline 66A 105 M
Carcharhinus
galapagensis 2015-11-03 17.35 CIMAR 21 Longline 63A 108 F
Carcharhinus
galapagensis 2015-11-03 17.35 CIMAR 21 Longline 64A 90.1 M
Seriola lalandi 2015-11-03 17.35 CIMAR 21 Longline 61A 102 ND
Carcharhinus
galapagensis 2015-11-03 17.35 CIMAR 21 Longline 69A 93 M
Carcharhinus
galapagensis 2015-11-03 17.35 CIMAR 21 Longline 70A 86 F
Carcharhinus
galapagensis 2015-11-03 17.35 CIMAR 21 Longline 2 ND ND
Carcharhinus
galapagensis 2015-11-03 17.35 CIMAR 21 Longline 67A 83 M
Carcharhinus
galapagensis 2015-11-03 17.35 CIMAR 21 Longline 3 ND ND
Seriola lalandi 2015-11-03 17.35 CIMAR 21 Longline 39N 124 ND 154061
Carcharhinus
galapagensis 2015-11-03 17.35 CIMAR 21 Longline 32N 104 M
Carcharhinus
galapagensis 2015-11-03 17.35 CIMAR 21 Longline 34N 86 M
Carcharhinus
galapagensis 2015-11-03 17.35 CIMAR 21 Longline 4 84 M

134
Carcharhinus
galapagensis 2015-11-03 17.35 CIMAR 21 Longline 31N 120 F
Seriola lalandi 2015-11-04 9.05 CIMAR 21 Handline 37N 76.5 ND
Seriola lalandi 2015-11-04 9.20 CIMAR 21 Handline 33N 94.5 ND
Seriola lalandi 2015-11-04 9.50 CIMAR 21 Handline 36N 93 ND
Carcharhinus
galapagensis 2015-11-04 10.25 CIMAR 21 Handline 35N 91.5 F
Carcharhinus
galapagensis 2015-11-04 10.30 CIMAR 21 Handline 40N 108 F
Carcharhinus
galapagensis 2015-11-04 10.40 CIMAR 21 Handline 30B 110 M
Seriola lalandi 2015-11-04 17.40 CIMAR 21 Handline 23B 78 ND
Seriola lalandi 2015-11-04 17.46 CIMAR 21 Handline 21B 71 ND
Seriola lalandi 2015-11-04 17.51 CIMAR 21 Handline 25B 76.5 ND
Carcharhinus
galapagensis 2015-11-04 17.52 CIMAR 21 Handline 26B 97 M
Carcharhinus
galapagensis 2015-11-04 17.56 CIMAR 21 Handline 29B 79 M
Seriola lalandi 2015-11-04 18.05 CIMAR 21 Handline 22B 75.5 ND
Carcharhinus
galapagensis 2015-11-04 18.10 CIMAR 21 Handline 24B 100 F
Carcharhinus
galapagensis 2015-11-04 18.14 CIMAR 21 Handline 27B 96.5 F
Carcharhinus
galapagensis 2015-11-04 18.20 CIMAR 21 Handline 28B 93.5 M
Carcharhinus
galapagensis 2015-11-04 18.25 CIMAR 21 Handline 46AZ 101 F
Seriola lalandi 2015-11-04 18.33 CIMAR 21 Handline 47AZ 82 ND
Carcharhinus
galapagensis 2015-11-04 18.37 CIMAR 21 Handline 50AZ 93 F
Carcharhinus
galapagensis 2015-11-04 18.45 CIMAR 21 Handline 44AZ 82.5 F
Seriola lalandi 2015-11-04 18.50 CIMAR 21 Handline 43AZ 69 ND
Carcharhinus
galapagensis 2015-11-04 18.55 CIMAR 21 Handline 41AZ 85 F
Carcharhinus
galapagensis 2015-11-04 17.00 CIMAR 21 Handline s/n 170 F 154065
Carcharhinus
galapagensis 2015-11-04 17.10 CIMAR 21 Handline 48AZ 80 F
Seriola lalandi 2015-11-04 17.15 CIMAR 21 Handline 49AZ 74 ND
Carcharhinus
galapagensis 2017-11-20 18.30 SOSF 380 Handline ND 130 F
Carcharhinus
galapagensis 2017-11-20 18.35 SOSF 380 Handline ND 110 ND
Carcharhinus
galapagensis 2017-11-20 18.40 SOSF 380 Handline 40R 100 F
Seriola lalandi 2017-11-20 18.45 SOSF 380 Handline 12 83 ND
Carcharhinus
galapagensis 2017-11-20 18.50 SOSF 380 Handline 13 128 ND
Carcharhinus
galapagensis 2017-11-21 17.43 SOSF 380 Handline 8 119 F 173480
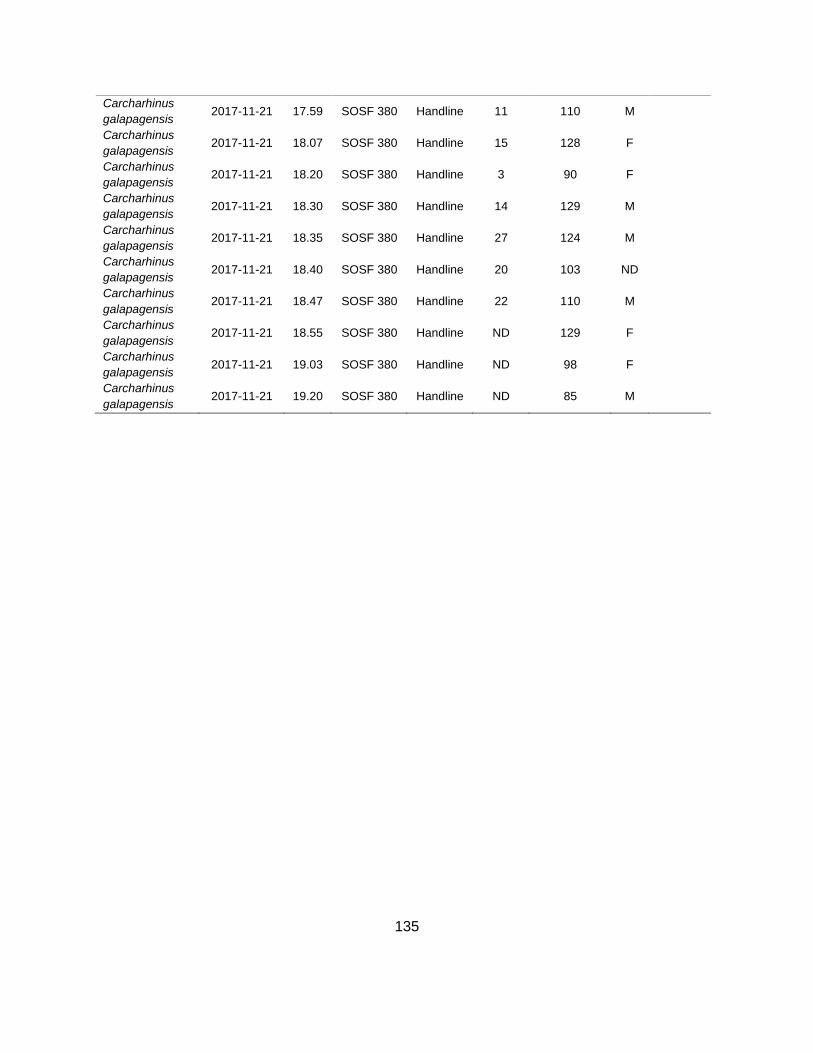
135
Carcharhinus
galapagensis 2017-11-21 17.59 SOSF 380 Handline 11 110 M
Carcharhinus
galapagensis 2017-11-21 18.07 SOSF 380 Handline 15 128 F
Carcharhinus
galapagensis 2017-11-21 18.20 SOSF 380 Handline 3 90 F
Carcharhinus
galapagensis 2017-11-21 18.30 SOSF 380 Handline 14 129 M
Carcharhinus
galapagensis 2017-11-21 18.35 SOSF 380 Handline 27 124 M
Carcharhinus
galapagensis 2017-11-21 18.40 SOSF 380 Handline 20 103 ND
Carcharhinus
galapagensis 2017-11-21 18.47 SOSF 380 Handline 22 110 M
Carcharhinus
galapagensis 2017-11-21 18.55 SOSF 380 Handline ND 129 F
Carcharhinus
galapagensis 2017-11-21 19.03 SOSF 380 Handline ND 98 F
Carcharhinus
galapagensis 2017-11-21 19.20 SOSF 380 Handline ND 85 M

136
Table S4.2. Minimum, maximum, and average depth of night and daytime periods from all tags as well as its standard deviation (SD).
Tag ID daytime n (days of data)
Depth (m)
Minimum Maximum Average SD
154061 Day 59 9.5 75 19 7.8
154061 Night 58 5.5 100.5 26.4 12.8
154062 Day 14 2 114 24.7 30.8
154062 Night 13 0.5 131.5 25.6 22.4
154064 Day 11 0.5 195.5 58.1 46.1
154064 Night 11 0.5 165.5 37.5 34.7
154065 Day 18 1.5 109 40.4 30.9
154065 Night 18 1 100.5 40.3 22.8
173480 Day 38 0.5 96 26.6 16.2
173480 Night 38 0.5 63 11.4 8.3
Table S4.3. Number of data points per vertical behaviour cluster and Galapagos shark tagged.
Tag ID
Data points (n)
Cluster 1 Cluster 2
154062 2 11
154064 5 6
154065 6 12
173480 0 37
Sum 13 66
Percentage 16.5 83.5