Characterization of Avian H5N1 Influenza Viruses from Poultry in Hong Kong

The Ecology of Influenza A Viruses in Wild Birds in SouthernAfrica
Graeme S. Cumming,1 Alexandre Caron,2,3,4 Celia Abolnik,5,6 Giovanni Cattoli,7
Leo W. Bruinzeel,1,8 Christina E. Burger,5 Krizia Cecchettin,7 Ngoni Chiweshe,2
Bontsi Mochotlhoane,5 Gregory L. Mutumi,1 and Mduduzi Ndlovu1
1Percy FitzPatrick Institute, DST/NRF Centre of Excellence, University of Cape Town, Rondebosch, Cape Town, 7701, South Africa2UPR AGIRs, Department ES, Cirad, Harare, Zimbabwe3UPR AGIRs, Department ES, Cirad, Montpellier, France4Mammal Research Institute, Department of Zoology and Entomology, University of Pretoria, Pretoria, South Africa5ARC-Pretoria Veterinary Institute, Old Soutpan Road, Onderstepoort 0110, South Africa6Department of Animal Production, Faculty of Veterinary Sciences, University of Pretoria, Old Soutpan Road, Pretoria 0110, South Africa7OIE/FAO Reference Laboratory for Avian Influenza and Newcastle Disease, Istituto Zooprofilattico Sperimentale delle Venezie, viale dell’Universita 10,
35020 Legnaro, PD, Italy8Altenburg & Wymenga Ecological Consultants, P.O. Box 32, 9269 ZR Feanwalden, The Netherlands
Abstract: Avian influenza viruses (AIVs) are pathogens of global concern, but there has been little previous
research on avian influenza in southern Africa and almost nothing is known about the dynamics of AIVs in the
region. We counted, captured and sampled birds regularly at five sites, two in South Africa (Barberspan and
Strandfontein) and one in each of Botswana (Lake Ngami), Mozambique (Lake Chuali) and Zimbabwe (Lakes
Manyame and Chivero) between March 2007 and May 2009. The South African and Zimbabwean sites were
visited every 2 months and the sites in Botswana and Mozambique every 4 months. During each visit we
undertook 5–7 days of standardised bird counts followed by 5–10 days of capturing and sampling water-
associated birds. We sampled 4,977 birds of 165 different species and completed 2,503 half-hour point counts.
We found 125 positive rRT-PCR cases of avian influenza across all sites. Two viruses (H1N8 and H3N8) were
isolated and additional H5, H6 and H7 strains were identified. We did not positively identify any highly
pathogenic H5N1. Overall viral prevalence (2.51%) was similar to the lower range of European values, con-
siderable spatial and temporal variation occurred in viral prevalence, and there was no detectable influence of
the annual influx of Palearctic migrants. Although waterbirds appear to be the primary viral carriers, passerines
may link wild birds and poultry. While influenza cycles are probably driven by the bird movements that result
from rainfall patterns, the epidemiology of avian influenza in wild birds in the subregion is complex and there
appears to be the possibility for viral transmission throughout the year.
Electronic supplementary material: The online version of this article
(doi:10.1007/s10393-011-0684-z) contains supplementary material, which is available
to authorized users.
Published online: April 23, 2011
Correspondence to: Graeme S. Cumming, e-mail: [email protected]
EcoHealth 8, 4–13, 2011DOI: 10.1007/s10393-011-0684-z
Original Contribution
� 2011 International Association for Ecology and Health

Keywords: avian influenza, pathogen, epidemiology, Anatidae, South Africa, Zimbabwe
INTRODUCTION
Influenza A viruses have long been acknowledged as
pathogens of global concern. In recent years, outbreaks of
highly pathogenic avian influenza (HPAI) in populations of
domestic and wild birds, and the related deaths of nearly
300 people (WHO, 2010), have heightened fears of a new
influenza pandemic in the human population (e.g. Pickles,
2006; Enserink, 2006). Assessments of the risks that are
posed by avian influenza, and the development of appro-
priate response strategies in the event of an epidemic or
pandemic, rely heavily on a fundamental scientific under-
standing of avian influenza virus (AIV) dynamics in pop-
ulations of domestic and wild birds (Dudley, 2008).
Although low pathogenic avian influenza (LPAI) viral
prevalence in western European and North American wild
bird populations has been well documented (Olsen et al.,
2006), it is unclear how the long-distance movements of
migratory and nomadic bird species relate to larger-scale
spatial and temporal variation in AIV genotypes, mainte-
nance, and epizootics/epidemics (Krauss & Webster, 2010;
Kilpatrick et al., 2006). One of the largest single gaps in the
geographical coverage of AIV sampling has been southern
Africa (Olsen et al., 2006; Kilpatrick et al., 2006; Gaidet
et al., 2007), a region that is at risk following the detection
of highly pathogenic strains in sub-Saharan Africa north of
the Zambezi (Gaidet et al., 2008; Fasina et al., 2009).
Although some intriguing data exist from South Africa
(such as the finding that precursors to pathogenic AIV
strains are introduced to and possibly moved between
ostrich farms by Egyptian Geese Alopochen aegyptiacus; e.g.
see Abolnik et al., 2010; Abolnik et al., 2009; Sinclair et al.,
2005), little relevant research has been carried out in most
southern African countries.
By comparison to western Europe, southern Africa has
a mild winter; highly variable and often scarce rainfall; a
higher diversity of bird species; no true geese or swans; and
many nomadic waterbirds but no truly migratory afro-
tropical Anas ducks (Cumming et al., 2008; Underhill et al.,
1999). We tested the predictions that (1) due to its more
arid environment and absence of migratory Palearctic
ducks, LPAI prevalence in wild waterbirds should be lower
in southern Africa than in Europe; (2) due to the presence
of many opportunistic, colonial and nomadic waterbird
species, and the lack of migratory corridors (Hockey,
2000), LPAI prevalence in wild birds in southern Africa
should show relatively little spatial variation along longi-
tudinal and latitudinal gradients; and (3) the arrival of
Palearctic migrants in September (see Appendix 1 in Sup-
porting information for details), including charadriids
known as potential LPAI reservoirs, should create a pulse in
influenza occurrences in Afrotropical species.
While exploring these fundamental assumptions for
the first time, we also provide a wealth of new and useful
information on AIV and wild birds in southern Africa. Our
results suggest that none of our starting assumptions can be
strongly supported. Some re-thinking of prevailing
assumptions about influenza A viruses in southern African
bird populations thus appears necessary in planning health
care and risk management strategies.
METHODS
Project Design and Field Sites
Data were collected in Botswana, Mozambique, South
Africa and Zimbabwe from March 2007 to May 2009. We
worked on a regular basis at five different sites (Fig. 1) and
12–15 sampling locations per site. We counted and sam-
pled birds at daily, bimonthly and annual time scales. Our
three core sites [Barberspan and Strandfontein in South
Africa, and the Manyame catchment in Zimbabwe
(including Lakes Chivero and Manyame)] were sampled
every 2 months and our Botswana site (Lake Ngami) and
Mozambique site (Lake Chuali) every 4 months. We also
sampled a small number of birds during a single ‘test’
sampling mission to Massingir Dam in Mozambique. Exact
sampling dates and coordinates of capture sites are given in
Appendix 2 (Supporting information) and additional
details on study sites in Appendix 3 (Supporting infor-
mation).
Counting Protocols
Each site visit included 5–7 days of standardised bird
counts followed by 5–10 days of bird captures in the same
locations (Fig. 2). Counts consisted of a 10-min habitua-
tion period followed by a 30-min counting period, during
The Ecology of Influenza A Viruses in Wild Birds in Southern Africa 5

which the number and species of all birds within a 150 m
radius of the (stationary) observers were recorded. Each
location was counted at four different times of day over a
5–7 day period prior to captures [additional details in
Appendix 3 (Supporting information)]. Over the 2 years of
the study we completed 2,503 half-hour point counts. For
each of our three core sites (Barberspan, Manyame/Chivero
and Strandfontein) the count data also provide estimates
from 13 different points in time (i.e. every 2 months for 2
years), giving us a spatiotemporally balanced sampling
design for exploring both spatial and temporal variation in
the bird community.
Capture and Sampling Protocols
Captures used standard procedures as detailed in Appendix
3 (Supporting information). We targeted ducks because
they are considered reservoir hosts of some type A AIVs in
Europe and Asia. The other sampled species were by-catch
(i.e. they were captured during the process of catching
ducks). In addition to ancillary data (morphometry, pho-
tographs, blood, feathers) we collected two cloacal and two
tracheal swabs per bird. Birds recaptured in the same week
were not resampled. All swabs were placed in cryovials in
viral transport medium (Hank’s salt solution with antibi-
otics and fungicides) and frozen in liquid nitrogen within
half an hour of collection.
The swabs were stored in a -70�C freezer and trans-
ported in dry ice or liquid nitrogen to an FAO reference
laboratory, either the Agricultural Research Council-On-
derstepoort Veterinary Institute, Pretoria, South Africa
(ARC-OVI) or the Istituto Zooprofilattico Sperimentale
delle Venezie, Padova, Italy (IZSVe) for analysis (see
Appendix 3 in Supporting information for details). Sets of
swabs were randomised by laboratory; each received the
first cloacal and second tracheal swab from one bird and
the second cloacal and first tracheal swab from the next
bird. All samples from Botswana and Mozambique were
analysed at IZSVe.
Sources of error included (1) failure to obtain a full
complement of swabs, due to bird escapes or shortages of
vials; (2) labelling errors; (3) loss or destruction of vials in
transit and (4) mistakes in allocation of vials to laborato-
ries. Most of these errors were random and hence unbiased.
We had fewer than four swabs per bird in just under 4% of
cases. Samples were only sent to IZSVe on completion of
the project, giving a delay between sampling and analysis of
2–24 months that may have affected the probability of AIV
detection (Forster et al., 2008).
Data Analysis
Virus prevalence was too low to determine the influence of
the number of swabs on virus detection probability. Since
missing swabs were <4% and randomly distributed by
species, we assumed that each sampled bird (rather than
Figure 1. Map of southern Africa showing sampling sites mentioned
in this article. Site codes: ZIM Lakes Chivero and Manyame, NGA
Lake Ngami, MAS Massingir Dam, CHU Lake Chuali, BAR
Barberspan, STR Strandfontein. Our three core sites were STR,
BAR and ZIM, which fall in different biomes along a north–south
latitudinal gradient.
Figure 2. Example of a walk-in trap used to catch ducks. In this
picture, Mduduzi Ndlovu (L) and Leo Bruinzeel (R) capture
Egyptian geese at Strandfontein.
6 Graeme S. Cumming et al.

each swab) had an equal chance of viral detection. Virus
prevalence was calculated as the ratio of the number of
influenza viruses detected to the number of birds sampled.
Since recaptures were not re-sampled during the same
capture mission, and since each sampling effort was at least
2 months apart, we treated samples from recaptures
(including birds that we had ringed and those ringed by
others) as independent.
Having quantified virus prevalence for each species by
site, we calculated overall prevalence for all bird species and
all sites. Bird count summaries by site used the average
number of birds counted across all point counts.
For the Palearctic migrant analysis we included all
birds found in our study sites that were both listed in class
6 (i.e. intercontinental and marine migrants) of the Rob-
erts’ database (Hockey et al., 2004) and associated with
wetland and estuarine habitats. A full list of Palearctic
migrant species and their abundances is presented in the
Supporting information in Appendix 1. The total number
of foraging and non-foraging Palearctic migrants for each
sampling mission was converted to a mean abundance by
dividing the total count for a single mission by four, since
each point count location was counted four times. Since the
total numbers of birds are more relevant than their relative
abundance to the role of Palearctic migrants in influenza
transmission, we did not divide these data by the number
of locations per site. We then used Spearman’s rank-order
correlations to test for a significant relationship between
the number of Palearctic migrants, the abundance of
anatids, and virus prevalence.
RESULTS
We sampled a total of 4,977 birds of 165 different species,
including 158 recaptures. Captures were distributed
unevenly across sites (Table 1) despite comparable sam-
pling effort, with the Zimbabwean site yielding the most
birds (n = 1916), followed by Barberspan (n = 1418) and
Strandfontein (n = 888). Differences in the composition of
species caught resulted primarily from differences in local
species composition and catchability. A full listing of the
number of individuals of the 165 sampled species is pro-
vided in Appendix 1 (Supporting information). Some of
the data from Zimbabwe have been presented previously by
Caron et al. (2010a).
From 4,977 sampled birds, 125 were influenza A
positive, giving a prevalence across all species and sites of
2.51%. The probability of an influenza-positive sample being
from a cloacal or a tracheal swab was almost identical
(n = 125, P = 0.48 vs. P = 0.52 for cloacal and tracheal
swabs, respectively; 5 birds were positive on both cloacal and
tracheal swabs, one on both tracheal swabs, and none on both
cloacal swabs). Infuenza A virus prevalence across different
bird families was uneven (Table 1), with four families
(Anatidae, Jacanidae, Charadriidae and Dendrocygnidae)
together contributing 72.8% of positive samples; the same
four families represented 67.5% of birds captured.
Reliable conclusions cannot be drawn from small
sample sizes. We sampled over 20 individuals (i.e. the
influence of an outlier was 5% or less) for 18 different bird
families. From these families the highest mean prevalence
values across all sites occurred in the Alaudidae (larks; 24
birds, 3 positives, prevalence 12.5%) and the Dend-
rocygnidae (whistling ducks; 234 birds, 12 positives, prev-
alence 5.15%). Also of note were the Scolopacidae
(sandpipers and snipes, 180 birds, 6 positives, prevalence
3.33%), Jacanidae (jacanas, 492 birds, 15 positives, preva-
lence = 3.05%), Ploceidae (weavers, 165 birds, 5 positives,
prevalence = 3.03%), Charadriidae (plovers and lapwings;
458 birds, 12 positives, prevalence = 2.62%) and Anatidae
(ducks; 2168 birds, 52 positives, prevalence = 2.4%).
Conversely, despite reasonably large sample sizes, no AIV
RNA was found in the Columbidae (pigeons and doves;
n = 122), Glareolidae (pratincoles and coursers; n = 116)
or Ardeidae (herons, egrets and bitterns; n = 88).
There was no spatial synchrony in influenza occurrences,
with the prevalence of influenza viruses in any 2-month
sampling period not being significantly correlated between
any pair of sites (n = 12 or 13, Spearman’s rho < 0.43, P not
significant to the 0.05 or 0.1 levels in all cases).
Two influenza viruses were isolated and several dif-
ferent strains identified (Table 2). An H1N8 influenza virus
was isolated from an Egpytian Goose Alopochen aegyptiacus
caught at Barberspan (see Abolnik et al., 2010) and an
H3N8 influenza virus from a Red-billed Teal Anas ery-
throrhyncha caught at Strandfontein. Type-related infor-
mation was obtained via rRT-PCR for an additional 22
viruses, which included 10 H5-positive and 10 H7-positive
samples as well as two H6-positives. Amplicons from the
reactions were insufficient for obtaining DNA sequences,
and thus the amino acid sequence at the HA0 cleavage sites
could not be determined; it is therefore unknown whether
the H5 and H7 viruses were of high or low pathogenicity.
H7 strains were only identified from Zimbabwe but were
found in five different species.
The Ecology of Influenza A Viruses in Wild Birds in Southern Africa 7
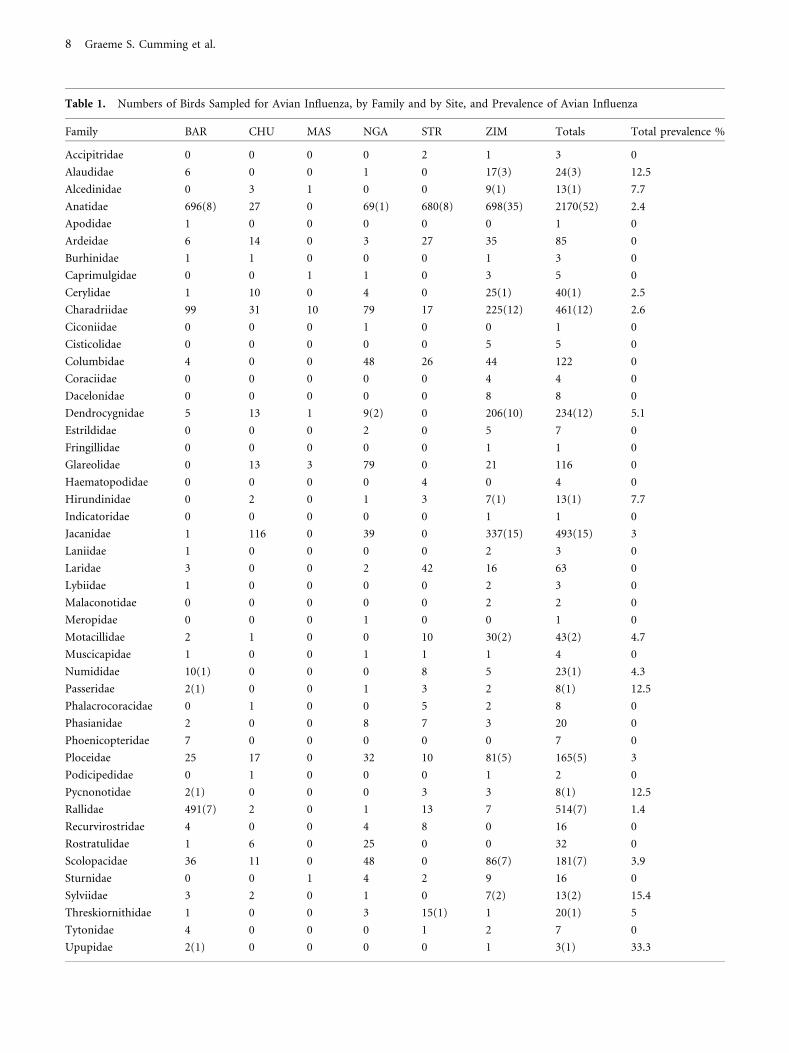
Table 1. Numbers of Birds Sampled for Avian Influenza, by Family and by Site, and Prevalence of Avian Influenza
Family BAR CHU MAS NGA STR ZIM Totals Total prevalence %
Accipitridae 0 0 0 0 2 1 3 0
Alaudidae 6 0 0 1 0 17(3) 24(3) 12.5
Alcedinidae 0 3 1 0 0 9(1) 13(1) 7.7
Anatidae 696(8) 27 0 69(1) 680(8) 698(35) 2170(52) 2.4
Apodidae 1 0 0 0 0 0 1 0
Ardeidae 6 14 0 3 27 35 85 0
Burhinidae 1 1 0 0 0 1 3 0
Caprimulgidae 0 0 1 1 0 3 5 0
Cerylidae 1 10 0 4 0 25(1) 40(1) 2.5
Charadriidae 99 31 10 79 17 225(12) 461(12) 2.6
Ciconiidae 0 0 0 1 0 0 1 0
Cisticolidae 0 0 0 0 0 5 5 0
Columbidae 4 0 0 48 26 44 122 0
Coraciidae 0 0 0 0 0 4 4 0
Dacelonidae 0 0 0 0 0 8 8 0
Dendrocygnidae 5 13 1 9(2) 0 206(10) 234(12) 5.1
Estrildidae 0 0 0 2 0 5 7 0
Fringillidae 0 0 0 0 0 1 1 0
Glareolidae 0 13 3 79 0 21 116 0
Haematopodidae 0 0 0 0 4 0 4 0
Hirundinidae 0 2 0 1 3 7(1) 13(1) 7.7
Indicatoridae 0 0 0 0 0 1 1 0
Jacanidae 1 116 0 39 0 337(15) 493(15) 3
Laniidae 1 0 0 0 0 2 3 0
Laridae 3 0 0 2 42 16 63 0
Lybiidae 1 0 0 0 0 2 3 0
Malaconotidae 0 0 0 0 0 2 2 0
Meropidae 0 0 0 1 0 0 1 0
Motacillidae 2 1 0 0 10 30(2) 43(2) 4.7
Muscicapidae 1 0 0 1 1 1 4 0
Numididae 10(1) 0 0 0 8 5 23(1) 4.3
Passeridae 2(1) 0 0 1 3 2 8(1) 12.5
Phalacrocoracidae 0 1 0 0 5 2 8 0
Phasianidae 2 0 0 8 7 3 20 0
Phoenicopteridae 7 0 0 0 0 0 7 0
Ploceidae 25 17 0 32 10 81(5) 165(5) 3
Podicipedidae 0 1 0 0 0 1 2 0
Pycnonotidae 2(1) 0 0 0 3 3 8(1) 12.5
Rallidae 491(7) 2 0 1 13 7 514(7) 1.4
Recurvirostridae 4 0 0 4 8 0 16 0
Rostratulidae 1 6 0 25 0 0 32 0
Scolopacidae 36 11 0 48 0 86(7) 181(7) 3.9
Sturnidae 0 0 1 4 2 9 16 0
Sylviidae 3 2 0 1 0 7(2) 13(2) 15.4
Threskiornithidae 1 0 0 3 15(1) 1 20(1) 5
Tytonidae 4 0 0 0 1 2 7 0
Upupidae 2(1) 0 0 0 0 1 3(1) 33.3
8 Graeme S. Cumming et al.

Influenza viruses are in circulation across the subre-
gion throughout the year (Fig. 3), with no obvious pattern
in relation to temperature or rainfall. Patterns between
years also appear to be inconsistent, with peaks in viral
prevalence in December 2007 and January 2008 in Zim-
babwe and Barberspan not present in 2008–2009.
These data should be interpreted within the context of
the sampled bird communities. We had relatively high
numbers of influenza-positive birds from each of four avian
families: Anatidae, Charadriidae, Dendrocygnidae and
Jacanidae. The birds in each of these families show differing
seasonal trends in abundance as well as considerable spatial
variation between our three core sites (see examples in
Appendix 4 in Supporting information).
During counts we recorded 32,153 individuals
belonging to 32 different Palearctic migrant bird species
from 12 avian families (Supporting Table S2). The abun-
dance of Palearctic migrants showed a strong peak in the
southern African summer (Fig. 4), although the exact
timing and magnitude of the peak varied between sites and
years. Comparison of the abundance of Palearctic migrants
and the prevalence of viruses from the same site and time,
treating each site as an independent sample at each time
step, found no dependency of viral prevalence on numbers
of migrants (Spearman’s r = 0.039, P < 0.8, n = 42). Viral
prevalence was also independent of the numbers of anatid
ducks (Spearman’s r = -0.1, P < 0.5, n = 42). At time
lags of 2 and 4 months, and excluding the Lake Ngami
data, the relationship remained insignificant (2 months,
Spearman’s r = 0.2, P < 0.22, n = 35; and at 4 months,
r = 0.1, P < 0.57, n = 33).
DISCUSSION
The overall prevalence of LPAI influenza viruses that we
found in anatid ducks across southern Africa is 2.4%. The
range in PCR prevalence in anatids reported from Northern
Europe is between 2.1% and 3.8% (Munster et al., 2006;
Munster & Fouchier, 2009); and an extended survey in EU
member states documented an overall LPAI prevalence in
Europe of 1.87% (Breed et al., 2007). Some studies have
found higher prevalences, ranging from 4% in Switzerland
(Baumer et al., 2010) through 6.1% for European dabbling
ducks (Munster et al., 2007) to as high as 12–15% (Wal-
lensten et al., 2007; Terregino et al., 2007; Olsen et al.,
2006). Estimates depend on the time of year when sampling
occurred and the species that were tested (Olsen et al.,
2006); our results are within the range of northern hemi-
sphere estimates rather than notably lower.
One of our most interesting results is the lack of a
predictable annual spike in prevalence. In Canada, for
example, AIV prevalence in anatids may be as high as 60%
on breeding grounds in early fall (Olsen et al., 2006). Our
highest prevalence across all birds for any one sampling
event was 21.43%, in summer in Zimbabwe; but in the
same month in the following year, albeit with a relatively
small sample size, prevalence was zero (Fig. 3). We attri-
bute this unpredictability to the relatively stochastic nature
of southern African seasonality and the flexible movement
strategies of nomadic southern African ducks (Hockey,
2000; Hockey et al., 2004).
The prevalence of influenza A viruses in southern
Africa appears to be twice as high in dendrocygnid (whis-
tling) ducks (5.2%) as in anatid ducks (2.4%), although
this result may be partly an artefact of whistling ducks
having been sampled in largest numbers at the site with the
highest overall virus prevalence. Most of our dendrocygnid
samples were from White-faced Whistling Duck Dendro-
cygna viduata, but Fulvous Duck Dendrocygna bicolor are
common (if almost uncatchable) at Lake Chuali and Lake
Ngami. Whistling ducks are less abundant in South Africa
but we observed both Fulvous and White-backed Duck
Thalassornis leuconotus as far south as Strandfontein, and
Table 1. continued
Family BAR CHU MAS NGA STR ZIM Totals Total prevalence %
Zosteropidae 0 0 0 0 1 0 1 0
TOTALS 1418(19) 271 17 467(3) 888(9) 1916(94) 4977(125) 0
Numbers in brackets indicate the number of birds that tested positive for avian influenza (these are included only when n > 0). BAR, Barberspan; CHU,
Chuali; MAS, Massingir; NGA, Ngami; STR, Strandfontein; ZIM, Zimbabwe (Chivero and Manyame). Sample sizes for Anatidae were similar across our
three core sites (BAR, ZIM, STR). Some of the most obvious differences in bird species composition between sites occurred in the Jacanidae (jacanas;
mostly ZIM and CHU), Dendrocygnidae (whistling ducks; mostly ZIM) and Rallidae (coots and rails; mostly BAR).
The Ecology of Influenza A Viruses in Wild Birds in Southern Africa 9

Barberspan periodically hosts flocks of >20 White-faced
Whistling Duck. Analyses of the movements of White-faced
Whistling Duck in southern Africa suggest displacement on
the scale of around 100 km/year, although ringing records
suggest displacements of up to 1125 km and seasonally
nomadic movements to ephemeral wetlands (Petrie and
Rogers, 1997; Hockey et al., 2004; Underhill et al., 1999).
White-faced Whistling Duck and Fulvous Duck have an
extensive pan-African range and individuals from popula-
tions north of the equator may mix with Palearctic species,
such as Garganey Anas querquedula, that migrate annually
to western Europe. Gaidet et al. (2007) reported an AI
prevalence of 3% in West African dendrocygnids and found
HPAI H5 genomes in White-faced Whistling Duck in West
Table 2. Information on Viral Strains and Types
Common name Latin name Family Total +ves H1 +ve H3 +ve H5 +ve H6 +ve H7 +ve Typed
African Hoopoe Upupa africana Upupidae 1
African Jacana Actophilornis africanus Jacanidae 15 2
African Pipit Anthus cinnamomeus Motacillidae 1
African Red-eyed Bulbul Pycnonotus nigricans Pycnonotidae 1 1
African Snipe Gallinago nigripennis Scolopacidae 1
African Wattled Lapwing Vanellus senegallus Charadriidae 3 1
Barn Swallow Hirundo rustica Hirundinidae 1
BlackSmith Lapwing Vanellus armatus Charadriidae 8 1 1
Cape Teal Anas capensis Anatidae 1
Chestnut-backed Sparrowlark Eremopterix leucotis Alaudidae 3 1
Common Ringed Plover Charadrius hiaticula Charadriidae 1
Common Sandpiper Actitis hypoleucos Scolopacidae 2
Egyptian Goose Alopochen aegyptiaca Anatidae 7 1 H1N8
Fulvous Duck Dendrocygna bicolor Dendrocygnidae 2 1
Glossy Ibis Plegadis falcinellus Threskiornithidae 1
Helmeted Guineafowl Numida meleagris Numididae 1
Hottentot Teal Anas hottentota Anatidae 3 1
Little Rush-warbler Bradypterus baboecala Sylviidae 1
Little Stint Calidris minuta Scolopacidae 3 1
Malachite Kingfisher Alcedo cristata Alcedinidae 1 1
Pied Kingfisher Ceryle rudis Cerylidae 1
Red-billed Quelea Quelea quelea Ploceidae 1
Red-billed Teal Anas erythrorhyncha Anatidae 35 1 2 H3N8
Red-knobbed Coot Fulica cristata Rallidae 7
South African Shelduck Tadorna cana Anatidae 2 1 1
Southern Grey-headed Sparrow Passer diffusus Passeridae 1
Southern Masked-weaver Ploceus velatus Ploceidae 1
Spur-winged Goose Plectropterus gambensis Anatidae 2
Village Weaver Ploceus cucullatus Ploceidae 2
White-faced Duck Dendrocygna viduata Dendrocygnidae 10 1 5
Willow Warbler Phylloscopus trochilus Sylviidae 1
Wood Sandpiper Tringa glareola Scolopacidae 1 1
Yellow Bishop Euplectes capensis Ploceidae 1
Yellow-billed Duck Anas undulata Anatidae 2
Yellow-throated Longclaw Macronyx croceus Motacillidae 1
Totals 125 1 1 10 2 10 (2)
This table describes birds that tested positive, rather than positive samples; the 6 birds that tested positive for the same type on two different swabs provide 6
entries rather than 12. Note that blank cells are zeros rather than unknown values.
10 Graeme S. Cumming et al.

Africa. Given their high abundance and mobility (Cum-
ming et al., 2008), whistling ducks may play an important
regional role in the dynamics of AIV.
Sequencing and phylogenetic analysis of the H1N8
virus that was typed from Barberspan, together with other
AIVs found in South Africa (Abolnik et al., 2010), yielded
no evidence of internal genes associated with Asian HPAI
H5N1 strains. The H1N8 virus from our study was the first
isolate of an H1 AIV in southern Africa; its hemagglutanin
gene grouped closely (96.4–97.4%) with homologous genes
of Italian H1 N1 samples, suggesting a possible link to
Europe (Abolnik et al., 2010).
Although no HPAI viruses were positively identified,
potentially virulent H5 and H7 strains are in circulation in
southern Africa in resident wild bird populations. Both
viral abundance and the presence of potentially virulent
strains appeared to be higher in the Manyame catchment,
our northernmost site. There is some hint of a latitudinal
gradient in prevalence, with Manyame > Barberspan
> Strandfontein; but data from Mozambique and Bots-
wana do not fit this pattern, although the sample sizes
(n = 271 and 467 birds, respectively) are too small to draw
strong inferences.
Most studies of avian influenza have focused on
Anseriformes and Charadriiformes (ducks and waders), but
other waterbirds may play a role in maintaining AIV in
southern Africa. Rallids and jacanids (e.g. Red-knobbed
Coot Fulica cristata and African Jacana Actophilornis af-
ricanus) occur year-round in high abundances in many
wetlands and were frequently observed foraging near to
dabbling and diving ducks. Cormorants and darters
(Phalacrocoridae) are common in our study sites, mobile
and frequently seen roosting with ducks. Risks of trans-
mission to humans are increased by their capture in fishing
Figure 3. Prevalence of avian influenza by site and month across all
captured birds. Sites are BAR Barberspan, STR Strandfontein, NGA
Ngami and ZIM Zimbabwe (Manyame and Chivero). Note that (1)
another 294 birds were sampled in Mozambique over the same
period, with no AIV positives found; and (2) BAR, STR and ZIM
were sampled every 2 months and NGA every 4 months, so birds
were not sampled in some months. The shaded squares at the top of
the chart indicate when a given site was sampled, using the same
colour codes as the bars.
Figure 4. Relative abundance of Pale-
arctic migrants per half-hour point
count by site. Bars represent a mean
number of migrants per point count;
error bars represent an average standard
deviation across point counts for all
species for a given mission. A breakdown
by species is given in Appendix 1
(Supporting information). Birds arrive
earlier at more northern sites (ZIM and
NGA); seasonal peaks coincide with the
austral summer and the boreal winter.
The Ecology of Influenza A Viruses in Wild Birds in Southern Africa 11

nets (and indeed, we were able to sample a White-breasted
Cormorant that survived an encounter with a fishing net on
Lake Manyame). A variety of other species such as Sacred
Ibises (Threskiornis aethiopicus; Threskiornithidae) also
share foraging habitats with grazing and dabbling ducks
(Hockey et al., 2004); Sacred Ibises in particular may feed
on carcasses, making them potentially vulnerable during
AIV epizootics in locations (e.g. unmonitored lakes) where
carcass removal is not rapid.
For the Passeriformes, a prevalence of 4.5% (14 posi-
tives out of 308 birds) suggests a potential role in influenza
epidemiology. Most of the AIV positive species that we
found in this order are residents (Yellow-throated Long-
claw, Chestnut-backed Sparrowlark, Red-billed Quelea and
Village Weaver; Appendix 1 in Supporting information)
but Barn Swallows and Willow Warblers are Palearctic
migrants. Our data and those from other studies (e.g.
Caron et al., 2010b) suggest that some passeriform families
(e.g. Alaudidae and Ploceidae) may contribute to the per-
sistence and spread of AIV in southern African ecosystems.
Our results are unusual from a European perspective,
suggesting higher prevalence than expected in southern
African passerine populations, but agree with recent find-
ings from the United States (e.g. Fuller et al., 2010) that
imply a larger role for passerines in avian influenza
dynamics than has been previously proposed.
In practical terms, our results preclude the assump-
tions of an annual cycle of virus circulation and strong
seasonal variation in wild bird-related risks that hold in
many northern hemisphere regions. From the perspective
of both humans and poultry, AIV transmission by wild
birds appears to be possible at any time of the year. The
opportunistic behavioural responses of waterbird popula-
tions to environmental drivers, and the lag between rainfall
and bird and pathogen responses, may nonetheless make it
possible to obtain short-term predictions of AIV risks using
information on rainfall.
ACKNOWLEDGMENTS
We thank the many people who helped us during the
course of this study. Logistics and permits were facilitated
by Deon Hignett (Cape Nature), Dalton Gibbes (City of
Cape Town), Daan Buijs (NorthWest Parks Board), Ongai
Musemburi (Zimbabwe Parks and Wildlife Authority), Dr.
Pious Makaya and Dr. Chris Foggin (Zimbabwe Veterinary
Services), Felix Monggae (Kalahari Conservation Society),
Dr. Neo Mapitse (Government of Botswana) and Raim-
undo Matisse (Government of Mozambique). Sampie van
Der Merwe provided accommodation and field support at
Barberspan. We are grateful to our >80 field assistants,
especially those who helped with three or more sampling
missions: Jonathan Aaronson, Joel Avni, Tertius Gous,
Dominic Henry, Rhinos Kambanje, Mmapula Kgagodi,
Mike Kock, Amos Koloti, Innocent Magunje, Josphine
Mundava, Admire Muzeziwa, Andrew Mvundle, David
Nkosi, Khumbulani Nyathi and Sydwell Setuki. This
research was funded by a USAID-sponsored Global Avian
Influenza Network for Surveillance subcontract from the
Wildlife Society to GSC, with additional contributions
from the DST/NRF Centre of Excellence at the Percy
FitzPatrick Institute. Steve Osofsky and Scott Newman
facilitated parts of the funding process. Analyses by ARC-
OVI were funded by the South African National Depart-
ment of Agriculture, Forestry and Fisheries; and by IZSVe,
by the Italian Ministry of Health and a grant from the Food
and Agriculture Organization of the United Nations
(FAO). In Zimbabwe we benefited from the ‘‘Mesures
d’Urgence’’ and GRIPAVI projects funded by the French
Ministry of Foreign Affairs and the scientific and logistical
support of the Research Platform Produce and Conserve in
Partnership (RP-PCP).
REFERENCES
Abolnik C, Gerdes GH, Sinclair M, Ganzevoort BW, Kitching JP,Burger CE, Romito M, Dreyer M, Swanepoel S, Cumming GS,Olivier AJ (2010) Phylogenetic analysis of influenza A viruses(H6N8, H1N8, H4N2, H9N2, H10N7) isolated from wild birds,ducks, and ostriches in South Africa from 2007 to 2009. AvianDiseases 54:313–322
Abolnik C, Londt BZ, Manvell RJ, Shell W, Banks J, Gerdes GH,Akol G, Brown IH (2009) Characterisation of a highly patho-genic influenza A virus of subtype H5N2 isolated from ostrichesin South Africa in 2004. Influenza and Other Respiratory Viruses3:63–68
Baumer A, Feldmann J, Renzullo S, Muller M, Thur B, HofmannMA (2010) Epidemiology of avian influenza virus in wild birdsin Switzerland between 2006 and 2009. Avian Diseases 54:875–884
Breed AC, Harris K, Hesterberg U, Gould G, Londt BZ, Brown IH,Cook AJ (2007) Surveillance for avian influenza in wild birds inthe European Union in 2007. Avian Diseases 54:399–404
Caron A, Abolnik C, Mundava J, Gaidet N, Burger CE, Moc-hotlhoane B, Bruinzeel L, Chiweshe N, De Garine-WichatitskyM, Cumming GS (2010a) Persistence of low pathogenic avianinfluenza virus in waterfowl in a Southern African ecosystem.EcoHealth. doi:10.1007/s10393-010-0356-4
12 Graeme S. Cumming et al.

Caron A, De Garine-Wichatitsky M, Gaidet N, Chiweshe N,Cumming GS (2010b) Estimating dynamic risk factors forpathogen transmission using community-level bird census dataat the wildlife/domestic interface. Ecology and Society 15(3):25.http://www.ecologyandsociety.org/vol15/iss3/art25/
Cumming GS, Hockey PAR, Bruinzeel LW, Du Plessis MA (2008)Wild bird movements and avian influenza risk mapping insouthern Africa. Ecology and Society 13:26
Dudley JP (2008) Public health and epidemiological consider-ations for avian influenza risk mapping and risk assessment.Ecology and Society 13:21
Enserink M (2006) Avian influenza—H5N1 moves into Africa,European Union, deepening global crisis. Science 311:932
Fasina FO, Bisschop SP, Joannis TM, Lombin LH, Abolnik C(2009) Molecular characterization and epidemiology of thehighly pathogenic avian influenza H5N1 in Nigeria. Epidemi-ology and Infection 137:456–463
Forster JL, Harkin VB, Graham DA, Mccullough SJ (2008) Theeffect of sample type, temperature and RNAlaterTM on thestability of avian influenza virus RNA. Journal of VirologicalMethods 149:190–194
Fuller TL, Saatchi SS, Curd EE, Toffelmier E, Thomassen HA,Buermann W, Desante DF, Nott MP, Saracco JF, Ralph CJ,Alexander JD, Pollinger JP, Smith TB (2010) Mapping the riskof avian influenza in wild birds in the US. BMC InfectiousDiseases 10:187
Gaidet N, Cattoli G, Hammoumi S, Newman SH, Hagemeijer W,Takekawa JY, Cappelle J, Dodman T, Joannis T, Gil P, Monne I,Fusaro A, Capua I, Manu S, Micheloni P, Ottosson U,Mshelbwala JH, Lubroth J, Domenech J, Monicat F (2008)Evidence of Infection by H5N2 highly pathogenic avian influ-enza viruses in healthy wild waterfowl. PLoS Pathogens4:e1000127
Gaidet N, Dodman T, Caron A, Balanca G, Desvaux S, Goutard F,Cattoli G, Lamarque F, Hagemeijer W, Monicat F (2007) Avianinfluenza viruses in water birds, Africa. Emerging InfectiousDiseases 13:626–629
Hockey PAR (2000) Patterns and correlates of bird migrations insub-Saharan Africa. Emu 100:401–417
Hockey PAR, Dean WRJ, Ryan PG (2004) Roberts’ Birds ofSouthern Africa, Cape Town: Russell Friedman Books CC, pp1296
Kilpatrick AM, Chmura AA, Gibbons DW, Fleischer RC, MarraPP, Daszak P (2006) Predicting the global spread of H5N1 avianinfluenza. Proceedings of the National Academy of Sciences of theUnited States of America 103:19368–19373
Krauss S, Webster RG (2010) Avian influenza virus surveillanceand wild birds: past and present. Avian Diseases 54:394–398
Munster VJ, Baas C, Lexmond P, Waldenstrom J, Wallensten A,Fransson T, Rimmelzwaan GF, Beyer WE, Schutten M, Olsen B,Osterhaus AD, Fouchier RA (2007) Spatial, temporal, andspecies variation in prevalence of influenza A viruses in wildmigratory birds. PLoS Pathogens 3:e61
Munster VJ, Fouchier RAM (2009) Avian influenza virus: of virusand bird ecology. Vaccine 27:6340–6344
Munster VJ, Veen J, Olsen B, Vogel R, Osterhaus AD, FouchierRA (2006) Towards improved influenza A virus surveillance inmigrating birds. Vaccine 24:6729–6733
Olsen B, Munster VJ, Wallensten A, Waldenstrom J, Osterhaus A,Fouchier RAM (2006) Global patterns of influenza A virus inwild birds. Science 312:384–388
Petrie SA, Rogers KH (1997) Ecology, nutrient reserve dynamicsand movements of white-faced ducks in South Africa, Pretoria:Department of Environmental Affairs and Tourism
Pickles H (2006) Avian influenza—preparing for the pandemic—using lessons from the past to plan for pandemic flu. BritishMedical Journal 332:783–786
Sinclair M, Bruckner GK, Kotze JJ (2005) Avian influenza in os-triches: epidemiological investigation in the Western CapeProvince of South Africa. Elsenburg Joernaal 2:2–4
Terregino C, De Nardi R, Guberti V, Scremin M, Raffini E, MartinAM, Cattoli G, Bonfanti L, Capua I (2007) Active surveillancefor avian influenza viruses in wild birds and backyard flocks inNorthern Italy during 2004 to 2006. Avian Pathology 36:337–344
Underhill LG, Tree AJ, Oschadleus HD, Parker V (1999) Review ofring recoveries of waterbirds in southern Africa, Cape Town:Avian Demography Unit, University of Cape Town
Wallensten A, Munster VJ, Latorre-Margalef N, Brytting M,Elmberg J, Fouchier RA, Fransson T, Haemig PD, Karlsson M,Lundkvist A, Osterhaus AD, Stervander M, Waldenstrom J,Olsen B (2007) Surveillance of influenza A virus in migratorywaterfowl in northern Europe. Emerging Infectious Diseases13:404–411
WHO (2010) Cumulative number of confirmed human cases ofavian influenza A/(H5N1) reported to the World HealthOrganization. World Health Organization on-line fact sheet,available at http://www.who.int/csr/disease/avian_influenza/country/cases_table_2010_08_12/en/print.html
The Ecology of Influenza A Viruses in Wild Birds in Southern Africa 13
Copyright © 2022 FDOKUMEN