The ecology and productivity of new cultivars of subterranean ...
324
! I ,,r .tili:1.¿:;i'i;i"tì:i I i :q. 6.nÞ i i --¡ ii;rl,,iit- j f] 'ts o..*-,. ^-'. *^,¡-, THE ECOLOGY AND PRODUCTIVITY OF NEW CULTIVARS OF SUBTERRANEAN CLOVER (Trifolium subteruaneum L.) Carolyn Theresa de Koning, B.Ag. Sc. (Hons.) - Adelaide A thesis submitted to The University of Adelaide in fulfilment of the requirements for the degree of Doctor of Philosophy. by ?,o '\ô ' at V/ai tute February, 1990
-
Upload
khangminh22 -
Category
Documents
-
view
1 -
download
0
Transcript of The ecology and productivity of new cultivars of subterranean ...
!
I ,,r .tili:1.¿:;i'i;i"tì:i Ii :q. 6.nÞ ii --¡ ii;rl,,iit- jf]'ts o..*-,. ^-'. *^,¡-,
THE ECOLOGY AND PRODUCTIVITY OF NEWCULTIVARS OF SUBTERRANEAN CLOVER
(Trifolium subteruaneum L.)
Carolyn Theresa de Koning, B.Ag. Sc. (Hons.) - Adelaide
A thesis submitted to The University of Adelaide in fulfilmentof the requirements for the degree of Doctor of Philosophy.
by
?,o '\ô ' at
V/ai tute
February, 1990
ll
TABLE OF CONTENTS
ABSTRACT
STATEMENT
ACKNOWLEDGEMENTS
LIST OF DIAGRAMS
LIST OF FIGURES
LIST OF TABLES
LIST OF PLATES
LIST OF APPENDICES
1. GENERAL INTRODLICTION
2. LITERATURE REVIEW
Introduction
2.I Differences in the productivity of subterraneanclover cultivars
2.2 Effects of density on productivity of subterraneanclover
2.3 Effects of mechanical defoliation on subterraneanclover
2.4 Defoliation by grazing
2.4.I Grazingmanagement2.4.2 Stocking rate effects
(Ð Botanical ges
(iÐ Response swards to grazing(üi) Resþonse ilitY and total
productivity to stocking rate
2.4.3 Grazing method and interactions with stocking rate
2.5 Seed production of subterranean clover
Burr burialDensity and seed yieldEffects of defoliation on seed yield
(Ð Defoliation by mechanical methods(ii) Defoliation by grazing
page
vi
ix
x
xi
xii
xv
xix
xx
I
6
6
l2
15
1tì
202l2lL)
2.5.12.5.22.5.3
24
26
2fl
36
38
283234
34
2.5.4 Hard-seededness
lll
2.6 Seed survival following ingestitln by animals 42
4244
47
53
55
61
6l64
6468
77
778283
84
8487
3 SMALL-PLOT EXPERIMENT 1985 - The effects ofsowing rate and time of sowing on the growth and seedproduction of four cultivars of sub clover.
Introduction
3.1 Materials and Methods
3.2 Herbage harvest results 1985
Sub clover plant populationHerbage production(a) Sub clover(b) Weeds
3.3 Seed harvest results 1985
Seed yieldSeed numberIndividual seed weight
2.6.1
2.6.22.6.3
3.3.4
3.3.5
The grazing of dry pasture residues duringsummer-autumnThe dissemination of weed seeds via defaecationThe dissemination of seed from pasture plants viadefaecation
Germination tests of seeds in burrs
3.3.4.1 Percentage soft seed3.3.4.2 Percentage hard seed3.3.4.3 Percentage dormant seed
Natural regeneration of sub clover onExperiment site
3.2.I3.2.2
3.3.r3.3.23.3.3
88
3.4. Discussion and conclusions
Herbage harvest resultsSeed harvest resultsConclusions
4 . GRAZING EXPERIMENT 1986 - 1987
Introduction
4.I Materials and methods
4.2 Herbage harvest results, MES 1986 - 1987
Sub clover establishmentPasture yield and botanical compositionPasture production
3.4.13.4.23.4.3
88
9T
919498
100
100
L02
I12
r12113119
4.2.14.2.24.2.3
IV
4 .3. Seed harvest results, 1986-l9tt7
4.3.1 Seed harvest l9fl6Seed number/burr in 1986Mean seed weight in 1986Seed number in 1986Seed yield in 1986Germination test of seed in above-groundburrs in 1986
4.3.1-6 Germination test of seed in below-groundburrs 1986
4 .3 .I .7 Regeneration of sub clover in 1987
4.3.2 Seed harvest 1987
.2.I Number of seedsiburr in 1987
.2.2 Mean seed weight in 1987
.2.3 Seed number in 1987
.2.4 Seed yield in 1987
.2.5 Gennination tests of seeds in abovc-groundburrs for 1987
4.3.2.6 Germination tests of seed in below-groundburrs, 1987
4.3.2.7 Regeneration of sub clover in 1988
4.4. Discussion and conclusions
Herbage productionSeed productionConclusions
SUMMER.AUTUMN GRAZING EXPERIMBNT AND PENFEEDING STUDIES 1987 . 1988
Introduction
5.1. Materials and methods
Field grazing experimentPen feeding studies
5.2 Results - summer-autumn field grazing experiment
5.2.I Dry pasture residues on offer to the sheep5.2.2 Seed survival through the digestive ract of grazing
sheep5.2.3 Seedling emergence from held faecal samples and
the raised-bed experiment
5.3 Results - Pen feeding experiment
122
4.3.r.14.3.r.24.3.t.34.3.r.44.3.1.5
122
122r23r24r25
4.34.34.34.34.3
131135
137
r37138r39140
r44
130
r45r46
148
148156159
4.4.14.4.24.4.3
5
5.5.15.1.2
t62
162
t64
164r69
172
112
wr82
1tt 5
185185
5.3.1s.3.2
Burr germination and burr dissection dataSurvival of seed following ingestion by penned sheep

6
6
6
5.4 Discussion and conclusions
S ummer-autumn grazing experi mentPen-feeding studiesConclusions
6 . GENERAL DISCUSSION AND CONCLUSIONS
6.1 Influence of sub clover plant density on herbageand seed production(i) Herbage production(iÐ Botanicalcomposition(iiÐ Seed yield
6.2 Influence of grazing on herbage and seed production(i) Regeneration(iÐ Botanicalcomposition(iiÐ Pasture availability and total pasture production(iv) Animal production(v) Sccd production
6.3 Herbage and seed production differences betweencultivars and the mixture
6
(i) Botanical composition(iÐ Herbage production(üÐ Seed yield
The grazing of dry sub clover residues and seedsurvival following ingestion by sheep
Practical implications of research
Future work
Main fTndings and conclusion
1. Small-plot density experiment2. Grazing experiment at Mortlock Experiment Station3. Summer-autumn seed intake experiment4- Animal House feeding experiment5. Conclusions
APPBNDICES
Appendix A
Appendix B
Appendix C
BIBLIOGRAPHY
5.4.r5.4.25.4.3
1rì8
188191193
l9s
195
195196196
L97
198199r99200200
20rz0l202203
204
207
209
2Lt2tlzll2122122t2
214
226
252
256
4
5
6
7
7
I
v1
ABSTRACT
The breeding, selection and release of new subterranean clover (Trifolium
subterraneum L) cultivars is warranted if genotypes are limiting production: however,
often pasture management and graz\ngmanagement factors are the major constraints to
production. In this thesis, two research priorities are identified and studied, viz. (i) the
pasture and/or grazing management required to maximize herbage and seed production
during the growing season and (ii) the effects of grazing management on seed survival
over the summer-autumn period.
These research priorities were addressed in four experiments as follows:
1. Small-plot density experiment
The density experiment examined herbage and seed production of subterranean
clover (hereafter referred to as sub clover) using the cultivars Yarloop, Trikkala,
Esperance and Clare at six sowing rates (1, 4, 16, 64, 256, and lO24 kg/ha pure
germinable seed) in the field at the'Waite Institute. Two sowing times were used: Early =
17 ¡4ay 1985 and Lare = 7 June 1985). The main conclusions were: (i) Dry matter
production is strongly related to plant density early in the season (i.e. the greater the
plant number the grearer the yie1d. (ii) Differences in the herbage yield of cultivars late in
the season were due to differences in maturity. (iii) Seed production was positively
correlated with herbage production at low and medium densities: however, high density
swards (e.g. 14,000 plants/m2) which were undefoliated had lowered herbage
production and seed production and subsequent regeneration. (iv) Differences in the
ability of culúvars to suppress weeds only occurred at high plant densities.
vll
2. Grazing experiment
This paddock-scale experiment at the Mortlock Experiment Station, Mintaro, South
Australia (hereafter MES) involved continuous grazing of sub clover pastures at three
stocking rates (7, 11 and 15 sheep/ha) during two seasons 1986 and 1987. Five
cultivars: Nungarin, Dalkeith, Trikkala, Junee, Clare and a mixture comprising all five
were sown at two rates (10 and 200 kg/ha). The main findings and conclusions were: (i)
low-density swards (e.g. 150 plants/m2) had low productivity and could support only
low stocking rates (7 to 11 sheeplha) throughout the growing season and the summer-
autumn period, whereas high-density pastures (1,500 to 2,000 plants/m2) were more
productive and could be grazed at higher stocking rates (e.g. 15 sheeplha) during the
growing season and at the beginning of summer. (ii) Changes in botanical composition
were rapid and were influenced by initial sub clover plant density and further modified by
stocking rate. (iii) Under grazing, cultivars did not show any differing ability to
suppress weeds. (iv) Seed yield of some cultivars (e.g. Nungarin and Dalkeith) were
signifrcantly reduced if the initial sowing rate Ìvas 10 kg/ha compared to 200 kg/hu.
3. Summer-autumn seed intake experiment
The aim of the summer-autumn seed intake experiment was to identify and quantify
the main effects of sheep on the seed reserves and the consequent seedling dynamics of
sub clover-based pastures. The impact of sheep grazing dry sub clover pasture residues
(comprising a mixture of five sub clover cultivars) was examined over a period of 70
days. The main findings were: (i) Sheep are efficient harvesters of sub clover burr and
seed during the summer-autumn period. First they select the largest burr, containing the
most seed and the largest seed leading to a progressive decline in burr weight, seeds/burr
and seed size. (iÐ Seedling emergence from faecal pellets was poor and would not
contribute significantly to the regeneration of sub clover pastures in Mediterranean
climatic zones. (iii) An estimated l%o (hard) seed of the total sub clover seed ingested
survived passage through the digestive tract of sheep grazing dry pasture residues. These
vlll
results indicate that summer-autumn grazing should be carefully managed and that the
quantity of seed on the surface and in the top 2.5cm of the soil be monitored to ensure
that there is sufhcient seed to ensure regeneration of a high-density pasture.
4. Animal house feeding experiment
The animal house experiment involved the feeding of intact burrs from each of the
cultivars used in the mixture at MES and the summer-autumn seed-intake experiment.
The burrs of Nungarin, Dalkeith, Trikkala, Junee and Clare were fed at to individually-
penned sheep fitted with faecal-collection harnesses at the rate of 50g (except Clare 40g)
of burrs in a standa¡d sheep diet. The main findings were: (i) The survival of seed in
faeces was higher (2.9 to 5Vo hañ) than the survival of seed ingested in the summer-
autumn f,reld experiment (l7o hard). These differences possibly reflect the higher-quality
feed in the animal house and consequent greater rate of passage. (ii) The percentage
viable seed found in the faeces of pen-fed sheep did not differ between cultivars.
Overall, the findings from the research described in this thesis support the view that
management factors have far greater impact than differences ascribed to various cultivars
of sub clover.

ix
STATEMENT
The studies presented in this thesis represents original work carried out by myself except
whete due acknowledgement has been made in the text. This thesis has not been
previously submitted in full or part to any other University for any degree or diploma. I
consent to the thesis being made available for photocopying and loan if accepted for the
award of the degtee.
C. T. de Koning

X
ACKNOWLBDGEMBNTS
I wish to sincerely thank Mr. E. D. Carter, my supervisor, for his guidance, and
expertise advice throughout this study and for his critical comments during the
preparation of this thesis. I have learnt much as a result. I am also grateful to Dr. G. K.
Mc Donald for his advice in the absence of Mr. E. D. Carter and his comments on drafts
of this thesis.
Many people helped with freld work and with laboratory analyses: Steve Challis,
Mary Armstrong, Richard Knowles, Neville Sutherland, Kylie Le Leu and Diona
Mobsby, provided technical assistance cluring the project which is greatly appreciated.
The friendship of Deirdre Frappell and Paul Quigley have contributed to the enjoyment
during my studies, and the encouragement and support of my family.
The farm staff at the Waite Institute and the Mortlock Experiment Station deserve
special mention for their practical advice and assistance with field work which is much
appreciated. Margaret Morris, a member of the Biometry department at the Waite
Institute, deserves thanks for her statistical advice and assistance.
I wish to gratefully acknowledge The Australian 'Wool Corporation for their
financial support with the provision of a postgraduate scholarship which enabled this
research to take place.

M,3.1
3.2
4.1
4.2
4.3
5.1
XI
LIST OF DIAGRAMS
Title
Block orientation and size within the allocated field site.
The random allocation of treatments to the blocks.
The position and orientation of treatrnent plots.
Randomization of treatments.
The movement and position of quadrat cages.
The paddock site Wl6 at the Waite Institute and the position ofdry rèsidue samples for the summer-autumn grazing experiment1987.
The layout of the raised-bed experiment at the Waite Institute.
Page
59
60
108
109
110
5.2
r6l
168
xll
No.
3.1
3.2
3.3
3.4
LIST OF FIGURES
Title
The sub clover plant densities of four cultivars sown at sixsowing rates.
Yields of sub clover cultivars at six sowing rates in the small-plot experiment, 1985 (Mean of two sowing times).
Yield of sub clover cultivars at six sowing rates in the small-plot experiment, 1985 (Mean of two sowing times).
Yield of weeds growing with four cultivars of sub clover sownat six densities.
Yield of weeds growing with four cultivars of sub clover sownat six densities.
Yield and botanical composition of plots sown to four subclovcr cultivars at six densities.
Harvest 5, relationship between sub clover plant number andweed yield.
The relationship between percentage seed yield found below-ground and sowing rate.
Relationship between total seed yield of sub clover and plantdensity at Harvest 5.
Sub clover total seed number in relation to plant density atHarvest 5.
The percentage soft, hard and dormant seed of sub cloverproduced on early- and late-sown treatments.
The relationship between seed number and seed yield for eachcultivar at MES in 1986.
The relationship between and seedling number in 1987 and totalseed yield in 1986.
The relationship between total seed yield in 1986 and earlyherbage production in 1987.
The relationship between sccdling number and early herbageproduction in 1987.
The dependence of seed yield on seed number at MES in 1987-
The dependence of seedling number in 1988 on total seed yieldin 1987 at MES.
The dependence of seedling number in 1988 on total seed yieldin 1987 at MES.
Page
3.5
63
66
6t
ll
72
3.6
3.7
3.8
3.9
3.10
3.1 1
4.1
4.2
4.3
4.4
4.5
4.6
14,7 5
80
76
81
81
86
t27
r28
r29
136
14r
142
4.7r43
xlll
TitleNo.
4.8
5.1
5.2
5.3
5.4
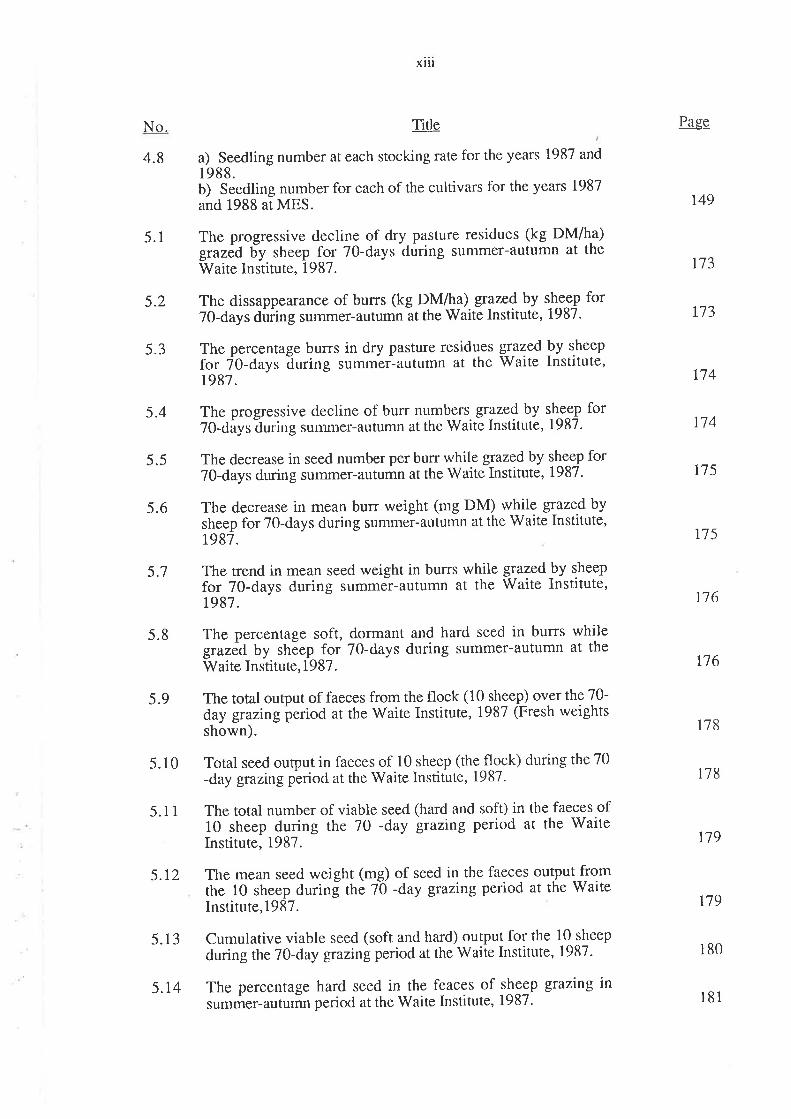
a) Seedling number at each stocking rate for the years 1987 and
1988.b) Seedling number for each of the cultivars for the years 1987
and 1988 at MES.
The progressive decline of dry pasture residues (kg DM/ha)grarêd ñy sheep for 7O-days during summer-autumn at theWaite Institute, 1981.
The dissappearance of burrs (kg DM/ha) grazed by sì^eep for7O-days during sunìmer-autumn ât the Waite Institute, 1987.
The percentage burrs in dry pasture residues g:1Td þV sheelfor fO-days ãuring summer-autumn at the Waite Institute,1987.
The progressive decline of burr numbers. grazed by sl^eep for7O-tlays-tlurittg summer-autumn at the Waitc Institute, 1987.
The decrease in seed number per burr while grazed by sheep for70-days during surnmer-autumn at the Waite Institute, 1987.
The decrease in mean burr weight (mg DM) while grazedbysheep for 7Q-days during sununer-autumn at the Waite Institute,1987.
The trend in mean seed weight in burrs while gtazed by sheep
for 70-days during summel-autumn at the Waite Institute,t987.
The percentage soft, dormant and hard seed in burrs whilegrared by shéep for 7O-days during summer-autumn at theWaite Institute,1987.
The total ouqput of faeces from the flock (10 sheeÐ over the 70-day grazing þeriod at the Waite Institute, 1987 (Fresh weightsshown).
Total seed output in faeces of 10 sheep (theflock) during the 70
-day grazing pèrioA at the Waite Institute, 1987.
The total number of viable seed (hard and soft) in the faeces of10 sheep during the 70 -day grazing period at the WaiteInstitute, 1987.
t fromWaite
Page
r49
113
173
t74
174
175
175
176
116
178
r78
n9
t79
180
5.5
5.6
5.1
5.8
5.9
5.10
5.1 1
s.t2
5.13
The mean seed weight (mg) of seed in the faeces outputhe 10 sheep during the 70 -day grazing period at theInstitute,1987.
Cumulative viable seed (soft and hard) output for the 10 sheep
during the 70-day grazingperiod at the Waite Institute, 1987'
The percentage hard seed in the feaces of sh99l grazing insummer-autumn period at the Waite Institute, 1987'
5.14181

No.
5.15
5.16
xtv
Title
The percentage total viable seed (soft and hard) in $q faecaloutpùt of sheép grazing in the summer-autumn period at theWaite Institute, 1987.
merge from faecalsheep) in the field
Page
181
183

No.
3.0
XV
LIST OF TABLBS
Title
Maximum and minimum air temthe 1985 field experiment at theInstitute.
peratures, and rainfall duringWaite Agricultural Research
Summary of Analyses of varaince for sub clover plant number'Based on natural logarithms.
The relationship between sowing rate (x) and plant number (y)for the four cultivars at Harvests 1, 3 and 6.
Summary of Analyses of Variance for the yield parameter sub
clover herbage.
The realtionship between sub clover herbage production (y) andplant density (x) at harvest 1, 3 and 6.
Summary of Analyses of variancc for yicld of weeds. (Basedon natural logarithms).
The relationship between sub clover herbage production (x) and
weed yield (y) at harvest 1, 3 and 6.
Summary of Analysis of Varaince on the parameters-s^e^e{ Vield,seed number, mean seed weight and regeneration in 1986-
Seed yields of subterranean clover at six sowing rate-s (Above-grounã (AG), Below-ground (BG) and Total (T) seed yield, allin kglha).
Sub clover seed yield (y) [above-, below-ground and total] inrelation to herbage production (x).
Interrelations of seed yield (y) and seed number (x) for above-,below-ground and total seed components.
Seed production of subterranean clover at six sowing rates,Abovê-ground (AG), Below-ground (BG) and Total (T) seed
number/m2.
Mean seed weight (y) in relation to sowing rate (x) for above-and below-ground burrs (Seed weight in mg).
Summary of analyses of variance for the percentage soft,-hardand dormant seeã at each sowing time- (Analysis made onarcsine- transformed data).
Sub clover regeneration in 1986 on the 1985 experiment site (#
seedlings/m2) (Expected emergence based on percentage softand Vo dormant seed are shown in brackets)
Seedling regeneration in 1986 (y) in relation to sowing rate in1985 (x).
Seedling number at the beginningclover herbage yield at the end of
of 1986 (y) in relation to sub1985 (x).
Page
3.1
3.2
3.3
3.4
3.s
3.6
3.7
3.8
3.9
3.10
3.1 1
3.r2
3. 13
3.r4
3.15
3.16
No.
4.0
4.1
4.2
4.3
4.4
4.5
4.6
4.7
4.8
4.9
4.10
4.rr
XV1
Title
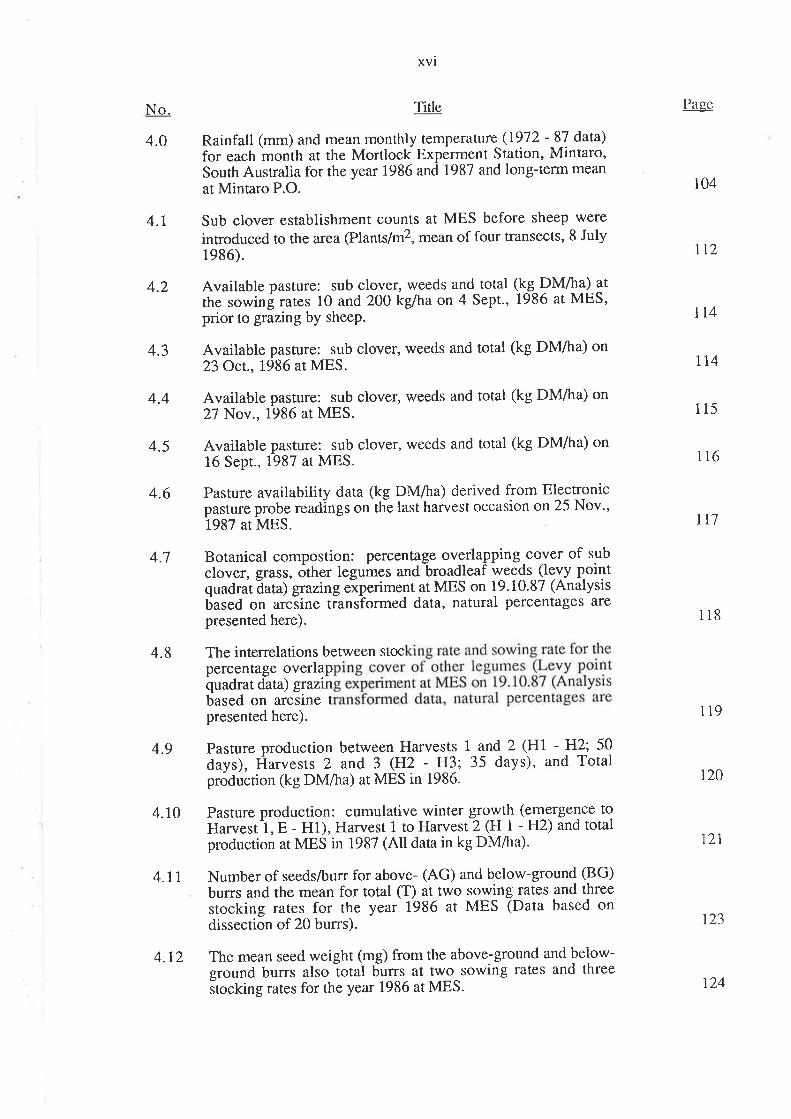
Rainfall (mm) and mean monthly temperature (1972 - 87 data)
for each month at the Mortlock Experment Station, Mintaro,South Australia for the year 1986 and 1987 and long-term mean
at Mintaro P.O.
Sub clover establishment counts at MES before sheep were
introduced to the area (Plants/m2, mean of four transects, 8 July1986).
Available pasture: sub clover, weeds and-total (kg DM/ha) at
the sowinf rates 10 and 200 kglha on 4 Sept., 1986 at MES,prior to grazing by sheep.
Available pasture: sub clover, weeds and total (kg DM/ha) on23 Oct.,1986 at MES.
Available pasture: sub clover, weeds and total (kg DM/ha) on27 Nov., 1986 at MES.
Available pasture: sub clover, weeds and total (kg DM/ha) on16 Sept., 1987 at MES.
Pasture availability data (kg DM/ha) derived from Electronicpasture probe readings on thè last harvest occasion on 25 Nov.,1987 at MES.
Botanical compostion: percentage overlapping cover of sub
clover, grass, óther legumes and broadleaf weeÇs- (levy pointquadratãata) grazingeiperiment at MES on 19.10'87 (Analysisbased on arciine transformed data, natu¡al percentages are
presented here).
The interrelations between stocpercentage overlapquadrat data) grazinbased on arcsine tpresented here).
Pasture production between Harvests 1 and 2 (Hl - H]; 50days), Éa*ests 2 and 3 (H2 - H3; 35 days), and Totalpróduction (kg DM/ha) at MES in 1986.
Pasture production: cumulative winter g-roytlì (emergence toHarvesti, E - H1), Harvest 1 to Harvest2 (H 1 - H2) and totalproduction at MES in 1987 (Atl data in kg DM/lta).
Number of seeds/burr for above- (AG) and below-ground (BG)
burrs and the mean for total (T) at two sowing rates and three
stocking rates for the year 1986 at MES (Data based on
dissection of 20 burrs).
The mean seed weight (mg) from the above-ground and below-ground burrs also iotal buns at two sowing rates and three
stocking rates for the year 1986 at MES.
Page
104
tt2
114
114
115
116
t17
118
119
120
12r
t23
4.12
124
xvll
TitleNo.
4.r3
4.t4
4.t5
4.t6
4.r7
4.18
4.r9
4.20
4.2r
4.22
4.23
4.24
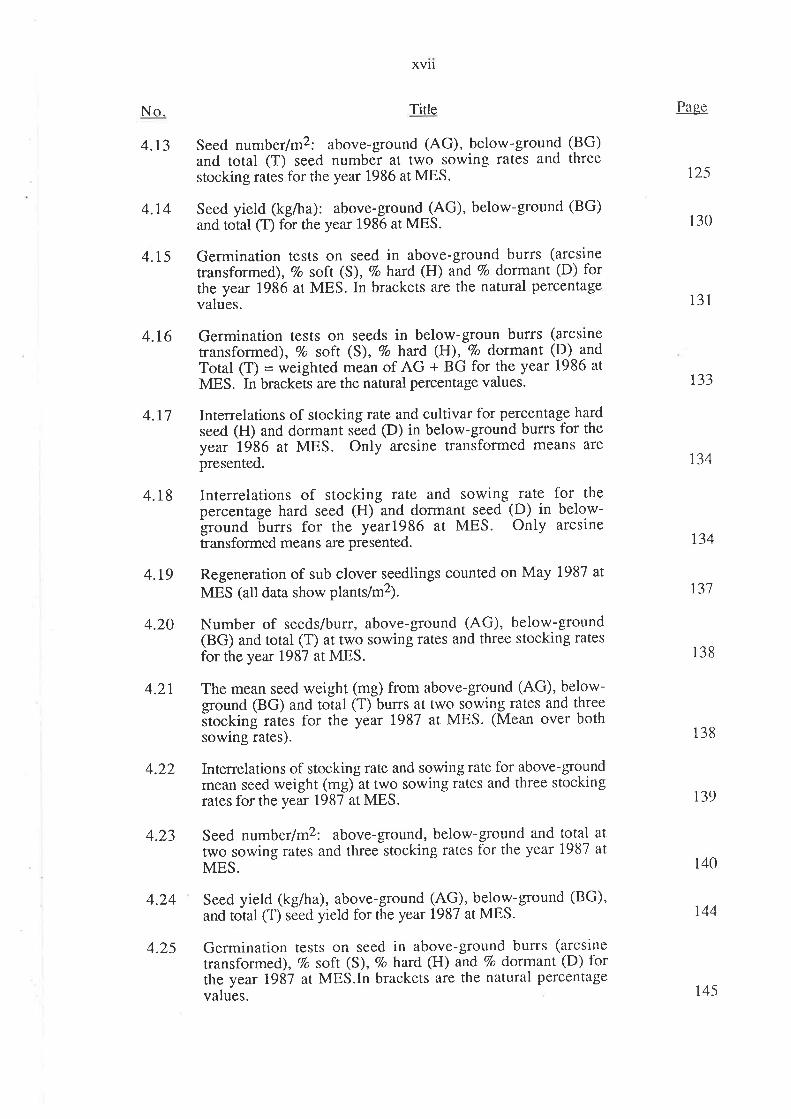
Seed numberlm2: above-ground (AG), below-ground (BG)and total (T) seed number at two sowing rates and threestocking rates for the year 1986 at MES.
Seed yield (kg/ha): above-ground (AG), below-ground (BG)and total (T) for the year 1986 at MES.
Germination tests on seed in above-ground burrs (arcsinetransformed),7o soft (S), Tohard (H) and 7o dormant (D) forthe year 1986 at MES. In brackets are the natural percentagevalues.
Germination tests on seeds in below-groun burrs (arcsinetransformed), 7o soft (S), 7o hard (H), Vo dormant (D) andTotal (T) = weighted mean of AG + BG for the year 1986 at
MES. In brackets are the natural percentage values.
Interrelations of stocking rate and cultivar for percentage hardseed (H) and dormant séed (D) in below-ground burrs for theyear 1986 at MES. Only arcsine transformed means are
presented.
Interrelations of stocking rate and sowing rate for thepercentage hard seed (H) and dormant seed (D) in below-
þround burrs for the year1986 at MES. Only arcsinetransformed means are presented.
Regeneration of sub clover seedlings counted on May 1987 at
MES (atl data show plants/m2).
Number of seeds/burr, above-ground (AG), below-ground(BG) and total (T) at two sowing rates and three stocking ratesfor the year 1987 at MES.
The mean seed weight (mg) from above-ground (AG), below-ground (BG) and total (T) burrs at two sowing rates and threeItocking rates for the year 1987 at MES. (Mean over bothsowing rates).
Interrelations of stocking rate and sowing rate for above-groundmean seed weight (mg) at two sowing rates and three stockingrates for the year 1987 at MES.
Seed numberlmz: above-ground, below-ground and total at
two sowing rates and three stocking rates for the year 1987 atMES.
Seed yield (kg/ha), above-ground (AG), below-ground (BG)'and total (T) seed yield for the year l98l at MES-
Germination tests on seed in above-ground burrs (arcsinetransformed), Vo soft (S), Vo hatd (H) and 7o dormant (D) forthe year 1987 at MES.In brackets are the natural percentagevalues.
Page
125
130
131
r33
134
t34
137
138
138
r39
140
r44
4.25
145
XVlIT
No.
4.26
4.27
5.1
5.2
5.3
5.4
5.5
5.6
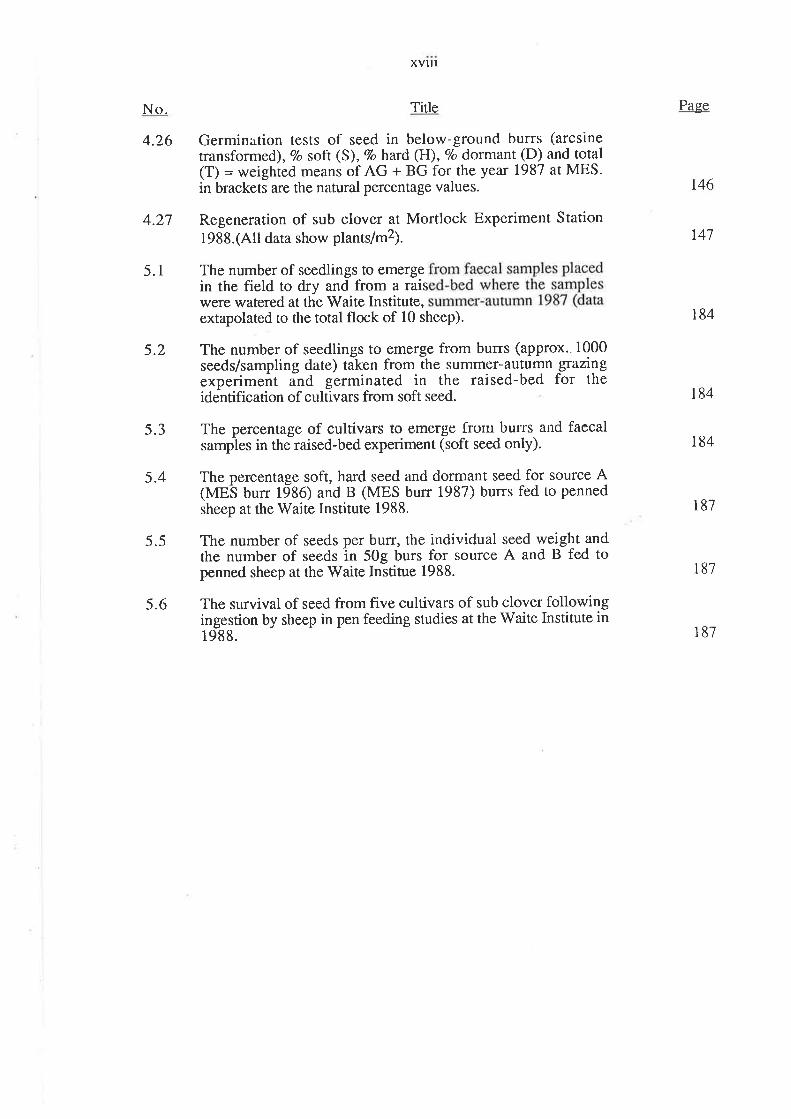
Title
Germination tests of seed in below-ground burrs (arcsinetransformed),7o soft (S),Vo hard (H), o/o dotmant (D) and total(T) = weighted means of AG + BG for the year 1987 at MES.in brackets are the natural percentage values.
Regeneration of sub clover at Mortlock Experiment Station19S8.(All data show plants/m2).
The number of seedlings to emergein the field to dry and from a raiswere watered at the Waite Institute,extapolated to the total flock of 10 sheep).
The number of seedlings to emerge from burrs (approx. 1000seeds/sampling date) taken from the summer-autumn -grazingexperimeñt and germinated in the raised-bed for theidentification of cultivars from soft seed.
The percentage of cultivars to emergc frotn butrs and faecalsamples in the raised-bed experiment (soft seed only).
The percentage soft, hard seed and dormant seed for source A(MES burr t986) and B (MES burr 1987) burrs fed to pennedsheep at the Waite Institute 1988.
The number of seeds per burr, the individual seed weight andthe number of seeds in 50g burs for source A and B fed topenned sheep at the V/aite Institue 1988.
The survival of seed from five cultivars of sub clover followingingestion by sheep in pen feeding studies at the Waite Institute in1988.
Page
r46
147
184
184
184
187
r87
187
xlx
No'.
4.1
4.2
5.1
5.2
LIST OF PLATES
Title
General view of a low stocking rate area (7 sheep/ha) at MES in1986. High density plot in fore-gtound.
View of a high stocking rate area (15 sheep/ha) at MES in 1986.l,efu high sowing rate plot.Righn low sowing rate plot
General view of sheep fitted with faecal collection harnessesgrazingdry sub clovef residues in summer-autumn at the WaiteInstitute, 1987.
Close-up view of dry sub clover residues. Left: grazed bysheep for 7O-days, Right: ungrazed.
Page
111
111
nl
t7t
No.
4.1
XX
LIST OF APPENDICBS
Title
Summary of the Sowing Time x Cultivar and Sowing Time xCultivar-x Sowing Raté data for sub clover plant numbers atHarvest 2 (Natural logarithms).
Page
4.2
A.3
A.4
4.5
A.6
4.1
A.8
A.9
4.10
4.11
A.t2
A.13
A.t4
4.15
A.16
The density of sub clover plants for the six sowing rates at each
harvest occasion (Data show # plants/m2).
Summary of the least significant differences at the 57o level forcultivar effect on sub clover plant numbers.
Summary of the Cultivar x Sowing Rate data for plant-numbersfrom Harvests 3 to 5 @ata transformed to natural logarithms).
Summary of the Sowing Time x Cultivar and Sowing Time xCultivar x Sowing Rate transformed data for sub clover yield atHarvest 2 (Data on kg DM/ha transformed to naturallogaritlrrns).
Summary of the transformed data Sowing Time x Cultivar atHarvest 5 for weed yield (Mean of six sowing rates).
Summary of the sub clover Cultivar x Sowing Rate transformedyield dáta (Yield data in kg/ha transformed to Naturallogarithms).
The sub clover yield (kg DM/ha) for each sowing rate andharvest occasion.
Summary of least significant differences at the 57o level forcultivar effect of sub clover yield.
Summary of the Sowing Rate x Cultivar transformed data forweed yiétd at Harvests 1, 3 and 6. (Yield data in kg DM/hatransformed to natural logarithms).
The amount of weed (kg DM/ha) at each harvest occasion and allsowing rates.
Summary of LSD (5Vo level) values of cultivar main effect onparameter weed yield (kg DM/ha).
Sub clover seed weights from the 1985 growing season.(Seedweight (mg) mean of two sowing times)
The percentage of sub clover soft seed at each sowìng time,sowiñg rate añd cultivar for above- and below-ground burrs.
The percentage of sub clover hard seed at each sow.ing time,sowiñg rate añd cultivar for above- and below-ground burrs.
The percentage of sub clover dormant seed at each sowing time,sowing rate and cultivar for above- and below-ground burrs'
2t4
215
215
2t6
2.t7
2t7
2t8
219
2t9
220
22t
22l
222
222
223
224
No.
A.t7
8.1
BFigl
8.2
8.3
8.4
B.5
8.6
8.7
8.8
8.9
B.10
8.11
B.I2
8.13
8.14
B.15
8.16
8.17
XXI
Title
Main cultivar effect for the percentage soft seed, hard seed anddormant seed at each sowing time, above- and below-ground.
The sheep body weights (kg/headexperiment,4.g.86, 4.6.87 and I2.lwool weghts (kg/head) on 19.3.87.
) at three stages in the1.87 and also the greasy
Relationship between pasture yield and electronic probereading.
The percentage bare-ground on 19.10.87 (Levy point quadratdata) at MES.
The above-ground burc#lm2for the year 1986 at MES.
The below-ground burr#lr& for the year 1986 at MES.
The above-ground burr#/rçp for the year 1987 at MES.
The below-ground bur. #lmz for the year 1987 at MES.
The total bur^ #lrfl for the year 1986 at MES.
The total bun #/m2 for the year 1987 at MES.
Regeneration of sub clover seedlings counted 2O lil4ay 7987 at
MES (Att data show plants/m2).
Regeneration of sub clover at Mortlock Experiment Station1988 (All data show plants/m2).
Available pasture: sub clover, weeds and total on23 Oct.,1986at MES (kg DM/ha).
Available pasture: sub clover, weeds and total on 21Nov.,1986 at MES (kg Dlvl/ha).
Available pasture: sub clover, weeds and total on 16
Sept.,1987 at MES (kg DM/ha).
Pasture availability data (kg DMlha) derived from ElectronicPasture Probe readings on the last harvest occasion on 25Nov., 1987 at MES.
Botanical composition: percentage overlapping cover of subclover, grass, other legumes and broadleaf weeds (Levy PointQuadrat data, grazing experiment at MES on 19.10.87).
Pasture production between harvests 1 and 2 (H1 - H2 = 50days), Harvests 2 and 3 (HZ - H3 = 35 days), ancl totalproduction (kg DM/ha) at MES in 1986.
Pasture production: cumulative winter grolYlh (emergence toHarvest 1, (E - H1), Harvest 1 to Harvest} (Hl - H2) and totalproduction at MES in 1987 (All data in kg DM/ha).
XXII
No.
8.18
8.19
8.20
B.2t
8.22
8.23
8.24
8.25
8.26
B.2l
8.28
8.29
c.1
c.2
Title
Seed yield (kglha): Above-ground (AG, Below-ground (BG)and Total (T) for the year 1986 at MES
Seed numberlm2: Above-ground (AG), Below-ground (BG)and Total (T) seed number at two sowing rates and threestocking rates for the year 1986 at MES.
Number of seeds/burr for above- (AG) and Below-ground(BG) buns at two sowing rates and three stocking rates for theyear 1986 at MES (Data based on dissection of 20 burrs).
The mean seed weight (mg) of the above-ground and below-ground burrs at two sowing rates and three stocking rates forthe year 1986 at MES.
Germination tests on seed in above-ground burrs (arcsinetransformed),7o soft (S), Vo hard (H) and Vo dormant (D) forthe year 1986 at MES.(Natural percentage values are shown inbrackets).
Germination tests on seeds in below-ground burrs (arcsinetransformed),7o soft (S),7o hard (H) and 7o dormant (D) forthe year 1986 at MES. (Natural percentage values are shown inbrackets).
Seed yield (kg/ha): Above-ground (AG), Below-ground (BG)and Total (T) seed yield for the year 1987 at MES.
Seed numberlmZ: Above-ground (AG), Below-ground (BG)and Total (T) at two sowing rates and three stocking rates forthe year 1987 atMES.
Number of seed/burr: Above-ground (AG), Below-ground(BG) and Total (T) at two sowing rates and three stocking ratesfor the year 1987 at MES.
The mean seed weight (mg) from Above-ground (AG), Below-ground (BG) and Total (T) burrs at two sowing rates and threestocking rates for the year 1987 at MES.
Germination tests on seed in above-ground burrs (arcsinetransformed),7o soft (S), 7o hard (H) and 7o dotmant (D) forthe year 1987 at MES.(Natural percentage values are shown inbrackets).
Germination tests on seed in below-ground burrs (arcsinetransformed),7o soft (S), Vo hard (H) and 7o dormant (D) forthe year 1987 atMES.(Natural percentage values are shown inbrackets).
The bodyweights of sheep in the summer-autttmn grazingexperiment at the Waite Institute, 1987.
The bodyweights of sheep in the pen feeding experiment at theWaite Institute, 1988.
240
Page
241
243
244
250
251
242
245
246
247
248
249
252
252
XXiii
No.
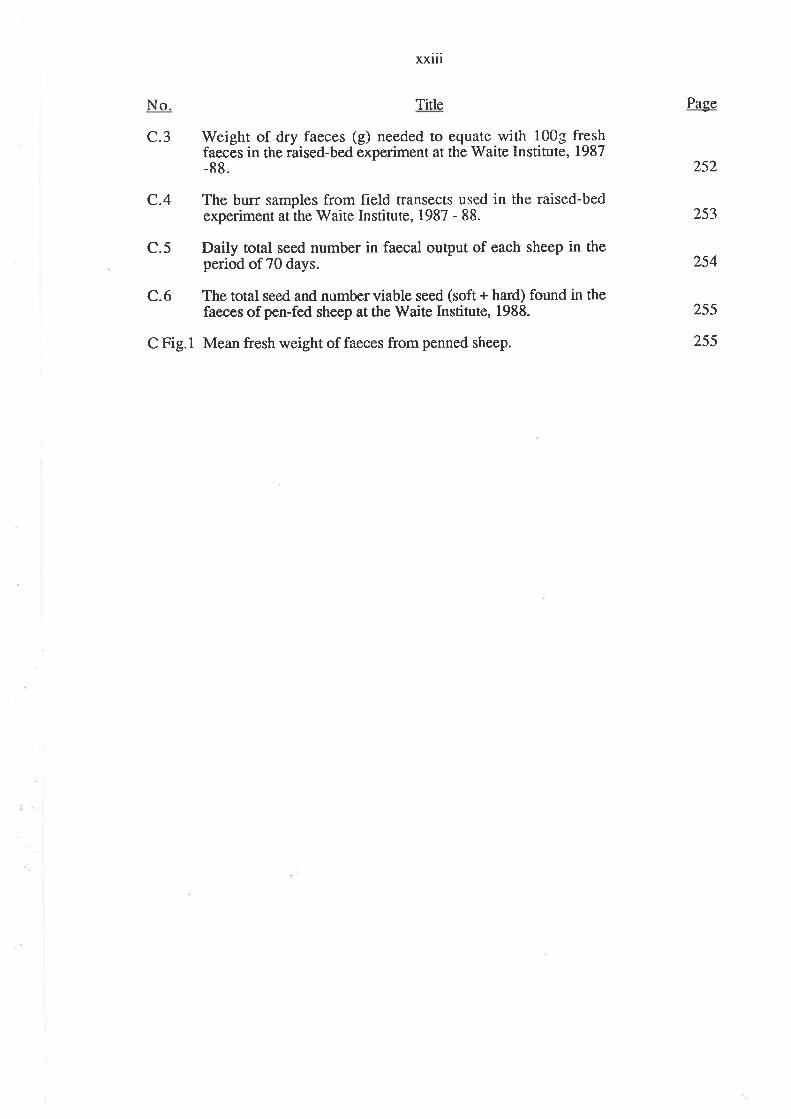
c.3
Title
rWeight of dry faeces (g) needed to equate with l00g freshfaeces in the raised-bed experiment at the \ü'aite Institute, 1987-88.
Page
252
253
254
255
255
C.4 The burr samples from field transects used in the raised-bedexperiment at the Waite Institute, 1987 - 88.
C.5 Daily total seed number in faecal output of each sheep in theperiod of70 days.
C.6 The total seed and number viable seed (soft + hard) found in thefaeces of pen-fed sheep at the V/aite Institute, 1988.
C Fig.1 Mean fresh weight of faeces from penned sheep.

r' i :l
,.r1,:.1 ,"
1. GENERAL INTRODUCTION
Subterranean clover (Trifolium subterraneum L.), hereafter refered to as sub
clover, is the most important pasture plant in southern Australia. Sub clover forms the
basis of about 20 million ha of sown annual pastures on neutral to acidic soils and
helping to guaranree the quality and quantity of livestock feed during the green and dry
stages (e.g. Rossiter and Pack 1956).
Sub clover probably originated in the Middle East, from where it spread throughout
the Mediterranean basin and v/estern Europe (Collins et al. 1984). In Australia, sub
clover was recognized as an 'alien' plant and first recorded as naturalised in Victoria
(Mucller 1888) but the exact introduction date is unknown. However, it was Amos
Howard in 1889 who first recognized the potential value of sub clover as a pasture plant
(Symon 1961). Mueller (1S95) also commented on its value. Howard, an Adelaide
nurseryman, first noticed a patch of sub clover in a field nea¡ Nairne, South Australia and
publicised the merits of sub clover with well-founded enthusiasm (Howard 1906 a, b)'
This genotype was later named as the cultivar Mt. Barker. Throughout the early 1900's,
Howard experimented and devised ways to harvest sub clover seed. The seed was
difficult to harvest due to burr burial, and the burr structure itself proved difficult to
thresh. The hrst sale of seed was in 1907, and by 1908, the demand for sub clover seed
from farmers and graziers had increased.
Cook conducred experiments on sub clover at the Kybybolite Experiment Station in
South Australia and made numerous reports from1922 to 1951 on the value of sub
clover as a pasture plant (cited by Symon 1961). The experiments reported by Cook over
this period played a major part in promoting and extending the use of sub olover
commercially throughout southern Australia. In \ùy'estern Australia and Victoria, interest
in sub clover was beginning to emerge at about the same time. The first public
recognition of the value of the plant by the South Australian Department of Agriculture
was in lg24,when Spafford wrote a major article on the virtues of sub clover, in which
topics such as fertilizers and harvesting were described (Spafford 1924).
2
In 1929 Adams selected Dwalganup, the first commercial strain in Western
Australia (Adams 1929): however, it was first introduced as a contaminant of imported
seed about 1890 on the property of the late Mr. P. D. Forrest at Boyup Brook, Western
Australia. During the next 20 years there were only six strains of sub clover in
commercial use, viz: Dwalganup, Yarloop, Cla¡e, Bacchus Marsh, Mt. Barker and
Tallarook. Bacchus Marsh and Tallarook arose from a collection of variants made by
Aitken and Drake in Victoria (Aitken and Drake I94l). Many Australian agricultural
scientists including C. M. Donald, C. A. N. Smith and D. E. Symon went to the
Mediterranean basin on expeditions to collect sub clover and other pasture species. For
about 70 years the commercial sub çlovers were all regional ecotypes but later there were
deliberate crosses e.g. the cultivars Howard (1964) and Uniwa ger (1967). The dates of
first use or release of the newer cultivars are shown in Table 1. At the present time
(1989) there are at least 22 commercial cultivars available. Many of the recently released
cultivars were selected or bred at the National Subterranean Clover Improvement
Program (N.S.C.I.P) in Western Australia.
Sub clover cultivars can be allocated to three different subspecies, each of which
has a distinct ecological basis (Katznelson and Morley 1965): TriþIium subterraneum
subsp. subterraneum (e.g. Tallarook), T. subterraneum subsp. yanninicttm (e.9.
Yarloop) and T. subterraneum subsp. brachycalycinum (e.g. Clare). A diversity of
cultivars have been selected from these three subspecies to fill many ecological niches and
to cover a range of agronomic situations. A wide range in maturity, relatively high
tolerance to grazing, various levels of hard-seededness and burr burial have all
contributed to the success of sub clover in southern Australia. However, insect pest
resistance, disease resistance (e.g. to clover scorch, Kabatiella caulivora ) and low
oestrogen content are characteristics which are also important. Some of the important
characters of registered sub clover cultivars in Australia are given in Table 1 (Collins er
al.1984).

1
Tablc l: Data on subterranean clover cultivars, sub species Yanninicum (Y), Subtenaneum (S)
and Brachycalycinum (B).
Days fromsowing toflowering*
Flowering+begins about
Seed setcompletedby
Relative**hard-seededness
Ocstrogcnicactivity
Relative**CloverscorchresisÍmce
Nungarin (1916) S 77Northam (1912) S 78Dwalganup (1929) S 83Geraldton (1959) S 97Daliak (1967) S 97Dalkeith (1983) S 98Uniwager (1961) S 103Yarloop (1939) Y 109Seaton Pa¡k (1967) S 110Trikkala (1975) Y Ir2Dinninup (1962) S 113Enheld(1982) S ll8Esperance (1978) S 120
Clare (1950) B rz9Woogenellup (1959) S 130Howa¡d (1964) S 93-135Bacchus Marsh (1947) S131Mt. Ba¡ker (1935) S 137Larisa (1975) Y 142Nangeela (1961) S 143Meteora (1981) Y 148
Early-mid Aug. Late Sept.Mid Aug. Early-mid Oct.Mid Aug. Mid-late Oct.Mid-late Aug. Early Oct.Late Aug. Mid-late Oct.Late Aug.++ Mid-late Oct.Mid-late Aug. Early Oct.Early Sept. Late Oct.Early Sept. Late Oct.Early Sept. Early Nov.Early Sept. Early Nov.Early Sept.++ Early-mid Nov,Early Sept. Early-mid Nov.Mid Sept. Late Nov.Mid Sept. Mid Nov.Early-mid Sept. Mid. Nov.Mid Sept. Mid-late Nov.Late Sept. Late Nov.Early Oct. Early Dec.Early Oct. Early Dec.Early Oct. Early Dec.
VeryHigh
108186
8-9545J7
1-25
3JJ1
Ia
L
8I
LowLow
II4I9III1
63696II5
66J86
high
Tallarook 0943\ S 163 Mid Oct. Mid Dec.
LowLowLowVery highLowLowVery highLow to mediumLow to mediumLowLowHighLowLowLowLowMediumHieh
* Sown at Perth in early May+ In a¡eas where the cultivar is commonly gro'ffn
Source: Collins et al. 1984
++ Estimates based on existing cultivars** Scale of 1 to 10 for bottr hard-seededness at the autumn seasonal break and resistance to clover scorch
1 = Little or no hard-seedednessÂittle or no resistance to clover scorch10 = Verv hish level of ha¡d-seededness/verv hi eh of resis0ance to clover scorch
In Darentheses is the date of release or commercial in W.4.. see B¿¡rna¡d 1972
Within the relatively short time that sub clover has been in AusEalia it has become
widely distributed. An extensive survey of sub clover burrs collected from wool samples
from a various locations in South Australia showed that the older cultivars had the widest
distribution (Cocks and Phillips 1979). Variations from the original biotypes were also
found. Despite this spread of sub clover there are three boundaries which do limit the
distribution of sub clover in Australia,viz: alkaline soils, the 400mm rainfall isohyte (i.e
the arid zone) and the frost and excessive cold boundary (1,220 m altitude in the
Australian alps, Donald 1960). Morley (1961) and later Rossiter (1966, 1978)
summarized research on the ecology of sub clover-based pastures'
4
While there has been considerable investment in breeding new cultivars of sub
clover there is little merit in producing new cultivars if these are mis-managed- It is
therefore important to understand the ecological basis of the productivity of sub clover-
based pastures particularly when grazed by ruminant livestock. Pasture and/or grazing
management will therefore become increasingly important in Australia. Recently, there
has been re-newed interest in legume-based pastures in crop rotations as the value of
cereal crops has decreased and wool prices have increased. However, over the past 20
years the productivity of sub clover pastures has declined because many of the necessary
skills to manage them have diminished. Though medic and sub clover-based pastures
have deteriorated in many regions (Carter 1976 et se.q.), there is an urgent need for
pasture renovation and re-establishment in higher-rainfall pasture zones.
There is also increasing interest in the use of complex mixtures which consist of
several cultivars and/or species, to improve the productivity and persistence of sub
clover-based pastures. This practice has been advocated by a number of researchers
(Carter and Wigg 1963; Carter et aI. 1982; Dear 1982; Carter 1983, 1987; Christian
1987; Obst 1987; Reed 1987; Reeves 1987 and Simpson and Culvenor 1987) because the
dry matter production of complex mixtures (4 or more cultivars of differing maturity) is
more stable and seed set is more assured under most adverse conditions, thereby helping
to guarantee persistence.
A neglected area of pasture ecology that is crucial to the continued productivity of
sub clover pastures is seed survival over the hot, dry Summer months. In most areas of
sub clover pastures in Australia, the dry pasture residue is grazed by livestock. The
availability of these pasture residues is an integral part of sheep production in the
cereal/livestock zone. However, despite its importance there is little information on sub
clover seed survival during summer and autumn months.
Despite the millions of dollars spent on developing new cultivars of sub clover (and
other pasture plants), there is a considerable lack of knowledge on the complex soil-plant-
-5
animal interrelations of the grazed.pasture ecosystem. This is especially true with annual
pastures based on self-regenerating legumes like sub clover. Precise recommendations
for management of sub clover pastures to ensure maximum production of herbage and
seed during the growing season do not exist or are inadequately defined. Furthermore,
the optimum management of the dry pastute residues in summer and autumn to ensure
adequate survival of seed for regeneration of a dense, productive sub clover pasture also
requires definition.
The aims of this thesis are to improve knowledge of the ecological basis of sound
management decisions related to sub clover-based pastures. The major area of the
research described in this thesis is the management of sub clover-based pastures with
emphasis on their ecology. The literature has many examples Of the relationship between
grazing management and animal production (e.g. Fitzgerald 1976) but very little
emphasis on the impact of grazing on pasture production, changes in botanical
composition and the seed-seedling dynamics of the pasture. Two research priorities were
therefore addressed in this thesis. Firstly, the pasture and/or grazing management needed
to maximize the herbage and seed production of sub clover during the growing season
and secondly, the grazing management to ensure adequate seed survival over the dry
suûìmer-autumn period.
Chapters 3 and 4 concentrate on the first priority i.e. the various factors influencing
herbage and seed production of sub clover in both ungrazed and grazed situations.
Chapter 5 deals with the impact of summer-autumn grazing by sheep on seed survival of
sub clover and complementary pen-feeding studies in the animal house to assess seed
survival of five cultivars of sub clover after ingestion by sheep.

6
2 LITERATURE REVIEW
2.0 Introduction
Despite the success of sub clover as a pasture plant, there are problems associated
with sub clover-based pastures: for example, difficulties with pasture establishment,
increased occu¡aence of insect pests (e.g. blue-green aphid, Acyrthosiphon kondoi) and
fungal diseases (e.g. clover scorch, Kabatiella caulivora) (Gramshaw et al- 1989). In
addition, the behaviour of sub clover under grazing is inadequately understood. In the
past, research emphasis has been placed mostly on animal production from pastures with
little regard to the growth and persistence of sub clover-based pastures or have involved
defoliation by cutting, which is not representative of grazing.
Sub clover cultivars and plant density are important components of pasture
production and therefore have relevance to research priority one (Chapter 1). Therefore,
this literature review will cover differences in herbage and seed production between sub
clover cultivars and the effects of sub clover plant density on both herbage and seed
yield. The influences of defoliation by cutting and grazing ruminants on the production
of sub clover-based pastures are also addressed in this review as this is also related to
priority one. Finally, the fate of pasture seeds, including those of sub clover consumed
by grazingruminants is the focus of the final section of this literature review which has
geat bearing on research priority two (Chapter 1).
Z.L Differences in the productivity of subterranean clover cultivars
Differences in productivity between sub clover cultivars have been established in
the earliest experiments with this species. Assessment of sub clover cultivars for
production differences were first made at the V/aite Agricultural Research Institute
(WARI) during the 1930's (Anon. 1937 - 1933). Large differences in maturity of
cultivars were demonstrated in this work (e.g. the cultivar Dwalganup flowered 99 days
after sowing, cultivar Tallarook flowered 166 days after sowing). A positive correlation
was found between late-maturity and herbage yield. Further trials at WARI including the
cultivars Dwalganup, Mulwala, Seaton Park, Bacchus Marsh, Mt. Barker and Tallarook
(Anon. lg3g-4}) shorved that the cultivars Bacchus Marsh, Mt. Barker and Tallarook
l
produced high densities of seedlings in the regeneration year. The early cultivars
Dwalganup, Mulwala and Seaton Park had set a high proportion,of hard seed, therefore
herbage yietd in the year of regeneration was not as high as the yield obtained by the late-
maturity cultivars. Results from trials (Anon. l94l-42) found Bacchus Marsh was well
adapted to the soil and climatic conditions at field sites located at the Waite Institute,
Salisbury and Kangaroo Island in South Australia. At each of the field sites, Bacchus
Marsh outyielded all other cultivars, particularly the white-seeded cultivar Yarloop from
Western Australia. However, Yarloop did grow better than Bacchus Marsh under wetter
conditions.
The series of experiments conducted at WARI demonstrate the need for several
cultivars of varying maturity to be used in experiments involving the evaluation of sub
clover. Late maturing cultivars have the potential to produce more herbage than early
maturing cultivars if the seasonal conditions are favourable. However, early maturing
cultivars can provide more feed in the earlier stages of the growing season provided the
hard-seed levels are not too high. Hard seed levels which are too high could be
detrimental to the regeneration because the number of seedlings at regeneration are
indicative of the early herbage productivity.
Since the early 1950's, farmers and research workers have observed that some
cultivars of sub clover within the three subspecies- Triþlium subterraneum subsp.
subterraneum,T. subterraneum subsp. yanninicum, and T. subterraneum subsp.
brachycalycinum grew more vigorously than others during the winter months (Carter
1954; Anon. 1955; Higgs 1958) which sometimes resulted in greater livestock
productivity (Day 1963). Morley (1958), found that differences in productivity of
cultivars in the early vegetative stage depended largely on leaf area. He grew Tallarook,
Clare, Yarloop, Wenigup and Bacchus Marsh as spaced plants at constant temperatures
of 16.8oC, 18.6oC and24.2oC. Temperature x Cultivar interactions were found for
relative growth rate, net assimilation rate and leaf weight during the early vegetative
stages. Some differences in the productivity of sub clover cultivars can be attributed to
density effects (Wolfe 1981) and seed size effects (Black 19-59, Evers 1982)' Lawson
8
and Rossiter (1958) found that at a constant sowing rate, differences between sub clover
cultivars in the early growth rate of tops could not be attributed to differences in seed
size. Dwalganup had superior yield over Mt. Barker during winter and early spring.
Yarloop was shown to have outstanding winter production in waterlogged lateritic
podzols on Kangaroo Island (Carter lg5l,lg52; Anon 1955; Day'1963;Carter and Wigg
1963) and it was subsequently oversown into many sheep, beef and dairy pastures in the
higher rainfall areas of southern Australia during the 1950's to increase winter
production. Experiments at Rutherglen Research Station showed that the earlier-maturing
cultivars (Bacchus Marsh, Burnley and Yarloop) produced more winter feed than the
later-maturing cultivars (e.g. Mt. Barker). Similar results were found later by de Koning
(1984) and de Koning and Carter (1987 a, b). The earlier-maturing cultivars promoted
greater wool production: however, the total production for the season was the same for
all cultivars (Anon. 1968). Cameron and McGowan (1968) also found that the winter
productivity of earlier-maturing cultivars were mostly better'than Mt. Barker. Bacchus
Marsh produced more dry matter in autumn-winter than Mt. Barker and liveweight gains
of sheep grazing Bacchus Marsh pasture were consequently superior to those on Mt.
Barker. In a mowing experiment, both Yarloop and Burnley were found to have good
winter yields as compared with Mt. Barker, Bacchus Marsh, Clare, Nangeela and
Portuga (CPI I44 54). These studies indicate that early maturing cultivars are inherently
more productive. However, plant numbers of early maturing cultivars in a comparison
with late maturing cultivars would be required, particularly early in the season to ascertain
whether productivity differences were due to higher densities at emergence.
Cameron and McGowan (1968) concludecl that the superior growth of some
cultivars need higher utilization by grazing animals to be reflected as a saleable product
from those animals. There is no merit in having highly productive cultivars if they are
not utilized by the grazinganimal. However, not all research has shown that the highly
productive sub clover cultivars are the best in terms of animal production. Intake by
grazinglivestock and subsequent liveweight gain is also dependent on the palatability and
digestability of the sub clover. Dinninup, for example, has excellent winter prodr'rction
9
but is highly oestrogenic (Anon. lg73). It was found that sheep grazing Dinninup during
mid to late winter did not gain weight as fast as sheep grazing other types of sub olover
(Anon. lg1.3). This was a6ributed to reduced intake of Dinninup which was probably
due to unpalabililty. The same study also found that Dwalganup and Geraldton were
high in winrer production but sheep grazing those cultivars did not gain bodyweight.
Pastures based on Dinninup, Dwalganup and Geraldton all produced less wool than
pastures based on other cultivars. These three cultivars are high in formononetin which
would contribure to their unpalatability. Dunlop et aI. (19S4) also found that the
liveweight of sheep grazing a grass-free Dinninup pasture were on average 6'0 kg per
head lighter than sheep gtazing grass-free pastures based on other cultivars'
The large differences in height of sub clover cultivars means that visual appearance
of high herbage yield can be deceptive. This has resulted in controversy over potential
winrer production of various cultivars (Rossiter and Collins 1980; Wolfe 1982)- The
resulrs obtained by Rossiter and Collins (1930) showed no significant difference in
winter productivity between cultivars. This result conflicts with those of Morley (1958)
who found differences in productivity between cultivars grown at low temperatures.
However, Rossiter and Collins used three non-commercial genotypes of subterranean
clover which had been observed to have poor winter growth and the cultivar Tallarook.
They also compared spaced plants to swards and had alternating daylnight temperatures
(12oC llocdaylnight and2}oC llloc). No significant differences were found for sub
clover plants growing as spaced plants or in swards. A decrease in regrowth of less than
207o exhlbrted by Phillip Island compared with Tallarook at the low temperature (12oC /
7oC) did not qualify Phillip Island as abnormally cold susceptible. It was concluded by
Rossiter and Collins that poor winter growth may be due to factors other than a "winter
dormancy" phenomenon.
Collins et al. (I983a) suggested that under good conditions of moisture, nutrition
and plant density, substantial differences in winter production between sub clover straitls
were unlikely, particularly if swards were defoliated closely (2cm height at weekly
intervals). However, in South Australia, there is evidence that cultivars do differ in
l0
productivity in winter when undefoliated and defoliated. Yarloop and Clare out-produced
Larisa, Mount Barker and Trikkala in growth cabinet studies, raised-bed and field
experiments (de Koning 1984; de Koning and Carter 1987a). The high productivity of
yarloop and Clare cannot be attributed to seed size effects because seed of constant size
was used for all cultivars.
Differences between cultivars during early winter may also depend on the sowing
date. Dear and Loveland (1984) found that when emergence occurred in March'
Woogenellup and Seaton Park were slightty more productive than Nungarin and Mt'
Barker. However, when the same sub clover cultivars emerged later (e.g. April and
May) there were no differences between the cultivars during the early stages of growth'
Dear and l-oveland (1994) concluded that differences between cultivars irt teûrperature
response could be very relevant to winter production, especially if swards have a low leaf
area index such as when they are grazed hard or growing slowly' Responses to low
temperature will then reflect the response of individual plants within the sward.
'Winter productiviry differences between sub clover cultivars may also be influenced
by the subspecies group to which the cultivar belongs. Reed ¿r ¿/' (1985) found that the
Trifolium subterraneum subsp. yanninicum cultivars Trikkala and Yarloop were
consistently more productive in winter than the T. subterraneum Subsp. subterraneum
cultivars Mt. Barker and Woogenellup. Production of the T. subterrLneum subsp-
yanninicum cultivars was similar at poorly-drained sites or well-drained sites, but the
most productive T. subterraneum subsp. subterraneum, i.e. cv. Woogenellup, produced
significantly less on the poorly drained sites compared to the well drained sites'
Genotypes of T. subterraneum subsp. yanninicum are known for their adaptability to
warer-logged conditions (Katznelson 1970). Essentially, the field experiments in south
west Victoria showed that the newer cultivars are more productive in winter than Mt.
Barker and as a result they should compete better with winter-growing weeds (Reed et al'
1985).
1l
Reed (1987) emphasized that much more remains to be done to improve wlnter
growth even though at present we do have well proven Species and cultivars available'
Both the South Australian and New South wales Departments of Agriculture are selecting
T. subterraneum subsp. brachycalycinum lines for vigorous growth and good
persistence. The potential use of new T. subterraneum subsp. brachycalycinum lines for
northern N.S.W was assessed by Archer et al. (1987). The lines from T. subtemaneum
subsp. brachycalycinumcompared well with the T. subterraneum subsp' subterraneum
cultivars for dry matter yields. Clare, aT. subterraneum subsp' brachycalycinum
cultivar was found to be highly productive during the winter of 1984 as compaled with
the most productive T. subterraneum subsp. subterraneum cv. Woogenellup' Some of
the new lines of T. subterraneum subsp. brachycalycinum were also found to have better
spring production than both Clare and Woogenellup.
The superior early growth of both Yarloop and Clare grown in growth cabinets,
raised beds and in the field, was shown in experiments at the Waite Institute (de Koning
I984;de Koning and Carter 1987a). High dry matter production, although desirable, is
not the only criterion used to select new sub clover cultivars. Disease and pest resistance'
low formononetin content and high seed yields with a large proportion of hard seed are
also considered important by the National Subterranean Clover Improvement Programme
(Stern et al. I98l) .
Conclusions: As discussed in the literature, differences in the productivity of
sub clover cultivars are due to factors such as maturity and sub-species group, and the
growth of a cultivar is further modified by temperature. However, it is important to
consider the grazing animal when examining difl-erences in herbage productivity between
cultivars. Superior herbage yield of a sub clover cultivar is of no advantage if sheep do
not eat it because of unpalatability (Ano n. 1913) or the utilization of that pasture by sheep
is inefficient due to low stocking rates. Future research on sub clover-based pastures
should place more emphasis on high winter production rather than high total seasonal
production.
t2
2.2 Effects of density on productivity of subterranean clover
As described in secti,on2.l, some cultivars of sub clover exhibit vigorous winter
growth which could be due to high individual seedling vigour or high seedling density.
Seedling density is of particular importance at the time of autumn break in the season as
early growth per unit a¡ea is directly related to plant numbers. However, the growth per
plant can also be important. Hence high density improves herbage yield in winter and, as
feed scarcity in winter imposes limits on animal production, high density can increase
year-round stocking rates. In conftast, in spring there is normally an abundance of feed
for grazing animals and herbage production at this time is largely due to maturity of the
sub clover cultivar (Wolfe 1981). Wolfe (1981) concluded that the assessment of sub
clover cultivars in the field should emphasize population characteristics such as seedling
density (measured at the start of the season) and seed yield measured at the end of the
growing season (Carter 1981; Carter et al..1982).
Donald (1954) showed that sub clover plants of the cultivar Mt. Barker grown at
the lowest density (12 plants/mz) were the largest (31.3 glplant) and became
progressivety lighter as density increased; until at the highest density (18,510 plants/m2)
individual plants only weighed 0.04 grams (plants sown 21 April 1949 and harvested 12
Dec. 1949). Racemes per plant, seeds per plant and weight of seed per plant followed
similar decreases as plant density increased. Overall, maximum dry matter production
occurred at intermediate densities and was maintained at the higher densities. Stern
(1960) found that for high-density swards of sub clover (36 plants/d-2¡ the ceiling Leaf
Area Index (LAI) was reached 100 days after emergence as compared with 146 days for
plants grown at the low density of 4 plants /dm2. The medium density (16 plants/dm2)
was intermediate and the ceiling LAI was reached at 123 days. He also found that
individual plant weight increasingly became a function of density after 34 days, the
largest plants being found at the lowest density. He attributed this partly to the survival
of all branches while the number of branches decreased at the medium and high densities.
Both studies by Donald (1954) and Stern (1960) showed that high densities greatly
13
reduced the individual plant size, therefore intermediate densities used by both
researchers were best in terms of increasing ancf maximizing dry matter production.
Yates (1961), found that the dry matter production varied between sub clover
cultivars (Dwalganup, Yarloop, Bacchus Marsh, Burnerang and Tallarook) at the lower
plant densities. As density increased, differences between strains were reduced. The
early-maturing cultivars were stemmy when grown as single plants: however, as density
increased there were morphological changes such as increased height of the sward due to
petiole elongation.
Plant density is the first important factor in determining the leaf area and dry matter
presenr (Spedding 1971). Responses to light and particularly temperature depend on the
amounr of dry marter present (Cocks 1973; Fukai and Silsbury 1977). Cocks (1973),
showed that when the LAI was low (0.2), gowth rate was found to increase with
increasing temperature up to 22o day/I7oC night. Higher density swards (LAI 3.0) were
nor influenced by temperatures in the range tested (IzoC day/7oC night to 27oQ ivyl27oC
night), while at a higher LAI (5.5) the growth response became negative with increasing
temperature. Silsbury and Fukai (1977) showed similar results. In general, plant density
influences the stage at which competition commences between and within species. As
density increases, the growth stage at which competition begins will be earlier (Donald
1951). Competition is often for light, usually when other factors such as nutrients and
water are abundant (Davidson 1954). Given sufficient time both low density and high
density swards tend toward a similar LAI and yield (Davidson and Donald 1958; Prioul
and Silsbury 1982). The ability of low density swards to eventually attain similar yields
to that of high density swards can be attributed to higher glowth rates than for those at
high density swards but the relative gowth rate decreases with increasing density
(Donald 1951).
A plant that effectively utilizes the factors necessary for growth will also be a strong
competitor when growing in association with other species and sometimes when growing
in monocultures. The reason for intense competition between members of the same
14
species is due to the plants having a similar requirement for the necessary factors for
growth (e.g. light and moisture). Therefore, in pure swards of sub clover, inter-plant
competition can be intense. Burch and Andrews (1976) found that the contrasting
behaviour of the sub clover cultivars Yarloop, Larisa, Yl11, Y136 and 39313Y grown in
monoculture or in binary mixtures was more pronounced at the low density (2O
plants/dm2) than ar the high density (40 plants/dm2¡. Yarloop produced larger plants than
Larisa even when the proportion of Yarloop to Larisa was 1:4. However, genotype was
shown to be more important than density for herbage production. The density only
influenced individual plant size. Silsbury and Fukai (1977) found that the maximum crop
growrh rate (glmz/day) with sowing in May for sub clover decreased from 13.1 to 9.8 as
density increased from 1,000 plants/m2 to 4,000 plants/m2 for ungrazed swards- This
also occurred at each density for June and August sowings. In later research, Prioul and
Silsbury (1932) found that a low density, ungrazed sward of sub clover had a higher
crop growth rate than the high density sward.
It is not always possible to specify precisely the most desirable seedling density for
sub clover-based pastures because of the range of environmental conditions and
management practices. However, Taylor et aI. (1984) have suggested that a density of at
least 1000 to 5000 plants/m2 is necessary to produce good pastures for a wide range of
grazingmanagement systems in medium to high rainfall environments. More recently,
Carter (1989), has emphasized the importance of total weight of readily germinable (soft)
seed; 200 kg/ha should provide a good level ofregeneraúon'
Conclusions: Plant density has a large influence on both the individual plant
yield and sward yield. Density mostly influences the stage at which competition begins
and its severity. Therefore, it is essential to include various density levels in experiments
involving the comparison and assessment of different sub clover cultivars. Most of the
density and competition studies have focussed on sub clover and the grass relations of
mixed pastures (e.g. Stern 1960). Little attempt has been made to examine the effects of
density on the $owth and persistence of different cultivars of sub clover in pure and
mixed swards consisting of several cultivars (de Koning l9tì4). None of the plant

l-5
density experiments described here have involved defoliation by grazing. Since plant
density has such an important influence on the productivity of sub clover it is surprising
that it has received very little attention under grazingconditions.
2.3 Effects of mechanical defoliation on subterranean clover
In grazed communities of plants there is a continual likelihood of defoliation. The
success of a pasture therefore partly depends on its ability to cope and recove¡ from
frequent defoliation. The effects of defoliation on the growth of plants is influenced by
the height of defoliation, the frequency of defoliation, the stage of gowth at which
defoliation occurs and the species or cultivar being defoliated (e.g. Motazedian 1984). It
is well established that cutting management can influence yield of harvested material
(Spedding I97t).
The amount of foliage, in particular leaf material, present prior to defoliation and the
amount remaining following defoliation are the key to the responses to defoliation
(Brougham 1956 Davidson and Donald 1958). In addition, climatic conditions at the
time of defoliation also influence the response.
Brougham (1956) imposed three defoliation intensities on a pasture of short rotation
ryegrass, red clover and white clover by cutting to 25,75 and 125mm. Measurements
were made of the herbage dry matter, leaf area index and percentage light penetration 25
mm above ground level. The pasture defoliated to 25mm required 24 days after
defoliation to redevelop a canopy to intercept 937o of the incoming radiation, rvhile
pastures defoliated to 75 and 125mm could intercept almost all incident radiation after 16
and 4 days respectively. In summary, during recovery from defoliation, the most severe
defoliation resulted in the lowest initial $owth rate and the longest interval taken to reach
the maximum growth rate.
Davidson and Donald (1958) sowed Bacchus Marsh sub clover at different densities
(25, gg,346 and 1236 plantslmz). The control swards were not defoliated while the
other swards were subjected to a single defoliation at various dates (507o of herbage

r6
removed on a fresh weight basis). Dry matter production slightly increased for those
swards defoliated near rhe ceiling LAI. Yet swards defoliated at very low LAI (below 3)
or high LAI (8.7) showed marked reductions in both dry matter production and leaf
production. Therefore, the growth stage (i.e. LAI) at which defoliation occurred is very
important in this experiment.
Black (1963a) examined the effects of a single severe defoliation on six commercial
cultivars of sub clover. He proposed three categories of cultivars based on the reaction to
defoliation as follows: (i) the tall cultivars such as Yarloop and Clare which recovered
slowly following defoliation, (ii) the prostrate cultivars with many small leaves such as
Dwalganup and Tallarook which recovered rapidty following defoliation and (iii) an
intermediate group of cultivars including Mt. Barker and Bacchus Marsh which recovered
from defoliation at a reasonable rate.
Black concluded from this study, that prostrate cultivars were favoured by low
cutting height, mainly because they had more leaf remaining following defoliation. The
height of the cultivar being defoliated was the main factor determining the response to
defoliation in this experiment. Black (1963b) also studied the inter-relationship between
defoliation and sub clover cultivars Yarloop and Tallarook in pure and mixed swards.
yarloop recovered slowly from severe defoliations, while Tallarook recovered relatively
quickly. However, Yarloop leaves did re-establish above the Tallarook canopy. Black
concluded that the response of pure swards to severe defoliation was not a good guide to
their behaviour when gfown in mixtures. The research by Black was important to
demonstrate the differences between sub clover cultivars in their response to defoliation:
however, his research on sub clover during early vegetative growth does not fully relate
to the field situation.
Most tall cultivars of sub clover can adjust to defoliation if it is more frequent and
nor roo severe (i.e. the height of defoliation is high). Sub clover can adapt to weekly
cutting by the development of a prostrate network of runners and dense sites of leaf
production. Forexample, in one study,707o of defoliated sward herbage was leaf as
compared with257o for uncut swards (Davidson and Birch l97z).
11
Rossiter (1g76) found that defoliated swards yielded less than uncut swards. A
possible reason proposed by Rossiter was that there was a lower LAI for defoliatå¿
swards. If so, this result is similar to that found earlier by Davidson and Donald (1958)'
Swards of sub clover cultivars Blackwood, Dwalganup and Daliak were grown outdoors
and defoliated to 1.5 cm every 14 days or every 3 to 4 days (Rossiter 1976). Defoliated
swards had developed smaller and more numerous leaves than the uncut swards- The
compact, small leaved varieties with high branch and leaf number are more tolerant to
frequent defoliation than the taller varieties. Burch and Andrews (1976) found
dominance of the sub clover cultivar Yarloop over Larisa when grown in binary uncut
swards but this dominance disappeared when the sward was cut frequently' Taylor et al'
(Iglg),found that maximum forage yield was achieved by taking a single late cut'
Collins et al. (1983a), conducted defoliation experiments at Perth, Western
Australia and Wagga'Wagga, New South Wales. The productivity during the winter
months was compared for selected cultivars of sub clover at the two locations. At Perth,
cv.'Woogenellup, Esperance and genotype 209.8.19.1 we're grown in an open-sided
glass shelter. Five cultivars were glown at V/agga Wagga in the open' The cultivars
included woogenellup and Esperance but also Nungarin, Larisa and Yarloop. Selection
of cultivars was based on a range of growth habits and reputed differences in winter
growth. However, results indicated that there was very little difference between
productivity of the cultivars at both sites.
Differences of productivity between different pasture species under defoliation are
common. For example, Motazedian (1984) conducted field studies in which perennial
ryegrass (Lolium perenne L.) and sub clover pasture was defoliated every 7 ,21,35, or
49 days to the stubble heights 70, 55 and 40mm. Total dry matter production increased
as the frequency of defoliation decreased. The erect growing perennial ryegrass
produced more dry maner with a high stubble height while sub clover gave greater yields
with low stubble heights. Therefore, the effect of defoliation in this experiment depended
on rhe growth habit of the plant and the height of defoliation.
ltì
Conclusions: Defoliation has an important influence on the productivity of sub
clover cultivars. There are examples of differences in the response to defoliation which
are mostly due to the growth habit of the cultivar. Prostrate cultivars are normally more
tolerant to defoliation rhan tall cultivars, although the frequency of defoliation is also
important. Threrefore, it is important to incorporate some form of defoliation (i.e. cutting
or grazing) after herbage production has been assessed under non-defoliated conditions.
In some situations defoliation may nullify any production differences between cultivars
(Collins et at.1983a). Although defoliation by mechanical methods has provided a great
deal of information about the basic responses of sub clover to defoliation. Mechanical
defoliation is not representative of the field situation under the influences of grazing
livestock. Interactions between sub clover plant density and detbliation in relation to
herbage production are little understood, yet both factors have great influence on the
herbage production of sub clover - based pastures-
2.4 Defoliation by grazing
For the evaluation of legumes, like sub clover cultivars, frequent defoliations by
cutting are more realistic than a single defoliation. Cutting or mowing is rapid and
complete which is not representative of the field situation where the grazing animal is
consuming selected herbage. Therefore, plant responses after mowing may not be the
same as those after grazing (Matches 1968, Curll and Davidson 1983).
The various effects of the grazing animal on pastures, viz: ffeading, defoliation, re-
cyling of nutrients and the spread of seed, are well established. Mowing and other forms
of cutting are rapid and remove most (or all) herbage, while grazing animals selectively
remove herbage. Not only is there selection of which plants to consume but also between
plant pafts. Leaves, for example, are eaten in preference to stems; and green herbage in
preference to dry (Sheath and Rattray 1935). Sheep have even been found to select
Triþlium repens leaves without markings in preference to leaves with markings (Cahn
and Harper 1976). Also, grazing animals do not necessarily select the most abundant
species in a pasture. For example, when total pasture availability was very low, sheep
19
ignored the two most abundant species (Arctotheca calendula and Erodium botrys) and
prefçrred the more palatable species Wimmera ryegfass and sub clover (Broom and
Arnold 1936). The type of grazing animal also has an influence on pasture recovery'
Sheep graze close to the ground while cattle graze further from the ground'
Consequently, sheep remove more growing points from pasture plants than do oattle'
During grazing,livestock not only ingest feed, but also indiscriminately damage{
the pasture by treading, causing poaching and pugging. Under rainfed conditions Carter
and Sivalin gam (1977) showed that 98 days after sowing severe treading by sheep
caused a 467o reduction in plant numbers and 5l%o reduction in yield of sub clover and
corresponding reduction of 5I7o reduction in plant numbers and 32Vo reduction in yield
of Wimmera ryegrass. Treading also caused a337o reduction in late winter production
from irrigated sub clover-'Wimmera ryegrass pasture (V/itschi and Michalk 1979)'
Treading damage is also common on many pastures in high rainfall zones. Ultimately the
grazing animal returns some mineral nutrients back to the pasture via defaecation and
urination. Defaecation may also return some viable seed from pasture species and weeds.
(See Section2.6)
In the higher-rainfall areas of southern Australia, early and mid-winter are the main
period of feed shortage (due to low availability) and sub clover pastures are heavily
grazed.at this time. Therefore, the ability of sub clover cultivars to recover from heavy
grazing is important for continued productivity and persistence. Grazing tolerance of
some species can be explained by their ablility to retain relatively high residual leaf area
after defoliation (Simpson and Culvenor 1987). However, it is important for the residual
leaf area to have high carbohydrate content to enable rapid leaf production following
defoliation (Alberda 1966). Francis et aI- (1976) emphasized the need for more research
of grazing recovery and stated in relation to cultivar differences "that these be considered
in conjunction with winter growth because the two may in fact be antagonistic... rapid
growing types with leafy growth may not recover as well as other types and persist less
well in mixed swards". The literature has much on the general effects of grazing and
more often significance is placed on the productivity of the aninlal, with little reference to
20
the productivity and persistence of the pasture. Comparatively little is known about the
glowth and persistence of various sub clover cultivars under grazing conditions and the
influence that grazing management may have on various cultivars.
2.4.1 Grazing management
Management decisions have an impact by modifying the production or composition
of the plant biomass (Morley 1981). Stocking rate, the type or breed of livestock and the
methd of grazing (i.e. continuous, rotation, deferment etc.) are the factors which can be
manipulated by livestock producers. Stocking rate is still a major determinant of
livestock productivity (Carter 1965, 1968 b, lgll; Obst 1987) and affects the economic
rerurn from grazed pastures (Bransby and conrad 1985). The main objective is to make
herbage production fit the nutritive requirements of livestock (Morley 1966)' Another
important objective is to maximi zþ theintake of digestible organic matter (Christian 1987)
which does not necessarily mean maximum weight of pasture' In Australia' much
emphasis is placed on the management of stock rather than on the management of
pastures: in New Zealand more emphasis is placed on pasture management and the
differences between various management practices (Stern 1984).
McMeekan (1956) reviewed gtazing management and animal production
experiments undertaken with dairy cattle at Ruakura Research Station, Hamilton' New
Zealand. The three major gtazingmanagement factors under farmer control: namely'
grazlng method, type of livestock and stocking rate' were examined in a se¡ies of
experiments set up in the following manner: (i)' Same animals, same stocking rates' but
dffirent grazing method. (li). Dffirent animals, same stocking rates and same grazing
method. (iii). Same animals, dffirent stocking rates andsame grazing method' Grazing
method had little impact on animal production if the type of livestock and stocking rate
were kept constant. However, dairy pastures rotationally grazed were found to be more
vulnerable to pugging and drought because of the more open sward structure compared to
the dense sward structure of continuously grazed pastures. The type of livestock (eg'
sheep vs. cattle) can have large effects on the efficiency of converting grass to animal

2l
products. Stocking rate was found to be the most important factor influencing the
efficiency of production on a unit area basis and was described as the most "powerful
weapon" of the three management options (McMeekan 1956). Because stocking rate is
one of the most influential factors (Carter 1968 a, b), differing levels of stocking intensity
should be considered in grazing experiments (Bransby et al- 1988).
2.4.2 Stocking rate effects
Stocking rate can affect the botanical composition and productivity of the pasture,
as well as animal production per unit area and per head, as do the level and type of
grazing.
(i) Botanical composition changes: Rossiter and Pack (1956) monitored changes
in botanical composition of a Dwalganup-based pasture over seven years. Continuously-
grazedpastures were clover dominant with capeweed whereas ungrazed pasture on the
same site was soon dominated by annual grasses and Erodíum botrys. The legume
content ofthe ungrazed pastures rapidly declined to only 5Vo after 2 years. The authors
stated that the experiment was an example of the profound effect that differential grazing
pressure can have on the botanical composition of a sub clover-based pasture. Changes
in botanical composition induced by stocking rate can be rapid. On a Wimmera ryegrass
(Lolium rigidum)- sub clover-based pasture grazed at the stocking rates 2.5, 7.4, I4.8
sheep/ha, differences in botanical composition of pastures were found within a yeat
(Sharkey et aI. 1964). Both Wimmera ryegrass and sub clover declined under high
grazingpressure and soil seed reserves of both species declined. However, in the low
stocking rate plots, the amount of Wimmera ryegrass increased, while sub clover
declined.
Carter (1966, 1977), also found a direct link between stocking rate and changes in
the grass/clover balance over a hve year period at the V/aite Institute, South Australia. At
the beginning of the experiment, the pasture consisted mostly of the sub clover cv.
Yarloop and Dwalganup with Wimmera ryegrass. Merino wethers were continuously
grazed for f,rve years ar J .4, 12.4, 14.8, ll .3 and 22.2 sheep/ha. Low stocking rates led
22
to barley grass (Hor deum ^rpp.) becoming dominant (Carter 1966) while high stocking
rates led to successful invasion by winter grass (Poa annua) and volunteer small-seeded
legumes mainly cluster clover (Triþlium glomeratum.). Intermediate stocking rates led
to capeweed (Arctotheca calendula) dominance (Carter 1966, 1977; Carter and Lake
198s).
However, Carter and Day (1970) found there was no distinct effect of stocking rate
or superphosphate on botanical composition. Nevertheless, there was a trend for sub
clover percentage to increase aS the Season progressed. Perennial ryegrass was found to
be depressed by higher stocking rates, while Poa annua,Trifolium glomeratum and
Erodium botrys were found to invade heavily stocked treatments with low
superphosphate application (94 kg/ha).
The invasive species may not affect pasture and animal productivity (Carter 1966,
Allden 1968). Cameron and Cannon (1970) found that a Lolium perennefsub clover
pasture, continuously stocked at 4.9, 7.4, g.g, L2.4, 74.8, 17.3 and 19.8 sheep/ha,
showed major changes in botanical composition but this did not affect animal
productivity. High stocking rates, for example, increased the amount of Trifolium
glomeratum,T. dubium andT. campestre in the sward but the appearance of these
clovers did not affect the wool production even though the amount of sub clover
decreased (Carter and Lake 1985). However, decreases in stocking rate during winter
can increase the frequency of broadleaf weeds such as Arctotheca calendula (Dunlop
1985).
Some invasive species reduce the productivity of pastures. High stocking rates
(29.i y1enno wethers/ha) g¡eatly reduced the total pasture production by the third year at
Kybybolite, South Australia because of the increased invasion of Poa annu'a and Junctts
bufonius (Brown l9l6a). Appearance of both these species could therefore be useful as
indicators that the graz\ng pressure is too high. They are also indicators of loss of soil
structure (i.e. soit compaction) and prevalence of waterlogging. Therefore, the type of
invasive species will determine whether pasture productivity will be adversely affected.
23
Earlier, Cameron and Cannon (1970), Carter (1917) and Carter and Lake (1985) found
rao detrimental influences on the pasture productivity when the invasive species were
small-seeded legumes.
However, Taylor (1985) stated that in field experiments it is almost impossible to
show without any doubt that defoliation by animals was the sole cause of changes in
botanical composition. Long-term studies on the effects of grazing have shown that
grasses replace the herbaceous species at low stocking rates (Carter 1966;Dunlop et al.
1984; Dunlop 1985). This is probably due to shading by taller growing grasses and
variations in survival of seed from different pasture species eaten by livestock.
Ove.rseas stuflies have also shown the general trend toward grassy pastures under
low stocking intensities. Rosierie (1937) found an increase in sub clover with increased
grazingintensity, while soft chess (Bromus mollis Z.) decreased with increased grazing
intensity. A reduction in total herbage yield of grasslands was found to occur under the
heaviest grazlngand this was attributed to the reduction of soft chess which was replaced
by sub clover. Low frequency of defoliation is not always beneficial to grasses.
Motazedian and Sharrow (1937) found in a perennial ryegrass-sub clover pasture that
mortality of perennial ryegrass occurred when defoliation was infrequent.
(ii) Response of mixed pasture swards to grazing: Stocking rate affects the
abundance, structure and relative composition of pasture on offer to animals in mixed
swards. Increasing stocking rate reduces plant morphological variation in the sward
while minimizing the negative effects of plant structure on the selection process (Stuth er
at.1985). Certainly, grazing can overide the influencs that tall vigorous pasture plants
can have in mixed sward situations. For example, in the ungrazed situation, rose clover
(Trifolium hirtum ) and cupped clover (T. cherlerl ) shaded sub clover (Rossiter er a/.
l9i2; Taylor and Rossiter 1974). However, sub clover (cvv. Geraldton, Dwalganup,
Northam A and Carnamah) can dominate in some pasture mixtures with rose and cupped
clovers when continuously grazed by sheep. Different cultivars of sub clover may
produce different results because of the different growth habits of cultivars. It was also
24
found that rose and cupped clover pastures failed when the stocking rate was increased to
g sheep/ha (Rossiter et aI.l9l2). Competition between sub clover cultivars also occurs
and the response is dependent on grazing pressure. Rossiter and Pack (1912) found that
increasing the stocking rate on a pasture of Geraldton, Woogenellup and Bacchus Marsh
sub clovers, restricted shading effects caused by the taller Woogenellup cultivar, thereby
improving the competitiveness of Geraldton.
The growth habit of a plant can affect its ability to persist in a mixed pasture which
is grazed. As discussed earlier, defoliation can change the growth habit of plants
although there is evidence to suggest that some species are more responsive than others.
Smith et al. (1972) found that of the five annual species examined during autumn and
winter, Wimmera rye gmss (Lotium rigidum Gaud.) changed the least under continuous
grazingat a stocking rate of 10 sheep/ha. However, sub clover cultivar rW'oogenellup,
silver grass (Vulpiafasiculata) and Erodium spp. rapidly developed a prostrate habit. As
a result the apparent intake of herbage \Ã/as restricted. Sub clover was also found to adopt
a prostrate habit in response to deferred graz\ng (Smith et aI. 1973). Legume species
differ markedly in their response to continuous close grazing (Watkin and Clements
1978). The grazing tolerance of erect types such as Clare and other members of T.
subterraneum subsp. brachycalycinum are poor under heavy grazing pressures, whereas
prostrate, densely-leafed cultivars such as Daliak, Seaton Park, Dinninup and Geraldton
are well proven under high grazing pressure (Francis et al. 1976; de Koning 1984; de
Koning and Carter 1987 b).
Total
seasonal pasture production is also affected by stocking rate which may reflect changes in
density and/or changes in botanical composition. Recovery of pasture plants from
defoliation becomes slower as the severity of defoliation increases and eventually the
productivity of an area can be reduced or destroyed ( Carter 7966,1977; Christian 1987).
Total annual pasture production was reduced from 7.5 to 4.0t DMiha with an increase in
srocking rare from 5.6 to 16.3 sheep/ha (Dunlop et al. 1934). At the highest stocking
rate, total pasture produotion was 54Vo that of pastures at the lowest stocking rate. This
25
is in contrast to the findings of Carter (1968 a, 19'77), who found that in the first three
years that pasture production at the waite lnstitute was gleatest for the highest stocking
rate (22.2 sheep/ha). However, the highest stocking rate was unstable' After a false
break to the season in the fourth year, there was a reduction in plant densities later in the
season and subsequent death of sheep. The situation was much the same in the hfth year
of this experiment. However, it should be emphasized that the lowest stocking rate
produced the least feed for the duration of the experiment. This was ascribed to wastage
of light and water. Brown (1977) also found the highest total production on
continuously grazedpastures grazedat high stocking rates. Dunlop et al' (1984) found
that pasture availability was always lowe¡ at the highest stocking rate than at the lowest
stocking rate. Reductions in pasture production by increased stocking rates may be due
to changes in botanical composition. Seasonal conditions may have been more
favourable during the studies by Carter (1977) compared with Dunlop et aI' (1984)' this
may explain the differences in results.
High total productivity of pastures needs to be utilized effectively by gtazing
livestock to be beneficial to animal productivity. Birrell (1981) made observations of
animal and pasture characteristics under various gtaz\ng pressures (10, 15, 2O and25
sheep/ha). The amount of herbage was important to animal production at the high
stocking rates whereas the quality changes in herbage influenced animal performance at
the two lowest stocking rates. Birrell (1981) concluded that intake was the major factor
in determining animal performance but diet quality and time spent grazing also altered the
response to intake. Later, Birrell (1987) related wool production to intake of pasture at
several stocking rates. Observations were made in various environments with different
pasture plant genotypes. His results indicated that the effrciency of conversion of pasture
to ,wool were affected by the overall quality of pasture and not by the genotype of pasture
plant. The botanical composition of the pasture in terms of palatable species is more
important than the genotype or cultivar.
26
2.4.3 Grazing method and interactions with stocking rate
Different graz\ngstrategies may not confer an advantage in animal production (Mc
Meekan 1956), but they can influence the response of pasture species to grazing method'
For example, a major effect of early grazing,is that it substantially delays the attainment
of the oprimum LAI when the LAI of the sward is low (Donald and Black 1958)'
Furthermore, once the optimum LAI is reached, the management strategy should be one
which would enable the pasture to remain at this level. Mc Kinney (L972) found that
pasture availability at the beginning of winter was far more important than either pre-
winter weight of sheep or winter pasture growth rate. There was a larger influence on
weight of sheep at the end of winter if the early winter availability was high'
Autumn deferment of grazing is one option available to increase the amount of
winter feed. Deferment is most successful when coupled with fodder conservation and
supplementary feeding pfogïammes. Rotational graz\ng may also be advantageous
during the late autumn/winter to early spring when the availability of pasture is low
(Morley 1968). The main advantage of both methods is that they allow the pasture to
develop a sufficient leaf area before the commencement of gtazing and greater pasture
availability in winter (Smith et al. 1973; Brown 1976 a,b; Brown 1977 and Davies
1937). However, the main disadvantage in both cases, when grazing animals are
excluded from one area, it automatically increases the grazing pressure on the remaining
area. However, deferment iS important in the first year of pasture establishmsnt, or to
protect regenerating seedlings. Pasture was found to benefit through increased seed
reserves at the end of summer and the number of plants which re-established at the
beginning of the next season (Smith et aI. 1913). Losses in animal production can result
from keeping livestock off deferred areas (Fitzgerald 1916). These losses were not
always compensated later in spring and this was dependant on the grazing strategy used
and the area Set aside for deferment. However, the emphasis of most grazing Strategy
experiments have been on animal productivity. The experiments conducted by Davies

21
and sourhey (19s5) and Davies (1987) highlighted the connection between pasture
production and animal production. /
Conclusions: In a similar way to defoliation by cutting, grazing tolerance of sub
clover cultivars is also determined by gfowth habit. However, the system involving
graz\nganimals is more complex because grazingtolerance will not only be influenced by
the sub clover cultivar but also the plant density and the grazing management (i'e'
stocking rate and grazingmethod). Research on grazed sub clover-based pastures needs
not only to examine changes in yield and botanical composition, but also to examine the
sub clover seed yield and the regenerative abilities of that pasture. High seed yields
under grazed. conditions should maintain high plant density in the following season
provided a relatively high proportion of that seed is soft (germinable) and sufficient seed
remains after summer and autumn grazingof pasture residues.
From the literature, it can be seen that there are no simple generalizations regarding
the effects that grazing animals have on pastures, or for the effects that pastures can have
on grazing animals. There is a multitude of different variables involved. Since the
objectives of grazing systems are seldom simple, one should aim for long term stability
as well as immediate profit (Morley 1981). The main problem associated with grazing
experiments is the complexity of the factors involved and as a result, this limits the
number of factors which can be examined at any one time. Therefore, it is not suprising
that many of the stocking rate experiments are primarily concerned with animal
production. Efforts have been made to examine pasture production in relation to animal
production (e.g. Carter 1966, 1917; Davies and Southey 1985; Davies 1987) but no
study involved the use of clifferent cultivars of sub clover grown at contrasting plant
densities. Yet both cultivar and plant density are important factors in determining pasture
productivity. In addition, there is no real account of the impact of grazing on sub clover
(e.g. Carter 1966, 1968, 1987; Carter, Wolfe and Francis 1982; Carter and Lake 1985;
de Koning and Carter 1987). Therefore, both the cultivar and density factors need to be
integrated into experiments which involve gtazing.
2Í1
2.5 Seed production of subterranean clover
2.5.1 Burr burial
Sub clover is almost unique among pasture legumes in that it can bury some of its
seed in the soil (i.e. geocarpism). The sub clover inflorescence has 3-5 flowers bome on
an erect peduncle. Following fertilization the young pods reflex against the peduncle'
Downward bending and lengthening of the peduncle carries the developing burr with
seed towards the soil surface. Several sterile calyces develop from the apex of the
peducle and form the burr around the seed. Once the sterile calyces have penetrated the
soil they reflex which aids burr burial.
part of the success of sub clover as a pasture plant may be attributed to burr burial
(Rossiter 1966,1978). This characteristic may have developed as a grazing escape
mechanism, to protect some of the seed from grazing animals. Burr burial may also be a
protective mechanism against low relative humidity and high temperatures (Yates l95l '
1958). The early-maturing strains most probably evolved in areas where the growing
season is short and the conditions less favourable for seed production. Generally,
cultivars which exihibit strong geocarpism are short-seasoned and are most commonly
found and used in areas which have hot, dry conditions during the period of seed set and
development (Barley and England 1970). The early-season cultivar, Dwalganup' can
bury 50 to B0To of its seed (Barley and England 1970) and Yarloop can have 907o of its
burrs buried. (Yates 1958). The late-maturing cultivars Burnerang and Tallarook set
nearly all seed above ground (Yates 1961).
yates (1957) tested the assumption that burr burial is a protective mechanism. The
strain Red Leaf was chosen, because it matures some seed above and below ground'
Spaced plants wele glown in the freld. Some plants were allowed to bury burrs freely in
the soil, others were prevented from burying burrs by placing asbestos sheeting on the
soil while a third group of plants buried burrs in foam rubber placed on the soil surface'
The best seed set was achieved by plants which could develop their burrs at or below the
soil surface, or when burrs were enclosed in foam rubber. Seed set above the surface

29
had lower individual seed weight and poor gerrnination' In contrast, seeds that
developed within buried burrs (soil or foam rubber) were much heavier with a higher
percentage germination. Seeds formed at the soil surface had intermediate seed weight
and germination. On heavy-textured soils which form an impermeable crust, Quinlivan er
aI. (1973) found that the cultivarDaliak was prevented from burying burrs and as a
result, mean seed weight and total seed yield were reduced.
In a further study by Yates (1958), it was postulated that the extent of burr burial
depended on the interaction between cultivar, environment and the condition of the soil
surface. Hot, dry conditions were found to promote burr burial but only if the soil
conditions were favourable (moist soil). A range of sub clover cultivars were tested
which represented differing maturity types. They were glown as single plants under two
different environmental conditions, cool and moist, and hot and dry with frequent
watering of the roots. Under the mild conditions, eally-maturing cultivars buried a high
proportion of their burrs, while the late-maturing cultivars buried only a few burrs'
However, under more Severe conditions, the late-maturing types were found to bury a
high proportion of their burrs. The ability to set seed above the soil varied depending on
the strain. Even within a strain, the ability to set seed above ground was greater in the
mild environment. Buried burrs normally had good seed set'
Yates (1961) later found that plants growing in sward conditions could change the
micro-environment suff,rciently to affect burr burial. He used the cultivars Dwalganup,
Yarloop, Bacchus Marsh, Burnerang and Tallarook anci grew them at five densities (4'9'
24.1, 123.6, 618.0, 3,090.0 plants/m2). Increasing plant cover increased the humidity
and decreased temperature in the canopy micro-environment resulting in a reduced burr
burial. Similarly, leafy foliage of late-maturing strains may also modify the micro-
environment of the burr (Yates 1958) and reduce burial. The cultivars Burnerang and
Tallarook, which are late-maturing cultivars, set nearly all seed above ground irrespective
of plant density. Differences in seed production between cultivars grown as single plants
were reduced markedly in sward conditions. Nevertheless, differences in the percentage
burr burial between cultivars did exist when plants wefe grown rtnder sward conditions'
30
Generally, early flowering cultivars are selected for districts with short growing
Seasons. For example, the early flowering cultivar Dwalganup extended into areas of
short growing seasons in southern Australia: however, Geraldton, which flowers ten
days later but matures seed 6 - 9 days earlier than Dwalganup, is known to persist better
than Dwalganup in lower-rainfall areas (Tennant 1965). Therefore, it could be a inherited
character which enables a cultivar to set viable seed early but the actual period required is
influenced by burr burial. Dwalganup was found to have the heaviest individual seed
weight when the burrs were buried. Geraldton also had heavier seed as a result of burr
buriat but not to the same extent as Dwalganup which has inherently large seeds. The
benefits of early flowering on the survival,of sub clover in dry regions would only be
useful if combined with a shon flowering duration, ensuring that viable seed is set before
the end of a short growing season. The ability to produce viable seed quickly would
appeil to be a more important character than time of flowering in dry environments.
Even though burial of seed is seen as important, not all environmental conditions
will allow successful burr burial to occur. Regions which have short growing seasons
present many problems, particularly on the heavier-textured soils which form hard crusts
in spring. For this reason, Quinlivan and Francis (L97I) sought cultivars with the ability
to set viable seed on the soil surface. When testing the seven cultivars - Norham A,
Geraldton, Dwalganup, Daliak, Dinninup, MottntHelena A and Seaton Park, they found
a highly significant Cultivar x Treatment (prevention of burr burial) interaction for the
amount of viable seed produced. The prevention of burr burial affected the cultivars
Northam A and Dwalganup the most by reducing the amount of viable seed set. Daliak,
in contrast, was able to produce a reasonable quantity of viable seed above ground.
Nevertheless, buried seed still had the greatest viability and the highest levels of
impermeability. Quinlivan and Francis (1971) made reference to the fact that cultivars
such as'Woogenellup and Mount Barker both have poor burr burial, yet are successful in
terms of their persistence. They suggested that most likely both cultivars were capable of
setting reasonable quantities of viable seed above ground. Poor burr burial but high
quantities of viable seed set on the soil surface for the cultivars Woogenellup and Mount

31
Barker indicates that both cultivars probably evolved in cool, moist environments. It
should be possible to select mixtures of sub clover cultivars with a range of burr-burying
abilities because there are sufficient differences between genotypes and within sub
species (Walton I975).
Sub clover genotypes vary in their ability to set seed above ground' The extent of
cultivar differences in burr burial was examined by Francis et al. (1972). The strength of
burr burial was measured by counting the number of burrs that had penetrated a standard
polythene mesh. The strongest degree of burr burial was exhibited by cultivars within
the I. subterraneum subsp. subterraneum:T. subterraneum subsp'yanninicum was
next, while T.subterraneum subsp.brachycalycinum had the weakest tendency to bury
burrs of the three subspecies. Differences between cultivars within a subspecies were
strongly correlated with maturity with earlier-maturing cultivars having the greater
quantity of penetration through the mesh. Strong geotropism was also associated with
strong peduncles, which enabled forceful penetration through the mesh. These results
agree with those found earlier by Barley and England (1970).
Francis and Gladstones (1974) found that from the 24 clover strains tested, seed
size was unrelated to strain maturity. Three characteristics were found to be significantly
related to seed yield, viz. rate of inflorescence production, number of seeds per burr and
seed size. Generally, the seeds from small-seeded and fast-flowering strains, produced
viable seed quicker than the large-seeded and slow-flowering strains. Rapid flowering
may be advantageous for seed production. Francis and Gladstones concluded that rapid
flowering and high seed number per burr may be useful traits when selecting sub clover
for seed yield.
Later studies by Collins et aI. (1976) also found that prevention of burr burial
reduced the yield of viable seed. This was due to a decline in total burr numbers, number
of mature burrs, number of seeds/burr, individual seed weight and seed viability. As in
the earlier studies of Yates (1958), they found that the ability of sub clover to set seed in
unburied burrs depended on the cultivar. The later-maturing cultivars had the greatest

32
capacity to produce seed in unburied burrs. seed set in early cultivars such as Gingin
and Shenton Park A was affected more by preventing burr burial than in the later cultivars
such as Midland B, Dinninup and Daliak. The proportion of hard seed was lower in
unburied burrs and the breakdown of hard-seededness was much faster, although there
was significant variation between cultivars. Hard-seededness was found to depend
largely on the temperature and moisture conditions at the time of seed production' As a
result, all the strains studied, developed high proportions of hard seed in buried burrs'
The extent of burr burial has important implications on the persistence of sub
clover-based pastures. Burial of burrs provides protection from grazing animals and also
provides a viable source of seed in the soil. So any genotype which exhibits good burr
burial ability should persist under heavy grazlng pressure'
2.5.2 Density and seed ]'ield
As discussed in Section2.2, plant density can have strong influences on the
herbage production of sub clover. Seed yield of sub clover has also been shown to be
affected by plant density. Walton (1975) suggested that sward density was very
important when considering experiments which evaluate sub clover genotypes for seed
yield under defoliation.
Donald (1954) studied the effects of sowing density on seed yields of sub clover
and Wimmera ryegrass. Sub clover was sown at densities of 12, J9' 269, 1931 and
1g,510 plants/m2. Seed yield was gïeatest at intermediate densities (269 and l93l
plants/m2) and decreased at the highest density. Decreases in seed yield per plant were
not compensated by having more plants at ths higher densities. widely spaced plants
were found to have the greatest numbef of inflorescences per plant, but they had smaller
seed and fewer seeds per inflorescence than plants in denser swards. The results indicate
that intra-plant competition was occurring between inflorescences at the sparse densities
where inter-plant competition would be at the lowest' Donald concluded that dense
swards were the most useful for grazing but if seed multiplication was desired,
intermediate densities gave the highest seed yields. However, the relationship of density
33
to seed production will vary from season to season (i.e. variations to the break of the
season, moisture conditions of the soil, etc.).
Rossiter (1959) conducted a series of one-year experiments in which a large
number of sub clover cultivars were grown either as single-spaced plants or in swards.
Plant density was shown to affect the relationship between the interval of sowing to
flowering (maturity grading) and the pattern of seed production. Single plants and
swards reacred differently. The total yield (tops + burrs) and the seed yield increased
linearly for single plants as the maturity grading increased. Swards had a slight decrease
in total yield as maturity grading increased but seed yield declined dramatically. To
illustrate the response, the early cultivar Dwalganup was shown to have the lowest seed
yield when grown as single plants, but had the highest seed yield under sward
conditions. The roverse was true for the late cultivars Wenigup and Tallarook.
Differences between spaced plants and swards in seed próduction were ascribed to
available soil moisture. Under sward conditions soil moisture can be very low during
spring. Dwalganup, grown as spaced plants, was found to flower one month later than
. - plants grown in a sward. Hence spaced plants were exposed to harsher climatic
conditions. Rossiter suggested that this may explain the poor seed yield of that cultivar
under spaced plant conditions. Furthermore, Rossiter stressed that the scope of the data
was not suitable for predicting long term adaptation since the experiments were only of
one year duration. Similarly, Taylor and Rossiter (1967), using the cultivars Carnamah
and Geraldton at 9,36 and l44kglha showed that there was a significant decrease in seed
yield at the highest sowing rate. Although senescence occured earlier in the high density
swards there was no significant Cultivar x Sowing Rate interaction in terms of seed
production.
Medicago species behave similarly to sub clover when sown at a range of
densities. Cocks (1984) found sowing rate to be important because of its effect on seed
survival of M. truncatula. Softer seeds were formed under less dense swards possibly
because sparse swards offered less shading from the impact of the sun's heat. To
examine the effect on seed yield a range of Medicago species were sown at two rates 10,
34
and 200 kg/ha (Cocks 1987). There was a strong Species x Density interaction for the
number of seeds per pod. Generally, at the highest density, the seed production was less
but the number of seeds greater- Variation in seed yield at the higher density when
compared to the lower density can be explained by flowering time. Flowering was earlier
at the high density which may be a response to moisture stress' Later, in a similar
experiment, Cocks (1987) reported that at a high sowing rate (256 kg/ha) flowers were
more likely to set seed: however, flower ploduction was highest at the sowing rates less
than 30 kg/ha. Furthermore, early-produced flowers were more likely to give rise to
mature pods compa¡ed to later-produced flowers.
Bolland (1986), also studied the effect of sowing rate (2 and 100/kg/ha) on the
cultivars Clare, Mount Barker and Esperance. Attention was given to the relationship
between interval from sowing to flowering. Seed yields increased with increasing
sowing rate and declined as maturity grading increased. Declines in seed yield due to
maturity grading were mafkedly decreased as sowing rate increased' These results
support the earlier findings of Rossiter (1959) and Taylor and Rossitet (1967)'
2.5.3 Effects of defoliation on seed yield
Timing of defoliation affects seed yield and could be more important than the
number of defoliations (Rossirer 1961). This may help explain the differences between
results from various researchers.
(i) Defoliation b), mechanical methods: Increased production of seed by sub clover
in response to one or more defoliations (by cutting or mowing) has been demonstrated
(Rossiter 1961; Scott 1971; Collins 1978, 1981; Wolfe 1981 and Dunlop 1985).
Increases in seed yield due to defoliation were partly attributed to increases in the
inflorescence number and other yield parameters such as marked increases in burr burial
(Collins 1978; Dunlop 1985). Marked increases in burr burial resulting from defoliation
were also noted by Rossiter and Pack (lgl2),walton (1975) and collins (1981).
35
Poorly timed defoliations (i.e. during and after flowering) may depress seed
production (Rossiter 196l, 1912; Collins and Aitken l97O; Collins et aL l976 and
Collins et aI. I983b). Low seed production may be due to delayed flowering resulting
from defoliation (Collins and Aitken 1970; Rossiter 1972). Alternatively the removal of
photosynthetic tissue during the reproductive phase may reduce the amount of assimilate
available for subsequent seed growth and development resulting in reduced seed yield
(Collins et al. 1916). The response to defoliation is further modified by the density of the
sward. Cut swards of Dwalganup had increased flowers/unit area than uncut swards
when severely defoliated at early flowering or after flower initiation (Rossiter 1972)'
Spaced plants defoliated ar the same stages had larger reductions. Rossiter (1972)
concluded that field. implications from these results may suggest that grazing low density
swards may greatly reduce seed yield.
Cultivars react differently if defoliation continues after the commencement of
flowering. A Cultivar x Defoliation interaction was found for seed yield when cutting
was continued after the commencement of flowering (Collins 1973). For example, the
cultivars Yarloop and Midland B had a reduction in seed yield when cutting continued
midway through flowering, when compared with treatments when cutting ceased before
flowering. In contrast, Seaton Park suffered no reduction in seed yield from the same
defoliation treatment. practical implications are that frequent and severe gtazingof pure
sub clover swards prior to flowering will enhance seed production. Later Collins ¿r ø/'
(l9S3b) found the cultivar Midland B to be more sensitive to defoliation throughout the
flowering period when compared with Seaton Park. It was postulated that Midland B
may have set seed and senesced earlier than Seaton Park as a result of the severe
defoliation treatment. This may have allowed Seaton Park to benefit from the resources
which were previously utilized by Midland B. The influence of grazing during flowering
on sub clover seed yield will depend on the cultivar and grazing intensity. Sub clover
appears to be well adapted to severe defoliation, and this undoubtedly has contributed to
its success under a range of conditions, such aS continuous grazing at high stocking rates
(Rossiter 1961; Carter 1966, 1968 c,lgll). However, poor seed yield has resulted from
36
high stocking rates (Sharkey et al. 1964). The reason for this may be due in part to the
consumption of seed by livestock at high stocking rates (Carter and Lake 1985)'
Hagon (1973b), Walton (1975) and later collins (1983b), found no response of
seed yield to pre-flowering defoliation. The lack of response of seed yield to pre-
flowering defoliation (Walton 1.g1s)contrasts with the results obtained earlier by Rossiter
(1961, lg72). Walton (1975) explained that this was most probably due to the lower
plant density used in his experiments compared to Rossiter (1961, 1972)' As a result'
leaf area would be low therefore allowing better light penetration than the denser swards
used by Rossiter. Therefore, stem development resulting from defoliation, did not
increase seed yield. Rossiter found that for dense, undefoliated swards, stem growth was
limited due to Supra-optimal leaf area: hence, the production of less flower nodes'
shading may be responsible for seed reductions under dense swa¡d conditions' collins
et aI .(1978) showed that the shading of sub clover reduced the number of inflorescences
per unit area. Dunlop (1985) also found that shading at flowering for sub clover reduced
seed yield.
(ii) Defoliation by grazing: Defoliation in most seed production experiments
involved mechanical defoliation. The impact of grazlngon seed production of sub clover
needs attention.
The success or failure of a sub clover cultivar to persist under grazing was related
to its ability to produce seed when grown in ungrazed pure swards (Rossiter 1966)'
Rossiter grew a range of cultivars i) under single sward conditions, ii) as single cultivar
swards with an indicator cultivar gfown in association and iii) as a mixture of several
strains. Seed yield was found to vafy for each of the three competitive situations'
success of a cultivar to persist was found to be related to seed yield and maturity grading.
Data supported the proposal that the success or failure of a sub clover cultivar grown in a
grazed mixture is closely related to the seed yield of that strain grown in pure swards'
Furthermore, SuccsSS was attributed to seed size, petiole length and hard-seededness'
although petiole length is not expected to be of any advantage under heavy grazing'
31
In addition to his cutting experiments, Rossiter (1961) tested the cultivars
Dwalganup, Yarloop and Bacchus Marsh under gtazed conditions from June 17 to
August 26 at 5 sheep/ha. At the stage when sheep were removed, Dwalganup had begun
flowering but Yarloop and Bacchus Marsh had not. Although, the cultivar x Grazing
interaction was not significant, glazingincreased seed production for all three cultivars'
Seed production increased by 23Vo and seed number by 45 percent' However' the
weight of individual seeds from both above- and below-ground burrs was decreased by
grazing. Defoliation by cutting also caused a decline in seed size. In view of the results
from the cutting experiment, grazing increased seed yield mainly because grazing was
early and commenced in June and finished toward the end of August, at which time only
Dwalganup had begun flowering. Marret (1960) recommended that first year stands of
sub clover need to be grazed lightly during the flowering stage and this is standard
pfactice for any new annual pasture Sown at low rates. As a result, Dwalganup and
Yarloop gave gogd seed production with a high percentage of hard seed'
Management practices which delay flowering may lower seed yield (Collins and
Aitken l97O,lg1l). It was suggested that if gtazing occufs early in the growing season
flowering may be postponed by 3 to 4 weeks. Seed yields of Mt Barker are known to be
drastically reduced when stocking rates are high, so possibly a delay in flowering may
pafily be the reason for reduction in seed yield (Collins and Aitken 1971)'
Rossiter and pack (Ig12) observed in the field that increased stocking rate
increased both the seed production and hard-seededness of Geraldton when grown in a
mixture with Woogenellup. Increased grazingpressure decreased shading caused by the
taller cultivar Woogenellup leading to improved competitiveness of Geraldton during
vegetative growth.
However, Carter (1966), Carter et al. (1932) and Carter and Lake (1985)'
described a grazing experiment in which the hard and total seed yield decreased
progressively over a five year period on plots which were continuosly grazed at the
highesr stocking rate (22.2 sheep/ha). At the low stocking rate (7'4 sheep/ha) barley
38
grass became dominant, botanical compostion fluctuated greatly and so did sub clover
seed production. It was concluded that the mixture of cultivars used (Bacchus Marsh,
Dwalganup and Yarloop) was able to withstand heavy graz\ng and sub clover set seed
even in the fifth year of the experiment which was a drought year' Furthermore' sub
clover seed samples were glown and identified and were found to decline progressively
in the Cultivars Bacchus Marsh and Dwalganup while Yarloop was found to increase
during five years of continuous gtazing (Carter 1968c).
Recently, de Koning (1984) and de Koning and Carter (19S7b) found that high
grazingpressure applied in mid-season caused a decline in the seed yield of the cultivars
Yarloop and Clare. However, this effect was primarily due to the high stature of both
cultivars at the time of the first grazlng which caused excessive mortality of many
Yarloop and Clare plants.
2.5.4 Hard-seededness
Hard-seededness is an important attribute for pasture legumes, particularly for
persistence in a pasture-ley in a cfop fotation. Hard seed (i.e. impermeable to water)'
will not germinate on the first rainy occasion. In dry regions this is of particular
importance because soft seeded cultivars can lose a high percentage of their seed through
early germination resulting from a false break to the season. For this reason, softer-
seeded cultivars are better suited to higher rainfall regions where the rainfall is more
reliable.
The level of hard-seededness found depends on many factors such as cultivar, the
degree of burr burial, defoliation and the environmental conditions (eg.humidity and
temperatue). As discussed earlier, defoliation can increase the number of burrs buried.
Buried burrs have higher levels of hard-seededness than unburied burrs. There are
however, many interactions involved even though some cultivars are known to have
inherently high levels of hard seed. Cultivars have been shown to display inherent
differences in their ability to bury burrs and their response to defoliation (see 2.5-3)'
Hagon (lgl4) showed thar later-maturing cultiv¿rrs generirlly had higher levels of soft
39
seed compared to the earlier-maturing cultivars. There was a negative correlation (r = -
0.61***) between seed yield and maturity grading (i.e. Later-maturing cultivars had less
seed yield). The correlation was just significant when number of seeds/unit area was
related to maturity grading. However, Hagon stressed that if the percentage residual hard
seed level was very high in any year, there would be a limited amount of readily-
germinable (i.e. soft) seed for emergence in autumn' This problem is observed to occur
for many of the medics when high levels of regeneration are sought' High levels of hard-
seededness in medics is common and often limits the density of regenerating pasture (e.g.
Dear and Jenkins 1987).
Collins (19S1) demonsrrated that the level of hard-seededness in the cultivar
Midland B was affected by defoliation, whereas Seaton Park was not' In the earlier
study by collins (1978), both Yarloop and seaton Park increased hard seed levels due to
defoliation. This was because cutting significantly increased the proportion of buried
burrs which have higher levels of hard-seededness'
The level of hard seed may also be influenced by the number of seeds per burr'
This assumption was tested by Salisbury and Hallaron (1919a) using the cultivars
Merino, Tallarook and Dwalganup. Seed from},3 and 4-seeded burrs from each of the
cultivars was germinated at diurnal temperatur"t 15oÇ/60oC' Comparisons could be
made within cultivars but not between. Generally, 4-seeded burrs had the highest
percentage of hard seed. It was suggested that if differences were significant, the
differences between cultivars need to be looked at mofe closely, as it may explain some
of the variations in hard-seededness between cultivars. Salisbury and Hallaron (1979b)
also found that seed set in the latest flowers was most likely the first seed to show
softening of hard seed. Quite often the largest seed was found in the last flower'
Usually hard-seededness in the largest seed, or the seed with the highest moisture content
breaks down first, however, the stage of flower development Seems to be more
important. salisbury and Hallaron proposed that the pre-determination of hard seed
breakdown was due to either a promoter or an inhibitor which is distributed
disproportionally to the flowers in the inflorescence. Earlier' Grant et aI' (1964\ had
40
shown that the large seeds were less hard than the small seeds. They determined this by
separating the seed from three genotypes (Portugal cPI 19465, Burnerang, Mount
Barker) into seed size classes. The large- and small-seed were sub divided into ha¡d- and
soft-seed categories. The proportion of hard seed varied between cultivars and from year
to year. The data also supported those results obtained by Yates (1957 ' 1958) which
showed that relatively cool conditions favoured the formation of larger seed' Varietal
differences in hard-seededness were most likely due to the differing timss of flowering'
hence the differing conditions for seed maturation experienced by each of the cultivars'
Differences in the pattern of seed softening of various cultivars were shown to be
significant (Boltand 19S7). Five cultivars (Woogenellup, Seaton Park, Daliak'
Esperance and Trikkala) were only allowed to set seed in the year of sowing. Levels of
soft seed were measured in the field each May for the regeneration years. Development
of soft seed was recorded in a diurnal alternating temperature oven (15o/60oC). Residual
seed collected at the end of the two regeneration years had a significantly gleater number
of soft seeds than the seed collected at the end of the sowing year. Both Trikkala and
'Woogenellup were considered the softest, while Daliak was the hardest'
In the Tamworth region of New South Wales, the sub clover cultivars which
produced the most seed had the greatest number of seedlings in the following autumn
(Hagon 1973a). When rainfall was reliable the dense swards produced more dry matter
in early winrer. Reed ¿r a/ . (1985) showed that the hard-seeded early cultivar Daliak and
the hard-seeded, early to mid season cultivars Seaton Park and Esperance were the most
successful with regard to plant density in early winter. The results from Hagon (1973a)
and Reed et al. (Igg5) indicate that high seed yield combined with hard-seededness are
essential for good levels of regeneration. However, a common field observation is that
soft-seeded cultiva¡s re-establish at higher densities in second-year pastures'
In addition to the role that hard-seededness plays in the persistence of sub clover,
physiological seed dormancy may also be important. The work of Gladstones (1987)
supported the contention of Taylor (1984) that physiological seed dormancy plays a
4t
significant part in the control of the pattern of sub clover germination in field conditions'
Gladstones (1987) observed that genotypes which exhibited high dormancy in petri dish
tests were also found to be slower by a few days in their emergence when Sown under
field conditions in Perth, Western Australia.
Taylor (1984, 1935) and Taylor and Ewing (1988), showed that burrs from a range
of sub clover cultivars had a decreased rate of seed softening with increased depth of
burial in soil. Burrs were left on the soil surface or buried 2,6, and 10cm deep in the
soil. For the hardest seeded cultivar, Nungarin, there was no significant decline in the
proportion of hard seed following four years burial at 10cm (Taylor and Ewing 1988)'
After three years, less than 2OVo ofNungarin seed on the soil surface remained hard' On
the other hand, the cultivar Geraldton had only 57o hard seed remaining after only one
year on the surface. Seventy five percent of Geraldton seed remained hard at the depth of
10 cm. while the seed buried at 10cm depth is not expected to emerge, it is hoped that in
a crop-pasture rctation suff,rcient seed can be brought to the surface by tillage prior to the
pasture phase. However, it should be remembered that normally there is no tillage after a
cropping phase before natural regeneration of sub clover. Burial to a depth of 2 cm was
sufficient to reduce the rate of seed softening when compared to surface seed (Taylor
1984). It is also the 2 cm depth at which most bu1¡ will be buried during the pasture
phase if the soil and weather conditions are favourable. Furthermore, Taylor (1984)
found evidence of some microbial decomposition of hard seed in the field. Previously, it
was thought that hard seeds were fairly resistant to such microbial attacks. Certainly, at
the Waite Institute in Adelaide, there has been substantial loss of both sub clover and
medic seeds buried by scarifrer in a red brown earth (Carter et al' 1987)
Conclusions: Differences in seed yield between sub clover cultivars and the
ability of sub clover to bury burrs has been established (e'g' Yates 1961; Barley and
England 1970; and collins 1978). Burr burial and hard-seededness are both important
factors which are influenced by environment and genotype' Both ensure the long-term
survival of sub clover-based pastures. Burr burial is also important for the protection of
seed from grazinganimals. Therefore, the ideal sub clover ctlltivar would bury enough

42
Seed to ensure long-term persistence but also yield sufficient seed above-ground to
contribute to the Summer nutrition of grazing livestock. The influence of grazing on seed
production and seed survival is little understood in sub slover-based pastures and
requires further examination. Some research on these aspects is addressed in Chapter 4
and 5 of this thesis.
2.6 Seed survival following ingestion by animals
2.6.1 The grazing of dry pasture residues during summer-autumn
The quantity and quality of annual pastures declines markedly during summer when
the sward matures and dries off. Increasingly' sheep become dependent on the
nutritional value of dry burrs/pods which allow them to maintain body weight (e'g'
wilson and Hindley 1968; Hall 1984). Often sheep are under nourished over the
summer/autumn period because of the limitation imposed by the availability and quality of
dry pasture residues, although Donald and Allden (1959) found no adverse long-term
effects of nutritional stress over summer in young sheep'
The greater dependence of sheep on burrs and seeds over Summer means that
varietal differences in the production of seeds and their nutritional value can be important'
Research has shown that the seed is the most useful nutritional component of dry pasture
residues during summer (Franklin and Pownin g 1942 Vercoe and Pearce 1960; Franklin
et at.l964; Wilson and Hindley 1968 and Denney et a\.1978). Large differences in
crude protein and chemical composition exist in the pods of medic species and burrs of
sub clover (Franklin and Powni ng 1942; Hume et at. 1968) and liveweight gains of
sheep can be affected by the pod/ sand/or burrs ingested from the specified cultivars of
legume pastures grazed,. Latge differences in the crude protein content were found
between the Medicago species used by Franklin and Powning (J942)' Medicago
orbicularis was found to have a crude protein level for the whole pod of between 27 '857o
and3l.557o, compared to M. laciniata (48.85Vo and 49.967o). Subterranean clover was
much lower with values between lï.2l%o to22.55Vo crude protein in the whole burr'
43
Nunitionally, small hard seeds ingested by livestock were considered to be less
digestible than large seeds (Franklin and Powning L942)- It was found that 57Vo of the
Trifolium glomeratum seeds fed were passed intact in the faeces' In conclusion' sheep
were unable to digest small seeds in the unground state. However, many pasture
researchers (Carter 1980, 1981; Carter and Lake 1985, Carter 1987 and Cartet et al'
1939) have found that the survival of small ha¡d seed to be beneficial in teÍns of pasture
persistence. The return of some seed via the faeces to grazing systems is an important
component of regeneration and is a method of dispersal of both desirable and undesirable
species. (See section 2.6.3)
In Australia, much of the research on summer grazing has focused on the
nutritional aspects of the consumption of dry pasture residues and seeds' Very little data
is available on the fate of seed once ingested by grazing livestock' Wilson and Hindley
(1963) took into account the seed component and fed dry tops, seed and the burr of
subterranean clover with dry ryeg¡ass to penned sheep. The burr content of the diet was
varied and the seed throughput in the faeces measured. On average,5To of the seed eaten
by sheep was passed as whole seed in the faeces. Germination of this seed was found to
be 5IVo which was the same as that of the seed on offer (527o). A freld experiment was
also undertaken to aSSesS the proportion of clover burrs eaten by oesophageal-fistulated
sheep while they grazeddry pasture. Four different types of dry pasture were grazed'
viz. i) pure'wimmera ryegrass, ii) pure subtelranean clover, iii) a mixture of both
ryegrass and subterranean clover, and iv) the mixture of ryegrass and subterranean
clover after flowering of subterranean clover was prevented. The nitrogen content (crude
protein) of the differrent pasture types was measured. Those pastures containing
subterranean clover had more nitrogen content in the diet than grass only' On the mixed
ryegrass/sub clover pasture burrs comprised 10.3 percent of the total dietary intake by
sheep. Wilson and Hindley (1968) concluded that the pods of pasture legumes can be
important as a protein supplement in Summer and that dry clover tops can be just as
important aS the pods as a protein source. However, this would depend on the severity
of grazing.
44
In a study by Squires (1978) the liveweight changes of sheep were related to
estimated intake of clover seed over a 60-day period on irrigated pastures at Deniliquin,
NSW Sheep lost weight over the period of the experiment: however, the least weight
loss was found for intakes of 750g/day clover seed. Sheep which were only fed burr had
the slowest decline in liveweight, while sheep fed burr-free residues showed wide
fluctuations in weight. In contrast, sheep fed tops and burrs were found to gain weight.
The percentage of sub clover burr in the diet of grazing sheep was also studied by Hall
(1984) ar V/agga Wagga, NSV/. The highest percentage of burrs in the diet was found
I during drought in mid-July and the disestfbitity of the burr was between 45-55Vo.
Energy content rathil than nitrogen content is likely to limit animal production when the
burr constitutes most of the dietary intake (Hall 1984).
2.6.2 The dissemination of weed seeds via defaecation
Much of the early research on seed survival following ingestion by animals was
concerned with weed seeds. Researchers at the beginning of the 20ft century recognized
the problem of weed seeds in livestock feeds and the viability of those seeds. Much of
the research on weed seed survival has provided a valuable insight into the survival of
seed from useful pasture species. Hills and Jones (1907) found viable weed seeds in
many commercial feed stuffs and expressed concern that the digestive systems of horses
and cows wete not able to destroy them as well as sheep and poultry. Weed seeds in
feed stuffs were seen as a potent source of weed dispersal (Beach 1908). Emphasis of
early research was therefore focused on weed seeds and the role of various farm animals
in dispersing those seeds (Atkeson et aI . L934; Harmon and Keim 1934 and Dore and
Raymond 1942).
Harmon and Keim (1934) studied the through-put and the percentage survival of
seed from seven different weeds: velvet weed (Abutilon abutilon L.) 22.8Vo, field
bindweed (Convolvulus arvensis L) 23.17o, white sweet clover (Melitlotus alba Desv.)
15.07o, smooth leaf dock (Rumex acetocella) 6.27o, annual smartweed (Polygonum
pennsylvanicum L.) I2-8o/o, wild rose (Rosa arkansana)l}.lo/o and perennial
peppergrass (Lepidium draba) 9.4Vo. They were fed to a variety of farm animals, viz:
45
yearling calves, geldings, wethers, four month old hogs and ten month old cockerels'
one thousand seeds of each weed species was fed to the different farm animals and the
percentage of seed recovered varied widely according to the different classes of animals'
The average (overall mean for weed species) percentage of uninjured seeds recovered
from the faeces of various animals was 24.lVo (for hogs), 23.lVo (calves), l2'9Vo
(horse), l0.7Vo (sheep) and O.3Vo (chickens). It was concluded that the percentage
recovery of seed was correlated to the thoroughness of mastication and/or digestion by
the different classes of animals. Viability of the the uninjured seed was tested and the
overall average was 6.7Vo from each 1,000 seeds fed to the animals' Survival of seed in
the manure of cows and the horse was further examined. After one month burial' only
velvet weed, field bindweed, white sweet clover, and pepper grass seeds were viable'
The rest of the series of weed species were partially decomposed.
Further studies have examined the survival of weed seeds when stored in manure'
Atkeson et al. (1934) determined whether or not the spreading of manure over fields
caused weed infestations, particularily when feeds contained large amounts of weed
seeds. A range of weed seeds, which varied in their size, structure and type of seed coat
were fed to cows. Fouty-two hours was required before any substantial amount of seed
was passed through, but then seed continued to come through for up to four days
following feeding. The main findings were that the soft (permeable) seed had reduced
vitality (i.e.viability) following passage through the cows, which was attributed to the
penetration of digestive juices into soft seed. It was concluded that in many instances the
seed would die when the manure is spread directly on the land. Alfalfa (Medicago
sativa),one of the species fed, had only a 77o reduction in germination following passage
through the digestive ffact and storage in manure compared to the original germination
test before feeding. Heady (1954) recommended that animals suspected of carrying weed
seeds should be held on a weed-free diets for at \eastT2 hours. From the results of his
experiments, Heady concluded that sheep and deer had aided the spread of both desirable
and undesirable plants onto the rangelands of California. Ozet (1979) also found that
seed from 10 different species had varying levels of survival immediately after
defaecation and after three months storage in sheep dung heaps' The species Vicia sativa'
46
Hordeum nodosum and Onybrychis sativa were totally destroyed' The germination
potential of the other seven species was as follows: Coronilla voria (6.87o), Lotus
corniculatus (6.lVo),Trifolium repenç (5.17o), Phleum pratense (4'97o), Medicago sativa
(4.67o), Agrostis alba (3.2Vo) and Stipaviridula (l'I7o)'
The spread of noxious weeds, especially the small-seeded weed species' via
livestock is of concern in Australia. The dispersal of Echium plantagineum by sheep was
studied extensively (Piggin 1973). Seed of this species were placed directly in the rumen
of fistulated sheep and, 507o survived. Approximately L2O seeds/sheeplday passed
through the sheep most seed being defaecated in 30 days. Germination of the seed when
defaecated within 24 hours of ingestion had similar levels to that of seed before feeding
(40Vo). However, if the seed took longer than24 hours to be defaecated the germination
percenrage dropped rapidly to 10Vo. This was attributed to high temperatures rather than
digestion in the alimentary tract. Clearly enough of the weed seed survived passage
through sheep and was deposited in the faecal pellets to contribute to its widespread
occurrence in Australia.
Variabitity between sheep was also noted by Piggin (1978). The number of seeds
passed varied considerably between sheep (4I - 275 seeds/day) and between days for any
one sheep. This is probably due to sheep size; large sheep tended to eat more fodder and
seed, and therefore pass more faeces and seed than small sheep' Other research has
found that large differences exist between animals in experiments of this kind (Suckling
I950,1952;Powell and Mapes 1955; Carter 1980, 1981; and Leonard 1986)'
The passage of seed through grazing sheep was also studied by Piggin (1978)'
Germination was found to be much lower when compared to the hstulated sheep (1 to
27o from an initial level of 307o pnor to feeding). Nevertheless, it is clear that the
movement of stock contaminated with the weed seed should be controlled both within
and between farm districts, since most germinable seed is passed within three days of
ingestion. Holding yards which can be carefully watched could restrict the spread of E'
plantagineum. and many other weeds.

47
2.6.3 The dissemination of seed from pasture plants via defaecation
The benefits of dispersal of seed from pasture species defaecated by grazittg
livestock has been recognized as important for the persistence of pasture species
(Suckling 195O,1952; Powell and Mapes 1955 and Vercoe and Pearce 1960)' Cattle
especially have been used in the dispersal of pasture seeds. Dore and Raymond (1942)
found that a single cow could defaecate approximately 900,000 seeds of Trifolium repens
in a grazing season. The reason given for the high levels of seed survival of T' repens is
the high levels of hard seed, coupled with small seed size. Seeds were able to avoid or
escape injury during mastication and pass through the digestive tract of the cows.
Suckling (1950,19.52) studied in detail the ingestion of white clover (Trifolium
repens) seed by sheep and the impact of this on the persistence of that species in New
Zealand. Unscarified seed fed to sheep while gtazing a pure grass sward was found to
pass through sheep better than scarified seed (29Vo and 3J7o recovered seed
respectively), which confirms the earlier work of Atkeson et aI ' (L934)' Suckling
(1952) fed seed to sheep using gelatine capsules with the aim to minimize chewing
damage. A large percentage of hard seed was destroyed: of the gOVo (impermeable) seed
fed only 297o hard seed survived. However, the survival rate of hard seed is much
greater than that of soft (permeable) seed. Scarified seed containinggS7o soft seed prior
to feeding, was all destroyed on passage through sheep. Three of the four sheep had no
trace of seed in their dung after six days following ingestion. One sheep was killed (this
sheep had faces of seed at six days) and the digestive tract dissected to see whether seed
still remained within the digestive tract. Considerable amounts of hard seed was found in
the folds of the omasum. Thus, he concluded that some seed can be excreted with the
faeces for a long time following ingestion.
The fate of white clover seed when grazed in situ was also considered by Suckling
(1950, lg52). Two sheep grazedwhite clover pasture with predetermined availabilities
of both mature and immature flowering heads. From the first sheep only 4'37o of the
available seed was recovered (3.37o hard, lo/o swollen and discoloured). From the
second sheep, 0.i6Vo of the seed available in the feed was recovered (0.657o hard,

48
Q.IlVo swollen and discoloured). Germination and seedling appearance from faecal
samples in the field was also monitored. Suckling (1950, 1952) concluded that (i) it may
be possible to graze white clover pasture with high quantities of ripe flowering heads
with a large flock of sheep and to introduce the flock onto afeas in the hill country of
New Zealand to increase the population of white clover and (ii) the hard (impermeable)
seed which is passed through the animal and has staggered germination over a long
period, may be important for upgrading established sown pastures where it is an
advantage for seed to germinate over an extended period rather than on the first occasion
when temperature and moisture conditions appear to be favourable.
powell and Mapes (1955), also investigated the survival of seeds from various
pasture plants with the objective of finding appropiate species for disseminating seed via
defaecating livestock. Sub clover (Triþlium subterraneum), rose clover (Trifolium'
hirtum),crimson clover (T. incarnatum),bun medic (Medicago polymorpha),tall fescue
(Festuca arundinaceø), harding grass (Phalaris tuberosa vat. stenoptera), veldt grass
(Ehrhartaspp.) and smilo (ory zopsis miliacea) were fed to 4 steers. Percentage recovery
of viable seed ,was I2.57o, 25.}Vo, 17 .77o, l.\Vo, !.57o, O'67o and 72'0Vo respectively'
High quantities of hard seed were found in faeces for rose and crimsom clovers and it
was concluded that viable hard seed could pass through the animal. For the purpose of
the dissemination of seed via livestock, both smilo and rose clover were considered the
only economical species due to seed costs and high survival following ingestion by
steers. Furthermore, Seed dispersed via livestock in this manner should only be
considered if the land is not suitable for the use of machinery and aerial sowing by plane
is too costly.
The survival of a variety of different seeds fed to dairy cows was studied by
Yamada and Kawaguchi (1972). They fed seeds from ladino clover (Triþlium repens),
sub clover, Italian ryegrass (Lolium italicum), orchard grass (Dactylis glomerata) and
Bahiagrass (Paspalum notatum) to two Holstein heifers. The highest percentage recovery
of seed was found for Bahiagrass, followed by ltalian ryegrass and sub clover'
Orchardgrass and Ladino clover had the lowest percentage recovery' Furthermore' the
49
number of seedlings emerging from faeces was also examined. [talian ryegrass had the
highest number of seedlings to emerge from lkg of faeces; sub clover' orchardgrass and
bahiagrass were the lowest, while Ladino was intermediate. Yamada and Kawaguchi
concluded that Italian ryegrass and Ladino clover could be disseminated by dairy cows.
For seed to pass intact through the digestive tract of animals, it has to survive the
initial mastication which physically breaks down seeds. In the case of ruminants, this
may also include regurgitation and further mastication. Hence, large seeds are more
prone to crushing damage by chewing. The large seeds from both snail medic (Medicago
scutellata) and the gama medi c (M. rugosa) cv. Paragosa had the lowest survival of seed
following passage through sheep, compared to the smaller-seeded species Jemalong (M'
truncatula), Harbinger (M. littoralis) and Tornafield (M. tornata) (Jenkins 1978). In
general the survival of medic species was low, ranging from 1.77o (snail medic) to 6-37o
for Tornafield. Any seed which survives the first stage of mastication, has to undergo
further influences from the digestive tract, such as chemical breakdown and enzymic
activity, all of which, if the seed coat is weakened, predisposes it to heat damage' Once
the seed is passed out in the faeces, survival of seed will depend on how well it can resist
fermentation in the manure.
The importance of the survival of seed from useful pasture species following
ingestion by grazing livestock, and the influences this may have on the regeneration
capacity of pastures, was not given much attention in Australia until recent times (Carter
1976, 1980, 1981; Ca¡ter and Lake 1985; Jones and Simao Neto 1987 and Simao Neto
and Jones 1981).
An intensive experiment was undertaken at the V/aite Agricultural Research
Institute, South Australia on hard-setting red brown earth by Carter (1981), to quantify
and qualify the influence of sheep grazing Medicago truncatula pasture during the
summer-autumn months. Highty significant linear decreases were found to occur for the
total pasture (r = -0.999), medic pods (r = -0.gg}) and medic herbage (r = -0'997) during
the 56 days of grazing. Exffaction of medic seed from faeces showed a dramatic decline
in the seed throughput (6,155 - 3,251viable seeds/sheeP/day¡. Not only was there a

50
progressive decrease in the number of viable seeds left on the soil surface (23,715/m2 on
day 0 to 2,652/m2 on day 56) but the sheep selected the largest pods first which
contained the most seed and the heaviest seeds, leaving progressively smaller pods and
smaller seeds. These surviving small seeds may be regarded as ecologically-less-fit in a
crop pasture rotation (Carter et al.1988). The experiment showed that sheep were very
efficient at harvesting medic pods on hard-setting soils and thereby seriously depleting
the seed reserves of medic pastures during Summer and autumn. Depletion of seed
reserves results in poor seedling density at the break of the season. In addition, low seed
reserves are insufficient for regeneration following a cropping sequence.
The impact of seed size and degree of hard-seededness on seed survival has been
studied by Carrer (1917,1980) and Carter et al. (7988, 1989). Recent studies conducted
by ICARDA in Aleppo, Syria (Thomson et aI. 1987) compared the harder-seeded
ICARDA medic lines with the Australian cultivars. The annual clovers Trifolium
campestre and.T. tomentosumwere fed to Awassi sheep. The objective was to identify
medics with good survival following ingestion by sheep, in order to reduce the impact of
overgrazing. Seed size accounted for SOVo of the survival of seed (i.e. smaller seeds
survived. better): however, smaller seeds increase the difficulties associated with
establishmenr in prepared seed beds (Carter and Challis 19S7). In addition, the sheep
may be used as a means for seed dispersal seed onto marginal lands and into cereal
stubbles. More recently, Cocks (1938) reported an experiment in which ewes grazed dry
medic residues over the summer in Syria. Sheep weÍe gÍazed at three stocking densities
(5.3, 10.7, and 16.0 sheep/ha). These sheep were found to gain weight from grazing
dry medic residues, although there was no further liveweight increase for sheep grazed at
the highest level. Furthermore, the day on which pods ceased to disappear also coincided
with the day liveweights began to fall. Sheep were found to gain weight as long as the
pod availability exceeded 10 kg/ha. However, the level of pod needed for the persistence
of pasture is considerably higher rhan 10kg/ha and cannot be related to the condition of
the ewes.
Survival of the seed from pasture legume species following ingestion by animals
was beginning to emerge as highly important in Australia following the research by
51
Carter (1980, 1981). The need to test important tropical legume and grass species had
finally gained recognition (Simao Neto ¿t al 1987; Jones and Simao Neto 1987). Some
new cultivars of legumes such as Medicago murex were found to have very poor survival
(in some cases 07o) while Triþlium balansae cv. Paradana had approximately 4OVo
survival following ingestion by sheep (Leonard 1986; Carter l98l; Carter et al. 1988;
Carter et aI.I989). The high survival of T. balansae was attributed to it having small,
hard seeds. Similarly, short seed length was found to be a factor influencing the high
recovery of seed from tropical pasture species (Simao Neto ¿r al.1987) Simao Neto and
Jones (1987) tested a range of grasses and legumes (Simao Neto ¿r al. 1981) that were
divided into three categories according to the amount of hard seed present: a mixture of
hard and soft seed, IO07o soft seed, and !007o hard seed. To avoid the effects of
mastication, the seeds were suspended in nylon bags in the rumen of cattle (in sacco) ot
subjected to invitro tests. All soft legume seed were destroyed. The percentage hard
seed in the seed sample before feeding was the best indicator of the level of survival from
ingested seed.
Jones and Simao Neto (1987) also examined the relationship between the amount
of seed in the diet and the quality of the diet and the subsequent effects on seed recovery
from sheep. Basal diets of three different qualities ,low (45Vo), medium (60Vo) and high
digestibility (70Vo) were fed to penned sheep. Both the percentage seed recovery and
viability of seed recovered was unaffected by the amount of seed fed. In contrast,
Thomson et al. (1987) found that feeding equal seed number compared to equal pod
mass, always gave higher seed survival. However, quality of the diet was found to
affect the percentage recovery of seed (Jones and Simao Neto 1987). The low quality
diet had the lowest survival of seed found in faeces (lo7o of the total seed ingested)
whereas there was 28Vo recovery of ingested seed found for the medium and high quality
diets. In conclusion, Jones and Simao Neto (1987) suggested that if animals are to be
used for the dissemination of pasture seed it is important to have a high quality diet and a
high proportion of small, hard legume seed.
Although, it is desirable for weed seeds to be destroyed by fermentation in faeces,
it is important for useful pasture species to be able to survive in faeces for extended
52
periods. Suckling (1950) made the assumption that only the hard seed would be able to
withstand fermentation,of faeces and retain its viability. Most of the seed in the faeces
remained in the soil in a viable but dormant state long after the faeces had decomposed.
Furthermore, most of the permeable seed is destroyed by mastication and digestion and
the soft seed that is found in the faeces doesn't appear to survive the period of
fermentation or it is desiccated. Similarly, Simao Neto and Jones (1986) found that hard-
seeded tropical pasture legume seeds were resistant to storage in cattle faeces and there
was good emergence of legume seedlings from faeces (Simao Neto ¿r al. 1987).
Conclusions: Few studies have attempted to examine the impact of grazing
sheep on the survival of sub clover seed once ingested although many studies have been
conducted in pen feeding facilities. Furthermore, the survival of sub clover seed within
faecal pellets has not been examined in the Mediterranean-type environment of southern
Australia. Although the emergence of medic from faecal pellets has been studied during
the period 1976 - 1989 (Carter 1916 et seq.). Some studies which considered survival of
seed in faecal pellets have been conducted in favourable well watered conditions using
white clover or tropical species (eg. Suckling 1950; Simao Neto and Jones 1986).
However, the likelihood that sub clover seed deposited in faecal pellets is a significant
source of seed for regeneration has received scant attention in Australia. Because sub
clover can bury some seed in the soil surface the impact of summer-autumn grazing on
seed survival is frequently less severe than with Medicago species which do not bury
seed. These matters will be discussed further in Chapter 5 of this thesis.

53
3. SMALL.PLOT EXPERIMENT 1985 ' The effects of sowing rate and
time of sowing on the growth and seed production c¡f four cultivars of sub
clover
3.0 Introduction
Herbage production in winter and seed yield of a pasture can influence the year-
round livestock carrying capacity of a sub clover-based pasture' Therefore the main
objectives of this experiment ,were: (Ð To examine the early productivity and
competitiveness of new and old cultivars in response to density and sowing time' The
decision was rnarie to neithcr defoliate nor control weeds' thus giving the opportunity to
examine early productivity and ability of cultivars to control weeds' (ii) To examine the
interrelations of sowin grateand resultant plant density on early productivitY (i'e' looking
for optimum densities to ensure maximum early production)' (iii) To examine seed
production and naturai regeneration in 1986'
Early winter production is dependent on plant density (Donald 1954; Black |95.7.,
Hagon 19ï3a:Wolfe 1981). It has been suggested that seed size can effect early growth
(Black lgs|),but Lawson and Rossiter (1958) came to the general conclusion that seed
size had no effect on growth rate of a sub clover sward provided that sowing rate was
held constant and was based on pure germinating seed'
Time of sowing is important because it can affect the herbage and seed yield of
cultivars of differing maturities (Morley 1961; Rossiter 1966)' More recently Dear and
Loveland (1934) found differences between cultivars that were sown in early autumn but
no differences at later sowing times. Also seedling growth at different densities is little
understoorl when sown at different times (Silsbury and Fukai lg77). Time of sowing is
only important in the year of establishment'
TherehasbeenSomecontroversyoverobserveddifferencesinthewinter
productionofsubclovercultivars(RossiterandCollinslgS0;Wolfe|982).

54
Nevertheless, Since the early 1950's farmers and research workers have observed that the
early growth of some cultivars of sub clover is more vigorous, especially during the
winter months (Carter 1953; 1954; Anon. 1955). For example, the winter vigour and
erect growth habit of both cv. Yarloop and cv. Clare have been recommended for
controlling weeds such as Oxalis pes-caprae (Higgs 1958)' More recently' de Koning
(1984) and de Koning and carter (1987 a,b) have shown the superior winter production
of Clare and Yarloop sub clover in comparison to the cultivars Mt' Barker' Trikkala and
Larisa.
It is imporrant thar the ecology of cultivars be examined as well as their potential
productivity assessed because high herbagc production may not necessarily he an
advantage in terms of seed production. The two may be antagonistic because excessive
shading has been shown to reduce seed yield (Collins et aI1978; Dunlop 1985)'
55
3.1 Materials and methods
Location and preparation of site: The experirnent was conducted at the Waite Agricultural
Research Institute (hereafter W.A.R.I.Þdelaide, South Australiat The average annual
rainfall is 625mm and the soil type a hard-setting, red-brown earth (Urrbrae loam)' The
site was cultivated with a rotary hoe April 29, Ig85 and sprayed with sprayseed@
(Paraquat 175gI+ diquat 7sgtì)May 17, 1985. Prior to sowing the area was harrowed'
to give a fine seed bed.
Treatments and experimental design: Four cultivars (Clare, Esperance' Trikkala and
Yartoop) were sclccted to give a range of characteristics such as maturity g¡ading' growth
habit, reputed winter gfowth (General Introduction, Table 1'1)' These cultivars are
suited to the environment at the W.A.R.I. Each cultival was sown at l' 4' 16' 64' 256'
and,I024kg/ha ( based. on pure germinating seed). This range represents the widely
varying levels of seed found in field situations. The two highest sowing rates are
representative of soft seed levels which can occur in good stands of subterranean clover'
To heighten any contrast in the wintel growth between cultivars' two sowing times
were used viz: May 17 : (Early) and June 7 = (Late)' The experiment was of split-plot
design for sowing time with sowing rate and cultivar randomized within each sowing
time. A sunìmary of the experimental design is as follows:
Cultivars (4) x Sowing Rates kglha (6) x Sowing Times (2) x Blocks (3) = 144 plots'
Each block (see diagram 3.1) was split into an Early- and a Late-sown half' The
four cultivars at six sowing rates (i.e. =24 treatments) were randomized within the areas
allocated to each sowing date (See Diag. 3.7). Each plot measured 2'5 x 5'0 metres'
seed was weighed out for each cultivar (I.25,5,20,80, 320 and 1,280 g pure
germinating seed/plot respectively) which represented the range of sowing rates 1' 4' 16'
64,256, and lO24 kg/ha respectively'
The weighed seed was wet-inoculated with Rhizobium type C in a peat slurry and
allorved to dry. At sowing time the appropiate seed was placed in a large screw-top glass

-56
jar with slightly moistened sand. Single superphosphate equivalent to a rate of 100kg/ha
(120g per plor) was added last to the jar. The seed, sand and superphosphate were then
mixed thoroughly. The plots were lightly raked prior to hand-broadcasting with the
mixture, and again following sowing to ensure good coverage of the seed.
DATA COLLECTION
Emergence counts of sub clover (plants/m2) were made for the early-sown
treatments from May 29 toMray 31, counting one block per day' Two quadrats (25 x 40
cm) per plot were used to count plant numbers. Plant numbers were counted for the late-
sown treatments on JulY 4.
Harvests: The plots were sampled six times throughout the growing season: Harvest 1
on June 12; Harves t2 onJuly 3; Harvest 3 on July 31; Harvest 4 on August 28; Harvest
5 on September 25; and Harvest 6 on October 24,1985. Only early-sown plots were
harvested at Harvest 1, since late-sown plots had not emerged at this Stage'
Quadrats were placed on plots shortly after the emergence of early-sown
treatments. Sixteen galvanised wire quadrats (25 x 40 cm) were alranged on each
treatment plot. The plots were divided into east and west sections (ie' 8 quadrats per
half¡, and harvests were rando mized,among the eight quadrats (six of these quadrats were
used for the herbage harvests). Harvest 1, corresponded with quadrat position 1 and so
on. Quadrat position 7 was used for the seed harvest and quadrat 8 was used for the
regeneration counts in the following year (1986). In brief, on each harvest occasion two
quadrats were taken per plot, one from the eastern half and one from the western half of
the plots.
Measurements: Each sub clover plant was cut to just below ground level so that plants
could be counted. For the two highest densities a subsample of 50 plants was removed
from the centre of the quadrat and this was used to calculate total plant numbers' All
herbage samples were dried at 85oC for 24 hours in a forced-draught dehydrator'
other measurements made at each ha¡vest occasion included total herbage yield of
sub clover and yield of the weeds.
57
Seed harvest: A seed harvest was made on January 8 and 9, 1986 using an inhltrometer
ring (2gcm diam. i.e. 15.35/m2¡ to define the sample area. An east and a west sample
were taken on each plot. The above- and below-ground (3cm deep) soil/seed samples
were bagged separately. A stiff, fibre hand broom was used to collect the above-ground
samples and a rabbiting hoe was used to dig up the below-ground sample' The
infiltrometer rings were placed in the randomised position of the seventh quadrat' The
samples were oven dried at 40oC in a forced-draught dehydrator for 24 hours' Below-
ground samples were then wet-sieved through a square-holed, lmm sieve to retrieve
intact burrs and any loose seed: these samples were then returned to the dehydrator for
tlr'ying at 40oC for Z|hours. Surface samples were processed by carefully removing the
burrs by hand from the dry pasture residues. In addition, thirty infiltrometer ring
samples were taken in the pathways of the experiment to assess the amount of
contamination from other sub clover cultivars, the seed of which was present as hard
seed in the below-ground samPles.
yield components measured from the seed harvest were: individual burr weight
(mg/bun), Vo hard seed, Vo soft seed (permeable, readily germinable), 7o dormant seed
(permeable, swollen seed but no germination), total seed weight (kg/ha), and mean seed
weight (mg/seed).
Regeneration of the sub clover cultivars on this field site was examined in autumn
1986. Sub clover seedlings were counted by using the eighth random quadrat position
(east and west) in each of the plots. Pathway counts (30 quadrats each, 40 x 25 cm)
were also made to measure the contamination of previously resident sub clover on the
experiment site.
Germination tests of seed in burrs: Burr germination tests wele conducted on intact
burrs. Burrs were taken at random from Block 1 samples (statistical analysis showed no
significant differences between Blocks for all parameters)' Twenty five burrs were
placed in Petri dishes with three pieces of filter paper (Whatman @ qualitative no'1) on
the bottom and one piece on the top of the burrs. Each treatment was replicated 4 times
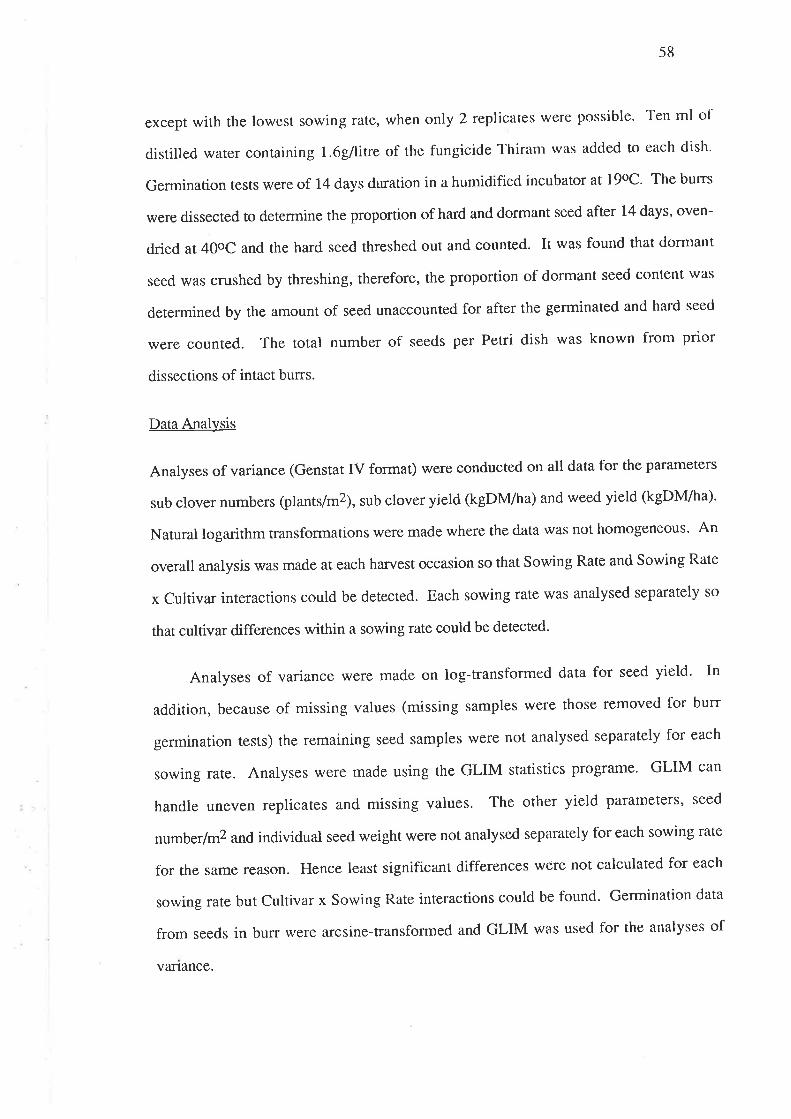
58
except with the lowest sowing rate, when only 2 replicates were possible' Ten ml of
distilled water containing 1.6gllitre of the fungicide Thiram was added to each dish'
Germination tesrs were of 14 days duration in a humidified incubator at 19oC. The burrs
were dissected to determine the proportion of hard and dormant seed after 14 days, oven-
dried at 40oC and the hard seed threshed out and counted. It was found that dormant
seed was crushed by threshing, therefore, the proportion of dormant seed content was
determined by the amount of seed unaccounted for after the germinated and hard seed
were counted. The total number of seeds per Petri dish was known from prior
dissections of intact burrs.
DataAnalysis
Analyses of variance (Genstat IV format) were conducted on all data for the parameters
sub clover numbers (plants/m2), sub clover yield (kgDtvl/ha) and weed yield (kgDM/ha)'
Natural logarithm transformations were made where the data was not homogeneous' An
overall analysis was made at each harvest occasion so that Sowing Rate and Sowing Rate
x cultivar interactions could be detected. Each sowing rate was analysed separately so
thar cultivar differences within a sowing rate could be detected.
Analyses of variance were made on log-transformed data for seed yield' In
addition, because of missing values (missing samples were those removed for burr
germination tests) the remaining seed samples were not analysed separately for each
sowing rate. Analyses were made using the GLIM statistics progfame' GLIM can
handle uneven replicates and missing values. The other yield parameters, seed
number/m2 and individual seed weight were not analysed separately for each sowing rate
for the same reason. Hence least significant differences were not calculated for each
sowing rate but Cultivar x Sowing Rate interactions could be found' Germination data
from seeds in burr were arcsine-transformed and GLIM was used for the analyses of
vanance.

Diagram 3.1: Block orientation and size within the allocated field site.
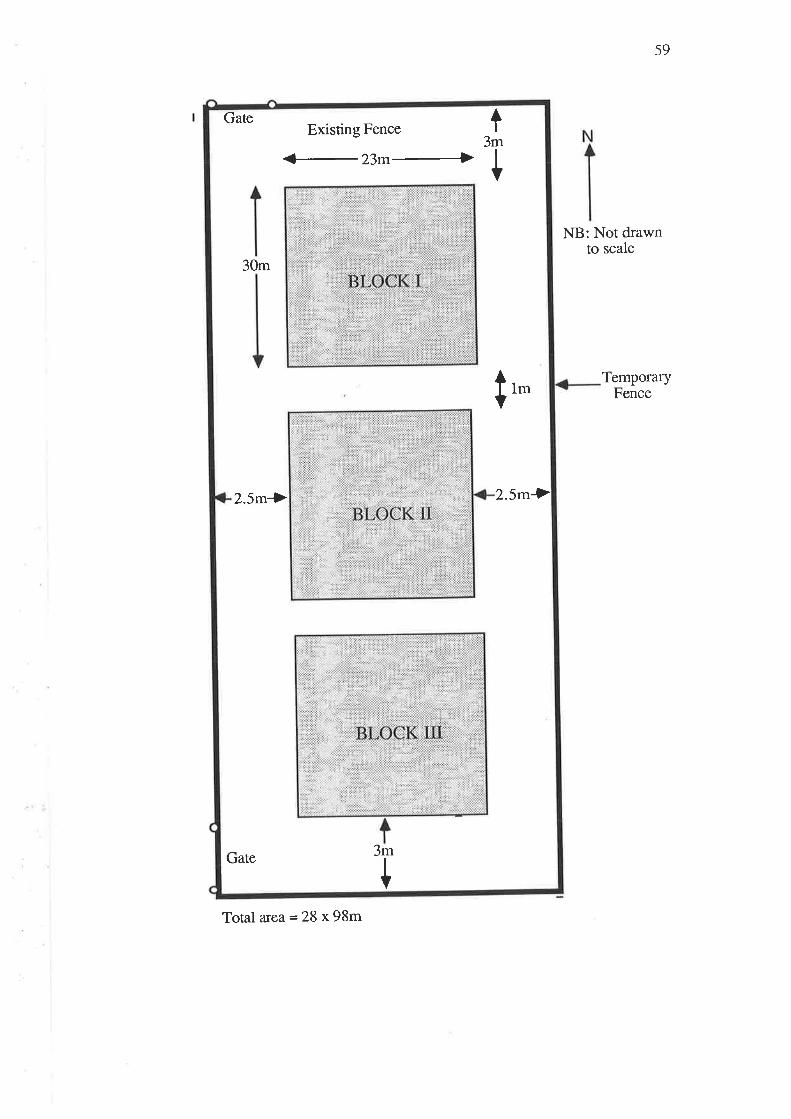
Gate t3m
tExisting Fence
{-23m4
30m
I 1m
2.5m1 2.5mÞ
Gate 3m
I
NB: Not drawnto scale
59
TemporaryFence
Total area = 28 x 98m
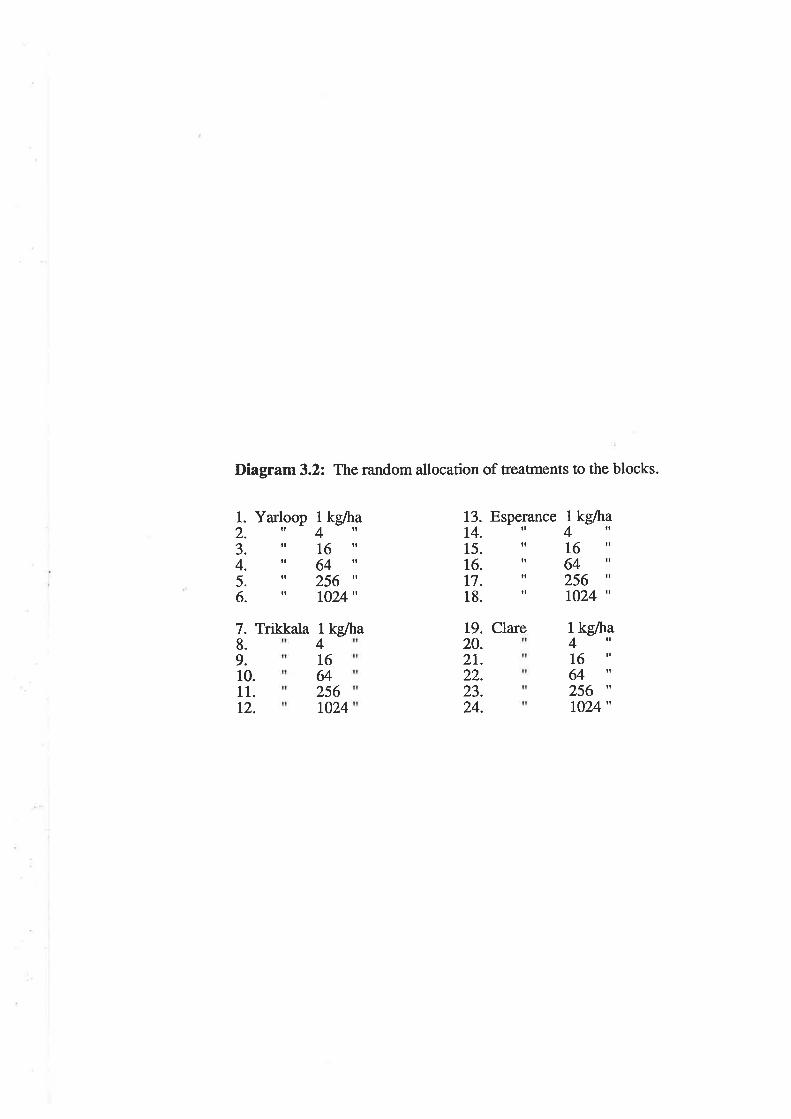
Diagram 3.2: The random allocation of treatments to the blocks.
Trikkala
1.2.3.4.5.6.
7.8.9.
Yarloop l kg/ha"4rlrt16["64rr" 256 '!,
" 1024"
642561024
13. Esperance14. '|,
15. '16. '!,
17. 'i,
18. 'i,
1
41
1kg/ha4rt16 '|,
64 rr
256 '!,
1024 "
Ikglha4'16 '|,
64 rr
256 'i,
1024"
10.11.12.
Claret9.20.2r.22.23.24.
kg/ha
6
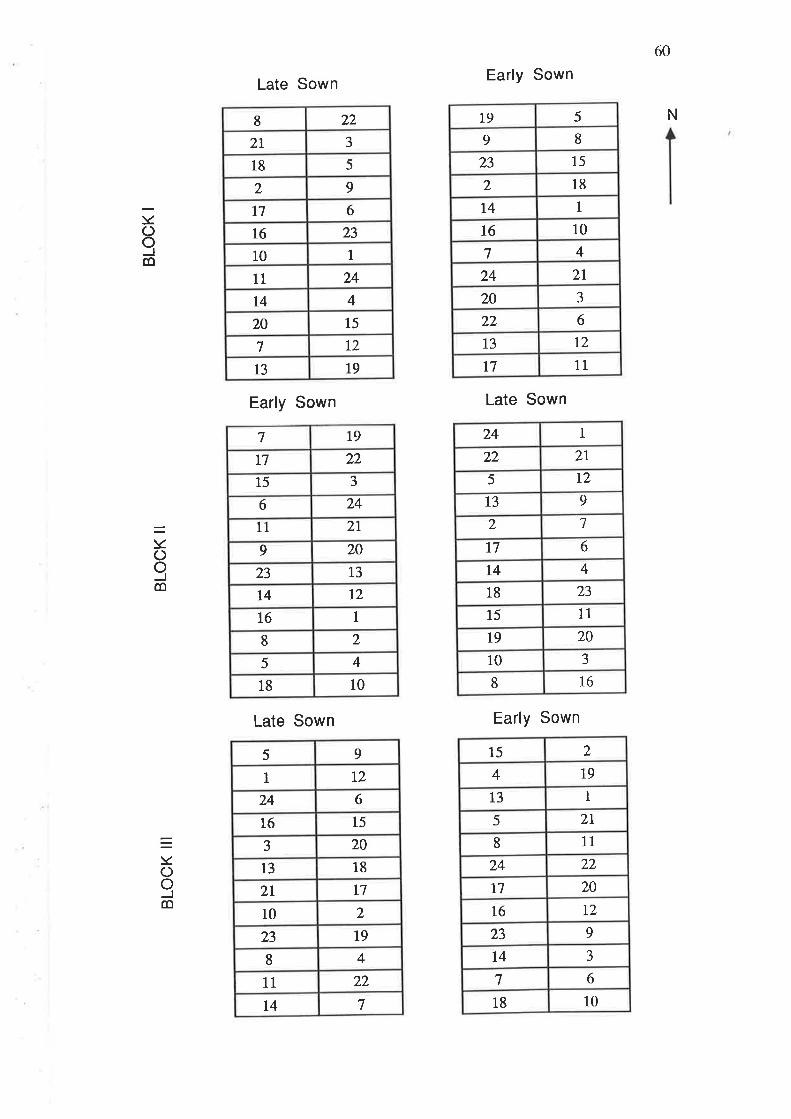
L913
t27
1520
4t4
2411
110
23r6
617
92
518
J2l228
60
Late Sown
Early Sown
Late Sown
Early Sown
Late Sown
168
310
2019
1115
2318
4t46t7
72
913
t25
2I22
124
Early Sown
1018
67
Jl4923
1216
20t7
2224
118
2t5
113
194
215
N
;()oco
=YC)oco
=YC)oJco
1117
t213
622
320
2l24
47
10t6
1T4
182
1523
89
519
1018
45
28
116
12t41323
209
2I11
246
J15
22T7
t97
7t4
2211
48
1923
210
l72l1813
203
1516
624
L21
95
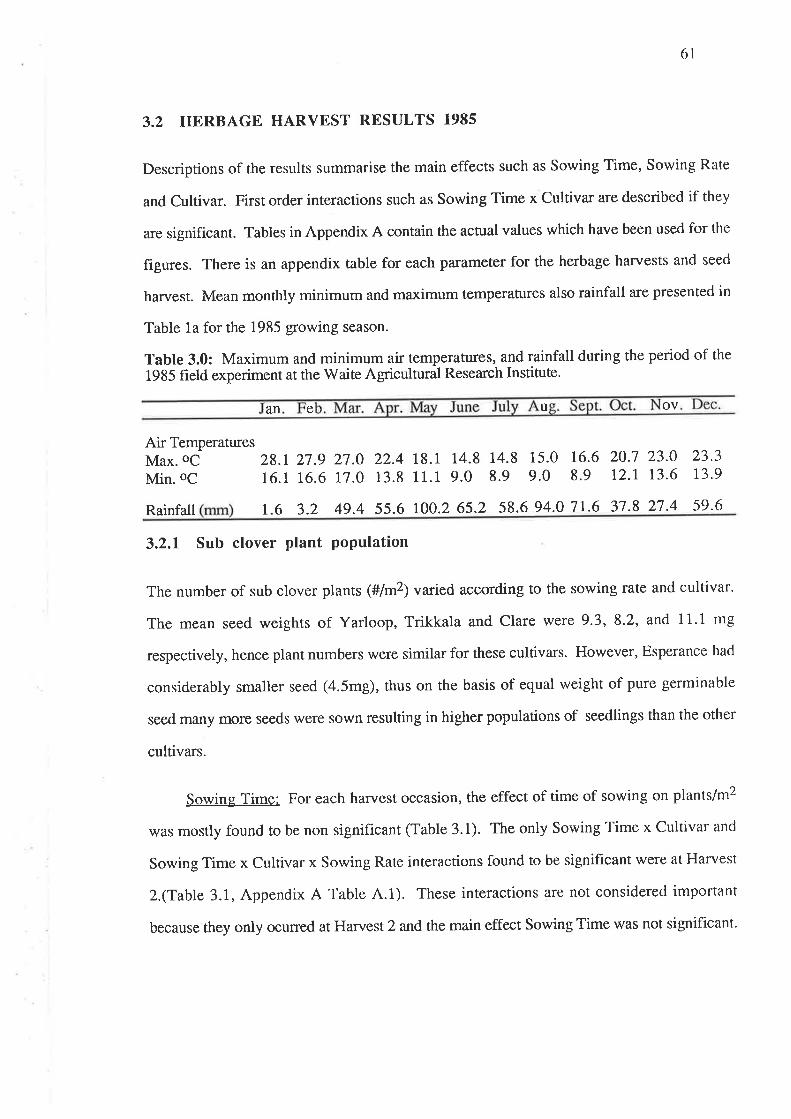
6l
3.2 HERBAGE HARVBST RESULTS 1985
Descriptions of the results summarise the main effects such as Sowing Time, Sowing Rate
and Cultivar. First order interactions such as Sowing Time x Cultivar are described if they
are significant. Tables in Appendix A contain the actual values which have been used for the
figures. There is an appendix table for each p¿ìrameter for the herbage ha¡vests and seed
harvest. Mean monthly minimum and maximum temperatures also rainfall are presented in
Table 1a for the 1985 growing season.
Table 3.0: Maximum and minimum air temperatures, and rainfall during the period of the
1985 freld experiment at the Waite Agricultural Research Institute.
an e ov
Air TemperaturesMax. oC
Min. oC28.r 27.9 27.0 22.4 tï.r 14.8 14.8 15.0 16.6 20.7 23.0
16.1 16.6 17.0 13.8 11.1 9.0 8.9 9.0 8.9 r2-r 13.623.313.9
Rainfall 1.6 3.2 49.4 55.6 ro0.2 65.2 58.6 94.0 7r.6 37.8 27.4 59-6
u
3.2.1 Sub clover plant population
The number of sub clover plants (#lfiP) varied according to the sowing rate and cultivar.
The mean seed weights of Yarloop, Trikkala and Clare were 9.3,8.2, and 11.1 mg
respectively, hence plant numbers were similar for these cultivars. However, Esperance had
considerably smaller seed (4.5mg), thus on the basis of equal weight of pure germinable
seed many more seeds were sown resulting in higher populations of seedlings than the other
cultivars.
Sowing Time: For each harvest occasion, the effect of time of sowing on plants/m2
was mostly found to be non significant (Table 3.1). The only Sowing Time x Cultivar and
Sowing Time x Cultivar x Sowing Rate interactions found to be significant were at Harvest
2.(Table 3.1, Appendix A Table 4.1). These interactions are not considered important
because they only ocuned at Harvest 2 and,the main effect Sowing Time was not significant'
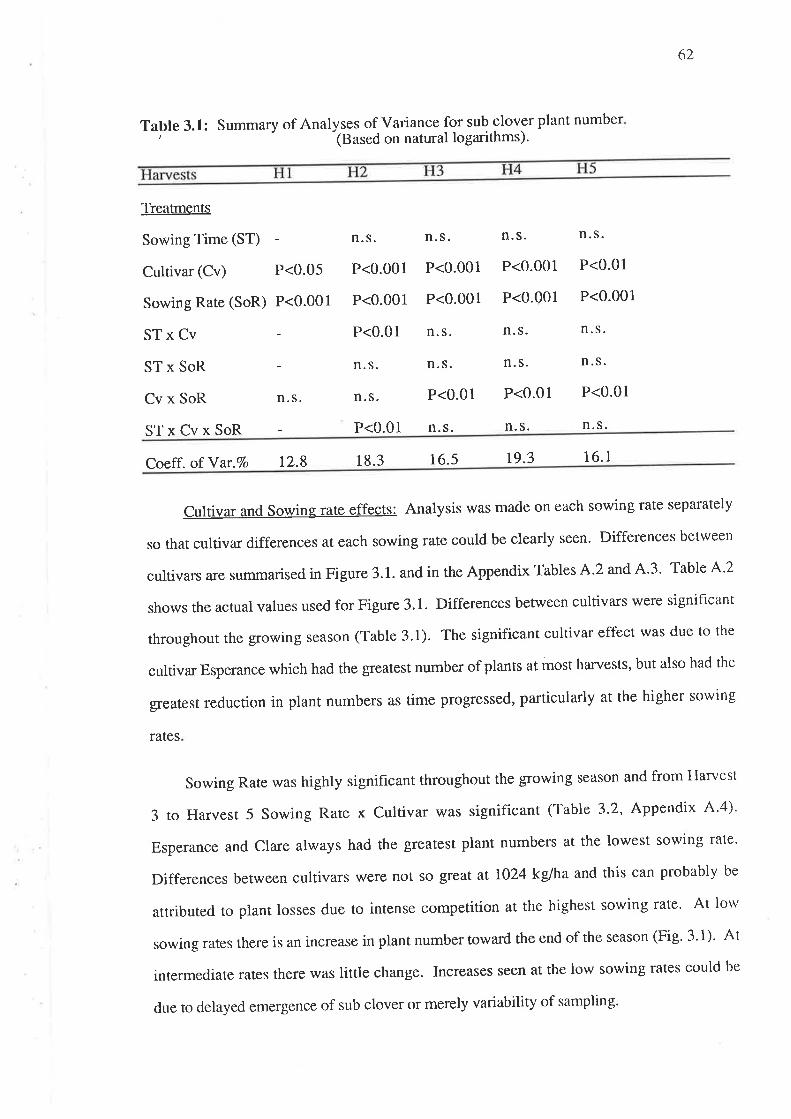
62
Table 3.1: Summary of Analy.ses of.variance for sub clover plant number' - (Based on natural logarithms)'
Treatments
Sowing Time (ST)
Cultivar (Cv) P<0.05
Sowing Rate (SoR) P<0.001
STxCv
ST x SoR
Cv x SoR n.s.
S'l'x Cv x SoR
n. s.
P<0.001
P<0.001
P<0.01
n. s.
n. s.
P<0.01
n. s.
P<0.001
P<0.001
n. s.
n. s.
P<0.01
11. s.
n. s.
P<0.001
P<0.001
n. s.
n. s.
P<0.01
n. s.
n. s.
P<0.01
P<0.001
n. s.
n.s.
P<0.01
n. s.
Coeff. ofYar.Vo 12.8 18.3 16.5 r9.3 16.1
Cultivar and Sowing rate effects: Analysis was made on each sowing rate separately
so that cultivar differences at each sowing rate could be clearly seen' Differences between
cultivars are summarised in Figure 3.1. and in the Appendix Tables A'2 and A'3' Table A'2
shows the actual values used for Figure 3.1. Differences between cultivars were significant
throughout the growing season (Table 3.1). The significant cultivar effect was due to the
cultivar Esperance which had the greatest number of plants at most harvests, but also had the
gfeatest reduction in plant numbers as time progressed, particularly at the higher sowing
rates
Sowing Rate was highly signif,rcant throughout the growing season and from Harvest
3 to Harvest 5 Sowing Rate x Cultivar was significant (Table 3'2, Appendix A'4)'
Esperance and Clare always had the greatest plant numbers at the lowest sowing rate'
Differences between cultivars were not so great at 1024 kg/ha and this can probably be
attributed to plant losses due to intense competition at the highest sowing rate' At lorv
sowing rates there is an increase in plant number towafd the end of the season (Fig' 3'1)' At
intermediate rates there was little change. Increases Seen at the low sowing rates could be
due to delayed emergence of sub clover or merely variability of sampling'

Figure 3.1: The sub clover plant densities of four cultivars sown at six sowlng rates.
Legend: n Yarloop Vertical bars show LSD (57o)" a TrikkahE Esperancs * See Appendix A, Table A'3o Cla¡e
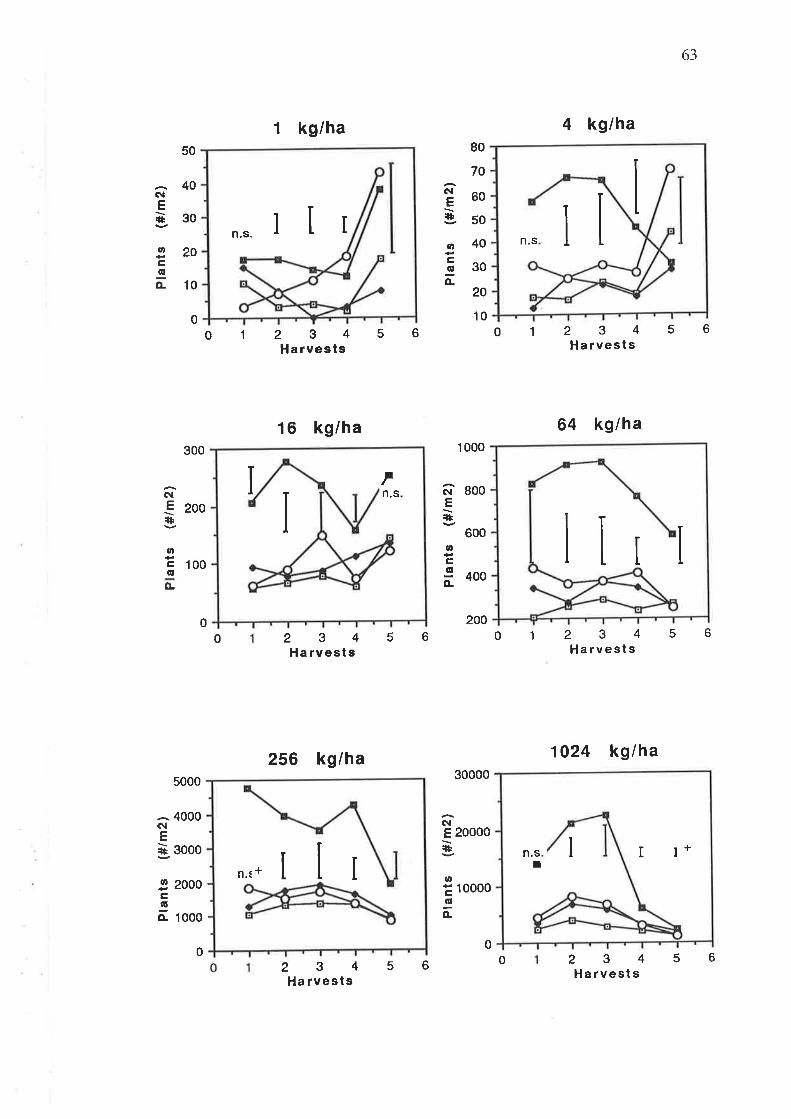
50
40(\.Eì30
20aÊgo-
1 kg/ha
234H a rvests
l6 kg/ha
234H a rvest s
256 kg/ha
234Ha rvests
s6
80
70
60
50
40
30
20
10
30000
20000
10000
01
01
56
63
56
NEith
.D
coÀ
4 kg/ha
234H a rvests
64 kg/ha
234Harvests
1024 kg/ha
234Harvests
10
300
al,
c 1006o.
0
010
1 000
800
600
400
200
NE+
al,
ÊgÈ
200NE+
0 56
5000
4000
3000
NE:th
6lE+
ID
Ê,6E
2 20ooÊ6d looo
00 56
n.s. IIn.s
In.s
n.f *I I I+n.s
!
560

64
Table 3.2: The relationship between plant number (y) and sowing rate (x) for the four
cultivars at Harvests 1, 3 and 6. (Y = a + bx + cxz)
cba r Probability
Harvest 1
YarloopTrikkalaEsperanceClare
Harvest 3
EsperanceClare
Harvest 6
119.0226.0909.2243.4
-304.5-523.9
-2199.5-635.1
-360.9-935.5
-4r98.3-1155.8
87.0r39.2s68.9t7 6.7
r07.624r.0974.r284.4
0.9950.9880.9880.993
P<0.01P<0.05P<0.01P<0.01
YarloopTrikkala
296065
YarloopTrikkala
13 1.1385.s
1947.8519.8
0.9950.987o.9670.979
P<0.01P<0.05P<0.05P<0.05
15.164.510.961.1
-34.6-r70.3-82.7-71.9 35.7
0.9890.9960.9900.993
P<0.01P<0.01P<0.01P<0.01
981Esperance
Clare
3.2,2 Herbage Production
a) Sub clover
Sowing time: The effect of time of sowing was signifioant for Harvest 2 only (Table
3.3). The Sowing Time x Cultivar and Sowing Time x Cultivar x Sowing Rate interactions
at Han¡est 2 were also significant for some sowing rates (Appendix Table A'5)' Late-sown
treatments generally showeC a marked reduction in yield, but Yarloop and Trikkala were the
least affected by late sowing whereas the herbage production of Esperance and Clare was
significantly reduced. When sown late, there were very few differences between cultivars'
In most situations when sowing Time x cultivar was significant this was due to clare
having the highest yield when sown early.
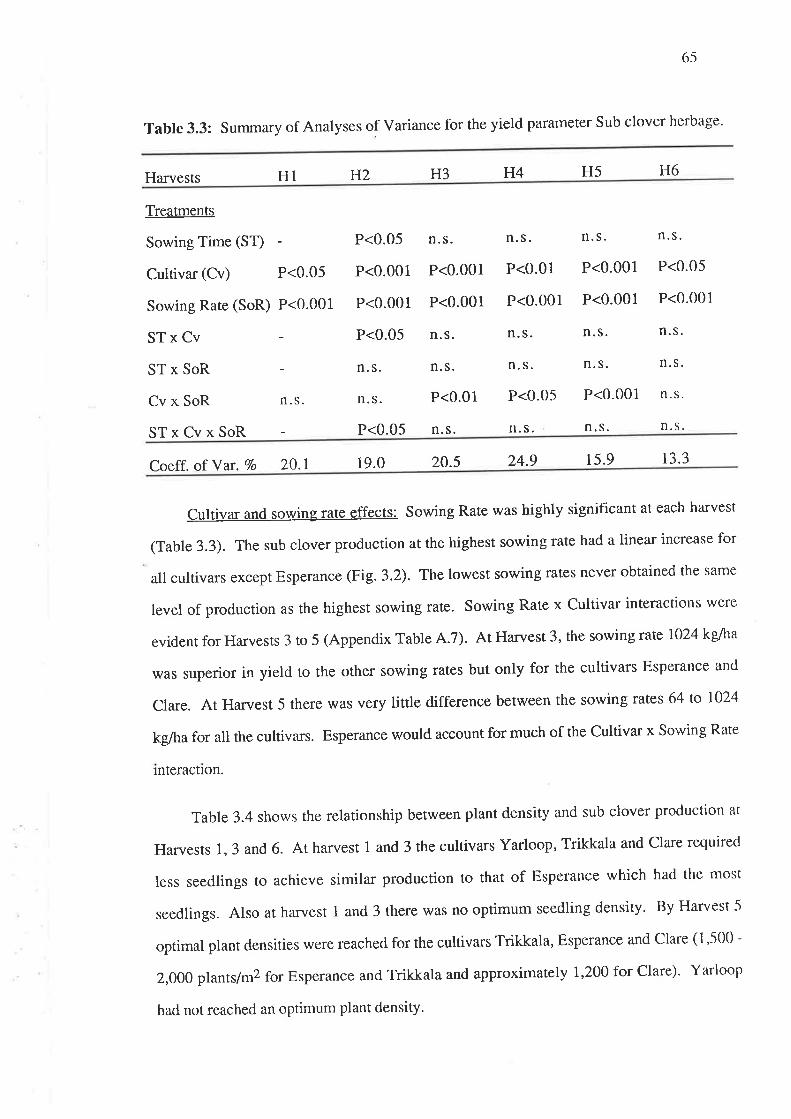
6-5
Table 3.3: Summary of Analyses of variance for the yield parameter Sub clover herbage'
Ha¡vests H1 H2 H3 H4 H5 H6
Treatments
Sowing Time (ST)
Cultivar (Cv) P<0.05
Sowing Rate (SoR) P<0.001
STxCv
ST x SoR
Cv x SoR n.s.
STxCvxSoR
P<0.05
P<0.001
P<0.001
P<0.05
n. s.
n. s.
P<0.05
n. s.
P<0.001
P<0.001
n.s.
n. s.
P<0.01
n. s.
n. s.
P<0.01
P<0.001
n. s.
n. s.
P<0.05
rl. s.
n. s.
P<0.001
P<0.001
n. s.
n. s.
P<0.001
n. s.
n. s.
P<0.05
P<0.001
n. s.
n. s.
n. s.
n. s.
Coeff. of Yar. To 20.1 19.0 20.5 24.9 15.9
Cultivar and sowing rate effects: Sowing Rate was highly significant at each harvest
(Table 3.3). The sub clover production at the highest sowing rate had a linear increase for
all cultivars except Esperance (Fig. 3.2). The lowest sowing rates never obtained the same
level of production as the highest sowing rate. Sowing Rate x Cultivar interactions were
evident for Harvests 3 to 5 (Appendix Table 4.7). At Ha¡vest 3, the sowing rate lO24 kg/ha
was superior in yield to the other sowing rates but only for the cultivars Esperance and
Clare. At Harvest 5 there was very little difference between the sowing rates 64 to 1024
kg/ha for all the cultivars. Esperance would account for much of the Cultivar x Sowing Rate
mteractlon.
Table 3.4 shows the relationship between plant density and sub clover production at
Harvests l, 3 and 6. At harvest 1 and 3 the cultivars Yarloop, Trikkala and Clare required
less seedlings to achieve similar production to that of Esperance which had the most
seedlings. Also at harvest 1 and 3 there was no optimum seedling density' By Harvest 5
optimal plant densities were reached for the cultivars Trikkala, Esperance and Clare (1,-500 -
2,000 plants/m2 for Esperance and Trikkala and approximately 1,200 for Clare)- Yarloop
had not reached an optimum plant density-
13.3
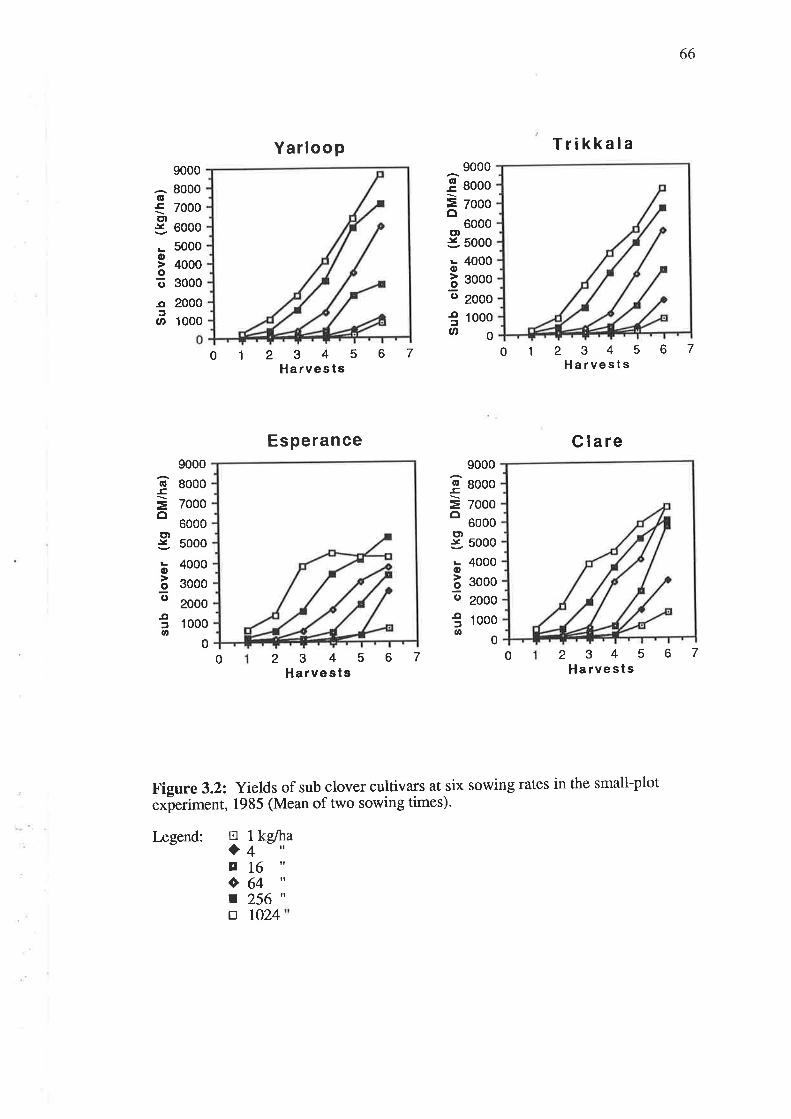
66
234567Harvests
Clare
TrikkalaYarloop
2345H a rves ts
2345Harvests
9000
8000
7000
6000
5000
4000
3000
2000
1 000
oE
=oo¡-v
Lo
I(,¡¡fat,
9000
8000
7000
6000
5000
4000
3000
2000
1000
G-cot.v
c)
ot)
l¡J(t,
00170
Esperance
kúha
61
9000
8000
7000
6000
5000
4000
3000
2000
1 000
6E
=oE)lt
Lo
9()
.C¡fU'
9000
8000
7000
6000
5000
4000
3000
2000
1000
ql.Ê,
=cl
o).Y
LIt
9o
.ctfal,
00 67234sHa rvests
070 6
Figure 3.2: Yields of sub clover cultiva¡s at six sowing rates in the small-plot
exþeriment, 1985 (Mean of wo sowing times)-
Irgend: 1
4 It
il
I
16642561
EI
agottr o24

Figure 3.3: Yields of four sub clover cultivars at six sowing rates(Mean of two sowing times).
lægend: traqo
Vertical bars show LSD (57o)
+ See Appendix A, Table 4.9
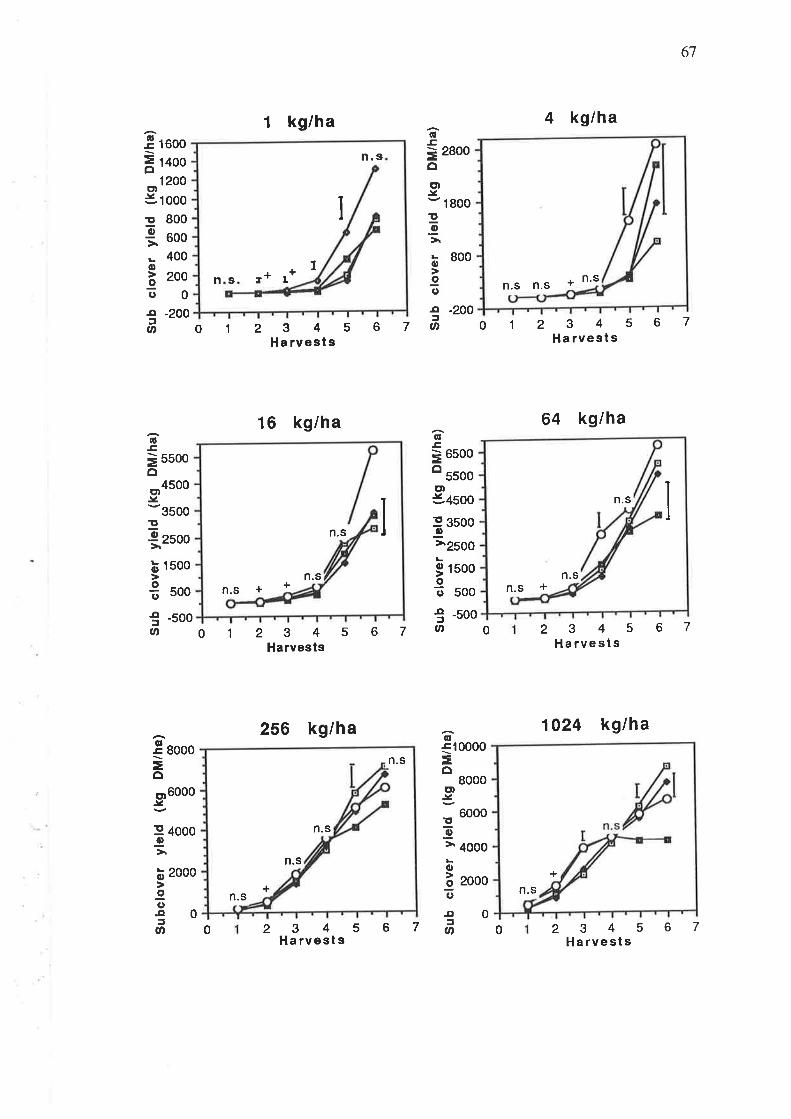
Tsn I+
1
I+
n.soE
=oE¡-v
!3
o
I()
ttfU'
1600
1400
1200
1 000
800
600
400
200
0
-200
1 kg/ha
2345Ha rvests
16 kg/ha
234sHarvests
256 kg/ha
2345Ha rvests
0
2800
1 800
800
-200
qlE
=oct¡-v
9g
Lo
9(,-ctfo7
4 kg/ha
2345Harvests
64 kg/ha
2345Harvests
1024 kg/ha
2345Harvests
67
67
67
01
01
b
6
6E
=o
1
6-c
=oCD.!
Eõ
o9(,-q¡U'
5500
4500
6500
5500otú+soo
I 35oog>2500
6€l=oEt.v
II
o
Io¡¡fØ
Lo
9o¡lã11,
3500
2500
1500
500
-500
! eooo
=oo)6000y-
500
07
1
500
-500
0000
8000
6000
4000
2000
00
0
4000
2000
II
o
9o
..C¡fØ
n.s n.sn.s+
n.s
n.s
+n.s +n.s
n.s
n.s +
n.s
n.s
n.s
+
n.s ^",t'n.s
+
067 67
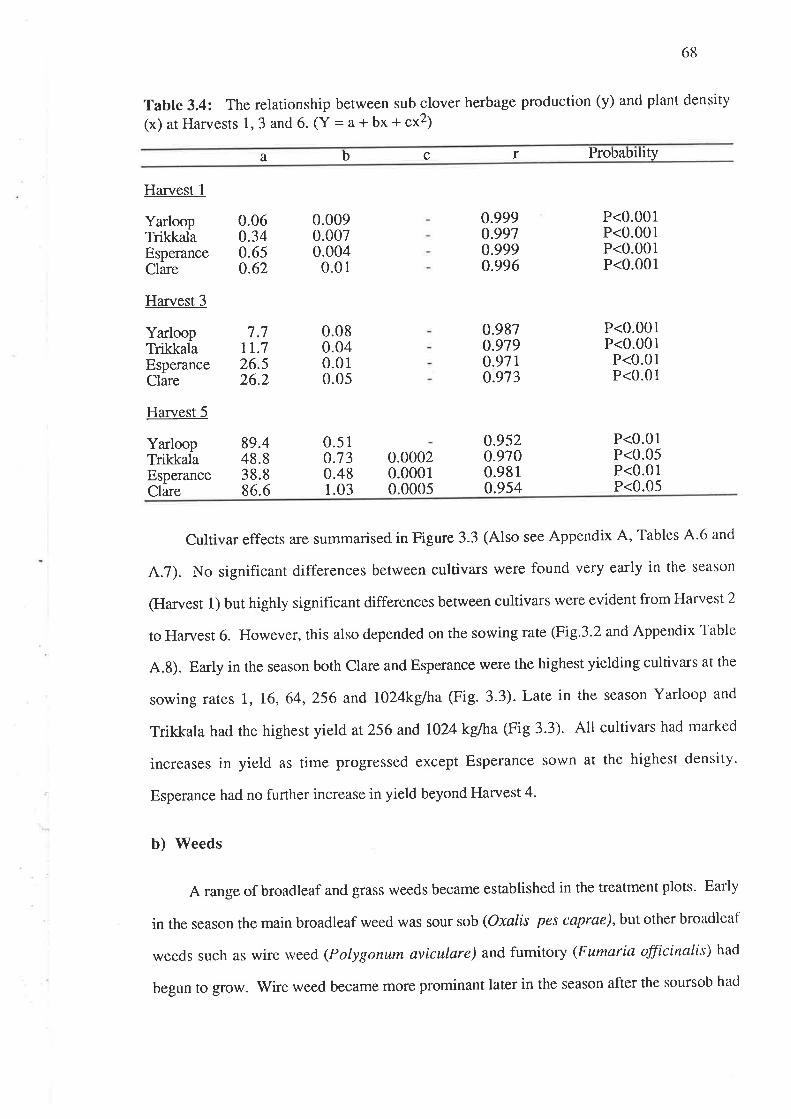
6[Ì
Table 3.4: The relationship between sub clover herbage production (y) and plant density
(x) at Harvests 1, 3 and 6. (Y : a + bx + cx2¡
a Probabrlttyrcb
Harvest I
EsperanceClare
Harvest 3
EsperanceClare
Harvest 5
0.0090.0070.004
0.01
0.080.040.010.05
0.9990.9970.999o.996
0.987o.9790.9710.973
0.9520.9700.9810.954
P<0.001P<0.001P<0.001P<0.001
YarloopTrikkala
YarloopTrikkala
YarloopTrikkala
0.060.340.650.62
7.7tt.726.526.2
EsperanceClare
89.448.838.886.6
0.510.130.481.03
0.00020.00010.0005
P<0.001P<0.001
P<0.01P<0.01
P<0.01P<0.05P<0.01P<0.05
Cultivar effects are summarised in Figure 3.3 (Also see Appendix A, Tables A-6 ancl
4.7). No significant differences between cultivars were found very early in the season
(Harvest 1) but highly significant differences between cultivars were evident from Harvest 2
to Harvest 6. However, this also depended on the sowing rate (Fig.3.2 and Appendix Table
4.8). Early in the season both Clare and Esperance were the highest yielding cultivars at the
sowing rates 1, 16,64,256 andl}24kglha (Fig. 3.3). Late in the season Yarloop and
Trikkala had the highest yield at 256 and 1024kglha (Fig 3.3). All cultivars had nrarked
increases in yield as time progressed except Esperance sown at the highest density.
Esperance had no further increase in yield beyond Harvest 4.
b) Weeds
A range of broadleaf and grass weeds became established in the treatment plots. Early
in the season the main broadleaf weed was sour sob (Oxatis pes caprae), but other broadleaf
weeds such as wire weed (Potygonum aviculare) and fumitory (Fumaria officinalis) had
begun to grow. Vy'ire rveed became more prominant later in the season after the soursob had
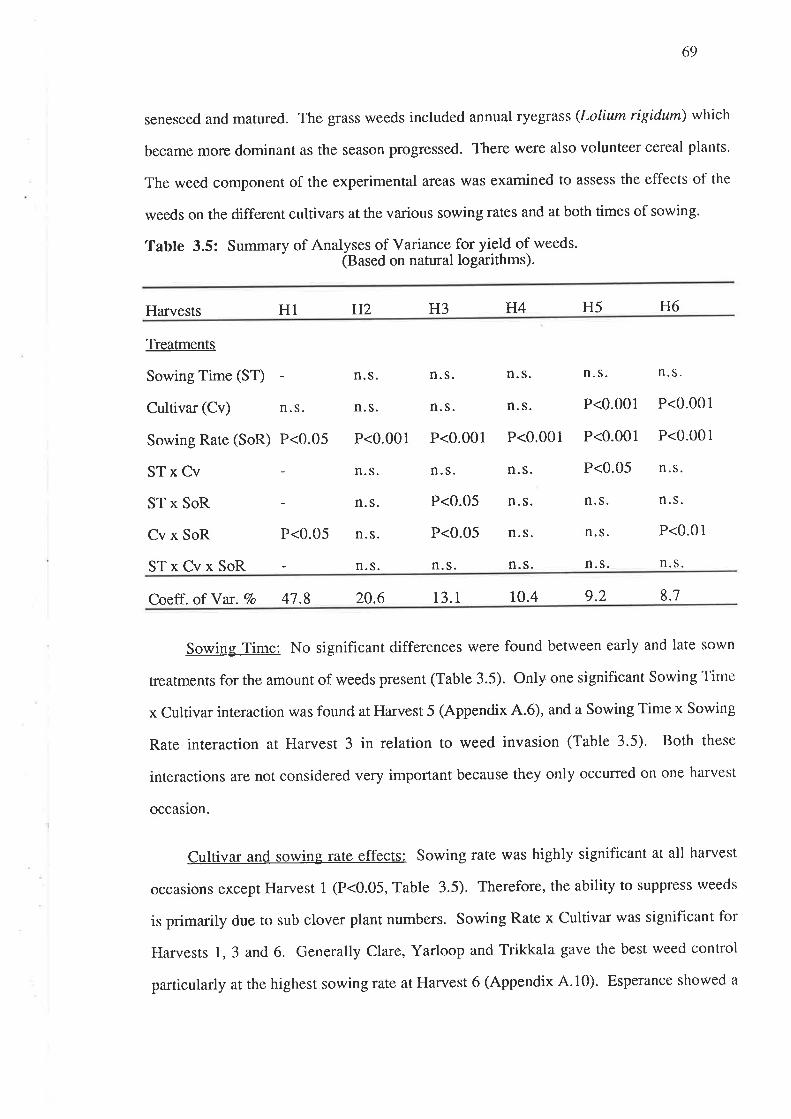
69
senesced and matured. The grass weeds included annual ryegrass (Lolium rigidum) which
became more dominant as the season progressed. There were also volunteer cereal plants.
The weed component of the experimental areas was examined to assess the effects of the
weeds on the different cultivars at the various sowing rates and at both times of sowing.
Tabte 3.5: Summary of Analyses of Variance for yield of weeds.(Based on natural logarithms).
Harvests H1 H2 H3 H4 H5 H6
Treatments
Sowing Time (ST)
Cultivar (Cv) n.s.
Sowing Rate (SoR) P<0.05
STxCv
ST x SoR
Cv x SoR P<0.05
STxCvxSoR
n. s.
n. s.
P<0.001
n. s.
n. s.
n. s.
n. s.
n. s.
n. s.
P<0.001
n. s.
P<0.05
P<0.05
n. s.
n. s.
n. s.
P<0.001
n. s.
n. s.
n. s.
n. s.
n. s.
P<0.001
P<0.001
P<0.05
n. s.
n. s.
n. s.
n. s.
P<0.001
P<0.001
n. s.
n. s.
P<0.01
n. s.
Coeff. of Yar. Vo 41.8 20.6 13.1 10.4 9.2 8.1
Sowing Time: No significant differences were found between early and late sown
treatments for the amount of weeds present (Table 3.5). Only one significant Sowing Tirtre
x Cultivar interaction was found at Harvest 5 (Appendix 4.6), and a Sowing Time x Sowing
Rate interacrion ar Harvest 3 in relation to weed invasion (Table 3.5). Both these
interactions are not considered very important because they only occurred on one harvest
occaslon.
Cultivar and sowing rate effects: Sowing rate was highly significant at all harvest
occasions except Harvest 1 (P<0.05, Table 3.5). Therefore, the ability to suppress weeds
is primarily due to sub clover plant numbers. Sowing Rate x Cultivar was significant for
Harvests 1, 3 and 6. Generally Clare, Yarloop and Trikkala gave the best weed control
particularly ar rhe highest sowing rate at Harvest 6 (Appendix 4.10). Esperance showed a
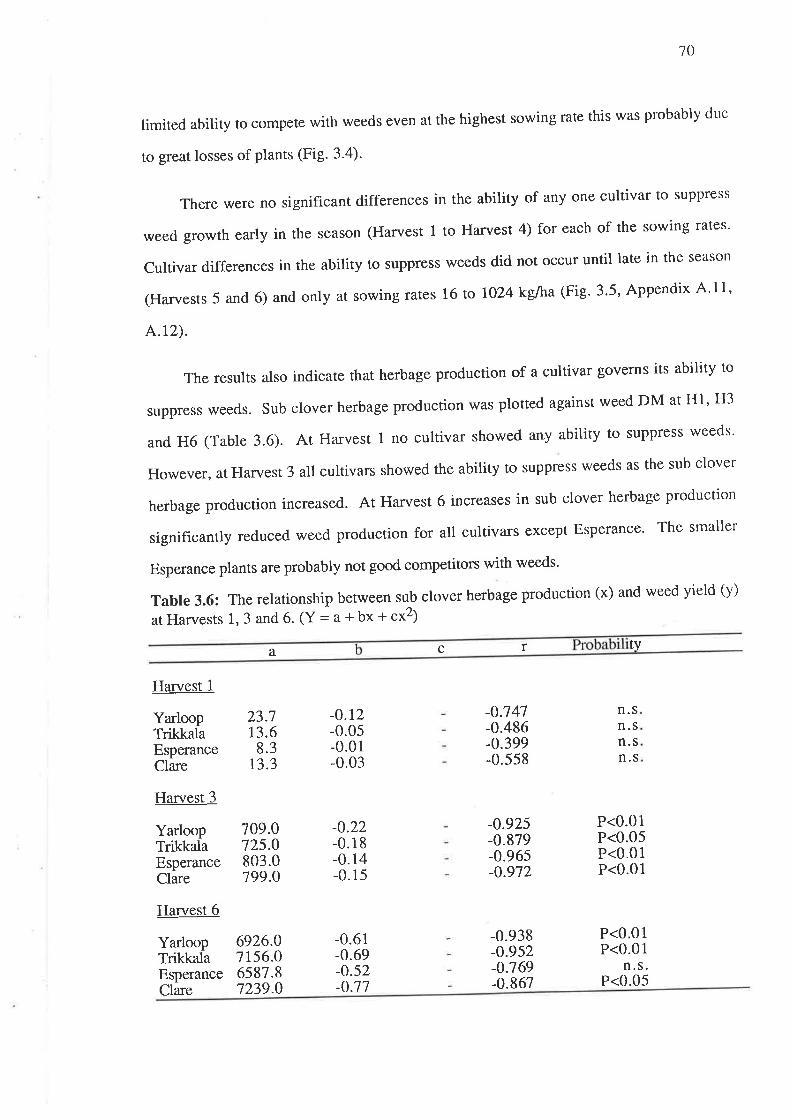
70
limited ability to compete with weeds even at the highest sowing rate this was probably dtre
to great losses of plants (Fig. 3.4)-
There were no significant differences in the ability of any one cultivar to suppress
weed growth early in the season (Harvest I to Harvest 4) for each of the sowing rates'
Cultivar differences in the ability to suppress weeds did not occur until late in the season
(Harvests 5 and 6) and only at sowing rates 16 to 1024 kg/ha (Fig' 3'5' Appendix A' 1 1 '
A.r2).
The results also indicate that herbage production of a cultivar governs its ability to
suppress weeds. Sub clover herbage production was plotted against weed DM at Hl' H3
and H6 (Table 3.6). At Harvest I no cultivar showed any ability to suppress weeds'
However, at Harvest 3 all cultivars showed the ability to suppress weeds as the sub clover
herbage production increased. At Harvest 6 increases in Sub clover herbage production
significantly reduced weed production for all cultivars except Esperance' The smaller
Esperance plants are probably not good competitors with weeds.
Table 3.6: The relationship between sub clover herbage production (x) and weed yield (y)
at Harvests 1, 3 and 6' (Y = a * bx + cx2¡
c r tya
23.YarloopTrikkala
YarloopTrikkala
Harvest 1
EsperanceClare
Harvest 3
EsperanceClare
Harvest 6
YarloopTrikkalaEsperanceClare
709.0725.0803.0799.O
6926.01156.06587.81239.0
-0.r2-0.0s-0.01-0.03
-0.22-0.18-0.14-0.15
-0.61-0.69-0.52-0.71
-o.747-0.486-0.399-0.558
-0.925-0.879-0.965-o.972
-0.938-o.952-0.769-0.867
P<0.01P<0.05P<0.01P<0.01
P<0.01P<0.01
n. s.P<0.05
n.sn.sn.sn.s
11.3.68.3
13.3
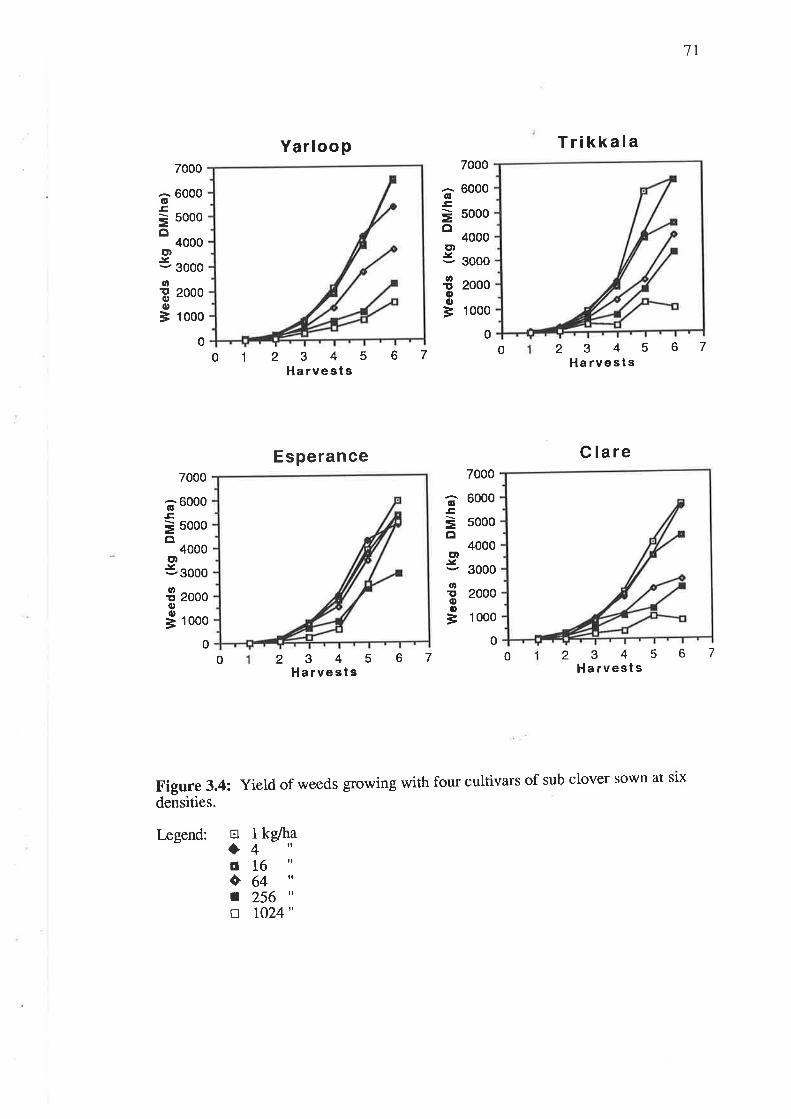
11
4000
3000
2000
1000
ct).Y
o!oo
=
6E
=oo)L
cr,!o0,
=
7000
6000
5000
4000
3000
2000
1 000
Yarloop
2345Harvests
Esperance
2345Harvests
7000
^ 60006E
= sooo
cl
0
T rikkala
2345Harvests
C lare
2345Ha rvest s
00 67
0 1 67
67
7000
6000
5000
4000
3000
2000
1 000
0
7000
6000
5000
4000
3000
2000
qlE
=ooltt
o!o0,
=
6E
=c¡
ct¡.!
a¡,îto0,
=0001
000
67
Figure 3.4: Yield of weeds growing with four cultivars of sub clover sown at slx
densities.
I-egend: tratrôIú
kelha
6
1
41
it
tl
tl
ll642561024"

Figure 3.5: Yield of weeds growing with four cultivars of sub clover sown at stxdensities.
Legend: Vertical bars show LSD (57o)troEo
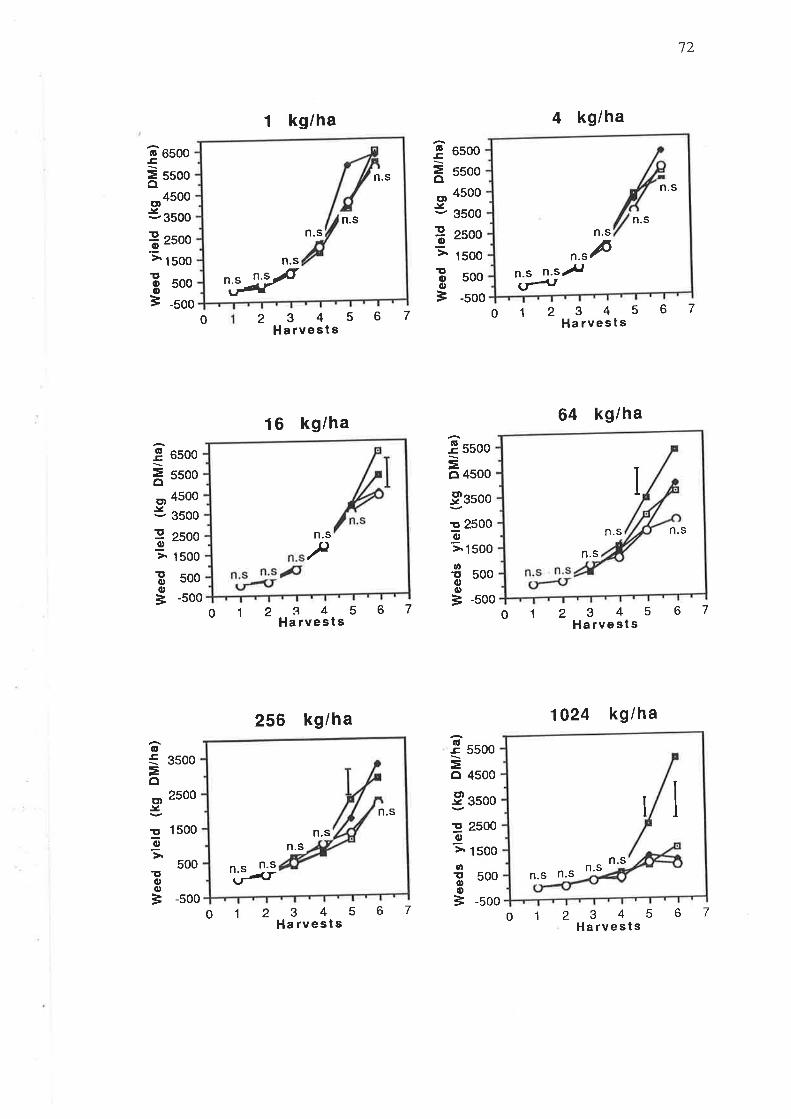
^Jyn.s
n.s
n.s
n.s
1)
!'osooÈ ssooaor4500úgsoo
ã zsoo> 15oO
1 kg/ha
234567H a rvest s
16 kg/ha
345Ha rvests
67
6.E
=oo)-t
ItE
Itoc,
=
4500
3500
2500
1 500
500
-500
6500
5500
4 kg/ha
2345Ha rvests
64 kg/ha
2345Harvests
1024 kg/ha
2345Ha rvests
!o0,
=
500
-5001
0'l
6700
6E
=octì.Y
9
6500
5500
4500
3500
2500
1 500
500
-500
6E
=octt-v
II!oo
=
5500
.9
antt0,0t
=
4500
3500
2500
1 500
500
-500012
o1
256 kg/ha
2345Harvests
0 1 67
67
3500
2500
1 500
500
-500
6E
=oEt.-
!õ;ît0)o
=
(lE
=ôctt.v
9o
at!oo
=
5500
4500
3500
2500
1 500
500
-50067
n.s
Fn.s
n.s
n.sn.s n.s/(fl
A/ n'"
2n.s n.s n.s
n.s
I
n.s
n.s
ui;n.s
n.s n.s n.sn.s

13
Figure 3.6, illustrates the proportions of sub clover and weeds' As sowing rate increased
the proportion of sub clover in the sward increased, and the proportion of weeds decreased'
Clare at the lower sowing rates (1 to 16 kg/ha) has the highest proportion of sub clover'
especially at Harvest 6. Esperance lost its competitiveness at 1024 kg/ha as the season
progtessed presumably due to plant losses. Harvests 5 and 6 show a marked increase in the
amount of weed present in Esperance plots (Also see Figure 3.4).
Figure 3.7 illustrates the relation of sub clover plant density and weed yield at Harvest
5. There was the potential for the cultivars Yarloop, Trikkala and clare to increase their
ability to suppress weeds if the plant density was higher than 1,200 for Clare and Yarloop
and 1,850 for Trikkala. Esperance clearly showed the least ability to control weeds even
though it had the highest plant density.

Figure 3.6: Yield and botanical composition of plots sown to four sub clover cultivars.
Legend:
NB: Figure 3.6 continued next page
Y_T-l=C_
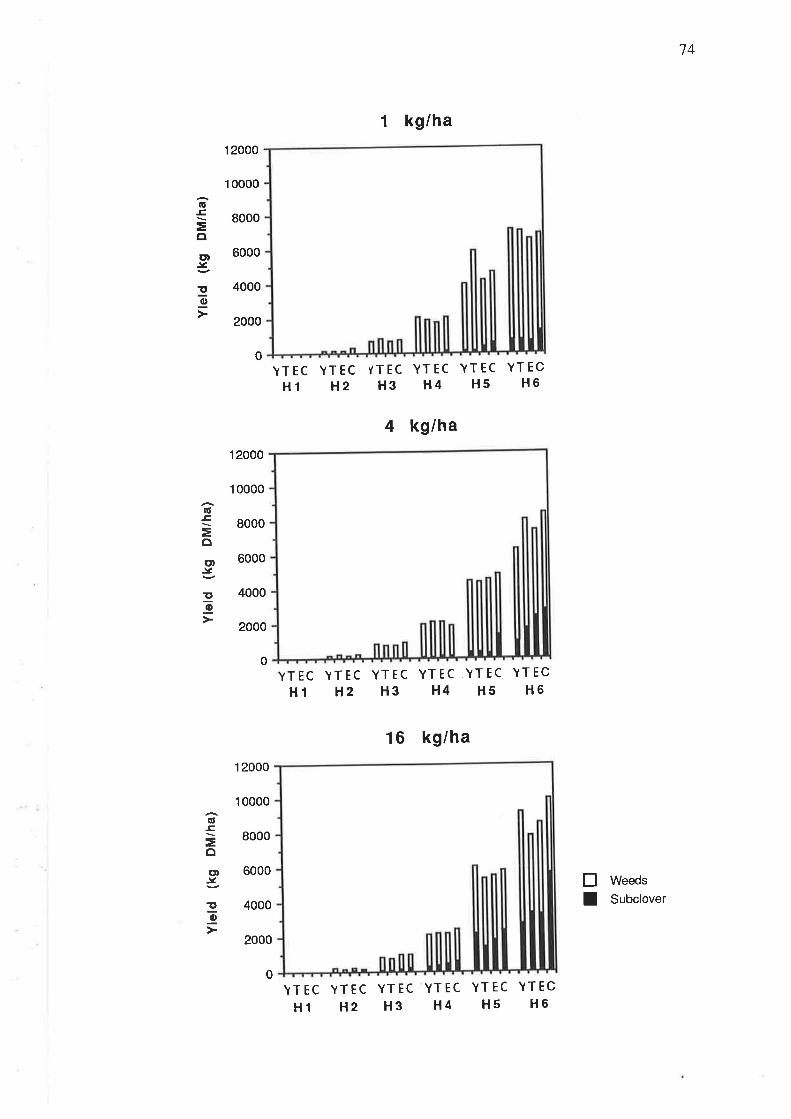
14
1 0000
1 2000
8000
6000
4000
2000
0
1 2000
8000
6000
4000
2000
0
1 2000
8000
6000
4000
2000
YTEC YTECH1 H2
1 kg/ha
YTEC YTEC YTEC YTECH3 H4 H5 H6
oE
=oot-l
3p
1 0000
4 kg/ha
YTEC YTEC YTEC YTEC YTEC YTEC
H1 H2 H3 H4 H5 H6
16 kg/ha
YTEC YTEC YTEC YTEC YTEC YTEC
Hl H2 H3 H4 H5 H6
(lE
=c¡
C').Y
ItE
1 0000
6E
=oo).Y
'oE
Ú Weeds
I Subclover
o

Figure 3.6: Yield and botanical composition of plots sown to four sub clover cultivars
Legend: Y = YarloopT = Trikkala
EsperanceClare
þ=Q=

'75
1 0000
12000
8000
6000
4000
2000
o
12000
8000
6000
4000
2000
0
12000
8000
6000
4000
2000
64 kg/ha
YTEC YTEC YTEC YTEC YTEC YTECHl H2 H3 H4 H5 H6
256 kg/ha
YTEC YTEC YTEC YTEC YTEC YTEC
H1 H2 H3 H4 H5 H6
1024 kg/ha
YTEC YTEC YTEC YTEC YTEC YTECHl H2 H3 H4 H5 H6
6E
=oEl.t
t3
1 0000
6E
=oct).-
Io;
10000
WeedsnT
6.Ê,
=ôC'¡.v
ÎtISubclover
0
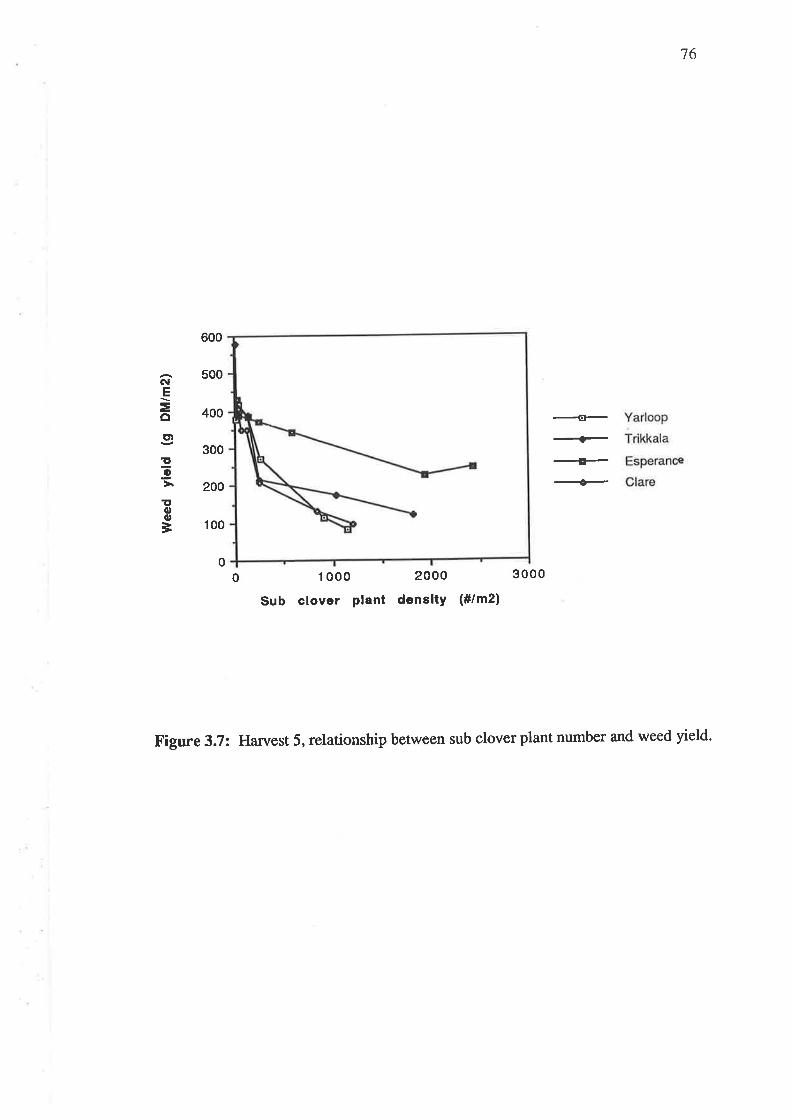
76
600
C\lE
=ôo)
Eõ
Itoo
=
500
400
300
200
100
+t-+-++
Yarloop
Trikkala
Esperance
Clare
00 1 000 2000
Sub clover Plant densltY (#lm2l
3000
Figure 3.7: Harvest 5, relationship between sub clover plant number and weed yield.
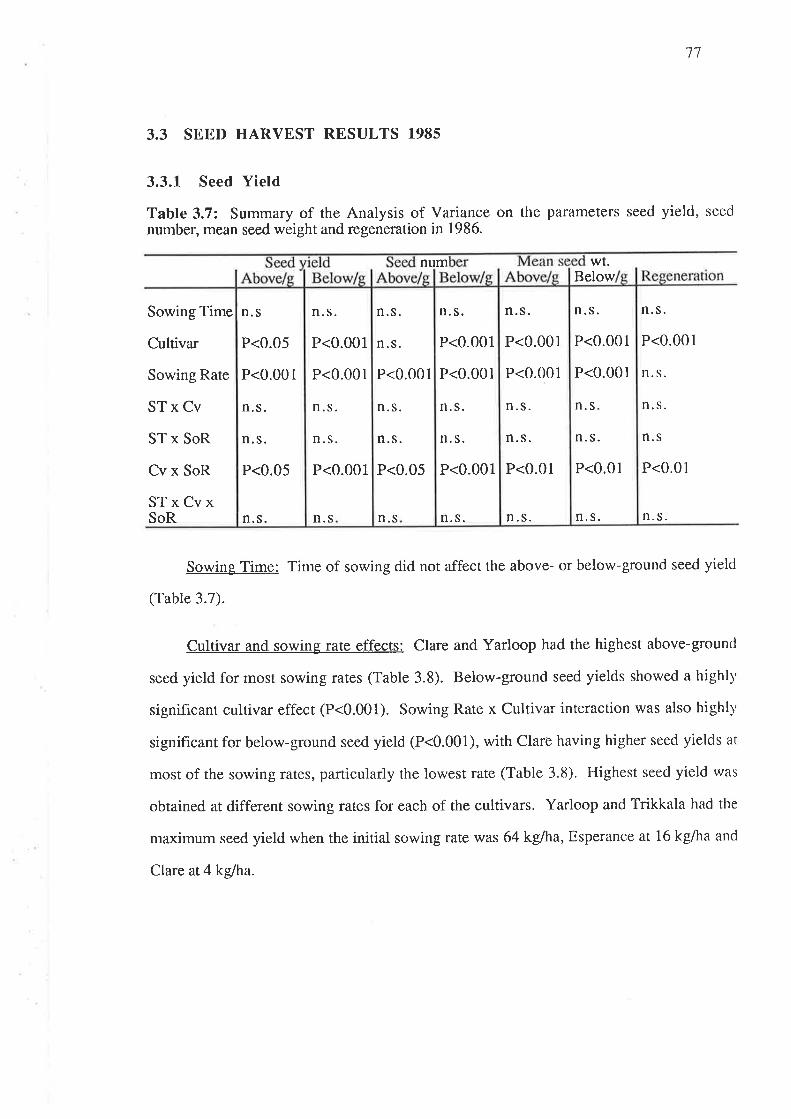
77
3.3 SEED HARVEST RESULTS 1985
3.3.1 Seed Yield
Tabte 3.7: Summary of the Analysis of Variance on the parameters seed yield, seed
number, mean seed weight and regeneration in 1986.
numBelow
wt.
Sowing Time
Cultivar
Sowing Rate
STxCv
ST x SoR
Cv x SoR
STxCvxSoR
n. s.
P<0.001
n. s.
n. s.
n.s
P<0.01
n. s.
Sowing Time: Time of sowing did not affect the above- or below-ground seed yield
(Table 3.7).
Cultivar and sowing rate effects: Clare and Yarloop had the highest above-ground
seed yield for most sowing rates (Table 3.8). Below-ground seed yields showed a highll'
significant cultivar effect (P<0.001). Sowing Rate x Cultivar interaction was also highll'
significant for below-ground seed yield (P<0.001), with Clare having higher seed yields at
most of the sowing rates, particularly the lowest rate (Table 3.8). Highest seed yield was
obtained at different sowing rates for each of the cultivars. Yarloop and Trikkala had the
maximum seed yield when the initial sowing rate was 64kg/ha, Esperance at 16 kglha ancl
Clare at4kglha.
n. s.
P<0.001
P<0.001
n. s.
n. s.
P<0.001
n.s
n.s
P<0.05
P<0.001
n.s.
n.s.
P<0.05
n.s.
n. s.
P<0.001
P<0.001
n. s.
n. s.
P<0.001
n. s.
n.s.
n.s.
P<0.001
n. s.
n.s.
P<0.05
n.s
n. s.
P<0.001
P<0.001
n. s.
n. s.
P<0.01
n. s.
n.s.
P<0.001
P<0.001
n.s.
n.s.
P<0.01
n. s.
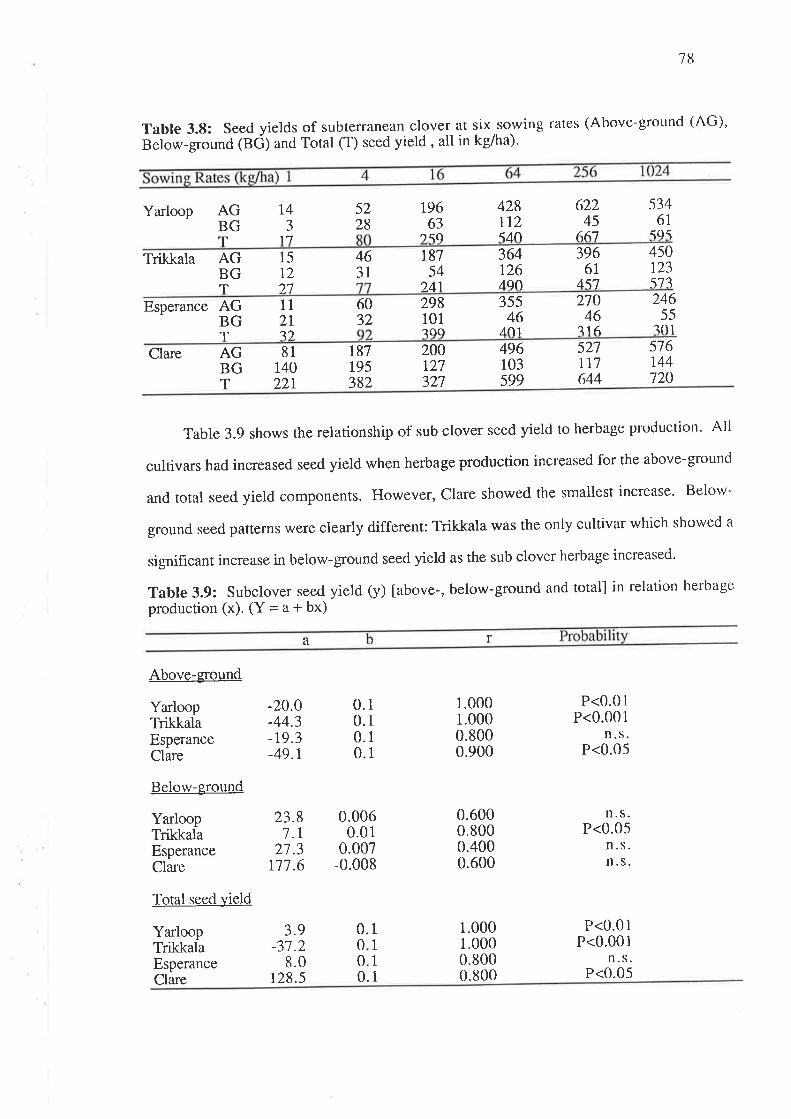
78
Table 3.tl: Seed yields of subterranean clover at six sowing rates (Above-ground (AG)'
Below-ground (BG) and Total (T) seed yield , all in kg/ha)'
Yarloop AGBG
t4J
17
5228
19663
)59
428tt2s40
62245
66',7
5346l
595TTrikkala AG
BG15T2)'7
4631
187 364126490
39661
457
450123573
54T 241
Esperance AGBG
112t?)
6032
298101?qq
35546
40.1
27046
?16
24655
?o1TClare AG
BGT
81140221
187195382
200tzl327
496103599
527ttl644
576t44720
Table 3.9 shows the relationship of sub clover seed yield to herbage production- All
cultivars had increased seed yield when herbage production increased for the above-ground
and total seed yield components. However, Clare showed the smallest increase' Below-
ground seed patterns were clearly different: Trikkala was the only cultivar which showed a
significant increase in below-ground seed yield as the sub clover herbage increased'
Table 3.9: Subclover seed yield (y) [above-, below-ground and total] in relation herbage
production (x). (Y = a + bx)
Above-ground
a r
YarloopTrikkalaEsperanceClare
Below-ground
EsperanceClare
Total seed yield
-20.0-44.3-r9.3-49.7
23.81.1
21.3r77.6
0.0060.01
0.007-0.008
1.0001.0000.8000.900
0.6000.8000.4000.600
P<0.01P<0.001
n. s.P<0.05
n. s.P<0.05
n. s.n. s.
P<0.01P<0.001
n.s.P<0.0-5
0.0.0.0.
000
1
1
1
1
YarloopTrikkala
YarloopTrikkalaEsperanceClare
3.9-37.2
8.0
1
1
1
000000800
1
1
0128.s 0.1 0.800
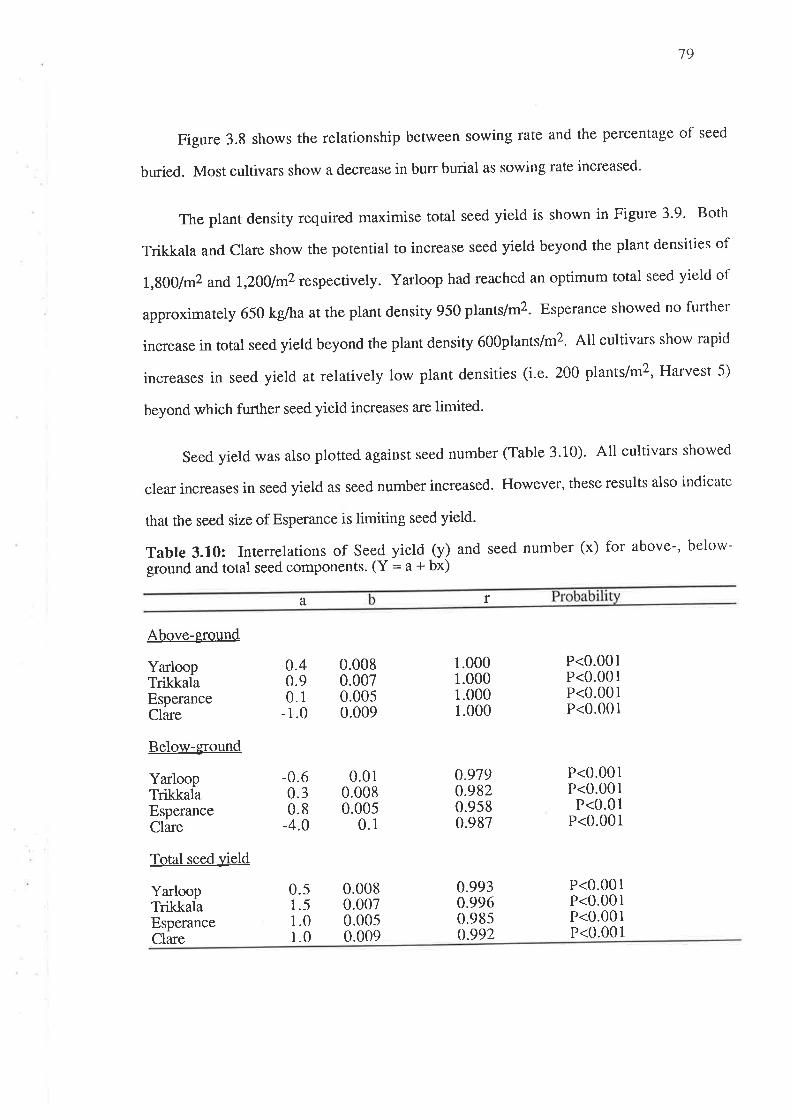
79
Figure 3.8 shows the relationship between sowing rate and the percentage of seed
buried. Most cultivars show a decrease in burr burial as sowing rate increased.
The plant density required maximise total seed yield is shown in Figure 3-9. Both
Trikkala and Clare show the porential to increase seed yield beyond the plant densities of
1,g00/m2 and 1,200/m2 respectively. Yarloop had reached an optimum total seed yield of
approximatety 650 kglhaat the plant density 950 plants/m2. Esperance showed no ft¡rther
increase in total seed yield beyond the plant density 600plants/nr2. Rtl cultivars show rapid
increases in seed yield at relatively low plant densities (i.e. 200 plants/m2, Harvest 5)
beyond which funher seed yield increases are limited'
seed yield was also plotted against seed number (Table 3.10). All cultivars showed
clear increases in seed yield as seed number increased. However, these results also indicate
that the seed size of Esperance is limiting seed yield.
Table 3.10: Interrelations of Seed yield (y) and seed number (x) for above-' below-
ground and total seed components. (Y : a + bx)
a
Above-eround
r
0.40.90.1
-1.0
YarloopTrikkala
-0.60.30.8
-4.0
EsperanceClare
Below-g¡ound
YarloopTrikkalaEsperanceClare
Total seed ]¡ield
P<0.001P<0.001
P<0.01P<0.001
0.0080.0070.0050.009
0.010.0080.005
0.1
1.0001.0001.0001.000
P<0.001P<0.001P<0.001P<0.001
0.9190.9820.9580.987
YarloopTrikkalaEsperanceClare
0.0080.0070.0050.009
0.9930.9960.9850.992
P<0.001P<0.001P<0.001P<0.001
0.51.51.01.0
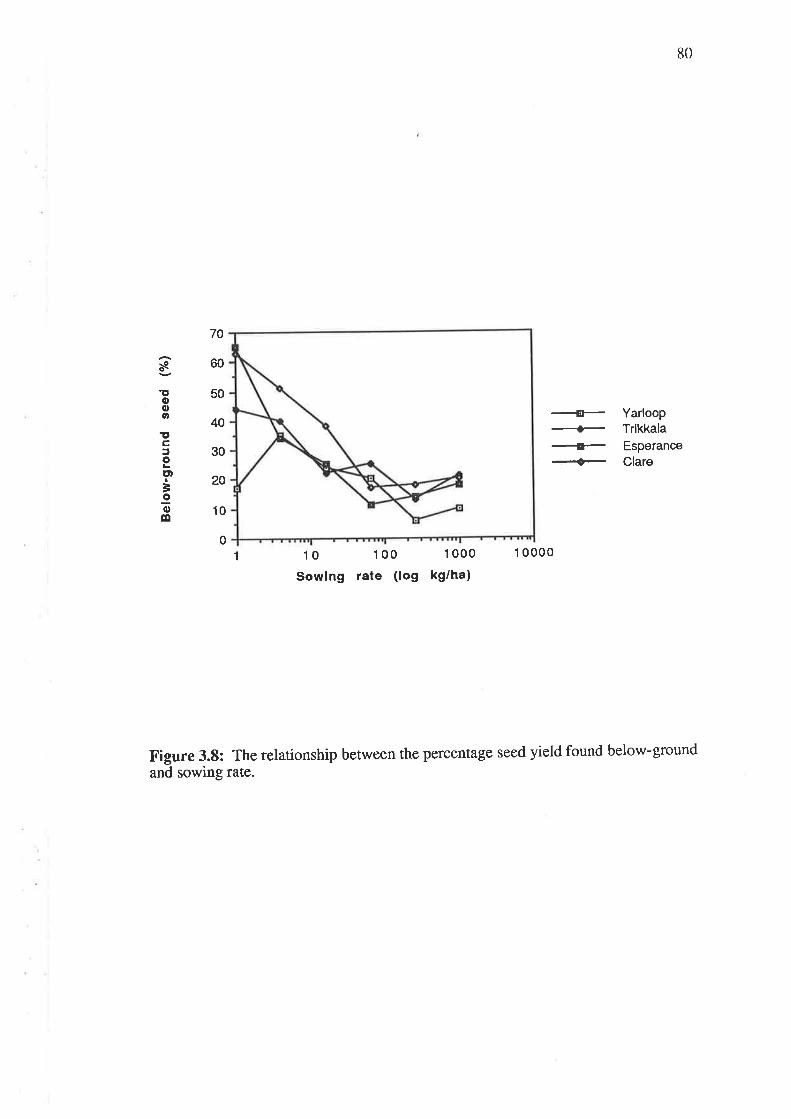
80
*Îtooo
!Ê,ãot'¡ìorlo
70
60
50
40
30
20
10
0
-_l-+
-F-+
YarloopTrlkkalaEsperanceClare
1 10 100 1000
Sowlng rate (log kg/ha)
1 0000
Figure 3.8: The relationship between the percentage seed yield found below-ground
and sowing rate.
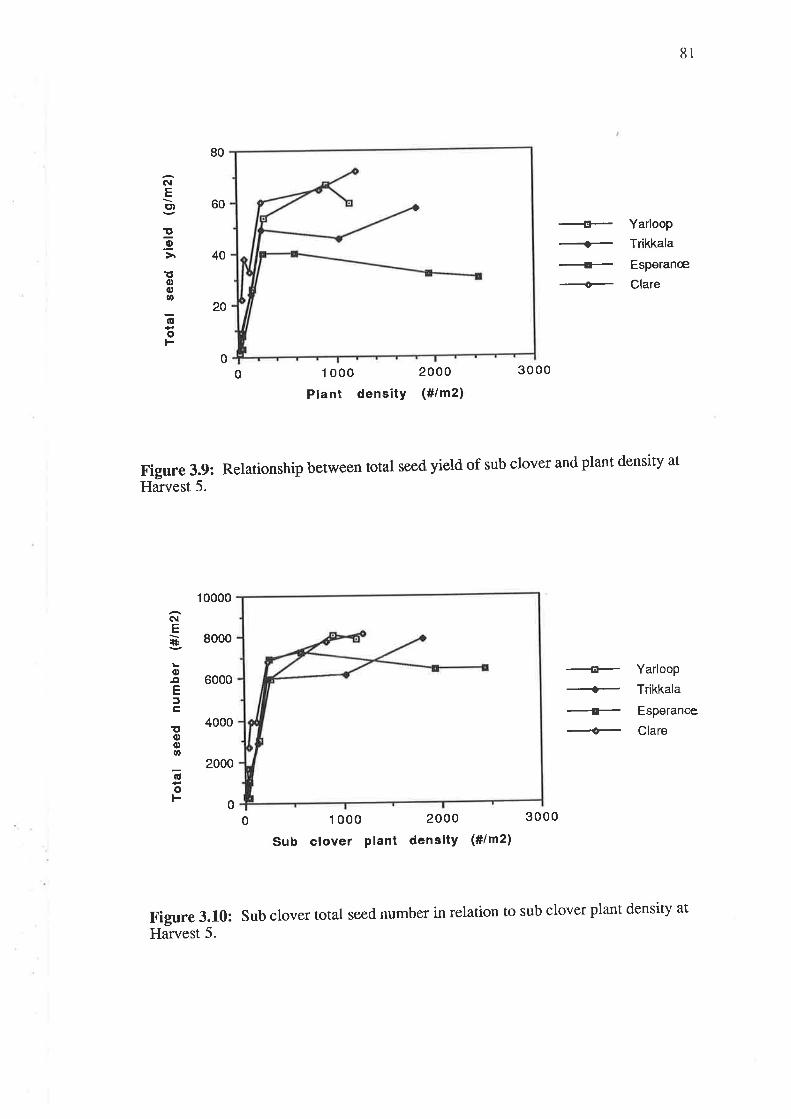
(\¡Eot
It3
ìoooo
ro
80
60
40
20
4P+-++
tìl
Yarloop
Trikkala
Esperanæ
Clare
Yarloop
Trikkala
Esperance
Clare
00 1 000
Plant densitY
2000(#tm2l
3000
3000
Figure 3.9: Relationship between total seed yield of sub clover and plant density at
Harvest 5.
8000
1 0000
NE!*
o¡tEfc
T'oo!,
Gol-
6000
4000
2000
#l-.*#+
00 1 000
Sub clover Plant
2000
dcnslty (#/m2)
Figure 3.10: Sub clover total seed number in relation to sub clover plant density at
Harvest 5.
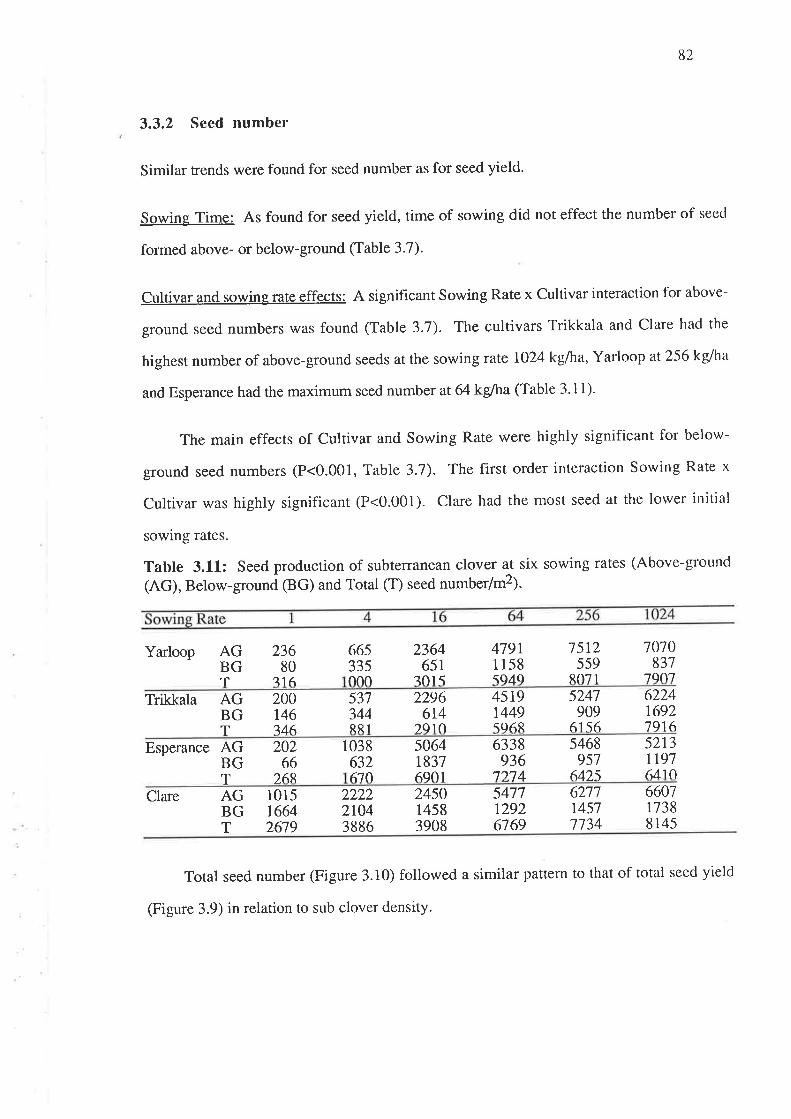
Í12
3.3.2 Seed number
Similar trends were found for seed number as for seed yield.
Sowing Time: As found for seed yield, time of sowing did not effect the number of seed
formed above- or below-ground (Table 3.7).
Cultivar and sowing rate effects: A significant Sowing Rate x Cultivar interaction for above-
ground seed numbers was found (Table 3.7). The cultivars Trikkala and Clare had the
highest number of above-ground seeds at the sowing rate 1O24 kg/ha, Yarloop at256 kg/ha
and Esperance had the maximum seed number at 64 kglha (Table 3.11).
The main effects of Cultivar and Sowing Rate were highly significant for below-
ground seed numbers (P<0.001, Table 3.7). The first order interaction Sowing Rate x
Cultivar was highly significant (P<0.001). Clare had the n'rost seed at the lower initial
sowing rates.
Table 3.11: Seed production of subterranean clover at six sowing rates (Above-ground
(AG), Below-groun¿ (BC) and Total (T) seed number/m2).
Yarloop AGBGT
23680
?16
66s335ooo
2364651
?o1 5
47911 158sq4q
7 512559
RO71
1070837
'7go'7
Trikkala AGBGT
200r46746
537344RRl
2296614
2.910
4519r449sq6R
5247909
61s6
6224r6927916
AGBGT
Esperance 20266
268
1038632
506418376q01
6338936
'7).74
5468951
642s
5213tt9764106'70
Clare AGBGT
1015r6642679
22222r043886
245014583908
5477r2926769
6211r4571734
660717388145
Total seed number (Figure 3.10) followed a similar patterrì to that of total seed yield
(Figure 3.9) in relation to sub clover density.
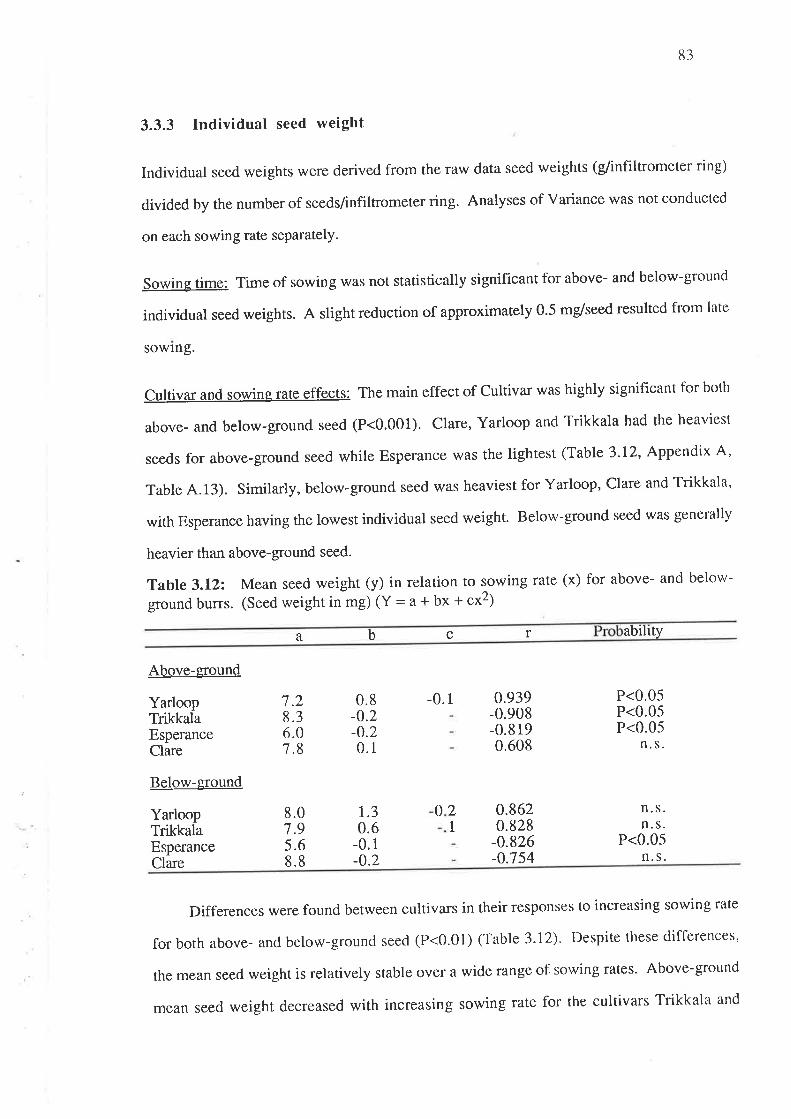
tì3
3.3.3 Individual seed weight
Individual seed weighrs v/ere derived from the raw data seed weights (g/infiltrometer ring)
divided by the number of seedsÂnfiltrometer ring. Analyses of Variance was not conducted
on each sowing rate separately.
Sowing time: Time of sowing was not statistically significant for above- and below-ground
individual seed weights. A slight reduction of approximately 0.5 mg/seed resulted from late
sowlng.
Cultivar and sowing rate effects: The main effect of Cultivar was highly significant for both
aþove- and below-ground seed (P<0.001). Clare, Yarloop ancl Trikkala had the heaviest
seeds for above-ground seed while Esperance was the lightest (Table 3'12' Appendix A'
Table 4.13). Similarly, below-ground seed was heaviest for Yarloop, Clare and Trikkala'
with Esperance having the lowest individual seed weight. Below-ground seed was generally
heavier than above-ground seed.
Tabte 3.12: Mean seed weight (y) in relation to sowing rate (x) for above- and below-
ground burrs. (Seed weight in mg) (Y = a + bx + cx2)
abilityrcba
YarloopTrikkala
Above-grouncl
EsperanceClare
Below-ground
.2
.3
.0
.8
7867
0.8-0.2-0.20.1
-0.1 0.939-0.908-0.8190.608
P<0.05P<0.05P<0.05
n. s.
n. s.n. s.
P<0.05n. s.
YarloopTrikkalaEsperanceClare
021
8.07.95.68.8
1.30.6
-0.1-0.2
0.8620.828-0.826-o.154
Differences were found between cultivars in their tesponses to increasing sowing rate
for both above- and below-ground seed (P<0.01) (Table 3.12). Despite these differences'
the mean seed weight is relatively stable over a wide range of sowing rates. Above-ground
mean seed weight decreased with increasing sowing rate for the cultivars Trikkala and
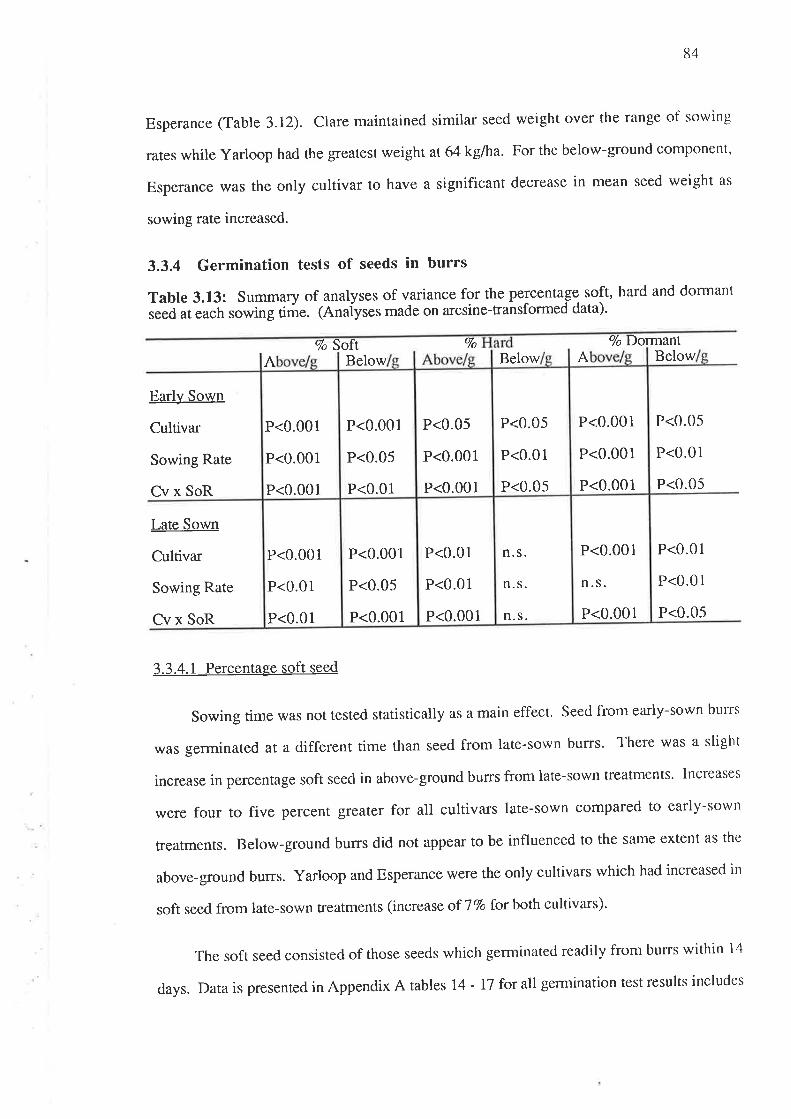
84
Esperance (Table 3.12). Clare maintained similar seed weight over the range of sowing
rates while yarloop had the greatest weight at 64kglha. For the below-ground component,
Esperance was the only cultivar to have a significant decrease in mean seed weight as
sowing rate increased.
3.3.4 Germination tests of seeds in burrs
Tabte 3.13: Summary of analyses of variance for the percentage soft, hard and dormant
seø at "uctt
sowing time. (AnaÍyses made on arcsine-transformed data)'
Vo Soft Voo/oDormanf
A Below Below A Below
P<0.05
P<0.0i
P<0.05
P<0.01
P<0.01
P<0.05
Earlv Sown
Cultivar
Sowing Rate
Cv x SoR
Late Sown
Cultivar
Sowing Rate
Cv x SoR
3.3.4.1 Percentage soft seed
Sowing time was not tested statistically as a main effect. Seed fronr early-sown burrs
was germinated at a different time than seed from late-sown burrs. There was a slight
increase in percentage soft seed in above-ground burrs from late-sown treatments. Increases
were four to five percent greater for all cultivars late-sown compared to early-sown
treatments. Below-gtound burrs did not appear to be influenccd to the same extent as the
above-ground burrs. yarloop and Esperance were the only cultivars which had increased in
soft seed from late-sown ffeatments (increase of 77o for both cultivars)'
The soft seed consisted of those seeds which germinated readily from burrs within l4
days. Data is presented in Appendix A tables 14 - 17 for all gemlination test results includes
P<0.001
P<0.01
P<0.01
P<0.001
P<0.05
P<0.001
P<0.01
P<0.01
P<0.001 n. s.
n. s.
n. s. P<0.001
n. s.
P<0.001
P<0.001
P<0.001
P<0.001
P<0.001
P<0.05
P<0.01
P<0.05
P<0.001
P<0.001
P<0.05
P<0.01
P<0.05
P<0.001
P<0.001
P<0.001
8-5
hard (impermeable) and dornrant seed (inrbibed but did not germinate). All gemlination
percentage results were transformed to arcsine for analyses of variance. However, all data
in the text, and tables in the Appcndices have the natural values presented.
Sowing time: Both above- and below-ground data on gemrination of seed in burrs were
analysed separately for each sowing time. Above-ground burrs from late-sown treatnìents
had a higher soft seed percentage. For early-sown treatments the order of lowest soft seed
to highest soft seed was as follows, Yarloop (4.2), Trikkala (8.8), Esperance (12'6) and
Clare (21.S). This orderremained the same for the late-sown treatments (8.8, 15.4, 18.3
and 27 .6 respectively) (Appendix A, Table 4.17). Figure 3.1 1 illustrates the relationship
betwccn soft seed, hnrd seed and dormant seed. For early- or late.-sown ffeatments it can be
seen that there are relatively more dormant seed below-ground. Conversely there was much
less hard seed below-ground.
In contrast, below-ground samples were not as strongly influenced by sowing time as
the above-ground samples. There were very few increases in soft seed with burrs from late-
sown ffeatments. For both Yarloop and Esperance there was an increase in soft seed with
late-sown treatments.
Cultivar and sowing rate effects: As mentioned earlier, Clare had the highest overall soft
seed from the above-ground buns (P<0.001) (AppendixA, Table 4.14). This is in complete
contrast to below-ground burrs, when Clare had one of the lowest soft seed percentages'
Also in complete conuast Yarloop seed from burrs were nore readily germinable if thel'
were from below-ground samPles.
Sowing Rate x Cultivar interactions were mostly highly significant (P<0.001)'
Despite the variation in the results (Appendix 4.14), it does show that cultivars have a slight
decrease in soft seed percentage with increasing sowing rate for above-ground samples'
Below-ground results were also variable. For early-sown treatments there is a gradtral
decrease in soft seed percentage as sowing rate increases for nrost cultivars.
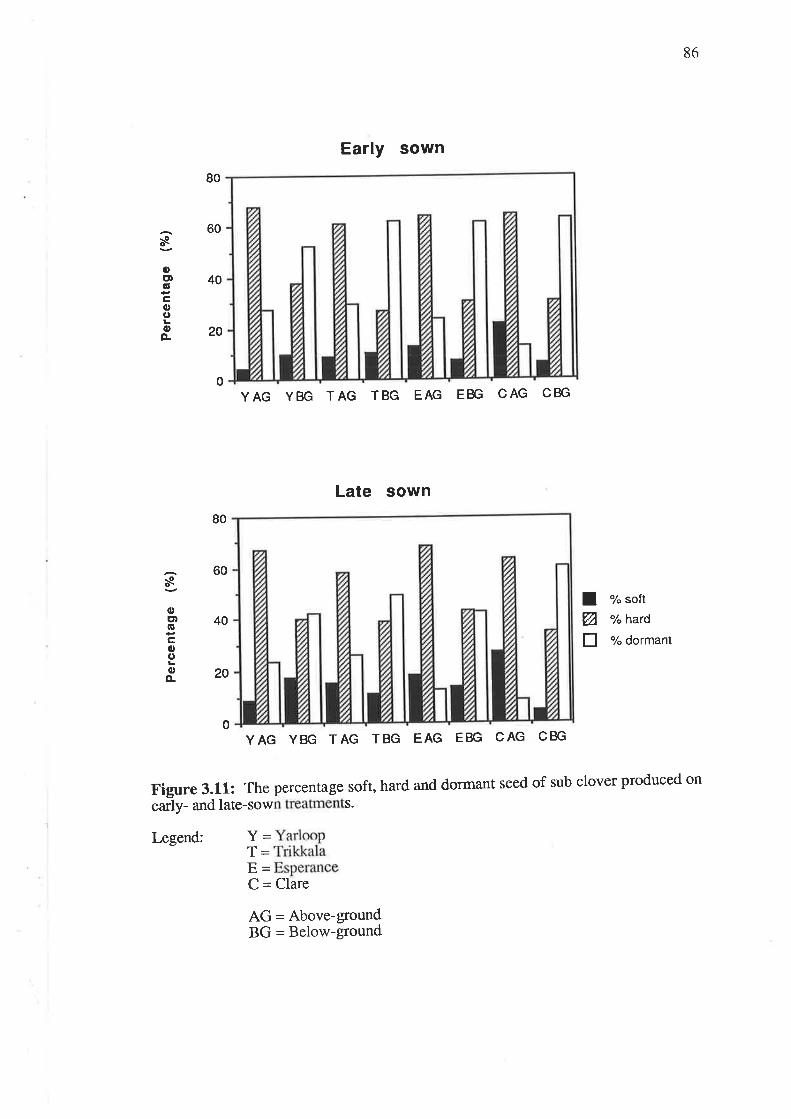
86
Early sown
YAG YBG TAG TBG EAG EBG CAG CBG
Late sown
YAG YBG TAG TBG EAG EBG CAG CBG
80
60
40
20
s0,ct¡qt
Êo(,oÀ
0
I 7" soft
ø l"hard
fl 7o dormant
80
60
40
20
Ioctt6coooo.
0
percentage soft, hard and dormant seed of sub clover produced onFigure 3.11: Theearly- and late-sow s.
Clare
Y_T_þ=Ç=
Legend:
AG = Above-groundBG = Below-ground
87
3.3.4.2 Percentage hard seed
The hard seed was defined as seed which did not imbibe water within 14 days during the
germination test.
Sowing time: Time of sowing did not affect the percentage hard seed found in above-
ground burrs. The results for above-ground burrs from early-sown treatments were not
consistent. However, below-ground burrs were influenced by the time of sowing, in
particular the cultivars Trikkala and Esperance. Both cultivars had a greater percentage of
hard seed below-ground with later-sowing (Figure 3.11).
Cultivar and sowing rate effects: Differences between cultivars were not great for early-
sown treatments above-ground (P<0.05) (Figure 3.11). Late-sown treatments exhibited
more pronounced differences between cultivars (P<0.01) (Figure 3.11). Generally, Yarloop
had the highest percentåges of hard seed for above-ground burrs.
Differences between cultivars were only evident on early-sown plots for below-ground
buns (Fig 3.11). Yarloop had the highest level of hard seed. Interestingly the overaìl
percentage ha¡d seed in below-ground burrs was approximately 20Vo less than those for the
above-ground burrs. This appears to be related to the level of dormant seed (See next
section 3.3.4.3).
The Cultivar x Sowing Rate interaction for percentage hard-seed was highty signíficant at
both sowing rimes for above-ground burrs (P<0.001) (Appendix 4.15). Results show that
Yarloop and Trikkala behaved similarly. Below-ground interactions for Cultivar x Sowing
Rate were only significant for early-sown treatments (P<0.05), Clare was the only cultivar
which had decreased hard seed percentage aS sowing rate increased.

tì tì
3.3.4.3 Percentage dormant seed
Dormant seeds were defined as those seeds which imbibed water but failed to
germinate within 14 days. Below-ground burrs tended to have a much higher propofiion of
dormant seed (approx.547o) than above-ground burrs (approx.2O7o).
Sowing time: There was a slight reduction in dormant seed in above-ground burrs
with late sowing (Fig. 3.11) in Trikkala, Clare and Yarloop, but almost a 507o reduction in
Esperance. A similar reduction in the proportion of dormant seed was found in below-
ground burrs, with late-sown treatments-
Cultivar and sowing rate effects: Differences between cultivars were highly signif,rcant
for above-ground burrs (P<0.001). Treatments at both sowing times showed Clare to have
the least dormant seeds above-ground, while both Yarloop and Trikkala had the highest
(Figure 3.11). Cultivar differences were not as pronounced for the below-gtound samples
(p<0.05 and P<0.01 for early- and late-sown treatments respectively). Yarloop has less
dormant seed than the other cultivars for early sown plots. Clare had the highest proportion
dormant seed for late sown plots, while both Yarloop and Esperance had the lowest
proportion dormant seed.
No clear trends can be seen for the above-ground burrs in relation to the interastion
Cultivar x Sowing Rate. Each cultivar behaved differently (Appendix 4.16). No interaction
was clear for the below-ground burrs.
3.3.5 Natural regeneration of sub clover on experiment site
sowing Time: Time of sowing in 1985 had no effect on regeneration in 1986.
Cultivar and sowing rate effects: There was no significant effect of Cultivar on seedling
regeneration at the sowing rate I kg/ha (Table 3.14). Differences between cultiva¡s occurred
at 4 kglha where Clare and Esperance had the most seedlings. Esperance had the highest
population of seedlings at 16 kg/ha, but was statistically similar to Clare- The sowing rates
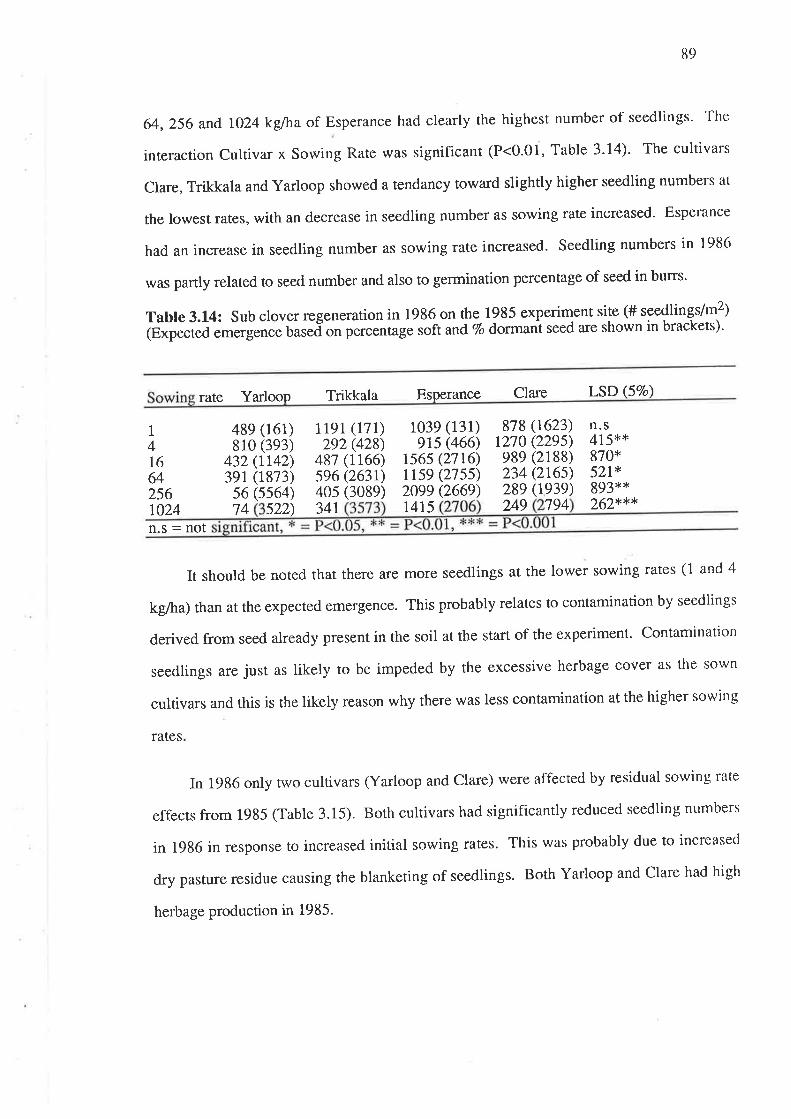
89
64,256 and lO24 kg/ha of Esperance had clearly the highest number of seedlings. The
interaction Cultivar x Sowing Rate was significant (P<0'01, Table 3'14)' The cultivars
Clare, Trikkala and Yarloop showed a tendancy toward slightly higher seedling numbers at
the lowest rates, with an decrease in seedling number as sowing rate increased. Esperance
had an increase in seedling number as sowing rate increased. Seedling numbers in 1986
was paftly related to seed number and also to germination percentage of seed in burrs'
Table 3.14: Sub clover regenerarion in 1986 on the 1985 experiment site (# seedlingVm2)
@xpected emergence based on percentage soft and Vo dormaitseed are shown in brackets)'
rate Yarloop Trikkala Esperance Clare LSD (57o)
I416
489 (161)810 (3e3)
432 (rr42)391 (1873)
56 (s564)
1191 (171)292 (428)
487 (1166)se6 (263r)405 (3089)
103e (131)els (466)
rs6s (2716)rt59 (275s)2099 (2669)
878 (1623)1270 (229s)989 (2188)234 (2r6s)28e (re3e)
n.s415**870*521*893*x262***
64256t024 74 s22) 34r 141,5 249 794
n.s = not
It should be noted that there are more seedlings at the lower sowing rates (1 and 4
kgiha) than at the expected emergence. This probably relates to contamination by seedlings
derived from seed already present in the soil at the start of the experiment. Contamination
seedlings are just as likely to be impeded by the excessive herbage cover as the sown
cultivars and this is the likely reason why there was less contamination at the higher sowing
rates
In 1986 only two cultivars (Yarloop and Clare) were affected by residual sowing rate
effects from 1985 (Table 3.15). Both cultivars had significantly reduced seedling numbers
in 1986 in response to increased initial sowing rates. This was probably due to incrcased
dry pasture residue causing the blanketing of seedlings. Both Yarloop and Clare had high
herbage production in 1985.
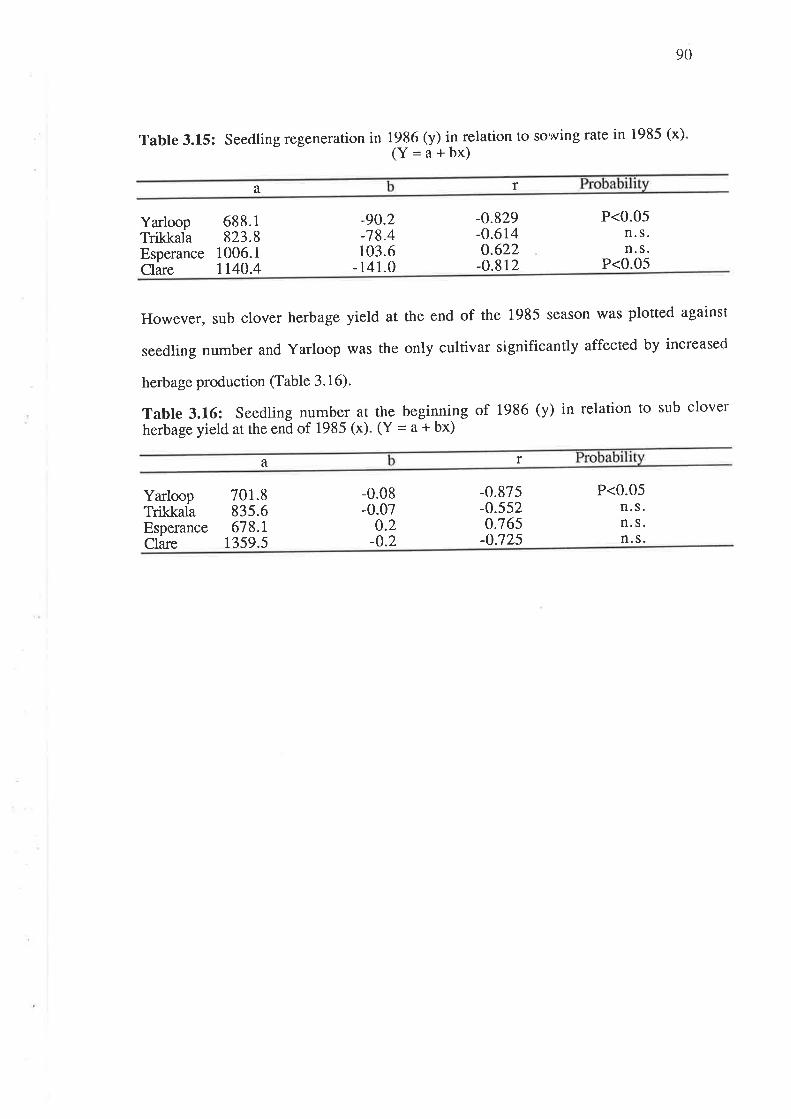
90
Table 3.15: Seedling regeneration t" t}iglin relation to so'rving rate in t985 (x)
a f
Yarloop 688.1Trikkala 823.8Esperance 1006.1Clare 1140.4
-90.2-78.4103.6
-141.0
-o.829-o.614o.622-o.8r2
P<0.05n. s.n. s.
P<0.05
However, sub clover herbage yield at the end of the 1985 season was plotted against
seedling number and Yarloop was the only cultivar significantly affected by increased
herbage production (Table 3.16).
Tabte 3.16: Seedling number at the beginning of 1986 (y) in relation to sub clover
herbage yield at the end of 1985 (x). (Y = a + bx)
a
YarloopTrikkala
701.883s.6678.r
1359.5
-0.08-0.07
0.2-0.2
-0.875-o.5520.765-0.725
P<0.05n. s.n. s.n. s.
EsperanceClare
r
9l
3.4 Discussion and conclusions
3.4.1 Herbage harvest results
plant density: Esperance had clearly the highest plant numbers which were groatly
reduced later in the season. No doubt there was a high level of intra-plant competition
between the numerous but small plants of Esperance and dramatic self-thinning resulted'
At high plant densities mutual shading is common and often results in self-thinning
(lffestoby and Howelt 1982). Competition for light and moisture may have been strong'
In comparison, the plant d.ensity of the cultivars Yarloop, Trikkala and Clare was not
large enough to cattse the same magnitude of reduction as found for Esperance at the
higher sowing rates. Competition which results in dominance and suppression occur in
all plant communities (stern 1965): competition in high-density Esperance plots was
high. Donald (1951) found. that the higher the density the earlier the growth stage at
which competition begins. This appears to have happened to Esperance' Yates (1961)
also found that as density increased differences in herbage production between strains are
reduced. To some extent this has occurred, especially at the high sowing rate of 1024
kg/ha late in the season. Esperance was no longer the cultivar with signif,rcantly more
plants, Trikkala was also statistically similar. In some cases there was a rise in plant
numbers beyond Harvest 1, this could be due to late emergence of seedlings increasing
the plant density count, or the initial plant counts may have been inadequate' Another
explanation could be delayed germination due to reduced domrancy and breakdown of
hard-seededness.
Sub clover herbage yield: The two early-maturing cultivars (Yarloop and Trikkala)
were the least affected by late sowing, while the late-maturing cttltivars, (Esperance and
Clare) were most affected as these require a longer growing period to reach their
maximum productive potential. Therefore, late-sowing resulted in very few cultivar
differences compared to early-sown treatments. For example, Clare had the highest yield
for early-sown treatments but was r.tot much higher in yield than the other cultivars wherl
92
sown later. These results stlpport those of Dea¡ and Loveland (1984) who also found
that cultivar differences were reduced with later sowing. In this experiment it appears
that the three week interval between sowing times was sufficient to show this effect'
However, late sowing did not limit the production of Esperance and Clare late in the
season. This indicates that favourable seasonal conditions were of sufficient length for
the later-maturing cultivars. The sowing dates used are typical of the environment and
the seasonal conditions for that year.
The high yield of the cultivar Esperance early in the season can be attributed to
many small plants. Early high yield of the cultivar Clare can be attributed to large plant
size even though the density was lower than Esperance. However, Esperance was the
only cultivar which had reached a plateau in herbage production at the high sowing rate'
The plateau in yield for Esperance can be attributed to the great loss of plants. Individual
plant weights of Esperance at that stage of growth were not sufficient to compensate for
loss of plants. Overall, the highest sub clover production at the end of the season was
8628 kg DM/ha for the cultivar Yarloop sown at lO24 kgpure germinating seed/ha'
Lawson and Rossiter (1954) found no differences in yield of sub clover cultivars
provided these were Sown at equivalent weights of pure germinating seed per unit area'
Similar results were obtained by de Koning (1934) and de Koning and Carter (1987a)'
However, the results from the 1985 experiment ale at variance, possibly due to weed
competition earlY in the season.
The lower densites of sub clover (1, 4, and 16 kglha) in the small-plot experiment
1985 never reached the same sub clover yields as the higher rates (64, 256 and 1024
kg/ha). No doubt this reflected the substantial weed invasion which suppressed the low-
density sub clover. Under favourable (weed-free) conditions low plant densities can
attain similar yield to higher plant densities (Davidson and Donald 1958, Adem 1977,
Prioul and Silsbuty 1977). However, the two highest rates of sub clover' reached
similar yields at the end of the season.
93
V/eed yield: Cultivars exhibited various levels of competitiveness with weecls,
although this depended on the rate of sowing (i.e. sub clover plant density) and the stage
in the growing season. No cultivar was able to suppress weed growth at the two lowest
sowing rates. The ability ro compete with weeds is affected by the growth habits of the
cultivar and the weeds. For example, Scott (197I) found plots with tall cultivars (Clare
and yarloop) had significantly fewer weeds than more prostrate cultivars (Geraldton' Mt.
Barker and Tallarook). In this 1985 experiment, the tall cultivars (yarloop, Trikkala and
Clare) were the most Successful competing with weeds. The more numerous and smaller
prostrate plants of Esperance are not as competitive as the fewer, larger and taller plants
of Yarloop, Trikkala and Clare. Taller and fewer plants are probably more effective in
reducing the weed composition by shading some of the weeds. This situation is not
dissimilar to that described by Burch and Andrews (1976) who found the fewer, taller
Yarloop plants were able to compete successfully with the more numerous but prostrate
plants of Larisa. However, weed numbers were not counted in the 1985 experiment, but
the canopy height of the cultivars Trikkala, Clare and Yarloop were similar to or higher
than the weeds in the plots, while Esperance was shorter.
All cultivars had fewer weeds as sowing rate increased. Greater sub clover plant
populations and increased erectnoss of the swards contributed to the lessened level of
weeds. Morphological changes to sub clover swards as with increased density (as
described by Yates 1961) would contribute to some extent to weed control'
Morphological changes such as sward height may have contributed to some weed control
in Esperance plots at the higher sowing rates. However, when Esperance plants died at
the highest rate, the gaps remaining were quickly utilized by weeds and the remaining
Esperance plants were insufficient to compete with the weeds. Clare swards had beconle
very tall at the highest sowing rates shading weeds effectively, therefore the ratio of
weeds to clover was lowest. However, herbage production of a cultivar was also
important for weed control. Reductions in herbage production of the cultivar Esperance
was due to a loss of plants which probably resulted in greater weed invasiotl.

94
3.4.2 Seed harvest results
Seed yield: Some caution is required when interpreting results of above- and below-
ground seed yields from only one season, because the extent of burr burial depends on
the interaction between cultivar, environment and condition of the soil surface (Yates
1953). In addition, the density of sub clover plants has a very important influence on
burr burial. Donald (1954) also stressed that the relationship between density and seed
production depended on season.
The big loss of plants of Esperance at the high sowing rates has affected the above-
ground seed yields. The other cultivars had higher se.ed yields as sowing rate increased,
but this did not occur for Esperance which had no further increases beyond the sowing
rate 64kg/ha. Esperance had similar seed numbers to the other cultivars, but small seed
size limited seed yield. However, below-ground seed yield was very unresponsive to
sowing rate. Total seed yietd did not greatly increase above the plant density 200
plants/m2. Similarty, Donald (1954) found the intermediate rates of sowing sub clover to
be the most productive for seed yield (densities 269 and 1931 plants/m2). Donald's
highest density (18,510 plants/m2) was very similar to the level of Esperance plants at the
two higher sowing rates in the 1985 experiment. However, soed yield was not related to
sub clover herbage production for Donald's (1954) results. The cultivar used by Donald
was Mt. Barker which belongs to the subsp. subterraneum group as does Esperance
used in the 1985 experiment. Esperance was the only cultivar that did not show any
significant relationship between total seed yield and herbage production. Possibly both
cultivars behaved similarly because they belong to the same sub-species group' Other
cultivars representing a range of maturities from the subsp. subterraneørn would require
further density studies to test this assumption.
Bolland (1986) found that the seed yields of sub clover increased with increased
sowing rates, but declined as maturity grading of the cultivars increased. However,
decreases due to maturity grading were not found in the small-plot experinrent 1985.

95
Clare the latest-maturing cultivar used did not have decreased seed yield (Highest level of
total seed production 720kglha).
The stimulus for burr b¡rial appears to have decreased as sowing rate increased and
this affected all cultivars to some degree. These results are similar to those of Yates
(1961) who showed increased plant cover decreased the stimulus for burr burial due to
micro-envifonment changes to temperature and humidity. Nevertheless' one would
expect the burr burial to be relatively low at the low sowing rates in this experiment due
to the weed covef. However, weed-infested plots had a Sparse canopy Structure ìn
comparison to the high-density sub clover plots with dense, compact canopies'
Individual seed weight: The mean seed weight was greater in below-ground burrs
(7.58 mg) compared to above-ground burrs (7.36mg). This was true for all cultivars
except Esperance, which had similar seed weights for above- and below-ground seed'
Similarly, yates (1957) found rhat the strain Red Leaf had the lighter seed above-ground.
But the results from the 1985 Waite Institute experiment indicate that not all cultivars
behave the same way and the effect may be modified by plant density.
Decreases in seed weight as initial sowing rate increased were more pronounced for
above-ground seed. Esperance and Trikkala were the only cultivars to show this
response. Competition between plants within the swa¡ds as sowing rate increased would
account for part of this effect. Inter-plant competition may explain why Yarloop had
depressed mean seed weight at the higher sowing lates, but a combination of weed
competition and intra-plant competition may be the cause for low mean seed weights at
the lowest sowing rate. Donald (1954) found intra-plant competition occurring at the
lowesr and sparsest plant densities (12 to 79 plants/m2). The cultivar may determine the
extent of intra-plant competition effects on mean seed weight, since the other cultivars in
this experiment (i.e. Trikkala, Esperance and Clare) did not show signs of reduced mean
seed weight at the lower densities.
96
, Germination of seed in burrs: Increases in seed germination in burrs from late-
sown treatments may suggest that more readily-germinable seed was produced under the
shortened gfowing season. However, hard seed percentage did not change in response
to sowing time for above-ground burrs. Above- and below-ground, dormant seed
content was reduced in late sown treatments.
Clare was the only cultivar which had substantial decreases in the percentage soft
seed in below-ground burrs when compared to above-ground burrs, irrespective of
sowing time. Conversely, Yarloop had an increase in soft seed in below-ground burrs.
Germination results of Yarloop follow those found by Yates (1957) and Quinlivan and
Francis (Ig7l), whereby better germination and viabitity of seed was tbund below-
ground compared. to above-ground seed. However, Clare contrasts with these results:
thus any differences between above- and below-ground germination percentages may
also be dependant on the cultivar.
Commonly the hard seed percentage found below-ground was approximately half
that for the above-ground burrs, irrespective of cultivar or sowing rate effects. This
result conflicts with most research which has found that the highest proportion of hard
seed is found in below-ground burrs (Quinlivan and Francis 1971, Collins et al. 1976).
possibly the heavy soil texture at the Waite Institute may have influenced the amount of
dormant seed produced below-ground due to high moisture content' Such soil types
would retain more moisture than sandy textued soil types used by Quinilivan and Francis
(1971) and Collin s et al. (1976). Only below-ground burrs from early-sown treatments
hact significant differences between cultivars (P<0.05). Yarloop had the highest
percentage hard seed below-ground. Differences in hard seed percentages between
cultivars was not great for above-ground burrs (P<0.05), most cultivars having between
60 - 68 Vo hard seed irrespective of sowing rate-
The amount of loose seed was high in some samples which were wet-sieved and
this in part may account for reduced hard-seed levels in burrs. Another reason for a

97
lower percentage of hard seed below-ground could possibility be due to a high level of
microbial atrack on seed produced below-ground (Taylor 1984). This may cause some
reduction in percentage hard seed. A high level of microbial attack may have resulted
from the wet December 1985 (Table 3.0) and the warm temperatures. The December
rainfall was very simila¡ to normal June and July rainfall. This would have created ideal
conditions for soil-borne microbes, because the soil would remain relatively moist for a
longer time compared to the surface burrs and sub clover residues. Wet-sieving of
below-ground samples is not believed responsible, because samples were blotted
thoroughly with absorbent paper after washing and dried to prevent the imbibition of
seed. Checks were made on burrs in the oven to see if imbibition did occur, and showed
no imbibition.
Irrespective of sowing rate, there was variation between cultivars in the percentage
soft seed and dormant seed categories. For example, Clare had the highest soft seed
from above-ground burrs, conversely Clare had the lowest percentago dormant seed'
usually half that of the other cultivars. The situation was reversed for the below-ground
burrs; Clare had the lowest percentage soft seed and one of the highest dormant seed
contents. Cultivar differences in soft and dormant seed levels will influence subsequent
regeneration. A cultivar with high soft and dormant seed percentages will have high
levels of germinable seed at the break of the season. However, this could also mean
much seed will germinate with a'false break' to the season, resulting in the loss of seed
resources.
Regeneration of sub clover in the field: The number of seedlings was dependant
on both cultivar and the sowing rate, irrespective of sowing time' The highest level of
regeneration was obtained by the cultivar Esperance (2099 plants/m2 at the initial sowing
rate256kdha). Reed ¿r ¿/. (1985) found Esperance to be successful with regard to plant
density early in winter- The numerous but smaller seed of Esperance accounts for this
effect. yarloop, Trikkala and Clare progressively had fewer seedlings as initial sowing
rate increased. This is contrary to the actual numbers of seed produced per unit area
9tì
which showed an increase in seed number as sowing rate increased. The high sowing
rate cultivar plots of Trikkala, Clare and Yarloop were observed to have a gleater bulk of
dry sub clover residue on the surface than Esperance plots, therefore blanketing of
seedlings may have been more severe on those plots. The 'blanketing effect' can be a
serious problem of high density and/ or under-utilized swards in physically constraining
emergence of seedlings following summer rains or early-autumn rains (Carter 1954'
1987).
3.4.3 Conclusions: The results of this experiment have shown that the early-a
/ season herbage production of sub clover-based pasture is dependrdnt on seed size and
plant de.nsity. High plant density is essential for high early winter production. However,
this is partly dependant on the cultivar, for example Clare had less seedlings than
Esperance but still maintained good early production. Results clearly show that the
weight of pure germinating seed is important for early herbage production'
Maintaining high sub clover density in a pasture improves the ability of that pasture
to produce seed and to compete with weeds. Suppression of weeds depends on both the
sub clover plant density and the growth habit of the sub clover cultivar. This is especially
important when sub clover-based pastures are ungrazed. The results also indicate that a
pasture based on a more prostrate cultivar (e.g. Esperance) would require greater plant
numbers than a taller cultivar (e.g. Clare) in suppressing weeds under ungrazed
conditions. In practical terms it is normally better to have a lower yield from a pasture
with a high proportion of desirable sown species, rather than a higher total pasture yield
with a large proportion of weeds. Livestock production may be reduced if pasture
contains a high percentage of unpalatable weeds. Research has shown that even when
feed is limited early in the season sheep will avoid the most abundant species if these are
unpalatable weeds (Broom and Amold 1986). However, the 1985 experiment was not
grazedand the closest comparison which could be made to practical situations would be
pasture spelling early in the season to protect establishment or late in the season for
haymaking pracrices. Nevertheless, both practical situations require high quality pasture'

99
The results from this experirnent also show the relationship between herbage
production and seed yield. In general the cultivars which produced the most herbage also
had the highest seed yield. This was the trend for all cultivars except Clare which
produced the highest seed yield but had similar herbage production to some other
cultivars. In addition, both sub clover herbage and seed production increased as sowing
rate increased. A cultivar such as Esperance had no further increases in herbage
production when the sowing rate was high, seed yield followed the same pattern.
Sowing time effects have the most relevance in the year of establishment. Late-
maturity cultivars of sub clover should be sown as soon as practical so benefits of high
production (herbage and seed) can be achieved. In years of natural regeneration a late
start to the season will affect the later-maturing cultivars the most in terms of reduced
herbage and seed production.
High density swards which have not been grazed and have a large mass of dry
pasture residue usually suppress emergence of seedlings in the following season.
Therefore, it is important that some of the dry herbage cover is removed during the
summer months to ensure that seedlings can emerge freely. Results also indicate that the
smothering of emerging seedlings is influenced by the amount of dry pasture.
Management of pastures should aim for high herbage yield and seed yield. During
summer and autumn grazing it will be essential to remove some dry residue to avoid
suppression of emergence of seedlings by blanketing: however, sunxner-autumn grazing
musr be carefully monitored to avoid excessive depletion of seed (See Chapter 5). High
production of pure germinating seed is essential for high seedling regeneration, resulting
in good early herbage production of sub clover-based pastures.
100
4. GRAZING EXPERIMENT 1986 . L987
4.0 Introduction
Sub clover plant density and grazingpressure ale important components involved
in maximizing herbage and seed production and the potential performance of sub clover
cultivars has to be assessed under defoliation by the grazing ruminant animal" The soil-
plant-animal interactions are numerous and' very complex but this is no reason to avoid
reseafch into these important interactions. Very little is known about the response of
various clover species and cultivars under realistic grazing conditions. The following
quotation from Franc is et a].(1976) sums up Some of the problems' """ a need for more
study in grazing recovery in relation to cultivar differences....should be considered in
conjunction with winter growth because the two may in fact be antagonistic""rapid
growing types with leafy growth may not recover as well as other types and persist less
well in mixed swards". Many researchers have made reference to the lack of
understanding of population dynamics and ecology of pastures grazed by animals
(Rossiter 1966, Carter 1968, Carter 1977, Watkin and Clements 1978, Williams 1978'
Whalley 1980, Dunlop et at.1984' Christian 1987, Obst 1987)'
A small-sc ale grazingexperiment was described in which the importance of pasture
and/or grazingmanagement was revealed (de Koning and Carter 1987b). It is possible to
have a high-producing cultivar (e.g. Yarloop or Clale) but if mismanaged (e'g' under- or
over-stocked) density and herbage productivity may be reduced, and the benefits of high
herbage production may be nullified also seed production may also be reduced' The
experiment described in Chapter 3 demonstrated how under-utilised pastures with a large
bulk of dry pasture residues can reduce the subsequent regeneration' The reverse
situation can also occur: low-producing cultivars if managed wisely can produce
comparatively well (Brougham and Cosgrove 1985). Walton (1975) suggested that
sward density was very important when considering experiments which evaluated sub
clover genotypes for seed yield under defoliation. This lack of information on the overall

,;;;;;ìi;;;,;lOtnnn v
impact of grazing on sub clover provided the impetus to initiate further research on the
grazingmanagement of the cultivars that ,were ungrazed in the 1985 ,-u¡¡'-plot
experiment. This experiment described in Chapter 3 did show cultivar differences in
herbage and seed production and these differences varied with plant density. Therefore it
is important to esøblish whether these differences will occur under gtazed conditions.
A field experiment was established in 1986 to quantify the effects of three gtazing
pressures and two plant densities on the herbage and seed production of five cultivars of
sub clover and a mixture of these.

t02
4.1 Materials and Methods
Location and preparation of site: The grazing experiment was established on red-
brown earth soil on semi-improved old pasture (volunteer grasses-Loli'um spp' and
Vulpiaspp. -with some Bacchus Ma¡sh sub clover) at the Mortlock Experiment station
(M.E.S.), Mintaro, South Australia, approximately 85 km north of Adelaide' A fine seed
bed was prepared by scarification, then sprayed with non-selective herbicide (Roundup
@) before sowing.
Experimental design: Five cultivars were used, viz; Nungarin, Dalkeith, Trikkala'
Junee and clare in orrler of maturity. These cultivars represented a range suited to the
clare-Mintaro region. The mean seed weights of the cultivars were 6.0, J-1,9'6,7'O,
and !2.5mg respectively and the germination percentages of the same commercial seed
was 99, gg,95,86, and 91 respectively. A mixture of all five cultivars, (20Vo by weight
of each) was also included, because complex mixtures comprising several cultivars are
considered more stable in the long term over several seasons and have been advocated by
pasture researchers (eg. Carter and V/igg 1963; Carter 1983)' Thus, there were six
d.ifferent sub clover swards (i.e. 5 cultivars and a mixture of all five) each at two
densities.
Two sowing rates, Low = lQkg/ha and High = 2OO kg/ha were used' These two
rates, although nor exactly the same as used for the 1985 small-plot waite Insititute
experiment are still within the range of rates which showed contrasting effects and are
representative of the amount of seed commonly found in the field. A low rate (10 kg/ha)
typifies new-sown pastures while the high rate (200 kg/ha) is representative of many
regeneratin g Pastures.
The swards were continuously grazedwith Merino wethers at three stocking rates,
viz: Low = 7 sheep/ha; Medium = 11 sheep/ha; High: 15 sheeplha' The experimenterl
design was therefore a split plot design with Stocking Rate as the main plots and Sowing
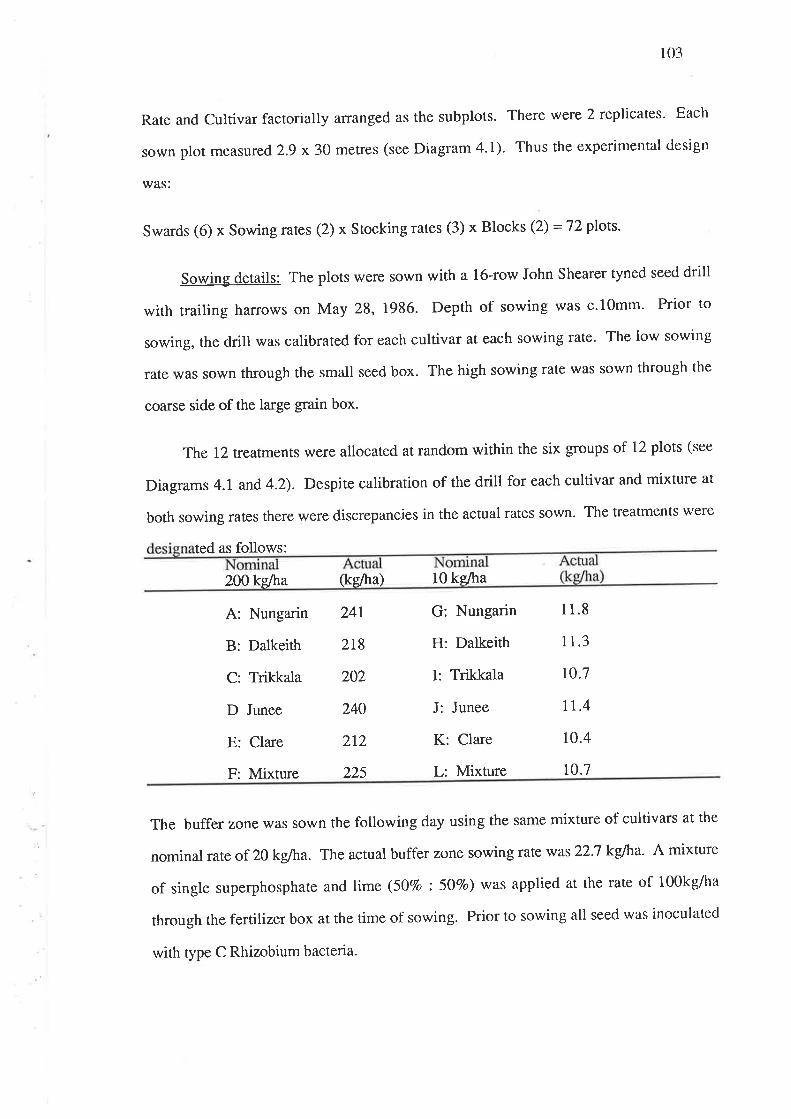
103
Rate and Cultivar factorially arranged as the subplots. There wete2 replicates' Each
sown plot measured 2.9 x3O metres (see Diagram 4.1). Thus the experimental design
was:
Swards (6) x Sowing rates (2) x Stocking rates (3) x Blocks (2) = 72 plots.
Sowing details: The plots were sown with a L6-row John Shearer tyned seed drill
with trailing harrows on May 28, 1986. Depth of sowing was c'lOmm' Prior to
sowing, the drill was calibrated for each cultivar at each sowing rate' The low sowing
rate was sown through the small seed box. The high sowing rate was sown through the
co¿ìrse side of the large grain box.
The 12 treatments were allocated at random within the six groups of 12 plots (see
Diagrams 4.1 and 4.2). Despite calibration of the drill for each cultivar and mixture at
both sowing rates there were discrepancies in the actual rates sown. The treatments were
ted as follows:
200ke/ha (ke/ha) 10 kg/ha
A: Nungarin
B: Dalkeith
C: Trikkala
D Junee
E: Clare
F: Mixture
241
218
202
240
ztz
225
11.8
11.3
10.7
tt.4
10.4
10.7
G: Nungarin
H: Dalkeith
I: Trikkala
J: Junee
K: Clare
L: Mixture
The buffer zone was sown the following day using the same mixture of cultivars at the
nominal rate of 20kglha. The actual buffer zone sowing rate was22.7 kg/ha. A mixture
of single superphosphate and lime (507o : 5O7o) was applied at the rate of 100kg/ha
through the fertilizer box at the time of sowing. Prior to sowing all seed was inoculated
with type C Rhizobium bacteria.
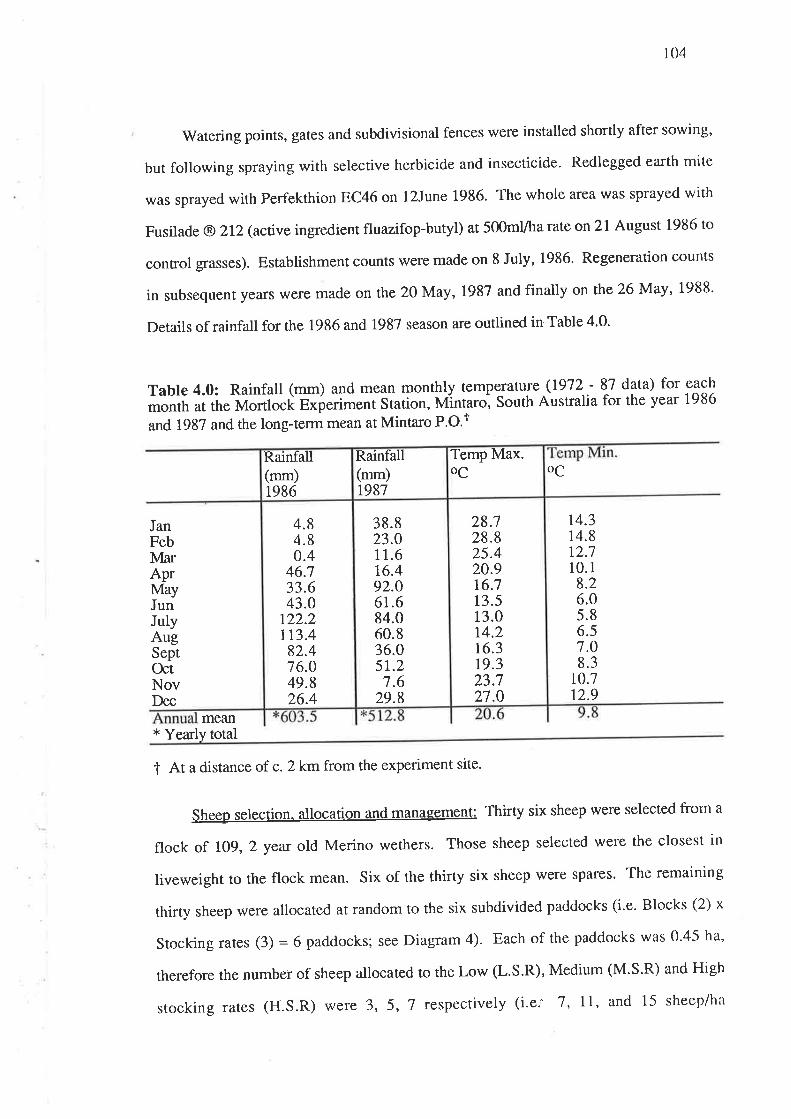
104
Watering points, gates and subdivisional fences were installed shortly after sowiltg,
but following spraying with selective herbicide and insecticide. Redlegged earth mite
was sprayed with perfekthion F;C46 on 12June 1986. The whole area was sprayed with
Fusilade @ Zl2 (active ingredient fluazifop-butyl) at 500mVha rate on 21 August 1986 to
control grasses). Establishment counts were made on 8 July, 1986' Regeneration counts
in subsequent years were made on the 20 May, 1987 and finally on the 26 Mray' 1988'
Details of rainfall for the 1986 and 1987 season are outlined in Table 4'0'
Tabte 4.0: Rainfall (mm) and mean monthly tempelatule (1972..- 87 data) for each
month at the Vfottfå.Èn*i".i-.ttt Stadon, tvtintaro, South Australia for the year 1986
and 1987 and the long-term mean at Mintaro P.O.Î
oc
JanFebMar
r4.314.812.110.18.26.05.86.57.08.3
t0.112.9
AprMayJunJulyAugSeptOctNovDec
mean* Yearly total
4.84.80.4
46.733.643.0
122.2tr3.482.416.049.826.4
38.823.011.61,6.492.O6r.684.060.836.051.27.6
29.8
28.728.825.420.916.713.513.0t4.216.319.323.727.0
(mm)1986
Rainfall RainfaII(mm)1987
Temp Max.oc
t At a distance of c.2 km from the experiment site'
Sheep selection. allocation and management: Thirty six sheep were selected from a
flock of 109, 2 year old Merino wethers. Those sheep selected were the closest in
liveweight to the flock mean. Six of the thirty six sheep were spares. The remaining
thirty sheep were allocated at random to the six subdivided paddocks (i.e' Blocks (2) x
Stocking rates (3) = 6 paddocks; see Diagram 4). Each of the paddocks was 0.45 ha'
rherefore the number of sheep allocared ro the Low (L.S.R), Medium (M.S.R) and High
stocking rates (H.S.R) were 3, 5,'l respectively (i-er '7, lI, and 15 sheep/ha

l0-5
respectively). Sheep were introduced to the area 5 September, 1986' At this stage the
pasture was well established. Sheep had access to all treatment plots within a stocking
rate. The sheep grazed,the a¡ea continuously until 11 November, 1987.
Greasy wool weights (Appendix B, Table 1) were measured 9 March, 1987 and
autumn-winter liveweights recorded on 4 July, 1987 and finally on 12 November' 1987
(appendix 8.1). The table also shows the liveweights of individual sheep before the
experiment.
Because of very low pasture availability, cereal hay was fed from 4 July to 5 Oct''
1987 to sheep on the two high stocking rate areas. Half a bale of hay was fed three times
a week in the buffer zone.
Herbage harvests: The first herbage harvest was taken on 4 September, 1986 the day
before sheep were introduced to the area. This harvest indicated the levels of pasture
availability at the time the sheep were introduced to the area' Two 25 x 40 cm quadrats
per treatment plot were cut to ground level (i.e. one taken west and the other east on the
drill strip). The 'open' and 'closed' quadrat method of Mc Intyre (1946) was adopted for
the measurement of pasture availability and cumulative growth of the pasture'
The "open" cuts were made adjacent to the quadrat cage which was placed on a
similar representative site. Two quadrat cages measuring 70cm square and lm tall were
placed in each plot. The'closed' cuts were taken from within the cage' Harvest 2' was
taken on23October, 1986 using 40 x 36 cm quadrats (2 quadrats 'open' cÛt '2 quadrats
'closed' cut per plot). Larger quadrat size was used because of the increasing height of
the pasture. Harvest 3, the final harvest for 1986, was taken on 2'l November' 1986
using 40 x 40cm quadlats, the same number of cuts were taken per plot as for Harvest 2'
Only two herbage harvests were taken throughout the 1987 growing season' these
were taken on 16 September and,25 November,lg87 (Harvests I and 2 respectively).
The reason for this was that the difference between the outside and the inside of the cage
r06
was not great due to the slow pasture $owth in 1987. This was paftly because of lower
annual rainfall in 1987 (513 mm) compared to 1986 (604 mm) lsee table 4.1]. At
Harvest 1 in 1987, two'open' and two 'closed' cuts were taken per plot using 36 x 40
cm quadrats cut to ground level. Only two 'closed' samples per plot using a25 cm x 25
cm cutting quadrat were taken at Harvest 2. Thecutting quadrat was used because at that
stage the herbage was still green, but very tangled. An electronic pasture probe was used
to take both'open' and'closed'readings on the same day (two'open' and two 'closed'
per plot = 288 readings).
All'open' cuts were hand-separated into sub clover and weeds in 1986 and in 1987
into st¡b clover, grass and weeds. Herbage samples were dried at 85oC for 24 hrs in a
forced-draught dehydrator. Between both harvests in 1987 a non-destructive estimate of
botanical composition was made on grazed areas (6 paddocks) on the 19 October using
the Levy Point Quadrat method. Four sets of readings were taken per plot (two from the
eastern end and two from the western end).
Ouadrat cage placement ând movement: Each drill plot was divided into two 15m
lengths and a quadrat cage was placed in each half plot. One quadrat cage was placed at
the western end of the plot and the second cage was placed on the mid-line' On each
harvest occasion quadrat cages were moved onto a new representative site after the cut
was taken from the in-place cage. Cages were progressively moved eastward along the
plots (see Diagram 4.3). The schematic movement of cages in this manner avoided
previously-harvested sites.
Seed harvests: Seed harvests were taken at the end of each growing season, when
the burrs had fully matured. The seed harvests for the 1986 growing season were taken
on the 6 and 7 January, 1987 and for the 1987 growing season the seed harvest was
taken in late December (hereafter called 1986 and 1987 seed harvests respectively).
Samples were taken within the two cages per plot. In addition, two sots of galvanised
mesh (apertures 75mm x 50mm) cut into pieces 40 x 35 cm were placed adjacent to the
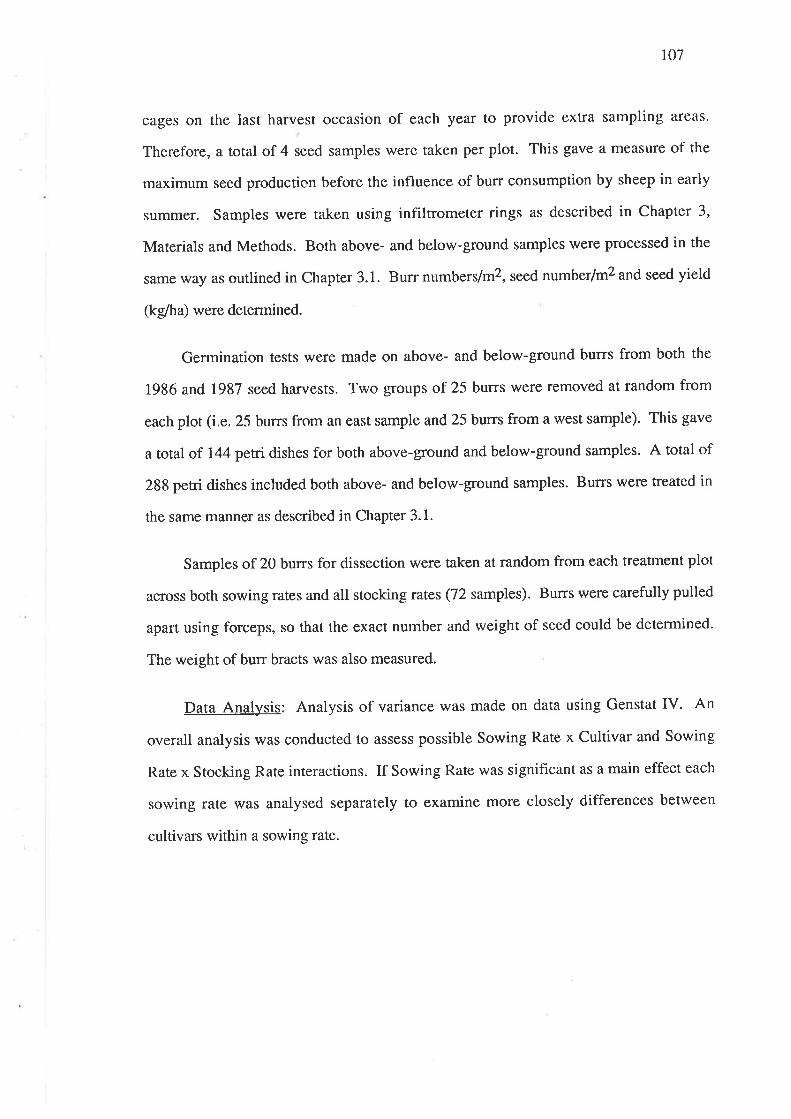
107
cages on the last harvest occasion of each year to provide extra sampling areas.
Therefore, a total of 4 seed samples were taken per plot. This gave a measure of the
maximum seed production before the influence of burr consumption by sheep in early
summer. Samples were taken using infiltrometer rings as described in Chapter 3,
Materials and Methods. Both above- and below-ground samples were processed in the
same way as outlined in Chapter 3.1. Burr numbers/m2, seed number/m2 and seed yield
(kg/ha) were determined.
Germination tests were made on above- and below-ground burrs from both the
1986 and 1987 seed harvests. Two groups of 25 burrs were removed at random from
each plot (i.e. 25 br¡rrs from an east sample and25 burrs from a west sample). This gave
a total of 144 petri dishes for both above-ground and below-ground samples. A total of
288 petri dishes included both above- and below-ground samples. Burrs were treated in
the same manner as described in Chapter 3.1.
Samples of 20 burrs for dissection were taken at random from each treatment plot
across both sowing rates and all stocking rates (72 samples). Burrs were carefully pulled
apart using forceps, so that the exact number and weight of seed could be determined.
The weight of bur bracts was also measured.
Data Analysis: Analysis of variance was made on data using Genstat IV. An
overall analysis was conducted to assess possible Sowing Rate x Cultivar and Sowing
Rate x Stocking Rate interactions. If Sowing Rate was significant as a main effect each
sowing rate was analysed separately to examine more closely differences between
cultivars within a sowing rate.

Diagram 4.1: The position and orientation of treatment plots
L.S.R. : Low Stocking RateM.S.R. = Medium Stocking RateH.S.R. = High Stocking Rate
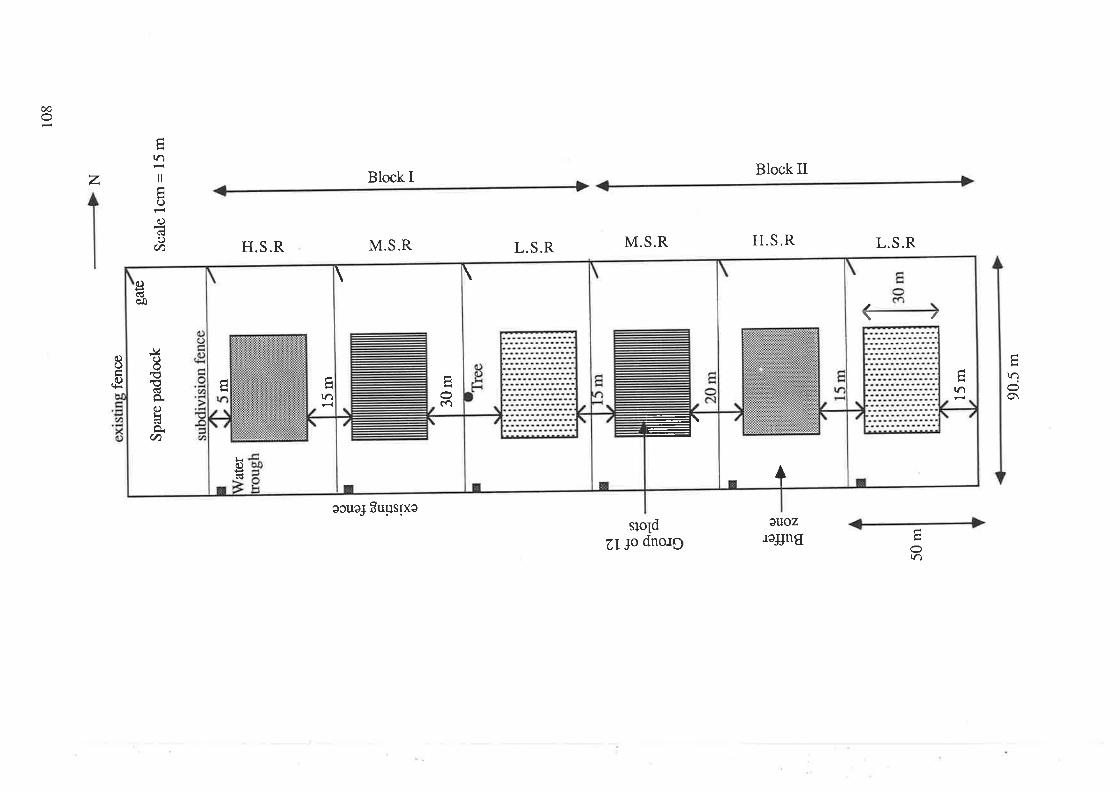
oo
z\ñ
il
oa)(€O
U) H.S.R
Block I
M.S.R
ecue¡ Surlsrxe
M.S.R
slold¿1 ¡o dnorg
Block II
H.S.R
evozreJJng
L.S.R L. S.R
o()
eÁ
\a)
o\
É
rô
-
/
tñ
+
\
É
cî
\
rô
Lo)
J¿8õËCÉÈOliÈ
ct)
c)dèo

Diagram 4.2: Randomization of treatments.
200 kg/ha 10 kg/ha
A: NungarinB: DalkeithC: TrikkalaD: JuneeE: ClareF: Mixture
G: NungarinH: DalkeithI: TrikkalaJ: JuneeK: ClareL: Mixture
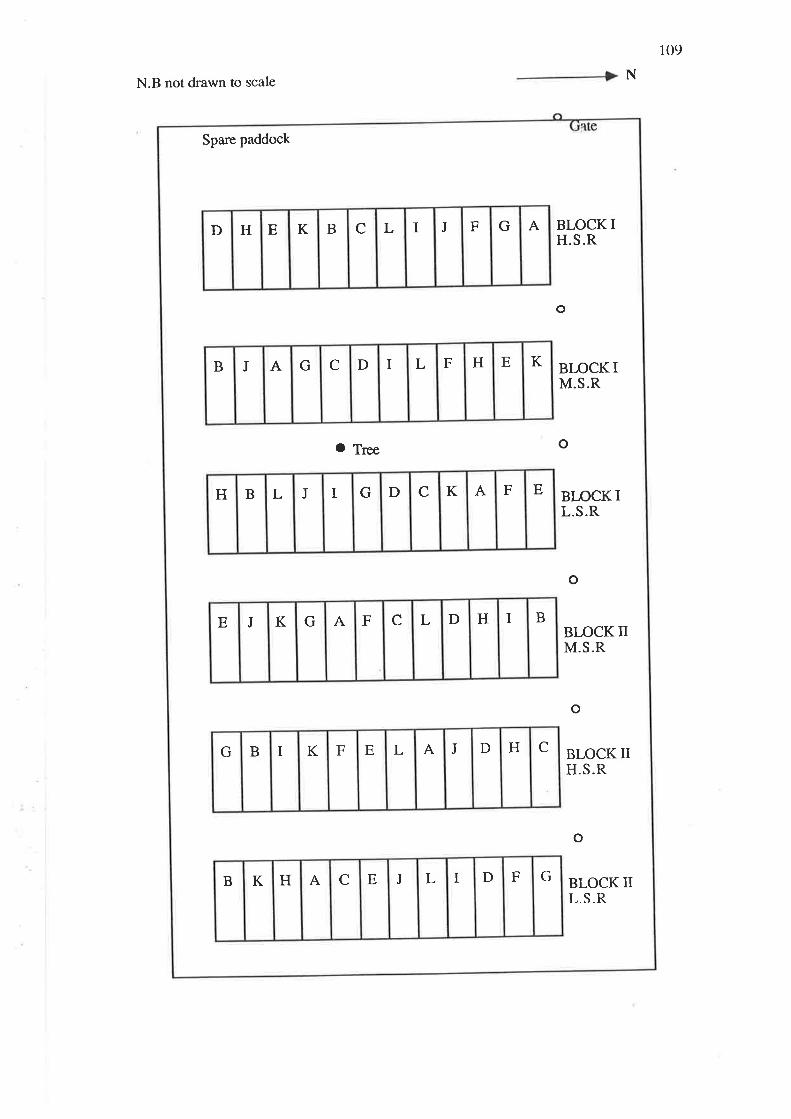
109
NN.B not d¡awn to scale
Spare paddock
BLOCK IH.S.R
o
BLOCK IM.S.R
o Tree o
BI,OCK IL.S.R
o
BI,OCK trM.S.R
o
BLOCK UH.S.R
o
BLOCK IIL.S.R
AGFJILCBKEHD
KEHFLIDCGAJB
EFAKCDGIJLBH
BIHDLCFAGKJE
CHDJALEFKIBG
KB CAH LJE DI GF
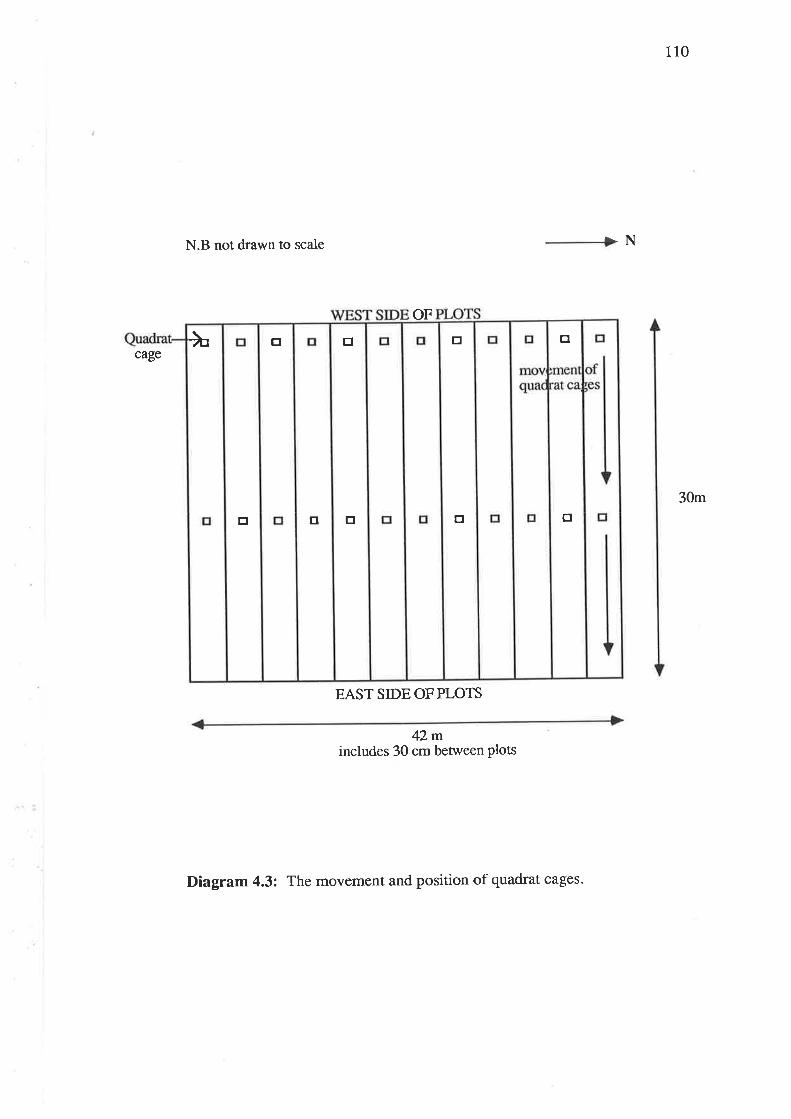
110
N.B not drawn to scale
OF
EAST SIDE OF PLOTS
42mincludes 30 cm between Plots
Diagram 4.3: The movement and position of quadrat cages.
t- N
cùEe
30mtlE
tr
tr
tr
E
à
E
tr E

Plate 4.1: General view of a low stocking rate area (Tsheep/ha) at MES in 1986. Highdensity plot in forc-ground.
Plate 4.2: View of a high stocking rare area (15 s eeplha) at MES in 1986.læft high sowing rate plot.Right low sowing rate plot.
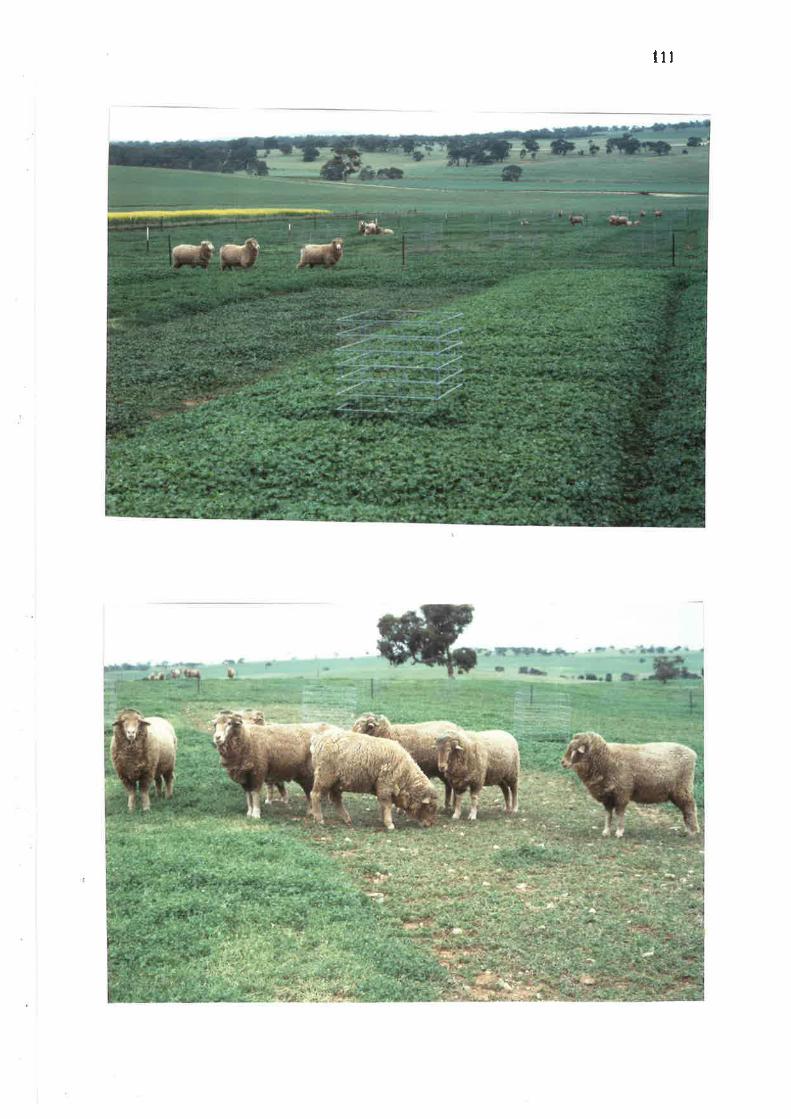
TII
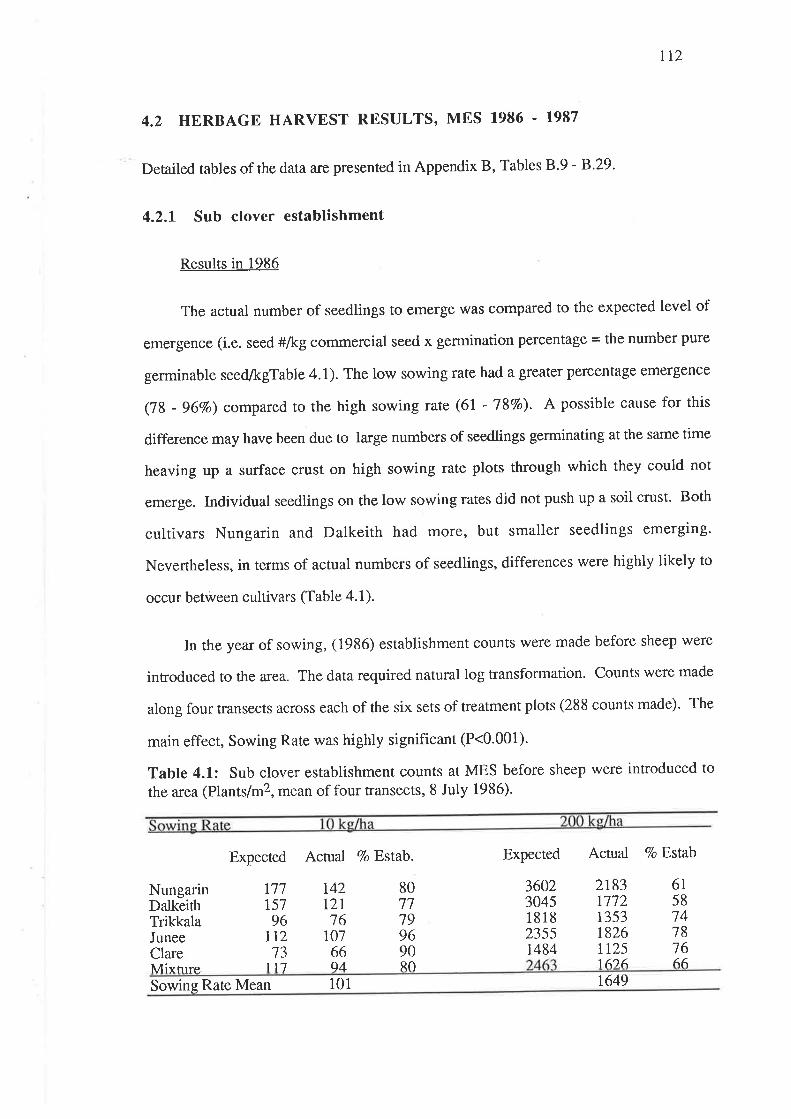
112
4.2 HERBAGE HARVEST RESULTS, MES 1986 . 1987
Detailed tables of the data are presented in Appendix B' Tables 8.9 - 8.29.
4.2.1 Sub clover establishment
Results in 1986
The actual number of seedlings to emerge was compared to the expected level of
emergence (i.e. seed #lkg commercial seed x germination percentage = the number pure
germinable seedlkgTable 4.1). The low sowing rate had a greater percentage emergence
(78 -96Vo) compared ro rhe high sowing rate (6I -78Vo). A possible cause for this
difference may have been due to large numbers of seedlings germinating at the same time
heaving up a surface crust on high sowing rate plots through which they could not
emerge. Individual seedlings on the low sowing rates did not push up a soil crust- Both
cultivars Nungarin and Dalkeith had more, but smaller seedlings emerging.
Nevertheless, in terms of actual numbers of seedlings, differences were highly likely to
occur between cultivars (Table 4.1).
In the year of sowing, (1986) establishment counts were made before sheep were
introduced to the area. The data required natural log transformation. Counts were made
along four transects across each of the six sets of treatment plots (288 counts made). The
main effect, Sowing Rate was highly significant (P<0.001).
Tabte 4.1: Sub clover establishment counts at MES before sheep were introduced to
the area (Plants/m2, mean of four transects, 8 July 1986).
Expected Actual VoBstab. Expected
3602304518 1823551484
Actual ToBsfab
NungarinDalkeithTrikkalaJuneeClare
17115796
1n73
117
14212r16
r0766qA
8077799690RO
2r8311121353r826tt2516).6
615874781666Mixture
Sowing Rate Mean 101 r649
I 13
4.2.2 Pasture yield and botanical t-'omposition
Sub clover availability and weed yield was determined from'open' cuts
1986. Harvest 1 (4 Sept.. 1986)
(i) Sub clover availability: Sowing rate had a highly significant effect (P<0.001,
transformed data) on herbage production of sub clover. The mean yield for high and low
sowing rate plots were 1931 and I94 kg DM/ha respectively.
Analyses were carried out on each sowing rate separately. Nungarin, Dalkeith,
Junee, CIa¡e and. the mixture had very similar yields when sown at 200 kg/ha. Trikkala
was the only cultivar which had a significantly lower yield (P<0.001, Table 4.2).
Cultivars were not significantly different from one another when sown at 10 kg/ha.
(ii) Weed yield: Weed yield was determined from hand-separated samples. The 1986
season had only one category of weeds because of grassy weeds were eliminated by
spraying with Fusilade @ early in the season. Surviving weeds comprised mainly
broadleaf weeds such as poppy (Papaver hybridum), capeweed (Arctotheca calendula),
and Erodium spp.
Sowing rate was the only factor which significantly influenced yield of weeds
(P<0.05). More weeds were found on low sowing rate plots (151 and 344kgDM/hafot
high and low respectively). Sub clover cultivars did not influence the amount of weed
present (Tabte 4.2).

tt4
Table 4.2: Available pasture: sub clover, weeds.and total (kg.DM/ha) at the sowing
iui"" f O and 200 kg/ha on 4 Sept., 1986 at MES, prior to gtazing by sheep'
Nunsalin Dalkeith Trikkala Junee Clare Mixture lVlean
10 kg/ha
195344
Sub clover 249V/eeds 304
187388
t79385
161399
218343
113244
200 kg/ha
2030 1325 2019r43 230 148
2001r29
2073131
r931151
Sub cloverWeeds
2137t25
Total 2262 2t73 1555 2r 2130 2204 82
Cultivar x Sowing Rate interaction for Sub clover, LSD(57o) =204
1986. Harvest 2 (23 Oct.. 1986)
(i) Sub clover availability: Sowing rate was highly signiircant (P<0.001, Tab1e 4'3)'
Overall analysis showed no statistically-signihcant stocking rate effect. This could be the
result of having only two replicates with which to test the effect of stocking rate. Another
probable reason for the lack of difference is the high availability of pasture which is often
the situation with first year experiments of this type.
(ii) V/eed yield: Sowing rate was the only significant effect on weed yield (P<0.001)'
As found for Harvest 1, there were significantly more weeds on low sowing rate plots
compared to high sowing rate plots (223 andZl kgDM/ha respectively, also data needed
logx + 1 transformation).
Table 4.3: Available pasture: sub clover, weeds and total (kg DM/ha) on 23 Oct"1986 at MES.
Clare MixtureTrikkala Junee
Sub cloverV/eedsTotal
200 kg/ha
2990192
3t82
2242253
2495
2295239
2534
265r2ll
2862
t75r185
r936
2513257
2710
460439
4643
Sub cloverWeedsTotal
466215
4677
475818
4776
493633
4969
523253
528s
36884
3692

115
1986. Harvest 3 (27 Nov.. 1986)
(i) Sub ctover availabilit)¡: Sowing rate was significant (6525 and 4559 for high and low
sowing rates respectively, P<0.001, Table 4.4). Analysis of each sowin grate separately
showed cultivar differences at the low sowing rate only (P<0.001)' The cultivars
Nungarin, Dalkeith and Clare had the lowest availability, while Trikkala, Junee and the
mixture had the highest availabilities of sub clover (Table 4.4). The Stocking Rate x
Cultivar interaction was also significant at the low sowing rate (P<0'05, see Appendix B'
Table 12). All cultivars excepr Clare and the mixture, showed a decline in availability as
stocking rate increased.
(ii) V/eed yield: Sowing rate was highly significant (P<0.001, log transformed data)'
More weeds were found on low-sowing-rate plots compared to high-sowing-rate plots
(486 and 25kgDM/ha respectively, P<0.001, Table 4'4)'
Table 4.4: Available pasture: sub clover, weeds and total (kgDMlha) on 27 Nov"1986 at MES.
ungann Junee Clare Mlxture
Sub cloverWeedsTotal
Sub cloverWeedsTotal
At 10 kg/ha: Cultivar LSD (57o) = 851
200kglha
373r685
44r6
5778I4
5192
349r430
3921
5r75768
5943
726418
7282
5624304
5928
3919238
4t51
621919
6298
5415490
5905
69138
692r
541,23L
5443
750560
7565
1987. Harvest 1 (16 Sept.. 1987)
(i) Sub clover availabilit),: Dry Matrer production was not signihcantly affected by the
1986 sowing rate (average of 1683kg DM/ha and 1836 kg DM/ha for high and low
sowing rates respectively). The best overall availability was for Nungarin > Dalkeith =
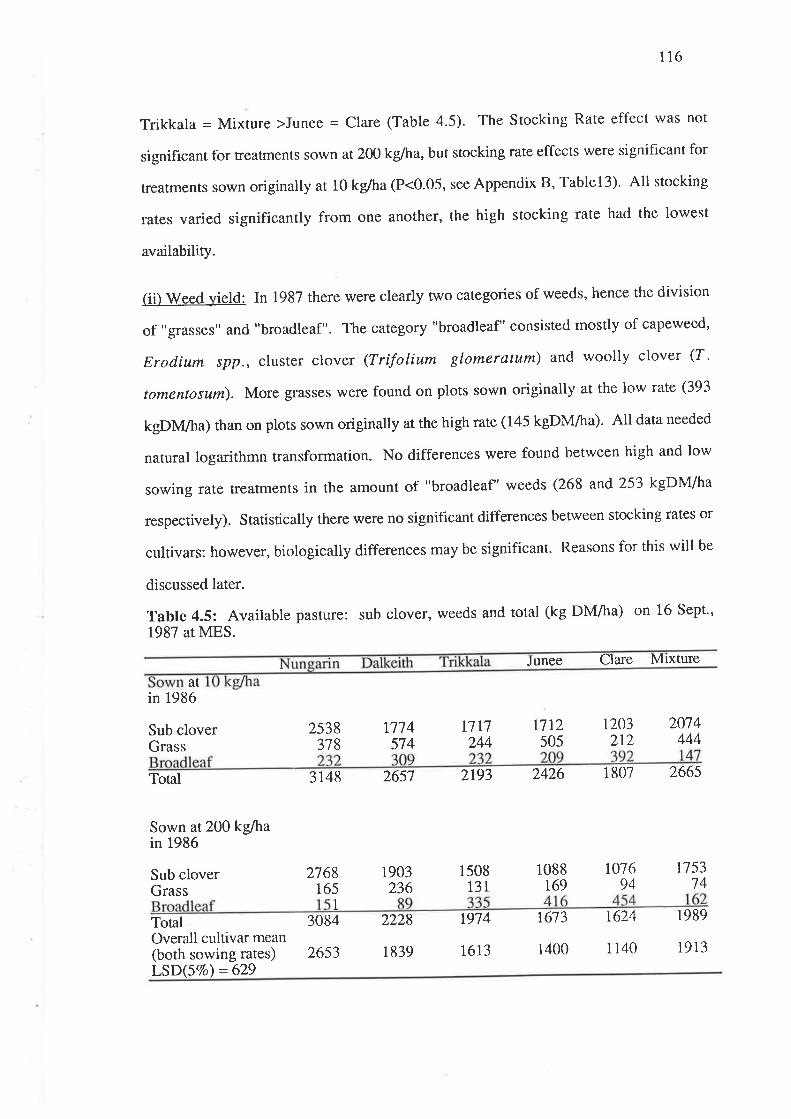
116
Trikkala : Mixture >Junee = Clare (Table 4.5). The Stocking Rate effect was not
signihcant for treatments sown at 200 kg/ha, but stocking rate effects were significant for
rreatments sown originally at 10 kg/ha (P<0.05, see Appendix B, Tablel3). All stocking
rates varied significantly from one another, the high stocking rate had the lowest
availability.
(ii) V/eed yield: In 1987 rhere were clearly two categories of weeds' hence the division
of ,,grasses" and "broadleaf". The category "broadleaf" consisted mostly of capeweed,
Erodium spp., cluster clover (Trifolium glomeratum) and woolly clover (T'
tomentosum). More glasses were found on plots sown originally at the low rate (393
kgDlvl/ha) than on plots sown originally at the high rate (145 kgDM/ha)' All data needed
natural logarithmn transformation. No differences were found between high and low
sowing rate treatments in the amount of "broadleaf" weeds (268 and 253 kgDM/ha
respectively). Statistically there were no significant differences between stocking rates or
cultivars: however, biologically differences may be significant. Reasons for this will be
discussed later.
Table 4.5: Available pasture: sub clover, weeds and total (kg DMlha) on 16 Sept''
1987 at MES.
J unee Clare Mtxture
atin 1986
Sub cloverGrass
2s38318
r714574
l117244
t712s0s
1203212
2074444
3148 2657 2193 2426 1807 2665Total
Sown at 200 kglhain 1986
Sub cloverGrass
2768165
1903236
I 508131
1088r69
r01694
115374
1
TotalOverall cultivar mean(both sowing rates)
3084 2228
1839
1914
t613
1613
1400
t624
1 140
1989
1913
LSD(57o\ = 6292653
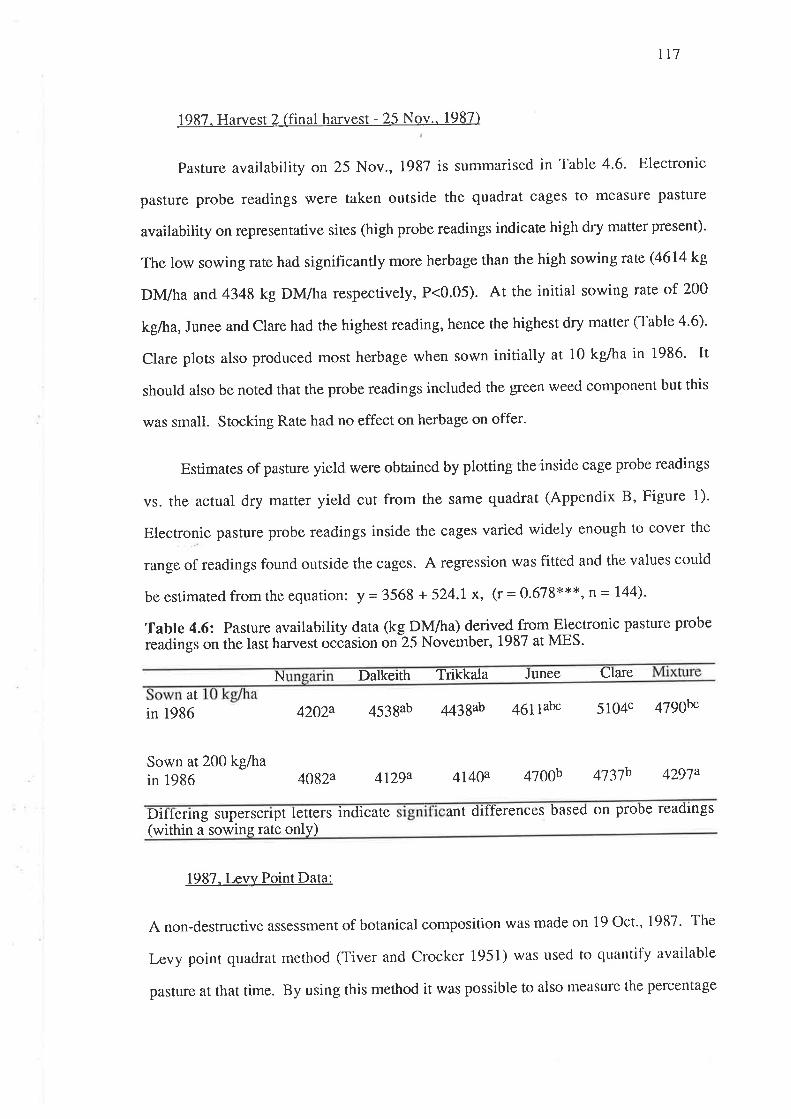
117
1987. Harvest 2 (final harvest - 25 Nov.- 1987)
Pasture availability on 25 Nov., 1987 is summarised in Table 4.6. Electronic
pasture probe readings were taken outside the quadrat cages to measure pasture
availability on representative sites (high probe readings indicate high dry matter present).
The low sowing rate had significantly more herbage than the high sowing rato Ø6la kg
DM/ha and 4348 kg DM/ha respectively, P<0.05). At the initiat sowing rate of 200
kg/ha, Junee and Clare had the highest reading, hence the highest dry matter (Table 4.6).
Clare plots also produced most herbage when sown initialty at 10 kg/ha in 1986' It
should also be noted that the probe readings included the green weed component but this
was small. Stocking Rate had no effect on herbage on offer.
Esrimates of pasture yield were obtained by plotting the inside cage probe readings
vs. the actual dry matter yield cut from the same quadrat (Appendix B, Figure 1)'
Electronic pasture probe readings inside the cages varied widely enough to cover the
range of readings found outside the cages. A regression was fitted and the values could
be estimated from the equation: y = 3568 + 524'1x, (r = 0'678***' n = 144)'
Tabte 4.6: Pasture availability data (kg DM/ha) derivedfrom Electronic pasture probe
readings on the last han¡est occasion on25 November, 1981 at MES.
N Dalkeith Trikkala Junee Clare
atin 1986 4202a 4538ab 4438ab 46rßbc 5104c 4790k-
Sown at20} kg/hain 1986 4082a 4r2ga 414æ 4700b 4ßlb 4297a
Dittenng superscrlpt letters indicate ant diffþrences based on probe readings
within a sowing rate only)(
1987. Levy Point Data:
A non-destructive assessment of botanical composition was made on 19 Oct., 1987. The
Levy point quadrat method (Tiver and Crocker 1951) was used to quantify available
pasture at that time. By using this method it was possible to also measure the percentage
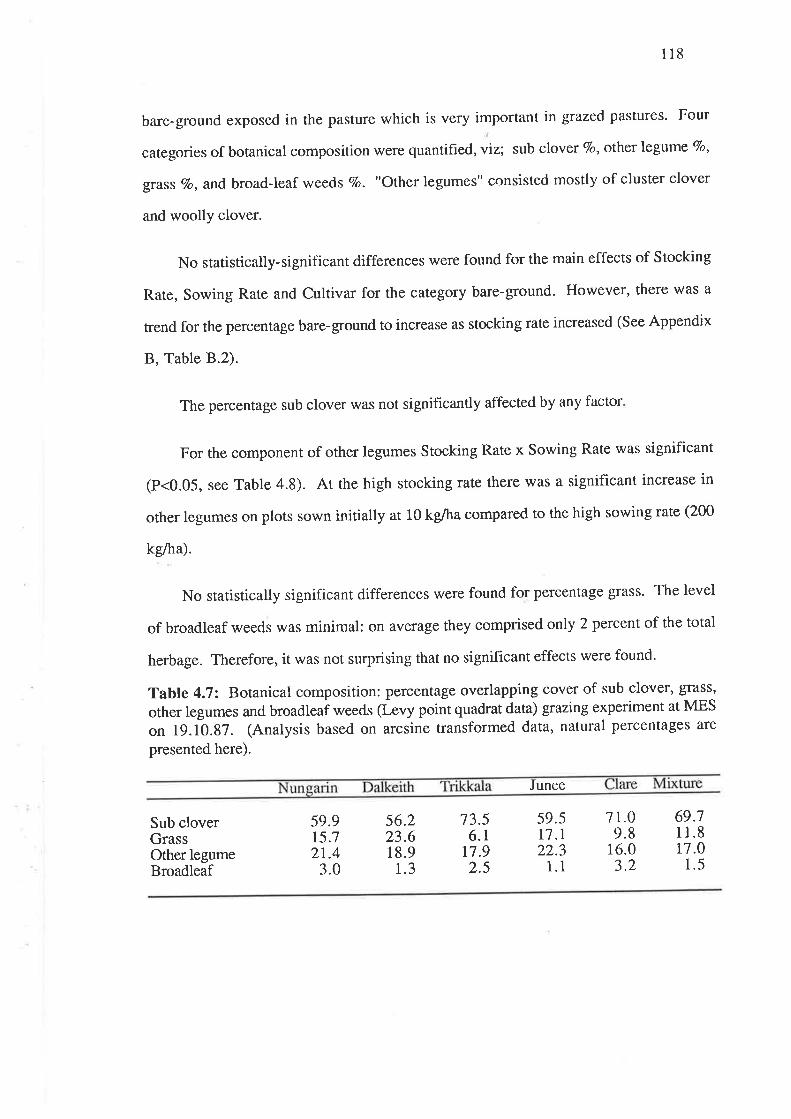
118
bare-ground exposed in the pasture which is very important in grazed pastures' Four
categories of botanical composition rwere quantified, viz; sub clover Vo, olhu legume 7o,
grass Vo, and broad-leaf weeds Vo. "Other legumes" consisted mostly of cluster clover
and woolly clover.
No statistically-significant differences were found for the main effects of Stocking
Rate, Sowing Rate and Cultivar for the category bare-ground. However, there was a
trend for the percentage bare-ground to increase as stocking rate increased (See Appendix
B, Table 8.2).
The percentage sub clover was not signif,rcantly affected by any factor
For the component of other legumes Stocking Rate x Sowing Rate was significant
(p<0.05, see Table 4.8). At the high stocking rate there was a significant increase in
orher legumes on plots sown initially at 10 kg/hacompared to the high sowing rate (200
kg/ha).
No statistically significant differences were found for percentage grass. The level
of broadleaf weeds was minimal: on average they comprised only 2 percent of the total
herbage. Therefore, it was not surprising that no significant effects were found.
Table 4.7: Botanical composition: percentage overlapping cover of sub clover, grass,
other legumes and broadleai weeds (Levy point quadrat data) grazing experiment at MES
on t9.1b.87. (Analysis based on arcsine transformed data, natural percentages are
presented here).
Junee
Sub cloverGrassOther legumeBroadleaf
59.915.72t.4
3.0
56.223.618.9
1.3
13.56.1
r7.92.5
69.711.817.0
1.5
7 r.09.8
16.03.2
59.5r7.122.3
1.1
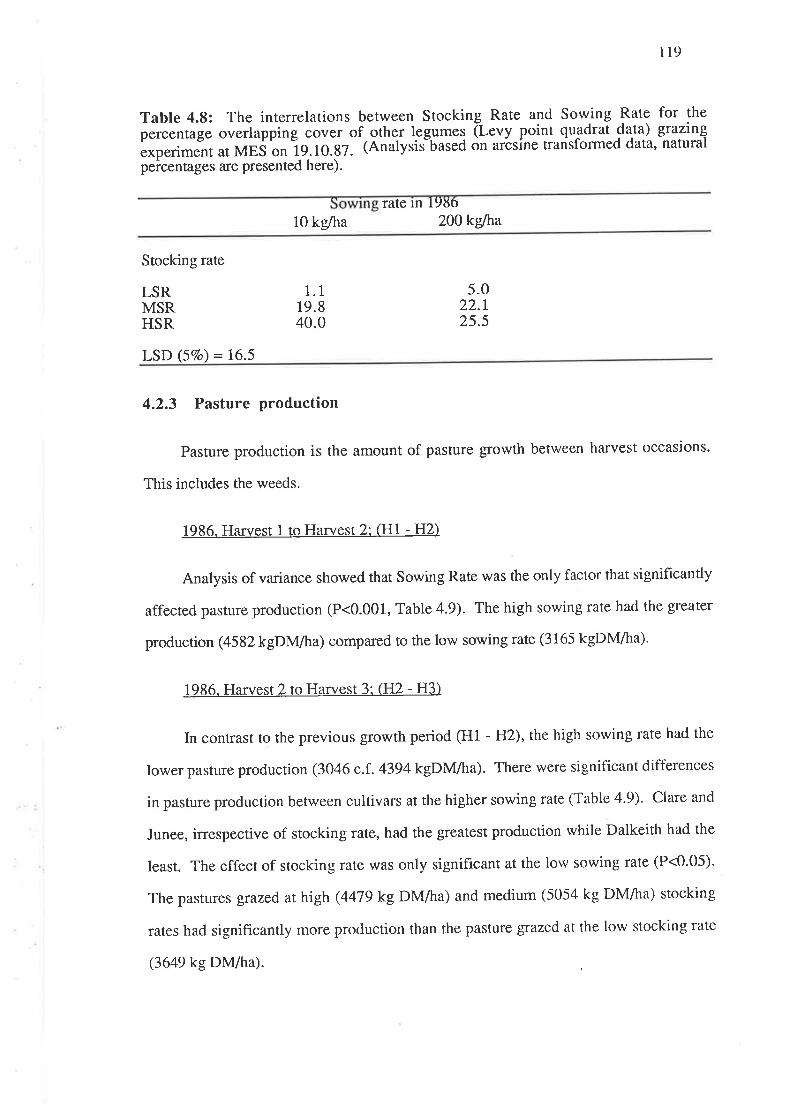
119
Table 4.8: The interrelations between Stocking Rate and Sowing Rate for the
f"õ"nog" overlapping cover of .other legumes (Levy Poilt 9Yiq1'^-di9)^ gtazing
experimenr ar MES ã" ig.io.g7- (Analysifüased ôn arósíne trarisformed data, natural
peicentages are presented here).
rate ln IYðO
10 kglha 200 kg/ha
Stocking rate
LSRMSRHSR
1.119.840.0
5.022.125.5
LSD (57o) = 16.5
4.2.3 Pasture production
Pasture production is the amount of pasture growth between harvest occasions.
This includes the weeds.
1986. Harvest 1 to Harvest 2: (Hl - H2)
Analysis of variance showed that Sowing Rate was the only factor that signifrcantly
affected pasrure production (P<0.001, Table 4.9). The high sowing rate had the greater
production (4582kgDM/ha) compared to the low sowing rate (3165 kgDMiha).
1986. Harvest 2 to Harvest 3: (H2 - H3)
In contrast to the previous glowth period (Hl - H2), the high sowing rate had the
lower pasrure production (3046 c.f .4394 kgDMlha). There were significant differences
in pasture production between cultivars at the higher sowing rate (Table 4.9). Clare and
Junee, irrespective of stocking rate, had the greatest production while Dalkeith had the
least. The effect of stocking rate was only significant at the low sowing rate (P<0.05).
The pastures grazed at high (4479 kg DM/ha) and medium (5054 kg DM/ha) stocking
rates had significantly more production than the pasture grazed at the low stocking rate
(3649 kg DM/ha)

120
The high sowing rate plots produced more than low sowing rate plots (9793 and
8116 kg OM/ha respectively). Analysis of each sowing rate separately showed a
significant effect of cultivar at the high sowing rate (P<0.01, Table 4'9), but no effect at
the low sowing rate. Clare then Junee, Trikkala and the mixture had the highest pasture
yields at the high sowing rate. Nungarin and Dalkeith were not significantly different'
Tabte 4.9: Pasture production between Harvests 1 and 2 (HL-HZ; l9i^uyt):^Harvests2 and3 (l¡ifz-Iß:,ildayÐ, and Total Production (kg DIWha) at MES in 1986.
H1-H2H2 -Il3Total *
3340 3446 3056 28733589 3133 4964 4891
7482 7272 8583 8330
290048158265
338049618763
Cultivar effect at 10 n.s.Hl - H2; n.s.H2 - n.s.Totalures pasture ty cut ore
sg.azeÅ bv sheep.expenment was
200 kg/ha
HI -H2H2 -H.3Total *
43472tr68126
4817r7038694
465535399748
43063783
10256
46924t48
rr470
467529869865
Cultivar effect at 200 kglha: n.s.Hl - H2; LSD (57o) HZ -|f;3 =1659; Total =1358
1987. Cumulative winter production (emergence to Harvest 1l
Cumulative winter production of the pasture was determined from the first "closed" cut
on 16 Sept., 1987 (Tabte 4.10). The plots sown initially at 10 kg/ha in 1986 had the
highest production (5956 kgDM/ha) compared to plots sown initially at 200 kg/ha (5151
kg DM/ha, P<0.001). Cultivar differences were only found on plots sown originally at
the high sowing rate. Nungarin had the highest production, while Trikkala, Junee and
Clare the lowest. Dalkeith and the mixture wele intermediate (Table 4'10)'
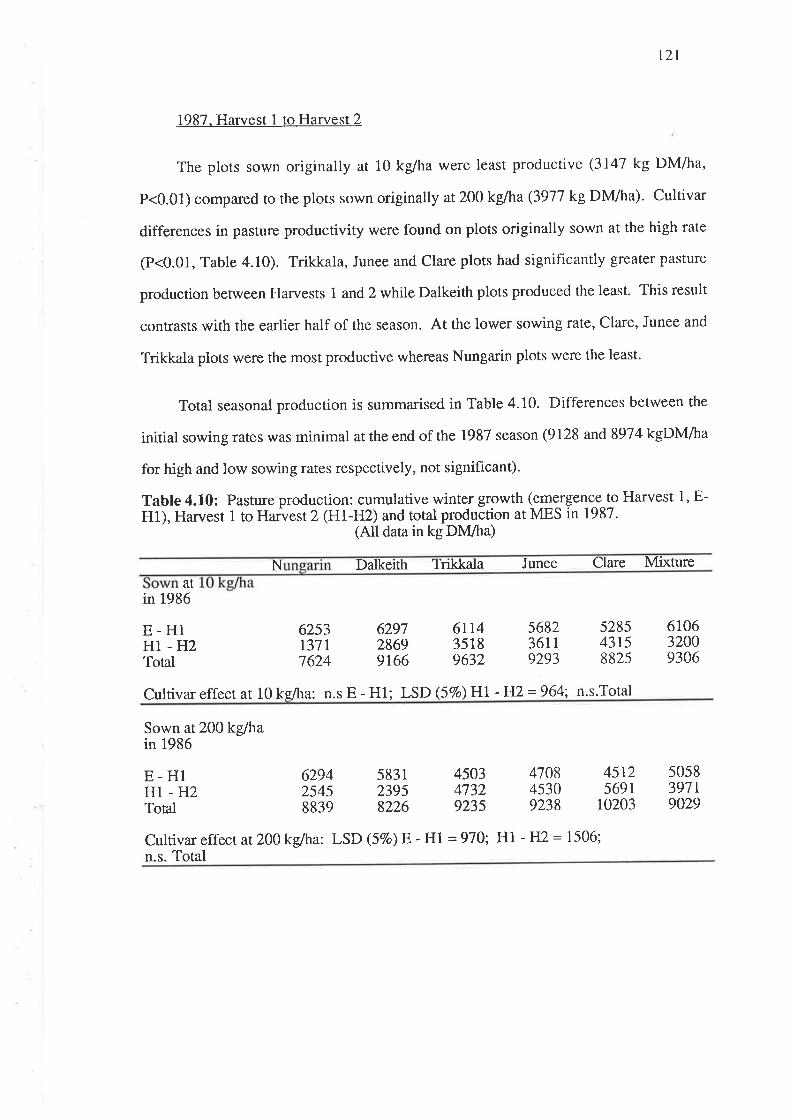
t2t
1987. Harvest 1 to Harvest 2
The plots sown originally at 10 kg/ha were least productive (3147 kg DM/ha,
P<0.01) compared to the plots sown originally at200 kg/ha (3917 kg DM/ha). Cultivar
differences in pasture productivity were found on plots originally sown at the high rate
(P<0.01, Table 4.10). Trikkala, Junee and Clare plots had significantly greater pasture
production between Harvests 1, and2 while Dalkeith plots produced the least. This result
contrasts with the earlier half of the season. At the lower sowing rate, Clare, Junee and
Trikkala plots were the most productive whereas Nungarin plots were the least.
Total seasonal production is summarised in Table 4.10. Differences between the
initial sowing rates was minimal at the end of the 1987 season (9128 and 8974 kgDM/ha
for high and low sowing rates respectively, not significant).
Table 4.10: Pasture production: cumulative winter growth (eqe¡ge1c^e^to Harvest 1, E-H1), Harvest 1 to Harvest 2 (Hl-If1z) and total production at MES in 1987.
(All data in kg DM/ha)
N Datkeith Trikkala Junee Clare Mixtureat
in 1986
E-HlHl-H2Total
6253 6297 6114 5682 5285l37L 2869 3518 3611 43151624 9166 9632 9293 8825
610632009306
Cultivar effect at 10 ke/ha: n.s E - Hl; LSD 67o\ Hl - H2 =964: n.s.Total
Sown at 200 kglhain 1986
E-HlHI -H2Total
629425458839
583123958226
450347329235
410845309238
45125691
10203
505839tr9029
Cultivar effect atz}}kgiha: LSD (57o) E - Hl =970;' H1 - H2 = 1506;
n.s. Total
122
4.3 SEED HARVEST RESULTS, 1986 . L987
Seed yield samples were taken from 'closed' quadrats and from under the mesh
placed adjacent to quadrat cages. Total seed yield comprised two components, above-
and below-ground, and data from both components were analysed separately and
together. The number of seeds/m2, seeds/burr, mean seed weight and germination tests
of seeds in burrs were analysed statistically. Seed yield was determined from the burr
dissection data (see Methods and Materials). Firstly, the number and weight of seed
from twenty random burrs was measured, also the number of burrs per m2 was
calculated (see Appendix B, Tables B.3- B.S). Thus, the number and weight of seed per
m2 could be estimated. Any loose seed was added for the final calculation.
4.3.1 Seed harvest 1986
4.3.1.1..Seed number/burr in 1986
(i) Above-ground: Seed number/burr for above-ground burrs is summarised in
Table 4.11.
(ii) Below-ground: Dalkeith had signif,rcantly more seeds/burr than all the other
cultivars except Nungarin at the sowing rate 200 kg/ha (P<0.001). The Cultivar x
Stocking Rate interacrion and Sowing Rate x Cultivar interaction was significant
(P<0.001). Junee shorved a significant decrease in the number of seeds/burr from the
high stocking rate to the low stocking rate. The other cultivars did not change
signihcantly between stocking rates (See Appendix B, Table 8.20).
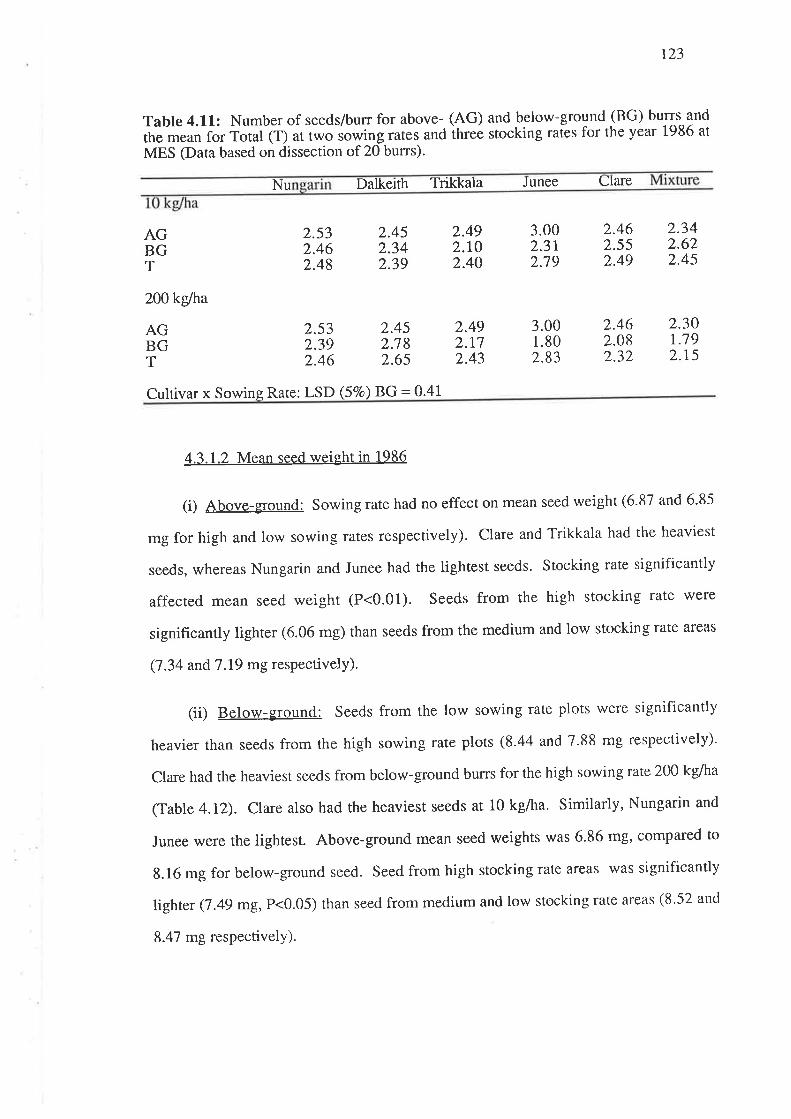
t23
Table 4.11: Number of seeds/burr for above- (AG) and below-ground (BG) burrs and
the mean for Total (i) at t*o sowing rates and ihree stocking rates for the year 1986 at
MES (Data based on dissection of 20 burrs).
Nu Dalkeith Trikkala Junee Clare
AGBGT
200 kg/ha
AGBGT
2.53 2.452.39 2.782.46 2.65
2.532.462.48
2.452.342.39
2.492.ro2.40
2.492.t72.43
3.002.3r2.79
2.462.552.49
2.462.082.32
2.342.622.45
2.30r.192.r5
3.001.802.83
Cultivar x Sowing Rate: LSD (5Vo)BG = 0.41
4.3.1.2 Mean seed weight in 1986
(i) Above-ground: Sowing rate had no effect on mean seed weight (6'81 and 6'85
mg for high and low sowing lates respectively). Clare and Trikkala had the heaviest
seeds, whereas Nungarin and Junee had the lightest seeds. Stocking rate significantly
affected mean seed weight (P<0.01). Seeds from the high stocking rate were
signifrcantly lighter (6.06 mg) than seeds from the medium and low stocking rate areas
(7 .34 and 7 .I9 mgrespectivelY).
(ii) Below-ground: Seeds from the low sowing rate plots were significantly
heavier than seeds from the high sowing rate plots (8.44 and 7.88 mg respectively)'
Clare had the heaviest seeds from below-ground burrs for the high sowing rate 200 kg/ha
(Table 4.I2). Clare also had the heaviest seeds at 10 kglha. Similarly, Nungarin and
Junee were the lightest. Above-ground mean seed weights was 6'86 mg, compared to
8.16 mg for below-ground seed. Seed from high stocking rate areas was significantly
lighter (7.49 mg,P<0.05) than seed from medium and low stocking rate areas (8.52 and
8.47 mgrespectively).
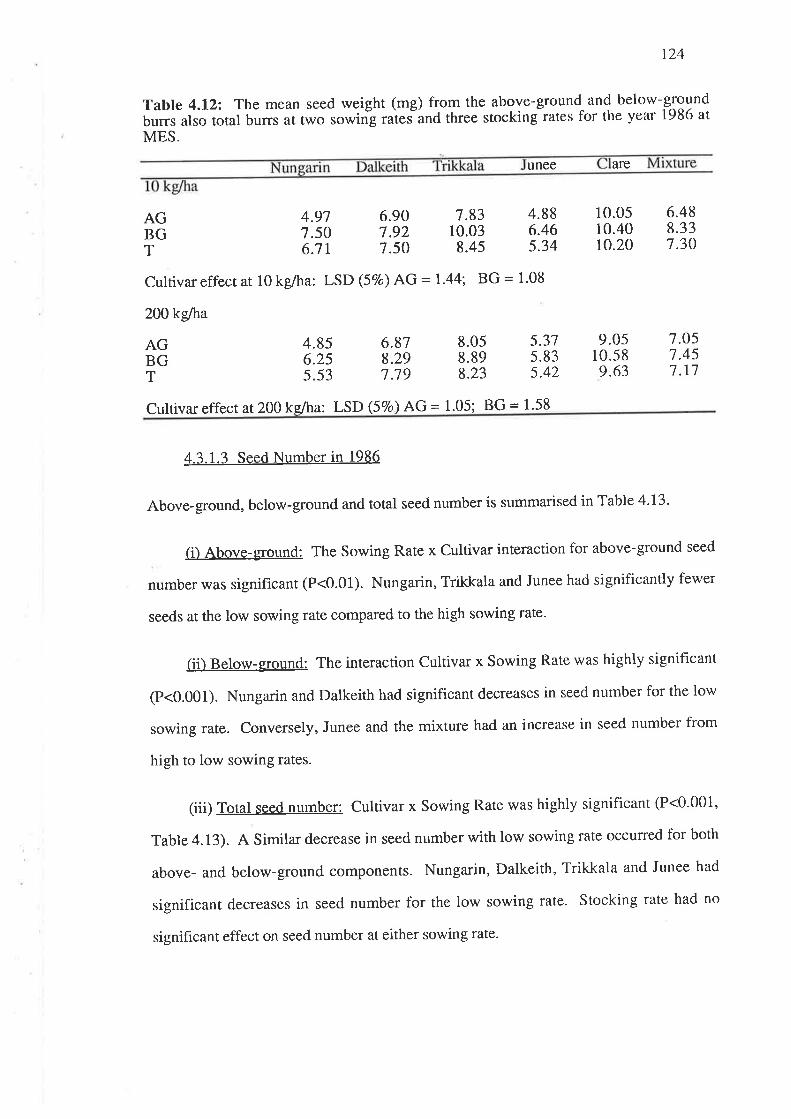
Table 4.I2: The mean seed weight (mg) from the above-ground and below-g-round
burrs also total burri ui t*o sowirig raìes"and three stockingrates for the year 1986 at
MES.
10.0510.4010.20
124
6.488.337.30
7.051.451.11
unee
7.83 4.8810.03 6.468.45 5.34
5.375.835.42
are
AGBGT
AGBGT
4.977.506.tt
6.907.927.50
8.058.898.23
4.856.255.53
Culúvar effect at 10 kg/ha: LSD (57o) AG = I.44; BG = 1'08
200 kg/ha
6.878.297.79
9.0510.589.63
Cultivar effect at200 ke/ha: LSD (5 7o\ AG = 1.05; BG = 1.58
4.3.1.3 Seed Number in 1986
Above-ground, below-ground and total seed number is summarised in Table 4'13'
(i) Above-ground: The Sowing Rate x Cultivar interaction for above-ground seed
number was significant (P<0.01). Nungarin, Trikkala and Junee had significantly fewer
seeds at the low sowing rate compared to the high sowing rate'
(ii) Below-ground: The interaction Cultivar x Sowing Rate was highly significant
(p<0.001). Nungarin and Dalkeith had significant decreases in seed number for the low
sowing rate. Conversely, Junee and the mixture had an increase in seed number from
high to low sowing rates.
(iii) Total seed number: Cultivar x Sowing Rate was highly significant (P<0.001'
Table 4.13). A Similar decrease in seed number with low sowing rate occulred for both
above- and below-ground components. Nungarin, Dalkeith, Trikkala and Junee had
significant decreases in seed number for the low sowing rate. Stocking rate had no
significant effect on seed number at either sowing rate.
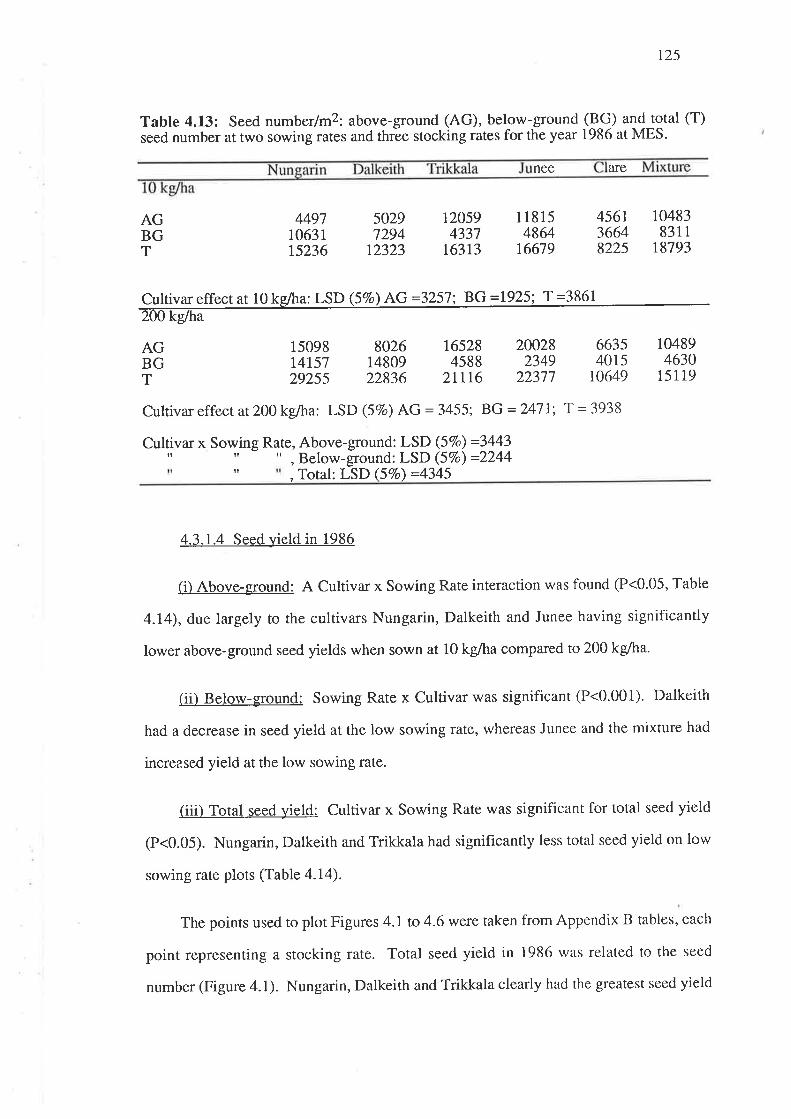
Table 4.13: Seed numberlmZ: above-ground (AG), below-ground (BG) and-total (T)seed number at two sowing rates and thrée stocking rates for the year 1986 at MES.
44911063115236
50291294
12323
120594337
r6313
nee
I 18154864
r6679
200282349
22317
are
456136648225
663s4015
r0649
125
10483831 1
r8193
AGBGT
Cultivar effect at 10 kg/hu' LSD (5%) AG :32WAGBGT
15098 8026 16528r4r57 14809 458829255 22836 21116
104894630
15119
Cultivar effect at200 kglha: LSD (57o) AG = 3455; BG = 2471;
Cultivar x Sowing Rate, Above-ground: LSD (57o) =3443" , Below-ground: LSD (57o) =2244
T = 3938
il, Total: LSD (57o) :4345
4.3.1.4 Seed yield in 1986
(i) Above-ground: A Cultivar x Sowing Rate interaction was found (P<0.05, Table
4.74), due largely to the cultivars Nungarin, Dalkeith and Junee having significantly
lower above-ground seed yields when sown at 10 kg/ha compared to 200 kg/ha.
(ii) Below-ground: Sowing Rate x Cultivar was significant (P<0.001). Dalkeith
had a decrease in seed yield at the low sowing rate, whereas Junee and the mixture had
increased yield at the low sowing rate.
(iii) Total seed yietd: Cultivar x Sowing Rate was significant for total seed yield
(P<0.05). Nungarin, Dalkeith and Trikkala had significantly less total seed yield on low
sowing rate plots (Table 4.14).
The points used to plot Figures 4.1 to 4.6 were taken from Appendix B tables, each
point representing a stocking rate. Total seed yield in 1986 was related to the seed
number (Figure 4.1). Nungarin, Dalkeith and Trikkala clearly had the greatest seed yield

r26
and seed numbers were highly related. The results were more variable for the cultivars
Junee, Clare and the mixture. Seedling number in 1987 was examined in relation to total
seed yield in 1986 @ig. a.Ð. Nungarin, Trikkala, the Mixture and Dalkeith required less
seed yield at 10 kglha sowing rate to establish the same or more seedlings compared to
the 200 kg/ha sowing rate. Dalkeith actually showed a negative correlation between total
seed yield and seedling number when sown at 2}Okglhain 1986. This indicates that the
seed yield was not limiting but some other factor, possibly a'blanketing effect' was
reducing the number of seedlings which emerged. Junee and Clare showed that seed
yield in 1986 had no influence on seedling number in 1987'
Total seed yield. in 1986 was clearly a determinant of to early herbage production in
1987 for the cultivars Nungarin and Dalkeith at both initial sowing rates (Fig. 4.3). Both
cultivars had greater early production on less seed yield at the initial sowing rate of 10
kg/ha compared to 200 kg/ha. Dalkeith, Trikkala and Clare clearly showed a positive
realtionship between increased seed yield resulting in higher herbage production atZ00
kg/ha. No such relationship existed for 10 kg/ha: however, generally the early herbage
production of Dalkeith, Trikkala and Clare was higher at 10 kg/ha compared to 200
kg/ha. Blanketing of seedlings is seen as a possible cause for reduced early herbage
production in 1987 when the initial (1986) sowing rate was 200 kg/ha even though the
seed yield was similar, or comparitively higher, than 10 kg/ha treatmeqts' The mixture
showed no response at either sowing rate.

Figure 4.1: The relationship between seed number and seed yield for eachcultivar at MES in 1986.
Legend: o 10 kg/ha4 200 kg/ha
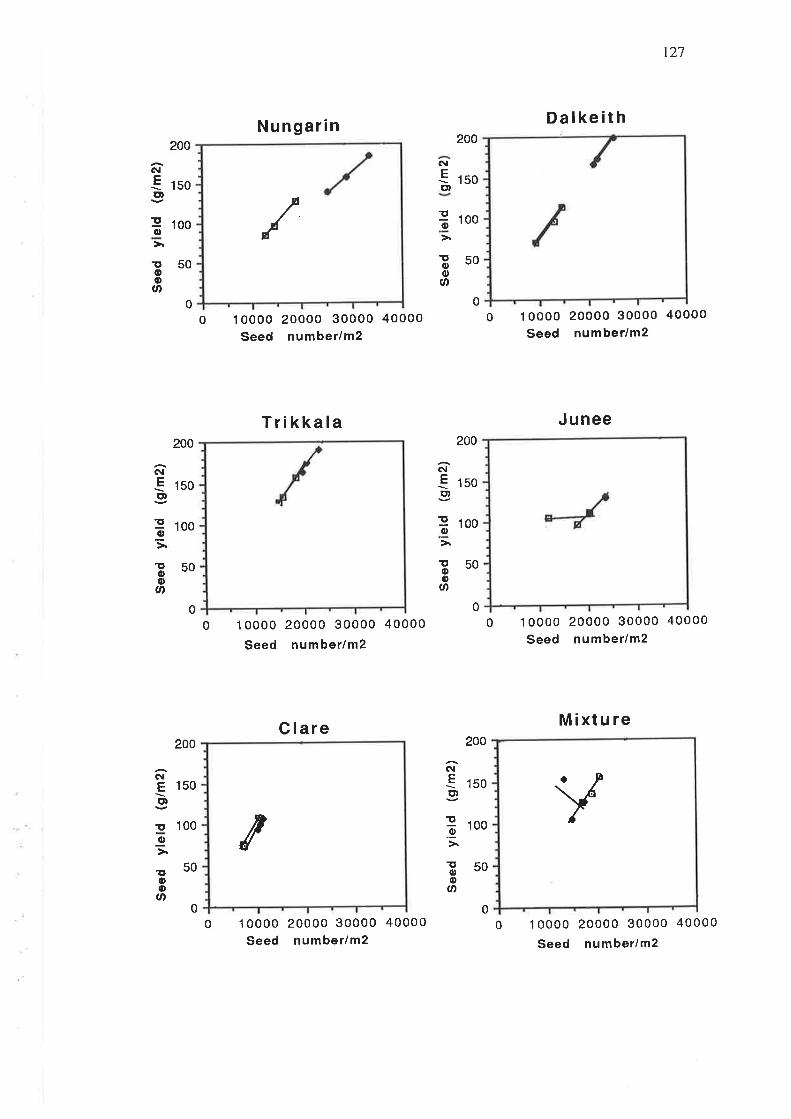
/
NEot
200
150
Nungarin
1 0000 20000 30000 40000Seed number/m2
Trikkala
1 0000 20000 30000 40000
Seed number/m2
C lare
1 0000 20000 30000 40000Seed number/m2
127
Da lke it h
1 oooo 20000 30000 40000Seed number/m2
Junee
1 oooo 20000 30000 40000Seed number/m2
Mixture
1 0000 20000 30000 40000
Seed number/m2
200
N
€ rsool
f, roo
0
200
N
€ lsoI3 rooo
f, too
rr 50oott,
ã50oU'
000
fi too
NEo)
';îtooU,
200
150
ãs0orn
50
0000
i50oU'
200
ôlE 150ct¡
p 100g
E50ooU'
0
200
ôl€ 150g¡
Ë 1oo
00
foPv
0

Figure 4.22 The relationship between seedling number in 1987 and total seedyield in 1986.
Legend: o 10 kglhaa 2W kdha
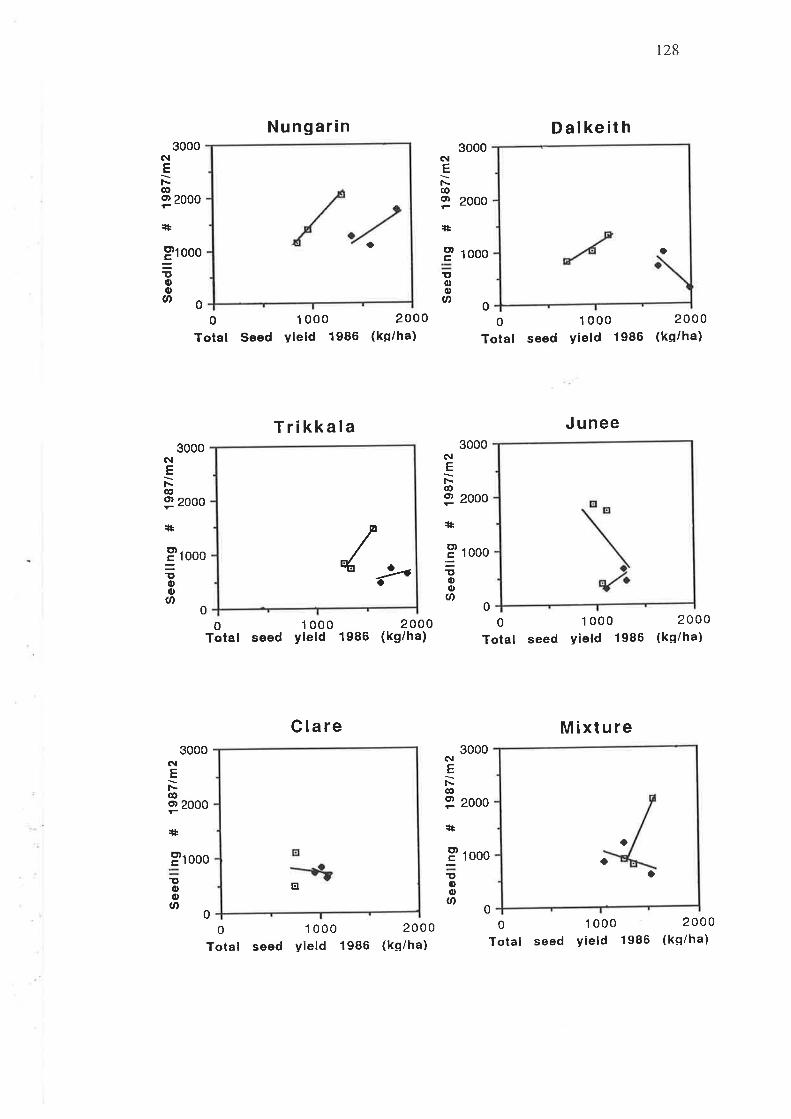
o
Nungarin D alke it h
t28
2000(kq/ha)
3000
2000
3000
2000
NEÌ\co(t)r
:Ît
NE
@o)
+
ptooo 3 roooîto0)Ø
Ittl,oU'
'ct
00
Total Seed1 000
yleld 19862000
(kq/ha)
00
Total1 000
seed yield 1986
oTotal seed
1 000yield 1986
0
Total seed
Junee
1 000 2000yield 1986 (kg/ha)
TrikkalaôlE
€Ot
+
Ito
3000
2000
NEF-@C"
3000
2000
.Plooo
0)Ø
+
I loooïtoo)Ø
002000
(kg/ha)
NE
@o)r
:*
3000
2000
3000
2000
C lare
1 000 2000seed yield 1986 (ks/ha)
ô¡Et-@O)
+
0)o
P looo
Mixture
1 000yield 1986
Proooîtoott)
0 0
0
Total
0
Total seed2000
(kq/ha)
o
/o
trO
aa
an

Figure 4.3: The relationship between total seed yield in 1986 andearly herbage production.
Legend: u 10 kg/haa 20O kg/ha
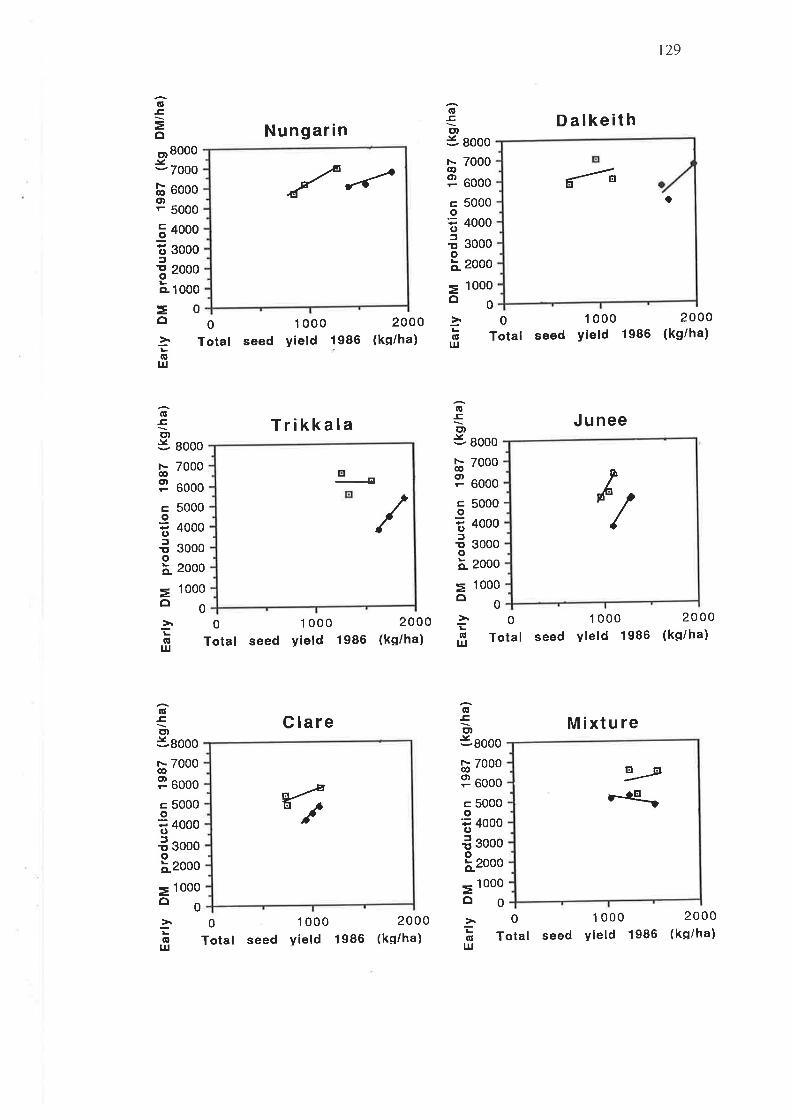
cIC)
=rc,oCL
=oà(t
LrJ
J!toCL
=ô
Lol¡l
8000
7000
6000
5000
4000
3000
2000
1 000
0
oE
=oct)v
o(t)rÊo=(,fItoCL
=o
L(út¡l
õEg¡.v
@ct)
cIC'a
rctoCL
=oà(EuJ
Nungarin
1 000 2000seed yield 1986 (kg/ha)
D alkeith
1 000seed yleld 1986
qtEÈ,5 sooo
¡- 7000@
3 oooo
129
2000(kg/ha)
5000
4000
3000
2000
1 000
0
0Total
0Total
8000
7000
6000
5000
4000
3000
2000
1 000
0
TrikkalaG-{otJ gooo
à 7000
3 oooo
c 5000oI +ooo
Junee
1 000yield 1986
3000
2000
1 000
0
0
Total seed1 000
yield 19862000
(ks/ha)0
Total seed
20 00(ks/ha)
6EÈtY-sooo
¡- 7000ø3 oooo
c 5000oI 4ooo
å sooooä2ooo
5 1000oo
eEE)--eooo
È 7000
P aooo
c 5000oE 4000
å sooooä2000
= 1oo0
oO
C lare
0 1000Total seed Yield 1986
2000(kq/ha)
0
Total seed
Mixture
1 000yield 1986
2000(ks/ha)
GIt¡J
àG¡¡l
"/-^/ ol"
/
-4
E
Å/
{. aa
Eld
.4-,
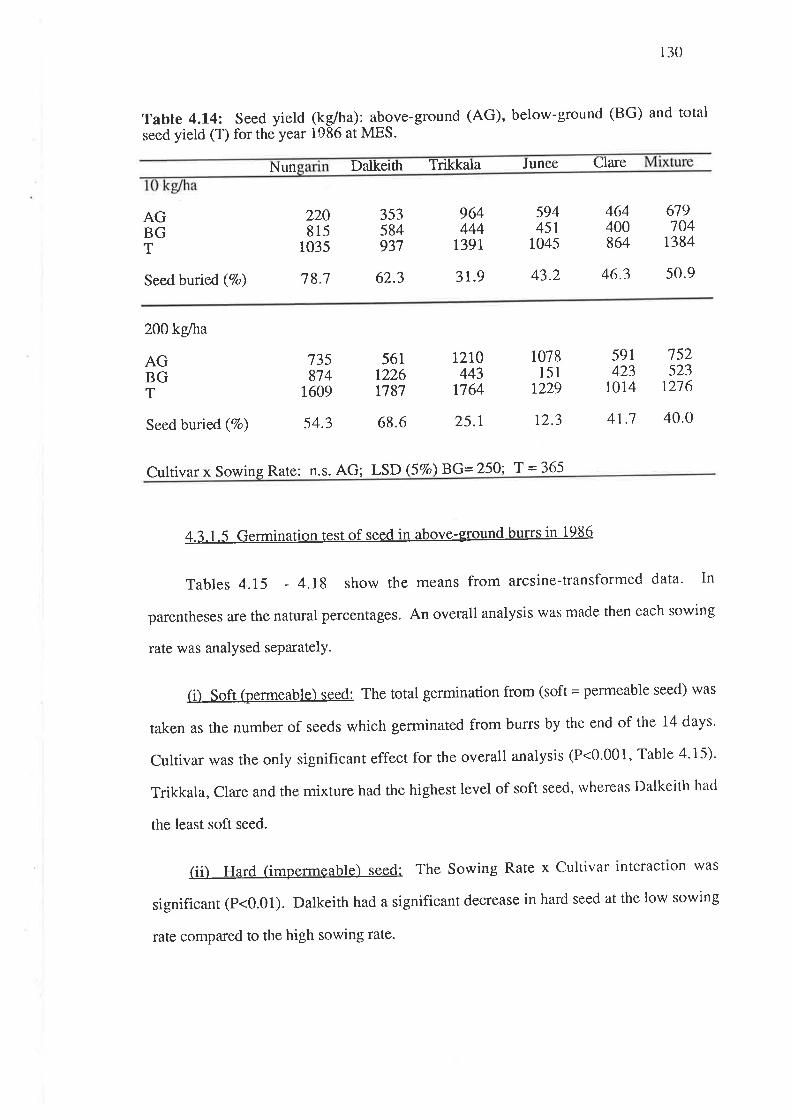
130
Table 4.14: Seed yield (kg/ha): above-ground (AG), below-ground (BG) and total
seed yield (T) for the year 1986 at MES.
Nun Dalkeith Trikkala Junee Ctare
AGBGT
220815
1035
964444
r39l
59445r
1045
464400864
46.3
353584937
679704
t384
Seed buried (7o) 78.7 62.3 31.9 43.2 50.9
200 kg/ha
AGBGT
Seed buried (7o) s4.3 68.6 25.r 12.3 41.7 40.0
735874
1609
561t226n87
r2t0443
1764
1078151
t229
591423
1014
752523
1276
Cultivar x Sowing Rate: n.s. AG ; LSD 6Vo\ BG=250; T=365
4.3.1.5 Gennination test of seed in above-ground burrs in 1986
Tables 4.15 - 4.18 show the means from arcsine-transformed data. In
parentheses are the natural percentages. An overall analysis was made then each sowing
rate was analysed seParatelY.
(i) Soft (permeable) seed: The total germination from (soft = permeable seed) was
taken as the number of seeds which germinated from burrs by the end of the 14 days'
Cultivar was rhe only signif,rcant effect for the overall analysis (P<0.001, Table 4'15)'
Trikkala, Clare and the mixture had the highest level of soft seed, rvhereas Dalkeith had
the least soft seed.
(ii) Hard (impermeable) seed: The Sowing Rate x Cultivar interactron was
significant (p<0.01). Dalkeith had a significant decrease in hard seed at the low sowing
rate compared to the high sowing rate.
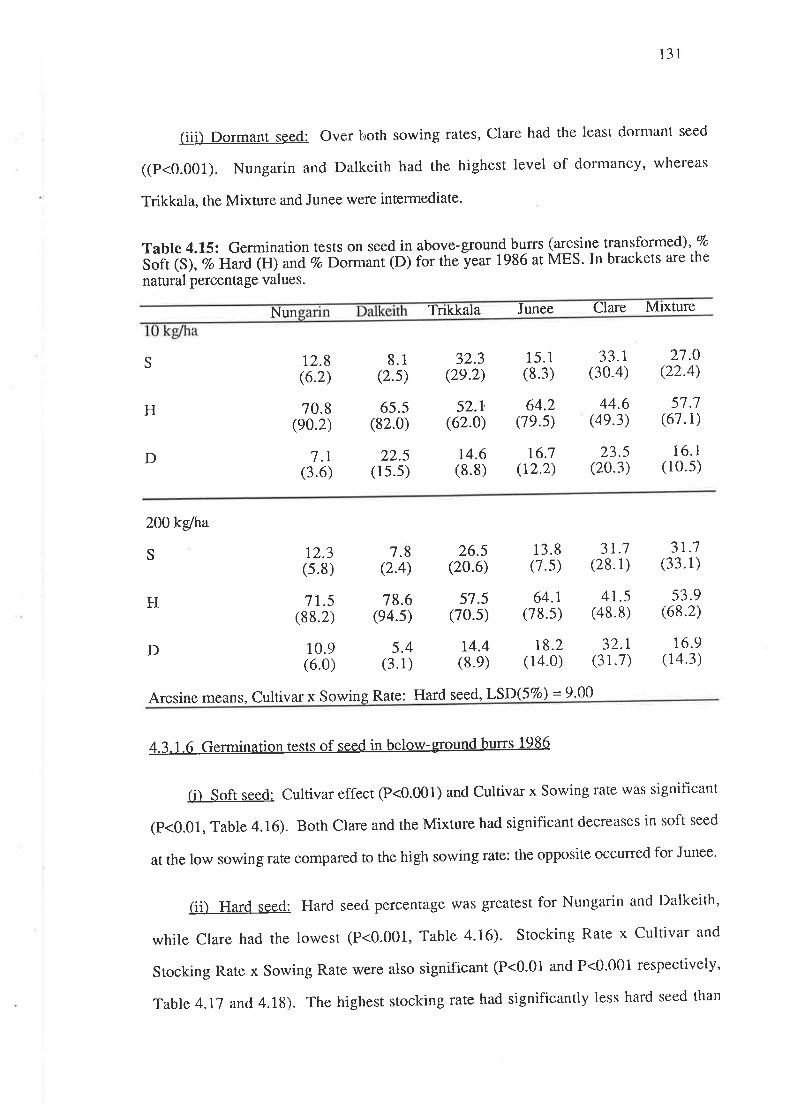
131
(iii) Dormant seed: Over both sowing rates, Clare had the least dornrant seed
((P<0.001). Nungarin and Dalkeith had the highest level of dormancy, whereas
Trikkala, the Mixture and Junee were intermediate.
Table 4.15: Germination tests on seed in above-ground burrs (qry¡in-e transformed)' Eo
S.rt fSl, Ø nar¿ Cii-""12, -ói.-ant
(D) for the-year 1986 at MES. In brackets are the
natural percentage values.
Nun Trikkala Junee Clare Mtxture
t2.8(6.2)
7.1(3.6)
(2.s)32.3
(2e.2)
52.L(62.0)
15.1(8.3)
64.2(7e.5)
r6.7(r2.2)
33.r(30.4)
2t.o(22.4)
57.7(67.1)
8.1
70.8(e0.2)
65.s(82.0)
22.5(15.5)
r4.6(8.8)
44.6(4e.3)
23.s(20.3)
16.1(r0.5)
S
H
D
200kglha
S 12.3(5.8)
71.5(88.2)
26.s(2o.6)
57.5(70.s)
14.4(8.e)
13.8(7.s)
37.1(33.1)
53.9(68.2)
16.9(14.3)
7.8(2.4)
64.r(78.5)
31.7(28.1)
4t.5(48.8)
78.6(e4.5)
5.4(3.1)
H
D 18.2(14.0)
32.r(31.7)
10.9(6.0)
Arcsine means, Cultivar x Sowing Rate: Hard seed, LSD(57o) = 9.00
4.3.1.6 Germination tests of seed in below-ground burrs 1986
(i) Soft seed: cultivar effect (P<0.001) and cultivar x Sowing late was significant
(p<0.01, Table 4.16). Both Clare and the Mixture had significant decreases in soft seed
at the low sowing rate compared to the high sowing rate: the opposite occurred for Junee'
(ii) Hard seed: Hard seed percentage was greatest for Nungarin and Dalkeith'
while Clare had the lowest (P<0.001, Table 4-16). Stocking Rate x Cultivar and
stocking Rate x Sowing Rare were also significant (P<0.01 and P<0.001 respectively,
Table 4.17 and.4.1S). The highest stocking rate had significantly less hard seed than
t32
both the medium and low stocking rates but only at the sowing rate 10 kg/ha' Dalkeith
and the Mixture had signif,rcant increases in hard seed as the stocking rate deoreased, the
reverse happened for Clare. Nungarin and Trikkala were unresponsive to stocking rate'
(iii) Dormant seed: Both Cultivar and Cultivar x Sowing Rate interactions were
significant (P<0.001 and P<0.05 respectively, Table 4.16). The dormant seed of the
mixtute had significantly decreased at the high sowing rate compared to the low sowing
rate. Stocking Rate x Cultivar and Stocking Rate x Sowing Rate were also significant
(both P<0.01, Table 4.17 and.4.18). Low-sowing-rate plot areas had significantly more
dormant seed than high-sowing-rate ptots if they were in high stocking rate aleas' In low
stocking rate ¿ìreas the reverse occurred. Dormant Seed increased for Dalkeith and Clare
as stocking rate decreased, the opposite was found for Trikkala' Nungarin and the
mixture were unresponslve.
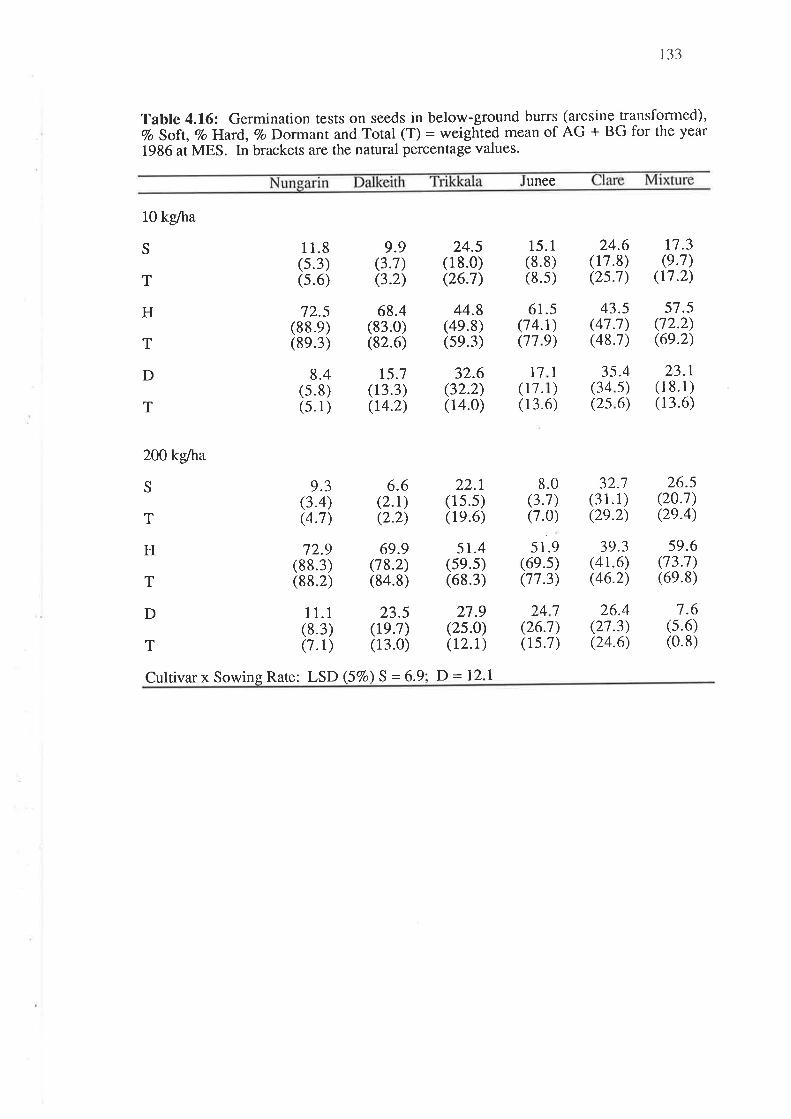
r33
Table 4.16: Germination tests on seeds in below-ground burrs (arcsine transfomred),7o Soft, 7o ]Hard, 7o Dormant and Total (T) = weighted mean of AG + BG for the year
1986 at MES. In brackets are the natural percentage values.
unee
10 kg/ha
S
T
H
T
D
T
200kglha
S
T
H
T
D
T
24.5(18.0)(26.7)
1 1.8(s.3)(s.6)
.48)1)
85.5.
24.6(r7.8)
9.9
(2s.1)(3.7)(3.2)
I)
15.1(8.8)(8.5)
17.3(e.1)17.2)(
72.5(88.e)(8e.3)
68.4(83.0)(82.6)
15.1(13.3)(r4.2)
44.8(4e.8)(se.3)
32.6(32.2)(14.0)
43.5(41.7)(48.7)
(34(2s
32.7(31. 1 )(2e.2)
39.3(4r.6)(46.2)
26.4(27.3)(24.6)
57.5(72.2)(6e.2)
1
(7 4.6
(17
t717.13.
23.r(1 8.1)(13.6)
.4s)6)
35
.51)e)
6)
(7.0)
51.9(6e.5)(77.3)
( (((
9.3(3.4)(4.7)
72.9(88.3)(88.2)
26.5(20.7)(2e.4)
1.6(s.6)(0.8)
724.13)1)
l1(8.(7.
6.6 22.r(2.r) (15.s)(2.2) (1e.6)
69.9 5r.4(18.2) (se.s)(84.8) (68.3)
8.0(3.7)
59.6(73.7)(6e.8)
23.5 27.9(r9.7) (2s.0)(13.0) (r2.1)
(26.7)( 1s.7)
Cultivar x Sowins Rate: LSD (57o )S=6.9; D=12.1
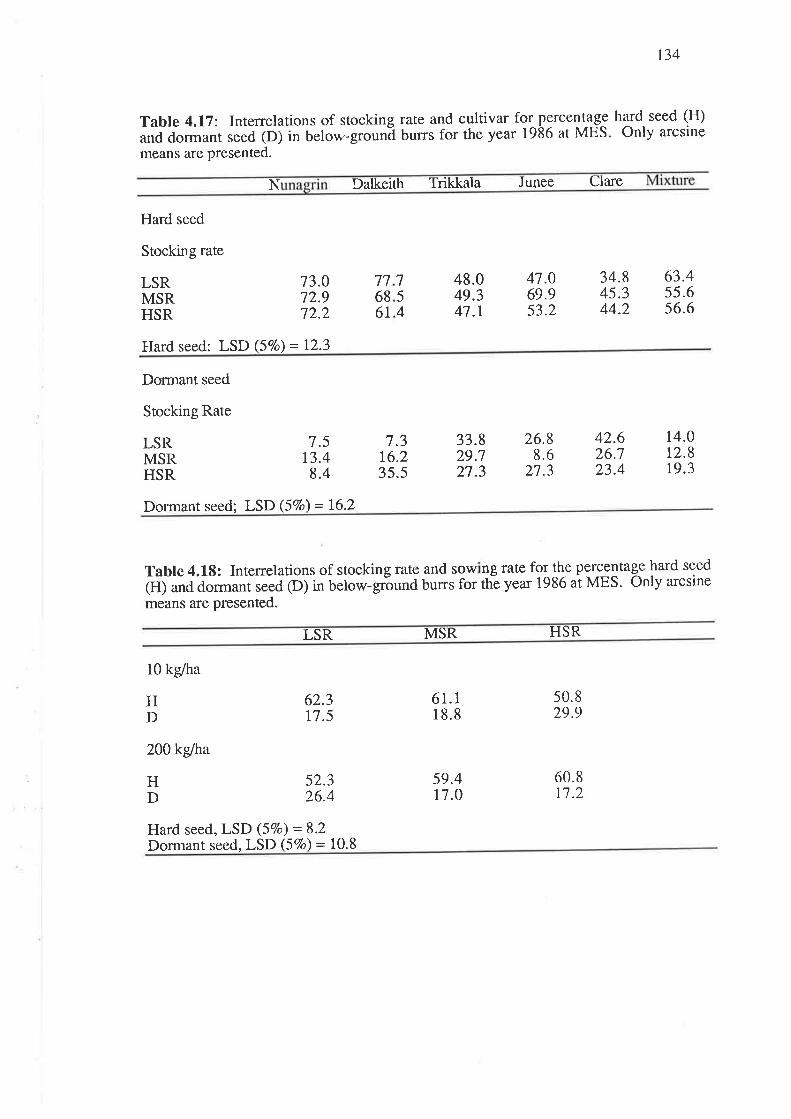
Table 4.17: Interrelations of stocking rate and cultivar for percentage
und dor-unt seed (D) in below-grounã burrs for the year 1986 at MES
means are presented.
t34
hard seed (H)Only arcsine
N Dalkeith Trikkala Junee Clare
Hard seed
Stocking rate
LSRMSRHSR
13.012.912.2
716861 53.2
754
48.049.347.1
47.069.9
34.845.344.2
63.455.656.6
Hard seed: LSD (57o) = 12.3
Dormant seed
Stocking Rate
LSRMSRHSR
1.5t3.48.4
7.3r6.235.5
33.829.727.3
14.012.819.3
26.88.6
27.3
42.626.723.4
Dormant seed; LSD (57o \ = 16.2
Table 4.18: Interrelations of stocking rate and sow ng rate for th-e pgrcentaqe
(II) and dormant seed @) in below-gróund burrs for thê year 1986 at MES' On
means are presented.
hard seedly arcsine
LSR MSR HS R
10 kg/ha
200 kg/ha
HD
HD
62.317.5
52.326.4
61.118.8
59.417.O
50.829.9
60.811.2
Hard seed, LSD (57o) = 8.2Dormant seed, LSD (57o) = 10.8

r35
4.3.1.7 Regeneration of sub clover in 1987
The regeneration data in 1987 were analysed by using the overall analysis of
variance, then analysing separately for each sowing rate (to give a better comparison
between cultivars within the same sowing rate). For the purpose of analysis, the data
needed log transformation: however, the natural values will be presented, with any
comparisons based on the log-transformed analyses. Initial sowing rate was highly
significant (P<0.001, transformed data). The high sowing rate treatments had
significantly fewer seedlings than the low sowing rate treatinents (793 and 1153
respectively).
A Sowing Rate x Cultivar interaction was also significant (P<0.05, transformed
data) (Table 4.19). The cultivars Dalkeith, Trikkala, Junee and the Mixture had
significantly more seedlings on low sowing rate treatments in comparison with the high
sowing rate treatments.
Nungarin had the most seedlings while Junee had the least number of seedlings on
plots sown originally at20O kg/ha. At the initial sowing rate of 10 kg/ha, seedling
numbers were reduced significantly with higher stocking rates (1635 #lm2; LSR> 1089
#lrfl: MSR> i35 #lmz HSR). Nungarin also had the highest number of seedlings at the
initial sowing rate of 10 kglha and Clare had the lowest number.
Seedling numbers at the beginning of 1987 determined early herbage production in
1987 although there were some erratic data (Fig 4.4). Nungarin showed clearly that as
seedling numbers increased so did the herbage production. Dalkeith showed at the 200
kg/ha sowing rate a decrease in herbage production as the seedling number increased'
Trikkala, Junee, Clare and the Mixture had the best herbage production from 10 kg/ha
plots even though 200 kg/ha plots had similar plant numbers. Again, this is possibly the
result of a "blanketing effect".

Figure 4.4: The relationship between seedling number and early herbageproduction in 1987.
Legend: o 10 kg/ha<) 200kg/ha
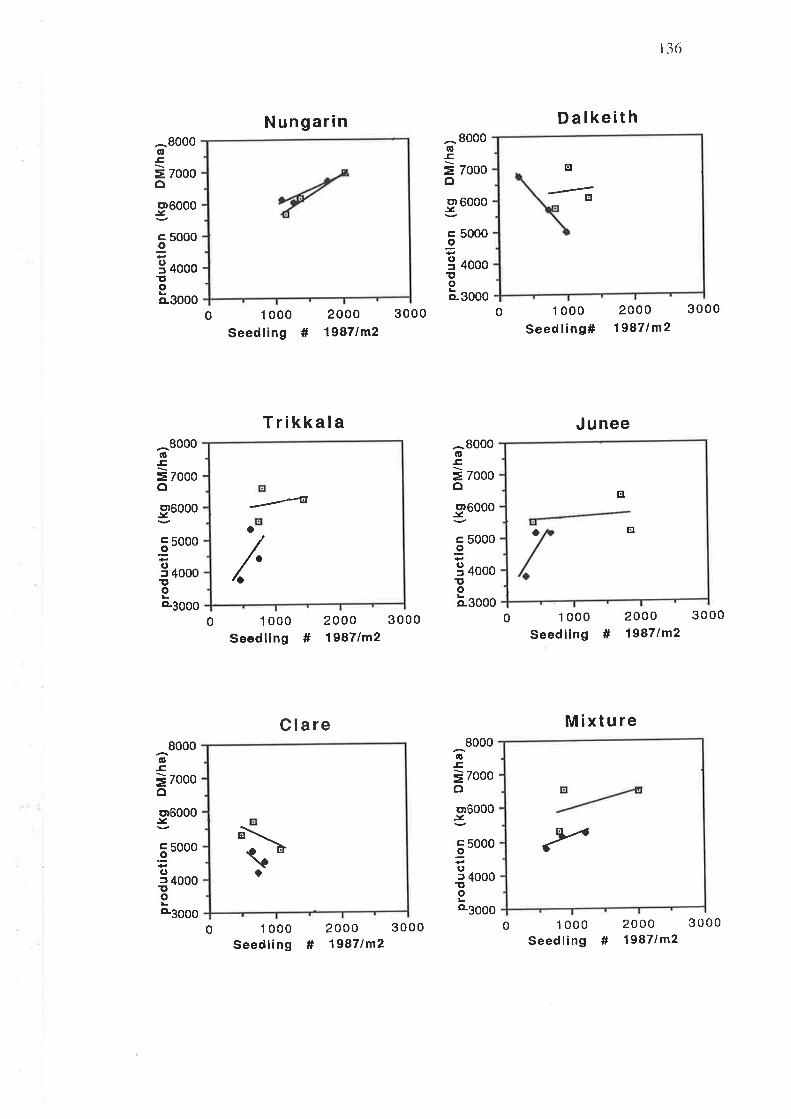
N ungarin D a lkeit h
136
200019871m2
8000
7000
6000
5000
4000
6-c
=oo).v
c,oof
^ 80ooclEÈ zooocl
u¡ 6000.Y
luoooo
3 +oooÌtoäsooo
!oo.3000
00 1 000Seedling #
200019871m2
3000 1 000Seed ling#
3000
30001 000
Seedling #2000 300019871m2
Junee
1 000Seedling #
200019871m2
Trikkala8000
7000
6000
5000
4000
(ú.c,
=,c¡
o).Y
c.9o:tõoL
5000
4000
(úE
=ô
Ê,o(,=roo
8000
7000
E6000
e3000 o-3000
0 0
Clare
1 000Seedling #
Mixtu re8000 8000
(úEi zoooo
o.Ê
=ô7000
or6000-l
.ã s000
C'f 4000îto
s¡6000.Y
q3ooo
5000
4000
ÊIoaÌtoL
2000 300019871m2
1 000Seed I i ng
2000# 19871m2
E
¡t
/.
o--¿4
O E¡
EI
o
"è ve3ooo
0 0 3000

t3'7
Table 4.19: Regeneration of sub clover seedlings counted on 20 May l9tì7 at MES
(All data show plants /m2).
N Dalkeith Trikkala Junee Clare Mixture
atin 1986
t52gc 1058b 1004b l327b,c 753a 1246b'c
Sown a¡.2O0 kg/hain 1986
1390c 672a,b 609a,b 46Ia ßtb 888b,c
differences (P<0.05), on lograte only)
4.3.2 Seed harvest 1987
Burr numbers for the 1987 season are presented in Appendix B, Tables 6 - 8'
4.3.2.1 Number of seeds /burr in 1987
(i) Above-ground: Cultivar and Cultivar x Sowing Rate were significant (P<0.01
and p<0.05 respectively). Clare in the second year's seed harvest had signihcantly more
seeds/above-ground burr than the other cultivars on plots initially sown at 200 kg/ha
(Table 4.20).
(ii) Below-ground: (See Table 4.20). It should be noted that burrs from the 1986
season would be included because of the diff,rculty in segregating burrs produced in 1986
from 1987 burrs. Cultivar and Sowing Rate main effects were significant (P<0.001 and
P<0.05 respectively). Plots sown originally at 10 kg/ha had more seeds per btrrr 1'74
seeds/burr compared to 1.52 seeds/burr when sown at 200 kglha in 1986.
Cultivar x Sowing Rate was also significant (P<0.05). Nungarin and Dalkeith had
the most seeds/burr from plots initially sown at the high rate (P<0'001)' This result
contrasts with data from above-ground burrs, where both Nungarin and Dalkeith were
among the lowest. Junee and Clare had significant reductions in the rlumber of
seeds/burr at the original sowing rate 200 k/ha-
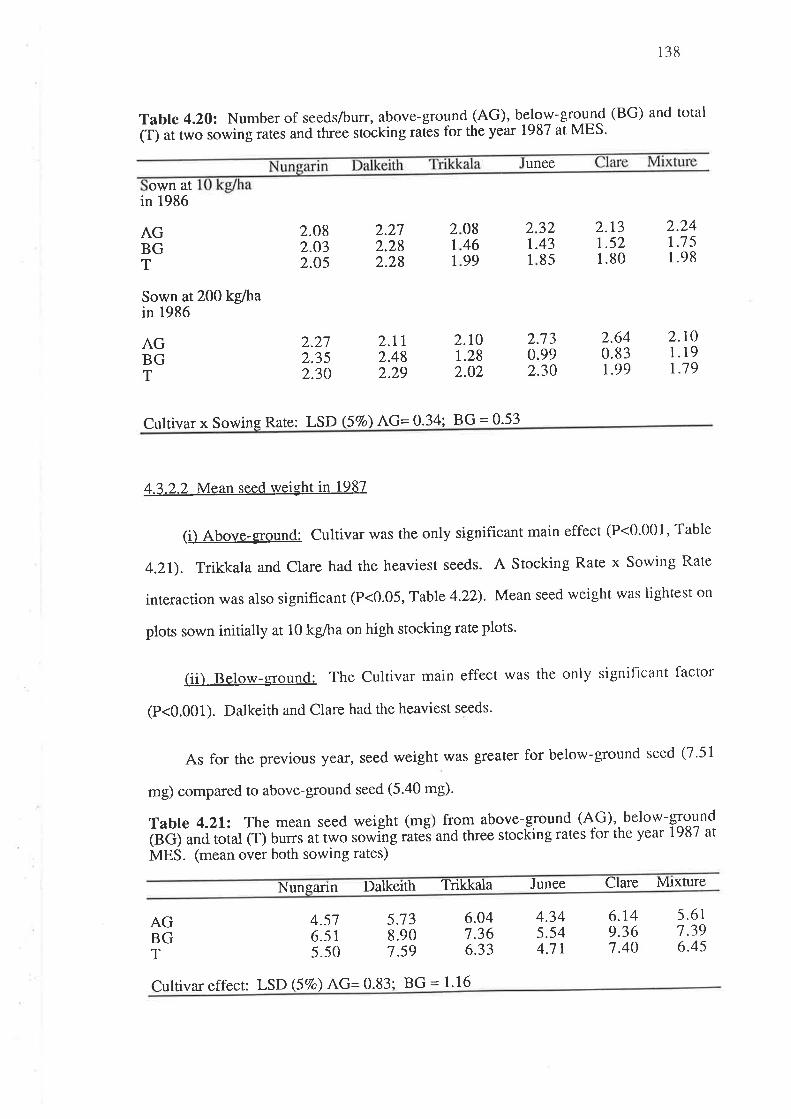
Table 4.20: Number of seeds/burr, above-ground (AG), below-ground (BG) and total
tÐ uit*o sowing rates and three stocking raies for the year 1987 at MES.
2.082.O32.05
2.212.352.30
2.272.282.28
2.ll2.482.29
unee
2.730.992.30
2.t3t.521.80
l3tì
2.241.7 51.98
2.101.191.79
own atin 1986
AGBGT
Sown at 200 kglhain 1986
AGBGT
084699
21
1
21
1
32.4385
2.r0r.282.O2
2.640.83r.99
Cultivar x Sowing Rate: LSD (57o) AG= 0.34; BG = 0.53
4.3.2.2 Mean seed weight in 1987
(i) Above-ground: Cultivar was the only significant main effect (P<0'001, Table
4.21). Trikkala and Clare had the heaviest seeds' A Stocking Rate x Sowing Rate
interaction was also significant (P<0.05, Table 4.22). Mean seed weight was lightest on
plots sown initially at 10 kg/ha on high stocking rate plots'
(ii) Below-ground: The Cultivar main effect was the only significant factor
(P<0.001). Dalkeith and Clare had the heaviest seeds'
As for the previous yeal, seed weight was gleater for below-ground seed (7'51
mg) compared to above-ground seed (5.40 mg).
Table 4.21: The mean seed weight (mg) from above-ground (AG), below-ground
(BGi;rd rótal (T) Uu..s ait*o ,o*iîg ràtei'and three stocliing rates for the year 1987 at
MES. (mean over both sowing rates)
Nungarin Dalkeith Trikkala Junee Clare Mixture
AGBGT
4.st 533 6.046.51 8.90 7.365.s0 7.59 6.33
4.345.544.7 |
6.t49.367.40
5.617.396.45
Cultivar effect: LSD (57o) AG:0.83; BG = 1.16
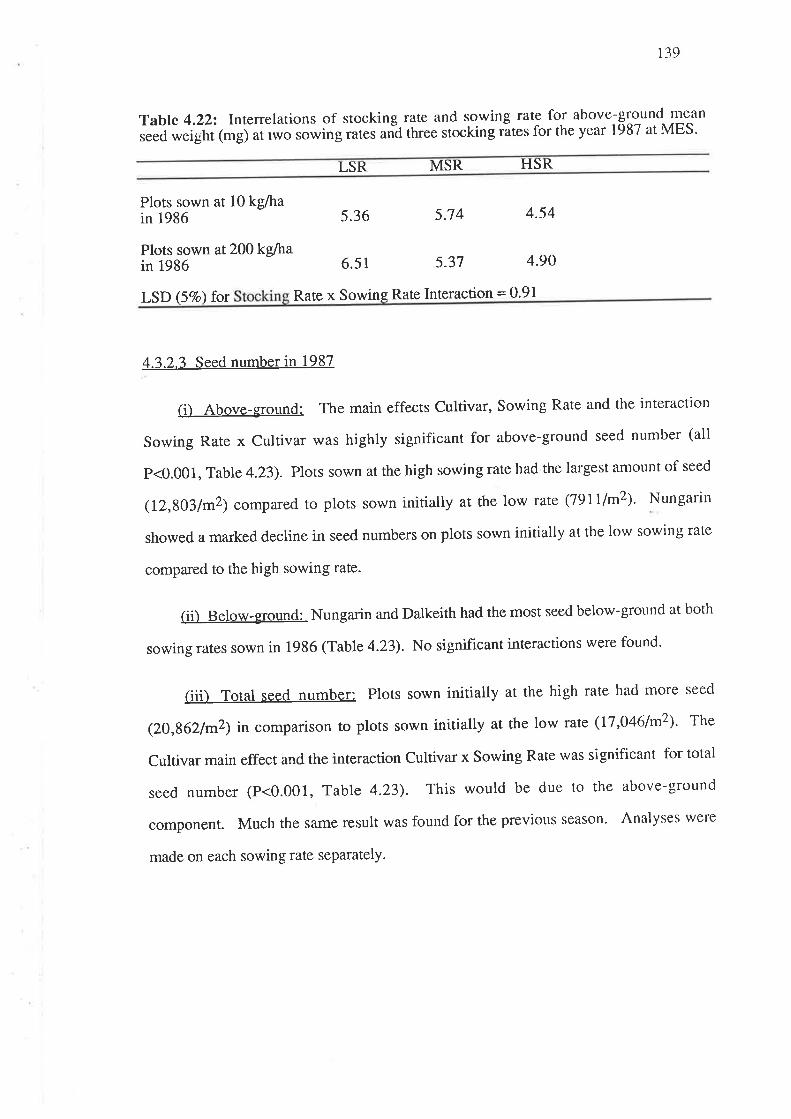
139
Table 4.22'. Interrelations of stocking rate and sowing rate for above-gro-und mean
r"ø *"igttt (mg) at two sowing .ut", uñd three stocking rãtes for the year 1987 at MES'
LSR MSR HSR
Plots sown at 10 kg/hain 1986
Plots sown at 200 kg/hain 1986
5.74 4.54
s.37 4.90
5.36
6.51
LSD (57o ) for Rate x Sowing Rate Interaction = 0.91
4.3.2.3 Seed number in 1987
(i) Above-ground: The main effects Cultivar, Sowing Rate and the interaction
Sowing Rate x cultivar was highly significant for above-ground seed number (all
p<0.001, Table 4.23). Plots sown at the high sowing rate had the largest an.ìount of seed
(12,803/m2) compared to plots sown initially at the low tate (79lum\' Nungarin
showed a marked decline in seed numbers on plots sown initially at the low sowing rate
compared to the high sowing rate.
(ii) Below-ground: Nungarin and, Dalkeith had the most seed below-ground at both
sowing rates sown in 1986 (Table 4.23). No significant interactions were found'
(iiil Total seed number: Plots sown initially at the high rate had more seed
(ZO,B62/y2¡ in comparison to plots sown initially at the low rate (17,0461n'P). The
Cultivar main effect and the interaction Cultivar x Sowing Rate was significant for total
seed number (P<0.001, Table 4.23). This would be due to the above-ground
component. Much the same result was found for the previous season' Analyses were
made on each sowing rate separately.
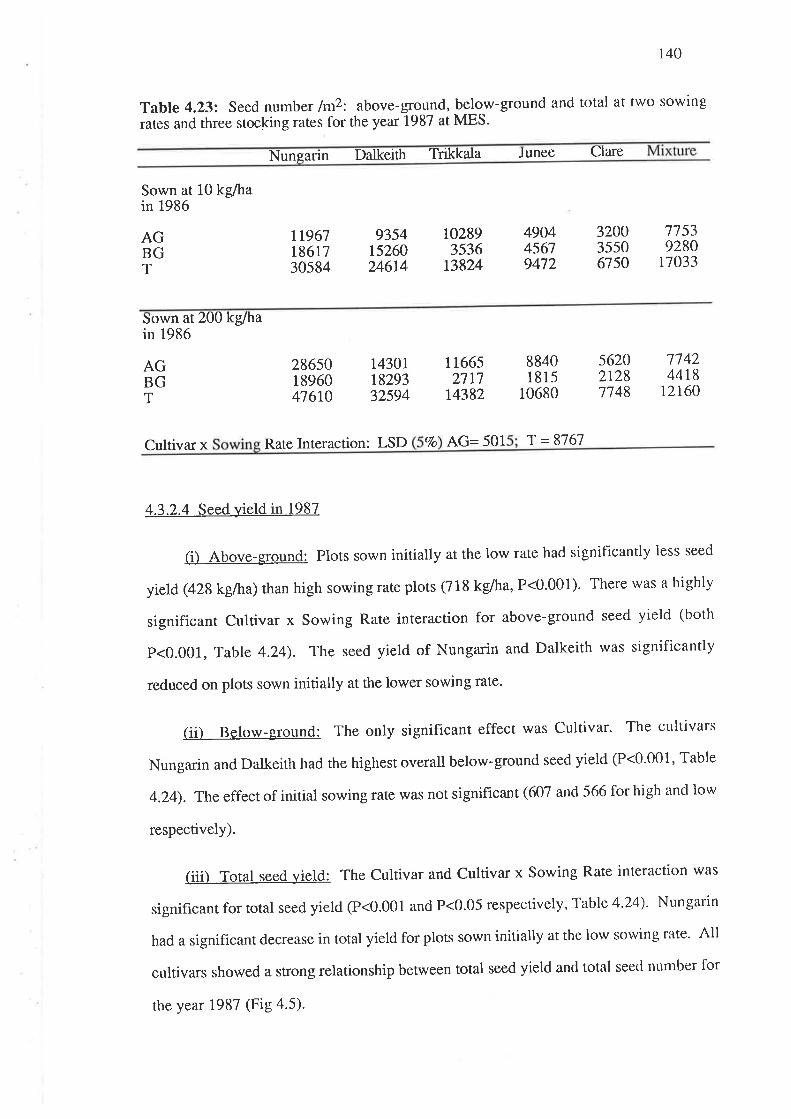
r40
Table 4.23: Seed numb er /n'P: above-ground, below-ground and total at two sowlng
rates and three stocking rates for the year 1987 at MES'
Nungarin Dalkeith Trikkala Junee Clare
Sown at 10 kg/hain 1986
AGBGT
1t9611861730s84
9354r5260246t4
102893536
13824
490445679472
320035506750
77539280
t7033
Sown atin 1986
AGBGT
ZOIJkglha
286501896047610
t430rr829332594
1 16652717
t4382
8840I 815
10680
56202r287148
17424418
12r60
Cultivar x Rate Interaction: LSD 7o AG= 501 'l = 8767
4.3.2.4 Seed yield in 1987
(i) Above-g¡ound: Plots sown initially at the low rate had significantly less seed
yield (428 kglha) than high sowing rate plots (718 kg/ha, P<0.001)' There was a highly
significant Cultivar x Sowing Rate interaction for above-ground seed yield (both
P<0.001, Table 4.24). The seed yield of Nungarin and Dalkeith was significantly
reduced on plots sown initially at the lower sowing rate'
(ii) Below-ground: The only significant effect was Cultivar' The cultivars
Nungarin and Dalkeith had the highest overall below-ground seed yield (P<0'001' Table
4.24). The effect of initial sowing rate was not significant (607 and 566 for high and low
respectively).
(iii) Totat seed yield: The cultivar and cultivar x Sowing Rate interaction was
significant for total seed yield (P<0.001 and P<0.05 respectively, Table 4'24)' Nungarin
had a signihcant decrease in total yield for plots sown initially at the low sowing rate' All
cultivars showed a sÍong relationship between total seed yield and total seed ntlmber for
the year 1987 (Fig 4.5).

Figure 4.5: The dependence of seed yield on seed number at MES in 1987.
Legend: tr lOkg/haa 200 kg/ha
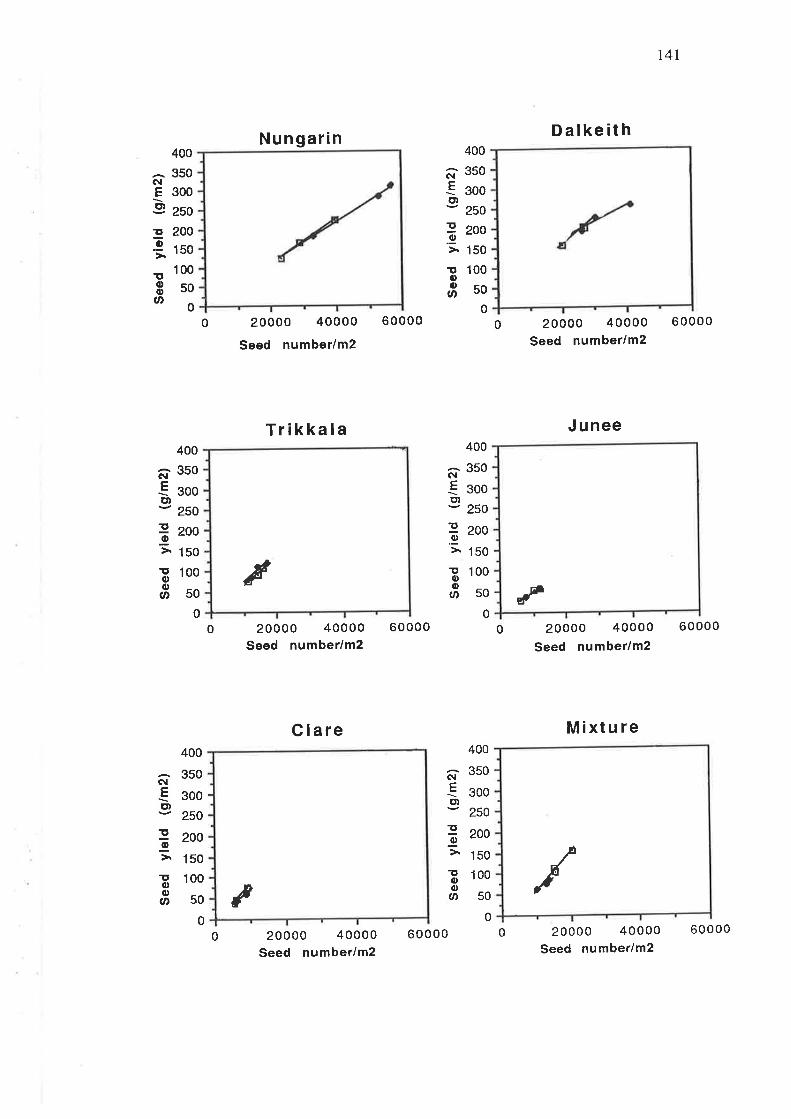
t4l
400
^ 350ôtE 300
Þ zso
g 200
T rso
Nungarin
20000 40000
Seed number/m2
Trikkala
20000 40000Seed number/m2
C lare
60000
60000
Dalkeith
20000 40000Seed number/m2
J unee
20000 40000Seed number/m2
Mixture
20000 40000Seed number/m2
400
350
300
250
200
NEo)
!õ> 150
!ooU'
100
50
0
!0,og,
100
50
00
400
^ 350N
€ soog¡- 250
fi zoo> 150
3 100
8so0
60000
60000
0
400
350
300
250
NEctt
ã zoo> 150
I 100
Eso0
400
^ 350N€ sooE)v 250
! 2ooo'; 1so
00
400
350
300
250
200
150
100
50
0
NEo)
9g
T'0,q)
U'
T'ooa
100
50
000 20000 40000
Seed number/m2
fElld
iÂ
/
60000 60000

Figure 4.6: The dependence of seedling number in 1988 on total seed yieldin 1987 at MES.
lægend: n 10 kg/ha) zDkg/ha
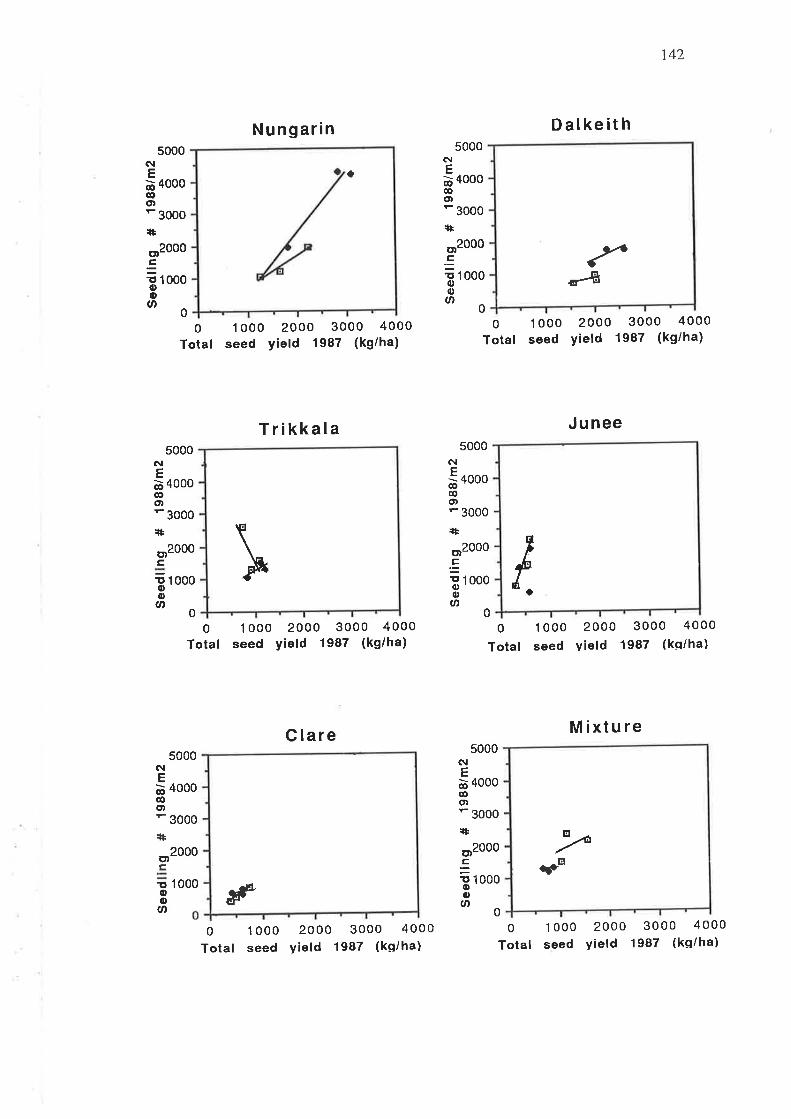
o
5000NEõ 4000oo)- 3ooo{tor20o05! tooooU'
0
Nungarin
o 1 0oo 2000 3000 4000Total seed Yield 1987 (kg/ha)
142
D alke it h
1 ooo 2000 3000 4000seed yield 1987 (kg/ha)
Junee
1 ooo 2000 3000 4000
seed vield 1987 (kq/ha)
NE@@d)
+
EÎtooü,
o)2000
5000
4000
3000
000
0
1
0Total
Trikkala5000
4000
3000
5000
4000
3000
NE@@ot
:tf
(\¡E@@o)
+
cIt0)oØ
õ)2000Ê
o)2000
11 1 000ot¡,U,
0
000
0
1
0Total
1 ooo 2000 3000 4000seed yietd 1987 (kg/ha)
0
Total
ôtE@@q)
:sh
c
3000
5000NEò 4000@q)
:lÈ
o¡2000E
Eo0,U,
1 000
Clare
2000 3000 4000yield 1987 (kq/ha)
Mixture
1 000 2000 3000 4000seed yield 1987 (ks/ha)
5000
4000
3000
Ð2000
1' 1000o6'
0
0
Total1 000seed
0
Total
ã-Br
þ i.
ãP.tEv
Ø
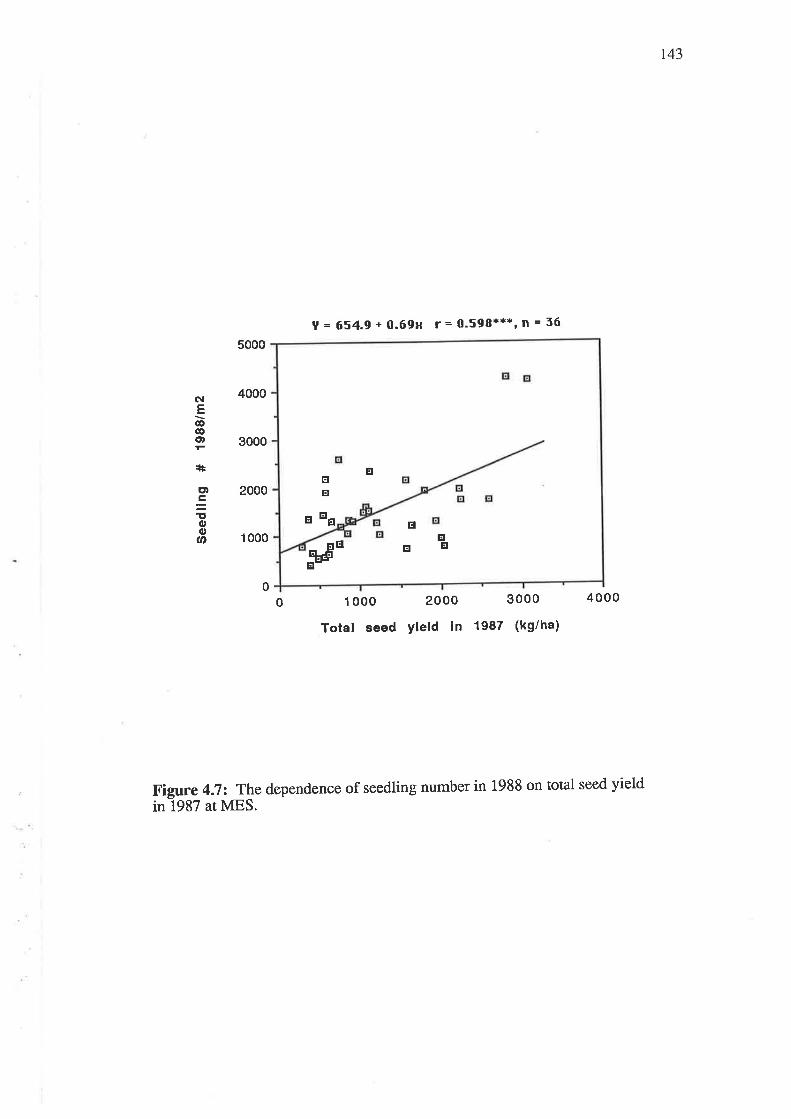
t43
4000
5000
3000
2000
1 000
Y = 654.9 + 0.69¡r r= 0.598***,n = 56
1 ooo 2000 3000
Total seed Yield in 1987 (kg/ha)
NE€@o)
+aDÊ,
1to0tU'
00 4000
Figure 4.72 Thedependence of seedling number in 1988 on total seed yield
in 1987 atMES.
gEq
EE
frËE
EE
E
E
E
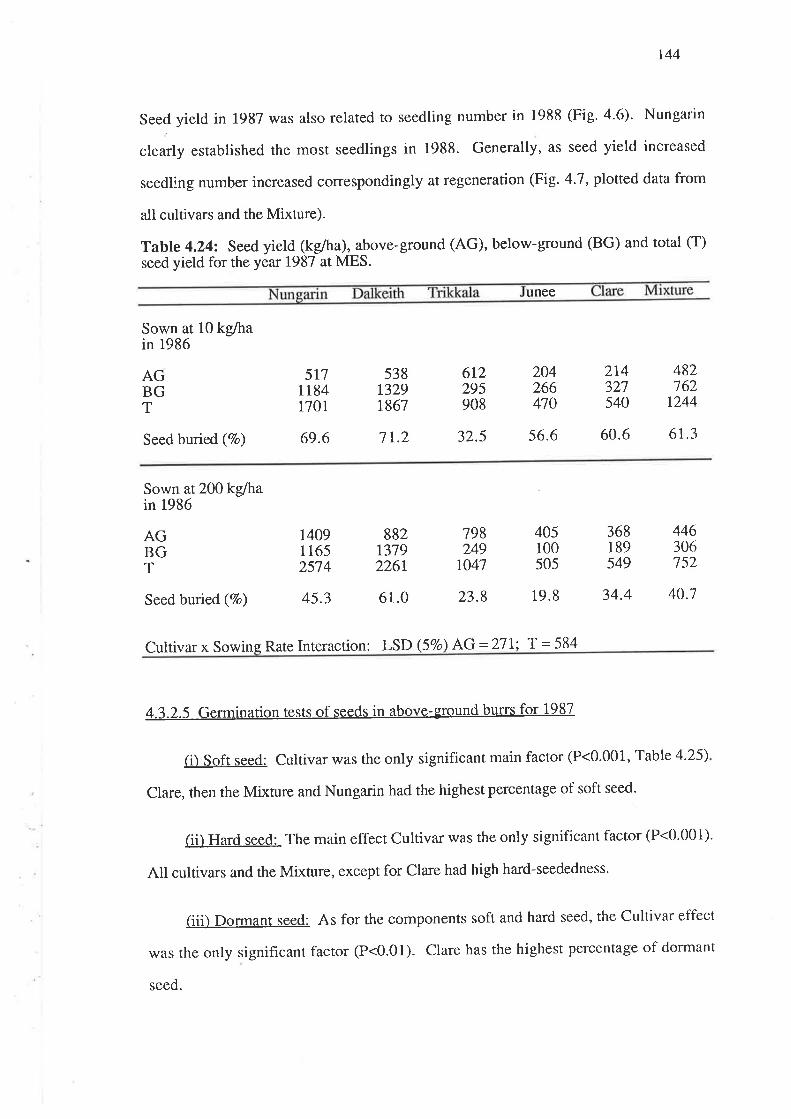
144
Seed yield in 1987 was also related to seedling number in 1988 (Fig. a.6). Nr-rngarin
clearly established the most seedlings in 1988. Generally, as seed yield increased
seedling number increased correspondingly at regeneration (Fig. 4.7, plotted data from
all cultivars and the Mixture).
Table 4.24: Seed yieldseed yield for the year 19
(kg/ha), above-ground (AG), below-ground (BG) and total (T)
87 at MES.
unee
Sown at 10 kg/hain 1986
204266470
AGBGT
5111 184t70r
53813291867
612295908
214321540
482762
r244
Seed buried (7o) 69.6 t r.2 32.5 56.6 60.6 61.3
Sown at200 kg/hain 1986
AGBGT
r4091 1652514
882r379226t
798249
r041
405100505
368189s49
446306752
Seed buried (7o) 45.3 61.0 23.8 19.8 34.4 40.1
Cultivar x Sowing Rate Interaction: LSD (5Vo\ AG =271: T = 584
4.3.2.5 Gennination tests of seeds in above-ground burrs for 1987
(i) Soft seed: Cultivar was the only significant main factor (P<0.001, 'fable 4.25)
Clare, then the Mixture and Nungarin had the highest percentage of soft seed'
(ii) Hard seed: The main effect Cultivar was the only significant factor (P<0.001).
All cultivars and the Mixture, except for Clare had high hard-seededness.
(iii) Dormant seed: As for the components soft and hard seed, the Cultivar effect
was the only signifrcant factor (P<0.01). Clare has the highest percentage of dormant
seed.
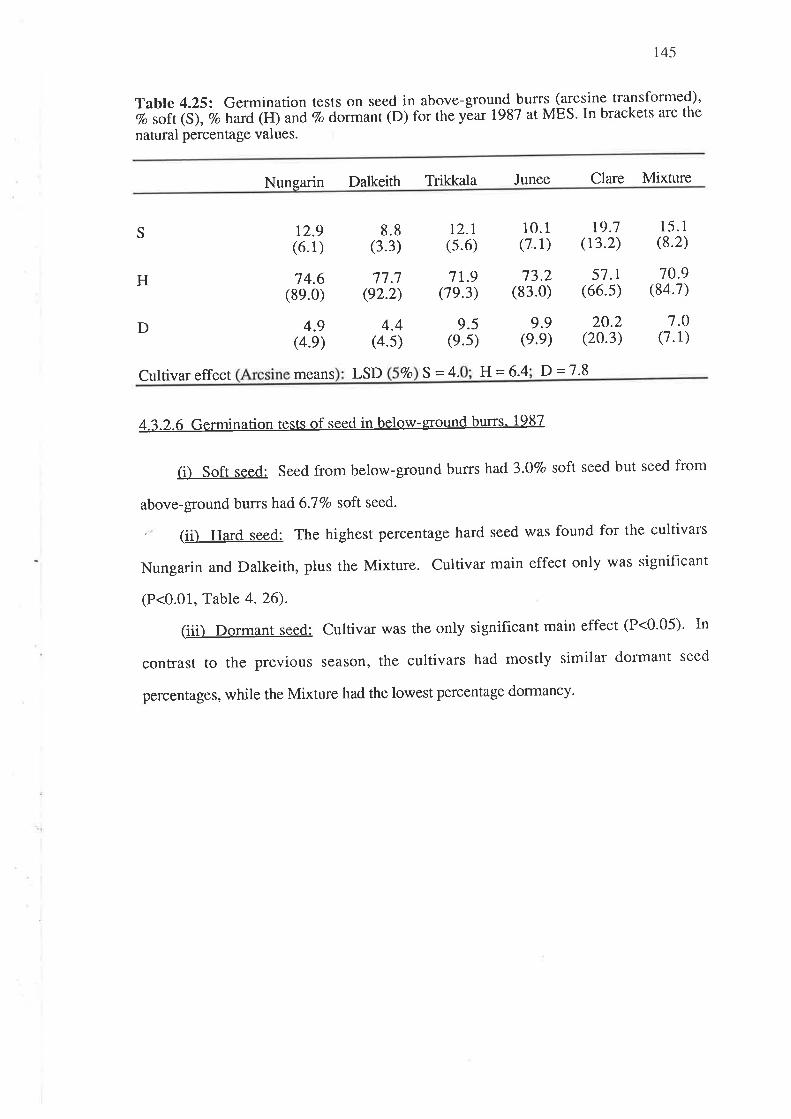
145
Table 4.25: Germination tests on seed in above-ground burrs (arcsine tra-nsformed),q" i'¡ fS¡, n trar¿ triiänã Z, Oo.*unt (D) for the y-ear 1987 at MES. In brackets are the
natural percentage values.
Nungarin Dalkeith Trikkala Junee Cla¡e Mixture
S
H
D
t2,9(6.1)
7 4.6(8e.0)
4.9(4.e)
8.8(3.3)
77.1(e2.2)
4.4(4.s)
t2.l(s.6)
7 r.9(7e.3)
9.5(e.s)
10.9(84.7)
15.1(8.2)
1.0(7.1)
10.1 t9.1(7.1) (t3.2)
73.2 57.r(83.0) (66.s)
9.9 20.2(e.e) (20.3)
Cultivar effect means LSD Vo S=4. H=6.4 D=7.8
4.3.2.6 Germination tests of seed in below-ground burrs. 1987
(i) Soft seed: Seed from below-ground burrs had3.OVo soft seed but seed from
above-ground burrs had 6.7Vo soft seed.
. (ii) Hard seed: The highest percentage hard seed was found for the cultivars
Nungarin and Dalkeith, plus the Mixture. cultivar main effect only was significant
(P<0.01, Table 4.26).
G11¡ pg¡Lnt see¿: Cultivar was the only significant main effect (P<0.05). In
contrast to the previous Season, the cultivars had mostly similar dormant seed
percentages, while the Mixture had the lowest percentage dormancy.
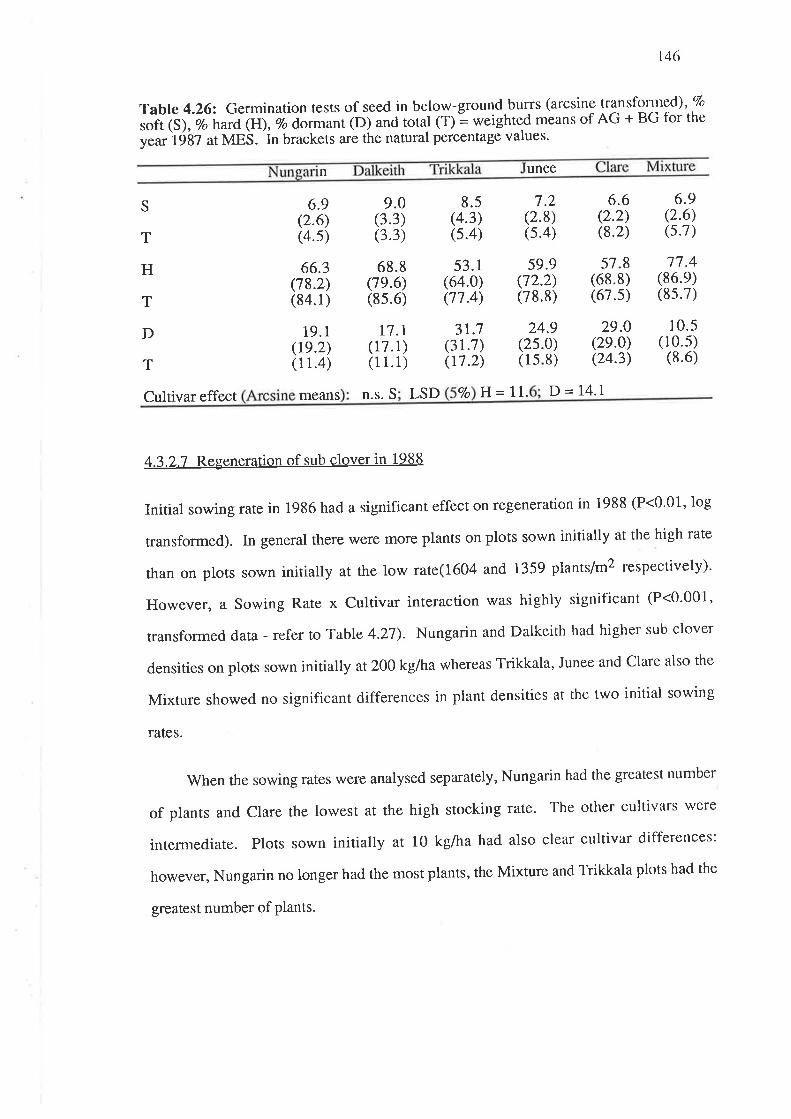
Table 4.262 Germination tests of seed in below-ground burrs (arcsine transfomred),l/o
*rt(s),2'hard(H),Todormant(D)andtotat(T)"=weightedmeansofAG+BGfortheyear'té|g at MES.'in brackets are the natural percentage values.
n
6.9(2.6)(4.s)
8.5(4.3)(s.4)
53.1(64.0)(77.4)
31.7(31.7)(r7.2)
unee
7.2(2.8)(s.4)
59.9(72.2)(78.8)
(1
6.6(2.2)(8.2)
57.8(68.8)(67.s)
29.0(2e.o)(24.3)
146
77.4(86.e)(8s.7)
10.5(10.s)
(8.6)
S
T
H
T
D
T
Cultivar effect
66.3(78.2)(84.1)
19.1(re.2)(11.4)
6.9(2.6)(s.7)
9.0(3.3)(3.3)
.90)8)
24(2s.
5
11.r(17.1)(1 1.1)
68.8(7e.6)(8s.6)
means n.s. S LSD 7o H= 11. D = 14.1
4.3.2.7 Regeneration of sub clover in 1988
Initial sowing rate in 1986 had a significant effect on regeneration in 1988 (P<0'01, log
transformed). In general there were more plants on plots sown initially at the high rate
rhan on plots sown initially at rhe low rate(l604 and 1359 plants/m2 respectively)'
However, a sowing Rate x cultivar interaction was highly significant (P<0.001,
transformed data - refer to Table 4.27). Nungarin and Dalkeith had higher sub clover
densities on plots sown initially at 200 kg/ha whereas Trikkala, Junee and Clare also the
Mixture showed no significant differences in plant densities at the two initial sowing
rates.
When the sowing rates were analysed separately, Nungarin had the greatest nutnber
of plants and clare the lowest at the high stocking rate. The other cultivars were
intermediate. Plots sown initially at 10 kglha had also clear cultivar differences:
however, Nungarin no longer had the most plants, the Mixture and Trikkala plots had the
greatest number of Plants.
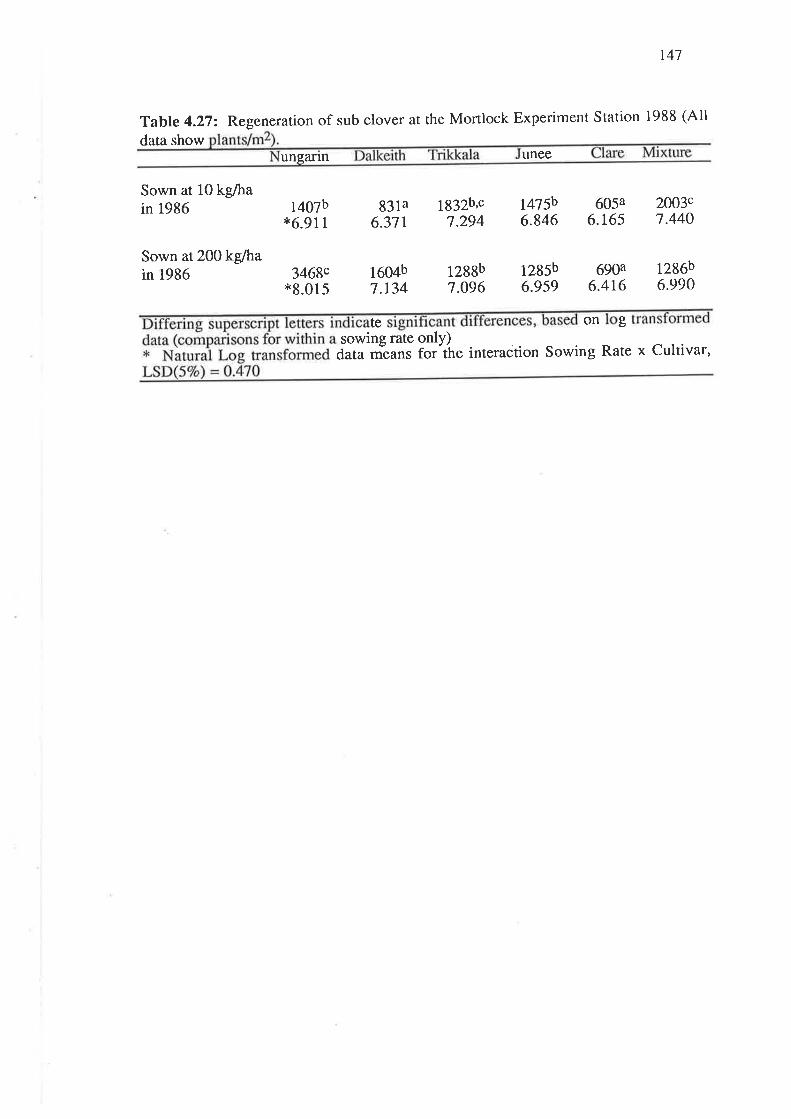
141
Table 4.272 Regenerarion of sub clover at the Mo¡tlock Experiment Station 1988 (All
data showunqarrn unee
Sown at 10 kg/hain 1986
Sown atz0} kg/hain 1986
t407b*6.911
3468c*8.015
831a6.371
1604b7.134
1g32b'c7.294
1288b7.096
t475b6.846
1285b6.959
605a6.165
2003c7.440
1286b6.990
690a6.4r6
te on (rb
sowing rate only)data means for the interaition Sowing Rate x Cultivar,
148
4.4 Discussion and conclusions
4.4.L Herbage production
Establishment and regeneration: The cultivar of sub clover and plant density had a
strong influence on herbage and seed production. Grazing pressure modified the
fesponse that cultivar and plant density had on herbage and seed production'
Initial plant density influenced regeneration. The seedling numbers in 1987 were
lowest on low stocking rate plots sown initially at 200 kg/ha (Figure 4'8a)' This was
undoubtably caused by a blanketing effect in 1987 due to the abundance of dry pasture
residue, which physically constrains emergence (Carter 1937). On high sowing rate
plots sheep under-utilized the dry pasture residues during the summer, thereby leaving
excessive dry pasture residue on the surface. Stocking rate also affected regeneration,
less seedlings were found on highly stocked areas. This would be the result of increased
pressure from sheep eating seedlings.
The high seedling numbers of Nungarin indicate good persistence under
continuously grazedconditions (Figure 4.8b). High seedling numbers of Nungarin also
ensured high early production. In contrast the cultivar Clare had poor regeneration at
MES also in the small-plot experiment at the Waite Institute'
The seedling numbers were generally higher for the 1988 season for all stocking
rates and sowing rates. This probably is related to higher total seed yields for the year
1987 and that sheep were no longer grazingthe a¡ea at emergence in 1988. Higher seed
yield in 1987 can be partly artributed to the cumulation of seed from the 1986 season.

Figure 4.8: a) Seedting number at each stocking rate for the years 1987and 1988.
Legend: L = Low stocking rateM = Medium stocking rateH = High stocking rate
10 = 10 kdha200 =200kg/ha
b)and
Seedling number for each of the cultivars for the years 19871988.
Legend: N= Nungarin,D =Dalkeith, T =Trikkala, J= Junee,C=Clare,M=Mixture
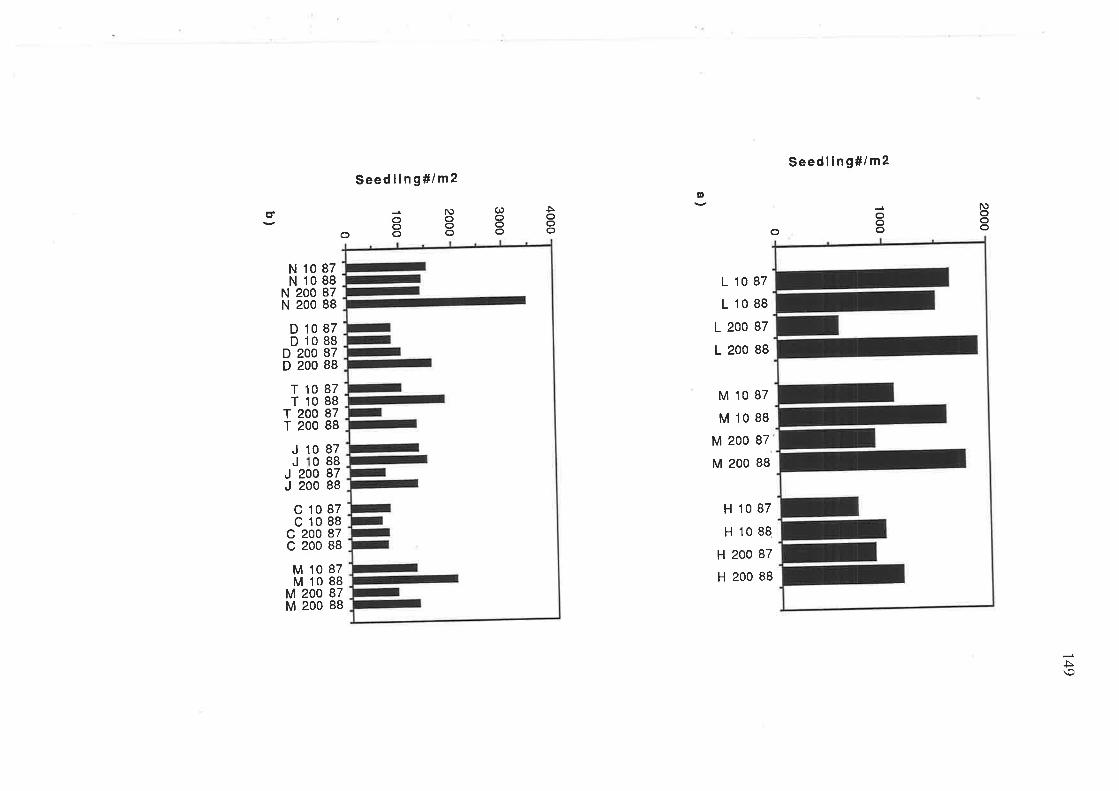
Seedllng#/m2Seedllng#/m2
D
oooET
of\)ooo
Nooo(Þooo
oooÞooo o
N 10 87N 10 88
N 200 87N 200 88
D 10 87D 10 88
D 200 87D 200 88
L 10 87
L 10 88
L 200 87
L 200 88
M 10 87
M 10 88
M 200 87
M 200 88
H 10 87
H 10 88
H 200 87
H 200 88
T 10 87T 10 88
T 200 87T 200 88
JJ
8788
8788e788
1JJ
20
c 10 87c 10 88
200200
000
200
c 200 87c 200 88
M '10 87M 10 88
MM
è\o
1-s0
Sub clover availability: Plant density has been recognised as an important factor in
governing the level of pasture available early in the growing season (Donald 1951; Wolfe
1931). Both the MES and small-plot experiment showed early herbage production was a
function of plant densiry. However, the effect of initial sowing rate had diminished in the
1987 season at MES. Cultivar differences also existed and this cannot be attributed
solely to plant density. Clare had low plant density, yet maintained a relatively high sub
clover availability early in the season 1986 due mainly to its large seedlings (de Koning
1984;de Koning and Carter 1987a). The cultivars Nungarin, Dalkeith, Junee' Trikkala
and the Mixture had high availability because of numerous smaller seedlings' Plant
density, continued to influence the availability of sub clover in the pasture throughout the
1986 growing season. The high sowing rate maintained its greater availability under all
three stocking rates.
Availability measures the amount of pasture on offer to the grazing animal' Low
pasture availability may arise through three causes, (i) the pasture may be growing
slowly and/or of low plant density, (ü) the stock frnd the pasture highly palatable and eat
it readily, thereby reducing its availability, or (iii) the stocking pressure may be high'
Clare had low availability at both sowing rates in 1986, presumably due in part to its high
palatability ((ii) above). It is known that Clare has good winter production (de Koning
and Carter 1987b), hence its low availability may well reflect high intake'
Stocking rate influenced availability late in the 1986 season. Nungarin, Dalkeith,
Trikkala and Junee did show declines of approximately 2000 kg DM/ha from the low
stocking rate to the high stocking rate. Higher utilization of pasture would explain low
availabilities at high stocking rates. However, the reason that Nungarin and Dalkeith had
low availabilities at the later stages in the growing season may be ascribed to early
maturity of these cultivars. Both cultivars were senescing while Trikkala, Junee, Clare
and the Mixture continued to grow.
l-5I
Stocking rate continued to influence the sub clover availability in 1987 of plots
sown originally at 10 kg/ha. As found for the previous year, high stocking rate areas had
the least pasture available. Early in the season Nungarin, had high pasture availability'
The winter productivity of early-maturing cultivars is generally better than mid- to late-
season cultivars (Anon 1968; Cameron and Mc Gowan 1968)' The high Nungarin plant
numbers most likely conftibuted to this high availability in the MES experiment'
However, as in the 1986 season, Nungarin had one of the lowest availabilities toward the
end of the season due to early maturity. Later-maturing cultivars such as Clare and Junee
maintained high pasture availability and at the final harvest occasion in 1987 the mixture
was intermediate. Late maturity of both cultivars governed the availability of pasture later
in the season (Wolfe 1981).
Weed yield and botanical composition: Stocking rate, and to a certain extent the
initial sowing rate, played an important role in the botanical composition changes' To a
smaller extent the cultivars themselves also influenced the botanical composition, but only
under lax grazing pressure. Initial plant density had a strong effect on the weed yield'
Strong competition is the likely cause for less weeds on high-sowing-rate plots in 1986
because of the large sub clover populations. The low-sowing-rate plots throughout the
1986 season continued to be more weedy compared to high-sowing-rate plots. This
result is comparable to the low density swards in the small-plot density experiment in
1985.
Stocking rate had no influence on the 1986 percentage weed component: however'
poppies failed to flower on high stocking fate areas compared to the medium and low
stocking rate areas where poppies did flower. Thus, in the longer term a higher stocking
rate is certain to reduce poppies along with other weeds' In 1987, poppies were no
longer prominent, but grasses, especially silver grass were common in the weed
population. Plots sown initially at the low sowing rate in 1986 were found to have more
grassy weeds than plots sown initially at the high sowing rate'

152
The ability of cultivars to control weeds depended largely on the grazing pressure.
Differences between cultivars \¡/ere not great at the high stocking rates, mainly because
the sheep are acting as the weed controllers. Therefore, under well grazed conditions the
cultivar is not expected to contribute to the suppression of weeds. However, on low
stocking rate plots, there were observable differences between cultivars. Dalkeith and
Junee plots sown at 10 kg/ha on the low stocking rate areas had over 1000 kgDM/ha
grasses: by comparison Trikkala and Clare had only 343 and 215 kgDM/ha' This can be
attributed to the tall stature of both Trikkala and Clare. Similarly, under non-defoliated
conditions of the small-plot density experiment, Clare was also the most successful in
terrns of weed control. Scott (1971), also found that plots which contained the tallest
cultivars also contained fewer weeds.
Observable differences could be seen between stocking rates, even though no
statistically-signif,rcant differences were found. Stocking rate strongly influenced the type
of weed found. Different stocking rates generated different weed species (Carter
1968a,b). Both volunteer clovers, cluster clover (Triþlium glomeratum) and woolly
clover (T. tomentosum) werc obvious on high stocking rate areas in 1987 on plots sown
initially at 10 kg/ha in 1986. The sparse structure of low density swards would faciliate
the invasion by other legumes such as cluster and woolly clover compared to a dense
canopy structure of a high density sward. Cameron and Cannon (1970) also found that
high stocking rates (up to 19.8 sheeplha) had increased levels of Triþlium glomeratum,
T. dubium and T. campestre, at the same time sub clover declined. Undoubtably a
principle cause of invasion by small seeded legumes is the ability of seed to pass through
sheep in a viable state. Similar results were obtained by Carter (1966,1968 a,b,c), Carter
and Day (1970), and Dunlop et at. (1984,1985). The invasion of small-seeded legumes
onto high stocking rate pastures is not detrimental to the overall productivity of the
pasture if the pasture is being used for animal production. Grass content increased as
stocking rate was reduced. The taller growing grasses have a competitive advantage
under lax grazing conditions. This effect was clearly visible in the MES experiment, but

l -53
not statistically significant. Many researchers have found that the grass content lncreases
as the stocking pressure is reduced (Rossiter and Pack 1956; Carter 1966; Carter and
Lake 1985; Rosierie 1937). The results support those of (Sharkey et al ' 1964) in which
changes in botanical composition in response to stocking fate were rapid' The MES
experiment illustrated how pastures changed from sub clover dominance in the first year
(assisted by spraying Fusilade @), to widety diverse botanical composition in the second
year
The percentage bare-ground increased as stocking rate increased during the 1987
season. This was not statistically significant, but is biologically important' Bare-ground
in a pasture provides sites for colonization by invasive plant species (Carter and Day
1970; Carter andLake 1985; Lambettet aI.1987)
Pasture production: There is no substitute for high density swards to give early
feed supply for sheep in the autumn-winter period. Plots sown at 200 kg/ha made more
growth early in the 1986 season compared to 10 kg/ha plots because at that stage
production was directly proportional to plant density. However, in the second half of the
season the high-density plots were probably undergoing intense competition and rapid
self-thinning resulting in reduced production, whereas the low-sowing-rate plots
continued to grow and gave similar final yields. These results for the later part of the
season are similar to those obtained by Donald (1951), Silsbury and Fukai (1982) and
Prioul and Silsbury (1982) with sub clover, who found that low density swards had a
higher crop growth rate than the high density swards. Howevel, these experiments were
ungrazed.
Clare and Junee continued to glow during the latter part of the 1986 and 1987
SeaSonS due to their later maturity, when cultivars such as Nungarin and Dalkeith ceased
to glow. Best early production was made by Nungarin: at emergence Nungarin also had
the most seedlings. Nungarin plots were also selectively grazed early in the season'
Low pasture production from the cultivars Trikkala, Junee and Clare is most likely a
t54
result from low plant numbers. However, Clare may also be more easily danraged by
grazingbecause of its tall leafy growth. Francis et at' (I976) expressed their concern that
the rapid growing leafy types may not recover as well as prosrate types' Research by de
Koning and Carter (1987) demonstrated how Clare and Yarloop can be easily danraged
and suffer high plant mortality under high stocking pressure when grazing is delayed and
there is substantial herbage on offer, whereas the prostrate later-maturing cultivars
survived relatively well. Earlier Watkin and Clements (1978) also expressed their doubts
concerning erect types such as Clare under heavy grazing'
Stocking rate had very little influence on pasture production of 200 kglha plots' but
did affect pastufe production on 10 kg/ha plots. Pasture production was greater on high
and medium stocking 1ates than at the low stocking rate. This result is similar to that of
Carter (1968 a, 1977) but contrasts with those of Dunlop et al' (1984) and Curll and
Davidson (1983). Reduced gfowth made on low stocking rate plots is most likely due to
plant competition for light due to lax leafy gowth causing shading' On high-stocking-
rate plots herbage is continually being removed and never reaches the stage where
excessive mutual shading occurs. Davidson and Donald (1958) showed that if the
defoliation treatment was not too Severe, dry matter production increased from a sward
defoliated near the ceiling LAI compared to those cut at a very low LAI' However' their
experiment did involve a single cut.
Total pasture production: The total pasture production for the 1986 season was
greatest for the cultivars clare and Junee. This result contfasts with work in victoria that
found that total pasture production was the same for all cultivars (Anon' 1968)'
However, those studies were conducted in Victoria under higher rainfall and different soil
conditions. Seasonal conditions may determine whether the total production differs' For
example a late finish to the Season will favour late-maturing cultivars and if those
cultivars gtew well throughout the year they will also produce more than early-maturing
cultivars. However, the results for 1987 at MES do support those of Anon' (1968)'
Nungarin and Dalkeith plots gave lowest total production, wheteas Trikkala ancl the
l -5-5
mixture were intermediate. Stocking rate influenced total pasture production in 1986'
High-stocking-rate tleatments had similar total production to low stocking rates because
of the greater growrh made by plots grazed at high stocking rates (Carter 1968 a,1977)'
Brown (1976a) also found that high stocking rates were associated with higher growth
rates in sPring.
Sheep bod)¡r,veights and Sreasy wool production: Bodyweight data are presented in
Appendix B, Table 1. The sheep had a mean bodyweight of 50 kg/head when first
introduced to the alea on 5 Sept., 1986. The sheep were re-weighed in the middle of
winter the following ye¿r (4 JuIy, 1987) when sheep on the-high-stocking rate treatments
had the lowest bodyweight (45.7 kg/head). The medium stocking rate sheep were
heavier (i.e. 55.2 kglhead) and the low stocking rate sheep were marginally heavier than
the medium stocking rate (58.4 kg/ha). Sheep were weighed the day they were removed
from the experiment, late in the growing season (12 November, 1987)' Sheep from high
stocking rate areas had gained weight in spring (i.e. 67.5 kg/head). In addition, sheep
from medium- and low-stocking-rate areas had also gained weight over the same period
(75.8 and 77 .5 kglhead for medium and low stocking rates respectively)'
In conclusion, sheep at high stocking rates did not reach the same bodyweights as
those on medium and low stocking rate a1eas, but the animal production per unit area was
greater. Sheep grazed.at the high stocking rate required supplementary feeding during
winter 1981: however, the cost of this feed would have been compensated by the
additional wool cut per hectare. In terms of greasy wool produced, the high stocking fate
had by far the highest production (118 kg/ha). The sheep at this stage had maintained
high individual wool cuts. Often under excessively-high stocking rates the individual
wool cut is decreased but the yield per unit area can be high (Carter 1965, 1966,l9l1;
Allden 1968; V/illoughby 1968). The medium and the low stocking rates had 84'5 kg/ha
and23-4 kglha greasy wool respectively.

l -56
4.4.2 Seed Production
Seed yield and number: The cultivars Nungarin, Dalkeith and Junee were affected
by initial plant density and had reduced seed yield on plots sown initially at the low rate'
Donald (1954) suggested that reduced yield at low plant densities was due to strong intra-
plant competition. This may be the strongest in the early cultivars Nungarin and Dalkeith
in the MES experiment. Similarly, Rossiter (1959) found that the early cultivar
Dwalganup had one of the lowest seed yields when grown as single plants'
The effect of stocking rare on seed yield was not statistically significant' This is
somewhat surprising since low stocking rate plots were highly shaded and this is known
to reduce seed yield. Supra-optimal leaf area of dense swa¡ds were found to produce less
flowering nodes (Rossiter 1961, 1912). Shading was also shown to reduce seed yield
due to decreases in the number of inflorescences (collins et al .1978; Dunlop 1985)'
However, the density range used by Collins et al. (1978) was higher (1800 - 3200
plants/m2) compared ro those of the MES experiment (1 I25 - 2183 plants/m2)' Rossiter
(1961) also found no cultivar x Grazing interactions for seed yield of the cultivars
Dwalganup, Yarloop and Bacchus Marsh' An early-maturing cultivar such as Nungarin
may lose a higher pfoportion of seed than later-maturing cultivars. This was indicated by
the dramatic decrease in the amount of seed above-ground due to high stocking pressure'
Despite this, Nungarin had the highest seed yield at each stocking rate' collins (1978)
found that defoliation during flowering caused a reduction in seed yield of some cultivars
and not others. This was attributable to behaviour of strains to defoliation: however'
Collin's experiment did not involve defoliation by grazing' The MES experiment
indicates that differences were due to maturity'
Nungarin and Dalkeith had the greatest seed yield below-ground in 1986' Both
cultivars are early-season types, and hence have more opporttlnity to bury their seeds
before soil moisture conditions become unfavourable and a hard crust forrns on the soil
surface in late spring. Clare buried less seed in comparison' because of its later matunty
t51
as well as its inherently weaker burr burial capabilities (Barley and England 1970; Francis
et al. 1972). Nungarin buried the highest percentage of its seed below-ground in 1986
(427o). Later- maturing cultivars buried proportionately less of their seed (Dalkeith 34Vo'
Trikkala 3OVo, Clare 237o, Junee 2l7o and the Mixture 257o)' The proportion of seed
buried followed the same order in 1987, except Trikkala had the highest proportion of
seed below-ground. All cultivars showed an increased level of seed buried in 1987 but
this is due to some accumulation of 1986 seed. The seed from the cultivars Nungarin and
Datkeith would have the highest level of protection from grazing animals due to high burr
burial. No doubt this contributed to high seedling numbers at regeneration'
Trikkala, Clare, Mixture and Junee had reduced total seed yield and numbers in
1987, whereas Nungarin and Dalkeith had increased total seed yield in 1987 compared to
1986. This possibly could be seasonal, since the 1987 season at MES was shorter than
1986, thus favouring the seed production of the earlier-maturing cultivars Nungarin and
Dalkeith.
Rossiter (1961) found that individual seed weight from both above- and below-
ground burrs was decreased by grazing. smaller seed was found at high stocking rates at
MES, this could result in smaller seedlings for the year of regeneration. This indicates
that some Stress was imposed on developing seed causing seed size reductions' In
addition, the largest burrs may have been eaten while the feed was still green' This
would result in the production of smaller seeds at the end of the growing season'
Summer-autumn grazing of burrs could further reduce the mean seed size and this effect
would be more pronounced under high grazing plessure (de Koning and Carter 1989
a,b). This topic will be further expanded in Chapter 5'
In conclusion, seed yield and number can be affected by the initial sowing rate' but
this is dependent on the cultivar. Cultivars such as Nungarin and Dalkeith have
depressed yields at the initial sowing rate 10 kg/ha. Stocking rate was never statistically
signihcant for seed yield. Nungarin and Dalkeith are both successful in the second year's
158
seed production. This could be a combination of inherently high seed prodt¡ction and
early maturity. The late spring in 1987 was drier than in the previous year (Table 4'1)
and this would have favoured the early cultivars. Thus, seed yield in this experiment was
also dependent on seasonal weather conditions.
Nungarin and Dalkeith are probably the most suited cultivars under continuously
grazedconditions in the Mintaro district of South Australia. Both had prolific seed
production combined with good burr burial which is essential for productive self-
regenerating pastuÎes.
Germination of seed from burrs: Soft seed percentage was definitely influenced by
the season. Above-ground burr from the 1986 harvest had approximatety 16 percent soft
seed, irrespective of cultivar, sowing rate or stocking rate. The above-ground burr from
the 1987 season had approximately 7 percent soft seed. The 1986 growing season
finished later than 1987, which may have resulted in the production of more permeable
seed. Furthermore, the cultivars which had the highest soft seed percentage in above-
and below-ground burrs were the same for both years. Conversely, cultivars with high
soft seed had lower hard seed content and higher dormant seed (e.g. Clare above-ground
burrs). Clare and the mixture always had the highest soft seed along with the cultivar
Trikkala (above- and below-ground burrs). This result was similar to those found under
non-defoliated conditions (small-plot density experiment 1985). Therefore, soft seed
differences between cultivars are strongly influenced by inherent factors' Sowing rate
was not an influential factor with regard to soft seed percentage.
Increased stocking rate may have influenced the seed coat permeability resulting in
reduced hard-seededness of below-ground burrs of the cultivar Dalkeith, due to removal
of residues resulting in increased exposure of burrs to fluctuating temperatures'
Correspondingly, Dalkeith had increased dormant seed as stocking rate increased. The
cultiva¡ Dalkeith buried more burrs at the low stocking rate, the level of hard seed was
also higher at the low stocking rate. Buried burrs were found to have a higher level of
l -59
hard-seededness (Collins 1981). Cocks (1984) found with medics that softer seed were
formed under less dense swards and this may have been due to less protection from the
sun's heat. The progressive reduction of breakdown of hard-seededness in medic seeds
with increasing straw cover has been clearly shown by Quigley and Carter (1989)'
However, Clare produced more belo'ü-ground hard seed at the high stocking rate' The
percentage soft seed in burrs on heavily stocked areas would be expected to increase over
the summer as more and more herbage residue was removed exposing more burrs' In
addition, exposing burrs also predisposes them to be more readily eaten by the sheep'
4.4.3 Conclusions
A granngexperiment at the Mortlock Experiment Station, Mintaro during 1986 and
1987 has shown that a low density s,ward of sub clover (100 plantsTm2) achieved high
herbage yield and seed yield if the stocking rate was kept at a medium to low level (e'g'
11 and 7 sheep/ha (d.s.e.). However, the sheep went onto the pasture at a relatively late
stage in 1986. Low plant density pastures could not tolerate prolonged high stocking
rates through treading and defoliation effects. The experiment showed that high plant
density swards could be grazed at higher stocking rates (e'g' 15 sheep/ha (d's'e)'
Furthermore, results from the experiment indicated that high density swards (1600
plants/m2) are at an disadvantage if the grazing pressure is too low. Excessive amounts
of dry residues left on the surface over summer can physically impede emergence' while
also insulating seeds from the sun's heat which can reduce hard seed breakdown'
Seed production was favoured by high-density swards and the early maturing
cultivars had the best seed production if the initial sowing rate was high- This supports
the contention that seed yield is strongly correlated to herbage yield' High seed
production also increases the over-Summer carrying capacity of a pasture' There is some
evidence from the MES experiment that early-maturing cultivars have reduced seed yield
due to severe grazingduring flowering.

lí)
The cultivars Nungarin and Dalkeith show the greatest promise in the Mintaro
district. Both cultivars have good early production, high seed set and good regeneration'
A substantial amount of seed is also buried by both cultivars which will protect that seed
from over grazingduring the summer-autumn period. Clare, on the other hand showed
signs of deterioration in the second year. Regenefation of clare was reduced on high-
stocking-rate plots resulting in poor early-season yields. This contrasts dramatically with
the good performance of Cla¡e in the first season at MES and in the small-plot-density
experiment of 1985. These results heighten the need for cultivar evaluation to go beyond
one yeaf and under continuous grazing. The MES experiment would have provided more
information on the persistence of cultivars under grazing if the experiment continued
beyond 2 years. However, it gave indications that Nungarin and Dalkeith have the
potential for good performance and persistence under continuously grazed conditions'
Mixtues of several cultivars with a range of maturities to fill the range of ecological
niches in any Sown area show promise in terms of herbage and seed production' High
seed production is a prerequisite for good regeneration for general purpose pastures' The
mixture at MES was intermediate for all yield parameters' The proportions of the
components of the mixture will constantly change according to the Season' however a
mixture will provide a mofe stable source of herbage and seed' The more successful
components of the mixture will persist, so in a sense natural selection will determine
which cultivars are most suited to the environmental conditions and the stocking pressure
most commonly used (Carter 1988).
Botanical compostion obviously differed between years at MES' These differences
reflect changes in the sward structure rather than seasonal differences between years'
Sub clover plant numbers (i.e. density) and grazing pressure had key roles in altering
sward structure. Changes to botanical composition are inevitable in grazed ecosystems:
however, the medium stocking rate (11 sheep/ha) was relatively more stable which will
be important if that pasture is to be used for seed production.

l6r
I-ong term persistence of sub clover-based pastures will be favoured by high sub
clover plant numbers and high seed production. Both high sub clover plant numbers and
high seed production are sffongly influenced by the cultivar. If high plant numbers are
maintained the stocking rate can be increased which in turn increases the animal
productivity from pasture. Monitoring of soft seed reserves and plant numbers at
emergence (Carter et al. 1989) are useful aids to assessing the stability, potential
productivity, and carrying capacity of sub clover pastures.
162
5. SUMMER - AUTUMN GRAZING EXPERIMENT AND PEN-
FEEDTNG STUDTES, 1987-88
5.0 Introduction
A shortage of livestock feed in the summer-autumn period is a common feature of
Iivestock production in the Mediterranean-type environment of southern Australia' Over
summer there is a gradual decline in the quality and quantity of dry pasture residues' and
heavy grazingof this residue may severely deplete seed reserves' Carter (1981) showed
that as sheep progressively consumed dry medic residues on a hard-setting soil the sheep
first selectived the largest pods that contained the most seed and the largest seed' As
grazingcontinued the residual pods became progressively smaller containing fewer and
smaller seed.
The seed reserves of pastures based on sub clover can also be severely depleted
although it may be less severe than grazed medic residues because some seed is buried in
the soil. I{owever, on the hard-setting soils that are common in the south Australian
cereal belt, a lesser percentage of seed is buried and so loss of seed over summer by
grazing may greatly reduce seed reserves. Although survival of seed following ingestion
by sheep is very important ecologically, most research has focused on nutritional aspects
of sub clover residues during summe (Donald and Allden 1959; Hume et al ' 1968;
Wilson and Hindley 1968). While the survival of ingested seed has long been recognized
as a means of spreading legumes on non-arable land (e.g. Suckling 1950), only recently
have the effects of summer grazing on seed survival and consequent botanical
composition and seed production of annual pastures, and the broader ecological
implications of these factors been recognized (Carter I918, Carter and Lake 1985, Jones
and Simao Neto 19g7, and Simao Neto et al. lg87). Furthermore, there is very little
detailed understanding of the passage and survival of sub clover seed ingested by sheep'
The aim of the research described in this Chapter is to identify and quantify the
main effects of summer-autumn grazingby sheep on the seed and seedling dynamics of
sub clover-based pastures. The first experiment is primarily concerned with the inlpact of

163
Sheep grazing dry residues of mixed sub'clover cultivars over the summer-arltt¡nln
period. A mixture of sub clover cultivars was selected because it is more representative
of the strategy of having a broad-based mixture for long-term stability of the pasture
(carter 1937). The second experiment was designed to quantify the survival of sub
clover seed fed to penned sheep. The seed was fed as intact burrs collected separately
from swards of the MES grazing experiment. The same five sub clover cultivars were
used in the mixture sown for the summer-autumn grazingexperiment. It was expected
that seed from the five different cultivars could well have differing levels of survival
following passage through the sheep.
r64
5.1 Materials and Methods
5.1.1 Field grazing experiment:
Location and preparation of site: The area used was paddock W16 on a hard-setting
red brown earth soil at the Waite Agricultural Research Institute (w A R I), South
Australia. The previous cropping history of the paddock was beans in 1983' wheat in
19g4, oars in 19g5. In 19g6 the paddock was limed before sowing on 22 May with a 30
kg/ha sub clover mixture. The mixtwe comprised five cultivars viz: Nungarin, Dalkeith'
Trikkala, Junee and Clare in equal proportions by weight (i'e' the same cultivars as used
for the MES grazing experiment). All seed was inoculated with Type C inoculum prior to
sowing. The actual sowing rate achieved was 31.5 kgiha' The seed mixture was sown
through the fine side of the grain box with a Horwood Bagshaw combine drill fitted with
trailing harrows. Singte superphosphate (97o P) was applied at a rate of 100 kglha'
Emergence counts were made on the 3 June, 1986' Fifty quadrats (20 x 30cm) in
total were counted along five transects (i.e. 10 quadrats/transect)' The average number of
seedlings was 121lm2. On 11 August, 1986 the area was sprayed with 350 ml/ha Rogor
(active ingredient }OglLDimethoate) to control lucerne flea' The next day wire weed
was sprayed using Z,4,DB at 3 litres/ha . On 18 August, 1986 the area was sprayed with
Fusilade 212 at500mVha to control grass weeds' The site was grazed normally during
the 1986 growing season and seed set. The total area available for grazing was 0'27 ha'
Introduction of sheep: Ten Merino wether sheep, fitted with canvas faecal-
collection harnesses, were introduced to the paddock on 2 February, 1987 and
continuously grazedthe site for the following seventy days (bodyweights of the sheep at
the start and the end of graz\ng a¡e presented in Appendix C, Table 1)' Sheep were
penned each morning at 0900 hr to allow the removal and replacement of faecal-collecting
bags. Faecal samples were weighed and 1009 sub-sample taken' The remaining faeces
were dried at 45oC in a forced-draught dehydrator and held in reserve' The l00g sub-
l6-5
sample was washed through a square-holed lmm test sieve' Seed from the washed
sample was placed in petri dishes and germinated in a humidified incubator at l9oC'
Each petri dish had 3 filter papers and 5nrl distilled water containing 1.6gllitre of the
fungicide Thiram added. Dishes were remoistened when necessary. On the seventh day
of the germination test all hard seed was scarified using fine sand paper' The total
duration of the germination tests were 14 days. Total seed throughput and percentage
viable seed I i.e. potential germination of both permeable (soft) and impermeable (hard)
seedsl was calculated for the mixture of sub clover cultivars. Every seventh day from 6
February to 10 Aprit a second 1009 sample of fresh faeces was taken and placed in the
freld (10 sheep replicates x 10 weeks = 100 samples) on the soil surface contained within
15.5 cm Square white plastic rims to restrict movement and the emergence of seedlings
from the faecal pellets counted twice at the break of the season (21Mray' 1987 and 28
May, 1987). No seedlings emerged from the faecal pellets during summer'
Harvesting of dr], pasture residues: The dry pasture ¡esidues on the area were
sampled on 30 January 1987. Thirty-three circular samples were taken on a grid pattern
using a steel cylinder 28 cmin diameter (See Diagram 5.1). Above-ground samples and
below-ground samples to a depth of 2.5 cm (for estimating buried sub clover seed) were
taken. Every week, while the sheep grazed the area, harvests of above-ground dry
pasture residue were taken. At each grid intersection (see Diagram 5.1) a central sample
was taken on the first harvest occasion, subsequent samples were taken 1.5m away on
the circumference of a circle surrounding the central harvest site. All harvested sites were
marked with a steel peg with coloured tape tied to the top so that previously harvested
sites could be avoided. A second below-ground harvest was made after the sheep had
been removed. Harvests were taken to measure the disappearance of total pasture residtle
including burr from the surface. Twenty of the 33 samples were processed fully (gricl
positions 1.1 - 1.8, 2.1 -2.8,and 3.1- 3.4) to calculate the number of burr/m2, number
of seed/m2 and for germination tests on burrs. Those grid positions were selected to
avoid a possible border effect from the southern fence which was lined with trees' The
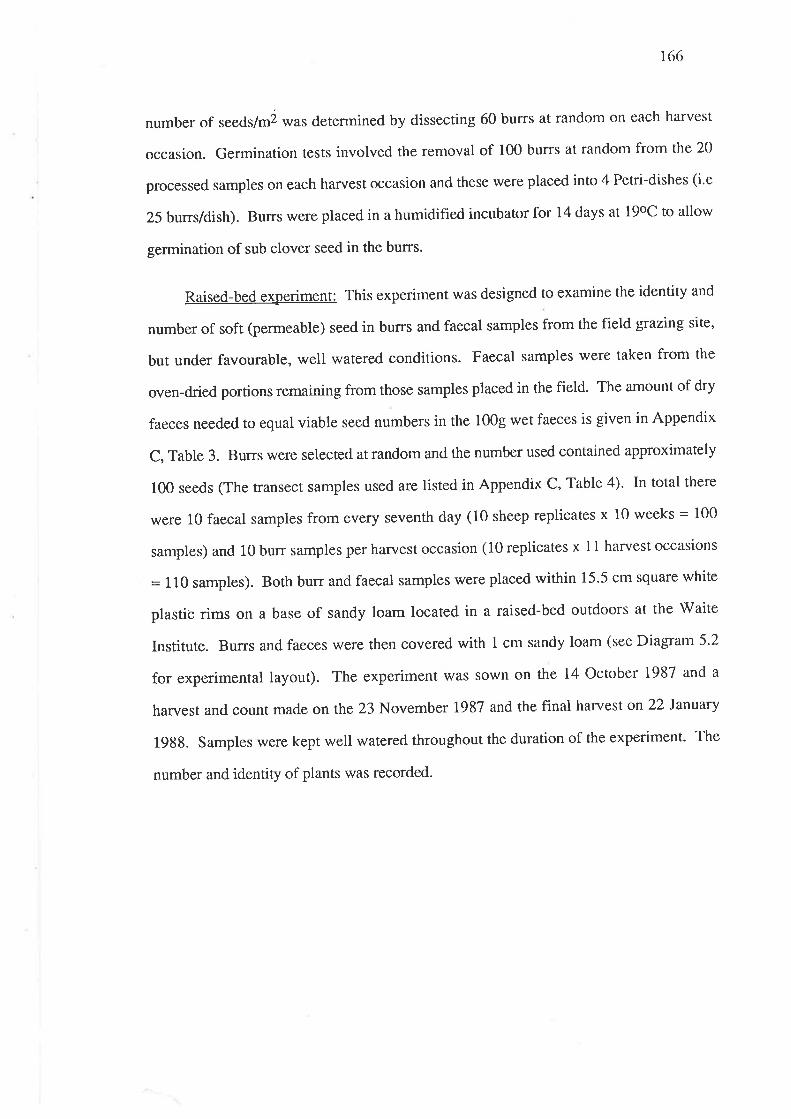
166
number of seeds/má was determined by dissecting 60 burrs at random on each harvest
occasion. Germination tests involved the removal of 100 burrs at random from the 20
processed samples on each harvest occasion and these were placed into 4 Petri-dishes (i.e
25 burs/dish). Burrs were placed in a humidified incubator for l4 days at 19oC to allow
germination of sub clover seed in the buns.
Raised-bed experiment: This experiment was designed to examine the identity and
number of soft (permeable) seed in burrs and faecal samples from the field grazing site,
but under favourable, well watered conditions. Faecal samples were taken from the
oven-dried portions remaining from those samples placed in the field. The amount of dry
faeces needed to equal viable seed numbers in the 1009 wet faeces is given in Appendix
C, Table 3. Burrs were selected at random and the number used contained approximately
100 seeds (The transect samples used are listed in Appendix C, Table 4). In total there
were 10 faecal samples from every seventh day (10 sheep replicates x 10 weeks = 100
samples) and 10 burr samples per harvest occasion (10 replicates x 11 harvest occasions
= 110 samples). Both burr and faecal samples were placed within 15.5 cm square white
plastiê rims on a base of sandy loam located in a raised-bed outdoors at the Waite
Institute. Buns and faeces were then covered with 1 cm sandy loam (see Diagram 5.2
for experimental layout). The experiment was sown on the 14 October 1987 and a
harvest and count made on the 23 November 1987 and the final harvesf on 22 January
1988. Samples were kept well watered throughout the duration of the experiment. The
number and identity of plants was recorded.

Diagram 5.1: The paddock site W16 at the V/aite Institute and theposition of dry residue samples for the summer-autumn grazingexperiment, 1987.
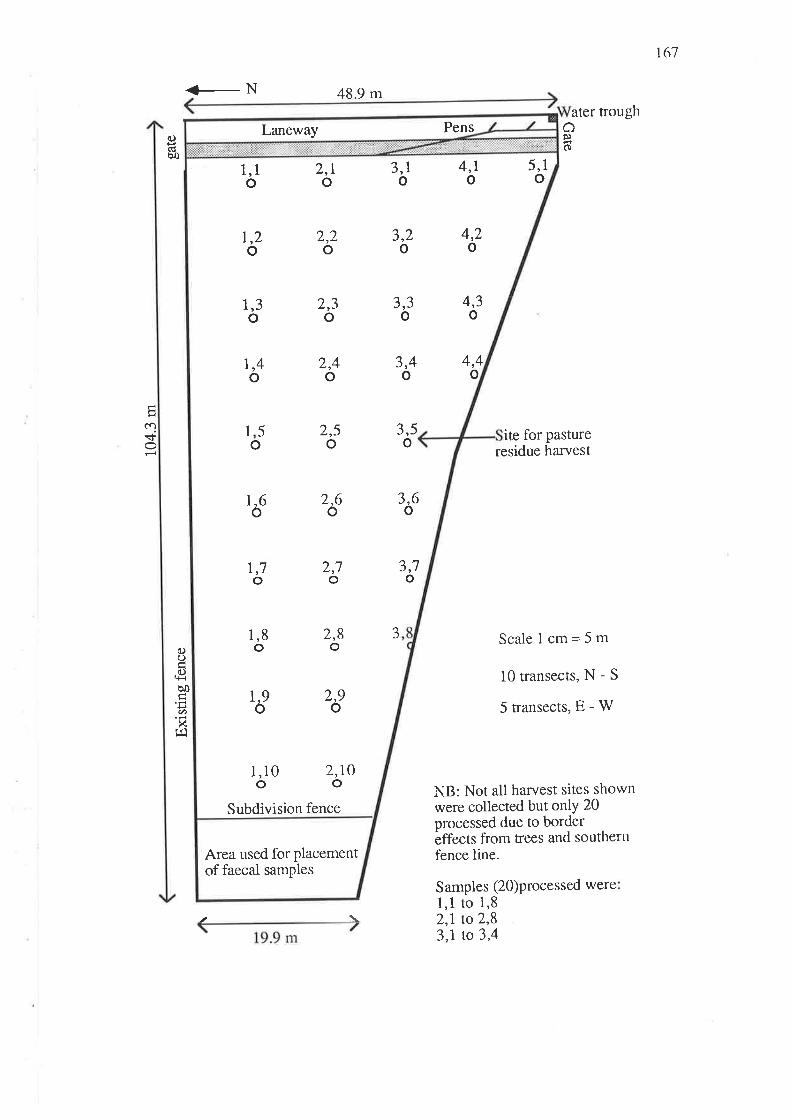
Area used for placementof faecal samples
Subdivision fence
2,roo,1o
1 0
.9ô
1 2.9o
3,Jo
1,6o
o51 3,5
o
o
,3o
J
)o
4,2o
3') ')o
o
o
o
o
1,8 2,8 3oo
r,1
3,4
1,3o
r,4o
2,3 4,3
2,1 3,1oo
4,4o
2,4o
2,5o
2,6o
2,7o
3,6o
r,2o
4,ro
5,1o1,1
Laneway Pens
t6l
c)cdbo
<-N 48.9 mater trough
oÞ(l
ite for pastureharvestresidue
Scalelcm=5m
l0transects,N-S
5transects,E-W
NB: Not all harvest sites shownwere collected but onlY 20processed due to borderèffects from trees and southernfence line.
Samples (2O)processed were1,1 to 1,82,1 to 2,83,1 to 3,4
Eca+
ooebo
(tt
xfrl
I
:
i
l
Diagram 5.2: The layout of the raised-bed experiment at the Waite Institute, 1987.
H1;H2:H3;}l4;H5;H6;Ít7;H8;H9;H 10;H 11;
Burr samples taken onI il il lt
ililillr
ililllll
ililtllt
ilililtl
ililillt
tlillrll
ilililrt
ilillrll
ilillllt
30.1.879.2.87
r6.2.8723.2.87
2.3.879.3.87
16.3.8723.3.8730.3.87
6.4.8713.4.87
FaecesF1;F2;F3;F4:F5;F6;F7;F8;F9;F 10;
samples 6.2.8713.2.8720.2.9727.2.87
6.3.8713.3.8720.3.8727.3.81
3.4.87r0.4.87
taken onil
I
il
il
il
lt
lt
il
!t
il
tl
ll
il
It
It
tl
tl
I
It
il
ll
tl
il
il
t!
il
il
lt
il
il
ll
il
lt
tl
lr

!trtr Inn n
ffi H
trtr trntrrI I
ffiffit¡i¡¡¡l
tffi¡:ïË¡
trtr n!
H ffitr¡ ntr
D !!ffi
ffiHHffi Hn ¡
tr
@ Htrntr
tr trffitËjiÈ:t
@ ffiEIn n!
trtlffi H
fl !tr
@ ffiH ¡',#l
tr trtru
ffi ¡.ffi|¡¡i!ËtH
ffi Htr ntr tr
H ffiilH@ H
ffiH
I (rtì
IN I 1 Scale 3cm = l00om
El = Burr samPle
fl = Faecal samPleî.,
î",
H4
F3
H5
F4
H6
F5
H7
F6
\H8
7
H9
F8r\H10
/
F,/
\
\/
F9V
11
Ï10
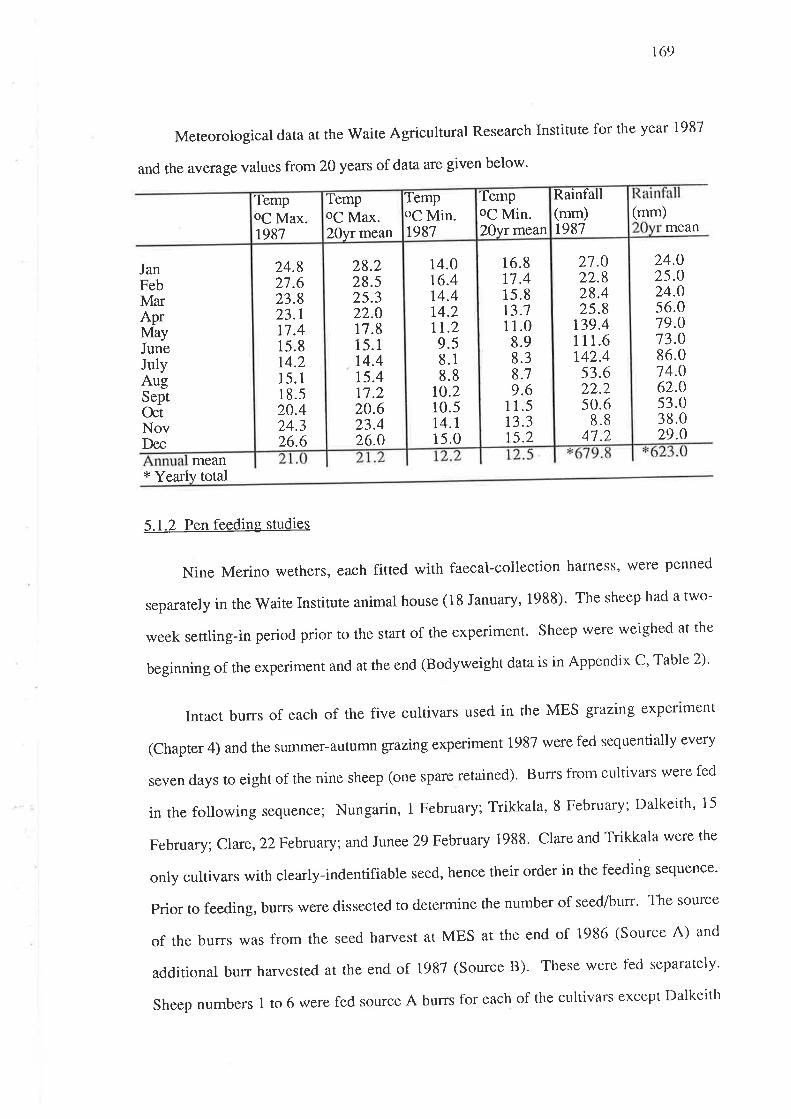
I (r9
Meteorological data at rhe Waite Agricultural Research Institute for the year 1987
and the average values from 20 years of data are given below'
(mm)mean
JanFebMarAprMayJuneJulyAugSeptOctNovDec
24.025.024.056.019.073.086.014.062.053.038.029.0
mean* Yearlv total
5.1.2 Pen feeding studies
Nine Merino wethers, each fitted with faecal-collection harness, were penned
separately in the'Waite Institute animal house (18 January, 1988)' The sheep had a two-
week settling-in period prior to the start of the experiment. Sheep were rveighed at the
beginning of the experiment and at the end (Bodyweight data is in Appendix C' Table 2)'
Intact burrs of each of the five cultivars used in the MES grazing experlmelìt
(chapter 4) and the summer-autufnn grazingexperiment 1987 were fed sequentially every
seven days to eight of the nine sheep (one spare retained)' Burrs fronr cttltivars were fed
in the following sequence; Nungarin, l February; Trikkala, S Febrtrary; Dalkeith' 15
February; clare, 22February; and Junee 29 February 1988. Clare and Trikkala were the
only cultivars with clearly-indentifiable seed, hence their order in the feeding sequenco'
prior to feeding, burrs were dissected to determine the number of seed/btrn" The source
of the burrs was from the seed harvest at MES at the end of 1986 (Source A) and
additional burr harvested at the end of 1987 (Source B)' These were fed separately'
Sheep numbers I to 6 were fed source A burrs for each of the cultivars except Dalkeith
24.821.623.823.1t7.415.814.215.118.520.424.326.6
28.228.525.322.O17.815.1t4.415.4ll.220.623.426.0
14.016.414.414.2tr.2
t0.210.5t4.r15.0
9.58.18.8
16.8t7.415.813.711.08.98.38.19.6
11.513.315.2
21.022.828.425.8
r39.4111.6t42.453.622.250.6
8.847.2
TempoC Max.1987
TempoC Max.20yr mean
TempoC Min.1981 meanZOyr
TempoC Min.
Rainfall(mm)1981

170
Source A which was fed to sheep 1 - 5. Source B burrs were fed to sheep ntlnlbers 7 and
8, except source B Datkeith burrs which was fed to sheep 6,7 and 8.
Each sheep was fed 50g burrs (except Clare when only 40g was fed because there
were less Clare burrs available) mixed in with the normal ration of 8009 pellets and 100g
chaffed straw. All burrs were consumed within half a day. On the days between btlrr
feeding the normal ration of pellets and straw was fed. It was noted that the majority of
seed was voided before the end of 14 days. Therefore, the last collection of faeces was
made on the 13 March 1988.
Faeces from the sheep was collected daily at 0900hr, weighed and a 4009 sub-
sample taken. The remaining faeces was dried at 45oC in a forced-draught dehydrator'
The sub-sample was washed through a square-holed, lmm test sieve and the seed
removed and placed in petri dishes. Germination of seed was carried out in a humidified
incubator ar 19oC for 14 days. On the seventh day all hard seed were scarified. The total
seed throughput, percentage total viable seed (soft + hard seed) and percentage hard seed
were calculated for each of the cultivars. Germination tests on sub-samples of burrs to
determine seed numbers and levels of hard-seededness preceded the actual feeding'

Plate 5.1: General view of sheep fitted with faecal collection harnesses grazing dry subclover residues in summer-autunm at the Waite Institute, 1987.
Plate 5.2: Close-up view of dry sub clover residues. Left: grazed by sheep for 70-days, Right: ungrazed.
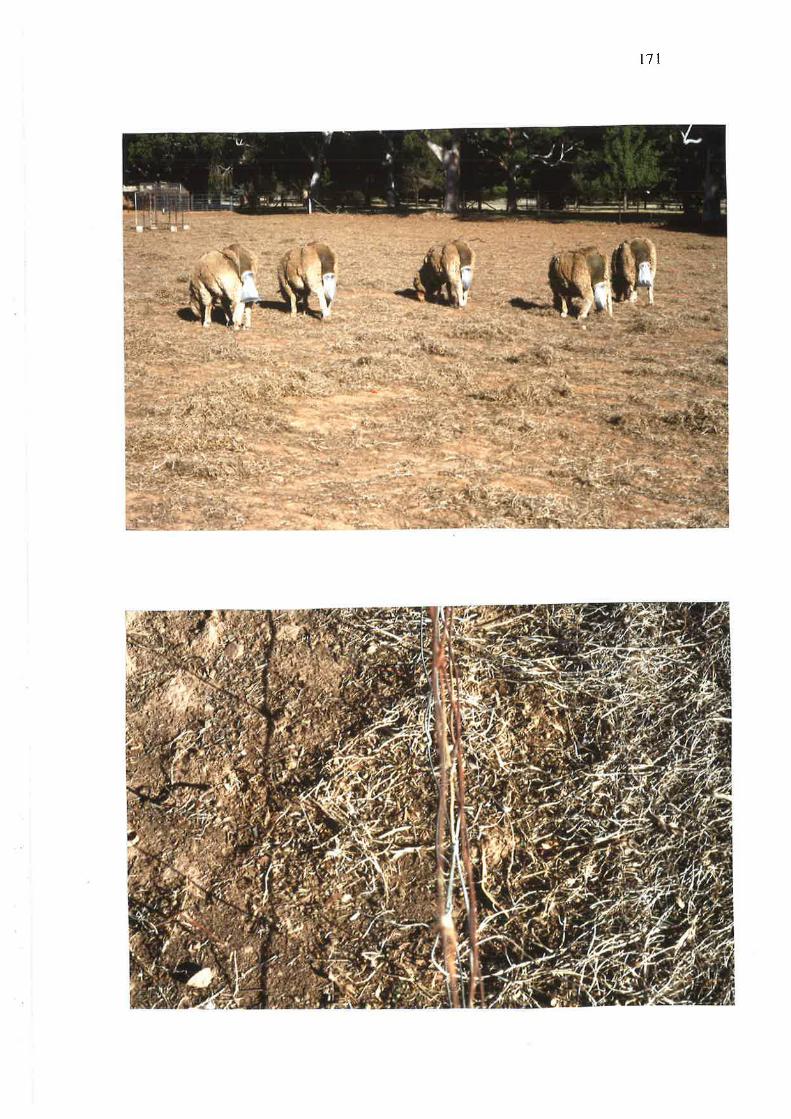
.:3
tLr
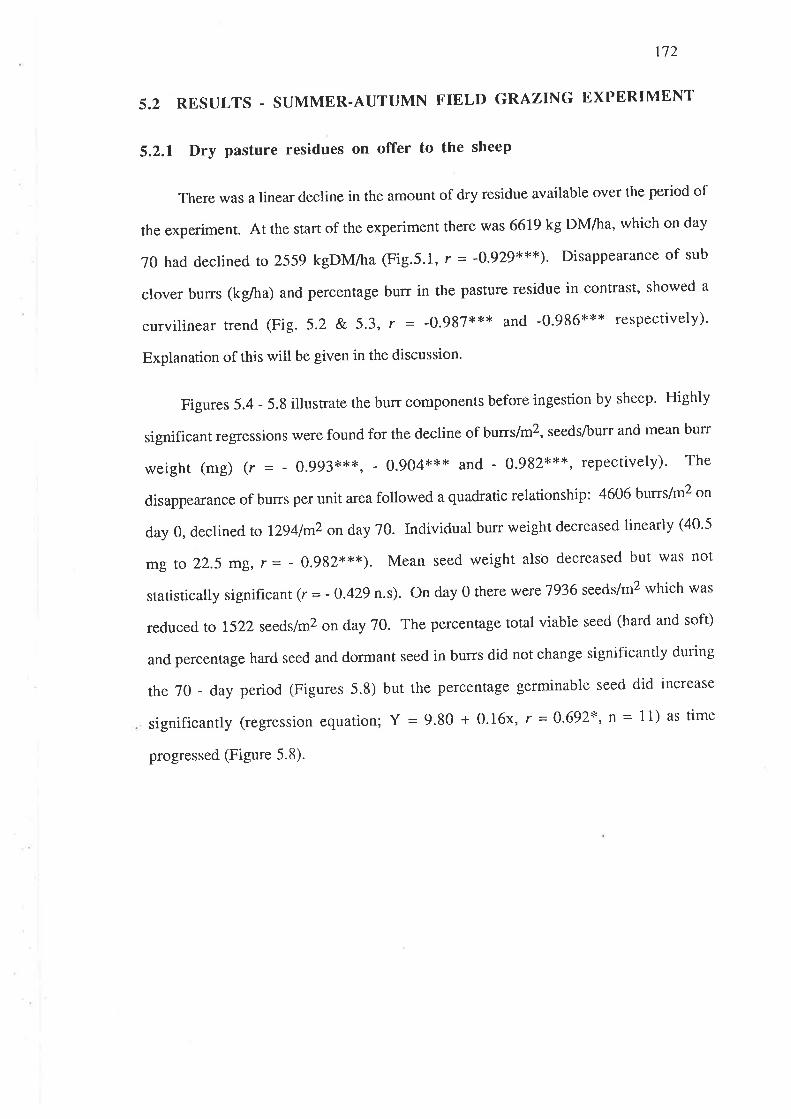
172
5.2 RESULTS . SUMMER.AUTUMN FIELD GRAZING EXPBRIMENT
5.2.I Dry pasture residues on offer to the sheep
There was a linear decline in the amount of dry residue available over the period of
the experiment. At the start of the experiment there was 6619 kg DM/ha, which on day
70 had declined to2559 kgDM/ha (Fig.5.1, r = -0.929***). Disappearance of sub
clover burrs (kg/ha) and percentage burr in the pasture residue in contrast' showed a
curvilinear trend (Fig. 5.2 &. 5.3, r = -0.987*** and -0.986*x* respectively)'
Explanation of this will be given in the discussion'
Figures 5.4 - 5.8 illustrate the burr components before ingestion by sheep. Highly
significant regressions were found for the decline of burrs/m2, seeds/burr and mean burr
weight (mg) (r = - 0.993***, - 0.904*** and - 0.982x**, repectively). The
disappearance of burrs per unit area followed a quadratic relationship: 4606 burrs/m2 on
day 0, declined to I294lmZ on day 70. Individual burr weight decreased linearly (40'5
mg to 22.5 mg, r = - 0.982**4<). Mean seed weight also decreased but was not
statistically significant (r = - 0.429 n.s). On day 0 there were 7936 seeds/m2 which was
reduced to 1522 seeds/m2 on day 70. The percentage total viable seed (hard and soft)
and percentage hard seed and dormant seed in burrs did not change significantly during
the 70 - day period (Figures 5.8) but the percentage germinable seed did increase
significantly (regression equation; Y = 9.80 + 0.16x, r = 0'692*, n = I 1) as time
progrossed (Figure 5.8).

113
Y = 6829 - 68.59H ß=-O.929***, ¡= ll)
C'E
=ocl).Y
attofIu,o
o
9000
8000
7000
6000
5000
4000
3000
20000 10 20 30
Days
40 50 60 70 80
g razi ng
Fig. 5.1 The progressive decline of dry pasture residues (kgDlwha) gtazedby sheep
iór'Zó-ãuvr d,iti"Ë J;;";-*io-n ut tié Wuit" Institute, 1987.
2000
V = 2037- 41.96H + O-2284tt2 (r = -O'ggZ*{"t', ¡ = I l)
1000
0 10 20 30 40 50 60 70 80
Days grazing
ql.Ê,
=oC').Y
ø,Lfl0
0
EI
o
a
a
o
o
Fig. 5.2: The disappe¿ìrance _of burrs (rcF^!M/hÐ grazed by sheep for 7O-days during
suñrmer-autumn at the Waite Institute, 1987'
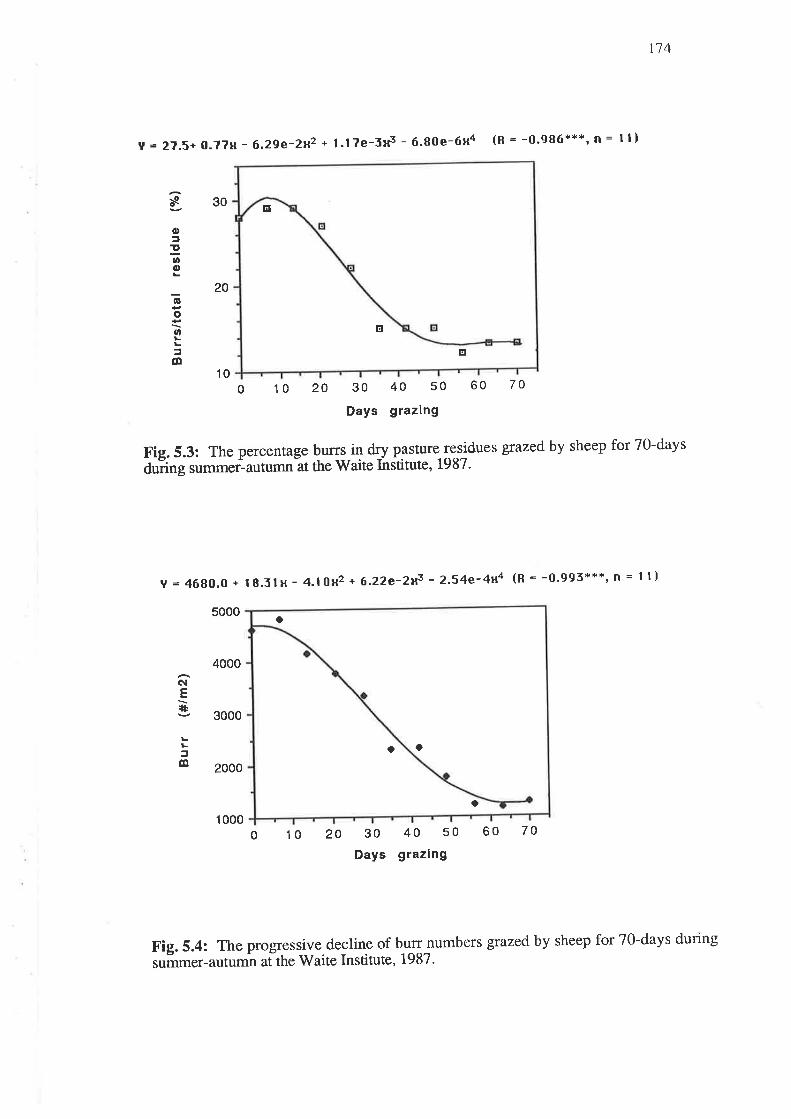
n4
Y = 27.5+ 0.7?s - 6.29e-2u2 + l.l?e-5s3 - 6'80e-6xa (R=-0.9S6***,¡= ll)
20
sofPa¡,o
rooLLJo
30
100 '10 20 30 40 50
Days grazlng
20 30 40 s0
Days grazlng
60 70
60 70
Fig.5.3: The percentage Þurr_!_il ty pastore residues grazed by sheep for 70-days
duäng summer:autumn at the Waite Institute, 1987'
v = 46g0.0 + lg.5lH - 4,1 o$2 + 6.22e-2r3 - 2.54e-4*t4 (B = -0.995*',t'*, ¡ = I l)
5000
3000
2000
1 000
4000
ô¡E+
Lfo
0 10
E
E
E
O
o o
o
Fig. 5.4: The progressive decline of burr numbers grazed by sheep for 70-days during
summer-autumn at the waite Institute, 1987.
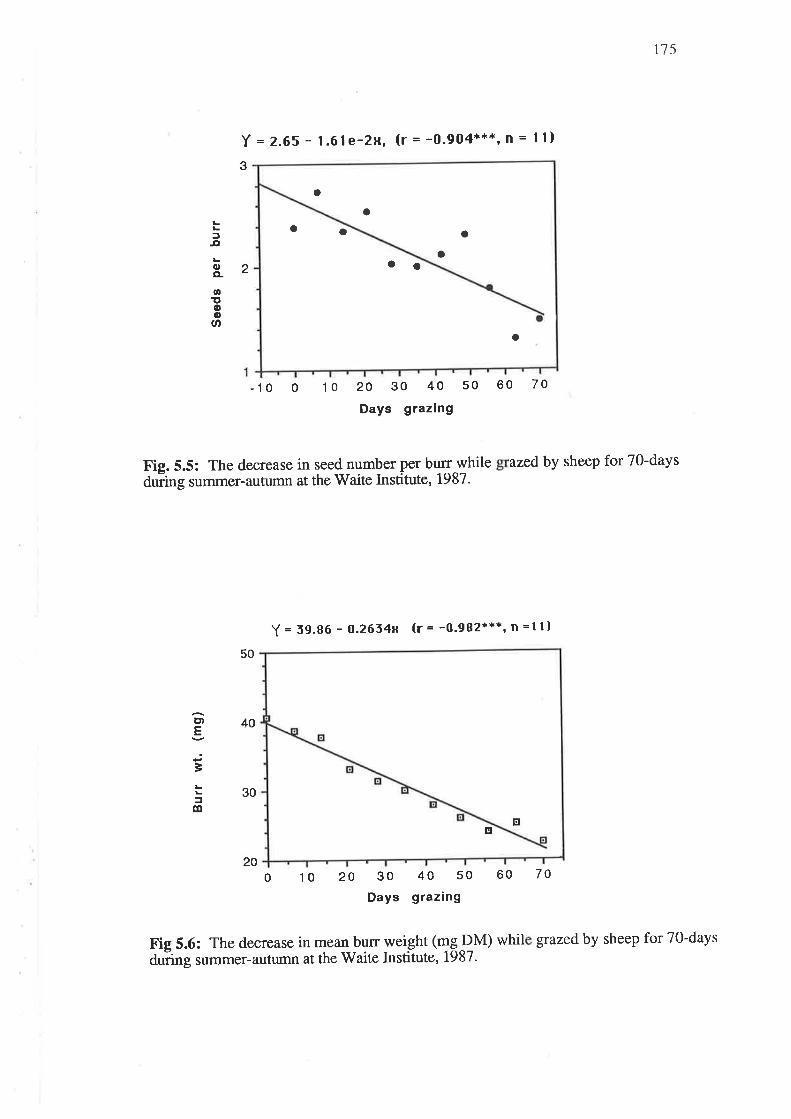
115
L
f-o
0,(L
an!c)i¡,(t,
Y = 2.65 - l.6l e-zq, (r = -0.904***, tt = I l)3
2
-10 0 1o 20 30 40 50 60 70
Days grazing
Y = 59.S0 - O.2634tt (r = -0.982***, n =l l)
2060 70
Fig. 5.5: The decrease in seed number per burr while azedby sheep for 7O-days
dùing summer-autumn at the Waite Institute, 1987.
50
40
30
ct)E
ìL
o
0 10 20 30Days
40 50
grazing
Fig 5.6: The decrease in mean burr weight (mg PM) whil grazedby sheep for 7O-days
duäng summer-autumn at the V/aite Institute, 1987.
a
aaa
aooa
a
EE
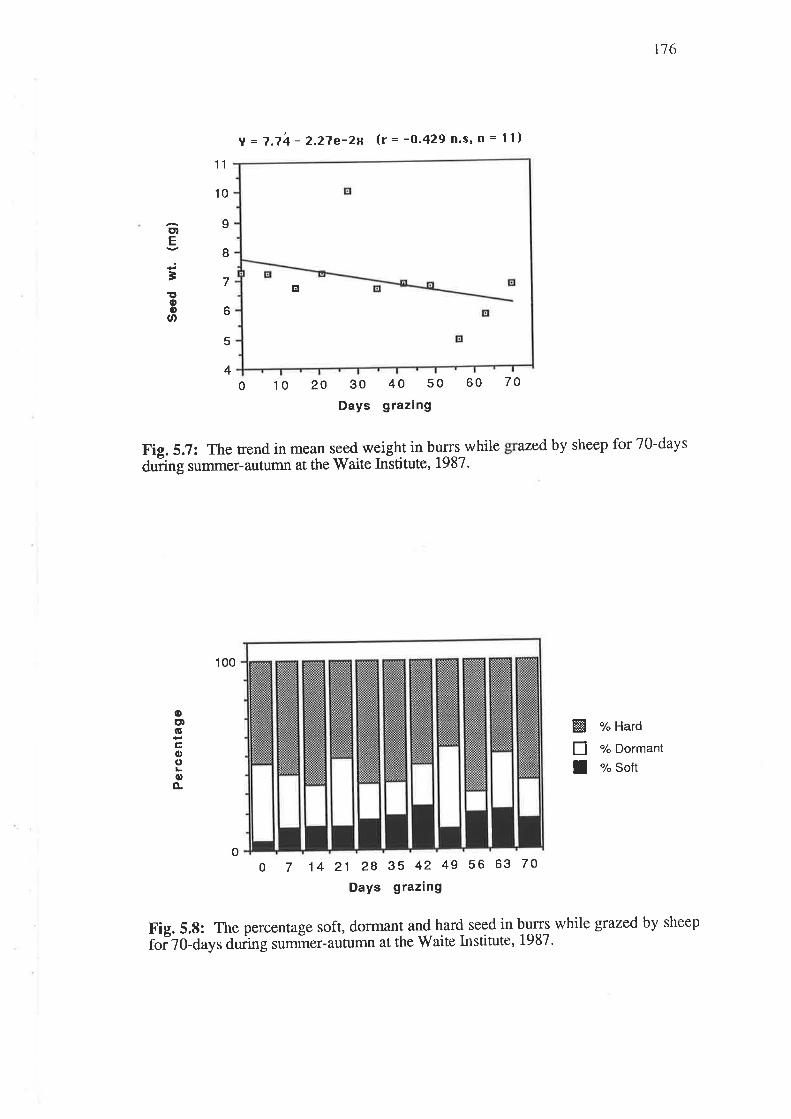
116
V = ?.74- 2.27e-2u k = -O-qZg n.s, n = I l)
cttE
ì'roo0,Ø
11
10
I
I
7
6
5
40 10 20 40 s0 60 70
grazlng30
Days
Fig. 5.7: The trend in mean seed weight in burrs while azedby sheep for 70-days
duäng summer-autumn at the Waite Institute, 1987.
ocrl6c,oo0,o.
100
o
W !"Hard
tr 7o Dormant
I % sort
o 7 1421 283s4249 566370DaYs grazing
Fig. 5.8: The percentage soft, dormant and hard seed in burrs while grazed by sheep
foíZO-auyr duàng sumñrer-autumn at the'Waite Institute, 1987.
E
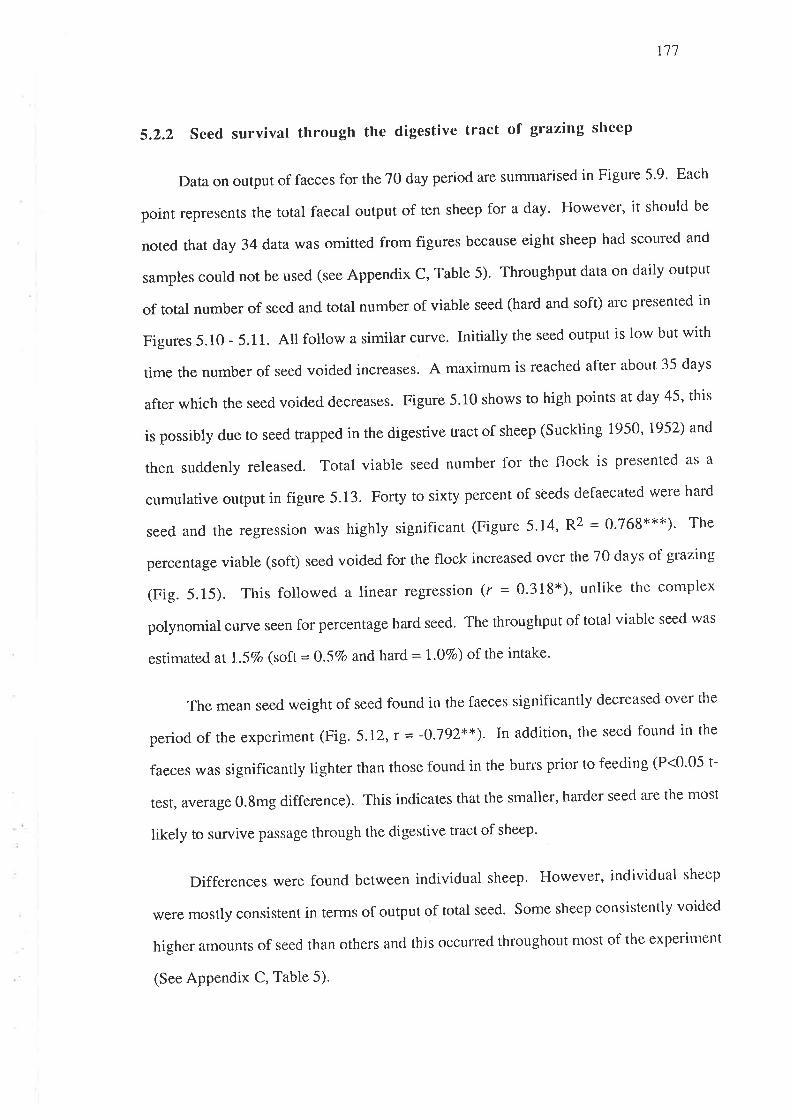
111
5.2.2 seed survival through the digestive tract <¡f grazing slreep
Data on output of faeces for the 70 day period are sumnarised in FigLrre 5.9. Each
point represents the total faecal output of ten sheep for a day' However, it should be
noted that day 34 datawas omitted from figures because eight sheep had scoured and
samples could not be used (see Appendix C, Table 5). Throughput data orl daily outptrt
of total number of seed and total number of viable seed (hard and soft) are presented in
Figures 5.10 - 5.11. AII follow a similar curve. Initially the seed output is low but with
time the number of seed voided increases. A maximum is reached after about 35 days
after which the seed voided decreases. Figure 5.10 shows to high points at day 45, this
is possibly due to seed trapped in the digestive Eact of sheep (Suckling 1950, 1952) and
then suddenly released. Total viable seed number for the flock is presented as a
cumulative output in figure 5.13. Forty to sixty percent of seeds defaecated were hard
seed and the regression was highly significant (Figure 5.14, R2 = 0'768***)' The
percentage viable (soft) seed voided for the flock increased over the 70 days of grazing
(Fig.5.15). This foltowed a linear regression (r = 0.318*), unlike the complex
polynomial curve seen for percentage hard seed. The throughput of total viable seed was
esrimared at I .57o (soft = 0.57o and. hard = | .jvo) of the intake.
The mean seed weight of seed found in the faeces significantly decreased over the
period of the experiment (Fig. 5.12,r = -0.192**). In addition, the seed found in the
faeces was significantly lighter than those found in the burrs prior to feeding (P<0'05 t-
test, average 0.8mg difference). This indicates that the smaller, harder seecl are the most
likely to survive passage through the digestive tlact of sheep.
Differences were found between individual sheep. However, individual sheep
were mostly consistent in terms of output of total seed. Some sheep consistently voided
higher amounts of seed than others and this occurred throughout most of the experi¡lent
(See Appendix C, Tabte 5).

17tì
1
=Eat,o
cD
CLo0,.c(r,
oLo
ã(Lão
ãooo¡¡.
y = 6455 + 278t{ - 3.444u2 (R2 = O.734***, n = 70)
Fig. 5.9: The total output of faeces from the flock (10 sheep) ovel the 70-day grazing
peãod at the Waite Institute, 1987 (Fresh weights shown)'
14000
12000
10000
8000
6000
4000
20000
0 10 20 30
Days
40 50
grazl ng
60 70
V = - 595.5 + 569.0s - 8.0987x2 (R2 = 0'65?*'*, n=70)
0000
CLo)o-c.D
o
7çLfo
Ì,ooC,
0
o 10 20 30 40 s0 60 70 80
DaYs grazing
Fig.5.10: Total seed output in faeces of 10 sheep (the flock) during the 70-day
grãzing period at the'Waite Institute, 1987-
EE
EtE
dF#E %
EI
EE¡
oo
oo
o @ oI o
soo
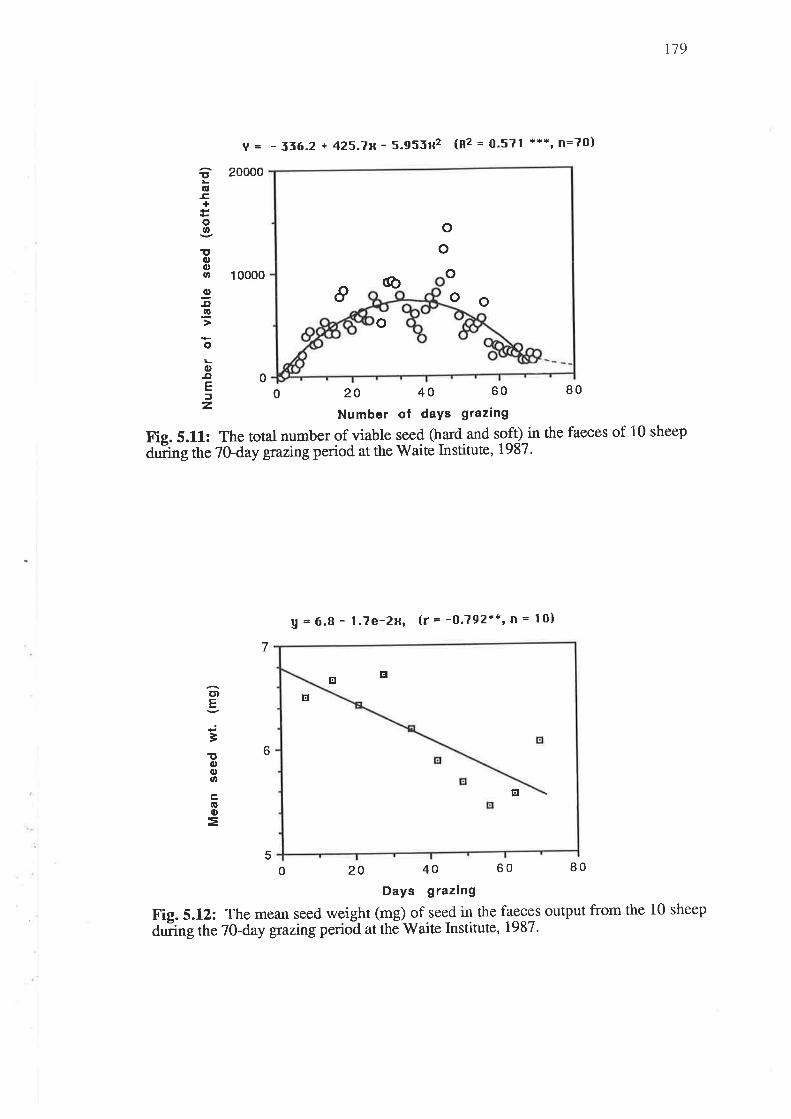
rt9
Y = - 336.2 + 425.7H - 5.9551t2 (82 = 0'571 **+, n=70)
20000
1 0000
0 20 40 60
Number of daYs grazing
80
Fig. 5.11: The totat number of viable seed (h_ard and softfn the faeces of 10 sheep
dnäng the 70-day grazingperiod at the V/aite Institute, 1987 '
U = 6.s - l.7e-2u, k= -O.792**, n = l0)
0
!tL(ú-c+
og,
T'ooal,
g¡to'toLí,.oE)
7
6
o)E
ìT'ooal,
É(úo
=5
o20406080DaYs grazing
Fig. 5.12: The mean seed weight (mg) of seed in the faeces output from the 10 sheep
duäng the 70-day grazingperiod at the Waite Institute, 1987'
oo
o&
@o
oo
EI
EI
E E
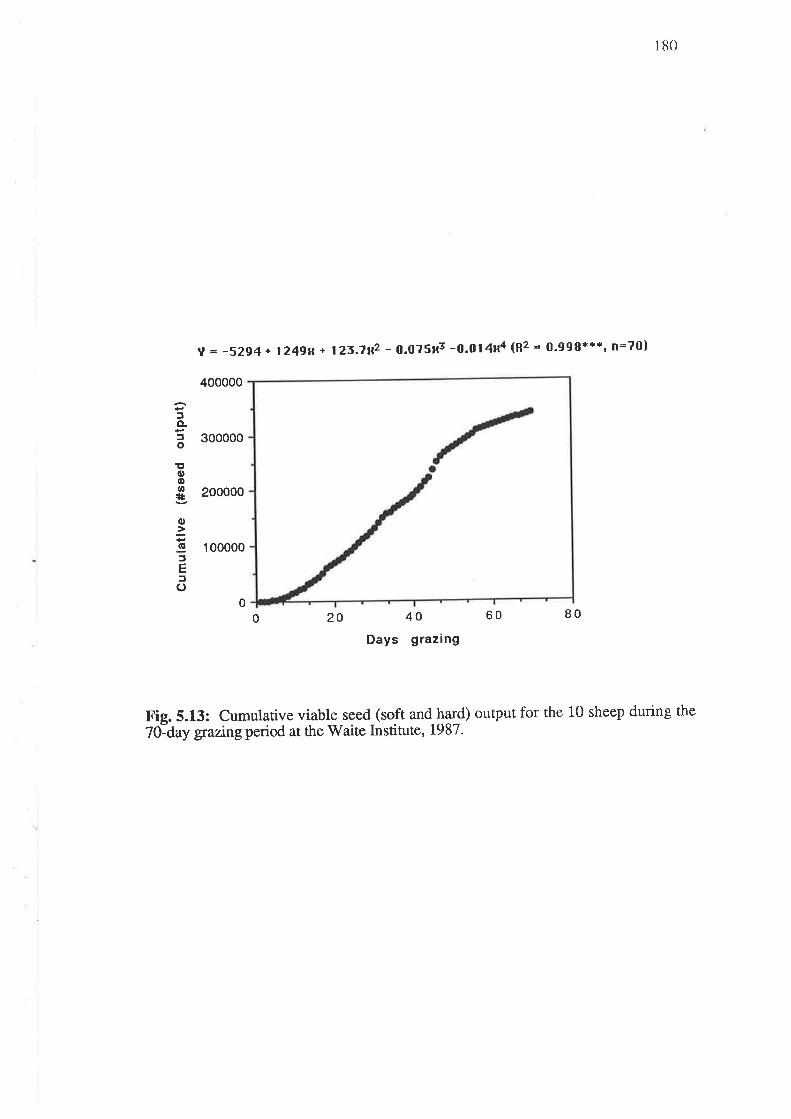
I tì0
.t = -5294+ l24g$+ 123.7|l'2 - 0.075x3 -0.014¡r4 (ß2 = 0'998r'**, n=70)
300000
200000
1 00000
20 60 BO
Fig. 5.13: Cumulative viable seed (soft and har_d) output for the 10 sheep during the
70--day granngperiod at the Waite Institute, 1987.
400000
fÈfo
Ïlooan+
o.ì(¡l
fEfC)
0
0 40
Days grazing
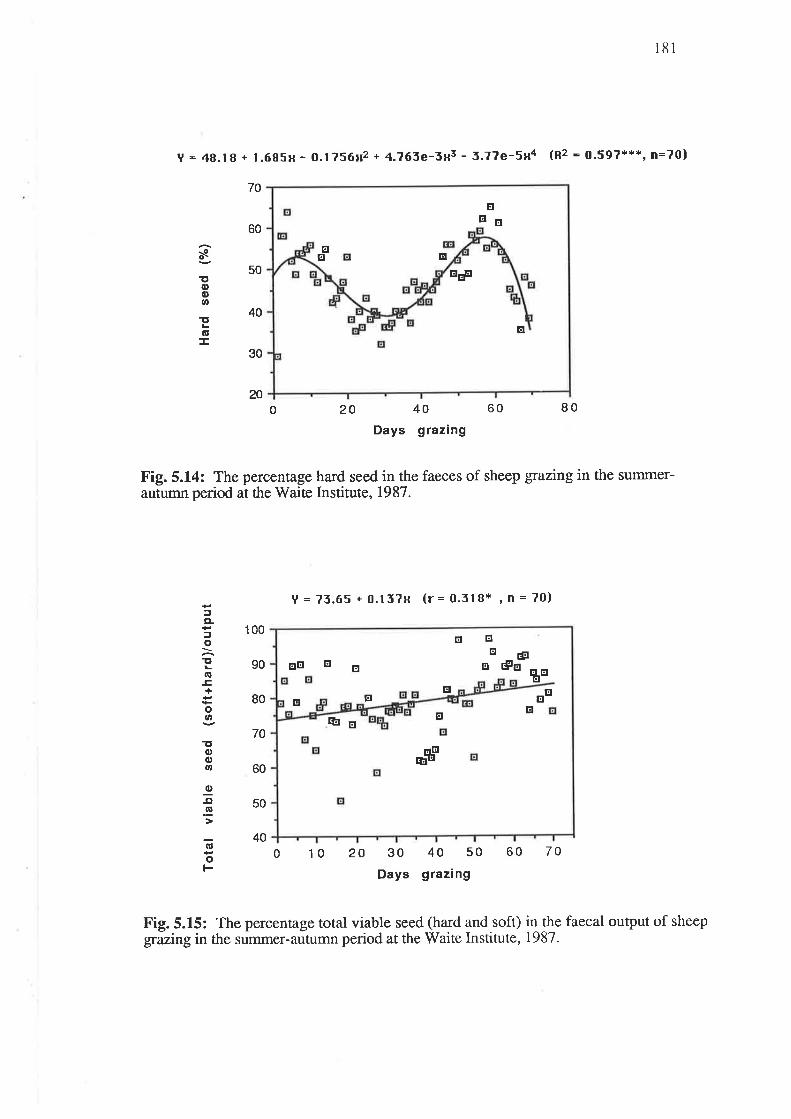
ltì1
Y = 48.18 + 1.685¡r - o.l?56t¡2 + 4.763e-3¡r3 - 5.7?e-5¡r4 (R2 = 0.597***, n=70)
0 20 40
Days grazing
60 80
Fig. 5.14: The percentage hard seed in the faeces of sheep grazing in the summer-autumn period at the V/aite Institute, 1987.
70
60
50
40
30
20
sT'oq)!,
Ìt6E
V = 75.65 + 0.15?s (r= O.¡tBr',n= 70)fCL
foIto-c+
o.o
ItItoø
(¡,
.Ct
.o
ro
100
90
80
70
60
50
400 10 20 30 40 50
Days grazing
60 70
GI
EddE
EGI
EEE
E+t
EE E gE
E
tr
EIËg
EEEEBE
EE@
E4s
Fig. 5.15: The percentage total viable seed (hard and soft) in the faecal output of sheepgrazingin the summer-autumn period at the Waite Institute, 1987.
182
All sheep had lost an average of 7.5 kg/head liveweight over the 10 day period of the
experiment (Appendix C, Table .1).
5.2.3 Seedling emergence from field faecal samples and the raised'bed
experiment
Table 5.1 comparg,S the number of seedlings which emerged from the field faecal
It , /lsamples comparedf.dthe raised-bed samples. The survival and number of seedlings was
much greater for samples placed in the raised-bed. The number of sub clover seedlings
emerging from faecal pellets in the field was estimated to be only O.l3Vo of the total seed
ingested (Table 5.1). This can also be seen in Figure 5'16 which illustrates the
cumulative number of seedlings to emerge from samples taken over the 70-day grazing
period. The figure also represents the number of seedlings that may be present at any
time during the 70-day graz\ngperiod after rain. However, both field samples and
samples placed into the raised-bed only represent those seedlings that were derived from
the soft seeds. These seeds are the most likely to contribute to the plant population in the
next season, while the hard seed contribute mainly to the long-term seed bank'
Data on total number of seedlings to emerge from burrs is sunrmarised in Table
5.2. Clarc, Trikkala and. Junee had the highest pfoportion of seedlings to emerge fronr
burrs in the raised-bed experiment. However, as Table 5.3 shows, it does depend on tl.ìe
stage in the experiment. Junee appears to increase as time progressed' This nray be due
to more rapid softening of Junee seeds aS burrs became progressively exposed' hetlce
more germination. Seedlings from faecal samples comprised nlostly Junee and Dalkeith
particularly in the later stages of the grazingexperiment'
Regeneration of the experimental site was poor, only an average of 63 plants/rn2
(Counted 13 May 1987).

183
00
o.ooEoe
U'o(,oo
Eo
|t,olE!0to
cD
12000
1 0000
8000
6000
4000
2000
10 20 30 40 50 60 70 80
Days grazing
Fig. 5.16: The cumulative number of seedlilglJg emerge from faecal slmgl.es
iÑññ based on nocÈ of 10 sheep) in the fréld (unwatered) and in a raised-bed
(watered).
I-egend: o Field emergencea Raised-bed emergence
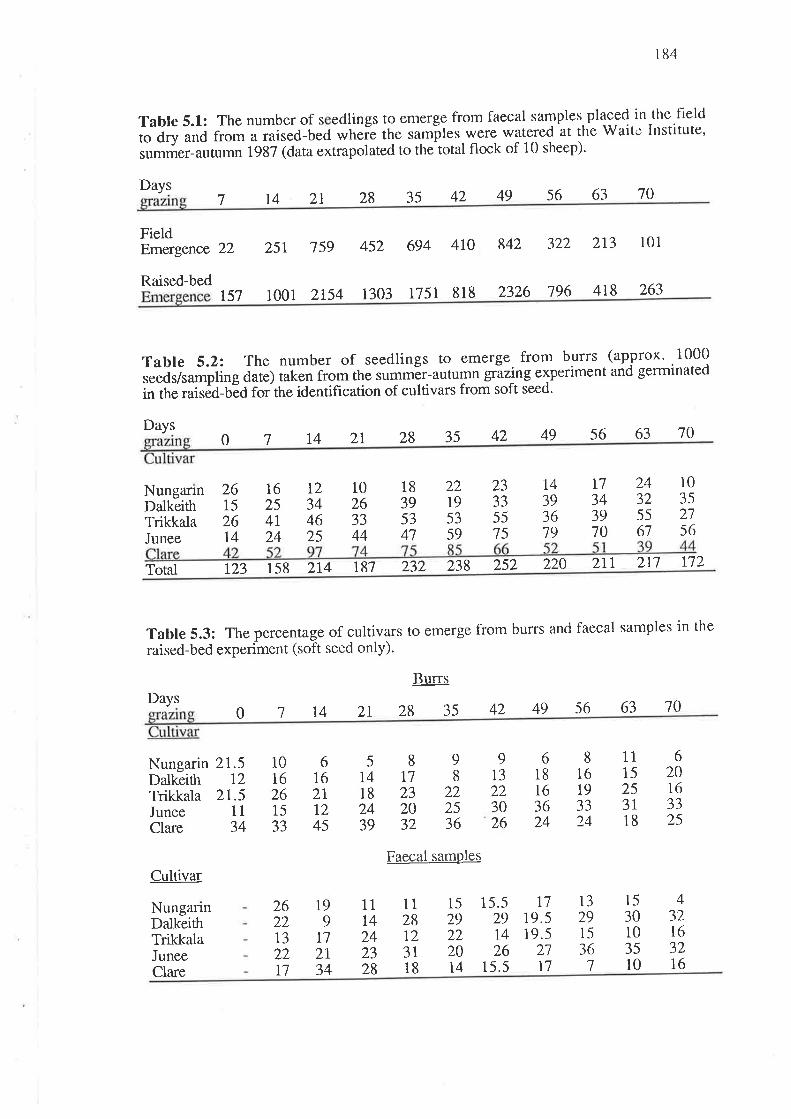
I tì4
Table 5.1: The number of s edlings to emerge from faecal samples pltg9{ in the field
¡o ã;y ãnd from u *ir"¿-U"d wheie the samþtes.were watered at the Waito Institute,
ru-ó"r-uutumn 1987 (data extrapolated to the total flock of 10 sheep)'
Days7142128 35 42 49 56 63 10
FieldEmergence 22
Raised-bed
z5r 759 452 694 410 842 322 213 101
r57 1001 2154 1303 175t 818 2326 196 418 263
Tabte S.2z The number of seedlings to emerge. from burrs (approx' 1000
,"ããViu-pfing date) taken from the summer-autumn grazing experiment and germinated
in tfr" raisä¿-¡õ¿ for the identifrcation of cultivars from soft seed.
Days 3s 42 49 56 63 1007142128
NungarinDalkeithTrikkalaJunee
261526t4
I6254l24
12344625
1026JJ44
18395341
22195359
23335575
t4393679
t]343910
24325561
1035zls6
Totat I23 158 2r4 187 232 238 252 220 2rr 2r1 r72
Table 5.3: The percentageraised-bed experiment (soft
Days
of cultivars to emerge from burrs and faecal samples in the
seed only).
Burrs
z8 35 42 49 56 63 100l14zr
Nungarin 21.5Dalkeith 12Trikkala 21.5Junee 11Clare 34
Cultivar
811232032
Faecal samples
10t6261533
6162lT245
5t4182439
913223026
618163624
816193324
1115253r18
620163325
98
222536
NungarinDalkeithTrikkalaJuneeClare
26221322t7
799t]2T34
11t4242328
1t28tz3l18
1529222014
15.529l426
15.5
t]19.519.5
zl17
1329l536
1
1530103510
432.163216

I tÌ-5
5.3 Results - Pen feeding experiment
5.3.1 Burr germination and burr dissecti<ln data
Clare and Trikkala burrs had the highest percentage of readily-germinable seed, and
the lowest level of hard seed prior to feeding but this was only for source A bttrrs'
Nungarin and Dalkeith had the highest level of hard seed (Table 5.4).
Junee had the highest numbers of seeds per burr. However' it also had one of the
smallest seeds (Table 5.5). As a reult the number of seeds fed to penned sheep was
greatest for Junee. In contrast, Clare had the largest seed hence less seed was fed'
5.3.2 Survival of seed fotlowing ingestion by penned sheep
The mean fresh faecal weights from the eight sheep are given in Appendix C' Fig'
1. Table 5.6 summarises results from feeding burrs of the five cultivars of sub clover'
Most seed was voided on the third and fourth days after feeding. The throughput of total
viable seed (hard,+soft) and hard seed are expressed as percentages of seed fed because of
the variable number of seeds fed depending on the cultivar. Analyses of variance were
carried out on arcsine transformed data. The percentage of hard seed in the faecal seed
output did differ significantly between cultivars (p<0.001). Dalkeith had the highest
percentage of hard seed in the ourput while clare had the lowest. The high proportion of
hard seed found in faeces of sheep fed Dalkeith can possibly be ascribed to the high level
of hard seed in the burrs before ingestion. However, when percentage sof{ seed (did not
include dormant seed) and hard. seed were related to the total number of seeds eaten (i'e'
output/inpu t Vo) differences between cultivars were not significant' Differences betrveen
cultivars in percentage total viable seed output would be difficult to detect because of the
wide variation between sheep. However, sheep with low seed oupttt, mostly hacl low
o¡tput for each of the cultivars (See Appendix C, Table 6 for an exanlple of this)' C¿lrter
(1980) has recorded a consistent three-fold difference in medic seed throughput by three

r86
, sheep. Sheep # 4 and #5 in the pen feeding had the lowest total viable (soft and harcl)
seed output regardless of cultivar. This also corresponds to the total seed outptlt.
All cultivars excepr Trikkala showed a decrease in mean seed weight for seed found
in the faeces (Table 5.6) compared to seed in burrs prior to feeding (Table 5.5) but
differences were not significant.
i
I

187
Table 5.4: The percentage soft, hard seed and dormant seed for sottrce A (MES burr
iqS6l unO e 1¡4ES Uu.. iç:SZi burrs fed ro penned sheep at the Waite Institute in 198[ì.
Soft seed (ø/o) Hard seed (7o) Donrrant (û/o)
SourceA SourceB Source A Source B Source A Source B
Cultivar
NungarinDalkeithTrikkalaJuneeClare
1.510.42.34.0
10.-5
t.46.67.3
12.623.5
7.55.28.85.79.1
5.73.1
24.67.4
29.4
92.990.368.180.047.1
8s.084.488.990.380.4
Tabte 5.5: The number of seeds per burr, the individual seed weight and the nLrnrber
ði s""¿r in 50g burrs for sources Å and B îed to penned sheep at the Waite Institute in
1988.
Seed (#/burr)
SourceA SourceB
Mean seed wt. (mg)
SourceA Source B
No. of seed in 50g burrs*
Source A Source B
Cultivar
NungarinDalkeithTrikkalaJuneeClare
2.42.52.52.92.3 2.6
4308312831124r301182
420131 193361501-5296r
4.97.0t.85.16.8
4.96.87.95.19.6
2.53.12.4J.J
t only of Clare burrs were fed
Tabte 5.6: The survival of seed from five cultivars of sub clover following ingestion
by sheep in pen feeding studies at the Waite Institute in 1988'
Subterranean clover cultivarN Dalkeith Trikkala Junee Clare
7193 104) 208 t39 232Seeds
Mean seed wt.ðiiããã voideã imel +.¡s s-sz 8-¡+ ¿'zz z'02Viable seedOutpuVlnpu<øri 3.5 5.1 3'4 4'2 3'l n's'
Hard seedOutput/input(7o) 2.9 5.0 3.2 4.O 3.1 n.s
Hard seed
in output(7o) 62.7b 80.5c 72.7bc 7 4.obc 61.04
z.l (60.8 (s7.1 (58.4 42.1)
nt supers pt ln rcate srgnl lcan erences u at on arcslne
transformed data. In brackets are the means calculated from the arcsine transfornled data
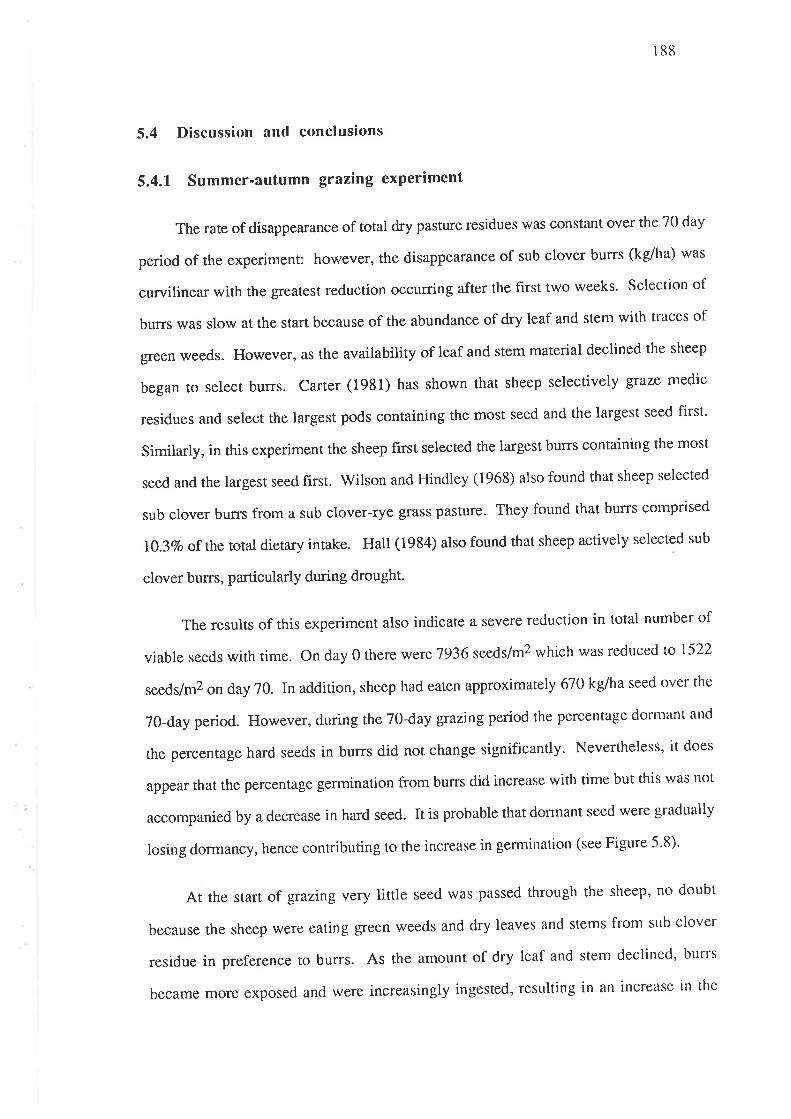
l tìtì
5.4 Discussion and conclusions
5.4.1 Summer-autumn grazing experiment
The rate of disappearance of total dry pasture residues was constant over the 70 day
period of the experiment: however, the disappeafance of sub clover burrs (kg/ha) was
curvilinear with the gleatest reduction occurring after the first two weeks' Selection of
burrs was slow at the start because of the abundance of dry leaf and stem with traces of
green weeds. However, aS the availability of leaf and stem material declined the sheep
began to select burrs. Carter (1981) has shown that sheep selectively graze medic
residues and select the largest pods containing the most Seed and the largest seed first'
Similarly, in this experiment the sheep first selected the largest burrs containing the most
seed and the largest seed frrst. Wilson and Hindley (1968) also found that sheep selected
sub clover burrs from a sub clover-rye grass pasture- They found that burrs comprised
70.37o of the total dietary intake. Hall (1984) also found that sheep actively selected sub
clover burrs, particularly during drought.
The results of this experiment also indicate a severe reduction in total number of
viable seeds with time. on day 0 there were7936 seeds/m2 which was reduced to 1522
seeds/m2 on day ?0. In addition, sheep had eaten approximately 670 kglha seed over the
70-day period. However, during the 70-day grazingperiod the percentage dormant and
the percentage hard seeds in burrs did not change significantly. Nevertheless, it does
appeil that the percentage germination from burrs did increase with time but this was not
accompanied by a decrease in hard seed. It is probable that domrant seed were gradually
losing dormancy, hence contributing to the increase in germination (see Figure 5.8)'
At the start of grazing very little seed was passed through the sheep' no doubt
because the sheep were eating gfeen weeds and dry leaves and stems from strb clover
residue in preference to burrs. As the amount of dry leaf and stem declined, burrs
became more exposed and were increasingly ingested, resulting in an increase in the
1iì9
viable seed output. The decrease in viable seed outpttt in the final 2 - 3 weeks c:an be
attributed to declining availability of burrs. The cumulative total viable seed otltptlt was
linear from day 14 to 55. From day 56 to day 70, the number of viable seed voided
dropped dramatically. Had the experiment continued beyond 70 days, the late of viable
seed voided would no doubt have fallen gradually resulting in the levelling of Figtlre 5' 13
and the extended tail for Figure 5.11.
Up to two-thirds of the seed found in faeces was hard. However, considering the
level of hard seed found in burrs (587o), much hard seed was destroyed' Suckling
(1950, lg52) also found rhat unscarlfled (98Vo hard) white clover seed was still
destroyed despite having been administered to sheep via gelatine capsules to minimise
chewing effects. Nevertheless, seed that remains whole and viable following cherving
and digestive processes is most likely hard seed. Sub clover seed is considerably larger
than white clover seed, therefore is more prone to chewing damage' Furthemrore, Figure
5.14 shows how the percentage hard seed found in the faecal output fell nrid-way
through the experiment when the greatest number of seed was being passed through the
sheep. This effect cannot be attributed to the percentage hard-seededness of the burrs at
that time because these were shown not to change at any period during the experintertt'
One possible explanation is that at that stage sheep were selecting the large burrs of Clare
and Trikkala, both of which normally have a higher proportion of soft seed than the other
cultivars. The raised-bed experiment also showed that Clare and Trikkala had high soft
seed levels throughout the 70-day period of the experiment. The subsequent rise in hard
seed percentage may be the result of sheep having to eat whatever burrs are there on offer
as burr availability decreased. Burrs at this stage possibly consisted mostly of the smaller
burrs of harder-seeded cultivars such as Nungarin and Dalkeith. The final decrease in
hard seed found in the faeces could be due to the small amounts of seed being consttrrled
and reduced and slower throughput of digesta, hence the digestive juices are nlore likely
to attack and penetrate the seed coat thus reducing the hard-seededness. This clid not
occur early in the experiment even though levels of burrs consumed were small because
190
there were also large quantities of dry leaf and stem matter being ingested' Sofi seed
voided in faeces is unlikely to survive under the hot, dry sttmmer-atlttlmrì conditions in
southern Australia. Therefore, this soft seed in faeces will not contribute signifrcantly to
the regeneration of Pasture.
Sheep lost bodyweight during the 70 days (AverageT-5 kg/head, Appendix c'
Table 1). Even though bodyweights wefe not checked weekly, it is possible that the
bodyweight loses commenced from day 35 - 40 onwards because this corresponds to the
time when daily viable seed olìtpllts were declining and the faecal otltptlt decreased' The
burr availability ar that stage was 725 kglha(i.e approximately 300kg/ha seed)' This is
considerably higher than the minimum level of 10 kg/ha of medic pods required to sustain
weight gain of Awassi sheep (Cocks 19SS). Squires (1978) found that sheep gained
weight when fed burrs and tops. However, in the waite Institute experiment sheep lost
weight on a similar diet. Dry tops disappeared quickly in the Waite Institute experiment
and sheep became more dependant on burrs. Squires (1978) found that sheep fed burrs
only had a slow decline in weight. Therefore, in the waite Institute experinreut sheep
may have begun to lose weight when they became more dependant on burrs for a source
of feed but at the same time burrs were decreasing in availability. It should be noted that
the stocking density in the Waite Institute experiment was the equivalent of 30 sheep/ha
and this high level of grazing pressure may have contributed to the weight loss of sheep'
The stocking tates used by Cocks (198S) were lower 5'3 to 16 sheep/ha' while those
stocking rates used in Squires (1978) experiment were from 12 to 25 sheep/ha'
Furthermore, sheep in the pen-feeding studies did not lose weight: in fact' nrost gained
some weight. This can be related to the higher quality of the diet and that sheep in
penned conditions do not have the stress of actively seeking feed as in the case of grazing
sheep.
The number of sub clover seedlings emerging from faecal pellets in the field was
estimated to be only 0.l3Vo of the seed ingested' Low survival of the imbibed soft seed
deposited in faecal pellets is likely to have been due to desiccation' Suckling (1950)'
r9l
suggested that soft seed in dung most probably doesn't survive the period of fernrentation
or they become desiccated. These results are in contrast to those of Simao Neto ¿r r¿l.
(19S7) who found seedling emergence from faecal pellets were similar to gernlinations
from washed-out samples: however, they used different legume species and kept faeces
moist. Nevertheless, the raised-bed experiment at the Waite Institute in which faecal
pellets were well watered have some similarities to the laboratory germination tests from
washed-out samples. Seed in faeces which was placed in the field represents the normal
situation after sheep have defaecated while grazing under field conditions in a
Mediterranean-type environment. Not only is it likely that imbibed seeds are desiccated,
but any seed which germinates will die unless there is sufficient following stlmmer
rainfall to allow establishment. If there is no follow-up rain, those seeds which have
begun germinating will frnd it difficult to emerge from the hardening faecal pellet. It was
observed in this experiment that in some cases only the radicle protruded from the pellet
before.it dried and died through desiccation. Problems may be similar to those of soil
pelleting (Campbell 1963) whereby the radicle was often beyond the pellet and prone to
desiccation. Therefore, in some dry environments the faecal pellet itself may present a
physical barrier to the germinating seed. Observations confirmed this contention. Most
faecal pellets were very hard and dry, requiring much water to moisten them. They also
dried quickly once wetted. The breakdown of hard seed in faecal pellets found on the
soil surface, could be faster due to fluctuating temperatures, particularly on hard-setting
soil where little if any dung would be trampled into the soil dtrring sumlner-arlttlnln.
Therefore, in dry climates it would be benefrcial to scarify the soil surface to incorporate
faecal pellets and any surface burrs.
5.4.2 Pen-feeding studies
One of the most notable aspects of this experiment is the higher survival of total
viable seed compared to the field grazing experiment (3.4 - 5.77o for the pen-feeding
studies and, 1.57o for the summer-autumn grazing experiment). Wilson and Hindley
(1963) had also founcl 5Vo ofthe seed eaten by penned sheep to bepassed as rvhole seeci
192
in the faeces. Of that seed 51o/o germinated. However, in their study no mention is nrade
of the hard seed percentage found in faeces. It is probable that the high survival of seed
in the animal house at rhe Waite Institute is due to the higher quality fed (digestibility)
compared ro the field. Jones and Simao Neto (1987), found that low quality diets had the
lowest survival of seed found in faeces. Dry pasture residues in the field always
deteriorate with time from exposure to the weather. Suckling (1950, 1952) also found
that the grazingof mature white clover stands in situ had low seed survival following
ingestion. However, the figures quoted were based on the amount of seed available and
not the amount of seed eaten. The pen feeding studies described in this thesis showed no
statistical differences between cultivars in the percentage total viable seed survival,
despite Dalkeith having the highest survival.
Seed size accounted for 80Vo of the survival of seed in the studies conducted by
ICARDA in Alleppo, Syria (Thomson et at. 1987). Seed size is trnlikely to have
influenced the survival of sub clover seed in the pen-feeding studies at the Waite Institute,
because the range of seed size was not large enough to show any response. Legume seed
used in the study by Thomson et al. (1937) had a very wide range in seed size (several
Australian medic cultivars, ICARDA medic lines, Trifolium campestre and 7.
tomentosum).
Wilson and Hindley (1968) also found that the germination percentage of seed from
faeces was very simila¡ to the seed on offer to grazing sheep. However, the sunrmer-
autumn grazingexperiment and the pen-feeding studies at the V/aite Institute showed that
the percentage germination was higher for seed in faeces than seed prior to feeding.
Wilson and Hindley (1968) used seed and burr, therefore much of the seed prior to
feeding may have been scarified aS indicated by the 52Vo germination of seed prior to
feeding.
Results from the pen-feeding studies have shown no signific¿rnt differences
between the cultivars in the survival of seed through the digestive tract of sheep. Dtle to
193
the lack of variation in the survival of the seed from the sub clover ct¡ltivars used in this
experiment, it is not expected that changes in botanical composition will occtlr.
However, burr size and seed size are potentially important contributors to changes ilr
botanical composition. The summer-autumn grazing experiment demonstrated that sheep
selected the largest burrs containing the most seed and the largest seed first. Therefore
some cultivars with inherently large burrs (e.g. Clare) are more likely to be selected fronr
dry residues first, thus contributing to botanical composition changes.
5.4.3 Conclusions
Results from the Waite Institute, 1987 experiment have shown how rapidly the
seed from a sub clover pasture is depleted by grazing sheep over the summer-autumn
period. Excessive grazing during this period may also result in smaller, ecologically-
less- fit seed remaining at the end of summer-autumn grazing. Therefore, sunlmer-
autumn grazing management of sub clover pastures must ensure that adequate seed
reserves are left for either regeneration of the pasture or adding to the seed bank
following tillage for a cereal crop. In addition, enough dry pasture residue should be
removed to prevent smothering of seedlings (Carter 1987).
Although sub clover buries some seed it would be beneficial to incorporate nlore
seed into the soil by shallow scarification (i.e. no deeper than 3 cnr) following grazirrg by
sheep to prevent excessive consumption of seed. This will enhance the seed bank reserue
in the soil for regeneration. The sheep themselves can be used to incorporate burr into
sands and other light-textured soils.
The removal of some dry pasture residues not only reduces the risk of 'blanketing'
seedlings but increases the level of soft seedfor the regeneration year. This is due to the
removal of the insulative effect that dry residues can have, thus exposing burr/seeds to a
wider fluctuation in temperature which is required fbr hard seed breakdown (Quigley
1989).

194
If dry pasture residues of sub clover are to be grazed it is important that the ltnloutlt
of seed in the soil seed bank prior to grazing is known. Monitoring of the decline of strb
clover burrs/seeds may then be undertaken to avoid excessive depletion of the sub clover
seed reserves


195
6. GENERAL DISCUSSION AND CONCLUSIONS
6.1 Influence of sub clover plant density on herbage antl seed production
Sowing tate or plant density proved to be a very influential factor in herbage
production and seed yietd in the small-plot experiment of 1985 and in the grazing
experiment at MES in 1986 - 87. Early in the growing season pasture production was
directly related to plant density. High pasture production led to high seed yield and high
seed yield commonly lead to high seedling density ut t"g"n"'ution' Despite the fact that
some cultivars have inherently high levels of hard seed, high seed numbers can
compensate and ensure good densities at emergence' Persistence of sub clover-based
pastures is assured if high seed/seedling production is maintained' A low density sub
clover pasture has the potential to produce high herbage production and seed production
if maintained at low stocking rates and the weed species are controlled' However' low
pasture density depresses autumn-winter production and depresses livestock carrying
capacity at that time.
(i) Herbage production: There is no doubt that high-density swards are mole
productive early in the season, but depending on the cultivar' both herbage yield and seed
yield may be depressed if not defoliated or under-utilized. Low utilization of dry pastttre
residues on the low stocking fate plots resulted in a'blanketing' of emerging seedlings
which reduced pasture availability and total yield (Carter 1954' 1987' 1988; Carter and
wigg 1963). Similarly, in the small-plot experiment, the cultivars clare' Trikkala and
Yarloop had reduced seedling numbers at emelgence as the amount of dry herbage
residues increased. The opposite occurred for Esperance. Quigley (1988) has
demonstrated that excessive cereal straw cover severely reduced the number of en-rerging
medic seedlings. It was suggested that part of the solution was to graze the straw
residue. Similarly, the grazing of dry sub clover pasture residues from high density
swards is essential, but care needs to be taken not to overgraze and deplete the seed
reserves (see general discussion 6'4)'

r96
under continuously-grazed conditions a large initial plant density is important
because it governs the level of grazing which can be tolerated. Donald (1954) suggested
that high density pastures would be the most useful for grazing' Many, small seedlings
can optimise yield early in the season, but a cultivar such as Clare can have fewer, larger
seedlings and can yield equally well or better as demonstrated in the small-plot
experiment 1985. This was also shown by de Koning (1984) and de Koning and Carter
(1987a). However, small-seeded culúvars such as Esperance can lose a high proportion
of plants later in the season which may result in reduced herbage and seed yield at the
higher densities (Chapter 3). Early defoliation of a high-density sward such as Esperance
may well have lessened the number of plants lost. The management strategy is to
maximise the utilization of light energy early in the season'
(ii) Botanical composition: Plant density affected botanical composition in both
undefoliated swards of the small-plot experiment and the MES grazing experiment'
Generally, more weeds were found on low density sub clover plots in both experiments'
Undefoliated swards in the 1985 experiment showed differences were due to both density
and the cultivar, taller cultivars having a competitive advantage over the more prostrate
cultivars. Results from the MES experiment showed that under grazing' cultivar
differences contributed little to the reduction of weeds in the pasture, and stocking rate
and sub clover plant density were more important. Mostly the high-stocking-rate plots
had the highest sub clover content for 200 kg/ha plots in 1987' High-stocking-rate plots
sown to 10 kglha had substantial invasion of other species such as Trifolium glomeratum
and T. tomentosum. Low stocking rate plots sown at 10 kg/ha had proportionally more
grasses. Botanical composition changes are not necessarily detrimental to livestock
production so long as the invasive species are relatively productive and palatable to
livestock (Ca¡ter 1968a; Cameron anfl Cannon 1970; Carter and Lake 1985)'
(iii) Seed yield: Seed yield was affected by the initial plant density. Very high
densities were found to reduce the seed yield of some cultivars (for example Esperance in
197
the 1985 experiment). This result is similar to the earlier work of Donald (1954),
Rossiter (1959) and Taylor and Rossiter (1967). All researchers found that nriâ-late
maturity strains had reduced seed yields when grown under sward conditions. However,
in the small-plot experiment in 1985, Clare (mid-late season cultivar) did not have
reduced seed yield under high plant densities. The reason for this is probably due to the
large initial seed size of Clare compared to Esperance, so even though both cultivars were
sown at equivalent weight of pure germinable seed, Esperance had the greatest ntlmber of
seedlings. Low density was also found to limit the seed production of cultivars in
undefoliated swards and under lax grazing.
Nungarin and Dalkeith had substantial decreases in seed yield in 1987 at MES
when the initial sowing Íate was 10 kg/ha. Similarly, Bolland (1986) found seed yield
was lowest at the low sowing rate of 10 kglha. It was the above-ground seed component
that was affected by sub clover density, the seed yield found below-ground was mostly
unaffected by density and this was the situation for the small-plot experiment in 198-5 and
at MES. Nevertheless, the percentage of seed buried was affected by sowing rate.
Cultivars in both experiments had a reduction in the percentage of the seed yield buried at
the higher sowing rates. Strong evidence of this was found in the small-plot experiment
with no defoliation. Junee and Trikkala were the only cultivars which showed a
reduction in the percentage of seed buried below-ground at the high sowing rate at MES
for both years. It was calculated that Junee had a reduction of between 3l to 377o with
higher sowing rates, while Trikkala had a '7 to ïVo reduction in the percentage of seed
found below-ground.
6.2 Influence of grazing on herbage and seed producti<¡n
Grazing influences on herbage and seed production on many occasions were found
not to be statistically significant even though differences between grazing tre¿ìtments
could be clearly seen in the field. Observable differences are likely to have biological
significance. Those stocking rate effects that were significant were mostly found on low
198
sowing rate plots indicating that low plant density pastures were more sensitive to grazing
pressure. However, a minimum of two replicates is necessary for sttrdying the
in terrel ation s of the soi l-plant- animal interface.
(i) Regeneration: Continuously stocked pastures unavoidably suffer from plant
losses at emergence (Smith et a\.1973, Brown 1976a). Removal of seedlings by sheep
was not a large problem on 10 kg/haplots when grazed at the low stocking rate and the
dry residue cover was not inhibitory as seen for similarly stocked 200 kg/ha plots. In
conclusion, stocking rate modifies the regeneration of sub clover cultivars when sown
initially at two contrasting sowing rates mainly through direct effects (treading - Carter
and Sivalingam Ig77) and defoliation of young plants and indirect effects through
accumulation of dry herbage residues and consequent suppression of emergence.
Removal of burr/seed during the summer-autumn period would have contributed to
the lower seedling emergence seen on high stocking rate plots (i.e. less seed present at
the start of the growing season, therefore less available to germinate and emerge). The
active selection by sheep for something green at the beginning of the growing season
would also lead to the reduction in seedlings. Those cultivars with large cotyledons (e'g.
Clare and Trikkala) would be more susceptible to selection by sheep at high stocking
rates because of their more-readily prehendible size and height. This is one area of
pasture research that requires more attention, particularly in view of the use of mixtures.
The question needs to be answered as to whether large seedlings are more likely to be
selected by sheep when gïown in a mixture of cultivars with smaller seedlings. This has
ecological implications in terms of yield, botanical composition and persistence of
pastures in the long term. The aim is highest possible level of
regeneration. High density regeneration leads to better winter production, higher
carrying capacity and the ability to achieve greater animal productivity and potentially
increase profitability.
199
(ii) Botanical composition: The type of invasive species was a result of grazing
pressure (i.e. grasses at the low stocking rate; small seeded annual legunles at the high
stocking rate). This has been shown earlier by other researchers utlder a range of
different environments (Carter 1966, l9l1; Cameron and Cannon 1970; Carter and Day
1920). However, grazingpressure is not the only determinant of botanical conrposition
changes, as stressed by Taylor (1985). In the MES experiment, initial sowing rate also
influenced botanical composition. The results from the MES experiment indicate how
rapidly changes in botanical composition can occur, hence adding to the difficulty in
interpreting results from such studies. However, the study also highlights the fact that
systems involving grazingare very dynamic (Carter and Lake 1985).
(iii) Pasture availabilit), and total pasture production: Depending on the sub clover
cultivar, high or medium stocking rates made the best growth supporting those restrlts of
Carter (1966, Ig77) and Brown (1977). However, the MES experiment was run only
for two years and sheep on high stocking rate areas needed supplementary feed' High
stocking rate areas may not continue to have good growth if the experinrent proceeded
beyond two years: Carter (1968 a,b,1977) found that high stocking rates led to failure
of the pasture in the fourth year and Brown (I916 a,b) found that the total pastttre
production was greatly reduced at high stocking rates in the third year at Kybybolite, in
the south-east of South Australia. However, dense plant populations can sustain a high
stocking rate and invariably when a high stocking rate treatment'crashes' it is the result
of greatly reduced pasture production often following a "false break" to the seasoll
(emergence followed by death of annual pasture species through drought). Though not
statistically significant, generally the high and medium stocking rate pasttlre areas made
the best $owth. Better gïowth was maintained by the earlier cultivars (Nungarin and
Dalkeith) compared to the same cultivars in low stocking rate areas. The 1987 seasorl
was much drier than the 1986 season and it would appear that high stocking rates helped
maintain better growth of the early cultivars, irrespective of the sowing rate. The later
cultivars Junee and Clare made good growth which could partly be attributed to late

200
maturiry. Carter (1966) and Brown (1916a) also found that heavily-stocked areas
remained greener for longer, because those pastures were able to oontinue to grow
following rain in late spring. So it would appear that high stocking rates may be
benehcial in extending the period of pasture growth.
(iv) Animal production: A highly-productive pasture grazed at a high stocking rate
' "un
gr"utly increase animal production. However, the needs of different livestock n]ust
be kept in mind. The requirements of wethers are not so high as those for ewes 'in lamb'
or ewes with lambs at foot. Simply, ewes cannotbe grazed at high stocking rates
without risking production decreases and lamb losses. Nevertheless, wethers can be
maintained at higher rates in the short term and the increases in wool production per
hectare ate great. The animal production per hectare (i.e. greasy wool weight) was much
higher for high stocking rate areas.
(v) Seedproduction: Rossiter (1972) suggested that grazing low density swards
may gïeatly affect seed yield, because sub clover cv. Dwalganup grown as single plants
had reduced seed yield when defoliated at flower initiation or early flowering. In
conffast, swards were found to have increased seed yield. Some evidence can be found
to support this contention in the MES experiment, particularly at the end of the first
season when there were large differences in sub clover populations following high and
low sowing rates. The difference between the two sowing rates at the high stocking rate
was approximately 1 tonne seed for Dalkeith. Later-maturing cultivars did not have the
same magnitude of seed yield reduction. This may imply that on relatively pure swards
of sub clover which are of low plant density (i.e those swards at 10 kg/ha at MES 1986)
care needs to be taken when grazing the earlier cultivars at high stock densities
particularly if a large seed yield is sought. However, the MES data in 1987 also indicate
that heavy grazlngon relatively high plant populations can also reduce seed yielcl-
Overall, mean seed weight had also decreased in the 1987 season compared to the
1986 season. This may be a seasonal difference, but could also indicate the beginning of
201
long-term changes in seed size because of grazing. Rossiter (1961) also found a clecrease
in mean seed weight due to grazing. Both above- and below-grourtd seed corllponerlts
appeff to have been influenced by high stocking rates at MES. The production of srnaller
seed will result in smaller seedlings ar regeneration. Possibly the smaller seedlings could
be ecologically less-fit, particularly if they are to emerge following a cropping sequence
but not if regenerating in a long term pasture (Carter et a|.7989)'
The proportion of burrs buried has also been shown to be affected by defoliation
(Rossiter and Pack 1972;Walton 1975; Collins 1981). In the MES experiment Nungarin
and Dalkeith buried a high proportion of seed. Hence, both cultivars are suited to persist
well under grazingconditions. These results support the results of the above research
workers.
Herbage and seed production differences between cultivars ancl the6.3
mixture
production of herbage and seed varied between cultivars in the small-plot experinrent and
the MES grazingexperiment. As commercial seed with a range of seed sizes was used in
both experiments, it was not surprising that there were cultivar differences in plant
densities following the sowing of equivalent weights of pure germinating seed.
(i) Botanical composition: Cultivars differ in the ability to compete with weeds as
seen most clearly in the small-plot experiment, but only in the late stages of the growing
season at the higher sub clover plant densities. Ability to compete with weeds under
undefoliated conditions is also related to cultivar height. Sin-rilarly, Scott (1971) found
that the plots containing the tall sub clover cultivars had the least weeds. Differences
between cultivars in the ability to compete with weeds was not very clear at MES and this
was probably due to grazing. Grazing is known to reduce the morphological differences
between plants, particularly when the stocking rate is increased (Stuth et al 19tì5). This
has implications for complex pasture mixtures, especially if there are tall and prostrate
cultivars growing together as in the MES experiment. Tall cultivars such as Clare wotrlcl
202
be less likely to dominate at the high stocking rates, but may dominate the sward at low
stocking rates. Rossiter and Pack (1972) found that increasing stocking rate restricted the
taller Woogenellup cultivar thereby improving the competitive performance of Geraldton,
a prostrate cultivar. In the MES experiment the individual cultivars of sub clover were
too difficult to separate from the herbage harvested, hence no record of cultivar
composition in the mixture was obtained from grazed areas. More-detailed examination
of mixture swards under grazing is required. One can only speculate that Clare and
Trikkata could be the dominant cultivars on low stocking rate plots at both sowing rates.
Conversely the cultivars Nungarin, Dalkeith and Junee may be the most dominant at high
stocking rates because of their more prostrate growth habit.
(ii) Herbage production: In the year of sowing at MES and in the small-plot
experiment in 1985 there were no signifrcant differences between cultivars in sub clover
yield early in the growing season. This result supports the contention of Lawson and
Rossiter (1958), given that equivalent weight of pure germinating seed is sown,
differences between cultiva¡s will be minimal. Differences between the yield of cultivars
developed later in the growing season in both experiments which probably reflected
differences in maturity. However, the second year at MES (i.e. the year of regeneration)
did show cultivar differences in the cumulative winter growth but this was probably due
to differences in seedling density at the high sowing rate which resulted from the
constraint on emergence imposed by varying amounts of dry herbage residues' Both
Nungarin and Dalkeith had the highest seedling numbers at regeneration and the highest
yields. The early cultivars such as Nungarin and Dalkeith did have reduced growth late
in the season at MES compared to other later maturing strains such as Clare and Junee.
Nevertheless, had the seasonal breaks been late, the production of late-maturing cultivars
could have been reduced. This was demonstrated in the small-plot experiment with the
use of two sowing times which represented different breaks to the season. Clare had the
greatest reduction in herbage yield when it was sown late in the small-plot experitnent
compared to early cultivars. As a result, late-sown Clare plots were ¡lot nruch different in
203
yield to the other cultiva¡s. Early sowing did result in production differences with Clare
having the superior yield. Similarly, Dear ¿tnd Loveland (1984) found cultivar
differences in herbage yield of sub clover when sown early. This effect could also
influence the cultivar composition of a mixture. Late seasonal breaks could reclLrce the
yield of late-maturing cultivars when grown in a mixture or as pure swards' Late spring
il 'nation ofrains can also favour late-maturing cultivars and may, infact, cause Some gennl
seed of early-maturing cultivars. ,
Gd_See¿:þl¿: Seed yields varied with cultivars: however, cultivar differences
were dependent on the sowing rate (sub clover plant number) in the snlall-plot
experiment. Both Clare and Yarloop had the highest total seed yield (above- + below-
ground components), but only at the two highest sowing rates. Under gtaz'tng at MES,
cultivar differences existed at both sowing rates (10 and 200 kglha). Seasonal conditions
will also influence seed yield: in both yeafs at MES, Nungarin and Dalkeith had the
highest total seed yields while Clare had one of the lowest. Donald (1954) stated that the
relationship between density and seed production was not expected to remain constant
because of seasonal influences. High herbage yield did not always produce high seed
yield. Clare had high pasrure production in 1986 at MES but had one of the lowest seed
yields. yet in the small-plot experiment it had high herbage production and seed
production. Defoliation by grazingprobably affected the seed yield of Clare at MES.
Flowers on tall sub clover cultivars would be more accessible to grazing livestock than
prostrate cultivars. In addition Clare does not have good burr burial ability (Barley and
England 1910;Francis et al. l9l2) which would also predispose more burrs to be eaten
by livestock.
Cultivars with large seeds produced large seed in subsequent years; small- seeded
cultivars produced small seeds. This was shown to be partially dependent on sowing rate
(small-plot experiment). Clare had the heaviest seeds in the small-plot experiment arld the
MES experiment: however, large seed size was not sufltcient to compensate for low seed
numbers for the total seed yield of Clare in the MES experiment.

204
The level of hard-seededness of sub clover in burrs will vary with ctrltivar, the
degree of burr burial, defoliation and seasonal conditions at the time of seed nraturatiolì.
Nevertheless, a cultivar such as Clare used in both the small-plot experiment and MES
experiment generally had the lowest level of hard seed and the highest proportion of soft
seed. In the MES and small-plot experiments the below-ground burr component
contained proportionally more dormant seed, this was the situation for all cultivars.
There is also some evidence that there is considerable microbial attack of seed in below-
ground burrs. Taylor (1984) found evidence of microbial decomposition of hard seeds in
the field. The evidence from the small-plot experiment and MES may suggest microbial
attack or insect attack from crickets may occur early in burrs while they are relatively
lmmature.
Experiments of one year duration (small-plot density experiment 1985) which are
not defoliated do not provide information about the persistence of sub clover oultivars.
For example Clare had one of the best herbage and seed productivities in the small-plot
experiment, but showed signs of deterioration under continuously grazed conditions in
the second season at MES. In terms of early herbage production, seed yield and
regeneration, the cultivars Nungarin and Dalkeith are the most suited to the Mintaro
environment and are likely to persist under continuous gtazing. The influence of grazing
and density interrelations on seed yield needs more research.
6.4 The grazing of dry sub clover pasture residues and seed survival
following ingestion by sheep
Evidence from the pen-feeding studies indicate that no particular cultivar has an
advantage in terms of the percentage total viable seed voided (hard and soft seed)
following ingestion by sheep. In a mixture this may imply that no cultivar will be at a
disadvantage in terms of survival of seed ingested. The range of seed sizes between
cultivars used in the pen-feeding studies and the summer-autumn grazing experinrent
were not large enough to prodt¡ce differences itr the surr¿ival of seed from the various
20-5
cultivars. Thomson et al. (1987) found that seed size accounted for 8Oo/o of the strrvival
of seed. The range of seed sizes used by Thomson et al. was more varied. Snrall-seeded
legumes have a much higher survival rate (Dore and Raymond 1942 Suckling 1950,
1952; Powell and Mapes 1955; Vercoe and Pearce 1960; Carter 1980; Carter et al- 1989).
In addition, the high variability between sheep would also mask any differences'
However, the small-seeded cultivar Esperance may have had a higher survival if it was
used in the pen-feeding studies. However, results tended to indicate that hard seed level
could be more important for the range of cultivars used. Furthermore, there was some
evidence that hard-seeded cultivars such as Dalkeith had a higher percentage of hard seed
in the faecal output compared to the other cultivars.
The stocking rate (30 sheeplha) used in the summer-autumn grazing experiment
represents the high stocking densities that are common over the summer-autumn period
on many pasture ley-cereal properties. The experiment also illustrated the efficiency of
sheep in harvesting sub clover burr and seed from the surface of hard-setting soils'
Cultivars which produce proportionally more seed above-ground are likely to lose more
seed over summer-autumn due to grazing (e.g. Clare). Furthermore, results show the
selectivity by sheep for the largest burrs first (Chapter 5). Similar results were obtained
on grazed dry medic pastures (Carter 1981) whereby the largest pods containing the
largest seed and the most seed was selected frst by sheep. Sub clover burrs selected fronl
the summer-autumn grazingexperiment 1987 also contained the most seed and the largest
seed, although the decrease in the overall seed size in burrs (hard and soft seed) was not
statistically significant. However, the hard seed in burrs was found to significantly
decrease in size over the 70 day grazingperiod (eqn: Y =7 .! - O.lZx, r = 0'700 *¡' The
evidence indicates that grazing by sheep at high stocking rates during the green season
can also reduce the size of seed produced and the number of seed produced' Reductions
in seed size due to grazing were shown earlier by Rossiter (1961). This was conlmonly
the situation for the earlier cultivars as discussed previously. Further decreases in seed
size can result over the Summer-autumn period. Selectivity of large burrs has ft¡rther
206
implications, particularly those cultivars which inherently produce large burrs (e.g.
Clare). Therefore, part of the reason why large leafy cultivars such as Clare have
altegedly not produced well under heavy grazingmay reflect the heavy selection pressure
on large burrs formed on the soil surface. In addtion, Clare has a higher proportion of
seed set on the soil surface. In a mixture, cultivars with large burrs are the ones most
likely to be selected first by the sheep. Part of this effect can be seen in the results from
the raised-bed experiment. Both Nungarin and Clare had a decrease in the proportion of
soft seed as time progressed. Sheep grazing a mixture of dry medic residues may have
stronger pod selectivity because of the wider range of pod sizes (e.g' snail medics vs
barrel medics).
The survival of sub clover seed in the pen-feeding studies and particularly the
summer-autumn grazing experiment indicates that the regeneration of seedlings from
sheep faecal pellets is unlikely to contribute signihcantly to the overall regeneration of that
pasture. In addition, sub clover seed is probably not suitable for the use of disseminatiorl
on non-arable land, because the survival of seed is not great enough compared tdthe
other pasture species such as white clover (Trifolium repens) and balansa clover (7.
balansae) (Dore and Raymond1942; Suckling 1950,1952; Powell and Mapes 1955;
Carter Ig76,1980, 1981; Carter etal. 1989). Therefore, the successful continuation of
sub clover-basedpastures should focus on leaving sufhcient seed reserves above-ground
rather than relying solely on below-ground reserves and the little regeneration from faecal
pellets. The regeneration of the summer-autumn grazing experiment site was not
satisfactory ( 63 plants /mZ). Many of those seedlings may have come from below-
ground burrs. Long-term continuous hard grazing may result in a progressive reduction
in seed size as the season progresses. Resulting pastures may become ecologically-less-
fit if following a cropping sequence. This problem will be heightened if insufficient
seed/seedling numbers are produced from one year to the next.
There was evidence to suggest that the percentage germination of seed in burrs
increased over the period of the summer-autumn grazing experiment. It was postulated
207
that increased germination may be the result of burrs becoming exposed to the Sun's heat
as the amount of dry residues was progressively consumed by sheep' However, the
results from the summer-autumn grazing experiment also indicate that the increased
germination is not the result of reduced hard seed percentages, but a reduction in the
percentage dormant seed. So in the short-term (i.e. 70 days grazing) breakdown of
physiological dormancy is more probable rather than the breakdown of hard seed.
6.5 Practical implications of research
Results from these studies indicate that high density swards should be grazed at
moderately to high levels throughout the green season. This will minimize the deleterious
effects that high plant density can have on both herbage yield late in the growing season
and seed production. Furthermole, pastures which have low plant densities are best
grazedat medium to low levels of stocking rate. If seed set is reasonable at the end of the
gfowing season and the regeneration of the pasture is at least 1,000 - 1,500 plants /m2
then the pasture could be grazed at a higher stocking rate the following year' Low-
density pastures can achieve a production level similar to high-density swards if grazed
moderately and seed production ensured. This also implies that moderate to low stocking
rates should follow in the summer and autumn. In the Mintaro district (MES site
location) the standard stocking rate on continuously-grazed pastures is the medium level
(i.e 11 sheep/ha). Hence, there is scope for increased stocking rates for Merino wethers
if pastures have initially high plant densities. Low stocking rates can have deleterious
effects on the regeneration of high-density productive pastures due to the "blanketing"
effect caused by excessive dry pasture residues.
Grazing over summer and autumn is recommended but should be carefully
monitored, because results from the summer-autumn experiment indicate how rapidly
seed can be depleted from the soil surface. The stage at which to remove sheep or redtlce
stocking rate will depend on the initial availability of dry pasture residues and seed,
stocking rate and the extent of the seed bank (germinable and impernreable seecl)above-
208
and below-ground. More reasearch is required to determine the ideal stage at which
sheep should be removed. At the same time it is important to avoid trampling and
excessive fragmentation of dry residues. Notably in the summer-autumn period
fragmentation lea{ to clumping of residues and bare-ground, which could lead to an
/tuneven distribution of seedlings at regeneration allowing weed species to colonize the
bare areas.
Results at this stage indicate that the cultivars with large burrs should be treated with
more caution when grazing over summer. Similarly, cultivars which set a high
proportion of seed above-ground should be grazed with care. Caution is also required
when grazingduring the green season especially if a seed crop is sought' and particularly
for early-maturing cultivars because there is greater likelihood of proportionally more
flowers and immature burrs being removed. Furthermore, high seed yield ensures better
persistence (Carter 1982). High seed yield at the beginning of summer is also important
as a source of feed for sheep grazing that pasture over summer (Hutton 1968)' Initial
high seed yields may allow grazingto continue for longer on that pasture'
The increased appearance of the annual volunteer clovers Triþlium glomeratum and
T. tomentosum could be used as indicators that the grazing pressure is high in the
Mintaro environment. Carter (1965,1966) and Carter and Day (1970) found the same
species of clover on high stocking rate pastures. Similarly, Brown (I976 a) found the
increased invasion of Poa annua and Juncus bufonius indicated the gfazing pressure was
too high and the total productivity decreased. However, at MES the invasion of both T'
glomeratumand 1. tomentosumdid not result in a reduction in total herbage production'
Furthermore, invasive species may not necessarily be inferior in terms of animal
production/unit area (Carter 1966; Allden, 1968; Cameron and Cannon 1970 and Carter
and Lake 1935). However, long-term production of that pasture could be affected,
particularly if sub clover is expected to regenerate after a cropping sequence' Carter
(1963) and Carter and Lake (1985) demonstrated that T. glomeratum increased as
stocking rate increased from 7.4 to 22 sheep /ha ( 1.1 kg to 438 kg/ha seed for 7 '4 and

209
22 sheep/ha respectively). Trifolium, glomeraturn seed prodrrction differences were
reflected in botanical composirion and appear to be due to differential seed digestibility of
T. glomeratum compared to other pasture species present. Botanical composition
changes are inevitable and may not be detrimental to the pasture production or animal
production depending on the invading species.
It has been assumed for too long that seed production of sub clover pastures can
take care of itself. However, there are critical levels of seed reserves required for good
regeneration of a sub clover-based pasture. These levels are similar to those required for
medic-based pasture (500 kg/ha, very good seed reserve) (Caner 1982: Cartet et al. 1982
and Carter 1985). Satisfactory seed reserves for sub clover-based pasture in the high
rainfall (700- 880mm annually) dairy pastures of the Adelaide Hills was between249 and
382kg/ha(Carter and Cochrane 1985). Drier regions such as the Mintaro district (603
and 513 mm annually for the years 1986 and 1987) would require more seed than the
higher-rainfall zone to acr as a buffer against 'false breaks' to the season (i.e. 200
kglha<). Below-ground seed reserves at Mintaro for the cultivars Junee and Clare were
below 200 kg/ha in i987. This is insufficient for the Mintaro environment and poor
regeneration resulted. It is the below-ground seed yield that is more likely to contribute
to regeneration under continuously grazedconditions, so cultivars such as Nungarin and
Dalkeith would be the most successful.
6.6 Future work
The summer autumn grazingexperiment conducted at the Waite Institute was on
hard-setting red brown earth soil. A similar study is required on sandy textured soils'
Seed/seedling survival is expected to be better on sandy textured soils due to increased
natural burr burial by cultivars and also sheep will trample additional burrs into the soil
while grazingresidues over Summer. Furthermore, the influence of grazing on herbage
production during the green season and the seed production on sandy textured soils is

210
w¿uranted. In addition erosion risks need to be addressed. The influence of soil texture
on productivity and persistence of sub clover-based pastures is little understood.
Any future studies involving gtazing of sub clover cultivars in pure swards or as a
mixture should include at least two widely-contrasting densities. The results from MES
highlight the suggestion made by V/alton (1975) that sward density is very inrportant
when considering experiments which evaluate sub clover genotypes for seed yield under
defoliation. In addition, more detailed information is required on the performance of
mixtures during the green Season and over the summer-autumn period.
Pen-feeding studies involving a wider range of seed sizes of sub clover would be
useful in determining with clarity whether seed size is important for sub clover cultivars.
There are some inherently-small-seeded cultivars which may have an advantage. For
example, the Esperance seed used in the 1985 small-plot experiment had an average seed
size of only 4.5 mg. This was half the size of the other cultivars used in the same
experiment (Yarloop, Trikkala and Clare). Possibly the selection of different burr sizes
by sheep could be tested further under animal house conditions. Such studies could
involve the feeding of an inherently-large burr size cultivar (e.g. Clare) mixed with a
small burr size cultivar (e.g. Esperance).
Dry pasture residues of known availability and burr content should be grazed at
differing stocking densities. It needs to be qualified and quantified as to whether burr
disappearance would be slower under low stocking rates. There could be the possibility
that sheep at low stocking rates may actively select burrs despite an abundance of dry
herbage. More active selection of burrs could occur as the quality of the dry residues in
the field deteriorate. The assessment of any annual pasture species should include the
feeding of seed to animals, especially those grazing animals most likely to utilize that
pasture species. Future pasture studies would be the most beneficial if both the aninlal
and pasture production parameters were exanrined, thereby adding to the limited
211
knowledge of the pasture factors which influence animal production and the animal
influences on the pasture production and long-term persistence'
6.7 Main Findings and Conclusi<lns
1. Small-plot density experiment
The main findings were: (i) Dry matter production was strongly related to plant
density early in the season (i.e. the greater the plant number the greater the yield. (ii)
Differences in the herbage yield of cultivars late in the season were due to differences in
maturity. (iii) Seed production was positively correlated with herbage production at low
and medium densities: however, high density swards (e.g. 14,000 plants/m2) which
were undefoliated hadreduced herbage production and seed production and subsequent
regeneration. (iv) Differences in the ability of cultivars to suppress weeds only occurred
at high plant densities.
2. Grazing Experiment at MortlockExperiment Station
The main findings and conclusions were: (i) Low-density swards (e'g' 150
plants/m2) should be grazedwith caution (7 to 11 sheep/ha in the Mintaro district of
South Australia) throughout the growing season and the summer-autumn period, whereas
high-densirypasrures (1,500 to 2,000 plants/m2) can be grazed at higher stocking rates
(e.g. 15 sheep/ha) during the growing season and at the beginning of summer' (ii)
Changes in botanical composition were rapid and were influenced by initial sub clover
plant density and further modified by stocking rate. (iii) Under gtazing, cultivars did not
show any differing ability ro suppress weeds. (iv) Seed yield of some cultivars (e.g.
Nungarin and Dalkeith) were significantly reduced if the initial sowing rate was 10 kg/ha
':.1''i'';
compared h 200 kg/ha.
212
3. Summer-autumn Seed Intake Experiment
The main findings were: (i) Sheep were efficient harvesters of sub clover burr and
seed during the summer-autumn period: fust they selected the largest burr, containing the
most seed and the largest seed leading to a progressive decline in burr weight, seeds/burr
and seed size. (iÐ Seedling emergence from faecal pellets was poor and would not
contribute significantly to the regeneration of sub clover pastures in Mediterranean
climatic zones. (iii) An estimated l7o (hard) seed of the total sub clover seed ingested
survived chewing and passage through the digestive tract of sheep gtazing dry pasture
residues. These results indicate that summer-autumn grazing should be carefully
managed and the quantity of seed on the surface and in the top 2.5cm of soil monitored to
ensure that there is sufhcient seed to ensure regeneration of a high-density pasture.
4. Animal House Feeding Experiment
The main findings were: (i) The survival of seed in faeces was higher (2-9 to 5o/o
hard) than the survival of seed ingested in the summer-autumn field experimenr. (7Vo
hard). These differences possibly reflect the higher-quality feed in the animal house. (ii)
The percentage viable seed found in the faeces of pen-fed sheep did not differ between
cultivars.
5. Conclusions
Overall, the findings from the research described in this thesis support the view that
management factors have far greater impact on the potential productivity and value of
subterranean clover than differences ascribed to cultivars of sub clover. However, there
remains a need for further research into pasture management to enhance the
understanding of the complex soil-plant-animal interaction. Such research will need to
involve grazing livestock. Animal experiments are expensive but detoliation by
mechanical means can not simulate the influences the graz\ng animal has on pastures (e.g.
treading, selectivity of plants and plant parts, spread of nutrients and seed). Such grazing

213
influences need to be imposed on any new pasture species to assess persistence under
grazed conditions.


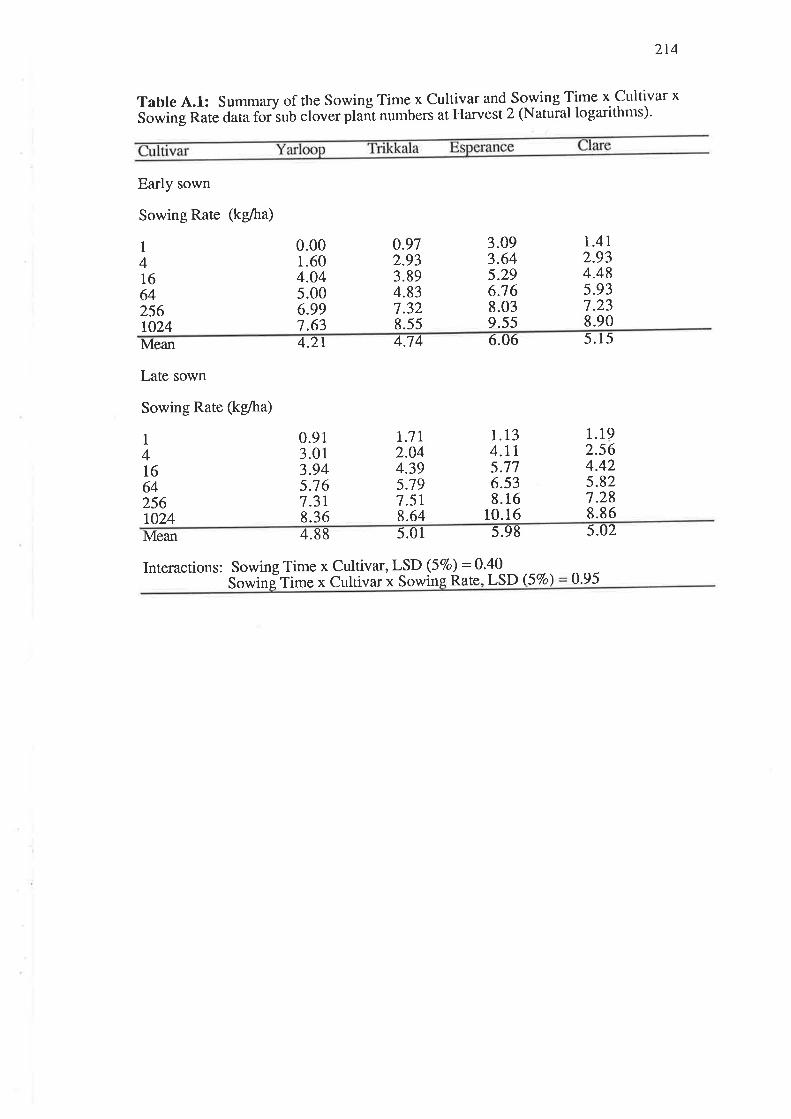
214
Table 4.1: Summary of the Sowing Time x Cultivar and Sowing Time x. Cultivar x
S;;ñg i;te data for'sub clover plañt numbers at Harvest 2 (Natural logarithnrs).
Early sown
Sowing Rate (kglha)
1
41664256to24
0.001.604.O4s.006.997.63
0.912.933.894.837.328.55
3.093.645.296.168.039.s5
r.4r2.934.485.937.238.90
Mean
Late sown
Sowing Rate (kg/ha)
4.2r 4.74 6.06 5.15
1
4t6
0.913.013.94s.7 67.318.36
T.7L2.044.395.197.518.64
1.134.11
1.192.564.425.827.288.86
64256LO24
5.776.538.16
10.164.88 5.01
LSD (57o) = 0
s.98
.40LSD (57o)
5.O2Mean
Interactions: Sowing Time x Cultivar,Sowins Time x Cultivar x Sowine Rate. 0.95
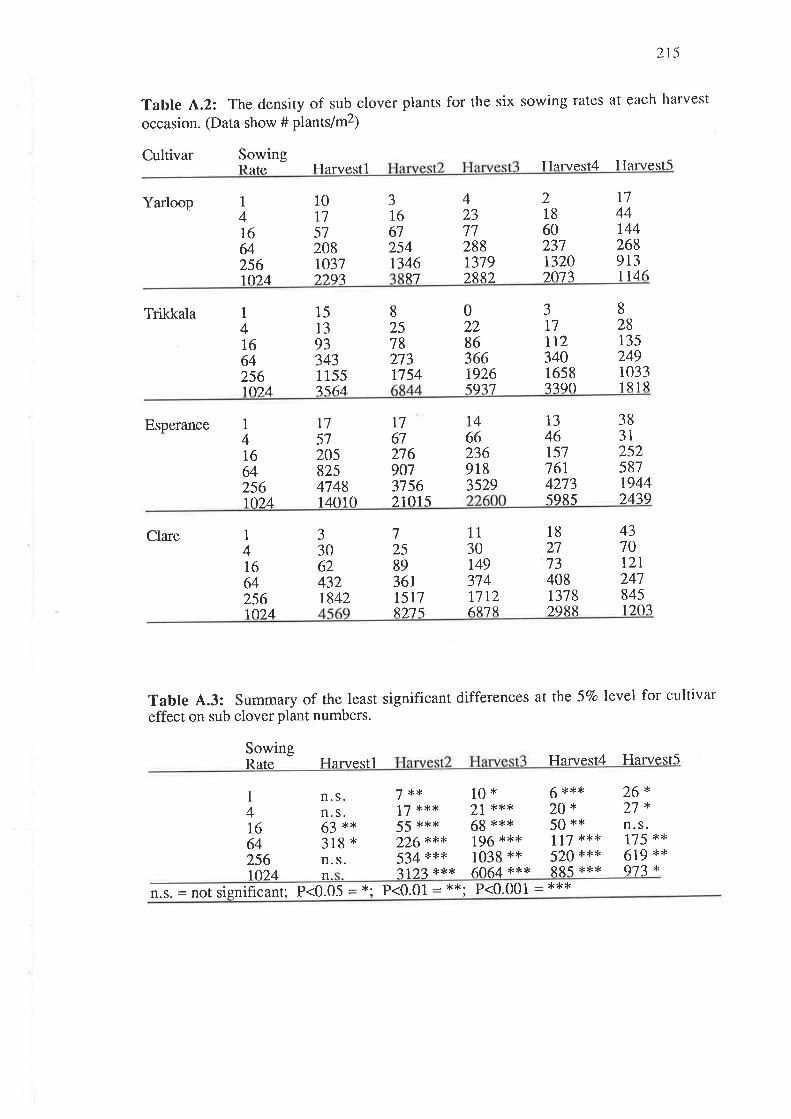
215
Table 4.2: The density of sub clover plants for the six sowing rates at each harvest
occasion. (Data show # plants/m2)
Cultivar SowingRate É{arvestl Harvest4 Harvest5
Yarloop 10tl51208r037).?97
aJI661254t346
4237728813792882
2186023713202077
t744t442689131 146
1
416642561024 R7
Trikkala 1
4t6
1513933431 155?'564
825782131754
0228636619265977
3t7t123401658?3go
82813524910331RlR
642561024
Esperance 1
416642561024
T75720s825474814010
t]672169073156
t4662369183s29
T346t5776r4273s98-5
3831252587194424392 1015
Clare 1
4r6
J30624321842
7258936tt517R).75
1130r49374t7126R78
l82173408r3782988
43l01212418451201
6425610).4
Table 4.3: Summary of the least significant differences at the 5Vo level for cultivar
effect on sub clover plant numbers.
SowingRate Harvestl Harvest4 Harvest5
1
416642561024
n. s.n. s.63 **318 *n. s.
7*x17 **x55 ***226***534 ***7123 x**
10x21 ***68 **>k
196 ***1038 **6064 ***
6 ***20*50 x*1 17 ***520 ***885 ***
26*27*n. s.175 **619 **973 *n.
n.s. = not significant; P<0.05 = *; P<0.01 - **. P<0.001 = ***
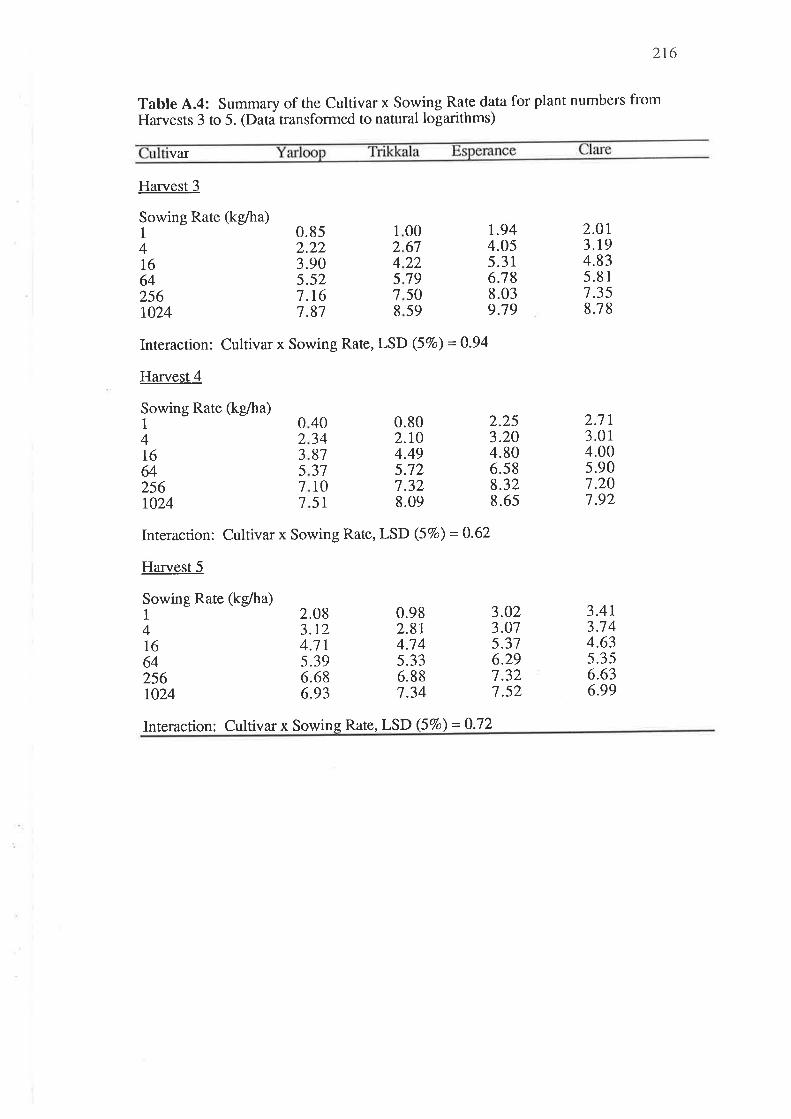
216
Table 4.4: Summary of the Cultivar x Sowing Rate data for plant nttmbers fronr
Harvests 3 to 5. @ata transformed to natural logarithms)
var
Harvest 3
Sowing Rate (kg/ha)1
41664256r024
Sowing Rate (kg/ha)1
4
64256t024
Sowing Rate (kg/ha)1
4t6642s6r024
0.852.223.905.52t.t61.87
006l22t95059
I245l8
r.944.055.316.788.039.79
2.253.204.806.588.328.6s
3.O23.O75.376.297.327.52
2.0r3.194.835.817.358.7 8
2.113.014.005.907.207.92
3.4t3.7 44.635.356.636.99
Interaction: Cultiva¡ x Sowing Rate, LSD (57o) = 9.94
Harvest 4
16
02J577
2.083.r24.7r5.396.686.93
0.802.t04.495.727.328.09
0.982.8r4.7 4s.336.887.34
403487311051
Interaction: Cultivar x Sowing Rate, LSD (5Vo) = 9-62
Harvest 5
Interaction: Cultivar x Sowing Rate, LSD (5%) =0.72
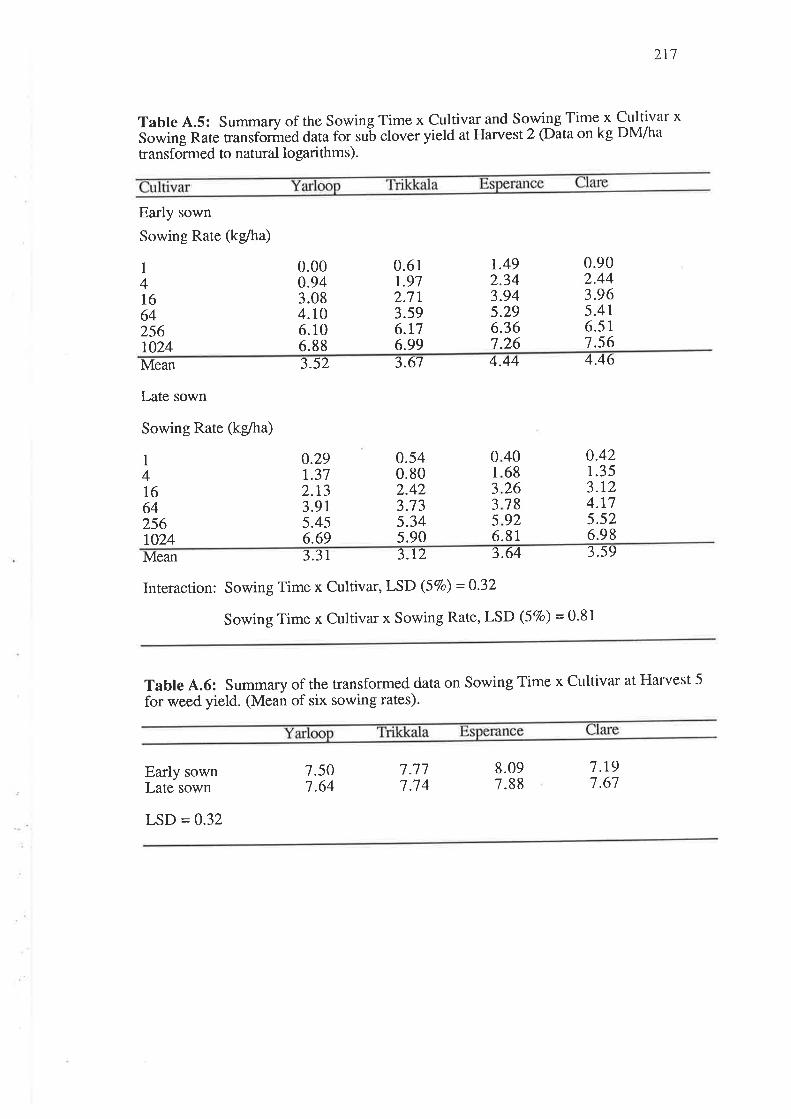
2tl
Table 4.5: Summarv of the Sowing Time x Cultivar and Sowing Time x Cultivar x
Sowing [ate transforáred data for su'b clover yield at Harvest 2 Qataon kg ¡M/hatransformed to natural logarithns).
Early sown
Sowing Rate (kg/ha)
1
416
0.000.943.084.106.106.88
r.492.343.945.296.367.26
0.902.443.965.4r6.517.56
0.61r.912.7r3.s96.r76.99
64256t024Mean
Late sown
Sowing Rate (kg/ha)
.52 3.67 4.44 4.46J
4068267892
01
J35
1
4t664256to24
0.29r.312.t33.9r5.456.69
0.540.802.423.735.345.90 6.81
0.421.353.124.175.526.98
Mean 3.3r 3.r2 3.64 3.59
Interaction: Sowing Time x Cultivar, LSD (57o) =0.32
Sowing Time x Cultivar x Sowing Rate, LSD (5Vo) = g'91
Tabte 4.6: Summary of the transformed data on Sowing Time x Cultivar at Harvest 5
for weed yield. (Mean of six sowing rates).
Early sownLate sown
LSD = 0.32
1.507.64
7.711.74
8.097.88
1.t91.67
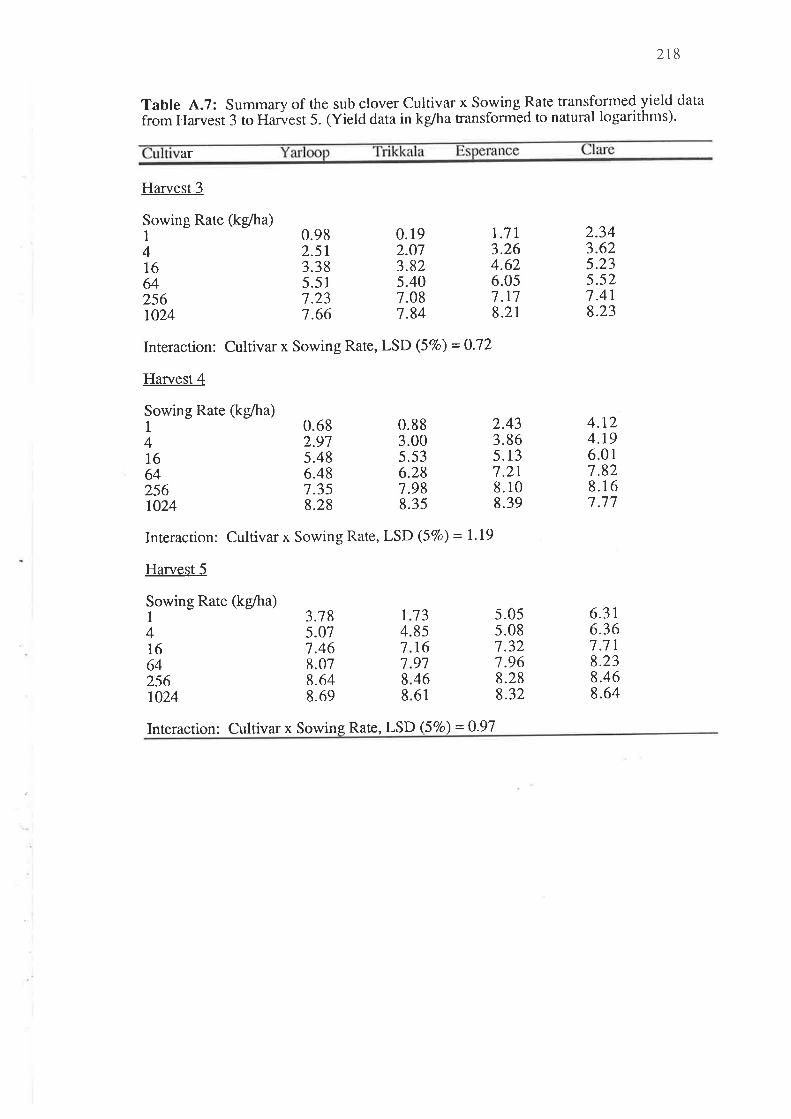
2rtì
Table 4.7: Summary of the sub clover Cultivar x Sowing Rate transformed yield data
from Harvesr 3 ro HÑest 5. (Yield data in kg/ha transformed to natural logarithms).
ar
Harvest 3
Sowing Rate (kg/ha)1
416642561024
Sowing Rate (kglha)1
4
64256to24
0.982.5r3.385.517.231.66
0.682.975.486.487.358.28
0.192.O7
0.883.00
6.281.988.35
t.7 |3.264.626.0s7.178.21
2.433.865.13t.2l8.108.39
5.05s.087.327.968.288.32
2.343.625.235.527.4r8.23
4.t24.r96.017.828.167.77
6.3\6.36l.lr8.238.468.64
3.825.407.087.84
Interaction: Cultivar x Sowing Rate, LSD (5Vo) = g-72
Harvest 4
5.53t6
Interaction: Cultivar x Sowing Rate, LSD (5Vo) = 1.19
Harvest 5
Sowing Rate (kgiha)1
41664256r024
.78
.07
.46
.01
.64
.69
J51888
1
41l88
t385169l4661
Interaction: Cultivar x Sowing Rate, LSD (57o) = 0.97
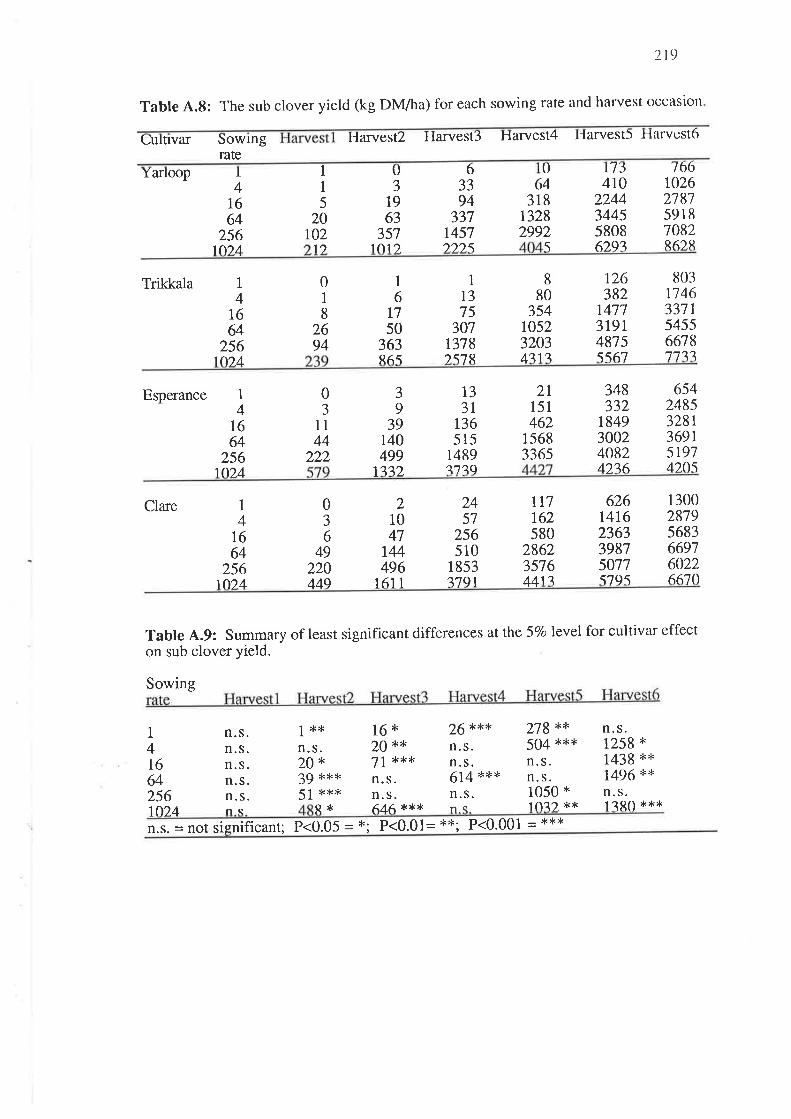
2t9
Table 4.8: The sub clover yield (kg DM/ha) for each sowing rate and harvest occAsrorì
Culttvar Sowing HarvestZ Harvest3 Harvest4 Harvest5 Harvcst6
rateI4
1664
2561n)4
I1
520
r02
63394
331t457n)5
7 3 '766
t026278159187082R62R
U
Jt963
357
0 IYarloop
1) 10.12.
64318
t3282992
5
4102244344558086).q1
Trikkala 1
41664
256'to)4
1
6t750
363ß65
1
13t5
301t378)5'13,
880
354r0523203
t26382
t477379148755567
80317463371545566187777
0I8
2694
411?
Esperance 0J
1144
222
1
4r664
256
J9
3914049977).
133r
136515
r489
"7?9
2l151462
1568336s
348332
r849300240824?.76
6s42485328r369r5r974).0510.)4 1
Clare 1
4t664
25610.24
21047
r44496
161 1
2457
256510
1853?'791
r77r62s80
28623st6
626t4t62363398750175795
130028795683669760226670
0J6
49220449 44 13
Tabte 4.9: Summary of least significant differences at the 57o level for cultivar effect
on sub clover yietd.
Sowing
1
416642561024
1**n. s.20x39 ***51 ***
16*20 **7 | **>k
n. s.n. s.646 **>k
26 x**n.s.n. s.614 ***n. s.
279 **504 ***n. s.n. s.1050 *10?2 **
n. s.1258 x
1438 **1496 **n. s.lj80 ***
n.s.n.s.n. s.n.s.n.s.ns Rt< ns
n.s. = not significant; P<0.05 P<0.01= **. P<0.001 = * ll*_*.t
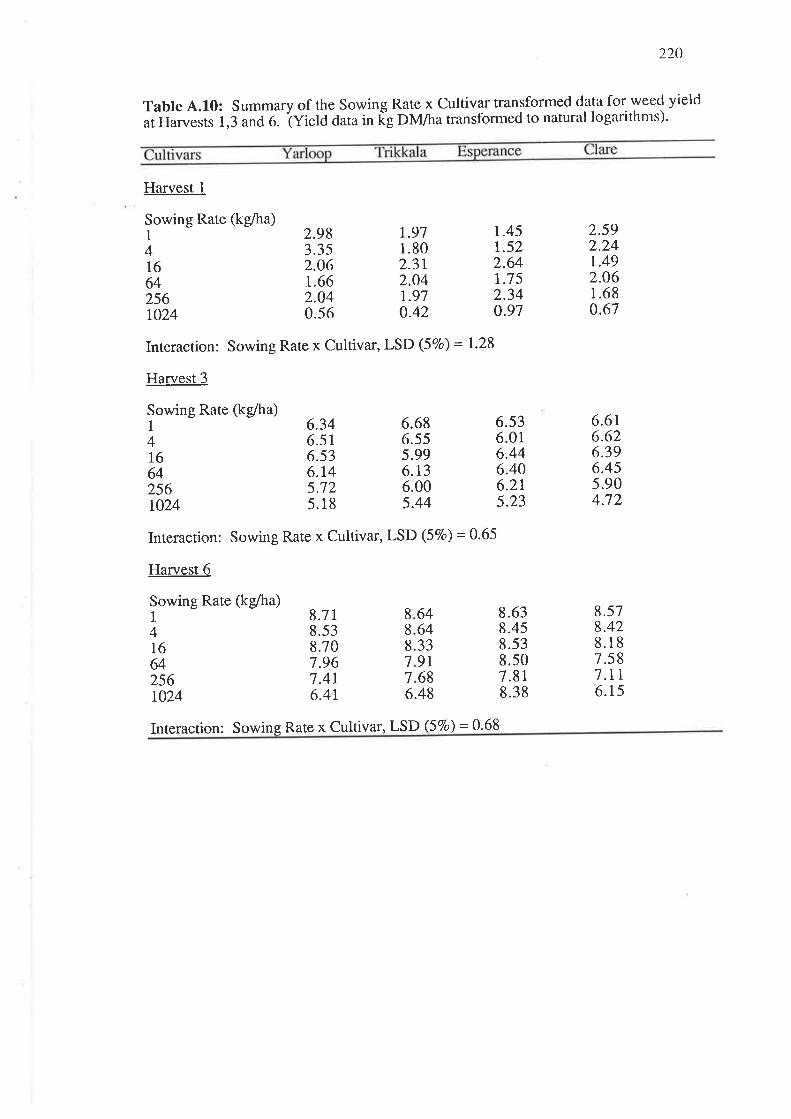
220
Table 4.10: Summary of the Sowing Rate x Cultivar transformed data for weed yielcl
atHarvests 1,3 and O- iVi"f¿ data in Ëg DM/ha transformed to natural logarithms).
Harvest I
Sowing Rate (kg/ha)1
416642567024
Sowing Rate (kgiha)1
416642561024
2.983.352.061.662.040.56
6.346.516.536.r45.125.18
6.136.005.44
r.45r.522.64r.7 52.340.97
6.536.016.446.406.2r5.23
8.638.458.s3
2.592.24t.492.061.680.67
6.616.626.396.455.904.72
8.578.428.187.5 87.rr6.15
r.9l1.802.3r2.04t.970.42
Interaction: Sowing Rate x Cultivar, LSD (57o) = 1.28
Harvest 3
6.686.55s.99
Interaction: Sowing Rate x Cultivar, LSD (57o) = 0.65
Harvest 6
Sowing Rate (kglha)1 8.714 8.5316 8.7064 7.96256 1.411024 6.4r
88871
6464339168
8.507.818.386.48
Interaction: Sowing Rate x Cultivar, LSD (57o) = 0.68

221
Table 4.11: The amount of weed (kg DM/ha) at each harvest occasion and all sowingrates.
I416642561o.)4
29362069o
r37135189r29r46't\
703799730489373?5R
2092191518671258727LR1
37944153385327271 133R16
642r5345648 I36s222491482
Trikkala 86t2
1
416642561o)4
124203151tt493LO
88274068252744271).
t9482055r879r293738)6
578440433898215717361).06
6268630344613970326210lo
298o
34r66
1
416
Esperance
642561o')4
159r63t74r2982'7 "l
714768843773629)47
fl742008r778r525875575
38714305370034232268).467
592349605315531828685O3fr
12o
Clare 287196116134111)5
76587270975446r)49
t9771753188910281002
40533500348020901299q40
565855664340250r2t727qR
1
416
29
64
1048
60
256o).41
a1
Table A,.I2z Summary of LSD (5Vo)values of cultivar main effect on weed yield (kg
DM/ha).
Sowing Harvestl Harvest2 Harvest3 Harvest5rate
41664256
n.sn.sn.sn.sn.s
n. s.n.s.
n. s.n.s.n.s.n.s.n. s.
n. s.n. s.n. s.908741
nnInn
n. s.n. s.n. s.n.s
n.sn.s
n. s.n. s.
2
.s.
.s,55.s,.s,
11
n.s = not significant.
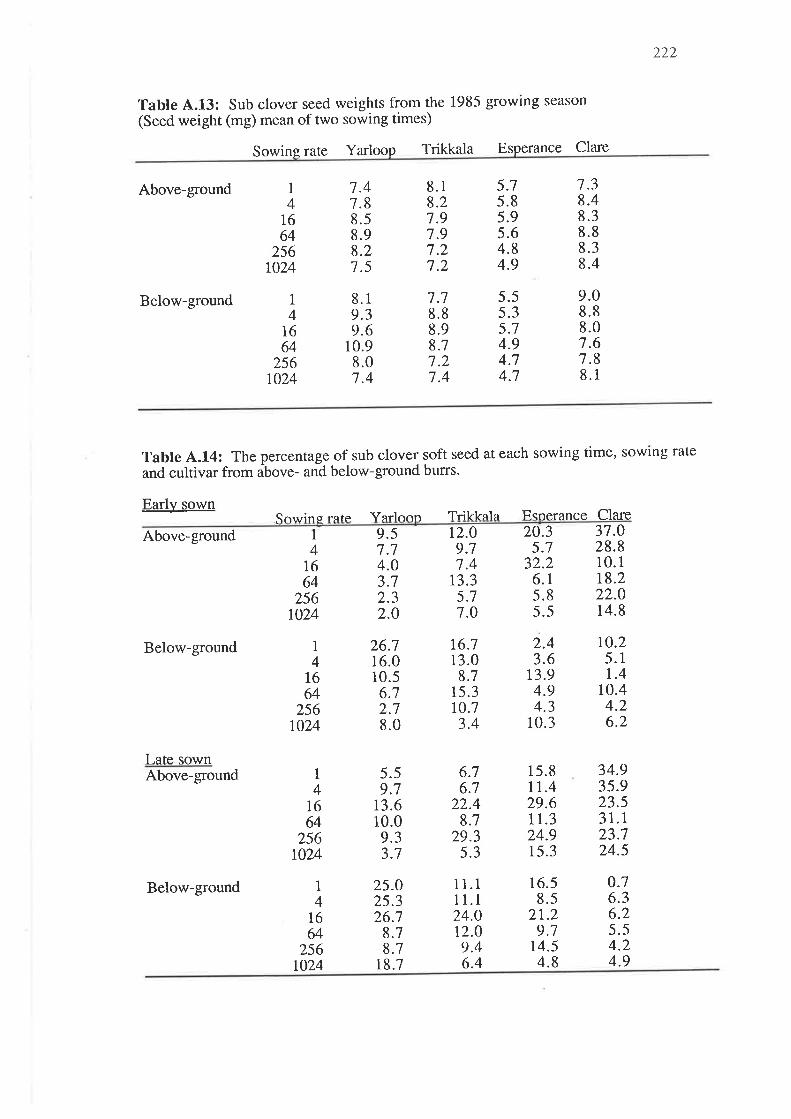
222
Table 4.13: Sub clover seed weights from the 1985 growing season
(Seed weight (mg) mean of two sowing times)
Sowing rate Yarloop Trikkala Esperance Clare
Above-ground
Below-ground
1
4r664
2561.024
1
41664
256t024
1.38.48.38.88.38.4
5.75.85.95.64.84.9
8.18.27.97.97.21.2
7.41.88.58.98.27.5
9.08.88.07.67.88.1
5.55.35.74.94.74.7
7.78.88.98.17.27.4
1
36904
8.9.9.
10.8.1.
Table A.l4z The percentage of sub clover soft seed at each sowing time, sowing rate
and cultivar from above- and below-ground burrs.
Early sownSowins rAt? Yarloon Trikkala Esnerance Clare
Above-ground
Below-ground
Late sownAbove-ground
Below-ground
1
4t664
256r024
1
41664
256r024
1
41664
2561024
5.732.2
6.15.85.5
12.09.77.4
13.35.77.O
9.57.74.03.72.32.0
20.3 31.O28.810.118.222.014.8
26.716.010.56.12.78.0
16.l13.08.7
15.3r0.13.4
11.111.124.012.09.46.4
13.94.94.3
10.3
15.8rt.429.611.324.915.3
r4.54.8
o.212.43.6 5.1
1.410.44.26.2
6.76.7
22.48.7
29.35.3
5.59.7
13.610.09.33.7
34.935.923.531.123.724.5
1
41664
256r024
o.76.36.25.54.24.9
r6.58.5
2r.29.7
25.025.326.1
8.18.7
18.7

223
Table 4.15: The percentage of sub clover hard seed at each sowing time, sowing rate
and cultivar for above- and below-ground burrs'
Early sown
Below-ground
Late sownAbove-ground
Below-ground
rate Y Trikkala
62.412.360.053.756.7
20.842.73r.330.725.816.l
s3.338.560.763.744.369.3
49.421.430.8
41664
256t024
1
41664
2561024
1
4T664
2561024
76.175.O73.0
93.95s.866.456.450.0
2,) )37.02t.9
54.579.668.164.363.771.2
24.854.5s7.042.431.630.3
Clare
58.047.98 r.07 5.564.5
33.832.430.43r.728.223.5
57.259.348.359.77 6.87 5.5
3 1.821.636.631.142.r4r.4
64.Os9.0
33.350.752.052.0t0.732.7
64.07r.361.774.762.068.3
t9.440.033.4
1
41664
256t024
15.029.354.044.732.018.0
55.655.644.0
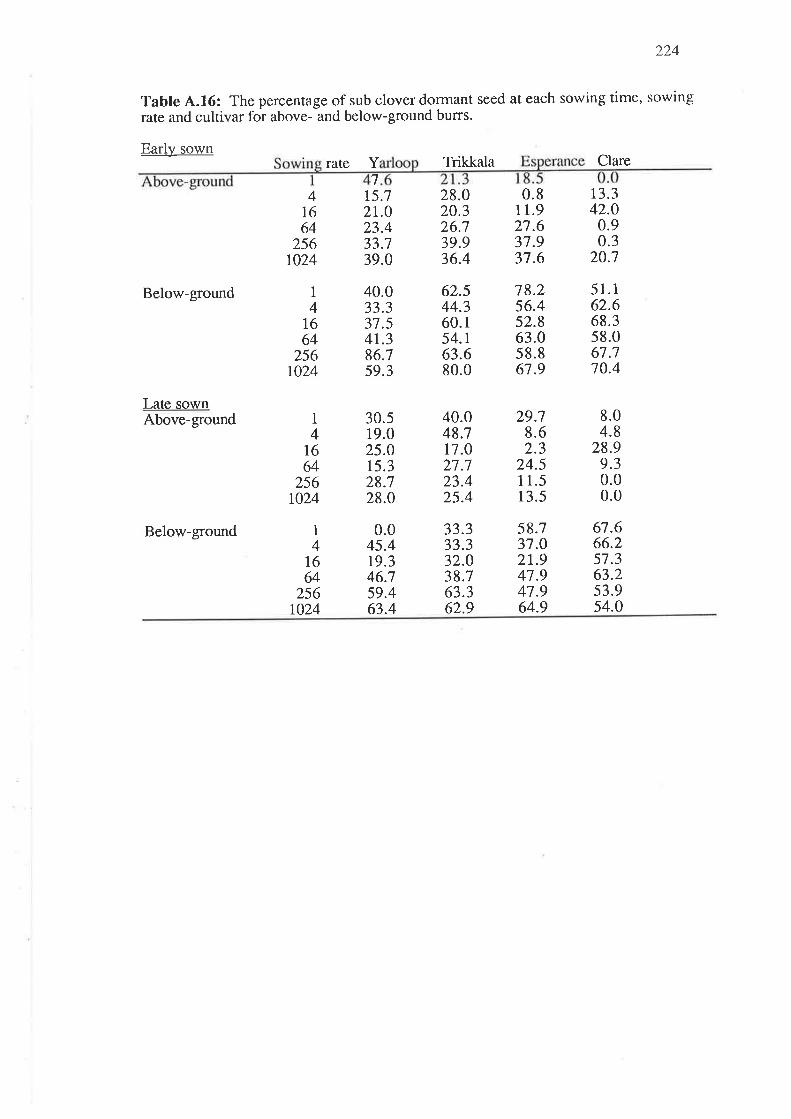
224
Table 4.16: The percentage of sub clover dormant seed at each sowing time, sowingrate and cultivar for above- and below-ground burrs.
Early sown
Below-ground
Late sownAbove-ground
Below-ground
rate Y7
15.72r.023.433.739.0
40.033.337.54r.386.759.3
Trikkala
28.O20.326.739.936.4
40.048.717.021.723.425.4
33.333.332.038.763.362.9
Clare
4I664
256r024
1
41664
256r024
1
4r664
256t024
63.058.867.9
62.544.360.154.r63.680.0
8.04.8
28.99.30.00.0
30.519.025.015.328.728.0
0.811.927.637.937.6
78.256.452.8
29.78.62.3
24.51 1.513.5
58.737.O21.947.947.964.9
13.342.0
0.90.3
20.7
51.162.668.358.061.770.4
67.666.257.363.2s3.954.0
1
4I664
256ro24
0.045.419.346.759.463.4
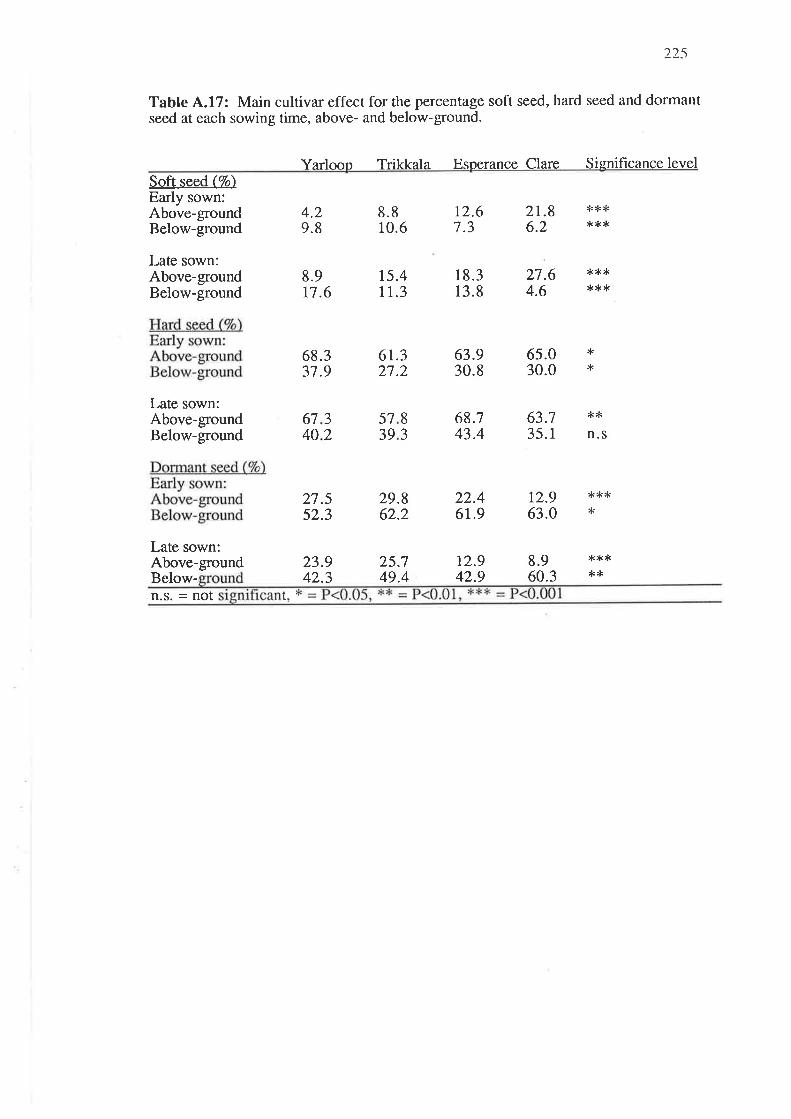
225
Table A.l7: Main cultivar effect for the percentage soft seed, hard seed and dormantseed at each sowing time, above- and below-ground.
Yarlcnn Trikkala Esoerance Clare Sisnificance levelSoft seed (7o)Early sown:Above-groundBelow-ground
Late sown:Above-groundBelow-ground
4.29.8
8.917.6
68.337.9
27.552.3
8.810.6
t5.411.3
61.327.2
29.862.2
25.749.4
12.67.3
63.930.8
68.743.4
22.46r.9
t2.942.9
2t.86.2
27.64.6
65.030.0
63.735.1
t2.963.0
8.9
**rß**t<
*{<*
,< * )+(
{<*
n.s
18.313.8
d<
x<
Late sown:Above-groundBelow-ground
Late sown:Above-ground
6740
5739
8J
)2
{< {< *<
*
9J
23.42.
**;l<,k*Below-
n.S. = not t,
60.3
',,, 1,., l¡l, rli,,i',';""i'

226
Table 8.1: The sheep bodyweights (kg/head) atthree stages in the 91n^e{9ent, 4'9'86,
4.6.81and 12.11.82 aid alío the"greas! wool weights (kg/head) on 19.3.87.
Bodyweight Bodyweight(ke) (ke)4.9.86 4.6.87
Bodyweight(ke)t2.tr.87
Greasy Wool(kdhead)19.3.81
BLOCK I
H.S.R.sheep # 1
#2#3#4#5#6#1
65.863.662.O6t.26s.664.260.0
79.4
#8#9#10#11#12
75.089.618.6
49.549.550.550.550.549.549.5
51.049.548.548.551.0
45.446.440.845.245.040.043.4
57.053.056.654.2s8.2
76.468.875.O74.O
6.3508.1007.9008.8008.800
7.6.9.7.9.8.8.
550800100750r00200300
M.S.R
L. S.R.#13#14#15
48.549.0s0.0
58.465.460.2
7.8008.8009.000
BLOCK II
H.S.R.#16#t7#18#19#20#21#22
S.R.#23#24#25#26#21
51.0s0.050.048.050.050.049.s ( 4e.9)
49.550.5s1.s (49.8)
17.870.673.468.6I r-273.661.6 (67
70.882.21r.274.285.8 (7s.8)
10.487.064.6 (11.s)
8.0007.8506.6007.9508.8006.9008.1s0 (1 .e32)
54.446.055.042.646.644.644.4 .5(4s.1) )
M.
57
40g*158.4)
s7.o (ss.z
49.548.s49.048.04e.s (4e.3)
55.858.251.650.0
6.8508.9508.1506.3008.800 (7.900)
8.s00 (1.792)
L. S.R.#28#29#30
s66445
600050
was replaced, hence the lower weight* The original sheep in this treatment died and
In brackeis are the õverall treatment means for both Blocks I and II.
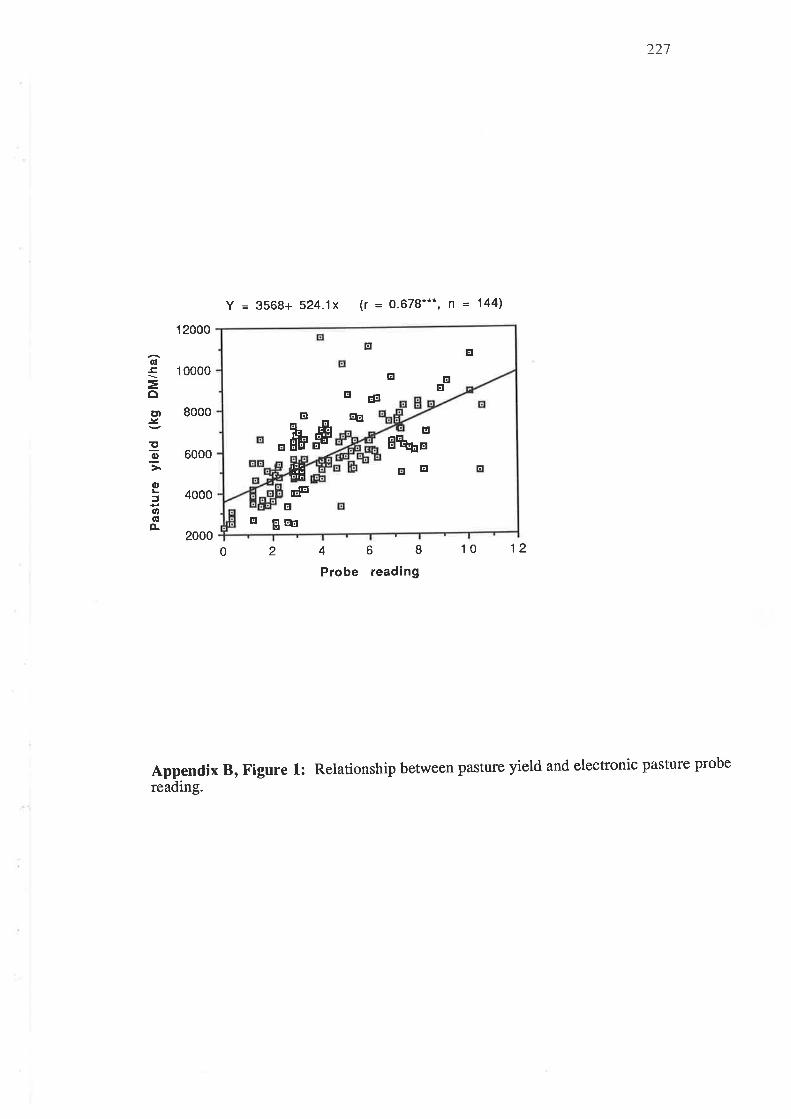
221
Y = 3568+ 524.1x (r = 0.678**', n = 144)
(Il-Ê.
=ottl.Y
îtp
0,Laü,oÀ
1 2000
1 0000
8000
6000
4000
200020 468
Probe reading
10 12
Appendix B, Figure 1: Relationship between pastufe yield and electronic pastule probe
reading.
EI E
EqËEÞ
E
E gEE
4s
.fu"#GI
EEI
E
EEI
EEEE
tg',olõ

z2t1
Table 8.2: The percentage bare-ground on 19.10.87 (Levy point data) at MES
L.S.R M.S.R H. S.R Cultivar means
Sown at Iin 1986
NungarinDalkeithTrikkalaJuneeClare
Stocking Ratemeans
Sown at 200 kg/hain 1986
NungarinDalkeithTrikkalaJuneeClare
kg/ha
6444
10
0.00.00.00.00.0
2.52.50.00.00.0
17.510.0t2.512.530.0
15.0 n.s. n.s
15.07.5
t2.517.515.0
L2.9 n.s. n.s.
12220
0.8
5.4
0.0
6.710.84.26.7s.8
0.02.5
5.022.50.02.50.0
0.02.50.0
0.8Stocking Ratemeans
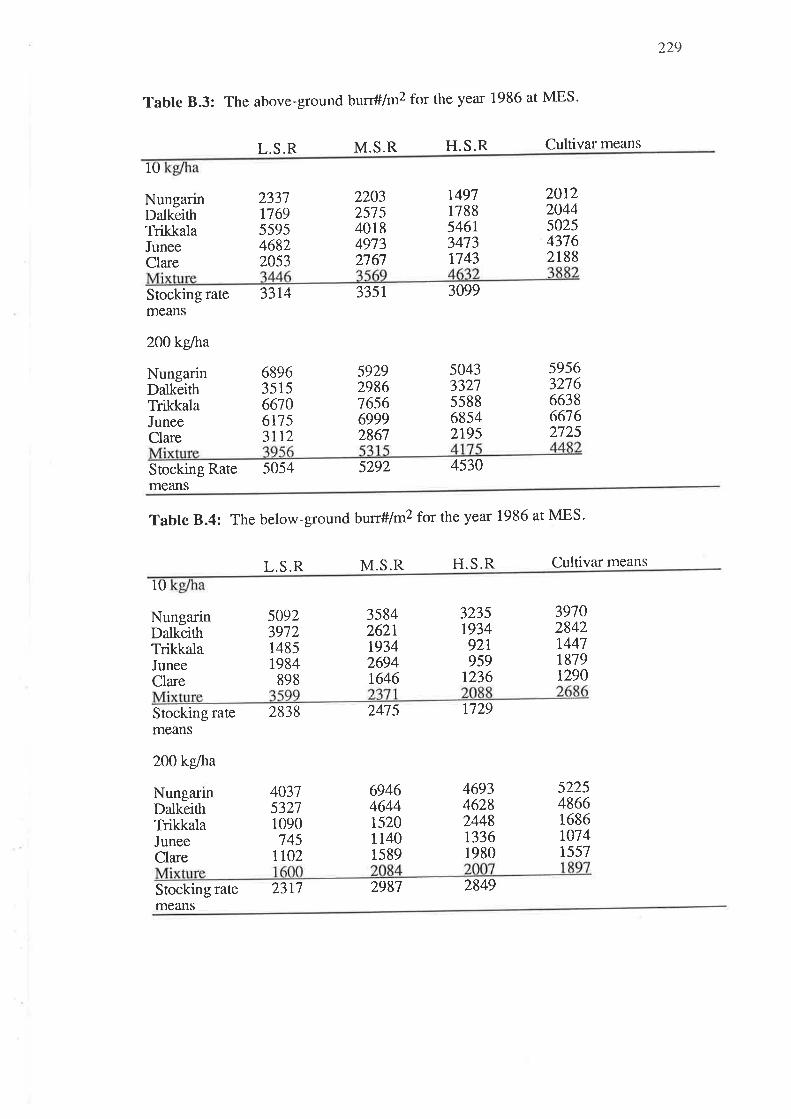
229
Table 8.3: The above-ground burr#/m2 for the year 1986 at MES.
L.S.R M.S.R H. S.R Cultivar means
10
NungarinDalkeithTrikkalaJuneeClare
Stocking ratemeans
2O0kglha
NungarinDalkeittrTrikkalaJuneeClare
2337r769559546822053
22032515401849132167
59292986165669992861
5292
r4971788546r3473t743
504333275s8868542r95
20122044502543762188
59s63276663866762125
33r4
689635 15
6670617 53l12
3351 3099
Stocking Rate 5054 4530means
Table 8.4: The below-ground burr#/m2 for the year 1986 at MES.
L.S.R M.S.R H.S.R Cultivar means
l0
NungarinDalkeithTrikkalaJuneeClare
Stocking ratemeans
200 kg/ha
NungarinDalkeithTrikkalaJuneeClare
5092397214851984898
2838
403153211090745
rt02
35842621r93426941,646
3235r934921959
r236
t729
469346282448r3361980
2849
39702842r4471879r290
522548661686r074r557
2475
2987
69464644r52011401589
Stocking rate 2311means
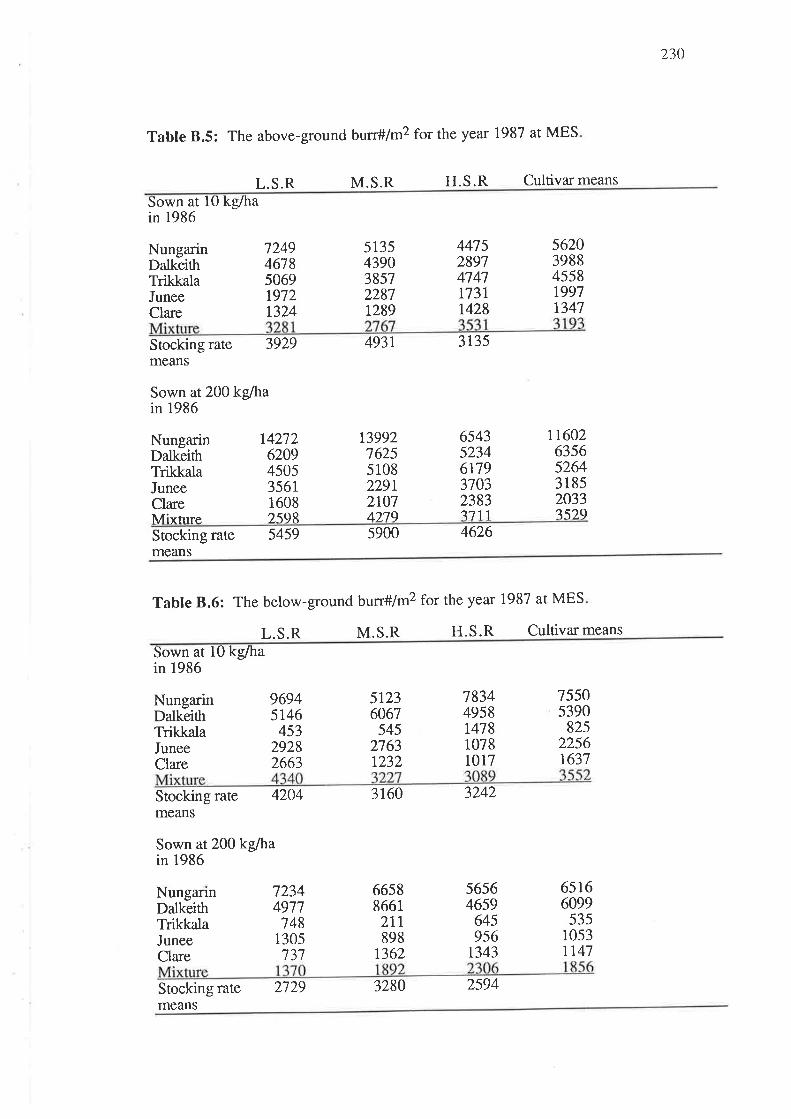
230
Table 8.5: The above-ground burr#/m2 for the year 1987 at MES
L.S.R M.S.R H.S.R Cultivar means
Sown atin 1986
NungarinDalkeithTrikkalaJuneeClare
Stocking ratemeans
Sown at200 kglhain 1986
493r 3r35
10 kg/ha
NungarinDalkeithTrikkalaJuneeClareMixture
t427262094505356116082s98
r399276255 1082291,210742;79
654352346179370323837711
12494678506919721324
3929
5 135439038572287t289
447528974747r73lr428
5620398845581997t341
rr60263s6526431852033?529
Stocking rate 5459 5900 4626means
Table 8.6: The below-ground bun#/m2 for the year 1987 at MES
L.S.R M.S.R H.S.R Cultivar means
Sown atin 1986
NungarinDalkeittrTrikkalaJuneeClare
Stocking ratemeans
Sown at 200 kg/hain 1986
NungarinDalkeitttTrikkalaJuneeClare
3160 3242
10 kg/ha
96945t46
45329282663
5r236067
5452763I23Z
66s886612tl898
1362
78344958t47810781017
15505390
82s2256r637
4204
72344917748
1305731
56564659
645956
1343
65166099
5351053tr47
Stocking rate 2729means
3280 2594

231
Table 8.7: The total burr #/m2 for the 1986 at MESL var mealls
10 kg/ha
NungarinDalkeithTrikkalaJuneeClare
Stocking ratemeans
2OOkglha
7429514l70806666295r
6152
578751965952166744tr
41323122638244322979
4828
97367955803681904r756182
59824866641262553478
11181814283247750428267'Ì9
NungarinDalkeithTrikkalaJuneeClareMixtlrre
1093388427760692042t45s56
5826
1287576309\768 1394456
Stocking rate 737I 8279 7319means
Tabte 8.8: The total burr#/m2 for the year 1987 at MES
L.S.R M. S.R. H. S.R Cultivar means
Sown at 10 kg/hain 1986
NungarinDalkeithTrikkalaJuneeClare
169439824552249003981
8133
2150613186s35348662345
10258r0457
440250502521
123097855622528092445
131709378538342532984
181 1812455
579942383180
Stocking ratemeans
Sown at200 kg/hain 1986
NungarinDalkeithTrikkalaJuneeClare
12r999893682446593126
8091
20650r628653t931893469
6377
Stocking ratemeans
8188 9180 7220
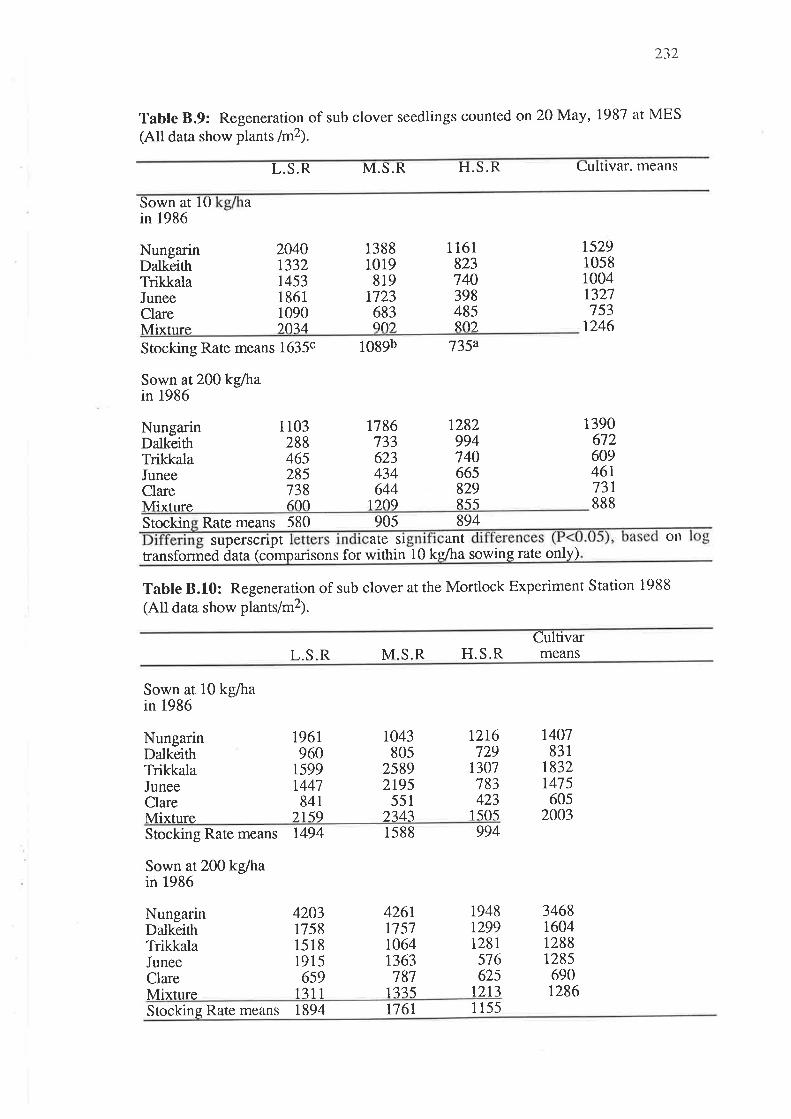
232
Table 8.9: Regeneration of sub clover seedlings counted on 20 May, 1987 at MES
(Alt data show plants /m2).
L.S.R M.S.R H.S.R Culüvar. means
Sown at I0in 1986
a
Stocking Rate means 1635c
Sown at200 kg/hain 1986
1089b 735a
NungarinDalkeittrTrikkalaJuneeClareMixture.
20401332r45318611090)o74
13881019819
1723683qo?
1161823740398485RO?.
152910581004t32t753
r246
139061260946r737888
NungarinDalkeithTrikkalaJuneeClareMixture
1 103288465285738600
r786133623434644
1 ?Og
1282994740665829Rs5
Stockin Rate means 580 905 894superscnpt ate sl ant
transformed data (comparisons for within 10 ke/ha sowing rate only)
Table 8.10: Regeneration of sub clover at the Mortlock Experiment Station 1988
(All data show plants/m2).
L.S.R M.S.R H.S.RCultivarmeans
on
Sown at 10 kg/hain 1986
NungarinDalkeithTrikkalaJuneeClareMixture
196r960
r599t447841
2159
r04380s
25892r95
5512343
tzr6729
1307783423
1505
1407831
t832t475605
2003
3468r60412881285690r286
Stocking Rate means 1494
Sown at200 kg/hain 1986
NungarinDalkeithTrikkalaJuneeClareMixture
4203175815181915
6591311
1588
4261175110641363787
133.5
994
19481299t28l
516625
1213
Stocking Rate means 1894 176l 115-5
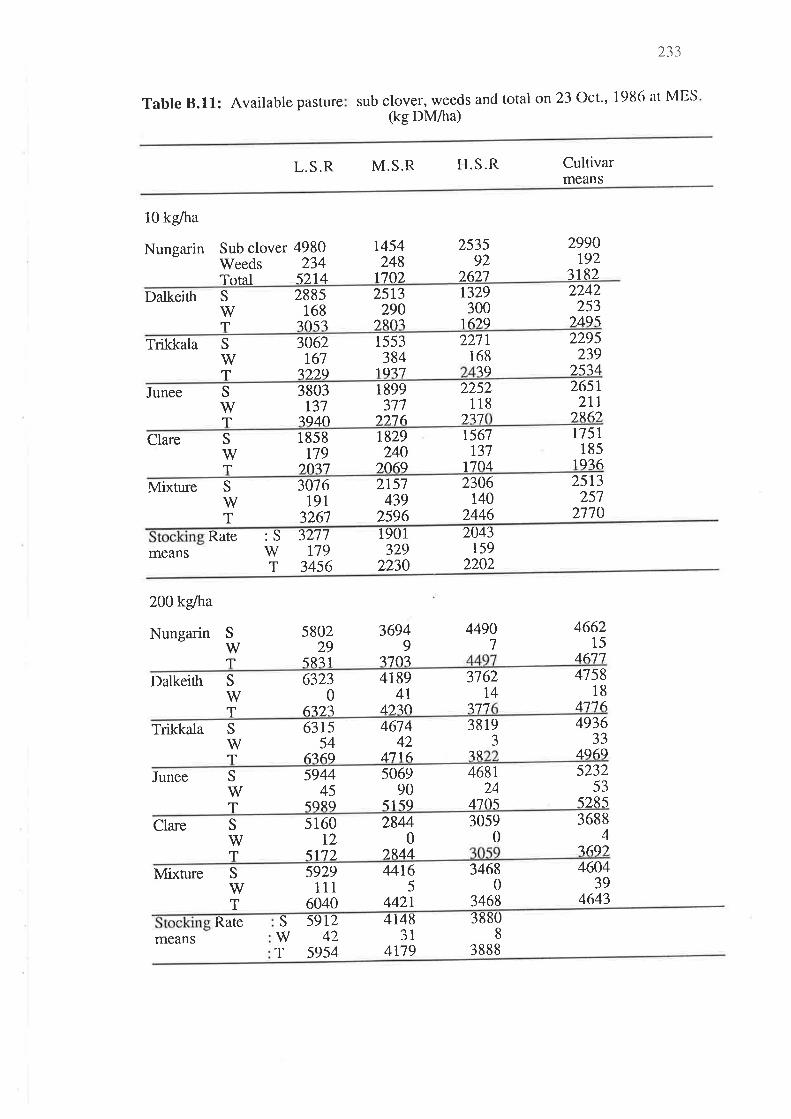
Table 8.11: Available Pasture
233
sub clover, weeds and total on 23 Oct', 19[ì6 at MES(kg DM/ha)
L.S.R M.S.R H.S.R Cultivarmeans
10 kg/ha
Nungarin Sub clover 4980Weeds 234
t454248
1702
253592
2627
2990192
3182Total 52t4Dalkeith 2885
168?o5?
25t3290
?ROî
1329300
2242253
).495
S
wT 6)q1
Trikkala 3062r6l
7)).9
1553384
1977
2271168
2295239
2s14
S
wT 3q
Junee 3803r31
?940
1899377
).).76
2252118
265r2ll
)?,6)
S
wT )77
Clare S
\MT
1858t79
)o?''1
r829240
)0,69
r567r3770,4
1751185
1 qi61
Mixnre 3076191
3261
2t51439
2596
2306140
2446
2s13251
2770
S
wT
means: S 3277w r19T 3456
Rate 1901329
2230
2043159
2202
200kglha
Nungarin 580229
sR31
36949
?70?
44907
466215
L6't'7
SwT
Dalkeittr 63230
672?
4t894T
4)30
3762l4
475818
47',76
S
wT 777
Trikkala 63r554
6?6q
467442
47't6
38 19J
4936JJ
ijq6q
SwT ?R
Junee S
wT
594445
sq89
506990
51 59
468124
4705
523253
s285
Clare 5160t2
5"t72
28440
).R44
30590
S
wT
36884
?69)
Mixture 592;9111
6040
44t65
4421
34680
3468
460439
4643
S
wT
meansRate s 5912
w42T 5954
414831
4r19
38808
3888
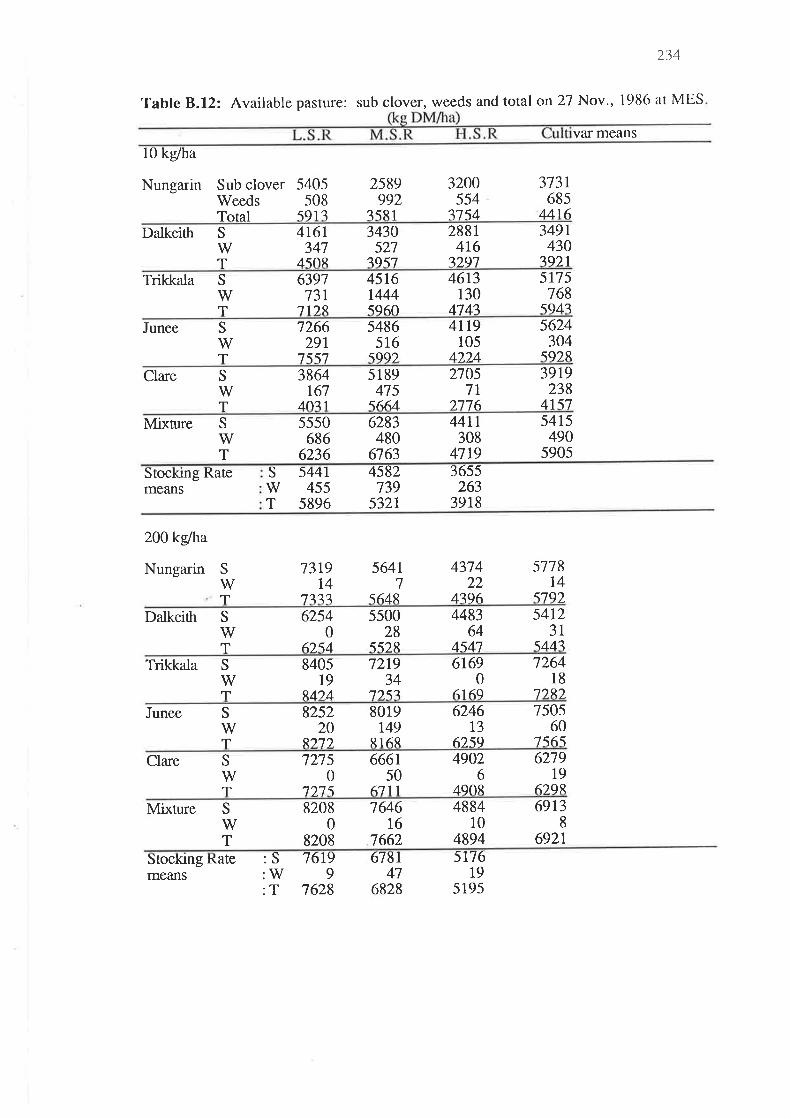
234
Table B.L2z Available pasture: sub clover, weeds and total on 27 Nov., 19lì6 at MES
var means
10 kg/ha
Nungarin Sub clover 5405Weeds 508
2589992
isRl
3200554
?754
373168s
4416Total sq13Dalkeith 4t61
3474soR
3430527
7957
28814t6
3297
3491430
7921
S
wT
Trikkala 639773r
7',t)g,
45r6t444sq60
46t3130
474?
5175768
594i
S
V/T
Junee S
wT
7266291
7557
5486516
sqq?
4t19105
4)2,4
5624304
sq?R
Clare S
wT
3864r67
40?'l
5189415
5664
21057t
2776
39t9238
41s7
Mixture 5550686
6236
6283480
6763
44tl308
47t9
5415490
590s
S
V/T
Stockrng Ratemeans
s 5441w 455T 5896
4582739
5321
3655263
3918
200kglha
Nungarin S
wT
73r9t4
7777
5641l
564R
437422
4?96
5778t4
579).
Dalkeittr 62540
6)54
550028
552R
448364
4547
54123l
5447
S
V/T
Trikkala 8405t9
R4?,4
72r934
1)\7
6t690
6169
7264l8
'7)R)
SwT
Junee S
V/T
825220
R)7).
8019t49
R1 68
6246L3
62s9
750s60
7s65Clare S
wT
72750
'D.7s
666150
6711
49026
4qo8
621919
6)qR
Mixture 82080
8208
764616
7662
488410
4894
6913I
6921
S
wT
Stocking Ratemeans
: S 1619:'W 9:T 7628
678 l47
6828
5t1619
5195
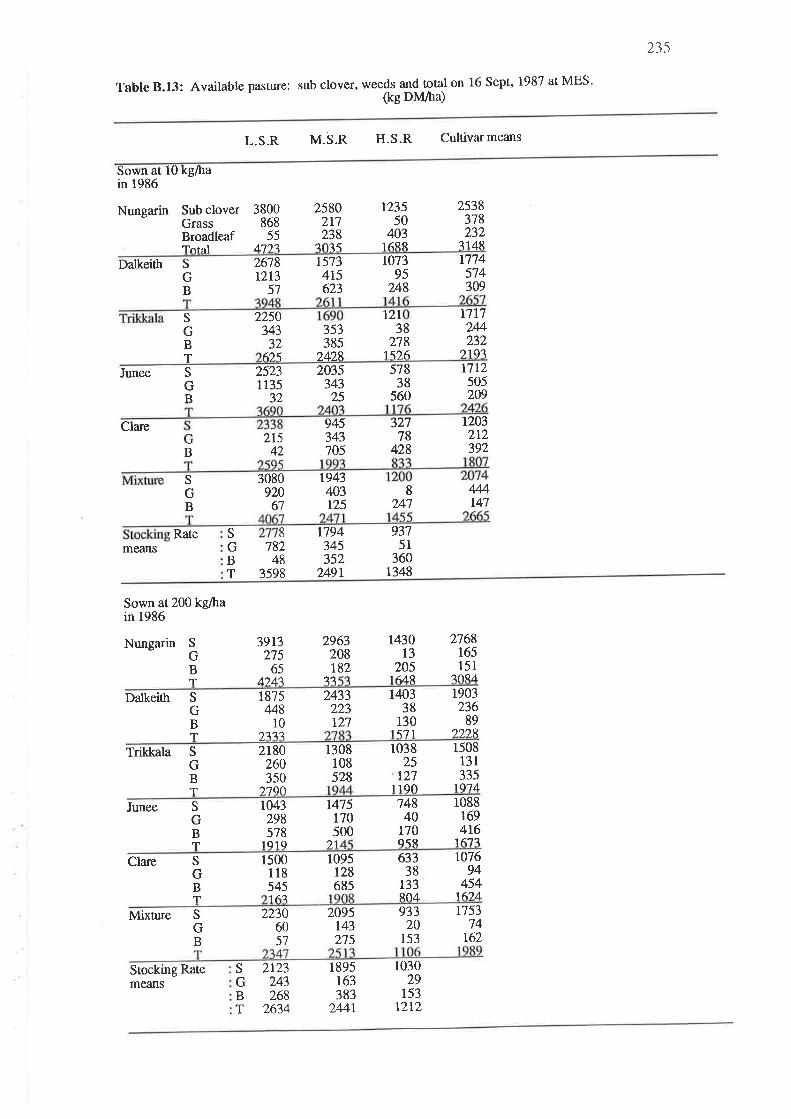
235
Table 8.13: Available pasture: sub clover, weeds and total on 16 Sept, 1987 at MES
ßg Dlvl/ha)
L.S.R M.S.R H.S.R Cultiva¡means
Sown atin 1986
l0 kg/ha
Nungarin Sub cloverGrassBroadleafTntnl
3800868
55n)?
2580211238
?035
r23550
4031688
2538378232
i148Dalkeitlr 2678
t2r351
2250343
32
1573415623
r774574309
107395
248
sGB
353385
S
GBT
rzt38
21815?,6
17l'l2M232
).19i6)5 2428Junee
Clare
means
25231r35
32
2t542
3080920
67
2035343
25
57838
560
1712505209
S
GB
GB
S
GB
945343705
t2032rz392
32778
428
8A7
444t47
1 943N3r25
Rate r794345352
249r
93751
3601348
SGBT
8
18248
3598
Sown at 200kglhain 1986
Nungarin SGBT
2963208r82
1903236
89)))9,
SGBT
3913275
654)/l;\
143013
205164R
2168165151
?oR4jj
Dalkeith 1875448
10laa?
2433223r21
ua338
r301{71
Trikkala 2180260350
)'too.
r308108528
103825
r271 lqo
1508131335
10'tL
S
GBT
Junee 1043298578
10r q
r475r70500
74840
r70q5R
10881694t6
16'1?
SGBT ).1
Clare 1500118545
1095r28685
63338
133Rñ4
r07694
4541Ã)4
SGBT rÁ?
Mixture
Stocking Ratemeans
s zr23G 243B 268T 2634
SGB
22306057
2095r43275
93320
153
n5374
162
103029
153t2r2
1895t63383
244r

236
Table 8.14: Pasrure availability data (kg DM/ha) derived from Electronic Pastttre
Probe readings on the last harvest occasion on 25 Nov., 1987 at MES.
L.S.R M.S.R H. S.R Cultivar means
Sown at 10in 1986
NungarinDalkeithTrikkalaJuneeClare
4695525654295219602r
4381460640r4574r479045ROl
a
4t343804384644075298
37784554404042133988
4187390942764459438 I3q61
42024538443846tr51044
Stocking Rate means 4355
Sown at200 kg/hain 1986
5314 4r7l
NungarinDalkeithTrikkalaJuneeClareMixtrre
367338724r34450150364754
40824r294140470047374).97
Stocking Rate means 4260 4s85 4r97
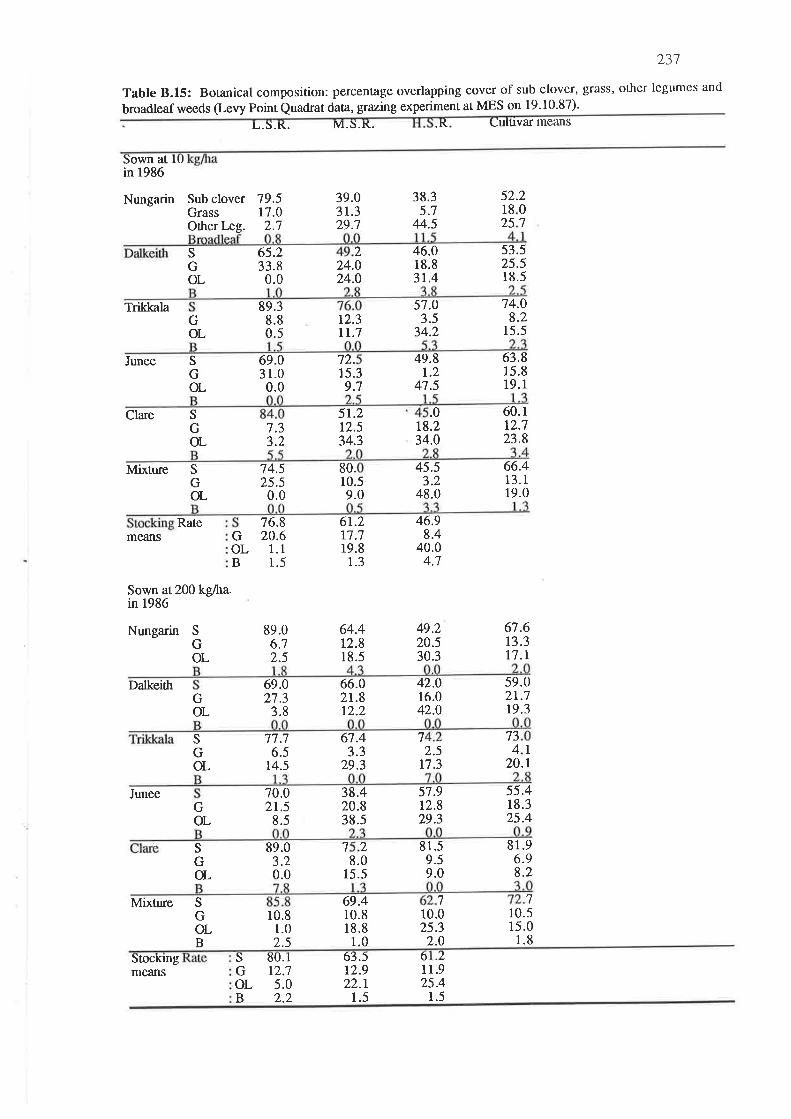
Table 8.15 : Boranical composition: percentage overlapping
broadleaf weeds (Levy Point Quadrat data, grazing experiment
231
cover of sub clover, grass, other lcgumes and
atMES on 19.10.87).
L.J.K. M.S.t(. .K uuluvar means
Sown at lUin 1986
Nungarin
Trikkala
Junee
Clare
Mixture
means
Sown at 200kglhæin 1986
Dalkeith
Junee
Mixture
Sub clover 19.5Grass 17.0Other læg. 2.7
39.031.329.7
24.024.0
9.7
5r.212.534.3
80.10.59.0
64.412.818.5
66.02t.812.2
67.43.3
29.3
38.420.838.5
38.35.7
44.5
46.018.831.4
57.O3.5
34.2
49.81.2
41.5
.0
14.08.2
15.5
53.525.518.5
63.815.819.1
52.207
7.33.2
SGOL
GOL
S
GOL
SGOL
SGOL
65.233.80.0
)
1825
67.613.317.r
1
1
734
20.
81.96.98.2
2
89.38.80.5
12.3tr.7
69.031.00.0
72.r5.3
Rate
74.525.50.0
1.8.234.0
45.53.2
48.0
46.98.4
40.04.7
60.112.723.8
66.413.119.0
6r.211;719.8
1.3
GOLB
76.820.6
1.11.5
69.027.3
3.8
49.220.530.3
S
GOL
GOL
SGOL
GOL
SGOL
SGOL
Nungarin 89.06.72.5
42.016.042.0
7
s9.02r.719.3
77 .76.5
t4.5
70.02r.5
8.5
89.03.20.0
2.517.3
51.912.829.3
81.59.59.0
55.418.325.4
7
78.0
15.5
69.410.818.8
1.0
't
10.81.02.5
10.025.32.0
means
B
1 r.925.4
1.5
r0.515.0
1.8
Stockmg S ðU.TG 12.7oL 5.0B 2.2
63.s12.922.r
1.5
ó .2
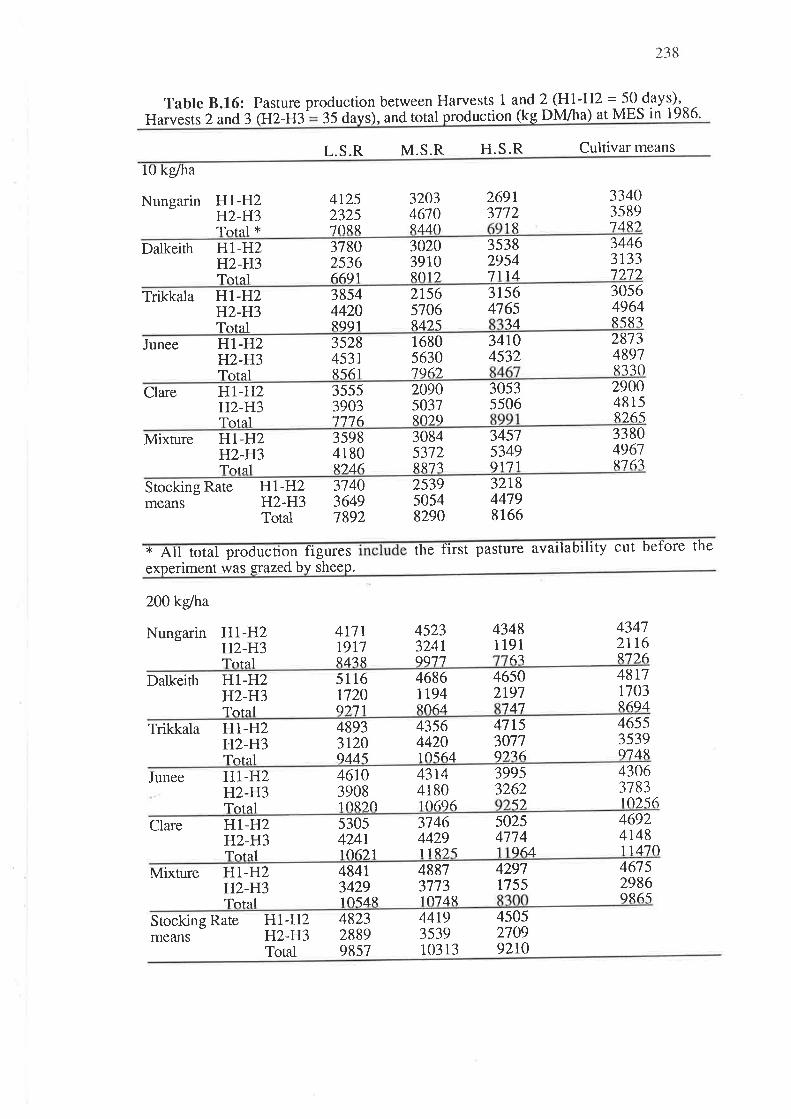
238
Table 8.16: Pasture production between Harvests 1 and 2 (HL -IJ^Z = 50 days),
Harvests 2 and3 (H2-H3 35 days), and total production (kg DM/h a) at MES in 1986.
L.S.R M.S.R H.S.R Cultivar means
lU kg/ha
Nungarin H1-H2Il2-}{3Totnl x
4t252325TORR
320346709,440.
26913172
1R
33403s89'7 4R)
Dalkeith H1-H2IJz-I]3Total
378025366691
30203910ßo't?.
35382954
34463r337?.727 114
Trikkala Hl-H2H.2-}]3Total
385444208991
21565106R425
31564765
30564964R58314
Junee H1-H2Il2-}]3Total
3528453rR561
16805630'796).
34r04532
28734891Ri30
Clare H1-H2IJz-If3Total
35553903777 6l
20905037RO2g
30535506
2900481-5R2,65
Mixture Ifl-H2Il2-} 3Tofal
35984180R)46
30845372RR7?
34575349
33804961R767I 1'11
Stocking Rate Hl-Ilzmeans H.2-Il3
Total
374036497892
253950548290
32r844798166
x All total produc tlon figures the first pasture availa bility cnt before the
experiment was crazeÀ bv sheep.
200 kg/ha
Nungarin 477r19r7R/.?R
I{I-H.2IJ2-Ij3Tntnl
4523324rqQ7',?
43481191
6a
43412116R7)6
Dalkeith }lL-IfzIJz-H.3Tntal
5116r720q)7 1
4686rt94ROÁ4
46502191
48tl1103R694147
Trikkala H1-H2}l2-If3Totnl
48933tz0q445
4356442010564
47t53071
46553539q'74RI )76
Junee Hl-Il2IJz-}{3Tofal
461039081 0R20
43r441801 0696
39953262
43063783102565).
Clare HI-H.2}{2-H.3Tofal
5305424r10,6)1
3746442911R?5
50254774
4692414811470I q64
Mixture H1-H2Ifz-}l3Tntel
484134291 054R
488'l37731o.'749,
42971755
46752986qR65
Stocking Rate }]T-r]^ZIfz-I]^3Total
482328899857
4419353910313
450521099Zr0
means
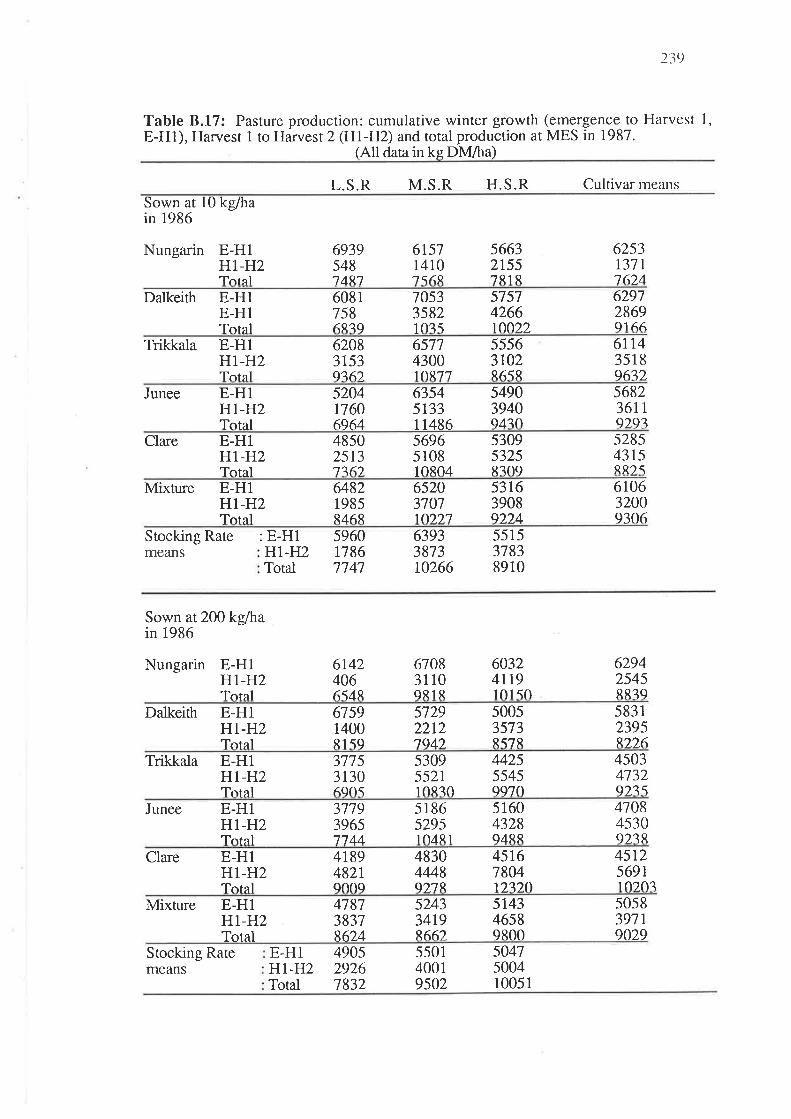
2:39
Table 8.17: Pasture production: cumulative winter growth (emergence to Harvest l,E-Hl), Harvest 1 to Harvestz (}ìl-H^z) and total production at MES in 19tì7.
(All data in ke DM/ha)
L.S.R M.S.R H.S.R Cultivar n-ìeans
Sown at l0 kg/hain 1986
Nungarin E-H1H1-H2Totnl
693954874R7
61571410'7569,
s66321557R1 R
6253137 1
76).4Dalkeith E-H1
E-H1Total
60817586R?q
70533582
5757426610022
62972869a1661 035
Trikkala E-HlH1-H2Totnl
62083r539?6).
657143001o.R'71
55563r02R65R
6rt4351896??.
Junee E-H1H1-H2Total
520417606964
63545 1331 1486
549039409470
568236rt9293
Clare E-H1}l7-}]2Total
485025137?6)
56965108
oR04
s30953258309
528543t5RR? 51
Mixture E-H1H1-H2Total
648219858468
652037071o.?,7
531639089D.4
61063200q306
Stocking RateInEAIìS
: E-Hl'Ilt-Ilz:Total
s96017867747
6393387310266
551531838910
Sown at200 kg/hain 1986
Nungarin E-H1rlt-IfzTotal
6r424066s4R
67083110qRlR
60324r19101 50
62942545R8?g
Dalkeith E-H1}lI-}l2Total
67591400ß1 59
572922t27gL)
500s3573R57R
58312395n),6
Trikkala E-Hl}lI-}f2Total
37153130Áqos
530955211 0R?O
442555459970
45034132q??5
Junee E-H1H1-H2Total
311939657744
51865295104R1
51604328q4RR
41084s30g23R
Clare E-H1}fT-}l2Total
4189482rqooq
48304448q)7R
45r678041).7).O
45t256911 0?n?
Mixture E-H1rf7-}f2Total
478738378624
52433419R662
514346589800
50s839719029
Stocking Rate E-H1H1-H2Total
490s29261832
550140019502
5041500410051
means

240
Table 8.1{t: Seed yield (kglha): Above-ground (AG), Below-ground (BG) arrd -l'otal
seed for the 1986 at MEStlvar
means Vo seed buried
10 kg/ha
Nungarin AGBGT
25510351?,91
24r721961
t63690
54
220815
1 0i5
78.7
Dalkeith AGBGT
306831
1142
445523967
30939r
35358493',7
62.3
Trikkala AGBGT
r014543
1 565
171506
r277
1048284
1332
964444
1 i91
3r.9
Junee AGBGT
635334969
675437
111).
47r584
594451
1 045
43.2
1 5
Clare 436324760
587500
1 ORR
370375'745
464400R64
46.3AGBGT
Mixture AGBGT
603951
1 553
624629
1),5?
810532
679704
1 i84
50.9
1
Stocking Ratemeans
:AG 551:BG 671:T I2l3
557553
1110
528476
1005
200kglha
Nungarin
Dalkeith AGBGT
AGBGT
851730
1 581
73211181 R4q
622775
1397
735874
1 609
54.3
68.6
25.t
12.3
41.7
40.0
601t3821 9R4
511rt461 656
5691 1501720
561r22617R7
Trikkala t32l308
1 63s
1191389
1ql)
lt12632
1744
I2l0443
1764
AGBGT
Junee AGBGT
991106
1 103
1 130176
1?O7
I 107112
1279
1078151
1),2,9
Clare AGBGT
67521595.l
622456
1 07R
416537
1014
591423
1014
Mixture 664855
1 519
892364
1).5'7
70r350
1053
752523
1276
AGBGT
Stocking Rate :AG:BG:T
853609
1462
846608
1510
765603
1368means
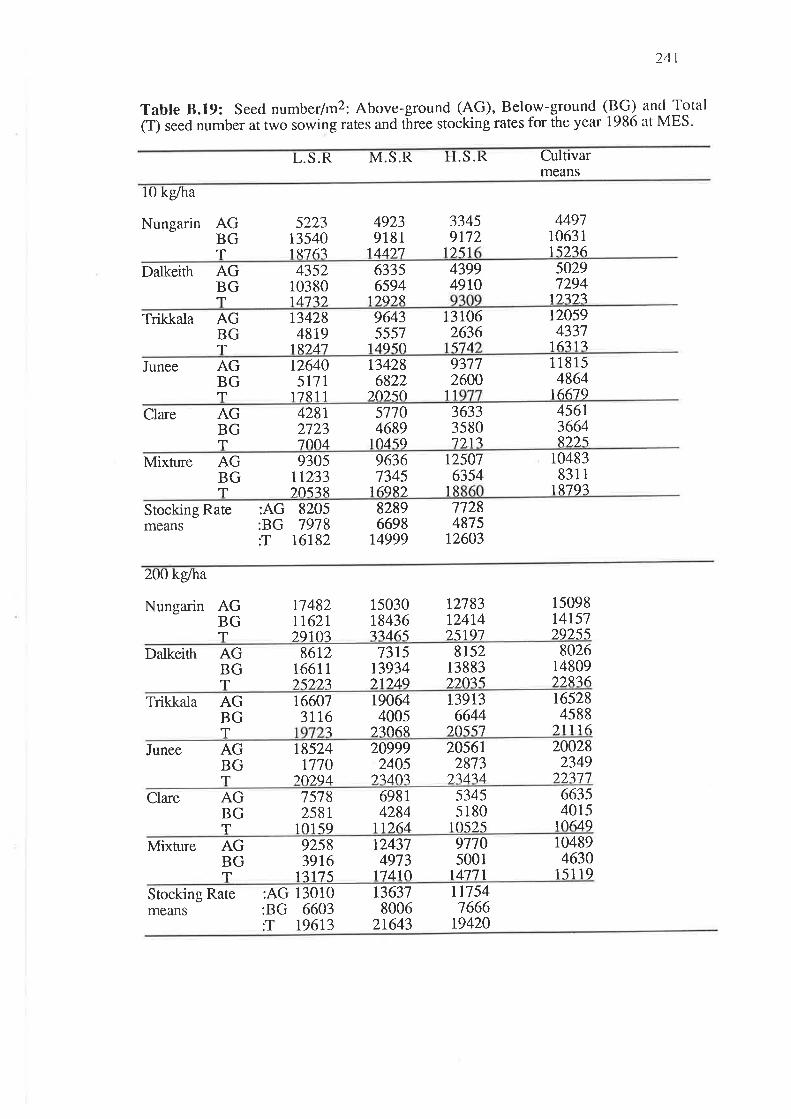
241
Table 8.19: Seed number/m2: Above-grou(T) seed nnmber at two sowing rates and three
ground (BG) ancl Totalthe year 1986 at MES.
nd (AG), Below-stocking rates for
L.S.R M.S.R H.S.R Cultivarmeans
10 kg/ha
Nungarin AGBGT
5223135401R767
49239181
144)7
33459172
44971063 I19361),51
Dalkeith AGBGT
4352103801477).
63356594
1)9)9,
439949r0
50291294
07).?Trikkala AG
BGT
134284819
1R)4',7
96435557
1 ¿q50
131062636
r20594331
16?13't5'74
Junee AGBGT
126405l7l
r7R11
134286822
)o).so
93772600
I 18154864
1667911
Clare AGBGT
428r2723'7004
57704689
1 04sq
36333580
456r3664RD.5'7).1 ?
Mixtüe 9305rt23320538
96367345
16qR).
r25076354
10483831 1
1R793
AGBGT 18
Stocking Ratemoans
:AG 8205:BG 7978:T 16182
82896698
t4999
77284875
12603
200 kg/ha
Nungarin 17482TI62I79103
15030184367?465
rzt831241425197
15098r415729255
AGBGT
Dalkeith 861216611).92.7
737513934)1)49
815213883).?.o75
802614809)).9?6
AGBGT
Trikkala r66073r1.6
t90644005
2io6R
r39136644
)o55'l
r65284s88
)1116
AGBGT
Junee 18524r770
)o).94
209992405
)740.?
205612873
).t474
200282349
)??1',7
AGBGT
Clare AGBGT
75782581
rol59
69814284
't 1)64
53455180
r 0s25
663s4015
10649
Mixture 92583916
1i17 5
124374973
1'1410
97105001
14771
104894630
15119
AGBGT
Stocking Rate :AG 13010:BG 6603:T 19613
136378006
21643
rn541666
t9420means
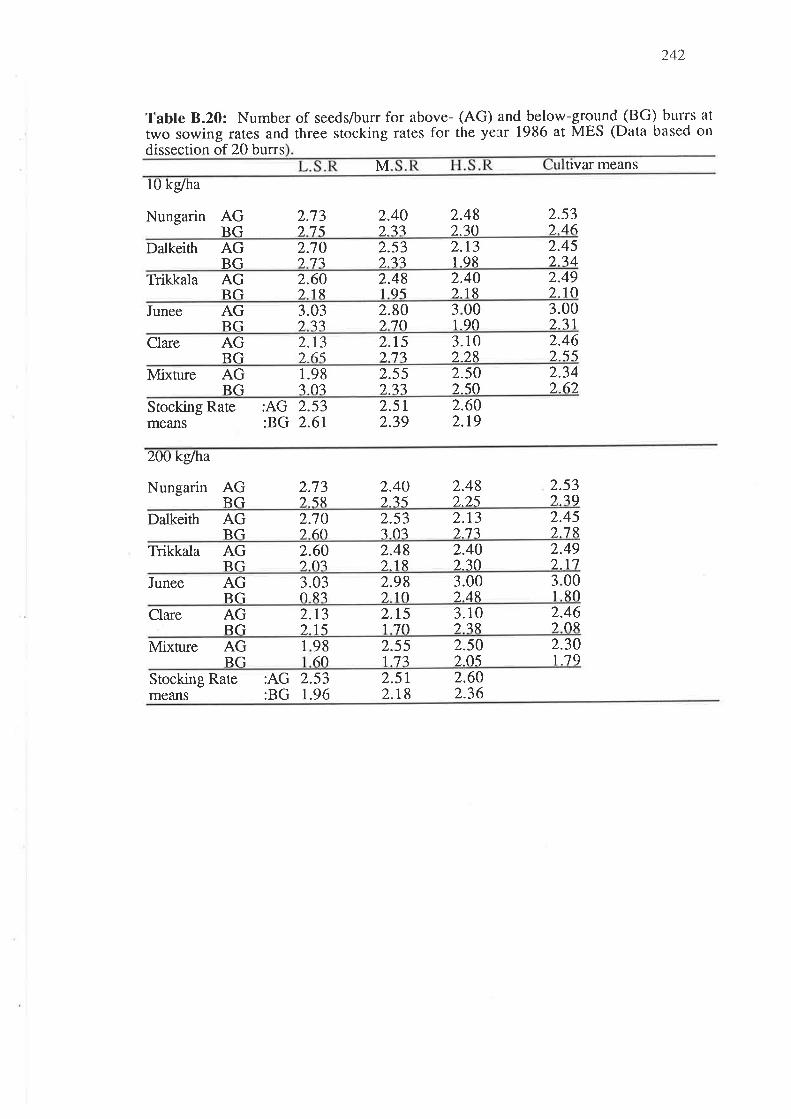
242
Table 8.20l. Number of seeds/burr for above- (AG) and below-ground (BG) bttrrs at
two sowing rates and three stocking rates for the yerr 1986 at MES (Data based on
dissection of 20 bunsM tlvar means
10 kg/ha
Nungarin AGBG
2.13).7 5
2.40?.77
2.482.30
2.53246
Dalkeith 2.70).77
2.532.?3
2.t31.98
2.452.34
AGBGAGRG
Trikkala 2.60)1R
2.48195
2.402,18
2.49).10
Junee AGRG
3.03)?7
2.80?.'to
J 001.90
3.002?1
Clare AG 2.r3)65
2.r527?
3.10228
2.46255BG
Mixture AGBG
1.98?03
2.55?.17
2.502.50
2.34262
Stocking Ratemeans
:AG 2.53:BG 2.61
2.512.39
2.602.r9
200 kglha
Nungarin AGBG
2.73?5R
2.40?.?5
2.482,25
2.53). ?9
Dalkeith 2.70)60
2.53?03
2.r3277
2.45).7 g
AGRG
Trikkala AGRG
2.60)o?
2.48).1R
2.402.30
2.49217
Junee AGBG
3.03oR3
2.98?.10
3.002.48
0080
)1
Clare AGR(ì
2.r3).15
2.r517o-
3.10)?R
2.46?OR
Mixture AG 1 9860
2.55177
2.502.O5
2.30179RG
Stocking Rate :AG 2.53:BG 1.96means
2.5r2.r8
2.602.36
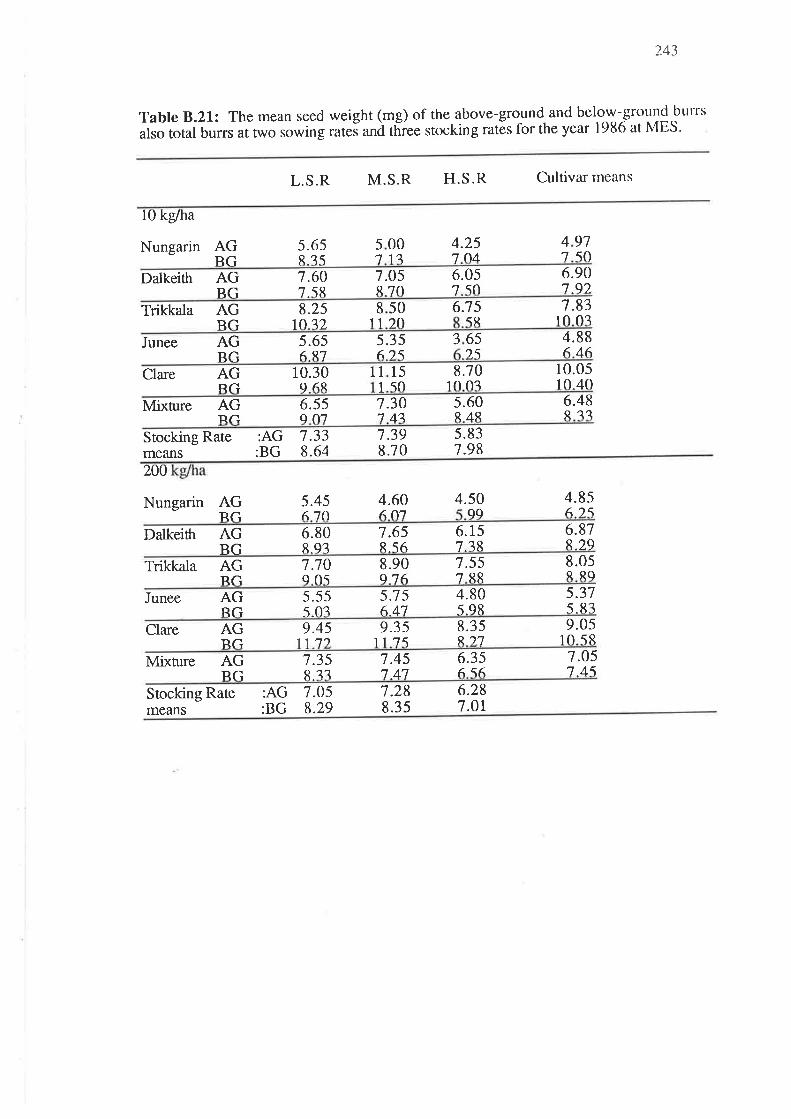
243
Table B.2lz The mean seed weight (mg) of the above-grortnd and below-grotrnd bt¡rrs
also total burrs ar twò so*ing rut"í unà tñiee stocking ratés for the year l9tl6 at MES'
L.S.R M.S.R H.S.R Cultivar means
l0 kg/ha
Nungarin AGRG
5.65R3s
001?
57
4.25 47
97507 o4
Dalkeith AGRG
1.6075R
7.05R70
6.05 6.907 9?,7 50
Trikkala AGRG
8.25o 7).
6.7 550)o
81
7.8310 03
1 1 5R
Junee AGRG
5.656 8'l
5.356)5
3 65 4.88646)5
Clare AGRlì
10.30 1
q 6R1550
1
1
8.7010 0?
10.0510 40
Mixture 6.5s 7.3014?
5.60R4R
6.48R??
AGIIl-l q n1
Stocking Rate :AG 7.33:BG 8.64
7.398.70
5.837.98meafis
20tJ
Nungarin AGRG
5.45670,
4.606.o.7
4.50qq
4.856)5
Dalkeittr AG 6.808.93
7.65R56
6.15 6.87829BG 7 38
Trikkala AG 1.70q05
8.90q167.55 8.05
RG 7 RR RRg
Junee AG 5.55 5.t 56.47
4.80598
5.37.s.83RG 5.o3
Clare AGRlì
9.45 9.3s1175
8.3sR)7
9.0510 5Rl1 't)
Mixture AG 7.3s 7.45747
6.3s656
7.O5745Rlì R -^
Stocking Rate :AG:BG
7.058.29
7.288.35
6.287.01means
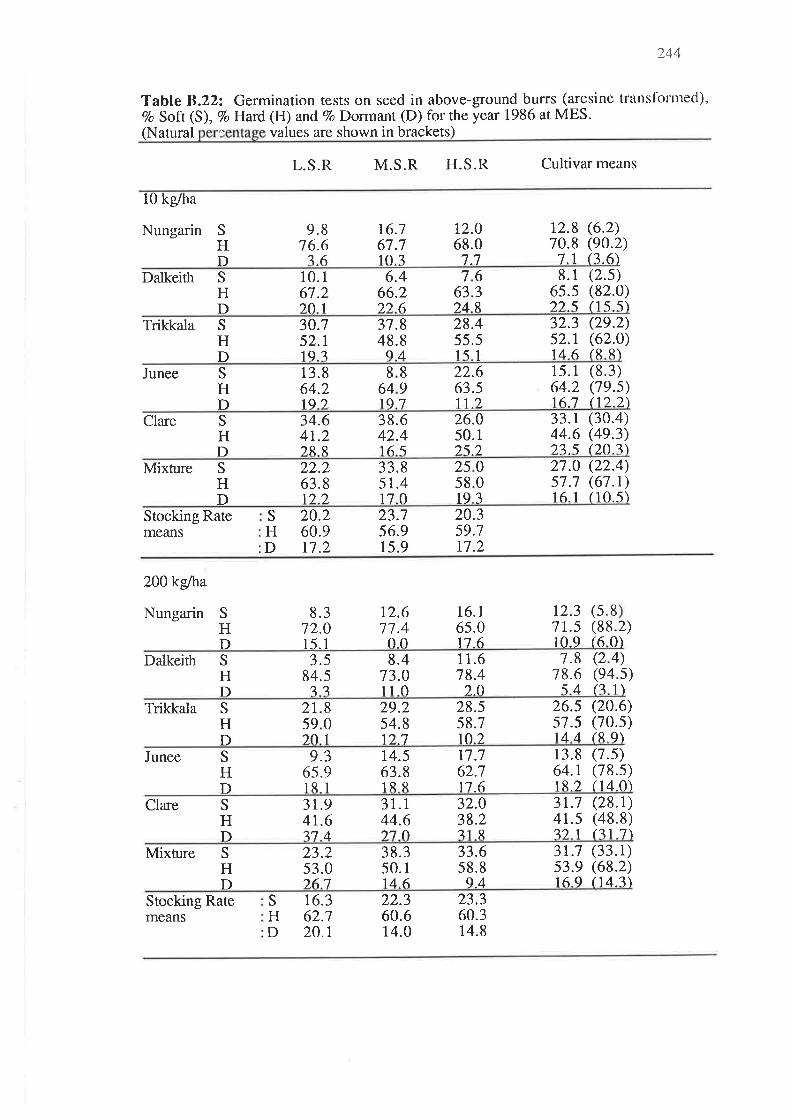
244
Table 8.222 Germination tests on seed in above-ground burrs (arcsine trarlsfblrnecl),7o Soft (S), Vo Hard (H) and Vo Dormant (D) for the year 1986 at MES.(Natural values are shown in brackets )
L.S.R M.S.R H.S.R Cultivar means
10 kg/ha
Nungarin SHD
9.876.676
t6.767.7103
12.068.0
7.7
r2.8 (6.2)70.8 (90.2)7.1 13.6)
Dalkeith 763),4
S
H.|-)
10.167.2)o1
6.466.2))6
63R
8.1 (2.s)6s.5 (82.0))2.5 tl s 5)
Trikkala SHD
30.752.r1q 3
37.848.8q4
28.455.515
32.3 (2e.2)sz.t (62.0)1¿ 6 tR R\I
Junee 89'7
8641q
SHD
13.864.21q)
22.663.5't1 2
15.1 (8.3)64.2 (79.s)167 (1?.2\
Clare S
HD
34.64t.2?RR
38.642.416 5
26.050.1252
33.1 (30.4)44.6 (49.3)?.7 5 (20 ?\
)4
10.5)
21.0 (s7.7 (16.1 (
22.00a-)
2558t9
S
HD
Mixture 22.263.8122
33.851.4170
67.t)
Stocking Ratemeans
23.756.915.9
S
HD
20.260.9r7.2
20.359.7t7.2
200kglha
Nungarin
17.6
S
HD
8.372.015.1
12.677.4o0
16.165.0
12.37 r.510.9
88.2)8
0)
5
6
(((
Dalkeith 3.584.5
a^
8.473.O110
11.618.420
(e4(2
(?
7.878.654
SHD
)s)
4
1\
Trikkala 2T59)o
S
Hl-)
801
29.254.81).7
28.558.710.2
26.s (20.6)57.5 (70.s)144 (89\
Junee SHD
9.365.91R 'l
14.563.8lR ß
17.762.717.6
13.8 (7.s)64.r (78.s)1R 2 t14.0)
Clare SHT)
3r.94r.6?'t 4
31.144.6)70
32.038.231 I
3r.7 (28.1)41.5 (48.8)a) 1 t?l 7)
Mixture 23.253.0)67
38.350.1146
33.658.89.4
S
HD
3r.t (33.1)s3.e (68.2)16I (14.7\
Stocking Rate s 16.3H 62JD 20.t
22.360.614.0
23.360.314.8
means
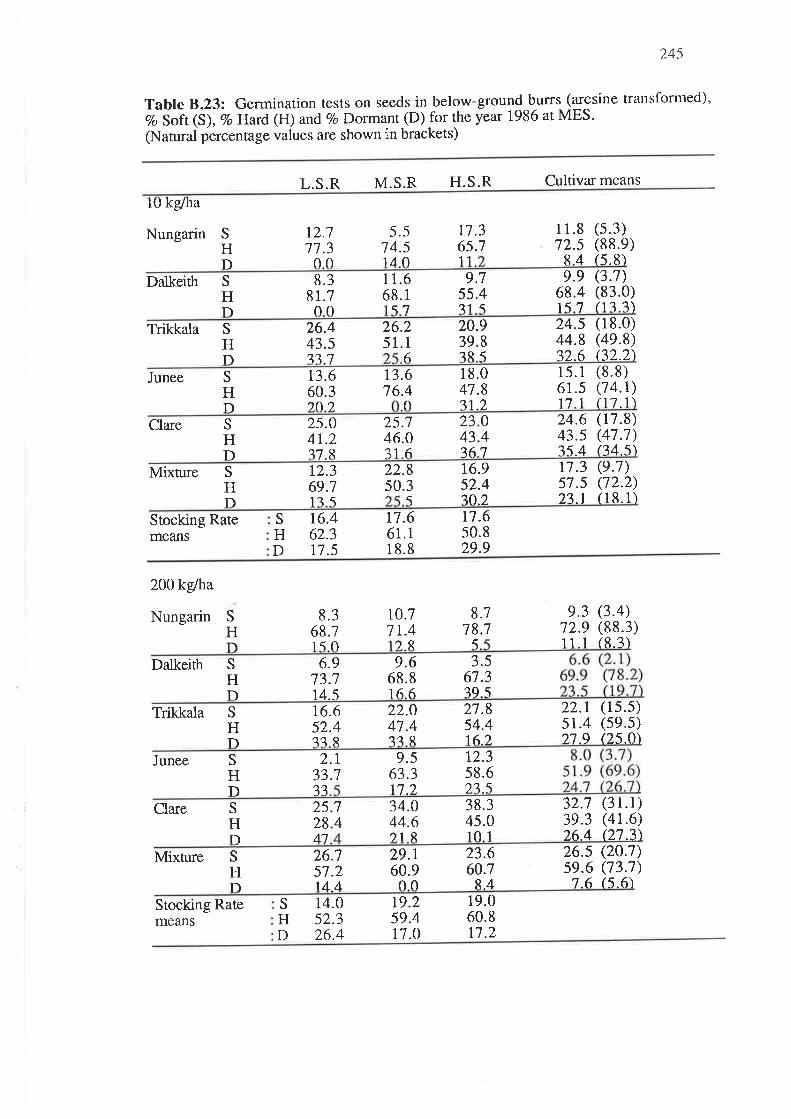
245
Table 8.232 Germination tests on seeds in below-ground burrs (arcsine transfornled),qo sott(s), 7o Hard (H) and.7o Dormant @) for the year 1986 at MES.(Natural percentage values are shown in brackets)
L.S.R M.S.R H.S.R Cultivar means
10 kg/ha
Nungarin SHD
12.177.3oo
5.57 4.5
11.365.7
1 LO l1
I 1.8 (s.3)72.s (88.e)R.4 (5.8)
Dalkeittr S
HT)
8.381.7no
11.668.1
9.755.4?1 5
e.e (3.1)68.4 (83.0)1s 7 113.3)<7
Trikkala S
HT)
26.443.577'7
26.251.1
20.939.8i8.5
24.s (18.0)44.8 (49.8)72.6 (32.2\6
Junee S
HT)
13.660.3)o)
t3.676.4
18.047.811 ).
1s.1 (8.861.s (74.17 1 (1'7 .
)1)1lo
Clare 047
S
HD
25.04t.27'7 g
25.746.0
234336
24.6 (t7.8)43.s (47.7)3s.4 (34.s)a
.1 16Mixture S
HD
12.369.11? 5
22.850.3
16.952.410.2
11.3 (e.7)s1.s (72.2)23.t (18.1)5
Stocking Ratemeans
s 16.4H 62.3D 17.5
t7.661.118.8
17.650.829.9
200 kg/ha
Nungarin 8.778.1
S
HT)
8.368.1150
r0.7I1.4)3, 5
e.3 (3.4)72.9 (88.3)11 1 t8.3)
Dalkeith SHD
6.973.714.5
9.668.816.6
3.561.3i9.-5
Trikkala SHT)
16.652.4??R
22.O47.4
27.854.4162
22.r (1s.s)51.4 (s9.s)27.9 (25.0)
1 ?RJunee 9.5
63.317.2.1 -1
SHD
2.133.7
12.3s8.623.5
Cla¡e SHTI
14
2528
34.044.6)1 R
38.45.10
J01
32.7 (3t.t)39.3 (41.6)26.4 (27.3\47
Mixture SHT)
26.757.2144
29.r60.9oo
23.660.7R4
26.5 (20.7)s9.6 (73.1)7.6 (5.6\
Stocking Rate S
HD
14.052.326.4
19.259.417.0
19.060.817.2
m9ans
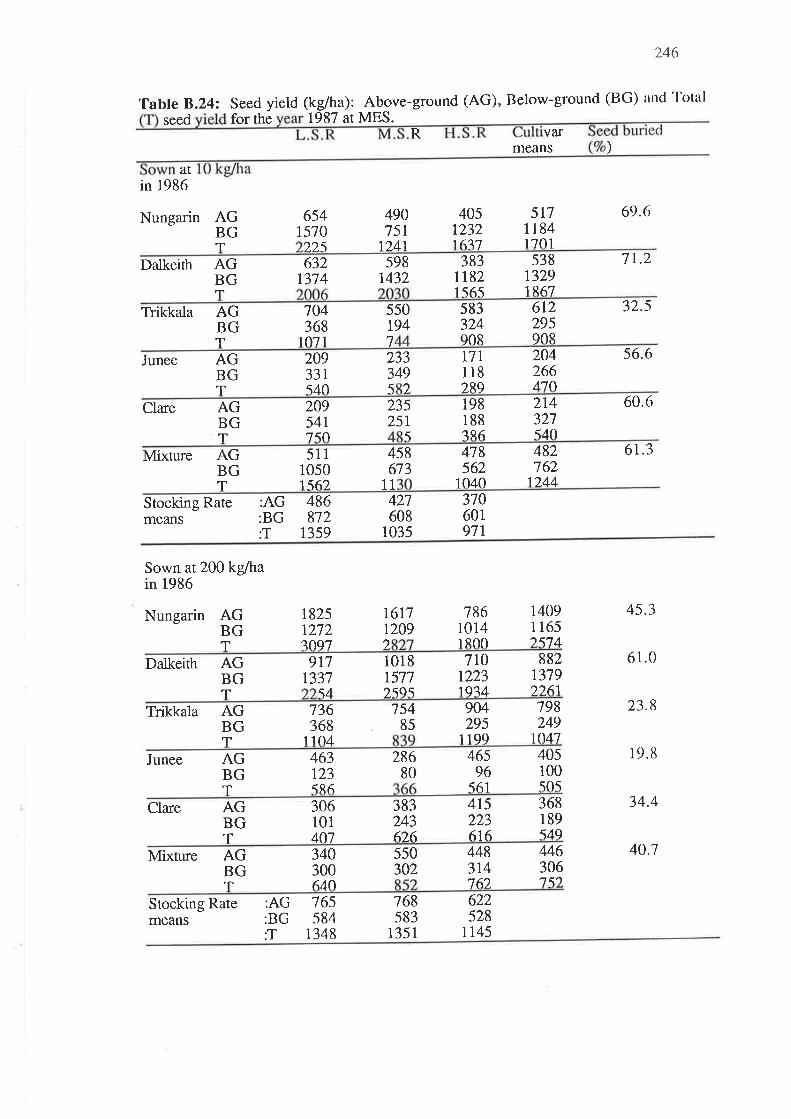
246
Table 8.242 Seed yieldseed for the
atin 1986
ground (AG), Below-ground (BG) and Tot¿tl(kg/ha): Above-1987 at MES.
R var
AGBGT
6541570
490751
40512321677
means
5171 1841701
69.6
)
Nungarin
))5 1241
Dalkeith AGBGT
632t374
5987432
383tr821 56s
53813291R67
7r.2
Trikkala AGBGT
104368
107 1
550 583324908
612295908
32.5t947
2042664'.70
AGBGT
20933rs40
233 t7t118289
s6.6Junee3495 )
Clare AGBGT
2095417sfl
235 198188?R6
214321s40
60.625t
5
Mixture AGBGT
51110501562
458673
478562
1040
482762
1244
6r.3
11
Stocking Ratemeans
:AG 486:BG 872:T 1359
421608
1035
3706019t\
Sown at200 kglhain 1986
Nungarin AGBGT
t825t272?oq7
r6tl1209
78610141 ROO
14091 165)5'74
45.3
61.0
23.8
19.8
34.4
40.1
).
Dalkeith 917t337
1018r577
710t2231974
882r319)).61
AGBGT 54 2s95
Trikkala 736368
1 10'4
AGBGT
75485
904295
r lgg
798249
10'47
Junee 28680
AGBGT
4631235R6
46s96
561
405100s05
CIare 383243626
AGBGT
306101407
4t5223616
368189s49
Mixture 44630675).
AGBG
622528145I
3403006Lî
5s0302
4483r476?.T
Stocking Ratemeans
:AG 765:BG 584:T 1348
168583
135 I
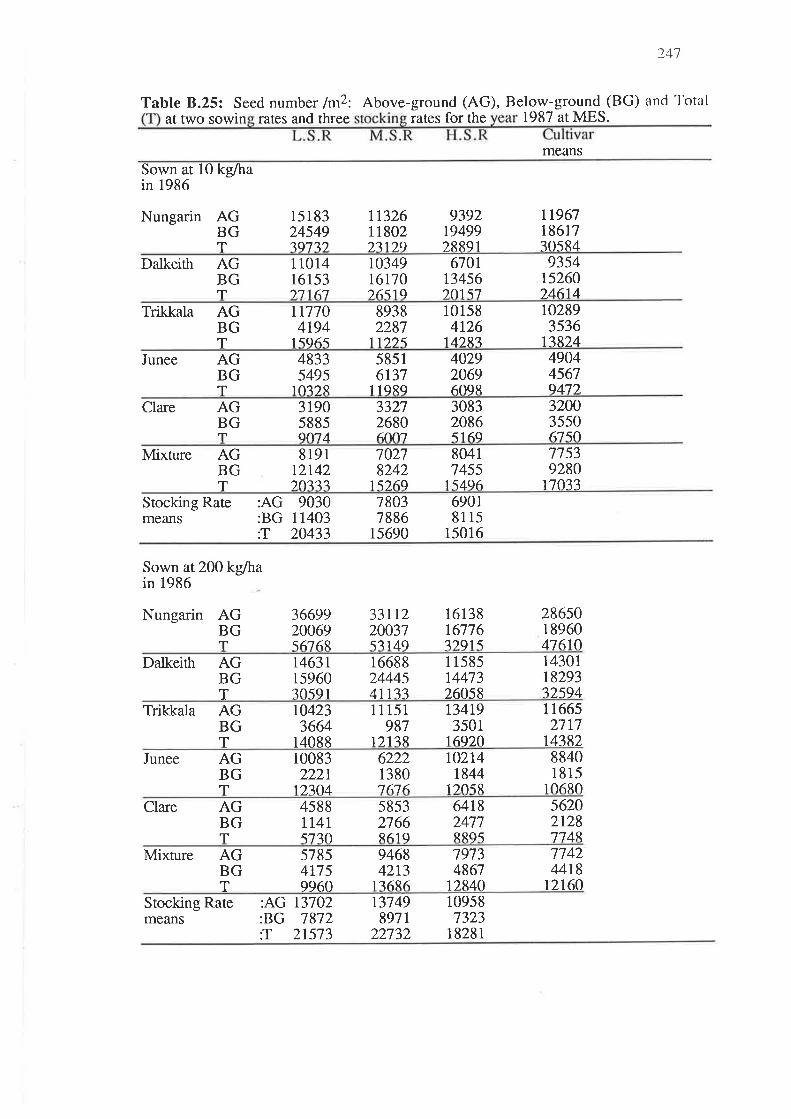
241
Table 8.25: Seed number /m2: Above-ground (AG) , Below-ground (BG) and Totalat two sowin rates and three rates for the 1987 at MES.
means
Sown at 10 kgÀain 1986
Nungarin AGBGT
1518324549?q77)
r13261 1802)?1)q
9392194992RRql
t1967r86t730584
Dalkeith 1101416153)'71Á'7
r034916170)6<1q
670113456)o1\7
935415260).4614
AGBGT
Trikkala AGBGT
tr7104t94
I 5qÁ5
89382287
1 1))5
101584126
14).R7
r02893s36
1?824Junee AG
BGT
48335495
1 0??R
58516t37
llqRq
40292069609R
49044561q41)
Clare AGBG
31905885an1^
332126806.o,n'l
3083208651 Áq
32003550Ã1<OT
MiXfurE 8191r2142?o???
70278242
1 5)69
80417455
15496
77539280
17033
AGBGT
Stocking Ratemeans
:AG 9030:BG 11403:T 20433
78037886
15690
69018115
15016
Sown at 200 kg/hain 1986
Nungarin AGBGT
3669920069s676R
33112200375?1 4q
1613816776??ql 5
286s01896047610
Datkeith AGBGT
r46311596030591
166882444541133
1 15851447326058
1430r1829332594
Trikkala r04233664
14088
11 151987
1?.13R
134r93501
16920
1 16652717
14382
AGBGT
Junee AGBGT
100832221
1)3o4
622213801676
r02t4t844
1 ?O5R
884018 15
1 06ß0Clare AG
BGT
4588TT4Is730
58532766R61 q
64182477RRg5
56202t287748
Mixture 57854r759960
94684213
r 36R6
79734861
12840
774244r8
r2160
AGBGT
Stocking Rate :AG 13702:BG 7872:T 21573
t3749891t
22732
109587323
18281means

248
Table 8.262 Number of seeds/burr: Above-ground (AG), Below-ground (BG) andTotal (T) at two sowing rates and three stocking rates for the year 1987 at MES.
L.S.R. M.S.R H.S.R Cultivar nleans
Sown at l0 kg/hain 1986
Nungarin AGBG
2.13257
2.28)o7
1.83l5?
2.08207
Dalkeith AGRG
2.43?.5s
2.r8tqR
2.20)7?
2.27228
Trikkala AGBG
2.331?7
2.285R1
1.65145
2.08146
Junee AGRG
2.13155
2.50't 65
2.33110
2.321.43
AGRG
Clare 1.98167
2.531)?
1.88170,
2.13152
AGRG
Mixture 2.20). ).5
2.4515R
2.0814?.
2.241'7s
Stocking Ratemeans
:AG 2.2O:BG 1.98
2.37t.67
t.991.s9
Sown at200 kg/hain 1986
Nungarin AGRG
2.30270
2.33))5
2.r8)10
2.2727s
Dalkeith AGBG
40?o
z)
2.03)s7
1.90). ?,o
2.rl)4R
Trikkala AG 2.20140.
1.981)RRG
2.t01 15
2.r01 )9,
Junee r397
J0
AGRG
2.65os6
2.4314R
2.730.99
AGRG
Clare 2.40o60
3.10o'7?
2.431 1R
2.64oRi
Mixture AGRG
2.t5110
1.981)?
2.181)5
2.r01 lg
Stocking Ratemeans
:AG 2.43:BG 1.50
2.34r.49
2.19 n.s.1.56 n.s.
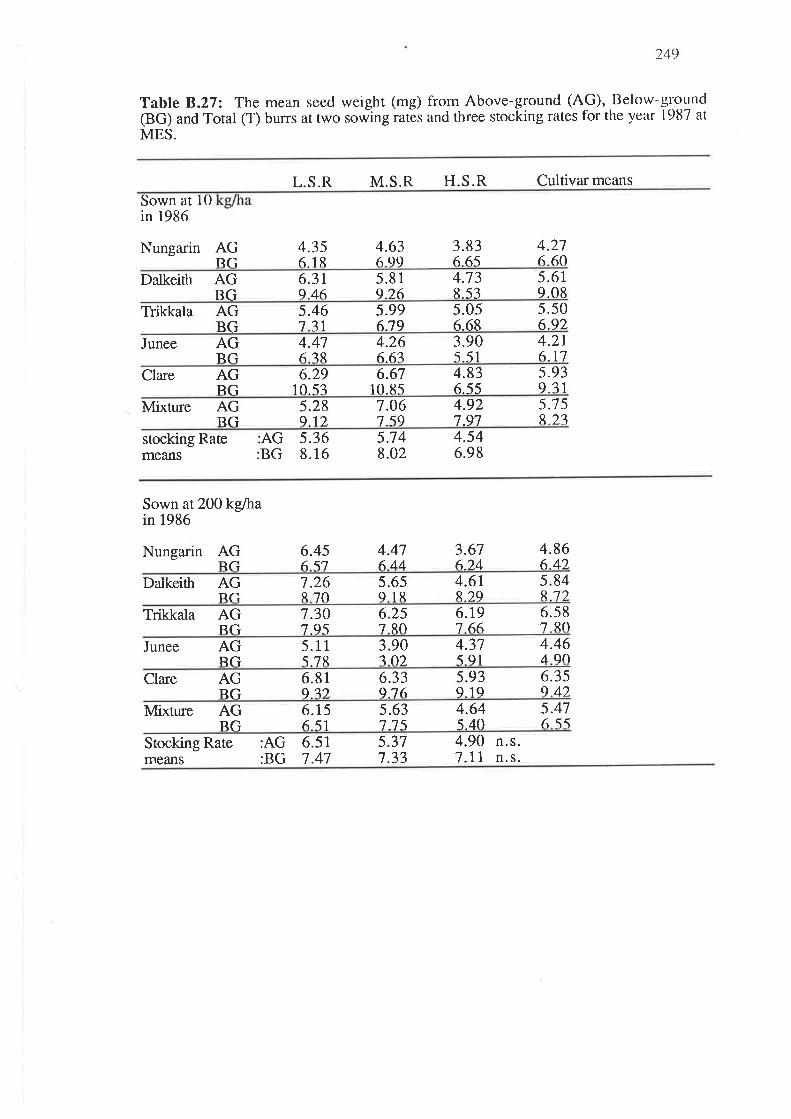
249
Table 8.27: The mean seed weight (mg) from Above-ground (AG), Below-ground(BG) and Total (T) burrs at two sowing ratés and three stocking rates for the year 1987 at
MES.
L.S.R M.S.R H.S.R Cultivar means
Sown at 10in 1986
Nungarin AGRG
4.356.1 I
4.636qg
3.83665
4.27660
Dalkeith AGBG
6.3r9,46
5.819.26
4.738.53
5.619.08
Trikkala 5.467.31
AGBG
5.996.79
5.056.68
5.506.92
AGRG
Junee 4.476îR
4.26667
3.905.51
4.2r617
AGRG
Clare 6.29o531
6.6710 R5
4.836.-55
s.93931
Mixture AGBG
5.28I 1).
7.06759
4.927.97
5.7 sR2?'
stocking Ratemeans
:AG 5.36:BG 8.16
5.7 48.02
4.546.98
Sown at200 kg/hain 1986
Nungarin AGRG
6.45657
4.47644
3.676.24
4.86642
Dalkeith AGRG
1.26R70
5.65q 1R
4.61R ).9
5R
841)
Trikkala AGR(ì
7.3079s
25RO
67
6.r9766
6.587RO
Junee AGR(ì
5.1157R
4.31591
4.464qo
90o)
931S
59
AGRG
Clare
5.6377s
AGRG
Mixture
J?
6.81I 1).
6.33976
6.3s942
6.15651
4.64s.40
5.476s5
Stocking Rate :AG 6.51:BG 7.47means
5.377.33
4.90 n.s.7 .Ll n. s.
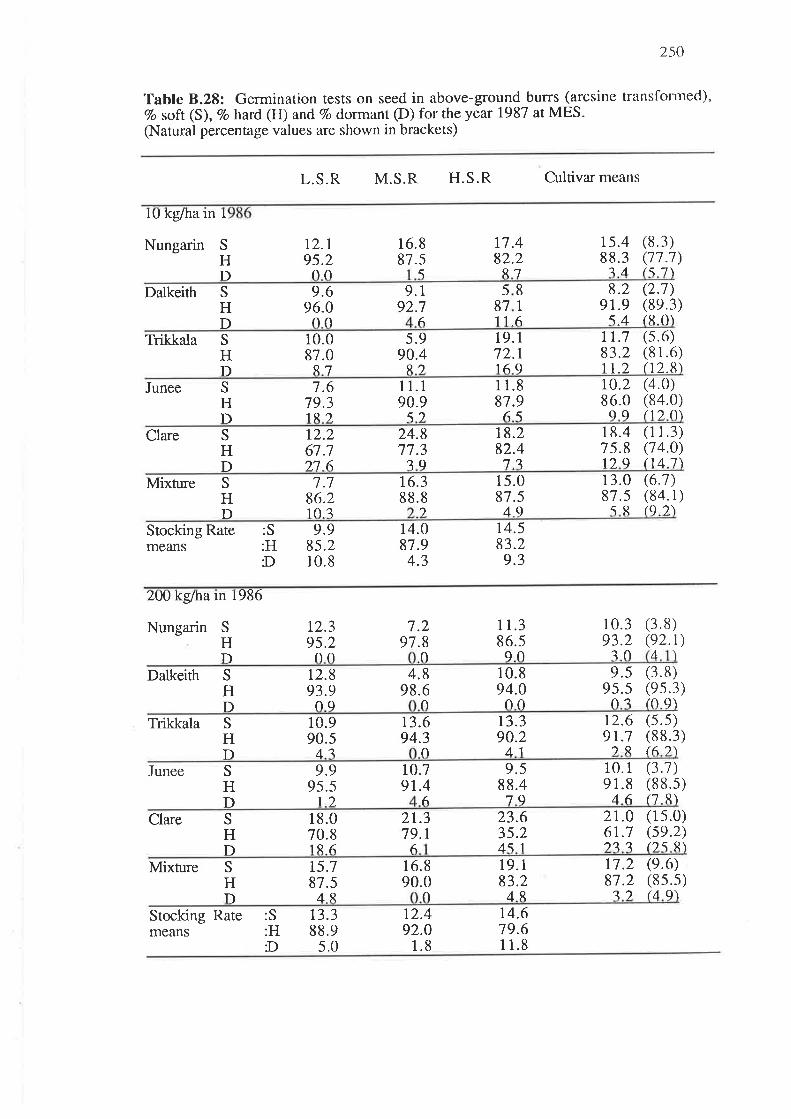
250
Table 8.28: Germination tests on seed in above-ground burrs (arcsine transformed),7o soft (S), Vo hard (H) and 7o dormant (D) for the year l98l at MES-(Natural percentage values are shown in brackets)
L.S.R M.S.R H.S.R Cultivar nìearìs
lU kg/ha tn I
Nungarin S
HD
t2.r95.2oo
16.887.5
5
17.482.2R7
(8.3)(77.1)
r5.488.3a4 t5 7\
Dalkeith 587
S
HD
9.696.0oo
9.192.7
(\ 116
81
8.2 (2.7)91.9 (8e.3)s4 t80)
Trikkala S
HD
10.087.0
R7
5.990.4
19.172.r169
71.7 (s.6)83.2 (81 .6)11.2 (12.tì)R )
Junee 1.619.319, )
S
HD
11.190.9
11.887.965
r0.2 (4.0)86.0 (84.0)q q tl? o\5 )
Clare SHD
12.267.1):7 6
24.877.3
18.282.47?
18.4 (1 1 .3)7s.8 (14.0)1).9 (147\
1 g
Mixture S
HD
l.l86.210 3
r6.388.8
)
15.087.549
13.0 (6.1)87.5 (84.1)sR (9?,\
Stocking Ratemeans
:S:HD
9.985.210.8
14.087.94.3
r4.583.29.3
200 kg/ha in r986
(3.8(e2.
10.393.2?o
S
Hì-)
Nungarin 12.395.2oo
1.297.8
o
1 1.386.sqo 4
)1)'t
Dalkeith t2.893.9oq
4.898.6
o
10.894.0oo
9.s95.5o3
SHT)
(3.8)(e-s.3)lo g\
Trikkala 10.990.s4?
6Jo
13.94.
S
HD
13.390.241
12.6 (s.5)9r.7 (88.3)) 9, (6)\
Junee 9.995.5
1).
S
HD
rc.19r.4
6
9.588.479
10.1 (3.1)91.8 (88.s)46 t7 R'l
Clare S
HT)
18.070.81R Á
2t.379.1
23.63s.2451
21.06r.7)??
(1s.0)(se.2)l?s tì\(r
Mixture 19.183.24R
S
H|-)
15.187.5AR
16.890.0
o
tt.2 (e.6)81.2 (8s.s)7) t4q\
Stocking Rate :S:HÐ
13.388.9
5.0
12.492.0
1.8
r4.619.611.8
means
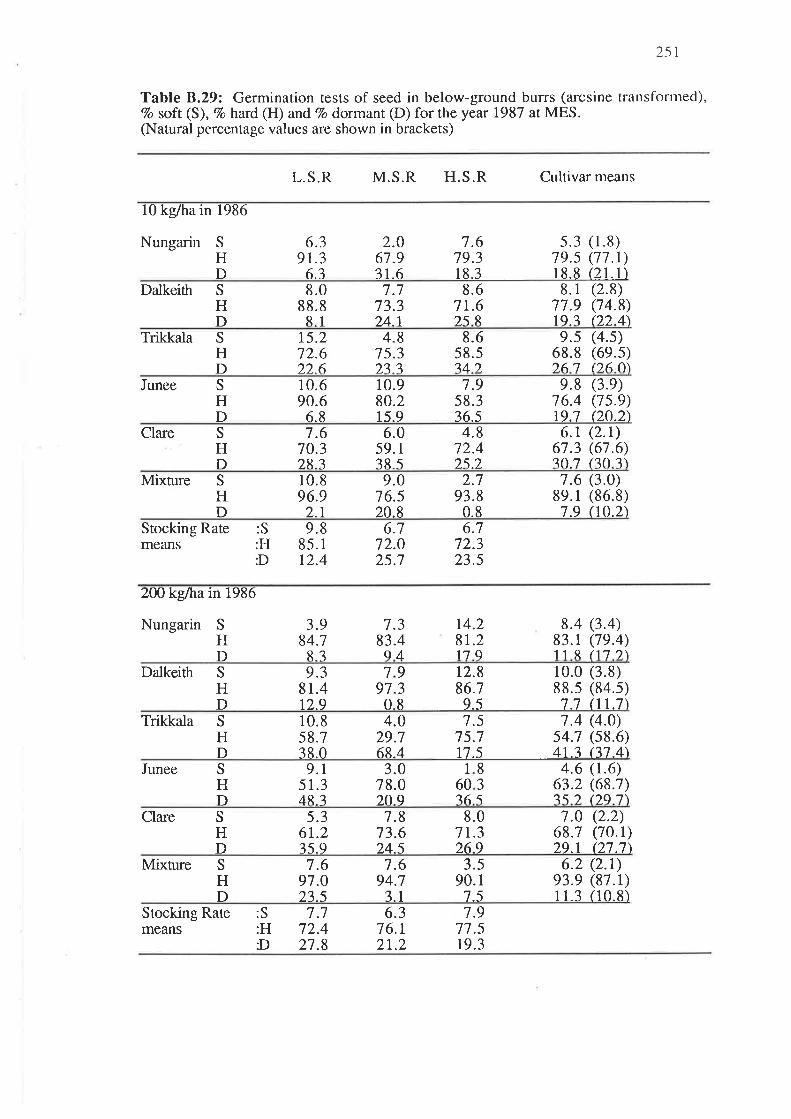
251
Table 8.29: Germination tests of seed in below-ground burrs (arcsine transfortned),Vo soft (S), Vo hard (H) and Vo dormant @) for the year 1987 atMES.(Natural percentage values are shown in brackets)
L.S.R M.S.R H.S.R Cultivar means
Nungarin
10 kg/ha in 1986
S
HD
6.39r.36.3
2.O61.93r.6
t.6 5.3 (1.8)19.3 t9.s (17.t)18.3 18.8 (21.1)
Dalkeith 8.671.6?5R
8.088.881
S
Hl-)
1.773.324.1
8.1 (2.8)77.9 (74.8)lq 3 ().). 4\
Trikkala S
HD
15.212.6226
4.87 5.32?.7
8.658.s74)
e.s (4.s)68.8 (69.s))6 7 ().6 0\
Junee S
HD
10.690.6
6.8
10.980.215.9
7.958.336.5
e.8 (3.e)76.4 (1s.9)19.t (20.2\
Clare S
HD
7.670.328.3
6.059.138..s
4.812.4).s ).
6.1 (2.1)67.3 (67.6)30 7 liO il
Mixture 10.896.9
2.1
9.0t 6.s20.8
2.793.8
0.8
S
HD
7.6 (3.0)89.1 (86.8)7.9 /10.2\
Stocking Ratemeans
6.772.323.5
:S:HÐ
9.885.112.4
6.772.025.7
2(Nkg/hain 198ó
Nungarin 3.984.1ß3
S
Hì-)
7.383.49L
14.281.2179
8.4 (3.4)83.1 (7e.4)11 3, (17 ).\
Dalkeittr 9.381.4t2.9
sHD
7970
9J8
r2.8 10.0 (3.8)86.7 88.s (84.5)9,5 7f t-tt.t\
Trikkala 10.858.738.0
4.029.768.4
S
HD
7.s 7.4 (4.0)7s.7 54.7 (s8.6)r7.s 4r.3 (37.4\
Junee 9.15 1.34R3
3.078.0209
8-J5
I6076
SHD
4.6 (1.6)63.2 (68.7)?5 ) ()q 7\
Clare 5.361.23s.9
7.873.624.5
8.071.326.9
S
HD
7.0 (2.2)68.7 (70.l)29.1 (27.1\
Mixture 7.697.O23.5
1.694.7
3.1
3.590.1
7.5
S
HD
6.2 (2.1)e3.e (87.r)r 1.3 (10.8)
Stocking Rate :S:HD
7.172.421.8
6.37 6.r21.2
7.971.519.3
means

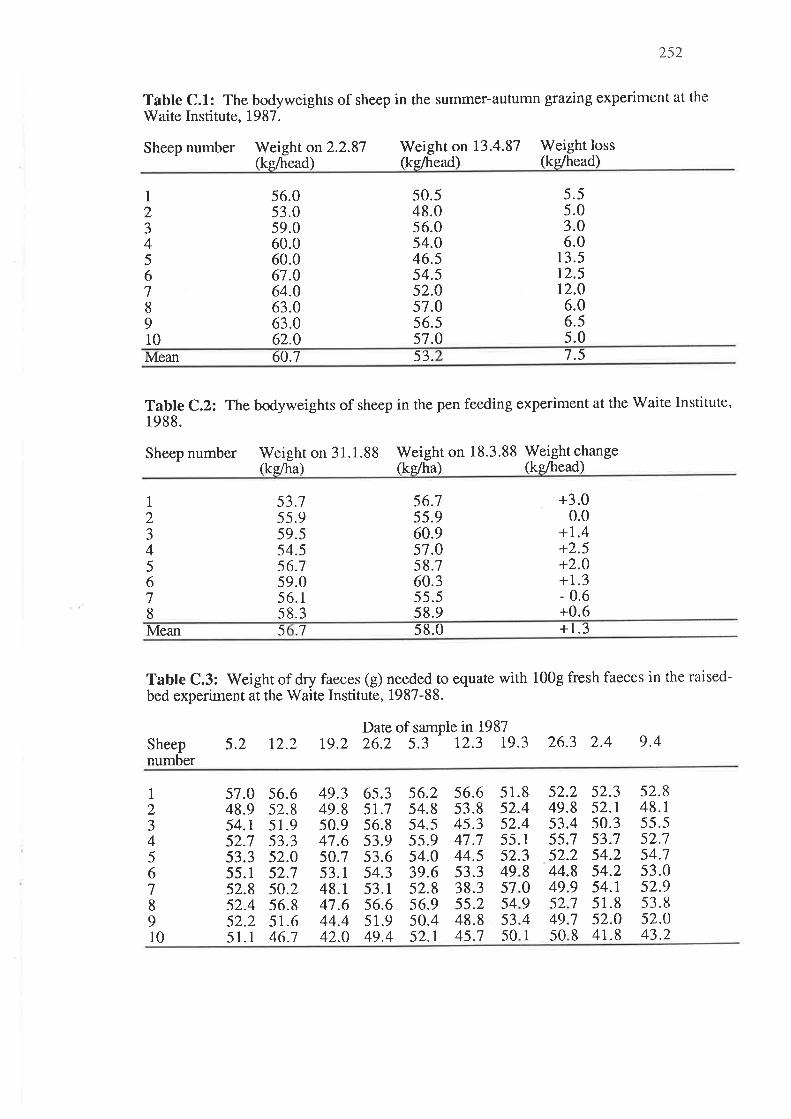
252
Table C.1: The bodyweights of sheep in the summer-autumn grazing experiment at the
Waite Institute, 1987.
Sheep number V/eight on2.2.81fts/head)
Weight on 13.4.87 Weight loss(ke/head)(ke/head )
1
2J456l8910
56.053.059.060.060.067.064.063.063.062.0
50.548.0s6.054.046.554.552.057.056.s57.0
.5
.0
.0
.0
.5
.52.0
553632
1
II6.06.55.0
Mean 60.7 53. 7.5
Tabte C.2: The bodyweights of sheep in the pen feeding experiment at the Waite Institute,1988.
Sheep number Weight on 31.1.88 Weight&e/ha) &e/ha)
on 18.3.88 Weight change(ke/head)
s5.960.957.058.760.355.558.9
1
2J45678
53.7s5.959.554.556.159.056.1s8.3
56.7 +3.00.0
+1.4+2.5+2.0+1.3- 0.6+0.6
Mean 5 7 s8.0 +I.3
Table C.3: V/eight of dry faeces (g) needed to equate with 1009 fresh faeces in the raised-bed experiment at the Waite Institute, 1987-88.
Date of sample in 19875.2 12.2 1,9.2 26.2 5.3 r2.3 r9.3 26.3 2.4 9.4Sheep
number
1
2345678910
57.048.954.r52.753.355.152.852.452.251.1
s3.352.0
65.35r.156.853.9s3.654.353.1s6.651.949.4
s6.254.854.555.954.039.652.8s6.950.452.1
56.653.845.347.744.553.338.355.248.845.7
51.852.452.455.152.3
52.249.853.455.752.44.49.
52.848.155.s52.154.153.052.953.852.043.2
52.352.7s0.353.7
49.349.850.941.650.753.1
56.652.851.9
80941
495l5453
52.750.256.851.646.7
48.147.644.442.O
52
2 54.28 54.29 54.17 51.87 52.OI 41.8
495050
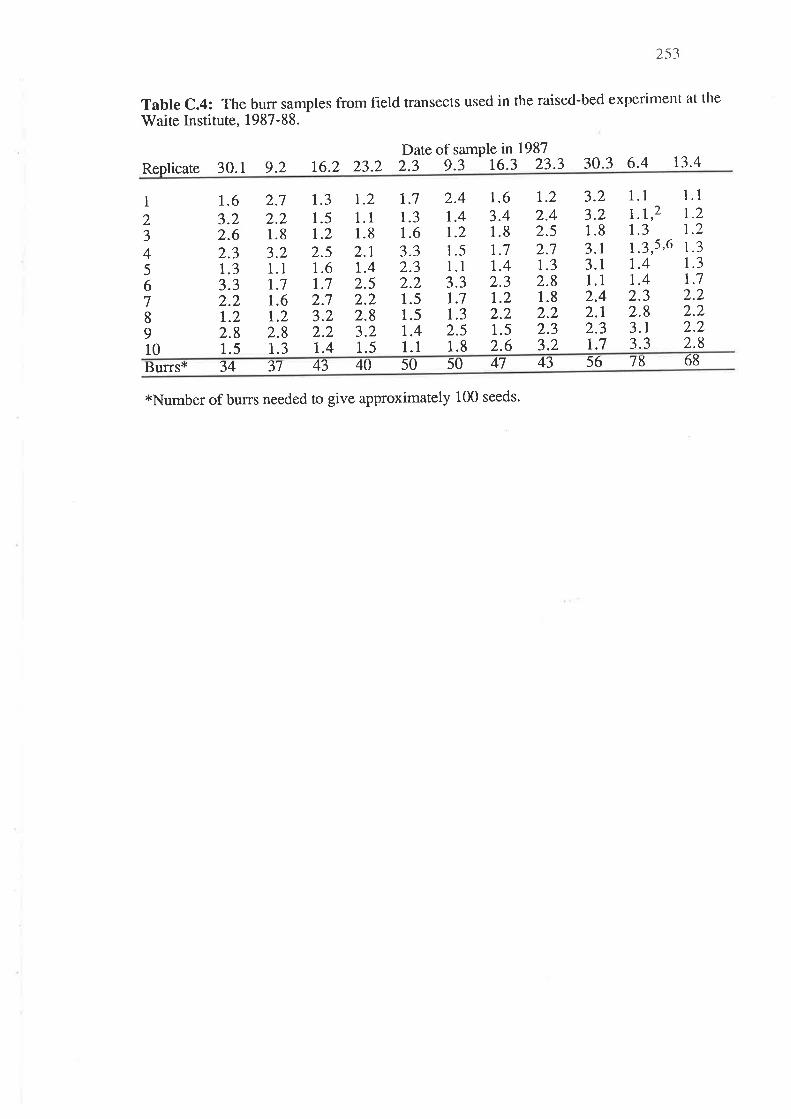
2-s3
Table C.4: The burr samples from field transects used in the raised-bed experiment at the
Waite Institute, 1987-88.
Replicate 30.1 9.2 16.2 23.2Date of sample in 19872.3 9.3 16.3 23.3 30.3 6.4 r3.4
1.1
1.21.21.31.31.72.22.22.22.8
1.1
1.1,21.31.3,5,6t.41.42.32.83.13.3
3.23.21.83.13.11.12.42.12.3t.7
r.22.42.52.71.32.81.8)')2.33.2
r.63.41.8t.7r.42.3
7.21.11.82.1t.42.52.22.83.2
1.31.5t.22.5r.6t.72.73.2))
2.4t.4t.21.51.13.31.7r.32.51.8
t.1r.31.63.32.32.21.51.51.41.1
2.72.21.83.21.1t.71.6r.22.81.3
1.63.22.62.3t.33.32.21.22.81.5
1
23
456789
7.22.21.52.61.4 1.510
Burrsx 34 37 43 40 50 43 56 t8 6850 47
*Number of burrs needed to give approximately 100 seeds.

254
Table C.5: Daily roral seed number in faecal output of each sheep in the period of 70
days.
2622ts2460rt242It513066930601'to70
r692252t376ll6l10856455274336969
2346zzE85544ó477116971972844U6E6E
l8l929)t52782?50125r33384335496767
168 8t47372ütIt3t3I4t2r340l92456666
3017140r 3153lt5z4940920935723)326565
263916072070r69504321803144ó49E6464
24tO2t642986312t2359lt7f24245ltó363
2489ll8I07 I50!7tllE4903!ZI5ó56262
2t19103tt245Z5E4l239E2I3l261óI6l
3I54194tl97652566Z4075E5ZZIIt460ÓU
to97103r487t252r04344ó10237643t6z208229rJ57592t734929tül356lo165)ü5E
3óó5t63t629204114362t23533791595757
85354IO5374L7.629rrt4670235EZz853EÜ5ó5ó
59Eó676t993r3l247tEz500249Lr72t347025555
5 178721773l1719E212ó634to8972559325454
505746971614432515E909433I02E236365353
óo44671ló132031163029óE47E647z5z5745252
5óE I55869r297444199t4623üJ9689Z585JI5t
6l03654693t2l477324I 100337953ll9I 12550JU
7467659ll185003E3527t 116l4z133 E212tz)24949
ó5y20307234óI6E7r 649505I3l330913044t4ü
120r69472039I Ió2540739tó2875220t4227It9r4747
r49331óE93545I O)Z3t7t972179548l96E46tr95r4ó46
I5515t37927a3EIE25174tJ3923767tt44351135 34545
I lt59to23ztt37264047lJ2óE5516r92352ót32E4444
9756lo742047t454012E52446429IOE3425l2t 5434l9947t4942629562'30197r54l675t364533l 0204Z4Z
loloS9743AtZl07r763ð3tt9z496I t432-35t3 E74t4l9E2E932999I3ó57236z!t35I7r40E3139óO4040
5El5587I tó7134232969Z'I LI I75275r0053959
70t29EOtL722t7717254972t96I033244to27383t
9741L22r32t7544527309r242308l059r9ztr2237t7
E200L82167924924163E1527!93l4I3365t6t3636
EO62t27442t39373E49814643751 l6óIt3lózo3535
t77Et25E5ZO3434
toz59t6673t9353524ótu2593410rlt)4925493t33
Lto7zI 363L2372-96641IOI J2364622l46tt919773232
r2100tSzEr5654713E9r328ZJ6U29EL5't716924t53t3I
tt622l2265E4442509I 1753l 1939õ1957143207 |3U30
88 r3120244U4Lt14590t2EOE2LO9797U4I3042929
67701007316t733719E9t5 r9I431()43204loo52A2E
9EóEt4349453557ZEl3 l5r776za9t30ó42t1299ZI27
l05óüLO2464325169441317672742129344256926z6
9r579304243463EE52715004EOt25tt79tLzSz525
7252I 13042229216374E845277I 166t74l6lJ2424
76't Lt2!L261t206406ü07I 554t62r284zz913322323
't401E473092656007092I tü3099E526692322,22
7ólu5659Ió255349EO917452t99623E4I 3tó2r2l
50077El451I503164509ó5647ztlt0362020
ó903ü5rzoTL2103U'l671ll8zt9693326961lyI9
toó90l 8789tó3454lJ9554r 6t94612L525E2r704IElü
99661429r 10923l3lo722t543298l8l533U2t79L7t7
8157tt42862ó4235l r0913042to965392I t74l6l6
óó5 Itzza3573E407EE7I l3l292697tzL1293l)I5
55ó59092345l434910t264r40ó1323476tl4l4
5804EOr77a't179r 03ll9u6I5ót32127óoEI3t3
576Itt82tE9lo09156579t t9r32728L2t2
42047727532lt254t't46392't't674605llll
4AZ9724ltll392E387450I62559r57366l0l058t96I4t572r65L52EO9r200t22447154184I9
4492óJl7493770570l09E989005E2218ü
29443646t7I lõ602077ZZ776tz7t6z77
1392L2st1054IElE3260ü260llL4tóó
9442t42502430t36a25lotzo7955
E9ü1052499Et44lóó2l103o9344
I r48EÓ4EOoo96258l)5Z0l6l3I127l4231o0559t6Uo022
2El60t2o0II
otal scdt/fìælrcep l(rhæp 9rhæp E7ræp 5shccp 4shccp 3shæp 2shæp Id¡lc
NB: Missing values on day 34 due to scoured sheep. Other nìissing values are due to
loss of bag.

255
Table C.6: The total seed and the number of viable seed (soft+hard) found in thefaeces of pen-fed sheep at the Waite Institute, 1988.
Sheep number45 7 82 3 6
Cultivar
NungarinDalkeithTrikkalaJuneeClare
NungarinDalkeithTrikkalaJuneeClare
253472t24343t40
18837610527272
14323117526546
95191t23229
26
26811813633936
82t22246145702
50r042tl1017T
2074481852583s9
178382126209327
29979
181358ro7
2286444
t2828
846
2020t2
Total viable seed output
216106t0729530
572
T729
3
t7860369012
23661.
14524179
o)
øoo0)(t
-c(ooL
¡.L
1 000
900
800
700
600
500
400o 10 20 30 40 50
Days
Appendix C: Fig. 1 Mea¡r fresh weight of faeces from penned sheep
qE
tr
E
opE fE Eh
EbE
E
EIE
El Etr tr
@Eb

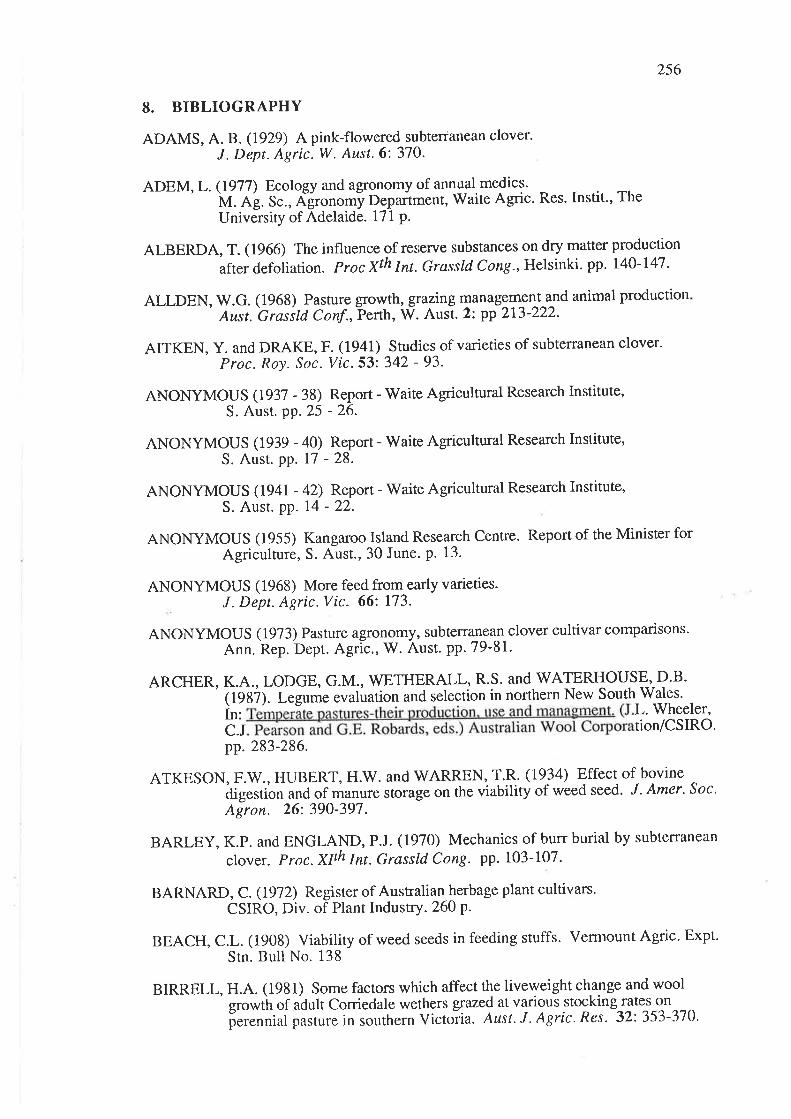
256
ANONYMOUS (1939 - 40)S. Aust. pp. 17 -
8. BIBLIOGRAPHY
ADAMS, A. B. (1929) A pink-flowered subteranean clover'J. Dept. Agric. W. Aust. 6: 37O.
ADEM, L. (1917) Ecology and agronomy of annual.medics'' M. eg. Sc., ,{!.onoln} Department, Waite Agnc' Res' Instit', The
University of Adelaide. I7l P.
ALBERDA, T. (1966) The influence of re¡erve substances on dry matter production
after defoliarion. Proc xth Int. Grassld cong., Helsinki. pp. 140-147.
ALLDEN, W.G. (1968) Pasture growth, grazlngmanagem€nt and animal productionAust.'Grassld Conf.,Þerth, V/. Aust. 2: pp 213-222'
AITKEN, y. and DRAKE, F. (1941) Studies of varieties of subterranean clover.Proc. Roy. Soc. Vic.53:342 - 93.
ANONYMOUS (1937 - 38) Report - Waite Agricultural Research Institute,
S. Aust. pp.25 - 26.
Report - Waite Agricultural Research Institute,28.
ANONYMOUS (1941 - 42) Report - Waite Agricultural Research Institute,
S. Aust. pp. t4 - 22.
ANONyMOUS (1955) Kangaroo Island Research Centre. Report of the Minister forAgriculture, S. Aust., 30 June. p. 13.
ANONYMOUS (1968) More feed from early varieties.J. Dept. Agric.Vic. 66: ll3-
ANONYMOUS (1973) Pasture agronomy, subterranea_n clover cultivar comparisons.Ann. Rep. Dept. Agric., W. Aust. pp. 79-81.
ARCTIER, K.4., LODGE, G.M., WETHERALL, R.S. ANd WATERHOUSE' D.B.' (198i). Legume evaluation and selection in northern New South Wales.
Ìn: ' e L'wheeler'C-J tion/CSIRO'pp.283-286.
ATKESON, F.Vy'., HUBERT, H.W. and WARREN, T.R. (19?4) lffect of bovineâigeSi'on and of manure storage on the viability of weed seed. J. Amer- Soc.
Agron. 26:390-397.
BARLEY, K.p. and ENGLAND, P.J. (1970) Mechanics of burr burial by subterranean
clover. Proc. XIth Int. Grassld Cong. pp' 103-107.
BARNARD , C. (1912) Register of Australian herbage plant cultivars.CSIRO, Div. of Plant Industry-260 p.
BEACH, C.L. (1908) Viability of weed seeds in feeding stuffs. Vermount Agric. Expt.
stn. Bull No. 138
BIRRELL, H.A. (1981) Some factors which affect the liveweight ch.ange and woolgrowtit of adult Corriedale wethers g.azeg at various stocking^rate^s_on
perennial pasture in southern Victoia. Aust. J. Agric. Res. 32 353-370.
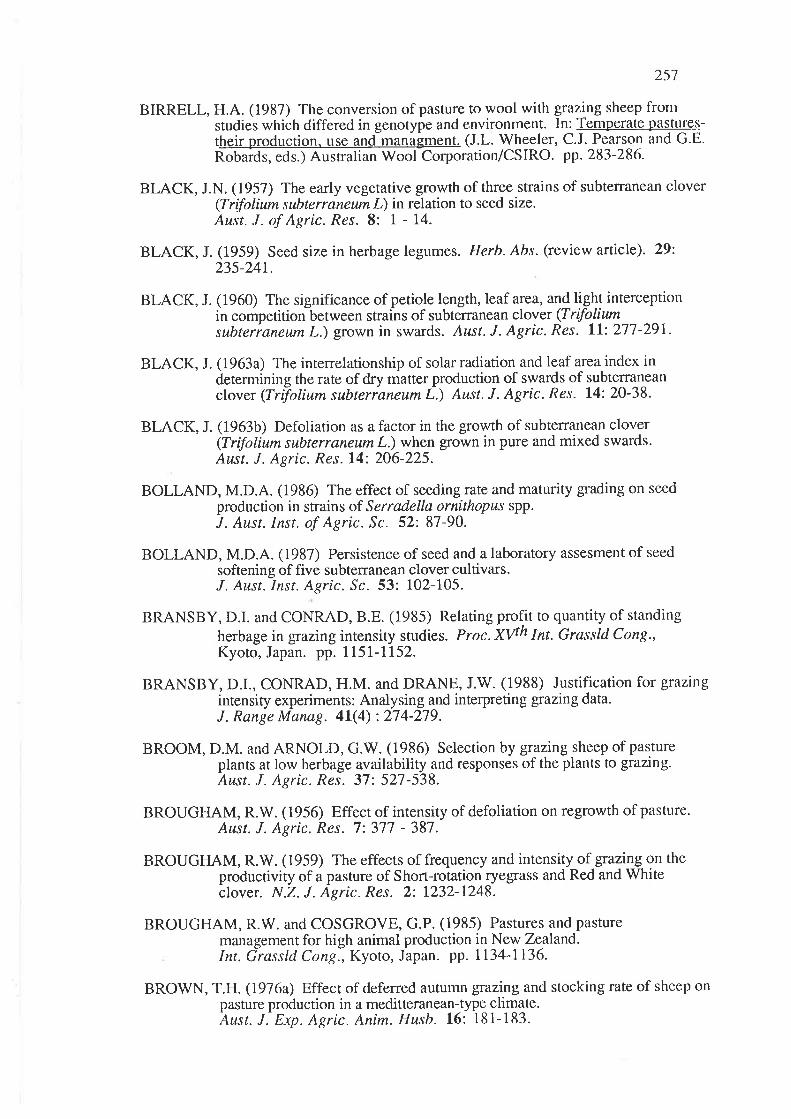
257
BIRRELL, H.A. (1987) The conversion of pasture to wool with grazing sheep fromstudies which differed in genotype and environment. In: Temperate pas-tujes-
their production (J.L. Wheeler, C.J. Pearson and G.E.Robaids, eds.) Australian Wool Corporation/CSlRO. pp. 283-286.
BLACK, J.N. (1957) The early vegetative growth of three strains of subterranean clover(Trifolium subterraneum L) in relation to seed size.Aust. J. of Agric. R¿s. 8: | - 14.
BLACK, J. (1959) Seed size in herbage legumes. Herb. Abs. (review article). 29:235-241.
BLACK, J. (1960) The significance of petiole length, leaf area, and light interceptionin competitiorrbetween straiis of subterranean clover (Trtfo]i-ury -- ^subterianeum L.) grown in swards. Aust. J. Agric. R¿s. 11: 277-29t.
BLACK, J. (1963a) The interrelationship of solar radiation and leaf area index indetermining the rate of dry matter production of swards of subterraneanclover (Trifolium subterianeum L.) Aust. J. Agric. Res. 14:20-38.
BLACK, J. (1963b) Defoliation as a factor in the growth of subterranean clover(TriþIium subteryaneum L.) when grown in pure and mixed swards.Aust. J. Agric. Res.14: 206-225.
BOLLAND, M.D.A. (1986) The effect of seeding rate and maturity grading on seedproduction in strains of Serra.della ornithopus spp.J. Aust. Insr. of Agric. Sc. 52:87-90.
BOLLAND, M.D.A. (1937) Persistence of seed and a laboratory assesment of seedsoftening of five subterranean clover cultivars.J. Aust. Inst. Agric. Sc. 53: 102-105.
BRANSBY, D.I. and CONRAD, B.E. (1985) Relating profit to quantity of standing
herbage in grazing intensity studies. Proc.XVth ht. Grassld Cong.,Kyoto, Japan. pp. 1151-1152.
BRANSBY, D.I., CONRAD, H.M. and DRANE, J.W. (1988) Justification for grazinginten sity experiments : An alysin g and interpretin g gr azin g data.J. Range Manag. 4l(4) :274-219.
BROOM, D.M. and ARNOLD, G.W. (1936) Selection by grazing sheep of pastureplants at low herbage availability and responses of the plants to grazing.Aust. J. Agric. Res. 37:521-538.
BROUGHAM, R.W. ( 1956) Effect of intensity of defoliation on regrowth of pasture.Aust. J. Agric. Res. 7:317 - 387.
BROUGFIAM, R.Vy'. (1959) The effects of frequency and intensity of grazing on theproductivity of a pasture of Shon-rotation ryegrass and Red and Whiteclover. N.Z. J. Agric. Res. 2: 1232-t248.
BROUGHAM, R.W. and COSGROVE, G.P. (1985) Pastures and pasturemanagement for high animal production in New Zealand.Int. Grassld Cong., Kyoto, Japan. pp. 1134-1136.
BROV/N, T.H. (1976a) Effect of deferred autumn grazing and stocking rate of sheep onpasture production in a meditteranean-type climate.Aust. J. Exp. Agric. Anim. Husb. 16: 181-183.
258
BROWN, T.H. (1976b) The effect of stocking rate and deferred autumn grazing ofpasture on liveweight and wool production of Merino wethers in ameditteranean-typé climate. Aust. J. Exp. Agric. Aním. Husb. 16: 189-196.
BROWN, T.H. (1971) A comparison of continuous grazing and deferred autunrngrazingof Merino ewes and lambs at l3 stocking rates.Aust. J. Agric. Res. 28: 947 -961.
BURCH, G.J. and ANDREWS, P. (1976) Replacement of cv. Yarloop in swards bynew genotypes of Trifolium subterianeum L. subsp. yanninícum and theeffecis of dèfoliation. Aust. J. Agric. Res. 2l:211-226.
CAHN, M.A. and HARPER, J.L. (1976) The biology of the leaf mark polymorphism inTrifolíum repens L. 2. Evidence for the selection of leaf marks by rumenfistulated sheep. Herediry 37 : 327 -333.
CAMERON, I.H. and CANNON, D.J. (1970) Changes in the botanical composition ofpasture in relation to rate of stocking with sheep and consequent effects on
wool production. Proc.XIth Int. Grassld Cong' pp. 640-643.
CAMERON, I.H. and Mc GOV/AN, A.A. (1968) Comparative productivity of somevarieties of subterranean clover (TriþIium subterraneum L.) in north easternVictoria. Aust. J. Exp. Agric. Aním. Husb. 8: 46-51.
CAMPBELL, M.H. (1963) Establishment of pasture species on unploughed ground.
3rd Aust. Grassld Conf., Warburton, Vic. part 4.3'
CARTER, E.D. (1951) Report: Department of Agriculture, South Australia.
CARTER, E.D. (1952) Report: Department of Agriculture, South Australia.
CARTER, E.D. (1953) Report: Department of Agriculture, South Australia.
CARTER, E.D. (1954) Pasture development and regrowth problem on kangaroo Island.The Chronical, Adelaide., Aug. 261954 Supplement. 97(5462):22-24.
CARTER, E.D. (1965) Some relationships between superphosphate use and consequentanimal production from pastuie in South Australia. Proc.IX Int. GrassldCong., Sao Paulo, Brazil. 2: pp. 1027 -1032
CARTER, E.D. (1966) Pasture management and utilization. Waite AgriculturalResearch Institute, Biennial Report 1966167. pp.42-43-
CARTER, E.D. (1968a) Implications of stocking rate for botanical composition ofpasture. Proc. Aust. Grassld Conf., Perth, W.Aust. 2: pp. 173 - 179.
CARTER, E.D. (1968b) The effect of stocking rate on the production and utilization ofannual pasture and on wool production.Proc. Ãust. Grassld Conf.,Perth, W. Aust-, May 1968. 1(la): pp. 9-11'
CARTER, E.D. (1968c) Changes in seed supply of an annual pasture grazedcontinuously by sheep at five stocking rates.Proc. Aust.'Giasslands Conf., Perth,W. Aust., May 1968. 1(1b): pp.7-10'
CARTER, E.D (1976 et. seq.) Re: Deterioration of medic- and sub clover-basedpastures. Waite-Agricultural Research Institute, Biennial Reports 1914-15:
þp. 45-a6; 191 6-17 : pp. 72-7 5; 197 8-79: pp- 57- 58'

259
CARTER, E.D. (1977) Stocking rate and ecosystem: Some soil-plant-animalinterrelationships on annual pastures in South Australia. Proc. XIIt th I nt.Gras sld Cong., Leipzig. 2: pp. 839-842.
CARTER, E.D. (1973) Stocking rate and the ecosystem: some interrelationships ofpasture availability , grazing behaviour and productivity of Merino sheep onsown annual pasture in South Australia. Proc. IV World Conf. on AnimaLP roduction, Buenos Aires, Argentina.
CARTER, E.D. (1980) The survival of medic seeds following ingestion of intact podsby sheep. Proc. Aust. Agron. Conf., Lawes, Qld., p.178.
CARTER, E.D. (1981) Seed and seedling dynamics of annual medic pastures in South
Australia. Proc. XNth Grassld Cong., Lexington, Kentucky, USA. pp.447-450.
CARTER, E.D. (1982) The need for change in making the best use of medics in cereal-livestock farming systems of South Australia. Proc. Aust. Agron. Conf.,Wagga Wagga, NSW, July p. 180.
CARTER, E.D. (1983) Portugal University Institutes development project. Report onshort-term staff assignment April 1.5 - May 16, 1983. Purdue University,USA. (Contract AID^\IE - c - l70l).24 p.
CARTER, E.D. (1985) The medic status of cereal farms in thr.ee districts of SouthAustralia. Workshop on Tillage Systems, Rotations, Nitrogen and cerealRoot Diseases. 'Waite Agricultural Research Institute, S. Aust., Feb. 28 -March 1. pp. N-2, N-3.
CARTER, E. D. (1937) Establishment and natural regeneration of annual pastures. In:Temperate pastures - their production use and management. (J.L.Wheeler, C. J. Pearson and G. E. Robards , eds.) Australian WoolCorporation/CSlRO. pp. 35-5 1.
CARTER, E.D. (1988) Improving pasture production in winter in the cereal farmingdistricts. Regional Conference of Agricultural Bureaux, Wasleys SouthAustralia. 1lp.
CARTER, E.D. (1989) In: Improved pastures = improved profits. an introduction tothe benefits of improved pastures. UFS S.A. Inc./ Seed Ind. Assoc.Aust./ Dept. Agric, S.A./ Seedco. 15 p.
CARTER, E.D., ARMSTRONG, A. and SOMMER, K.J. (1987) Effects of minimumtillage practices for wheat on survival and productivity of annual pasturelegumes. Waite Agricultural Research Institute, Biennial Report 1986 - 87pp. 58 - 59.
CARTER, E.D. and CHALLIS, S. (1987) Effects of depth of sowing medic seeds on
emergence of seedlings. Proc.4th Aust. Agron. Conf., Melbourne - p. 192.
CARTER,8.D., CHALLIS, S. and KNOWLES, R.C. (1988) Legume seed survivalfollowing ingestion by sheep. Workshop on tillage systems, rotations,nitrogen and cereal root diseases. Adelaide, S. Aust. p. N2
CARTER, E.D., CFIALLIS, S., KNOWLES, R.C. and BAHRANI, J. (1989) Pasture
legume seed survival following ingestion by sheep. Proc. 5th Aust. Agron.Conf ., Perth, W. Aust. p. 437.
260
CARTER, E.D. and COCHRANE, M.J. (1985) The poor subterranean clover status ofdairy pastures in the Adelaide Hills.Proc. Aust. Agron. Conf ., Hobart, Tas. p.217.
CARTER, E.D. and DAY, H.R. (1970) Interrelationships of stocking rate andsuperphosphate rate in pasture as determinants of animal production.Aust. J. Agric. Res. 2I: 473-491.
CARTER, E.D. and LAKE, A. (1985) Seed, seedling and species dynamics of gtazed
annual pastures in South Australia. Proc. XVth Int. Grassld Cong., Kyoto,Japan. pp. 654-656.
CARTER, E.D. and SIVALINGAM, T. (1977) Some effects of treading by sheep 9npastures of the Mediterranean climatic zone of South Australia. Proc. XIilInt. Grassld Cong.,Leipzig, G.D.R. 5: pp. 3O7 - 3I2.
CARTER, E.D. and WIGG, P.M. (1963) Pasture establishment on problem soils ofKangaroo Island. J. Dept. Agric. S. Aust.66: 464-415.
CARTER, E.D., WOLFE, E.C. and FRANCIS, C.M. (1982) Problems of maintainingpastures in the cereal-livestock areas of southern Australia.Þroc. Aust. Agron. Conf., Wagga Wagga, N.S.W., July. pp. 68-82'
CHRISTIAN, K.R. (1987) pasture production and animal requirements.In: (J.L.V/heeler, C.J. and G.E. Robards, eds.) Australian V/oolcorporation/CslRo. pp. 463-47 6.
COCKS, P.S. (1973) The influence of temperature and density on the growth ofcommunities of subterranean clõver (Triþlium subterraneum L cv.}/4it.Barker). Aust. J. Agric. Res. 24: 479-495.
COCKS, P.S. (1934) ICARDA- International Centre for Agricultural Research in DryAreas. Annual Report. p. 275.
COCKS, P.S. (1987) ICARDA- International Centre for Agricultural Research in_!r,y_ .
Areas. Annual Report- Pasture, forage and livestock program. pp.126-134.
COCKS, P.S. (1988) Seed production and seed survival under grazing^of .q1nr¡al medics(M'edicago spp.) in North Syria. J. Agric. Sci. Camb. Ll0: 455-463.
COCKS, P.S. and PHILLPS, J.R. (1979) Evolution of subteranean clover in SouthAustralia 1. The strains and their distribution.Aust. J. Agric. Res. 30: 1035-1052.
COLLINS, W.J. (1973) The effect of defoliation on inflorescence production, seedyieldand hard seededness in swards of subterranean clover. Aust. J. Agric. Sc.
29: 789-801.
COLLINS, W.J. (1981) The effects of length of growing season with and withoutdefoliation, on seed yield and hard-seededness in swards ofsubterraneanclover. Aust. J. Agric. Res. 32:783-792.
COLLINS, W.J. and AITKEN, Y. (1970) The effect of leaf removal on flowering timein subterranean clover. Aust. J. Agric. Res. 2l: 893-903.
COLLINS, W.J. and AITKEN, Y. (1971) Grazing affects flowering of subterraneanclover. J. Dept. Agric.Vic. 69 20-
26t
COLLINS, W.J., FRANCIS, C.M. and QUINLÍVAN, B.J. (1976) Theinterrelationship of burr burial, seed yield and dormancy in strains ofsubterranean clover. Aust. J. Agric. Res. 27:787-797.
COLLINS, W.J, FRANCIS, C.M. and QUINLIVAN, B.J (1984) Registered cultivarsof subterranean clover - their origin, identification and potential use in'Western Australia. W. Aust. Dept. Agtc.Bulletin No. 4083.
COLLINS, V/.J., RHODES, T., ROSSITER, R.C. and PALMER, M.J. (1983b) Theeffect of defoliation on seed yield of two strains of subterranean clover grownin mono-cultures and in binary mixtures. Aust. J. Agric. Res.34: 67I-619.
COLLINS, W.J., ROSSITER, R.C. and MONREAL, A.R. (1978) The influence ofshading on seed yield in subterranean clover.Aust J. Agric. Res. 29: 1167-75.
COLLINS, W.J., ROSSITER, R.C. and WOLFE, E.C. (1983a) The winter productionof some strains of subterranean clover grown in defoliated swards.Aust. J. Exp. Agric. Anim. Husb. 23: 140-145.
CURLL, M.S. and DAVIDSON, J.L. (1983) Defoliation and productivity of a Phalaris-subterranean clover sward, and the influence of grazing experience on sheepintake. Grass and Forag¿.Sc. 38: 159-167.
DAVIDSON, J.L. (1954) The effect of density of sowing on the growth of Triþliumsubterraneum L. (Subterranean clover). B. Ag. Sci. (Hons) Thesis,The University of Adelaide. 76 p.
DAVIDSON, J.L. and BIRCH, J.W. (1972) Effects of defoliation on growth andcarbon dioxide exchange of subterranean clover swards.Aust. J. Agric. Res. 23:981-993.
DAVIDSON, J.L. and DONALD, C.M. (1958) The growth of swards of subterraneanclover with particular reference to leaf area. Aust. J. Agríc. Res. 9: 53-13.
DAVIES, H.L. (1987) The effect of autumn and winter grazing pressure on end ofspring pasture production. Proc.4th Aust. Agron. Conf., Melb., Vic.p.203.
DAVIES, H.L. and SOUTFIEY, I.N. (1985) The effect of stocking rate and gtazingmanagement upon ewe liveweight, ewe fertility, lamb growth and pastureproduction on subterranean clover based pasture in Western Australia.Proc. X\lth Int. Grassld Cong., Kyoto, Japan. pp. 1158-1160.
DAY, H.R. (1963) Sub clovers for Kangaroo Island. J. Dept. Agric. S. Aust. 66:289-297.
DEAR, B.S. (1982) Legumes for cold environments. Proc. Workshop on pastureIegumes, Dept. Agnc. NSV/. pp. 2l-23.
DEAR, B.S. and JENKINS, L. (1987) The potential of Medicago murex as a newlegume species for the eastern wheat belt.Proc. 4th Aust. Agron. Conf., Melb., Vic., Aug. p. 167.
DEAR, B.S. and LOVELAND, B. (1984) Herbage production and seed yield ofdefoliated subterranean clover swards in a cool temperate environment. Aust.1. Erp. Agric. Anim. Husb. 24: 543-549.
262
DE KONING, C.T. (1984) Studies on the ecology and productivity of subterraneanclover- B. Ag. Sci. (Hons.) Thesis, The University of Adelaide. I 3l p.
DE KONING, C.T. and CARTER, E.D. (1987a) Differing winter production ofsubterranean clover cultivars. Proc.4th Aust. Agron. Conf., Melb.,Vic. p. 160.
DE KONING, C.T. and CARTER, E.D. (1987b) Impact of grazing by sheep onsubterranean clover cultivars. Proc.4th Aust. Agron. Conf., Melb.,Vic. p. 169.
DE KONING, C.T. and CARTER, E.D. (1989a) The survival of seed of subterraneanclover following ingestion by sheep. Proc. XVI Int. Grassld Cong., NiceFrance. pp. 1031 - 1032.
DE KONING, C.T. and CARTER, E.D. (1989b) Losses of subterranean clover seedfrom dry pasture residues during grazing by sheep in summer-autumn. Proc.5th Aust. Agron. Conf., Perth. p. 408.
DENNEY, G.D., LINDSAY, J.R. and HOGAN, J.P. (1978) The nutritive value of hayand pods of Barrel medic (Medicago tuncatula) for sheep.Proc. Aust. Soc. Anim. Prod. 12:148.
DONALD, C.M. (1951) Competition among annual pasture plants. 1. Intraspecificcompetition among annual pasture plants. Aust. J. Agric. Res. 2:355 - 376.
DONALD, C.M. (1954) Competition amongon flowering and seed productionAust. J. Agric. Res. 5: 585-597.
pasture plants. 2.The influence of densityin annual pasture plants.
DONALD, C. M. (1960) The influence of climatic factors on the distribution ofsubterranean clover. Herb. Abs. 30:81 - 90
DONALD, C.M. and ALLDEN, W.G. (1959) The summer nutrition of weaner sheep.Aust. J. Agríc. Res. 10: 199 - 218.
DONALD, C.M. and BLACK, 1../Ú.t)tfqS8) The significance of leaf area in pasturegowth. Herb. Abs.
-(review article) 28: l-6.
DORE, W.G and RAYMOND, L.C. (1942) Viable seeds in pasture soil and manure.Sc. Agric. 23: 69-79.
DUNLOP, A.C. (1985) The effects of grazing and cropping on pastures. In: Proc. ofseminar discussing pastures and their management. (4.C. Dunlop andC.W. Thorn, eds.) Perth, W. Aust. Aust. Soc. Anim. Prod. pp.28-39.
DUNLOP,4.C., BOWDEN, J.W. and ALLEN, G.M. (1984) The effect of stockingrate on dry matter production of mediterranean annual pastures. In: Animalproduction in Australia, Proc. Aust. Soc. Anim. Prod. 15: pp. 333-336.
EVERS, G.W. (1982) Seedling gowth and nodulation of arrowleaf, crimson, andsubterranean clovers. Agron. J. 74(4): 629-632.
FITZGERALD, R.D. (1976) Effect of stocking rate, lambing time and pasturemanagement on wool and lamb production on annual subterranean cloverpasture. Aust. J. Agric. Res. 27:26I-215.

263
FRANCIS, C.M. and GLADSTONES, J.S. (1974) Relationship and duration offlowering and seed yield components in subterr¿rnean clover (Trifoliutnsubterraneum). Aust. J. Agric. Res. 25: 435.
FRANCIS, C.M., QUINLIVAN, 8.J., HALSE, N.J. and NICHOLAS, D.A. (1976)Subterranean clover in Western Australia. 2. Charcteristics required foragronomic success. J. Agric. W. Aust. 17:26-3I.
FRANCIS, C.M., QUINLIVAN, B.J. and NICOL,H.I. (1972) Variation in burr burialability in subterranean clover. Aust. J. Agric. Res. 23: 605-610.
FRANKLIN, M.C., Mc INNES, P. and BRIGGS, P.K. (1964) The seed of Medicagospecies as a supplement to a low protein roughage diet for merino sheep.Aust. J. Exp. Agric. Anim. Husb. 4: 129-131.
FRANKLIN, M.C. and POWNING, R.F. (1942) Studies on the chemical composition. of pods and seeds of certain species of Medicago, with a note on the apparentI digest{bility of cluster clover (TriþIiutn glomeratum) seed.
J.C.S.l.R. Aust. 15: l9l.
FUKAI, S. and SILSBURY ,1.H. (1971) Effects of irradiance and solar radiation ondry matter gowth and net CO2exchange rate of Trífolium subterraneum Lswards at a constant temperature. Aust. J. Plant Physiol. 4: 485-491.
GLADSTONES, J.S. (1987) Measurement of high temperature seed dormancy insubterranean clover. J. Aust. Inst. Agríc. Sci. 53: 99-101.
GRAMSHAW, D., READ,'W. J., COLLINS, V/.J. and CARTER, E.D. (1989) Sownpastures and legume persistence: an Ausralian overview. In: Persistence offorage legumes. (G. C. Marten et aI., eds). Amer. Soc. Agron., Crop
^Sc. Soc. of Amer., Soil Sc. Soc. of Amer. pp. | - 22.
GRANT LIPP, A.E. and BALLARD, L.A.T. (1964) The interrelation of dormancy,size, and hardness in seed of Trifolium subterraneum L.Aust. J. Agric. R¿s. 15: 215-222.
FIAGON, M.W. (1973a) Research News: Regeneration of subterranean clover.Agric. Gaz. NSW. 84: 124 - 128.
HAGON, M.V/. (1973b) The effect of defoliation on flowering and seed yield insubterranean clover. Aust. J. Agric. Res. 24:211-217.
HAGON, M.W. (1974) Regeneration of annual winter legumes at Tamworth, NewSouth Wales. Aust. J. Exp. Agric. Anim. Husb. 14:57-64.
HALL, D.G. (1984) The contribution of subterranean clover burr to the diet of sheepand cattle. Proc. Aust. Soc. Anim. Prod. 15: p. 690.
FIARMON, G.\ry. and KEIM, F.D. (1934) The percentage and viability of weed seedsrecovered in the feces of farm animals and their longevity when buried inmanure. J. Amer. Soc. Agron. 26:762-167.
HEADY, H.F. (1954) Viable seeds recovered from faecal pellets of sheep and deerJ. Range Manag. 7:259-26I.
HIGGS, E.D. (1958) Choosing subclover strains for your farm.J. Dept. Agric. S. Ausr. 6l: 267-272.
264
HILLS, J.L. and JONES, C.H. (1907) Commercial feeding stuffs. Vermqúnt Agric.Exp. Stn. Bull. No. 131: .8p.
HOWARD, A. Vy'. (1906a) A valuable weed. The Advertiser. S. Aust. 3 Feb.
HOV/ARD, A. W. (1906b) A new fodder plant. The Advertis¿r. S. Aust. 2 March.
HUME, I.D., SOMERS, M. and Mc KEOWN, N.R. (1968) Nutritive evaluation of twostrains of mature subterranean clover.Ausr. J. Exp. Agric. Anim. Husb. 8: 295-300.
HUTTON, E.M. (1968) Theme review: Evaluaúon of herbage plants.ProcAust. Grassld Conf., Perth, W. Aust. 2: 49-55.
JENKINS, S.J. (1978) The effect of sheep on survival of medic seed. AgronomyProject, V/aite Agric. Res. Inst., S. Aust. 15 p.
JONES, R.M. and SIMAO NETO, M. (1987) Recovery of pasture seed ingested byruminants 3. The effect of the amount of seed in the diet and of diet qualityon seed recovery from sheep. Aust. J. Exp. Agríc. 27:253-256.
KATZNELSON, J. (1970) Edaphic factors in the distribution of subterranean clover inthe Mediterranean règion. Proc.XI lh Int. Grassld Cong. pp.l92-196.
KATZNELSON, J. and MORLEY, F.H.W (1965) Speciation procession Tríþliumsubterraneum L, Legumunosae. Israel J. Bot. 14: 15 - 35.
LAMBERT, M.C., CLARK, D.4., GRANT, D.A. and COSTALL, D.A. (1986)Influence of fertilizer and grazing management on North Island moist hillcountry 2. Pasture botanical composition. N.Z. J Agric. Res. 29: l-l0.
LAWSON, E.H. and ROSSITER, R.C. (1958) The influence of seed size and seedlingrate on the growth of two strains of subterranean clover (Trifoliumsubteruaneum L.). Aust. J. Agric. Res. 9:286-298.
LEONARD, V. (1986) The fate of legume seed and pods when fed to sheep. AgronomyProject, Waite Agric.Res. Inst., S. Aust. 17 p.
Mc INTYRE, G.A. (1946) The measurement of pasture yield under grazing.In:CSIR bulletin. 201: pp. 70-83.
MCKINNEY, G.T. (1972) Simulation of winter grazing on temperate pastures.Proc. Aust. Soc. Anim. Prod. 9: 3l-37.
MCMEEKAN, C.P. (1956) Grazing management and animal production . Proc. Tth Int.Grassld Cong. pp. 146-156.
MARRETT, A.J. (1960) Seed reserves are important in establishing subterranean cloveron lower north farms. J. Dept. Agric. S. Aust. 64:93,102.
MATCHES, A.G. (1968) Performance of four pasture mixtures defoliated by mowingor grazing rvith cattle or sheep. Agron. .1. 60:281-285.
MORLEY, F.H.W. (1958) Effect of strain and temperature on the growth ofs u b terrane an clover (T r ifo I i um s ubt e r r an e um L.) .
Ausr. J. Agric. Res. 9:745-753.
26s
MORLEY, F.H.W. (1961) Subterranean clover. Adv. Agron.13: 57-123.
MORLEY, F.H.V/. (1966) The biology of grazing management. Proc. Aust. Soc.Anim. Prod. 6:127-136.
MORLEY, F.H.V/. (1968) Pasture growth curves and grazing management.Aust. J. Exp. Agric. Anim. Husb. 8: 40-45.
MORLEY, F.H.W. (1981) Management of grazing systems. In: GrazingAnimals(F.H.W. Morley, ed.), Elsevier Scientific Publ. Co., Amsterdam. pp.379-397.
MOTAZEDIAN,I. (1984) Effect of defoliation treatments on forage cluality, quantityand species composition of a Inlium perenne L.-Trifolium subterraneutn L.pasture. Diss. Abstr. Int.8.44:2966 p.
MOTAZEDIAN, I. and SFIARRO'W, S.H. (1987) Persistence of a Lolium perrene-T r iþ Ii um s ub t e r r aneur4? p asture under differin g defoli ation treatmen ts.
J. Range Manag. 40:232-236.
MUELLER, F. (1888) A key to the system of Victorian plants.Melb. Govt. Printer, Aust.
MUELLER. F. (1895) Select extra tropical plants, 19th ed) Melb. Govt. Printer, Aust.
OZFR, Z. (lg7g) The influence of passage through sheep on the seeds of meadowplants. Weed R¿s. 19: 241-254.
OBST, J.M. (1987) Gcattle. In: (J.LVy'heeler, C.J. Pearson and G.E. Robards, eds.) Australian WoolCorporation/CSlRO. pp. 477 -485.
PIGGIN, C.M. (1978) Dispersal of. Echium plantagineum L. by sheep.Weed Res. 18: 155-160.
PRIOUL, J.L. and SILSBURY, J.H. (1982) A physiological analysis of the effect ofsowing density on the growth rate of subterranean clover.Aust. J. Agríc. Res. 33: 213-222.
POV/ELL, V/.R. and MAPES, J.W. (1955) The recovery and viability of some rangeforage seeds passed through the digestive Eact of sheep and cattle. Temlrepoit for Range Management 199. Uni. Calif., Davis, USA.
QUIGLEY, P.E. (1988) The effects of cereal straw residues on germination, emergenceand productivity of annual medics. Ph. D. Thesis, Agron. Dept., WaiteAgric. Res. Inst., The Univeristy of Adelaide. 254 p.
QUIGLEY, P.E. and CARTER, E.D. (1989) The effects of straw mulch on
establishment of annual medics. Proc. 5th Aust. Agron. Conf. p- 588.
QUINLIVAN, B.J., DEVITT, A.C. and FRANCIS, C.M.(1973) Seeding rate, time ofsowing and fertilizers for subterranean clover seed production.Aust. J. Exp. Agric. Anim. Husb. 13: 681-684.
QUINLIVAN, B.J. and FRANCIS, C.M. (l9ll) The effect of burr burial on the seed
of sonre early maturing subterranean clover cultivars.Aust..l. Exp. Agric. Anim. Husb. 11: 35-38.
266
REED, K.F.M. (1987) Agronomic objectives for pasture t improvement. In:(J.L. Wheeler
C.J. Pea¡son and G.E. Robards, eds.) Australian Wool Corporation/CSIROpp.265-271.
REED, K.F.M., SCHRODER, P.M., EALES, J.\ry., MCDONALD, R.M. ANd CHIN,J.F. (1985) Compararive productivity of Triþlium subterraneum and T.
yoniiniru^in soith *estern Victoria. Aust. J. Exp. Agric. 25: 351-361.
REEVES, T.G. (1987) Pastures in cropping systems. In: Tempefale Pastures : their' production. use and managemen!, (J.L. Wheeler, C.J. Pearson,and G.E.Fouar¿s.ouar¿s, øÐ. Ausralian wool corporation/cslRo. pp. 501-515.
ROSIERIE, R.E. (1987) An evaluation of grazingintensity influences on Californiaannual range. J. Range Manag. 40: 160-165.
ROSSITER, R.C. (1959) The influence of m d and seed
production ii strains of Triþlium single plants
and in swards. Aust. J. Agric. R
ROSSITER, R.C. (1961) The influence of defoliation on the components of seed yieldin swards olsubterranean clovet (Triþlium subterraneum L.)'Aust. J. Agric. Res. 12:821-833.
ROSSITER, R.C. (1966) The success or failure of strains of Trifolium s-ubterraneum L.
in a mediterranean environment. Aust. J. Agric. Res. ll: 425-446.
ROSSITER, R.C. (1972) The effect of defoliation on flower production in. -subterranean
clover '(Trifolium
subterraneum L.). Aust. J. Agric. Res. 23: 427 - 435.
ROSSITER, R.C. (1976) The influence of defoliation on vegetative gro_wth in swards ofihree sìrains of subterranean clover. Aust. J. Agric. Res. 27: 191-206-
ROSSITER, R.C. (1978) The ecology of subterranean clover based pastures.in: Plant relations in pasiúres. (J.R. Wilson, ed.) CSIRO, Melb., Aust. pp.
325 - 339
ROSSITER, R.C. and COLLINS, W.J. (1980) Are some strains of subterranean clover(fryotium subterraneum)highly susceptible to low temperature stress ?
Aust. J. Exp. Agric. Anim. Husb. 20 197-201.
ROSSITER, R.C. and PACK, R.J. (1956) The effect of protection from grazing on the
botanical composition of annual-type subtelTanean clover pasture.
J. Aust. Inst. Agric. Sci. 22(L): ll - 73.
ROSSITER, R.C. and PACK, R.J. (1972) Effect of stocking rate and defoliation onrelative seed production in a mixture of two subterranean clover strains-J. Aust. Inst. Agríc. Sci. 38: 209 - 2Il.
ROSSITER, R.C. and PALMER, M.J. (1981) An analysis of seed yield in some strainsof subterranean clover (Trifotium subterraneum L.) when grown in binarymixtures. Aust. J. Agric. Res. 32: 445-452-
ROSSITER, R.C., TAYLOR, G.B. and ANDERSON, G.W. (1972) The performanceof subterranean, rose, and cupped clovers under set stocking.Aust. J. Exp. Agric. Anim. Husb- 12: 608-613.
267
SALISBURY, P. and HALLORAN, G. (1979a) The influence of the number of seecls
per burr on hardseededness in subterranean clover.Aust. Seed Sci. Newsletter. 5: 40.
SALISBURY, P. and HALLORAN, G. (1979b) Predetermination of the order ofhard seedednesss breakdown in subterranean clover.Aust. Seed Sci. Newsletter- 5:25.
SCOTT, V/.R. (1971) An agronomic evaluation of subterranean clover cultivars.Proc. N.Z. Grassld Assoc. 33: pp.134-140.
SFIARKEY, M.J., DAVIS, I.F. and KENNEY, P.A. (1964) The effect of rate ofÁtocking with sheep on the botanical composition of an annual_pasture insoutherã Victoria.^ Aust. J. Exp. Agric. Anim- Husb. 4:34-38.
SHEATH, G.W. and RATTRAY, P.V. (1935) Influence of pasture quantity and quality
on intake and prduction of sheep. Proc. XVth Int. Grassld Cong., Kyoto,Japan. pp. 1131-1133.
SILSBURY, J.H. and FUKAI, S. (1977) Effects of sowin J time and sowing density on
the growth of subterranean clover at Adelaide.Aust. J. Agric. Res. 28: 427-44O.
SIMAO NETO, M. and JONES, R.M. (1986) The effect of storage in cattle dung on
viability of tropical pasture seeds. Tropic. Grasslds .20: 132-150.
SIMAO NETO, M. and JONES, R.M. (1937) Recovery of pasture seed ingested byruminants. 2. Digestion of seed in sacco and in vito.Aust. J. Exp. Agric. 27:247-251.
SIMAO NETO, M., JONES, R.M.and RATCLIFF, D. (1987) Recovery of pastureseed ingested by ruminants. 1. Seed of six tropigal-pasture_ species fed tocattle, Jheep and goats. Aust. J. Exp. Agric. 27:239-246.
SIMPSON, R.J. and CULVENOR, R.A. (1987) Photosynthesis, carbon partitioningandherbage yield. Inmanasement. (J.L. Wheeler, C.J. Pearson and .E. Robards, eds),Australian Wool Corporation/CSlRO. pp. 103- 1 1 8.
SMITH, R.C.G., BIDDISCOMBE, E.F. and STERN, W.R. (1972) Evaluation of fivemediterranean annual pasture species during early growthAust. J. Agric. Res. 23 103-716.
SMITH, R.C.G., BIDDISCOMBE,E.F. and STERN, W.R. (1973) Eflecl of spelling. newÍy sown pasrure. Aust. J. Exp. Agric. Anim. Husb. 13: 549-555.
SPAFFORD, W. J. (1924) Value of subterranean clover as a fodder crop.Dept. Agric. S. Aøsr. BUII. l&L:1 - 15.
SPEDDING, C.R. (1971) Grassland Ecology. Claredon Press, Oxford. 221p.
SQUIRES, V.R. (1978) Subterranean clover residues and the nutrition of sheep insummer. Aust. Soc. Anim. Prod. 12:2I2.
STERN, V/.R. (1960) The light factor in grass and clover swards. Ph.D. Thesis, The
University of Adelaide. 384 p.
268
STERN, W.R. (1965) The effect of density on the performance of individual plants insubterranean clover swa¡ds. Aust. J. Agric. Res- 16:541 - 555.
STERN, W.R. (1984) Environment foragesystems in Australia. In:pioduction. Proc.TrilateralWorkshop, Palmerston North, N. Z. pp' 101.
srERN, W.R., GLADSTONES, J.S., FRANCIS, C.M., COLLINS, Vy'.J., CHATEL'D.L., NICHOLAS, D.A., GILLESPIE, D.J., WOLFE, 8.C., SOUTHWOOD, O.R.,BEALE, P.E. and CURNOW, B.C. (1981) Subterranean clover improvement: an
Australian proglam. Proc. XIV Int. Grassld Cong., Lexington, Kentucky,USA. pp. 116 - 118.
STUTH, J.W., BROWN, J.R., OLSON, P.D. and ARAUJO, M.R. (1985) Influenceof stocking rate on the plant animal interface in rotational grazed mixed
swards. Proc. XVth Int. Grassld' Cong., Kyoto, Japan. pp. 1148-1150.
SUCKLING, F.E.T. (1950) The passage of white clover seeds through the body ofsheep and the effect on germination capacity.Proc. N.Z. Grassld Assoc. 12: pp.108-121.
SUCKLING, F.E.T. (1952) Dissemination of white clover (Triþlium repens) by sheep.
N. Z. I. Sc. Tech. 33: 64-77.
SIMPSON, R.J. and CULVENOR, R.A. (1987) Photosysthesis, carbon partitioningandherbage yield. In:management. (J.L. V/heeler , C.J. Pearson and .E. Robards, eds)Australian Wool Corporation/CSlRO. pp. 1 03-1 18
SYMON, D.E. (1961) A bibliography of subterranean clover together with a descriptiveintroduction. Mime. Publ. no. I/1961 C.A.B. publ I22 p'
TAYLOR, 4.O., HUGHES, K.A. and HUNT, B.J. (1979) Annual cool-seasonlegumes for forage. II. Seasonal growth patterns and effects of cuttingfrequency and cutting height on yield. N.Z. J. Exp. Agric- 7: 149-152.
TAYLOR, G.B. (1984) Effect of burial on the softening of hard seeds of subterraneanclover. Aust. J. Agric. R¿s. 35: 20I - 210.
TAYLOR, G.B. (1935) Effect of tillage practices on the fate of hard seeds ofsubteranean clover in a ley farming system.Aust. J. Exp. Agric. 25: 568-573.
TAYLOR, G.B. and EWING, M.A. (19SS) Effect of depth of burial on the longevity ofhard seeds of subterranean clover and annual medics.Aust. J. Exp. Agric. 28:77-8I.
TAYLOR, G.B. and ROSSITER, R.C. (1967) Seed production and persistence ofCarnamah and other early strains of Triþlium subterraneum in the wheat-beltof Western Australia. Ãust. J. Exp. Agric. Anim. Husb. 7:25-32.
TAYLOR, G.B. and ROSSITER, R.C. (1974) Persistence of several annual legumes irrmixtures under continuous grazing in the south west of Western Australia.Aust. J. Exp. Agric. Anim. Husb. 14: 632-639.
TAYLOR, G.8., ROSSITER, R.C. and PALMER, M.J. (1984) Long term patterns ofseed softening and seedling establishment fronr single seed 9r9q9.of .
subterrane¿rn clover. AusI. J . Exp. Agric. Anim. H usb. 24: 200-212.
269
TAYLOR, J.A. (1935) The animal factor in pasture studies. Proc. XV Int. GrassldCong., Kyoto, Japan. pp. 114O-1142.
TENNANT, D. (1965) The differential rate of seed development in Dwalganup andGeraldton varieties of subterranean clover.Aust. J. Exp. Agric. Anim. Husb. 5:46-48.
THOMSON, E.F., RIHAWI, S. and COCKS, P.S. (1987) The survival of medic seed
ingested by sheep. ICARDA - Annunl Report - Pasture,forage and lívestockprogram. pp. 135-141.
VERCOE, J.E. and PEARCE, G.R. (1960) Digestibility of Medicago rribuloides (barrelmedic) pods. ,/. Aust.Inst. Agric. Sci. 26:67-lO.
WALTON, G.H. (I97 5) Responses of burr burial in subterranean clover (Triþliumsubteruaneum L.) to defoliation.Aust. J. Exp. Agric. Anim. Husb. 15:69-73.
WATKIN, B.R. and CLEMENTS, R.J. (1978) The effects of grazing animals onpastures. In: Plant relations in pastures. (J.R. Wilson, ed.) CSIRO, Melb.,Aust. pp. 273 - 289.
WESTOBY, M. and HOWELL, J. (1982) Self-thinninginTriþlium su.bterranewnpopulations fiansferred between full daytight and shade.J. Ecol. 70: 615 - 62I.
WIIALLEY, R.D.B. (1980) The management of Australian pastures.Proc. Aust. Agron. Conf., Qld., Aust. pp. 1-14.
WILLIAMS, C.M.J. (1978) Studies of herbage availability and plant density in relationto animal performance. Ph D. Thesis, Dept. of Agronomy, Waite Agric.Res. Instit., The University of Adelaide. 270 p.
WILLOUGHBY, W.M. (1959) Limitations to animal production imposed by seasonalfluctuations in pasture and by management procedures.Aust. J. Agric. R¿s. 10: 248-261 .
WILLOUGHBY, W.M. (1968) Implications of stocking rate experiments.Proc. Aust. Grassld. Conf., Perth, W. Aust. 2: 165 - 168.
WILSON, A.D. and HINDLEY, N.L. (1968) The value of the seed, pods and dry topsof subterranean clover (Trifolium subterraneum) in the summer nutrition ofsheep. Aust. J. Exp. Agric. Anim. Husb. 8: 168-171.
WITSCHI, P.A. and MICFIALK, D.L. (L979) The effect of sheep treading and grazingon pastue and soil characteristics of irrigated annual pastures.Aust. J. Agric. R¿s. 30: 741-750.
V/OLFIE, E.C. (1981) Subterranean clover and annual medics - Boundaries and comnìongtound. Proc. Medic Workshop, Warburton, Vic'
V/OLFE, E.C. (1982) Annual Report l98l/I982. Agric. Res. Inst. Wagga Wagga.
YAMADA, T. and KAWAGUCHI, T. (1972) Dissemination of pasture plants bylivestock. 2. Recovery, viability and emergence of some pasture plant seeds
passed through the digestive tract of dairy cows.J. Jap. Soc. Grassld Sci. 18: 8-15.

270
YATES, J.J. (1957) Seed setting in subterranean clover (Trifolium subterraneum L)l. The importance of the micro-environment.Aust. J. Agric. Res. 8: 433 - 443.
YATES, J.J. (1958) Seed-setting in subterranean clover (Trifolium subterraneum L.)2. Strain-environment interactions in sirrgle plants,Aust. J. Agríc. Res. 9:754-766.
YATES, J.J. (1961) Seed-setting in subterranean clover (Trífolíum subterraneum L.)3. The effect of plant density. Aust. J. Agric. Res. L2: 10-26.