The Doha Development Round and Africa: Partial and General Equilibrium Analyses of Tariff Preference...
17
The Doha Development Round and Africa: Partial and General Equilibrium Analyses of Tariff Preference Erosion Mohamed Hedi Bchir Stephen N. Karingi Andrew Mold Patrick N. Osakwe Mustapha Sadni Jallab Invited paper prepared for presentation at the International Association of Agricultural Economists Conference, Gold Coast, Australia, August 12-18, 2006 Copyright 2006 by Mohamed Hedi Bchir, Stephen N. Karingi, Andrew Mold, Patrick N. Osakwe, and Mustapha Sadni Jallab. All rights reserved. Readers may make verbatim copies of this document for non-commercial purposes by any means, provided that this copyright notice appears on all such copies.
-
Upload
independent -
Category
Documents
-
view
0 -
download
0
Transcript of The Doha Development Round and Africa: Partial and General Equilibrium Analyses of Tariff Preference...
The Doha Development Round and Africa: Partial
and General Equilibrium Analyses of Tariff Preference Erosion
Mohamed Hedi Bchir Stephen N. Karingi
Andrew Mold Patrick N. Osakwe
Mustapha Sadni Jallab
Invited paper prepared for presentation at the International Association of Agricultural Economists Conference,
Gold Coast, Australia, August 12-18, 2006
Copyright 2006 by Mohamed Hedi Bchir, Stephen N. Karingi, Andrew Mold, Patrick N. Osakwe, and Mustapha Sadni Jallab. All rights reserved. Readers may make verbatim copies of this document for non-commercial purposes by any means, provided that this
copyright notice appears on all such copies.
The Doha Development Round and Africa: Partial and General Equilibrium Analyses of Tariff Preference Erosion
Mohamed Hedi Bchir, Stephen N. Karingi, Andrew Mold, Patrick N. Osakwe, Mustapha Sadni Jallab1
Trade and Regional Integration Division UN Economic Commission for Africa
P. O. Box 3005, Addis Ababa Ethiopia
Preliminary version
Abstract: Erosion of trade preferences currently being enjoyed by LDCs and some developing countries remain an important area in the on-going trade negotiations. The different positions regarding the preference erosion question besides being informed by political economy considerations are also founded on empirical results of this particular question. But does the methodology used for the empirical analysis matter? In this paper, the importance of preference erosion question due to MFN liberalisation on agriculture is analyzed. Drawing from the potential complementary strengths in triangulation, the paper uses both partial and general equilibrium analyses. The paper shows that the ranking of preference erosion as an issue of policy concern is influenced by the empirical methodology adopted. However, irrespective of the rank, the paper concludes that preference erosion is an important issue not only in terms of welfare, but also as it has impacts on incomes for preference receiving countries.
1 The authors are staff member of the Trade and Regional Integration Division of the UNECA. This paper should be attributed to the authors. It is not meant to represent the position or opinions of the United Nations or its Members, nor the official position of any UN staff member. Corresponding author: Mustapha Sadni Jallab, Trade and Regional Integration Division, United Nations Economic Commission for Africa, P.O. Box 3005, Addis Ababa, Ethiopia, Phone: 251-115-44-52-12; Fax: 251-115-51-30-38, e-mail: [email protected].
1
I. Introduction The market access question has remained one of the critical areas in the multilateral trade
talks. This is a question that has not only been relevant to the trade in agricultural goods but
also, the trade in industrial goods, especially with respect to the role latter can play in the
diversification of African countries’ economies. However, the liberalisation of agricultural
trade in the on-going Doha Round negotiations has attained something akin to the pole
position. This prominence is not in any way by accident but is a reflection of the significance
liberalising market access for agricultural exports from developing countries, especially
African countries is. Enhancement of market access in agricultural trade, particularly in the
developed countries’ markets is supposed to bolster exports and economic activity in
developing countries.
This liberalisation however is expected to favour countries whose exports are currently
impeded by multilateral protection through tariffs and non-tariff measures. At the same time,
the liberalisation is expected to be a challenge to the Least Developed Countries (LDCs) and
some developing countries, especially those from Africa, that currently enjoy preferential
market access through different schemes set up by the developed countries. Therefore, for
Africa, a key issue has been whether MFN liberalisation under the Doha Round will
adversely affect their market access to developed countries, through erosion of the
preference margins that they currently enjoy. The question of preference erosion has almost
attained a deal-breaker status in the current negotiations. For the African countries,
preference erosion from any multilateral liberalisation needs to be treated not just as a
market access issue, but a development issue.
The link of the preferences to the development dimensions of the trade negotiations has been
a key factor in the incorporation of the preference erosion question to the aid-for-trade
discussions. Yet for the non-preference receiving developing countries, especially those from
Latin America and some parts of Asia, either the preferences are extended to them, or they
will not support any agreement that continue to provide asymmetrical preferences. They are
a market access issue from their point of view and there is no justification whatsoever for
their continuation as development support to the LDCs and some of the developing countries
especially those from Africa. Even as the developing countries from Africa and Latin
America continue to take different positions on the treatment of preferences in the
2
negotiations, for the developed countries, compensation for preference erosion can only be
contemplated if the magnitude of this erosion is appropriately measured.
As discussed in Section II of this paper, several studies have been carried out, using different
methodologies to address the question of preferences in different contexts, ranging from
their relevance to the implication of multilateral liberalisation to the existing schemes. In
deed, in the context of the on-going negotiations, two key questions have come out clearly.
First, do preferences matter to those countries receiving them? And second, what is the
magnitude of preference erosion that is likely to result from global trade liberalisation? The
answers to these two questions have been addressed in several studies. Yet, review of
existing literature presents no single study that sought to answer the two questions, while at
the same time using different methodologies. That the political significance of the preference
erosion question is dictated upon by the methodology used is not in doubt. Thus, it would be
useful using the triangulation framework to address the question of preferences in a unified
way in order to seek consensus and consistency in the conclusions and recommendations
with regard to the preference erosion question. And that is the task that this paper has set
upon itself, to use the triangulation framework to see whether a consistent result on the
relevance of the preference erosion question can be obtained.
In the paper, we provide an evaluation of the current trade preferences granted to African
countries and of their potential erosion due to MFN liberalisation on agriculture. Drawing
from the potential complementary strengths in triangulation, the paper uses both partial and
general equilibrium analyses. The paper shows the importance of taking account of
preferences in trade liberalisation scenarios using the two methodologies. In particular, it
aims to assess the effects of Doha Round MFN liberalisation on trade flows and
macroeconomic variables. The focus of the paper on agriculture trade liberalisation does not
mean that preference erosion is not important for the industrial goods trade, but is more
informed by the availability of a well-tested partial equilibrium model that is used for
agriculture trade policy analysis.
The paper is organized as follows. Section II provides a summary of the studies that have
been carried out on the preference erosion question in the context of trade liberalisation. That
all the studies have used one particular methodology to answer this question comes out
clearly in this review. Section III briefly describes the modeling frameworks and
3
methodologies employed in order to capture the triangulation element of the study. In
particular, two different general equilibrium models are highlighted to compare the results
obtained from the two models, before comparing them with the partial equilibrium model. In
Section IV, the aggregation of the database and the scenarios are described. In order to be
able to apportion the differences in the results to the modeling frameworks, it was important
that the regional and sectoral aggregations for the general equilibrium models are similar.
Section V discusses the results of the simulations while Section VI concludes.
II. Literature review
In the empirical literature, there are several ways in which preferential schemes have been
evaluated. Some papers provide purely descriptive measures of the effectiveness of
preferences, based on utility and utilisation rates (e.g. UNCTAD, 2003), others are based on
econometric techniques which attempt to analyse their impact on trade volumes and
aggregate welfare. For example, Romalis (2003) reports a growth dividend over a period of
fifteen years of 10 percent for the average African country resulting due to preferential
market access.2 Haveman and Shatz (2003) estimate an expansion of LDC export volumes
by as much as US$7.6 billion if duty-free access is granted simultaneously by the EU, Japan
and the United States. Cline (2004) also reports a substantial increase in export volumes due
to the Lome/Cotonou Agreements, but pointedly his SSA dummy is negative, implying that
the SSA countries have not taken advantage of preferential access in the same way as other
beneficiary countries. Other things being equal, preferential regime membership has boosted
real export growth by 7.2 percent annually for Caribbean Basin Initiative (CBI) countries
and 8.8 percent for Lomé countries. But he also suggests that the model confirms the poor
performance of SSA (despite preferential market access), and indicates that “an SSA country
typically had a 10.7 percent lower real export annually than would otherwise be expected”
(Cline, 2004:97).
Simulation techniques have also been employed to examine the impact of multilateral trade
reforms on preference-receiving countries. Some of these studies adopt a partial equilibrium
approach while others are based on a general equilibrium framework. For example, IMF
(2003) used a partial equilibrium model to examine the impact of a 40 per cent cut in tariffs 2 These results should however be treated with some caution. Romalis’s model could be criticized on the grounds that it is under-specified, using as it does only a measure of the value of preferences and a variable representing the structural characteristics of exports to explain GDP growth.
4
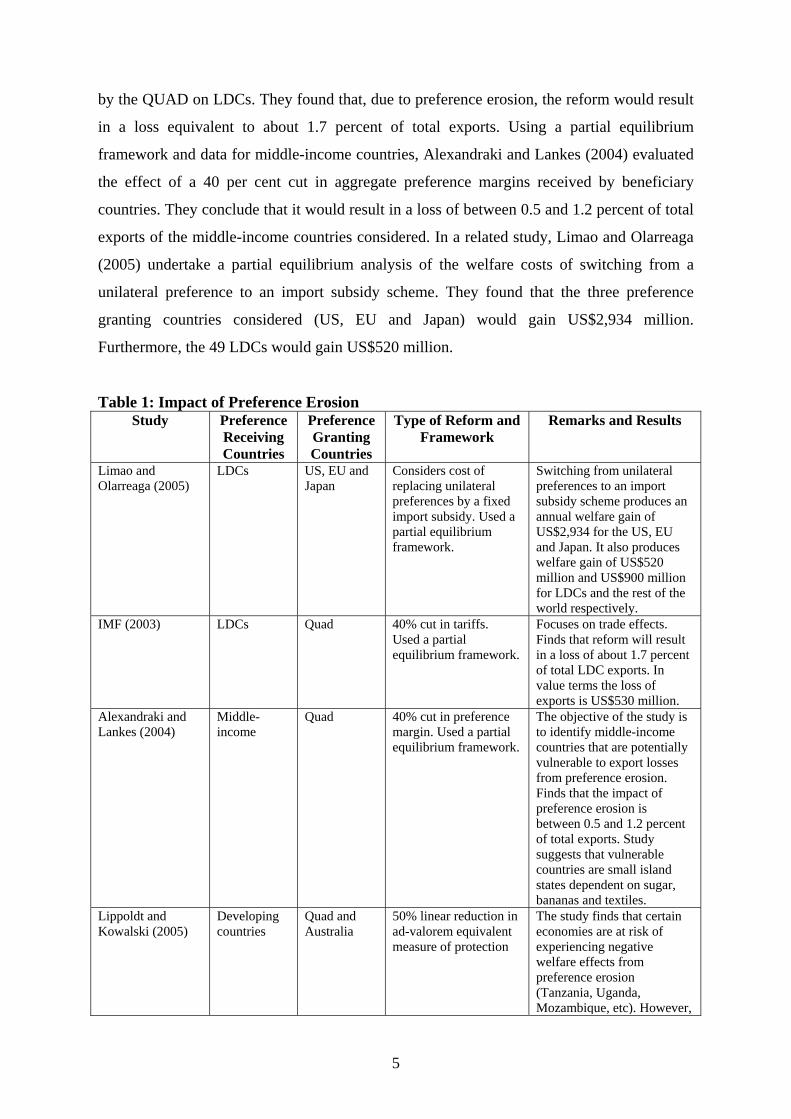
by the QUAD on LDCs. They found that, due to preference erosion, the reform would result
in a loss equivalent to about 1.7 percent of total exports. Using a partial equilibrium
framework and data for middle-income countries, Alexandraki and Lankes (2004) evaluated
the effect of a 40 per cent cut in aggregate preference margins received by beneficiary
countries. They conclude that it would result in a loss of between 0.5 and 1.2 percent of total
exports of the middle-income countries considered. In a related study, Limao and Olarreaga
(2005) undertake a partial equilibrium analysis of the welfare costs of switching from a
unilateral preference to an import subsidy scheme. They found that the three preference
granting countries considered (US, EU and Japan) would gain US$2,934 million.
Furthermore, the 49 LDCs would gain US$520 million.
Table 1: Impact of Preference Erosion Study Preference
Receiving Countries
Preference Granting Countries
Type of Reform and Framework
Remarks and Results
Limao and Olarreaga (2005)
LDCs US, EU and Japan
Considers cost of replacing unilateral preferences by a fixed import subsidy. Used a partial equilibrium framework.
Switching from unilateral preferences to an import subsidy scheme produces an annual welfare gain of US$2,934 for the US, EU and Japan. It also produces welfare gain of US$520 million and US$900 million for LDCs and the rest of the world respectively.
IMF (2003) LDCs Quad 40% cut in tariffs. Used a partial equilibrium framework.
Focuses on trade effects. Finds that reform will result in a loss of about 1.7 percent of total LDC exports. In value terms the loss of exports is US$530 million.
Alexandraki and Lankes (2004)
Middle-income
Quad 40% cut in preference margin. Used a partial equilibrium framework.
The objective of the study is to identify middle-income countries that are potentially vulnerable to export losses from preference erosion. Finds that the impact of preference erosion is between 0.5 and 1.2 percent of total exports. Study suggests that vulnerable countries are small island states dependent on sugar, bananas and textiles.
Lippoldt and Kowalski (2005)
Developing countries
Quad and Australia
50% linear reduction in ad-valorem equivalent measure of protection
The study finds that certain economies are at risk of experiencing negative welfare effects from preference erosion (Tanzania, Uganda, Mozambique, etc). However,
5

the impact tends to be relatively modest. For example, for African countries the change in per capita welfare is less than 0.3%.
Francois, Hoekman and Manchin (2005)
African LDCs
EU and OECD
Full MFN liberalization. Used a general equilibrium framework.
Finds that the real income loss to African LDCs from liberalization by the EU is US$458 million. For liberalization by the OECD the figure is US$110 million.
General equilibrium studies into the costs of preference erosion per se are relatively few and
far between (for a recent review of these, see Hoekman, Martin and Primo Braga, 2006),
essentially because until quite recently preferential margins were not included in the GTAP
database as well as other key databases used for analyses of the impact of global trade
reform. That said, in recent years several authors have provided estimates of the welfare
effect of multilateral trade liberalization resulting from preference erosion using CGE
models. For example, Francois, Hoekman and Manchin (2005) examined the scope for
preference erosion resulting from full elimination of European Union (EU) and OECD
tariffs. Their results suggest that trade liberalization by the EU would lead to income losses
of around $460 million for African LDCs.3 They argue that if preference erosion is viewed in
the broader context of potential tariff reduction by all OECD, not just EU members, the
magnitude of the total losses is reduced to $110 million. They explain that this is in part
because the EU has been the most aggressive in using preferences as a tool for development
assistance. Thus the gains associated with non-EU MFN tariff reductions could partially
offset losses due to the erosion of EU preferences. In a related study, Lippoldt and Kowalski
(2005) examined the welfare consequences of preference erosion resulting from a 50 percent
linear cut in the ad-valorem equivalent measure of protection. They show that such
multilateral trade reform would lead to modest welfare losses for some non-OECD countries,
most of which are in Sub-Saharan Africa.
3 Francois, Hoekman and Manchin also recalculate the effects of preference erosion taking into account the costs of compliance (due to rules of origin and other administrative costs), estimated at around 4 percent of the value of the goods traded. This reduces the value of preferences, and implies losses of only $342 million, instead of $460 million, as per the baseline unadjusted estimate.
6
A key finding of the results from CGE models is that the estimated welfare effects associated
with preference erosion is relatively small. This is due in part to the fact that CGE models
assume that domestic goods are differentiated from imported goods and so are imperfect
substitutes. This assumption, which follows from Armington (1969), implies that exporters
of goods receiving preferences will not face stiff competition as a result of liberalization and
so reduces the potential welfare losses that could arise from preference erosion.
III. Modelling Framework and Methodology
To examine the consequences of agricultural trade liberalization for African economies, we
use three well-known models of trade policy analyses that take account of trade preferences:
the Global Trade Analysis Project (GTAP) model; the MIRAGE model; and the Agricultural
Trade Policy Simulation Model (ATPSM). The first two are computable general equilibrium
models while the third is a partial equilibrium methodology and so it would be interesting to
compare and contrast the results from these different but complementary models.
The GTAP model was developed by the Center for Global Trade Analysis at Purdue
University in the United States. The standard GTAP model used in our analysis and its key
features are described in Hertel (1997). It is a static multi-country and multi-sector general
equilibrium model which assumes perfect competition as well as full employment of factors.
Since we are focusing on the role of preferences, we use version 6 of the model, which
includes trade preferences. The MIRAGE model was developed by CEPII and has been
widely used to analyse agricultural and multilateral trade issues. For a full description of the
standard MIRAGE model see Bchir, Decreux, Guérin and Jean (2002). To make the
results of the MIRAGE model as comparable as possible to those of GTAP, we use a static
version of the MIRAGE model that also assumes perfect competition as well as full
employment of factors of production. The ATPSM is a deterministic, static, partial
equilibrium model developed by UNCTAD and FAO. It is multi-country, multi-commodity,
model that takes account of the distribution of quota rents as well as differences between
bound and applied tariffs. A full description of the model can be found in Vanzetti and
Graham (2002).
IV. Aggregation and Scenarios
Since the focus of our study is Africa and agricultural trade liberalization, the 87 GTAP
regions in version 6 of the database were aggregated into nine regions namely, Sub-Saharan
7

Africa (SSA), North Africa, USA, EU25, Japan, Rest of the World Developed (ROWD),
China, India, and Rest of the Developing World (ROW). The composition of these groups
and their mapping to the GTAP 6 sectors are presented in Table 2.
Table 2: Regional Aggregation Group GTAP Region USA United States EU25 Austria, Belgium, Denmark, Finland, France,
Germany, United Kingdom, Greece, Ireland, Italy, Luxembourg, Netherlands, Portugal, Spain, Sweden, Cyprus, Czech Republic, Hungary, Malta, Poland, Slovakia, Slovenia, Estonia, Latvia, Lithuania
Japan Japan Rest of the World Developed (ROWD) Australia, New Zealand, Canada North Africa Tunisia, Morocco, Rest of North Africa
Sub-Saharan Africa (SSA) South Africa, Botswana, Malawi, Mozambique,
Tanzania, Zambia, Zimbabwe, Rest of SADC, Rest of
South African Customs Union, Madagascar, Uganda,
Rest of Sub Saharan Africa.
China China India India Rest of the Developing World (ROW) Rest of Oceania, Hong Kong, Korea, Taiwan, Rest of
East Asia, Singapore, Vietnam, Rest of Southeast Asia, Bangladesh, Sri Lanka, Rest of South Asia, Mexico, Rest of North America, Colombia, Peru, Venezuela, Rest of Andean Pact, Rest of FTAA, Rest of Europe, Albania, Bulgaria, Croatia, Romania, Russian Federation, Rest of Former Soviet Union, Turkey, Rest of Middle East, Indonesia, Malaysia, Philippines, Thailand, Argentina, Brazil, Chile, Uruguay, Rest of South America, Central America.
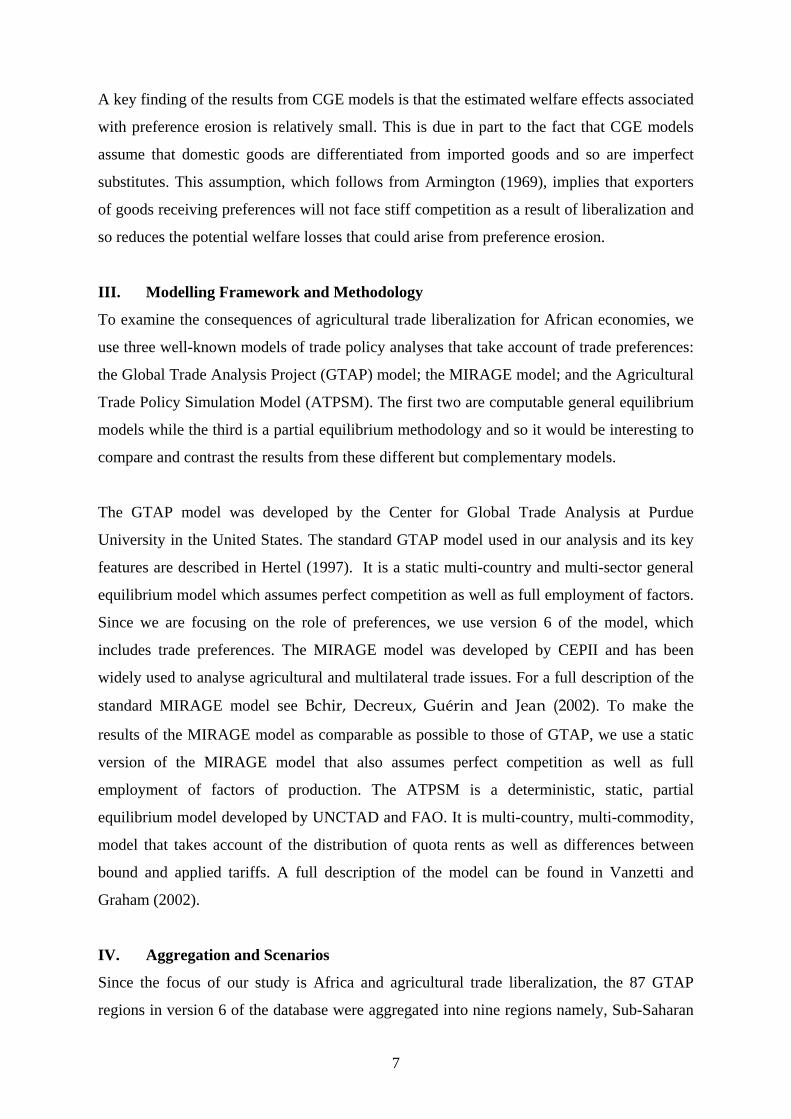
Turning to the sectors, the 57 GTAP sectors in version 6 were aggregated into 18 sectors in
our analysis. Eleven of the eighteen sectors deal with agricultural goods. This sectoral
aggregation allows us to focus on the commodities and sectors of interest to African
countries in the negotiations. Table 3 contains the exact composition of the sectors used in
our analysis as well as their relation to the GTAP 6 regions and sectors.
Table 3: Sectoral aggregation
Sector GTAP Category Cereals Paddy rice, wheat, cereal grains nec, crops nec
Veg_fruit Vegetables, fruits, nuts
Oil_seeds Oil seeds
Sugar Sugar cane, sugar beet, sugar
8
Cot_bev Plant-based fibers, beverages and tobacco products
Meat Cattle, sheep, goats, horses, animal products nec
Dairy Raw milk, dairy products
Wol Wool, silk-worm cocoons
Frs Forestry
Fsh Fishing
Res_nat Coal, oil, gas, minerals nec
Agro_ind Vegetable oils and fat, processed rice, food products nec
Tex_vet Textiles, wearing apparel
Heavy Industry Motor vehicles and parts, transport equipment nec, electronic equipment, machinery and equipment nec.
Medium Industry Petroleum, coal products; Chemical,rubber,plastic prods; Mineral products nec; Ferrous metals; Metals nec; Metal products; Manufactures nec.
Light Industry Leather products; Wood products; Paper products, publishing.
Services Electricity; gas manufacture, distribution; water; construction; communication; financial services nec; insurance; business services nec; recreation and other services; pubAdmin/defence/health/educat; dwellings.
Transport Trade; transport nec; sea transport; air transport.
As indicated earlier, the focus of our study is on agricultural trade liberalization. However,
within this sector, we also focus on the market access pillar. This means that the
liberalization experiments performed will not involve the domestic support and export
competition pillars of the agricultural negotiations. In the simulations, we consider three
trade policy scenarios. Scenario 0 is the full liberalization scenario in which all tariff barriers
to agricultural trade for all products and all regions are eliminated. Although this scenario is
a good benchmark for comparison of the results of the different models, it is not a realistic
scenario, because it is unlikely to happen in the current Doha Round negotiations.
Consequently, we also consider two scenarios designed to reflect the range of proposals that
are being considered in the modalities phase of the Doha negotiations. Scenario 1 involves
deep cuts for developed countries and minor cuts for developing countries. It is a version of
the proposal contained in the “draft possible modalities for agriculture” issued by the Chair
of the Committee on Agriculture (Special Session) on 22 June 2006. It is interesting because
it involves aggressive cuts in trade barriers by developed countries but contains elements for
Special and Differential Treatment for developing countries. Scenario 2 is basically the G20
proposal and is less ambitious than the cuts in scenarios 0 and 1. More details on the
scenarios are provided below.
9
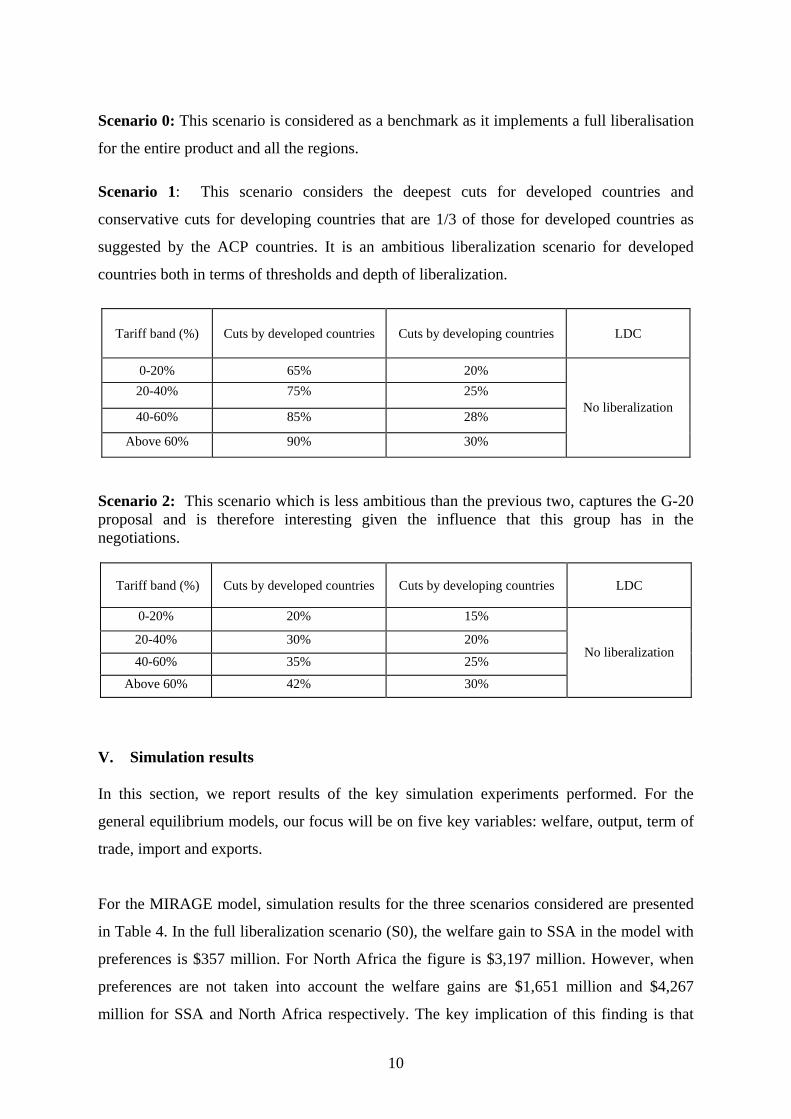
Scenario 0: This scenario is considered as a benchmark as it implements a full liberalisation
for the entire product and all the regions.
Scenario 1: This scenario considers the deepest cuts for developed countries and
conservative cuts for developing countries that are 1/3 of those for developed countries as
suggested by the ACP countries. It is an ambitious liberalization scenario for developed
countries both in terms of thresholds and depth of liberalization.
Tariff band (%) Cuts by developed countries Cuts by developing countries LDC
0-20% 65% 20% 20-40% 75% 25%
40-60% 85% 28%
Above 60% 90% 30%
No liberalization
Scenario 2: This scenario which is less ambitious than the previous two, captures the G-20 proposal and is therefore interesting given the influence that this group has in the negotiations.
Tariff band (%) Cuts by developed countries Cuts by developing countries LDC
0-20% 20% 15%
20-40% 30% 20%
40-60% 35% 25%
Above 60% 42% 30%
No liberalization
V. Simulation results In this section, we report results of the key simulation experiments performed. For the
general equilibrium models, our focus will be on five key variables: welfare, output, term of
trade, import and exports.
For the MIRAGE model, simulation results for the three scenarios considered are presented
in Table 4. In the full liberalization scenario (S0), the welfare gain to SSA in the model with
preferences is $357 million. For North Africa the figure is $3,197 million. However, when
preferences are not taken into account the welfare gains are $1,651 million and $4,267
million for SSA and North Africa respectively. The key implication of this finding is that
10
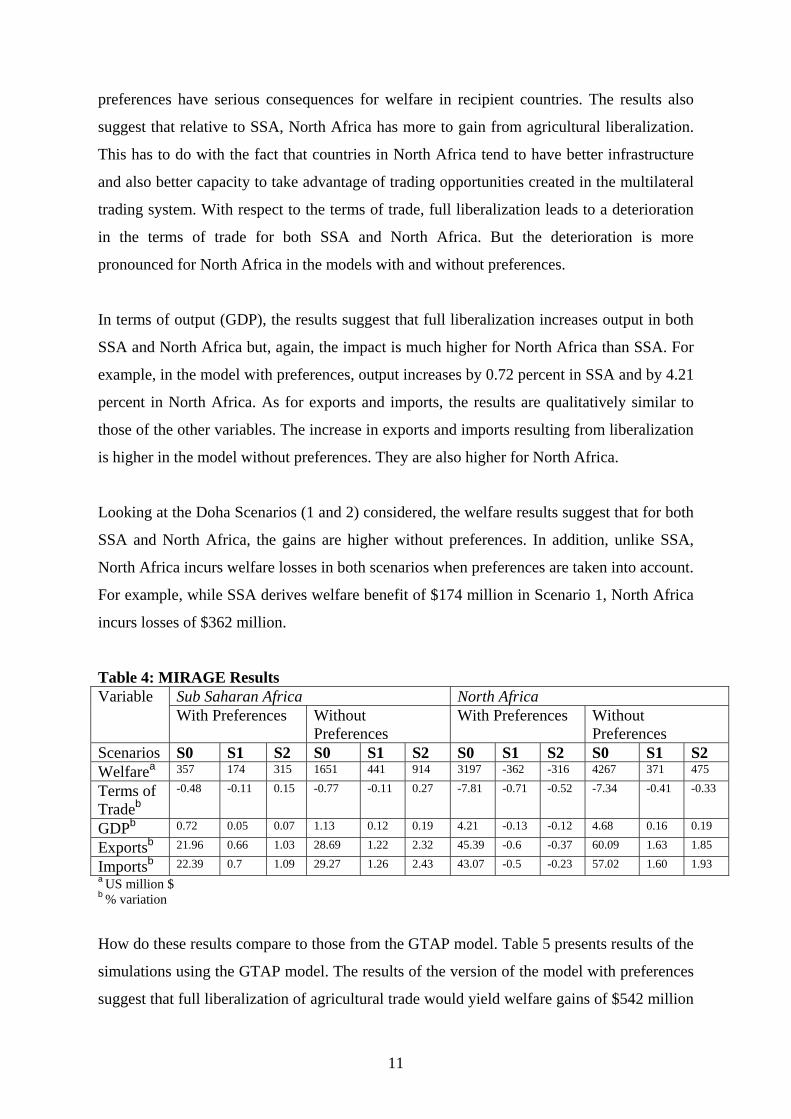
preferences have serious consequences for welfare in recipient countries. The results also
suggest that relative to SSA, North Africa has more to gain from agricultural liberalization.
This has to do with the fact that countries in North Africa tend to have better infrastructure
and also better capacity to take advantage of trading opportunities created in the multilateral
trading system. With respect to the terms of trade, full liberalization leads to a deterioration
in the terms of trade for both SSA and North Africa. But the deterioration is more
pronounced for North Africa in the models with and without preferences.
In terms of output (GDP), the results suggest that full liberalization increases output in both
SSA and North Africa but, again, the impact is much higher for North Africa than SSA. For
example, in the model with preferences, output increases by 0.72 percent in SSA and by 4.21
percent in North Africa. As for exports and imports, the results are qualitatively similar to
those of the other variables. The increase in exports and imports resulting from liberalization
is higher in the model without preferences. They are also higher for North Africa.
Looking at the Doha Scenarios (1 and 2) considered, the welfare results suggest that for both
SSA and North Africa, the gains are higher without preferences. In addition, unlike SSA,
North Africa incurs welfare losses in both scenarios when preferences are taken into account.
For example, while SSA derives welfare benefit of $174 million in Scenario 1, North Africa
incurs losses of $362 million.
Table 4: MIRAGE Results Sub Saharan Africa North Africa Variable With Preferences Without
Preferences With Preferences Without
Preferences Scenarios S0 S1 S2 S0 S1 S2 S0 S1 S2 S0 S1 S2 Welfarea 357 174 315 1651 441 914 3197 -362 -316 4267 371 475
Terms of Tradeb
-0.48 -0.11 0.15 -0.77 -0.11 0.27 -7.81 -0.71 -0.52 -7.34 -0.41 -0.33
GDPb 0.72 0.05 0.07 1.13 0.12 0.19 4.21 -0.13 -0.12 4.68 0.16 0.19
Exportsb 21.96 0.66 1.03 28.69 1.22 2.32 45.39 -0.6 -0.37 60.09 1.63 1.85
Importsb 22.39 0.7 1.09 29.27 1.26 2.43 43.07 -0.5 -0.23 57.02 1.60 1.93 a US million $ b % variation
How do these results compare to those from the GTAP model. Table 5 presents results of the
simulations using the GTAP model. The results of the version of the model with preferences
suggest that full liberalization of agricultural trade would yield welfare gains of $542 million
11
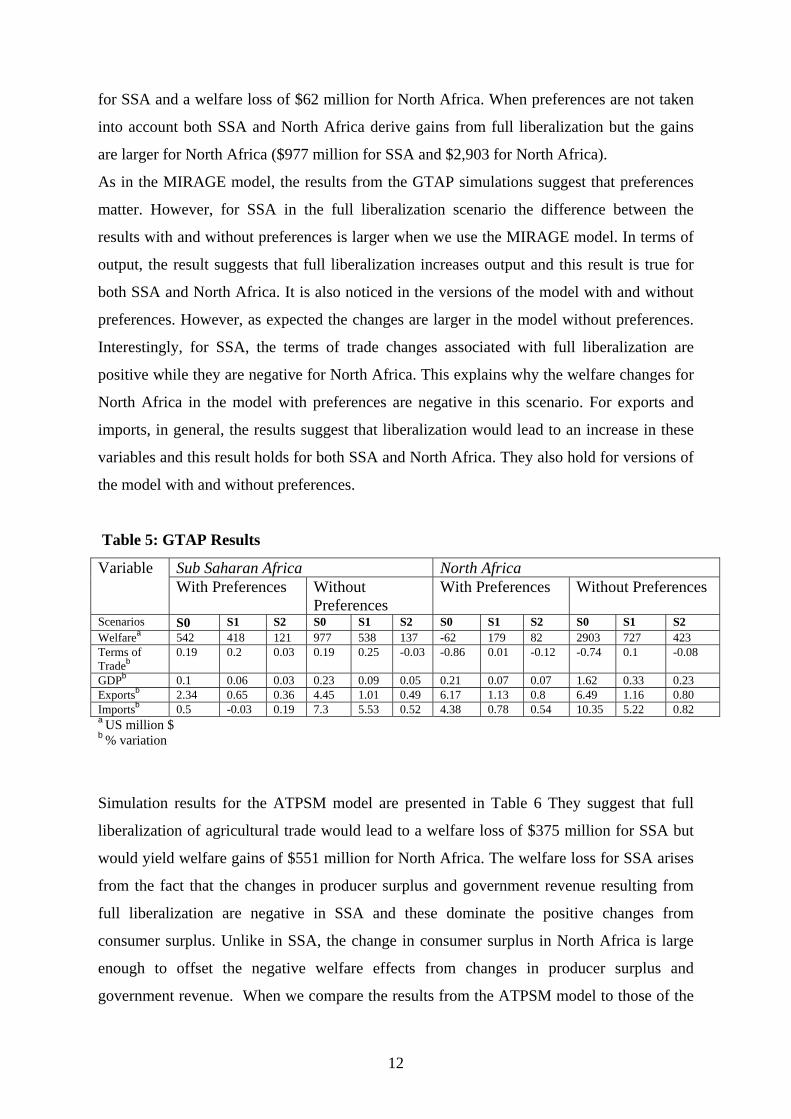
for SSA and a welfare loss of $62 million for North Africa. When preferences are not taken
into account both SSA and North Africa derive gains from full liberalization but the gains
are larger for North Africa ($977 million for SSA and $2,903 for North Africa).
As in the MIRAGE model, the results from the GTAP simulations suggest that preferences
matter. However, for SSA in the full liberalization scenario the difference between the
results with and without preferences is larger when we use the MIRAGE model. In terms of
output, the result suggests that full liberalization increases output and this result is true for
both SSA and North Africa. It is also noticed in the versions of the model with and without
preferences. However, as expected the changes are larger in the model without preferences.
Interestingly, for SSA, the terms of trade changes associated with full liberalization are
positive while they are negative for North Africa. This explains why the welfare changes for
North Africa in the model with preferences are negative in this scenario. For exports and
imports, in general, the results suggest that liberalization would lead to an increase in these
variables and this result holds for both SSA and North Africa. They also hold for versions of
the model with and without preferences.
Table 5: GTAP Results
Sub Saharan Africa North Africa Variable With Preferences Without
Preferences With Preferences Without Preferences
Scenarios S0 S1 S2 S0 S1 S2 S0 S1 S2 S0 S1 S2 Welfarea 542 418 121 977 538 137 -62 179 82 2903 727 423 Terms of Tradeb
0.19 0.2 0.03 0.19 0.25 -0.03 -0.86 0.01 -0.12 -0.74 0.1 -0.08
GDPb 0.1 0.06 0.03 0.23 0.09 0.05 0.21 0.07 0.07 1.62 0.33 0.23 Exportsb 2.34 0.65 0.36 4.45 1.01 0.49 6.17 1.13 0.8 6.49 1.16 0.80 Importsb 0.5 -0.03 0.19 7.3 5.53 0.52 4.38 0.78 0.54 10.35 5.22 0.82 a US million $ b % variation
Simulation results for the ATPSM model are presented in Table 6 They suggest that full
liberalization of agricultural trade would lead to a welfare loss of $375 million for SSA but
would yield welfare gains of $551 million for North Africa. The welfare loss for SSA arises
from the fact that the changes in producer surplus and government revenue resulting from
full liberalization are negative in SSA and these dominate the positive changes from
consumer surplus. Unlike in SSA, the change in consumer surplus in North Africa is large
enough to offset the negative welfare effects from changes in producer surplus and
government revenue. When we compare the results from the ATPSM model to those of the
12
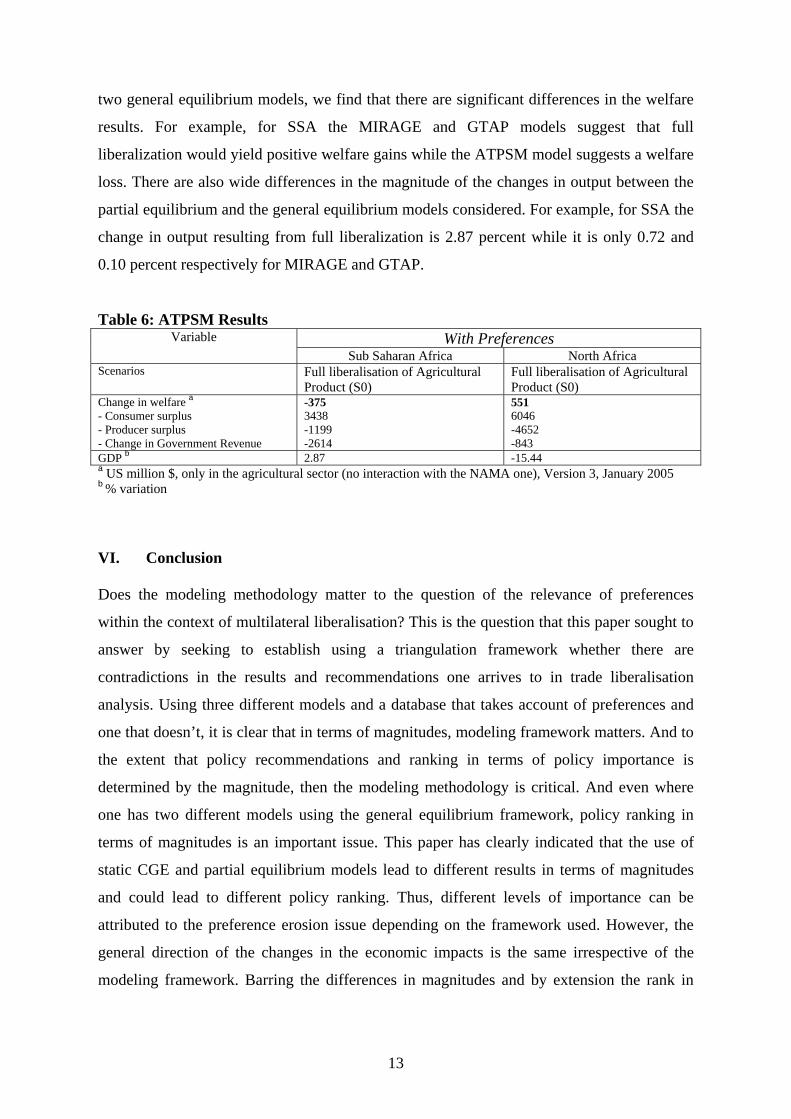
two general equilibrium models, we find that there are significant differences in the welfare
results. For example, for SSA the MIRAGE and GTAP models suggest that full
liberalization would yield positive welfare gains while the ATPSM model suggests a welfare
loss. There are also wide differences in the magnitude of the changes in output between the
partial equilibrium and the general equilibrium models considered. For example, for SSA the
change in output resulting from full liberalization is 2.87 percent while it is only 0.72 and
0.10 percent respectively for MIRAGE and GTAP.
Table 6: ATPSM Results With Preferences Variable
Sub Saharan Africa North Africa Scenarios Full liberalisation of Agricultural
Product (S0) Full liberalisation of Agricultural Product (S0)
Change in welfare a - Consumer surplus - Producer surplus - Change in Government Revenue
-375 3438 -1199 -2614
551 6046 -4652 -843
GDP b 2.87 -15.44 a US million $, only in the agricultural sector (no interaction with the NAMA one), Version 3, January 2005 b % variation VI. Conclusion Does the modeling methodology matter to the question of the relevance of preferences
within the context of multilateral liberalisation? This is the question that this paper sought to
answer by seeking to establish using a triangulation framework whether there are
contradictions in the results and recommendations one arrives to in trade liberalisation
analysis. Using three different models and a database that takes account of preferences and
one that doesn’t, it is clear that in terms of magnitudes, modeling framework matters. And to
the extent that policy recommendations and ranking in terms of policy importance is
determined by the magnitude, then the modeling methodology is critical. And even where
one has two different models using the general equilibrium framework, policy ranking in
terms of magnitudes is an important issue. This paper has clearly indicated that the use of
static CGE and partial equilibrium models lead to different results in terms of magnitudes
and could lead to different policy ranking. Thus, different levels of importance can be
attributed to the preference erosion issue depending on the framework used. However, the
general direction of the changes in the economic impacts is the same irrespective of the
modeling framework. Barring the differences in magnitudes and by extension the rank in
13
terms of importance in the negotiations, it is clearly evident that preferences matter for sub-
Saharan Africa.
14

References
Armington, P. (1969). A theory of demand for products distinguished by place of production. IMF Staff papers 16, pp. 179-201.
Bchir M., Decreux, Y., Guerin, J., and Jean, S. (2002). ‘MIRAGE, un modèle d’équilibre
général calculable pour l’évaluation des politiques commerciales. Economie Internationale 89-90, pp 109-153.
Cline, William (2004), ‘Trade Policy and Global Poverty’, Institute of International Economics,
Washington D.C.
Francois, Joseph, Bernard Hoekman and Miriam Manchin (2005), “Preference Erosion and
Multilateral Trade Liberalisation”, World Bank Research Working Paper 3730, October
Hertel, T. (1997). Global Trade Analysis: Modeling and Applications. Cambridge: Cambridge
University Press.
Hoekman, Bernard, Will Matrin and Primo Braga (2006), “Preference Erosion: The Terms of
the Debate”, in Richard Newfarmer’s book.
International Monetary Fund (2003), ‘Financing of Losses from Preference Erosion, Notes on
Issues raised by Developing Countries in the Doha Round.” Communication to the WTO
from the IMF, WT/TF/COH/14. 14 February.
Limao, Nuno and Marcelo Orreaga (2005), Trade Preferences to small countries and the welfare
costs of lost multilateral liberalisation”, World Bank Policy Research Working Paper 3565
Lippoldt, D., and Kowalski, P. (2005). Trade preference erosion: expanded assessment. OECD Trade Policy Working Paper 20.
Romalis, John (2003), “Would Rich Country Trade Preferences Help Poor Countries Grow?
Evidence from the Generalized System of Preferences”, mimeo
Vanzetti, D., and Graham, B. (2002). Simulating Agricultural Policy Reform with ATPSM.
Paper presented at the Fourth Annual Conference of the European Study Group, September.
15
UNCTAD (2003), “Trade Preferences for LDCs: An Early Assessment of Benefits and Possible
Improvements”, Geneva and New York
16