The Poverty Impacts of the Doha Round and the Role of Tax ...
40
The Poverty Impacts of the Doha Round and the Role of Tax Policy: A Case Study for Cameroon Christian Arnault Emini* John Cockburn** Bernard Decaluwé** March 17 th , 2005 * CEREG (University of Yaoundé II, Cameroon) and CIRPEE (Université Laval, Quebec). ** CIRPEE (Université Laval, Québec, Canada)
-
Upload
khangminh22 -
Category
Documents
-
view
0 -
download
0
Transcript of The Poverty Impacts of the Doha Round and the Role of Tax ...

The Poverty Impacts of the Doha Round and the Role of Tax Policy: A Case Study for Cameroon
Christian Arnault Emini* John Cockburn**
Bernard Decaluwé**
March 17th, 2005
* CEREG (University of Yaoundé II, Cameroon) and CIRPEE (Université Laval, Quebec). ** CIRPEE (Université Laval, Québec, Canada)

2
ABSTRACT We use a CGE microsimulation model to assess the poverty impacts for Cameroon of
the Doha round, as well as more ambitious world and domestic trade liberalization, paying particular attention to the choice of replacement tax. Doha Agreements remove roughly 43,000 people from poverty in Cameroon. More ambitious world trade liberalization brings down the number of poor by 308,000 individuals. However, Cameroon’s own liberalization has strong adverse impacts, increasing the number of poor by over a million. Combined world and domestic liberalization thus increases poverty, especially when lost tariff revenues are compensated by a consumption tax rather than a VAT.
SUMMARY
The aim of this paper is to assess the possible impacts of the Doha round of
negotiations on poverty in Cameroon. During the recent period of economic recovery, Cameroon has enjoyed a sharp decline in poverty with the headcount index falling from 53.3 percent of inhabitants in 1996 to 40.2 percent in 2001, mostly thanks to economic growth rather than redistribution. Will the current trade negotiations under the Doha Round reinforce or curb this trend? We apply a CGE microsimulation model which involves 10,992 households in order to respond. The Doha Round is found to be poverty reducing for Cameroon. For the whole country, the estimate of net number of people who get out of poverty is 42,000 following this scenario. Further investigations indicate that more ambitious world trade liberalization tends to alleviate poverty and lessen income inequalities at national level, while Cameroon’s domestic trade liberalization has adverse poverty and inequality impacts. If ROW and Cameroon trade liberalizations are combined, the adverse impacts of own liberalization far offset the favorable outcomes of the ROW liberalization. The cuts in Cameroon’s tariffs in the Doha scenarios are very small (the average tariff rate moves from 11.79 percent in the base run to merely 11.66 percent) so that ROW liberalization effects on world prices more than offset the adverse own liberalization effects in this scenario. Our results suggest furthermore that the choice of tax replacement instrument can have important bias in poverty impacts: poverty gets even worse in our country-case study when using a consumption tax to compensate lost tariff revenue (936,000 rise in the number of poor) instead of the VAT (665,000 new poor in net terms). This may be due to the “imperfect” status of the Cameroon’s VAT, which is progressive. Finally, beyond the Doha scenarios which are the focus of this study, the poverty worsening impacts of own-liberalization depicted here raise an alarm for Cameroon. In particular, they suggest that accompanying measures should be considered in order to avoid poverty increases in the framework of Economic Partnership Agreements currently in negotiation between ACP countries and the EU, which propose a drastic dismantlement of the ACP tariffs by January 1st 2008 at the latest.
1
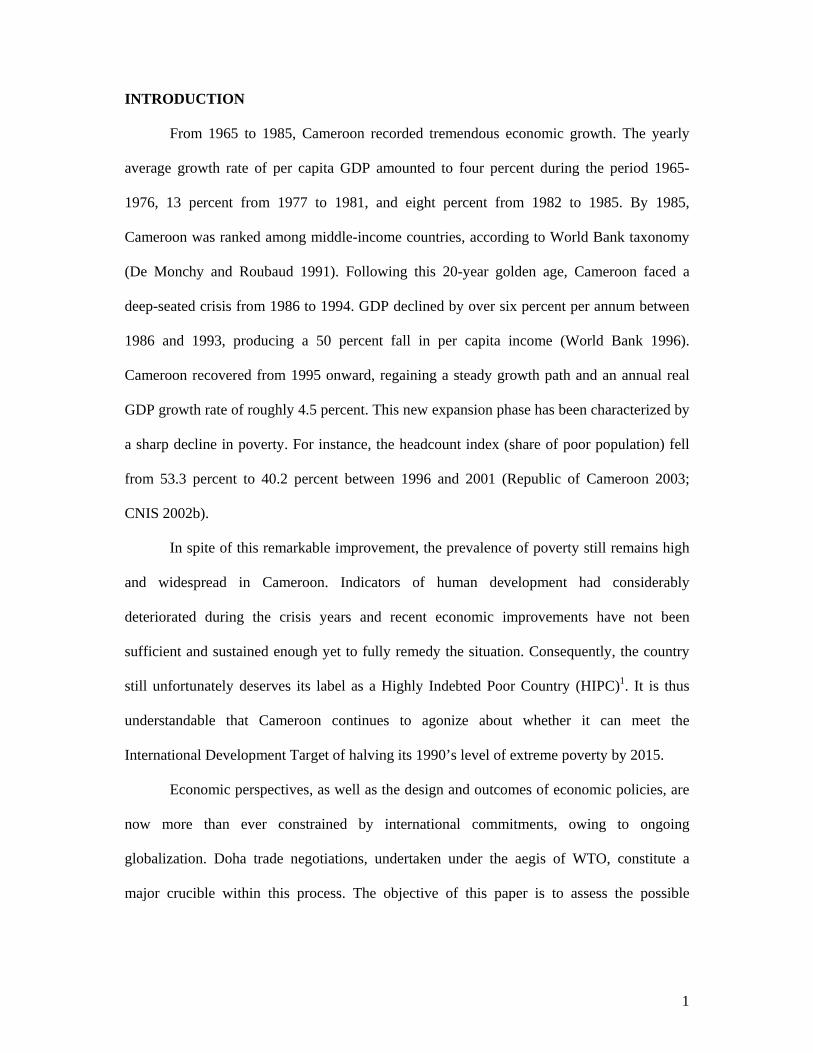
INTRODUCTION
From 1965 to 1985, Cameroon recorded tremendous economic growth. The yearly
average growth rate of per capita GDP amounted to four percent during the period 1965-
1976, 13 percent from 1977 to 1981, and eight percent from 1982 to 1985. By 1985,
Cameroon was ranked among middle-income countries, according to World Bank taxonomy
(De Monchy and Roubaud 1991). Following this 20-year golden age, Cameroon faced a
deep-seated crisis from 1986 to 1994. GDP declined by over six percent per annum between
1986 and 1993, producing a 50 percent fall in per capita income (World Bank 1996).
Cameroon recovered from 1995 onward, regaining a steady growth path and an annual real
GDP growth rate of roughly 4.5 percent. This new expansion phase has been characterized by
a sharp decline in poverty. For instance, the headcount index (share of poor population) fell
from 53.3 percent to 40.2 percent between 1996 and 2001 (Republic of Cameroon 2003;
CNIS 2002b).
In spite of this remarkable improvement, the prevalence of poverty still remains high
and widespread in Cameroon. Indicators of human development had considerably
deteriorated during the crisis years and recent economic improvements have not been
sufficient and sustained enough yet to fully remedy the situation. Consequently, the country
still unfortunately deserves its label as a Highly Indebted Poor Country (HIPC)1. It is thus
understandable that Cameroon continues to agonize about whether it can meet the
International Development Target of halving its 1990’s level of extreme poverty by 2015.
Economic perspectives, as well as the design and outcomes of economic policies, are
now more than ever constrained by international commitments, owing to ongoing
globalization. Doha trade negotiations, undertaken under the aegis of WTO, constitute a
major crucible within this process. The objective of this paper is to assess the possible

2
poverty impacts in Cameroon of the Doha round of trade negotiations as well as more
ambitious world and domestic trade liberalization.
Trade liberalization can affect income opportunities of the poor in a number of ways.
In general, the final poverty incidence depends on the relationship between trade
liberalization, growth and income distribution.2 This new round has been heralded since the
beginning as the Doha Development Round with WTO Ministerial Meeting promises that the
Doha Round should provide major opportunities for developing countries to derive more
benefits from trade. However, exposure to increased international competition can be a
double-edged sword for developing countries. The contribution of Doha Round in achieving
Cameroon’s target on poverty alleviation will depend on the specific details of the new trade
agreement.
To achieve our objective, we use a computable general equilibrium (CGE)
microsimulation model. The remainder of the paper includes six sections. In section two, we
present some background on trade and poverty in Cameroon. Section three is devoted to
modeling specificities and data. We then analyze in section four the poverty impacts of
various trade liberalization scenarios using a uniform consumption tax as the replacement
mechanism to offset losses in tariff revenues. In section five, we compare these impacts when
using a value-added tax (VAT) as the replacement mechanism, instead of a consumption tax.
The sixth section is devoted to the analysis of actual Doha scenario outcomes. Finally, we
make some concluding remarks in section seven.
POVERTY AND TRADE BACKGROUND
Poverty trends during the period 1996-2001
Cameroon undertook two household surveys during the last decade, respectively in
1996 and 2001. From the results of these surveys, it arises that between 1996 and 2001,

3
Cameroon has recorded a drastic fall in poverty prevalence. The headcount index (FGT0), i.e.
the proportion of people that are counted as poor, decreased by 13.1 percentage points; from
53.3 percent in 1996 to 40.2 percent in 2001. The poverty gap (FGT1), which measures the
degree to which the poor fall below the poverty line on average, also declined from 19.1 to
14.1 percent during this period. The squared poverty gap (FGT2), which evaluates the extent
of severe poverty among the poor, also shows improvement, declining from 9 to 7 percent.
A breakdown of poverty indicators shows that this sharp poverty alleviation is largely
attributable to economic growth, rather than redistribution (Republic of Cameroon 2003).
Economic growth contributed about 90 percent of the reduction in the headcount index,
supporting the view that “growth is good for the poor”, as underlined in studies such as
Dollar and Kraay (2000). Indeed, income distribution is found to have actually increased the
poverty gap and squared poverty gap, suggesting that redistribution is required to better
alleviate poverty.
The decrease in all three poverty measures was more substantial in urban areas than in
rural Cameroon, further increasing the divergence in poverty between these two areas.
Indeed, the difference between the percentage of poor in rural and in urban areas has risen
from 18.2 points in 1996 to 27.8 points in 2001. With regard to the poverty gap, this
difference has gone from 6.8 to 12 points. Similarly, the squared poverty gap has gone from
being 3.2 higher in rural areas in 1996 to 6.6 points higher in 2001.
Needless to say, poverty does not affect people and regions evenly throughout the
country. In 2001, the more one moved from the Atlantic coast and southern Cameroon
towards the interior and the north, the larger the share of people living below the poverty line.
This trend emerges clearly when one considers a poverty map of Cameroon (map 1).

4
Trends in Cameroon’s Trade
Cameroon’s trade has grown considerably during the three last decades. In domestic
currency, imports and exports have increased at average annual rates of 5.49 percent and 6.53
percent, respectively, between 1983 and 2003.3 This expansion is greatest after 1994, i.e. in
the post-devaluation4 and new economic recovery era. In fact, Cameroon’s external trade
actually declined during the 1986-1993 economic crisis, with imports and exports falling by
an average of 9.7 and 6.0 percent per year, respectively. But the economic recovery
beginning in 1994 has been characterized by a significant resurgence of external trade,
beyond the devaluation’s immediate mechanical effect.
Imports have grown faster than exports during this post-devaluation period. From
1995 to 2003, the current value of imports have increased by a factor of three with a 13.2
percent annual average growth rate, while the current value of exports has increased by a
factor of only 1.7 with an average growth rate of 7.0 percent per annum during the same
period. This has resulted in a continuous fall in rate of coverage of imports by exports5 from
164 percent in 1995 to 104 percent in 2003, with a low of 95 percent in 2001. Indeed, 2001
and 2002 are the only year for which Cameroon has recorded a trade deficit since 1988.
However, the net-of-oil trade balance has been in deficit continuously since 1997,
reflecting the country’s dependency on oil exports. Cameroon has produced crude oil since
1977 and, from 1980 on, crude oil has generally accounted for 40 percent to 60 percent of
Cameroon’s export revenues. The rapid decline in oil prices in 1985 and 1986 is generally
identified as the source of Cameroon's economic crisis.
Cameroon's lack of export diversification is illustrated by the fact that its five
principal exports account for 74 to 81 percent of total export revenue over the last five years.
All these products are either agricultural (broad-bean cocoa, and raw cotton) or natural
resource-based (crude oil, wood processing, and refined petrol).6 The top five imports in 2003

5
were hydrocarbons, machinery, chemicals, transport equipment, and flour. During the last
five years, the top five product clusters have accounted for 65 to 68 percent of the total value
of imports.
The European Union (EU) is by far the most important trading partner of Cameroon.
In 2003, 64.5 percent of Cameroon’s exports and 54.6 percent of Cameroon’s imports were
exchanged with the EU.7 The EU is followed by Africa (13.6 percent of exports and 22.5
percent of imports), Asia (10.3 percent of exports and 15.6 percent of imports), North
America (7.6 percent of exports and 5.5 percent of imports) and Latin America (1.4 percent
of exports and 2.1 percent of imports).
MODELING FEATURES AND DATA
Our CGE microsimulation model involves 10,992 households, as compiled from the
“ECAM II” household survey undertaken in Cameroon in 2001 (CNIS 2002a; 2002b; 2003).
Other data were processed from the Cameroon’s 2001 Supply and Use Tables (SUT) of
Cameroon, and from the underlying Integrated Economic Account Tables (IEAT).
The general architecture of the CGE is based on the “EXTER” archetype model
(Decaluwé, Martens, and Savard 2001; Fofana, Cockburn, and Decaluwé 2003).
Microsimulations are carried out following Cockburn (2001) and Cloutier and Cockburn
(2002). The way the VAT is modeled is based on Emini (2000a; 2000b).
The model includes ten production sectors, each utilizing a nested production
technology. Primary factors of production are combined according to a constant Elasticity of
Substitution (CES) functions to constitute value and added, which in turn combines with
intermediate consumptions through Leontief functions. There are two agricultural sectors:
foodstuff and cash crop agriculture. Both utilize four primary factors of production:
agricultural unskilled labor, agricultural skilled labor, agricultural capital, and land. The eight

6
other sectors are non agricultural and use three kinds of primary factors: nonagricultural
unskilled labor, nonagricultural skilled labor, and nonagricultural capital. Capital is sector-
specific and fixed. Agricultural labor, skilled and unskilled, is mobile between agricultural
sectors, just as nonagricultural labor is mobile between nonagricultural sectors, excluding the
oil and public sectors where all factors are fixed.
A summary of key parameters and shares for the model in the baseline year of 2001 is
provided in Table 1. Services, industry and agriculture represent 47.5, 31.9 and 20.6 percent,
respectively, of national value added. But the greatest share of national production goes to
industry (44.5 percent), followed closely by services (40.0 percent) and, far behind,
agriculture (15.5 percent).
The impacts of trade liberalization crucially depend on sectoral import and export
shares and ratios. Foodstuff (18.2 percent of national value added and 13.2 percent of overall
production) are almost entirely non tradable (0.8 percent of exports and 1.1 percent of
imports). Exports are 79.5 percent industrial, 12.7 percent services and 7.9 percent
agricultural goods. Nearly 70 percent of these exports are composed of agricultural and
natural resource-based industrial goods: crude oil (43.6 percent of total exports), wood
processing (11.9 percent), cash crops (7.1 percent), and refined petroleum (5.8 percent).
These sectors are, indeed, substantially export-oriented with export-orientation ratios (exports
as a share of output) of 98.5 percent for crude oil, 43.0 percent for cash crops, 37.1 percent
for wood processing, and 28.5 percent for refined petroleum. Cameroon's imports are
predominantly composed of industrial goods (84.7 percent of imports). The highest import-
penetration ratio (imports as a share of total domestic demand of a good) is recorded for
crude oil (95.0 percent), followed by other manufacturing goods (29.1 percent), food
processing (12.3 percent), and refined petroleum (10.7 percent).

7
We use this model first to examine various world and free trade scenarios. In the
subsequent section, we compare alternative tax mechanisms the government can adopt to
compensate for losses in tariff revenues. Finally, we examine the likely impacts of a
successful conclusion to the Doha Round.
WORLD AND DOMESTIC FREE-TRADE SIMULATIONS
Three scenarios are performed in this section and involve the complete elimination of
import tariffs: in the rest of the World (ROW), in Cameroon, and in both. According to
results from the GTAP world model (table 6), a complete liberalization in ROW would lead
to a non negligible increase in world import prices, especially for foodstuff agriculture (7.31
percent) and food processing (4.79 percent), as well as an increase in export prices of
foodstuff agriculture (3.39 percent), cash crops (1.73 percent) and of food processing (1.49
percent). On the other hand, unilateral liberalization by Cameroon means a 100 percent
reduction in domestic tariffs from an average tariff rate of 11.79 percent and a maximum rate
of 28 percent and 23 percent respectively for the wood processing and food processing
industries. Finally, the full liberalization scenario, where ROW and Cameroon both eliminate
their respective barriers to trade, simultaneously involves an increase in world import and
export prices and a complete removal of domestic tariffs. Depending on the sector and the
initial level of tariffs, this tariff removal can completely offset the increase in world import
prices. The macroeconomic closure of the model for these scenarios is similar to the one used
in the other country studies in this book for comparison. Employment, real investment, real
public expenses and the trade balance are fixed. To compensate lost tariff revenue, we
introduce a household consumption tax.

8
Macro effects
We observe (table 2) dramatically opposing price effects in the ROW free-trade
scenario compared to Cameroon’s own-liberalization. While prices uniformly increase under
ROW free-trade as a result of increases in world import and export prices, they fall
substantially with domestic liberalization. The movement in domestic prices for imports and
exports is also substantially different. In the ROW liberalization scenario, the increase in
import prices (0.68 percent) is less important than the increase in export prices (0.76 percent).
When Cameroon liberalizes alone, import prices drop substantially (-11.61 percent), while
export prices drop much less (-2.28 percent). When we combine both scenarios, impacts of
Cameroon own-liberalization dominate ROW impacts. Indeed, the real exchange rate
depreciation (9.02 percent) is nearly equal to the own-liberalization scenario (9.51 percent).
In contrast, increases in both import and export prices under ROW free trade leads to a small
real appreciation of the exchange rate (0.42 percent).
Concerning effects on trade and production, Cameroon and ROW liberalization also
have opposing impacts. Under ROW liberalization, changes in world prices have nearly no
impact on aggregate imports, exports and locally-sold production. On the contrary,
Cameroon’s unilateral liberalization creates a substantial increase in imports (13.74 percent)
and exports (14.10 percent) and consequently a reduction in local production exchanged on
the domestic market (-1.26 percent). In the combined scenario, once more, the expansion of
trade is nearly identical to the situation under Cameroon own-liberalization (13.91 percent for
imports and 14.11 percent for exports).
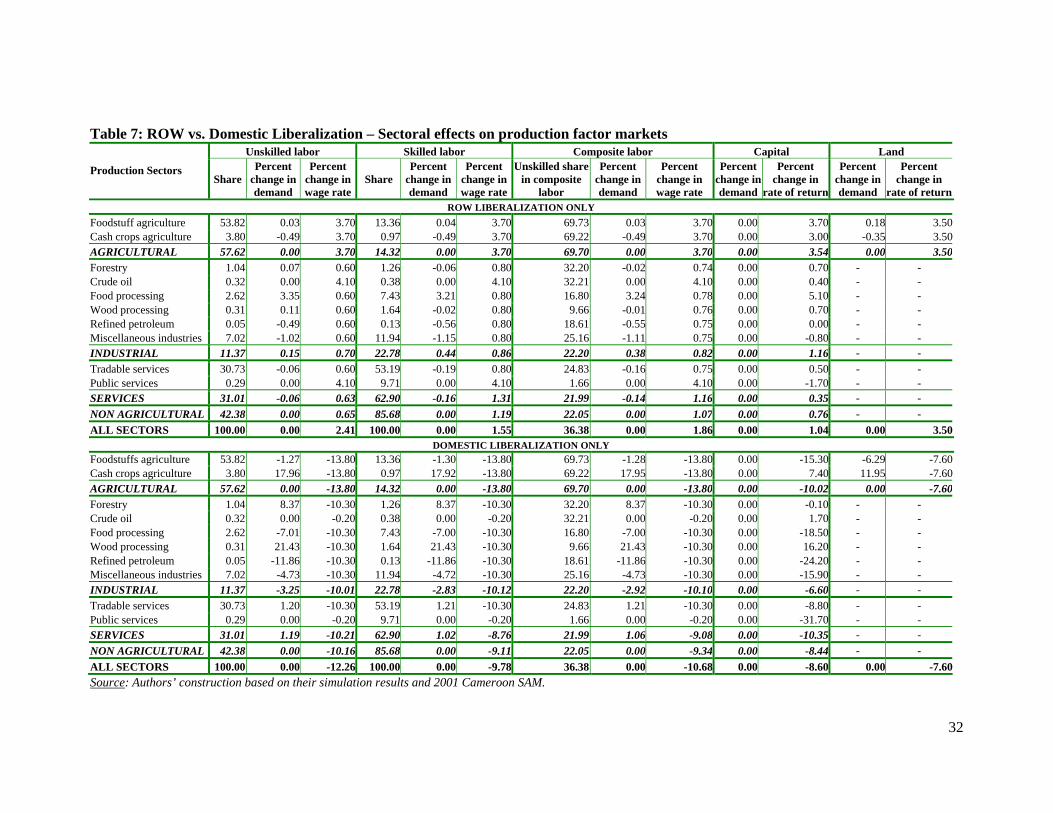
Sectoral effects, the labor market and reallocation of resources
In order to understand the transmission mechanisms, we need to look carefully at the
sectoral factor reallocation processes in each scenario. Table 6 provides a breakdown of the

9
price and volume effects for the ten sectors of activities, whereas Table 7 presents the impacts
on factor markets.
Row liberalization scenario
Even with very low import-penetration and export-intensity ratios in foodstuff
agriculture (Table 1), a strong increase in world prices leads to a fall in foodstuff imports
(15.55 percent) and an increase in their exports (1.03 percent) and producer prices (2.98
percent), as domestic and foreign foodstuffs are considered to be good substitutes (Table 6)8.
Foodstuff production is very intensive in labor9 and particularly in unskilled agricultural
workers (69 percent of labor; Table 1). Indeed, markets for skilled and unskilled agricultural
workers are dominated by the foodstuff sector (nearly 93 percent of agricultural workers;
Table 7). Thus, the increase in domestic foodstuff prices pushes up unskilled and skilled
agricultural wages (3.70 percent each), as well as the returns to land.
In turn, the increase in the cost of agricultural labor and land drives costs and,
consequently, producer prices (2.15 percent) in the cash crop sector (Table 6). The increase in
the world export price of cash crops (1.73 percent) is not sufficient to cover the extra costs10
and thus cash crop exports fall (0.66 percent). As the cash crop market is export oriented, a
reduction in exports (combined with an increase in import competition) negatively affect this
sector, reducing domestic production by 0.26 percent and moderating the domestic price
increase (1.93 percent). As a result, land and agricultural labor move toward the foodstuff
sector, whereas the returns to immobile capital increase more in this sector.
In the non-agricultural sectors, the GTAP model predicts an increase in the world
import price of (agricultural-based) food processing (4.79 percent) and a much less important
increase on the export side (1.49 percent). In the other sectors the change in prices are less
than one percent. The food processing sector represents 11 percent of total output, 25 percent

10
of the industrial sector and is linked to the international market with an export-intensity rate
of 7 percent and import-penetration ratio of 12 percent (Table 1). Domestic and imported
processed foods are considered to be close substitutes (elasticity of 6.49).
Under these conditions, the increase in world prices creates upward pressure on
producer and consumer prices in the food processing sector (2.33 percent and 2.63 percent
respectively) and a rise in domestic production (1.17 percent), the only nonagricultural sector
in expansion. The cost-based contractionary impact on the other nonagricultural sectors is
very small but widespread, between zero in the forestry and wood processing industries to a
maximum fall of 0.54 percent in miscellaneous industries. As a result, there is a reallocation
of labor toward the food processing sector. Given the lower than average share of unskilled
(vs. skilled) labor in food processing, there is a bigger increase in non-agricultural skilled
wage rates (0.80 percent) relative to unskilled wage rates (0.60 percent).
In terms of international trade, the increase in world import prices for processed food
reduces import demand (9.79 percent) and increases domestic demand for local production
(1.37 percent). On the export side, the food processing industry is unable to increase its
export performance (-1.60 percent) since the increase in world export prices for food
processing (1.49 percent) is not high enough to compensate the increase in production costs
(2.33 percent). In the other non-agricultural sectors, imports and exports generally increase
moderately, with the strongest impacts in "miscellaneous industries" for which world export
prices increase by almost one percent.
Cameroon unilateral liberalization scenario
The industrial sector is the most protected sector in Cameroon. Initial tariffs in the
wood processing, food processing, refined petroleum and miscellaneous industries are,
respectively, 28.1, 23.8, 18.3 and 14.6 percent (Table 6). A complete removal of customs

11
barriers results in a reduction in the domestic prices of these imports and an increase in their
volume11. The food processing and miscellaneous industries are most affected by this
increased import competition given their high initial import penetration ratios and degree of
substitution with respect to imports (Table 1). Consequently, domestic demand, consumer
prices and producer prices for these industries all decline more than in the other industrial
sectors (Table 6). Industrial producers respond to falling domestic prices by expanding
exports, especially in the food processing and miscellaneous industries. However, this export
expansion is insufficient to offset the loss in local sales, such that output declines in all but
the export intensive wood processing industry and its main source of inputs, the forestry
industry.
On the agriculture side, initial tariffs are higher in the foodstuff sector (12.2 percent)
than in the cash crop sector (8.0 percent) and, consequently, trade liberalization leads to a
greater reduction in foodstuff import prices. These price variations are passed on to domestic
producer and consumer prices in these two sectors, leading local producers to substitute
massively toward export markets. In the export-intensive cash crops sector, output
consequently expands, whereas it contracts in the inward-oriented foodstuffs industry.
Furthermore, we postulate that the government introduces a uniform tax on household
consumption to compensate for lost tariff revenue. As nearly 54 percent of total demand for
foodstuffs is for household consumption, as compared to only 3.9 percent for cash crop, the
consumption tax further depresses demand and output of foodstuffs. Indeed, even foodstuff
imports decline, despite the elimination of import tariffs. Within industry, the consumption
tax also helps explain the contraction in the food processing industry, for which households
represent 57 percent of total demand.
As a result of these output variations, labor moves toward the expanding export-
intensive subsectors: cash crops, forestry and wood processing (Table 7). Agricultural wages

12
fall slightly more (13.80 percent) than industrial wages (10.30), reflecting greater reductions
in agricultural producer prices. As the expanding subsectors have roughly the same shares of
unskilled labor in composite labor as their corresponding sectors (agriculture and industry),
skilled and unskilled wages fall in the same proportion. Returns to land fall less than
agricultural wages, as producer prices fall more in the labor-intensive foodstuffs sector than
in the land-intensive cash crops sector. The returns to (immobile) capital rises for cash crops
(7.40 percent) given that producer prices fall less than wages and returns to land, whereas the
contrary is observed for returns to capital in the foodstuffs sector.
Combined full liberalization of Rest of the World and Cameroon
The results from the combined ROW and Cameroon liberalization (upper-half of
Tables 8 and 9) are very similar to Cameroon liberalization alone. The increase in world
prices due to free world trade is insufficient to offset the reduction in prices resulting from the
elimination of Cameroonian tariffs. Results do not change in any substantive way, although
magnitudes change slightly. At the macro level for example, the real exchange rate
depreciates by 9.02 percent compared to a 9.51 percent depreciation in case of Cameroon
unilateral liberalization, the consumer price index is down 7.72 percent compared to 9.02
percent, imports are up 13.91 percent compared to 13.74 percent, exports are nearly at the
same level, and wage rates in the agriculture sector decline less12.
Household income effects
Shares and changes in household factor incomes for all scenarios are summarized in
table 3. Variations in factor remunerations affect the income of household groups according
to their respective factor endowments in the base run. Urban households derive most of their
income from skilled wages and returns to nonagricultural capital (84 percent). Rural

13
households derive a large proportion of income from agricultural factors, even if a non
negligible proportion comes from other income sources. They consequently have more
diversified income sources compared to urban households.
ROW free-trade increase rural incomes (2.75 percent) more than urban incomes (0.97
percent) given the larger increase in the returns to agricultural factors (Table 7). Incomes in
male-headed households rise slightly more than in female-led households, given the greater
dependency on income from agricultural factors in male-headed households. The base-year
poor also experience a larger increase in income (2.55 percent vs. 1.44 percent for the base-
year non-poor), once again due to a larger share of agricultural factor income.
As expected, we get opposite effects under Cameroon unilateral liberalization.
Incomes fall as a result of the import-price led reduction in domestic output and factor prices,
especially for agricultural wages. Rural and base-year poor households suffer more, due to
their higher shares of agricultural wage income. There is no difference between male- and
female-led households.
In the combined ROW and Cameroon scenario, household incomes fall, although less
than under unilateral Cameroonian liberalization. The impacts offset each other in such a way
that rural and base-year poor households have only slightly larger falls in their incomes than
their urban and base-year non-poor counterparts. The impacts of ROW liberalization imply
that incomes fall slightly more in male-led households.
Poverty effects
In the analysis of variations in the FGT poverty indicators, impacts come essentially
from two sources: (1) from the change in household income; and (2) from the change in
consumer prices which affect the poverty line. Overall, it is clear that free world trade slightly
reduces poverty, whereas domestic liberalization substantially increases poverty (Table 4).

14
As a consequence of ROW liberalization, the poverty headcount index (FGT0)
decreases from 40.22 to 38.23 percent for the entire country, the poverty gap (FGT1) falls
from 13.76 to 12.23 percent, poverty severity (FGT2) declines from 6.38 to 5.38, and the Gini
index goes from 0.458 to 0.446. Free ROW trade reduces poverty in rural areas, where
income gains are greatest, but leaves the situation of the urban poor practically unchanged,
regardless of the poverty or inequality indicator considered (Table 4). ROW liberalization
benefits both male and female-led households but, as expected, the fall in poverty is more
significant in male-led households as a result of the greater increase in their incomes. Free
ROW trade allows 5.6 percent of the poor, or roughly 348,000 individuals (Table 5), to
escape poverty. However, 0.44 percent of the non-poor (about 40,000 individuals) fall into
poverty. In net terms, the number of poor declines by 308,000 individuals. Household groups
that would most profit from ROW liberalization are those whose head is principally involved
in agriculture activities, fishing, hunting, breeding, mining, food industry, or in hotel and
restaurant activities. The greatest losers from ROW liberalization would be households whose
head works in the textile or chemical industries.
Under Cameroon’s unilateral liberalization, there is a strong increase in poverty as
incomes fall more than consumer prices. The national headcount index jumps from 40.22 to
46.81 percent. The poverty gap and poverty severity deteriorate even more, increasing
respectively from 13.76 to 22.23 percent and from 6.38 to 15.50 percent. Not surprisingly,
inequality increases, with a shift in the Gini index from 0.458 to 0.523. Given the fact that the
reduction in rural income is larger than the reduction in urban income, poverty increases
more among rural households than among urban households. Unilateral liberalization enables
fewer individuals to escape poverty (87,000, as compared to 348,000 with ROW
liberalization), while dramatically increasing the number of base-year non-poor who fall into
poverty (1,107,000 versus 40,000). In net terms, Cameroon unilateral liberalization is

15
predicted to raise the number of poor individuals by 1,020,000. This poverty worsening
would be experienced by all household groups except those whose head works in wood
industry. Particularly strong increases in poverty are noted among households whose head is
involved in the food, textile or chemical industry.
Considering the combined Cameroon and ROW liberalization, the poverty-increasing
effects of Cameroon's own liberalization dominate. Indeed, the poverty results of this
combined scenario are nearly the same as those following unilateral Cameroonian
liberalization. Indeed, nine of the 20 household groups have exactly the same headcount
index in both scenarios and differences in other groups are less than one percentage point,
xcept for households led by a head working in agriculture, fishing, hunting or the food
industry.
THE TAXATION BIAS IN FREE-TRADE OUTCOMES: VAT VS. CONSUMPTION
TAX AS REPLACEMENT TAX
Impacts of trade liberalization will ultimately depend on the replacement tax used to
offset cuts in import tariffs. To capture the possible bias induced by the choice of the
replacement tax, we compare the effects of combined ROW and Cameroon liberalization
using VAT as replacement tax, instead of the previous household consumption tax. Uniform
consumption tax is proportional by definition, whereas the VAT implemented in Cameroon is
progressive.
An overview of the VAT in Cameroon
The VAT is a good candidate as the replacement tax in Cameroon, as the community
rules adopted within the framework of CACEU dictate that member-states rely on the VAT
as the principal domestic indirect tax instrument. Since the 1994 fiscal and customs reform,

16
the VAT has increasingly become the main goods and services taxes in Cameroon. In 2001,
VAT revenues accounted for 53 percent of total tax revenues levied on goods and services,
while imports tariffs contributed for 27 percent, excises and miscellaneous taxes for 19
percent, and export duties for one percent.
Notwithstanding its dominant status, the Cameroon VAT remains very “imperfect”,
compared to a “pure” VAT13, mainly because of the narrowness of the VAT base and the
partial and delayed deductibility of VAT paid upstream on inputs. Indeed, refunds of VAT
credits are statutorily delayed in Cameroon; owing to the “one month latency rule” according
to which companies must wait one month before finally recovering their refundable VAT.
There is a coexistence of two VAT regimes: a normal regime and a simplified regime.
Companies that belong to the simplified regime cannot claim any VAT credits on their input
purchases. Moreover, VAT applied to products subject to the simplified regime are not
refundable, even for the companies belonging to the normal regime.
The VAT base is narrow as several activities are exempted, either because their sales
revenue is below the minimal threshold or, more generally, because they operate in the
informal sector. In 2001, the informal sector represented 77 percent of total employment and
50.6 percent of total value added in Cameroon (Table A1.1). The narrowness of the VAT
base has led to low effective VAT rates. While the official nominal VAT rate was 18.7
percent in 2001, the average VAT effective rates were 1.64 percent for non deductible
products sold on the domestic market, 7.29 percent for non deductible imports, and 2.38
percent for all non deductible products.
The above three VAT effective rates are somewhat theoretical, since the VAT bases
used for their computation include input purchases, which are in principle exempted. The real
VAT base is composed of purchases by households, government and firms not involved in
the VAT system. With this base (63.47 percent of total demand) yields an average effective

17
VAT rate of 3.74 percent for 2001. This implies that only 20 percent of purchases made by
final VAT taxpayers supported the 18.7 percent VAT nominal rate.
VAT revenues and effective rates are generally inversely linked to the share of
informal activities for a given sector or product. This share is greatest in the agricultural
sector (96 percent) and services, and it is smaller in the industrial sector. Indeed, industrial
products represent 40.46 percent of purchases made by final VAT taxpayers and generate the
greatest share of VAT revenues (74.93 percent), while agricultural products represent only
14.42 percent of purchases made by final VAT taxpayers and contribute only 0.43 percent of
VAT revenues.
In 2001, rural households consumed represented 61 percent of household
consumption of agricultural goods versus only 29 percent for industrial goods. Consequently,
rural households were much less subject to the VAT than urban households. Given that over
80% of the poor are located in rural areas, the VAT system is thus progressive. Table A1.2
shows that the poor represent 40.22 percent of total population, but consumed 11.36 percent
of total household consumption and contributed only 9.43 percent of VAT revenues on
household consumption, with an effective VAT rate equal to 2.89 percent. In contrast, the
non poor paid an effective VAT rate of 3.58 percent.
Comparative macro and sectoral effects
Both scenarios shift macro variables in the same direction (table 2), but the magnitude
of changes are generally smaller in the VAT case. This is due to the fact that VAT rates
partly offsets the fall in import prices, especially where initial real effective VAT rates are
high (Table A1.1). Consequently, while all consumer prices fall in the consumption tax case,
in the VAT case, there is an increase in consumer price in all sectors for which real effective
rate of VAT is higher than the mean (3.74 percent) in the base run, i.e. in wood processing,

18
refined petroleum and miscellaneous industries. As expected, in the scenario with VAT the
reduction in household demand is smaller for goods with lower initial real effective VAT
rates and larger for goods with high initial effective VAT rates. In addition, the VAT is less
biased against sectors with high household consumption shares. Consequently, aggregate
household and aggregate national demand fall much less and distortions are generally smaller
with the VAT as the replacement tax.
Comparative household income effects
Since the fall in factor returns are smaller with the VAT, the average reduction in
household incomes is also smaller: 4.91 percent, as compared to 7.40 percent with the
consumption tax. Whatever the household group considered in table 3 (urban vs. rural
households, male-led vs. female-led households, base-year poor vs. non poor), the losses in
household factor incomes are roughly 50% smaller with the VAT. However, the loss in total
factor income remains slightly larger in rural, female-led and base-run poor households than
their respective counterparts.
Comparative poverty effects
Full liberalization with a VAT replacement tax clearly increases poverty less than
with a replacement household consumption tax. When we use the VAT as the replacement
tax, the headcount index rises from 40.22 to 44.52 percent at national level; while it climbs to
46.27 with a consumption tax. While a smaller number of base-year poor escape from
poverty with the VAT (43,000 vs. 63,000), the number of base-year non poor who fall into
poverty is also much smaller (708,000 vs. 999,000). The extrapolated increase in the net
number of poor individuals is equal to 936,000 in the consumption tax case, as compared to
665,000 if we use the VAT.

19
The magnitude of the changes in the poverty gap and severity are also always smaller
with the VAT, whether we considering urban, rural, male-led or female-led households. The
base-run poor who escape poverty are mostly those where the head is employed in wood
industry. All other household groups experience a rise in poverty, particularly with a
consumption replacement tax.
IMPACTS OF DOHA SCENARIO
The Doha scenario involves a reduction in world and domestic tariffs, exports
subsidies and domestic support. For Cameroon, changes in tariff rates are minimal (table 10)
with the average tariff level falling from 11.79 percent to 11.66 percent. According to the
GTAP model, implementing Doha scenario should lead to a small increase in average world
import prices for Cameroon (0.47 percent) and practically no change to its world export
prices (0.04 percent). The food processing and foodstuff sectors are the only sectors which
record an increase in import prices that exceeds one percent: 3.3 and 2.1 percent,
respectively. The variations in export prices do not exceed one percent in any sector.
Macro and sectoral effects
At the aggregate level, the Doha scenario has practically no impact on Cameroon; the
real exchange rate appreciate of one tenth of 1 percent and wage rates stay practically
constant with a small increase (0.5 percent) in agricultural labor markets.
At sectoral level (tables 10 and 11), impacts are also weak. In the food processing
industry, for which the increase in world import prices is greatest (3.2 percent), effects are
mitigated by the counteracting fall in domestic tariffs (a reduction from 23.8 to 21.7 percent).
The combined effect leads nevertheless to a 1.54 percent increase in the domestic import
price and a 3.87 percent fall in import volumes. The result increase in local demand for

20
domestic production leads to a small expansion of output and producer prices in the food
processing industry (0.6 percent), despite a small reduction in its exports. Indeed, as the
world export price for food processing rises by only 0.1 percent, the stronger increase in
producer prices reduces the sector's export competitiveness.
In the agriculture sectors, the cash crop industry faces a fall in both import prices
(0.28 percent) and export prices (0.17 percent), although the variations are very small. This
leads to a drop in both exports and output and an increase in cash crop imports. The GTAP
simulation of the Doha scenario predicts a small increase in world import prices for
foodstuffs (2.3 percent), which is partially offset by a reduction in tariff rate from 12.2 to 11.9
percent. On the whole, Doha scenario involves a rise in import prices and a substitution of
local demand toward domestically-produced substitutes: imports and exports decline (6.15
percent and 0.95 percent respectively) and output and locally-sold production expand (by
0.04 and 0.06 percent respectively). Rates of returns to capital rise in the foodstuff sector and
fall in cash crops, while all agricultural wage rates record a small 0.5 percent increase. On
average, wage rates of skilled labor rise by 0.07 percent, wage rates of unskilled labor by 0.28
percent, rates of returns to capital by 0.26 percent, and rates of return to land by 0.30 percent.
Household income effects
The above small increases in factor remunerations result in a slight rise in overall
household income at the national level (0.13 percent). On the basis of the initial factor
endowments of household groups and changes in the remuneration rates of various factors,
total factor income for urban households remains unchanged, whereas rural households
enjoys a 0.34 percent increase due to the increase in skilled and unskilled agricultural wage
rates, as well as rates of return to agricultural and non agricultural capital, which account
altogether for about 67 percent of rural household factor income. Factor income of male-led
21
households grows relatively more (0.17 percent) than the income of female-led households
(0.10 percent). Factor income for households that were initially poor rises more (0.32
percent) than for the initially non poor (0.09 percent). In general, households enjoying an
improvement in income are those more endowed with skilled or unskilled agricultural labor,
or with agricultural capital. Those experiencing a small fall in income are households mainly
endowed with nonagricultural labor.
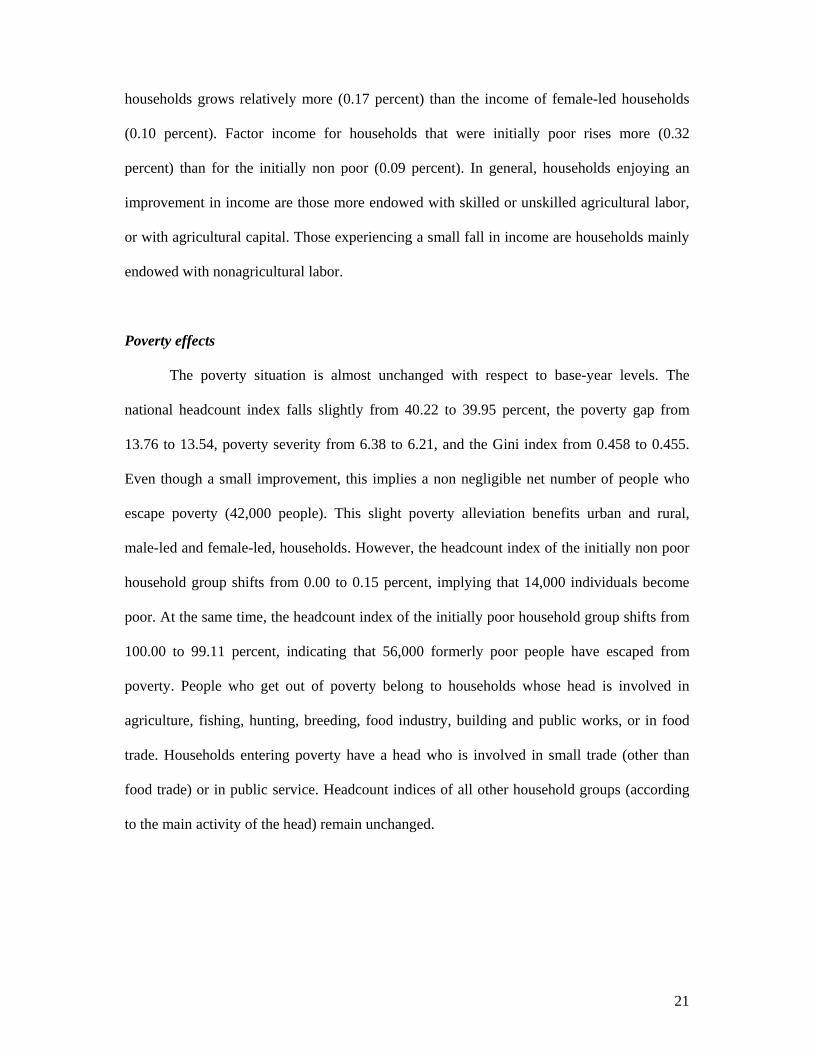
Poverty effects
The poverty situation is almost unchanged with respect to base-year levels. The
national headcount index falls slightly from 40.22 to 39.95 percent, the poverty gap from
13.76 to 13.54, poverty severity from 6.38 to 6.21, and the Gini index from 0.458 to 0.455.
Even though a small improvement, this implies a non negligible net number of people who
escape poverty (42,000 people). This slight poverty alleviation benefits urban and rural,
male-led and female-led, households. However, the headcount index of the initially non poor
household group shifts from 0.00 to 0.15 percent, implying that 14,000 individuals become
poor. At the same time, the headcount index of the initially poor household group shifts from
100.00 to 99.11 percent, indicating that 56,000 formerly poor people have escaped from
poverty. People who get out of poverty belong to households whose head is involved in
agriculture, fishing, hunting, breeding, food industry, building and public works, or in food
trade. Households entering poverty have a head who is involved in small trade (other than
food trade) or in public service. Headcount indices of all other household groups (according
to the main activity of the head) remain unchanged.

22
CONCLUDING REMARKS
The general conclusion that emerges from this study is that the Doha development
round might contribute to poverty alleviation in Cameroon. The Doha scenario considered in
this study indeed results in a fall in overall poverty and a decline in income inequalities,
allowing 42,000 people to escape from poverty in net terms.
Further experiments on trade liberalization show that free-trade in ROW strongly
alleviates poverty, at least at the national level, whereas Cameroon’s own liberalization
worsens the poverty and inequality situations. In case of combined ROW and own
liberalization, the adverse impacts of own liberalization proves to strongly outweigh the
favorable outcomes of the ROW liberalization. This result is very worrying since, besides
Doha scenarios, Economic Partnership Agreements (EPA) currently negotiated between ACP
countries and the EU propose a drastic dismantlement of domestic tariffs in ACP countries.
Furthermore, our results indicate that the choice of tax replacement instrument has
important implication for the poverty impacts of trade liberalization: poverty gets worse in
our country-case study when using a consumption tax instead of the VAT as replacement tax.
This is primarily due to the progressive nature of Cameroon’s VAT.
Another important result is that poverty alleviation within the entire nation does not
exclude the possibility that some initially non poor people become poor. Conversely, some
households escape poverty even when overall poverty increases.
In the end, it appears from our experiments that Doha Agreements should be a part of
the twisty path of poverty alleviation in Cameroon. However, policymakers should be aware
of the importance of choosing appropriate replacement taxes and the negative poverty
impacts of the elimination of domestic tariffs. They should also be aware that some
households will lose out and possibly fall into poverty, even if national poverty rates fall.

23
REFERENCES
Cloutier, Marie-Hélène, and John Cockburn. 2002. “How To Build An Integrated CGE
Micro-Simulation Model: Step-by-Step Instructions with An Illustrative Exercise.”
Centre Interuniversitaire sur le Risque, les Politiques Économiques et l’Emploi,
Université Laval, Québec.
CNIS (Cameroon National Institute of Statistics). 2002a. Conditions de vie des populations et
profil de pauvreté au Cameroun en 2001: Rapport principal de l’ECAM II. Republic of
Cameroon. Yaoundé: CNIS.
CNIS (Cameroon National Institute of Statistics). 2002b. Evolution de la pauvreté au
Cameroun entre 1996 et 2001. Republic of Cameroon. Yaoundé: CNIS.
CNIS (Cameroon National Institute of Statistics). 2003. Deuxième enquête camerounaise
auprès des ménages. Présentation des bases de données de l’enquête. Republic of
Cameroon. Yaoundé: CNIS.
CNIS (Cameroon National Institute of Statistics). 2004. Cameroon Statistics Yearbook 2004.
Republic of Cameroon. Yaoundé: CNIS.
Cnossen, Sijbren. 1991. “Design of the Value Added Tax : Lessons from Experience”. in:
Khalillzadeh-Shirazi, Javad, and Anwar Shah (eds), Tax Policy in Developing Countries,
A World Bank Symposium, The World Bank, Washington, D.C., pp. 72-85.
Cockburn, John. 2001. “Trade Liberalization and Poverty in Nepal: A Computable General
Equilibrium Micro-Simulation Analysis.” Working paper 01-18., Université Laval,
Quebec: CREFA
De Monchy, G., and F. Roubaud. 1991. « Cameroun : Evolution économique rétrospective et
perspectives macro-économiques à l'horizon 1995 ». Paris : DIAL.

24
Decaluwé, Bernard, André Martens, and Luc Savard. 2001. La politique économique du
développement et les modèles d'équilibre général calculable. AUPELF-UREF. Montréal :
Les Presses de l'Université de Montréal.
Dollar, D., and A. Kraay. 2000. “Growth is Good for the Poor.” Development Research
Group, Washington, D. C.: The World Bank.
Emini, Arnault C. 2000a. « Analyse de l’incidence d’une TVA imparfaite à l’aide d’un
modèle calculable d’équilibre général. Application au cas camerounais. » Cahier de
recherche 00-06. Université Laval, Québec: CRÉFA.
Emini, Arnault C. 2000b. “Long Run versus Short Run Effects of A Value Added Tax. A
Computable General Equilibrium Assessment for Cameroon.” Cahier de recherche 00-
12. Université Laval, Québec: CRÉFA.
Fofana, I., J. Cockburn, and B. Decaluwé (2003). « Libéralisation commerciale et pauvreté en
Afrique. Description du modèle standard d’équilibre général calculable « EXTER+
version 2 » ». Document de travail, Université Laval, Québec : CIRPÉE – PEP Network.
Hertel, T., and Reimer. 2004. “Predicting the Poverty Impacts of Trade Liberalization: A
Survey”. A previous version of this paper circulated as World Bank Policy Research
Working Paper 2790: “Estimating the Poverty Impacts of Trade Liberalization.”
Republic of Cameroon. 2003. Poverty Reduction Strategy Paper., Yaoundé: Prime Ministry.
Shoup, Carl S. 1990. “Choosing among Types of VATs”. in: Gillis, Malcolm, C. S. Shoup,
and G. P. Sicat (eds, 1990): Value Added Taxation in Developing Countries. A World
Bank Symposium, The World Bank, Washington, D.C. pp. 3-16.
World Bank. 1996. “Cameroon: Country Assistance Strategy”. Report No. 12275-CM.
Washington, D.C.: The World Bank.
World Bank. 2002. “2002 World Bank Africa Database CD-ROM”. Operational Quality and
Knowledge Services, Washington D.C.: World Bank African Region.

25
Map 1: Poverty Map of Cameroon in 2001 using Geo-Referenced Headcount Indices by SUB-DIVISION
Bounds of Poverty HeadcountIndex at Subdividional level
03.3%37.0%41.9%48.6%96.2%
Source: Authors’ construction based on ECAM II results. CNIS (2002a; 2002b).
.

26
Table 1: Key elasticities and parameter values in the model Production Trade
Exports* % Imports* % Production Sectors VA* share
% X* share
% VA/X* % Cap-Lab ratio** Share
%
Export intensity % ***
CET elasticities % *****
Export demand
elasticities
Export tax rates
%
Share %
Import intensity %
Armington elasticities
*****
Import tariff rates
% Foodstuff agriculture 18.2 13.2 73.0 0.26 0.8 0.9 4.3 6.0 0.22 1.1 0.9 4.3 12.2 Cash crops agriculture 2.3 2.3 53.1 1.13 7.1 43.0 6.5 6.0 0.00 0.0 0.1 6.5 8.0 AGRICULTURE 20.6 15.5 70.0 7.9 7.2 1.1 0.9 Forestry 1.1 2.7 22.8 0.94 1.1 6.0 5.0 6.0 8.67 0.1 0.5 5.0 7.4 Crude oil 9.6 6.3 80.9 51.87 43.6 98.5 14.2 6.0 0.25 17.2 95.0 14.2 3.2 Food processing 7.8 11.6 35.5 1.74 5.7 6.9 5.0 6.0 0.23 13.0 12.3 5.0 23.8 Wood processing 2.2 4.5 25.7 2.81 11.9 37.1 6.8 6.0 0.31 0.0 0.2 6.8 28.1 Refined petroleum 0.5 2.9 9.9 9.57 5.8 28.5 4.2 6.0 0.03 2.1 10.7 4.2 18.3 Miscellaneous industries 10.6 16.5 33.9 1.08 11.3 9.7 7.3 6.0 0.29 52.1 29.1 7.3 14.6 INDUSTRY 31.9 44.5 37.9 79.5 25.2 84.7 22.9 Tradable services 42.9 36.2 62.6 0.90 12.7 4.9 3.8 6.0 0.00 14.3 4.6 3.8 0.0 Public services 4.6 3.8 64.4 0.47 0.0 0.0 1.5 6.0 0.00 0.0 0.0 1.5 0.0 SERVICES 47.5 40.0 62.8 12.7 4.5 14.3 4.2ALL SECTORS 100.0 100.0 52.8 100.0 14.1 100.0 12.0Source: Authors’ construction: * Based on the 2001 SAM; VA = Value added; X = Production. ** Capital/Labor ratio. *** Export intensity = exports as a share of output. **** Import intensity = import as a share of domestic demand ***** Armington elasticities calculated from GTAP for our commodity aggregations. We symmetrically use these values for CET elasticities.

27
Table 2: Changes in selected macro variables (in percent) Standard comparison scenarios
With consumption replacement tax Country-specific scenarios
With VAT as the replacement tax SCENARIOS
VARIABLES ROW CAM FULL FULL-VAT DOHA
AGGREGATE FEATURES OF SCENARIOS
Index of world prices of exports 0.77 0.00 0.77 0.77 0.04
Index of world prices of imports 0.76 0.00 0.76 0.76 0.47
Overall tariff rate in Cameroon 0.00 -100.00 -100.00 -100.00 -1.10
PRICE EFFECTS
Real exchange rate (*) -0.42 9.51 9.02 5.98 -0.13Production price index 1.19 -8.68 -7.57 -4.92 0.17
Producer price index of exports 0.76 -2.28 -1.50 -0.79 0.07
Producer price index of locally sold production 1.26 -9.84 -8.67 -5.64 0.19
Market price index of locally sold production 1.26 -9.86 -8.69 -4.59 0.21
Market price index of imports 0.68 -11.61 -10.85 -5.71 0.29
Total absorption price index 1.18 -10.10 -9.01 -4.72 0.22
Consumer price index 1.39 -9.02 -7.72 -2.40 0.34
VOLUME EFFECTS
Output 0.00 -0.04 -0.03 -0.01 0.00
Exports 0.06 14.10 14.11 9.65 -0.15
Locally sold output 0.01 -2.44 -2.41 -0.80 0.06
Imports 0.29 13.74 13.91 9.53 -0.55
Total demand of composite goods 0.04 -0.50 -0.46 0.44 -0.01
Household consumption 0.05 -4.69 -4.62 -2.64 -0.20
REMUNERATION OF FACTORS
Wage rate of agricultural labor 3.70 -13.80 -10.47 -6.70 0.50
Wage rate of skilled agricultural labor 3.70 -13.80 -10.40 -6.70 0.50
Wage rate of unskilled agricultural labor 3.70 -13.80 -10.50 -6.70 0.50
Wage rate of nonagricultural labor 1.07 -9.34 -8.81 -6.03 -0.01
Wage rate of skilled nonagricultural labor 1.19 -9.11 -8.60 -6.01 -0.01
Wage rate of unskilled nonagricultural labor 0.65 -10.16 -9.58 -6.08 -0.01
Average wage rate of composite labor 1.86 -10.68 -9.31 -6.23 0.15
Wage rate of agricultural labor 3.70 -13.80 -10.47 -6.70 0.50
Wage rate of nonagricultural labor 1.07 -9.34 -8.81 -6.03 -0.01
Rate of return to capital 1.04 -8.60 -7.29 -4.52 0.26
Rate of return to agricultural capital 3.54 -10.02 -6.72 -4.42 0.39
Rate of return to nonagricultural capital 0.76 -8.44 -7.35 -4.53 0.25
Rate of return to land 3.50 -7.60 -4.30 -2.90 0.30
HOUSEHOLD BUDGET AND WELFARE
Household gross income 1.42 -8.51 -7.40 -4.91 0.13
Household consumption budget 1.44 -13.28 -11.98 -4.98 0.13
EV (**) as percentage of initial consumption 0.06 -4.73 -4.65 -2.73 -0.21
Source: Authors’ construction based on simulation results. Aggregate features of scenarios are compiled from GTAP global model results. ROW = Rest Of the World liberalization only; CAM = Cameroon liberalization only; FULL = Combined ROW and Cameroon full liberalization with consumption replacement tax; FUL-VAT = = Combined ROW and Cameroon full liberalization with VAT as replacement tax; DOHA = Doha scenario;
(*) Real exchange rate = Ratio of the nominal exchange rate multiplied by the index of world export prices, divided by the domestic output price index. (**) EV = Hicksian Equivalent Variation. A positive value implies a welfare improvement and a negative value indicates a welfare worsening.

28
Table 3: Sources of household factor income and changes following simulations Changes following simulations of scenarios
Household groups and factor incomes Shares in the base run ROW CAM FULL FULL-VAT DOHA
Wages earned on skilled agricultural labor 1.5 3.66 -14.04 -10.71 -6.81 0.47 Wages earned on unskilled agricultural labor 1.0 3.61 -13.77 -10.38 -6.58 0.40 Wages earned on skilled nonagricultural labor 58.4 1.05 -9.26 -8.78 -6.01 -0.04 Wages earned on unskilled nonagricultural labor 11.8 0.49 -10.47 -10.03 -6.12 0.02 Returns to agricultural capital 1.2 3.63 -13.76 -10.33 -6.59 0.49 Returns to nonagricultural capital 26.0 0.65 -10.27 -9.63 -6.17 0.03 Returns to land 0.1 1.55 -5.16 -2.37 -1.13 0.00 U
rban
hou
seho
lds
Total factor income 100.0 0.97 -9.83 -9.21 -6.09 0.00
Wages earned on skilled agricultural labor 13.4 3.64 -13.72 -10.39 -6.62 0.48 Wages earned on unskilled agricultural labor 33.9 3.65 -13.80 -10.47 -6.66 0.51 Wages earned on skilled nonagricultural labor 19.6 1.48 -8.38 -7.76 -5.83 0.00 Wages earned on unskilled nonagricultural labor 11.4 0.73 -9.64 -9.02 -6.07 0.00 Returns to agricultural capital 12.1 3.59 -12.40 -9.06 -5.81 0.43 Returns to nonagricultural capital 7.8 2.23 -12.99 -10.91 -7.97 0.70 Returns to land 1.8 2.35 -6.50 -3.36 -1.78 0.03 Ru
ral h
ouse
hold
s
Total factor income 100.0 2.75 -11.89 -9.50 -6.34 0.34
Wages earned on skilled agricultural labor 7.2 3.65 -13.76 -10.43 -6.65 0.49 Wages earned on unskilled agricultural labor 15.9 3.65 -13.82 -10.49 -6.67 0.51 Wages earned on skilled nonagricultural labor 40.9 1.18 -8.96 -8.43 -5.96 -0.03 Wages earned on unskilled nonagricultural labor 11.7 0.61 -10.12 -9.60 -6.08 0.01 Returns to agricultural capital 6.4 3.60 -12.62 -9.28 -5.95 0.45 Returns to nonagricultural capital 16.9 0.97 -10.89 -9.97 -6.50 0.18 Returns to land 0.9 2.39 -6.59 -3.40 -1.82 0.03 M
ale-
led
hous
ehol
ds
Total factor income 100.0 1.82 -10.76 -9.31 -6.19 0.17
Wages earned on skilled agricultural labor 4.6 3.61 -13.70 -10.37 -6.62 0.43 Wages earned on unskilled agricultural labor 14.7 3.62 -13.67 -10.34 -6.56 0.44 Wages earned on skilled nonagricultural labor 41.5 0.85 -9.76 -9.41 -6.07 -0.03 Wages earned on unskilled nonagricultural labor 10.6 0.48 -10.00 -9.50 -6.18 -0.01 Returns to agricultural capital 4.0 3.56 -11.84 -8.33 -5.36 0.31 Returns to nonagricultural capital 23.7 0.90 -10.41 -9.50 -6.64 0.09 Returns to land 0.8 1.76 -5.33 -2.69 -1.23 0.00 Fe
mal
e-le
d ho
useh
olds
Total factor income 100.0 1.48 -10.75 -9.53 -6.25 0.10
Wages earned on skilled agricultural labor 11.1 3.64 -13.76 -10.42 -6.64 0.48 Wages earned on unskilled agricultural labor 33.7 3.65 -13.83 -10.49 -6.68 0.51 Wages earned on skilled nonagricultural labor 18.1 0.88 -9.71 -9.20 -6.08 -0.01 Wages earned on unskilled nonagricultural labor 13.4 0.58 -10.10 -9.56 -6.13 0.01 Returns to agricultural capital 14.7 3.61 -12.59 -9.24 -5.93 0.45 Returns to nonagricultural capital 7.4 1.49 -11.86 -10.42 -7.07 0.43 Returns to land 1.7 2.32 -6.61 -3.46 -1.79 0.03 Po
or p
eopl
e in
bas
e ru
n
Total factor income 100.0 2.55 -12.13 -9.82 -6.33 0.32
Wages earned on skilled agricultural labor 5.1 3.65 -13.76 -10.43 -6.65 0.48 Wages earned on unskilled agricultural labor 8.2 3.64 -13.75 -10.42 -6.62 0.49 Wages earned on skilled nonagricultural labor 50.6 1.18 -8.97 -8.47 -5.96 -0.03 Wages earned on unskilled nonagricultural labor 10.8 0.60 -10.11 -9.60 -6.07 0.01 Returns to agricultural capital 2.5 3.57 -12.45 -9.08 -5.82 0.40 Returns to nonagricultural capital 22.2 0.89 -10.65 -9.81 -6.45 0.13 Returns to land 0.5 2.29 -6.19 -3.11 -1.68 0.03
Non
poo
r peo
ple
in b
ase
run
Total factor income 100.0 1.44 -10.18 -9.14 -6.14 0.09
Souce: Authors’ constriction based on their simulation results ROW = Rest Of the World liberalization; CAM = Cameroon liberalization; DOHA = Doha scenario; FULL = Combined ROW and Cameroon full liberalization with consumption replacement tax; FUL-VAT = Combined ROW and Cameroon full liberalization with VAT as replacement tax.

29
Table 4: Poverty and inequality indices before and after simulations Scenarios with consumption replacement tax Scenarios with VAT as the
replacement tax Scenarios
Poverty and inequality indices
Baseline ROW CAM FULL FULL-VAT DOHA
Poverty headcount 40.22 38.23 46.81 46.27 44.52 39.95Poverty gap 13.76 12.23 22.97 21.60 19.03 13.54Poverty severity 6.38 5.38 15.50 13.92 11.27 6.21
Cameroon
Gini index 0.4575 0.4459 0.5230 0.5116 0.4936 0.4554
Poverty headcount 17.97 17.91 24.02 24.04 22.09 17.89Poverty gap 4.56 4.53 9.27 9.04 7.30 4.58Poverty severity 1.75 1.74 5.59 5.35 3.80 1.76
Urban area
Gini index 0.4538 0.4514 0.4896 0.4871 0.4747 0.4534Poverty headcount 52.17 49.15 59.05 58.22 56.57 51.80Poverty gap 18.70 16.36 30.34 28.35 25.34 18.35Poverty severity 8.86 7.34 20.82 18.53 15.28 8.60
Rural area
Gini index 0.3906 0.3770 0.48.23 0.4644 0.4406 0.3880
Poverty headcount 40.54 38.18 48.10 47.44 45.53 40.23Poverty gap 14.01 12.27 24.45 22.93 20.06 13.76Poverty severity 6.51 5.37 16.87 15.13 12.14 6.32
Male-led households
Gini index 0.4615 0.4488 0.5340 0.5217 0.5020 0.4593Poverty headcount 39.18 38.41 42.66 42.52 41.28 39.04Poverty gap 12.95 12.09 18.25 17.34 15.76 12.83Poverty severity 5.97 5.41 11.14 10.05 8.51 5.87
Female-led households
Gini index 0.4443 0.4365 0.4870 0.4786 0.4663 0.4429
Poverty headcount 100.00 94.41 98.60 98.99 99.32 99.11Poverty gap 34.20 30.39 51.10 48.71 44.36 33.65Poverty severity 15.86 13.38 34.42 31.26 26.11 15.44
Poor people in base run
Gini index 0.1777 0.1817 0.3387 0.3068 0.2601 0.1759Poverty headcount 00.00 0.44 11.97 10.81 7.65 00.15Poverty gap 00.00 0.01 4.05 3.36 1.99 00.00Poverty severity 00.00 0.00 2.78 2.26 1.29 00.00
Non poor people in base run
Gini index 0.3709 0.3662 0.4114 0.4048 0.3927 0.3701
Agriculture, Fishing, Hunting 57.05 53.53 64.26 63.23 61.27 56.42Breeding 51.02 36.19 65.96 64.66 60.73 50.15Mining 24.31 18.41 35.70 35.70 31.30 24.31Food Industry 20.54 15.08 49.13 47.80 43.66 18.55Textile Industry 29.20 31.28 45.69 45.69 39.61 29.20Wood Industry 22.19 22.08 19.62 19.62 21.13 22.19Chemical Industry 13.19 19.92 33.40 33.40 29.58 13.19Industry of Building Material 11.71 11.71 17.74 17.74 14.15 11.71Metals, Mechanics, Repairing 26.10 26.10 41.69 41.69 32.32 26.10Energy, Gas, and Water 19.68 19.68 22.30 22.30 22.30 19.68Building and Public Works 30.59 27.58 38.07 38.07 36.53 29.81Transport 19.61 19.75 29.62 30.13 27.38 19.61General Trade 18.44 18.44 25.51 24.57 24.04 18.44Food Trade 22.64 22.84 33.98 33.69 29.63 22.41Other Trades 29.28 29.61 34.38 34.06 31.85 29.48Hotel and Restaurant 25.09 22.30 28.81 29.11 28.54 25.09Banks and Insurance 1.93 1.93 3.67 3.67 3.67 1.93Public Service 13.45 12.51 15.41 16.19 16.89 14.37Miscellaneous Services 24.67 25.03 34.90 34.71 32.45 24.87
Poverty headcount (FGT0): Households categorized by sector of activity of the head of household
Not Classified 28.36 28.58 29.07 28.83 28.54 28.36Source: Authors’ construction based on simulation results and the 2001 Cameroon household survey. ROW = Rest Of the World liberalization; CAM = Cameroon liberalization; DOHA = Doha scenario; FULL = Combined ROW and Cameroon full liberalization with consumption replacement tax; FUL-VAT = = Combined ROW and Cameroon full liberalization with VAT as replacement tax.

30
Table 5: Estimates of changes in the number of poor Number of former poor people who
escape from poverty
Number of former non poor people
who become poor
Net change in the number of poor people * Scenarios performed
A B C = B – A
ROW: ROW full liberalization only 348,000 40,000 – 308,000
CAM: Cameroon own full liberalization only, with proportional consumption tax as the replacement tax
87,000 1,107,000 + 1,020,000
FULL: Combined ROW and Cameroon full liberalization, with proportional consumption tax as the replacement tax
63,000 999,000 + 936,000
FULL-VAT: combined ROW and Cameroon full liberalization, with VAT as the replacement tax
43,000 708,000 + 665,000
DOHA: Doha scenario with VAT as the replacement tax 56,000 14,000 – 42,000
Source: Authors’ construction based on simulation results and poverty profiles in 2001 (CNIS 2002a; 2002b). * A negative sign “–” implies a fall in overall number of poor people; and a positive sign “+” indicates a rise in the overall number of poor people.

31
Table 6: ROW vs. Domestic Liberalization – Sectoral effects on Prices and Volumes of goods and services Percent changes in world prices from GTAP simulations
Tariffs (in percent) Percent changes in domestic market prices Percent changes in volumes
Production Sectors World Export Prices
World Import Prices
Original tariffs
Cut in original tariffs
New tariffs
Producer prices
Export prices
Import prices
Locally sold
output prices (*)
Prices of locally sold output (**)
Prices of composite goods (**)
Consumer prices (**)
Output Exports Imports
Locally sold
domestic output
Total demand of composite
goods
Household consumption
ROW LIBERALIZATION ONLY
Foodstuff agriculture 3.39 7.31 12.2 0.00 12.2 2.98 3.21 7.10 2.98 2.98 3.02 3.00 0.03 1.03 -15.55 0.03 -0.12 -0.04
Cash crops agriculture 1.73 0.51 8.0 0.00 8.0 1.93 1.85 0.51 1.98 1.98 1.98 1.98 -0.24 -0.70 10.03 0.13 0.14 0.30
Forestry 0.80 0.54 7.4 0.00 7.4 0.66 0.74 0.58 0.66 0.66 0.66 0.66 -0.01 0.36 0.38 -0.03 -0.03 0.52
Crude oil 0.49 0.44 3.2 0.00 3.2 0.49 0.49 0.44 0.47 0.47 0.44 0.00 0.00 0.01 -0.02 -0.39 -0.04 0.00
Food processing 1.49 4.79 23.8 0.00 23.8 2.33 1.77 4.76 2.37 2.37 2.71 2.63 1.17 -1.60 -9.79 1.37 -0.01 -0.36
Wood processing 0.70 0.24 28.1 0.00 28.1 0.67 0.69 0.23 0.66 0.66 0.66 0.66 0.00 0.09 2.90 -0.05 -0.05 0.29
Refined petroleum 0.53 0.33 18.3 0.00 18.3 0.43 0.49 0.34 0.41 0.42 0.41 0.40 -0.05 0.20 0.16 -0.15 -0.12 0.16
Miscellaneous industries 0.96 -0.15 14.6 0.00 14.6 0.40 0.69 -0.13 0.37 0.37 0.20 0.35 -0.54 1.62 2.96 -0.76 0.32 0.52
Tradable services 0.67 0.36 0.0 0.00 0.0 0.72 0.70 0.36 0.72 0.72 0.71 0.70 -0.08 -0.16 1.30 -0.07 -0.01 0.03
Public services 0.00 0.00 0.0 0.00 0.0 1.65 0.00 0.00 1.65 1.65 1.65 0.00 0.00 0.00 0.00 0.00 0.00 0.00
All sectors 0.77 0.76 11.79 0.00 11.79 1.19 0.76 0.68 1.26 1.26 1.18 1.39 0.00 0.06 0.29 0.01 0.04 0.05
DOMESTIC LIBERALIZATION ONLY
Foodstuff agriculture 0.00 0.00 12.2 -100 0.00 -12.66 -5.40 -11.76 -12.73 -12.73 -12.72 -12.63 -1.13 39.53 -6.07 -1.47 -1.51 -3.77
Cash crops agriculture 0.00 0.00 8.0 -100 0.00 -5.31 -3.42 -7.83 -6.85 -6.86 -6.86 -6.85 8.29 23.23 4.28 -2.59 -2.59 -4.85
Forestry 0.00 0.00 7.4 -100 0.00 -7.55 -3.87 -7.98 -7.79 -7.79 -7.79 -7.76 4.21 26.71 3.95 2.89 2.89 -5.38
Crude oil 0.00 0.00 3.2 -100 0.00 -0.08 -0.05 -3.10 -1.51 -1.51 -3.03 0.00 0.00 0.32 2.66 -18.47 1.59 0.00
Food processing 0.00 0.00 23.8 -100 0.00 -11.77 -5.33 -19.44 -12.35 -12.37 -13.64 -10.07 -2.64 38.89 43.97 -5.80 0.33 -4.43
Wood processing 0.00 0.00 28.1 -100 0.00 -3.22 -2.11 -21.86 -3.90 -3.86 -3.95 -3.78 5.10 13.63 310.08 0.20 0.70 -7.95
Refined petroleum 0.00 0.00 18.3 -100 0.00 -3.58 -1.37 -15.57 -4.52 -4.58 -6.01 -3.82 -1.21 8.64 58.51 -5.20 1.62 -5.12
Miscellaneous industries 0.00 0.00 14.6 -100 0.00 -9.55 -5.21 -13.28 -10.11 -10.21 -11.34 -6.15 -2.32 37.83 20.46 -6.66 1.22 -6.31
Tradable services 0.00 0.00 0.0 -100 0.00 -8.77 -3.56 0.00 -9.06 -9.07 -8.72 -8.74 0.64 24.29 -30.73 -0.58 -1.97 -4.37
Public services 0.00 0.00 0.0 -100 0.00 -9.28 0.00 0.00 -9.28 -9.28 -9.28 0.00 0.00 0.00 0.00 0.00 0.00 0.00
All sectors 0.00 0.00 11.79 -100 0.00 -8.68 -2.28 -11.61 -9.84 -9.86 -10.10 -9.02 -0.04 14.10 13.74 -2.44 -0.50 -4.69
Source: Authors’ construction based on their simulation results (for changes in domestic prices and volumes) and on GTAP results (for changes in world prices and tariffs).
(*) Exclusive of taxes (**) Inclusive of all taxes on goods
32
Table 7: ROW vs. Domestic Liberalization – Sectoral effects on production factor markets Unskilled labor Skilled labor Composite labor Capital Land
Production Sectors Share
Percent change in demand
Percent change in wage rate
Share Percent
change in demand
Percent change in wage rate
Unskilled share in composite
labor
Percent change in demand
Percent change in wage rate
Percent change in demand
Percent change in
rate of return
Percent change in demand
Percent change in
rate of returnROW LIBERALIZATION ONLY
Foodstuff agriculture 53.82 0.03 3.70 13.36 0.04 3.70 69.73 0.03 3.70 0.00 3.70 0.18 3.50Cash crops agriculture 3.80 -0.49 3.70 0.97 -0.49 3.70 69.22 -0.49 3.70 0.00 3.00 -0.35 3.50AGRICULTURAL 57.62 0.00 3.70 14.32 0.00 3.70 69.70 0.00 3.70 0.00 3.54 0.00 3.50Forestry 1.04 0.07 0.60 1.26 -0.06 0.80 32.20 -0.02 0.74 0.00 0.70 - - Crude oil 0.32 0.00 4.10 0.38 0.00 4.10 32.21 0.00 4.10 0.00 0.40 - - Food processing 2.62 3.35 0.60 7.43 3.21 0.80 16.80 3.24 0.78 0.00 5.10 - - Wood processing 0.31 0.11 0.60 1.64 -0.02 0.80 9.66 -0.01 0.76 0.00 0.70 - - Refined petroleum 0.05 -0.49 0.60 0.13 -0.56 0.80 18.61 -0.55 0.75 0.00 0.00 - - Miscellaneous industries 7.02 -1.02 0.60 11.94 -1.15 0.80 25.16 -1.11 0.75 0.00 -0.80 - - INDUSTRIAL 11.37 0.15 0.70 22.78 0.44 0.86 22.20 0.38 0.82 0.00 1.16 - - Tradable services 30.73 -0.06 0.60 53.19 -0.19 0.80 24.83 -0.16 0.75 0.00 0.50 - - Public services 0.29 0.00 4.10 9.71 0.00 4.10 1.66 0.00 4.10 0.00 -1.70 - - SERVICES 31.01 -0.06 0.63 62.90 -0.16 1.31 21.99 -0.14 1.16 0.00 0.35 - - NON AGRICULTURAL 42.38 0.00 0.65 85.68 0.00 1.19 22.05 0.00 1.07 0.00 0.76 - - ALL SECTORS 100.00 0.00 2.41 100.00 0.00 1.55 36.38 0.00 1.86 0.00 1.04 0.00 3.50
DOMESTIC LIBERALIZATION ONLY Foodstuffs agriculture 53.82 -1.27 -13.80 13.36 -1.30 -13.80 69.73 -1.28 -13.80 0.00 -15.30 -6.29 -7.60Cash crops agriculture 3.80 17.96 -13.80 0.97 17.92 -13.80 69.22 17.95 -13.80 0.00 7.40 11.95 -7.60AGRICULTURAL 57.62 0.00 -13.80 14.32 0.00 -13.80 69.70 0.00 -13.80 0.00 -10.02 0.00 -7.60Forestry 1.04 8.37 -10.30 1.26 8.37 -10.30 32.20 8.37 -10.30 0.00 -0.10 - - Crude oil 0.32 0.00 -0.20 0.38 0.00 -0.20 32.21 0.00 -0.20 0.00 1.70 - - Food processing 2.62 -7.01 -10.30 7.43 -7.00 -10.30 16.80 -7.00 -10.30 0.00 -18.50 - - Wood processing 0.31 21.43 -10.30 1.64 21.43 -10.30 9.66 21.43 -10.30 0.00 16.20 - - Refined petroleum 0.05 -11.86 -10.30 0.13 -11.86 -10.30 18.61 -11.86 -10.30 0.00 -24.20 - - Miscellaneous industries 7.02 -4.73 -10.30 11.94 -4.72 -10.30 25.16 -4.73 -10.30 0.00 -15.90 - - INDUSTRIAL 11.37 -3.25 -10.01 22.78 -2.83 -10.12 22.20 -2.92 -10.10 0.00 -6.60 - - Tradable services 30.73 1.20 -10.30 53.19 1.21 -10.30 24.83 1.21 -10.30 0.00 -8.80 - - Public services 0.29 0.00 -0.20 9.71 0.00 -0.20 1.66 0.00 -0.20 0.00 -31.70 - - SERVICES 31.01 1.19 -10.21 62.90 1.02 -8.76 21.99 1.06 -9.08 0.00 -10.35 - - NON AGRICULTURAL 42.38 0.00 -10.16 85.68 0.00 -9.11 22.05 0.00 -9.34 0.00 -8.44 - - ALL SECTORS 100.00 0.00 -12.26 100.00 0.00 -9.78 36.38 0.00 -10.68 0.00 -8.60 0.00 -7.60Source: Authors’ construction based on their simulation results and 2001 Cameroon SAM.

33
Table 8: Full liberalization with consumption tax vs. VAT tax – Sectoral effects on Prices and Volumes of goods and services Percent changes
(GTAP simulations)
Tariffs (in percent)
Percent changes in domestic market prices Percent changes in volumes
Production Sectors World Export Prices
World Import Prices
Original tariffs
Cut in original tariffs
New tariffs
Producer prices
Export prices
Import prices
Prices of locally sold output (*)
Prices of locally sold output (**)
Prices of composite goods (**)
Consumer prices (**)
Output Exports ImportsLocally
sold output
Demand of composite
goods
Household consumption
FULL LIBERALIZATION WITH CONSUMPTION TAX
Foodstuff agriculture 3.39 7.31 12.2 -100 0.00 -9.94 -2.31 -5.51 -10.02 -10.02 -9.98 -9.92 -1.07 40.54 -20.18 -1.41 -1.59 -3.72
Cash crops agriculture 1.73 0.51 8.0 -100 0.00 -3.45 -1.60 -7.35 -4.94 -4.94 -4.95 -4.94 7.88 22.14 15.29 -2.43 -2.41 -4.53
Forestry 0.80 0.54 7.4 -100 0.00 -6.91 -3.14 -7.45 -7.15 -7.15 -7.15 -7.12 4.18 27.04 4.52 2.84 2.85 -4.84
Crude oil 0.49 0.44 3.2 -100 0.00 0.42 0.44 -2.67 -1.05 -1.05 -2.60 0.00 0.00 0.33 2.62 -18.79 1.54 0.00
Food processing 1.49 4.79 23.8 -100 0.00 -9.63 -3.63 -15.61 -10.16 -10.18 -11.11 -7.73 -1.37 36.42 31.13 -4.24 0.13 -4.68
Wood processing 0.70 0.24 28.1 -100 0.00 -2.56 -1.43 -21.67 -3.25 -3.21 -3.30 -3.13 5.07 13.68 322.19 0.13 0.65 -7.77
Refined petroleum 0.53 0.33 18.3 -100 0.00 -3.16 -0.88 -15.28 -4.13 -4.19 -5.63 -3.44 -1.28 8.84 58.68 -5.37 1.48 -4.99
Miscellaneous industries 0.96 -0.15 14.6 -100 0.00 -9.16 -4.53 -13.39 -9.76 -9.87 -11.19 -5.74 -2.89 39.87 23.97 -7.52 1.63 -5.87
Tradable services 0.67 0.36 0.0 -100 0.00 -8.08 -2.87 0.36 -8.38 -8.38 -8.04 -8.06 0.56 24.00 -29.73 -0.65 -1.99 -4.35
Public services 0.00 0.00 0.0 -100 0.00 -7.67 0.00 0.00 -7.67 -7.67 -7.67 0.00 0.00 0.00 0.00 0.00 0.00 0.00
All sectors 0.77 0.76 11.79 -100 0.00 -7.57 -1.50 -10.85 -8.67 -8.69 -9.01 -7.72 -0.03 14.11 13.91 -2.41 -0.46 -4.62
FULL LIBERALIZATION WITH VAT TAX
Foodstuff agriculture 3.39 7.31 12.2 -100 0.00 -6.35 -0.81 -0.43 -6.41 -6.41 -6.35 -6.28 -0.63 28.22 -23.60 -0.21 -0.42 -1.16
Cash crops agriculture 1.73 0.51 8.0 -100 0.00 -2.28 -0.88 -7.35 -3.38 -3.36 -3.36 -3.30 4.78 16.91 30.36 -0.93 -0.91 -1.61
Forestry 0.80 0.54 7.4 -100 0.00 -4.68 -1.98 2.70 -4.85 -4.85 -4.81 -4.80 2.34 18.27 -30.39 1.97 1.79 -1.89
Crude oil 0.49 0.44 3.2 -100 0.00 0.42 0.44 -2.67 -1.05 -1.05 -2.60 0.00 0.00 0.33 2.62 -18.79 1.54 0.00
Food processing 1.49 4.79 23.8 -100 0.00 -6.84 -2.31 -13.12 -7.22 -7.03 -8.09 -4.23 -1.66 25.74 36.34 -3.08 1.79 -1.88
Wood processing 0.70 0.24 28.1 -100 0.00 -2.05 -1.09 -13.33 -2.62 1.74 1.68 9.20 3.08 11.38 198.00 0.17 0.49 -7.30
Refined petroleum 0.53 0.33 18.3 -100 0.00 -2.62 -0.64 -11.97 -3.45 -0.75 -2.20 1.83 -1.40 7.27 57.39 -4.91 1.76 -3.58
Miscellaneous industries 0.96 -0.15 14.6 -100 0.00 -5.02 -2.43 -5.33 -5.33 -3.76 -4.32 4.49 0.18 22.72 10.95 -1.67 2.00 -5.87
Tradable services 0.67 0.36 0.0 -100 0.00 -5.43 -1.82 0.36 -5.63 -4.28 -4.09 -3.44 0.04 16.25 -16.46 0.00 -0.76 -2.03
Public services 0.00 0.00 0.0 -100 0.00 -4.73 0.00 0.00 -4.73 -4.73 -4.73 0.00 0.00 0.00 0.00 0.00 0.00 0.00
All sectors 0.77 0.76 11.79 -100 0.00 -4.92 -0.79 -5.71 -5.64 -4.59 -4.72 -2.40 -0.01 9.65 9.53 -0.80 0.44 -2.64
Source: Authors’ construction based on their simulation results (for changes in domestic prices and volumes) and on GTAP results (for changes in world prices and tariffs).
(*) Exclusive of taxes (**) Inclusive of all taxes on goods

34
Table 9: Full liberalization with consumption tax vs. VAT tax – Sectoral effects on production factor markets Unskilled labor Skilled labor Composite labor Capital Land
Production Sectors Share
Percent change in demand
Percent change in wage rate Share
Percent change in demand
Percent change in wage rate
Share of unskilled labor on
composite labor
Percent change in demand
Percent change in wage rate
Percent change in demand
Percent change in
rate of return
Percent change in demand
Percent change in
rate of return
FULL LIBERALIZATION WITH CONSUMPTION TAX Foodstuff agriculture 53.82 -1.20 -10.50 13.36 -1.23 -10.40 69.73 -1.21 -10.47 0.00 -11.90 -5.99 -4.30Cash crops agriculture 3.80 17.03 -10.50 0.97 17.00 -10.40 69.22 17.02 -10.47 0.00 10.40 11.36 -4.30AGRICULTURAL 57.62 0.00 -10.50 14.32 0.00 -10.40 69.70 0.00 -10.47 0.00 -6.72 0.00 -4.30Forestry 1.04 8.41 -9.70 1.26 8.27 -9.60 32.20 8.32 -9.63 0.00 0.60 - - Crude oil 0.32 0.00 -1.10 0.38 0.00 -1.10 32.21 0.00 -1.10 0.00 2.20 - - Food processing 2.62 -3.58 -9.70 7.43 -3.71 -9.60 16.80 -3.68 -9.61 0.00 -14.00 - - Wood processing 0.31 21.46 -9.70 1.64 21.29 -9.60 9.66 21.31 -9.62 0.00 17.00 - - Refined petroleum 0.05 -12.36 -9.70 0.13 -12.47 -9.60 18.61 -12.45 -9.63 0.00 -24.30 - - Miscellaneous industries 7.02 -5.80 -9.70 11.94 -5.92 -9.60 25.16 -5.89 -9.62 0.00 -16.60 - - INDUSTRIAL 11.37 -3.11 -9.45 22.78 -2.39 -9.45 22.20 -2.55 -9.45 0.00 -5.50 - - Tradable services 30.73 1.15 -9.70 53.19 1.02 -9.60 24.83 1.06 -9.62 0.00 -8.30 - - Public services 0.29 0.00 -1.10 9.71 0.00 -1.10 1.66 0.00 -1.10 0.00 -22.70 - - SERVICES 31.01 1.14 -9.62 62.90 0.87 -8.30 21.99 0.93 -8.59 0.00 -9.27 - - NON AGRICULTURAL 42.38 0.00 -9.58 85.68 0.00 -8.60 22.05 0.00 -8.81 0.00 -7.35 - - ALL SECTORS 100.00 0.00 -10.11 100.00 0.00 -8.86 36.38 0.00 -9.31 0.00 -7.29 0.00 -4.30
FULL LIBERALIZATION WITH VAT TAX Foodstuff agriculture 53.82 -0.71 -6.70 13.36 -0.73 -6.70 69.73 -0.72 -6.70 0.00 -7.60 -3.62 -2.90Cash crops agriculture 3.80 10.09 -6.70 0.97 10.07 -6.70 69.22 10.08 -6.70 0.00 6.10 6.87 -2.90AGRICULTURAL 57.62 0.00 -6.70 14.32 0.00 -6.70 69.70 0.00 -6.70 0.00 -4.42 0.00 -2.90Forestry 1.04 4.57 -6.10 1.26 4.60 -6.20 32.20 4.59 -6.17 0.00 -0.40 - - Crude oil 0.32 0.00 -4.60 0.38 0.00 -4.60 32.21 0.00 -4.60 0.00 1.70 - - Food processing 2.62 -4.48 -6.10 7.43 -4.45 -6.20 16.80 -4.45 -6.19 0.00 -11.70 - - Wood processing 0.31 12.42 -6.10 1.64 12.46 -6.20 9.66 12.46 -6.18 0.00 9.70 - - Refined petroleum 0.05 -13.67 -6.10 0.13 -13.56 -6.20 18.61 -13.58 -6.17 0.00 -22.70 - - Miscellaneous industries 7.02 0.36 -6.10 11.94 0.39 -6.20 25.16 0.38 -6.18 0.00 -5.70 - - INDUSTRIAL 11.37 -0.12 -6.06 22.78 -0.17 -6.17 22.20 -0.16 -6.15 0.00 -3.06 - - Tradable services 30.73 0.04 -6.10 53.19 0.07 -6.20 24.83 0.07 -6.18 0.00 -6.10 - - Public services 0.29 0.00 -4.60 9.71 0.00 -4.60 1.66 0.00 -4.60 0.00 -5.30 - - SERVICES 31.01 0.04 -6.09 62.90 0.06 -5.95 21.99 0.06 -5.98 0.00 -6.05 - - NON AGRICULTURAL 42.38 0.00 -6.08 85.68 0.00 -6.01 22.05 0.00 -6.03 0.00 -4.53 - - ALL SECTORS 100.00 0.00 -6.44 100.00 0.00 -6.11 36.38 0.00 -6.23 0.00 -4.52 0.00 -2.90Source: Authors’ construction based on their simulation results and 2001 Cameroon SAM.

35
Table 10: Doha scenario with VAT as the replacement tax – Sectoral effects on Prices and Volumes of goods and services Percent changes in world prices from GTAP simulations
Tariffs (in percent) Percent changes in domestic market prices Percent changes in volumes
Production Sectors World Export Prices
World Import Prices
Original tariffs
Cut in original tariffs
in Percent
New tariffs
Producer prices
Export prices
Import prices
Prices of locally
sold output (*)
Prices of locally sold output (**)
Prices of composite goods (**)
Consumer prices
(**) Output Exports Imports
Locally sold
domestic output
Total demand of composite
goods
Household consumption
Foodstuff agriculture 0.015 2.233 12.2 -2.77 11.9 0.44 0.19 1.95 0.44 0.44 0.46 0.46 0.04 -1.03 -6.15 0.06 0.00 -0.1
Cash crops agriculture -0.177 -0.284 8.0 -0.49 8.0 0.09 -0.02 -0.32 0.16 0.16 0.16 0.16 -0.30 -0.95 3.45 0.23 0.23 0.0
Forestry -0.122 -0.108 7.4 -1.83 7.3 -0.02 -0.06 0.03 -0.01 -0.01 -0.01 -0.01 -0.14 -0.36 -0.32 -0.11 -0.11 0.0
Crude oil 0.111 0.114 3.2 0.00 3.2 0.11 0.11 0.11 0.11 0.11 0.11 0.00 0.00 0.00 -0.04 0.00 -0.03 0.0
Food processing 0.115 3.234 23.8 -8.70 21.7 0.60 0.29 1.54 0.63 0.63 0.76 0.97 0.47 -1.07 -3.87 0.60 0.05 -0.4
Wood processing -0.061 -0.064 28.1 -0.54 27.9 -0.05 -0.05 0.05 -0.05 0.04 0.04 0.21 -0.06 -0.05 -0.06 -0.03 -0.03 -0.2
Refined petroleum 0.105 0.073 18.3 -0.27 18.3 0.04 0.08 0.12 0.02 0.08 0.09 0.13 -0.04 0.14 -0.26 -0.12 -0.13 -0.2
Miscellaneous industries 0.103 0.017 14.6 -0.74 14.5 0.07 0.08 0.12 0.07 0.11 0.11 0.24 0.05 0.13 -0.02 0.05 0.03 -0.2
Tradable services -0.064 -0.024 0.0 -0.00 0.0 0.02 -0.02 -0.02 0.03 0.06 0.05 0.07 -0.09 -0.25 0.24 -0.07 -0.05 -0.2
Public services 0.000 0.000 0.0 -0.00 0.0 0.38 0.00 0.00 0.38 0.38 0.38 0.00 0.00 0.00 0.00 0.00 0.00 0.0
All sectors 0.044 0.471 11.79 -1.10 11.66 0.17 0.07 0.29 0.19 0.21 0.22 0.34 0.00 -0.15 -0.55 0.06 -0.01 -0.2
Source: Authors’ construction based on their simulation results (for changes in domestic prices and volumes) and on GTAP results (for changes in world prices and tariffs).
(*) Exclusive of taxes (**) Inclusive of all taxes on goods

36
Table 11: Doha scenario with VAT as the replacement tax – Sectoral effects on production factor markets Unskilled labor Skilled labor Composite labor Capital Land
Production Sectors Share
Percent change in demand
Percent change in wage rate
Share Percent
change in demand
Percent change in wage rate
Share of unskilled labor on composite
labor
Percent change in demand
Percent change in wage rate
Percent change in demand
Percent change in
rate of return
Percent change in demand
Percent change in
rate of return
Foodstuff agriculture 53.82 0.04 0.50 13.36 0.04 0.50 69.73 0.04 0.50 0.00 0.60 0.23 0.30Cash crops agriculture 3.80 -0.61 0.50 0.97 -0.61 0.50 69.22 -0.61 0.50 0.00 -0.30 -0.43 0.30AGRICULTURAL 57.62 0.00 0.50 14.32 0.00 0.50 69.70 0.00 0.50 0.00 0.39 0.00 0.30Forestry 1.04 -0.23 0.00 1.26 -0.28 0.10 32.20 -0.26 0.07 0.00 -0.30 - - Crude oil 0.32 0.00 -0.80 0.38 0.00 -0.80 32.21 0.00 -0.80 0.00 0.10 - - Food processing 2.62 1.34 0.00 7.43 1.29 0.10 16.80 1.30 0.09 0.00 1.80 - - Wood processing 0.31 -0.20 0.00 1.64 -0.24 0.10 9.66 -0.24 0.08 0.00 -0.30 - - Refined petroleum 0.05 -0.33 0.00 0.13 -0.45 0.10 18.61 -0.43 0.07 0.00 -0.60 - - Miscellaneous industries 7.02 0.13 0.00 11.94 0.08 0.10 25.16 0.10 0.08 0.00 0.20 - - INDUSTRIAL 11.37 0.36 -0.02 22.78 0.43 0.08 22.20 0.41 0.06 0.00 0.45 - - Tradable services 30.73 -0.13 0.00 53.19 -0.18 0.10 24.83 -0.17 0.08 0.00 -0.20 - - Public services 0.29 0.00 -0.80 9.71 0.00 -0.80 1.66 0.00 -0.80 0.00 3.40 - - SERVICES 31.01 -0.13 -0.01 62.90 -0.16 -0.04 21.99 -0.15 -0.03 0.00 0.04 - - NON AGRICULTURAL 42.38 0.00 -0.01 85.68 0.00 -0.01 22.05 0.00 -0.01 0.00 0.25 - - ALL SECTORS 100.00 0.00 0.28 100.00 0.00 0.07 36.38 0.00 0.15 0.00 0.26 0.00 0.30Source: Authors’ construction based on their simulation results and Cameroon SAM.

37
ACKNOWLEDGEMENTS The authors are grateful to Veronique Robichaud for her technical assistance, and to
Nabil Annabi, Thomas Hertel, Patrick Osakwe and the participants at the Conference on “Putting Development Back into the Doha Agenda” held in The Hague, December 2-4, 2004, for their valuable comments. They remain of course responsible for all possible errors and omissions.
1 Cameroon reached the Decision Point in October 2000 and is now making efforts to reach the Completion Point, within the framework of the Enhanced HIPC Initiative.
2 For a discussion on poverty impacts of trade, see Hertel and Reimer (2004).
3 If not indicated precisely, statistics presented in this subsection have been processed from Cameroon National Institute of Statistics (2004).
4 Cameroon and other CFA franc countries experienced a 50 percent devaluation in January 1994.
5 The coverage rate, that is the ratio of exports over the imports, may be seen as the ability of a country to pay its imports using its export revenues.
6 Other products that have been among the top five exports for at least one year during the last decade are: crude wood, raw aluminum, coffee and bananas.
7 The EU is considered here as the 15 member-countries of 2003, before its enlargement to 25 members in 2004.
8 Elasticity of substitution is equal to 4.3 for this product, both on the export and import sides (Table 1).
9 Given a value added rate of 73% and a capital/labor ratio as low as 0.26 (Table 1).
10 Export prices of Cameroonian cash crops increase more than world prices: 1.85 vs. 1.73 percent.
11 The increase in imports of wood processing is impressive (310.08 percent), but it is important to remember that the initial import penetration ratio is very low (0.2 percent).
12 The 13.9 percent wage reduction for skilled labor in the agriculture sector due to Cameroonian liberalization is partially compensated by a 3.7 percent increase due to free world trade, such that the net impact is a reduction of the agricultural skilled wage rate by 10.4 percent.
13 VAT systems vary from “embryonic” to asymptotic “pure” types. All non pure VAT systems are qualified as imperfect VATs. In a combinatory exercise, Shoup (1990) counts 576 VAT types. For more information on VAT modalities and types, see: Shoup (1990) and Cnossen (1991). We may consider a pure VAT system as one where:
- All activities are subject to and included within the VAT system, no matter what the stage of manufacturing or distribution of products concerned.
- The territory jurisdictional rule is the destination principle: for all products, the VAT applies to imports and their domestic substitutes at the same rate and exports are exonerated.
- Consumption is the only constitutive element of the VAT base. - There is a unique uniform VAT rate, different from zero. - The outwards VAT rate (applied to a VAT base exclusive of VAT) is preferred to the inwards VAT rate
(applied to a VAT base inclusive of VAT). - The computation of the payable VAT is done by the way of the “invoice method”: VAT collected from the
sale of outputs (downstream VAT) minus VAT paid on inputs (upstream VAT).

38
- VAT rebates are deducted without delay, and repaid in cash to firms for which downstream VAT is
structurally higher than upstream VAT (Exporters and firms which carry out sizeable investments).