
The disconfirmation of expectations paradigm for an industrial ...
241
University of Wollongong University of Wollongong Research Online Research Online University of Wollongong Thesis Collection 1954-2016 University of Wollongong Thesis Collections 1993 The disconfirmation of expectations paradigm for an industrial (business- The disconfirmation of expectations paradigm for an industrial (business- to-business), professional service : an empirical examination and extension to-business), professional service : an empirical examination and extension Paul G. Patterson University of Wollongong Follow this and additional works at: https://ro.uow.edu.au/theses University of Wollongong University of Wollongong Copyright Warning Copyright Warning You may print or download ONE copy of this document for the purpose of your own research or study. The University does not authorise you to copy, communicate or otherwise make available electronically to any other person any copyright material contained on this site. You are reminded of the following: This work is copyright. Apart from any use permitted under the Copyright Act 1968, no part of this work may be reproduced by any process, nor may any other exclusive right be exercised, without the permission of the author. Copyright owners are entitled to take legal action against persons who infringe their copyright. A reproduction of material that is protected by copyright may be a copyright infringement. A court may impose penalties and award damages in relation to offences and infringements relating to copyright material. Higher penalties may apply, and higher damages may be awarded, for offences and infringements involving the conversion of material into digital or electronic form. Unless otherwise indicated, the views expressed in this thesis are those of the author and do not necessarily Unless otherwise indicated, the views expressed in this thesis are those of the author and do not necessarily represent the views of the University of Wollongong. represent the views of the University of Wollongong. Recommended Citation Recommended Citation Patterson, Paul G., The disconfirmation of expectations paradigm for an industrial (business-to-business), professional service : an empirical examination and extension, Doctor of Philosophy thesis, Department of Management, University of Wollongong, 1993. https://ro.uow.edu.au/theses/1471 Research Online is the open access institutional repository for the University of Wollongong. For further information contact the UOW Library: [email protected]
-
Upload
khangminh22 -
Category
Documents
-
view
0 -
download
0
Transcript of The disconfirmation of expectations paradigm for an industrial ...
University of Wollongong University of Wollongong
Research Online Research Online
University of Wollongong Thesis Collection 1954-2016 University of Wollongong Thesis Collections
1993
The disconfirmation of expectations paradigm for an industrial (business-The disconfirmation of expectations paradigm for an industrial (business-
to-business), professional service : an empirical examination and extension to-business), professional service : an empirical examination and extension
Paul G. Patterson University of Wollongong
Follow this and additional works at: https://ro.uow.edu.au/theses
University of Wollongong University of Wollongong
Copyright Warning Copyright Warning
You may print or download ONE copy of this document for the purpose of your own research or study. The University
does not authorise you to copy, communicate or otherwise make available electronically to any other person any
copyright material contained on this site.
You are reminded of the following: This work is copyright. Apart from any use permitted under the Copyright Act
1968, no part of this work may be reproduced by any process, nor may any other exclusive right be exercised,
without the permission of the author. Copyright owners are entitled to take legal action against persons who infringe
their copyright. A reproduction of material that is protected by copyright may be a copyright infringement. A court
may impose penalties and award damages in relation to offences and infringements relating to copyright material.
Higher penalties may apply, and higher damages may be awarded, for offences and infringements involving the
conversion of material into digital or electronic form.
Unless otherwise indicated, the views expressed in this thesis are those of the author and do not necessarily Unless otherwise indicated, the views expressed in this thesis are those of the author and do not necessarily
represent the views of the University of Wollongong. represent the views of the University of Wollongong.
Recommended Citation Recommended Citation Patterson, Paul G., The disconfirmation of expectations paradigm for an industrial (business-to-business), professional service : an empirical examination and extension, Doctor of Philosophy thesis, Department of Management, University of Wollongong, 1993. https://ro.uow.edu.au/theses/1471
Research Online is the open access institutional repository for the University of Wollongong. For further information contact the UOW Library: [email protected]
TH E DISCONFTRMATTON O F EXPECTATIONS PARADIGM FO R AN
INDUSTRIAL (BUSINESS-TO-BUSINESS), PROFESSIONAL SERVICE - AN
EM PIRICAL EXAMINATION AND EXTENSION
A thesis submitted in fulfilment of the requirements
for the award of the degree
Doctor of Philosophy in M arketing
from
University of Wollongong
by
UNIVERSITY OF ' WOLLONGONG
LIBRARY
Paul G. PattersonB.Bus (UTS), MCom (UNSW), FAIM
D epartm ent of M anagem ent M arch 1993

I certify th a t this work is original and has not been subm itted fo r a degree in
any other university or institution.
Paul G. Patterson
Acknowledgements
The completion of this dissertation represents the attainment of an important personal goal for me. However, a number of individuals have assisted greatly along the way, providing encouragement, guidance, time and personal sacrifice to assist me. I wish to acknowledge their contributions here.
Firstly, I am indebted to my committee chairman, Professor Lester Johnson for his invaluable assistance throughout. His constructively critical and penetrating comments have been of great assistance, as has been his attention to detail. Furthermore, with his broad experience and strong commitment to PhD students, I knew that with his guidance and input I would complete the project successfully. I would also like to express my gratitude to Dr. Kwaku Atuahene-Gima and Dr. Philip Dawes. In a lengthy project such as this, it is easy to sometimes "fail to see the wood for the trees". Their guidance, insightful comments and encouragement proved to be a source of inspiration throughout.
I am grateful for the financial assistance provided by Price Waterhouse Urwick Pty Ltd. Furthermore, I am indebted to Mike Withford for arranging this assistance and in helping to provide a data base of client projects. I also wish to thank Dr. Blair Hunt and Brian McCarthy from the office of Public Management in the New South Wales government. Gaining access to a sampling frame of, on many occasions sensitive, consultancy projects, is exceedingly difficult. Their willingness to assist in this regard is appreciated. Thanks also go to Mrs. Irene Wilton and Mrs. Kim McCall for their cheerful assistance at various stages, but especially in typing the various path diagrams and other complex tables.
I would also like to express my gratitude to my children, Mark, Kylie and Angela for their encouragement and understanding throughout, but especially when time pressures kept me away from family activities.
Last, but by no means least, I am indebted to my wife Robyn for her support throughout. She played many roles during the project. She assisted in the logistically complex data collection phase, especially in following up nonrespondents - so critical to the success of longitudinal studies such as this. Her preparedness to master the word processor made life easier for me, and her insightful comments on the manuscript at times are appreciated. Finally, she took on much of the responsibility for "keeping the home fires burning" while I was immersed in my research and finally the task of writing the final document. This degree is partly hers. I will always be grateful to her for assistance and support.
i i i
ABSTRACT
Customer satisfaction/dissatisfaction (CS/D) is one of the most important and pervasive concepts in marketing and a major outcome of most marketing activity. Although there has been considerable research into modelling the determinants of CS/D, the research to date has almost entirely concentrated on products/goods (primarily low-involvement, non-durables). Almost no attention has been paid to testing these models with services in general, nor with industrial or business-to- business, professional services in particular.
Service businesses, but especially professional services, have unique characteristics which make them operationally different from manufacturing businesses. Due to these differences and the growing importance of services in our economy, separate studies modelling the determinants of CS/D are warranted. The dominant model to date, explaining CS/D is the discontinuation of expectations paradigm.
The primary purpose of this research was to empirically test for the first time, and extend our understanding of the determinants of CS/D in the context of a business- to-business, professional service (i.e., management consulting services). Previous studies have almost exclusively focussed on a few key antecedent variables (e.g., expectations, performance, discontinuation) or treated other potentially important explanatory variables in isolation. This research examined the simultaneous impact of these key constructs and additional variables, namely fairness (equity), prior attitudes, purchase situation (novelty, importance, and complexity) and individual- level variables in a causal path framework.
The data used to test the path model was obtained from a two-stage longitudinal survey of one hundred and twenty eight client organisations. Overall the path model proved to be rich in its portrayal of the complex relationships that precede and determine CS/D. Six statistically significant antecedent variables (discontinuation, performance, fairness, uncertainty, stakeholding and reliability dimension of prior attitudes) explained 84% of the variance in CS/D. The only variable found to impact upon repeat purchase intentions was satisfaction. When both direct and indirect effects are accounted for, the performance variable had by far the greatest overall impact on CS/D, closely followed by the combined impact of the individual difference variables (uncertainty and stakeholding). Pre-purchase expectations did not have the same dominant impact it has exhibited in product studies. Finally, an analysis of the expectations and performance items revealed dimensions (factors) substantively different from the previous consumer services studies (e.g., SERVQUAL).
These findings considerably aid our understanding of the complex, process nature of CS/D determination for services in general, and business services in particular. The findings have significant implications for managers of business, professional services.
i v
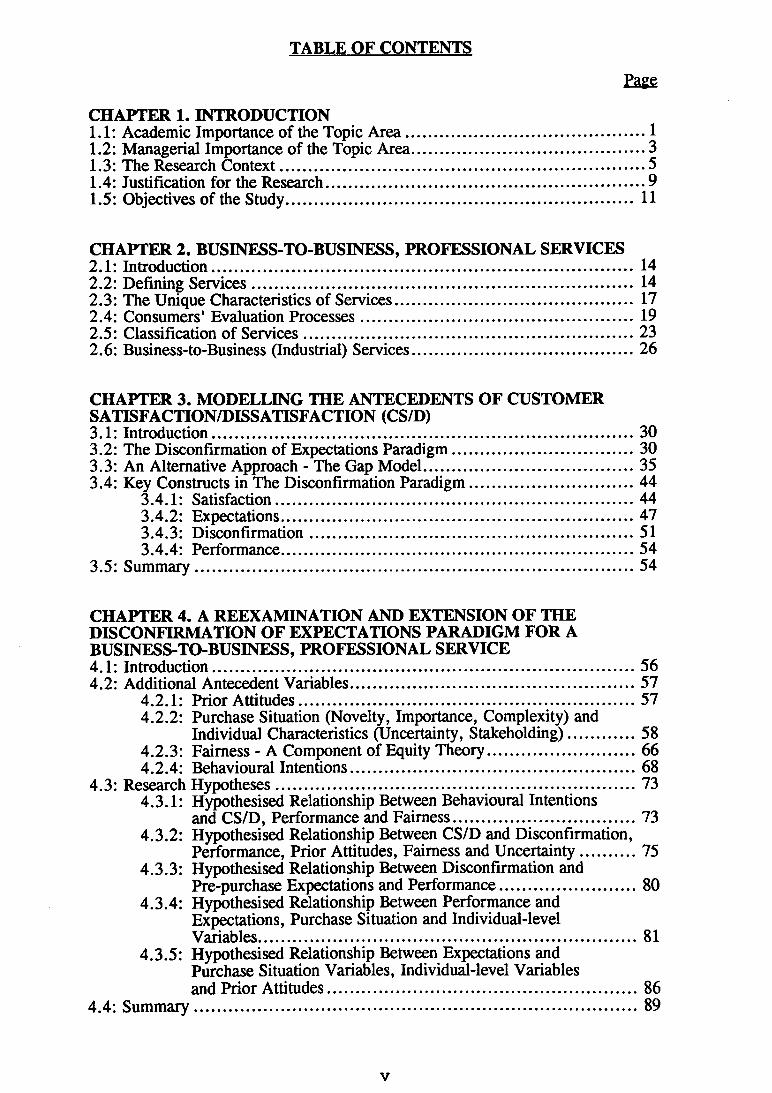
TABLE OF CONTENTS
CHAPTER 1. INTRODUCTION1.1: Academic Importance of the Topic A rea........................................................... 11.2: Managerial Importance of the Topic Area..........................................................31.3: The Research Context........................................................................................... 51.4: Justification for the Research............................................................................... 91.5: Objectives of the Study...................................................................................... 11
Page
CHAPTER 2. BUSINESS-TO-BUSINESS, PROFESSIONAL SERVICES2.1: Introduction......................................................................................................... 142.2: Defining Services............................................................................................... 142.3: The Unique Characteristics of Services........................................................... 172.4: Consumers' Evaluation Processes.................................................................... 192.5: Classification of Services....................................................................................232.6: Business-to-Business (Industrial) Services.........................................................26
CHAPTER 3. MODELLING THE ANTECEDENTS OF CUSTOMER SATISFACTION/DISSATISFACTION (CS/D)3.1: Introduction...........................................................................................................303.2: The Disconfirmation of Expectations Paradigm...............................................303.3: An Alternative Approach - The Gap Model......................................................353.4: Key Constructs in The Disconfirmation Paradigm.......................................... 44
3.4.1: Satisfaction...........................................................................................443.4.2: Expectations......................................................................................... 473.4.3: Disconfirmation.................................................................................. 513.4.4: Performance......................................................................................... 54
3.5: Summary....................................................................................... 54
CHAPTER 4. A REEXAMINATION AND EXTENSION OF THE DISCONFIRMATION OF EXPECTATIONS PARADIGM FOR A BUSINESS-TO-BUSINESS, PROFESSIONAL SERVICE4.1: Introduction........................................................................................................... 564.2: Additional Antecedent Variables........................................................................ 57
4.2.1: Prior Attitudes..................................................................................... 574.2.2: Purchase Situation (Novelty, Importance, Complexity) and
Individual Characteristics (Uncertainty, Stakeholding)..................584.2.3: Fairness - A Component of Equity Theory...................................... 664.2.4: Behavioural Intentions.........................................................................68
4.3: Research Hypotheses........................................................................................... 734.3.1: Hypothesised Relationship Between Behavioural Intentions
and CS/D, Performance and Fairness...............................................734.3.2: Hypothesised Relationship Between CS/D and Disconfirmation,
Performance, Prior Attitudes, Fairness and Uncertainty............. 754.3.3: Hypothesised Relationship Between Disconfirmation and
Pre-purchase Expectations and Performance....................................804.3.4: Hypothesised Relationship Between Performance and
Expectations, Purchase Situation and Individual-levelVariables................................................................................................ 81
4.3.5: Hypothesised Relationship Between Expectations andPurchase Situation Variables, Individual-level Variablesand Prior Attitudes...............................................................................86
4.4: Summary................................................................................................................ 89
v
Page
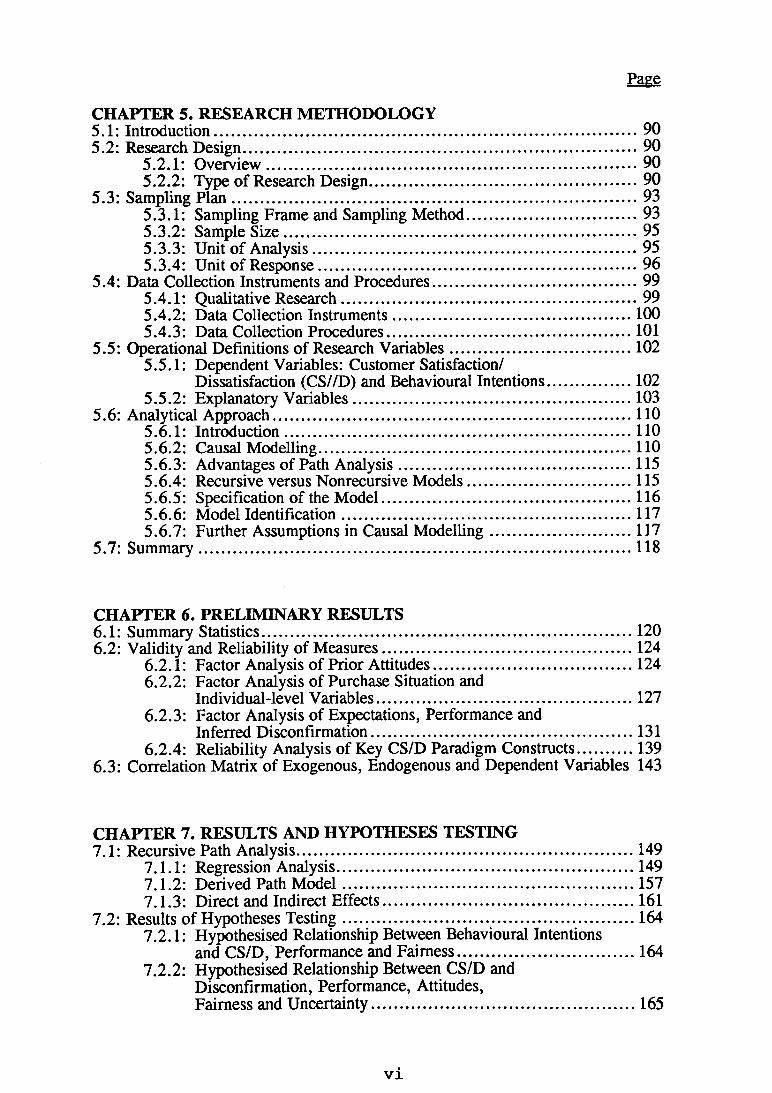
CHAPTER 5. RESEARCH METHODOLOGY5.1: Introduction......................................................................................................... 905.2: Research Design....................................................................................................90
5.2.1: Overview.............................................................................................. 905.2.2: Type of Research Design.................................................................... 90
5.3: Sampling P lan .......................................................................................................935.3.1: Sampling Frame and Sampling Method............................................935.3.2: Sample S ize..........................................................................................955.3.3: Unit of Analysis.................................................................................. 955.3.4: Unit of Response.................................................................................96
5.4: Data Collection Instruments and Procedures.................................................... 995.4.1: Qualitative Research........................................................................... 995.4.2: Data Collection Instruments.............................................................1005.4.3: Data Collection Procedures.............................................................. 101
5.5: Operational Definitions of Research Variables.............................................. 1025.5.1: Dependent Variables: Customer Satisfaction/
Dissatisfaction (CS//D) and Behavioural Intentions......................1025.5.2: Explanatory Variables.......................................................................103
5.6: Analytical Approach...........................................................................................1105.6.1: Introduction........................................................................................1105.6.2: Causal Modelling............................................................................... 1105.6.3: Advantages of Path Analysis........................................................... 1155.6.4: Recursive versus Nonrecursive M odels..........................................1155.6.5: Specification of the Model............................................................... 1165.6.6: Model Identification......................................................................... 1175.6.7: Further Assumptions in Causal M odelling.................................... 117
5.7: Summary............................................................................................................. 118
CHAPTER 6. PRELIMINARY RESULTS6.1: Summary Statistics..............................................................................................1206.2: Validity and Reliability of Measures............................................................... 124
6.2.1: Factor Analysis of Prior Attitudes...................................................1246.2.2: Factor Analysis of Purchase Situation and
Individual-level Variables.................................................................1276.2.3: Factor Analysis of Expectations, Performance and
Inferred Disconfirmation.................................................................. 1316.2.4: Reliability Analysis of Key CS/D Paradigm Constructs...............139
6.3: Correlation Matrix of Exogenous, Endogenous and Dependent Variables 143
CHAPTER 7. RESULTS AND HYPOTHESES TESTING7.1: Recursive Path Analysis....................................................................................149
7.1.1: Regression Analysis........................................................................... 1497.1.2: Derived Path M odel..................................................... 1577.1.3: Direct and Indirect Effects................................................................161
7.2: Results of Hypotheses Testing........................................................................ 1647.2.1: Hypothesised Relationship Between Behavioural Intentions
and CS/D, Performance and Fairness............................................1647.2.2: Hypothesised Relationship Between CS/D and
Disconfirmation, Performance, Attitudes,Fairness and Uncertainty...................................................................165
v i
Page
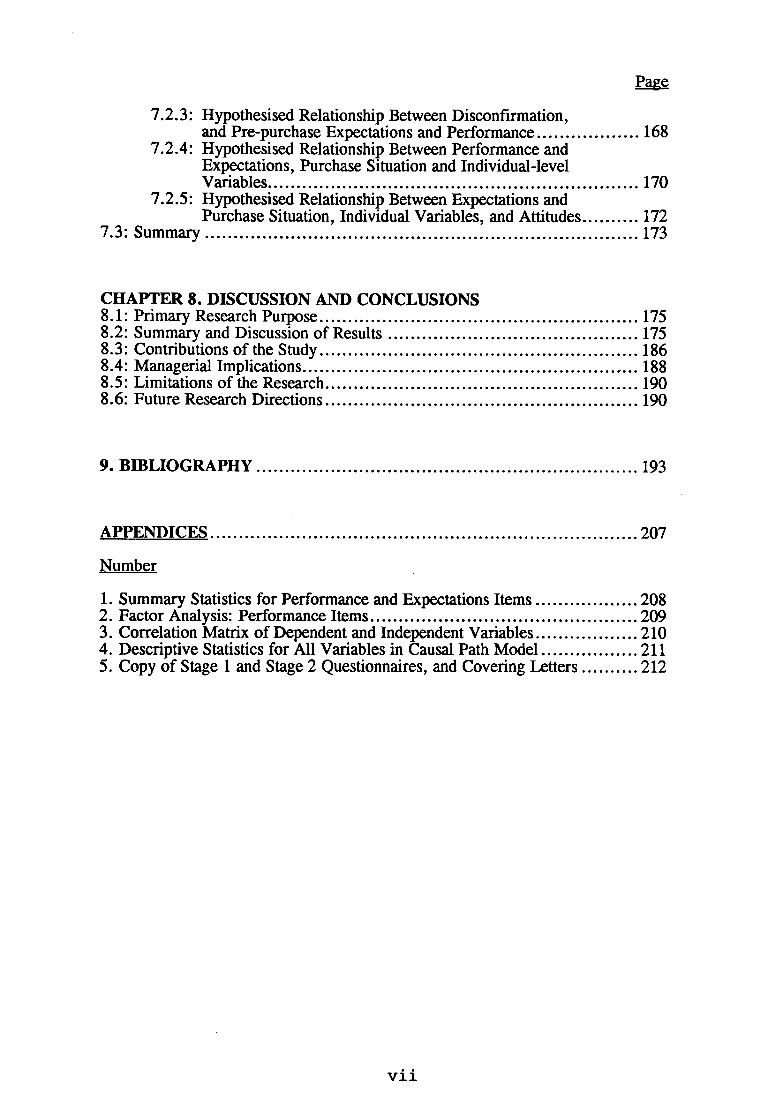
7.2.3: Hypothesised Relationship Between Disconfirmation,and Pre-purchase Expectations and Performance.........................168
7.2.4: Hypothesised Relationship Between Performance and Expectations, Purchase Situation and Individual-levelVariables..............................................................................................170
7.2.5: Hypothesised Relationship Between Expectations andPurchase Situation, Individual Variables, and Attitudes.............. 172
7.3: Summary............................................................................................................. 173
CHAPTER 8. DISCUSSION AND CONCLUSIONS8.1: Primary Research Purpose.................................................................................1758.2: Summary and Discussion of Results............................................................... 1758.3: Contributions of the Study................................................................................ 1868.4: Managerial Implications................................................................................ 1888.5: Limitations of the Research............................................................................... 1908.6: Future Research Directions............................................................................... 190
9. BIBLIOGRAPHY...............................................................................................193
APPENDICES.......................................................................................................... 207
Number
1. Summary Statistics for Performance and Expectations Item s.........................2082. Factor Analysis: Performance Items.................................................................. 2093. Correlation Matrix of Dependent and Independent Variables.........................2104. Descriptive Statistics for All Variables in Causal Path M odel ................. 2115. Copy of Stage 1 and Stage 2 Questionnaires, and Covering Letters..............212
v i i
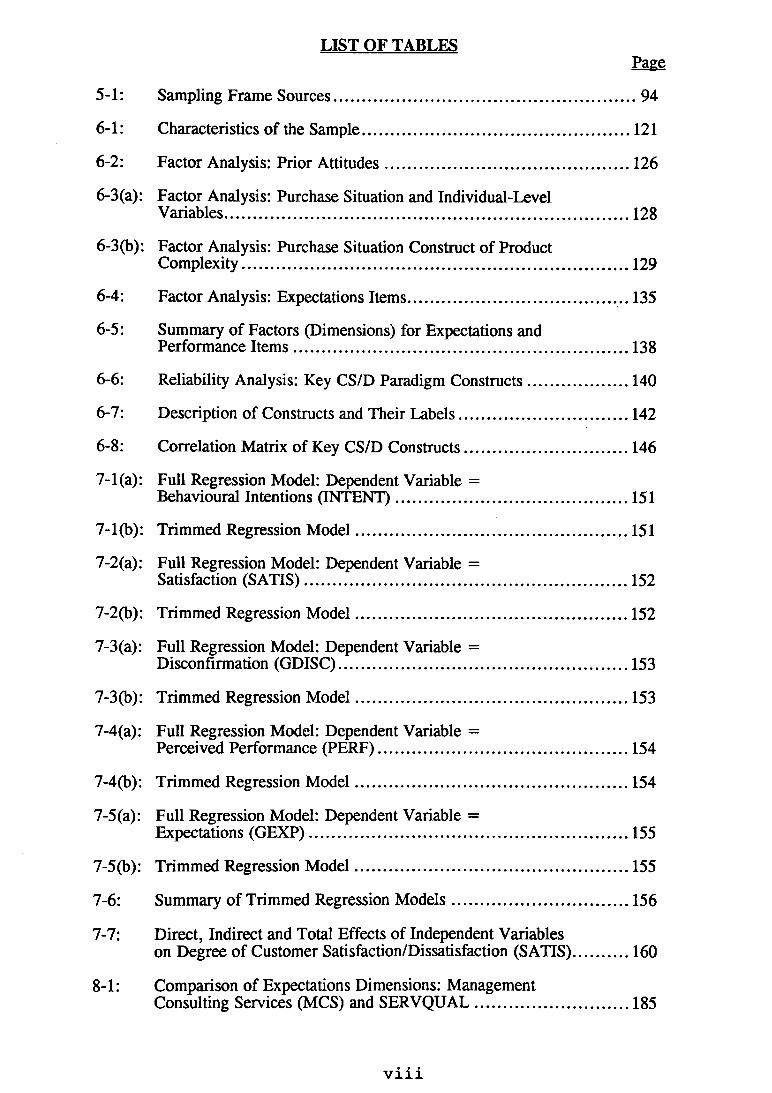
LIST OF TABLES
5- 1: Sampling Frame Sources............................................................
6- 1 : Characteristics of the Sample....................................................
6-2: Factor Analysis: Prior Attitudes..............................................
6-3(a): Factor Analysis: Purchase Situation and Individual-LevelVariables......................................................................................
6-3(b): Factor Analysis: Purchase Situation Construct of ProductComplexity..................................................................................
6-4: Factor Analysis: Expectations Items........................................
6-5: Summary of Factors (Dimensions) for Expectations andPerformance Item s.....................................................................
6-6: Reliability Analysis: Key CS/D Paradigm Constructs..........
6-7: Description of Constructs and Their Labels................ ...........
6- 8: Correlation Matrix of Key CS/D Constructs...........................
7- 1(a): Full Regression Model: Dependent Variable =Behavioural Intentions (INTENT)...........................................
7-1(b): Trimmed Regression M odel.....................................................
7-2(a): Full Regression Model: Dependent Variable =Satisfaction (SATIS)..................................................................
7-2(b): Trimmed Regression M odel.....................................................
7-3(a): Full Regression Model: Dependent Variable =Disconfirmation (GDISC).........................................................
7-3 (b): Trimmed Regression M odel.....................................................
7-4(a): Full Regression Model: Dependent Variable =Perceived Performance (PERF)...............................................
7-4(b): Trimmed Regression M odel.....................................................
7-5(a): Full Regression Model: Dependent Variable =Expectations (GEXP).................................................................
7-5 (b): Trimmed Regression M odel.....................................................
7-6: Summary of Trimmed Regression M odels.............................
7- 7: Direct, Indirect and Total Effects of Independent Variableson Degree of Customer Satisfaction/Dissatisfaction (SATIS)
8- 1: Comparison of Expectations Dimensions: ManagementConsulting Services (MCS) and SERVQUAL.......................
v i i i
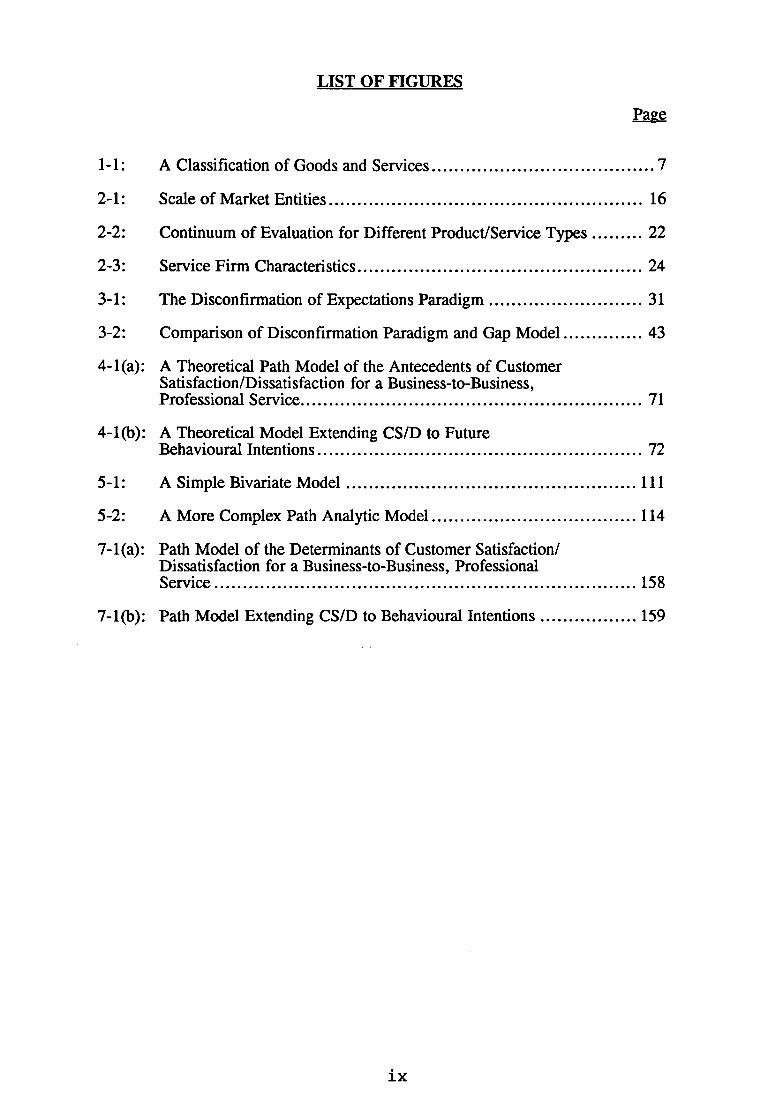
LIST OF FIGURES
1- 1: A Classification of Goods and Services......................................................... 7
2- 1: Scale of Market Entities............................................................................... 16
2-2: Continuum of Evaluation for Different Product/Service Types...............22
2- 3: Service Firm Characteristics..........................................................................24
3- 1: The Discontinuation of Expectations Paradigm.........................................31
3- 2: Comparison of Discontinuation Paradigm and Gap M odel...................... 43
4- 1(a): A Theoretical Path Model of the Antecedents of CustomerSatisfaction/Dissatisfaction for a Business-to-Business,Professional Service.......................................................................................71
4- 1(b): A Theoretical Model Extending CS/D to FutureBehavioural Intentions.................................................................................. 72
5- 1: A Simple Bivariate M odel...........................................................................I l l
5-2: A More Complex Path Analytic Model..................................................... 114
7-1(a): Path Model of the Determinants of Customer Satisfaction/Dissatisfaction for a Business-to-Business, ProfessionalService.......................................................................................................... 158
7-1(b): Path Model Extending CS/D to Behavioural Intentions.......................... 159
Page
ix
1
CHAPTER Is INTRODUCTION
The overriding objective of this research is to empirically test for the first time, and extend,
our knowledge of the antecedents of customer satisfaction/dissatisfaction in the context
of business-to-business, professional services.
For decades, the concept of satisfaction has been a key element in the understanding of
human behaviour by various disciplines. Satisfaction has been used by economists as a
measure of the effectiveness of various economies; by sociologists to portray a society's
social well-being, psychologists to indicate a person's emotional feeling; and by
Governments as a means of justifying policy decisions (Tse, Nicosia and Wilton 1990). In
the marketing discipline, the concept of customer satisfaction/dissatisfaction occupies a
pivotal position in the marketing concept (McCarthy and Perreault 1984).
The remaining parts of this chapter will firstly establish both the academic and managerial
importance of the topic area, then discuss the context in which the research was undertaken
and provide justification for the study. Finally, it will set out the study objectives and put
forth five research questions which are central to this dissertation.
1.1 Academic Importance of the Topic Area
Customer satisfaction is recognised as a key construct in models of consumer behaviour
(Assael 1987) where it is generally conceptualised as a "multidimensional, subjective
evaluation following the act of purchase" (Tse, Nicosia and Wilton 1990, p. 178). The
notion of customer satisfaction/ dissatisfaction is arguably one of the most important and
pervasive concepts in marketing and is a major outcome of marketing activity. Not only is
it of interest during the purchase and consumption stages of buyer decision making, but
also during the post-purchase phase. At this latter phase, satisfaction/dissatisfaction
represents a vital feedback loop in the buyer behaviour process and is linked to phenomena
such as attitude change, repeat purchase, and brand loyalty. Hanan and Karp (1989)
stressed its importance by stating "customer satisfaction is the ultimate objective of every
business: not to supply, not to sell, not to service, but to satisfy the needs that drive
customers to do business" (p. 49).
The dominant conceptual model in the customer satisfaction literature is the
disconfinnation of expectations paradigm. This paradigm posits that customer
satisfaction is related to the size and direction of the disconfirmation experience, where
discontinuation is defined as the gap or difference between an individual's pre-purchase
expectations and post-purchase performance of the product/service. A consumer's
expectations are (a) confirmed when the product/service conforms to expectations; (b)
negatively disconfirmed when perceived performance is less than expected; and (c)
positively disconfirmed when performance is better than expected (Anderson 1973;
Olshavsky and Miller 1972; Olson and Dover 1976; Swan and Trawick 1980; Tse and
Wilton 1988). This model theorises that expectations are crucial, as a standard of
comparison, in the formation of satisfaction judgements. Disconfirmation is treated as both
an intervening variable and an independent variable in the satisfaction literature.
Hence a basic model of the determinants of customer satisfaction/dissatisfaction (CS/D) can
be expressed as:
CS/D = /(Expectations, Performance, Disconfirmation)
This disconfirmation model of satisfaction has been widely accepted with respect to low
involvement, non-durable products (Cardozo 1965; Churchill and Surprenant 1982;
Olshavsky and Miller 1972; Tse and Wilton 1988). In comparison, little attention has been
paid to testing the model for high involvement, durable goods, the exceptions being studies
by Churchill and Surprenant (1982) and Patterson (1993).
While the customer satisfaction/dissatisfaction (CS/D) literature has grown throughout the
1980s, almost no attention has been paid to empirically testing the disconfirmation
3
paradigm in the business-to-business (industrial) products arena or services sector. The
exceptions include studies by Jayanti and Jackson (1991) for hairstyle services, Oliver
(1980a) for flu-innoculation and Swan (1988) for restaurant services. However, no studies
were found which specifically dealt with either business-to-business or professional services
(although Brown and Swartz (1989) adpoted a dyadic approach with patients and physicians
in their study of consumer medical services). This is unfortunate because services are the
fastest growing component of most developed economies. Within this component,
professional services are one of the largest and fastest growing segments. Despite this and
the unique characteristics of services, to date there has been a paucity of research directed
at understanding the determinants of CS/D in this area. The increasing volume of literature
addressing service quality issues (a related, but distinctly different construct) is further
evidence of the academic importance of both perceived quality and CS/D in service
industries. As noted by Jayanti and Jackson (1991):
"Although some authors have suggested the discontinuation model to be appropriatefor services, empirical evidence has yet to be found for this proposition" (p. 603).
The intent of this study is therefore to begin to fill this gap in the literature. In doing so
several key antecedent variables (prior attitudes, purchase situation, individual-level, and
fairness) are included in an extended model. In addition, post-purchase behavioural
intentions has been included as a consequence of CS/D in the extended model. The model
that is empirically tested is shown in Figures 4-1(a) and (b) on pages 71-72.
1.2 Managerial Importance of the Topic Area
In addition to its academic importance, the topic is also of considerable importance to
management. A good deal of recent management and academic literature has noted the
importance of researching and understanding the determinants of customer satisfaction
(Business Week 1990; Davidow and Uttal 1989; Fomell 1992). From a practitioners
viewpoint, Finkelman and Gorland (1990), two McKinsey consultants, claim that whether a
company succeeds or fails in the 1990s will depend to a large extent on how well it satisfies
4
its customers. They go on to state that customer satisfaction will be a major means of
companies building a sustainable competitive advantage. The importance of customer
satisfaction has not only been recognised in the traditional "marketing" sectors of society
(i.e., markets for consumer and industrial products) but by the emerging services sector as
well (e.g., Bitner 1990; Brown and Swartz 1989; Crane 1991; Ross et al. 1987)
Further, many of today's successful multinational companies (e.g., Kodak, McDonalds,
Price Waterhouse, Hewlett Packard), in an attempt to further inculcate the marketing
concept throughout their organisations, include the notion of customer satisfaction in their
corporate mission statements (Price Waterhouse Post 1991). The recent recession in many
western economies, including Australia, has resulted in an unprecedented intensity of
competition in many industries as organisations struggle to retain clients, sales levels and
market share. In this economic environment, the concept of customer satisfaction has taken
on even more importance, as organisations realise the importance of retaining their existing
customer base as a means of long term survival.
In an effort to promote quality and make its industries more internationally competitive and
market oriented, Sweden has become the first country to establish an ongoing customer
satisfaction barometer with CS/D being monitored in more than 30 industries and 100
corporations (Fomell 1992). In his research, Fomell (1992), proposes that whereas several
years ago market share growth was being advocated as a key element of management
strategy, today strategies for increased customer satisfaction are being promoted. The
argument is that satisfaction leads to reduced complaints, increased customer loyalty and
hence increased profitability.
At a micro level, understanding the determinants of CS/D (particularly expectations,
performance perceptions, disconfirmation) would seem to be highly desirable. Davidow
and Uttal (1989) point out that expectations are shaped by factors that can be difficult to
control, from advertised prices to product design to the behaviour of employees. They
5
further point out that the range of product/service attributes about which customers have
expectations are diverse and sometimes of surprise to marketers. Such information could
therefore be useful for segmentation purposes based on customer expectations and prove
invaluable in new product/service design and delivery, pricing, development of marketing
communications, and customer service programs. Further, understanding the relative
impact of expectations and performance on CS/D would allow marketers to focus their
attention on either raising or lowering customer expectations (e.g., through advertising
and/or word-of mouth) to bring it in line with perceptions of performance.
In summary, gaining an understanding of the determinants of customer
satisfaction/dissatifaction seems an important consideration for all organisations, whether
they be marketing products or services. Not only will this understanding aide in the
fundamental marketing task of market segmentation, but it will also facilitate the
development of more effective strategies for maintaining/increasing customer satisfaction.
1.3 The Research Context
Services marketing has become a recognised area of the marketing discipline. This is
particularly the case in consumer marketing where it is generally acknowledged that the
unique characteristics of services - notably intangibility, inseparability of production and
consumption, perishability and heterogeneity (variability of performance) - distinguish them
from tangible products (Bateson 1989). In industrial or business-to-business marketing
however, the extent to which services are different from tangible products has not been
well established (Morris and Fuller 1989). Further, little attention has been directed at
gaining a better understanding of the similarities and differences of the two major types of
business-to-business services proposed by Gronroos (1979), viz., "professional" services
(e.g., management consulting, accounting, medical, architectural services) and "other"
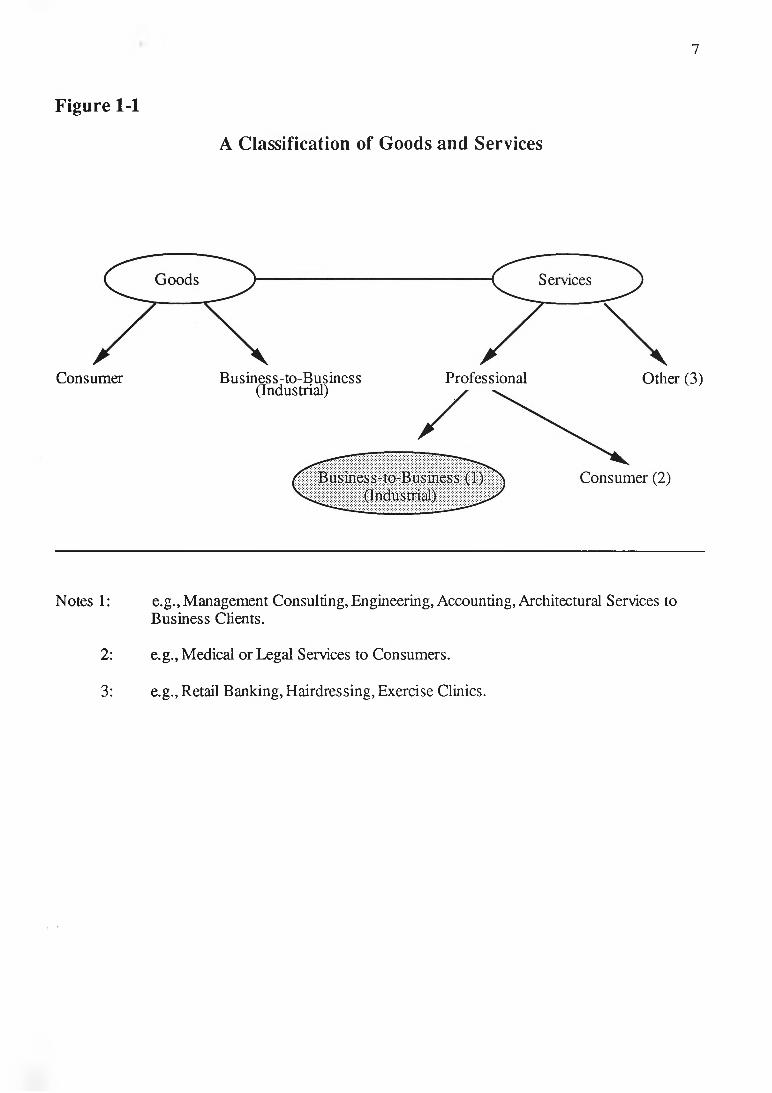
services (e.g., equipment maintenance, hairdressing, security). Figure 1.1 provides a
schematic view of these differences. The former category is distinguished by four
characteristics: (1) the service is provided by highly qualified personnel; (2) it is advisory
6
and focuses on problem solving; (3) the professional should have an identity such as a
"lawyer", "architect" or "management consultant"; and (4) the service should be an
assignment from the buyer to the seller (Gronroos 1979; Gummesson 1981). Professional
services have been largely ignored to date, some of the notable exceptions being general
and descriptive work (Bloom 1984; Gronroos 1979; Gummesson 1978, 1981; Turner 1969)
and empirical research (Brown and Swartz 1984,1989; Crane 1991; Dawes, Dowling and
Patterson 1991, 1992b; Day and Barksdale 1992; and Stock and Zinszer 1987). Business-
to-business professional services have been even further ignored with only a few empirical
studies focussing on this sector. These studies have examined such aspects as pricing
methods (Morris and Fuller 1989), the structure of the buying centre (Lynn 1987), the
nature of the referral process (Wheiler 1987), external information search (Dawes,
Dowling and Patterson 1993) and the differential perceptions of service suppliers and users
(Parasuraman and Zeithaml 1983). Furthermore, most studies have focused on certified
public accountants (CPAs). As a consequence of the limited amount of research and its
focus, we know little about the buying process, the antecedents of CS/D, or the setting of
the marketing mix variables among professional service providers.
As alluded to earlier, the research to date in the CS/D area has primarily focussed on low
involvement, non-durable goods. Only three empirical studies were found that specifically
examined consumer services (hairdressing, flu-inoculation and restaurant services). None
has examined the model in the business-to-business (industrial), or professional services
(e.g., accounting, management consulting, engineering, architectural services) sector,
although Brown and Swartz (1989) researched the related issue of service quality for
consumer medical services. The focus of this study is a combination of the latter two,
previously ignored sectors, that is business-to-business, professional services,
specifically management consulting services.
7
Figure 1-1
A Classification of Goods and Services
Consumer Business-to-Business(Industrial)
Professional Other (3)
Notes 1 : e.g., Management Consulting, Engineering, Accounting, Architectural Services toBusiness Clients.
2: e.g., Medical or Legal Services to Consumers.
3: e.g., Retail Banking, Hairdressing, Exercise Clinics.
8
The previous lack of attention to the services sector in general, and business-to-business
professional services in particular, is surprising for two reasons. Firstly, service industries
have assumed the role of economic leadership in most western economies. These industries
which encompass trade, communications, transportation, financial and medical services,
education, government, technical and business advisory services, now account for
approximately 58% of annual gross national product, averaged world-wide, and even
higher in some western economies (Bateson 1989). The growth in services is expected to
continue as business becomes more complex and as management continues to recognise the
need for business and other service specialists (Bateson 1989; Zeithaml, Parasuraman and
Berry 1990).
Secondly, because services possess unique characteristics of intangibility, inseparability of
production and consumption, perishability and heterogeneity (high variability in
performance) (Bateson 1989; Lovelock 1981), the disconfirmation of expectations
paradigm may not apply, or may do so in a modified manner (Jayanti and Jackson 1991).
These unique characteristics provide the rationale for a separate treatment of services. It is
these characteristics "....that pose vexing problems for service marketers that are not faced
by goods marketers" (Zeithaml, Parasuraman and Berry 1985, p. 33).
Referring to the business-to-business segment, Bateson (1989) also reported:
"The problems of service firms are so distinct from those of tangible goodsfirms that a separate chapter is needed to help the reader appreciate both thedifferences and their effects on business-to-business marketing strategy" (p.604). '
Further, providers of business-to-business professional services are becoming more
convinced of the need to adopt a greater marketing orientation when conducting their
business activities. This situation has arisen because of the increase in competitive activity
and the reduction of restrictions imposed by professional associations on the soliciting of
new clients (Bloom 1984; Fisher 1989; Wheiler 1987).
9
Management consulting services (MCS) were chosen as the research domain for several
reasons. Firstly MCS are typical of professional business services (adopting criteria put
forth by Gronroos (1979)). Secondly, MCS captures a wide array of professional services
such as marketing research, strategic planning, operations management, production
planning, information technology and human resource management. Thirdly, there is
evidence of a wide variation in the degree of client satisfaction/ dissatisfaction with MCS
(Moffet 1989). This wide variation should prove useful in developing an explanatory
model. Finally, the management consulting industry is a significant one in terms of its size
and growth from a $3 billion (world-wide) industry in 1980 to $22 billion in 1990
(Economist 1991).
1.4 Justification for the Research
The research is a legitimate area of academic concern from two standpoints. First, as
befits an academic study of this nature, the research is justified on the following grounds:
(a) The discontinuation of expectations paradigm has not previously been empirically
tested in either the industrial (business-to-business) or professional services arena.
Because of the unique characteristics of these two market sectors, it cannot be
assumed that the causal relationships between the major constructs (expectations,
perceived performance, disconfirmation and satisfaction) will be consistent with past
findings in the consumer products area (Jayanti and Jackson 1991). In particular, a
number of researchers have suggested that for high-involvement purchase decisions,
the role of expectations is diminished, and the impact of the performance construct
will be greater on the ultimate dependent variable, satisfaction (Hill 1986; Churchill
and Surprenant 1982).
(b) Research in the areas of organisational buyer behaviour (e.g., Johnston and Bonoma
1981) and services (e.g., Parasuraman, Berry and Zeithaml 1991a) suggest that a
range of purchase situation and individual difference variables might impact upon
key constructs in the disconfirmation paradigm. Including these variables in the
model will extend our understanding of the causal relationships and add to our body
of knowledge in this important area.
Recent research by Oliver and Swan (1989) suggests that the fairness dimension of
the equity construct (the other dimension, preference, is not tested here) has a direct
and independent impact upon CS/D formation. Accordingly, it is included in an
extended disconfirmation model. Likewise, behavioural intentions (i.e., intentions
to reuse the consulting firm) have been included as no prior CS/D study in the
services area has comprehensively tested the impact of antecedent variables on this
important construct (although Bitner (1990) modelled intentions as a function of
service quality, CS/D and attributions). Bloemer, Kasper and Lemmink (1990)
pointed out that, surprisingly, behavioural action such as brand loyalty or brand
switching are rarely investigated in CS/D studies.
Many of the studies conducted to date, have either been experimental designs where
the product has not actually been used by respondents (e.g., Churchill and
Surprenant 1982), or the major constructs have all been measured at the same point
of time (e.g., Cronin and Taylor 1992; Jayanti and Jackson 1991). This is a
methodological weakness since expectations and some purchase situation variables
are prepurchase constructs, while perceived performance, disconfirmation and
satisfaction must be measured post-purchase. The current study is a longitudinal
one, with measurements of expectations, prior attitudes, purchase situation and
individual difference variables, being taken at the time the consulting assignment is
commissioned, and a second measurement (of performance, disconfirmation, CS/D
and intentions) shortly after completion of the assignment. Such a methodology
overcomes weaknesses inherent in some of the previous research.
11
Second, from a managerial perspective, the area is worthy of study because:.
(a) The competitive environment as well as the economic and managerial significance
of the management consulting industry, as previously outlined, suggests it is an area
worthy of research.
(b) Because consultants are hired on a project by project basis, they are highly
expendable. Clients may, and often do, choose different consultants for different
assignments. In this environment, it is critically important to have a satisfied client
at the end of an assignment if repeat work is to be won. It seems therefore that a
thorough understanding of the antecedents of CS/D (and the relationship between
them) would be valuable to the consulting industry.
(c) A recent New South Wales Government report compiled by the Office of Public
Management concluded that about 37 percent of the consultants engaged by the
State Government or its instrumentalities, were assessed as performing less than
satisfactorily (Moffet 1989). Again, an understanding of the determinants of CS/D
in an extended disconfirmation model would seem to be valuable in shedding some
light on the causes of this dissatisfaction.
1.5 Objectives of the Study
The preceding discussion has attempted to demonstrate the importance of understanding the
determinants of CS/D, and the nature of the relationship for services in general, and
business-to-business professional services in particular. Further, it has been argued that the
unique characteristics of these services, plus their emerging importance to both academic
researchers and practitioners, warrant further empirical investigation. More specifically,
the study attempts to address the following research problem, and five research questions.
12
General Research Problem:
To extend and empirically test, for the first time, the disconfirmation of expectations
paradigm in the context of a business-to-business (industrial), professional service.
Research Questions to be Addressed:
1. What is the nature and extent of the differences between the disconfirmation of
expectations paradigm for a business-to-business, professional service and for
tangible products?
2. To what extent do prior attitudes, purchase situation and individual-level variables
impact upon the key constructs of expectations, perceived performance,
disconfirmation and CS/D?
3. What is the relative impact of expectations, perceived performance and
disconfirmation on the ultimate dependent variable, CS/D?
4. What impact does the fairness dimension of the equity construct have upon the
ultimate dependent variable, CS/D?.
5. To what extent does perceived service performance, CS/D and fairness impact upon
repeat purchase intentions for a business-to-business, professional service?
This chapter has attempted to establish the academic and managerial importance of the
topic area as well as outline the fundamental research problem and five specific research
questions which are the focus of the study.
Following this chapter, Chapter 2 provides a brief review of the domain in which this
research is conducted, i.e., the services marketing literature. Chapter 3 is a synthesis and
discussion of the customer satisfaction literature (in particular the disconfirmation of
expectations paradigm) and service quality literature. Special attention is given to
identifying those empirical and theoretical works relevant to this study. The purpose of
Chapters 2 and 3 is to provide the background and historical support for this study.
Following the synthesis of the literature, Chapter 4 develops the specific hypotheses to be
tested. Chapter 5 discusses the methodology used, and in particular examines the major
analytical method (recursive path analysis) employed in this research. In addition, it shows
how the key constructs and variables were operationalised for data collection.
Chapters 6 and 7 then present the research findings. The final chapter addresses the
contribution of this research to the CS/D and services marketing literature. It also
describes the limitations of the study, discusses the managerial implications and provides
some direction for future research.
14
CHAPTER 2: BUSINESS-TO-BUSINESS, PROFESSIONAL SERVICES
2.1 Introduction
The previous chapter provided the rationale and justification for this research. The purpose
of this chapter is to briefly review the literature most relevant to the context in which the
research is conducted, i.e., the services sector, but business-to-business professional
services in particular. First a description of what is meant by 'services' is provided. The
second section deals with the distinctions between goods and services, but especially
professional services, and the implications for consumers' evaluation processes. The third
section briefly reviews the organisational (i.e., business-to-business) buyer behaviour
literature, since this is the context in which this research is carried out. The final section
presents various schema used to classify types or categories of services. This review of the
services literature demonstrates why business-to-business, professional service firms, and
more specifically, management consulting services, is an excellent research domain for
furthering our understanding of the antecedents of CS/D for service businesses.
2.2 Defining Services
There is no one clear definition of a service. Economists have traditionally defined a
service business as one whose output is intangible (Zolla 1988). Lovelock (1991, p. 13)
stated that a service is a "process or performance, rather than just a thing" (or object),
while Bateson (1989) claimed that with services the consumer is purchasing an experience.
Other scholars (e.g., Shostack 1977) claimed that what customers are buying are
experiences (movies), time (consultants) or process (dry cleaning). Services have also been
defined in terms of both a process (i.e., the production of the service including the buyer-
seller interaction) and an outcome (e.g., arriving safely and on time at the destination
airport; receiving the marketing research report) (Gronroos 1984). Bell (1973) also refers
to the notion of services as a process when describing the provision of services as a "game
between persons". Although this metaphor does not capture all the characteristics of
15
services, it emphasises the critical importance of managing customer interface activities -
between service firm employees and their customers.
Gronroos (1990) seems to have encapsulated many of these views when he proposed:
"A service is an activity or series of activities of more or less intangible nature that normally, but not necessarily, take place in interactions between the customer and service employees and/or physical resources or goods and/or systems of the service provider, which are provided as solutions to customer problems" (p. 27).
Professional business-to-business services, the focus of this study, encompasses most of the
aforementioned characteristics. However they have been separately defined as
organisations that essentially sell or render the knowledge of their employees. The
knowledge sold by professional service firms reflects advanced learning and is thus
knowledge which does not normally reside with the client (Zolla 1988). This lack of
knowledge on the clients part is considered to increase uncertainty and perceived risk in
the purchase decision and make post-purchase evaluation (satisfaction/dissatisfaction)
difficult to objectively assess (Bateson 1989).
While it is possible to define services, it is becoming difficult to conceive of a pure service
or a pure good. A pure good implies that the benefits received by the consumer contain no
service element; and a pure service would contain no tangible/goods element. Shostack
(1977) proposed a model which made it possible to describe businesses along a continuum,
according to their weighting or mix of tangible/intangible components. This model is
depicted in Figure 2-1.
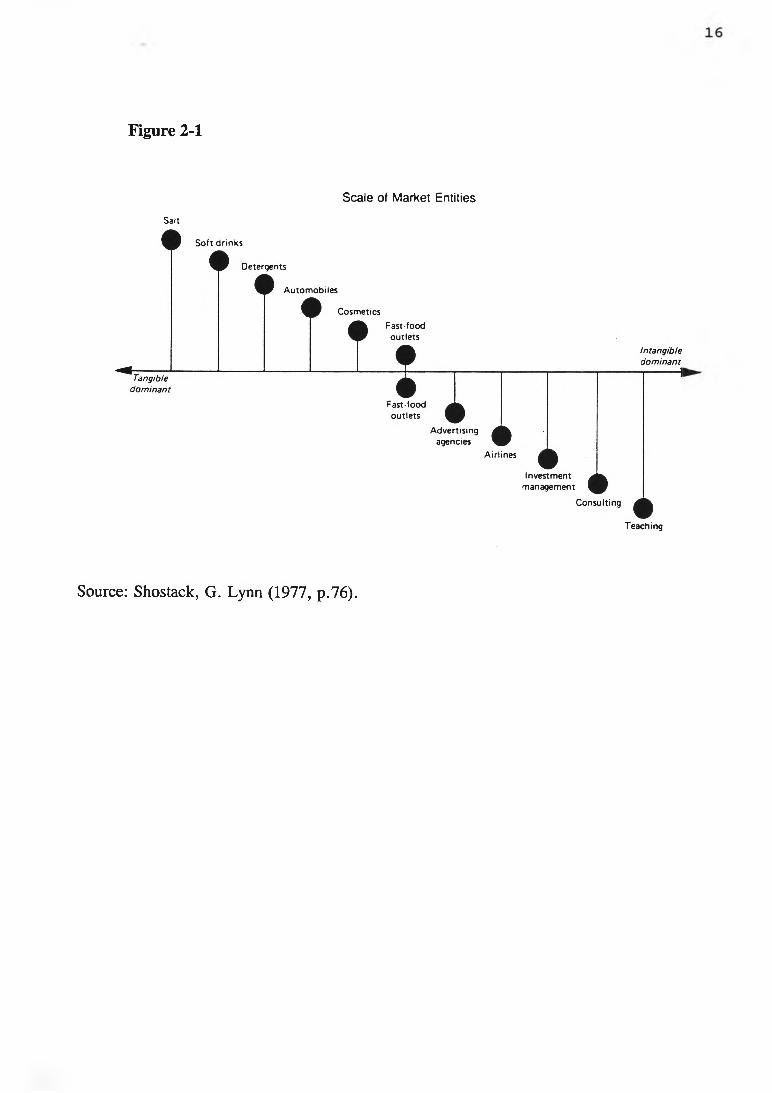
Figure 2-1
Scale of Market Entities
Salt
Source: Shostack, G. Lynn (1977, p.76).
17
As Figure 2-1 shows, management consulting services and other professional services are
at the 'intangible dominant' (i.e., pure service) end of the scale, while products such as
clothing and soft drink are examples of 'tangible dominant' products (i.e., products with
little if any service component attached). However fast-food organisations such as
McDonalds for example, contain a mix of both product (hamburger, french fries) and
service elements (fast, efficient service, friendly atmosphere and ambience, high degree of
consistent product quality). Shostack (1977) claimed that:
"The greater the weight of intangible elements in a market entity, the greater will be the divergence from product marketing in priorities and approach"(p. 41).
Shostack's view adds further weight for a separate treatment of services in the marketing
literature and the need to be cautious before generalising theories empirically tested with
products, to the services arena.
2.3 The Unique Characteristics of Services
Three underlying assumptions emerge from the literature on services marketing. The first
is that services possess several important characteristics that distinguish them from tangible
goods/products (namely, intangibility, inseparability of production and consumption,
heterogeneity/variability, and perishability). The second suggests that these characteristics
pose significantly different challenges for the marketing of services. The final assumption
holds that different tactics and strategies are required to meet the challenges posed (Bateson
1989; Zeithaml, Parasuraman and Berry 1985). The purpose of this section is to explore
the first two of these assumptions, but in particular the impact that the unique
characteristics of services have on consumer evaluation processes and CS/D formation.
Later sections examine differences between types of services and the distinguishing
features of professional, business-to-business services in particular.
18
The rationale for a separate treatment of services marketing hinges on a number of unique
characteristics which are consistently cited in the literature. The basic difference between
goods and services universally cited by researchers is intangibility (e.g., Bateson 1977,
1989; Berry 1980; Lovelock 1981; Shostack 1977). According to Bateson (1979),
intangibility is the critical goods-services distinction from which all other differences
emerge. This intangibility means they cannot be tested, inspected or generally tried out in
advance of purchase in the same manner in which goods can be. This makes it difficult for
potential customers to undertake risk-reducing strategies prior to purchase. Further, as
discussed in the following sections of this chapter, with many services it is also often
difficult for clients to objectively evaluate what they have received, even after purchase and
consumption.
Second, production and consumption of services occur simultaneously. Whereas most
goods are first manufactured and then sold and later consumed, services on the other hand
are first sold then simultaneously produced and consumed (Berry 1980). Since the
customer needs to be present during the production of many services, inseparability puts
the marketer of services into very close contact with the customer. An example of this type
of relationship would be the provision of legal services or a management consulting
engagement. In both cases, continuous interaction with the customer is essential for the
successful completion of the professional assignment. This causes marketing and
production to be highly interactive (Gronroos 1978).
Third, services are heterogeneous, i.e., they have the potential for high variability in
performance. Because people, and not pre-calibrated machines deliver a service, it is
difficult to standardise. Many different employees may come into contact with an
individual customer, making consistency of behaviour difficult to assure (Booms and Bitner
1981).
19
Fourth, services are ephemeral, taking place in space and time. As such they cannot be
stockpiled in inventory like products. Because services cannot be kept in inventory, service
firms often have difficulty synchronising demand and supply.
Jackson and Cooper (1988) have suggested a fifth characteristic, specialisation, which is
relevant when considering business-to-business services. Because of their customised
nature, most professional business services are organised on a project basis. The project
nature of the work means that there are three major activities in the delivery of such
services: client relations, project management, as well as performance of the assigned
professional task (Dawes, Dowling and Patterson 1993). Consequently is would seem
important to include these tasks in any post-purchase evaluative criteria used in assessing
performance, disconfirmation and CS/D. Further, customisation adds to the complexity of
the purchase situation. There is the added complexity of determining and communicating
to vendors the specifications required for the service. Combined with intangibility,
heterogeniety and inseparability, specialisation adds a further measure of complexity and
perceived risk to the buyer/client decision and post-purchase evaluation processes.
2.4 Consumers' Evaluation Processes
Because services are intangible and unstandardised, it is generally more difficult for
consumers to evaluate services than goods (Zeithaml 1981). However, unless marketers
appreciate consumers' evaluative processes and choice criteria, it becomes difficult to
influence their post-purchase satisfaction/ dissatisfaction.
Bateson (1991) provides a cogent argument as to why the three-stage model of the
consumer purchase and evaluation (pre-purchase, consumption, and post-purchase stages)
needs to be modified for services. He argues that because services are experiences,
processes or performances, consumers' evaluation is largely subjective, unlike goods where
there are likely to be more objective evaluations of performance (e.g., performance of the
motor vehicle, capital machinery, computer, etc.). He and other researchers (e.g., Fisk
20
1981) point out that most services involve an extended period of client-service provider
interface. As such, they argue the outcome is a dynamic, ongoing, and cumulative
postchoice process, refuting the idea that postchoice evaluation (CS/D) occurs only at a
certain point in time after the consumption experience. With services, there is no clear-cut
boundary or definite sequence between acquisition and consumption/use because there is no
transfer of "ownership" as such. Because of the often prolonged interactions between
service provider and client (e.g., in a consulting engagement), the production, acquisition,
and use of the service become almost merged into a single stage.
Hence the postchoice evaluation (CS/D) is a complex process (Bateson 1989). It begins
soon after the client selects a consulting firm for example, and continues throughout the
"consumption" and post-consumption stages. The client satisfaction evaluation may be
influenced by a range of social, psychological, and situational variables as well as the
client's experience with the service firm (i.e., contact with employees, physical and process
systems). Bateson (1991) has therefore suggested that the consumption and post
consumption evaluation stages be combined into one. He views the revised purchase
process model for services as having only two complex stages: (1) prepurchase choice and
(2) post-purchase evaluation and consumption. This latter stage, which has received much
attention in the literature, (e.g., Czepiel et al. 1985) is generally referred to as the "service
experience" which embraces all kinds of client-firm interactions (not just interpersonal
interactions).
One framework cited in the literature for more specifically isolating the differences in
evaluation processes between goods and services is the classification framework proposed
by economists Nelson (1970) and Darby and Kami (1973). Nelson distinguished between
two categories of qualities for consumer products: search qualities (attributes which
consumers can evaluate prior to purchase); and experience qualities (attributes which can
be evaluated only during or after the consumption process). Search qualities might include
attributes such as colour, price, texture, style, etc., while experience qualities include taste,
21
durability, in-store atmosphere, service efficiency. Some goods (e.g., clothing, cars, other
consumer durables) are high in search qualities because they can be evaluated before
purchase. Other goods and services (e.g., restaurant meals, vacations) are high in
experience qualities and can only really be assessed during or after consumption.
Darby and Kami (1973) added to Nelson's two-way categorisation a third category of
qualities - credence qualities. These are attributes which consumers often find difficult to
evaluate even after purchase and consumption. Examples include: some automobile
repairs; a full-fee paying overseas student studying for an MBA; a professional engineer
designing a production process; or a management consultant preparing a strategic plan.
Few consumers or organisational members would possess the knowledge or skills sufficient
to evaluate these services even after they have been received (Zeithaml 1981; Patterson and
Pascoe 1988).
Figure 2-2 shows an array of goods and services in search, experience and credence
qualities along a continuum ranging from "easy to evaluate" to "difficult to evaluate". The
major premise is that most goods fall to the left on the continuum in Figure 2-2 while most
services fall to the right due to the three distinguishing characteristics. Credence qualities
are thought to dominate in many services, but especially for professional services such as
MCS, where customers often find it difficult to objectively judge the performance of
professionals and specialists with extensive training or experience (Gummesson 1981;
Kotler and Bloom 1984; Zeithaml 1981).
This section has discussed differences in consumers' pre and post-evaluation processes
which are due mainly to the unique characteristics of services. Not only are there
significant differences between products and services, there are also differences amongst
types of services. These differences are briefly discussed in the following section.
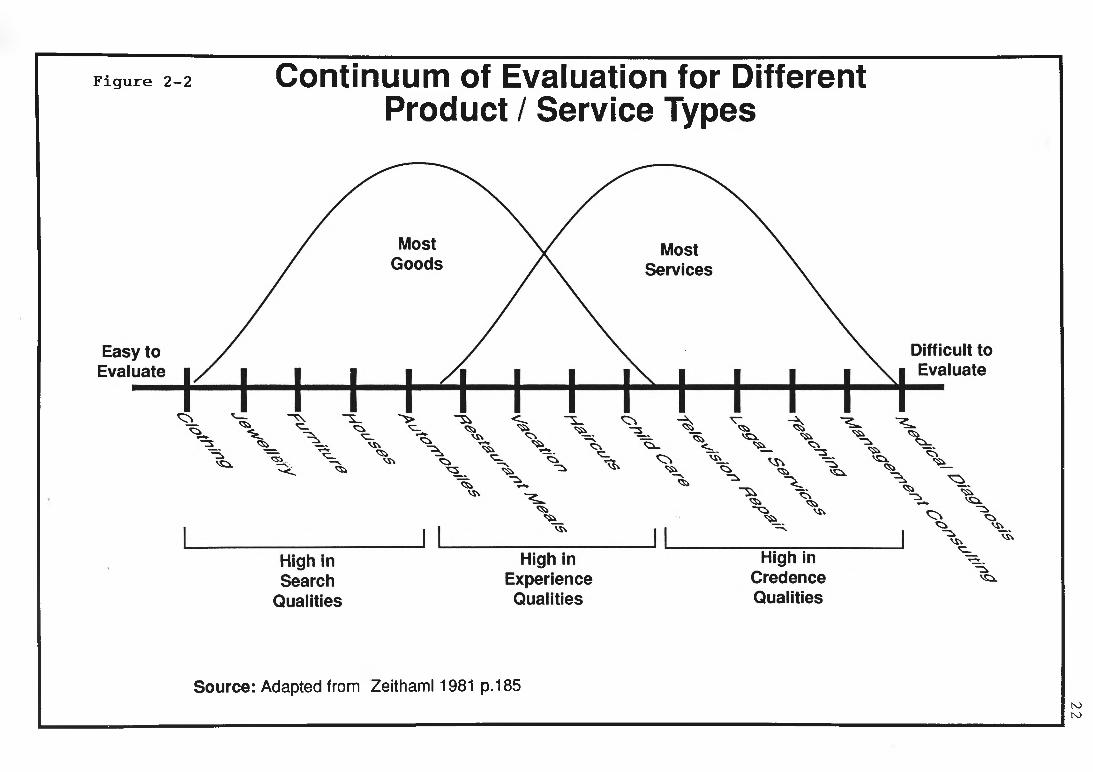
F i g u r e 2 - 2 Continuum of Evaluation for DifferentProduct / Service Types
Source: Adapted from Zeithaml 1981 p.185N>K)

2.5 Classification of Services
A search of the literature revealed five major dimensions that help differentiate between
service firms and are considered relevant to this study because they impact upon
consumers' evaluation processes. The model proposed in Figure 2-3 helps to conceptually
categorise types of service firms.
The first characteristic relevant to this study of professional services (management
consulting) is the nature of the service act (Lovelock 1984). Some services involve some
tangible action directed at people's bodies (haircut) or physical possessions (industrial
repairs and maintenance). Others involve intangible actions (management consulting, legal
services, architectural services).
The second characteristic that assists in conceptually mapping services is the degree of
contact (Bateson 1989; Chase 1978). Degree of contact is the extent to which personal
contact with the customer is used in delivery of the service. For example, a service
involving a high degree of contact would be a patient examination at a physician's office.
Here the staff, as well as the physician, is in constant contact with the patient through the
delivery of the service. An example of a low contact business is a car repair service.
Customer contact is only incurred upon delivery of the car and upon payment (Zolla 1988).
MCS could well vary in the degree of contact depending on the nature of the assignment.
The third characteristic is level of complexity (Shostack 1987). A service's complexity is
defined by analysing the number and intricacy of the steps required to perform it.
Financial planning, for example, is more complex than bookkeeping because it is a more
elaborate and thought-provoking process, involving more functions, skills and knowledge
(or expertise). Architecture is more complex than plumbing, plumbing is more complex
than lawn-mowing, etc. MCS are considered to be at the complex end of the continuum.
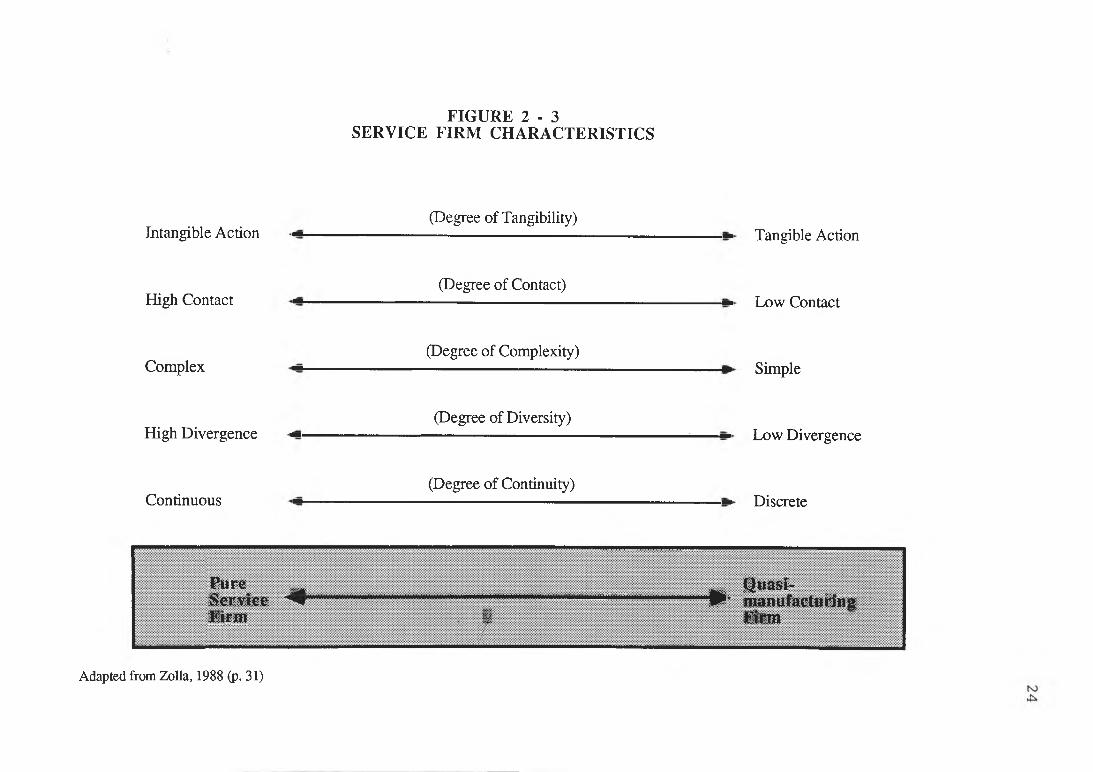
FIGURE 2 - 3SERVICE FIRM CHARACTERISTICS
Intangible Action
High Contact
Complex
High Divergence
Continuous
(Degree of Tangibility)
(Degree of Contact)
(Degree of Complexity)
(Degree of Diversity)
(Degree of Continuity)
Tangible Action
Low Contact
Simple
Low Divergence
Discrete
Pure ^ ^ QuasiService .... ........................................................... .........1.......I^1 manufacturingFirm . 1 Firm
Adapted from Zolla, 1988 (p. 31)
25
A fourth characteristic is divergence (Shostack 1987). Divergence can be thought of as the
degree of freedom allowed or inherent in a process, step, or sequence. A service of low
divergence would be one that is largely standardised. A highly divergent service on the
other hand is one in which virtually every performance of the process is unique. For
example, management consultants developing a strategic marketing plan would be highly
divergent. As the service is being performed, a consultant constantly gathers external data
and new information and assimilates it with existing internal information, reaching
conclusions, and then preparing a plan. Architecture, law, engineering and most other
professional services have similarly high divergence (as well as high complexity), because
they involve a considerable amount of judgement, discretion and situational adaptation
(Lovelock 1984). On the other hand, some non-professional services such as McDonalds,
has taken the divergence out of its production steps in preparing a hamburger by
automation (Levitt 1972).
The fifth and final characteristic concerns whether the service is continuously provided
(e.g., banking, telephone service, public utility) or a discrete event (e.g., management
consulting assignment). Both Bolton and Drew (1991a), and Oliver (1989) concluded that
pre-purchase expectations about a continuing service are not processed actively. During
the conduct of fifty in-depth interviews in their study of the impact of telephone service
level changes on customer satisfaction, Bolton and Drew found customers frequently
mentioned their perceptions of current performance, but made no mention about their
expectations. They concluded "..customers do not explicitly conceptualise expectations
about service because telephone service is characterised by its stability" (p. 3). MCS and
most professional services on the other hand are discrete assignments and largely
commissioned on a 'needs' basis rather than being continuous. Therefore it is concluded
that customers will have active and well defined pre-purchase expectations.
Utilising this classification scheme (Figure 2-3) allows a classification of services from
pure services (on the left side of the continuum) to quasi-manufacturing services, i.e.,
26
manufacturing firms that have a significant service component (on the right end of the
continuum). This classification scheme shows that not all service businesses are alike.
There can be considerable differences between entire service industries as well as
differences between firms within a particular service industry. Service businesses can vary
from being a pure service to a quasi-manufacturing business (Chase, 1978).
Because of the significant differences in service firms, the models and findings obtained
from previous discontinuation of expectations studies for manufactured, durable and non
durable goods may not be generalised to the service sector (Jayanti and Jackson 1991).
This conclusion is further supported by studies showing differing relationships in the
discontinuation paradigm, depending upon the nature of the product or service under study
(Bolton and Drew 1991a; Churchill and Surprenant 1982; Patterson 1993).
To understand how the complex interplay of relationships in the discontinuation of
expectations paradigm differ in service businesses it is desirable to select a service industry
that displays characteristics that differ markedly from manufacturing industries. Therefore,
the selection of a service industry that falls toward the pure service end of the continuum
developed in the model (Figure 2-3) would maximise the differences. Professional service
firms such as the one studied in this research, management consulting services (MCS), are
at the pure service end of the continuum. As discussed in the preceding sections, this is
because a professional service firm is typically characterised by a higher degree of
complexity and divergence than other service businesses. The degree of contact can vary
considerably depending on the nature of the consulting assignment in question. Further,
they are characterised by high intangibility and are often performed on an ad hoc or
discrete, rather than continuous basis.
2.6 Business-to-Business (Industrial) Services
Sections 2.3, 2.4 and 2.5 have highlighted some key differences between goods and
services, and between various types of services. However in the industrial or business-to-
27
business marketing literature, the extent to which this category of services is different has
not been well established (Morris and Fuller 1989). Further, little attention has been
directed at gaining a better understanding of the similarities and differences of the two
major types of business-to-business services proposed by Gronroos (1979), viz.,
'professional services' (e.g., management consulting, architectural, engineering services)
and 'other' services (e.g., repairs and maintenance, security). The purpose of this section
is to briefly review the literature in organisational buyer behaviour, the appropriate context
in which to consider the buying and selling of management consultancy services.
Fundamental differences exist between marketing to other businesses, often referred to as
industrial or business-to-business marketing, and marketing to consumers (Jackson and
Cooper 1988; Webster 1978). Although numerous differences have been cited in the
literature (Jackson and Cooper 1988, provide a concise summary of these differences),
several key characteristics are relevant to this dissertation. First, business-to-business
marketing is generally considered more complex because organisational buyer behaviour
involves a more intricate network of organisational and environmental buying influences
(Jackson and Cooper 1988). This web of influences is well illustrated in Webster and
Wind's (1972) model of organisational buyer behaviour. Second, organisational buying is
motivated by an organisation's goals and objectives as well as the individual needs and
goals of the personnel involved. Third, organisational buying is characterised by the
multiperson involvement in the decision making process. This principle is symbolised in
the concept of the 'buying centre'. The final characteristic relevant to this study is that
business-to-business marketing involves developing and maintaining longer-term client
relationships than is generally the case in consumer marketing (Jackson and Cooper 1988).
Webster (1974) summarised the fundamental differences between organisational (business-
to-business) and consumer buyer behaviour:
28
"Organisational buyer behaviour is a complex process (rather than a single instantaneous act) and involves many people, multiple goals, and potentially conflicting decision criteria. It often takes place over an extended period of time, requires information from many sources, and encompasses many interorganisational relationships" (p. 35).
Although the consumer marketing literature has acknowledged and defined the differences
in the marketing of goods/products and the marketing of services (Berry 1980; Thomas
1978; Zeithaml, Parasuraman and Berry 1985), the industrial marketing literature has not
really done so. Indeed, Jackson and Cooper (1988) examined both introductory managerial
and industrial marketing texts, and found the discussion of the marketing of services to
other businesses was very limited. As discussed in Chapter 1, only a few empirical studies
have been concerned with the marketing of business-to-business services. As a
consequence, we know little about the buying process, the setting of marketing mix
variables or the antecedents of customer satisfaction/dissatisfaction in professional services
such as strategic planning, logistics, human resource management, and information
technology (IT) consulting. This is surprising since the use of MCS in these areas is a
major activity for many organisations (Fisher 1989).
In summary, services have become a prominent component of our economy. Despite its
importance and distinctiveness, little scholarly work has focussed on its special features.
Nonetheless, services are dimensionally different than products. From the literature, a
model was developed which showed how services, and industrial professional (business-to-
business) services in particular, can vary considerably. To understand the nature and extent
of the differences in the discontinuation of expectations paradigm in general and the
determinants of CS/D in particular, it is important to study an industry that is at the pure
end of the product-service continuum. Professional management consulting services is
ideal for this purpose.
This chapter has reviewed the relevant literature concerning the unique characteristics of
services, the nature of business-to-business (industrial) professional services and

29
implications for consumers' evaluation processes. Chapter 3 reviews the research to date
concerning the determinants of CS/D and service quality, and the disconfirmation of
expectations paradigm.
30
CHAPTER 3: MODELLING THE ANTECEDENTS OF CUSTOMER
SATISFACTION/DISSATISFACTION (CS/D)
3.1 Introduction
The purpose of this chapter is to synthesise the literature concerning the conceptual models
in the satisfaction and service quality areas, especially the discontinuation of expectations
paradigm. Firstly, the discontinuation of expectations paradigm is discussed, and then
contrasted with the "gap" model approach for measuring service quality developed by
Parasuraman, Zeithaml and Berry (1985). Next, the primary dependent variable in this
research, customer satisfaction/dissatisfaction (CS/D) is discussed along with the other
major antecedent constructs in the model. The distinction between CS/D and the emerging
concept of service quality is also reviewed.
3.2 The Disconfirmation Of Expectations Paradigm
The most widely accepted model explaining the antecedents of CS/D, is the disconfirmation
of expectations paradigm (Churchill and Surprenant 1982). The basic disconfirmation
paradigm (sometimes referred to as the expectancy-disconfirmation paradigm) is a process
model explaining CS/D as a function of three key antecedent dimensions, namely: the level
of prior expectations, the level of perceived product (service) performance, and the degree
to which expectations are positively or negatively discontinued during the consumption
experience. More specifically, a consumer's expectations are (a) confirmed when
performance matches expectations; (b) negatively discontinued when performance fails to
match expectations; and (c) positively discontinued when performance exceeds
expectations. Dissatisfaction results when expectations are negatively discontinued, i.e.,
product (service) performance is less than expected. This paradigm is depicted in Figure 3
1.
In the traditional disconfirmation paradigm, the exact confirmation of expectations (i.e.,
when P = E in Figure 3-1) is the definition of satisfaction. However, the relationship may
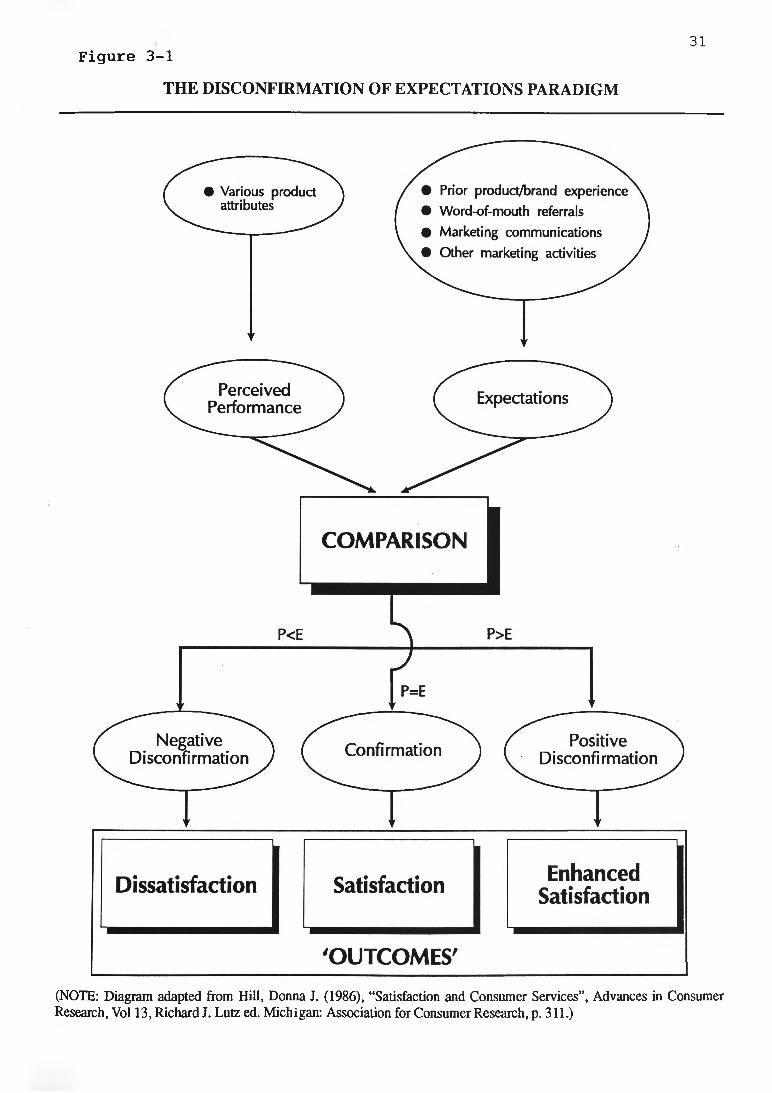
F ig u r e 3 -131
THE DISCONFIRMATION OF EXPECTATIONS PARADIGM
(NOTE: Diagram adapted from Hill, Donna J. (1986), “Satisfaction and Consumer Services”, Advances in Consumer Research, Vol 13, Richard J. Lutz ed. Michigan: Association for Consumer Research, p. 311.)
32
not be so simple. Oliver (1980a) suggested that expectations perform the function of an
adaptation level in that they define the baseline or standard against which subsequent
performance is judged, i.e., a norm. Woodruff, Cadotte and Jenkins (1983) suggested that
the relationship, instead of being monotonic and continuous is one of zonal ranges. They
argue that expectations are based on experience (product or brand) and that some interval
around a performance norm is likely to be considered equivalent to the norm. They
referred to this interval as a "zone of indifference". Hence positive or negative
discontinuation only results when the evaluation (comparison of performance and
expectations) is outside the zone of indifference, and thus sufficiently different from the
norm to be recognised as such.
In the consumer behaviour literature, the discontinuation paradigm is the basis for nearly
all proposed satisfaction processes. Churchill and Surprenant (1982) note:
"Since the early 1970s the volume of consumer satisfaction research has been impressive. Numerous theoretical structures have been proposed to examine the antecedents of satisfaction and develop meaningful measures of the construct. The vast majority of these studies have used some variant of the disconfirmation paradigm which holds that satisfaction is related to the size and direction of the disconfirmation experience.."(p. 491).
Studies focusing upon the antecedents of CS/D have produced strong empirical support for
the disconfirmation of expectations model across a wide range of non-durable, low-
involvement products (Anderson 1973; Cardozo 1965; Olshavsky and Miller 1972; Olson
and Dover 1979; Oliver 1979; Oliver 1980a; Swan and Trawick 1980; Churchill and
Surprenant 1982). However, comparatively little attention has been paid to testing the
paradigm with durable, high-involvement products or indeed services. The few exceptions
including studies by Churchill and Surprenant 1982, (new video disc player), Patterson
1993 (wood-burning slow combustion heaters) and Tse and Wilton 1988, (miniature hand
held record player). This lack of attention to high-involvement products is surprising given
that they are characterised by higher search effort, higher perceived risk, expectations
33
concerning a greater number of product attributes, (Barber and Venkatraman 1986) and
more intense post-purchase evaluation (Gr^nhaug 1977). The lack of attention to services is
even more surprising given the distinctive characteristics of services (as reviewed in
Chapter 2 of this thesis) which impact upon consumers' pre and post-evaluation processes.
In order to establish causality between the key constructs (i.e., expectations, performance,
disconfirmation and CS/D), the majority of early studies in the area were conducted in an
experimental setting where expectations was usually manipulated. The strongest support
for the paradigm is found in three studies: Anderson (1973), Cardozo (1965), and
Olshavsky and Miller (1972). These experimental designs were essential in the formative
stages of the development of the paradigm, and had the advantage of high internal validity.
However they suffer from reduced external validity because (a) subjects did not actually
use the product, and (b) the elapsed time between the expectation manipulation and
performance evaluation was limited. As Churchill and Surprenant (1982, p. 503) point
out, their experiment "..did not allow satisfaction as it is typically conceived to operate.
Consumer satisfaction is a post-purchase phenomenon. It reflects how much the consumer
likes or dislikes the product after using it. Respondents did not actually use the product in
our experiment.." More recently a number of cross-sectional field studies have been
reported examining a purchase event at a single point in time with expectations being
measured retrospectively (e.g., Brown and Swartz 1989; Westbrook and Reilly 1983).
However, expectation is a pre-purchase construct and therefore should ideally be measured
separately from, and prior to, perceptions of performance. A number of longitudinal
studies, mostly in recent times have appeared in the literature (Bolton and Drew 199 la ,6;
Mazursky and Geva 1989; Oliver and Bearden 1983; Patterson 1993). One of the strengths
of the current study is that it utilises a longitudinal framework to overcome the
aforementioned methodological weaknesses.
In summary, the research to date supports the disconfirmation paradigm, especially for
non-durable goods. Oliver and DeSarbo (1988, p. 496) claim support for the paradigm is
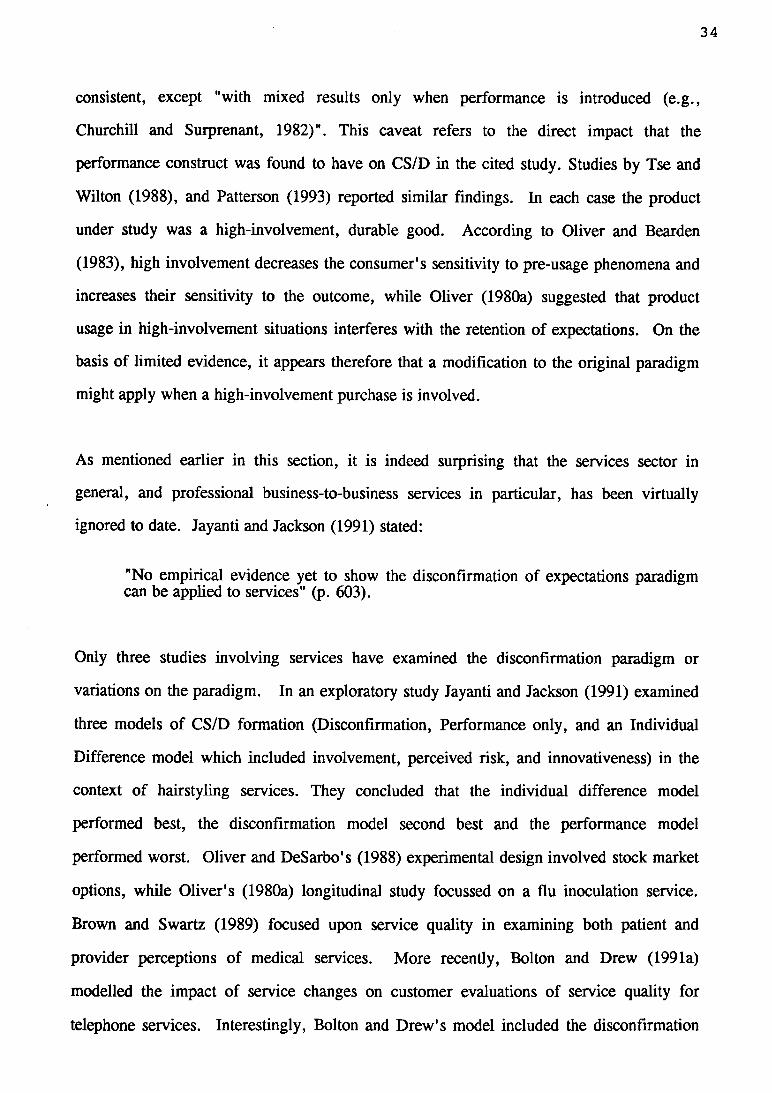
34
consistent, except "with mixed results only when performance is introduced (e.g.,
Churchill and Surprenant, 1982)". This caveat refers to the direct impact that the
performance construct was found to have on CS/D in the cited study. Studies by Tse and
Wilton (1988), and Patterson (1993) reported similar findings. In each case the product
under study was a high-involvement, durable good. According to Oliver and Bearden
(1983), high involvement decreases the consumer's sensitivity to pre-usage phenomena and
increases their sensitivity to the outcome, while Oliver (1980a) suggested that product
usage in high-involvement situations interferes with the retention of expectations. On the
basis of limited evidence, it appears therefore that a modification to the original paradigm
might apply when a high-involvement purchase is involved.
As mentioned earlier in this section, it is indeed surprising that the services sector in
general, and professional business-to-business services in particular, has been virtually
ignored to date. Jayanti and Jackson (1991) stated:
"No empirical evidence yet to show the discontinuation of expectations paradigmcan be applied to services" (p. 603).
Only three studies involving services have examined the discontinuation paradigm or
variations on the paradigm. In an exploratory study Jayanti and Jackson (1991) examined
three models of CS/D formation (Discontinuation, Performance only, and an Individual
Difference model which included involvement, perceived risk, and innovativeness) in the
context of hairstyling services. They concluded that the individual difference model
performed best, the disconfirmation model second best and the performance model
performed worst. Oliver and DeSarbo's (1988) experimental design involved stock market
options, while Oliver's (1980a) longitudinal study focussed on a flu inoculation service.
Brown and Swartz (1989) focused upon service quality in examining both patient and
provider perceptions of medical services. More recently, Bolton and Drew (1991a)
modelled the impact of service changes on customer evaluations of service quality for
telephone services. Interestingly, Bolton and Drew's model included the disconfirmation
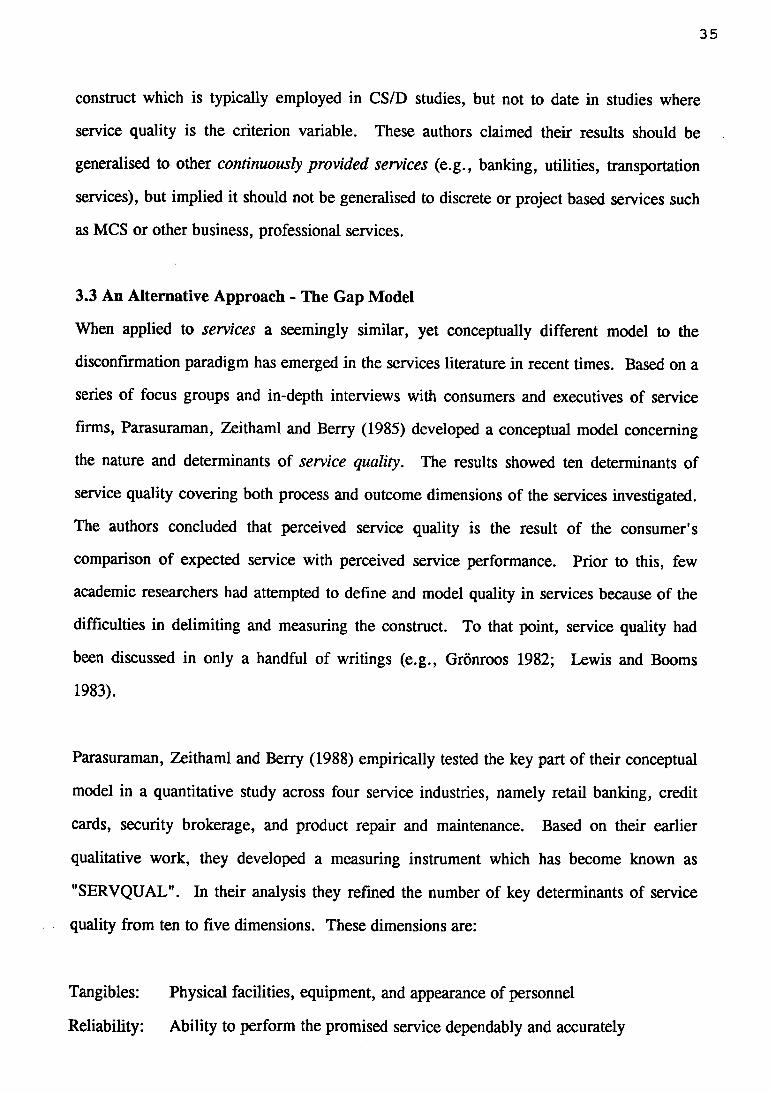
35
construct which is typically employed in CS/D studies, but not to date in studies where
service quality is the criterion variable. These authors claimed their results should be
generalised to other continuously provided services (e.g., banking, utilities, transportation
services), but implied it should not be generalised to discrete or project based services such
as MCS or other business, professional services.
3.3 An Alternative Approach - The Gap Model
When applied to services a seemingly similar, yet conceptually different model to the
disconfirmation paradigm has emerged in the services literature in recent times. Based on a
series of focus groups and in-depth interviews with consumers and executives of service
firms, Parasuraman, Zeithaml and Berry (1985) developed a conceptual model concerning
the nature and determinants of service quality. The results showed ten determinants of
service quality covering both process and outcome dimensions of the services investigated.
The authors concluded that perceived service quality is the result of the consumer's
comparison of expected service with perceived service performance. Prior to this, few
academic researchers had attempted to define and model quality in services because of the
difficulties in delimiting and measuring the construct. To that point, service quality had
been discussed in only a handful of writings (e.g., Gronroos 1982; Lewis and Booms
1983).
Parasuraman, Zeithaml and Berry (1988) empirically tested the key part of their conceptual
model in a quantitative study across four service industries, namely retail banking, credit
cards, security brokerage, and product repair and maintenance. Based on their earlier
qualitative work, they developed a measuring instrument which has become known as
"SERVQUAL". In their analysis they refined the number of key determinants of service
quality from ten to five dimensions. These dimensions are:
Tangibles: Physical facilities, equipment, and appearance of personnel
Reliability: Ability to perform the promised service dependably and accurately
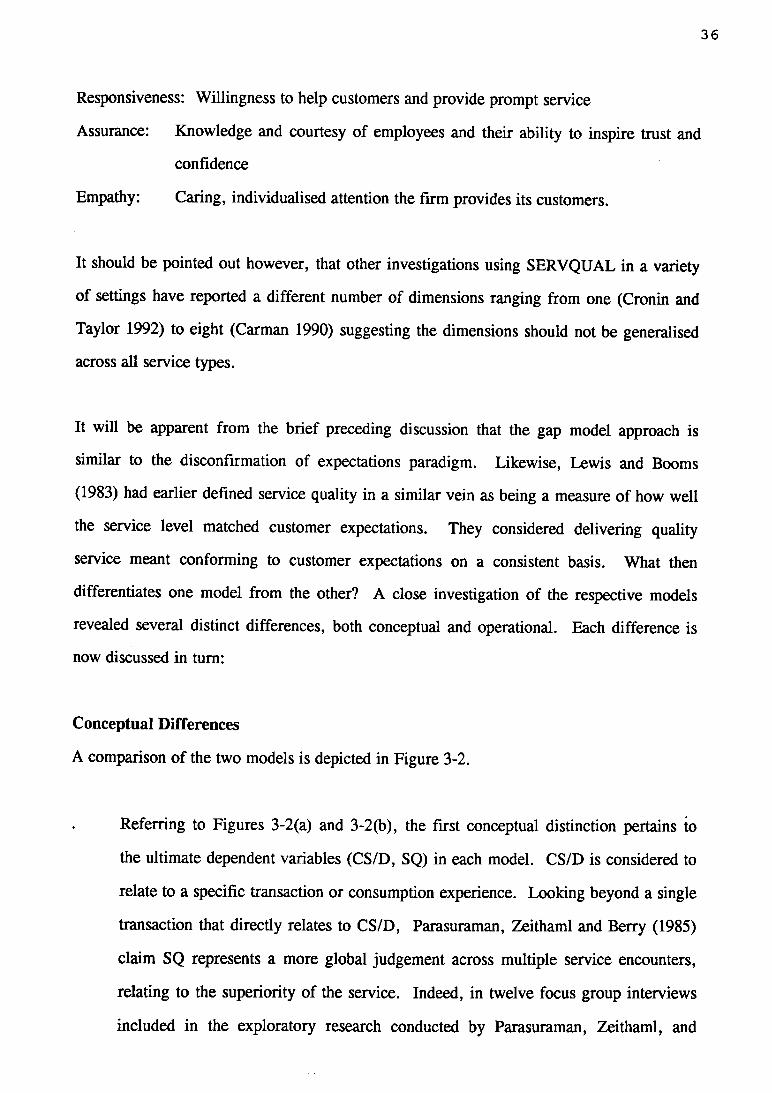
36
Responsiveness: Willingness to help customers and provide prompt service
Assurance: Knowledge and courtesy of employees and their ability to inspire trust and
confidence
Empathy: Caring, individualised attention the firm provides its customers.
It should be pointed out however, that other investigations using SERVQUAL in a variety
of settings have reported a different number of dimensions ranging from one (Cronin and
Taylor 1992) to eight (Carman 1990) suggesting the dimensions should not be generalised
across all service types.
It will be apparent from the brief preceding discussion that the gap model approach is
similar to the discontinuation of expectations paradigm. Likewise, Lewis and Booms
(1983) had earlier defined service quality in a similar vein as being a measure of how well
the service level matched customer expectations. They considered delivering quality
service meant conforming to customer expectations on a consistent basis. What then
differentiates one model from the other? A close investigation of the respective models
revealed several distinct differences, both conceptual and operational. Each difference is
now discussed in turn:
Conceptual Differences
A comparison of the two models is depicted in Figure 3-2.
. Referring to Figures 3-2(a) and 3-2(b), the first conceptual distinction pertains to
the ultimate dependent variables (CS/D, SQ) in each model. CS/D is considered to
relate to a specific transaction or consumption experience. Looking beyond a single
transaction that directly relates to CS/D, Parasuraman, Zeithaml and Berry (1985)
claim SQ represents a more global judgement across multiple service encounters,
relating to the superiority of the service. Indeed, in twelve focus group interviews
included in the exploratory research conducted by Parasuraman, Zeithaml, and
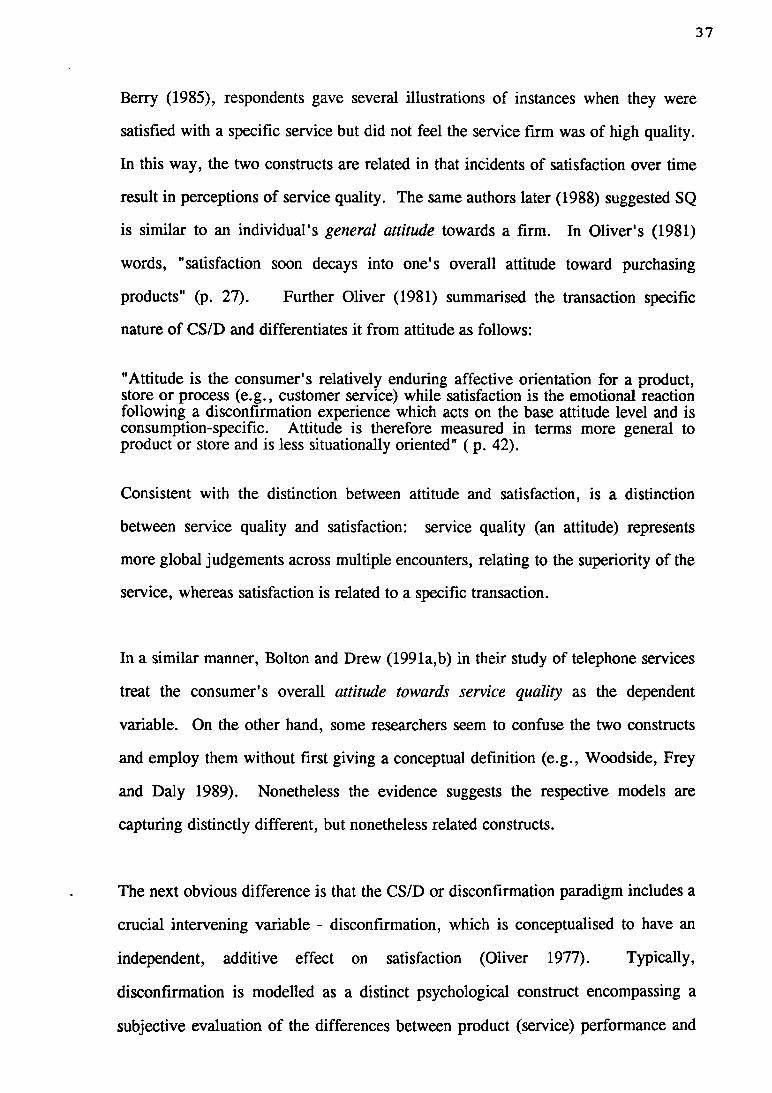
37
Berry (1985), respondents gave several illustrations of instances when they were
satisfied with a specific service but did not feel the service firm was of high quality.
In this way, the two constructs are related in that incidents of satisfaction over time
result in perceptions of service quality. The same authors later (1988) suggested SQ
is similar to an individual's general attitude towards a firm. In Oliver's (1981)
words, "satisfaction soon decays into one's overall attitude toward purchasing
products" (p. 27). Further Oliver (1981) summarised the transaction specific
nature of CS/D and differentiates it from attitude as follows:
"Attitude is the consumer's relatively enduring affective orientation for a product, store or process (e.g., customer service) while satisfaction is the emotional reaction following a disconfirmation experience which acts on the base attitude level and is consumption-specific. Attitude is therefore measured in terms more general to product or store and is less situationally oriented" ( p. 42).
Consistent with the distinction between attitude and satisfaction, is a distinction
between service quality and satisfaction: service quality (an attitude) represents
more global judgements across multiple encounters, relating to the superiority of the
service, whereas satisfaction is related to a specific transaction.
In a similar manner, Bolton and Drew (1991a,b) in their study of telephone services
treat the consumer’s overall attitude towards service quality as the dependent
variable. On the other hand, some researchers seem to confuse the two constructs
and employ them without first giving a conceptual definition (e.g., Woodside, Frey
and Daly 1989). Nonetheless the evidence suggests the respective models are
capturing distinctly different, but nonetheless related constructs.
The next obvious difference is that the CS/D or disconfirmation paradigm includes a
crucial intervening variable - disconfirmation, which is conceptualised to have an
independent, additive effect on satisfaction (Oliver 1977). Typically,
disconfirmation is modelled as a distinct psychological construct encompassing a
subjective evaluation of the differences between product (service) performance and
38
expectations (Oliver 1980a). That is, it encompasses the set of psychological
processes that may mediate perceived performance discrepancies. Tests of the
CS/D paradigm have consistently shown that the disconfirmation construct is a
powerful predictor of CS/D (Oliver 1980a; Oliver and DeSarbo 1988; Patterson
1993; Tse and Wilton 1988). The gap model simply omits this intervening
variable. Parasuraman, Zeithaml and Berry (1985, 1988) do not offer an
explanation for omitting disconfirmation when explicating their model. Referring to
Figure 3-2, unless there exists other key conceptual differences in the models then it
appears that the dependent variable in the gap model (SQ) may equate to
disconfirmation in the CS/D model.
Recent studies (Bitner 1990; Oliver and Swan 1989) have indicated that consumer
attributions (attributions are what people perceive to be the causes behind their own
behaviour, or the behaviour of other parties) and equity perceptions respectively,
are also antecedents of CS/D. This suggests that the traditional disconfirmation
model may indeed be far more complex than has previously been indicated. The
SQ gap model has not to date attempted to include these additional antecedent
variables.
As discussed earlier in this chapter, several empirical studies involving high-
involvement goods and services have shown perceived performance to have a direct
effect (as well as an indirect one mediated through disconfirmation) on CS/D
(Bolton and Drew 1991a; Patterson 1993; Tse and Wilton 1988). This direct effect
is not captured in the SQ or gap model. It postulates that all consumer evaluations
are a direct result of Performance minus Expectations. Whilst the gap model has
not been empirically tested on high-involvement services (e.g., management
consulting, legal, medical, investment, financial advice) it seems reasonable to
assume that such services carry similar, if not greater, risk and uncertainty
perceptions, engage in similarly intense information search and post consumption
39
evaluation. In addition, as discussed in Chapter 2, services are intrinsically difficult
to evaluate, especially before and during consumption. Hence post-purchase
evaluation of services is considered to be even more intense than for high-
involvement goods. High-involvement purchase situations for services are therefore
thought to decrease the consumers sensitivity to pre-usage expectations and increase
their sensitivity to the outcome (Oliver and Bearden 1983). Therefore it would be
reasonable to expect that perceived performance would have a direct impact as well
as an indirect (via expectations) impact on SQ.
. To make an assessment of SQ a consumer does not necessarily have to have
experienced the service (Rust and Oliver 1992). The SQ perceptions of say,
Marriot, Club Med, Qantas Airlines, American Express or Disney World, for
example, may be formed on the basis of word-of-mouth, marketer controlled
communications (e.g., advertising, point-of-sale material) or forms of non-marketer
controlled communications (e.g., publicity) without ever having experienced the
service in question. CS/D on the other hand, by definition, is transaction specific
and represents a consumer's post-purchase evaluation of the tried service (product)
offering (Hunt 1977). Both constructs therefore represent an evaluation rendered,
but one (CS/D) is based on experience with the service, while the other (SQ), is not
necessarily experience based. This is an important distinction as it adds weight to
the argument that SQ is attitude-like, since attitudes may be formed in part at least,
by non-experiential factors.
Operational Differences
. Because CS/D is transaction specific it should therefore be measured as soon as
possible after the service transaction has taken place. SQ perceptions on the other
hand, being a more enduring attitude and representing multiple transactions, could
be measured some time after exposure to a range specific service provider
40
experiences or exposure to some form of marketer or non-marketer
communications.
As indicated later in Section 3.4.3, the pre-purchase standard (expectations) in
CS/D research is typically operationalised as expected or predictive performance. It
reflects what performance "will (probably) be”. In contrast, in determining SQ
expectations are defined as the equitable or deserved, level of performance. It
represents the level of performance a consumer feels they "should" receive. For
example, Parasuraman, Zeithaml and Berry's (1988, p. 38) SERVQUAL instrument
asks respondents "..Please show the extent to which you think firms offering
....services should possess the features described by each statement" (emphasis
added). It is worth noting however that equitable, deserved or "should" receive
expectations have typically been used concerning frequently used (continuously
provided) services (e.g., banking, credit cards, security brokerage) (Berry and
Parasuraman 1991) where consumers have a range of recent experiences upon
which to draw. Hence, respondents will have some recent, normative pre-purchase
standard upon which to evaluate service performance. Therefore, measuring
equitable or "should" receive expectations seems appropriate in such situations.
Although the gap model does not explicitly measure disconfirmation, it does
nonetheless produce a difference or gap score (performance minus expectations).
This is an inferred measure which has been faulted on the grounds of its
psychometric properties (Brown, Churchill and Peter 1992). CS/D researchers on
the other hand prefer a perceived (or subjective) measure (using "Better than
expected" - "Worse than expected" scales) as disconfirmation is viewed as an
independent, mediating construct, and "the primary integrating cognition which
captures the discrepancy evaluation process". (Oliver and Bearden 1985, p. 236).
41
. Finally, SQ is an attitude concerning a customer's global evaluation of a service
offering - however there is little research on temporal shifts in attitudes towards
services (Bolton and Drew 1991a). Adaptation level theory provides a useful
framework for explaining these changes (Oliver 1980b). It suggests that past
experience with a phenomenon provides an anchor for subsequent judgements, and
that exposure to some stimuli (e.g., a transaction with a service firm thus generating
CS/D) above/below the adaption level modifies subsequent attitudes (Helson 1964).
In other words, a customer's attitude about a service offering at time t2 is to an
extent a function of attitude at time mediated by CS/D for current transactions.
This hypothesised relationship is shown in Figure 3-2(c). The purpose of Figure 3-
2(c) is to highlight a relationship between the models. It also indicates perhaps that
the gap model is inadequate for explaining the antecedents of SQ (an attitude) since
the model fails to include three key constructs - CS/D, disconfirmation and prior
attitudes, and fails to allow for any direct performance effects (at least for high-
involvement purchases).
The preceding discussion has highlighted the differences and similarities between the two
models. Furthermore, it indicates that SQ should be conceptualised as an overall attitude
toward the firm (and its services), and CS/D is transaction specific but later decays into an
attitude (SQ). These arguments are incorporated in the integrated model depicted in Figure
3-2(c). That is CS/D (resulting from a series of transactions with a service provider over
time), together with prior attitudes, will directly impact upon current perceptions of SQ.
The causal direction of this relationship is disputed by Cronin and Taylor's (1992) recent
work. They concluded on the basis of a structural equation analysis (Lisrel) that "..the
analysis ..indicates that this (i.e., CS/D -* SQ) may not be the case and provides empirical
support for the notion that service quality in fact leads to satisfaction" (p. 64).
Interestingly however, they do not provide any conceptual support for the direction of this
causal link or indeed their empirical findings. Unfortunately all their key constructs
(attitude/SQ, expectations, performance, CS/D and intentions) were measured at the one
42
point in time when in fact some are pre-purchase constructs (expectations), others should
be measured immediately post-purchase, and others measured some time after purchase and
consumption (SQ, intentions). The hypothesised relationship between the CS/D and SQ or
gap model put forth in this dissertation, is however supported by the findings of Bolton and
Drew's (1991a) three-stage longitudinal study of telephone services, and to a lesser extent
the work of Bitner (1990). Bolton and Drew (1991a) concluded that service changes
impacted upon CS/D for various components of service, but "average ratings of perceived
service quality are very stable and change slowly, so the effects of a service change become
noticeable only in the long term" (p. 7). They also concluded that "Furthermore,
customers current attitudes depend greatly on their prior attitudes.." (p. 7.).
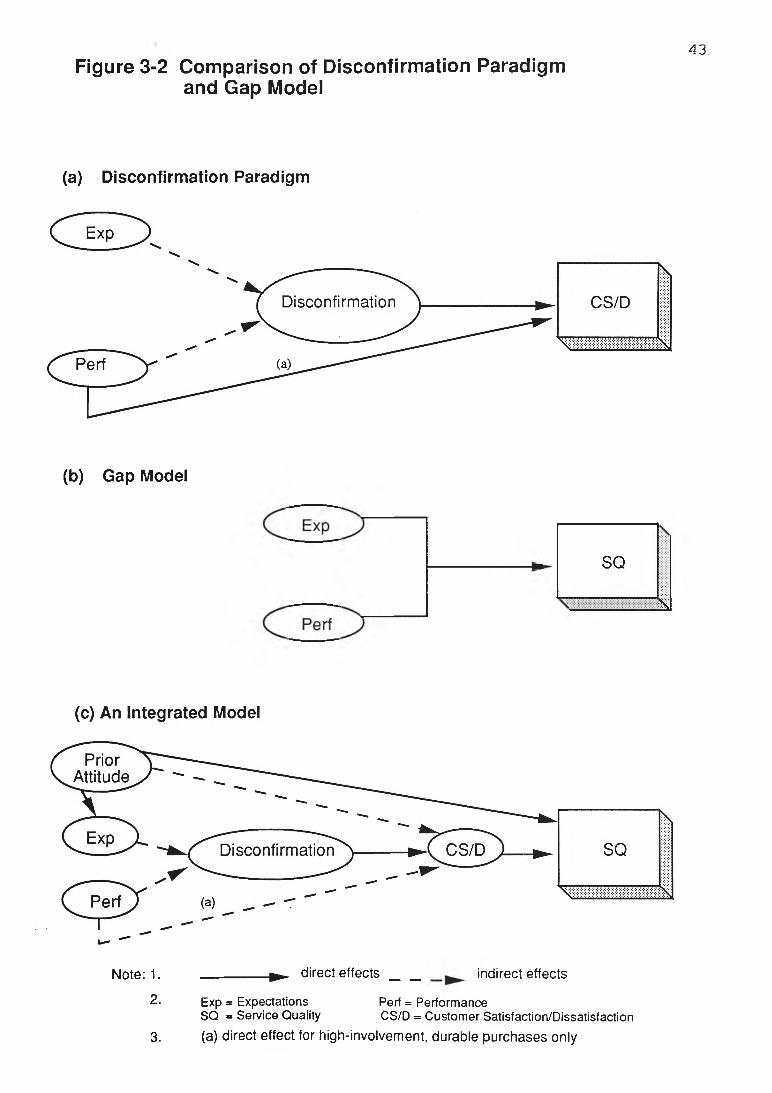
43Figure 3-2 Comparison of Disconfirmation Paradigm
and Gap Model
(a) Disconfirmation Paradigm
(b) Gap Model
SQ
1
Note:1. .________ ► direct effects _ __ indirect effects
2. Exp = Expectations Perf = PerformanceSQ = Service Quality CS/D = Customer Satisfaction/Dissatisfaction
(a) direct effect for high-involvement, durable purchases only3.
3.4 Key Constructs In The Discontinuation Paradigm
Each of the key constructs (i.e., satisfaction, expectations, discontinuation, and
performance) in the traditional disconfirmation of expectations paradigm will now be
discussed in turn. In addition, the conceptual relationship between three related constructs,
CS/D, attitude and SQ will be discussed.
3.4.1 Satisfaction
Despite the acceptance of satisfaction as a critical concept in marketing thought and
consumer research, a review of the literature indicates that until recently at least, it has
been variously defined. Conceptually, consumer satisfaction/dissatisfaction (CS/D)
contains both cognitive and affective elements. In fact, Swan (1982) noted that:
"Satisfaction is a ...specific affective/cognitive post-purchase orientation that has as its focus the evaluation of the product in terms of its performance in use" (p. 126).
Hunt (1977) stated satisfaction was:
"The evaluation rendered that the (product, product ownership and usage) experience was at least as good as it was supposed to be" (p. 459).
The conceptualisation that appears to have received the greatest support is the view that
satisfaction is a post-choice evaluative judgement concerning a specific purchase transaction
(Day 1984) However, Oliver (1981) has suggested that CS/D also has an emotional
component in response to the evaluation process. He stated:
"Satisfaction is a summary psychological state resulting when the emotion surrounding discontinued expectations is coupled with the consumer's prior feelings about the consumption experience" (p. 27).
The evaluative aspect of CS/D judgement is typically assumed to vary along a hedonic
continuum, i.e., from unfavourable (e.g., dissatisfied) to favourable (satisfied). Therefore
a natural question is whether CS/D and consumption emotion are distinguishable theoretical
45
constructs (Westbrook and Oliver 1991). Other researchers have conceptualised CS/D
itself as an emotional response to the judgemental disparity between product performance
and some prior standard (e.g., prior expectation), (Cadotte, Woodruff and Jenkins 1987).
Operationally however, satisfaction occurs when a product/service offering performs better
than expected. Dissatisfaction is the outcome when post-purchase performance does not
match up to pre-purchase expectations (Bolton and Drew 1991a).
The preceding conceptual and operational definitions suggest that CS/D is a summary or
global evaluation of a specific consumption experience. It indicates a gestalt approach in
that consumers are able to make a single evaluation of a product/service, which includes all
of the experiences surrounding its purchase and use. This gestalt view has widespread
recognition, both conceptually and as an operational definition. Some researchers however
have suggested a multi-attribute or disaggregative approach needs to be considered.
Churchill and Surprenant (1982) stated "Operationally satisfaction...can be assessed as the
sum of the satisfactions with various attributes of the product or service" (p. 493). Czepiel
and Rosenberg (1977) suggested that the multi-attribute approach deserved serious
consideration, but cautioned that it assumes satisfaction can best be quantified by measuring
each of the various attributes and then combining them into an overall measure. A multi
attribute approach might be appropriate for high-involvement purchases where perceived
risk is higher and consequently consumers hold expectations about a greater number of
attributes than they do for low-involvement products (Barber and Venkatraman 1986).
Another issue in the CS/D literature worthy of discussion, especially in the context of the
"consumption" of services, is the temporal dimension of the satisfaction construct. As
Czepiel and Rosenberg (1977) noted:
a time dimension might be added. It would be reasonable to assume that satisfaction may change from the time of purchase through the consumption and final disposal of a product. Three time frames become relevant: instantaneous, short-run and long-run” (p. 6).
46
It is not difficult to envision time being an important dimension for durable products with
an extended "consumption" duration, or for continuously (as opposed to discrete) provided
services (e.g., ongoing audit relationship with a client; or management consultancy
engagement extending over, say, a 6 month period).
Tse, Nicosia and Wilton (1990) recognised that consumers' feelings and emotions about a
product continues with the experiences of the purchased product over time. Patterson,
Romm and Hill (1992) have also drawn a similar conclusion in their longitudinal study of
overseas students (consumers) in Australia purchasing a professional service (i.e., higher
education). Tse, Nicosia and Wilton (1990) also concluded that existing research
concentrated on consumers' activities and mental processes preceding and during the act of
purchase, but neglected the "closing of the loop"; that is, the post-purchase activities.
Accordingly, whereas most of the literature has conceptualised and measured CS/D as a
single isolated consumption experience, they are proposing a process view of satisfaction.
Tse, Nicosia and Wilton (1990) state:
"..consumer satisfaction should be conceptualised as a dynamic, multidimensional, subjective process following the act of purchase" (p. 178).
Gronroos (1992) supported this view when he suggested the need to move from the present
static models of service quality, (and CS/D) to creating a dynamic process model. When
CS/D is conceptualised as a process, time becomes an important variable. As alluded to
earlier, time also interacts with product (service) performance in the satisfaction process.
Even after purchase, a consumer may not be able to evaluate some attributes immediately.
These attributes might include for example, durability, consistency in performance, and
social desirability.
The problem is likely to be even more pronounced with services whose attributes are
experience-related (Parasuraman, Zeithaml and Berry 1988). Satisfaction with medical
47
services, for example, has long been a major puzzle for researchers. How this continuous
unfolding of service performance impacts on the CS/D process is still largely unexplored
(Tse, Nicosia and Wilton 1990).
The implication is that future studies of CS/D, like the current one, need to be longitudinal
in order to capture possible shifts in satisfaction as a result of consumers' extended product
(service) usage over time. This seems particularly important for services, and high-
involvement, complex or durable products.
3.4.2 Expectations
Expectations are the most commonly used pre-purchase comparison standard in CS/D
research. That expectations (or some like comparison standard or norm) and subsequent
product (service) experience interact to affect CS/D and service quality has been given
substantial support in the literature (Parasuraman, Zeithaml and Berry 1985; Ross et al
1987; Cadotte, Woodruff and Jenkins 1987). In the terminology of adaptation-level
theory, initial expectations form the reference point for evaluating subsequent product
(service) experience. Despite this acceptance of the crucial role that expectations play in
CS/D and service quality formation, and the fact that research on expectations has been
extensive, consensus has not yet been reached on a number of issues surrounding its
conceptualisation (Mundt 1989). These unresolved issues concern (a) the most appropriate
type of expectations to use, (b) expectations versus other comparison standards, and (c) the
effect of situation differences in choosing an appropriate comparison standard.
An expectation is a belief about an object or service (e.g., medical treatment) and an
attribute(s) of that object (reduce pain). Beliefs are cognitive, constituting the information
about objects from which attitudes are developed. In general, consumers have relatively
few beliefs about an object, but can add beliefs by receiving new information or using past
experience in concert with new information to create new inferential beliefs (Fishbein and
Ajzen 1975). Defining expectations as beliefs allows expectations to be cognitive,
influenced by information and individual experience, and therefore capable to modification
over time.
In the majority of studies using the disconfirmation paradigm, expectations are postulated
as the standard for evaluating focal brand performance (i.e., the tried brand). However,
three approaches to conceptualising a pre-purchase comparison standard have been
suggested in the CS/D literature:
. Equitable or Deserved
Borrowing from equity theory (Adams 1963), this represents a normative standard for
performance and reflects the consumers' subjective evaluation of their product investment.
It represents the level of performance the consumer feels they ought to receive, or deserve,
given their perceived costs (Miller 1977; Woodruff, Cadotte and Jenkins 1983). Swan and
Trawick (1979b) empirically tested two types of expectations: predictive and desired, and
found them to have different impacts on CS/D formation. Desired expectations or
estimates of performance were defined as the levels that would be necessary to satisfy or
please the consumer. Thus, "desired" expectations are conceptually very similar to
Miller's (1977) concept of "deserved" expectations.
. Ideal
The ideal is the "wished for" level of product performance. It represents the optimal
product performance and reflects what performance "can be". It is based on previous
product exposure, advertising messages and other forms of marketing communications
(Leichty and Churchill 1979; Miller 1977).
. Expected
Deriving from expectancy theory, expected performance represents a products most likely
performance (Leichty and Churchill 1979) and is similar to Swan and Trawick's (1979b)
49
predictive expectations. Predictive expectations are defined as "the consumers pre-usage
estimates of the performance level that the product was anticipated to achieve" (Swan and
Trawick 1979b, p. 7). It is the most commonly used pre-purchase comparison standard in
CS/D research and reflects what performance "will (probably) be" (Tse and Wilton 1988).
These three approaches may be thought of as what consumers believe they: (a) "should"
receive (equitable or deserved), (b) "could" receive (ideal) and (c) "would" receive
(expected or predictive).
Because of the similarity between the Disconfirmation and Service Quality models, it seems
appropriate to comment on the pre-purchase comparison standards utilised in each model.
As discussed earlier in this chapter, Parasuraman, Zeithaml and Berry's (1985; 1988)
model of service quality relies on measuring expectations as the pre-purchase comparison
standard. However the term "expectations" as used in the service quality literature differs
from the way it is used in the CS/D, disconfirmation of expectations paradigm literature.
Parasuraman, Zeithaml and Berry (1988) state:
"... in the satisfaction literature, expectations are viewed as predictions made by consumers about what is likely to happen during an impending transaction or exchange. For instance, according to Oliver (1981), "It is generally agreed that expectations are consumer-defined probabilities of the occurrence of positive and negative events if the consumer engages in some behaviour" (p. 33). In contrast, in the service quality literature, expectations are viewed as desires or wants of consumers, i.e., that they feel a service provider should offer rather than would offer" (p. 17).
Parasuraman, Zeithaml and Berry's (1988) argument is far from convincing. As was
discussed earlier in this chapter that CS/D researchers have indeed defined and utilised
three different types of expectations, including what consumers' feel a service provider
"should" offer (i.e., equitable or deserved performance expectations). Indeed, Woodruff
Cadotte and Jenkins (1983) proposed the very same expectations measure (i.e., "should"
provide) several years earlier, for use in CS/D research. They stated:
50
"We proposed that consumers are likely to rely on standards that reflect the performance a consumer believes a focal brand should provide to meet needs/wants. To distinguish three standards from the usual expectations concept, we call them "experienced based norms" (p. 306). (Emphasis added).
Parasuraman, Zeithaml and Berry (1988) provide no theoretical or conceptual argument for
using an equitable or deserved (i.e., what service provider "should" offer) measure of
expectations. Further, they make no attempt to conceptually link this particular category of
expectations to their dependent measure, service quality. Whilst there have been few
conceptual arguments put forward for the differing expectations measures utilised in the
CS/D (discontinuation) and service quality models, a close examination of the service
quality measuring instrument (commonly referred to as the SERVQUAL instrument) is
enlightening.
As mentioned earlier, Service Quality is defined as a global judgement. The SERVQUAL
instrument asks respondents to indicate their expectations about firms in general - another
global measure. The latter is also akin to Cadotte, Woodruff and Jenkins "experience-
based norms" concept. It seems therefore that the common conceptual thread running
through the SQ literature is a series of general, global judgements. By contrast, much of
the CS/D literature has defined expectations narrowly as beliefs or predictions about a focal
brand (i.e., the tried brand) having certain attributes (Cadotte, Woodruff and Jenkins 1987;
Olson and Dover 1979).
Cadotte, Woodruff and Jenkins' (1987) empirical study of restaurant patrons examined
three types of comparison standards: focal brand expectations; best brand norms; and
generalised product norms (the latter two categories being referred to as "experience-based
norms"). They concluded (a) the product norm and the best brand norm models
(experienced based models) were better than the brand expectations model in explaining
variations in CS/D; (b) despite (a), there was a high correlation between the three
comparison standards suggesting a common core existed between them; and (c) the most
appropriate comparison standard is situation and product specific and that "no one standard
51
will always best explain satisfaction processes. Rather, researchers need a typology of
evaluation standards from which to draw" (p. 313).
Other Issues
The final issue addressed in this section, worthy of brief discussion, relates to expectations
for discrete versus continuously provided services. Oliver (1989) proposes that customer
responses for continuously provided services (e.g., banking services, public utilities, long
term client-auditor relationship) or long lasting durable goods are characterised by passive
expectations and that the disconfirmation construct will not operate unless service changes
occur that are outside the range of experienced based norms. Bolton and Drew (1991a) in a
study of the impact of service changes on customer attitudes for telephone services (a
continuous service) found in qualitative indepth interviews that customers had not actively
processed expectations. They stated:
"...concurrent verbal protocols collected during in-depth interviews with 50 telephone company customers yielded many speech segments about their perceptions of current performance, but not about expectations. Perhaps customers do not explicitly conceptualise expectations about service because telephone service is characterised by its stability" (p. 3). (Emphasis added).
Hence, their model postulated that a customer's satisfaction with local telephone service is
not affected directly by expectations (but only indirectly through disconfirmation). A
corollary is that customers actively process expectations for discrete services (e.g.,
occasional use of legal or medical services).
3.4.3 Disconfirmation
In the literature, the disconfirmation construct occupies a central focus as an independent,
crucial mediating variable. It is a comparison process and believed to be the primary
integrating cognition which captures the expectation-performance discrepancy evaluation
process. It is the direction and magnitude of this discrepancy that impacts on CS/D (Oliver
and Bearden 1983, 1985). If CS/D were purely performance dependent, there would be no
52
need for the disconfirmation or any other intervening variables. However, to the extent
that two consumers perceive identical performance, yet express different levels of CS/D,
"then other factors appear to be operating" (Oliver and Bearden 1985, p. 236). Empirical
studies (e.g., Anderson 1973; Oliver 1980a) have shown that as long as expectations vary
across consumers, the intervening construct approach is tenable.
Furthermore, disconfirmation is not thought to be satisfaction per se, which is a more
complex emotion involving a number of evaluative tendencies. While disconfirmation has
been shown to be a direct antecedent of CS/D, the psychological meanings of the two
constructs are sufficiently distinct so that they load on different dimensions when factor
analysed.
Some debate still exists, however, on the exact conceptualisation of the construct.
Disconfirmation has been modelled both as (a) inferred or subtractive disconfirmation (i.e.,
the difference between performance and expectations) (e.g., LaTour and Peat 1979); and
(b) a perceived or subjective evaluation of this discrepancy (e.g., Oliver 1980a), typically
measured using "Better than Expected" - "Worse than Expected" rating scales.
Inferred or subtractive disconfirmation assumes that the effects of a post-purchase
comparison on CS/D can be expressed as a function of the algebraic difference between
perceived performance and expectations. This approach was supported in industrial and
cognitive psychology (e.g., Anderson 1981). However, recent work by Carman (1990)
and Brown, Churchill and Peter (1992) has questionned the validity of this approach due to
psychometric problems associated with issues of discriminant validity, reliability and
variance restriction. Subjective (perceived) disconfirmation represents a distinct
psychological construct embracing a subjective evaluation of any variation between
performance and expectations; i.e., it encompasses the set of psychological processes that
may mediate perceived performance discrepancies. Such processes may be important in
53
purchase situations in which performance is difficult to evaluate (Tse and Wilton 1988),
(e.g., most services, but especially services high in credence qualities).
Oliver (1980a) suggests the subjective approach offers a richer explanation of the complex
processes underlying CS/D formation. Oliver's arguments are summarised in his work (p.
460) and in Tse and Wilton's (1988, p. 205) research. However, perhaps the difference is
not a major issue as Trawick and Swan (1980), in a study of fabric cleaners found a strong
correlation between the subtractive and subjective measures (r = 0.85).
The relationship between expectations and discontinuation has also been debated. Some
researchers claim discontinuation may have a greater impact on CS/D than does
expectations, because expectations may decay over time as product usage experience
interferes with the retention of expectations (Oliver 1980a). Patterson (1993) in a study of
a high-involvement, durable product found disconfirmation to have a greater direct impact
on CS/D. However when the total of both the direct and indirect effects (i.e., expectations
had indirect effects via disconfirmation, and via the performance variable in the tested
model), expectations had a greater overall impact on CS/D than did disconfirmation (total
effects of .47 and .29, respectively).
Oliver and DeSarbo (1988, p. 505), in a study which included attribution, expectation,
performance, disconfirmation, and equity found that, although their data "revealed some
distinct differences in how individuals respond to the stimuli presented, these differences
could not be identified". They suggested that some consumers may be more expectations
influenced, others may be more disconfirmation influenced, and others use both as separate
effects in the satisfaction response.
Results of other studies indicate that the role of disconfirmation may vary between differing
product use situations, such as Churchill and Surprenant's (1982) finding that
54
disconfirmation was an important determinant of satisfaction for non-durables but not for
durable products.
3.4.4 Performance
The final key construct in the disconfirmation paradigm is perceived performance. The
primary role of performance in the CS/D literature has been as a standard of comparison
(Churchill and Surprenant 1982). Olshavsky and Miller (1972) and Olson and Dover
(1976) in their experimental designs manipulated product performance. Their focus
however was on how performance perceptions were influenced by expectations, rather than
the impact of performance on CS/D. Churchill and Surprenant (1982) on the other hand
simultaneously examined the impact of performance on disconfirmation and CS/D for both
a high involvement, durable product (new video disc player) and a low involvement, non
durable product (a plant) and concluded that performance had a direct impact on CS/D in
both instances. For the high involvement, durable product (new video disc player), the
performance variable was the only explanatory variable to have a direct effect on CS/D.
The path between disconfirmation and CS/D was not statistically significant. Several other
studies involving high involvement, durable purchases have also reported a direct linkage
between performance and CS/D (Oliver and Bearden 1983; Patterson 1993; Tse and
Wilton 1988). The evidence suggests that for high involvement, durable purchases at least,
expectations as a determinant of CS/D decreases in importance and the role of perceived
performance increases. Oliver and Bearden (1983, p. 253) offer a possible explanation
when they stated ".. high involvement decreases the consumers sensitivity to pre-usage
phenomena and increases their sensitivity to the outcome”.
3.5 Summary
This chapter has provided a synthesis of the literature concerning the disconfirmation of
expectations paradigm and CS/D, and its relationship with the similar but distinct concept
of SQ and the gap model approach. The next chapter further develops the disconfirmation
model in the context of business-to-business, professional services. In doing so it includes

55
purchase situation and individual-level variables as antecedents of expectations, and
includes the concept of fairness (a component of equity) as a direct determinant of CS/D.
56
CHAPTER 4: A REEXAMINATION AND EXTENSION OF THE DISCONFIRMATION OF EXPECTATIONS PARADIGM FOR A BUSINESS-TO- BUSINESS, PROFESSIONAL SERVICE.
4.1 Introduction
The purpose of this chapter is twofold. First, it develops a modified conceptualisation of
the disconfirmation of expectations paradigm in the context of business-to-business,
professional services. Second, from this model a series of research hypotheses are
developed which form the basis of this study.
The need for a reexamination and extension appears necessary on the grounds that:
(a) services, especially business-to-business professional services, have distinctive
characteristics that impact upon consumers' pre and post-purchase evaluation processes.
Hence, it seems reasonable to expect that both the nature and impact of the antecedents of
CS/D will vary from previously reported empirical work, where the focus has been on
goods/products (in particular, low-involvement non-durables) rather than services. A
number of scholars have stressed the need to empirically test the disconfirmation of
expectations model across a range of products and services (e.g., Fomell and Robinson
1983; Jayanti and Jackson 1991; Swan and Trawick 1980). Wilton and Nicosia (1986) in
reference to the conflicting results for high and low-involvement products reported by
Churchill and Surprenant (1982) stated:
"While the authors offer several plausible explanations for this inconsistency, the result provides a clear indication of the inadequacy of a single model of satisfaction level as a representation of the processes associated with satisfaction judgements for all product types" (p. 8).
(b) The current study introduces several antecedent variables (purchase situation and
individual characteristics) not previously included in disconfirmation models, plus variables
which have only recently been empirically examined in CS/D models i.e., prior attitudes
and fairness (a component of equity theory).
57
The next section provides a justification for the inclusion of the foregoing variables into an
extended discontinuation model for business-to-business, professional services. This
general model is then used to generate a set of research hypotheses which are embodied in
a theoretical path model. However, it should be appreciated that since research into the
discontinuation paradigm is almost non-existent in both the organisation buyer behaviour
(business-to-business marketing) and services literature, some of these hypotheses are
necessarily somewhat speculative.
4.2 Additional Antecedent Variables.
4.2.1 Prior Attitudes
A number of scholars have suggested that consumers' prior attitudes may influence
expectations about the outcome of a particular product/service experience (e.g., Bitner
1990; Oliver 1980a; Swan 1982). Most researchers define attitude as an overall evaluation
that enables a consumer to respond in a consistently favourable or unfavourable manner
with respect to an object (Engel, Blackwell and Miniard 1990). Attitudes are generally
considered to possess three distinct components: (a) a cognitive component referring to
beliefs, knowledge and opinions; (b) an affective, emotional or feelings component; and (c)
a conative component which reflects a consumer's behavioural tendencies. In recent years
however, some consumer researchers have shifted their emphasis away from the three
component view toward a singular view of attitude as an affect, with cognitions (beliefs)
being viewed as a separate but related construct (e.g., Wilkie 1990, pp. 310-311).
Mazursky and Geva (1989) distinguished between focal brand expectations (i.e., the tried
brand or brand to be purchased/consumed) and "product norms" (defined as general
product class beliefs derived from accumulated past knowledge), and evaluated their
impacts on the disconfirmation paradigm. They concluded that the more general product
"norms", which conceptually appear similar to the attitude construct, had an independent
impact on both CS/D and future purchase intentions. In fact, the impact of these norms on
future intentions was greater than either focal brand expectations or perceived performance.
Bolton and Drew (1991a) in their study of U.S. telephone services, found that prior
attitudes had a significant impact on current perceptions of overall service quality.
Similarly, Cadotte, Woodruff and Jenkins (1987) claimed that consumers may derive a
norm from experience with known brands in at least two different ways. First, the norm
might be a typical performance of the focal or other brands and second, it represents an
average performance which is considered typical of a group of similar brands. The product
norms concept proposed by these researchers appears to be conceptually, closely aligned to
the beliefs component of the attitude construct. Therefore, it is contended that there exists
both empirical (e.g., Mazursky and Geva 1989) and conceptual evidence (e.g., Bitner
1990; Cadotte, Woodruff and Jenkins 1987) to suggest that prior attitudes is a potentially
useful pre-consumption variable to include in a re-conceptualised model. Given the
foregoing discussion, it also seems reasonable to postulate that prior attitudes will have a
direct impact on clients' expectations as well as CS/D.
4.2.2 Purchase Situation (Novelty, Importance, Complexity) and Individual-Level Characteristics (Uncertainty, Stakeholding)
The major models of organisational buyer behaviour (OBB) (e.g., Sheth 1973; Webster and
Wind 1972) suggest that purchase situation, organisational and individual-level variables
affect various stages in the buying decision process. Numerous empirical studies in the
OBB literature have supported the inclusion of these variables. For example, Johnston and
Bonoma (1981) developed a model of organisational decision making which utilised
purchase situation variables (e.g., complexity of purchase) and organisational structure
variables (e.g., formalisation) to explain the communication structure of buying centres.
Similarly, McQuiston (1989) developed a structural equation model that indicated the
purchase situation dimensions of novelty, complexity and importance were causal
determinants of participation and influence in an industrial (business-to-business)
purchasing decision. Kohli (1989) developed a model explaining an individual's manifest
59
influence in buying centres. Explanatory variables in Kohli's model included purchase
situation, individual resources and buying centre characteristics. Likewise, Wilson, Lilien
and Wilson (1989) employed purchase situation factors in a contingency paradigm approach
to develop predictive models of group choice in the context of organisational buying.
Finally, Dawes, Dowling and Patterson (1993) investigated the impact of purchase
situation, buying centre structure, individual (key informant) characteristics and
organisation structure variables on the degree of external information search in the selection
of management consulting services. They found all constructs, with the exception of the
organisation variables (firm size, degree of formalisation), impacted significantly on the
degree of search effort.
Concerning individual-level variables, Webster's (1989) study of three professional
consumer services (physicians, attorneys, and dentists) found age, ethnicity, occupation,
education and income to significantly impact clients' expectations of service quality. The
services literature in general also provides support for including individual-level variables.
Because services are intangible, they lack search qualities and are therefore difficult to
evaluate prior to purchase. Therefore risk and uncertainty perceptions are considered to
increase (Bateson 1989; Bloom 1984). Hence buyers tend to rely heavily on past
experience and personal sources of information in prior evaluations framing pre-purchase
expectations for services (Dawes, Dowling and Patterson 1991; Grônroos 1984). Further,
it has been suggested by OBB researchers that the inclusion of individual-level variables
should lead to a richer understanding of organisational buying decision and key evaluation
processes (e.g., Ghingold and Wilson 1985; Johnston and Bonoma 1981).
Concerning purchase situation variables, the consumer behaviour literature supports the
proposition that this group of variables, such as product importance and complexity might
have an impact on purchase outcomes (e.g., perceptions of performance, disconfirmation,
CS/D) (Barber and Venkatraman 1986; Bloch and Richins 1983). Further, the recent work
of Parasuraman, Berry and Zeithaml (1991a) and Zeithaml, Berry and Parasuraman (1991)
60
concerning a range of consumer and business services, explicitly links purchase situation
variables (importance, experience, number of alternatives available and personal needs) to
expectations.
These foregoing studies collectively, have examined the impact of purchase situation,
organisational, individual-level variables and other constructs at various points in the pre
purchase decision phases of the overall organisational buying decision process. No studies
could be located which linked these constructs to post-purchase evaluation stages of
performance evaluation, discontinuation or CS/D. However, Reeder, Brierty and Reeder
(1987) conceptually link pre-purchase expectations and prior experience in evaluating
performance of business-to-business suppliers.
In summary, many of the pre-purchase decision phases in OBB (e.g., degree of information
search, supplier evaluation and choice, size and composition of buying centre structures)
have consistently been shown to be explained, in part, by purchase situation, individual-
level and organisation variables. Further corroborative evidence supporting the inclusion of
these categories of variables came from the qualitative interviews conducted in the early
stages of this research study. It was apparent during the personal interviews, that for
consulting assignments of high importance to the individual (key informant - stakeholder)
and the organisation in general, expectations on a wide range of service attributes were
both well defined and higher than might otherwise have been the case. It was also apparent
that respondents (who were key decision-makers in both the selection and project
management stages) who had relatively little past experience dealing with consultants, had
less well defined expectations.
It therefore seems appropriate to include at least purchase situation and individual-level
categories of variables in an extended model of the discontinuation paradigm for business-
to-business services. Further, it seems reasonable to expect, given the previous discussion,
61
that these categories of variables will have, at least, an impact upon buyers expectations
and performance perceptions.
Clearly it is beyond the scope of any one study dealing with CS/D to attempt to test all
possible purchase situation and individual variables in such a complex model. These
categories of variables, whilst potentially important in adding to our understanding of the
complex range of antecedents of CS/D are not all central to the model. Consequently, this
study focuses only on three key purchase situation variables employed by McQuiston
(1989) and Dawes, Dowling and Patterson (1992a) - (novelty, importance and complexity)
and two individual variables (stakeholding and uncertainty) (e.g., Ghingold and Wilson
1985; Kohli 1989). Justification for inclusion of each of these variables is now discussed in
turn.
(a) Purchase Situation Variables
. Novelty
The novelty or newness of a given purchase situation to the organisation, or the lack of
collective experience of individual buying centre members with similar purchase
situations, has been shown to affect both participation and decision making in organisations
(McQuiston 1989). In a study of three organisations, Robinson, Faris and Wind (1967)
found that the amount of information required and experience in similar purchase situations
were the major determinants of the behaviour of industrial purchasers. Hence novelty is
defined here as the lack of experience of individuals in the organisation with similar
purchase situations. In other words, the less experience in commissioning management
consultants for a similar type of assignment, the more novel the purchase situation. Given
the above-mentioned research findings and the intrinsic difficulty in evaluating services
i.e., due to their intangibility and thus lack of search qualities, it therefore seems
reasonable to expect that novelty might effect both pre-purchase expectations and
performance perceptions. Further, support for this proposition is found in Gummesson
62
(1981) and Parasuraman, Berry and Zeithaml's (1991a) qualitative study (employing focus
groups) of six service firms (both consumer and business-to-business services). The latter
researchers stated: "In our interviews, the more experienced customers were more likely
to have higher expectations" (p. 42).
. Importance of the Purchase Decision
Researchers have defined the importance of the purchase to an organisation in two main
ways. For example, Johnston and Bonoma (1981) conceptualise it in terms of the relative
importance of the purchase to others of a similar nature. McQuiston (1989) on the other
hand has defined the construct according to its perceived impact on organisational
productivity and profitability. An accurate assessment of the importance of a professional
service such as management consulting may present some difficulties for a respondent.
Nonetheless, it seems likely that for management consulting services (MCS), the latter is a
more appropriate conceptualisation since in many cases, the nature of the assignment (e.g.,
development of a strategic plan) will no doubt impact on the organisation's viability.
Therefore, the importance of the purchase is defined here as the perceived impact of the
purchase (i.e., commissioning the consulting assignment) on organisational productivity
and profitability. Importance has been shown to impact upon perceived risk as well as
perceptions of the purchase situation, and on the behaviour of the individuals involved
(Kirsch and Kutschker 1982). McQuiston (1989) also found importance helped in
explaining participation and influence in industrial purchase situations. Parasuraman, Berry
and Zeithaml (1991a) during qualitative interviews found evidence that for business-to-
business customers at least, the more important the occasion, the higher were expectations.
It is therefore contended that importance is likely to effect both pre-purchase expectations
and consequently, the disconfirmation construct. Furthermore since services, unlike
tangible products, are typically more difficult to evaluate objectively, it seems reasonable to
postulate that the impact of the assignment might also affect perceptions of the consultant's
performance.
63
. Product (Service)/Complexity
Researchers have examined two notions of complexity, namely technical or product
complexity, and complexity of the purchase situation (or buying decision). These two
factors are distinct because a product's (or service) technical complexity need not influence
the complexity of the buying decision (Dawes, Dowling and Patterson 1993). In most
cases, researchers have focused on the complexity of the buying situation. For example,
Grashof (1979) found that more complex buying tasks were likely to result in a shared as
opposed to an individual decision. Johnston and Bonoma (1981) also found that more
complex buying tasks were associated with larger buying centres and more vertical
involvement (i.e., more management levels in the buying centre). In a recent study
however, McQuiston (1989) found that complexity did not explain different amounts of
participation in buying centres. A probable reason for this (as noted by the author) was
that a distinction was not made between the two dimensions of complexity.
Gr^nhaug (1975) in a study of purchasing decisions for industrial goods, provides some
empirical support for a positive relationship between situation complexity and search effort.
The only study which could be located linking either product or decision complexity to
constructs in the disconfirmation model was Parasuraman, Berry and Zeithaml's (1991a)
study of three business-to-business and three consumer service organisations. Their study
provides indirect support for the proposition that the perceived complexity is positively
related to pre-purchase expectations. Given the extremely complex nature of many
consulting engagements, both the product (service)/technical and purchase situation
complexity definitions are employed in this study. Further, because the current study is
concerned with a service (at the "pure" service end of the goods-services spectrum) rather
than a tangible product, the perceived technical complexity may be exacerbated due to the
fact that such services are low in search and experience qualities (as outlined in Chapter 2).
(b) Individual-Level Variables
. Stakeholding
Researchers in the OBB domain (e.g., Johnston and Bonoma 1981) have stressed the
importance of, and the need to model and empirically investigate individual-level variables.
Ghingold and Wilson (1985) attempted to partly address this situation by including
individual-level variables in their conceptual model of buying centre structure and
interaction. Further, Dawes and Patterson (1992) developed a theoretical model to predict
the use of technical consultants by firms making high technology purchase decisions (main
frame computers and PABX switchboards). Their model incorporated purchase situation,
organisation and individual-level characteristics of buying centre members.
Ghingold and Wilson (1985) argued that an individual's stake in an OBB purchase decision
is an important consideration affecting buying centre structure and interaction.
"Stakeholders" are defined as those individuals with the most at stake (or risk) since the
buying decision made will impact upon them far more than upon other members of the
buying centre. "In a sense, they truly must live with whatever is decided upon (the
consequences)" (Ghingold and Wilson 1985, p. 184). Dawes, Dowling and Patterson
(1992a) found stakeholding was an important variable in their study of buying centre
structures used in selecting management consultants. Zeithaml, Berry and Parasuraman
(1991) also provided further tentative support for including this variable. In a further study
of business services, they found buyers expectations were indeed influenced by the
demands and needs of top management. When asked about their own expectations, buyers
commented that, "The needs of upper administration can change your expectations" and
"when top management expects more of me" (p. 15). Stakeholding is akin to the purchase
situation variable of decision importance. The inclusion of the stakeholding variable also
allows some insight into the individual dynamics that take place during the buying decision
process. It is on these grounds that it is included in this study. Based on the
aforementioned arguments, it is postulated that stakeholding would influence client
65
expectations or what they believe they will receive from the consulting assignment, as well
as perceived performance.
. Uncertainty
Uncertainty is generally defined as a psychological state that results primarily from a lack
of adequate information or knowledge concerning a purchase situation (Duncan 1972). In
the OBB literature, researchers have linked uncertainty to manifest influence in purchase
decisions (Kohli 1989), and the structural characteristics of buying centres (e.g., McCabe
1987). McCabe (1987) provides a summary of these approaches. Contingency theorists
generally have used a view of uncertainty centring on the perceived uncertainties of the
buying task (availability of needed information, ability to evaluate outcomes), whereas
support for the constriction of authority position in the context of buying centres generally
has been rooted in a view of uncertainty centring on objective product characteristics (e.g.,
product differentiation, level of investment required). In addition, contingency studies of
buying decision behaviour have examined the uncertainty-structure relation at the task level
of analysis (e.g., Spekman 1977) whereas studies typical of the constriction of authority
perspective have examined this relationship at the organisational level of analysis (e.g.,
Corey 1978). This study employs measures of buying decision uncertainty (e.g., Kohli
1989) rather than product-complexity uncertainty as it seemed more appropriate to the
study context.
Given the intangible nature of services and consequent higher risk perceptions in the
purchase decision, plus the fact that professional services lack search and experience
qualities, but are high in credence qualities, it seems likely that uncertainty would be
further exacerbated when purchasing such services (Bloom 1984). In line with previous
arguments put forward in this chapter, it therefore seems likely that perceived buying
decision uncertainty will impact upon expectations, performance and CS/D directly.
Hence uncertainty is included in the extended disconfirmation model.
4.2.3 Fairness - A Component of Equity Theory
Marketing has, among other definitions, been frequently referred to as an exchange process
(e.g., McCarthy and Perreault 1984). Bagozzi (1975) suggested that the exchange process
is the most basic element of the marketing function, implying that satisfaction with an
exchange is important for an ongoing buyer-seller relationship. A crucial component of a
satisfactory exchange is equity/inequity (Oliver and Swan 1989). Exchange equity has
become established in the study of sales transactions. This research stream was introduced
into the marketing literature by Huppertz, Arenson and Evans (1978) when investigating
the consequences of the "fairness" of price inequity and service inequity for university
campus stores. Though they did not specifically link equity to CS/D, their study motivated
other research in which CS/D was of prime concern.
The equity/inequity construct adds a new dimension to the literature on CS/D because
outcomes within equity theory are thought to be evaluated in relation to those of the other
parties to an exchange as opposed to the more traditional benchmark of expectations. Early
sociologist researchers developed the notion of equity as a ratio of one's outcomes to inputs
in an exchange. However much of the research by sociologists in this area is in non
commercial situations and has been of limited value to commercial/marketing exchanges
(Oliver and Swan 1989). The problem is that (a) inputs were assumed to be easily
quantified; and (b) a notion of "equal partners" existed.
Rather than assuming an exchange is based on "equal partners" (a social exchange/non-
commercial perspective), when roles are unequal, one needs to rely on theories of
distributive justice (Jasso and Rossi 1977) or expectations states theory. These theories
require only that each party to the exchange have expectations of the role of the other party
(Oliver and Swan 1989). This framework is considered more useful in a commercial
context. Customers and salespeople typically play different roles. Likewise their desired
outcomes are entirely different - a salesperson desires a sale (and consequent commission)
whereas the customer (buyer) is seeking a bundle of product/service benefits. Neither can
67
accurately assess the other's outcomes in either economic or psychological benefits.
Rather, as suggested by Oliver and Swan (1989, p. 24) "each has some notion of what is
fair from a cultural or traditional perspective". This approach seems more appropriate in a
commercial/marketing context and is therefore employed in this study.
Two common competing operationalisations of the equity construct are "fairness" and
"preference":
"Fairness" is synonymous with equity in that it implies buyer and seller get "what
is right" or "what they deserve". In its original form, fairness was expressed as a
mathematical formula. It has however been conceptualised verbally as requiring only that
the inputs and outcomes of both parties be approximately equal. Fairness then can be
hypothesised as a positive function of both buyer's and seller's outcomes and a negative
function of their inputs (Oliver and Swan 1989).
"Preference" in the context of equity theory is unrelated to that in the consumer
behaviour literature where the term is usually defined as the preferred or choice of an
alternative. Here preference refers to an exchange outcome where one party (e.g.,
customer) receives more benefits or outcomes than the other party.
The impact of exchange equity on CS/D has been examined in five experimental design
studies (e.g., Fisk and Coney 1982). Oliver and Swan (1989, p. 22) provide a brief
summary of these studies. Collectively, these five studies indicate the role of
equity/inequity perceptions in sales transactions. However they did not investigate either
the nature of perceptions in an actual exchange situation, or the impact of the equity -
CS/D linkage. The only study so far attempting to link equity theory explicitly with the
discontinuation paradigm was undertaken by Oliver and Swan (1989). They addressed the
aforementioned two issues (nature of perceptions and strength of linkage to CS/D) in a
field survey of new automobile buyers and concluded:
68
"In the prediction of satisfaction, the effects are clear. Fairness dominates the respondent's satisfaction judgements, whereas preference evidently is unrelated to satisfaction in the model tested here. Disconfirmation as hypothesised, complements fairness in the prediction of satisfaction but is the lesser of the two determinants" (p. 30).
In the context of management consulting services, it seems reasonable to expect the client
will have a clear perception of fairness concerning the transaction (i.e., paying a substantial
consulting fee for some future promised benefit) because:
. The purchase can be regarded as a high involvement one with concomitant high
importance and risk. In such situations, consumers' post- purchase evaluation is
generally more intense (Gr^nhaug 1977).
. Qualitative interviews prior to questionnaire design plus reference to proprietary
research reports from Price Waterhouse Urwick (international management
consultants) clearly indicated many clients explicitly evaluate consulting
engagements in terms of the fairness dimension (some clients referred to "poor
value for money" in reference to past consulting assignments).
Given these arguments and the aforementioned findings of Oliver and Swan (1989), it was
decided to incorporate only the fairness dimension of the equity construct into the
hypothesised model as a direct antecedent of CS/D. A case could not be made for
incorporating the preference dimension. Hence it is not included in this study.
4.2.4 Behavioural Intentions
Early research in the satisfaction literature attempted to predict CS/D from the discrepancy
between performance and pre-purchase expectations (e.g., Cardozo 1965; Anderson 1973).
Several more recent studies extended this paradigm to predict future behavioural intentions
to purchase (e.g., Bearden and Teel 1983; Bitner 1990; Mazursky and Geva 1989; Oliver
1980a; Oliver and Swan 1989). With the exception of Bitner (1990 (travel agency service)
and Oliver's (1980a) study (a flu inoculation service) the remaining studies involved
products rather than services. None has examined the impact of antecedent variables on
69
behavioural intentions for business-to-business, professional services or other services of a
high involvement nature.
Oliver and Swan (1989) using a causal path framework to study new car sales, found only
CS/D had a direct effect on intentions. They also concluded that CS/D acted as a
mediating link for other antecedent variables, especially fairness perceptions and
disconfirmation. Mazursky and Geva (1989) hypothesised that general product class beliefs
(a form of general attitude towards the product) as well as CS/D with the current purchase,
would effect behavioural intentions. They further postulated that these prior cognitions
would have a greater impact on intentions in a delayed measurement, than if measured
immediately following the current purchase. Their longitudinal study of a new portable,
anti-theft electric alarm found that in immediate post-purchase situations, performance
evaluations and CS/D had the greatest impact in explaining future intentions. However, it
also confirmed that prior attitudes had more explanatory power than CS/D in predicting
future intentions in delayed measurement. Mazursky and Geva (1989) cautioned however,
that their findings should not be generalised across all product categories or purchase
situations.
The current study is confined to two measurement stages (pre and immediate post
purchase). While it would have been desirable to measure intentions at a third point in
time, the problems of obtaining respondents' (senior executives) agreement to participate in
a third, delayed post-purchase measurement were considered too great to be achieved in the
current study.
As discussed in Chapter 2, management consulting services lie at the "pure services" end of
the goods-services continuum. As such they are high in credence qualities, i.e., it is often
difficult for clients to evaluate the service before, during or sometimes after purchase.
Consequently, clients rely on personal (as opposed to impersonal) sources of information
plus past experience with consultants in general, and specific firms in particular, when
70
considering current choice and evaluation. Dawes, Dowling and Patterson (1991) in a
study of 253 Australian firms who had commissioned management consultants, found that a
client's evaluation of their past dealing with a particular consulting firm was the single
most influential factor in the selection process. Further, as reported earlier in this chapter,
a number of empirical studies have found CS/D to be an important determinant of future
behavioural intentions. Therefore it is contended that CS/D with a current consulting
assignment will have a powerful, direct impact on intentions to use the consulting firm in
the future.
In summary, this section has attempted to justify the inclusion of five categories of
variables not typically included in disconfirmation models. These relate to: prior attitudes,
purchase situation, individual characteristics, equity perceptions, and behavioural
intentions. The hypothesised relationships between the major constructs are shown in an
extended disconfirmation model in Figure 4-1(a) and 4-1(b).
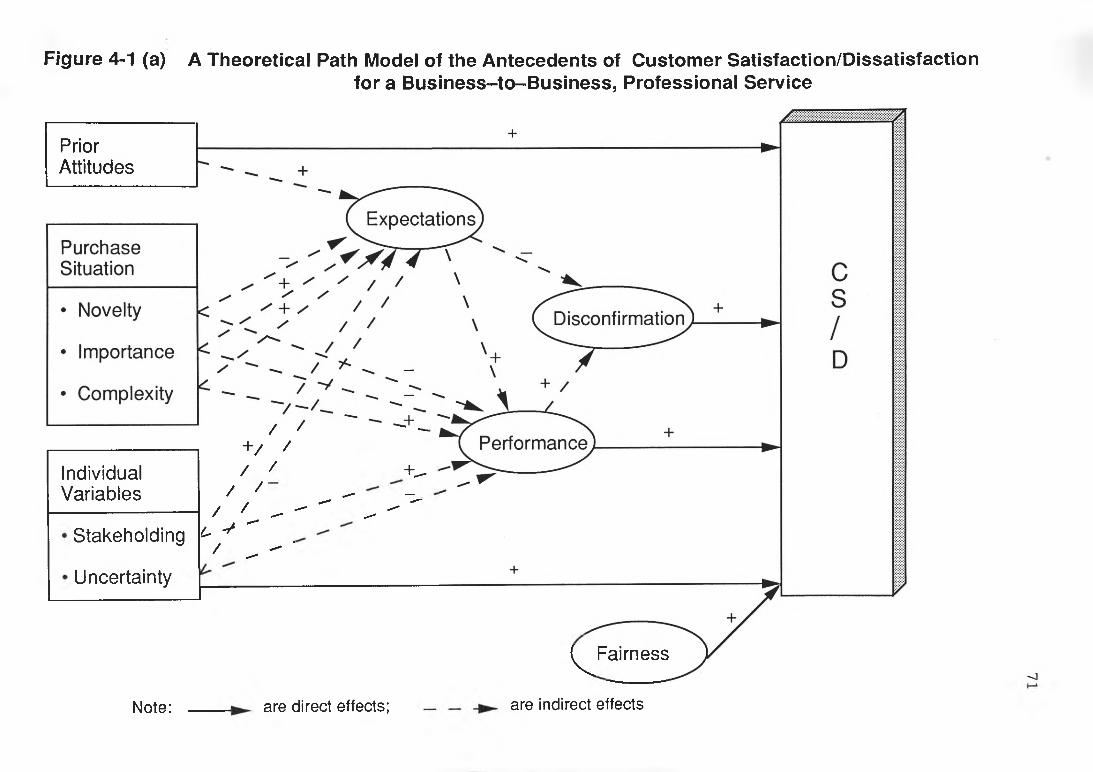
Figure 4-1 (a) A Theoretical Path Model of the Antecedents of Customer Satisfaction/Dissatisfactionfor a Business-to-Business, Professional Service
PriorAttitudes
IndividualVariables
Stakeholding
Uncertainty
/ / " " - + -+ / // / + „
/ / ^ _
/ /
y\\
\\\
c- ^ ^/ ^ ^ '
(^Fairness
Note: are direct effects; are indirect effects
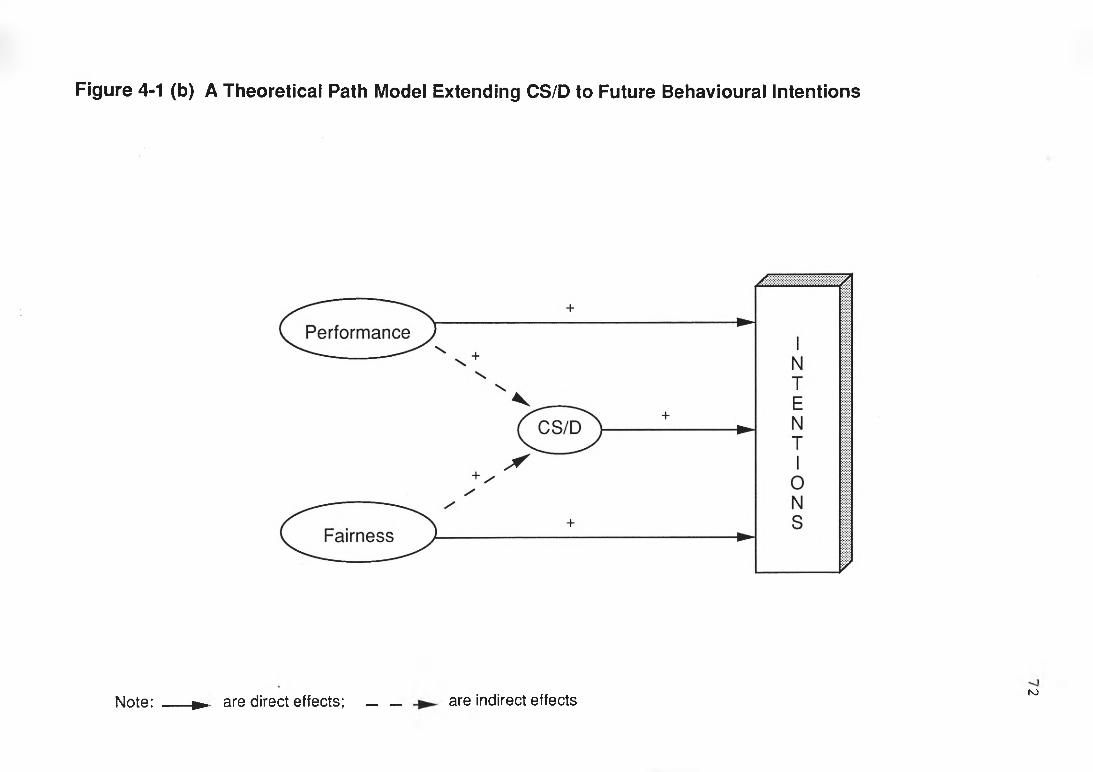
Figure 4-1 (b) A Theoretical Path Model Extending CS/D to Future Behavioural Intentions
Note: ► are direct effects; _ — are indirect effectsNJ
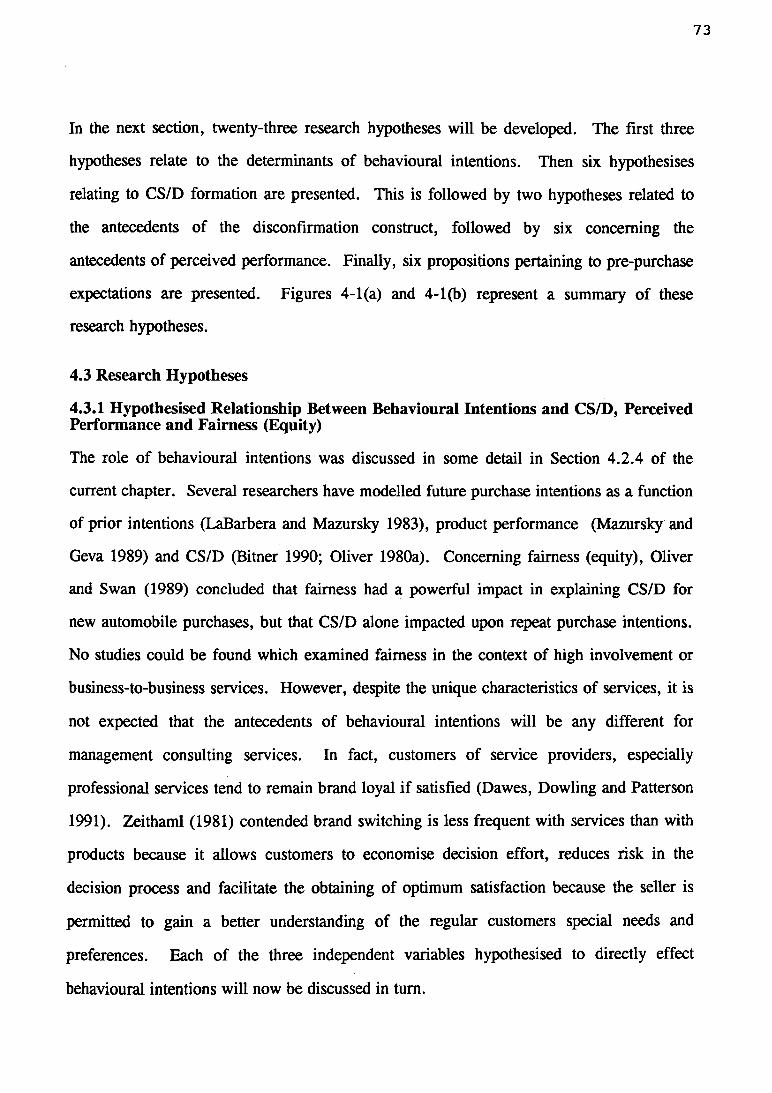
73
In the next section, twenty-three research hypotheses will be developed. The first three
hypotheses relate to the determinants of behavioural intentions. Then six hypothesises
relating to CS/D formation are presented. This is followed by two hypotheses related to
the antecedents of the disconfirmation construct, followed by six concerning the
antecedents of perceived performance. Finally, six propositions pertaining to pre-purchase
expectations are presented. Figures 4-1(a) and 4-1(b) represent a summary of these
research hypotheses.
4.3 Research Hypotheses
4.3.1 Hypothesised Relationship Between Behavioural Intentions and CS/D, Perceived Performance and Fairness (Equity)
The role of behavioural intentions was discussed in some detail in Section 4.2.4 of the
current chapter. Several researchers have modelled future purchase intentions as a function
of prior intentions (LaBarbera and Mazursky 1983), product performance (Mazursky and
Geva 1989) and CS/D (Bitner 1990; Oliver 1980a). Concerning fairness (equity), Oliver
and Swan (1989) concluded that fairness had a powerful impact in explaining CS/D for
new automobile purchases, but that CS/D alone impacted upon repeat purchase intentions.
No studies could be found which examined fairness in the context of high involvement or
business-to-business services. However, despite the unique characteristics of services, it is
not expected that the antecedents of behavioural intentions will be any different for
management consulting services. In fact, customers of service providers, especially
professional services tend to remain brand loyal if satisfied (Dawes, Dowling and Patterson
1991). Zeithaml (1981) contended brand switching is less frequent with services than with
products because it allows customers to economise decision effort, reduces risk in the
decision process and facilitate the obtaining of optimum satisfaction because the seller is
permitted to gain a better understanding of the regular customers special needs and
preferences. Each of the three independent variables hypothesised to directly effect
behavioural intentions will now be discussed in turn.
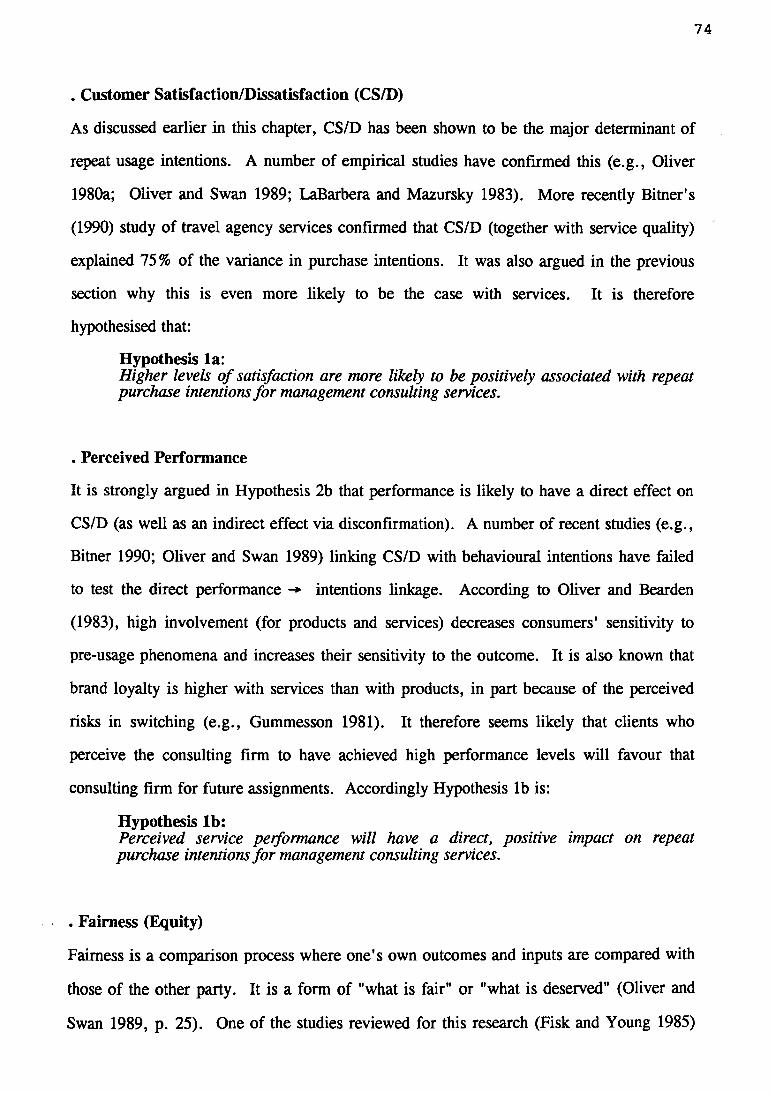
74
. Customer Satisfaction/Dissatisfaction (CS/D)
As discussed earlier in this chapter, CS/D has been shown to be the major determinant of
repeat usage intentions. A number of empirical studies have confirmed this (e.g., Oliver
1980a; Oliver and Swan 1989; LaBarbera and Mazursky 1983). More recently Bitner's
(1990) study of travel agency services confirmed that CS/D (together with service quality)
explained 75% of the variance in purchase intentions. It was also argued in the previous
section why this is even more likely to be the case with services. It is therefore
hypothesised that:
Hypothesis la:Higher levels o f satisfaction are more likely to be positively associated with repeat purchase intentions fo r management consulting services.
. Perceived Performance
It is strongly argued in Hypothesis 2b that performance is likely to have a direct effect on
CS/D (as well as an indirect effect via discontinuation). A number of recent studies (e.g.,
Bitner 1990; Oliver and Swan 1989) linking CS/D with behavioural intentions have failed
to test the direct performance -* intentions linkage. According to Oliver and Bearden
(1983), high involvement (for products and services) decreases consumers' sensitivity to
pre-usage phenomena and increases their sensitivity to the outcome. It is also known that
brand loyalty is higher with services than with products, in part because of the perceived
risks in switching (e.g., Gummesson 1981). It therefore seems likely that clients who
perceive the consulting firm to have achieved high performance levels will favour that
consulting firm for future assignments. Accordingly Hypothesis lb is:
Hypothesis lb:Perceived service performance will have a direct, positive impact on repeat purchase intentions fo r management consulting services.
. Fairness (Equity)
Fairness is a comparison process where one's own outcomes and inputs are compared with
those of the other party. It is a form of "what is fair" or "what is deserved" (Oliver and
Swan 1989, p. 25). One of the studies reviewed for this research (Fisk and Young 1985)
75
demonstrated a direct equity - intentions linkage. Given the high involvement nature of a
management consulting assignment and the fact that during preliminary qualitative
interviews, clients articulated definite expectations for "value for money" and the general
notion of "what is deserved" (given the consulting fee paid), it is hypothesised:
Hypothesis lc:The fairness dimension o f equity will have a direct, positive impact on repeat purchase intentions fo r management consulting services.
4.3.2 Hypothesised Relationship Between CS/D and Disconfirmation, Perceived Performance, Prior Attitudes, Fairness (Equity) and Uncertainty.
The previous review of the relevant literature, and CS/D models in particular, in Chapters
2 and 3 and Sections 4.1 and 4.2 of this chapter provide the foundation for asserting that
disconfirmation, performance, prior attitudes, fairness (equity) and buying decision
uncertainty have a significant, direct impact on customer satisfaction/dissatisfaction
(CS/D). Most studies of the disconfirmation paradigm have focused on low-involvement,
consumer non-durable products. Almost no attention has been paid to professional
services, let alone services in the business-to-business domain. The purchase situation and
individual-level variables introduced into the current model (see figure 4-1(a) and 4-1(b))
have been frequently used to explain and predict various phases of organisational buying
decision processes (e.g., Dawes 1989; Dawes and Patterson 1992; Ghingold and Wilson
1985; Johnston and Bonoma 1981; McQuiston 1989).
As noted by Jayanti and Jackson (1991):
"Although some authors have suggested the disconfirmation model to be appropriate for services, empirical evidence has yet to be found for this proposition" (p. 603).
Hence, the primary research objective of this study (as detailed in Chapter 1) is to
empirically extend and test, for the first time, the disconfirmation paradigm in the context
of (business-to-business) professional services. This is reflected in the following
hypotheses.
. Disconfirmation
As noted when reviewing the literature in Chapter 3, it is now well accepted that
disconfirmation is a powerful, direct antecedent of CS/D (e.g., Oliver 1980a; Oliver and
Swan 1989; Patterson 1993; Tse and Wilton 1988). These empirical tests have used
tangible products rather than services as the focus of their respective studies. However, the
recent work in the service quality literature has confirmed that consumers of services do in
fact compare expectations with their performance experiences (i.e., disconfirmation) (e.g.,
Brown, Churchill and Peter 1992; Brown and Swartz 1989; Parasuraman, Berry and
Zeithaml 1988). Accordingly, a similar outcome is anticipated from the results of this
study, and hence:
Hypothesis 2a:Positive disconfirmation will be associated with higher levels o f customer satisfaction.
. Perceived Performance
Two arguments will be put forth to support the proposition that perceived performance for
management consulting services will have a direct and powerful impact on CS/D
formation. The first argument concerns the fact that when performance evaluations tend to
be subjective (as is the case with management consulting services - or any professional
service for that matter), expectations and hence disconfirmation are considered to play a
less dominant role in CS/D formation (Oliver 1980a). Further, as argued by Zeithaml
(1981) the difficulty of pre-purchase evaluation of services means consumers have few
well-formed expectations regarding the service to be encountered. Jayanti and Jackson
(1991) found tentative empirical support for this proposition when they reported a direct
performance - CS/D linkage in their study of hairstyling services.
The second argument centres around the findings of Churchill and Surprenant (1982) in
their study of both high and low-involvement products. They concluded that when
77
involvement is high as in the case of many durable goods (as is also with services -
especially consulting services where the outcome is frequently critical to future business
decisions), performance overrides all other considerations. The higher the involvement
with the purchase process, the more intense is consumers' post-purchase evaluation
(Gr^nhaug 1977). Furthermore, according to Oliver and Bearden (1983), high
involvement decreases the consumers' sensitivity to pre-usage phenomena and increases
their sensitivity to the outcome. Furthermore, a recent study by Cronin and Taylor (1992)
of four consumer services (banking, pest control, dry cleaning, and fast food) provided
strong support for using performance-based measures of service quality (as distinct from
CS/D).
Given the preceding arguments, Hypotheses 2b and 2c are:
Hypothesis 2b:Perceived performance o f a management consulting assignment will have a positive, direct impact on CS/D.
Hypothesis 2c:CS/D will primarily be determined by the combined, direct and indirect impact o f perceived performance.
. Prior Attitudes
As previously outlined in Section 4.2.1, there is both conceptual and empirical support to
suggest prior attitudes is a potentially useful explanatory variable to include in models of
CS/D formation. In their longitudinal study of a new portable, anti-theft alarm, Mazursky
and Geva (1989) found general "product class beliefs" (a component of the wider attitude
construct) to be a salient predictor of CS/D.
Gronroos (1990) included corporate and/or local image as a mediating construct or "filter"
between service attributes and service quality in much the same way attitudes are included
here. He argued that service providers, unlike product manufacturers, cannot hide behind
brand names or distributors. Therefore images held by consumers act as a filter and impact
on perceptions of quality in various ways. If the consumer holds a positive image (attitude)
of the service provider, then minor mistakes will probably be overlooked, and vice versa.
Hill (1986) argued that services tend to be grouped by the consumer into categories rather
than being differentiated by brand. This implies that more general, product (service) based
rather than brand based expectations are employed in evaluating services. Accordingly,
Hypothesis 2d is:
Hypothesis 2d:More positive prior attitudes towards management consultants in general, are more likely to be associated with higher levels o f satisfaction.
. Fairness (Equity)
As discussed in Section 4.2.3, the equity construct has two major components: fairness
and preference. For reasons previously discussed, the preference dimension is not included
in this study. Fairness implies buyers and sellers get "what is right" or "what they
deserve". In Oliver and Swan's (1989) study of new automobile purchases, fairness was
found to be the most powerful independent variable in explaining variations in CS/D. It
should be noted however that they did not examine the direct performance CS/D link.
The high-involvement nature of management consulting services (and concomitant high
importance and risk) plus evidence from qualitative interviews in the preliminary stages of
this study, strongly suggest clients have clear expectations of fairness concerning the
outcome of the assignment. Hence Hypothesis 2e is:
Hypothesis 2e:The equity concept o f fairness is positively associated with higher levels o f satisfaction.
. Buying Decision Uncertainty
Uncertainty is a psychological state resulting from a lack of adequate information or
knowledge concerning a purchase situation. In OBB, uncertainty has been linked to the size
and composition of buying centres (Cardozo 1980), external information search (Dawes,
79
Dowling and Patterson 1993), reliance on external experts to assist in vendor selection
(Dawes and Patterson 1992), and manifest influence in purchase decisions (Kohli 1989). It
has not previously been explicitly linked to CS/D.
Oliver (1980a, p. 27) has defined CS/D "as an evaluation of the surprise inherent in a
product acquisition and/or consumption experience...." (emphasis added). Satisfaction
judgements are also thought to have both emotional as well as cognitive components.
Westbrook (1987) argued that CS/D incorporates an evaluation of the emotional aspects of
product/service usage. In light of these definitions, it seems reasonable to expect that in
consultancy commissioning decisions of high uncertainty (i.e., will the chosen consultants
deliver the "promised" benefits?; have we chosen the "best" consultant for the job?), that a
successful outcome can be expected to be at least a mildly pleasant surprise and emotional
experience and thus be associated with higher satisfaction than might otherwise be the case.
Furthermore, given the intangible nature of services and the accompanying higher risk
perceptions (Bateson 1977, 1989), it would seem that uncertainty is exacerbated, and
therefore the surprise element intrinsic in a successful consultancy assignment will lead to
higher levels of CS/D.
In addition to having a direct impact on CS/D formation, it might be expected that in
situations of high uncertainty, for example, that expectations (i.e., the probability of
attribute occurrence) might be lowered due to the uncertainty of a successful outcome.
Further, as discussed in the following sections, uncertainty is also hypothesised to impact
upon performance perceptions. Hence uncertainty perceptions are likely to be mediated
through expectations (defined as the probability of attribute occurrence) and consequently
the disconfirmation construct. Uncertainty is thus expected to have both direct as well
indirect affects on CS/D.
A further argument in support of this proposition is that increased uncertainty motivates
increased information search and hence more realistic (i.e., lowered) expectations (Jayanti
80
and Jackson 1991). Ceteris paribus, lower expectations should, in accord with the
disconfirmation paradigm result in increased CS/D. The foregoing discussion suggests that
decision uncertainty and CS/D will be positively related. Thus Hypothesis 2f is:
Hypothesis 2f:Buying decision uncertainty will have a direct and positive impact on satisfaction (as well as an indirect one mediated via expectations and performance)
4.3.3 Hypothesised Relationship Between Disconfirmation, and Pre-purchase Expectations and Performance.
In the traditional disconfirmation of expectations paradigm, the relationship between
disconfirmation, expectations and perceived performance is well established (e.g., Bearden
and Teel 1983; Oliver and Desarbo 1988; Tse and Wilton 1988). Disconfirmation occupies
a pivotal position as an important intervening variable. It arises from the discrepancy
between expectations and perceived performance (Churchill and Surprenant 1982). Several
empirical studies concerning tangible products have confirmed that expectations and
performance impact on disconfirmation (Churchill and Surprenant 1982; Oliver 1980b;
Patterson 1993; Tse and Wilton 1988). There is no reason to suggest that these two
antecedent constructs (expectations and performance) will have a different impact for
management consulting services. As discussed in detail earlier in this chapter, in previous
OBB studies purchase situation and individual difference variables have been shown to be
important determinants of various buying decision processes. It is possible that these
categories of variables might also impact upon the key mediating, disconfirmation
construct. However a sufficiently strong case could not be made to justify their inclusion
as hypotheses in this thesis. The two variables hypothesised to affect disconfirmation will
now be discussed in turn.
. Expectations and Performance
As discussed earlier in this chapter, disconfirmation is a cognitive comparison process and
is the primary integrating cognition which captures the expectation-performance
81
discrepancy (Oliver and Beardon 1985). When perceived performance fails to match
expectations, negative disconfirmation is the outcome; when performance is seen to be
greater than expectations, then positive disconfirmation is the result. It stands to reason
therefore that, ceteris paribus, higher expectations might be associated with negative
disconfirmation, and conversely, that higher levels of performance associated with positive
disconfirmation. Hence Hypotheses 3a and 3b are:
Hypothesis 3a:Higher levels o f pre-purchase expectations are more likely to be associated with negative disconfirmation.
Hypothesis 3b:Higher levels o f perceived performance are more likely to be associated with positive disconfirmation.
4.3.4 Hypothesised Relationship Between Perceived Performance and Expectations, Purchase Situation and Individual-level Variables.
Consumption emotion refers to the set of emotional responses elicited specifically during
product (service) usage or the consumption experiences (Westbrook and Oliver 1991).
Further, because of the intangible nature of services, performance assessment is necessarily
highly subjective. And in the case of MCS, it may not be possible for the client to assess
the true worth of the consultants work for some considerable time after completion of the
assignment. This is because the "promised benefits" (e.g., increased productivity, cost
reductions, increased market share and profitability) are unlikely to materialise and hence
benefit the client organisation for months (even years) after assignment completion.
Hence, because performance perceptions are a highly subjective and emotional response, it
seems reasonable to expect that relevant aspects of the purchase situation and individual key
informant characteristics might influence these perceptions.
Each of the explanatory variables hypothesised to impact upon performance will now be
discussed.
82
. Expectations
Initial studies of expectations and satisfaction by Cardozo (1965) and Anderson (1973)
provided support for the notion that increased expectations prior to product usage and
consumption resulted in hightened negative perceptions about the product if performance
did not live up to expectations. This effect is referred to in the literature as the contrast
effect. Other research by Olshavsky and Miller (1972), and Olson and Dover (1976, 1979)
provided evidence that increasing expectations prior to product usage resulted in heightened
perceptions about the product's performance, even though the product may have performed
less than satisfactorily. This seemingly contradictory effect has been referred to as the
assimilation effect.
More recent studies (Churchill and Surprenant 1982) and Patterson (1993) have provided
even further evidence of a direct expectations-perceived performance linkage, at least for
high-involvement products. Given the previous research findings, the high-involvement
nature of MCS and the fact that performance is difficult to objectively evaluate for services
(especially services at the pure end of the goods-services continuum), then it seems
reasonable to hypothesise:
Hypothesis 4a:Expectations will be positively associated with perceived performance fo rmanagement consulting services.
However, what is not well established is the role of purchase situation and individual-level
variables. As outlined earlier in this chapter, these groups of variables have been shown to
be particularly useful predictor and explanatory variables in the OBB literature. Since this
study is concerned, for the first time, with a business-to-business service, it seems
reasonable to expect that the newness (novelty), importance and complexity of a consultant
commissioning decision might impact upon both the clients pre-purchase expectations and
the subsequent performance evaluation processes. Likewise, it is argued that a clients
83
individual stakeholding and perceived uncertainty concerning the commissioning decision is
likely to impact upon both expectations and perceived performance.
The three purchase situation variables (novelty, importance, complexity) and two
individual-level variables (stakeholding and uncertainty) will now be briefly discussed in
turn. A more detailed discussion justifying the inclusion of these variables is found in
Section 4.2.2.
. Novelty
Novelty or newness is defined here as the lack of experience of individuals in the client
firm with similar consultant commissioning decisions. As noted earlier, Parasuraman,
Berry and Zeithaml (1991a) found more experienced consumers had higher expectations.
Conversely, inexperienced consumers (i.e., in novel/new purchase situations) can be
expected to have lower expectations than would otherwise be the case. Gummesson (1981)
also provides tentative support for this proposition. Novelty is hypothesised here to affect
clients' perceptions of performance in much the same way. Clients who are inexperienced
in dealing with MCS might be expected to have difficulty in objectively and confidently
evaluated the assignment outcome. This situation is exacerbated by the fact that services
such as MCS are high in credence qualities and have only a limited number of cues
available, and thus are intrinsically difficult to evaluate. It is expected therefore that clients
in a situation of high novelty or newness might not be in a position to evaluate the true
worth of the completed consulting assignment. Based on these arguments Hypothesis 4b is:
Hypothesis 4b:The more novel the consulting assignment is to the organisation, the more likely it is to be associated with lower perceptions o f performance.
. Importance
As previously outlined in Section 4.2.2, importance has been shown to effect perceptions
of risk, participation and influence in industrial purchase decisions and increased external
84
search effort. It seems reasonable to speculate that the more important the consulting
assignment to the organisation's future profitability and productivity, the more closely the
client will scrutinise the consultant's performance, both in terms of outcomes and service
encounters (process issues). Accordingly it is expected that the more important consulting
assignments will be associated with lower perceptions of performance. This reasoning
underlies the following hypothesis:
Hypothesis 4c:Higher importance o f the buying decision is more likely to be associated with lower levels o f perceived performance.
. Product (Service) Complexity
Justification for inclusion of complexity in the reconceptualised model was put forward
earlier in this chapter. Increased complexity in OBB has been linked to increased external
information search effort, larger buying centres, and the extent of participation in buying
centres. Only Parasuraman, Berry and Zeithaml's study (1991a) has explicitly linked
complexity to expectations. Their study indicated that more complex services are
associated with higher expectations. Since it has been previously demonstrated in this
chapter that higher expectations are associated with higher performance perceptions, a
somewhat speculative proposition is:
Hypothesis 4d:Higher levels o f complexity are more likely to be associated with higher performance perceptions.
. Stakeholding
The first individual-level variable used in this study concerns the amount of stakeholding
the key informant has in the decision outcome. Stakeholders are defined here as the
individual/s with the most at stake (or risk) since the choice of consultant will impact on
their reputation and credibility more than any other buying centre members. Stakeholding
could be considered somewhat akin to involvement in the consumer behaviour literature.
Zaichkowsky's (1985) definition is relevant to services. She defines involvement as a
85
person's perceived relevance of the (object) service based on inherent needs, values and
interests. Perceived relevance based on inherent needs, values and interests is especially
appropriate to services which are people based and generally delivered on a person-to-
person basis (Jayanti and Jackson 1991). Highly involved consumers with more at stake
are motivated to acquire more information about the service provider, thus their
expectations are more likely to be within realistic levels. Based on the foregoing arguments
Hypothesis 4e is:
Hypothesis 4e:Higher levels o f key informant stakeholding are more likely to be associated with more positive perceptions o f performance.
. Buying Decision Uncertainty
The second individual-level variable in the reconceptualised model is decision uncertainty
which results mainly from a lack of adequate information or knowledge concerning a
purchase situation. Even if we assume consumer expertise and knowledge in a particular
service category, the high variability nature of service encounters creates uncertainty
(Jayanti and Jackson 1991). It was argued previously in this chapter that high uncertainty
will result in lowered expectations of performance. It was also noted that there is evidence
(e.g., Churchill and Surprenant 1982; Jayanti and Jackson 1991) indicating that
expectations may have a direct and positive relationship with performance perceptions.
Further, as argued earlier, in situations of high uncertainty, clients simply may not be able
to assess the true worth or performance, especially in cases where the consultant may have
little face-to-face contact (service encounter) with the client during the course of the
consulting assignment. In line with these arguments then, it seems reasonable to expect that
high decision uncertainty will be associated with lower performance perceptions. Thus
Hypothesis 4f is:
Hypothesis 4f:Higher levels o f buying decision uncertainty are likely to be associated with lower perceptions o f performance.
86
4.3.5 Hypothesised Relationship Between Prior Expectations and Purchase Situation Variables, Individual-level Variables and Prior Attitudes.
As noted earlier, expectations are a fundamental element of the discontinuation paradigm
and form a frame of reference against which comparative judgements are made (Oliver
1980a). It is well accepted that expectations are based on such factors as: prior product
(service) experience, exposure to various forms of marketing communications, word-of-
mouth and observation of referents usage (Hill 1986).
Several researchers have suggested that individual difference and purchase situation
variables need to be investigated as antecedents in the formation of expectation and
satisfaction judgements (Hill 1986; Jayanti and Jackson 1991; Parasuraman, Berry and
Zeithaml 1991a). Jayanti and Jackson (1991) tested an "individual difference" model
comprising risk perceptions, involvement and innovativeness and found this model
outperformed the "pure" disconfirmation model in explaining CS/D. In conclusion they
stated that because of the peculiarities of services, caution needs to be exercised in
unambiguously accepting the disconfirmation paradigm to services. They also argued that
the impact of demographic variables (akin to the individual-level variables in this thesis)
may be substantial in explaining expectations and CS/D, depending upon the nature of the
service under study.
As discussed in Section 4.2.2, the purchase situation and individual variables employed in
this study have been demonstrated both conceptually and empirically, to be useful in
explaining a variety of decision stages in the general OBB literature. It is therefore
considered appropriate to include these groups of variables as antecedents of expectations
for MCS, which is a business-to-business service.
In the present study, desired rather than predictive expectations have been used (for reasons
outlined in the following chapter). Desired expectations may be thought of as how well the
customer (client) wanted the service to be performed. Predictive expectations are how well
the customer expected the service to perform (Swan and Trawick 1979b). Given that
87
desired expectations are used here, it seems reasonable to suggest that key purchase
situation and individual differences will impact how well the client wants the service
performed. For example, concerning the importance variable, it seems, a priori,
reasonable to expect that the higher the importance of the consulting assignment to the
organisation, the higher will be the "want" expectations.
Hence, based on this and the arguments put forward previously in this chapter in
establishing propositions for the performance construct, the following hypotheses are
offered.
. Novelty
Novelty or newness in OBB is considered to be an important explanatory variable for a
range of pre-purchase and purchase decision behaviours (see Dawes, Dowling and
Patterson 1993 for a summary). Concerning services, Gummesson (1981) suggested that
because clients typically try and reduce perceived risk when buying professional services,
there is a tendency to lower their expectations to a realistic level so as to increase the
chances of reaching a satisfactory outcome. It seems reasonable to think that this would be
particularly so when commissioning a particular type of consulting project which is new to
the client firm.
Hypothesis 5a:Novelty is likely to be negatively associated with expectations.
. Importance
As detailed in previous sections of this chapter when discussing the relationship between
importance and the disconfirmation and performance constructs, it is considered that the
more important the consulting assignment, the higher will be the "want" expectations of
clients. Parasuraman, Berry, Zeithaml's (1991a) qualitative study of business services
found support for this proposition. Thus Hypothesis 5b is:
88
Hypothesis 5b:Perceived importance is likely to be positively associated with expectations.
. Product (Service) Complexity
As noted earlier in this chapter, increased perceived complexity in OBB has been linked to
increased external information search effort, larger buying centres, and participation in
buying centres. Only Parasuraman, Berry and Zeithaml's study (1991a) has linked
complexity to expectations in a services context. In accord with this study, it seems
reasonable to hypothesise that the more complex assignments will command higher
consulting fees, and consequently clients will form higher expectations not only about the
outcome, but also about the service they receive during the process. Accordingly it is
hypothesised:
Hypothesis 5c:Complexity is likely to be positively associated with expectations.
. Stakeholding
Stakeholders are the individuals with the most at stake or risk, if the consulting assignment
does not produce a successful outcome. In line with cogent arguments put forth earlier in
this chapter, it is hypothesised that:
Hypothesis 5d:Stakeholding is likely to be positively associated with expectations.
. Uncertainty
As argued previously when discussing the relationship between uncertainty and CS/D and
performance, higher uncertainty in the consultant selection is likely to result in increased
information search and therefore more realistic (lowered) expectations than might otherwise
be the case (Jayanti and Jackson 1991). Thus it is hypothesised that:
Hypothesis 5e:Uncertainty is likely to be negatively associated with expectations.
89
The final construct hypothesised to impact on expectations is prior attitudes. There is both
conceptual and empirical support for this proposition (Bitner 1990; Bolton and Drew
1991a,b; Mazursky and Geva 1989; Oliver 1980a). Furthermore, in line with the views of
Gronroos (1990), a positive image of a service firm will act as a filter and result in more
positive perceptions of service performance, especially in the case of minor service
failures. In line with this thinking it seems reasonable to propose that more positive prior
attitudes towards MCS will also be associated with higher expectations of the consultants
performance. Accordingly hypothesis 4f is:
Hypothesis 5f:Prior attitudes towards management consultants will be positively associated with expectations.
4.4 Summary
This chapter began by highlighting the need to modify the basic discontinuation of
expectations paradigm in the context of a business-to-business, professional service
(management consulting). In particular, it was argued that the high-involvement nature of
management consulting services suggested that a direct performance -*■ CS/D link was
justified (in addition to an indirect linkage via discontinuation). Further, it was argued that
purchase situation and individual-level variables were especially germane to studies in a
business-to-business context. Accordingly, three purchase situation and two individual
variables were incorporated into an extended model explaining CS/D. In addition, the
model was further extended to the consequences of CS/D, i.e., repeat purchase intentions.
This model was then used to generate 23 research propositions which are embedded in a
theoretical path model (Figures 4-1(a) and 4-1(b)).
The following chapter outlines the research design, research instrument, operationalisation
of the constructs, and the analytical techniques employed.
90
CHAPTER 5: RESEARCH METHODOLOGY
5.1 Introduction
The preceding chapters reviewed the relevant literature and presented a re-conceptualised
model of the antecedents of CS/D in the context of a business-to-business, professional
service. The research hypotheses to be tested and their rationales were also presented.
This chapter is organised into five sections. In the first two sections, the research design
and sampling plan are presented. The third section describes the research instruments used
for the data collection, while section four provides the operational definitions of the
constructs. The final section contains a discussion of the techniques used to analyse the
data collected.
5.2 Research Design
5.2.1 Overview
Briefly, the research setting used to test the aforementioned research hypotheses employed
one hundred and twenty eight (128) clients who were using the services of a management
consultancy service (MCS). A two-stage longitudinal study, using self-administered
questionnaires was used to capture data relating to both pre and post-purchase constructs.
The collection of data over two time periods allowed an examination of the effects of
antecedent and moderator constructs on CS/D and behavioural intentions and assists in
overcoming methodological weaknesses identified in earlier cross-sectional CS/D studies.
All the constructs were operationalised with multiple measures.
5.2.2 Type of Research Design
Early CS/D studies, including those forming the foundation for this dissertation, have
generally relied on laboratory settings (e.g., Anderson 1973; Churchill and Surprenant
1982). These early experimental designs established the causal linkages, but more recently
descriptive field studies have been employed to increase the external validity and
generalisability of the findings (e.g., Bolton and Drew 1991a; Oliver and Swan 1989;
91
Patterson 1993). The present study continued the trend by using both exploratory and
descriptive research designs. As no previous academic research could be located which
specifically examined either the disconfirmation of expectations or service quality (gap)
models for business-to-business, professional services in general or MCS in particular, it
was deemed essential to undertake exploratory research as the initial phase of the study.
Exploratory research is typically used when a problem is ill-defined and the aim is to gain
insights and ideas, as well as to generate hypotheses for later testing in a quantitative
instrument (Aaker and Day 1980; Churchill 1987). Consistent with this, the primary aims
of the exploratory phase were firstly to provide tentative confirmation of the re
conceptualised CS/D model; and secondly to gain insights and an understanding into (a) the
nature and extent of client expectations and performance perceptions, and (b) the factors
influencing the formation of these perceptions.
The exploratory phase took the form of personal in-depth interviews with senior managers
of four consultancy firms and eight clients. In addition, Price Waterhouse Urwick Pty
Ltd., (an international consulting firm) provided access to four confidential, proprietary
research reports completed over the preceding four years. The New South Wales (N.S.W.)
Government also allowed access to a report commissioned in 1990 which examined CS/D
among State Government MCS clients. These secondary data sources dealt specifically
with issues of customer satisfaction, service quality, performance perceptions and attribute
importance with management consulting services (MCS), insolvency and audit services. In
addition, the SERVQUAL questionnaire and resultant findings (Parasuraman, Zeithaml and
Berry 1988) was examined for the suitability of its expectations dimensions to this research
study. In summary, the research protocol was to gain insights and explore possible
research hypotheses through an exploratory phase (i.e., qualitative interviews, examination
of secondary data sources) and then to test the relationships with the re-conceptualised
model through a descriptive, quantitative research design (using highly structured
questionnaires).
The initial step in developing the descriptive phase involved choosing between a cross
sectional and longitudinal approach. After due consideration, it was decided a longitudinal
research design was more appropriate for this study, for the reasons outlined in the
following three paragraphs. This type of research design involves collecting data at more
than one time period.
While a cross-sectional study yields a "snapshot" at a point in time of a situation being
researched, a longitudinal study produces a "motion picture" of a situation over time. As a
consequence, longitudinal studies are more likely to provide greater insights and
information concerning questions aimed at gaining a better understanding of processes
(e.g., decision making activities, CS/D formation) in organisations. However, although
longitudinal studies are generally more informative than cross-sectional studies, they are
also usually much more expensive and difficult to implement. Consequently, for the same
amount of resources, the sample size of a longitudinal study is typically smaller than for a
cross-sectional study.
However, because one of the key aims of this study was to examine the process of CS/D
formation in a causal path framework, time becomes an important independent variable.
Further, the conceptual model depicted in Figures 4-1(a) and 4-1(b) can be logically split
into pre and post-purchase constructs. Prior attitudes, purchase situation variables (novelty
or newness, importance, complexity), individual characteristics (uncertainty and
stakeholding) and expectations should, ideally, be measured pre-purchase (i.e.,
immediately prior to commissioning the consultancy project). On the other hand,
perceived performance, discontinuation, fairness, CS/D and behavioural intentions are best
measured post-purchase. The measurement of expectations for example, should be
independent from discontinuation (Westbrook and Reilly 1983). Because some earlier
studies have used experimental designs, where subjects did not actually use the product, the
elapsed time between "the expectation manipulation and the collection of the dependent
93
measures (i.e., perceived performance, disconfirmation) was limited" (Churchill and
Surprenant 1983, p. 496). Thus results could have reduced internal and external validity.
Hence a two-stage longitudinal design was used in this study.
The longitudinal design is one of the strengths of this study, and has been recently called
for by a number of researchers (e.g., Tse, Nicosia and Wilton 1990). Further, concerning
measurement of the key dependent variable (CS/D), Mazursky and Geva (1989) stated:
"A measure of immediate past usage satisfaction would yield the highest construct
validity" (p. 403).
However, because of the time consuming nature and concomitant logistic difficulties
associated with tracking the course of consulting assignments (which varied from one to
twelve months) the sample size (n = 128) is smaller than might have been achieved in a
one stage cross-sectional design. Ideally, a 3-stage design would have been even better,
with behavioural intentions being measured at a time separate from CS/D to avoid order
effects (Mazursky and Geva 1989). However time and resource constraints, and the
difficulty of getting senior business managers to complete a third questionnaire, precluded a
3-stage design.
5.3 Sampling Plan
5.3.1 Sampling Frame and Sampling Method
The sampling frame for the study was primarily provided by three consultancy firms and
one client organisation, over a thirteen month period from August, 1992 to September,
1993. The three consultancy firms who provided lists of client assignments, both won and
lost were:
* Price Waterhouse Urwick Pty Ltd (a large international, general consultancy practice);
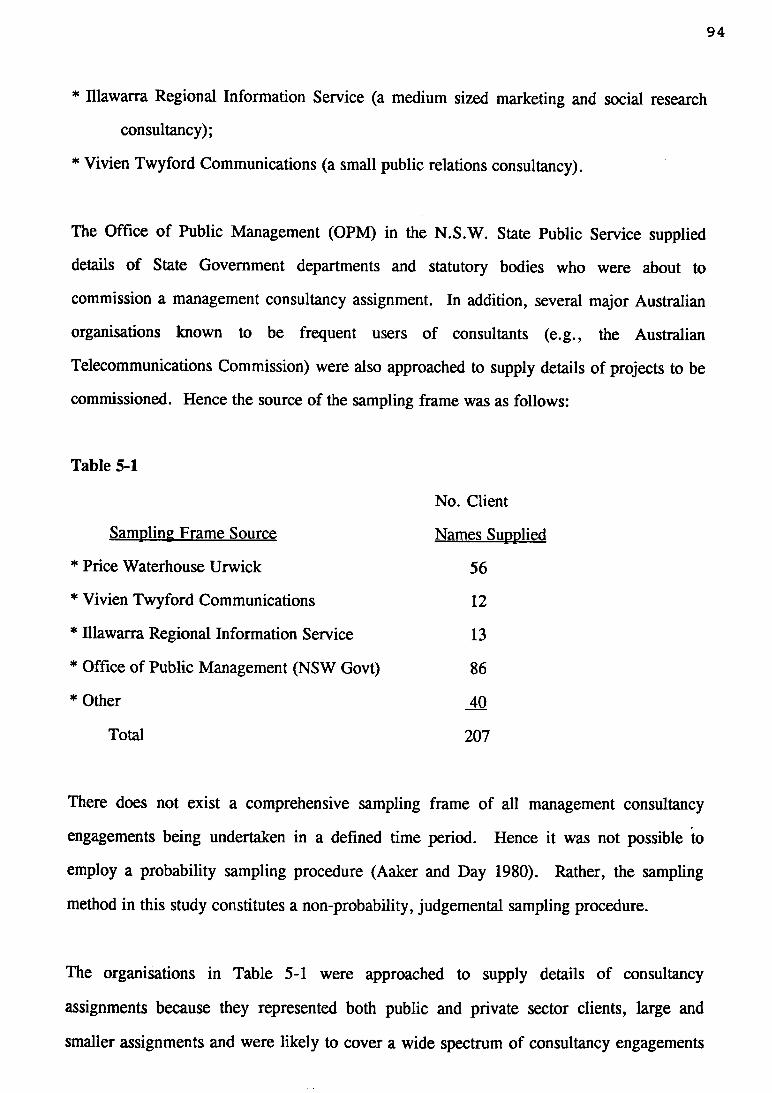
94
* Illawarra Regional Information Service (a medium sized marketing and social research
consultancy);
* Vivien Twyford Communications (a small public relations consultancy).
The Office of Public Management (OPM) in the N.S.W. State Public Service supplied
details of State Government departments and statutory bodies who were about to
commission a management consultancy assignment. In addition, several major Australian
organisations known to be frequent users of consultants (e.g., the Australian
Telecommunications Commission) were also approached to supply details of projects to be
commissioned. Hence the source of the sampling frame was as follows:
Table 5-1
No. Client
Sampling Frame Source Names Supplied
* Price Waterhouse Urwick 56
* Vivien Twyford Communications 12
* Illawarra Regional Information Service 13
* Office of Public Management (NSW Govt) 86
* Other _40
Total 207
There does not exist a comprehensive sampling frame of all management consultancy
engagements being undertaken in a defined time period. Hence it was not possible to
employ a probability sampling procedure (Aaker and Day 1980). Rather, the sampling
method in this study constitutes a non-probability, judgemental sampling procedure.
The organisations in Table 5-1 were approached to supply details of consultancy
assignments because they represented both public and private sector clients, large and
smaller assignments and were likely to cover a wide spectrum of consultancy engagements
95
(e.g., marketing research, corporate strategic planning, organisational review, human
resource management, information technology, production and operations management).
The client organisations in the sample were located primarily in Sydney and Melbourne
which are the two most populous and leading centres of commerce and industry in
Australia.
5.3.2 Sample Size
Of the 207 organisations approached, 186 agreed to participate in the study, yielding an
organisational response rate of 90%. Of those organisations agreeing to participate 142 or
76% completed the Stage 1 (pre-purchase) questionnaire. Two completed questionnaires
were rejected because the key informant failed to meet screening criteria (this is elaborated
upon in the subsequent section concerning the unit of response (key informant)). Finally,
of the 142 eligible Stage 1 questionnaires, 128 completed and returned matching Stage 2
questionnaires. This final sample size of 128 represents a net response rate of 62%.
Since the sample of firms is relatively small and represents organisations mainly from
only two of the six states in Australia, sample bias may exist and care must be taken in
generalising the results beyond the scope of the data base. The client firms, however, do
represent considerable diversity in type and size of organisation and product or service
offered to the market, as well as in the nature of the consultancy assignment commissioned.
5.3.3 Unit of Analysis
The purpose of this and the following section is to discuss some conceptual and
methodological issues concerning selection of the appropriate unit of analysis and unit of
response.
A unit of analysis is the element about which information is collected and analysed (Babbie
1990). Three categories of unit of analysis are relevant in the study of OBB decision
96
making (Wind and Thomas 1980), such as commissioning a management consultant. These
are individual, multiple-person and interactional units. An individual unit refers to a single
person (e.g., marketing manager), a department (e.g., marketing department), or an
organisational unit (e.g., strategic business unit (SBU) or an entire company). A multiple
unit of analysis includes two or more "individual" units such as a marketing manager and a
purchasing manager. The buying centre is an example of a multiple unit of analysis (Dawes
1989). The interactional unit of analysis focuses on the relationship between two or more
individual units (e.g., a dyadic relationship).
In this study it was decided to use as the unit of analysis, the individual organisation which
had commissioned the MCS. The reasons for this were firstly, that most management
consultancy assignments (e.g., strategic planning, marketing research, information
technology) are commissioned to impact on the well-being (e.g., profitability, market
share) of the client organisation overall. Furthermore, as discussed in Chapter 4, both
internal and external factors relevant to the overall organisation (e.g., purchase situational
factors: novelty, importance, complexity) are likely to influence CS/D and behavioural
intention outcomes.
5.3.4 Unit of Response
Models of organisational buyer behaviour (OBB) (e.g., Webster and Wind 1972) in
business-to-business marketing emphasise that much organisational purchasing decision
making is characterised by joint decision-making. A decision-making unit may consist of
only one individual, but normally comprises a group of individuals who share common
goals which the purchase decision will hopefully help them achieve, and who share the
risks arising from the decision (Reeder, Brierty and Reeder 1987). The concept of the
buying centre was introduced to capture this multiperson involvement and several
researchers (e.g., Wind and Thomas 1980) argue that the buying centre should be the
relevant unit of analysis in studies of OBB purchase decisions.
However, the buying centre is rarely reflected in empirical studies. Most OBB studies
continue to focus upon a single person (usually the purchasing manager) and not the buying
centre (Dawes 1989). The dearth of buying centre studies has been attributed to the
fundamental conceptual and methodological problems intrinsic in designing and conducting
multiple decision-participant research (Silk and Kalwani 1982).
Moriarty (1983) claimed the validity and reliability of data from single or key informant
studies is suspect because much of this research includes modified rebuys and new-buy
situations where the input of purchasing managers (typically the key informant in many
OBB studies), is generally viewed as being minimal. Philips (1981) also concluded that
reliance on single informants could lead to errors in the data collected, because the
individual respondent may not have complete and reliable knowledge about the
organisational phenomenon under study. Thus choosing a single respondent on a priori
grounds to represent the views of the buying centre can be problematic. It is apparent
therefore that an important design issue in buying centre studies involves the selection of
the appropriate unit of response. Buying centres are formed on an "as needed" basis,
usually highly transient and known to be unstable over time, and membership frequently
varies with different stages in the buying process (Dawes 1989).
As this study concentrates on both pre-purchase (e.g., expectations) and post-purchase
(e.g., CS/D) perceptions and behavioural intentions, it is vital that the respondent is able to
provide valid and reliable data about the consulting assignment over a period of months.
Despite the preceding advantages of the multiple informant approach, a single key
informant approach was used to collect data for this study for a number of reasons. First,
the key informant's name and designation was supplied by the organisations participating in
this study (refer Section 5.3.1). This key informant was generally a senior executive or
senior manager who was involved in the consultant selection process and equally important,
likely to be involved in the assignment from start to finish - an important consideration for
98
a longitudinal study of this nature. Secondly, Pennings (1979) suggests that a key
informant is appropriate where the informant occupies a senior or ownership position. He
argued that such people are direct participants in the organisation's boundary spanning
activities, and are therefore qualified to respond on behalf of the organisation. Likewise,
Philips (1981) found high level managers provide more reliable information on an
organisational phenomena than lower ranking managers. In the majority of cases the key
informant in this study was a senior executive, senior or middle manager. Thirdly, an
important advantage of the key informant design, as pointed out by Kohli (1989), is that it
enabled respondents to remain anonymous and did not necessitate their disclosing the
names of other buying centre members. Hence it is likely to have encouraged respondents
to provide candid responses. This was an important consideration given the potentially
politically sensitive nature of the information revealed throughout the two questionnaires.
Finally, a key informant was used for pragmatic reasons. As Conant, Mokwa and
Varadarajan (1990 p. 371) point out, "...in the face of time and resource constraints the
single informant approach allows for a large number of organizations to be surveyed."
This was an important consideration because to track multiple informants over several
months would have been an extremely difficult task, and have increased the organisational
non-response rate due to mortality effects (e.g., respondent changing functions within
company, leaving the organisation altogether or becoming too busy to continue
participating).
Several measures were taken to ensure the key informant was qualified to respond on
behalf of the organisation. Firstly, to increase the validity and reliability of the data
collected via the key informant method, two screening criteria were employed to assess the
appropriateness of the respondent. Firstly, only respondents who were involved in at least
four of the six key decision stages were included in the sample. These decision stages (as
per Q .8a of the pre-purchase questionnaire) were:
99
1. Identified existence of the problem
2. Determined if problem to be handled internally or externally
3. Identified possible consultants
4. Involved in search for information about consultants
5. Involved in shortlisting consultants
6. Involved in final selection of consultant
As previously mentioned, the key informant was also required to have ongoing involvement
with the consulting assignment. Secondly, respondents were asked "Concerning your
expectations about the consulting assignment, as expressed in Q6 & Q7. How
representative are these views of other members of the buying group?" This was measured
using a 7-point rating scale where 1 was "Not at all representative" and 7 "Very
representative". Only 3.9% (or five respondents) in the final sample reported that their
views were at variance with other members of the buying group (i.e., they reported less
than 4 on the scale). Finally, concerning the post-purchase phase, respondents were asked
(Q12) how representative their feelings of (dis)satisfaction were among other buying centre
members. Only six respondents (4.7%) reported their views being at variance with the
buying group. However, if these respondents were in a senior management position and
involved with at least four of the decision stages they were retained in the sample for
subsequent analysis.
5.4 Data Collection Instruments and Procedures
5.4.1 Qualitative Research
As indicated in Section 5.2.2, an initial qualitative stage was conducted prior to design of
the questionnaires. A major aim of this qualitative phase was to ensure all relevant
expectation and performance dimensions (attributes) as well as attitude dimensions were
captured for inclusion in the data collection instruments. These in-depth personal
interviews were conducted with executives of four major consultancy firms and eight
clients who had recently used the services of a consultant. Access was also gained to five
100
proprietary research reports (four prepared for Price Waterhouse Urwick Pty Ltd and one
for the N.S.W . State Government) dealing with client perceptions of MCS. The
information gleaned from this qualitative stage was then incorporated into the two
questionnaires.
5.4.2 Data Collection Instruments
The data collection instruments comprised two (2) self-administered, mail questionnaires
with accompanying covering letters (Appendix 5). The stage 1 questionnaire measured
pre-purchase constructs (expectations, importance weights of service attributes, prior
attitudes and purchase situation variables) and was administered at the time the consultancy
assignment was commissioned. The stage 2 questionnaire was administered between one
and two months after completion of the MCS assignment, and measured post-purchase
constructs (perceived performance, disconfirmation, CS/D and behavioural intentions).
The respective questionnaires were pre-tested by mailing them to eight senior
managers/executives who had commissioned MCS assignments in the previous twelve
months. Upon completing the questionnaires the pre-tested individuals were personally
interviewed. At these interviews, each executive was requested to identify any difficulties
or ambiguities they experienced with the instruments. Further, in accordance with Belson's
(1986) recommendations they were asked about the meaning they attached to certain
questions to ensure a uniform interpretation between researcher and respondent. These
interviews resulted in changes being made, especially to the battery of expectation and
performance attribute items. Some new items were included and the wording of others was
altered. The revised questionnaire was again pretested on two senior managers, and
reviewed by two marketing academics experienced in questionnaire design. As a result
minor changes were again made before the final instruments were prepared.
Babbie (1990) recommends that the contents of a questionnaire be designed with distinctive
sections that aide the respondents understanding of the different information requirements.
Hence, the stage 1 questionnaire was divided into six sections. The first dealt with the
101
nature and importance of the assignment as well as measures of the novelty, uncertainty,
and complexity of the consulting assignment. The first four questions were designed to act
as trigger mechanisms in order to help respondents recall the events which led to the
decision to commission the consultancy. These dealt with the type, nature, length of
assignment, their personal responsibility in selecting the consultancy and difficulty of
choosing between competing proposals. The second section included twenty-six Likert
scale statements pertaining to expectations about the processes and outcomes of the
assignment. Section three related to the selection decision, including buying centre size
and the number of proposals (tenders) considered. Sections four and five elicited the
perceived importance weights of the twenty six expectation dimensions and prior attitudes
towards consultants, respectively. The final section sought background details of the key
informant and some organisational demographic information.
The stage 2 questionnaire contained four sections. The first prompted respondents to use as
their reference point the consulting assignment they described in their initial questionnaire
(to ensure no confusion, the exact wording they used to describe the type and objectives in
the stage 1 questionnaire was written onto the questionnaire immediately prior to the first
question). The second and third sections measured perceptions of performance and
disconfirmation. The final section concerned satisfaction and behavioural intentions
measures.
5.4.3 Data Collection Procedures
The procedure adopted to acquire responses was as follows. The key informant (whose
name, designation, organisation and contact number were supplied by the four co-operating
organisations) was first contacted by telephone seeking their co-operation to participate in
the study, which was under the auspices of the University of Wollongong. If they agreed
to participate they were mailed a package containing a cover letter, a stage 1 questionnaire
and a self-addressed pre-paid envelope to facilitate a reply. The cover letter explained the
nature and importance of the study and offered a summary report of the findings upon
102
completion of the study. In order to minimise possible bias to reported behaviour in the
stage 2 questionnaire, due to main testing effects (Churchill 1987) respondents were not
forewarned either in the initial telephone contact or in the covering letter about a possible
follow-up (stage 2) questionnaire. The first section of the questionnaire asked for the
expected completion date of the assignment. Between one and two months after this date
the stage 2 questionnaire was mailed. No telephone pre-notification was used in this
instance. If responses were not received within three weeks then a telephone follow-up was
undertaken. Up to two follow-up calls were made if necessary.
5.5 Operational Definitions of Research Variables
This section discusses the measures of the dependent and explanatory/independent variables
in the re-conceptualised model shown in Figures 4-1(a) and 4-1(b). All key variables in
both questionnaires were assessed using multiple measures. Such scales are necessary to
adequately and accurately capture the domain of the constructs (Churchill 1987; Nunnally
1978). In addition, this approach is considered to reduce measurement error and increase
the reliability and validity of the measures (Peter 1979; Churchill 1979).
5.5.1 Dependent Variables: Customer Satisfaction/ Dissatisfaction (CS/D) and
Behavioural Intentions
The dependent variable in the disconfirmation of expectations paradigm is customer
(dis)satisfaction. However, as has been the case in a number of other CS/D studies (e.g.,
Oliver and Swan 1989), this is extended in this study to incorporate behavioural intentions.
Each of these two variables is now discussed in turn.
. Customer Satisfaction/Dissatisfaction (CS/D)
As discussed in Section 3.4.1, CS/D has been variously defined. However, the construct
was operationally defined for this dissertation in a manner consistent with most other
research in the literature. The conceptualisation that has received the greatest support is the
view that CS/D is a post-purchase evaluation of a specific consumption experience (Day

103
1984). Further, it contains both affective as well as cognitive components (Swan 1982)
and is a summary or global construct.
Accordingly CS/D was operationalised in this way, employing four of the six items used by
Oliver and Swan (1989), and Westbrook and Oliver (1991), relevant to this study. The
aforementioned studies reported reliability estimates of the CS/D measures ranging from
.91 to .95. The satisfaction items, measured with a 7-point bipolar adjective scale, were:
very pleased-very displeased, very contented-disgusted, did a poor assignment-did a very
good assignment, and very dissatisfied-very satisfied. In addition, four of Oliver's (1980a)
items (adapted to a MCS context) were also used in a 7-point Likert scale format. Finally,
respondents were asked: "Would you recommend this consultancy firm to a colleague in
another company with a similar problem ?" A 7-point bipolar adjective scale (definitely
yes-definitely not) was employed. These three sets of questions are shown in Q7, Q8 and
Q10 of the stage 2 questionnaire in Appendix 5.
. Behavioural Intentions
Behavioural intentions towards the consultancy firm was defined as expected post-purchase
behaviour in reference to that firm. Intention was measured on a four item, 7-point bipolar
adjective scale used by Fishbein and Ajzen (1975), and Oliver and Swan (1989).
Respondents were asked: "If your organisation requires the services of a management
consultancy firm in the near future, for a similar type of assignment, would you use the
same consultancy firm?" (Q 13). Item descriptors were "unlikely-likely", "very probable-
not probable", "impossible-very possible", "no chance-certain".
5.5.2 Explanatory Variables
The explanatory variables, as depicted in the re-conceptualised theoretical model in Figures
4-1(a) and 4- 1(b), can be placed into seven categories in order of temporal precedence:
prior attitudes; purchase situation; individual-level; expectations; perceived performance;
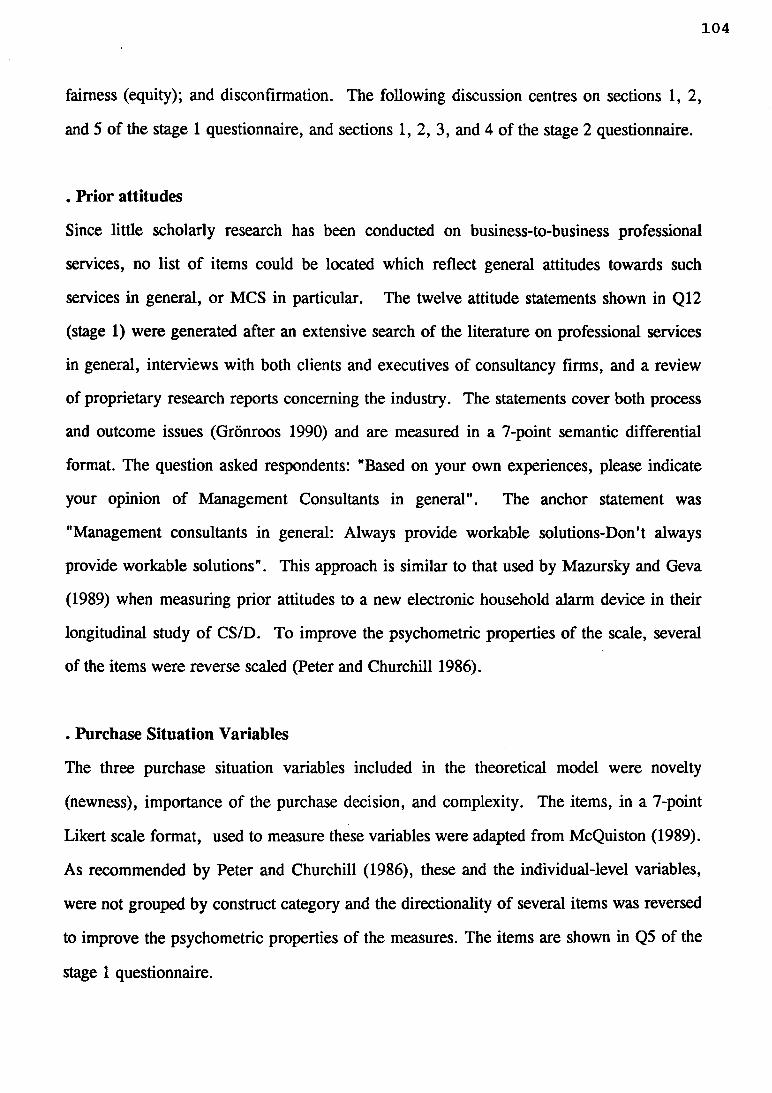
104
fairness (equity); and discontinuation. The following discussion centres on sections 1, 2,
and 5 of the stage 1 questionnaire, and sections 1, 2, 3, and 4 of the stage 2 questionnaire.
. Prior attitudes
Since little scholarly research has been conducted on business-to-business professional
services, no list of items could be located which reflect general attitudes towards such
services in general, or MCS in particular. The twelve attitude statements shown in Q12
(stage 1) were generated after an extensive search of the literature on professional services
in general, interviews with both clients and executives of consultancy firms, and a review
of proprietary research reports concerning the industry. The statements cover both process
and outcome issues (Grônroos 1990) and are measured in a 7-point semantic differential
format. The question asked respondents: "Based on your own experiences, please indicate
your opinion of Management Consultants in general". The anchor statement was
"Management consultants in general: Always provide workable solutions-Don't always
provide workable solutions". This approach is similar to that used by Mazursky and Geva
(1989) when measuring prior attitudes to a new electronic household alarm device in their
longitudinal study of CS/D. To improve the psychometric properties of the scale, several
of the items were reverse scaled (Peter and Churchill 1986).
. Purchase Situation Variables
The three purchase situation variables included in the theoretical model were novelty
(newness), importance of the purchase decision, and complexity. The items, in a 7-point
Likert scale format, used to measure these variables were adapted from McQuiston (1989).
As recommended by Peter and Churchill (1986), these and the individual-level variables,
were not grouped by construct category and the directionality of several items was reversed
to improve the psychometric properties of the measures. The items are shown in Q5 of the
stage 1 questionnaire.
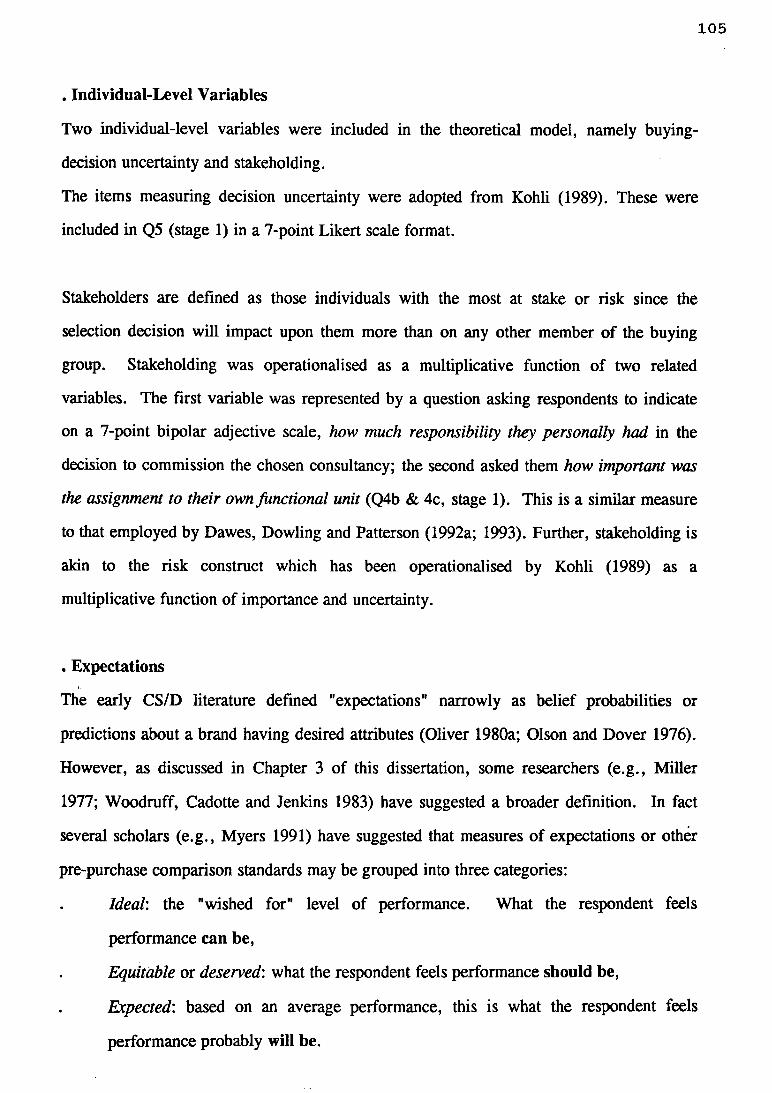
105
. Individual-Level Variables
Two individual-level variables were included in the theoretical model, namely buying-
decision uncertainty and stakeholding.
The items measuring decision uncertainty were adopted from Kohli (1989). These were
included in Q5 (stage 1) in a 7-point Likert scale format.
Stakeholders are defined as those individuals with the most at stake or risk since the
selection decision will impact upon them more than on any other member of the buying
group. Stakeholding was operationalised as a multiplicative function of two related
variables. The first variable was represented by a question asking respondents to indicate
on a 7-point bipolar adjective scale, how much responsibility they personally had in the
decision to commission the chosen consultancy; the second asked them how important was
the assignment to their own functional unit (Q4b & 4c, stage 1). This is a similar measure
to that employed by Dawes, Dowling and Patterson (1992a; 1993). Further, stakeholding is
akin to the risk construct which has been operationalised by Kohli (1989) as a
multiplicative function of importance and uncertainty.
. Expectations
The early CS/D literature defined "expectations" narrowly as belief probabilities or
predictions about a brand having desired attributes (Oliver 1980a; Olson and Dover 1976).
However, as discussed in Chapter 3 of this dissertation, some researchers (e.g., Miller
1977; Woodruff, Cadotte and Jenkins 1983) have suggested a broader definition. In fact
several scholars (e.g., Myers 1991) have suggested that measures of expectations or other
pre-purchase comparison standards may be grouped into three categories:
. Ideal: the "wished for" level of performance. What the respondent feels
performance can be,
. Equitable or deserved: what the respondent feels performance should be,
. Expected: based on an average performance, this is what the respondent feels
performance probably will be.
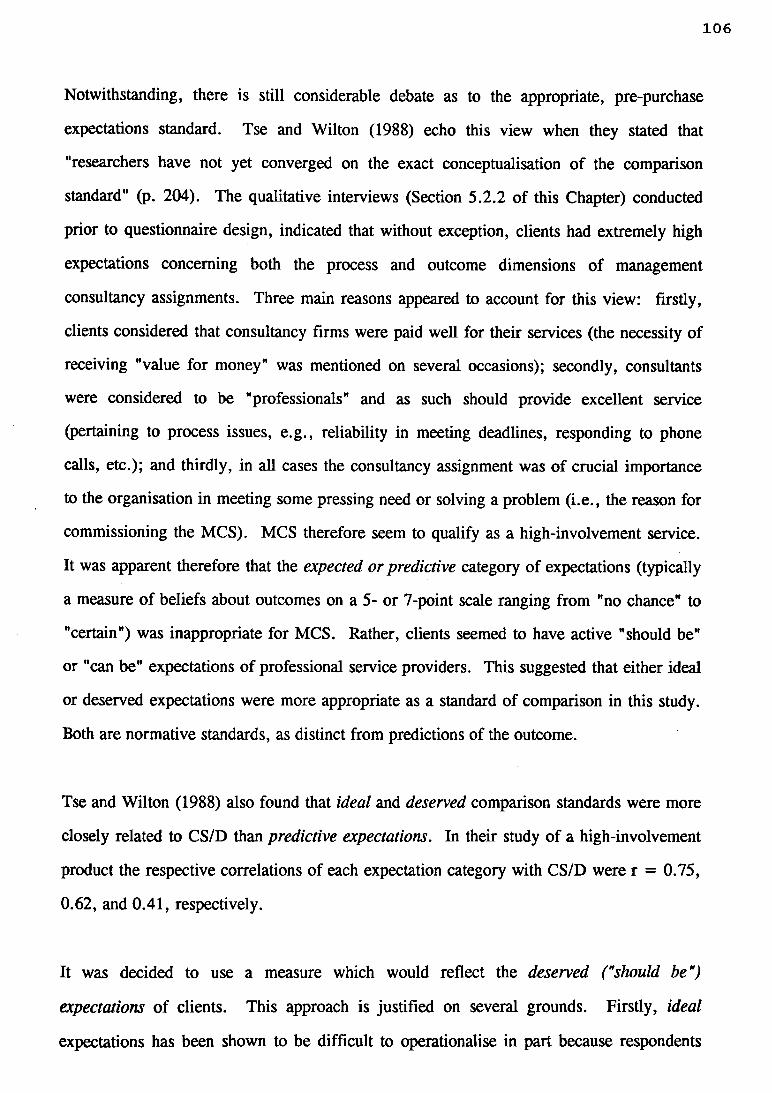
106
Notwithstanding, there is still considerable debate as to the appropriate, pre-purchase
expectations standard. Tse and Wilton (1988) echo this view when they stated that
"researchers have not yet converged on the exact conceptualisation of the comparison
standard" (p. 204). The qualitative interviews (Section 5.2.2 of this Chapter) conducted
prior to questionnaire design, indicated that without exception, clients had extremely high
expectations concerning both the process and outcome dimensions of management
consultancy assignments. Three main reasons appeared to account for this view: firstly,
clients considered that consultancy firms were paid well for their services (the necessity of
receiving "value for money" was mentioned on several occasions); secondly, consultants
were considered to be "professionals" and as such should provide excellent service
(pertaining to process issues, e.g., reliability in meeting deadlines, responding to phone
calls, etc.); and thirdly, in all cases the consultancy assignment was of crucial importance
to the organisation in meeting some pressing need or solving a problem (i.e., the reason for
commissioning the MCS). MCS therefore seem to qualify as a high-involvement service.
It was apparent therefore that the expected or predictive category of expectations (typically
a measure of beliefs about outcomes on a 5- or 7-point scale ranging from "no chance" to
"certain") was inappropriate for MCS. Rather, clients seemed to have active "should be"
or "can be" expectations of professional service providers. This suggested that either ideal
or deserved expectations were more appropriate as a standard of comparison in this study.
Both are normative standards, as distinct from predictions of the outcome.
Tse and Wilton (1988) also found that ideal and deserved comparison standards were more
closely related to CS/D than predictive expectations. In their study of a high-involvement
product the respective correlations of each expectation category with CS/D were r = 0.75,
0.62, and 0.41, respectively.
It was decided to use a measure which would reflect the deserved (”should b e”)
expectations of clients. This approach is justified on several grounds. Firstly, ideal
expectations has been shown to be difficult to operationalise in part because respondents
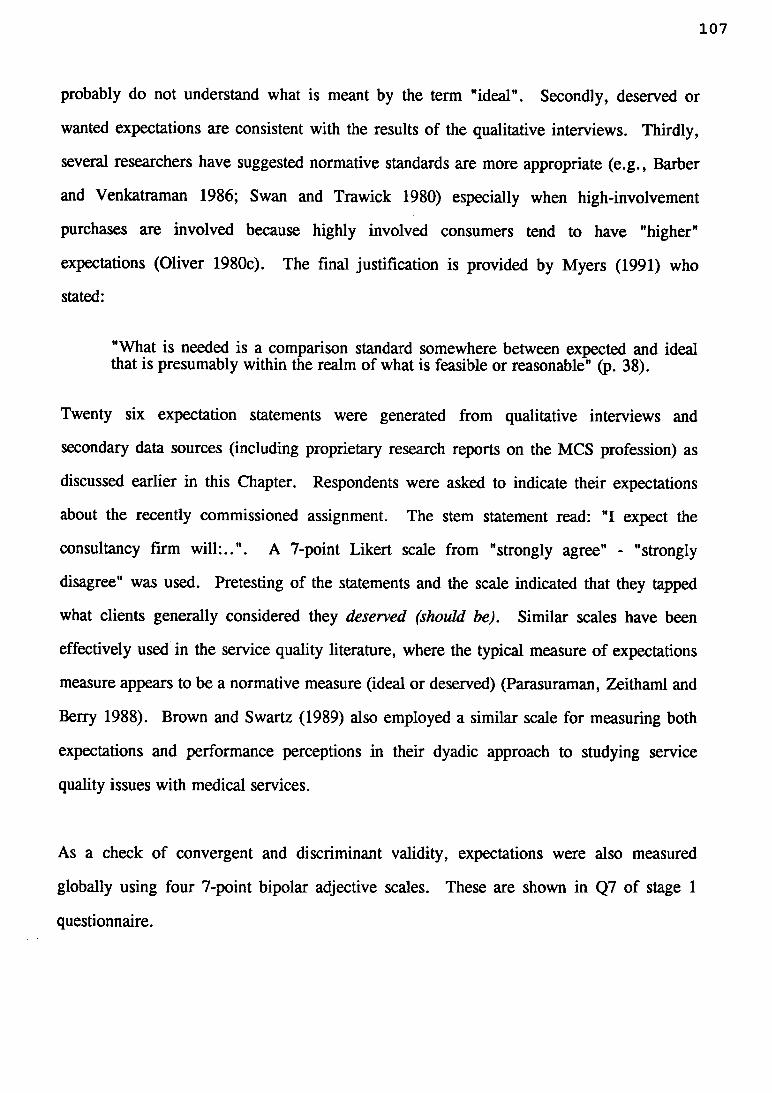
107
probably do not understand what is meant by the term "ideal". Secondly, deserved or
wanted expectations are consistent with the results of the qualitative interviews. Thirdly,
several researchers have suggested normative standards are more appropriate (e.g., Barber
and Venkatraman 1986; Swan and Trawick 1980) especially when high-involvement
purchases are involved because highly involved consumers tend to have "higher"
expectations (Oliver 1980c). The final justification is provided by Myers (1991) who
stated:
"What is needed is a comparison standard somewhere between expected and ideal that is presumably within the realm of what is feasible or reasonable" (p. 38).
Twenty six expectation statements were generated from qualitative interviews and
secondary data sources (including proprietary research reports on the MCS profession) as
discussed earlier in this Chapter. Respondents were asked to indicate their expectations
about the recently commissioned assignment. The stem statement read: "I expect the
consultancy firm will:..". A 7-point Likert scale from "strongly agree" - "strongly
disagree" was used. Pretesting of the statements and the scale indicated that they tapped
what clients generally considered they deserved (should be). Similar scales have been
effectively used in the service quality literature, where the typical measure of expectations
measure appears to be a normative measure (ideal or deserved) (Parasuraman, Zeithaml and
Berry 1988). Brown and Swartz (1989) also employed a similar scale for measuring both
expectations and performance perceptions in their dyadic approach to studying service
quality issues with medical services.
As a check of convergent and discriminant validity, expectations were also measured
globally using four 7-point bipolar adjective scales. These are shown in Q7 of stage 1
questionnaire.
108
. Perceived Performance
In line with the approach adopted by Brown and Swartz (1989), the same twenty six
statements used in measuring expectations were employed in assessing perceived
performance (Q4 of Stage 2 questionnaire). Respondents were asked how the consultancy
firm performed with various aspects of the assignment. A typical statement read: "The
Consultancy Firm: Made sure they understood our aims and goals". Subjects responded to
these items on a 7-point Likert scale, with 1 representing "strongly disagree" and 7
"strongly agree". This multi-attribute or disaggregative approach allows the
disconfirmation construct to be measured objectively (i.e., a subtractive measure) by
summing the differences between expectations and performance across all statements. As
discussed in the next section, disconfirmation was also assessed subjectively (i.e., inferred
disconfirmation).
. Disconfirmation
In the model used in this dissertation, disconfirmation is the degree to which performance
is perceived to exceed, meet or fall short of one's expectations, culminating in positive,
zero, and negative disconfirmation, respectively. Disconfirmation is difficult to measure
(Churchill and Surprenant 1982), yet it is a crucial intervening variable and has been shown
to be a direct antecedent of CS/D in a number of empirical works (e.g., Bearden and Teel
1983; Oliver and DeSarbo 1988; Oliver and Swan 1989) as well as in theoretical works
(e.g., Oliver 1981).
Oliver (1977) stressed the need to measure disconfirmation apart from expectations as he
maintained it has an independent, additive effect on CS/D. Disconfirmation was measured
separately from expectations in this study by including it in the post-purchase questionnaire
(Q5, Q6), thus providing a more valid measure.
Disconfirmation was measured on Oliver's (1980a) 3-item "better than expected/worse than
expected" scale. The three items sampled the dimensions of problems, benefits, and
109
overall perceptions (Q.6 in Stage 2 questionnaire). In addition, using a similar scale with
the identical scale descriptors, disconfirmation was also assessed with eight key attribute
dimensions, as a measure of convergent validity (Q5).
. Fairness
In traditional equity theory, one assumes that equity occurs when the ratio of outcomes to
inputs is equal for both parties. Other interpretations have been found in the literature,
including equality of outcomes where inputs are not considered (Shapiro 1975). The two
common interpretations of the equity construct are fairness and preference. As discussed in
Section 4.2.3., only the "fairness" dimension was used in this study. Although originally
stated as a mathematical formula, fairness has been conceptualised verbally as a positive
function of buyer's and seller's outcomes and a negative function of their inputs (Oliver
and Swan 1989). Thus if the buyer (or MCS client in this study) perceives the seller
(consultant) has concluded a sale where both parties have received sufficient outcomes
(given their respective inputs), then "fairness" is seen to have been accomplished.
Apart from a recent study (Oliver and Swan 1989) employing the equity construct in
explaining CS/D and behavioural intentions with car salespersons, no other equity scale
could be located in the literature surveyed. Further, because fairness was hypothesised as
an intervening construct in the re-conceptualised model, the straightforward measures
employed by Oliver and Swan (1989) were used in this study. Accordingly three Likert
scale statements, modified for the context of a MCS, were used in this study (Q.3, stage 2
questionnaire). Pretesting indicated that respondents were interpreting the statements
correctly in terms of the fairness dimension.
. Other Measures
Because all attributes are not of equal importance, several researchers have advocated
weighting individual expectations, performance, disconfirmation and CS/D attribute scores
by their respective importance weights (e.g., Czepiel and Rosenberg 1977; LaTour and
Peat 1979). Consequently, a measure of the importance scores for the twenty-six
expectation/performance attributes was deemed necessary. In the stage 1 questionnaire this
was achieved by asking respondents to rate the importance of each attribute on a 10-point
itemised rating scale, ranging from "Not at all important" to "Critically important (Q.10).
As a measure of reliability a similar question was asked in the stage 2 questionnaire.
5.6 Analytical Approach
5.6.1 Introduction
The preceding sections of this chapter described how the major constructs were
operationalised in this study. This section describes details of the method used to analyse
the data collected.
The analytical method used to empirically test the re-conceptualised disconfirmation model
has been referred to by different authors as path analysis (Blalock 1964; Duncan 1966;)
linear structural equations (Joreskog 1973), and causal modelling (Asher 1976; Bagozzi
1980). These terms refer to certain procedures which can be used to try to assess general
cause and effect relationships in non-experimental data, under a restrictive set of
conditions.
First, a general discussion of path analysis or causal modelling is presented. This includes
a discussion of the following issues: the basic assumptions; the advantages of this
technique; recursive vs. nonrecursive models; specification of the model; and,
identification of the model. Next, the particular causal modelling technique used in this
study is presented. This technique can best be described as non-reciprocal or recursive path
analysis (Asher 1976).
5.6.2 Causal M odelling
Causal modelling or path analysis is considered to be a general term for a diversity of
scientific approaches dealing with the representation of cause and effect (Bagozzi 1980).
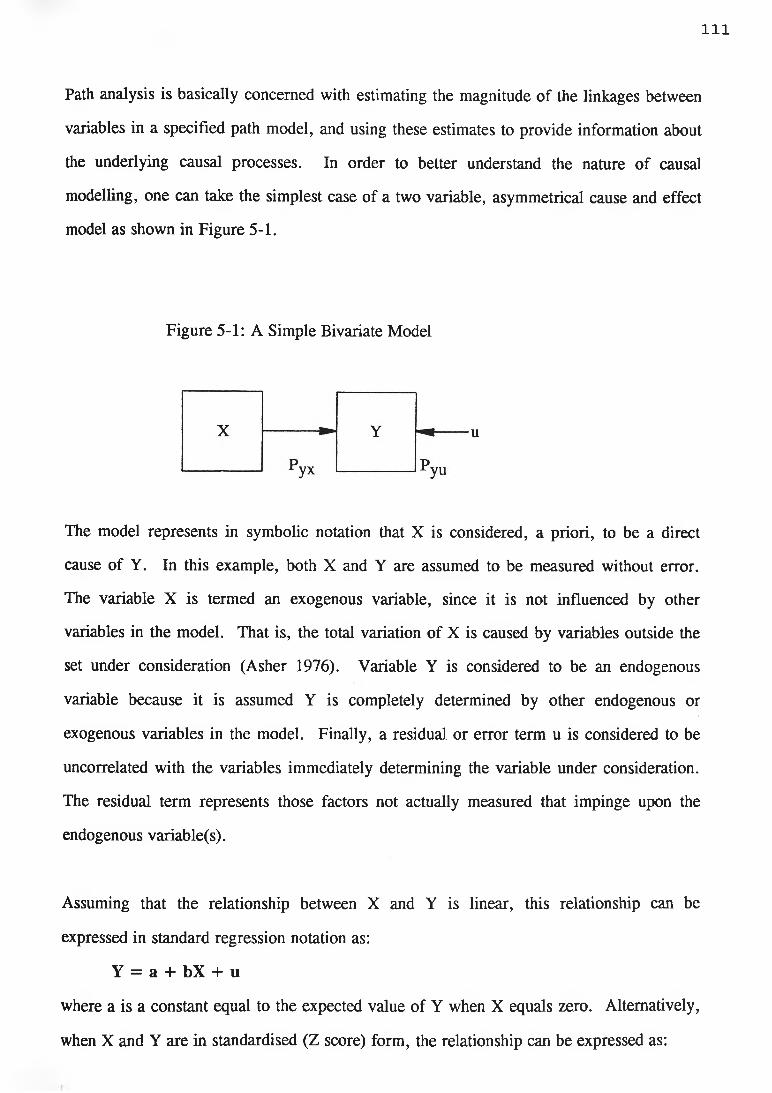
I l l
Path analysis is basically concerned with estimating the magnitude of the linkages between
variables in a specified path model, and using these estimates to provide information about
the underlying causal processes. In order to better understand the nature of causal
modelling, one can take the simplest case of a two variable, asymmetrical cause and effect
model as shown in Figure 5-1.
Figure 5-1: A Simple Bivariate Model
u
The model represents in symbolic notation that X is considered, a priori, to be a direct
cause of Y. In this example, both X and Y are assumed to be measured without error.
The variable X is termed an exogenous variable, since it is not influenced by other
variables in the model. That is, the total variation of X is caused by variables outside the
set under consideration (Asher 1976). Variable Y is considered to be an endogenous
variable because it is assumed Y is completely determined by other endogenous or
exogenous variables in the model. Finally, a residual or error term u is considered to be
uncorrelated with the variables immediately determining the variable under consideration.
The residual term represents those factors not actually measured that impinge upon the
endogenous variable(s).
Assuming that the relationship between X and Y is linear, this relationship can be
expressed in standard regression notation as:
Y = a + bX + u
where a is a constant equal to the expected value of Y when X equals zero. Alternatively,
when X and Y are in standardised (Z score) form, the relationship can be expressed as:
112
Y = BX + e
where B is the standardised beta coefficient representing the strength of the relationship
between X and Y and e is the model error term. The coefficient B conforms with the
definition of a path coefficient in that it measures the fraction of the standard deviation of
the endogenous variable for which the designated variable X is directly responsible (Wright
1934). In path notation, the equation becomes:
Y = PyxX + Pyull
The P 's are the unknown weights that represent the impact of one variable upon another,
and are labelled path coefficients (Asher 1976). For the bivariate example, it can be shown
that B is equal to the correlation coefficient of Y and X. Thus the squared path coefficient
is equal to the proportion of the variance of the dependent or endogenous variable for
which the determining variable is directly responsible. The unexplained variance is
represented by e . By similar reasoning it can be shown that e is equal to 1 - R , where
R is the coefficient of determination in a standard regression model.
To further illustrate the path analytic technique, a more complex example is presented in
Figure 5-2. This example contains two exogenous variables (Xj and X2) and three
endogenous variables (X3, X4 and X5). One structural equation can be written for each
endogenous variable. Included in each equation will be those variables that directly impact
upon the endogenous variable in question, weighted by the appropriate coefficients. In
terms of equations involving path coefficients, the model can be described by the following
set of equations:
x 3 = P31x l + P32x 2 + P3U1
x 4 = P41x l + P43x 3 + P4U2
x 5 = P52x 2 + P54x 4 + P5U3

The path coefficients are presented in standard notation where the first of the two subscripts
represents the dependent variable and the second subscript represents the independent or
explanatory variable. The absence of direct causal linkages in Figure 5-2 implies that the
path coefficients from X \ to X5, X2 to X4 and X3 to X5, are hypothesised to equal zero.
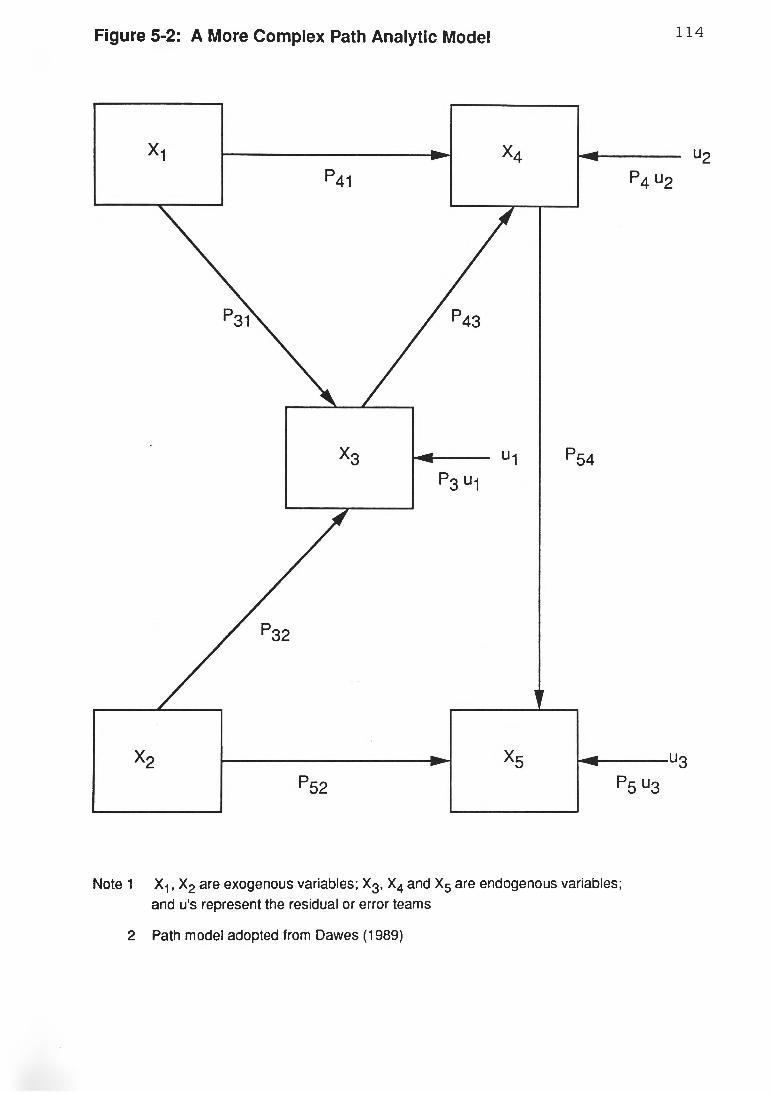
Figure 5-2: A More Complex Path Analytic Model 114
u2
Note 1 X1, X2 are exogenous variables; X3, X4 and X5 are endogenous variables; and u's represent the residual or error teams
2 Path model adopted from Dawes (1989)
115
5.6.3 Advantages of Path Analysis
As a statistical technique, path analysis is little different from least squares regression in
recursively estimating a system of equations. However, as a pattern of interpretation, path
analysis has some distinct advantages (Duncan 1966). Firstly, it makes the causal linkages
or assumptions in the model explicit and forces the causal scheme to be at least internally
consistent.
Secondly, path analysis enables the measurement of the direct as well as indirect effects
that one variable has upon another. It is this feature of path analysis which enables the
building of complex models of causal relationships of a type unattainable by multiple
regression analysis (Martin and Elliott 1971). Finally, path analysis enables the
decomposition of the correlation between any two variables into simple and compound
paths. This decomposition is important since it provides information about the causal
process as well as providing a test of the adequacy of the model (Asher 1976).
In summary, recursive path analysis is superior to ordinary regression analysis since it
allows us to move beyond the estimation of direct effects, the basic output of regression.
Path analysis allows the examination of the causal processes underlying the observed
relationships and to estimate the relative importance of alternative paths. It is for these
reasons that this technique was chosen as the major analytic tool for data analysis in this
study.
5.6.4 Recursive versus Nonrecursive Models
The two preceding models discussed are both examples of fully recursive models as they
have no feedback loops. In Figure 5-2, since X3 precedes X4 and X5, there can be no
causal linkage from X4 or X5 to X3. In a nonrecursive or interactive model, such
feedback loops would be allowed to exist.
116
A major advantage of recursive models over nonrecursive ones is evident when one
attempts to estimate the coefficients of the models. By restricting the model to having no
feedback loops, ordinary least squares regression can be used to solve for the coefficients.
Furthermore, assuming that the residual error terms in the endogenous variables are
uncorrelated with each other or with the exogenous variables insures that all path
coefficients can be estimated. In a nonrecursive model, ordinary least squares regression
will not produce unbiased estimates of the path coefficients. Consequently, more
sophisticated estimation procedures such as two-stage least squares or maximum likelihood
estimation must be used.
5.6.5 Specification of the Model
In developing a causal model, variables must be "specified", a priori, to be either causes or
effects for each equation in the model. Furthermore, if there is a causal relationship
between variables, we must be able to specify a priori, the direction of those relationships.
Failure to specify the correct variables as predictors of each of the effect variables results in
specification errors. These errors can occur either through incorrect ordering of the
variables or through incorrect inclusion or exclusion of predictor variables for any equation
in the model.
Specification errors can occur in both recursive and nonrecursive models. In recursive
models, however, the specified ordering of the variables must be based clearly upon theory
(Duncan 1975). Furthermore, the model must be sufficiently specified to allow for all
coefficients to be estimated. If all coefficients cannot be estimated, then the model is said
to be underidentified. Conversely, whenever we omit important linkages, we end up with
more equations than unknowns, commonly referred to as an overidentified model.
Specification errors in models can create biases in the estimates of the path coefficients.
These biases may or may not be substantial depending upon the number and severity of the
errors. In Figure 5-2, the direct causal path from X3 to X5 has been specified to be zero.
117
If, in fact, there is a direct linkage from X3 to X5, the path coefficient from X4 to X5 will
be biased upward in magnitude. Alternatively, if the linkage X3 to X5 were hypothesised
to be non-zero when there was no direct relationship, the coefficient would be unbiased but
be less efficient (Myers 1990).
5.6.6 Model Identification
Before the researcher can proceed with solving the model that has been specified, the
problem of whether it is possible to obtain unique solutions for all the parameters in the
model must be addressed. Determining whether the model can be solved has come to be
known as the identification problem in econometrics (Kenny 1979). More specifically, a
model is considered to be identified if there is a sufficient number of independent bits of
information in the empirical data to solve for the unknown parameters in the model.
The problem of model identification is important for both recursive and nonrecursive causal
models. It is, however, much less of a problem in recursive models since a number of
assumptions are made that ensure the equations will be identified (Asher 1976).
There are two basic ways of identifying a system of equations. The first way involves
imposing limitations on the coefficients linking the measured variables and the second
concerns making certain assumptions about the correlations among the residual terms.
Normally, these are referred to as coefficient and covariance restrictions. In a recursive
model, many coefficient restrictions are made since at least half of the coefficients are
usually set at being equal to zero (Asher 1976). Furthermore, the usual assumptions which
are made about the residual terms being uncorrelated in a recursive model guarantee that
the system of equations will be at least identified.
5.6.7 Further Assumptions in Causal Modelling
Recursive path analysis uses the same assumptions as for linear regression. The
relationship among constructs are assumed to be linear. If the underlying structure of the
causal relationship is not linear and cannot be transformed to a linear function, then
estimates of the parameters could be biased. Furthermore, the errors in the equations are
assumed to be normally distributed and homoscedastic, with expected values of zero. The
errors in the equations are further assumed to be uncorrelated with each other and with the
true constructs.
The explanatory variables used in regression equations are called the independent or
predictor variables. They are, however, seldom independent in a statistical sense.
Statistical independence implies that the variables are mutually uncorrelated, but if that is
the case, regression analysis would be unnecessary since the standardised regression
coefficients would reduce to zero-order correlation coefficients (Asher 1976). The problem
of multicollinearity - highly correlated independent variables - may lead to unreliable
estimates of the regression coefficients.
Multicollinearity is, however, much more likely to be a problem with aggregate data than it
is with survey data compiled from individuals. This is because in aggregating
observations, the random measurement error component of the scores is likely to be
cancelled out whereas in survey data random measurement error is ever present. As argued
by Asher (1976, p.52), the presence of random error attenuates correlation coefficients
thereby making the problem less likely and, therefore, less worrisome in recursive path
analysis using survey data. Furthermore, a recent study by Mason and Perreault (1991)
suggests that fears about the harmful effects of collinear predictors is often exaggerated.
5.7 Summary
This chapter has detailed the research methodology, operationalisation of the constructs and
a discussion of the major analytical technique employed (i.e., path analysis). Previously in
Chapter 4, a theoretical path model (Figures 4-1(a) and (b)) of the determinants of CS/D
and behavioural intentions was presented. The model comprises five (5) endogenous and
seven (7) exogenous variables. In the following two chapters, this framework of
119
relationships hypothesised in the path model was tested using recursive path analysis. This
analytical technique was chosen in preference to LISREL because of the relatively small
sample size. As indicated earlier in this chapter, the final sample size was 128 client
organisations, which is far less than the recommended minimum sample size of 200 for
analysis of complex models (Boomsa 1982). Bearden, Sharma and Teel (1982) suggested
that if LISREL is used with samples of less than 200, there is a real possibility of drawing
erroneous conclusions. Consequently causal path analysis was used to test the hypothesised
path model in this study.
The following two chapters present the results of the study. Chapter 6 presents a
preliminary examination of the data, including a profile of respondents and tests of the
validity and reliability of the measures. Chapter 7 presents the empirical path model of
CS/D determination as well the hypothesis testing results.
120
CHAPTER 6: PRELIMINARY RESULTS
The preceding chapter outlined the research methodology, operationalisation of the
dependent and independent variables, and the major analytical techniques employed. The
purpose of this, and the following chapter is to present the results of the data analysis and
hypothesis testing. This chapter presents results of the preliminary analysis (i.e., summary
statistics of the respondents' profile, correlation analysis, factor and reliability analysis),
while Chapter 7 focuses on the substantive results, i.e., the derived causal path model and
results of hypotheses testing. The final sample comprised 128 organisations that completed
both pre-purchase and post-purchase questionnaires concerning the commissioning of a
wide range of management consultancy assignments.
This chapter is organised into the following three sections. (1) summary statistics
concerning the profile of the organisations sampled; (2) validity and reliability of measures
of the independent and dependent variables; and (3) correlation analysis.
6.1 Summary Statistics
This section presents descriptive statistics for key characteristics of the 128 organisations
who completed both stage 1 and stage 2 questionnaires. These are presented in Table 6-1.
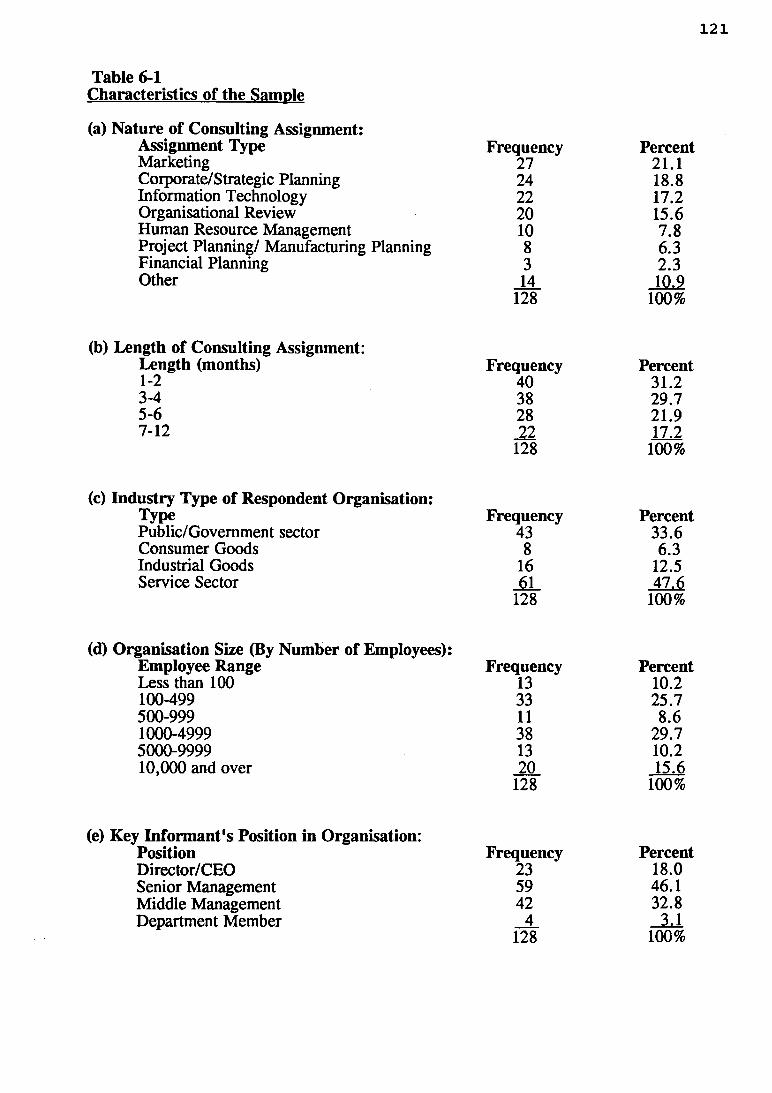
121
Table 6-1Characteristics of the Sample
(a) N ature of Consulting Assignment:Assignment Type Frequency PercentMarketing 27 21.1Corporate/Strategic Planning 24 18.8Information Technology 22 17.2Organisational Review 20 15.6Human Resource Management 10 7.8Project Planning/ Manufacturing Planning 8 6.3Financial Planning 3 2.3Other 14 10.9
128 100%
ngth of Consulting Assignment:Length (months) Frequency Percent1-2 40 31.23-4 38 29.75-6 28 21.97-12 22 17.2
128 100%
(c) Industry Type of Respondent Organisation:Type Frequency PercentPublic/Govemment sector 43 33.6Consumer Goods 8 6.3Industrial Goods 16 12.5Service Sector 61 47.6
128 100%
ganisation Size (By Num ber of Employees):Employee Range Frequency PercentLess than 100 13 10.2100-499 33 25.7500-999 11 8.61000-4999 38 29.75000-9999 13 10.210,000 and over 20 15.6
128 100%
y Inform ant's Position in Organisation:Position Frequency PercentDirector/CEO 23 18.0Senior Management 59 46.1Middle Management 42 32.8Department Member 4 3.1
128 100%
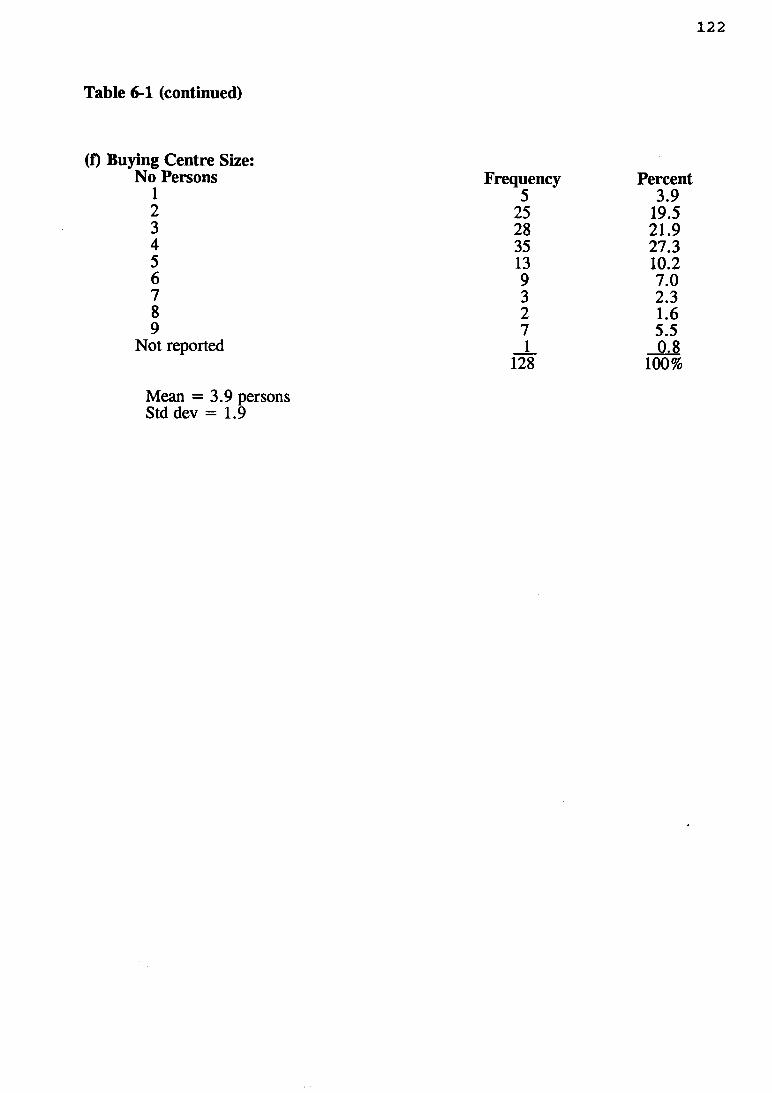
122
Table 6-1 (continued)
(f) Buying Centre Size:No Persons Frequency Percent
1 5 3.92 25 19.53 28 21.94 35 27.35 13 10.26 9 7.07 3 2.38 2 1.69 7 5.5
Not reported 1 0.8128 100%
Mean = 3.9 persons Std dev = 1.9
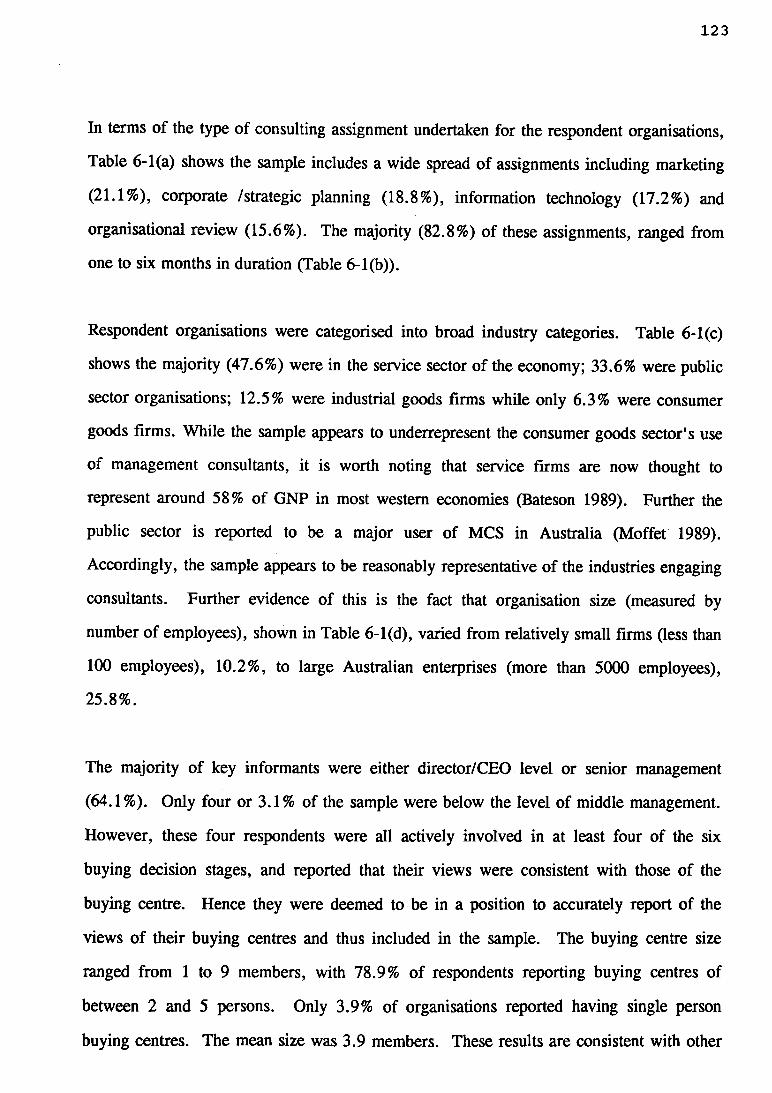
123
In terms of the type of consulting assignment undertaken for the respondent organisations,
Table 6-1(a) shows the sample includes a wide spread of assignments including marketing
(21.1%), corporate /strategic planning (18.8%), information technology (17.2%) and
organisational review (15.6%). The majority (82.8%) of these assignments, ranged from
one to six months in duration (Table 6-1(b)).
Respondent organisations were categorised into broad industry categories. Table 6-1(c)
shows the majority (47.6%) were in the service sector of the economy; 33.6% were public
sector organisations; 12.5% were industrial goods firms while only 6.3% were consumer
goods firms. While the sample appears to underrepresent the consumer goods sector's use
of management consultants, it is worth noting that service firms are now thought to
represent around 58% of GNP in most western economies (Bateson 1989). Further the
public sector is reported to be a major user of MCS in Australia (Moffet 1989).
Accordingly, the sample appears to be reasonably representative of the industries engaging
consultants. Further evidence of this is the fact that organisation size (measured by
number of employees), shown in Table 6-1(d), varied from relatively small firms (less than
100 employees), 10.2%, to large Australian enterprises (more than 5000 employees),
25.8%.
The majority of key informants were either director/CEO level or senior management
(64.1%). Only four or 3.1% of the sample were below the level of middle management.
However, these four respondents were all actively involved in at least four of the six
buying decision stages, and reported that their views were consistent with those of the
buying centre. Hence they were deemed to be in a position to accurately report of the
views of their buying centres and thus included in the sample. The buying centre size
ranged from 1 to 9 members, with 78.9% of respondents reporting buying centres of
between 2 and 5 persons. Only 3.9% of organisations reported having single person
buying centres. The mean size was 3.9 members. These results are consistent with other
124
recent studies of professional service providers (Dawes 1989; Dawes, Dowling and
Patterson 1992).
6.2 Validity and Reliability of Measures
6.2.1 Factor Analysis of Prior Attitudes.
Factor analysis permits an assessment of the convergent and discriminant validity of the
constructs. Each item represents an independent attempt to measure a particular construct.
Accordingly, all items (variables) of a scale should load strongly on one factor if they are
to satisfy the requirements of convergent validity, and load weakly on all other factors in
order to meet the requirements of discriminant validity (Kohli 1989).
As detailed in Chapter 5, no previous scholarly work could be located which had analysed
the dimensions of general attitudes towards professional services or MCS in particular.
Hence the twelve attitudinal statements used in the pre-purchase questionnaire were
generated from the qualitative stage and various secondary data sources as reported in
Chapter 5. Accordingly we had no, a priori, expectations as to the number or nature of
dimensions or factors that might emerge, other than both process (functional or "how" of
service delivery) and outcome (technical quality or "what") issues were embedded in the
statements. It therefore seemed likely that the emerging factors, while distinct, might not
be uncorrelated with one another. Hence a principal components factor analysis with
oblique rotation (rather than orthogonal rotation) was employed. The choice of a factor
solution used throughout this thesis was based on the following criteria:
. Factor interpretability, i.e., whether or not the variables matched the intuitive
conceptualisation of the hypothesised concept.
. The amount of variance explained by each factor. The rule of thumb relied upon
was that each factor should explain as much variance as an "average variable"
(Aaker and Day 1980).
125
. An examination of a factor's eigenvalue. The SPSS data analysis procedure
employed a cut-off of an eigenvalue of 1.0.
. An inspection of the scree plot.
. An examination of the communalities associated with each variable.
Table 6-2 depicts the factor solution for the prior attitude variables. Only factor loadings
of 0.30 or above are shown to aid the interpretability of the factors. One variable ("make
sure they thoroughly understand the problem before commencing an assignment") was
omitted from the final factor solution because it loaded across two factors. The final
solution resulted in a "clean" set of factors, i.e., each item was captured by one factor and
one factor alone. Three factors emerged which explain 55.6% of the total variance in the
data. An examination of the variables comprising each factor indicated that Factor 1 was
an Image dimension concerning clients' general perceptions of MCS. Factor 2 was
labelled a Process factor (Bitner 1990) as it captures various service issues (e.g., "keep the
client well informed"); and Factor 3 was best labelled a Reliability dimension.
Interestingly, these three factors approximate Gronroos (1990) primary dimensions for
evaluating a service.
The reliability of the three attitude measures was then assessed by computing the Cronbach
alpha coefficient, a measure of internal consistency. The alpha coefficient for each
measure is shown at the foot of Table 6-2. For the early stages of basic research,
Churchill (1979), Churchill and Peter (1984) and Nunnally (1978) claimed that reliabilities
of 0.50 and 0.60 suffice and that increasing reliabilities beyond 0.80 is wasteful.
Accordingly, 0.50 was set as the minimum acceptable for this research, although with one
exception (as detailed following in this section) all reliabilities well exceeded the 0.60
level.
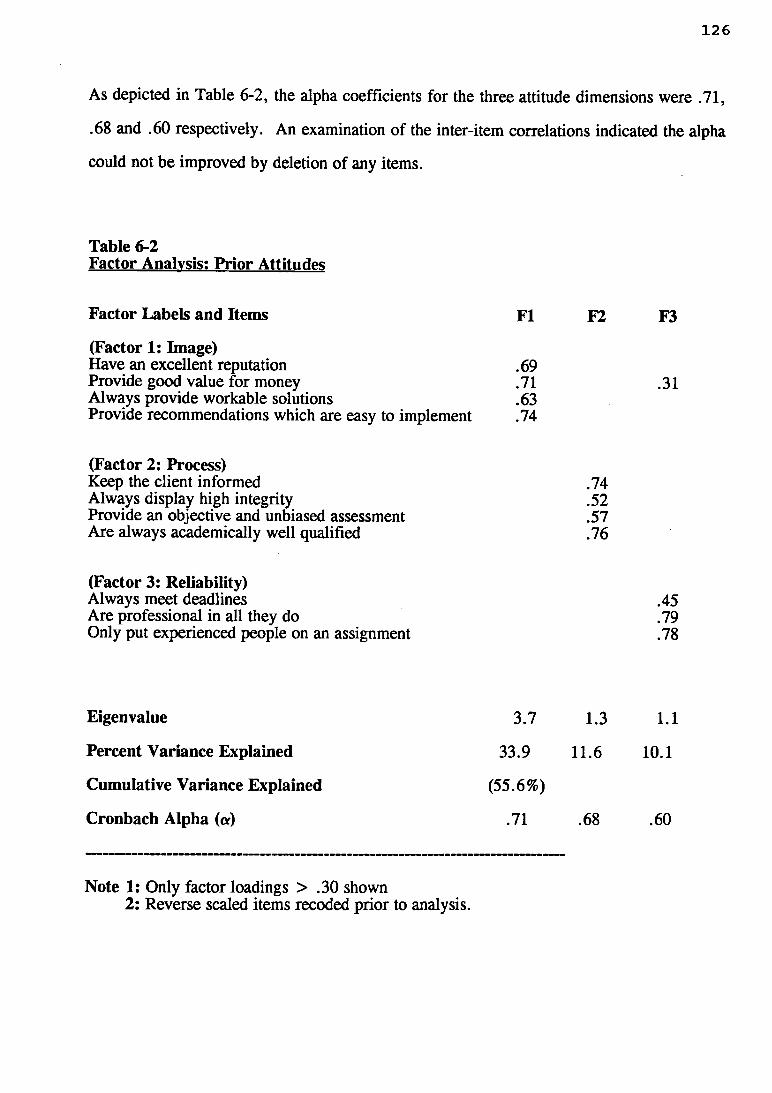
126
As depicted in Table 6-2, the alpha coefficients for the three attitude dimensions were .71,
.68 and .60 respectively. An examination of the inter-item correlations indicated the alpha
could not be improved by deletion of any items.
Table 6-2Factor Analysis: P rior Attitudes
Factor Labels and Items F I F2 F3
(Factor 1: Image)Have an excellent reputation .69Provide good value for money .71 .31Always provide workable solutions .63Provide recommendations which are easy to implement .74
(Factor 2: Process)Keep the client informed .74Always display high integrity .52Provide an objective and unbiased assessment .57Are always academically well qualified .76
(Factor 3: Reliability)Always meet deadlines .45Are professional in all they do .79Only put experienced people on an assignment .78
Eigenvalue 3.7 1.3 1.1
Percent Variance Explained 33.9 11.6 10.1
Cumulative Variance Explained (55.6%)
Cronbach Alpha (a) .71 .68 .60
Note 1: Only factor loadings > .30 shown2: Reverse scaled items recoded prior to analysis.
127
6.2.2 Factor Analysis of Purchase Situation (Novelty, Complexity, Importance) and
Individual-Level Variables (Uncertainty)
With the exception of the product (service) complexity measure which was assessed in a
separate scale in the Stage 1 questionnaire, the other measures were captured by seventeen
(17) Likert scale statements (Q5 of Stage 1 questionnaire). A principal components factor
analysis of the seventeen items (rotated orthogonally) resulted in some items loading on
several factors, implying that the factors might not be independent of one another. This
non-independence could also be argued on conceptual grounds (e.g., novelty or newness
probably breeds a degree of uncertainty). Consequently the data was subjected to oblique
rotation to allow for intercorrelations among the dimensions and to facilitate interpretation.
All reverse scaled variables were recoded prior to analysis. The subsequent analyses
resulted in two of the seventeen variables being dropped because they did not conceptually
fit with the factor.
The product complexity construct was measured in Q3 rather than Q5 of the Stage 1
questionnaire. Consequently it was factor analysed separately. The factor solutions are
shown in the following table (Table 6-3 (a) and (b)).
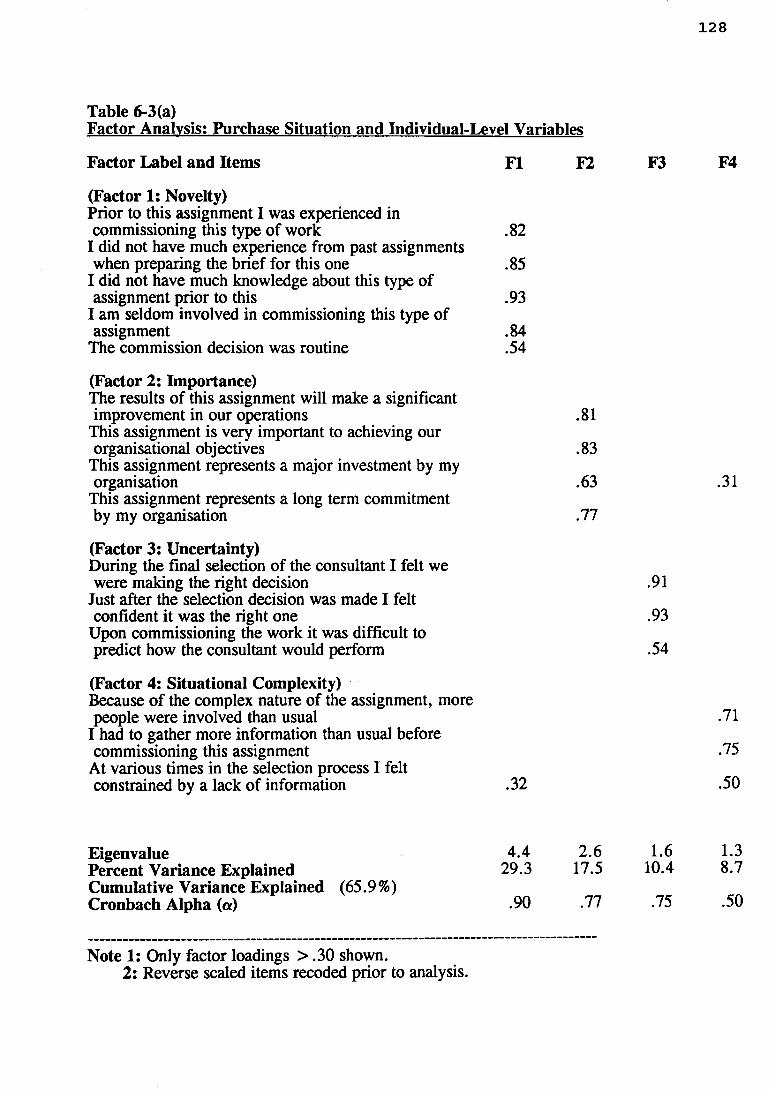
128
Table 6-3(a)Factor Analysis; Purchase Situation and Individual-Level Variables
Factor Label and Items FI F2 F3 F4
.82
.85
.93
.84
.54
(Factor 1: Novelty)Prior to this assignment I was experienced in commissioning this type of work
I did not have much experience from past assignments when preparing the brief for this one
I did not have much knowledge about this type of assignment prior to this
I am seldom involved in commissioning this type of assignment
The commission decision was routine
(Factor 2: Importance)The results of this assignment will make a significant improvement in our operations
This assignment is very important to achieving our organisational objectives
This assignment represents a major investment by my organisation
This assignment represents a long term commitment by my organisation
(Factor 3: Uncertainty)During the final selection of the consultant I felt we were making the right decision
Just after the selection decision was made I felt confident it was the right one
Upon commissioning the work it was difficult to predict how the consultant would perform
(Factor 4: Situational Complexity)Because of the complex nature of the assignment, more people were involved than usual
I had to gather more information than usual before commissioning this assignment
At various times in the selection process I felt constrained by a lack of information
EigenvaluePercent Variance Explained Cumulative Variance Explained (65.9%) Cronbach Alpha (a)
.81
.83
.63 .31
.77
.91
.93
.54
.71
.75
.32 .50
4.4 2.6 1.6 1.329.3 17.5 10.4 8.7
.90 .77 .75 .50
Note Is Only factor loadings > .30 shown.2: Reverse scaled items recoded prior to analysis.
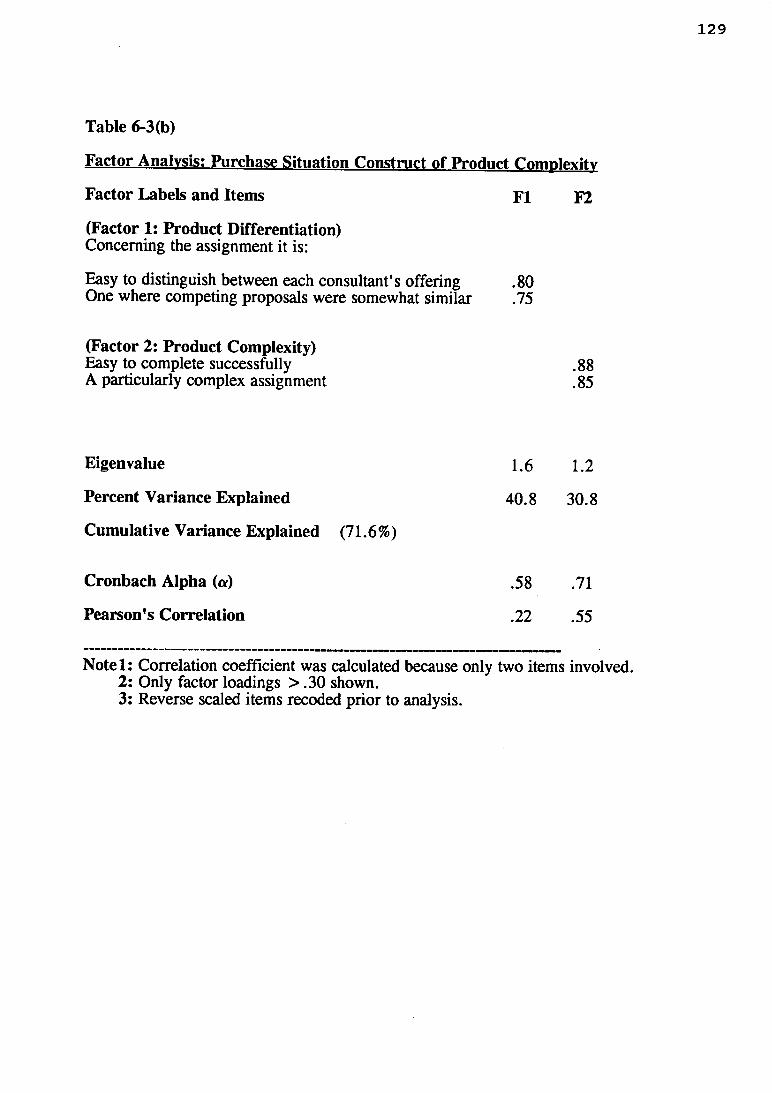
Factor Analysis: Purchase Situation Construct of Product Complexity
Table 6-3 (b)
Factor Labels and Items F I F2
(Factor 1: Product Differentiation)Concerning the assignment it is:
Easy to distinguish between each consultant's offering One where competing proposals were somewhat similar
.80
.75
(Factor 2: Product Complexity)Easy to complete successfully A particularly complex assignment
.88
.85
Eigenvalue 1.6 1.2
Percent Variance Explained 40.8 30.8
Cumulative Variance Explained (71.6%)
Cronbach Alpha (a) .58 .71
Pearson's Correlation .22 .55
N ote l: Correlation coefficient was calculated because only two items involved. 2: Only factor loadings > .30 shown.3: Reverse scaled items recoded prior to analysis.
130
Not surprisingly, the four factors to emerge were as expected, since the items were taken
from the OBB literature (and adapted to a MCS context). It will be noted from Table 6-
3(a) that the factors combined explain a credible 65.9% of the variance among the
variables. Further, with the exception of the Situation Complexity factor, the remaining
three dimensions each have quite high alpha values (Novelty 0.90; Importance 0.77; and
Uncertainty 0.75) demonstrating a high level of internal reliability among the items
comprising each factor. An individual-item analysis indicated that all items in each of the
factors should remain. However the Situation Complexity factor had a barely acceptable
alpha coefficient of 0.50, suggesting perhaps that the three measures are not capturing the
construct as well as they might. However because prior theory (refer to Chapter 4 for
development of hypothesis) strongly suggests this dimension might be important in
explaining expectations and perceived performance, it was retained as an antecedent
variable for the subsequent path analysis.
Referring to Table 6-3 (b), it will be noted that the two factors (Product Differentiation and
Product Complexity) explained 71.6% of the variance in the data. The Pearson correlation
for the two Product Complexity items was 0.55. Although the correlation coefficient
seems to be the preferred measure when only two items are involved (e.g., Bitner 1990),
some researchers have reported coefficient alpha (e.g., Ruekert and Churchill 1984). The
equivalent alpha for the two Product Complexity items is 0.71. Both statistics suggest the
two items do a better than reasonable job in capturing the domain of the construct
(Churchill 1979).
A priori, it was expected that the four items in Table 6-3(b) would measure Product
Complexity alone. However the foregoing analysis shows there are in fact two separate
factors (Product Differentiation and Product Complexity). As no hypotheses had been
developed concerning a Product Differentiation construct, it was not included in any
subsequent analysis.
131
The final antecedent construct, Stakeholding, was not required to be subjected to factor
analysis since it was operationalised as a multiplicative function of two single item
questions (Q4b and Q4c) in the Stage 1 questionnaire. The two single item questions
pertained to (a) how much responsibility the respondent had in choosing the consultancy;
and (b) how im portant the consulting assignment was to their own functional unit (or
department) within the organisation. Justification for the operationalisation of this measure
was put forth previously in Chapter 5.
6.2.3 Factor Analysis of Expectations, Performance and Inferred Disconfirmation
(Difference or Gap Scores)
In order to determine the dimensions that were contained within the twenty-six expectations
- performance items, and to assess the derived dimensions' (factors) convergent and
discriminant validity, factor analysis was employed. Three constructs could have been
used to determine the underlying dimensions of the twenty-six statements or items: pre
purchase expectations, post-purchase performance or the difference or gap scores (i.e.,
objective or inferred disconfirmation).
The CS/D literature to date has been more concerned with empirically testing the various
causal linkages leading to CS/D and behavioural intentions. Little effort has been made to
understand the dimensions of expectations or performance. In contrast the service quality
literature has placed a high priority and rightly so, on understanding these dimensions
(e.g., Brown and Swartz 1989; Grônroos 1990; Parasuraman, Zeithaml and Berry 1988).
Parasuraman, Zeithaml and Berry's (1988) seminal SERVQUAL work used the difference
or gap scores (performance minus expectations) data for factor analysis. No academic
literature could be found which reported the dimensions used in assessing business-to-
business professional services.
132
Nonetheless, it was anticipated that the dimensions for the current study would be
somewhat distinct (but encompass at least both outcome or "what", and process or "how"
dimensions). It was also expected, as Parasuraman, Zeithaml and Berry (1988) found, that
the dimensions might not be totally independent.
. Factor Analysis of Expectations Items
The first step was to test the appropriateness of the correlation matrix of the twenty-six
expectations items for factoring. Bartlett's test of specificity and the Kaiser-Meyer-Olkin
measure of sampling adequacy are recommended for this purpose (Stewart 1981). Both
tests indicated the data highly appropriate for factor analysis. The Kaiser-Meyer-Olkin
MSA coefficient was 0.85 and Bartlett's test rejected the null hypothesis that the
correlation matrix came from a population of variables that are independent (p < .000).
Next an iterative process similar to that used by Parasuraman, Zeithaml and Berry (1988),
was employed to arrive at the underlying structure (dimensions/factors) of the expectations
statements. Initially the variables were subjected to Principal Components factor analysis
then rotated orthogonally. However no clear factor pattern emerged. Several items had
high loadings on more than one factor, thereby implying that the factors might not be
independent of one another. Moreover, some degree of overlap among the dimensions was
expected. Therefore, the data was subjected to an oblique rotation to allow for
intercorrelation among the dimensions and to facilitate easy interpretation (Ruekert and
Churchill 1984). This resulted in a factor solution which was by and large, interpretable.
However, several items still loaded strongly across more than one factor. As a result,
these items were removed from the analysis in a procedure recommended by Kohli (1989),
Churchill (1979) and Ruekert and Churchill (1984), and the factor analysis re-run. This
step was repeated and resulted in six relatively clean factors; F I: Service, F2: Global,
F3: Industry Knowledge, F4: Outcome, F5: Relationship, and F6: Professionalism.
Together the factors accounted for 72.1% of the variance in the data.
133
Reliability analysis was then run on the items in each factor. An examination of the alpha
coefficients and the item-to-total correlations resulted in item 4 ("Only put highly
experienced and qualified personnel on the assignment") being dropped in order to
significantly improve the reliability of F5 (Relationship factor). The reliability analysis
confirmed the internal consistency of the items in each factor, with alpha coefficients
ranged from 0.71 to 0.96. These results are shown in Table 6-4, following.
A brief description of the individual dimensions is now given:
F I: Service factor (six items)
This captured items relating to dependability, responding promptly, reliability in
meeting deadlines and making sure the client's goals and aims were understood.
This factor explained 36.1% of the variance in the data. The Cronbach alpha
coefficient was 0.91. This dimension is akin to Parasuraman, Zeithaml and Berry's
(1988) responsiveness and empathy dimensions.
F2: Global (or International) (two items)
This factor contained two items relating to the consultant's use of their global or
international network and resources to come up with solutions. It appears this
factor is most likely unique to business-to-business services. It accounted for
11.0% of the variation in the data. This dimension has no counterpart in the
SERVQUAL instrument. For two item measures the Pearson's correlation (0.92) is
typically used in preference to the alpha coefficient (0.96) (Bitner 1980).
F3: Industry Knowledge (two items)
Qualitative interviews prior to questionnaire design and analysis of proprietary
studies and the literature on professional services, clearly indicated that
experience/knowledge of a given industry was almost an essential prerequisite to
win most assignments (Dawes, Dowling and Patterson 1992). This factor
accounted for 8.2% of the variation and the two items comprising it had r = .56 or
134
a = .71. This dimension has no apparent counterpart in the SERVQUAL study
and would appear to be applicable for business services.
F4: Outcome (four items)
This dimension relates to clients expectations of the results and outcome of the
consulting assignment (e.g., item 20: "Produce results which will enable us to
increase out organisation's effectiveness"). This result is akin to Parasuraman,
Zeithaml and Berry's (1988) reliability dimension. The alpha coefficient was 0.72.
F5: Relationship (two items)
This dimension captures the clients' expectation that the consultant will "Establish a
good rapport with staff during the assignment" (item 8) and "Develop a close
working relationship with our s ta ff (item 13). This dimension explained 5.5% of
the variation in the data. The two items had a Pearson's correlation of 0.65 (a =
0.80).
F6: Professionalism (five items)
This dimension explains clients' expectations that the consultant will behave in a
highly professional manner consistent with the image they project and the fees
charged. Typical items in this factor are item 14 ("Be thoroughly professional in all
they do"), item 16 ("Produce reports of the highest standard"), and item 18 ("Go
the extra mile if necessary to ensure we are satisfied at the end of the assignment").
This factor accounted for 4.9% of the variance. The Cronbach alpha for the five
items was 0.83. Again, this dimension has no direct counterpart among the
SERVQUAL dimensions and is likely to be unique to professional services (both
business-to-business and consumer).
The factor solutions and reliability analysis are shown, following, in Table 6-4.
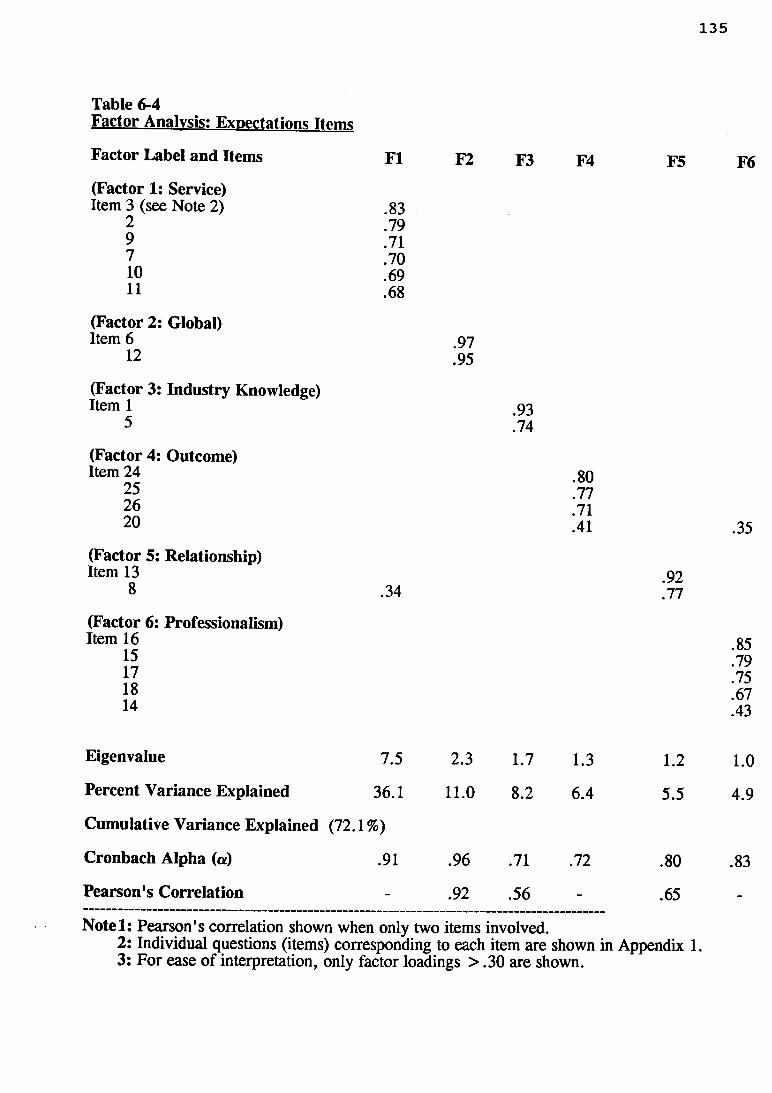
135
Table 6-4Factor Analysis: Expectations Items
Factor Label and Items F I
(Factor 1: Service)Item 3 (see Note 2) .83
2 .799 .717 .7010 .6911 .68
(Factor 2: Global)Item 6
12
(Factor 3: Industry Knowledge)Item 1
5
(Factor 4: Outcome)Item 24
2526 20
(Factor 5: Relationship)Item 13
8 .34
(Factor 6: Professionalism)Item 16
151718 14
F2 F3 F4
.97
.95
.93
.74
.80
.77
.71
.41
F5 F6
.35
.92
.77
.85
.79
.75
.67
.43
Eigenvalue 7.5 2.3 1.7 1.3 1.2 1.0
Percent Variance Explained 36.1 11.0 8.2 6.4 5.5 4.9
Cumulative Variance Explained (72.1%)
Cronbach Alpha (a) .91 .96 .71 .72 .80 .83
Pearson's Correlation _ .92 .56 .65
N ote l: Pearson's correlation shown when only two items involved.2: Individual questions (items) corresponding to each item are shown in Appendix 1. 3: For ease of interpretation, only factor loadings > .30 are shown.
. Factor Analysis of Performance Items
Firstly, the Kaiser-Meyer-Olkin measure of sampling adequacy and the Barlett test of
specificity indicated the performance data was highly amenable for factoring. Then a
similar iterative process to that adopted for determining the expectations dimensions, was
employed in analysing the performance items. This resulted in a five factor solution (as
opposed to six expectations factors) which is depicted in Appendix 2. The five factors to
emerge were F I: Relationship, F2: Global, F3: Industry Knowledge, F4: Service, and F5:
Professionalism. These same five factors emerged from the expectations item analysis,
although several of the individual items loaded on different factors. Interestingly, no
"Outcome" factor emerged from the analysis of the performance items, indicating perhaps
that the expectations that clients hold pre-purchase are somewhat different to the
dimensions they actually use, immediately post-purchase, to evaluate the consultant.
Most items loaded clearly on one factor, and one factor alone, thereby demonstrating
sound convergent and discriminant validity. One item however, item 18 ("Go the extra
mile, if necessary, to ensure we are satisfied at the end of the assignment") loaded
approximately equally across both the "Relationship" and "Professionalism" factors. It
was included in F5 (Professionalism) for consistency as this is where it clearly loaded in
the analysis of the expectations scores. Together the five factors accounted for 72.8% of
the variance in the data.
The reliability of the measures was assessed by examining the Cronbach alpha coefficient
and item-to-total correlations. The alpha coefficients ranged from 0.75 to 0.96 thus
indicating a high degree of internal consistency (i.e., the sample of items performs very
well in capturing the construct (Churchill 1979). The complete factor solution is shown in
Appendix 2.
137
. Factor Analysis of Difference Scores (Internal Disconfirmation)
A factor analysis of the difference or gap scores was not essential in this thesis as perceived
or subjective disconfirmation is measured separately as is typically the case in the CS/D
literature (e.g., Churchill and Surprenant 1982; Tse and Wilton 1988). However in the SQ
literature, it is the difference or gap scores which are utilised in determining the
dimensionality. It was therefore decided to factor analyse the scores to see whether or not
they confirmed the factors resulting from the expectations and performance item analysis.
However, an analysis of the correlation matrix, including the Kaiser-Meyer-Olkin measure
of sampling adequacy and the Bartlett test of specificity, indicated it was ill-conditioned for
factor analysis (Stewart 1981). This finding is consistent with recent research questioning
the use of difference scores to measure service quality. Carman (1990) has questioned the
psychometric properties of the difference scores, while Brown, Churchill and Peter (1992)
have shown that the calculation of the difference scores leads to three psychometric
problems, namely reliability, discriminant validity and variance restriction. Accordingly,
the difference scores for this study were not subjected to a factor analysis routine.
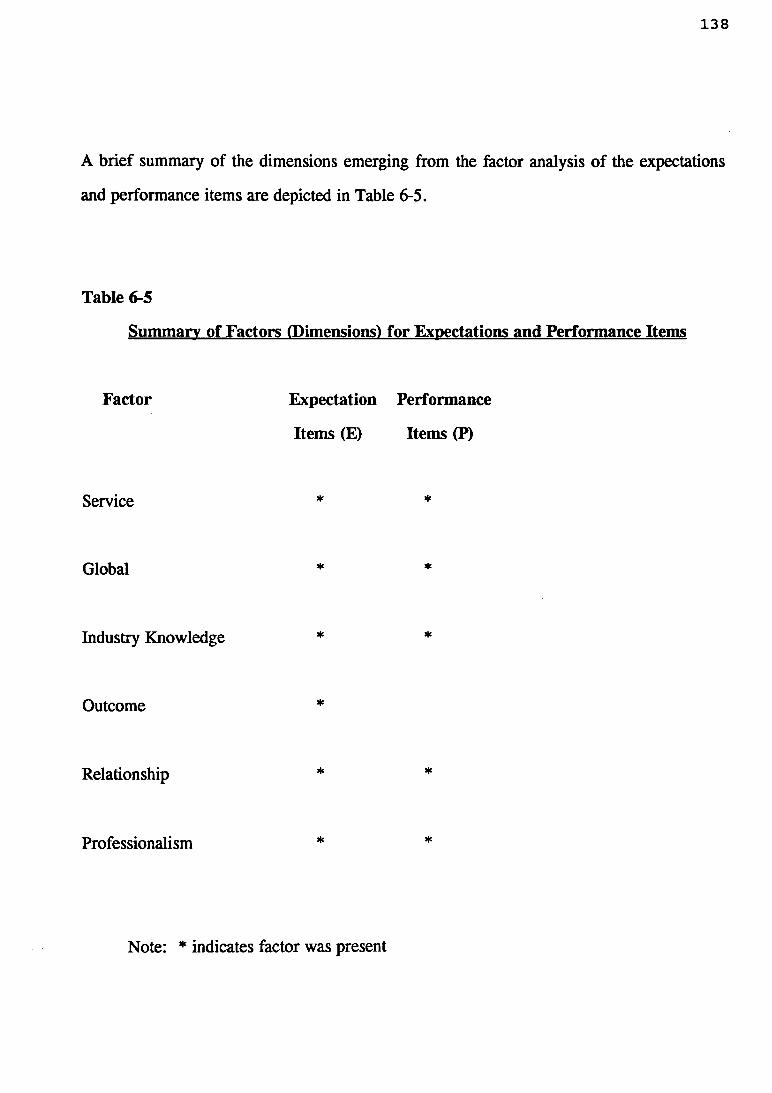
138
A brief summary of the dimensions emerging from the factor analysis of the expectations
and performance items are depicted in Table 6-5.
Table 6-5
Summary of Factors (Dimensions! for Expectations and Performance Items
Factor Expectation Performance
Items (E) Items (P)
Service * *
Global * *
Industry Knowledge * *
Outcome ♦
Relationship * *
Professionalism * *
Note: * indicates factor was present
139
6.2.4 Reliability Analysis of Key CS/D Paradigm Constructs
The key CS/D paradigm constructs of expectations, disconfirmation, fairness, satisfaction
and behavioural intentions were captured with a series of global-measure questions (the
expectations construct was also measured with a battery of twenty-six questions as
discussed in detail in the previous section). As discussed in Chapter 5 (Research
Methodology), these global measures were borrowed from the seminal CS/D literature
(e.g., Churchill and Surprenant 1982; Oliver and Swan 1989). The reliability of these
measures was assessed using the Cronbach alpha coefficient (Churchill 1979; Nunnally
1978). Table 6-6 reports the alpha coefficient as well as the item-to-total correlations.
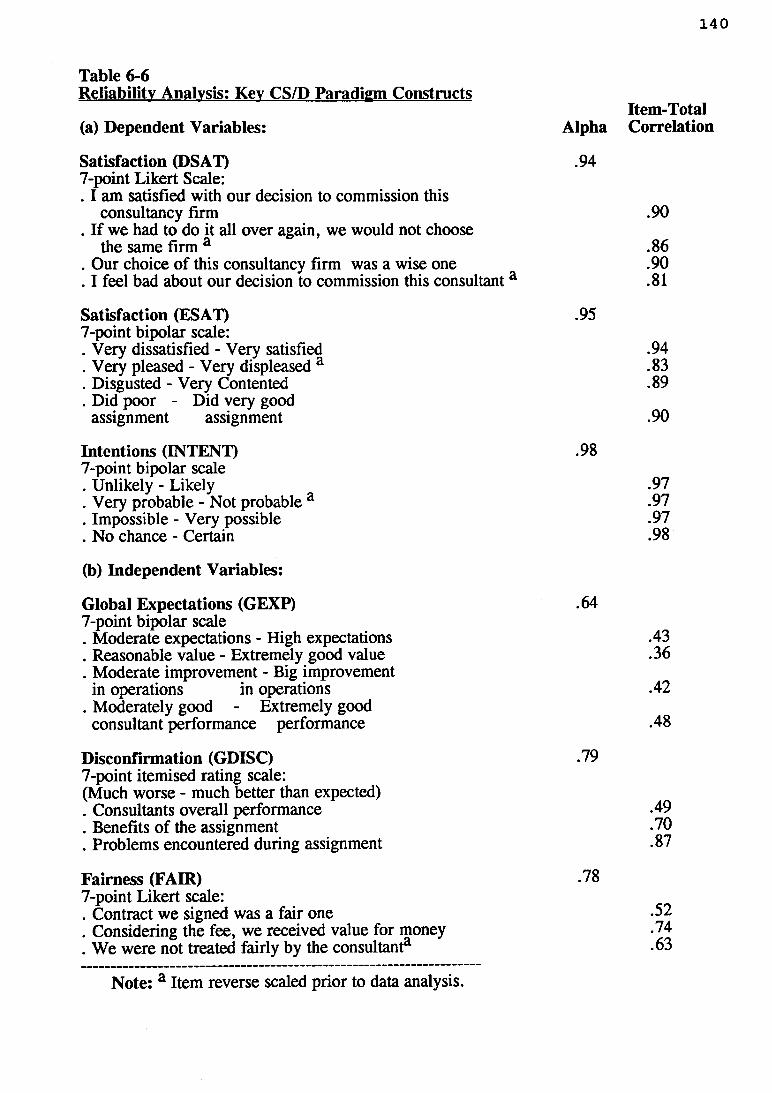
140
Table 6-6Reliability Analysis: Kev CS/D Paradigm Constructs
(a) Dependent Variables:
Satisfaction (DSAT)7-point Likert Scale:. I am satisfied with our decision to commission this
consultancy firm. If we had to do it all over again, we would not choose
the same firm a. Our choice of this consultancy firm was a wise one . I feel bad about our decision to commission this consultanta
Satisfaction (ESAT)7-point bipolar scale:. Very dissatisfied - Very satisfied . Very pleased - Very displeased a . Disgusted - Very Contented . Did poor - Did very good
assignment assignment
Intentions (INTENT)7-point bipolar scale . Unlikely - Likely . Very probable - Not probable a . Impossible - Very possible . No chance - Certain
(b) Independent Variables:
Global Expectations (GEXP)7-point bipolar scale. Moderate expectations - High expectations . Reasonable value - Extremely good value . Moderate improvement - Big improvement
in operations in operations. Moderately good - Extremely good
consultant performance performance
Disconfirmation (GDISC)7-point itemised rating scale:(Much worse - much better than expected). Consultants overall performance . Benefits of the assignment . Problems encountered during assignment
Fairness (FAIR)7-point Likert scale:. Contract we signed was a fair one . Considering the fee, we received value for money . We were not treated fairly by the consultant
Note: a Item reverse scaled prior to data analysis.
Item-Total Alpha Correlation
.94
.90
.86
.90
.81
.95
.94
.83
.89
.90
.98
.97
.97
.97
.98
.64
.43
.36
.42
.48
.79
.49
.70
.87
.78
.52
.74
.63
141
As Table 6-6 shows, all constructs far exceed the acceptable alpha standard of 0.50 for the
early stages of basic research (Churchill 1979), and all but one well exceed the generally
accepted level of 0.70 for basic research (Nunnally 1978). The global expectations
measure (GEXP - 4 items) could not be improved by deletion of any items. Its alpha of
0.64 is considered marginally acceptable. Accordingly it was retained for analysis.
The preceding factor and reliability analysis resulted in multiple-item measures of the
exogenous, endogenous and dependent variables being computed, for input into a
correlation matrix and the subsequent path analysis. These measures are shown in the
comprehensive correlation matrix in Appendix 3. Each multiple-item construct represents
a summed score of its component variables, then divided by the number of variables to
compute an average score for the construct. This approach is typically used when
employing multiple-item constructs (e.g., Churchill and Surprenant 1982; Cronin and
Taylor 1992; Swan and Trawick 1980). To assist the reader, a brief description and
accompanying labels for each construct follows.
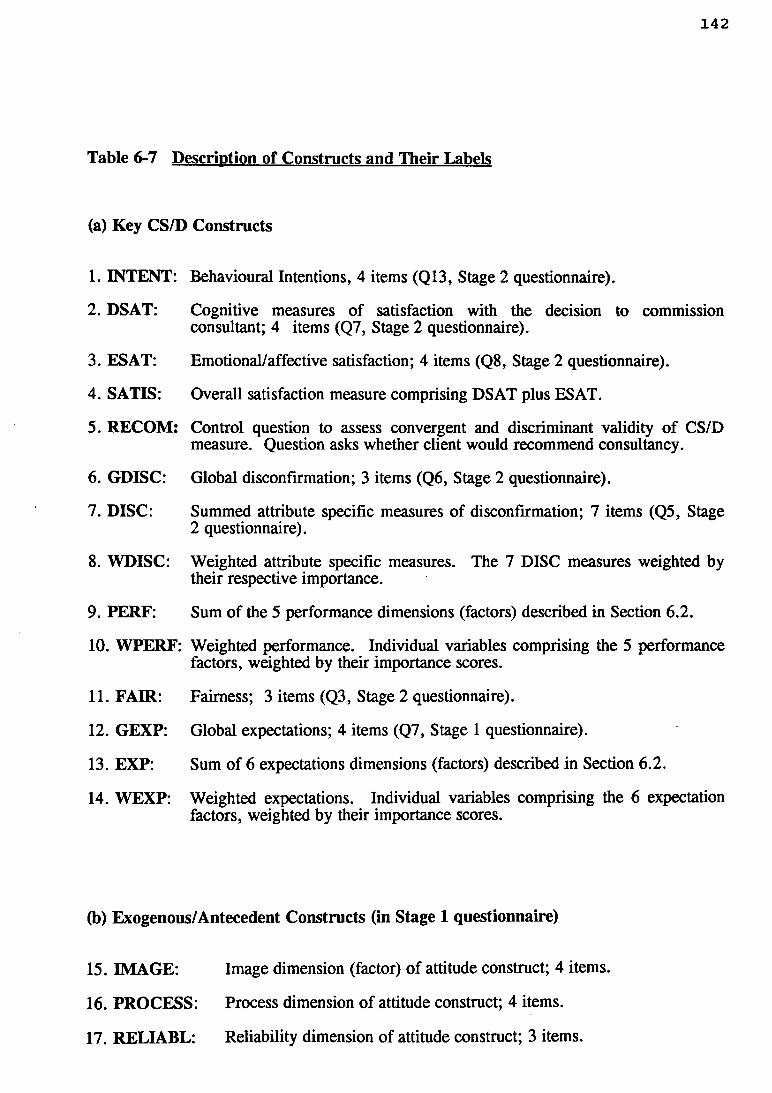
Table 6-7 Description of Constructs and Their Labels
(a) Key CS/D Constructs
1. INTENT: Behavioural Intentions, 4 items (Q13, Stage 2 questionnaire).
2. DSAT: Cognitive measures of satisfaction with the decision to commissionconsultant; 4 items (Q7, Stage 2 questionnaire).
3. ES AT: Emotional/affective satisfaction; 4 items (Q8, Stage 2 questionnaire).
4. SATIS: Overall satisfaction measure comprising DSAT plus ES AT.
5. RECOM : Control question to assess convergent and discriminant validity of CS/Dmeasure. Question asks whether client would recommend consultancy.
6. GDISC: Global disconfirmation; 3 items (Q6, Stage 2 questionnaire).
7. DISC: Summed attribute specific measures of disconfirmation; 7 items (Q5, Stage 2 questionnaire).
8. WDISC: Weighted attribute specific measures. The 7 DISC measures weighted by their respective importance.
9. PERF. Sum of the 5 performance dimensions (factors) described in Section 6.2.
10. W PERF: Weighted performance. Individual variables comprising the 5 performance factors, weighted by their importance scores.
11. FAIR: Fairness; 3 items (Q3, Stage 2 questionnaire).
12. GEXP: Global expectations; 4 items (Q7, Stage 1 questionnaire).
13. EXP: Sum of 6 expectations dimensions (factors) described in Section 6.2.
14. WEXP: Weighted expectations. Individual variables comprising the 6 expectation factors, weighted by their importance scores.
(b) Exogenous/Antecedent Constructs (in Stage 1 questionnaire)
15. IMAGE: Image dimension (factor) of attitude construct; 4 items.
16. PROCESS: Process dimension of attitude construct; 4 items.
17. RELIABL: Reliability dimension of attitude construct; 3 items.
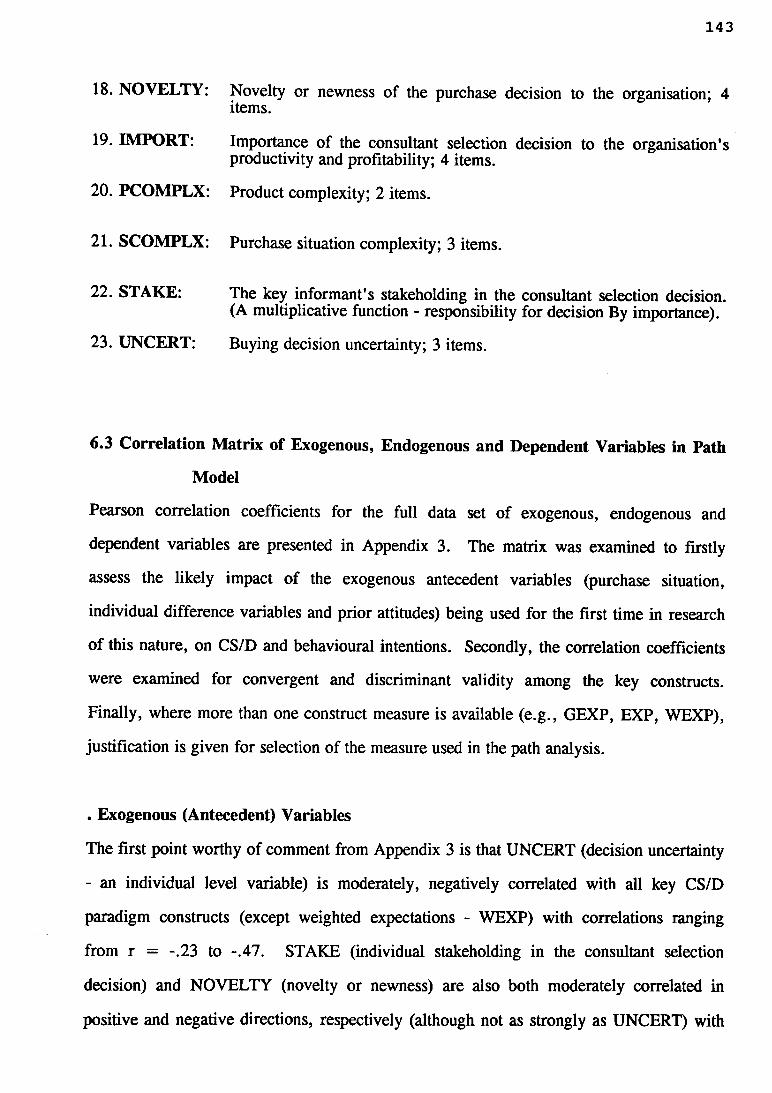
143
18. NOVELTY: Novelty or newness of the purchase decision to the organisation; 4 items.
19. IM PORT: Importance of the consultant selection decision to the organisation's productivity and profitability; 4 items.
20. PCOMPLX: Product complexity; 2 items.
21. SCOMPLX: Purchase situation complexity; 3 items.
22. STAKE: The key informant's stakeholding in the consultant selection decision. (A multiplicative function - responsibility for decision By importance).
23. UNCERT: Buying decision uncertainty; 3 items.
6.3 Correlation M atrix of Exogenous, Endogenous and Dependent Variables in Path
Model
Pearson correlation coefficients for the full data set of exogenous, endogenous and
dependent variables are presented in Appendix 3. The matrix was examined to firstly
assess the likely impact of the exogenous antecedent variables (purchase situation,
individual difference variables and prior attitudes) being used for the first time in research
of this nature, on CS/D and behavioural intentions. Secondly, the correlation coefficients
were examined for convergent and discriminant validity among the key constructs.
Finally, where more than one construct measure is available (e.g., GEXP, EXP, WEXP),
justification is given for selection of the measure used in the path analysis.
. Exogenous (Antecedent) Variables
The first point worthy of comment from Appendix 3 is that UNCERT (decision uncertainty
- an individual level variable) is moderately, negatively correlated with all key CS/D
paradigm constructs (except weighted expectations - WEXP) with correlations ranging
from r = -.23 to -.47. STAKE (individual stakeholding in the consultant selection
decision) and NOVELTY (novelty or newness) are also both moderately correlated in
positive and negative directions, respectively (although not as strongly as UNCERT) with
144
most CS/D paradigm constructs except the expectations measures (GEXP, EXP and
WEXP). All three antecedents (UNCERT, STAKE and NOVELTY) are particularly
strongly associated with INTENT (behaviour intentions), DSAT, ESAT and SATIS
(measures of satisfaction) and GDISC (global measure of disconfirmation). Interestingly
however, only UNCERT was hypothesised (refer Figure 4-1(a)) to have any direct impact
on CS/D. Otherwise these three antecedents were, a priori, not anticipated to directly
impact on disconfirmation, CS/D or behavioural intentions.
IMPORT (the importance of the consultant selection decision to the organisation) was
highly associated with GDISC (r = .57) but manifested only minor correlations with other
key constructs. The other observation of note is that the three attitude dimensions
(IMAGE, PROCESS, RELIABL) were not statistically significantly correlated with any of
the key CS/D paradigm constructs (i.e., satisfaction, expectations, performance or
disconfirmation). This finding is surprising and inconsistent with prior predictions in this
research.
. Convergent and Discriminant Validity
That portion of the correlation matrix in Appendix 3 that relates only to the key constructs
in the CS/D disconfirmation paradigm are reproduced here to aid discussion of issues
concerning validity. The patterns in the data in Table 6-8 indicate sound convergent and
discriminant validity. That is, measures of the same construct are, in nearly all cases,
more highly correlated (and statistically significant) with each other, than with measures
assessing different constructs. For example, the three satisfaction measures (DSAT, ESAT
and SATIS), all correlate above 0.90 with each other, which is higher than their
correlations with any other construct. Furthermore, a control question - RECOM ("Would
you recommend this consultancy firm to a colleague in another company with a similar
problem?") was included in this study to assess the validity of the key dependent variable -
satisfaction. This variable is closely linked, but not identical, to the satisfaction construct.
Therefore it was expected to correlate more heavily with the satisfaction measures than

145
with other constructs. An inspection of Appendix 3 confirmed this to be the case.
RECOM correlates r = .91 with SATIS, but only r = .82, .80 and .31, with GDISC,
PERF AND GEXP, respectively.
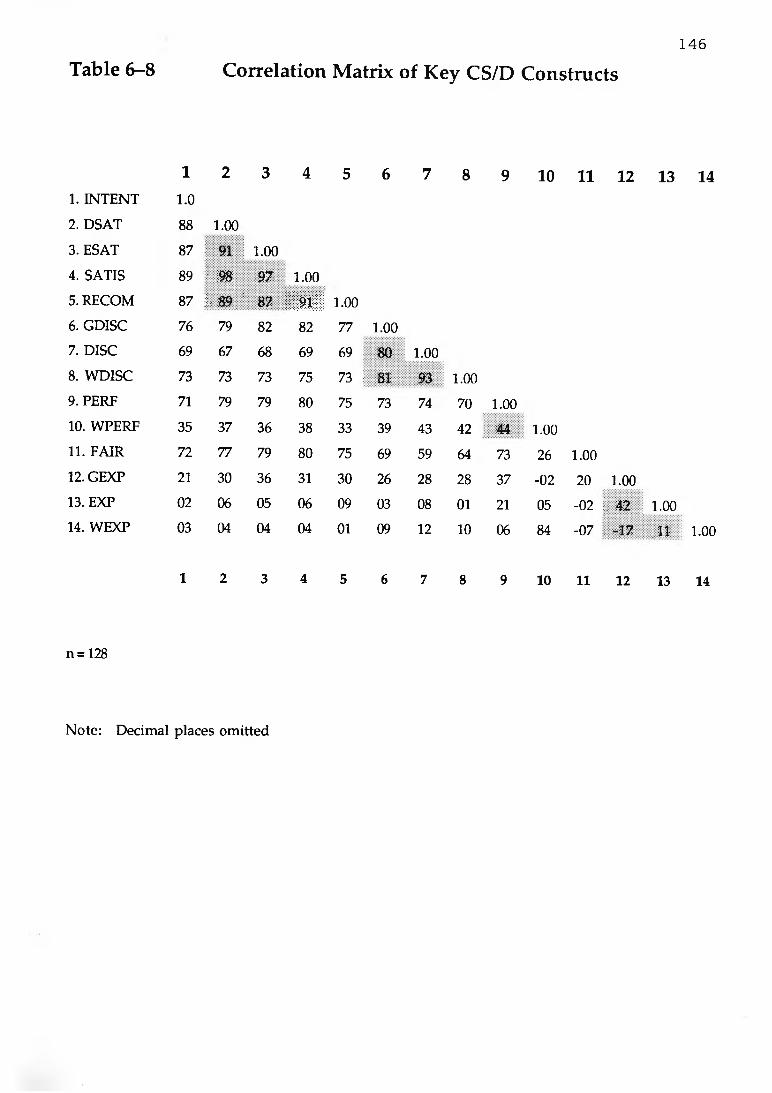
146
Table 6-8 Correlation Matrix of Key CS/D Constructs
1 2 3 4 5 6 7 8 9 10 11 12 13 141. INTENT 1.02. DSAT 88 1.00
3. ESAT 87 ! 91 1.00
4. SATIS 89 : 98 • •97 1.00
5. RECOM 87 I: , .8 9 . : 87 Bill! l.oo6. GDISC 76 79 82 82 77 TOO
7. DISC 69 67 68 69 69 80 IrPP8. WDISC 73 73 73 75 73 : 81 93 1.00
9. PERF 71 79 79 80 75 73 74 70 TOO
10. WPERF 35 37 36 38 33 39 43 42 ! 44 1.00
11. FAIR 72 77 79 80 75 69 59 64 73 26 1.00
12. GEXP 21 30 36 31 30 26 28 28 37 -02 20 1.00
13. EXP 02 06 05 06 09 03 08 01 21 05 -02 j: 42 1.00
14. WEXP 03 04 04 04 01 09 12 10 06 84 -07 i -17 .11 1.00
1 2 3 4 5 6 7 8 9 10 11 12 13 14
n = 128
N ote: D ecim al p laces om itted
147
The three disconfirmation measures (GDISC, DISC and WDISC) all correlate more highly
with each other than with different constructs. Concerning the "performance" measures,
the twenty-one multi-attribute items were each weighted by their respective importance
scores. The correlation between the sum of the unweighted attributes (PERF) and
weighted ones (WPERF) was only 0.44. The correlation between PERF and INTENT,
SATIS and GDISC ranged from r = .70 to .80, whereas WPERF correlated within a range
of only r = .35 to .39. Theory and prior research findings (as detailed in Chapter 3 -
literature review) strongly suggest performance, (especially in high involvement purchase
situations) should highly correlate with both disconfirmation and CS/D. It thus appears
that weighting the individual performance items by their respective self-reported
importance scores (a procedure suggested by Czepiel and Rosenberg (1977), and Swan and
Combs (1976)) does not enhance our understanding of the various complex relationships
involving the role of perceived performance. The problem may be due to the fact that the
performance items (a post-purchase construct) were weighted by importance scores
measured pre-purchase i.e ., at the point of commissioning the assignment. It is possible
that during the course of the consulting assignment, respondents' perceptions of the relative
worth or importance of various attributes has altered. It would thus seem necessary to
measure importance weights post-purchase if it is intended to weight individual
performance attributes. This was not done in this study because of the already onerous
burden placed on respondents by completing two questionnaires.
The weighted expectations measure (WEXP) also does not correlate well with the other
expectations measures (GEXP and EXP), again suggesting employing self-report
importance weights is of dubious value, at least in this study. However, the global
measure of expectations (GEXP) correlates more highly (r = .42) with the unweighted
expectations measure (EXP) than it does with any other construct.
148
. Selection of M easures for Use in Path Analytic Model of CS/D Form ation.
Measurement theory suggests that multi-item measures are typically better than single-item
measures (Churchill 1979, Nunnally 1978). Accordingly SATIS (i.e., DSAT plus ESAT)
was selected. It correlates 0.98 and 0.97 with DSAT and ESAT respectively. GDISC
(sum of four items) is more in line with disconfirmation theory and past research findings
in that it highly associated with SATIS. It is selected because it correlates marginally
higher with SATIS than does DISC or WDISC (although it appears that either of the three
measures is appropriate).
As discussed in the preceding section, the unweighted PERF (sum of multi-attribute items)
is preferred. The global expectations measure (sum of 4 global rather than attribute
specific items) was chosen for reasons outlined previously. A further point of interest
when examining Table 6-8 is that all three expectations measures have positive coefficients
with the three disconfirmation measures. Theory and prior research (e.g., Churchill and
Surprenant 1982; Patterson 1993) suggest this relationship should be negative. In other
words, the higher ones expectations, the lower must, by definition, be disconfirmation for
a given level of performance. It is possible that expectations (measured pre-purchase) have
shifted downwards during the course of the consulting assignment. Tse, Nicosia and
Wilton (1990) have suggested the need to monitor shifts in expectations and other
constructs over time. Patterson, Romm and Hill (1992) in a qualitative study of higher
education services, found preliminary evidence to support the notion that expectations do
indeed shift over time, especially for continuous services or those where there is an
extended "consumption" period.
149
CHAPTER 7: RESULTS AND HYPOTHESES TESTING
The purpose of this Chapter is to present the findings of the study, as they relate to the
hypotheses enunciated in Chapter 4. This chapter is divided into two parts. The first
presents the results of multiple regression analyses which form the basis of the path model
shown in Figures 7-1(a) and (b) on pages 158-159. The second section explicitly reports
the testing of the twenty-three research hypotheses.
7.1 Recursive Path Analysis
Given the potential existence of a set of direct and indirect relationships in the theoretical
model presented earlier, recursive path analysis was deemed to be an appropriate analytic
procedure for examining the complex process nature of CS/D formation. Path analysis
facilitates the interpretation of a set of linear relationships among a structured set of
variables. By postulating a causal ordering of the various antecedent variables in the
model, it is possible to empirically test this causal ordering. The number and magnitude of
the statistically significant relationships (termed "path coefficients") determine whether the
a priori causal ordering is justified (Deshpande and Zaltman 1982).
7.1.1 Regression Analysis
The first step involved performing a series of ordinary least squares regressions using each
of the five key endogenous constructs (INTENT, SATIS, GDISC, PERF and GEXP) in
turn, as the dependent variable and the hypothesised antecedent variables (as per the
theoretical model, Figures 4-1(a) and (b)) as the explanatory or predictor variables. Then
following the recommendations of Duncan (1975) and Heise (1969), each model was
"trimmed" by deleting causal linkages found to have statistically insignificant (i.e., zero)
path coefficients, and then re-running the model to arrive at the most parsimonious or
"trimmed" model. Detailed results of these series of regression models which underpin the
derived causal path model, are depicted in Tables 7-1(a) through 7-5(b). Both the full
model (i.e., including non-significant explanatory or independent variables) and the
150
accompanying "trimmed" models are shown. A summary table encapsulating the key
results of the five "trimmed" regression models is shown in Table 7-6.
In accord with procedures advocated by Asher (1976) for path analysis, all input variables
were standardised. It will be noted from Tables 7-l(a) through 7-5(b), that all regression
models were highly significant (p < .000). The coefficient of determination (R2) ranged
from 0.25 for the performance (PERF) construct to 0.84 for CS/D (SATIS). The R2 for
behavioural intentions (INTENT) was 0.81. Thus the two key endogenous variables in this
study, SATIS and INTENT, have 84% and 81% of their variance explained, respectively,
by the combined impact of their explanatory variables. The coefficients for the statistically
significant explanatory variables were shown to be robust in that they (i.e., the beta
coefficients and the accompanying t statistic) only varied marginally, if at all, upon deleting
non-significant variables and re-estimating the models.
Steps were taken to ensure that normal regression assumptions were not violated.
Scatterplots of the explanatory variables with the dependent variables did not indicate any
non-linear patterns. Further, an inspection of a histogram of residuals and a plot of the
cumulative standardised residuals confirmed the normality of the error term distributions.
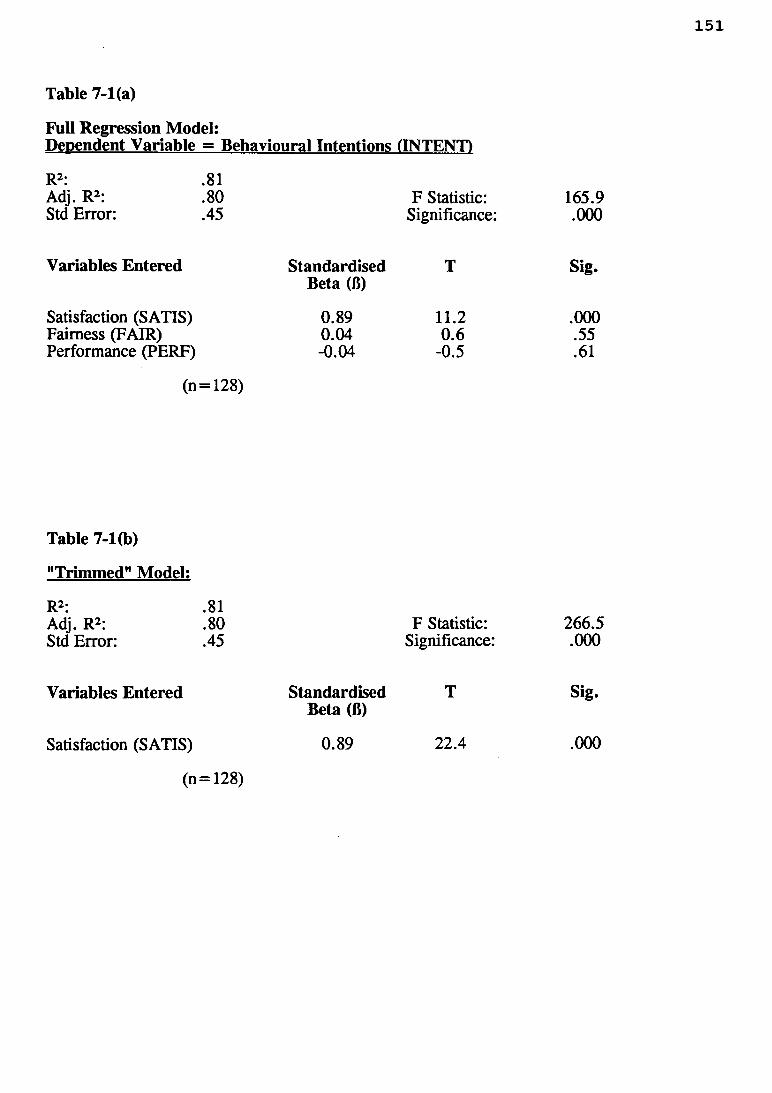
151
Full Regression Model:Dependent V ariable = Behavioural Intentions (INTENT)
Table 7-l(a)
R2: .81 Adj. R2: .80 F Statistic: 165.9Std Error: .45 Significance: .000
Variables E ntered Standardised T Sig.Beta (ß)
Satisfaction (SATIS) 0.89 11.2 .000Fairness (FAIR) 0.04 0.6 .55Performance (PERF) -0.04 -0.5 .61
(n = 128)
Table 7-l(b)
"Trim m ed” M odel:
R2:Adj. R2: Std Error:
.81
.80
.45F Statistic:
Significance:266.5.000
Variables E ntered Standardised Beta (fi)
T Sig.
Satisfaction (SATIS) 0.89 22.4 .000
(n=128)
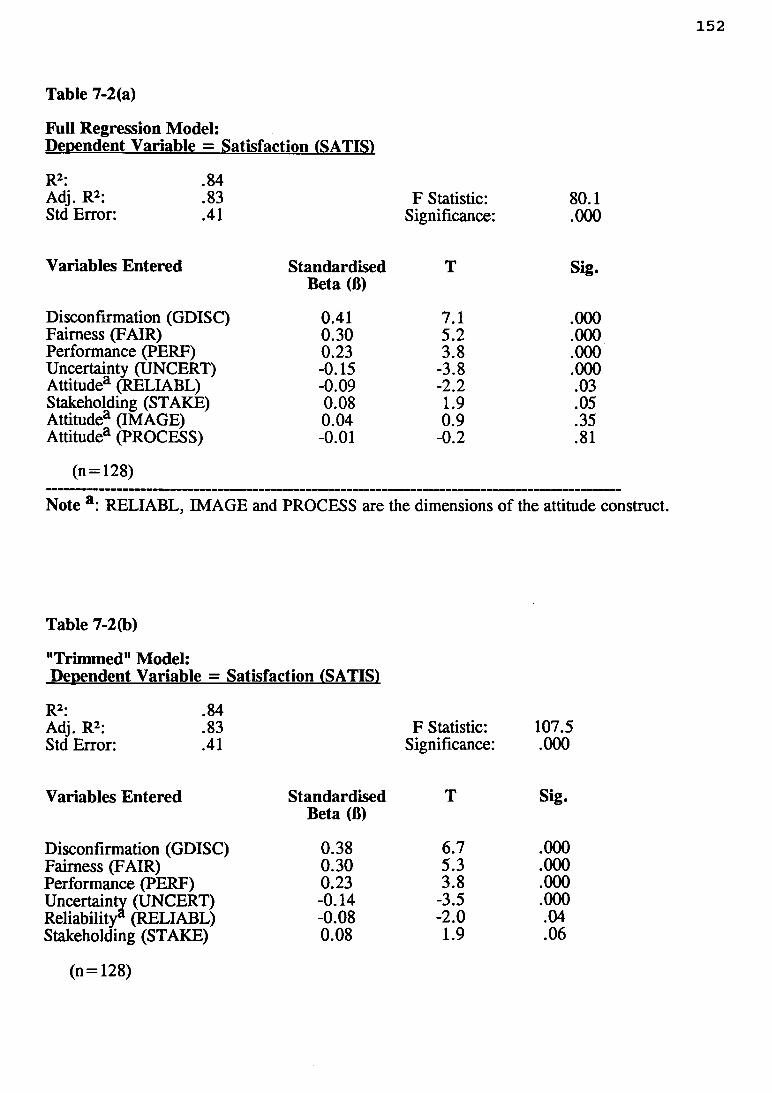
152
Full Regression M odel:Dependent Variable = Satisfaction (SATIS)
R2: .84
Table 7-2(a)
Adj. R2: .83 F Statistic: 80.1Std Error: .41 Significance: .000
Variables E ntered Standardised T Sig.Beta (fi)
Disconfirmation (GDISC) 0.41 7.1 .000Fairness (FAIR) 0.30 5.2 .000Performance (PERF) 0.23 3.8 .000Uncertainty (UNCERT) -0.15 -3.8 .000Attitude3 (RELIABL) -0.09 -2.2 .03Stakeholding (STAKE) 0.08 1.9 .05Attitude3 (IMAGE) 0.04 0.9 .35Attitude3 (PROCESS) -0.01 -0.2 .81
(n=128)
Note a : RELIABL, IMAGE and PROCESS are the dimensions of the attitude construct.
Table 7-2(b)
"Trimmed" Model:Dependent V ariable = Satisfaction (SATIS)
R2: .84Adj. R2: .83 F Statistic: 107.5Std Error: .41 Significance: .000
Variables E ntered Standardised T Sig.Beta (ß)
Disconfirmation (GDISC) 0.38 6.7 .000Fairness (FAIR) 0.30 5.3 .000Performance (PERF) 0.23 3.8 .000Uncertainty (UNCERT) -0.14 -3.5 .000Reliability* (RELIABL) -0.08 -2.0 .04Stakeholding (STAKE) 0.08 1.9 .06
(n=128)
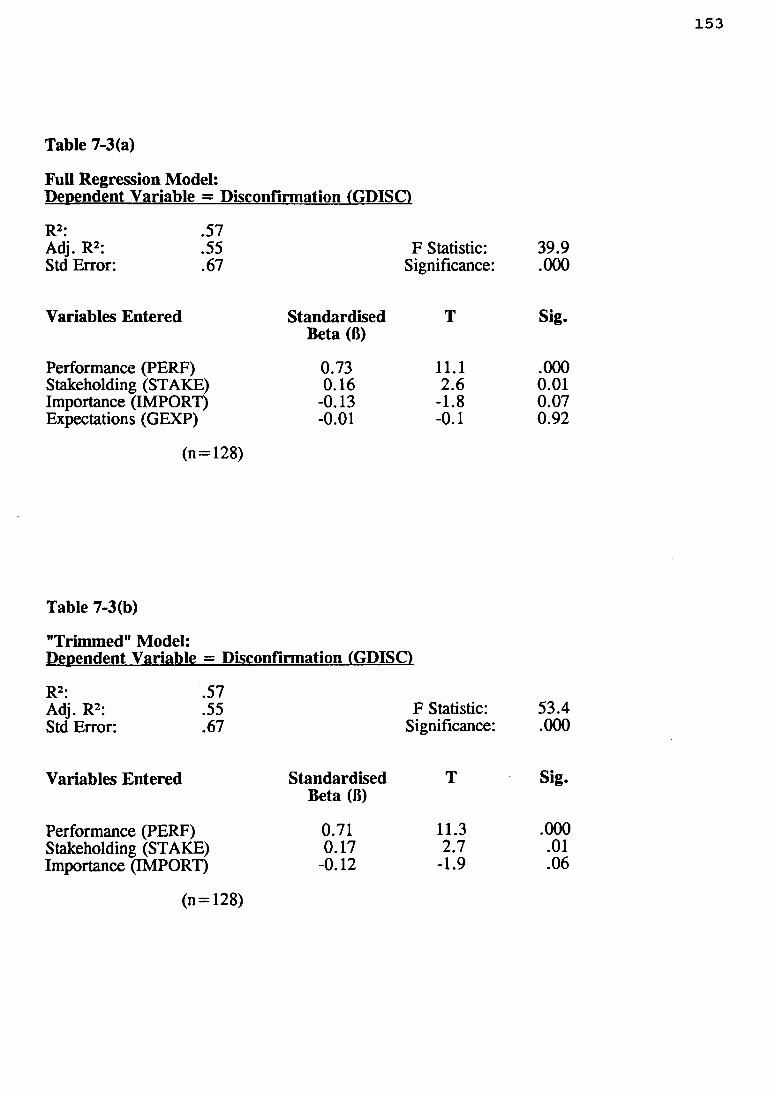
153
Table 7-3(a)
Full Regression M odel:Dependent V ariable = Disconfirmation (GDISC)
R2: .57Adj. R2: .55 F Statistic: 39.9Std Error: .67 Significance: .000
Variables E ntered Standardised T Sig.Beta (ß)
Performance (PERF) 0.73 11.1 .000Stakeholding (STAKE) 0.16 2.6 0.01Importance (IMPORT) -0.13 -1.8 0.07Expectations (GEXP) -0.01 - 0.1 0.92
(n=128)
Table 7-3(b)
"Trim m ed” Model:Dependent V ariable = Disconfirmation (GDISC)
R2: .57Adj. R2: .55 F Statistic: 53.4Std Error: .67 Significance: .000
Variables E ntered Standardised T Sig.Beta (ß)
Performance (PERF) 0.71 11.3 .000Stakeholding (STAKE) 0.17 2.7 .01Importance (IMPORT) -0.12 -1.9 .06
(n=128)
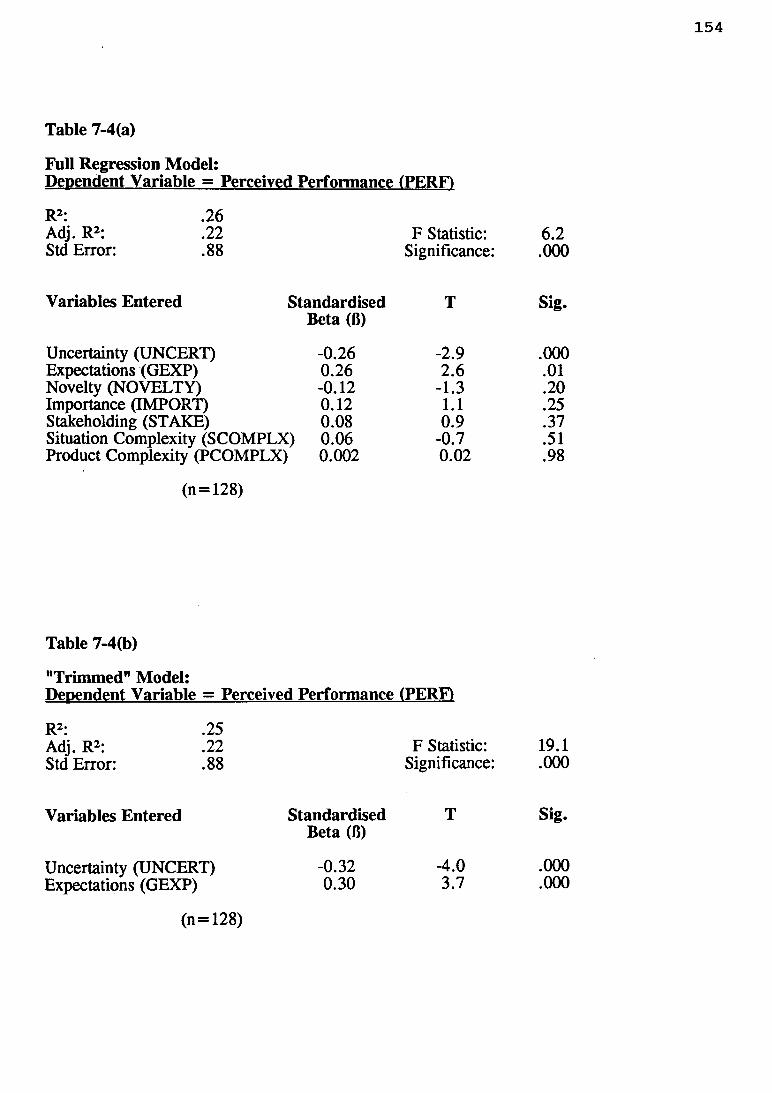
Table 7-4(a)
Full Regression M odel:Dependent V ariable = Perceived Perform ance (PERF)
R2: .26Adj. R2: .22 F Statistic:Std Error: .88 Significance:
Variables E ntered Standardised TBeta (ß)
Uncertainty (UNCERT) -0.26 -2.9Expectations (GEXP) 0.26 2.6Novelty (NOVELTY) -0.12 -1.3Importance (IMPORT) 0.12 1.1Stakeholding (STAKE) 0.08 0.9Situation Complexity (SCOMPLX) 0.06 -0.7Product Complexity (PCOMPLX) 0.002 0.02
(n=128)
Table 7-4(b)
"Trimmed" M odel:Dependent V ariable = Perceived Perform ance (PERF)
R2: .25Adj. R2: .22 F Statistic:Std Error: .88 Significance:
Variables E ntered Standardised TBeta (ß)
Uncertainty (UNCERT) -0.32 -4.0Expectations (GEXP) 0.30 3.7
(n=128)
6.2.000
Sig.
.000.01.20.25.37.51.98
19.1.000
Sig.
.000
.000
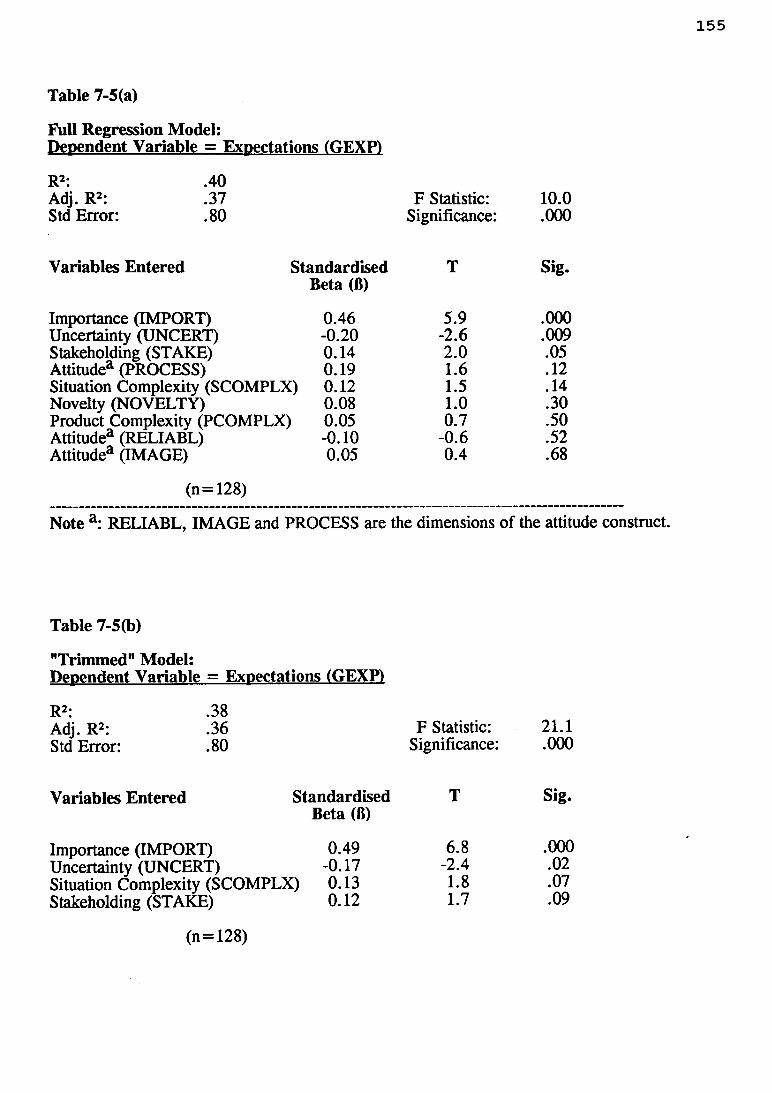
155
Table 7-5 (a)
Full Regression Model:Dependent Variable = Expectations (GEXP)
R2: .40Adj. R2: .37 F Statistic: 10.0Std Error: .80 Significance: .000
Variables E ntered Standardised T Sig.Beta (ß)
Importance (IMPORT) 0.46 5.9 .000Uncertainty (UNCERT) -0.20 -2.6 .009Stakeholding (STAKE) 0.14 2.0 .05Attitudea (PROCESS) 0.19 1.6 .12Situation Complexity (SCOMPLX) 0.12 1.5 .14Novelty (NOVELTY) 0.08 1.0 .30Product Complexity (PCOMPLX) 0.05 0.7 .50Attitudea (RELIABL) -0.10 -0.6 .52Attitudea (IMAGE) 0.05 0.4 .68
(n=128)
Note a : RELIABL, IMAGE and PROCESS are the dimensions of the attitude construct.
Table 7-5(b)
"Trimmed" Model:Dependent Variable = Expectations (GEXP)
R2: .38Adj. R2: .36 F Statistic:Std Error: .80 Significance:
Variables Entered Standardised TBeta (ß)
Importance (IMPORT) 0.49 6.8Uncertainty (UNCERT) -0.17 -2.4Situation Complexity (SCOMPLX) 0.13 1.8Stakeholding (STAKE) 0.12 1.7
21.1.000
Sig.
.000.02.07.09
(n = 128)
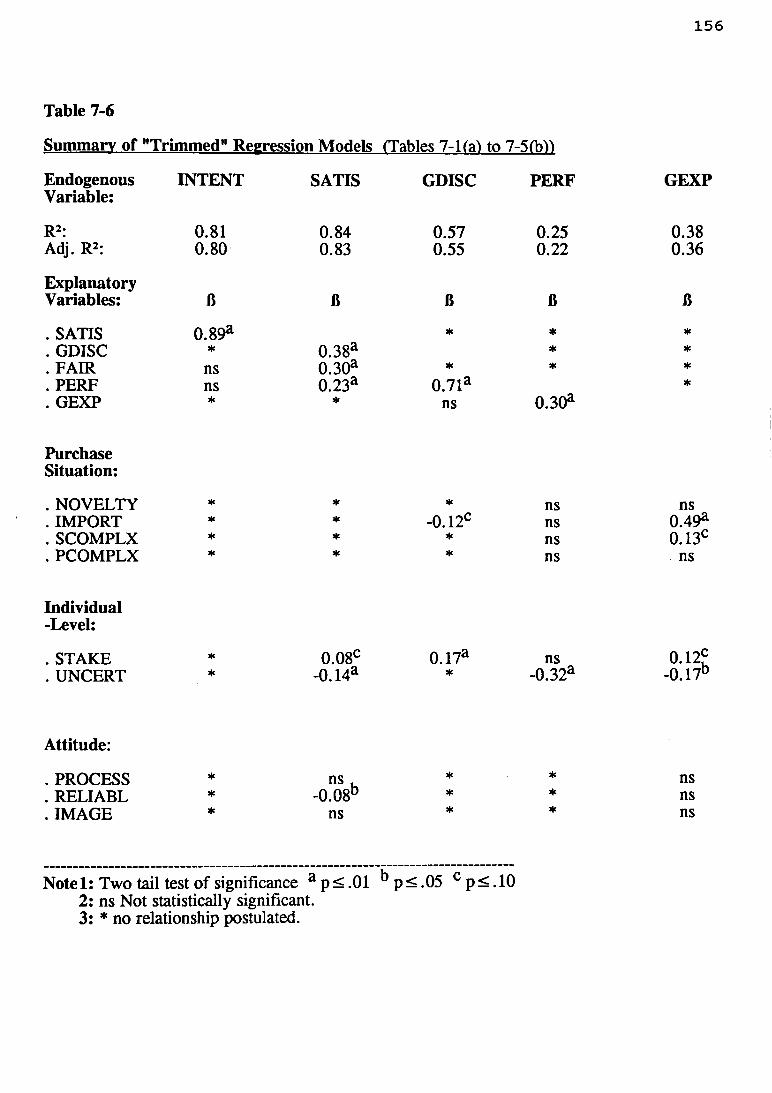
156
Table 7-6
Sum m ary of "Trim m ed" Regression Models (Tables 7-l(al to 7-5(bll
EndogenousVariable:
INTENT SATIS
R2: 0.81 0.84Adj. R2: 0.80 0.83
ExplanatoryVariables: ß ß
. SATIS 0.89a
. GDISC * 0.38a
. FAIR ns 0.30a
. PERF ns 0.23a
. GEXP * ♦
PurchaseSituation:
. NOVELTY * *
. IMPORT * *
. SCOMPLX * *
. PCOMPLX * *
Individual-Level:
. STAKE * 0.08c
. UNCERT * -0 .14a
Attitude:
. PROCESS * ns
. RELIABL * -0.08b
. IMAGE * ns
GDISC PERF GEXP
0.570.55
0.250.22
0.380.36
ß ß ß
« * ♦* *
♦ * *0.71a
ns 0.30a♦
* ns ns-0.12c ns 0.49a
* ns 0.13c★ ns ns
0.17a ns 0.12?* -0.32a -0 .17b
* * ns* ♦ ns* * ns
Note 1: Two tail test of significance a p < .01 b p < .05 c p < . 10 2: ns Not statistically significant.3: * no relationship postulated.
7.1.2 Derived Path M odel
The derived or empirical path model, and all consequent substantive discussion of the
results in this and the following chapter, will be in reference to the "trimmed" regression
results, i.e ., where all non-significant or zero paths are deleted.
The path model derived from these procedures outlined in the previous section is shown in
Figures 7-1(a) and (b). Broken lines show indirect paths while unbroken lines depict direct
paths to the ultimate dependent variables (i.e., SATIS and INTENT, respectively). To aid
the reader o f this thesis, a copy of the summary regression results (Table 7-6) and the
empirical path model (Figures 7-1 (a) and (b)) are included in a jacket on the inside rear
cover o f this thesis.
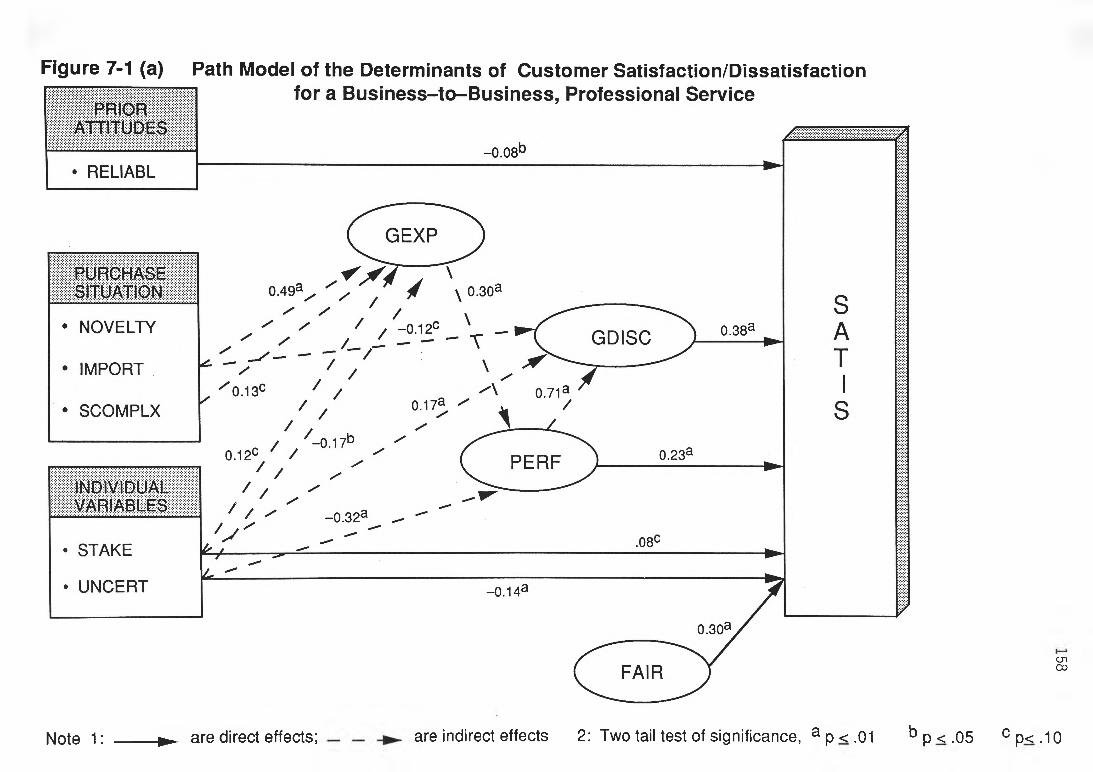
Figure 7-1 (a) Path Model of the Determinants of Customer Satisfaction/Dissatisfaction
cnooNote 1: .. - ► are direct effects; are indirect effects 2: Two tail test of significance, a p < .01 b p < .0 5 c p<.10
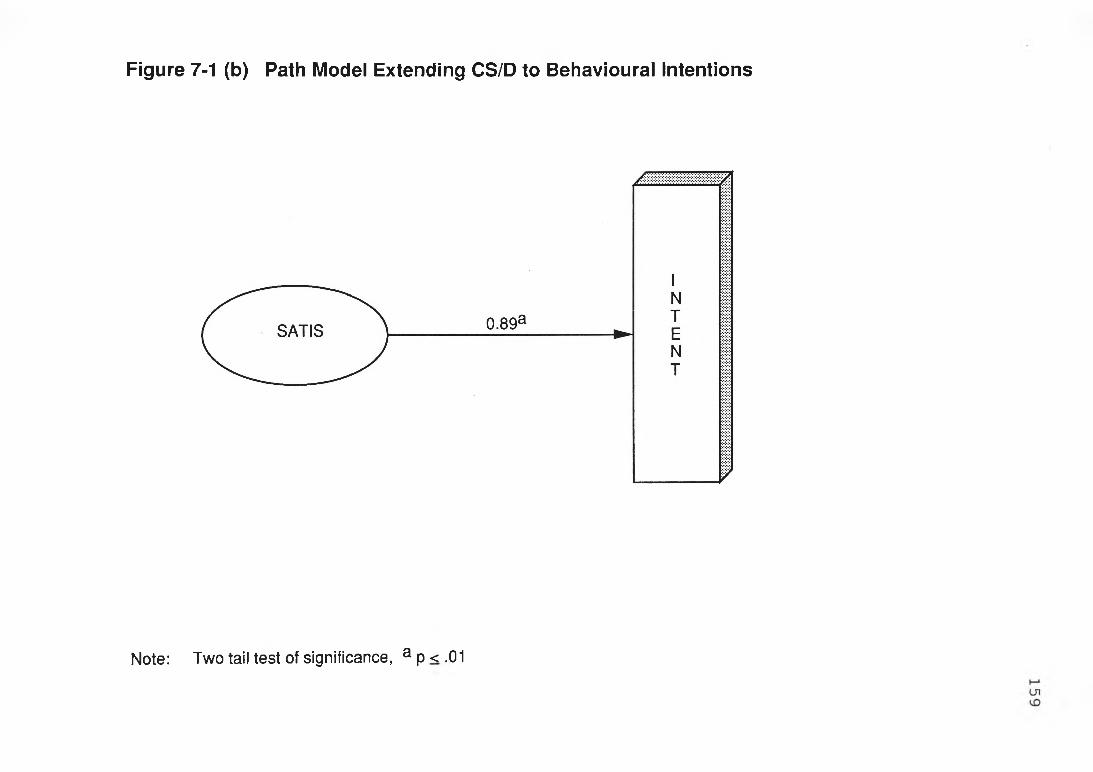
Figure 7-1 (b) Path Model Extending CS/D to Behavioural Intentions
Note: Two tail test of significance, a p < .01
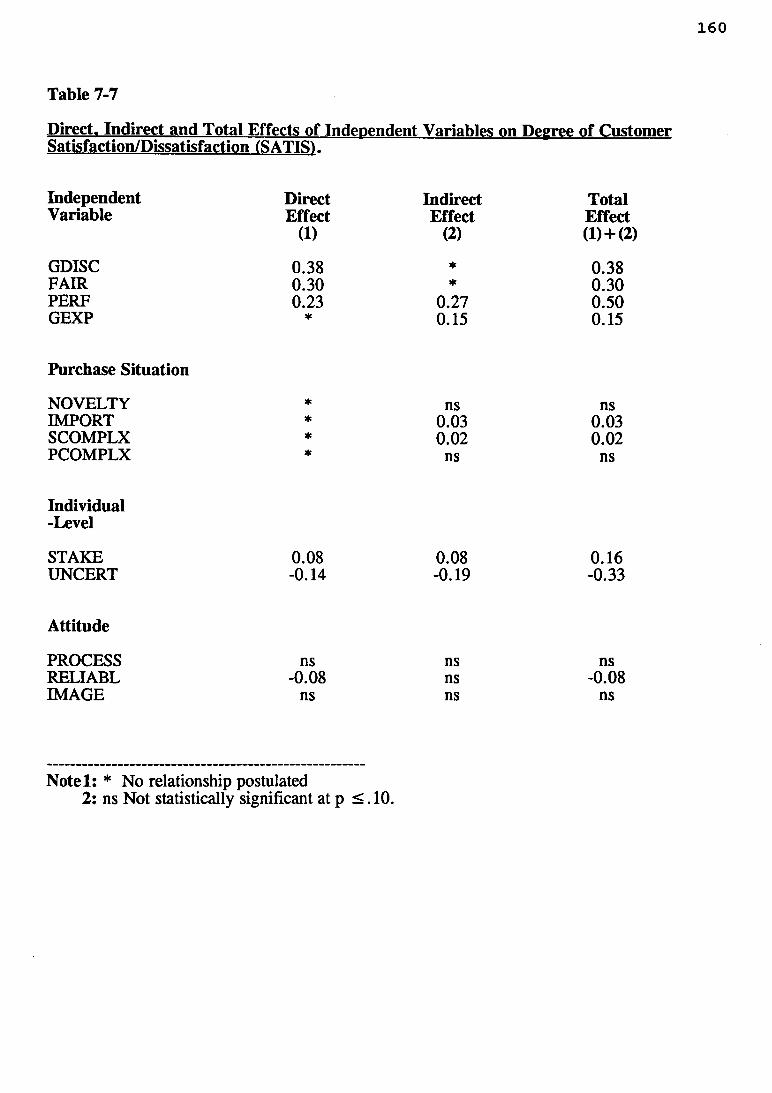
160
Direct. Indirect and Total Effects of Independent Variables on Degree of Custom er Satisfaction/Dissatisfaction (SATIS).
Table 7-7
Independent Direct Indirect TotalVariable Effect Effect Effect
(1) (2) (l)+ (2 )
GDISC 0.38 ♦ 0.38FAIR 0.30 * 0.30PERF 0.23 0.27 0.50GEXP * 0.15 0.15
Purchase Situation
NOVELTY ♦ ns nsIMPORT * 0.03 0.03SCOMPLX * 0.02 0.02PCOMPLX * ns ns
Individual-Level
STAKE 0.08 0.08 0.16UNCERT -0.14 -0.19 -0.33
A ttitude
PROCESS ns ns nsRELIABL -0.08 ns -0.08IMAGE ns ns ns
N o te l: * No relationship postulated2: ns Not statistically significant at p < . 10.
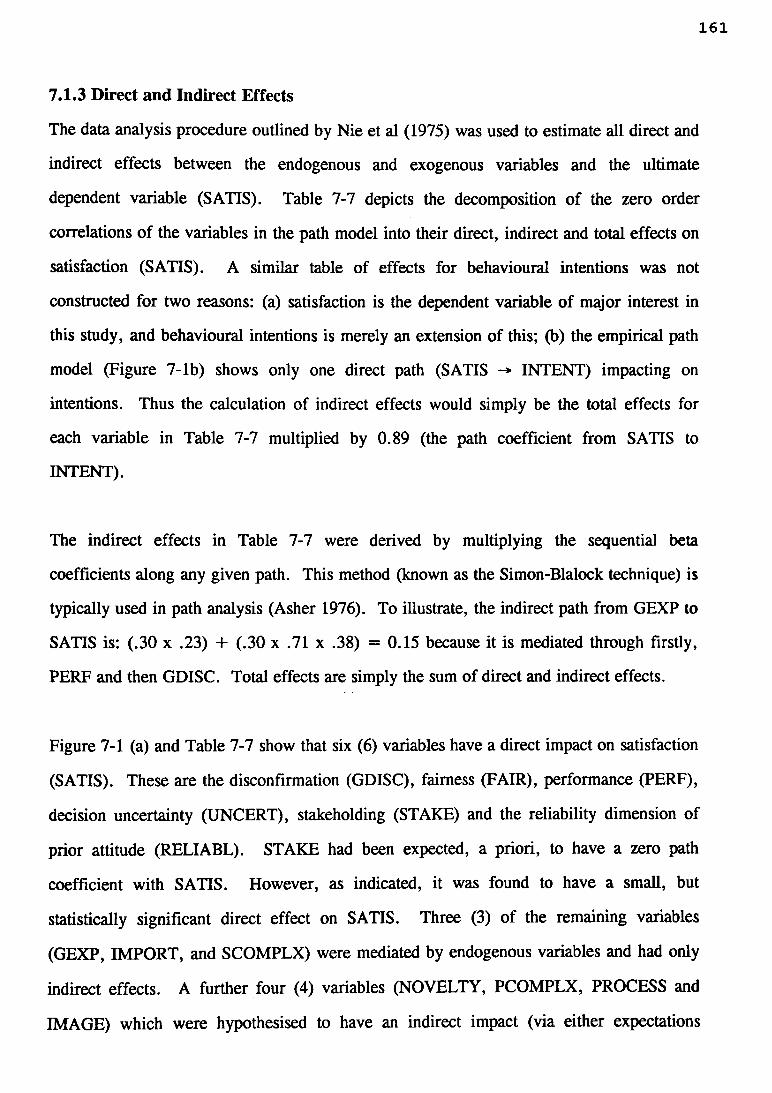
161
7.1.3 Direct and Indirect Effects
The data analysis procedure outlined by Nie et al (1975) was used to estimate all direct and
indirect effects between the endogenous and exogenous variables and the ultimate
dependent variable (SATIS). Table 7-7 depicts the decomposition of the zero order
correlations of the variables in the path model into their direct, indirect and total effects on
satisfaction (SATIS). A similar table of effects for behavioural intentions was not
constructed for two reasons: (a) satisfaction is the dependent variable of major interest in
this study, and behavioural intentions is merely an extension of this; (b) the empirical path
model (Figure 7 -lb) shows only one direct path (SATIS -» INTENT) impacting on
intentions. Thus the calculation of indirect effects would simply be the total effects for
each variable in Table 7-7 multiplied by 0.89 (the path coefficient from SATIS to
INTENT).
The indirect effects in Table 7-7 were derived by multiplying the sequential beta
coefficients along any given path. This method (known as the Simon-Blalock technique) is
typically used in path analysis (Asher 1976). To illustrate, the indirect path from GEXP to
SATIS is: (.30 x .23) + (.30 x .71 x .38) = 0.15 because it is mediated through firstly,
PERF and then GDISC. Total effects are simply the sum of direct and indirect effects.
Figure 7-1 (a) and Table 7-7 show that six (6) variables have a direct impact on satisfaction
(SATIS). These are the disconfirmation (GDISC), fairness (FAIR), performance (PERF),
decision uncertainty (UNCERT), stakeholding (STAKE) and the reliability dimension of
prior attitude (RELIABL). STAKE had been expected, a priori, to have a zero path
coefficient with SATIS. However, as indicated, it was found to have a small, but
statistically significant direct effect on SATIS. Three (3) of the remaining variables
(GEXP, IMPORT, and SCOMPLX) were mediated by endogenous variables and had only
indirect effects. A further four (4) variables (NOVELTY, PCOMPLX, PROCESS and
IMAGE) which were hypothesised to have an indirect impact (via either expectations
162
and/or performance) had neither a direct nor indirect impact after empirically testing the
hypothesised linkages.
The results reported in Figure 7-1 (a) and Table 7-7 for the purchasing of a high-
involvement, professional service (MCS - management consulting services) generally
supports, with some modifications, the discontinuation of expectations paradigm, and
demonstrates its consistency across purchase situations. Equally important is the fact that
several antecedent variables not previously thought to have an impact on the
discontinuation paradigm (i.e., importance of purchase situation, purchase situation
complexity, individual stakeholding, and decision uncertainty) are shown to have varying
degrees of impact on CS/D. Of particular note is the impact of buying decision uncertainty
(UNCERT) which has a total negative effect (refer Table 7-7) of -0.33, which is larger
than either expectations (0.15) or fairness (0.30), and only marginally smaller than the
effect of the crucial discontinuation variable (0.38). Furthermore, the other individual-
level variable (STAKE) also has an important overall impact on CS/D formation.
Stakeholding has a total effect of 0.16 via its direct impact on SATIS and its indirect paths
mediated via GDISC and GEXP. Taken together, the two individual variables (STAKE,
UNCERT) have a significant total effect on SATIS that rivals the impact of the traditional
antecedents. This highlights for the first time, the significance of understanding the
potential impact these categories of variables have in explaining variations in satisfaction, at
least for a professional, business-to-business service (MCS). We believe this is an
important contribution of this study.
The total effects column in Table 7-7 is a general indication of the relative overall
importance of each variable in determining satisfaction. For example, FAIR (total effect
0.30) has twice the impact of GEXP (0.15). A more literal interpretation is a one standard
deviation change in FAIR will have almost twice the impact on SATIS as a one standard
deviation change in expectations.
163
Overall, the results show that perceived performance (PERF) (total effect = 0.50) has the
greatest influence on the dependent variable (SATIS). This is followed by GDISC (0.38),
UNCERT (-0.33) and FAIR (0.30). Surprisingly expectations (GEXP) has a relatively
minor impact via its indirect effect (0.15). As indicated above, the impact of the
individual-level variables is considerable, however the purchase situation and attitude
variables have a relatively minor impact. A comment on the impact of the importance
(IMPORT) variable is deemed appropriate. IMPORT has significant indirect paths to
SATIS via GEXP and GDISC. In fact its path coefficient to expectations (0.49) suggests it
has a major role in framing clients' pre-purchase expectations. The positive coefficient
indicates the more important the consulting assignment, the higher are the expectations of
the outcome. The overall impact of IMPORT is however influenced by the fact that it has
a high, positive effect on GEXP, but a negative effect on GDISC, thus cancelling out to a
large extent, its overall impact. It has been shown nonetheless, to be an important variable
in understanding the complex relationships which determine client's CS/D judgements.
It should also be noted that the powerful impact of the performance variable is primarily
because it has both a direct effect on SATIS (0.23) as well as a quite sizeable indirect one
(0.27) mediated through GDISC. A final comment on the results concerns the non
significant path between pre-purchase expectations and disconfirmation (the latter measured
post-purchase). It was postulated that there would be a causal link between GEXP
GDISC. It turns out GEXP's impact on GDISC is an indirect one, mediated via PERF
(refer Figure 7-1(a)). Further comment on this finding is contained in the discussion of
results chapter (Chapter 8).
164
7.2 Results of Hypotheses Testing
7.2.1 Hypothesised Relationship Between Behavioural Intentions and CS/D, Perceived
Performance and Fairness.
Hypothesis la :
Higher levels o f satisfaction are more likely to be positively associated with repeat purchase
intentions fo r management consulting services.
The large, and statistically significant (p< .000) positive path coefficient linking SATIS -*
INTENT in Figure 7-1(b) clearly indicates that higher levels of satisfaction are positively
associated with repeat purchase intentions. Thus there is strong support for hypothesis la.
Hypothesis lb :
Perceived service performance will have a direct, positive impact on repeat purchase
intentions fo r management consultancy services.
An examination of the empirical path model (Figure 7-1(b) and Table 7-1(a)) shows the
PERF -* INTENT path not to be significantly different from zero. Table 7 -1(a) shows
PERF to be highly insignificant (p = 0.61) when behavioural intentions is regressed
simultaneously on SATIS, FAIR and PERF. It is clear from this table that the degree of
(dis)satisfaction with the present consulting assignment is the only variable directly
influencing repeat purchase intentions. Performance has been shown however to have only
an indirect impact on INTENT via SATIS.
Nonetheless, there is insufficient support for hypothesis lb and it is rejected.
165
Hypothesis le :
The fairness dimension o f equity will have a direct, positive impact on repeat purchase
intentions fo r management consultancy services.
Table 7 -1(a) clearly indicates that SATIS is the only variable directly impacting upon
intentions. Contrary to expectations, FAIR was not statistically significant (p = .55). As
depicted in Figure 7 -1(a), fairness' impact on intentions is an indirect one, via satisfaction.
Hence there is insufficient support for this hypothesis.
7.2.2 Hypothesised Relationship Between CS/D and Discontinuation, Perceived
Performance, Prior Attitudes, Fairness and Uncertainty.
Hypothesis 2a:
Positive disconfirmation will be associated with higher levels o f CS/D.
Referring to Tables 7-2(b) and Figure 7-1(a), it will be noted firstly that disconfirmation
(GDISC) has the highest beta coefficient (0.38, p < .000 ) of all the statistically significant
variables in the SATIS regression. This indicates the disconfirmation construct is the most
important explanatory variable in terms of direct effects on satisfaction. However, it will
be noted from Table 7-7 that while performance (PERF) has a relatively smaller direct
effect (0.23 versus 0.38), it has a large indirect effect. GDISC has no indirect effects.
Hence hypothesis 2a is supported.
Hypothesis 2b:
Perceived performance o f a management consulting assignment w ill have a positive, direct
impact on CS/D.
166
Table 7-2(b) and Figure 7-1(a) show that performance (PERF) was found to have a
positive, and statistically significant (p< .000) direct path to satisfaction (SATIS). The
path (beta) coefficient of 0.23 suggests it is the third most important explanatory variable
(in terms of its direct impact), behind GDISC and FAIR. Hence hypothesis 2b is
supported.
Hypothesis 2c:
CS/D will primarily be determined by the combined, direct and indirect impact o f perceived
performance.
This hypothesis was tested by computing both the direct and indirect effects of PERF on
SATIS. An inspection of Table 7-7 shows that although PERF had only the third most
important direct effect, its large indirect effect (mediated by GDISC) resulted in it having
the largest total impact (0.50) on satisfaction formation. Thus there is sufficient evidence
to support hypothesis 2c.
Hypothesis 2d:
More positive prior attitudes towards MCS in general are more likely to be associated with
higher levels o f satisfaction.
This research study found attitudes towards MCS to have three dimensions: (a) a reliability
dimension; (b) process dimension; and (c) image dimension. As indicated in Table 7-2(b),
only the reliability dimension has a statistically significant (p = .04), if relatively small (
0.08) negative beta coefficient. Thus PROCESS and IMAGE do not impact on CS/D as
hypothesised. RELIABL however, whilst significant, has a negative coefficient, rather
than a positive one as hypothesised. This means that the more positive or favourable a
client's prior attitudes toward MCS, the less likely that client is to be satisfied at
completion of the assignment. This result is difficult to explain. A tentative explanation is
that as attitudes (like expectations) were measured pre-purchase, more positive attitudes
167
would, ceteris paribus, have the effect of raising client's expectations, thus increasing the
chances of lower CS/D than might otherwise be the case.
But why was the consultant's reliability the only dimension to impact on CS/D? Clearly
there is scope for further research into the effect of prior attitudes, particularly as scholars
are now beginning to conceptually link service quality (an attitude) and CS/D. On the
basis of the data collected from 128 consulting clients in this study, hypothesis 2d is not
supported.
Hypothesis 2e:
The equity concept o f fairness is positively associated with higher levels o f satisfaction.
Table 7-2(b) and Figure 7-1(a) show fairness (FAIR) to be positively, significantly
associate with SATIS. Its beta coefficient of 0.30 indicates it has the second most
important direct impact on SATIS (behind GDISC). In other words, client's perceptions of
fairness in the exchange (including value for the fees paid) weigh heavily in their
determination of (dis)satisfaction. The data collected for this study therefore supports
hypothesis 2e.
Hypothesis 2f:
Buying decision uncertainty w ill have a direct and positive impact on satisfaction (as well
as an indirect one mediated through expectations and performance).
Figure 7-1(a) shows buying decision uncertainty to have both direct and indirect effects on
SATIS. Contrary to our hypothesis, its direct effect on SATIS is a negative one (B= -
0.14). The arguments put forth in Chapter 4 were that as CS/D was an evaluation of the
surprise inherent in the product/service consumption experience and that CS/D contains an
emotive component, then in situations of high uncertainty, a successful outcome (an
assignment which exceeded expectations) might be expected to be at least a mildly pleasant
surprise and emotional experience. Thus it was considered that higher uncertainty would
be associated with higher satisfaction, than might otherwise be the case. The empirical
results partially support this hypothesis. That is, UNCERT was found to have a
statistically significant, direct impact on CS/D, but its sign was not in the hypothesised
direction. The negative path coefficient in Figure 7-1(a) directly linking UNCERT -*■
SATIS indicates that the higher the pre-purchase decision uncertainty (i.e., "will the chosen
consultants deliver the promised benefits?"; "have we chosen the 'best' consultant for the
job?"), the lower the likelihood of satisfaction. MCS are at the pure services end of the
goods - services spectrum and therefore are high in credence qualities and thus intrinsically
difficult for some clients to objectively evaluate, even after assignment completion. This,
combined with the uncertainty has apparently had an adverse impact on client's CS/D
evaluations.
As can be seen from the theoretical model (Figure 4-1(a)), the only purchase situation or
individual-variable postulated to directly effect CS/D, was uncertainty (UNCERT). All
other direct paths were expected to be zero. However the empirical data shows that
stakeholding (STAKE) also has a direct, albeit small, effect (fi=0.08 p=0.06). This
indicates that the higher the key informant's stakeholding (i.e., risk and responsibility) the
more likely they are to perceive a satisfactory outcome.
7.2.3 Hypothesised Relationship Between Disconfinnation, and Pre-purchase
Expectations and Performance.
Hypothesis 3a:
Higher levels o f pre-purchase expectations are more likely to be associated with negative
disconfirmation.
As portrayed in Table 7-3 and Figure 7-1(a) pre-purchase expectations were not statistically
significant (p= .92) in explaining perceived or subjective disconfirmation (a post-purchase
construct). In other words, there is no non-zero path between GEXP GDISC. Thus the
findings of this study do not support hypothesis 3a.
Hypothesis 3b:
Higher levels o f perceived performance are more likely to be associated with positive
disconfirmation.
The empirical path model (Figure 7-l(a)) indicates PERF to be a powerful (fl=0.71, p =
.000) explanatory variable determining GDISC, thus supporting hypothesis 3b. No
hypotheses were put forward arguing that any of the exogenous variables (purchase
situation, individual-level) would impact directly on GDISC. However, the results of the
empirical path model show that the importance of the consulting assignment (IMPORT) to
the organisation in terms of increased profitability and/or productivity, and stakeholding
(STAKE) do in fact have significant non-zero paths. Unlike the service quality literature
where any variation between expectations and performance is modelled as a gap score (or
objective difference), the CS/D literature typically models disconfirmation as an
independent, cognitive comparison process that consumers go through prior to forming
CS/D judgements. It appears, at least for MCS, that this psychological comparison process
is affected by considerations other than simply expectations and perceived performance.
This is considered an important contribution of this study.
Figure 7-1(a) shows IMPORT to be negatively associated (B = -0.12) with disconfirmation
(GDISC) indicating that higher perceived importance is associated with negative
disconfirmation (i.e ., performance falls short of what was expected). STAKE on the other
hand, is positively associated (B = 0.17). This finding will be discussed in the final
chapter.
170
7.2.4 Hypothesised Relationship Between Perceived Performance and Expectations,
Purchase Situation and Individual-level Variables.
Hypothesis 4a:
Expectations will be positively associated with perceived performance fo r management
consulting services.
In accord with two previous studies (Churchill and Surprenant 1982; Patterson 1993),
expectations was found to have a significant, positive impact on perceived performance (B
= 0.30, p = .000). This indicates that clients with high pre-purchase, normative (i.e.,
what they "deserve" or "should" expect) expectations have, on average, higher perceptions
of the consulting firms performance. Hence hypothesis 4a is supported.
Hypothesis 4b:
The more novel the consulting assignment is to the client organisation, the more likely it is
to be associated with lower perceptions o f performance.
Hypothesis 4c:
Higher importance o f the buying decision is more likely to be associated with lower levels
o f perceived performance.
Hypothesis 4d:
Higher levels o f complexity are more likely to be associated with higher performance
perceptions.
171
Hypothesis 4e:
Higher levels o f key informant stakeholding are more likely to be associated with more
positive perceptions o f performance.
Table 7-4(a) and (b) shows that while NOVELTY, IMPORT, SCOMPLX, PCOMPLX and
STAKE, have signs in the hypothesised direction, they are not statistically significant in
explaining variations in perceived performance (PERF). Novelty was the closest to having
a significant beta, and therefore it was included in the "trimmed" model containing only
GEXP and UNCERT. However, it was still not significant (t= -1 .5 , p=0.14) and hence
was deleted. Therefore there is insufficient evidence to support hypotheses 4b through to
4e.
Hypothesis 4f:
Higher levels o f buying decision uncertainty are likely to be associated with lower
perceptions o f performance.
Table 7-4 shows that UNCERT has a strong, negative impact on PERF (B = -0.32, p =
.000) as hypothesised. In other words, the more uncertainty surrounding the
commissioning of a given consulting firm, the lower the performance perceptions. This
may be due to the fact that services (but especially "pure" services) are intrinsically
difficult to evaluate and hence any pre-commissioning uncertainties are carried over when
subjectively evaluating performance. It will be noted in Figure 7-1(a), that only UNCERT
and GEXP effect the performance construct.
Further, the final path coefficient, derived from the "trimmed" regression model (Figure 7-
4(b)), is quite robust. When five non-significant variables are deleted from the "full"
regression model (Figure 7-4(a)) to produce the more parsimonious "trimmed" regression
172
model, the beta coefficient only varies from -0.26 to -0.32. Thus hypothesis 4f is
supported.
7.2.5 Hypothesised Relationship Between Prior Expectations and Purchase Situation
Variables, Individual Variables, and Prior Attitudes.
The specific hypotheses are:
Hypothesis 5a:
Novelty is likely to be negatively associated with expectations.
Hypothesis 5b:
Importance is likely to be positively associated with expectations.
Hypothesis 5c:
Complexity is likely to be positively associated with expectations.
Hypothesis 5d:
Stakeholding is likely to be positively associated with expectations.
Hypothesis 5e:
Uncertainty is likely to be negatively associated with expectations.
Hypothesis 5f:
Prior attitudes towards management consultants will be positively associated with
expectations.
Referring to Figure 7-1(a), it will be noted that two purchase situation variables IMPORT
and SCOMPLX (one of the two complexity dimensions) directly impact on GEXP (B =
0.49 and 0.13, respectively). The signs on the coefficients are also in the expected

173
direction. Further, a comparison of the path coefficient in the "full" and "trimmed"
regression models shows the coefficient to be robust. Hence, hypothesis 5b is fully and
hypothesis 5c only partially supported. However there is insufficient support for
hypothesis 5a.
It will be further noted that both of the individual-level variables (STAKE and UNCERT)
directly influence client's expectations. The path coefficients of 0.12 and -0.17 have signs
in the hypothesised direction. These results indicate, not surprisingly, that (a) the higher
the personal stakeholding in consultant selection decision, the higher are client's
expectations of the outcome; and (b) higher uncertainty has the effect of dampening
client's expectations. Hence, both hypotheses 5d and 5e are supported.
None of the three dimensions of attitude were statistically significant in explaining the
variation in GEXP. Hence no path is shown in Figure 7-1(a) which purports to link prior
attitudes to expectations. Thus hypothesis 5f cannot be supported.
7.3 Summary
In summary, of the twenty-three hypotheses advanced in Chapter 4, twelve (12) were fully
supported, one (1) partially supported but there was insufficient evidence to support the
remaining ten (10). Overall, these results support a modified disconfirmation of
expectations paradigm in the context of a business-to-business professional service. It also
provides good support for a significant number of the structural linkages posited in the path
model explaining CS/D and behavioural intentions. While some of the hypotheses were
not supported, the inclusion of prior attitudes, purchase situation, individual-level variables
and fairness (equity) has added a richness to our understanding of the determinants of CS/D
in general, and a professional service (MCS) in particular. Of particular note is the impact
of decision uncertainty (a pre-purchase, individual-level variable) which had an overall
impact on CS/D which was only marginally less important than the key disconfirmation
construct, and more important than either fairness or expectations.
174
Finally, the derived path model shows perceived performance for MCS to (a) have a
significant, direct influence on CS/D (which supports recent evidence of a direct
performance service quality link (e.g., Cronin and Taylor 1992)), as well as an indirect
effect. Combined, these effects mean the consultancy's performance has the largest overall
impact of any variable on CS/D formation. Expectations was found to play a less
significant role than has been found in discontinuation studies of products. These issues
will be discussed in the following chapter.
175
CHAPTER 8: DISCUSSION AND CONCLUSIONS
The purpose of this final chapter is to provide a summary and draw together the
conclusions of this research. This includes a discussion of the following issues: a review
of the objectives of the research; a summary and discussion of the results; contributions of
the study; managerial implications; limitations of the research; and finally some future
research directions are provided.
8.1 Primary Research Purpose
The primary purpose of this study was to empirically test for the first time, and extend, our
knowledge of the determinants of CS/D in the context of a business-to-business,
professional service. This research purpose was achieved using a two-stage longitudinal
study of 128 client organisations who had commissioned a management consultancy. Prior
attitudes, purchase situation and individual-level variables, and expectations were measured
at the time the consulting assignment was commissioned (i.e., immediately pre-purchase),
while fairness, disconfirmation, performance, satisfaction and behavioural intentions were
measured one to two months after completion of the consulting assignment. The range of
consulting assignments included in the study involved strategic and corporate planning,
marketing, information technology, human resource management, as well as production
and operations management assignments.
8.2 Summary and Discussion of Results
The empirical results detailed in the previous two chapters will now be discussed with
reference to the five research questions posed in the first chapter, which set the direction
for this thesis. These research questions will now be discussed in turn.
Research Question 1: What is the nature and extent o f the differences between the
disconfirmation paradigm fo r a business-to-business, professional service and fo r tangible
products?
176
Firstly, the findings indicate that the basic disconfirmation paradigm applies to a
professional, business-to-business service. In terms of direct effects, two constructs central
to previous CS/D studies, disconfirmation and performance, together explained the
majority of the variation in satisfaction, clearly outperforming other predictor variables.
Unlike a number of earlier CS/D studies concerning products, pre-purchase expectations
did not have a direct impact on CS/D (it did however have a minor indirect one). This
may be in part, due to the extended duration of each consulting assignment during which
expectations may diminish in intensity and/or change over time. Furthermore, it conforms
to Bolton and Drew's (1991a) findings that indicate expectations are not actively processed
for services where consumers have had the opportunity to frame realistic expectations over
time. However, the addition of the reliability dimension of attitude, stakeholding,
uncertainty and fairness improved the explanatory power of the model. With the exception
of fairness (which has only been used in one CS/D study of automobile purchases - Oliver
and Swan 1989), the other three variables have not previously been examined as
determinants of CS/D.
Unlike most studies of low-involvement, non-durable products, performance was found to
have a direct impact on CS/D as has been the case recently in a service quality context
(Cronin and Taylor 1992). However the beta coefficient for disconfirmation (B = 0.38)
was larger than for performance (0.23) indicating the former is more important as an
explanatory variable when both are in the model. Studies by Patterson (1993) and Tse and
Wilton (1988) in studies of high-involvement products, found quite the opposite. MCS,
being at the pure service end of the goods - services spectrum, are known to be high in
experience and credence qualities and hence intrinsically difficult for some clients to
articulate their performance evaluation. It thus appears for MCS at least, the cognitive
comparison process (disconfirmation) is somewhat more important in explaining
satisfaction when only direct effects are considered. However, as will be discussed in
Research Question 2, when indirect or second order effects are considered, cognitive
177
constructs such as fairness and the individual difference variables have a major impact on
CS/D.
In summary, the discontinuation paradigm which has been empirically shown to explain
CS/D for high and low-involvement goods is operating in a modified manner. However,
antecedent variables stakeholding, uncertainty, fairness, reliability have been shown to add
significant additional insights into the CS/D evaluation process.
Research Question 2: "To what extent do prior attitudes, purchase situation and
individual-level variables impact upon the key constructs o f expectations, performance,
disconfirmation and CS/D?"
Taken together prior attitudes, purchase situation and individual variables were found to
have an extremely important impact on CS/D formation. Table 7-7 clearly illustrates that
the two individual-level variables (stakeholding and uncertainty) are particularly influential.
They have total effects of 0.16 and -0.33, respectively. Their impact can be guaged when
it is considered that perceived performance (the most influential variable) had a total effect
of 0.50. All three groups of antecedents (attitude, purchase situation and individual-level)
together, have an impact which rivals the traditional key constructs of disconfirmation,
performance and expectations. Their significant total effect is due largely to their indirect
impact on CS/D, mediated via expectations, disconfirmation and performance. This
finding offers new insights into the CS/D evaluation process for business, professional
services and is one of the major contributions of this study. Each antecedent will now be
summarised in turn.
Figure 7-1(a) shows prior attitudes to have a minimal impact, with only one of its three
dimensions (reliability) having any impact whatsoever. Prior research (e.g., Mazursky and
Geva 1989) suggested that product class beliefs (attitudes) impact on CS/D and behavioural
intentions. In the current study they did not effect intentions. Furthermore, the
178
significant, if small, attitudes -> satisfaction path had a negative sign, the opposite to that
hypothesised. It was postulated that more positive prior attitudes to management
consultants in general would result in more positive satisfaction assessments. This was not
the case. This finding is difficult to explain especially since recent work in integrating the
CS/D and service quality (an attitude) paradigms (Patterson and Johnson 1993), also
suggests a positive relationship. A possible explanation is that more positive prior attitudes
concerning the reliability or outcome (i.e., will the consultant deliver the promised
benefits), when coupled with a consultant's performance, that is in any way inconsistent
with these prior beliefs, results in lower satisfaction than might otherwise be the case.
Bolton and Drew's (1991a) study of telephone services (a low involvement, continuous
service) suggests that prior attitudes effect current perceptions of service quality.
However, they point out that the findings are for a continuously provided service where
customers have frequent contact and experience, thus resulting in realistic expectations and
attitudes. In the current study, MCS are a complex high-involvement discrete service and
thus client's expectations and prior attitudes would not be expected to be as well formed
and strongly held. Hence this may explain why in this situation, prior attitudes did not
impact upon expectations and had a relatively small explanatory power concerning CS/D.
Four of the five purchase situation and individual-level variables were significant in
explaining client's pre-purchase expectations. Only novelty (newness of the purchase
situation) failed to have an impact. More specifically, importance of the consulting
assignment to the organisation, its perceived complexity, and the amount of key informant
stakeholding involved, were all positively associated with expectations. Hence increased
importance, complexity, and stakeholding were associated with heightened expectations of
the assignment outcomes. As indicated by its relatively large path coefficient (0.49),
importance was by far the most significant variable in explaining variations in expectations.
Uncertainty on the other hand, was inversely associated with expectations. That is, the
more unsure or uncertain the client was as to how the chosen consultant would perform, the
lower the clients expectations.
"Understanding customer expectations is a prerequisite for delivering superior service"
(Parasuraman, Berry and Zeithaml 1991a, p. 39). The inclusion of the above-mentioned
antecedent variables provides, for the first time, quantitative evidence showing at least
some of the factors that determine expectations for a business-to-business service. As such
it begins to build on the exploratory work of Jayanti and Jackson (1991), Parasuraman,
Berry and Zeithaml (1991a) and Webster (1989). Only one of the antecedent variables,
decision uncertainty, was found to explain variations in the perceived performance.
Contrary to the hypothesis, uncertainty had a negative path coefficient (refer Figure 7-
1(a)). This indicates the higher the uncertainty concerning how the consultant might
perform, the lower the perceptions of performance. It appears any heightened pre-purchase
uncertainty, coupled with the fact that the consultant's performance is intrinsically difficult
to evaluate, results in less favourable client evaluations of performance than might
otherwise be the case. The only other variable to impact upon performance was
expectations. This finding, coupled with the uncertainty variable's impact on expectations
and CS/D has important managerial implications which will be discussed later in this
chapter.
In the theoretical path model developed for this study, no relationship between antecedent
variables and disconfirmation was hypothesised. However the empirical path analysis
concluded that both importance and stakeholding were statistically significant in explaining
variations in disconfirmation. Importance had a negative impact on disconfirmation. This
is no doubt because, as mentioned previously, importance had a large, positive impact on
expectations. Ceteris paribus, raised expectations should result in negative disconfirmation
(i.e., expectations exceed perceived performance). Interestingly, stakeholding was
positively associated. Thus the more the individual has 'at stake or risk concerning the
consultancy's performance, the more likely it is to lead to positive disconfirmation. This is
180
not surprising since it simply suggests, the more the individual stakeholder has at risk, the
more positive he views the outcome - as it is in his/her best interests to do so.
Performance however was by far the most important predictor variable in explaining
variations in discontinuation.
No previous work could be found which looked beyond expectations and performance to
explain variations in disconfirmation. Since discontinuation in this study (and most CS/D
studies for that matter) was measured as perceived (i.e., a cognitive approach), rather than
inferred (i.e., the difference or gap model approach), it stands to reason that individual and
purchase situation differences might effect these cognitions (especially since services are
difficult to objectively evaluate).
In all, six variables were statistically significant in directly explaining CS/D. Prior
attitudes has already been discussed, while disconfirmation, performance and fairness are
discussed in the following sections. The two individual-level variables included in this
study, stakeholding and uncertainty, both directly effect CS/D, (as well as indirectly - as
discussed above) even when regressed simultaneously with the other four key variables
(fairness, disconfirmation, performance and reliability). This is an important finding as no
reported research has modelled individual-level variables simultaneously with expectation,
performance and disconfirmation. It had been previously thought that various antecedents
would generally impact only indirectly on CS/D, mediated by expectations (Parasuraman,
Berry and Zeithaml 1991a).
Stakeholding was positively associated with CS/D. It would thus appear that when there is
more at stake (or risk), the key decision maker will, not surprisingly, view the outcome
more satisfactorily as it is in his/her personal best interests to do so. However, the
uncertainty variable had a statistically significant (p< .01 ) negative relationship with CS/D
(consistent with its strong negative association with performance). This was opposite to the
direction hypothesised. This finding is difficult to explain, other than to offer the same

181
explanation as given for uncertainty's negative relationship with performance. That is in
situations of high uncertainty, coupled with an intrinsic difficulty in unambiguously
evaluating an intangible, divergent and highly complex professional service, clients tend to
evaluate the outcome and thus CS/D in a less favourable manner than would be the case in
situations where there was low uncertainty (i.e., the client was perhaps experienced in
dealing with consultants, understood the methodology used, and was confident the
consultant would deliver what was promised). Interestingly, the zero-order correlation
between novelty (or newness/inexperience in being involved in similar consulting projects)
and uncertainty was 0.33 (p< .001), suggesting that perhaps high novelty (i.e., newness or
inexperience) leads to increased uncertainty. Novelty also had a significant, negative zero
order correlation with CS/D (r = -0.24, p < .0 1 ). Thus pre-purchase inexperience and
uncertainty seem to exacerbate the problem of objectively evaluating a complex service.
Once again, these findings add to our understanding of the complex relationship which
precede CS/D evaluation for a business-to-business, professional service, and have
important managerial implications.
Since the key aim of this study was to gain a better understanding of the determinants of
CS/D, another way of viewing these results is to examine the direct, indirect and total
effects o f the various antecedent variables on CS/D. Table 7-7 provides this information.
This decomposes the zero-order correlations with CS/D into their direct and indirect
effects. The vast majority of the preceding discussion has concentrated on direct effects
only. Probably the two most important observations from Table 7-7 are that (a)
performance alone has the singular most important impact on CS/D; (b) the individual-level
variables (stakeholding and uncertainty) through their direct and indirect effects, together
have an impact almost equal to performance. This is an important finding as these
variables have not previously been included in like studies. To put this into perspective,
their combined impact surpasses that of either disconfirmation, fairness or expectations.
182
The purchase situation variables and prior attitudes were found to have only a relatively
minor impact. Hence, when marketing managers are devising strategies and tactics to
improve CS/D (and service quality for that matter), it is not enough to simply consider
customers' expectations and one's own performance levels. Rather CS/D will also be
directly and indirectly influenced by the nature of the purchase situation and individual
differences. The results of this study clearly indicate that these individual differences
(stakeholding and uncertainty) in particular must be understood, taken into account, and
managed to ensure client satisfaction at completion of the consulting project.
Research Question 3: " What is the relative impact o f expectations, perceived performance
and disconfirmation on CS/D?”
As depicted in Figure 7-1(a) disconfirmation and performance have direct, positive impacts
on CS/D. However expectations was found to only have an indirect effect, mediated by
the performance construct. The direct performance -> CS/D linkage is supported by
several studies of high-involvement products (e.g., Churchill and Surprenant 1982;
Patterson 1993; Tse and Wilton 1988) and recent work in the service quality literature
(Cronin and Taylor 1992). These studies, collectively, suggested that more intense post
purchase evaluation takes place in high-involvement purchases. Hence it is not surprising
that for a complex, high-involvement service such as MCS, that performance directly
influences CS/D. This finding is also in accord with Oliver and Bearden (1983) who
claimed high-involvement decreases the consumer's sensitivity to the pre-usage phenomena
(e.g., expectations) and increases their sensitivity to the outcome (i.e., perceived
performance).
This reasoning might also partially account for the fact that expectations does not directly
impact upon CS/D. A further reason might be because each assignment takes some months
to complete (i.e., an extended "consumption" period), thus expectations may decline in
183
importance and/or be adjusted over time, in line with how the client views the assignment
progressing (thus conforming with assimilation theory (Anderson 1973)).
Research Question 4: "What impact does the equity dimension o f fairness have upon the
ultimate dependent variable, CS/D?"
Fairness was found to have an independent, direct impact on CS/D. This finding is
generally in line with the findings of Oliver and Swan (1989) for new automobile
purchases. In their study however, "fairness dominated respondents' satisfaction
judgements" (p. 30). Discontinuation complemented fairness in explaining CS/D but was
the lesser of the two determinants. These researchers concluded that fairness is a key
construct in determining CS/D in interpersonal situations. This might explain why in the
present study fairness, whilst statistically significant, has less explanatory power than
disconfirmation. In Oliver and Swan's (1989) study, the reference point for the fairness
question was the customer's perception of their relationship with the automobile salesman.
In the present study, the question related to the consultancy firm rather than any
interpersonal relationship with individual consultants working on the project.
Thus the results of this study and the work of Oliver and Swan (1989) suggest that fairness
is a relatively important construct which should be included in future CS/D and perhaps
service quality studies.
Research Question 5: "To what extent does perceived service performance, CS/D and the
fairness dimension o f equity impact upon repeat purchase intentions fo r a business-to-
business, professional service ?”
A priori, it was argued that for a high-involvement, complex service such as MCS
performance and fairness in addition to CS/D would have independent, direct effects on
repeat purchase (behavioural) intentions. However, this was not the case. Intentions to use
184
the same consultancy firm for a similar engagement in the future is a function only of
CS/D. Oliver and Swan (1989) reported a similar finding. In fact CS/D alone with the
current assignment explained 81% of the variation in behavioural intentions.
Fairness and performance do however have sizeable indirect impacts on intentions,
mediated by CS/D (Figure 7- 1(b) refers) (beta coefficients: fairness = 0.30, performance
= 0.23 and discontinuation = 0.38). This suggests that in order to influence intentions to
re-use the same consulting firm, efforts to increase perceptions of fairness may be nearly as
effective a strategy as attempting to exceed customer expectations (i.e., discontinuation),
and more important than simply trying to lift performance.
Other Points for Discussion
The factor analyses of the multiple-item expectations and performance items, reported in
Chapter 6, revealed a set of dimensions which are markedly different from other reported
studies of consumer services. Whilst not explicitly part of this study's research objectives,
the results are considered worthy of brief discussion.
Analysis of the expectations items revealed six clean factors, labelled: (a) Service (6
items); (b) Global (2 items); (c) Industry knowledge (2 items); (d) Outcome; (e)
Relationship, and (f) Professionalism. The factor analysis of the performance statements
also revealed five of these factors (the outcome dimension was not included). With this
one exception therefore, the pre-purchase dimensions about which clients have expectations
are almost identical to the dimensions used post-purchase in assessing performance. Using
the six factors revealed by the analysis of the expectations items, the following table
compares these to the five SERVQUAL factors (Parasuraman, Zeithaml and Berry 1988;
Parasuraman, Berry and Zeithaml 1991b). The reader is reminded however that the
SERVQUAL dimensions were based on an analysis of the gap scores rather than
expectations or performance items.
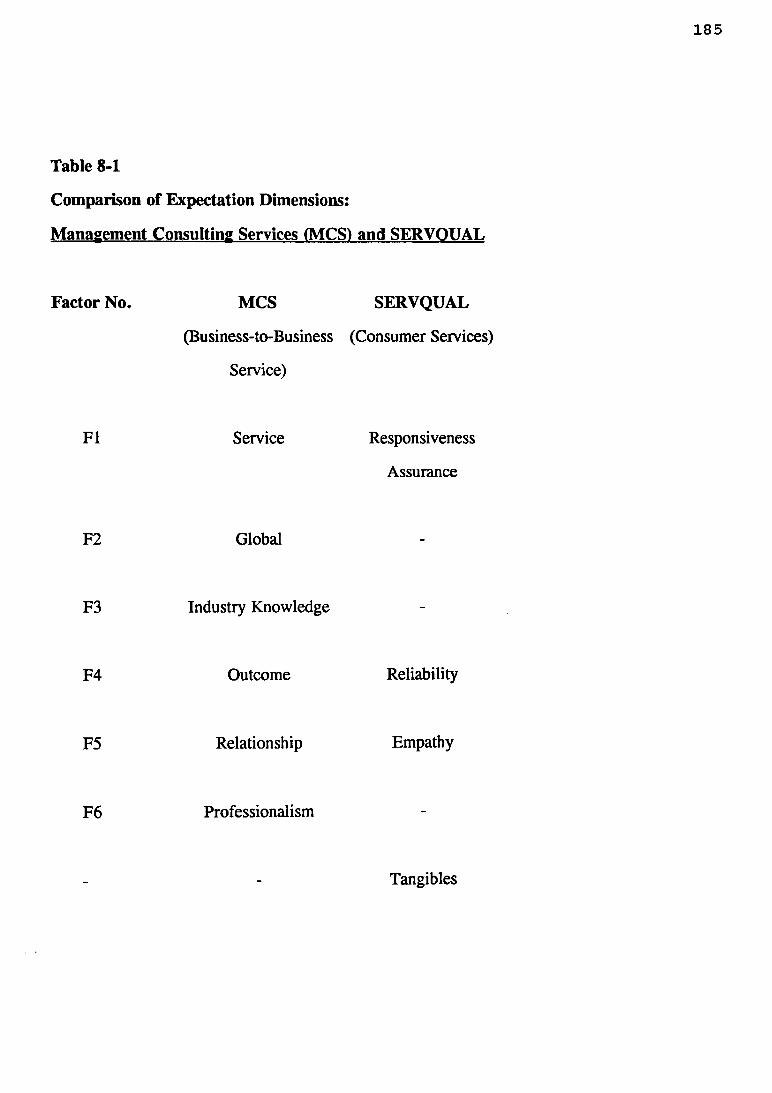
Table 8-1
Comparison of Expectation Dimensions:
Management Consulting Services (MCS) and SERVOUAL
Factor No. MCS SERVQUAL
(Business-to-Business (Consumer Services)
Service)
F I Service Responsiveness
Assurance
F2 Global -
F3 Industry Knowledge -
F4 Outcome Reliability
F5 Relationship Empathy
F 6 Professionalism
Tangibles
186
Table 8-1 shows some overlap between the two studies, but also a number of significant
differences. Most notably for a business-to-business, professional service (MCS), clients
have clear expectations concerning a consultancy firm 's need to possess specialised industry
knowledge, access to a range o f global contacts, and be thoroughly professional in all they
do (including using the most up-to-date methodologies, presentation of reports, and going
the "extra mile" to ensure clients are satisfied at assignment completion). These three
dimensions appear to be crucial for a range of business-to-business, professional service
firms - not simply management consultancies. It is not hard to image legal, engineering,
project management or other business or technical advisory services being evaluated along
similar dimensions. Brown and Swartz (1989) in their study of consumer medical services
reported the existence of a "professional" dimension. Davidow and Uttal (1989) in
discussing rising expectations among industrial customers, suggested the need for firms to
adopt a more professional approach in dealing with more sophisticated clients. They also
noted the increasing globalisation of businesses.
Concerning the Relationship factor found in the current study, recent qualitative work by
Parasuraman, Berry and Zeithaml (1991a) stress the importance of this dimension among
both consumers and business clients in the 1990s. They claim that forging customer
relationships will be central to exceeding customer expectations. In summary, this study of
MCS has revealed a set of dimensions which should prove useful in further studies of
professional, business-to-business services. Furthermore, it should prove valuable for
managers of such services in understanding and managing client expectations and
subsequent evaluation processes.
8.3 Contributions of the Study
The major contribution of this research is the development and testing of a comprehensive
path model of the determinants of CS/D judgements for an industrial (business-to-business)
professional service. The results show the disconfirmation of expectations paradigm can be
applied to professional business services, although the results are at variance with previous
187
product studies. An important part of the model was, for the first time, the simultaneous
inclusion of prior attitudes, purchase situation, individual-level and fairness (equity)
constructs. Several studies have attempted to assess their importance separately (e.g.,
Jayanti and Jackson 1991) or in exploratory, qualitative work. No previous study could be
found which incorporated these antecedents into the one comprehensive model.
Consequently the results add to our understanding of the CS/D formation process for
business-to-business, professional services.
The path analytic method employed in this study allowed the calculation of both direct and
indirect effects of the antecedent variables on CS/D and behavioural intentions, thus further
adding to our understanding of the underlying causal processes.
A further contribution relates to the performance construct. The results showed that it had
a direct as well as indirect impact on CS/D. However its influence, whilst highly
important, was not as dominant as expected. It appears the intangible, divergent and
complex nature of consultancy services (a "pure" service) and their concomitant lack of
search and experience qualities, means some clients have difficulty in objectively assessing
performance, even after completion of the assignment. Client's (dis)satisfaction
evaluations have been shown to be significantly influenced by other factors (e.g., fairness,
disconfirmation, individual difference variables) as well as performance perceptions.
The significant impact of the individual difference variables adds to our understanding of
the complex array of relationships that precede CS/D evaluation. In particular, the results
show for the first time, in the business-to-business domain, that purchase situation and
individual-level variables are instrumental in framing client expectations. The important
contribution of these two categories of variables in explaining CS/D variations should
encourage other researchers to further explore them in a range of service contexts.
188
Finally, the research found six expectations dimensions (and five performance dimensions)
which appear to be peculiar to business (industrial), professional services. These vary
considerably from the seminal work of Parasuraman, Zeithaml and Berry (1988) (consumer
services) and Brown and Swartz (1989) (consumer professional services), thus filling a gap
in the literature in the context of business-to-business, professional services. It also
provides support for the argument that "professional" services, with their high complexity
and divergence, high credence qualities, and intrinsic buyer uncertainty, deserve special
attention in further developing services marketing theory.
8.4 Managerial Implications
A rich set of implications flow from the results of this research. First, CS/D with the
current consulting assignment was the sole determinant of intentions to re-use the
consultancy firm for a similar engagement in the future. While the impact of immediate
post-purchase satisfaction is likely to change over time (Mazursky and Geva 1989), it
nonetheless highlights the importance of satisfying - even delighting the client, if repeat
work is to be won. Therefore, management consultancy firms would be well advised to
regularly monitor client (dis)satisfaction levels, and understand client expectations and
perceptions of the firms performance as the assignment progresses.
The second implication is that managers need to appreciate that there exists direct and
indirect effects, and the determinants of CS/D, at least for a business-to-business
professional service, are more complex than previous research suggests. In particular, the
potential influence of prior attitudes, purchase situation and individual-level variables
should not be ignored by MCS partners and managers. The individual difference variables
of stakeholding and perceived uncertainty had a combined effect second only to
performance in explaining variations in CS/D . Hence, when a consultancy firm has won a
contract, it will be in their best interests to understand (and then manage if necessary)
buying centre members' stakeholding and uncertainty perceptions. For example, if upon
winning an assignment, it is known that a key decision maker in the client firm is still
189
somewhat uncertain about the consultancy's capability to deliver the promised outcome,
and/or has a high personal stake in the outcome, then several actions could be taken. The
consultancy firm might consider reassuring the client by keeping them informed of progress
more regularly than usual, or attempt to educate the client (to some degree) in the technical
processes being used. Regular newsletters could be developed, highlighting the firms
expertise and successful assignments as a means of reassuring clients. Finally, a well
conceived marketing communications program would not only help attract new clients but
inform, educate and reassure existing clients.
The third implications relates to perceptions of fairness. Fairness proved to be almost as
important as discontinuation in the final path model. Thus managers should consider
strategies for increasing perceptions of fairness in the exchange, as this appears to be
almost as effective as exceeding client expectations. Providing some value-added in the
assignment (such as highlighting emerging problems/issues for the client firm, even though
not part of the formal assignment) could help in this regard.
In highly competitive environments such as the management consulting industry, the
temptation exists to raise potential clients expectations about what can be delivered in the
hope of winning the assignment. The research results showing the sizeable direct impact of
disconfirmation (the highest direct impact of all constructs) and the modest indirect impact
of expectations, suggests this is a dangerous strategy. Managers need to be careful not to
raise expectations to the point where they cannot be met - otherwise dissatisfaction is a
likely outcome. The results of this study suggest clients already have high expectations of
consultancy firms. The results also indicate that the perceived performance has the highest
overall impact o f all variables examined, suggesting consultancy firms would be well
advised to concentrate on providing a superior performance whatever the nature of the
assignment.
190
Finally, consideration needs to be given to directly influencing the disconfirmation
construct. This could be achieved for example, by giving the client more than they were
led to expect as part of the formal contract. It might also be indirectly achieved by
managing client expectations during the course of the assignment (i.e ., the "production
process"), so that the client does not develop unrealistic expectations of the ensuing
benefits.
8.5 Limitations of the Research
The first limitation concerns the generalisability of the findings. This study sampled a wide
range of management consultancy services, which in terms of the characteristic of services
(as discussed in Chapter 2) appear to be representative of a wide range of business-to-
business, professional services (e.g., architectural, engineering, legal services). However
it is doubtful whether the results should be generalised to either non-professional, business
services (e.g., maintenance/repairs) or consumer, professional services (e.g., medical).
Furthermore, the generalisability of the sample is questionable since MCS clients were
primarily from only two Australian cities. A further limitation concerns the sampling
method. In essence, a convenience sample was used because of the immense difficulties in
achieving any other research design (given that no sampling frame of all consulting
engagements about to commence at any given time, is available).
Finally, the measuring of intentions and CS/D at the same point in time may have
overstated the size of the coefficient linking the two constructs, due to method variance.
8.6 Future Research Directions
The findings of the current study have highlighted the need for more comprehensive models
of customer assessments, recognising potentially simultaneous relationships, in a range of
service contexts (refer Figure 1-1). The derived models of CS/D and behavioural
intentions are considered applicable to a wide range of management consultancy services.
Applying the model to other service contexts such as professional and non-professional
191
consumer services would test the generalisability of the model. Further, a MCS is a
discrete, complex and divergent service (Shostack 1987) rather than a less complex,
standardised, continuously provided one. It stands to reason that, (unlike discrete services)
in continuously provided service (e.g., retail banking, public utilities) customers will have
well formed and realistic expectations. Hence further research is need to test the model
with continuous business, professional services (e.g., financial audit) and other categories
of services.
As most services are essentially processes with generally, an extended "consumption"
period, time becomes an important variable. The findings of this study indicate that
perhaps some of the pre-purchase variables in particular may have shifted over the duration
of the consulting project. Future research therefore needs to make more use of
longitudinal, rather than cross-sectional studies to examine the impact of shifts in
individual-level variables, attitudes, expectations, discontinuation, perceived performance
and even satisfaction over time. MCS and other services (e.g., medical) have an extended
production and consumption period. Furthermore, often the benefits or outcome may not
fully materialise until sometime after the service has been performed. How this continuous
unfolding of service performance affects CS/D over time is still largely unexplored. This
is an area which deserves serious attention.
Repeat purchase is the behavioural outcome that impacts upon the strategic health of the
firm. Measuring CS/D, and service quality for that matter, at the same time as repeat
purchase intentions is likely to overstate these intentions. From a methodological
viewpoint then, it seems important to measure behavioural intentions at a point separate
from CS/D to avoid order effects.
The significance of the individual-level variables in explaining CS/D suggests that other
cognitive constructs such as risk and involvement need to be simultaneously investigated
with other key CS/D constructs. Purchase situation variables typically found to be have
explanatory power in a range of industrial product situations should also be investigated in
future studies. Further, these constructs might be tested across a range of services.
Contrary to the hypothesis, prior attitudes to MCS in general, were found to have only a
minor impact upon CS/D in this study. Consideration might therefore be given to
assessing the impact of specific b rand attitudes and image (i.e., concerning the particular
consultancy practice) in future studies.
Finally, the link between CS/D and service quality (SQ) is still far from clear.
Interestingly, in this study CS/D explained most of the variance in behavioural intentions,
without the contribution of SQ. While conceptual work has attempted to link the two
constructs (Bitner 1990; Bolton and Drew 1991a; Patterson and Johnson 1993),
comprehensive models need to be empirically tested across a range of continuous and
discrete services. The relationship needs to be examined starting with the pre-purchase
constructs of prior attitudes and expectations, moving to CS/D (an immediate post-purchase
evaluation), then SQ and finally behavioural intentions (post-purchase constructs).
193
BIBLIOGRAPHY
Aaker, David A. and George S. Day (1980), Marketing Research: Private and Public Sector Decisions. New York: John Wiley & Sons.
Adams, J. Stacy (1963), "Towards an Understanding of Inequity", Journal of Abnormal and Social Psychology. 67 (October), 422-436.
Anderson, Norman H. (1981), Information Integration Theory: A Case History in Experimental Science. 1, New York: Academic Press, Inc.
Anderson, Rolph E. (1973), "Consumer Dissatisfaction: The Effect of Disconfirmed Expectancy on Perceived Product Performance", Journal of Marketing Research. 10 (February), 38-44.
Asher, Herbert E. (1976), Causal Modeling. Beverly Hills CA: Sage Publications.
Assael, Henry (1987), Consumer Behavior and Marketing Action. 3rd ed., United States: PWS-Kent Publishing Coy.
Babbie, E. (1990), Survey Research Methods. Belmont, California: Wadsworth Publishing.
Bagozzi, Richard P. (1975), "Marketing as Exchange". Journal of Marketing. 39 (October),32-39.
Bagozzi, Richard P. (1980), Causal Models in Marketing. New York: John Wiley & Sons.
Barber, Mary B. and M. Venkatraman (1986), "The Determinants of Satisfaction for a High Involvement Product: Three Rival Hypotheses and Their Implications in the Health Care Context", in Advances in Consumer Research. Richard J Lutz ed., Ann Arbor, Michigan: Association for Consumer Research, 13, 316-320.
Bateson, John E. G. (1977), "Do We Need Service Marketing?", in Marketing Consumer Services: New Insights. Marketing Science Institute, (December), Report 77-115.
Bateson, John E. G. (1979), "Why We Need Service Marketing", in Conceptual and Theoretical Developments in Marketing. O. C. Ferrell, S. W. Brown and C. W. Lamb, Jr., eds., Chicago: American Marketing Association, 131-146.
Bateson, John E.G. (1989), Managing Services Marketing: Text and Readings. Orlando, FI:The Dryden Press.
Bateson, John E.G. (1991), Managing Services Marketing:Text and Readings. 2nd ed., Orlando, FI:Dryden Press.
Bearden, William D. Subhash Sharma and Jesse E. Teel (1982), "Sample Size Effects on Chi Square and other Statistics Used in Evaluating Causal Models", Journal of Marketing Research. 19 (November), 425-430.
Bearden, William D. and Jesse E. Teel (1983), "Selected Determinants of Consumer Satisfaction and Complaint Reports", Journal of Marketing Research. 20 (November),
Bell, D. (1973), The Coming of Post-Industrial Society: A Venture in Social Forecasting. New York: Basic Books.
Belson, William (1986), Validity in Survey Research. England: Gower Publishing Coy.
Berry, Leonard L. (1980), "Services Marketing is Different". Business. 30 (Mav- June), 24-29.
Berry, Leonard L. and A. Parasuraman (1991), Marketing Services: Competing Through Quality. New York: The Free Press.
Bitner, M.J. (1990) "Evaluating Service Encounters: The Effects of Physical Surroundings and Employee Responses", Journal of Marketing. 54 (April), 69-82.
Blalock, H.M . (1964), Causal Inferences in Nonexperimental Research. Chapel Hill: University of North Carolina Press.
Bloch, Peter H. and Marsha L. Richins (1983), "A Theoretical Model for the Study of Product Importance Perceptions", Journal of Marketing. 47 (Summer), 69-81.
Bloemer, Jose, Hans Kasper and Jos Lemmink (1990), "The Relationship Between Overall Dealer Satisfaction, Satisfaction With the Attributes of Dealer Service, Intended Dealer Loyalty And Intended Brand Loyalty: A Dutch Automobile Case", Journal of Consumer Satisfaction. Dissatisfaction and Complaining Behavior. 3, 42-
Bloom, Paul N. (1984), "Effective Marketing for Professional Services", Harvard Business Review. 28 (May/June), 44-52.
Bolton, Ruth N. and James H. Drew (1991a), "A Longitudinal Analysis of the Impact of Service Changes on Customer Attitudes", Journal of Marketing. 55 (January), 1-9.
Bolton, Ruth N. and James H. Drew (1991b), "A Multistage Model of Customers' Assessments of Service Quality and Value", Journal of Consumer Research. 17 (March), 375-384.
Booms, Bernard H. and Mary J. Bitner (1981), "Marketing Strategies and Organization's Structures for Service Firms", in Marketing of Services. J. Donnelly and W. George eds., Chicago: American Marketing. .
Boomsa, A. (1982), "The Robustness of LISREL Against Small Sample Sizes in Factor Analysis Models", in Systems Under Indirect Observation: Causality. Structure. Predictions. K.G. Joreskog and H Wold, eds., Amsterdam: North Holland.
Brown, Tom J., Gilbert A. Churchill, and J. Paul Peter (1992), "Improving the Measurement of Service Quality", Working Paper #92-4. The School of Business. University of Wisconsin-Madison. Madison, WI.
195
Brown, Stephen W. and Teresa A. Swartz (1984), "Consumer Medical Complaint Behavior: Determinants of and Alternatives to Malpractice Litigation", Journal of Public Policy & Marketing. 3, 85-98.
Brown, Stephen W. and Teresa A. Swartz (1989), "A Gap Analysis of Professional Service Quality", Journal of Marketing. 53 (April), 92-98.
Business Week (1990), "King Customer" (March 12), 88-94.
Cadotte, Ernest E ., Robert B. Woodruff and Roger L. Jenkins (1987), "Expectations and Norms in Models of Consumer Satisfaction", Journal of Marketing Research. 24 (August), 305-314.
Cardozo, Richard N. (1965), "An Experimental Study of Consumer Effort, Expectations and Satisfaction", Journal of Marketing Research. 2 (August), 244-249.
Cardozo, Richard N. (1980), "Situational Segmentation of Industrial Markets", European Journal of Marketing. 14 (June), 264-276.
Carman, James M. (1990), "Consumer Perceptions of Service Quality: An Assesment of the SERVQUAL Dimensions", Journal of Retailing. 66 (1), (Spring), 33-55.
Chase, R.B. (1978), "Where Does The Customer Fit In a Service Operation?", Harvard Business Review. 56 (November/December), 137-142.
Churchill, Gilbert A. Jr. (1979), "A Paradigm for Developing Better Measures of Marketing Constructs", Journal of Marketing Research. 16 (February), 64-73.
Churchill, Gilbert A. Jr. (1987), Marketing Research: Methodological Foundations. Chicago: The Dryden Press.
Churchill, Gilbert A. Jr. and J. Paul Peter (1984), "Research Design Effects on the Reliability of Rating Scales: A Meta-Analysis", Journal of Marketing Research. 21, 360-375.
Churchill, Gilbert A. Jr. and Carol Surprenant (1982), "An Investigation Into the Determinants of Customer Satisfaction", Journal of Marketing Research. 19 (November), 491-504.
Conant, J. S., M. P. Mokwa and P. R. Vanadarajan (1990)", Strategic types, distinctive competences and organisational performance: A multiple measures-based study", Strategic Management Journal. 11, 365-383.
Corey, E.R. (1978), The Organizational Context of Industrial Buying Behavior. Cambridge MA: Marketing Science Institute.
Crane, F. G. (1991), "Consumer Satisfaction/Dissatisfaction with Professional Services", Journal of Professional Services Marketing. 7 (2), 19-25.
Cronin, J. Joseph and Steven A. Taylor (1992), "Measuring Service Quality: A Reexamination and Extension", Journal of Marketing. 56 (July), 55-68.
Czepiel, John A. and Larry J. Rosenberg (1977), "Consumer Satisfaction: Concept and Measurement", Journal of Academy of Marketing Science. 5(4),(Fall), 403-411.
196
Czepiel, John, Michael Solomon, Carol Suprenant and E.G. Gutman (1985), "Service Encounters: An Overview", in The Service Encounter. J. Czepiel, M. Solomon, andC. Surprenant, eds., Lexington, MA:Lexington Books, 3-16.
Darby, M. R. and E. Kami (1973), "Free Competition and the Optimal Amount of Fraud", Journal of Law and Economics. 16 (April), 67-86.
Davidow, William H. and Bro Uttal (1989), Total Customer Service: the Ultimate Weapon. New York:Harper and Row.
Dawes, Philip L. (1989), "An Empirical Study of Organizational Information Search in the Context of a Technological Durable Product". Unpublished PhD Dissertation, Australian Graduate School of Management, University of New South Wales.
Dawes, Philip L ., G. Dowling and Paul G. Patterson (1991), "Information Sources Used to Select Different Types of Management Consultancy Services", Asia Pacific Journal of Management. 8 (2) (October), 185-199.
Dawes, Phillip L ., G. Dowling and Paul G. Patterson (1992a), "Factors affecting the structure of buying centers for the purchase of business advisory services", International Journal of Research in Marketing. 9, 269-279.
Dawes, Phillip L ., G. Dowling and Paul G. Patterson (1992b), "Criteria Used to Select Management Consultants", Industrial Marketing Management. 21, 187-193.
Dawes, Phillip L ., G. Dowling and Paul G. Patterson (1993), "Determinants of PrePurchase Information Search Effort for Management Consulting Services", Journal of Business-to-Business Marketing. 1 (1), 31-61.
Dawes, Philip L ., and Paul G. Patterson (1992), "The Use of Technical Consultancy Services By Firms Making High Technology Purchase Decisions", in Proceedings of the 21st Annual Conference of the European Marketing Academy. K. G. Grunert andD. Fuglede, eds., Aarhus, Denmark (May) 261-275.
Day, Ralph L. (1984), "Modeling Choices among Alternative Responses to Dissatisfaction" in Advances in Consumer Research. Thomas C. Kinnear, ed., Provo UT: Association for Consumer Research, 11, 496-499.
Day, Ellen and Hiram C. Barksdale, Jr. (1992), "How Firms Select Professional Services", Industrial Marketing Management. 21, 85-91.
Deshpande, Rohit and Gerald Zaltman (1982), "Factors Affecting the Use of Market Research Information: A Path Analysis", Journal of Marketing Research. 19 (February), 14-31.
Duncan, Otis D. (1975), Introduction to Structural Equation Models. New York: Academic Press, Inc.
Duncan, Otis D. (1966), "Path Analysis: Sociological Examples", The American Journal of Sociology. 72 (1), (July), 365-74.
197
Duncan, Robert B. (1972), "Characteristics of Organizational Environments and Perceived Environmental Uncertainty", Administrative Science Quarterly. 17 (September), 313-27.
Economist (1991), "Solution-pedlars lose their charm", (February 9), 65-66.
Engel, James E ., R. Blackwell and Paul Miniard (1990), Consumer Behavior. 6th ed, Orlando FL: The Dryden Press.
Finkleman, D. and A. Gorland (1990), "How Not to Satisfy Your Customers", The McKinsev Quarterly Review. (Winter), 2-12.
Fishbein, Martin and leek Ajzen (1975) Belief. Attitudes. Intention and Behavior: An Introduction to Theory and Research. Reading, MA: Addison-Wesley Publishing Company.
Fisher, A.B. (1989), "The Ever-Bigger Boom in Consulting", Fortune. (April 24),
Fisk, Raymond P. (1981), "Towards A Consumption/Evaluation Process Model For Services”, in Marketing of Services. James H. Donnelly and Williams R. George, eds., Chicago: American Marketing Association, 191-195.
Fisk, Raymond P. and Kenneth A. Coney (1982), "Post-choice Evaluation: An Equity Analysis o f Consumer Satisfaction/Dissatisfaction with Service Choices", in Conceptual and Empirical Contributions to Consumer Satisfaction and Complaining Behavior, H. Keith Hunt and Ralph L. Day, eds., Bloomington, IN: Indiana University, 9-16.
Fisk, Raymond P. and Clifford E. Young (1985), "Discontinuation of Equity Expectations: Effects On Consumer Satisfaction With Services", Advances in Consumer Research. 12, Elizabeth Hischman and Morris Holbrook, eds., Chicago: American Marketing Association, 340-345.
Fomell, Claes (1992), "A National Customer Satisfaction Barometer: The Swedish Experience," Journal of Marketing. 56 (January), 6-21.
Fornell, Claes and W. Robinson (1983), "Industrial Organization and Consumer Satisfaction/Dissatisfaction", Journal of Consumer Research. 9 (March).
Ghingold, Morry and David T. Wilson (1985), "Buying Center Structure: An Extended Framework For Research", in A Strategic Approach to Business Marketing". Robert Spekman and David T. Wilson, eds., Chicago: American Marketing Association, 180-193.
Grashof, J. F. (1979), "Sharing the Purchase Decision", Journal of Purchasing and' Materials Management. 15, 26-32.
Gr</>nhaug, Kjell (1975), "Autonomous vs Joint Decisions in Organizational Buying", Industrial Marketing Management. 4, 265-271.
Gr^nhaug, Kjell (1977), "Exploring Consumer Complaining Behavior: A Model and Some Empirical Results," in Advances in Consumer Research. 4, W. D. Perrault, ed., Atlanta, GA: Association for Consumer Research, 159-165.
198
Grönroos, Christian (1978), "A Service-Oriented Approach to Marketing of Services", European Journal of M arketing 12 (8), 588-601.
Grönroos, Christian (1979), "An Applied Theory for Marketing Industrial Services", Industrial Marketing Management. 8, 45-50.
Grönroos,Christian (1982), Strategic Management and Marketing in the Service Sector, Helsingfors: Swedish School of Economics and Business Administration.
Grönroos, Christian (1984), "A Service Quality Model and its Marketing Implications", European Journal of Marketing. 18(4), 36-44.
Grönroos, Christian (1990), Service Management and Marketing. Massachusetts: Lexington Books.
Grönroos, Christian (1992), "Towards A Third Phase In Service Quality Research, Challenges and Future Directions", unpublished conference paper at Frontiers in Services—Conference, American Marketing Association, Vanderbilt University, Nashville September 24-26, 1992.
Gummesson, Evert (1978), "Toward a Theory of Professional Service Marketing", Industrial Marketing Management. 7, 89-95.
Gummesson, Evert (1981), "The Marketing of Professional Services - 25 Propositions", in Marketing Services. James H. Donnelly and William R. George, eds., American Marketing Association:Chicago.
Hanan, Mack and Peter Karp (1989), "Customer Satisfaction, How to Maximise, Measure and Market Your Company’s Ultimate Product", New YoricAMACOM.
Heise, David R. (1969), "Problems in Path Analysis and Causal Inference", in Sociological Methodology. E.F. Borgatta, ed., San Francisco: Jossey-Bass, 38-73.
Helson, Harry (1964), Adaption - Level Theory. New York: Harper & Row Publishers, Inc.
Hill, Donna J .(1986), "Satisfaction and Consumer Services", Advances in Consumer Research. Richard J Lutz, ed., Ann Arbor, Michigan: Association for Consumer Research, 13, 311-315.
Holbrook, Morris B. (1984), "Situation-Specific Ideal Points and Usage of Multiple Dissimilar Brands", in Research in Marketing. Jagdish N. Sheth, ed., Greenwich, CT: JAI Press, Inc., 7, 93-112.
Hunt, H. Keith (1977), "CS/D - Overview and Future Directions", in Conceptualization and Measurement of Consumer Satisfaction and Dissatisfaction. H. Keith Hunt, ed., Cambridge, MA: Marketing Science Institute, 455-488.
Huppertz, John W ., Sidney J. Arenson, and Richard H. Evans (1978), "An Application of Equity Theory to Buyer-Seller Exchange Situations", in Journal of Marketing Research. 15 (May), 250-260.
199
Jackson, Ralph W. and Philip D. Cooper (1988), "Unique Aspects of Marketing Industrial Services", Industrial Marketing Management. 17, 111-118.
Jasso, Guillermina and Peter H. Rossi (1977), "Distributive Justice and Earned Income", American Sociological Review. 42 (August), 639-651.
Jayanti, Rama and Anita Jackson (1991), "Service Satisfaction: An Exploratory Investigation of Three Models", Advances in Consumer Research. Marvin E. Goldberg, Gerald Gom and Richard W. Pollay, eds., New Orleans: Association for Consumer Research, 18, 603-609.
Johnston, Wesley J. and Thomas V. Bonoma (1981), "The Buying Centre: Structure and Interaction Patterns", Journal of Marketing. 45 (Summer), 143-156.
Joreskog, Karl G. (1973), "A General Model for Estimating a Linear Structural Equation System", in Structural Equation Models in the Social Sciences. Arthur S. Goldberger and Otis D. Duncan, eds., New York: Seminar Press, Inc. 85-112.
Kenny, David A. (1979), Correlation and Causality. New York: John Wiley & Sons.
Kirsch, Walter and Michael Kutschker (1982), "Marketing and Buying Decisions in Industrial Markets", in Studies in Decision Making. Martin Irie, ed., New York: Walter de Gruyter, 443-88.
Kohli, Ajay (1989), "Determinants of Influence in Organizational Buying: A Contingency Approach", Journal of Marketing. 53 (July), 50-65.
Kotler, Philip and Paul N. Bloom (1984), Marketing Professional Services. Englewood Cliffs, NJ: Prentice-Hall.
LaBarbera, Priscilla A. and David Mazursky (1983), "A Longitudinal Assessment of Consumer Satisfaction/ Dissatisfaction: The Dynamic Aspect of the Cognitive Process", Journal of Marketing Research. 29 (November), 393-404.
LaTour Stephen A. and Nancy C. Peat (1979), "Conceptual and Methodological Issues in Consumer Satisfaction Research", Advances in Consumer Research. William F. Wilkie, ed., Ann Arbor, Michigan: Association for Consumer Research, 6, 431437.
Leichty, M. and Gilbert A. Churchill, Jr. (1979), "Conceptual Insights into Consumer Satisfaction with Services", in Educators' Conference Proceedings. Neil Beckwith et al, eds., Chicago: American Marketing Association, 94, 509-515.
Levitt, Theodore (1972), "Production Line Approach to Service", Harvard Business Review. (50), 1972.
Lewis, Robert C. and Bernard H. Booms (1983), "The Marketing Aspects of Service Quality", in Emerging Perspectives on Services Marketing. L. Berry,, G. Shostack and G. Upah, eds., Chicago: American Marketing Association, 99-107.
Lovelock, Christopher H. (1981), "Why Marketing Management Needs to be Different for Services", in Marketing of Services. J. Donnelly and W. George, eds., Chicago: American Marketing Association, 5-9.
200
Lovelock, Christopher H. (1984), Services Marketing. Text. Cases & Readings. Englewood Cliffs, NJ: Prentice-Hall, Inc.
Lovelock, Christopher H. (1991), Services Marketing. Text Cases & Readings Englwood Cliffs, NJ: Prentice-Hall Inc.
Lynn, S.A. (1987), Identifying Buying Influences for a Professional Service: Implications for Marketing Efforts", Industrial Marketing Management. 16, 119-130.
Martin, Christopher and Ken Elliott (1971), "Causal Path Analysis", in Explorations in Marketing Thought. G. Willis, ed., Bradford: University Press, 219-232.
Mason, Charlotte H. and William D. Perreault (1991), "Collinearity, Power, and Intrpretation of Multiple Regression Analvsis". Journal of Marketing Research. 28 (August), 268-80. ~ 6-------------
Mazursky, David and A. Geva (1989), "Temporal Decay in Satisfaction - Purchase Intention Relationship", Psychology and Marketing. 6 (3), (Fall), 211-217.
McCabe, Donald L. (1987), "Buying Group Structure: Constriction at the Top", Journal of Marketing. 51 (October), 89-98.
McCarthy, E. Jerome, and William D. Perrault jr ., (1984), Basic Marketing. 8th ed., Homewood, 111: Richard D. Irwin Inc.
McQuiston, Daniel H. (1989), "Novelty, Complexity and Importance as Causal Determinants of Industrial Buyer Behavior", Journal of Marketing. 53 (April), 66-79.
Miller, John (1977), "Studying Satisfaction, Modifying Models, Eliciting Expectations, Posing Problems, and Making Meaningful Measurements", in Conceptualization and Measurement of Consumer Satisfaction and Dissatisfaction. H. Keith Hunt, ed., Cambridge, Mass: Marketing Science Institute, 72-91.
Moffet, Libby (1989), "Consultants Collect SlOOm". Financial Review. (September 22), 31.
Moriarty, Roland T. (1983), Industrial Buying Behavior. Lexington MA: D.C. Heath.
Morris, M .H. and D.A. Fuller (1989), "Pricing an Industrial Service", Industrial Marketing Management. 18, 139-146.
Mundt, J. (1989), A Study of Relationships Between Performance. Consumer Satisfaction/Dissatisfaction and Repeat Intentions. PhD Thesis, Ann Arbor: U.M .I. Dissertation Information Service.
Myers, James H. (1991), "Measuring Customer Satisfaction: Is Meeting Expectations Enough?", Marketing Research. (December), 35-43.
Myers, Raymond H. (1990), Classical And Modem Regression With Applications. 2nd ed., Boston: PWS-Kent Publishing Coy.
Nelson, P. (1970), "Advertising as Information", Journal of Political Economy. 81 (July-August), 728-754.
201
Nie, Norman H ., C. Hadlai Hull, Jean G. Jenkins, Karen Steinbrenner and Dale H. Bent (1975), Statistical Package for the Social Sciences. 2nd ed., New York: McGraw-Hill Inc.
Nunnally, Jum C. (1978), Psychometric Theory. New York: McGraw Hill Book Coy.
Oliver Richard L. (1977), "A Theoretical Reinterpretation of Expectation and Discontinuation Effects on Posterior Product Evaluation : Experiences in the Field", in Consumer Satisfaction. Dissatisfaction and Complaining Behavior. Ralph Day, ed., Bloomington, IN: Indiana University (April), 2-9.
Oliver Richard L. (1979), "Product Satisfaction as a Function of Prior Expectations and Subsequent Disconfirmation: New Evidence", in New Dimensions of Consumer Satisfaction and Complaining Behavior. Ralph Day and K. H. Hunt, eds., Bloomington, IN: Indiana University, 66-71.
Oliver, Richard L. (1980a), "A Cognitive Model of the Antecedents and Consequences of Satisfaction Decisions", Journal of Marketing Research. 17 (November), 460-469.
Oliver, Richard L. (1980b), "Conceptualization and Measurement of Disconfirmation Perceptions in the Prediction of Customer Satisfaction", in Proceedings of Fourth Annual Conference on Consumer Satisfaction. Dissatisfaction and Complaining Behavior. H.K. Hunt and R.L. Day, eds., Bloomington, IN: School of Business, Indiana University, 2-6.
Oliver, Richard L. (1980c), "Theoretical Bases of Consumer Satisfaction Research: Review, Critique, and Future Direction," in Theoretical Developments in Marketing. C. W. Lamb and P. M. Dunne, eds., Chicago, IL: American Marketing Association, 206-210.
Oliver, Richard L. (1981), "Measurement and Evaluation of Satisfaction Processes in Retail Settings", Journal of Retailing. 57 (Fall), 25-48.
Oliver, Richard L. (1989), "Processing of the Satisfaction Response in Consumption: A Suggested Framework and Research Propositions", Journal of Satisfaction. Dissatisfaction and Complaining Behavior. 2, 1-16.
Oliver, Richard L. and W. O. Bearden (1983), "The Role of Involvement in Satisfaction Processes", in Advances in Consumer Research. Richard P. Bagozzi, and A. M. Tybout, eds., Ann Arbor, MI: Association for Consumer Research, 10, 250255.
Oliver, Richard L. and W. O. Bearden (1985), "Disconfirmation Processes and Consumer Evaluations in Product Usage", Journal of Business Research. 13, 235-246.
Oliver, Richard L. and Wayne S. DeSarbo (1988), "Response Determinants in Satisfaction Judgements", Journal of Consumer Research. 14 (March), 495-508.
Oliver, Richard L. and John E. Swan (1989), "Consumer Perceptions of Interpersonal Equity and Satisfaction in Transactions: A Field Survey Approach", Journal of Marketing. 53 (April), 21-35.
202
Olshavsky, Richard W. and John A. Miller (1972), "Consumer Expectations, Product Performance and Perceived Product Quality", Journal of Marketing Research 9 (February) 19-21. “
Olson, Gerry C. and P. Dover (1976), "Effects of Expectation Creation and Disconfirmation on Belief Elements of Cognitive Structure", in Advances in .Consumer Research, Beverlee B. Anderson, ed., Chicago: Association for Consumer Research, 3, 168-175.
Olson, Gerry C. and P. Dover (1979), "Disconfirmation of Consumer Expectations Through Product Trial", Journal of Applied Psychology. 64 (April), 179-189.
Parasuraman, A ., Leonard L. Berry, and Valarie A. Zeithaml (1991a), Understanding Customer Expectations of Service". Sloan Management Review.
(Spring), 39-48. 6--------------------
Parasuraman, A ., Leonard L. Berry and Valarie A. Zeithaml (1991b), "Refinement and Reassessment of the SERVQUAL Scale", Journal of Retailing. 67 (4), 420-450.
Parasuraman, A ., Valarie A. Zeithaml and Leonard L. Berry, (1985), "A Conceptual Model of Service Quality and Its Implications for Future Research", Journal of Marketing. 49 (Fall), 41-50.
Parasuraman, A ., Valarie A. Zeithaml and Leonard L. Berry (1988), "SERVQUAL: A Multiple-Item Scale for Measuring Consumer Perceptions of Service Quality", Journal of Retailing. 64 (1), 12-37.
Parasuraman A. mid V.A. Zeithaml (1983) "Differential Perceptions of Suppliers and Clients of Industrial Services", in Emerging Perspectives on Services Marketing. L. Berry, G.L. Shostack and G. Upta, eds., Chicago: American Marketing Association,
Patterson, Paul G. (1993), "The Role of Expectations and Product Performance for a High-Involvement Product", Psychology and Marketing. 10 (5), (Forthcoming).
Patterson, Paul G. and Lester W. Johnson (1993), "Disconfirmation of Expectations and the Gap Model of Service Quality: An Integrated Paradigm", Journal of Consumer Satisfaction. Dissatisfaction and Complaining Behavior. Bloomington, IN: Indiana University. (Forthcoming).
Patterson, Paul G. and Graham Pascoe (1988), "International Marketing of Australian Distance Education", in National Marketing Educators Conference Proceedings. Griffith University, Queensland, 2-21.
Patterson, P ., T. Romm and C. Hill (1992), "Consumer Satisfaction as a Process: A Qualitative, Longitudinal Study of Overseas Students in Australia", Paper presented at TIMS Special Interest Conference on Services Marketing. Customer Satisfaction and Service Quality. Vanderbilt University, Nashville (March).
Pennings, J.M . (1979), "Coordination between strategically interdependent organisations", in Handbook of Organisational Design. P. Nystrom and W. Starbuck, eds., Amsterdam: Elsevier.
203
Peter, J. Paul (1979), "Reliability: A Review of Psychometric Basics and Recent Marketing Practices”, Journal of Marketing Research. 16, 6-17.
Peter, J. Paul and Gilbert A. Churchill, Jr. (1986), "Relationships Among Research Design Choices and Psychometric Properties of Rating Scales: A Meta-Analysis", Journal of Marketing Research. 23 (February), 1-10.
Philips, L. W. (1981), "Assessing Measurement Error in Key Informant Reports: A Methodological Note on Organizational Analysis in Marketing". Journal of Marketing Research. 18, 395-415.
Price Waterhouse Post (1991), (November), 3.
Reeder, Robert, E.G. Brierty and Betty Reeder (1987), Industrial Marketing Management. Englewood Cliffs, NJ: Prentice-Hall Inc.
Robinson, Patrick J., Charles W. Faris and Yoram J. Wind (1967), Industrial Buying and Creative Marketing. Boston: Allyn and Bacon.
Ross, Caroline K ., Gayle Frommelt, Liza Hazlewood, and Rowland W. Chang (1987), "The Role of Expectations in Patient Satisfaction with Medical Care", Journal of Health Care Marketing. 4 (December), 16-26.
Ruekert, Robert W. and Gilbert A. Churchill Jr. (1984), "Reliability and Validity of Alternative Measures of Channel Member Satisfaction", Journal of Marketing Research. 21 (May), 226-233.
Rust, Roland T. and Richard L. Oliver (1992), "Service Quality: Observations and Hypotheses", unpublished conference paper at Frontiers in Services Conference. American Marketing Association, vanderbilt University, Nashville, September 24-26.
Shapiro, E. Gary (1975), "Effect of Expectations of Future Interaction on Reward Allocations in Dyads: Equity or Equality", Journal of Personality and Social Psychology. 31 (May), 873-80.
Sheth, Jagdish N. (1973), "A Model of Industrial Buyer Behavior", Journal of Marketing. 37 (October), 50-56.
Shostack, G. Lynn (1977), "Breaking Free From Product Marketing", Journal of Marketing. 41 (April), 73-80.
Shostack, G. Lynn (1987), "Service Positioning Through Structural Change", Journal of Marketing. 51 (January), 34-43.
Silk, Alvin J. and Manohar V. Kalwani (1982), "Measuring Influence in Organizational Purchase Decisions", Journal of Marketing Research. 19 (May), 165181.
Spekman, Robert E. (1977), "A Contingency Approach to Power Relationships Within the Industrial Buying Task Group", unpublished Ph.D. dissertation. Evanston: Northwestern University.
Stewart, David W. (1981), "The Application and Misapplication of Factor Analysis in Marketing Research", Journal of Marketing Research. 18, 51-62.
204
Stock, J. R. and P. H. Zinszer (1987), "The Industrial Purchase Decision for Professional Services", Journal of Business Research. 15, 1-16.
Suryanarayanan, Shankar (1989), "Trends and Outlook for U.S. Consulting", Journal of Management Consulting. 5 (4), 3-9.
Swan, John .E. (1982), "Consumer Satisfaction Research and Theory: Current Status and Future Directions", in Proceedings of The Seventh Annual Conference On Consumer Satisfaction. Dissatisfaction and Complaining Behavior. H.K. Hunt and R.L. Day, eds., Bloomington, IN: Indiana University, 124-129.
Swan, John .E. (1988), "Consumer Satisfaction Related to Disconfirmation of Expectations and Product Performance", Journal of Consumer Satisfaction. Dissatisfaction and Complaining Behavior. Bloomington, IN: Indiana University, 1,
Swan, John E. and Frederick I. Trawick (1979a), "Triggering Cues and the Evaluation of Products as Satisfactory or Dissatisfactory", in Educator's Conference Proceedings. N. Beckwith, M. Houston, R. Middlestaedt, K. B. Monroe, and S. Ward, eds., Chicago: American Marketing Association, 231-234.
Swan, John E. and Frederick I. Trawick (1979b), "Satisfaction Related to Predictive vs Desired Expectations," in New Dimensions of Consumer Satisfaction. Dissatisfaction and Complaining Behavior. Ralph L. Day and H. Keith Hunt, eds., Bloomington, IN: School of Business, Indiana University, 7-12.
Swan, John E. and Frederick I. Trawick (1980), "Satisfaction Related to Predictive vs Desired Expectations", in Retaining Concepts and Measures of Consumer Satisfaction and Complaining Behavior. Ralph L. Day and Keith Hunt, eds., Bloomington: School of Business, Indiana University, 7-12.
Swan, John E. and Linda J. Combs (1976), "Product Performance and Consumer Satisfaction: A New Concept", Journal of Marketing. 40 (April), 25-33.
Thomas, Dan R. E. (1978), "Strategy is Different in Service Business", Harvard Business Review. (July-August), 158-165.
Trawick, I. Frederick and John E. Swan (1980), "Inferred and Perceived Disconfirmation in Consumer Satisfaction", in Advances in Consumer Research. 97100.
Tse, David K. and Peter C. Wilton (1988), "Models of Consumer Satisfaction Formation: An Extension", Journal of Marketing Research. 25 (May), 204-212.
Tse, David K. Franco M. Nicosia, and Peter C. Wilton (1990), "Consumer Satisfaction as a Process", Psychology and Marketing. 7 (3), (Fall), 177-193.
Turner, Everett B. (1969), "Marketing Professional Services", Journal of Marketing. 33 (October), 56-61.
Webster, C. (1989), "Can Consumers Be Segmented On The Basis of Their Service Quality Expectations?", Journal of Services Marketing. 3(2), 35-53.
205
Webster, Frederick E. (1974), Marketing for Managers. New York: Harper & Row, Publishers Inc.
Webster, Frederick E. (1978), "Management Science in Industrial Marketing Marketing", Journal of Marketing. 42 (January), 21-27.
Webster, Frederick E. (1980), Industrial Marketing Strategy. New York: Ronald Press.
Webster Frederick E. and Yoram J. Wind (1972), Organizational Buying Behavior. New York: Prentice-Hall Inc.
Westbrook, Robert A. (1987), "Product/Consumption-based Affective Responses and Postpurchase Processes", Journal of Marketing Research. 24 (August), 258-270.
Westbrook, Robert A. and Richard L. Oliver (1991), "The Dimensionability of Consumption Patterns and Consumer Satisfaction", Journal of Consumer Research. 18 (June), 84-91.
Westbrook, Robert A. and Michael D. Reilly (1983), "Value-Percept Disparity: An Alternative to the Discontinuation of Expectations Theory of Consumer Satisfaction", in Advances in Consumer Research. Richard P. Bagozzi and Alice M Tybout, eds., Ann Arbor, Michigan: Association for Consumer Research, 10, 256-261.
Wheiler, K. (1987), "Referrals Between Professional Service Providers", Industrial Marketing Management. 16, 191-200.
Wilkie, William L ., (1990), Consumer Behavior. 2nd ed., New York: J.Wiley & Sons.
Wilson, Elizabeth J., G.L. Lilien and David T. Wilson (1989), "Situational Factors and Formal Models of Group Choice in Organizational Buying: A Contingency Paradigm", Working Series Paper 3124-A. Department of Marketing. Louisiana State University.
Wilton, Peter C. and Franco M. Nicosia (1986), "Emerging Paradigms", European Research. 14, 4-11.
Wind, Yoram J. and Robert J. Thomas (1980), "Conceptual and Methodological Issues in Organizational Buying Behaviour", European Journal of Marketing. 14, 239263.
Woodruff, Robert B, Ernest R. Cadotte and Roger L. Jenkins (1983), "Modeling Consumer Satisfaction Processes Using Experience-Based Norms", Journal of Marketing Research. 20 (August), 296-304.
Woodside, Arch G., Lisa L. Frey and Robert T. Daly (1989), "Linking Service Quality, Customer Satisfaction, and Behavior Intention", Journal of Health Care Marketing. 9 (December), 5-17.
Wright, Sewall (1934), "The Method of Path Coefficients", Annals of Mathematical Statistics. 5 (September), 161-215.
206
Zeithaml, Valarie A. (1981), "How Consumers Evaluation Processes Differ Between Goods and Services", in Marketing of Services. J. H. Donnelly and W. R. George, eds., Chicago: American Marketing Association, 186-190.
Zeithaml, Valarie A. (1988), "Consumer Perceptions of Price, Quality and Value: A Means-End Model and Synthesis of Evidence", Journal of Marketing. 52 (July), 2-22.
Zeithaml, Valarie A ., A. Parasuraman and Leonard L. Berry (1985), "Problems and Strategies in Services Marketing", Journal of Marketing. 49 (Spring), 33-46.
Zeithaml, Valarie A ., A. Parasuraman and Leonard L. Berry (1990), Delivering Service Quality: Balancing Customer Perceptions and Expectations. New York: The Free Press.
Zeithaml, Valarie A ., Leonard L. Berry and A. Parasuraman (1991), "The Nature and Determinants o f Customer Expectations of Service", Marketing Science Institute Working Paper. Report 91-113. 1-27.
Zaichkowsky, Judith (1985), "Measuring the Involvement Construct", Journal of Consumer Research. 12 (December), 341-352.
Zolla, R .W ., (1988), Environment. Strategy and Performance in the Professional Service Firm . PhD Thesis, Graduate School of Management, Boston University.

APPENDICES
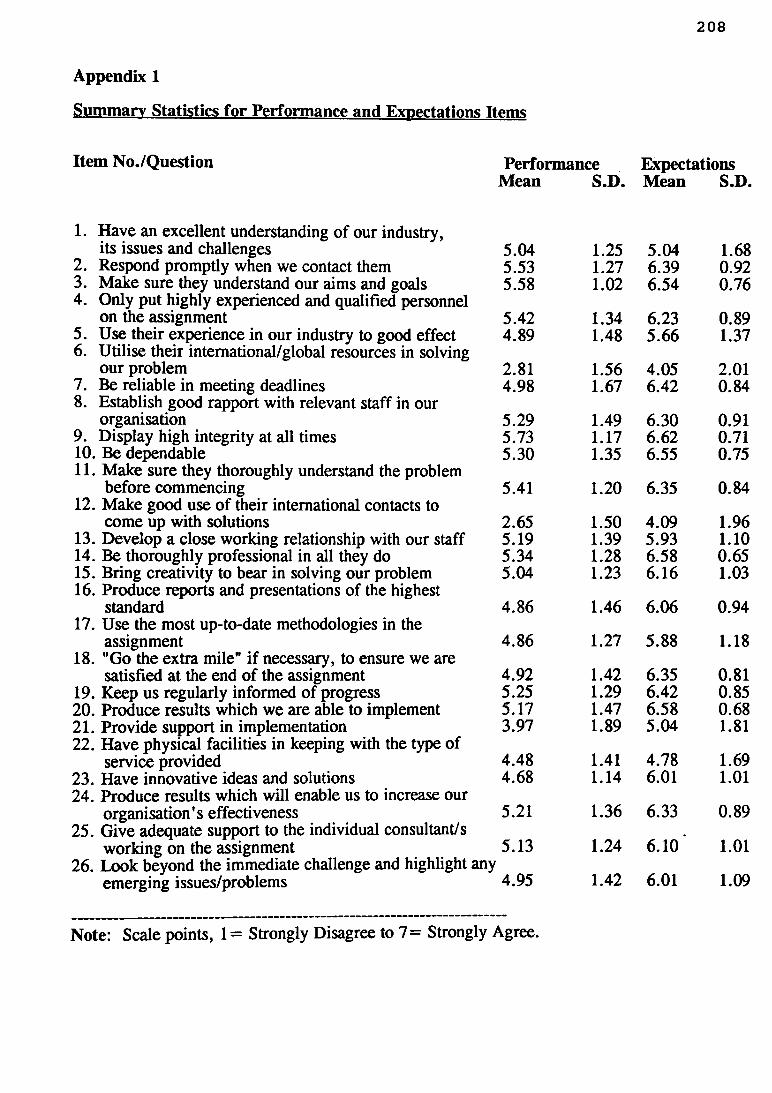
Summary Statistics for Performance and Expectations Items
Appendix 1
208
Item No./Question
1. Have an excellent understanding of our industry, its issues and challenges
2. Respond promptly when we contact them3. Make sure they understand our aims and goals4. Only put highly experienced and qualified personnel
on die assignment5. Use their experience in our industry to good effect6. Utilise their intemational/global resources in solving
our problem7. Be reliable in meeting deadlines8. Establish good rapport with relevant staff in our
organisation9. Display high integrity at all times10. Be dependable11. Make sure they thoroughly understand the problem
before commencing12. Make good use of their international contacts to
come up with solutions13. Develop a close working relationship with our staff14. Be thoroughly professional in all they do15. Bring creativity to bear in solving our problem16. Produce reports and presentations of the highest
standard17. Use the most up-to-date methodologies in the
assignment18. "Go the extra mile” if necessary, to ensure we are
satisfied at the end of the assignment19. Keep us regularly informed of progress20. Produce results which we are able to implement21. Provide support in implementation22. Have physical facilities in keeping with the type of
service provided23. Have innovative ideas and solutions24. Produce results which will enable us to increase our
organisation's effectiveness25. Give adequate support to the individual consultant/s
working on the assignment26. Look beyond the immediate challenge and highlight
emerging issues/problems
Performance ExpectationsM ean S.D. M ean S.D.
5.04 1.25 5.04 1.685.53 1.27 6.39 0.925.58 1.02 6.54 0.76
5.42 1.34 6.23 0.894.89 1.48 5.66 1.37
2.81 1.56 4.05 2.014.98 1.67 6.42 0.84
5.29 1.49 6.30 0.915.73 1.17 6.62 0.715.30 1.35 6.55 0.75
5.41 1.20 6.35 0.84
2.65 1.50 4.09 1.965.19 1.39 5.93 1.105.34 1.28 6.58 0.655.04 1.23 6.16 1.03
4.86 1.46 6.06 0.94
4.86 1.27 5.88 1.18
4.92 1.42 6.35 0.815.25 1.29 6.42 0.855.17 1.47 6.58 0.683.97 1.89 5.04 1.81
4.48 1.41 4.78 1.694.68 1.14 6.01 1.01
5.21 1.36 6.33 0.89
5.13 1.24 6. 10 ' 1.01
4.95 1.42 6.01 1.09
Note: Scale points, 1 = Strongly Disagree to 7 = Strongly Agree.
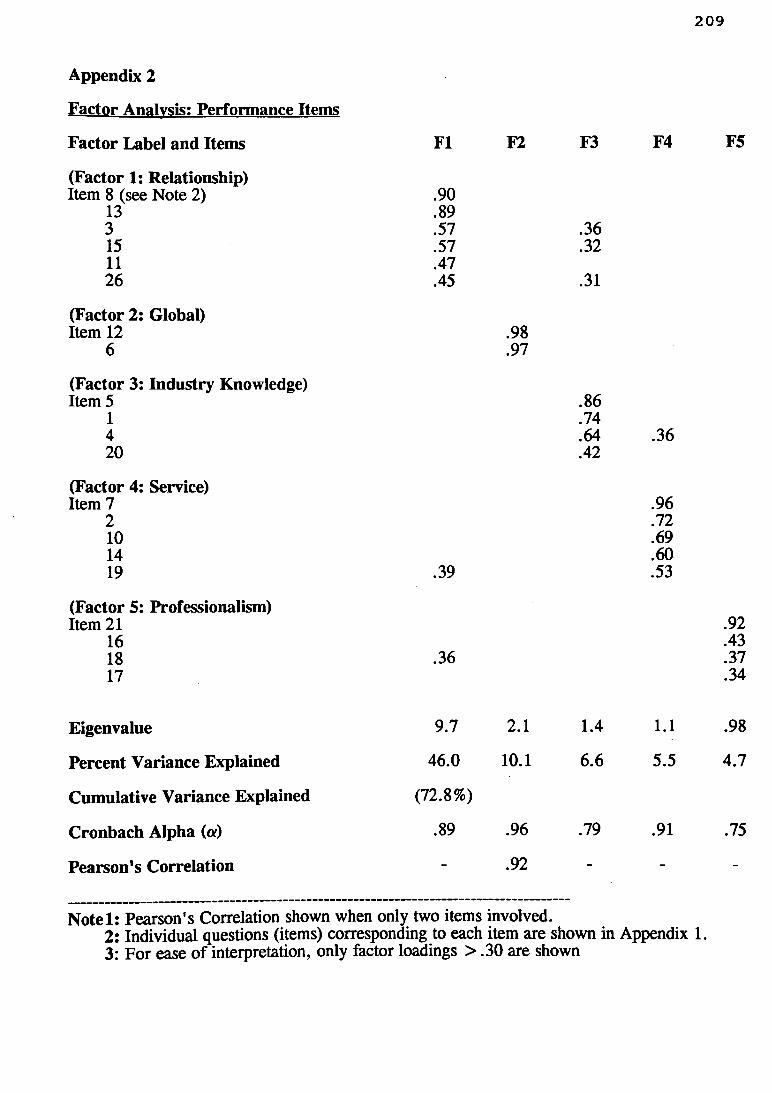
209
Appendix 2
Factor Analysis: Performance Items
Factor Label and Items FI F2 F3 F4 F5
(Factor 1: Relationship)Item 8 (see Note 2) .90
13 .893 .57 .3615 .57 .3211 .4726 .45 .31
(Factor 2: Global)Item 12 .98
6 .97
(Factor 3: Industry Knowledge) Item 5 .86
1 .744 .64 .3620 .42
(Factor 4: Service) Item 7 .96
2 .7210 .6914 .6019 .39 .53
(Factor 5: Professionalism) Item 21 .92
16 .4318 .36 .3717 .34
Eigenvalue 9.7 2.1 1.4 1.1 .98
Percent Variance Explained 46.0 10.1 6.6 5.5 4.7
Cumulative Variance Explained (72.8%)
Cronbach Alpha (a) .89 .96 .79 .91 .75
Pearson's Correlation - .92 - - -
N otel: Pearson's Correlation shown when only two items involved.2: Individual questions (items) corresponding to each item are shown in Appendix 1. 3: For ease of interpretation, only factor loadings > .30 are shown
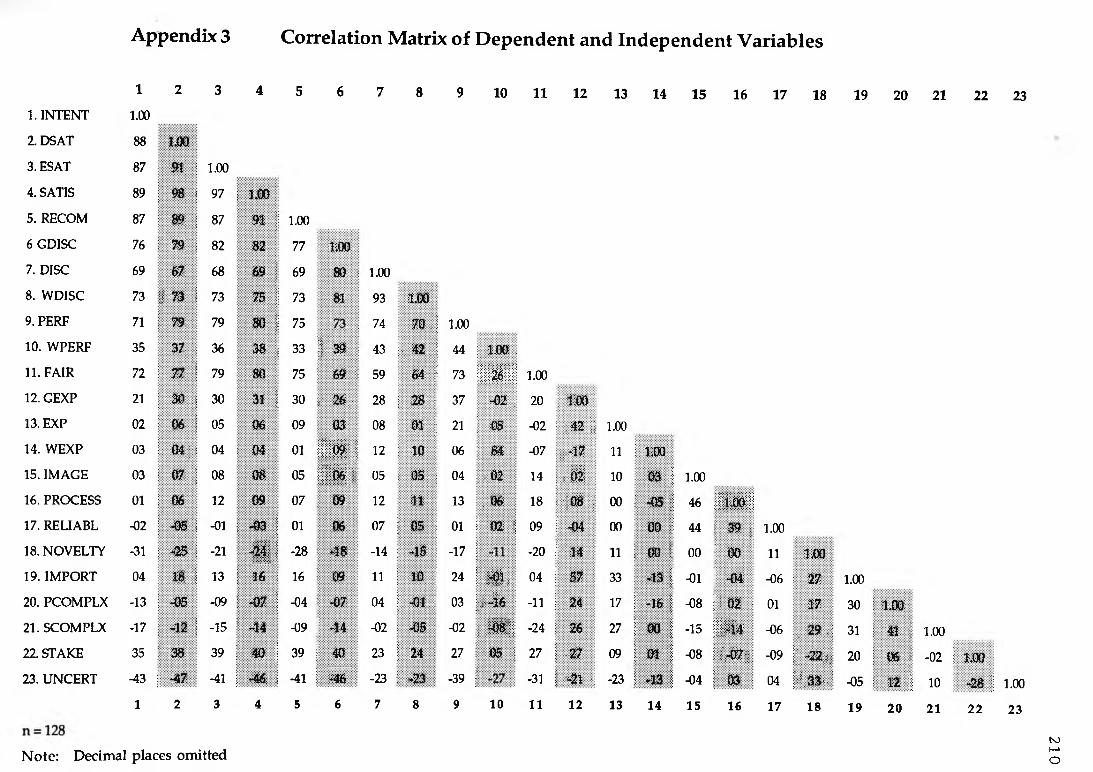
Appendix 3 Correlation M atrix o f D ependent and Independent V ariab les
1 2 3 4 5 6 7 8 9 10 11 12 13 14 15 16 17 18 19 20 21 22 231. INTENT 1.00
2. DSAT 88 1,00
3. ESAT 87 n j 1.00
4. SATIS 89 j 98 j 97 | 1.00
5. RECOM 87 I 89 j 87 91 1 1.00
6GDISC 76 ! 79 : 82 82 77 LOO
7. DISC 69 67 68 69 i 69 80 : 1.00
8. WDISC 73 ; 73 1 73 75 J 73 81 93 1.00
9. PERF 71 j 79 79 80 j 75 : 74 70 :j 1.00
10. WPERF 35 37 : 36 38 ! 33 1 39 ; 43 ;•• 42 j 44 j 1.00 .
11. FAIR 72 ! 77 j 79 80 75 ! 69 j 59 64 j 73 !I l l 1.00
12. GEXP 2i ; 30 ; 30 31 j 30 ;: ' 26 • 28 ; 28 j 37 -02 . 20 !.1 0 0
13. EXP 02 ! 06 1 05 06 09 ; 03 08 01 i 21 ! 05 -02 : ; 42 '/ 1.00
14. WEXP 03 !.0 4 ; : 04 : 04 01 im u j! i2 ; 10 06 ; 84 -07 ;;:*l7 h ! LOO
15. IMAGE 03 j 07 ; os 08 05 :1 1 ; 05 ; 05 ; 04 ; .02 14 ; : U i° 03 J 1.00
16. PROCESS 01 ! 06 12 09 07 : 09 12 11 13 . 06 18 : •;ôë ; 00 : -05 I 46 :i l l17. RELIABL -02 j -05 j -01 j -03 Ì 01 06 ! 07 j 05 : 01 1 02 ; 09 \ -04 00 00 1 44 ; 39 ; 1.00
18. NOVELTY -31 j *25 ; -2i 1ü
i
Î -28 1 *18 ! -14 ; *1$ ; -17 1 -20 1' 14 n I 00 1 00 i DO h 1XX3
19. IMPORT 04 1$ 1; 13 1 16 : 16 î 09 h ! 10 \ 24 j S : 04 j 57 33 •+13 ! -oi j -04 -06 : 27 1.00
20. PCOMPLX -13 j -05 -09 ! -07 j -04 ; -07 04 j -01 ; 03 |;.;- -Ï6 • -11 || 24 17 ! -16 1 -08 j : o2 • 01 17 30 ; 1.00
21. SCOMPLX -17 ; -12 j -15 ! -14 -09 j -14 -02 : -05 -02 : .Ä | -24 ; 26 27 j 00 j -15 jSIÎ4 . -06 . 29 . ; 31 1 41 l 1.00
22. STAKE 35 ! 38 39 j 40 1 39 j 40 23 j 24 i 27 ! •o$ ; 27 1 •27 09 j 01 1 -08 j•;’:-b7;. -09 Ü■ *22.;; 20 1 06 } -02 j LOO23. UNCERT -43 j *47 -41 j +46; I -41 j k
\
-23 1 *23 -39 j -31 j -2 i -, -23 I. *13 1 -04 1 03 • 04 1:;'.33v; -05 ! 12 j 10 “28 j 1.001 2 3 4 5 6 7 8 9 10 11 12 13 14 15 16 17 18 19 20 21 22 23
N o te : D ecim al places om itted
210
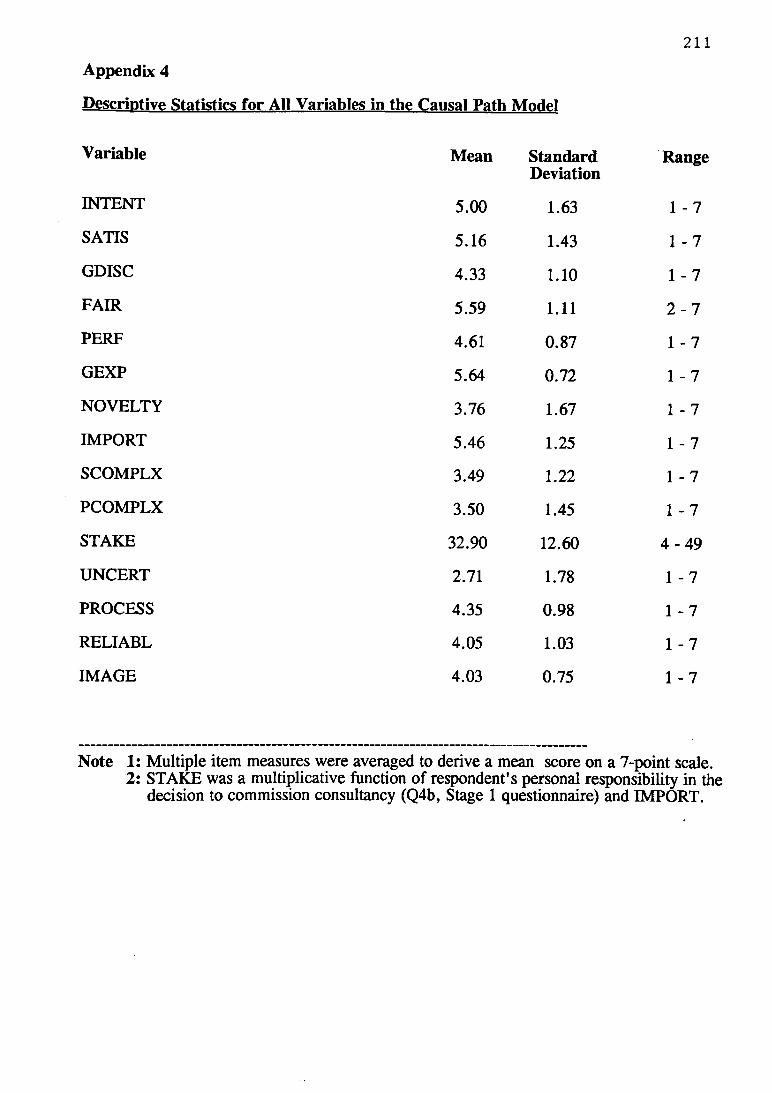
Descriptive Statistics for All Variables in the Causal Path Model
Appendix 4
211
Variable M ean StandardDeviation
Range
INTENT 5.00 1.63 1 - 7
SATIS 5.16 1.43 1 - 7
GDISC 4.33 1.10 1 - 7
FAIR 5.59 1.11 2 - 7
PERF 4.61 0.87 1 - 7
GEXP 5.64 0.72 1 - 7
NOVELTY 3.76 1.67 1 - 7
IMPORT 5.46 1.25 1 - 7
SCOMPLX 3.49 1.22 1 - 7
PCOMPLX 3.50 1.45 1 - 7
STAKE 32.90 12.60 4 - 4 9
UNCERT 2.71 1.78 1 - 7
PROCESS 4.35 0.98 1 - 7
RELIABL 4.05 1.03 1 - 7
IMAGE 4.03 0.75 1 - 7
Note 1: Multiple item measures were averaged to derive a mean score on a 7-point scale. 2: STAKE was a multiplicative function of respondent's personal responsibility in the
decision to commission consultancy (Q4b, Stage 1 questionnaire) and IMPORT.

Appendix 5
Copy of Stage 1 and Stage 2 Questionnaires, and Covering Letters
U N IV E R S IT Y O F W O L L O N G O N GDEPARTMENT OF MANAGEMENT
Dear
A Study of Client Decision Processes in Commissioning a Management Consultant
Thank you for agreeing to take part in this important research project. Very little empirical research has been undertaken anywhere concerning the decision processes that clients go through when purchasing professional business services. The focus of this study is the Management Consulting industry. The primary research purpose is to gain an understanding of client perceptions and decision processes surrounding the commissioning of a management consultant.
I appreciate that you probably have a heavy schedule, but ask that you take the time to carefully complete this questionnaire. My pre-testing indicates it will take only 15-20 minutes to complete.
Your responses will be treated as strictly confidential, and only be aggregated with all other responses to form an overall picture.
In return fo r your contribution you will receive a non-confidential copy o f an executive summary o f the research findings. Thank you for your co-operation and support.
Yours sincerely,
P . O . B O X 1 1 4 4 C N O R T H F I E L D S A V E N U E ] , W O L L O N G O N G , N . S . W . 2 5 0 0 , A U S T R A L I A
Phone: (M 2 ) 21 3 5 5 5 [Switchboard], [042] 21 3707 [Direct],
Telex: 29022 . Gable: UNIOFWOL. Fax: [042] 2Y 2YB5.
p.s. If you have any queries, don’t hesitate to contact me on (042) 213 707.
Enc.
UNIVERSITY OF WOLLONGONG — Department of Management
How to Complete this Questionnaire
Most questions refer to your recent decision to commission a Management Consultant. Please use this consulting assignment as the reference point for completing this questionnaire.
In most cases I would like you to circle a number which best reflects your opinion or behaviour. In a few instances, you are asked to supply short written answers or write a number.
If you have any queries, please telephone Paul Patterson on (042) 213707.
© 1991 P. G. Patterson, Department of Management, University of Wollongong.
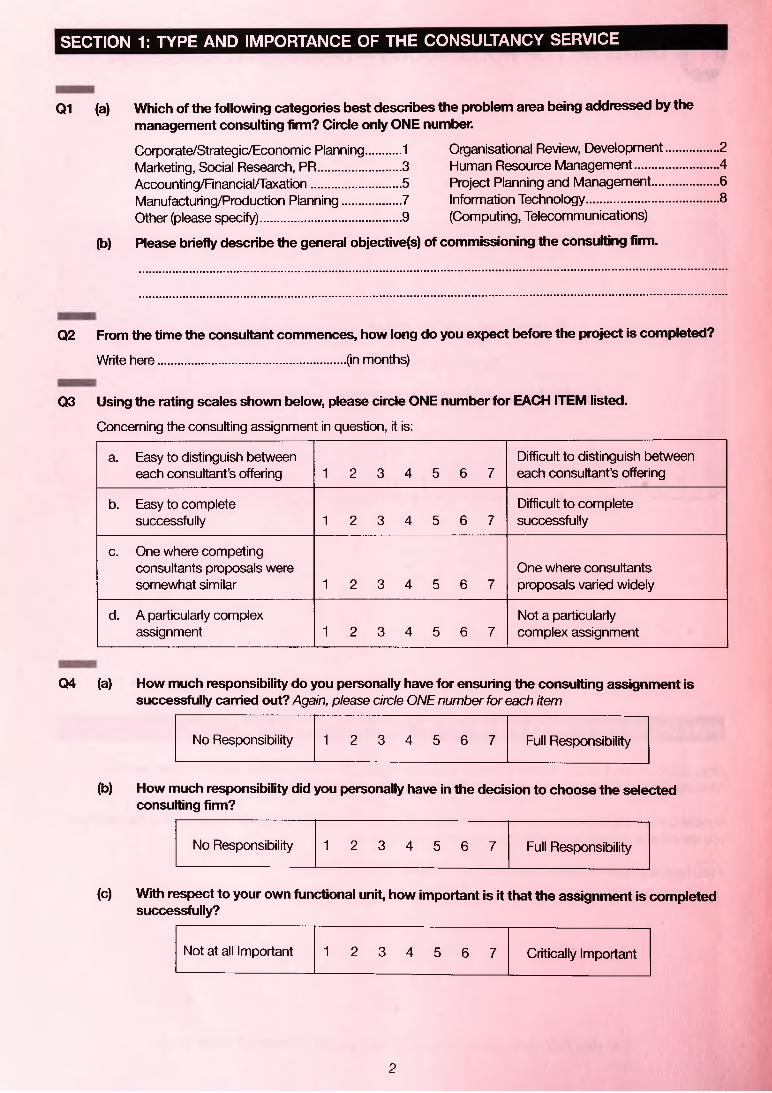
SECTION 1: TYPE AND IMPORTANCE OF THE CONSULTANCY SERVICE
Q1 (a)
(b)
Which of the following categories best describes the problem area being addressed by the management consulting firm? Circle only ONE number.
Corporate/Strategic/Economic Planning......... 1Marketing, Social Research, PR..................... 3Accounting/Financial/Taxation....................... 5Manufacturing/Production Planning............... 7Other (please specify).................................... 9
Organisational Review, Development..............2Human Resource Management......................4Project Planning and Management................. 6Information Technology.................................. 8(Computing, Telecommunications)
Please briefly describe the general objective(s) of commissioning the consulting firm.
Q2 From the time the consultant commences, how long do you expect before the project is completed?
Write here................................................ (in months)
Q3 Using the rating scales shown below, please circle ONE number for EACH ITEM listed.
Concerning the consulting assignment in question, it is:
a. Easy to distinguish between each consultant’s offering 1 2 3 4 5 6 7
Difficult to distinguish between each consultant’s offering
b. Easy to complete successfully 1 2 3 4 5 6 7
Difficult to complete successfully
c. One where competing consultants proposals were somewhat similar 1 2 3 4 5 6 7
One where consultants proposals varied widely
d. A particularly complex assignment 1 2 3 4 5 6 7
Not a particularly complex assignment
04 (a) How much responsibility do you personally have for ensuring the consulting assignment is successfully carried out? Again, please circle ONE number for each item
No Responsibility 1 2 3 4 5 6 7 Full Responsibility
(b) How much responsibility did you personally have in the decision to choose the selected consulting firm?
No Responsibility 1 2 3 4 5 6 7 Full Responsibility
(c) With respect to your own functional unit, how important is it that the assignment is completed successfully?
Not at all Important 1 2 3 4 5 6 7 Critically Important
2
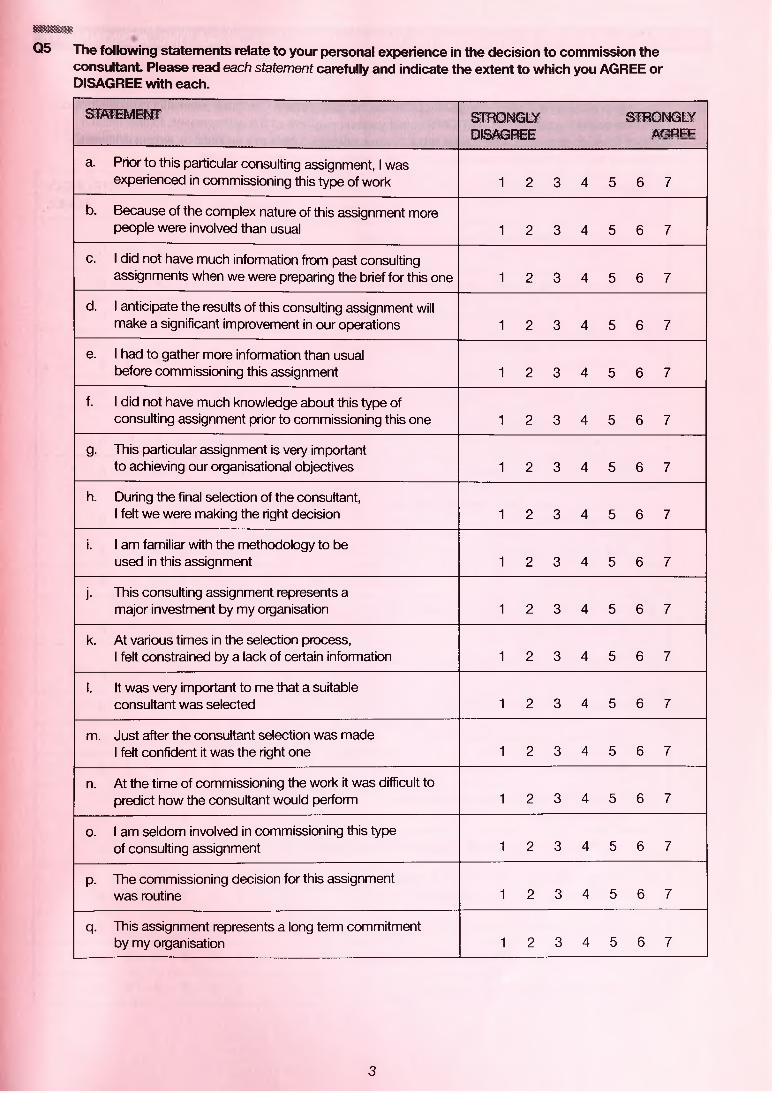
« ■ IllQ5 The following statements relate to your personal experience in the decision to commission the
consultant. Please read each statement carefully and indicate the extent to which you AGREE or DISAGREE with each.
STATEMENT STRONGLYn i O A P D C CUloAvjtHfcfc
STRONGLYAfiRFF
a. Prior to this particular consulting assignment, 1 was experienced in commissioning this type of work 1 2 3 4 5 6 7
b. Because of the complex nature of this assignment more people were involved than usual 1 2 3 4 5 6 7
c. 1 did not have much information from past consulting assignments when we were preparing the brief for this one 1 2 3 4 5 6 7
d. 1 anticipate the results of this consulting assignment will make a significant improvement in our operations 1 2 3 4 5 6 7
e. 1 had to gather more information than usual before commissioning this assignment 1 2 3 4 5 6 7
f. 1 did not have much knowledge about this type of consulting assignment prior to commissioning this one 1 2 3 4 5 6 7
g- This particular assignment is very important to achieving our organisational objectives 1 2 3 4 5 6 7
h. During the final selection of the consultant, 1 felt we were making the right decision 1 2 3 4 5 6 7
i. 1 am familiar with the methodology to be used in this assignment 1 2 3 4 5 6 7
j- This consulting assignment represents a major investment by my organisation 1 2 3 4 5 6 7
k. At various times in the selection process,1 felt constrained by a lack of certain information 1 2 3 4 5 6 7
1. It was very important to me that a suitable consultant was selected 1 2 3 4 5 6 7
m. Just after the consultant selection was made 1 felt confident it was the right one 1 2 3 4 5 6 7
n. At the time of commissioning the work it was difficult to predict how the consultant would perform 1 2 3 4 5 6 7
0 . 1 am seldom involved in commissioning this type of consulting assignment 1 2 3 4 5 6 7
P- The commissioning decision for this assignment was routine 1 2 3 4 5 6 7
q. This assignment represents a long term commitment by my organisation 1 2 3 4 5 6 7
3
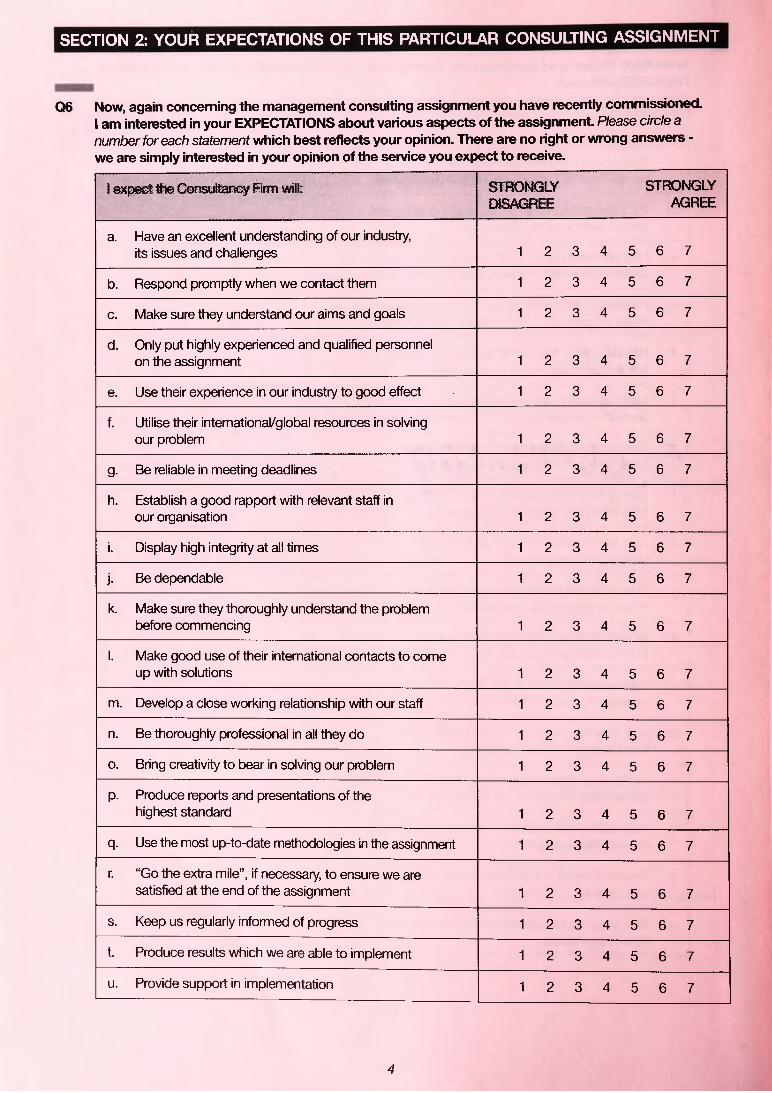
SECTION 2: YOUR EXPECTATIONS OF THIS PARTICULAR CONSULTING ASSIGNMENT
Q6 Now, again concerning the management consulting assignment you have recently commissioned. I am interested in your EXPECTATIONS about various aspects of the assignment Please circle a number for each statement which best reflects your opinion. There are no right or wrong answers - we are simply interested in your opinion of the service you expect to receive.
1 expect the Consultancy Firm will: STRONGLYDISAGREE
STRONGLYAGREE
a. Have an excellent understanding of our industry, its issues and challenges 1 2 3 4 5 6 7
b. Respond promptly when we contact them 1 2 3 4 5 6 7
c. Make sure they understand our aims and goals 1 2 3 4 5 6 7
d. Only put highly experienced and qualified personnel on the assignment 1 2 3 4 5 6 7
e. Use their experience in our industry to good effect . 1 2 3 4 5 6 7
f. Utilise their international/global resources in solving our problem 1 2 3 4 5 6 7
g- Be reliable in meeting deadlines 1 2 3 4 5 6 7
h. Establish a good rapport with relevant staff in our organisation 1 2 3 4 5 6 7
i. Display high integrity at all times 1 2 3 4 5 6 7
j- Be dependable 1 2 3 4 5 6 7
k. Make sure they thoroughly understand the problem before commencing 1 2 3 4 5 6 7
1. Make good use of their international contacts to come up with solutions 1 2 3 4 5 6 7
m. Develop a close working relationship with our staff 1 2 3 4 5 6 7
n. Be thoroughly professional in all they do 1 2 3 4 5 6 7
o. Bring creativity to bear in solving our problem 1 2 3 4 5 6 7
P- Produce reports and presentations of the highest standard 1 2 3 4 5 6 7
q- Use the most up-to-date methodologies in the assignment 1 2 3 4 5 6 7
r. “Go the extra mile”, if necessary, to ensure we are satisfied at the end of the assignment 1 2 3 4 5 6 7
s. Keep us regularly informed of progress 1 2 3 4 5 6 7
t. Produce results which we are able to implement 1 2 3 4 5 6 7
u. Provide support in implementation 1 2 3 4 5 6 7
4
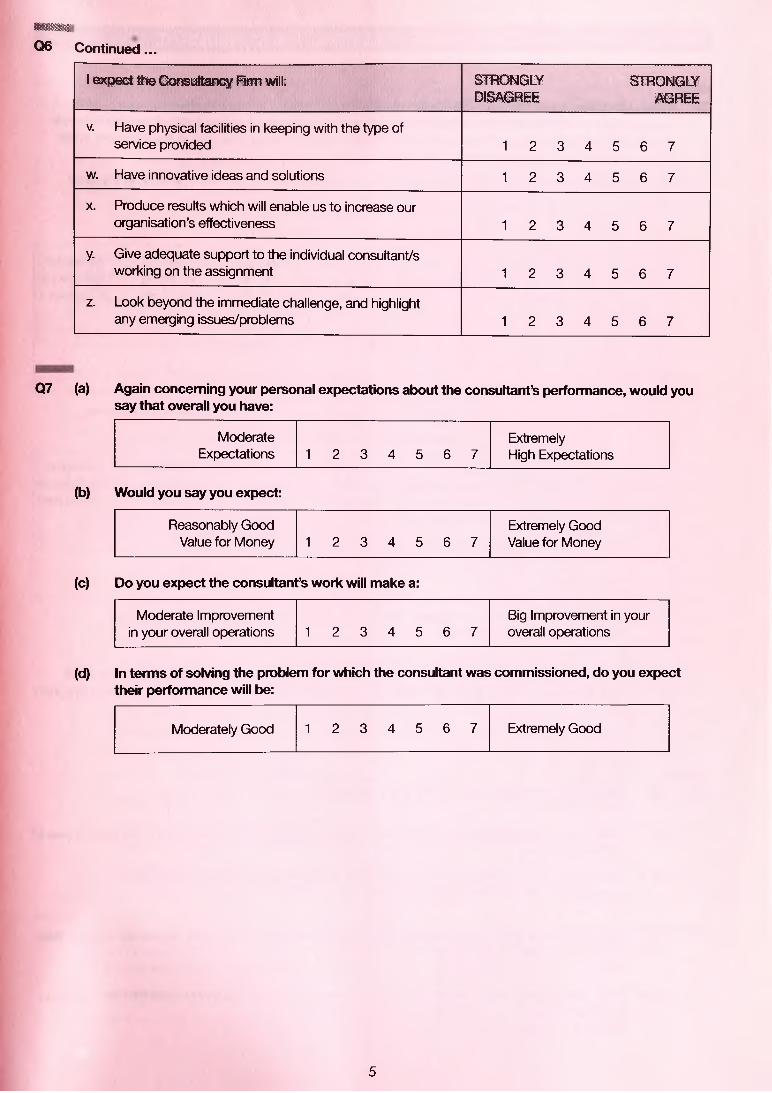
wmmm06 Continued...
I expect the Consultancy Firm will: STRONGLYDISAGREE
STRONGLYAGREE
V. Have physical facilities in keeping with the type of service provided 1 2 3 4 5 6 7
w. Have innovative ideas and solutions 1 2 3 4 5 6 7
X. Produce results which will enable us to increase our organisation’s effectiveness 1 2 3 4 5 6 7
y- Give adequate support to the individual consultant/s working on the assignment 1 2 3 4 5 6 7
z. Look beyond the immediate challenge, and highlight any emerging issues/problems 1 2 3 4 5 6 7
Q7 (a) Again concerning your personal expectations about the consultant’s performance, would you say that overall you have:
ModerateExpectations 1 2 3 4 5 6 7
Extremely High Expectations
(b) Would you say you expect:
Reasonably Good Value for Money 1 2 3 4 5 6 7
Extremely Good Value for Money
(c) Do you expect the consultant’s work will make a:
Moderate Improvement in your overall operations 1 2 3 4 5 6 7
Big Improvement in your overall operations
(d) In terms of solving the problem for which the consultant was commissioned, do you expect their performance will be:
Moderately Good 1 2 3 4 5 6 7 Extremely Good
5
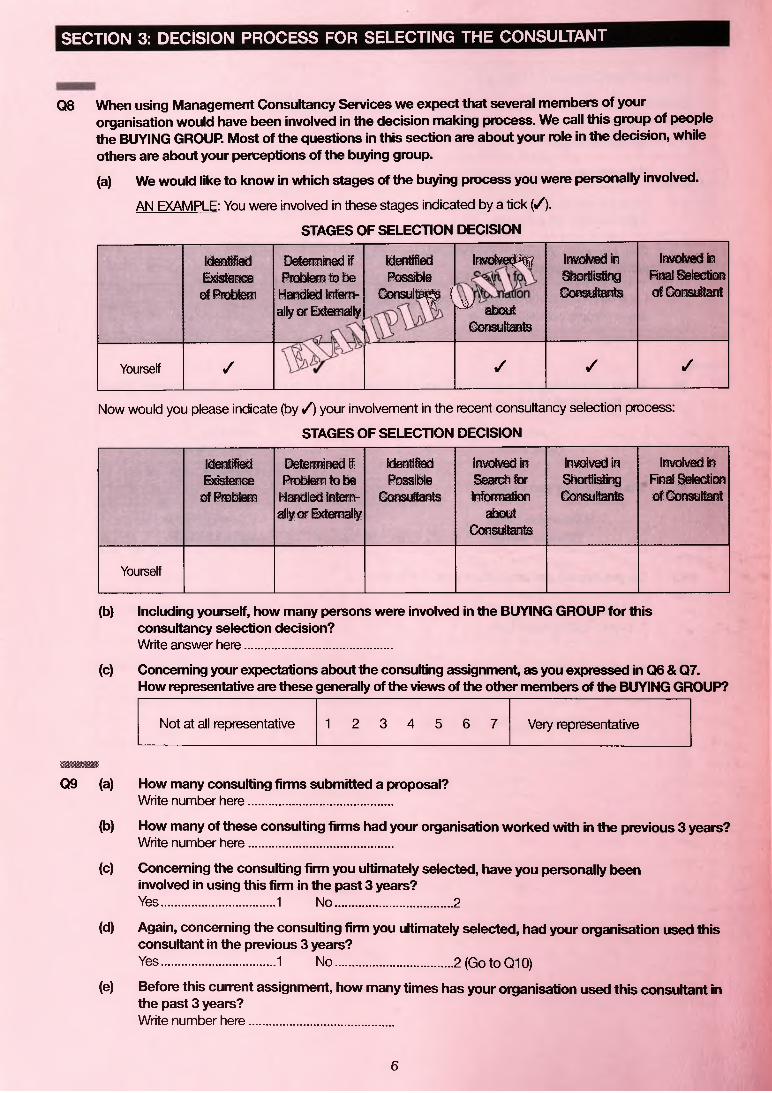
SECTION 3: DECISION PROCESS FOR SELECTING THE CONSULTANT
Q8 When using Management Consultancy Services we expect that several members of your organisation would have been involved in the decision making process. We call this group of people the BUYING GROUP. Most of the questions in this section are about your role in the decision, while others are about your perceptions of the buying group.
(a) We would like to know in which stages of the buying process you were personally involved.
AN EXAMPLE: You were involved in these stages indicated by a tick ( < / ) .
STAGES OF SELECTION DECISION
Identified Existence of Problem
Determined if Problem to be Handled Internally or Externally
Identified Possible
Consulte^ (
lnvolve<3%
^ about Consultants
Involved in Shortlisting Consultants
Involved in Final Selection of Consultant
Yourself / / / /
Now would you please indicate (by S ) your involvement in the recent consultancy selection process:
STAGES OF SELECTION DECISION
Identified Existence of Problem
Determined if Problem to be Handled Internally or Externally
IdentifiedPossible
Consultants
Involved in Search for Information
aboutConsultants
Involved in Shortlisting Consultants
Involved in Final Selection of Consultant
Yourself
(b) Including yourself, how many persons were involved in the BUYING GROUP for this consultancy selection decision?Write answer here......................................
(c) Concerning your expectations about the consulting assignment, as you expressed in 0 6 & Q7.How representative are these generally of the views of the other members of the BUYING GROUP?
Not at all representative 1 2 3 4 5 6 7 Very representative
lllllllill
09 (a) How many consulting firms submitted a proposal?Write number here.....................................
(b) How many of these consulting firms had your organisation worked with in the previous 3 years?Write number here.....................................
(c) Concerning the consulting firm you ultimately selected, have you personally been involved in using this firm in the past 3 years?Yes.............................1 No.............................. 2
(d) Again, concerning the consulting firm you ultimately selected, had your organisation used this consultant in the previous 3 years?Yes.............................1 No.............................. 2 (Go to Q10)
(e) Before this current assignment, how many times has your organisation used this consultant in the past 3 years?Write number here.....................................
6
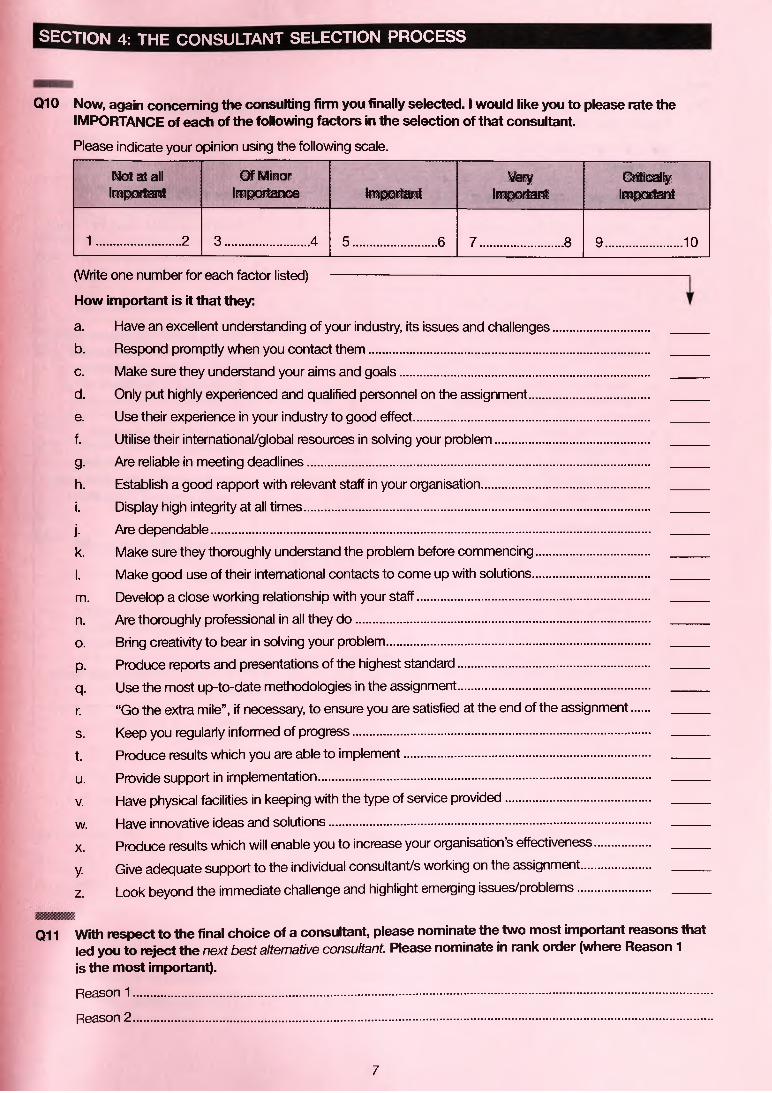
SECTION 4: THE CONSULTANT SELECTION PROCESS
Q10 Now, again concerning the consulting firm you finally selected. I would like you to please rate the IMPORTANCE of each of the following factors in the selection of that consultant.
Please indicate your opinion using the following scale.
Not at all Important
Of Minor Importance Important
VeryImportant
CriticallyImportant
1 ..................... 2 3 ......................4 5 ..................... 6 7 ..................... 8 9 ................... 10
(Write one number for each factor listed) -----------------------------------------------------------------
How important is it that they:
a. Have an excellent understanding of your industry, its issues and challenges...................b. Respond promptly when you contact them...................................................................c. Make sure they understand your aims and goals...........................................................d. Only put highly experienced and qualified personnel on the assignment..........................e. Use their experience in your industry to good effect........................................................f. Utilise their international/global resources in solving your problem..................................g. Are reliable in meeting deadlines...................................................................................h. Establish a good rapport with relevant staff in your organisation......................................i. Display high integrity at all times....................................................................................j. Are dependable............................................................................................................k. Make sure they thoroughly understand the problem before commencing........................l. Make good use of their international contacts to come up with solutions.........................m. Develop a close working relationship with your staff.......................................................n. Are thoroughly professional in all they do .......................................................................o. Bring creativity to bear in solving your problem...............................................................p. Produce reports and presentations of the highest standard............................................q. Use the most up-to-date methodologies in the assignment............................................r. “Go the extra mile”, if necessary, to ensure you are satisfied at the end of the assignment
s. Keep you regularly informed of progress.......................................................................t. Produce results which you are able to implement..........................................................u. Provide support in implementation................................................................................v. Have physical facilities in keeping with the type of service provided................................
w. Have innovative ideas and solutions..............................................................................x. Produce results which will enable you to increase your organisation’s effectiveness.........y. Give adequate support to the individual consultant/s working on the assignment............z. Look beyond the immediate challenge and highlight emerging issues/problems.............
Q11 w ith respect to the final choice of a consultant, please nominate the two most important reasons that led you to reject the next best alternative consultant. Please nominate in rank order (where Reason 1 is the most important).
Reason 1.....................................................................................................................................................................
Reason 2 .....................................................................................................................................................................
7
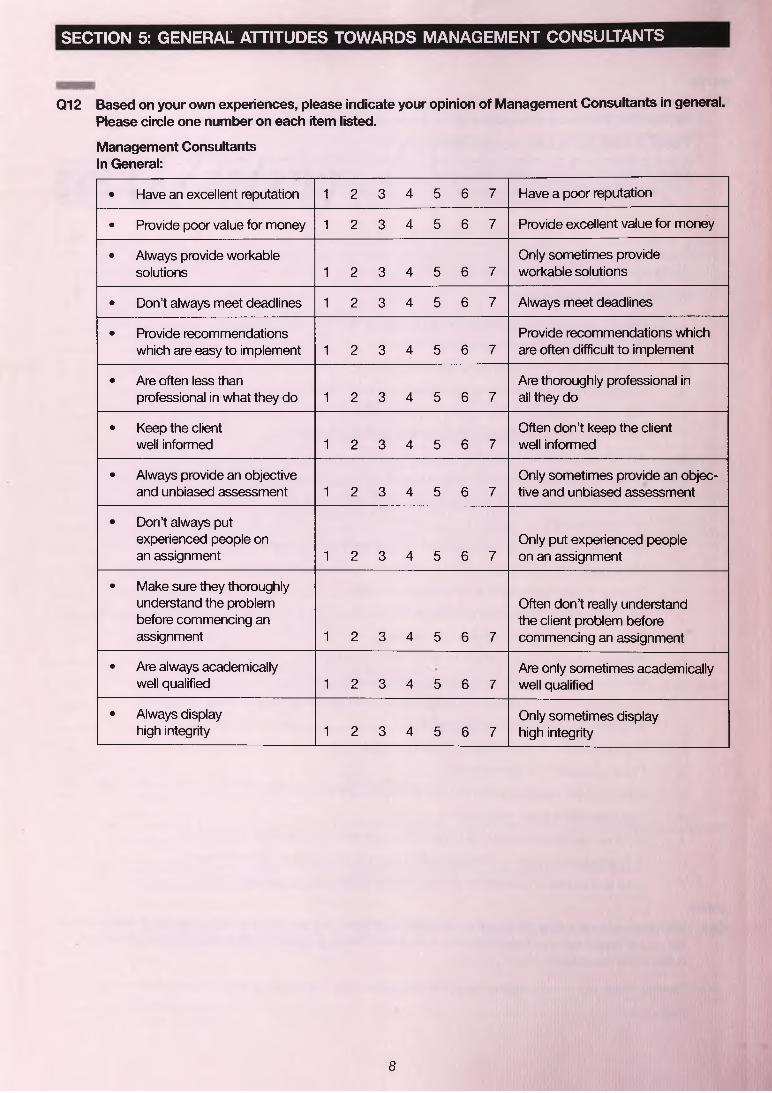
SECTION 5: GENERAL ATTITUDES TOWARDS MANAGEMENT CONSULTANTS
Q12 Based on your own experiences, please indicate your opinion of Management Consultants in general. Please circle one number on each item listed.
Management Consultants In General:
• Have an excellent reputation 1 2 3 4 5 6 7 Have a poor reputation
• Provide poor value for money 1 2 3 4 5 6 7 Provide excellent value for money
• Always provide workable solutions 1 2 3 4 5 6 7
Only sometimes provide workable solutions
• Don’t always meet deadlines 1 2 3 4 5 6 7 Always meet deadlines
• Provide recommendations which are easy to implement 1 2 3 4 5 6 7
Provide recommendations which are often difficult to implement
• Are often less than professional in what they do 1 2 3 4 5 6 7
Are thoroughly professional in all they do
• Keep the client well informed 1 2 3 4 5 6 7
Often don’t keep the client well informed
• Always provide an objective and unbiased assessment 1 2 3 4 5 6 7
Only sometimes provide an objective and unbiased assessment
• Don’t always put experienced people on an assignment 1 2 3 4 5 6 7
Only put experienced people on an assignment
• Make sure they thoroughly understand the problem before commencing an assignment 1 2 3 4 5 6 7
Often don’t really understand the client problem before commencing an assignment
• Are always academically well qualified 1 2 3 4 5 6 7
Are only sometimes academically well qualified
• Always display high integrity 1 2 3 4 5 6 7
Only sometimes display high integrity
8
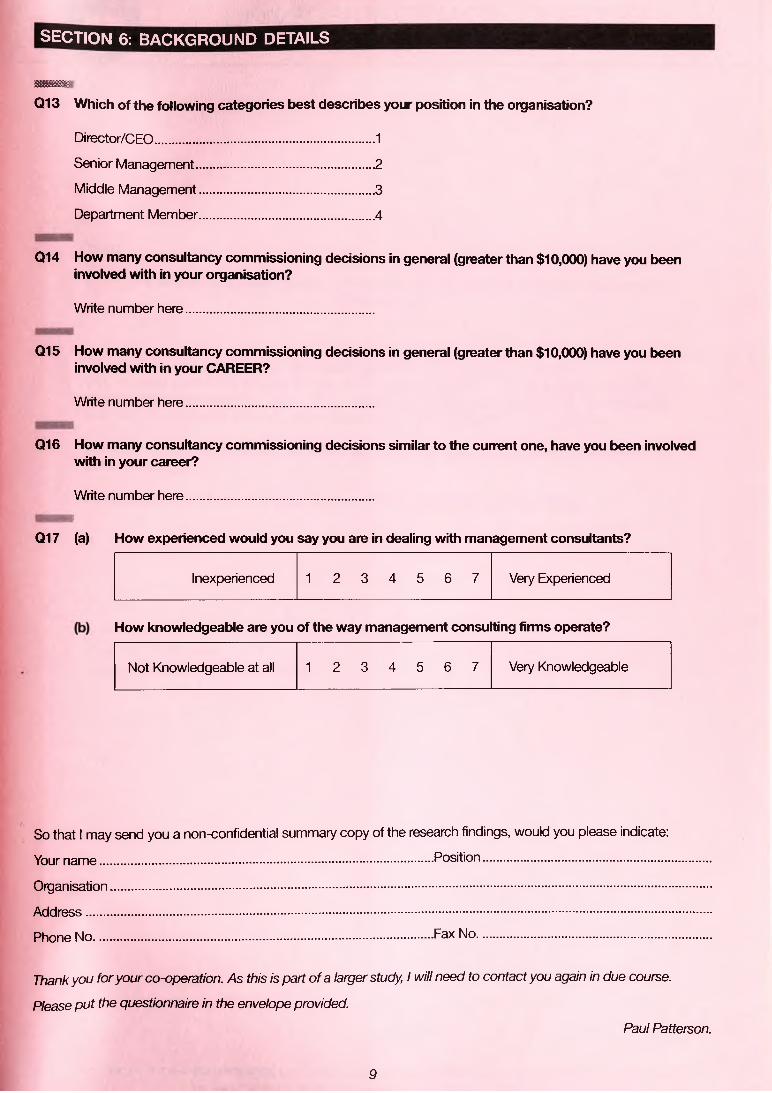
SECTION 6: BACKGROUND DETAILS
MMSIQ13 Which of the following categories best describes your position in the organisation?
Director/CEO.........................................................1
Senior Management.............................................. 2
Middle Management............................................. 3
Department Member............................................. 4
Q14 How many consultancy commissioning decisions in general (greater than $10,000) have you been involved with in your organisation?
Write number here................................................
Q15 How many consultancy commissioning decisions in general (greater than $10,000) have you been involved with in your CAREER?
Write number here................................................
Q16 How many consultancy commissioning decisions similar to the current one, have you been involved with in your career?
Write number here................................................
Q17 (a) How experienced would you say you are in dealing with management consultants?
Inexperienced 1 2 3 4 5 6 7 Very Experienced
How knowledgeable are you of the way management consulting firms operate?
Not Knowledgeable at all 1 2 3 4 5 6 7 Very Knowledgeable
So that I may send you a non-confidential summary copy of the research findings, would you please indicate:
Your name......................................................................................Position...........................................................
Organisation...........................................................................................................................................................
Address..................................................................................................................................................................
Phone No....................................................................................... Fax No.............................................................
Thank you for your co-operation. As this is part of a larger study, I will need to contact you again in due course.
Please put the questionnaire in the envelope provided.
Paul Patterson.
9
U N IV E R S IT Y O F W O L L O N G O N GDEPARTMENT OF MANAGEMENT
Dear
A Study of Client Decision Processes in Selecting Australian MnagementConsultants
Thank you for completing the initial questionnaire (which I received ..............).My records show the project is due to be completed, so I am forwarding the (final) follow-up questionnaire. Individual responses will remain completely confidential and only be collated with all other questionnaires to form an overall picture.
As soon as all responses are received and collated, I will send you a summary of the major findings.
Once again, thank you for your support in this important research study.
Yours sincerely,
R O . B O X 1 /\ 4 4 [ N O R T H F I E L D S A V E N U E ] , W O L L O N G O N G , N . S . W . 2 5 0 0 , A U S T R A L I A
Phone: CD42] 21 3 555 [Switchboard], CO-423 21 3 7 0 7 [Direct].
Telex: 2SD22. Cable: UNOFWOL. Fax: CO-42] 3 7 37B 5 .
UNIVERSITY OF WOLLONGONG - Department of Management
/ ” " " I. ■ ■ ■ ■ ! ■ . ■ . . ■ ■
■ . I ■ . ■ ■
A STUDY OF CLIENT EXPECTATIONSi i i l Ä Ä i i i i i S Ä
AND PERCEPTIONS OF
a u s t r a u a n m a n a g e m e n t c o n s u lta n ts
¡Jj IMWl Stage 2...UMHl
v _
HO W TO C O M PLETE TH IS Q U ESTIO N N A IR E
Most questions refer to the consulting assignment you described in our initial questionnaire. Please use this consulting assignment as the reference point for completing this questionnaire.
In most cases I would like you to circle a number which best reflects your opinion or behaviour. In a few instances, you are asked to supply short written answers or write a number.
If you have any queries, please telephone Paul Patterson on (042) 21 3707
© P.G. Patterson, Department of Management, University of Wollongong
1
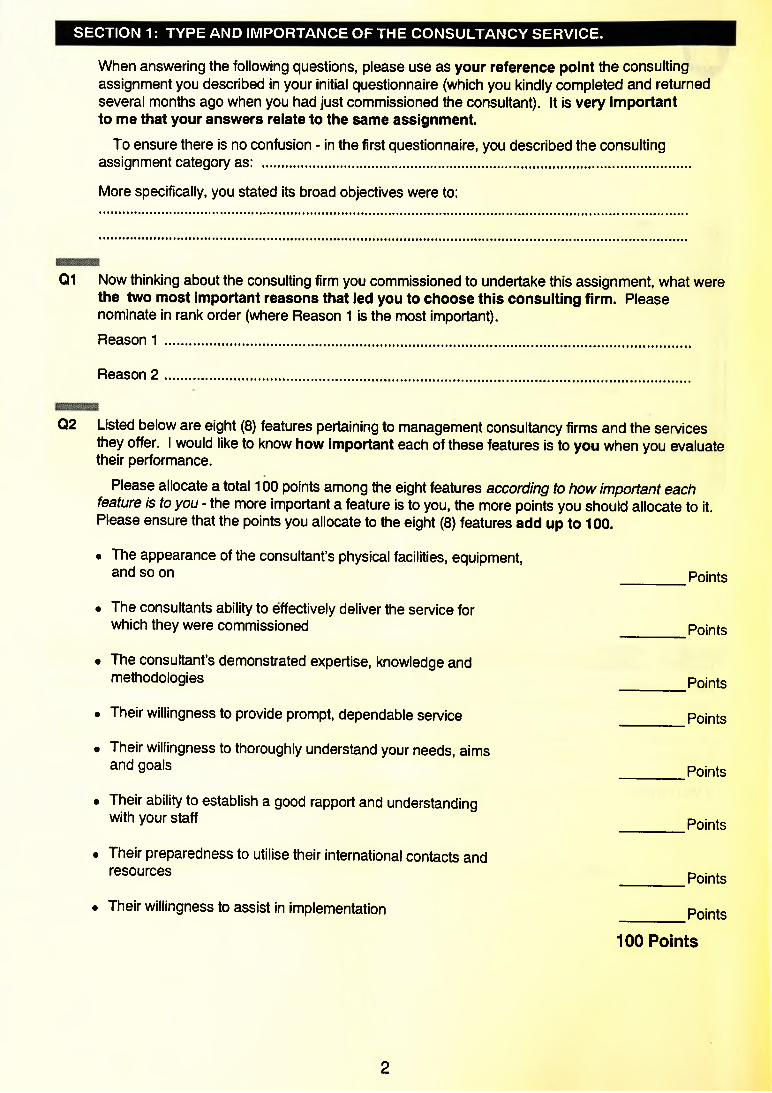
SECTION 1: TYPE AND IMPORTANCE OF THE CONSULTANCY SERVICE.
When answering the following questions, please use as your reference point the consulting assignment you described in your initial questionnaire (which you kindly completed and returned several months ago when you had just commissioned the consultant). It is very important to me that your answers relate to the same assignment.
To ensure there is no confusion - in the first questionnaire, you described the consulting assignment category as: ...............................................................................................................
More specifically, you stated its broad objectives were to:
Q1 Now thinking about the consulting firm you commissioned to undertake this assignment, what were the two most important reasons that led you to choose this consulting firm. Please nominate in rank order (where Reason 1 is the most important).
Reason 1 ........................................................................................................................................
Reason 2 ................................................................... .....................................
Q2 Listed below are eight (8) features pertaining to management consultancy firms and the services they offer. I would like to know how important each of these features is to you when you evaluate their performance.
Please allocate a total 100 points among the eight features according to how important each feature is to you - the more important a feature is to you, the more points you should allocate to it. Please ensure that the points you allocate to the eight (8) features add up to 100.
• The appearance of the consultant’s physical facilities, equipment, and so on
• The consultants ability to effectively deliver the service for which they were commissioned
• The consultant’s demonstrated expertise, knowledge and methodologies
• Their willingness to provide prompt, dependable service
• Their willingness to thoroughly understand your needs, aims and goals
• Their ability to establish a good rapport and understanding with your staff
• Their preparedness to utilise their international contacts and resources
• Their willingness to assist in implementation
________ Points
________ Points
________ Points
________ Points
________ Points
________ Points
________ Points
________ Points
100 Points
2
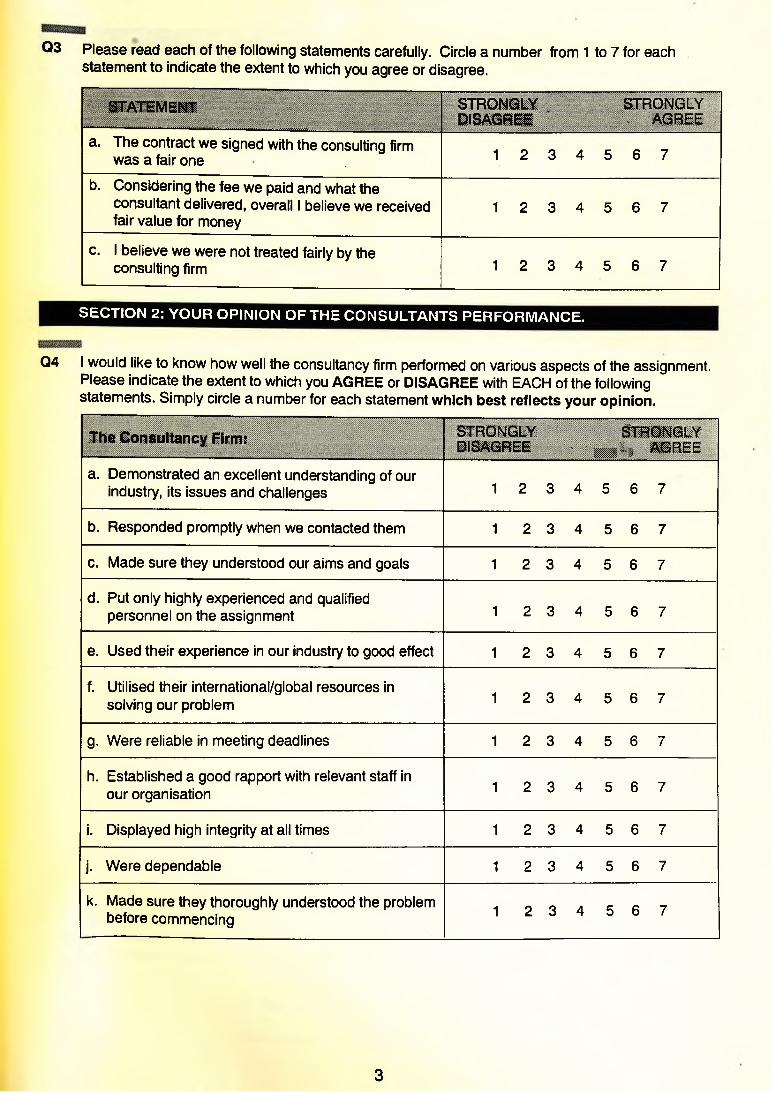
Q3 Please read each of the following statements carefully. Circle a number from 1 to 7 for each statement to indicate the extent to which you agree or disagree.
—STATEMENT
----.............- ...........STRONGLY STRONGLY DISAGREE ' ■ AGREE
a. The contract we signed with the consulting firm was a fair one . 1 2 3 4 5 6 7
b. Considering the fee we paid and what theconsultant delivered, overall I believe we received fair value for money
1 2 3 4 5 6 7
c. I believe we were not treated fairly by the consulting firm 1 2 3 4 5 6 7
SEC TIO N 2: YO U R O PIN IO N OF TH E C O NSULTAN TS PER FO RM ANC E.
Q4 I would like to know how well the consultancy firm performed on various aspects of the assignment. Please indicate the extent to which you AGREE or DISAGREE with EACH of the following ' statements. Simply circle a number for each statement which best reflects your opinion.
The Consultancy Firm: STRONGLYDISAGREE % .
111111¡STRONGLY ï ; AGREE
a. Demonstrated an excellent understanding of our industry, its issues and challenges 1 2 3 4 5 6 7
b. Responded promptly when we contacted them 1 2 3 4 5 6 7
c. Made sure they understood our aims and goals 1 2 3 4 5 6 7
d. Put only highly experienced and qualified personnel on the assignment 1 2 3 4 5 6 7
e. Used their experience in our industry to good effect 1 2 3 4 5 6 7
f. Utilised their international/global resources in solving our problem 1 2 3 4 5 6 7
g. Were reliable in meeting deadlines 1 2 3 4 5 6 7
h. Established a good rapport with relevant staff in our organisation 1 2 3 4 5 6 7
i. Displayed high integrity at all times 1 2 3 4 5 6 7
j. Were dependable 1 2 3 4 5 6 7
k. Made sure they thoroughly understood the problem before commencing 1 2 3 4 5 6 7
3
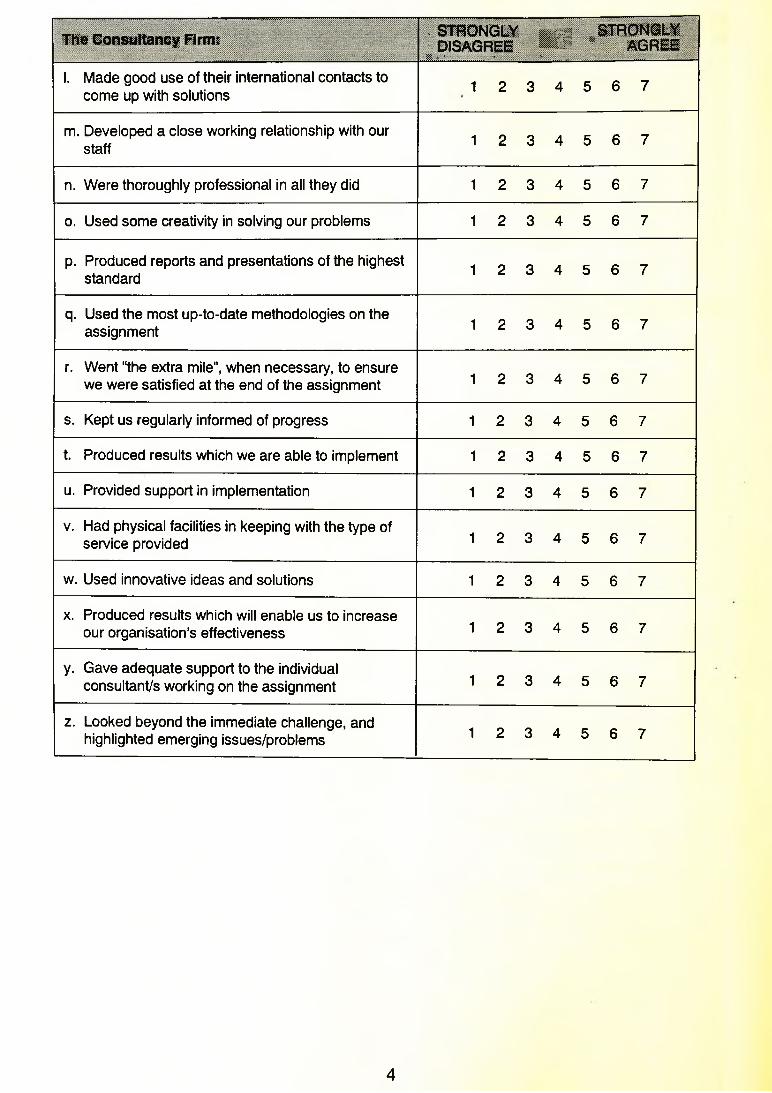
The Consultancy Firm : . STRONGLYDISAGREE
\ .. * ' %
HU ' ....
VSTRONGLYAGREE
1. Made good use of their international contacts to come up with solutions 1 2 3 4 5 6 7
m. Developed a close working relationship with our staff 1 2 3 4 5 6 7
n. Were thoroughly professional in all they did 1 2 3 4 5 6 7
o. Used some creativity in solving our problems 1 2 3 4 5 6 7
p. Produced reports and presentations of the highest standard 1 2 3 4 5 6 7
q. Used the most up-to-date methodologies on the assignment 1 2 3 4 5 6 7
r. Went “the extra mile”, when necessary, to ensure we were satisfied at the end of the assignment 1 2 3 4 5 6 7
s. Kept us regularly informed of progress 1 2 3 4 5 6 7
t. Produced results which we are able to implement 1 2 3 4 5 6 7
u. Provided support in implementation 1 2 3 4 5 6 7
v. Had physical facilities in keeping with the type of service provided 1 2 3 4 5 6 7
w. Used innovative ideas and solutions 1 2 3 4 5 6 7
x. Produced results which will enable us to increase our organisation’s effectiveness 1 2 3 4 5 6 7
y. Gave adequate support to the individual consultant's working on the assignment 1 2 3 4 5 6 7
z. Looked beyond the immediate challenge, and highlighted emerging issues/problems 1 2 3 4 5 6 7
4
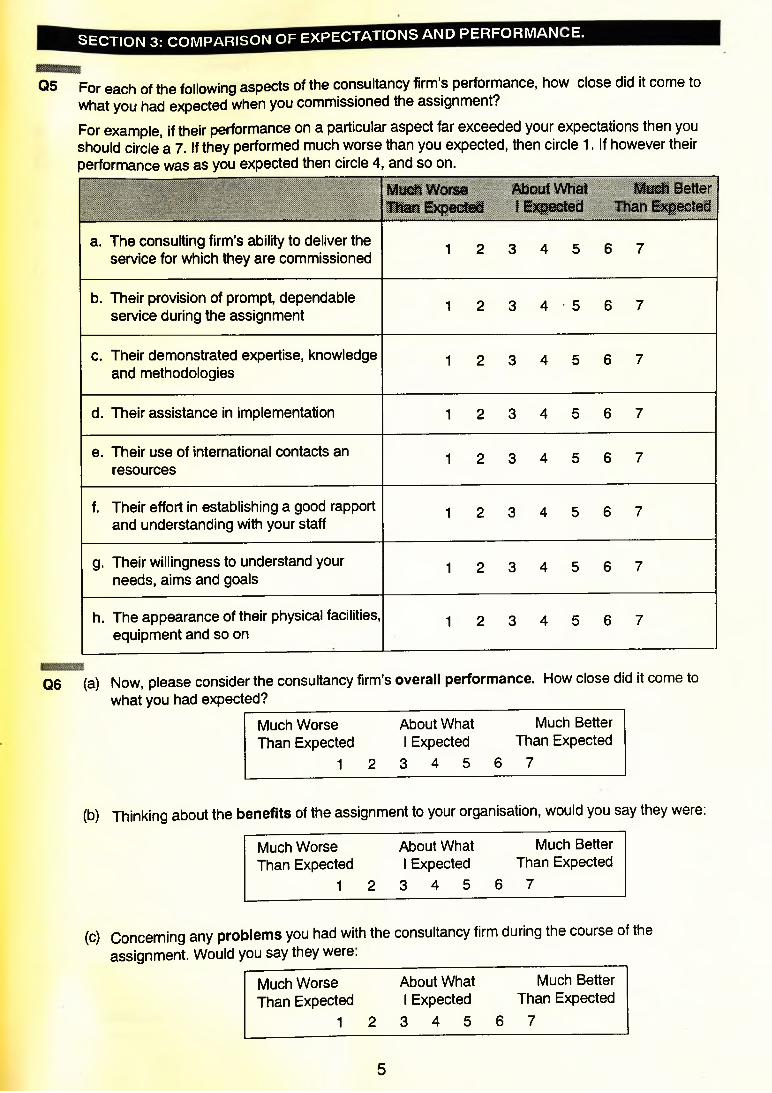
SECTION 3: COMPARISON OF EXPECTATIONS AND PERFORMAN CE,
Q5 For each of the following aspects of the consultancy firm’s performance, how close did it come to what you had expected when you commissioned the assignment?
For example, if their performance on a particular aspect far exceeded your expectations then you should circle a 7. If they performed much worse than you expected, then circle 1. If however their performance was as you expected then circle 4, and so on.
Much Worse Than Expected
About What I Expected
Much Better Than Expected
a. The consulting firm’s ability to deliver the service for which they are commissioned 1 2 3 4 5 6 7
b. Their provision of prompt, dependable service during the assignment
1 2 3 4 • 5 6 7
c. Their demonstrated expertise, knowledge and methodologies
1 2 3 4 5 6 7
d. Their assistance in implementation 1 2 3 4 5 6 7
e. Their use of international contacts an resources
1 2 3 4 5 6 7
f. Their effort in establishing a good rapport and understanding with your staff
1 2 3 4 5 6 7
g. Their willingness to understand your needs, aims and goals
1 2 3 4 5 6 7
h. The appearance of their physical facilities, equipment and so on
1 2 3 4 5 6 7
Q6 (a) Now, please consider the consultancy firm’s overall performance. How close did it come to what you had expected? _____________________
Much Worse About What Much BetterThan Expected I Expected Than Expected
1 2 3 4 5 6 7
(b) Thinking about the benefits of the assignment to your organisation, would you say they were:
Much Worse About What Much BetterThan Expected I Expected Than Expected
1 2 3 4 5 6 7
(c) Concerning any problems you had with the consultancy firm during the course of the assignment. Would you say they were.
Much Worse About What Much BetterThan Expected I Expected Than Expected
1 2 3 4 5 6 7
5
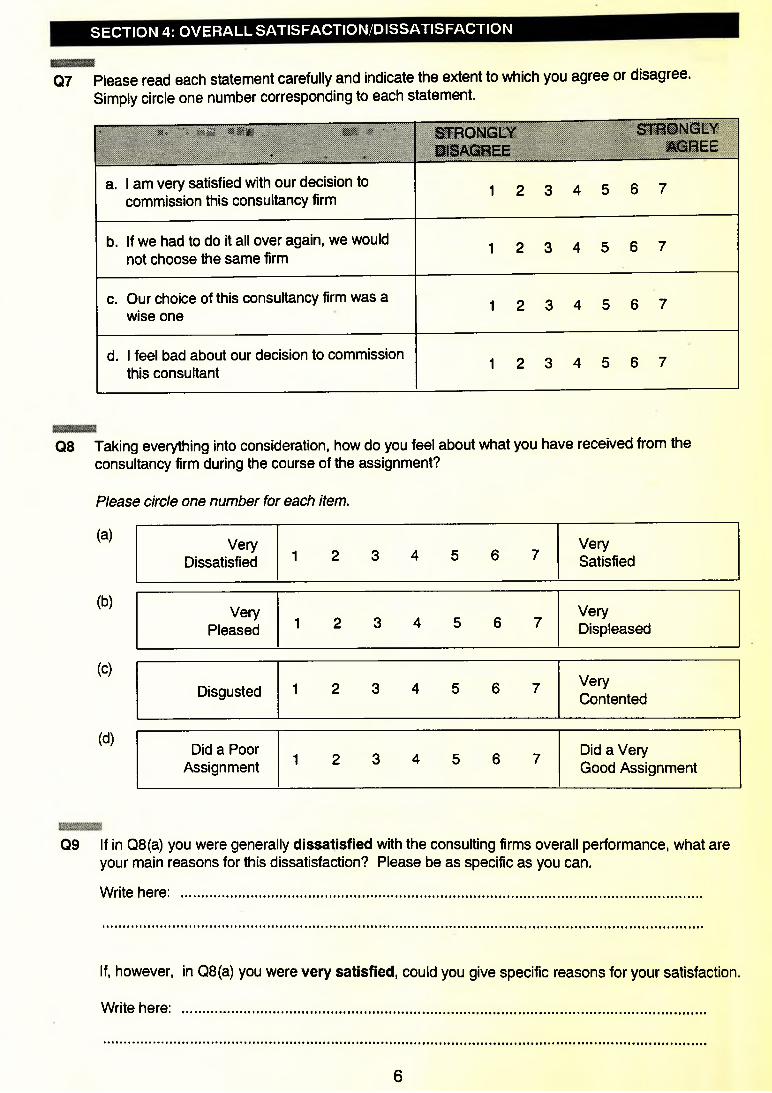
SECTION 4: OVERALL SATISFACTION/DISSATISFACTION
Q7 Please read each statement carefully and indicate the extent to which you agree or disagree. Simply circle one number corresponding to each statement.
1,1... ................ 1 ............ "----------------------------------' \ * s' s ft p & ft ft pft m " '
* s .
STRONGLY STRONGLY DISAGREE AGREE
a. 1 am very satisfied with our decision to commission this consultancy firm
1 2 3 4 5 6 7
b. If we had to do it all over again, we would not choose the same firm
1 2 3 4 5 6 7
c. Our choice of this consultancy firm was a wise one
1 2 3 4 5 6 7
d. 1 feel bad about our decision to commission this consultant
1 2 3 4 5 6 7
Q8 Taking everything into consideration, how do you feel about what you have received from the consultancy firm during the course of the assignment?
Please circle one number for each item.
(a)
(b)
(c)
(d)
VeryDissatisfied 1 2 3 4 5 6 7
VerySatisfied
VeryPleased 1 2 3 4 5 6 7
VeryDispleased
Disgusted 1 2 3 4 5 6 7 VeryContented
Did a Poor Assignment 1 2 3 4 5 6 7 Did a Very
Good Assignment
Q9 If in Q8(a) you were generally dissatisfied with the consulting firms overall performance, what are your main reasons for this dissatisfaction? Please be as specific as you can.
Write here: .......................................................................................................................................
If, however, in Q8(a) you were very satisfied, could you give specific reasons for your satisfaction.
Write here: .......................................................................................................................................
6
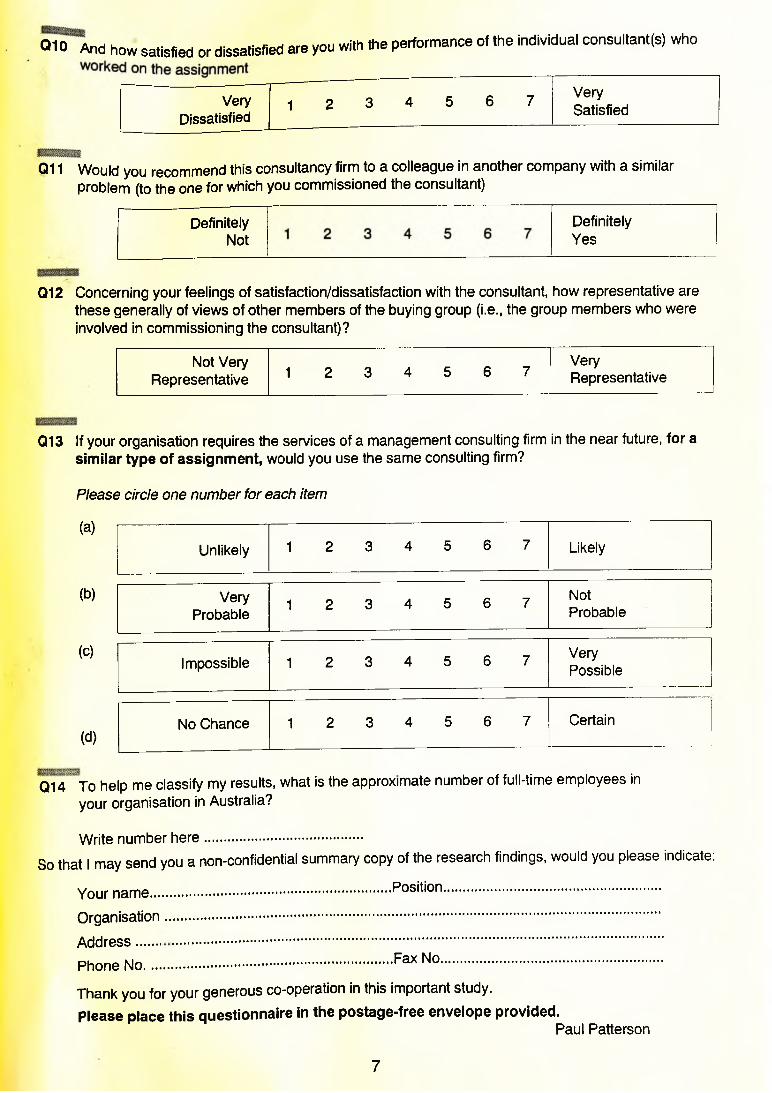
010 And how satisfied or dissatisfied are you with the performance of the individual consultant(s) who
VeryDissatisfied
1 2 3 4 5 6 7 VerySatisfied
Q11 Would you recommend this consultancy firm to a colleague in another company with a similar problem (to the one for which you commissioned the consultant)
DefinitelyNot
DefinitelyYes
Q12 Concerning your feelings of satisfaction/dissatisfaction with the consultant, how representative are these generally of views of other members of the buying group (i.e., the group members who were involved in commissioning the consultant)?
Not Very VeryRepresentative 1 2 3 4 5 6 7 Representative
Q13 If your organisation requires the services of a management consulting firm in the near future, for a similar type of assignment, would you use the same consulting firm?
Please circle one number for each item
(a)
(b)
(c)
(d)
Unlikely 1 2 3 4 5 6 7 Likely
VeryProbable
1 2 3 4 5 6 7 NotProbable
Impossible 1 2 3 4 5 6 7 VeryPossible
No Chance 1 2 3 4 5 6 7 Certain
Q14 To help me classify my results, what is the approximate your organisation in Australia?
number of full-time employees in
Write number here.........................................So that I may send you a non-confidential summary copy of the research findings, would you please indicate:
Your name... Organisation
Address ......
Phone N o ....
Position
Fax No,
Thank you for your generous co-operation in this important study.Please place this questionnaire in the postage-free envelope provided.
Paul Patterson
7