The Differences in the Prevalence of Cardiovascular Disease ...
12
Journal of Clinical Medicine Article The Differences in the Prevalence of Cardiovascular Disease, Its Risk Factors, and Achievement of Therapeutic Goals among Urban and Rural Primary Care Patients in Poland: Results from the LIPIDOGRAM 2015 Study Krzysztof Studzi ´ nski 1 , Tomasz Tomasik 1, * , Adam Windak 1 , Maciej Banach 2,3,4 , Ewa Wójtowicz 1 , Miroslaw Mastej 5 , Maciej Tomaszewski 6 , Dimitri P. Mikhailidis 7 , Peter P. Toth 8,9 , Alberico Catapano 10 , Kausik K. Ray 11 , George Howard 12 , Gregory Y.H. Lip 13,14 , Fadi J. Charchar 15 , Naveed Sattar 16 , Bryan Williams 17,18 , Thomas M. MacDonald 19 , Peter E. Penson 20,21 , Jacek J. Jó ´ zwiak 22 and on behalf of the LIPIDOGRAM2015 Investigators † Citation: Studzi ´ nski, K.; Tomasik, T.; Windak, A.; Banach, M.; Wójtowicz, E.; Mastej, M.; Tomaszewski, M.; Mikhailidis, D.P.; Toth, P.P.; Catapano, A.; et al. The Differences in the Prevalence of Cardiovascular Disease, Its Risk Factors, and Achievement of Therapeutic Goals among Urban and Rural Primary Care Patients in Poland: Results from the LIPIDOGRAM 2015 Study. J. Clin. Med. 2021, 10, 5656. https:// doi.org/10.3390/jcm10235656 Academic Editor: Andrea Frustaci Received: 10 October 2021 Accepted: 28 November 2021 Published: 30 November 2021 Publisher’s Note: MDPI stays neutral with regard to jurisdictional claims in published maps and institutional affil- iations. Copyright: © 2021 by the authors. Licensee MDPI, Basel, Switzerland. This article is an open access article distributed under the terms and conditions of the Creative Commons Attribution (CC BY) license (https:// creativecommons.org/licenses/by/ 4.0/). 1 Department of Family Medicine, Jagiellonian University Medical College, Bochenska 4, 31-061 Krakow, Poland; [email protected] (K.S.); [email protected] (A.W.); [email protected] (E.W.) 2 Polish Mothers Memorial Hospital Research Institute, 93-338 Lodz, Poland; [email protected] 3 Department of Hypertension, Chair of Nephrology and Hypertension, Medical University of Lodz, 90-136 Lodz, Poland 4 Cardiovascular Research Centre, University of Zielona Gora, 65-417 Zielona Gora, Poland 5 Mastej Medical Center, 38-200 Jaslo, Poland; [email protected] 6 Division of Cardiovascular Sciences, Faculty of Biology, Medicine and Health, University of Manchester, Manchester M13 9PT, UK; [email protected] 7 Department of Clinical Biochemistry, Royal Free Hospital, University College London, London NW3 2QG, UK; [email protected] 8 Cicarrone Center for the Prevention of Cardiovascular Disease, Johns Hopkins University School of Medicine, Baltimore, MD 21287, USA; [email protected] 9 CGH Medical Center, Sterling, IL 61081, USA 10 Department of Pharmacological Sciences, University of Milano and Multimedica IRCCS, 20099 Milano, Italy; [email protected] 11 Department of Primary Care and Public Health, Imperial Centre for Cardiovascular Disease Prevention, Imperial College, Kensington, London W6 8RP, UK; [email protected] 12 Department of Biostatistics, School of Public Health of Alabama at Birmingham, Birmingham B15 2TT, UK; [email protected] 13 Liverpool Centre for Cardiovascular Science, University of Liverpool and Liverpool Heart & Chest Hospital, Liverpool L14 3PE, UK; [email protected] 14 Aalborg Thrombosis Research Unit, Department of Clinical Medicine, Aalborg University, 9000 Aalborg, Denmark 15 School of Health and Life Sciences, Federation University Australia, Ballarat, VIC 3350, Australia; [email protected] 16 Institute of Cardiovascular and Medical Science, University of Glasgow, Glasgow G12 8TA, UK; [email protected] 17 NIHR University College London Biomedical Research Centre, University College London and University, London NW1 2BU, UK; [email protected] 18 College London Hospitals NHS Foundation Trust, London NW1 2BU, UK 19 MEMO Research, Ninewells Hospital and Medical School, University of Dundee, Dundee DD1 9SY, UK; [email protected] 20 School of Pharmacy and Biomolecular Sciences, Liverpool John Moores University, Liverpool L2 2QP, UK; [email protected] 21 Liverpool Centre for Cardiovascular Science, Liverpool L69 7TX, UK 22 Department of Family Medicine and Public Health, Institute of Medical Sciences, University of Opole, Oleska 48, 45-052 Opole, Poland; [email protected] * Correspondence: [email protected]; Tel.: +48-12-430-5593 † The list of the LIPIDOGRAM2015 Investigators is provided in the S1. Abstract: A nationwide cross-sectional study, LIPIDOGRAM2015, was carried out in Poland in the years 2015 and 2016. A total of 438 primary care physicians enrolled 13,724 adult patients that sought J. Clin. Med. 2021, 10, 5656. https://doi.org/10.3390/jcm10235656 https://www.mdpi.com/journal/jcm
-
Upload
khangminh22 -
Category
Documents
-
view
1 -
download
0
Transcript of The Differences in the Prevalence of Cardiovascular Disease ...

Journal of
Clinical Medicine
Article
The Differences in the Prevalence of Cardiovascular Disease,Its Risk Factors, and Achievement of Therapeutic Goals amongUrban and Rural Primary Care Patients in Poland: Results fromthe LIPIDOGRAM 2015 Study
Krzysztof Studzinski 1 , Tomasz Tomasik 1,* , Adam Windak 1, Maciej Banach 2,3,4, Ewa Wójtowicz 1,Mirosław Mastej 5, Maciej Tomaszewski 6, Dimitri P. Mikhailidis 7, Peter P. Toth 8,9, Alberico Catapano 10 ,Kausik K. Ray 11, George Howard 12, Gregory Y.H. Lip 13,14 , Fadi J. Charchar 15 , Naveed Sattar 16,Bryan Williams 17,18, Thomas M. MacDonald 19, Peter E. Penson 20,21 , Jacek J. Józwiak 22
and on behalf of the LIPIDOGRAM2015 Investigators †
�����������������
Citation: Studzinski, K.; Tomasik, T.;
Windak, A.; Banach, M.; Wójtowicz,
E.; Mastej, M.; Tomaszewski, M.;
Mikhailidis, D.P.; Toth, P.P.; Catapano,
A.; et al. The Differences in the
Prevalence of Cardiovascular Disease,
Its Risk Factors, and Achievement of
Therapeutic Goals among Urban and
Rural Primary Care Patients in
Poland: Results from the
LIPIDOGRAM 2015 Study. J. Clin.
Med. 2021, 10, 5656. https://
doi.org/10.3390/jcm10235656
Academic Editor: Andrea Frustaci
Received: 10 October 2021
Accepted: 28 November 2021
Published: 30 November 2021
Publisher’s Note: MDPI stays neutral
with regard to jurisdictional claims in
published maps and institutional affil-
iations.
Copyright: © 2021 by the authors.
Licensee MDPI, Basel, Switzerland.
This article is an open access article
distributed under the terms and
conditions of the Creative Commons
Attribution (CC BY) license (https://
creativecommons.org/licenses/by/
4.0/).
1 Department of Family Medicine, Jagiellonian University Medical College, Bochenska 4,31-061 Krakow, Poland; [email protected] (K.S.); [email protected] (A.W.);[email protected] (E.W.)
2 Polish Mothers Memorial Hospital Research Institute, 93-338 Lodz, Poland; [email protected] Department of Hypertension, Chair of Nephrology and Hypertension, Medical University of Lodz,
90-136 Lodz, Poland4 Cardiovascular Research Centre, University of Zielona Gora, 65-417 Zielona Gora, Poland5 Mastej Medical Center, 38-200 Jasło, Poland; [email protected] Division of Cardiovascular Sciences, Faculty of Biology, Medicine and Health, University of Manchester,
Manchester M13 9PT, UK; [email protected] Department of Clinical Biochemistry, Royal Free Hospital, University College London,
London NW3 2QG, UK; [email protected] Cicarrone Center for the Prevention of Cardiovascular Disease, Johns Hopkins University School of Medicine,
Baltimore, MD 21287, USA; [email protected] CGH Medical Center, Sterling, IL 61081, USA10 Department of Pharmacological Sciences, University of Milano and Multimedica IRCCS, 20099 Milano, Italy;
[email protected] Department of Primary Care and Public Health, Imperial Centre for Cardiovascular Disease Prevention,
Imperial College, Kensington, London W6 8RP, UK; [email protected] Department of Biostatistics, School of Public Health of Alabama at Birmingham, Birmingham B15 2TT, UK;
[email protected] Liverpool Centre for Cardiovascular Science, University of Liverpool and Liverpool Heart & Chest Hospital,
Liverpool L14 3PE, UK; [email protected] Aalborg Thrombosis Research Unit, Department of Clinical Medicine, Aalborg University,
9000 Aalborg, Denmark15 School of Health and Life Sciences, Federation University Australia, Ballarat, VIC 3350, Australia;
[email protected] Institute of Cardiovascular and Medical Science, University of Glasgow, Glasgow G12 8TA, UK;
[email protected] NIHR University College London Biomedical Research Centre, University College London and University,
London NW1 2BU, UK; [email protected] College London Hospitals NHS Foundation Trust, London NW1 2BU, UK19 MEMO Research, Ninewells Hospital and Medical School, University of Dundee, Dundee DD1 9SY, UK;
[email protected] School of Pharmacy and Biomolecular Sciences, Liverpool John Moores University, Liverpool L2 2QP, UK;
[email protected] Liverpool Centre for Cardiovascular Science, Liverpool L69 7TX, UK22 Department of Family Medicine and Public Health, Institute of Medical Sciences, University of Opole,
Oleska 48, 45-052 Opole, Poland; [email protected]* Correspondence: [email protected]; Tel.: +48-12-430-5593† The list of the LIPIDOGRAM2015 Investigators is provided in the S1.
Abstract: A nationwide cross-sectional study, LIPIDOGRAM2015, was carried out in Poland in theyears 2015 and 2016. A total of 438 primary care physicians enrolled 13,724 adult patients that sought
J. Clin. Med. 2021, 10, 5656. https://doi.org/10.3390/jcm10235656 https://www.mdpi.com/journal/jcm
J. Clin. Med. 2021, 10, 5656 2 of 12
medical care in primary health care practices. The prevalence of hypertension, diabetes mellitus,dyslipidaemia, and CVD were similar in urban and rural areas (49.5 vs. 49.4%; 13.7 vs. 13.1%;84.2 vs. 85.2%; 14.4 vs. 14.2%, respectively). The prevalence of obesity (32.3 vs. 37.5%, p < 0.01) andexcessive waist circumference (77.5 vs. 80.7%, p < 0.01), as well as abdominal obesity (43.2 vs. 46.4%,p < 0.01), were higher in rural areas in both genders. Mean levels of LDL-C (128 vs. 130 mg/dL,p = 0.04) and non-HDL-C (147 vs. 148 mg/dL, p = 0.03) were slightly higher in rural populations.Altogether, 14.3% of patients with CVD from urban areas and 11.3% from rural areas reachedLDL <70 mg/dL (p = 0.04). There were no important differences in the prevalence of hypertension,diabetes, dyslipidaemia, and CVD, or in mean levels of blood pressure, cholesterol fractions, glucose,and HbA1c between Polish urban and rural primary care patient populations. A high proportion ofpatients in cities and an even-higher proportion in rural areas did not reach the recommended targetsfor blood pressure, LDL-C, and HbA1c, indicating the need for novel CVD-prevention programs.
Keywords: primary health care; cardiovascular diseases; risk factors; urban; rural; Poland
1. Introduction
Differences in healthcare access, utilisation, and health status between rural and urbanpopulations are described in the medical literature [1,2]. Cardiovascular diseases (CVD)are the leading causes of death and disability globally [3]. Well-known cardiovascular (CV)risk factors include elevated blood pressure (BP), dyslipidaemia, hyperglycaemia, obesity,and smoking. The prevalence of CVD and CV risk factors is high in Central and EasternEuropean (CEE) countries [4]. Currently, in Poland, over 15% of the patients attendingprimary health practices are diagnosed with CVD, over 60% have hypertension (HTN),over 80% are dyslipidemic, and approximately 15% of patients are diagnosed with diabetesmellitus (DM) [5].
Differences in CVD prevalence and levels of CV risk factors between urban and ruralregions have been confirmed all across Europe [6–9]. Additionally, the Prospective UrbanRural Epidemiology (PURE) Study (which enrolled 156,424 persons from 3 high-income,10 middle-income, and 4 low-income countries) reported higher rates of CV events in ruralthan urban areas in middle-income and low-income countries. By comparison, there wereno such differences in high-income countries. However, at the same time, the prevalence ofthe CV risk factors was higher in urban than in rural communities [10].
Despite the high prevalence of CV risk factors, achieving the recommended levels ofcholesterol fractions, blood pressure, and glucose remains challenging. The authors of theDA VINCI study revealed that 54% of patients achieved their risk-based LDL-C goals [11].Meanwhile, data from the TERCET registry indicate that after ST-elevated myocardialinfarction (STEMI), 32.4% of patients achieved LDL-C < 70 mg/dL, compared to 29.9%patients after a non-ST elevated myocardial infarction (NSTEMI) [12].
Due to health inequities between urban and rural regions, place of residence remainsone of the essential determinants of health [9]. Nevertheless, it is not currently knownwhether urban–rural differences exist in the prevalence of CV risk factors and the achieve-ment of therapeutic goals in Poland and some other CEE countries.
The aim of this study was to analyse the differences between the patients attendingprimary health care (PHC) practices located in urban and rural settings in Poland inreference to (1) the prevalence of CV risk factors and CVD and (2) the proportion ofindividuals achieving therapeutic goals in the treatment of HTN, dyslipidaemia, and DM.
2. Materials and Methods
We conducted a secondary analysis of the data from the nationwide cross-sectionalstudy LIPIDOGRAM2015, which was carried out in Poland in the fourth quarter of 2015and first and second quarters of 2016 [13]. A group of 438 physician-investigators in 398practices were selected in a manner proportional to the number of inhabitants in 16 Polish

J. Clin. Med. 2021, 10, 5656 3 of 12
major administrative regions. The study actively enrolled 13,724 adult patients seekingmedical care for any medical reason in PHC practices. Details of sampling, selection, andmeasurement methods have been described previously [5,13]. Briefly, for each participantin the study, the physician-investigator completed a 28-item questionnaire, which gatheredbasic demographic (age, gender, level of education, place of residence) and clinical (chronicdiseases, lifestyle habits including diet, physical activity, smoking status, family historyof CVD, and current pharmacotherapy) data. Anthropometric measurements were made(height, body weight, waist circumference, and hip circumference) and the body massindex (BMI) was calculated. On the same day, measurements of BP, heart rate, and fastingglucose were taken. Blood samples were collected for measurement of the lipid profile.Glycated haemoglobin was assessed in a subgroup of patients (random sample of up tofour patients in each PHC practice).
2.1. Definitions and Classification
HTN, DM, and dyslipidaemia were defined according to the relevant guidelines thatwere in force in 2015 [14–16].
Participants were classified as having HTN, DM, and dyslipidaemia when: (1) thosediseases were previously diagnosed; or (2) patient used at least one hypotensive, lipid-lowering or hypoglycaemic medication, respectively. Participants were also defined ashaving HTN when office SBP was ≥140 mmHg and/or office DBP was ≥90 mmHg (averagefrom two measurements). Participants were also defined as having dyslipidaemia whenthe measured LDL-C level was ≥115 mg/dL and/or TG level was ≥150 mg/dL.
The presence of coronary heart disease, previous myocardial infarction, atrial fibrilla-tion, ischemic or haemorrhagic stroke, and medications the patients used were reported inthe questionnaire by the physician who cared for the patient.
We used the WHO classification of obesity, based on BMI [17] and the norms ofthe International Diabetes Federation (IDF) for waist circumference (<80 cm in womenand <94 cm in men) [18]. Overweight was defined as BMI 25.0–29.9 and obesity ≥30.0,respectively. We defined abdominal obesity as a waist–hip ratio (WHR) ≥ 1 for men andWHR ≥ 0.85 for women [19].
Patients who smoked at least one cigarette per day on the day of inclusion in the studywere classed as current smokers. Patients who had smoked at least 100 cigarettes in theirlifetime, quit smoking, and did not smoke on the day of inclusion in the study were classedas ex-smokers. Patients who never smoked cigarettes were classed as non-smokers.
Therapeutic goals for HTN (SBP < 140 mmHg and DBP < 90 mmHg), DM (HbA1c < 7%),and dyslipidaemia (patients with CVD: LDL-C < 70 mg/dL, non-HDL-C < 85 mg/dL)were established on the basis of the guidelines in place in 2015 [14–16]. The analyses wereextended to include the therapeutic goals proposed in relevant guidelines that appearedin subsequent years, i.e., the guidelines on hypertension (2018) [20] and dyslipidaemia(2019) [21].
2.2. Statistical Analyses
Mean values, standard deviations, proportions of risk factors, and treatment usedare presented and compared between the patients from urban and rural areas using Pear-son’s chi-square or Mann–Whitney U or Student’s t-tests, as appropriate. The relationshipbetween the patients’ characteristics and their achievement of lipid-lowering goals, hy-pertension, and diabetes therapy was examined separately for urban and rural areas, andeach variable was analysed individually. Logistic regression was used to investigate therelationship between all independent variables and achievement of: (1) lipid-fraction targetlevels, (2) blood-pressure target levels, (3) glucose and HbA1c target levels.
Odds ratios (OR) and 95% confidence intervals (CI) are presented. P-values below 0.05were considered significant. All statistical analyses were conducted using the STATISTICAprogramme, version 13.3.

J. Clin. Med. 2021, 10, 5656 4 of 12
3. Results3.1. Patient Characteristics
The LIPIDOGRAM2015 study included 13,724 patients (7028 residents of urban and6696 rural areas, respectively). The average age was 56 years (57 in urban and 56 in ruralpopulations; p < 0.01). The average age of women living in cities was 2 years older thanthose living in rural settings (p < 0.01). The level of education was higher in urban areas inboth genders (p < 0.01). Demographic characteristics of enrolled patients (categorised bygender and place of residence) are presented in Table 1.
Table 1. Participant clinical characteristics.
All Women Men
Urban Rural p Urban Rural p Urban Rural p
Total n (%) 7028(51.21%)
6696(48.79%) 0.11 4495
(51.7%)4195
(48.3%) 0.11 2533(50.3%)
2501(49.7%) 0.11
Age X ± SD (years) 57 ± 14 56 ± 14 0.00 57 ± 14 55 ± 14 0.00 56 ± 14 56 ± 14 0.17
Levels of educationn (%)
Primary 546(7.77%)
1181(17.64%)
397(8.83%)
796(18.97%) 149 (5.88) 385
(15.39)
Vocational 1754(24.96%)
2298(34.32%)
918(20.42%)
1166(27.79%)
836(33.0%)
1132(45.26%)
Secondary 2811(40.00%)
3112(31.54%)
1931(42.96%)
1448(34.52%)
880(34.74%)
664(26.55%)
High 1917(27.28%)
1105(16.50%) 0.00 1249
(27.79%)785
(18.71%) 0.00 668(26.37%)
320(12.79%) 0.00
SBPX ± SD (mmHg) 132 ± 18 133 ± 19 0.01 130 ± 18 131 ± 19 0.05 136 ± 19 135 ± 17 0.14
DBPX ± SD (mmHg) 80 ± 10 81 ± 11 0.00 79 ± 10 80 ± 11 0.00 83 ± 11 82 ± 10 0.03
TC X ± SD (mg/dL) 202 ± 44 203 ± 45 0.21 205 ± 44 205 ± 43 0.92 199 ± 47 196 ± 44 0.02HDL − C X ± SD
(mg/dL)55 ± 15 55 ± 15 0.02 59 ± 15 58 ± 15 0.00 48 ± 13 48 ± 13 0.14
LDL − C X ± SD(mg/dL)
128 ± 40 130 ± 41 0.04 129 ± 41 130 ± 41 0.23 129 ± 40 126 ± 39 0.05
non−HDL−C X ± SD(mg/dL)
147 ± 42 148 ± 43 0.03 146 ± 42 147 ± 41 0.24 151 ± 45 148 ± 42 0.04
TG X ± SD (mg/dL) 147 ± 113 149 ± 124 0.79 135 ± 97 135 ± 83 0.83 174 ± 170 169 ± 133 0.78
Glycaemia X ± SD(mg/dL)
104 ± 25 103 ± 25 0.048 102 ± 24 102 ± 23 0.07 106 ± 27 106 ± 27 0.27
HbA1c X ± SD (%) 5.7 ± 1 5.7 ± 1 0.61 5.7 ± 0.9 5.7 ± 0.9 0.83 5.8 ± 1 5.8 ± 1 0.39
Hypertension n (%) 3482(49.54%)
3306(49.37%) 0.84 2152
(47.88%)1990
(47.44%) 0.68 1330(52.51%)
1316(52.62%) 0.94
Diabetes n (%) 964(13.72%)
879(13.13%) 0.31 534
(11.88%)487
(11.61%) 0.70 430(16.98%)
392(15.67%) 0.21
Dyslipidaemia n (%) 5917(84.22%)
5706(85.22%) 0.11 3698
(82.27%)461
(82.50%) 0.77 2221(87.68%)
2245(89.76%) 0.02
CVD n (%) 1014(14.43%)
951(14.20%) 0.70 550
(12.24%)459
(10.94%) 0.06 464(18.32%)
492(19.67%) 0.22
CHD 921(13.10%)
866(12.93%) 0.77 492
(10.95%)415
(9.89%) 0.11 429(16.94%)
451(18.03%) 0.31
MI 335(4.77%)
290(4.33%) 0.22 113
(2.51%) 81 (1.93%) 0.07 222(8.76%)
209(8.36%) 0.61

J. Clin. Med. 2021, 10, 5656 5 of 12
Table 1. Cont.
All Women Men
Urban Rural p Urban Rural p Urban Rural p
Haemorrhagic stroke 17 (0.24%) 14 (0.21%) 0.69 8 (0.18%) 8 (0.19%) 0.89 9 (0.36%) 6 (0.24%) 0.45
AF 343(4.88%)
365(5.45%) 0.13 208
(4.63%)202
(4.82%) 0.68 135(5.33%)
163(6.52%) 0.07
FH 32 (0.46%) 41 (0.61%) 0.21 25 (0.56%) 27 (0.64%) 0.60 7 (0.28%) 14 (0.56%) 0.12
Overweight n (%) 2822(40.15%)
2595(38.75%) 0.09 1623
(36.11%)1528
(36.42%) 0.76 1199(47.34%)
1067(42.66%) 0.00
Obesity n (%) 2273(32.34%)
2513(37.53%) 0.00 1365
(30.37%)1497
(35.69%) 0.00 908(35.85%)
1016(40.62%) 0.00
Exceeded waistcircumference (W ≥ 80cm; M ≥ 94 cm) n (%)
5446(77.49%)
5401(80.66%) 0.00 3563
(79.27%)3478
(82.91%) 0.00 650(74.34%)
578(76.89%) 0.04
Abdominal obesityn (%)
3035(43.18%)
3107(46.40%) 0.00 2292
(50.99%)2356
(56.16%) 0.00 743(29.33%)
751(30.03%) 0.59
Smoking status n (%)
Never smokers 3648(51.91%)
3742(55.88%)
2620(58.29%)
2781(66.29%)
1028(40.58%)
961(38.42%)
Current smokers 1247(17.74%)
1056(15.77%)
748(16.64%)
551(13.13%)
499(19.70%)
505(20.19%)
Ex-smokers 2133(30.35%)
1898(28.35%) 0.00 1127
(25.07%)863
(20.57%) 0.00 1006(39.72%)
1035(41.38%) 0.29
p < 0.05 was considered statistically significant. SD: standard deviation, SBP: systolic blood pressure, DBP: diastolic blood pressure, TC: totalcholesterol, HDL-C: high-density lipoprotein cholesterol, LDL-C: low-density lipoprotein cholesterol, TG: triglycerides, HbA1c: glycatedhaemoglobin, CVD: cardiovascular disease, CHD: coronary heart disease, MI: myocardial infarct, AF: atrial fibrillation. To receive values inmmol/L: (1) for TC, HDL-C, and LDL-C divide the value in mg/dL by 38.67; (2) for TG divide the value in mg/dL by 88.57.
3.2. Risk factors and Cardiovascular Diseases
There were no statistical differences between the mean levels of total cholesterol,triglycerides, glucose, and HbA1c in patients living in urban and rural areas. Mean systolicand diastolic BP was 1 mmHg higher in the rural residents (a statistically significantdifference). HDL-C concentration was statistically higher in the urban female populationand non-HDL-C level in the urban male population. The prevalence of hypertension, DM,dyslipidaemia, and CVD was similar in urban and rural areas. The prevalence of obesityand excessive waist circumference (77.49% vs. 80.66%, p < 0.01), as well as abdominalobesity (43.18 vs. 46.40%, p < 0.01), were higher in rural areas in both genders. However,there was no such trend in the overweight category—in men, the prevalence was higher inthe urban population, while in women, the differences were not statistically significant. Inaddition, women living in rural areas smoked less frequently than those in urban areas (astatistically significant difference), while the differences in smoking status in men were notstatistically significant. Detailed data are presented in Table 1.
There were also no statistically significant differences in the use of lipid-loweringtherapies, antihypertensives, or most diabetic medications between patients living in urbanand rural areas. The most frequently used lipid-lowering medicine were: atorvastatin,simvastatin, and rosuvastatin. Diabetes was treated mostly with metformin. The groups ofantihypertensive drugs most commonly used in PHC practices were ACEI, diuretics, andB-blockers. Glipizide was significantly more frequently used in the female rural population.Detailed values are presented in Table S1.
3.3. Achievement of Therapeutic Goals
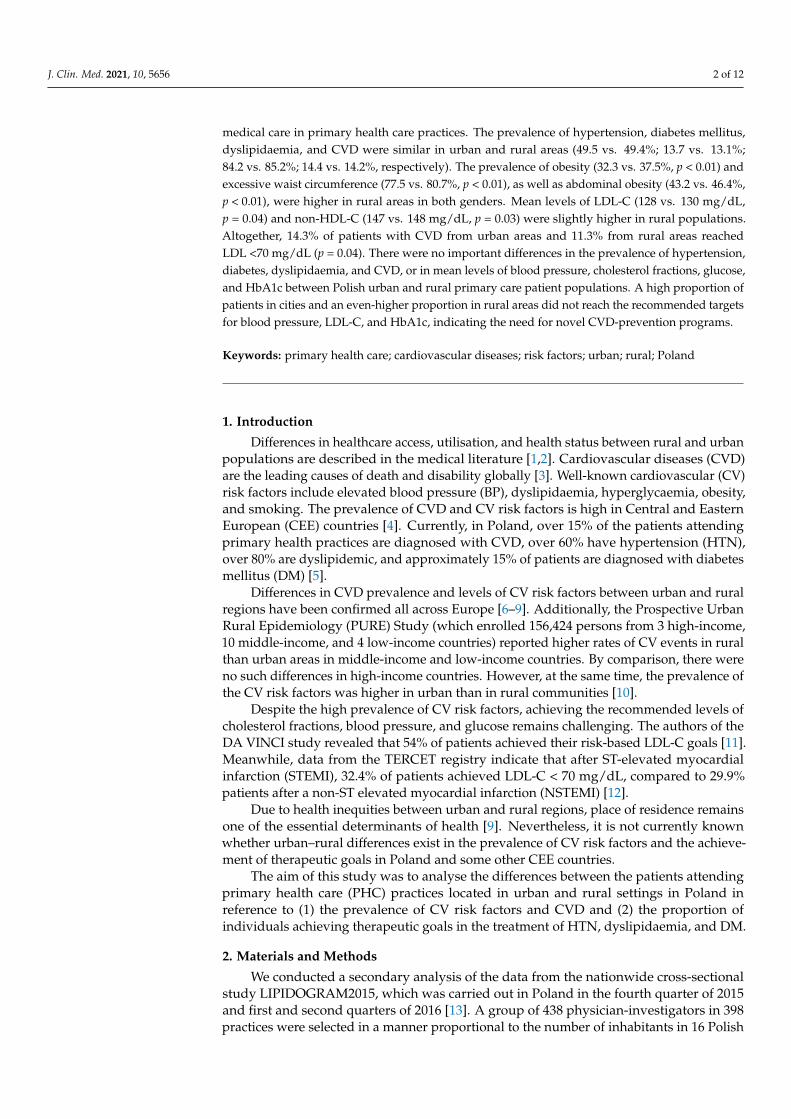
A proportion of 40% of patients (both in urban and rural areas) without diagnoseddiabetes had elevated fasting glucose levels. More than 55% of diabetic patients achievedHbA1c < 7% (Figure 1).

J. Clin. Med. 2021, 10, 5656 6 of 12
J. Clin. Med. 2021, 10, x FOR PEER REVIEW 6 of 13
3.3. Achievement of Therapeutic Goals A proportion of 40% of patients (both in urban and rural areas) without diagnosed
diabetes had elevated fasting glucose levels. More than 55% of diabetic patients achieved HbA1c < 7% (Figure 1).
Figure 1. Percentage of patients without diabetes with normal fasting glucose level and diabetic patients reaching treatment goals.
Roughly three quarters of patients without diagnosed hypertension had BP below 140/90 mmHg measured in the office. Forty-eight per cent of hypertensive patients in the urban population compared to 43% in the rural population achieved recommended BP targets (according to guidelines in force at the time the study was conducted) (p < 0.01). The differences were statistically significant in both genders (Figure 2). After analysing data in light of BP target values introduced by the 2018 ESH/ESC guidelines [20] (pub-lished after the study period), we discovered that new treatment targets were achieved in approximately 5% of patients. Detailed data are presented in Figure S1.
Figure 2. Percentage of patients without hypertension with normal blood-pressure level and hyper-tensive patients reaching treatment goals.
Over 36% of all patients without CVD had LDL-C < 115 mg/dL. In this group, around 22% had LDL-C < 100 mg/dL. Almost half of the patients reached non-HDL-C < 145 mg/dL, and around 2/3 of patients had TG < 150 mg/dL. The differences between urban and rural populations were not statistically significant (Figure 3). Fourteen per cent of patients with CVD from urban areas and 11% from rural areas reached LDL < 70 mg/dL (p = 0.04). The differences between urban and rural populations were statistically signifi-cant only in males (18% in urban areas vs. 12% in rural areas, p < 0.01). There were also
0%
10%
20%
30%
40%
50%
60%
70%
80%
90%
100%
all women men all women men
Fasting glycaemia <100 mg/dlin DM (-)
HbA1c <7%in DM (+)
urban rural
p=
0.70
p=
0.54
p=
0.71
p=
0.99
p=
0.58
p=
0.55
0%
10%
20%
30%
40%
50%
60%
70%
80%
90%
100%
all women men all women men
SBP <140 mmHgAND
DBP <90mmHgin HTN (-)
SBP <140 mmHgAND
DBP <90mmHgin HTN (+)
urban rural
p=
0.12
p=
0.00
p=
0.00
p=
0.05
p=
0.06
p=
0.38
Figure 1. Percentage of patients without diabetes with normal fasting glucose level and diabeticpatients reaching treatment goals.
Roughly three quarters of patients without diagnosed hypertension had BP below140/90 mmHg measured in the office. Forty-eight per cent of hypertensive patients in theurban population compared to 43% in the rural population achieved recommended BPtargets (according to guidelines in force at the time the study was conducted) (p < 0.01).The differences were statistically significant in both genders (Figure 2). After analysingdata in light of BP target values introduced by the 2018 ESH/ESC guidelines [20] (pub-lished after the study period), we discovered that new treatment targets were achieved inapproximately 5% of patients. Detailed data are presented in Figure S1.
J. Clin. Med. 2021, 10, x FOR PEER REVIEW 6 of 13
3.3. Achievement of Therapeutic Goals A proportion of 40% of patients (both in urban and rural areas) without diagnosed
diabetes had elevated fasting glucose levels. More than 55% of diabetic patients achieved HbA1c < 7% (Figure 1).
Figure 1. Percentage of patients without diabetes with normal fasting glucose level and diabetic patients reaching treatment goals.
Roughly three quarters of patients without diagnosed hypertension had BP below 140/90 mmHg measured in the office. Forty-eight per cent of hypertensive patients in the urban population compared to 43% in the rural population achieved recommended BP targets (according to guidelines in force at the time the study was conducted) (p < 0.01). The differences were statistically significant in both genders (Figure 2). After analysing data in light of BP target values introduced by the 2018 ESH/ESC guidelines [20] (pub-lished after the study period), we discovered that new treatment targets were achieved in approximately 5% of patients. Detailed data are presented in Figure S1.
Figure 2. Percentage of patients without hypertension with normal blood-pressure level and hyper-tensive patients reaching treatment goals.
Over 36% of all patients without CVD had LDL-C < 115 mg/dL. In this group, around 22% had LDL-C < 100 mg/dL. Almost half of the patients reached non-HDL-C < 145 mg/dL, and around 2/3 of patients had TG < 150 mg/dL. The differences between urban and rural populations were not statistically significant (Figure 3). Fourteen per cent of patients with CVD from urban areas and 11% from rural areas reached LDL < 70 mg/dL (p = 0.04). The differences between urban and rural populations were statistically signifi-cant only in males (18% in urban areas vs. 12% in rural areas, p < 0.01). There were also
0%
10%
20%
30%
40%
50%
60%
70%
80%
90%
100%
all women men all women men
Fasting glycaemia <100 mg/dlin DM (-)
HbA1c <7%in DM (+)
urban rural
p=
0.70
p=
0.54
p=
0.71
p=
0.99
p=
0.58
p=
0.55
0%
10%
20%
30%
40%
50%
60%
70%
80%
90%
100%
all women men all women men
SBP <140 mmHgAND
DBP <90mmHgin HTN (-)
SBP <140 mmHgAND
DBP <90mmHgin HTN (+)
urban rural
p=
0.12
p=
0.00
p=
0.00
p=
0.05
p=
0.06
p=
0.38
Figure 2. Percentage of patients without hypertension with normal blood-pressure level and hyper-tensive patients reaching treatment goals.
Over 36% of all patients without CVD had LDL-C < 115 mg/dL. In this group, around22% had LDL-C < 100 mg/dL. Almost half of the patients reached non-HDL-C < 145 mg/dL,and around 2/3 of patients had TG < 150 mg/dL. The differences between urban and ruralpopulations were not statistically significant (Figure 3). Fourteen per cent of patients withCVD from urban areas and 11% from rural areas reached LDL < 70 mg/dL (p = 0.04). Thedifferences between urban and rural populations were statistically significant only in males(18% in urban areas vs. 12% in rural areas, p < 0.01). There were also statistically significantdifferences between the percentage of patients with CVD reaching therapeutic goals ofnon-HDL-C in the urban and rural male population (11.21 vs. 7.32%, p = 0.04) (Figure 3).

J. Clin. Med. 2021, 10, 5656 7 of 12
J. Clin. Med. 2021, 10, x FOR PEER REVIEW 7 of 13
statistically significant differences between the percentage of patients with CVD reaching therapeutic goals of non-HDL-C in the urban and rural male population (11.21 vs. 7.32%, p = 0.04) (Figure 3).
Figure 3. Percentage of patients without cardiovascular diseases with normal cholesterol-fractions level and patients with cardiovascular diseases reaching treatment goals.
Applying the lower LDL-C target values introduced by the 2019 ESC/EAS guidelines [21] (published after the study period), treatment targets were achieved in less than 5% of patients. Detailed data are presented in Figure S1.
Patients with higher education were more likely to achieve therapeutic levels of LDL-C, BP, and glucose both in urban and rural populations (OR = 1.24, OR = 2.68, OR = 2.04, respectively). Diabetic patients living in urban areas had a slightly higher probability of achieving therapeutic LDL-C levels (OR = 1.15 in urban and OR = 1.06 in rural population). Age, male gender, co-existence of CVD risk factors, and other diseases were associated with a lower likelihood of reaching therapeutic levels of LDL-C, BP, and glucose. For both urban and rural populations, the strongest negative association with reaching therapeutic LDL-C goals was the co-existence of CVD (OR = 0.17 and OR = 0.13, respectively), while the presence of obesity was the strongest factor associated with failing to reach goals for BP and glucose levels. Detailed data are presented in Table 2.
Table 2. Logistic regression analysis of factors associated with the achievement of goals in the lipid-lowering, hypertension, and diabetes therapy, among study patients in urban and rural area.
Lipids Blood Pressure Glucose Urban Rural Urban Rural Urban Rural
Analysed Variables OR (95% CI)
p OR (95%
CI) p
OR (95% CI)
p OR (95%
CI) p
OR (95% CI)
p OR (95%
CI) p
Age 0.98
(0.98–0.98)
0.00 0.98 (0.98–
0.98) 0.00 0.97 (0.97–
0.97) 0.00 0.96 (0.96–
0.96) 0.00 0.97 (0.97–
0.98) 0.00 0.97 (0.97–
0.98) 0.00
Male 0.83
(0.75–0.91)
0.00 0.71 (0.65–0.79)
0.00 0.57 (0.51–0.63)
0.00 0.60 (0.54–0.67)
0.00 0.80 (0.73–0.88)
0.00 0.80 (0.72–0.88)
0.00
Levels of education
• Vocational 0.89
(0.74–1.09)
0.26 0.90 (0.78–
1.03) 0.13 1.16 (0.96–
1.41) 0.13 1.37 (1.19–
1.57) 0.00 1.16 (0.96–
1.41) 0.12 1.23 (1.07–
1.41) 0.00
0%
10%
20%
30%
40%
50%
60%
70%
80%
90%
100%
all women men all women men all women men all women men all women men all women men all women men
LDL-C <115 mg/dl LDL-C <100 mg/dl non-HDL-C <145 mg/dl TG <150 mg/dl LDL-C <70 mg/dl non-HDL-C <85 mg/dl TG <150 mg/dl
w i t h o u t p r e v i o u s C V D w i t h p r e v i o u s C V D
p g g
urban rural
p=
0.71
p=
0.91
p=
0.66 p
= 0.
22
p=
0.83
p=
0.09
p=
0.45
p=
0.91
p=
0.36
p=
0.04
p=
0.99
p=
0.00
p=
0.19
p=
0.85
p=
0.04
p=
0.13
p=
0.12
p=
0.59
p=
0.35
p=
0.47
p=
0.47
Figure 3. Percentage of patients without cardiovascular diseases with normal cholesterol-fractionslevel and patients with cardiovascular diseases reaching treatment goals.
Applying the lower LDL-C target values introduced by the 2019 ESC/EAS guide-lines [21] (published after the study period), treatment targets were achieved in less than5% of patients. Detailed data are presented in Figure S1.
Patients with higher education were more likely to achieve therapeutic levels of LDL-C, BP, and glucose both in urban and rural populations (OR = 1.24, OR = 2.68, OR = 2.04,respectively). Diabetic patients living in urban areas had a slightly higher probability ofachieving therapeutic LDL-C levels (OR = 1.15 in urban and OR = 1.06 in rural population).Age, male gender, co-existence of CVD risk factors, and other diseases were associatedwith a lower likelihood of reaching therapeutic levels of LDL-C, BP, and glucose. For bothurban and rural populations, the strongest negative association with reaching therapeuticLDL-C goals was the co-existence of CVD (OR = 0.17 and OR = 0.13, respectively), whilethe presence of obesity was the strongest factor associated with failing to reach goals forBP and glucose levels. Detailed data are presented in Table 2.
Table 2. Logistic regression analysis of factors associated with the achievement of goals in the lipid-lowering, hypertension,and diabetes therapy, among study patients in urban and rural area.
Lipids Blood Pressure Glucose
Urban Rural Urban Rural Urban Rural
Analysed Variables OR (95%CI) p OR (95%
CI) p OR (95%CI) p OR (95%
CI) p OR (95%CI) p OR (95%
CI) p
Age 0.98(0.98–0.98) 0.00 0.98
(0.98–0.98) 0.00 0.97(0.97–0.97) 0.00 0.96
(0.96–0.96) 0.00 0.97(0.97–0.98) 0.00 0.97
(0.97–0.98) 0.00
Male 0.83(0.75–0.91) 0.00 0.71
(0.65–0.79) 0.00 0.57(0.51–0.63) 0.00 0.60
(0.54–0.67) 0.00 0.80(0.73–0.88) 0.00 0.80
(0.72–0.88) 0.00
Levels of education
• Vocational 0.89(0.74–1.09) 0.26 0.90
(0.78–1.03) 0.13 1.16(0.96–1.41) 0.13 1.37
(1.19–1.57) 0.00 1.16(0.96–1.41) 0.12 1.23
(1.07–1.41) 0.00
• Secondary 0.99(0.83–1.19) 0.94 1.06
(0.92–1.22) 0.42 1.59(1.32–1.92) 0.00 2.21
(1.91–2.55) 0.00 1.51(1.25–1.81) 0.00 1.67
(1.44–1.93) 0.00
• High 1.24(1.02–1.50) 0.03 1.39
(1.18–1.64) 0.00 2.68(2.20–3.26) 0.00 3.56
(2.98–4.24) 0.00 2.04(1.68–2.47) 0.00 2.19
(1.85–2.60) 0.00
Hypertension 0.77(0.70–0.84) 0.00 0.84
(0.76–0.92) 0.00 0.31(0.28–0.34) 0.00 0.27
(0.24–0.30) 0.00 0.50(0.46–0.55) 0.00 0.53
(0.48–0.58) 0.00
Diabetes 1.15(1.00–1.32) 0.04 1.06
(0.92–1.23) 0.39 0.47(0.41–0.54) 0.00 0.46
(0.40–0.53) 0.00 0.69(0.60–0.79) 0.00 0.61
(0.53–0.71) 0.00
Dyslipidaemia 0.73(0.66–0.80) 0.00 0.76
(0.69–0.84) 0.00 0.70(0.64–0.77) 0.00 0.64
(0.58–0.71) 0.00 0.64(0.58–0.70) 0.00 0.69
(0.63–0.76) 0.00
CVD 0.17(0.14–0.20) 0.00 0.13
(0.11–0.16) 0.00 0.58(0.51–0.66) 0.00 0.59
(0.51–0.67) 0.00 0.65(0.57–0.75) 0.00 0.60
(0.52–0.69) 0.00

J. Clin. Med. 2021, 10, 5656 8 of 12
Table 2. Cont.
Lipids Blood Pressure Glucose
Urban Rural Urban Rural Urban Rural
Analysed Variables OR (95%CI) p OR (95%
CI) p OR (95%CI) p OR (95%
CI) p OR (95%CI) p OR (95%
CI) p
Overweight 0.62(0.55–0.70) 0.00 0.63
(0.56–0.72) 0.00 0.48(0.42–0.55) 0.00 0.51
(0.45–0.59) 0.00 0.59(0.52–0.67) 0.00 0.56
(0.48–0.64) 0.00
Obesity 0.59(0.52–0.67) 0.00 0.60
(0.53–0.69) 0.00 0.28(0.25–0.32) 0.00 0.28
(0.25–0.32) 0.00 0.38(0.34–0.44) 0.00 0.33
(0.29–0.38) 0.00
Exceeded waistcircumference(W ≥ 80 cm;M ≥ 94 cm)
0.63(0.56–0.71) 0.00 0.64
(0.57–0.72) 0.00 0.43(0.38–0.49) 0.00 0.39
(0.34–0.44) 0.00 0.45(0.40–0.51) 0.00 0.45
(0.39–0.51) 0.00
Abdominal obesity 0.81(0.74–0.90) 0.00 0.86
(0.78–0.95) 0.00 0.67(0.60–0.73) 0.00 0.66
(0.60–0.73) 0.00 0.64(0.58–0.70) 0.00 0.65
(0.59–0.72) 0.00
Smoking status
• Ex-smokers 0.85(0.76–0.95) 0.00 0.82
(0.74–0.92) 0.00 0.78(0.70–0.87) 0.00 0.90
(0.80–1.00) 0.06 0.78(0.70–0.86) 0.00 0.86
(0.77–0.96) 0.01
• Current smokers 0.80(0.70–0.91) 0.00 0.79
(0.68–0.90) 0.00 0.99(0.87–1.13) 0.90 1.02
(0.89–1.18) 0.73 0.85(0.74–0.97) 0.01 0.95
(0.83–1.10) 0.50
p < 0.05 was considered statistically significant. OR: odds ratio; CI: confidence interval; CVD: cardiovascular disease.
4. Discussion4.1. Main Findings
We found no important differences in the prevalence of hypertension, DM, dyslipi-daemia, or CVD in urban and rural adult populations attending primary care in Poland.Nor did we find differences in mean levels of glucose or HbA1c. However, obesity wasmore common among rural patients. There were no significant differences in the use oflipid-lowering, hypertensive, and diabetic medications between patients living in urbanand rural areas.
Both urban and rural women achieved recommended blood-pressure targets moreoften than men. Women without established CVD were also more likely to achieve theirtarget LDL-C, non-HDL-C, and TG values than men.
In urban areas, more patients with hypertension achieved their therapeutic goals. Thesame tendency was observed in patients with CVD attaining recommended LDL-C andnon-HDL-C targets in the male population.
Older age, male gender, co-existence of CV risk factors (e.g., excessive weight orwaist circumference, smoking, dyslipidaemia, hypertension, diabetes), and CVD, wereassociated with a lower likelihood of reaching therapeutic levels of LDL-C, BP, and glucoseboth in urban and rural populations. Of these factors, diagnosed CVD was most stronglyassociated with failure to reach therapeutic LDL-C goals. Obesity was strongly negativelyassociated with the achievement of therapeutic goals for BP and glucose.
4.2. Comparison with Other Studies
Poland is classified as a country with high CVD mortality [22]. Furthermore, severalstudies have observed high CVD morbidity and a high prevalence of CV risk factorsin Poland.
The NATPOL2011 study, which was conducted in Poland in 2011, showed that theprevalence of hypercholesterolaemia was 63.6% in villages, 55% in towns, with50,000–200,000 citizens, and 59.5% in towns with >200,000 citizens [23]. The WOBASZstudy measured the prevalence, in big Polish cities, of CVD risk factors such as overweight(47.9% in men, 39.0% in women), obesity (23.3% in men, 26.8% in women), HTN (68.8% inmen, 58.3% in women), hypercholesterolemia (82.6% in men, 87.4% in women), and DM(10.4% in men, 8.6% in women) [24]. In our study, the prevalence of obesity, dyslipidaemia,and diabetes was higher since the population of LIPIDOGRAM2015 does not represent the

J. Clin. Med. 2021, 10, 5656 9 of 12
general population of Poland, like the studies mentioned above, but those attending PHCpractices.
In 2018, Nowicki et al. published the results of a study conducted on 4040 inhabitantsof Eastern Poland, aged 35–64, without a prior history of CV events [25]. Residents ofurban areas more frequently achieved recommended levels of BMI (27 vs. 22%), BP (12 vs.9%), fasting cholesterol (38 vs. 35%), and fasting glucose (66 vs. 59%) than people living inrural areas. The prevalence of obesity was higher in rural areas (31 vs. 38%). Comparedwith our study, greater differences between the city and the countryside can be explainedby the method of recruiting patients (population selected from the electoral record) and thefact that the study was conducted in a less-developed region than the Polish average.
There are also some differences in the prevalence of CVD and CV risk factors betweenurban and rural populations in European countries and the United States.
In 2011, Markowic et al. published a study of 2467 participants ≥40 years old, whovisited their general practitioner for any reason. The study included 59 general practices,covering all of Croatia [6]. Participants from rural areas had significantly higher systolicand diastolic BP, while no clinically relevant differences in cholesterol fraction levels (TC,LDL-C, HDL-C, and TG) were observed. Obesity was more common in rural patientpopulations, both in the continental (35 vs. 45%) and coastal (32 vs. 36%) areas.
Lindroth et al. showed that the overweight and obesity rates were higher in rural thanurban areas (43 vs. 37% and 26 vs. 19%, respectively). The differences in SBP, DBP, andfasting glucose levels were not statistically significant. Cholesterol levels were lower incities than in the countryside, although the difference was minor (5.4 vs. 5.8 mmol/L inmales and 5.4 vs. 5.8 mmol/L in females) [7].
The U.S. Atherosclerosis Risk in Communities Study (ARIC) included white personsaged 45–64 (n = 7497) selected in urban and semi-rural areas surveyed in 1987–1989. TheTC and BP levels in both populations were similar [26,27].
Overall, the most recent studies from various developed countries have reportedsimilar results to ours and have found minor differences in CVD risk factors between ruraland urban areas.
4.3. Interpretation of Study Results
The results of our study confirm previous observations in relation to the high preva-lence of CVD and CV risk factors in the Polish population. This is true in both urban andrural areas. Although there are differences in the prevalence of CV risk factors betweenurban and rural populations in Poland, these differences in BP, cholesterol fractions, andglucose levels are small. Nevertheless, these differences should be taken into account fromthe public health point of view. They may be explained by differences in patients’ livingconditions and lifestyles. Differences may also reflect disparities in access to healthcare, asdescribed in other European studies [6,7]. Although we did not analyse these factors, theyshould be taken into account when interpreting our findings.
Our study results showed that less than half of hypertensive patients and less than10% of patients with CVD are reaching therapeutic goals for LDL-C. Those values are farfrom satisfactory and indicate a clear need for improvements in care. Pharmacotherapyused in the treatment of CVD, hypertension, and diabetes is similar in Polish urban andrural areas.
4.4. Implications of Study Results
The results of our study may be important for family doctors and their patients.Only around 50% of primary care patients in Poland achieve recommended targets forBP, glucose, and HbA1c. Of particular concern is the very low percentage of patientswith CVD reaching the therapeutic level of LDL-C. Thus, it is necessary to put moreemphasis on (1) understanding disease states and their implications for long-term health,(2) educating patients about the efficacy and importance of any drugs they are prescribed,and (3) emphasizing the importance of long-term adherence to drugs, lifestyle modification,

J. Clin. Med. 2021, 10, 5656 10 of 12
and clinical follow-up in order to optimize health care and management of CV risk factors.Concerning lipids, it is essential to encourage physicians to implement more effectivemanagement of patients, focusing on lifestyle changes and, when required, the use ofcombination therapy and share care arrangements with other specialists. Since the use ofezetimibe is suboptimal, PHC physicians should put more emphasis on combined statin–ezetimibe therapy. Particular attention should be paid to older men with a low level ofeducation and obese patients, especially in rural areas. We are currently seeing a trendtowards lowering the target values of cholesterol and blood pressure (introduced in 2018and 2019 by ESC guidelines) [20,21]. After analysing our data in light of those new targetvalues, we see the further need to implement more effective management of patients.
The results of our study are of interest to public health specialists. The high preva-lence of CV risk factors and problems with achieving therapeutic goals indicate that theexisting care and implemented national prevention programs are insufficient. The resultsof our study indicate that patients from rural areas likely have unrecognized obstacles toachieving target levels of BP, LDL-C, and non-HDL-C. It seems advisable to develop apatient information program and an educational agenda aimed at medical staff to improvethe situation.
Researchers should plan and perform additional systematic studies on CVD and CVrisk factor prevalence in the Polish PHC patient population. Such follow-up studies willhelp to assess whether the situation is changing in the desired direction.
5. Conclusions
The prevalence of CVD and CV risk factors among urban and rural adult populationsattending primary care in Poland is high. There were no important differences in theprevalence of hypertension, diabetes, dyslipidaemia, and CVD between those groups,while obesity was found to be slightly more common in rural areas. Patients with CVD, inparticular, have difficulties in achieving LDL-C target goals, while the rural male populationwith hypertension has less well-controlled BP. Therefore, there is a need to implement CVDprevention programs in Polish primary care aimed both at urban and rural areas residents,with greater attention paid to the rural population.
Supplementary Materials: The following are available online at https://www.mdpi.com/article/10.3390/jcm10235656/s1, S1. LIPIDOGRAM2015 Investigators; Table S1. Treatment used by LIPI-DOGRAM 2015 study participants; Figure S1. Therapeutic goals achievement according to 2018ESH/ESC and 2019 ESC/EAS guidelines in the LIPIDOGRAM 2015 study.
Author Contributions: K.S.: conceptualization, methodology, writing—original draft. T.T. and A.W.:conceptualization, methodology, writing—review and editing. M.B.: conceptualization, methodology,project administration, writing—review and editing. E.W.: conceptualization, methodology, formalanalysis. M.M., M.T., D.P.M., P.P.T., A.C., K.K.R., G.H., G.Y.H.L., F.J.C., N.S., B.W., T.M.M. andP.E.P.: writing—review and editing. J.J.J.: conceptualization, methodology, supervision, projectadministration, writing—review and editing. All authors gave final approval of the work, haveparticipated sufficiently in the work, and take public responsibility for appropriate portions of thecontent. All authors have read and agreed to the published version of the manuscript.
Funding: The present study was an initiative of the Polish Lipid Association (PoLA) and the Collegeof Family Physicians in Poland (CFPiP). The present study was funded by an unrestricted educationalgrant from Valeant. As a supporter of the study, Valeant had no role in study design, data analysis,data interpretation, or writing of the report. The present study was also supported by SilesianAnalytical Laboratories (SLA), CHDE, BIO–RAD.
Institutional Review Board Statement: The LIPIDOGRAM2015 study was approved by the Bioeth-ical Commission of the District Medical Chamber in Czestochowa on 02/12/2015 (No K.B.Cz.–0018/2015) and conforms to the principles outlined in the Declaration of Helsinki.
Informed Consent Statement: All participants signed informed consent and gave their permissionto use their anonymised data for the purpose of the scientific studies.

J. Clin. Med. 2021, 10, 5656 11 of 12
Data Availability Statement: The data underlying this article will be shared on reasonable requestto the corresponding author.
Acknowledgments: We would like to thank all volunteer LIPIDOGRAM2015 investigators, allvolunteer staff, and all participants. The list of the LIPIDOGRAM2015 Investigators is presentedin S1.
Conflicts of Interest: J.J.J. and M.B. have received an unrestricted educational grant from Valeant,and served as a consultant or speaker for Valeant. T.T. has served as a consultant or speaker forBoehringer Ingelheim, Biofarm, AstraZeneca, Novo Nordisk Pharma. P.E.P. owns four shares inAstraZeneca PLC and has received honoraria and/or travel reimbursement for events sponsored byAKCEA, Amgen, AMRYT, Link Medical, Mylan, Napp, and Sanofi. D.P.M. has given talks, acted asa consultant, or attended conferences sponsored by Amgen, Novo Nordisk, and Libytec. All otherauthors have no conflict of interest concerning the results of this analysis. The funders had no rolein the design of the study; in the collection, analyses, or interpretation of data; in the writing of themanuscript, or in the decision to publish the results.
References1. Hartley, D. Rural health disparities, population health, and rural culture. Am. J. Public Health 2004, 94, 1675–1678. [CrossRef]2. Bragg, F.; Holmes, M.V.; Iona, A.; Guo, Y.; Du, H.; Chen, Y.; Bian, Z.; Yang, L.; Herrington, W.; Bennett, D.; et al. Association
between diabetes and cause-specific mortality in rural and urban areas of China. JAMA J. Am. Med. Assoc. 2017, 317, 280–289.[CrossRef] [PubMed]
3. GBD 2017 Causes of Death Collaborators. Global, regional, and national age-sex-specific mortality for 282 causes of death in195 countries and territories, 1980–2017: A systematic analysis for the Global Burden of Disease Study 2017. Lancet 2018, 392,1736–1788. [CrossRef]
4. Wilkins, E.; Wilson, L.; Wickramasinghe, K.; Bhatnagar, P.; Leal, J.; Luengo-Fernandez, R.; Burns, R.; Rayner, M.; Townsend, N.European Cardiovascular Disease Statistics 2017; European Heart Network: Brussels, Belgium, 2017.
5. Józwiak, J.J.; Studzinski, K.; Tomasik, T.; Windak, A.; Mastej, M.; Catapano, A.L.; Ray, K.K.; Mikhailidis, D.P.; Toth, P.P.;Howard, G.; et al. The prevalence of cardiovascular risk factors and cardiovascular disease among primary care patients inPoland: Results from the LIPIDOGRAM2015 study. Atheroscler. Suppl. 2020, 42, e15–e24. [CrossRef] [PubMed]
6. Markovic, B.B.; Vrdoljak, D.; Kranjcevic, K.; Vucak, J.; Kern, J.; Bielen, I.; Lalic, D.I.; Katic, M.; Reiner, Ž. Continental-Mediterraneanand rural-urban differences in cardiovascular risk factors in Croatian population. Croat. Med. J. 2011, 52, 566–575. [CrossRef]
7. Lindroth, M.; Lundqvist, R.; Lilja, M.; Eliasson, M. Cardiovascular risk factors differ between rural and urban Sweden: The 2009Northern Sweden MONICA cohort. BMC Public Health 2014, 14, 1–8. [CrossRef] [PubMed]
8. Supiyev, A.; Nurgozhin, T.; Zhumadilov, Z.; Peasey, A.; Hubacek, J.A.; Bobak, M. Prevalence, awareness, treatment and control ofdyslipidemia in older persons in urban and rural population in the Astana region, Kazakhstan. BMC Public Health 2017, 17, 651.[CrossRef] [PubMed]
9. Nuotio, J.; Vähämurto, L.; Pahkala, K.; Magnussen, C.G.; Hutri-Kähönen, N.; Kähönen, M.; Laitinen, T.; Taittonen, L.; Tossavainen,P.; Lehtimäki, T.; et al. CVD risk factors and surrogate markers—Urban-rural differences. Scand. J. Public Health 2020, 48, 752–761.[CrossRef] [PubMed]
10. Yusuf, S.; Rangarajan, S.; Teo, K.; Islam, S.; Li, W.; Liu, L.; Bo, J.; Lou, Q.; Lu, F.; Liu, T.; et al. Cardiovascular risk and events in 17low-, middle-, and high-income countries. N. Engl. J. Med. 2014, 371, 818–827. [CrossRef]
11. Ray, K.K.; Molemans, B.; Schoonen, W.M.; Giovas, P.; Bray, S.; Kiru, G.; Murphy, J.; Banach, M.; De Servi, S.; Gaita, D.; et al.EU-Wide Cross-Sectional Observational Study of Lipid-Modifying Therapy Use in Secondary and Primary Care: The DA VINCIstudy. Eur. J. Prev. Cardiol. 2020, 28, 1279–1289. [CrossRef] [PubMed]
12. Dyrbus, K.; Gasior, M.; Desperak, P.; Nowak, J.; Osadnik, T.; Banach, M. Characteristics of lipid profile and effectiveness ofmanagement of dyslipidaemia in patients with acute coronary syndromes—Data from the TERCET registry with 19,287 patients.Pharmacol. Res. 2019, 139, 460–466. [CrossRef] [PubMed]
13. Józwiak, J.; Kasperczyk, S.; Tomasik, T.; Osadnik, T.; Windak, A.; Studzinski, K.; Mastej, M.; Catapano, A.; Ray, K.K.; Mikhai-lidis, D.; et al. Design and rationale of a nationwide screening analysis from the LIPIDOGRAM2015 and LIPIDOGEN2015studies. Arch. Med. Sci. 2020, 1–13. [CrossRef]
14. Tykarski, A.; Narkiewicz, K.; Gaciong, Z.; Januszewicz, A.; Litwin, M.; Kostka-Jeziorny, K.; Adamczak, M.; Szczepaniak-Chicheł,L.; Chrostowska, M.; Czarnecka, D.; et al. 2015 guidelines for the management of hypertension. Recommendations of the PolishSociety of Hypertension—Short version. Kardiol. Pol. 2015, 73, 676–700. [CrossRef] [PubMed]
15. Reiner, Z.; Catapano, A.L.; De Backer, G.; Graham, I.; Taskinen, M.-R.; Wiklund, O.; Agewall, S.; Alegria, E.; Chapman, M.J.;Durrington, P.; et al. ESC/EAS Guidelines for the management of dyslipidaemias: The Task Force for the management ofdyslipidaemias of the European Society of Cardiology (ESC) and the European Atherosclerosis Society (EAS). Eur. Heart J. 2011,32, 1769–1818. [CrossRef] [PubMed]

J. Clin. Med. 2021, 10, 5656 12 of 12
16. Czech, A.; Cypryk, K.; Czupryniak, L.; Gajewska, D.; Grzeszczak, W.; Gumprecht, J.; Idzior-Walus, B.; Jaosz-Chobot, P.; Kalarus,Z.; Karnafel, W.; et al. Guidelines (PTD) 2015 Guidelines on the management of diabetic patients. A position of Diabetes Poland.Clin. Diabetol. 2015, 4 (Supp. A), 1–79.
17. NCD Risk Factor Collaboration (NCD-RisC). Trends in adult body-mass index in 200 countries from 1975 to 2014: A pooledanalysis of 1698 population-based measurement studies with 19·2 million participants. Lancet 2016, 387, 1377–1396. [CrossRef]
18. Alberti, K.G.M.M.; Zimmet, P.; Shaw, J. Metabolic syndrome—A new world-wide definition. A Consensus Statement from theInternational Diabetes Federation. Diabet. Med. 2006, 23, 469–480. [CrossRef]
19. Perk, J.; De Backer, G.; Gohlke, H.; Graham, I.; Reiner, Ž.; Verschuren, M.; Albus, C.; Benlian, P.; Boysen, G.; Cifkova, R.; et al.European Guidelines on cardiovascular disease prevention in clinical practice (version 2012). Eur. Heart J. 2012, 33, 1635–1701.[CrossRef] [PubMed]
20. Williams, B.; Mancia, G.; Spiering, W.; Agabiti Rosei, E.; Azizi, M.; Burnier, M.; Clement, D.; Coca, A.; De Simone, G.; Dominiczak,A.; et al. 2018 Practice Guidelines for the management of arterial hypertension of the European Society of Hypertension andthe European Society of Cardiology: ESH/ESC Task Force for the Management of Arterial Hypertension. J. Hypertens. 2018, 36,2284–2309. [CrossRef] [PubMed]
21. Mach, F.; Baigent, C.; Catapano, A.L.; Koskinas, K.C.; Casula, M.; Badimon, L.; Chapman, M.J.; De Backer, G.G.; Delgado, V.;Ference, B.A.; et al. 2019 ESC/EAS Guidelines for the management of dyslipidaemias: Lipid modification to reduce cardiovascularrisk. Eur. Heart J. 2020, 41, 111–188. [CrossRef] [PubMed]
22. Piepoli, M.F.; Hoes, A.W.; Agewall, S.; Albus, C.; Brotons, C.; Catapano, A.L.; Cooney, M.T.; Corrà, U.; Cosyns, B.; Deaton, C.; et al.2016 European Guidelines on cardiovascular disease prevention in clinical practice. Eur. Heart J. 2016, 37, 2315–2381. [CrossRef][PubMed]
23. Zdrojewski, T.; Rutkowski, M.; Bandosz, P.; Gaciong, Z.; Solnica, B.; Drygas, W.; Wojtyniak, B.; Stokwiszewski, J.; Pencina, M.;Wołkiewicz, E.; et al. Assessment of the prevalence and control of cardiovascular risk factors in Poland—NATPOL 1997, 2002,2011 studies. In Epidemiology and Prevention of Cardiovascular Diseases; Medycyna Praktyczna: Kraków, Poland, 2015; pp. 57–64.
24. Dorynska, A.; Polak, M.; Kozela, M.; Szafraniec, K.; Piotrowski, W.; Bielecki, W.; Drygas, W.; Kozakiewicz, K.; Piwonski, J.;Tykarski, A.; et al. Cardiovascular disease (CVD) risk factors in Kraków and in the whole Poland adult population. Results fromthe WOBASZ study and Polish arm of the HAPIEE project. Przeglad Epidemiologiczny 2015, 69, 79–86, 175–180. [PubMed]
25. Nowicki, G.J.; Slusarska, B.; Piasecka, H.; Bartoszek, A.; Kocka, K.; Deluga, A. The status of cardiovascular health in rural andurban areas of janów lubelski district in eastern poland: A population-based study. Int. J. Environ. Res. Public Health 2018, 15, 2388.[CrossRef] [PubMed]
26. Rywik, S.L.; Davis, C.E.; Pajak, A.; Broda, G.; Folsom, A.R.; Kawalec, E.; Williams, O.D. Poland and U.S. Collaborative study oncardiovascular epidemiology hypertension in the community: Prevalence, awareness, treatment, and control of hypertension inthe Pol-MONICA project and the U.S. Atherosclerosis risk in communities study. Ann. Epidemiol. 1998, 8, 3–13. [CrossRef]
27. Broda, G.; Davis, C.E.; Pajak, A.; Williams, O.D.; Rywik, S.L.; Baczynska, E.; Folsom, A.R.; Szklo, M. Poland and United StatesCollaborative Study on Cardiovascular Epidemiology. Arterioscler. Thromb. Vasc. Biol. 1996, 16, 339–349. [CrossRef] [PubMed]