
THE DEVELOPMENT OF VIEWING STRATEGIES IN ...
285
THE DEVELOPMENT OF VIEWING STRATEGIES IN PATIENTS WITH MACULAR DISEASE Michael Dominique Crossland Institute of Ophthalmology, University College London Thesis submitted for the degree of Doctor of Philosophy 2004
-
Upload
khangminh22 -
Category
Documents
-
view
3 -
download
0
Transcript of THE DEVELOPMENT OF VIEWING STRATEGIES IN ...

THE DEVELOPMENT OF VIEWING STRATEGIES IN PATIENTS WITH
MACULAR DISEASE
Michael Dominique Crossland
Institute of Ophthalmology, University College London
Thesis submitted for the degree of Doctor of Philosophy
2004

UMI Number: U602656
All rights reserved
INFORMATION TO ALL USERS The quality of this reproduction is dependent upon the quality of the copy submitted.
In the unlikely event that the author did not send a complete manuscript and there are missing pages, these will be noted. Also, if material had to be removed,
a note will indicate the deletion.
Dissertation Publishing
UMI U602656Published by ProQuest LLC 2014. Copyright in the Dissertation held by the Author.
Microform Edition © ProQuest LLC.All rights reserved. This work is protected against
unauthorized copying under Title 17, United States Code.
ProQuest LLC 789 East Eisenhower Parkway
P.O. Box 1346 Ann Arbor, Ml 48106-1346

OV
O'Of
UJ

3
Abstract
Background: This thesis describes the results of the first longitudinal study of visual
behaviour in patients with newly developed macular disease (MD). The study is of a
natural history, case series design. Methods: Twenty patients with age-related
macular disease and five with juvenile forms of MD were recruited. All patients had
developed scotomas in their second affected eye within the previous two weeks.
Patients were assessed five times over the next twelve months. In addition to clinical
tests, fixation behaviour was assessed using a scanning laser ophthalmoscope, eye
movements were measured using an infra-red eyetracker and reading speed was
recorded. Multivariate statistical techniques were applied to determine which factors
limit reading speed and which variables lead to a change in reading speed. Results:
All 25 patients developed a preferred retinal locus (PRL) within six months. Sixteen
patients made an adaptation whereby they were unaware of using the PRL. By the
end of the study, fifteen patients (60%) repeatedly made eye movements which
displayed the characteristics of non-foveating saccades. Saccade efficiency reached
normal levels in eight patients (32%). Over the course of the study, reading speed
improved in four patients (16%), deteriorated in 7 patients (28%) and remained
constant in the remaining 14 patients. Changes in reading speed were due to changes
in fixation stability, non-awareness of using the PRL and developing a strategy of
repeatedly using the same number of PRLs. The likelihood of a change in reading
speed could not be predicted by disease type, visual acuity or scotoma size.
Conclusions: It was not possible to predict which patients’ reading speed will change
from the measures used in this study. The conclusions of this thesis have implications
for the counselling of patients with macular disease and the development of training
programs for patients with this common, debilitating condition.

Brief contents
4
This page gives an outline of the structure of this thesis. A full contents follows
overleaf.
Part 1: Introduction and methods
1: Introduction........................................................................................................... 16
2: General method.................................................................................................... 63
3: Development of statistical m ethod.................................................................... 77
4: Validation of novel methods............................................................................... 84
Part 2: Results5: Characteristics of patients at baseline and results for control subjects 97
6: The location of the PRL and awareness of its use.......................................... 106
7: Fixation stability and the number of preferred retinal loci........................... 120
8: Saccadic considerations..................................................................................... 132
9: Eye movements made whilst reading.............................................................. 154
Part 3: Analyses10: Cross sectional analysis: Factors which predict reading speed.................. 168
11: Longitudinal analysis: Factors which predict change in reading speed... 178
12: Factors which predict successful adaptation to macular disease.............. 188
Part 4: General discussion and conclusions
13: General discussion......................................................................................... 193
14: Clinical implications and suggestions for future research........................ 216
15: Conclusions..................................................................................................... 223
References.............................................................................................................. 225
Appendix 1: Patient details................................................................................. 242
Appendix 2: Consent fo rm ................................................................................. 253
Appendix 3: Protocols for methods................................................................... 260
Appendix 4: Published work............................................................................... 263

5
Contents
Frontispiece 2
Abstract 3
Brief contents 4
Contents 5
Acknowledgements 15
Chapter 1: Introduction 161.1 The human macula 16
1.1.1 Anatomy 16
1.1.2 Function 17
1.2 Macular disease 18
1.2.1 Age-related macular disease (AMD) 18
1.2.1.1 Geographic atrophy 19
1.2.2.2 Exudative AMD 19
1.2.1.3 Laser photocoagulation in exudative AMD 20
1.2.1.4 Photodynamic therapy in exudative AMD 21
1.2.2 Juvenile macular diseases 23
1.2.2.1 Stargardt disease 24
1.2.2.2 Best disease 25
1.2.3 Subjective complaints of patients with macular disease 25
1.2.4 Current approaches to the rehabilitation of patients with MD 26
1.2.4.1 Low vision assessment 26
1.2.4.2 Non-optical aids 27
1.2.4.3 Social support 27
1.2.5 The benefit of rehabilitation in macular disease 27
1.2.6 Summary 28
1.3 The preferred retinal locus 29
1.3.1 Assessment of the PRL 29
1.3.1.1 The scanning laser ophthalmoscope 29
1.3.1.2 Choice of fixation target 31
1.3.2 Position of the PRL 31

6
1.3.2.1 Theoretical best location for the PRL 32
1.3.2.2 Vertical vs. horizontal PRL location 33
1.3.2.3 Left vs. right PRL location 33
1.3.2.4 Task-dependent selection of the PRL 34
1.3.2.5 Attention and the choice of PRL location 34
1.3.3 Multiple PRLs 35
1.3.4 Awareness of PRL use 36
1.3.5 Fixation stability within the PRL 37
1.3.5.1 The bivariate contour ellipse area 37
1.3.5.2 Method of recording the BCEA 37
1.3.5.3 Range of BCEAs with and without MD 38
1.3.6 Limitations of current research into the PRL 38
1.3.6.1 The problem of multiple preferred retinal loci 38
1.3.6.2 The effect of the contralateral eye 39
1.3.6.3 The duration of disease 40
1.3.7 Conclusion 40
1.4 Eye movement control 41
1.4.1 Foveating eye movements 41
1.4.1.1 Saccadic latency 42
1.4.1.2 The number of saccades used to view a target 42
1.4.1.3 Saccadic velocity 43
1.4.2 Eye movements with a central scotoma 43
1.4.2.1 Saccadic latency and velocity 43
1.4.2.2 The number of saccades used to find a target 44
1.4.2.3 Animal models 44
1.4.2.4 Accidental laser damage to the macular region 45
1.4.3 Conclusion 46
1.5 Reading 47
1.5.1 Some elements of the reading process 47
1.5.1.1 The effect of text size and contrast on reading speed 47
1.5.1.2 Spans, visual and perceptual 48
1.5.1.3 Eye movements and fixations during reading 48
1.5.2 Reading with macular disease 50
1.5.2.1 Visibility: reduction in visual acuity and contrast sensitivity 50

7
1.5.2.2 Number of characters seen 51
1.5.2.3 Reduction in eye movement control 52
1.5.2.4 Reduction in fixation stability and the use of a PRL 53
1.5.3 Conclusion 53
1.6 Training visual behaviour in macular disease 55
1.6.1 Teaching awareness of the PRL location 55
1.6.2 Teaching the use of an “optimal” PRL 56
1.6.3 Teaching eye movement control 57
1.6.4 The use of prismatic spectacles 58
1.6.5 The use of visual training in macular disease 58
1.7 This study: The development of viewing strategies in macular disease 60
1.7.1 Rationale 60
1.7.2 Introduction to this project 60
1.7.3 Aims 61
1.7.4 Hypotheses 61
Chapter 2: General method 632.1 Patient selection 63
2.1.1 Inclusion and exclusion criteria 63
2.1.1.1 Inclusion criteria for patients 63
2.1.1.2 Exclusion criteria 63
2.1.1.3 Inclusion criteria for control subjects 64
2.1.2 Visit schedule 64
2.1.3 Discharge point from the study 64
2.1.4 Ethical committee approval 64
2.2 General method 65
2.2.1 Definition of study eye 65
2.2.2 Monitor setup 65
2.3 Clinical method 65
2.3.1 Refraction 65
2.3.2 Low vision assessment 65
2.3.3 Distance visual acuity measurement 66
2.3.4 Near visual acuity measurement 66
2.3.5 Contrast sensitivity 66

8
2.4 Assessment of visual function 66
2.4.1 Suprathreshold reading speed 66
2.5 Laboratory methods 67
2.5.1 Scanning laser ophthalmoscopy 67
2.5.1.1 Microperimetry 68
2.5.1.2 Analysis of SLO images 68
2.5.1.3 Measurement of scotoma size 70
2.5.1.4 Analysis of fixation 70
2.5.2 Eye tracking 71
2.5.2.1 Calibration and drift correction 72
2.5.2.2 Fixation stability 72
2.5.2.3 Saccadic latency, accuracy and peak velocity 73
2.5.2.4 Eye tracking for reading 75
2.6 Software used for statistics and data analysis 76
Chapter 3: Development of statistical method 773.1 Collaboration 77
3.2 Fixation stability: The bivariate contour ellipse area (BCEA) 77
3.3 Analysing multiple loci of fixation 78
3.3.1 The kernel density estimator 78
3.3.2 The EM algorithm 79
3.4 Application and validation 80
3.5 Validation and further information 80
Chapter 4: Validation of novel methods 84
4.1 The use of an infra-red gazetracker to measure fixation stability 84
4.1.1 Methods 85
4.1.1.1 SLO calibration 85
4.1.1.2 Measurement of fixation stability with the SLO 86
4.1.1.3 SLO data collection 86
4.1.1.4 Eyetracker calibration 86
4.1.1.5 Measurement of fixation stability with the eyetracker 86
4.1.2 Results 87
4.1.3 Discussion 88
4.1.4 Conclusion 89
9
4.2 The kernel density estimator and EM algorithm 90
4.2.1 Method 90
4.2.2 Results 90
4.2.2.1 Repeatability 93
4.2.3 Discussion 93
4.2.3.1 Limitations of the KDE 94
4.2.3.2 Limitations of the EM algorithm 95
4.2.4 Conclusion 95
Chapter 5: Characteristics of patients at baseline and results for control subjects97
5.1 Comparison of patients and control subjects 97
5.1.1 Specific methods 97
5.1.2 Demographic features 97
5.1.3 Clinical features of AMD patients and older control subjects 98
5.1.4 Clinical features of JMD patients and younger control subjects 99
5.1.5 Clinical features and the type of macular disease 99
5.1.6 Discussion 100
5.1.7 Summary 101
5.2 Change in control subjects’ performance over twelve months 101
5.2.1 Specific method 101
5.2.2 Results 102
5.2.3 Discussion 102
5.3 Determination of a statistically significant change in reading speed 102
5.3.1 Specific method 103
5.3.2 Results 103
Chapter 6: The location of the PRL and awareness of its use 1066.1 The location of the principal PRL 107
6.1.1 Specific methods 107
6.1.2 Results 107
6.1.2.1 Location of the principal PRL at baseline 107
6.1.2.2 Location of the principal PRL at exit point 108
6.1.2.3 Change in the location of the PRL 110
6.1.2.4 Change in PRL location and changes in reading speed 111
6.1.2.5 Time to use the “final” PRL 111

10
6.1.3 Discussion 111
6.1.4 Conclusion 113
6.2 Awareness of PRL use 114
6.2.1 Specific methods 114
6.2.1.1 Specific statistical methods 114
6.2.2 Results 114
6.2.2.1 Pseudofoveation and disease type 114
6.2.2.2 Reading speed and pseudofoveation 115
6.2.2.3 Prediction of pseudofoveation 116
6.2.3 Discussion 116
6.3 Summary of chapter 6 118
Chapter 7: Fixation stability and the number of preferred retinal loci 1207.1 Fixation stability 120
7.1.1 Specific methods 120
7.1.2 Results 120
7.1.2.1 Fixation stability 120
7.1.2.2 Change in fixation stability 121
7.1.2.3 Reading speed and fixation stability 122
7.1.3 Discussion 123
7.2 The number of preferred retinal loci 124
7.2.1 Specific methods 124
7.2.2 Results 124
7.2.2.1 Multiple PRLs at baseline 124
1.2.2.2 Change in the number of PRLs used 125
1.2.23 Reading speed and the presence of multiple PRLs 126
7.2.2.4 Time to develop the optimal number of PRLs 128
7.2.3 Discussion 128
7.3 Summary of chapter 7 130
Chapter 8: Saccadic considerations 1328.1 Specific methods 133
8.2 Interaction between saccadic properties in each meridian 133
8.2.1 Relationships among saccadic efficiency, latency and velocity 133

11
8.2.2 Systematic differences in saccades made in different directions 135
8.2.2.1 Saccadic latency 135
8.2.2.2 Peak saccadic velocity 136
8.2.23 Number of saccades to find a target 136
8.2.3 Discussion 137
8.3 Saccadic efficiency: the number of saccades used to view a target 138
8.3.1 The effect of macular disease on saccade efficiency 138
8.3.2 Saccade efficiency and reading speed 139
8.3.3 Changes in saccade efficiency with time 139
8.3.4 Discussion 141
8.3.5 Conclusion 142
8.4 Saccadic latency and velocity 143
8.4.1 Effect of age and macular disease on saccadic latency and velocity 144
8.4.2 Saccadic latency, saccadic velocity and reading speed 144
8.4.3 Changes in saccadic latency and velocity with time 146
8.4.4 Discussion 149
8.4.4.1 Saccadic latency and velocity at baseline 149
8.4.4.2 Foveating or non-foveating saccades? 150
8.5 Summary of chapter 8 152
Chapter 9: Eye movements made whilst reading 154
9.1 Specific methods 155
9.2 Number of saccades used whilst reading 156
9.2.1 The effect of macular disease on eye movements when reading 156
9.2.2 The relationship between eye movements when reading and when
observing a target 158
9.2.3 The relationship between eye movements when reading and reading
speed 159
9.2.4 Change in the number of saccades used for reading with time 160
9.3 Fixation duration 162
9.3.1 The effect of age and macular disease on fixation duration
at baseline 162
9.3.2 The relationship between fixation duration and reading speed 162
9.3.3 Changes in fixation duration with time 163

12
9.4 Discussion 164
9.4.1 The number of saccades used when reading 164
9.4.2 Fixation duration 165
9.4.3 The relative importance of each variable 166
9.5 Conclusion 166
Chapter IQ: Cross-sectional analysis: Factors which predict reading speed 168
10.1 Specific method 169
10.2 Baseline reading speed 170
10.2.1 Model constructed 170
10.2.2 Validity of the model 171
10.3 Exit reading speed 172
10.3.1 Model constructed 173
10.3.2 Validity of the model 174
10.4 Discussion 175
10.4.1 Conclusion 176
Chapter 11: Longitudinal analysis: Factors which predict change inreading speed 17811.1 Changes in reading speed for AMD patients 180
11.1.1 Change in reading speed between entrance and exit for AMD
patients 181
11.1.2 Change in reading speed between 0 and 3 months for AMD
patients 182
11.1.3 Change in reading speed beyond 6 months for AMD patients 183
11.1.4 Discussion 184
11.2 Changes in reading speed for JMD patients 186
11.3 Conclusion 186
Chapter 12: Factors which predict successful rehabilitation to
macular disease 18812.1 Specific methods 188
12.1.1 Logistic regression 188
12.1.2 Odds ratios 189
12.1.3 The receiver operating characteristic 189
12.2 Prediction of which patients will read fluently at the study exit point 189

13
12.3 Predictive values for reading speed improving or deteriorating 191
12.4 Discussion 192
Chapter 13: General discussion 19313.1 Hypothesis 1: The development of the preferred retinal locus 193
13.1.1 Development of a consistent PRL 193
13.1.1.1 Do saccadic characteristics determine the final PRL location? 194
13.1.1.2 What does predict the final PRL location? 195
13.1.2 The number of PRLs used 195
13.1.3 Fixation stability 196
13.1.4 Awareness of PRL use 196
13.1.5 Limitations 197
13.1.6 Conclusion 198
13.2 Hypothesis 2: Changes in eye movements 198
13.2.1 Saccadic efficiency 199
13.2.2 Foveating and non-foveating saccades 199
13.2.3 Eye movements made whilst reading 200
13.2.4 Limitations 200
13.2.5 Conclusion 201
13.3 Hypothesis 3: Prediction of reading speed 191
13.3.1 Limitations 201
13.3.2 Conclusion 202
13.4 Hypothesis 4: Functional performance will improve 202
13.4.1 The difference between “early” and “overall” changes in
reading speed 204
13.4.2 The importance of fixation stability 204
13.4.3 The importance of contrast sensitivity 204
13.4.4 Other factors which predict an improvement in reading speed 205
13.4.4.1 Self-prescribed training 206
13.4.4.2 CCTV use 206
13.4.4.3 Motivation 207
13.4.5 Limitations 207
13.4.6 Conclusions 207
13.5 Hypothesis 5: Superior performance of patients with JMD 208

14
13.5.1 Speed of adaptation 208
13.5.2 Fullness of adaptation 208
13.5.3 Limitations 209
13.5.4 Conclusion 209
13.6 Potential limitations of the study 210
13.7 Meeting the aims of the study 214
C hapter 14: Clinical implications and suggestions for fu ture research 216
14.1 Clinical implications 216
14.1.1 Implications for low vision assessment and counselling
patients with AMD 216
14.1.2 Training visual behaviour 217
14.1.2.1 An “ideal” method for training visual behaviour? 218
14.2 Suggestions for future research 219
14.2.1 The efficacy of training 219
14.2.2 Fixation assessment during reading 220
14.2.3 Assessment of the choice of PRL location 221
14.2.4 The role of cortical adaptation in macular disease 221
14.2.4 Conclusion 221
C hapter 15: Conclusions 223
15.1 The preferred retinal locus (PRL) 223
15.2 Eye movements 223
15.3 Reading performance 224
15.4 Prediction of which patients rehabilitate well 224
References 225
Appendix 1: Patient details and data 242
Appendix 2: Consent form 253
Appendix 3: Protocols for methods 260
Appendix 4: Published w ork 263

Acknowledgements
15
I must thank my supervisors, Professor Gary Rubin and Dr Louise Culham for their
unwavering enthusiastic support and guidance throughout this project. It has been a
pleasure to work under their supervision.
Patient recruitment was possible thanks to the help of many clinicians within the
Hospital, including, but not limited to, Andrew Milliken, Jenni Turner, Dr Sarah
Owens and Professor Alan Bird.
Within the Institute of Ophthalmology, Dr Stamatina Kabanarou has provided expert
advice and encouragement, whilst Glen Harding and Eugeniu Dinu have performed
programming and technical support roles with aplomb.
Michelle Sims and Dr Rex Galbraith of the Department of Statistical Sciences at UCL
developed the statistical techniques discussed in Chapter 3, and Dr Edmond Ng of the
Medical Statistics Unit of London School of Hygiene and Tropical Medicine gave
advice on the longitudinal techniques used in chapter 11.
I would like to express thanks to my family for their support over the past three years,
in particular to my late grandmother who travelled from Nottingham to London on
several occasions to act as an older control subject and to my father for answering
questions on English grammar.
Finally, I owe a huge debt of gratitude to my wife, Kate, for her immeasurable
support, encouragement and patience whilst I have been working on this thesis.
This project was supported by an Ophthalmic Research Grant from the Guide Dogs
for the Blind Association.

Chapter 1: Introduction
16
Visual function in patients with macular disease is notoriously difficult to predict;
two patients with apparently identical clinical features can exhibit very different
levels of impairment. Clinicians in low vision clinics frequently ascribe these
differences to adaptive strategies adopted by patients. This thesis investigates the
development of these strategies in patients with newly developed macular disease
(MD), with particular reference to the development of the preferred retinal locus
(PRL) and eye movements made to this PRL. The benefit of each strategy will be
assessed, with reading speed being the major outcome measure. The findings of this
thesis will be beneficial to those involved in the rehabilitation or counselling of
patients with macular disease, as well as to the development and implementation of
training programs for patients with MD.
By way of introduction, this chapter will first describe the healthy macula and the
different types of macular disease. Function and rehabilitation in macular disease
will then be discussed, including the concept of the preferred retinal locus. An
introduction to eye movements and reading with and without foveal function will
follow. Finally, the project’s hypotheses will be repeated.
1.1 The human macula
1.1.1 AnatomyThe definition of the macula varies between clinicians and anatomists (Lovie-
Kitchin & Bowman, 1985). Biologists define the macular region as being the part of
the posterior retina containing two or more layers of ganglion cells and
xanthophyllic pigment (Gass, 1987).
The central 1.5mm of this macular region appears darker than the surrounding retina
on ophthalmoscopy. This area is known as the fovea centralis by anatomists and is
what clinicians refer to as the macula. It subtends around 5 degrees of visual field.
The foveola is the concave floor of the fovea. Typically measuring around 0.35mm

M.D. Crossland. Chapter 1: Introduction.
across it is notable for a complete absence of rod photoreceptors and ganglion cells.
Cones in this area are the smallest (diameter 1.5 pm) and the most densely packed of
the retina (ca. 199,000 cones/mm2)(Cohen, 1992).
1.1.2 Function
The macula demonstrates the best visual acuity of the retina and there is a rapid
decline in visual acuity (VA) with increasing distance from the macular centre
(figure 1.1; (Weymouth et a l, 1928; Ludvigh, 1941; Virsu et al., 1987; Anderson et
al., 1991; Latham & Whitaker, 1996b). Similar effects are observed for reading
speed (Turano & Rubin, 1988; Latham & Whitaker, 1996a), contrast sensitivity
(Rovamo et al., 1978) and colour vision (Stromeyer et al., 1992).
100
I3 O)5%£ Mi s
Nasal retinaTemporal retina
200 40 60-60 -40 -20Eccentricity (degrees)
Figure 1.1. Variation of achromatic spatial resolution with across the human retina. (After Anderson et al, 1991).
1.1.3 Definitions
The definitions used in this thesis have been based on those used by Gass (1987),
viz:
Macula lutea: The central part of the retina which contains xanthophyllic pigment
and two or more layers of galnglion cells.
Fovea: The depression in the inner retinal surface in the centre of the fovea.
Foveola: The central floor of the fovea.

M.D. Crossland. Chapter 1: Introduction.
1.2 Macular disease
Macular disease (MD) is a term which can be applied to a group of conditions, all of
which can lead to the development of a relative or absolute scotoma within the area
of visual field corresponding to the foveal region.
The World Health Organisation estimates that 8 million people are severely visually
impaired as a result of MD (World Health Organisation, 1997) and MD accounts for
half of all blind registration in the UK (Bird, 1996; Evans et al., 1996). Results of a
recent cross sectional study indicate that 3.7% of people aged over 74, and nearly
15% of those over 90 years of age suffer visual impairment due to age-related
macular disease (AMD)(Evans et al., 2004). As the number of people aged over 65
is expected to grow by 30% by 2021 (Shaw, 1998), the number of individuals with
AMD will increase. Further, the incidence of AMD appears to be increasing at a
faster rate than can be explained solely by ageing of the population (Evans &
Wormald, 1996).
Pictorial representations of ARM and AMD can be found in figure 1.2.
1.2.1 Age-related maculopathy and age-related macular disease
1.2.1.1 Age-related maculopathy (ARM)
ARM is a term given to any age-related macular changes which do not occur as a
consequence of another disorder or process, such as trauma or inflammation. In
1995 the International ARM epidemiological study group (IAESG) produced a
standardised classification and grading system for ARM and AMD. This definition
requires the presence of either soft drusen, or hyperpigmentation of the outer retina
or choroid associated with soft drusen, or hypopigmentation of the retinal pigment
epithelium (RPE) in order for a diagnosis of ARM to be made.
Soft drusen are observable on funduscopy as large yellow lesions with indistinct
edges. They are caused by a build up of lipid deposits between the inner
collagenous layer of Bruch’s membrane and the basal lamina of the retinal pigment
epithelium (Pauleikhoff et al., 2003a).

M.D. Crossland. Chapter 1: Introduction.
1.2.1.2 Geographic atrophy
The most common form of AMD is geographic atrophy, also referred to as non
exudative or “dry” AMD (Lovie-Kitchin & Bowman, 1985; Kanski, 1994). This
condition is characterised by degeneration of localised areas of the retinal pigment
epithelium and the neural retina without a break in Bruch’s membrane. The IAESG
definition of geographic atrophy requires the presence of:
“any sharply delineated roughly round or oval area of hypopigmentation or depigmentation or apparent absence of the RPE in which choroidal vessels are more visible than in surrounding areas that must be at least 175 pm in diameter on a colour slide (using a 30° or 35° camera)”.
The foveal centre is often spared initially to leave a characteristic horseshoe-shaped
lesion, but most patients go on to develop an absolute central scotoma (Sarks et al.,
1988). Peripheral retina remains healthy and is unaffected by geographic atrophy
(Sunness etal., 1985).
The hydroconductivity of Bruch’s membrane reduces with age, secondary to age-
related thickening and structural changes within the membrane (Marshall et al.,
1998). This process contributes to the presence of drusen and reduces the metabolic
exchange between the choroid and RPE. This process is thought to lead to
geographic atrophy, although the exact pathogenesis is unknown (Bird, 1996). It is
important to note that drusen can occur without atrophy; they are observable in at
least 10% of individuals over 65 years of age (Bressler & Gills, 2000) and do not
cause vision loss per se (Sunness et al., 1988).
Patients with this form of AMD generally present complaining of a slow onset of
visual impairment, often over a time scale of years rather than months (Sarks et al.,
1988; Sunness et al., 1995a). No treatment is available to patients with geographic
atrophy. (Kanski, 1994; Bird, 1996; Bird, 1997).
1.2.1.3 Exudative AMD
Exudative, neovascular or “wet” AMD is characterised by sudden, acute loss of
visual acuity and accounts for about 10% of cases of AMD (Kanski, 1994).

M.D. Crossland. Chapter 1: Introduction.
Neovascular membranes from the choriocapilliaris break through Bruch’s membrane
into the sub-RPE space. These membranes can bleed, causing detachment of the
sensory retina. This blood can travel into the subretinal space, causing a
proliferation of RPE and retinal glial cells which in turn leads to a disciform scar.
Choroidal neovascular membranes can be classified as being classic or occult.
Classic lesions develop between the retinal pigment epithelium and the subretinal
space (Pauleikhoff et a l,2003a) and are characterised by the lesion being well
defined on early flourescein angiography images. In contrast occult lesions occur
beneath the RPE in the outer layers of Bruch’s membrane. These membranes lead to
multiple hyperfluorescent areas on fluorescein angiography.
In some circumstances the RPE can detach without haemorrhage, due to the build up
of other fluid in the sub-RPE space. Both haemorrhagic and non-haemorrhagic
forms of exudative AMD are thought to be linked to the build up of debris in
Bruch’s membrane (Bird, 1997).
The IAESG defines exudative AMD as being the diagnosis when any of the
following five signs are present: RPE detachment; subretinal or sub-RPE
neovascular membrane(s); epiretinal, intraretinal, subretinal, or sub-pigment
epithelial scar or glial tissue or fibrin-like deposits; subretinal haemorrhages
unrelated to other retinal vascular disease; or hard exudates within the macular area
related to any of the above, and not related to other retinal vascular disease.
Although many medical and surgical treatment options for exudative AMD have
been used experimentally (Chong & Bird, 1998; Ciulla et al., 1998; Chakravarthy &
MacKenzie, 2000), only two are currently in widespread use: laser photocoagulation
and photodynamic therapy.
1.2.1.4 Laser photocoagulation in exudative AMD
Photocoagulation using argon green (wavelength 514.5 nm), krypton yellow (568
nm), krypton red (647 nm) or frequency doubled Ng-YAG (532 nm) lasers can
destroy neovascular membranes. Only well defined lesions are amenable to

M.D. Crossland. Chapter 1: Introduction.
treatment. In suitable patients the risk of severe visual loss over a three year period
can be reduced by a factor of 1.4 with photocoagulation (Macular Photocoagulation
Study Group, 1986).
Photocoagulation destroys normal retinal tissue, hence the need for a small spot size
(100-200 pm) and a short duration to avoid accidental foveal bums caused by
sudden eye movements (Pauleikhoff et al., 2003b). Photocoagulation is appropriate
in only certain cases (Pauleikoff et a l, 2003b), and central fixation is unlikely to be
maintained after treatment (Fasce et al., 1996).
1.2.1.5 Photodynamic therapy (PDT) in exudative AMD
In order to reduce damage to healthy retina, photodynamic compounds such as
verteporfin (benzoporphyrin derivate monoacid A, e.g. Visudyne™, Novartis
Pharmaceuticals, Basle, Switzerland) can be activated by a diode laser to create a
photochemical effect in areas of neovascularisation only. Frequent retreatment is
required (Bressler, 2000). Results of a multicentre randomised study indicate that for
predominantly classic subfoveal membranes visual acuity was preserved in 60% of
patients treated (compared to 31% of those in the placebo group) for two years after
initial treatment (Bressler, 2001). These results appear to be sustained by the three
year follow-up stage (Blumenkranz et al., 2002).
The current guidelines of the Royal College of Ophthalmologists recommend the use
of PDT by medical retina specialists only, in the presence of classic or
predominantly classic subfoveal neovascular membranes when visual acuity is 6/60
or better (PDT Working Party, 2001). The National Institute for Clinical Excellence
has determined that NHS centres may only offer PDT to patients with fully classic
lesions, except in the case of clinical trials where patients with predominantly classic
membranes may be treated.

M.D. Crossland. Chapter 1: Introduction.
Degenerated f photorecepto
Drusen
Subretinal hemorrhage
CNV
Figure 1.2. Pictorial representations of AMD. Top: Geographic atrophy. Bottom: Exudative AMD. Both pictures reproduced from the homepage of the Macular Degeneration Center, Wilmer Eye Institute, Johns Hopkins University, Baltimore, MD, USA. www.wilmer.ihu.edu/mdp/whatismd.html. Accessed on 21 February 2003.

M.D. Crossland. Chapter 1: Introduction. 23
1.2.2 Juvenile and early-onset m acular diseases
A range of conditions can lead to macular lesions in patients who are too young to
develop ARM or AMD, such as those displayed in table 1.1 below.
Disease Typical age of onset
Typicalaetiology
Area of lesion
Typical VA and prognosis
Stargardt diseease (Group 1)
Childhood/youngadulthood
Genetic (AR) Wholefundus
To 6/60. No recovery.
Stargardt disease (Group 2)
Childhood/youngadulthood
Genetic (AR) Macula To 3/60. No recovery.
Stargardt disease (Group 3)
Childhood/youngadulthood
Genetic (AR) Wholefundus
To 3/60. No recovery.
Stargardt disease (Group 4)
Childhood/youngadulthood
Genetic (AR) At flecks only
Good, unless foveal fleck. No recovery.
Best disease Childhood/youngadulthood
Genetic (AD) Macula To 3/60. No recovery.
Adultfoveomacularvitelliformdystrophy
Fourth or fifth decade
Genetic (AD) Macula Mildmetamorphopsiaonly.
Conedystrophy
Childhood to middle age
Sporadic; Genetic (AD, X);2o to e.g.Batten’sdisease
Macularandparamacularareas
To 6/60.
Central serous retinopathy
Young adulthood to middle age
Sporadic Macula To 6/12, generally recovers.
Cystoidmacularoedema
Infants to old age
2o to cataractsurgery,diabetes,BRVO,nicotinic acidretinopathy.
Macula Generally recovers to 6/9 or better.
Punctate inner choroidopathy
Youngadulthood
2o tomultifocalchoroiditis
Macula Good, generally recovers.
Myopicmaculopathy
Middle age 2o to high myopia
Macula To 6/60, no recovery.
Table 1.1. Typical ages of onset, aetiology, site of lesion, function and prognosis of selected juvenile and early onset macular diseases. AR: Autosomal recessive; AD: Autosomal dominant; X: X-linked; 2o: Secondary. Sources: Gass, 1997; Kanski,

M.D. Crossland. Chapter 1: Introduction.
1994.
For the purposes of this study, only those diseases which are not caused by another
disease process, which affect the macular region only and with no subsequent
recovery of function are discussed; Stargardt disease and Best disease. These
conditions are described in more detail below.
1.2.2.1 Stargardt disease
Stargardt disease is an inherited macular dystrophy which generally leads to reduced
vision in the first or second decades. Fundus flavimaculatus is used as a synonym
by some authors (Gass, 1987; Newsome & Blacharski, 1988), although others
reserve this term for later-presenting Stargardt disease (Kanski, 1994). Stargardt
disease affects around 1 in 10,000 people in the USA (Newsome & Blacharski,
1988).
Fundoscopy often shows yellow “flecks” in the RPE which are similar in appearance
to drusen but more variable in terms of size, shape and distribution. Fluorescein
angiography shows these flecks to be non- or partially-fluorescent, as opposed to
drusen which are hyperfluorescent; and excessive lipofuscin within the RPE
prevents clear visualisation of choroidal features and the fundus is darker.
Four groups of patients with Stargardt disease have been identified. Patients in
group 1 have vermillion fundi and hidden choroidal fluorescence in fluorescein
angiography; group 2 Stargardt disease includes those with atrophic maculopathy
(witb or without flecks), group 3 patients have maculopathy with signs and
symptoms of retinitis pigmentosa, whilst in some cases (those said to have Group 4
Stargardt disease) flecks are present but there is no macular atrophy (Gass, 1997).
Visual acuity in patients with macular involvement deteriorates to between 6/60 and
3/60 (Kanski, 1994). Only 4% of patients in a large case series suffered from VA
worse than 3/60 (Rotenstreich et al., 2003). Patients with earlier presenting disease
seem to suffer from a quicker deterioration in vision (Rotenstreich et al., 2003).
In the absence of maculopathy, visual acuity is normal unless flecks obstruct the
foveola (Gass, 1987). About a quarter of patients maintain vision of 6/12 or better
(Rotenstreich et al., 2003).

M.D. Crossland. Chapter 1: Introduction.
The pattern of inheritance is generally autosomal recessive, although some
documented cases show dominant inheritance patterns (Gass, 1987). No treatment
options are currently available for Stargardt disease.
1.2.2.2 Best disease
Best disease is an inherited macular dystrophy characterised by distinctive
electrophysiological changes and yellow subfoveal pigment. This pigment can form
a vitelliform (yolk-like) cyst which may deteriorate to give a “scrambled egg”
appearance in the macular region. The cyst may later be replaced by atrophy, a
disciform scar or, in rare cases, a neovascular membrane (Kelly & Maumenee,
1999).
Vision loss can vary from mild metamorphopsia to severe impairment of acuity.
Visual symptoms usually develop between the ages of 10 and 25, although the
electrophysiological changes are apparent from birth.
1.2.3 Subjective complaints of patients with macular diseaseThe most common complaint of patients with macular disease is difficulty in reading
(Krieger, 1967; Faye, 1970; Faye, 1984; Farrall, 1991; Elliott etal.y 1997;
Dickinson, 1998; Hazel et al., 2000).
A large study examining presenting complaints of consecutive patients at the
Kooyong low vision clinic in Melbourne found that reading newspapers was the
major concern of patients over 60 years, with nearly 60% of patients complaining of
difficulty. Other concerns related to reading included reading books (25%), mail
(8%) and magazines (2%). Of course these figures reflect the popularity and
importance of these forms of media as well as their relative difficulty (Wolffsohn &
Cochrane, 1999).
Mangione and colleagues interviewed 246 patients with low vision and identified
2623 complaints whilst developing the 51-item National Eye Institute Vision
Function Questionnaire. They found “reading ordinary print” to be the most

M.D. Crossland. Chapter 1: Introduction.
frequent concern in AMD with 70% of patients expressing difficulty (Mangione et
al., 1998).
1.2.3.1 Psychological aspects o f visual impairment
It is known that patients who experience visual loss experience a similar grieving
process to those who have been recently bereaved (Schulz, 1977, Emerson, 1984),
and will typically experience stages of shock and depression before adjusting to their
visual impairment. “Personality hardiness” has been shown to be the best predictor
of successful adaptation to visual impairment, which is related to a sense of being
able to control events, having a commitment to oneself and dependents and
accepting the loss of vision as a challenge rather than a threat (Robbins &
McMurray, 1988).
Williams and colleagues interviewed 86 AMD patients and found quality of life to
be impaired and emotional distress significantly increased when compared to age-
matched subjects without macular disease. They found the psychosocial impact of
macular disease to be as severe as that experienced by sufferers of chronic
obstructive pulmonary disease and AIDS (Williams et al., 1998). Patients with
newly diagnosed MD were more distressed than those who had time to come to
terms with their visual impairment. Interestingly more distress and anxiety was
reported by patients with monocular AMD than those legally blind in both eyes,
perhaps suggesting that the fear of bilateral MD is more disabling than the reality.
1.2.4 Current approaches to the rehabilitation of patients with macular disease
As macular disease is a largely unbeatable condition which often leads to severe
visual impairment, rehabilitation of patients is a priority.
1.2.4.1 Low vision assessment
It is important to ensure that the optimal refractive correction is given to all patients.
In many circumstances magnifiers can be used to enable reading or other specific
tasks (Virtanen & Laatikainen, 1991; Dickinson, 1998; Margrain, 2000). In the UK,
the majority of low vision assessments take place in hospital eye departments

M.D. Crossland. Chapter 1: Introduction. 27
(Culham et al., 2002). A full description of low vision assessment is beyond the
scope of this text. However, examples of the type of magnifiers available, and their
approximate power range, are given in table 1.2. Visual training in macular disease
is discussed in section 1.6 below.
Type of magnifier Approximate range of magnification available
High power reading spectacles/ hyperoculars
to 12x
Non-illuminated hand magnifiers to 20xNon-illuminated stand magnifiers to 20xIlluminated hand magnifiers to lOxIlluminated stand magnifiers to 30xNear vision telescopes to 8xDistance vision telescopes to 20xNear CCTV systems to 50xDistance CCTV systems to 50xTable 1.2. The maximum magnification o1? certain low vision devices. Sources (Gill& Silver, 2001), manufacturers’ data from Telesensory Corp., CA, USA and Enhanced Vision Systems Ltd., CA, USA.
1.2.4.2 Non-optical aids
Many non-optical aids are available to help patients with activities of daily living.
These include large print books, kitchen aids, speaking watches and
newspapers on tape. Text enlargement software and voice reading programs mean
that access to information technology and the internet can be provided. Mobility can
be improved by the use of a cane and appropriate training.
1.2.4.3 Social support
Social support is offered by hospital based medical social workers, local sensory
impairment teams affiliated to councils and local support groups. In addition,
national charities such as the Royal National Institute for the Blind and the Guide
Dogs for the Blind Association exist to support people with any form of visual
impairment.
1.2.5 The benefit of rehabilitation in m acular disease
It is well documented and unsurprising that the provision of low vision aids will
improve visual acuity (Temel & Kazokoglu, 1991; Wu et al., 1995). One study

M.D. Crossland. Chapter 1: Introduction.
found that nearly 90% of a large sample of low vision patients were able to read N8
size print with appropriate low vision devices (Margrain, 2000). Further, self-
reported task performance has been shown to improve with the prescription of low
vision aids in 150 of 152 patients. 82 of these patients (54%) described their low
vision aids as “very useful”(Scott et al., 1999). As Scott’s study used interviews
rather than anonymous questionnaires, results may have been biased by patients’
eagerness to please the interviewer (the “Hawthorne effect”(Wickstrom & Bendix,
2000)). In a similar study, a questionnaire was sent to 576 low vision patients in
Germany (Rohrschneider et a l , 2002). More than 90% of patients that responded
reported high satisfaction with their low vision aids but the response rate was only
just over 50%. A serious limitation of this study is, of course, that patients who are
able to use their magnifier are far more likely to be able to fill in and return a
questionnaire.
It is more difficult to quantify whether quality of life is improved by the provision of
low vision aids. In a review of sixteen papers describing the outcomes of low vision
rehabilitation, Raasch and colleagues found none which adequately assessed quality
of life measures (Raasch et al., 1997).
A rigorous prospective randomised controlled trial to determine quality of life with
low vision rehabilitation is being performed in Manchester (Russell et al., 2001).
1.2.6 SummaryMacular disease is a common, debilitating disease which remains largely
untreatable. Rehabilitation of macular disease patients is largely based on the
prescription of magnification and non-optical aids.
This thesis will provide information on the natural course of adaptation to macular
disease, which will enable clinicians to counsel patients more efficiently on the
likely development of their symptoms. By studying the behaviour of patients who
successfully adapt to MD, it may be possible to advise people who develop MD on
the best viewing strategies to use.

M.D. Crossland. Chapter 1: Introduction.
The principal adaptive strategy used by patients with central scotomas is to adopt an
eccentric preferred retinal locus, which is described in the following section.
1.3 The preferred retinal locus
During fixation, there is some retinal motion due to involuntary eye movements such
as physiological nystagmus, drifts and microsaccades as well as correcting
movements to compensate for motion of the head (Steinman et a l , 1982; Carpenter,
1988). In those without eye disease, the locus of fixation always lies within the
foveola.
If there is damage to the foveal region due to macular disease, this locus of fixation
may be actively or passively shifted to a healthier retinal area in order to maintain
best possible vision. Many patients exhibit one discrete “preferred” retinal locus
(PRL) at a para- or extra-foveal location (Timberlake et al., 1986; White & Bedell,
1990; Schuchard & Raasch, 1992; Guez etal., 1993).
1.3.1 Assessment of the PRLSeveral devices can be employed to monitor visual behaviour in macular disease,
including fundus cameras (White & Bedell, 1990; Nilsson et a l , 1998), infra-red eye
trackers (Bullimore & Bailey, 1995) and scleral search coils (Cummings et a l, 1985;
Whittaker et al.> 1988). However in recent years the instrument of choice has been
the scanning laser ophthalmoscope (SLO).
1.3.1.1 The scanning laser ophthalmoscope
Scanning laser ophthalmoscopes suitable for ophthalmic use have been available for
around 2 decades (Webb et al., 1987). Common ophthalmological uses of the SLO
include optic disc tomography, imaging of the retina and ocular blood flow
measurements. Retinal imaging is performed using an infra-red laser. A video
recorder or personal computer can record the image from the SLO for retrospective
analysis.

M.D. Crossland. Chapter 1: Introduction.
Modem scanning laser ophthalmoscopes work on a confocal principle to reduce the
detection of scattered light and to increase image contrast (White & Amos, 1987;
Woon et al., 1992). Briefly, a pinhole aperture ensures that the illumination and
detection systems of the ophthalmoscope are coincident at any given time. This
reduces image degradation from light scatter from structures which are not being
observed. Only a small area of the retina is illuminated at once, and the illumination
system scans the retina by use of a rotating mirror. Figure 1.3 shows the principal
components of the SLO.
Monitor/videorecorder
Scanner
Laser
Photodetector
Figure 1.3. Principal components of the scanning laser ophthalmoscope. Dashed line represents the path of the laser beam entering the eye. (After Woon, 1992).
Assessment of the PRL and other psychophysical testing require the addition of a
visible laser such as a helium-neon (HeNe) laser (A.=630 nm) to produce stimuli
(Mainster et al., 1982; Webb et al., 1987; Wolf, 1997). The HeNe laser has the
capacity to display any monochromatic image which can be produced on a computer
monitor such as words or simple images. Targets can be stationary or moving.
Because of the real time retinal image provided by the infra-red laser, stimuli can be
placed on a known part of the retina. Therefore, the SLO can be used to assess
exactly which part of the retina the patient is using for certain tasks.
Another use of the SLO in the assessment of macular disease is microperimetry,
which can exactly define the location, area and depth of the scotoma. For this
technique, a stimulus is presented at a known retinal location and the patient
responds when they see the stimulus by means of a button press. The retinal image
is then frozen and the investigator places a cursor over a retinal landmark such as a
vessel bifurcation. Superimposition of these images can map “seeing” and “non-
seeing” retinal areas.

M.D. Crossland. Chapter 1: Introduction.
Unlike conventional perimetry, which only determines the location of any non-
seeing area with respect to the centre of fixation, SLO microperimetry elicits the
exact retinal location of any scotoma. For this reason the SLO is invaluable in
determining scotoma characteristics in patients who do not display central fixation.
The only commercially available SLO with the extra HeNe laser necessary for
microperimetry and psychophysics was the SLO-101 produced by Rodenstock of
Germany. Unfortunately this device is no longer produced.
1.3.1.2 Choice o f fixation target
Many different targets have been used to assess PRLs: squares (Timberlake et al.,
1986), numbers (Guez et al., 1993), 3-letter syllables (Timberlake et al., 1987), a
grid of letters (Culham et al., 1992) words (Duret et al., 1999) and scrolling text in a
variety of directions (Culham et al., 1992). Culham and collagues recommended
that only letters with orthogonal strokes (E, H, I, F etc.) be used to avoid artefacts
from curved or diagonal lines within the raster.
Schuchard and Raasch compared different types of central and paracentral fixation
targets including a 1° central fixation cross, a 12° cross with a 6° central gap and a
diamond pattern consisting of four squares (height 10 minarc) arranged at both 3°
and 7° separation. They found the diamond fixation target was the most difficult for
all subjects to observe and led to the least stable fixation in both normal subjects and
patients (Schuchard & Raasch, 1992).
1.3.2 Position of the PRLAlthough all studies have used different methodologies and report data in slightly
different ways (for example, defining the location of the PRL in visual field space or
as a retinal location) it is possible to collate data for 1573 eyes with macular disease
by combining 7 different publications (White & Bedell, 1990; Culham et al., 1993;
Guez et al., 1993; Sunness et al., 1996; Fletcher & Schuchard, 1997a; Nilsson et al.,
1998; Fletcher et al., 1999). Complete data can be seen in table 1.3. In visual field
space, 37% of eyes placed the PRL below the scotoma; 34% to the left of the

M.D. Crossland. Chapter 1: Introduction. 32
scotoma; 18% to the right; 6% above; 3% mixed and 1.6% either repeatably placed
the target within the scotoma or displayed no obvious PRL. It is important to note
that these patients had a variety of diagnoses and were at a variety of different
disease stages.
Study Method Number of eyes
PRL location with respect to scotoma (in visual field space)
BELOW LEFT RIGHT ABOVE CENTRAL/NoPRL
MIXED
White &Bedell(1990)
Funduscamera
42 86% 10%
Culham et al (1993)
SLO 6 33% - 17% - 50% -
Guez et al (1993)
SLO 40 15% 35% 25% - 15% 10%'
Sunness et al (1996)
SLO 41 22% 63% 15% 0% - -
Fletcher & Schuchard (1997)
SLO 1339 39% 34% 20% 7%
Nilsson et al (1998)2
Funduscamera
6 67% 16% - 16% - -
Fletcher et al (1999)
SLO 99 - 22% 15% - 17% 19% J 26% 4
Weightedmean
1573 37% 33% 19% 6% 1.6% 3%
Table 1.3. Prevalence of PRL location in visual field space.1 Central fixation for small objects, below-scotoma fixation for large objects.2 After rehabilitation training.3 PRLs above or below scotoma.4 PRLs both left and right of scotoma.
AMD patients generally place the PRL immediately adjacent to the lesion whereas
those with juvenile macular degenerations tend to leave a gap between the boundary
of the PRL and the scotoma edge (Timberlake et al., 1986; Sunness et al., 1996).
1.3.2.1 Theoretical best location for PRL
If retinal anatomy is considered, it is more logical to move the fixation locus
vertically rather than horizontally in the absence of central vision. This provides an
uninterrupted retinal area to fixate with, whereas moving the eye along the
horizontal meridian results in both the physiological blind spot and the scotoma
masking a line of text. It appears that reading speed is slightly faster when fixation
is shifted vertically rather than horizontally although it is difficult to determine

M.D. Crossland. Chapter 1: Introduction.
whether this effect is independent of the type of macular disease: patients with JMD
tend to shift their fixation vertically and to have a faster reading speed (Sunness et
al.y 1996).
Given the choice of moving the eye up or down, looking up (i.e. placing the PRL
below the scotoma in visual field space) is theoretically better than looking down.
This is due to a slight advantage in retinal cell density (Curcio & Allen, 1990;
Anderson et al., 1991) and the fact that lower visual field is of more use in
locomotion. In subjects without macular disease, reading is faster in inferior than in
superior visual field (Petre et al., 2000)
1.3.2.2 Vertical vs. horizontal PRL location
Most patients choose to fixate horizontally rather than vertically. One explanation
given for this horizontal bias in PRL location has been postulated by Sunness
(1996). She suggests that as during the development of a “horseshoe” scotoma in
geographic atrophy there is often a wider field of vision horizontally than vertically
the patient will become accustomed to scanning in the horizontal meridian.
Therefore when central fixation is lost in later stages of the disease, the eye naturally
scans horizontally in order to see clearly. Unfortunately this would not explain the
behaviour of patients with other forms of macular disease.
Horizontal eye movements are made far more frequently than vertical saccades in
reading. As most studies have investigated PRL use for near tasks, patients may
adopt the strategy which they would for reading; that is, moving the eyes
horizontally when a word can not be seen (or has been read).
Another reason for the horizontal bias could be to maintain binocularity: fusional
reserves in the horizontal direction are around 20-32A as opposed to 2-4A vertically
(Evans, 1997). Further, Panum’s areas of corresponding retinal loci are horizontally
oval (Evans, 1997).
1.3.2.3 Left vs. right PRL location
The perceptual span in reading English is 15 characters to the right of fixation and 4

M.D. Crossland. Chapter 1: Introduction.
characters to the left (see section 1.5.1.2 below) so placing the PRL to the right of
the scotoma should be advantageous. Investigation of normal subjects with
hemifield occlusion corroborates this: word identification and reading speed are
better in right visual field than in left visual field (Fine, 1999).
Puzzlingly, more patients appear to fixate to the left of their scotoma (see table 1.2).
It has been suggested that monitoring where fixation has landed with respect to the
previous word is of importance in reading (Guez et al., 1993) but no more
convincing reasoning has been expressed in the literature to date. In an unpublished
study Guez and colleagues found that the situation is reversed in Arabic readers (i.e.
those reading right to left) compared to those with French as a first language. In
other words, subjects always read into rather than away from their scotomas (Guez
et al., 1995). No investigation of PRL location in patients who read vertical
languages such as Cantonese has been described in the literature. This would be of
particular interest.
1.3.2.4 Task-dependent selection o f the PRL
Many of the theoretical considerations described above assume that reading is the
primary visual task of the patient. Of course this is not the case; even the most avid
readers spend a large proportion of the time not reading. It may be that fixating to
the left of the scotoma is advantageous for navigation, communication, face
recognition or other activities of daily living.
1.3.2.5 Attention and the choice o f PRL location
Attention is a high-level cognitive process which can reduce the perceptual threshold
at a given location or for a given stimulus. Transient attention is involuntary and
used to guide express saccades (Steinman et al., 1997); (Mackeben & Nakayama,
1993). In contrast focal attention is a sustained process which can divide attention
away from the fovea to a peripheral location (Bashinski & Bacharach, 1980;
Mackeben, 1999). Attention does not appear to be symmetrically divided around the
peripheral retina; the lower visual field has lower attention thresholds than the
superior visual field (He et al., 1996; Mackeben, 1999). As there is no
corresponding asymmetry in the primary visual cortex, higher cortical processes are
thought to guide attention (He et al., 1996).

M.D. Crossland. Chapter 1: Introduction.
Attention is by necessity shifted from the fovea in advanced MD. Some research
groups have begun investigations into whether PRL location is linked to areas of
highest attention. Fine and Rubin have suggested that variation in attentional fields
may be of more relevance in predicting reading speed than visual acuity or scotoma
characteristics (Fine & Rubin, 1999c). Altpeter and colleagues have examined
attentional fields in patients with early macular disease. Their research indicates that
there may be a connection between PRL location and previous areas of better-
attending retina (Altpeter et al., 2000). It is tempting to speculate that as these
patients’ disease progress, their PRLs may develop at the locations predicted by their
attentional fields.
1.3.3 Multiple PRLs*Initially it was assumed that most patients develop one, well-defined PRL
(Cummings et al., 1985; Timberlake et al., 1986; Timberlake et al., 1987). It has
been suggested that patients with scotomas larger than 20° are more likely to
develop several PRLs than those with smaller lesions (Whittaker et al., 1988).
For example, a case study has reported one patient who exhibits three discrete
preferred loci of fixation (Safran et al., 1999); a larger, superior PRL was used for
the initial recognition of a word and two smaller horizontal PRLs were used for
more acute vision. Another patient has been described with a small left PRL which
would be used for all but the longest of words, when a superior locus would be
employed (Duret et al., 1999). Interestingly upon microperimetric testing only one
PRL would be determined, implying that the choice of PRL is task-dependent.
The view that the choice of PRL is dependent on the size of the object viewed is
corroborated by Guez and colleagues who find multiple PRLs in four of 24 patients
(Guez et al., 1993). Each of these subjects had a spared area of functioning retina
within their scotoma for detailed examination of small targets but used a PRL for
other tasks.
* Although the plural of locus is loci and the correct abbreviation would be “PRL,” “PRLs” has been used throughout this thesis for clarity.

M.D. Crossland. Chapter 1: Introduction.
Lei and Schuchard revealed two PRLs in 28 patients with macular disease and found
that fixation could be switched between these preferred loci by altering the
luminance of the stimulus (Lei & Schuchard, 1997). The implication made is that a
PRL under high luminance is positioned within a relative scotoma, whereas the PRL
for dim objects would be in more healthy, peripheral retina.
There are marked methodological problems with assessing whether patients display
multiple PRLs. Although in some circumstances it is obvious that a patient has
multiple PRLs (for instance when one horizontally shifted and one vertically shifted
PRL is used), at other times it is difficult to determine whether a patient truly has
multiple loci or whether fixation remains within one, poorly defined PRL. This
problem is described further in section 1.3.6.1 below.
Even with scanning laser ophthalmoscopy it is difficult to know whether a patient is
attending with a given retinal point at any time, or indeed whether they can even see
the stimulus. This is especially true when analysing data from a reading task.
Asking patients to read text aloud on the SLO is not straightforward due to the head
motion induced by speaking whilst resting against a chin rest. Further, the word
which a subject reads is not necessarily the same one which they are looking at or
attending.
For the purposes of this study, the operational definition of a preferred retinal locus
is: “a circumscribed retinal area used for fixation of a target for >10% of a trial.”
Multiple PRLs are described when more than one discrete PRL, as defined above, is
used during an episode of fixation.
13.4 Awareness of PRL use
To determine whether patients are aware that they are eccentrically viewing when
they are using their PRL, White and Bedell (1990) used two different phrases when
assessing the PRL of patients with AMD and Stargardt disease. In the first condition
patients were asked to “look at the middle of the [target],” whilst in the second
condition patients were told to “look directly at the middle of the [target], even if it
becomes indistinct or disappears.” In only three of 21 patients did the change of

M.D. Crossland. Chapter 1: Introduction.
instruction make any difference; the remaining 18 patients used the same, non-foveal
PRL under both conditions.
In a similar experiment, Schuchard and colleagues (1992) found a difference in only
1 of 9 patients when they were asked to move their eye so it was in the best position
to see a pericentral target as opposed to “pointing directly at the centre of the target,
even if you do not see it very well with your eye in that position.”
Similarly, Culham (1994) found that 6 of 9 patients using an eccentric PRL felt that
they were still looking straight ahead. These papers suggest that the ability to lose
awareness of the PRL use is a beneficial adaptation. White and Bedell suggest that
this phenomenon is a corollary of re-referencing of the oculomotor system.
1.3.5 Fixation stability within the PRL
Human fixation is not precise. Rather, as described at the start of section 1.3,
fixation is contained within a retinal locus; in normal subjects within the foveola and
in patients with MD within the PRL.
1.3.5.1 The bivariate contour ellipse area
A bivariate contour ellipse has been shown to adequately describe loci of fixation in
normal observers (Steinman, 1965). The area of this ellipse (bivariate contour
ellipse area, BCEA) gives an indication of fixation stability; larger areas correspond
to poorer fixation stability. The size of these areas have been described at the 0.623
(Steinman, 1965; Kosnik etal., 1986), 0.68,(Nachmias, 1959; Culham et al., 1993)
or 0.95 levels (Schuchard & Raasch, 1992), the latter areas encompassing a greater
proportion of fixation points than the former.
1.3.5.2 Method o f recording the BCEA
The method of recording fixation stability will affect the size of the BCEA
measured. Gaze is more precise when fewer head movements require correction:
fixation is 2 to 4 times more stable when a subject uses a bite-board rather than a
chin and forehead rest (Steinman, 1965). By extension, fixation would be expected
to be less stable when measurement takes place with a free-head eyetracker than

M.D. Crossland. Chapter 1: Introduction.
with the SLO and a chin rest.
1.3.5.3 Range ofBCEAs with and without MD
SLO measurement of subjects without macular disease gives a BCEA of around 80-
370 minarc2 (Steinman, 1965; Kosnik et al., 1986; Culham et al., 1993;
Rohrschneider et al., 1995). With AMD, they range from near-normal values to
over 13,000 minarc2 (Culham et al., 1993; Schuchard & Fletcher, 1994;
Rohrschneider etal., 1995).
1.3.6 Limitations of current research into the PRL
Three factors have been frequently overlooked in research into the preferred retinal
locus: the problem of multiple PRLs, the effect of the contralateral eye and the
duration of the disease.
1.3.6.1 The problem o f multiple preferred retinal loci
As discussed in section 1.3.3 above, many patients exhibit multiple preferred retinal
loci. Grouping all fixation points together in one locus and measuring this area can
underestimate fixation stability. Further, the calculation of a BCEA requires fixation
points to be normally distributed along the major and minor axes of the ellipse. For
example if a patient has two PRLs and fixation falls within two, well defined areas,
construction of two ellipses is required. Recording the number and size of these
ellipses would provide a more accurate and useful description of fixation behaviour;
that is, fixation stability is good within each of two loci.
Whittaker and colleagues used this approach; they defined subjects as displaying
multiple fixation loci by assuming an arbitrary maximum area for each PRL of 3°x3°
(Whittaker et al., 1988). No empirical basis for using 3° as the maximum size of a
PRL was given. This technique could overestimate fixation stability if the eye was
drifting over a wider area without discrete loci being present. Other researchers
have observed the retina during fixation but have only described multiple PRLs
when very different areas of the retina were used for fixation (Lei & Schuchard,
1997; Duret et al., 1999).

M.D. Crossland. Chapter 1: Introduction.
When fixation points do not lie within obvious clusters, it is impossible to determine
whether patients are using one, poorly defined PRL or two PRLs which lie close to
each other on the retina by visual inspection.
1.3.6.2 The effect o f the contralateral eye
The overwhelming majority of patients have two eyes and most will have had good
binocular vision before the development of their scotomas. The behaviour of the
first eye and the second eye to develop macular disease will be very different for two
reasons. First, when only one eye is affected and good vision is maintained in the
other eye then there is less incentive for a PRL to develop: patients may prefer to
maintain foveal fixation in both eyes to allow some coarse level of binocularity.
Second, if patients with monocular or asymmetric macular disease are tested with
their better eye occluded then this unnatural situation does not represent their
behaviour with both eyes open (Schuchard et al., 1995).
As the SLO only allows assessment of one eye at a time, it will be more informative
to asses the better of the eyes, as this eye is likely to determine the fixation
behaviour with both eyes open (Schuchard et al., 1995).
There appears to be no consensus over which eye is examined. In some studies it is
not stated whether the better or worse eye’s fixation characteristics are being
recorded (Culham et al., 1993) whilst in others fixation data from both eyes are
taken and they are, incorrectly, classed as independent recordings (Guez et al., 1993;
Fletcher & Schuchard, 1997b).
White and Bedell assessed only patients’ “preferred eye” (White & Bedell, 1990).
However, recent research indicates that it may be the better eye and not the
dominant eye which drives the oculomotor system (Kabanarou et al., 2003).
To overcome this problem, throughout this thesis, only the eye with better vision
will be used, which will be defined as the study eye. The other eye will be occluded
for all testing of PRL location and position.

M.D. Crossland. Chapter 1: Introduction. 40
1.3.6.3 The duration o f disease
White and Bedell noted that patients with a longer history of macular disease
“showed oculomotor behaviors qualitatively more like those of normals, although
centred about a nonfoveal locus” (White & Bedell, 1990). This study was of a
cross-sectional design and had a fairly small cohort size with a large range of disease
duration. As macular disease patients are heterogeneous, either a very large cross-
sectional observation or a longitudinal study of the sort described in this thesis is
required to prove the qualitative statement which White and Bedell make in their
1990 paper.
1.3.7 Conclusion
The location of the PRL appears to be idiosyncratic and many patients use
theoretically suboptimal locations for fixation. Some patients use more than one
PRL to perform a task. Many patients make an adaptation whereby they lose
awareness of using their PRL. Fixation stability is poorer when using a PRL than
when using foveal fixation.
This study will examine the development of the PRL in terms of its position and
patient awareness of its use. Fixation stability will be measured, and a new
quantitative technique will be applied to determine the number of PRLs which are
used by patients. The selection of the study eye will be made carefully and the time
of vision loss in the study eye will be recorded.
The first hypothesis of this study concerns the development of the PRL. It states that
a repeatable PRL will develop. The number of PRLs used will fall from many to
one and the fixation stability will improve. Patients will lose awareness of the use of
the PRL.

M.D. Crossland. Chapter 1: Introduction.
1.4 Eve movement control
It is widely accepted that fixation is moved to an eccentric PRL in most patients with
macular disease and no foveal function. For the PRL to really be used as a
“pseudofovea”, eye movements must be made directly to the PRL.
Von Noorden first suggested that some patients used a point of eccentric fixation as
if it were a fovea (von Noorden & Mackensen, 1962). White and Bedell reported
that one third of their patients exhibited “complete re-referencing of the oculomotor
system” to the PRL. Their criteria included the direction of all saccades to the PRL
(without going via the scotoma), holding fixation solely within the PRL, and
repeatedly using the same, individual PRL. Von Noorden suggests reserving the
term “eccentric fixation” for patients who have managed to make this adaptation,
using “eccentric viewing” for those who have not re-referenced their oculomotor
system in this way.
“Pseudofoveation” is a term first used by Fuchs in 1922 (Fuchs, 1922) to refer to the
re-referencing of the visual system to a new point in patients with hemianopia. In
the context of macular disease, the term “pseudofovea” could perhaps be applied to a
PRL which has become the reference point for the oculomotor system (as a synonym
for Von Noorden’s “eccentric fixation”).
The characteristics of eye movements made to the fovea and to the PRL are
described below.
1.4.1 Foveating eye movementsSaccades which bring an object of interest onto the fovea are remarkably quick,
sometimes exceeding 700°/sec (Carpenter, 1988; Whittaker & Cummings, 1990b).
Non-foveating eye movements are slower (Whittaker et al., 1991) as are saccades to
a remembered target (sometimes referred to as R-saccades), saccades made in the
dark and the eye movements of infants(Hallett, 1986; Carpenter, 1988).
After an extensive literature review, Whittaker and Cummings found that the

M.D. Crossland. Chapter 1: Introduction.
following criteria need to apply to elicit these fast, foveating saccades:
“(1) saccades are elicited in response to a visual stimulus in the periphery; (2) prior to onset, the exact location of the stimulus is unpredictable; (3) the saccade results in the approximate foveation of the target.”(Whittaker & Cummings, 1990b)
1.4.1.1 Saccadic latency
An unusual aspect of saccades is their latency; at least 120 msec passes between the
presentation of a stimulus and the start of a foveating eye movement to follow it
(Carpenter, 1988; Pitt & Rawles, 1988). Foveating eye movements have a lower
saccadic latency than non-foveating saccades (Hallett, 1978) but the latency still
exceeds reaction time for other muscular movements. For example, blink latencies
are only around 55 msec (Peshori et al., 2001). Carpenter (1988) suggests that
saccadic latency is a delay caused by cognitive processes determining whether an
eye movement is necessary; that is, is the target interesting enough to observe?
Age has been shown to increase saccadic latency in normal observers by about 1-2
msec/year over the age of 20 (Abel et al., 1983; Carter et a l, 1983; Whitaker et al.,
1986; Pitt & Rawles, 1988).
1.4.1.2 The number o f saccades used to view a target
More than a century ago, Dodge and Cline discovered that subjects make more than
one eye movement to foveate any target displaced by more than 15° (Dodge &
Cline, 1901). Although they presented this as an aside (and indeed seemed quite
irritated by this artefact) it has since been well documented that hypometric saccades
are normal when observing targets which are decentred by more than about 10°
(Carpenter, 1988). The initial saccade represents about 90% of the eye movement
and it is immediately followed by a second, correcting saccade. These correcting
saccades do not appear to be visually guided; indeed they still occur in complete
darkness or when the target is moved to the end-point of the primary
saccade(Carpenter, 1988). However, using more than three saccades to fixate an
eccentrically presented target is abnormal (White & Bedell, 1990).

M.D. Crossland. Chapter 1: Introduction.
1.4.1.3 Saccadic velocity
There is a firm relationship between the amplitude, peak velocity and duration of
foveating saccades. The duration: amplitude relationship is approximately:
Saccadic duration (msec) = 2.2A + 21
Where A is the amplitude of the saccade in degrees (Dodge & Cline, 1901;
Carpenter, 1988). In normal observers, saccades get slightly slower with age (Pitt &
Rawles, 1988).
1.4.2 Eye movements with a central scotoma
The presence of a scotoma will influence foveating eye movements: true foveating
eye movements need to be suppressed or adapted so that “foveating” saccades are
directed to the PRL and not the scotoma.
1.4.2.1 Saccadic latency and velocity
In normal subjects with simulated central scotomas, saccadic latency has been
shown to be nearly doubled when compared to the same subjects without a
simulated scotoma (Zeevi & Peli, 1979). Zeevi and colleagues also found that
latency reduced towards normal levels with extended practice (14 sessions over a
four week period). These subjects never achieved the same saccadic latency for
their “pseudofoveating” saccades as for their foveating eye movements, but subjects
only practised with a simulated scotoma for the 40 minutes whilst they were in the
laboratory. Patients with complete central field loss are, of course, practising non-
foveating eye movements continuously.
Unfortunately, it does not appear that patients can reach the same level of latency as
age-matched subjects without central scotomas. White and Bedell found that all but
one of their patients had longer saccadic latency than age-matched controls (White
& Bedell, 1990) and Whittaker found a mean saccadic latency of 402 msec in
patients and 298 msec in control subjects (Whittaker et al., 1991). Although the
controls were slightly younger than the patients in the latter study, the difference in
age is not large enough to account for the differences in latency.
Peak velocity of saccades is reduced in patients with MD when compared to age-

M.D. Crossland. Chapter 1: Introduction.
matched control subjects (Whittaker et al., 1991).
1.4.2.2 The number o f saccades used to view a target
Some macular disease patients can saccade directly to the PRL with one or two eye
movements (White & Bedell, 1990; Whittaker & Cummings, 1990a; Whittaker et
al., 1991). White found that fifteen of her twenty-one patients (71%) did not make a
saccade to the fovea and directed the target to the PRL with 3 eye movements or
less. Interestingly the duration of disease did not seem correlated to the absence of
foveating saccades.
McMahon and colleagues examined the number of saccades used when patients
were asked to look at each of five letter targets in turn (McMahon et al., 1991).
They found that the number of saccades used was doubled in patients with AMD
when compared to control subjects. This implies that there is a greater saccadic
inefficiency in patients with central scotomas. McMahon has shown a correlation
between this inefficiency and a reduction in performance on a reading task
(McMahon et al., 1991; McMahon et al., 1993).
Patients with central scotomas perform less well on a visual search task, using more
saccades to find a target (Murphy & Foley-Fisher, 1988; Murphy & Foley-Fisher,
1989).
1.4.2.3 Animal models
Heinen and Skavenski used Argon laser photocoagulation to destroy photoreceptors
in the macula region of three adult monkeys (Heinen & Skavenski, 1991). Before
surgery, the monkeys were trained to make foveating eye movements to a moving
LED target and to fixate that target within a set window of 0.9°. Correct trials were
rewarded with a squirt of water. After the scotomas were created, the monkeys were
re-tested daily to analyse the adaptation to these new scotomas.
On the first post-operative day, the animals used superior retinal PRLs (i.e. placing
the PRL below the lesion in visual field space). Fixation stability was far worse
immediately after the surgery and stabilised within two days (although it never

M.D. Crossland. Chapter 1: Introduction.
reached pre-lesion levels).
The saccadic system took longer to stabilise. One monkey fully adapted within one
month, to reach pre-lesion levels of saccadic latency and accuracy. The second
animal did not reach pre-lesion characteristics but still displayed an improvement in
all saccadic properties and made one saccade to the PRL.
The third monkey did not pseudofoveate: he always made two saccades to the PRL.
The first saccade was not to the scotoma but to another retinal location completely.
This finding is puzzling; no human studies have shown a similar effect.
This simulation does not exactly recreate macular disease in terms of the scotoma
(as the lesion will be a well defined absolute scotoma with no surrounding relative
scotoma) or in terms of the disease presentation (humans would very rarely lose
central vision in both eyes immediately and simultaneously) but the results from
these studies remain of great interest.
In particular, the diversity of recovery amongst the three is remarkable. Given that
these animals all experienced identical visual loss and behaved differently,
examination of humans who experience a wide range of natural histories is likely to
produce very varied outcomes.
1.4.2.4 Accidental laser damage to the macular region
Although accidents with lasers are rare, there are a number of reports in the literature
of accidental, laser induced scotomas in human subjects (Henkes & Zuidema, 1975;
Zwick et al., 1998; Roider et al., 1999). Zwick and colleagues described two
subjects who were exposed to neodymium laser beams of the type used in weapon
viewfinders. These patients both developed central scotomas and subsequently used
a PRL in supero-temporal retina; that is, below the scotoma in visual field space
(Zwick et al., 1998). In a similar manner to laser ablations performed in animals,
these lesions are not equivalent to those experienced by patients with advanced
macular disease. Further, visual acuity recovered to normal values in these patients.

M.D. Crossland. Chapter 1: Introduction.
1.4.3 ConclusionTo return to the definition of “complete pseudofoveation” described in section 1.4
above, patients would need to make saccades to their PRL which displayed all the
properties of foveating saccades.
Although the first part of this definition appears to be fulfilled by at least some
patients, it appears that these pseudofoveating saccades never possess the same
properties as true foveating eye movements. As Whittaker states in his 1991 paper,
“patients with macular scotoma suppress rather than adapt a foveating saccade
mechanism”(Whittaker et a l, 1991).
It is clear that some patients manage to re-reference their oculomotor system more
fully than others. It is still unknown why some patients manage so much better than
others in adapting to their macular disease.
This study will examine the level of pseudofoveation in a variety of patients and will
examine the differences between patients who successfully adapt and those who do
less well.
The second hypothesis of this study is that saccadic characteristics will change with
time. Saccades will become more efficient (that is, fewer saccades will be made to
find a target), foveating saccades will be suppressed and eye movements will be
made directly to the PRL rather than to the scotoma.

M.D. Crossland. Chapter 1: Introduction.
1.5 Reading
Reading is a highly complex visual task, requiring good resolution, precise eye
movement control, stable fixation and higher-order cortical processes. It is
unsurprising that patients with macular disease suffer severe difficulties with
reading.
The ability to read efficiently is critical for full participation in society. In the older
population, particularly those with concomitant hearing loss, it is essential to
maintain independence. Difficulty in reading is the most frequent complaint of
patients with macular disease (Krieger, 1967; Faye, 1970; Faye, 1984; Farrall, 1991;
Elliott et al., 1997; Dickinson, 1998; Hazel et al., 2000).
Reading is not only important in itself, it also a better predictor of performance on a
variety of tasks (including everyday activities as diverse as recognising faces and
cutting finger nails) than standard clinical tests such as visual acuity and contrast
sensitivity measurement (McClure et al.y 2000).
To be able to identify the causes of the reduction in reading ability in MD is
therefore of great importance. Reading speed will be the major outcome measure for
the study described in this thesis.
In order to understand the causes of the deficit in reading which macular disease
patients experience it is necessary to first consider some elements of the normal
reading process.
1.5.1 Some elements of the reading process1.5.1.1 The effect o f text size and contrast on reading speed
In the first paper of their psychophysics of reading series, Legge and colleagues
measured the effect of character size on reading speed. They found that in normal
observers, reading speed asymptotes at around 250 words/minute once text size
reaches 0.3° (approximately three times acuity, assuming a visual acuity of 6/5).
When text size exceeds 2° reading speed again reduces, although the rate of decline

M.D. Crossland. Chapter 1: Introduction.
is slower than when the text size is diminished (Legge et al., 1985a). Psychophysics
of reading papers V, VI and XVI address the effect of contrast on reading speed and
find that for normal observers reading speed is not reduced until luminance contrast
falls beneath 10% (Legge et al., 1987; Rubin & Legge, 1989; Legge et al., 1997).
Contrast polarity (i.e. white text on a black background compared to black text on a
white background) does not influence reading speed in normal observers (Legge et
al., 1985a).
1.5.1.2 Spans, visual and perceptual
Each letter in a word is not fixated individually when reading. To do so would
reduce the speed of reading to an unacceptably low level; saccadic latency alone
would cut the time to read a five-letter word to around one second. Instead, several
letters are processed during each fixation. The width of this “window” of characters
which can be identified is referred to as the visual span (O'Regan, 1990; Legge et al.,
1997). Controlling the number of characters available to the reader by masking
letters and measuring reading time can indicate the size of the visual span. The
width of the visual span is around 10 characters in people with normal vision reading
high contrast, “normal size” text (Rayner & Bertera, 1979; Legge et al., 1997).
The visual span is measured when reading isolated words. However when reading
sentences other parameters are processed such as word length and the spacing
between words, so that eye movements can be planned. The width of this window is
known as the perceptual span (McConkie & Rayner, 1975; Rayner, 1975; Rayner &
Pollatsek, 1989). The perceptual span is asymmetric; in English readers it extends
15 characters to the right of fixation and 3-4 letters to the le ft In more complex
languages such as Chinese the perceptual span is much smaller (three characters to
the right) (Pollatsek et al., 2000) and in right-left languages the span is reversed (in
Hebrew, 11 letters to the left and 2-3 letters to the right of fixation) (Deutsch &
Rayner, 1999).
1.5.1.3 Eye movements and fixations during reading
Even in scientific text, the average word length is smaller than the visual span (for
example, in this introduction mean word length is 5.4 characters). Therefore in

M.D. Crossland. Chapter 1: Introduction.
general one fixation per word is sufficient to read fluently. Normal readers make
occasional regressive saccades and sometimes skip small words when reading but on
the whole follow this pattern (Cummings et a l , 1985; Carpenter, 1988), see figure
1.4.
F
20° I______1 sec
Figure 1.4. Typical eye movements for a normal subject reading text, showing fixations (F), forward saccades (S) and regressive saccades (R). Horizontal axis shows time, vertical axis shows horizontal position on the page. (After Carpenter, 1988).
The “landing position” of the eye is slightly biased towards the start of the word
which is being read (McConkie et al., 1988). Fixation is held at this point for about
220 msec (Rayner, 1978; Rubin & Turano, 1992) before a saccade is executed to the
next word. Fixation duration is increased when the word is uncommon (Raney &
Rayner, 1995) or ambiguous. For example, in the sentence:
“The port was a great success when she served it,”
the word “port” could refer to a fortified wine or a harbour. Fixation duration is
correspondingly increased. However, if the sentence is reordered, to read:
“When she served it to her guests, the port...”
the ambiguity is removed and fixation time is not increased (Rayner & Frazier,
1989; Rayner & Morris, 1990; Rayner, 2002).
If text is presented one word at a time on a computer screen by the RSVP technique
(Rapid Serial Visual Presentation; (Forster, 1970)) to eliminate the need for eye
movements, very high reading rates can be achieved whilst maintaining
comprehension. These rates can be as high as 1,652 words/minute(Rubin & Turano,
1992), equating to a processing time of 36 msec/word.

M.D. Crossland. Chapter 1: Introduction.
1.5.1.4 Cognitive aspects o f reading speed
In addition to the visual and oculomotor characteristics described above, cognitive
processes play a large role in determining how quickly people can read. Proficient
readers are able to assimilate information more quickly than poor readers, and they
display fewer, shorter fixations per sentence, and longer saccades between fixations
(Rayner, 1986). It is believed that fast readers are more able to encode information
into a conceptual representation from each fixation rather than having a larger visual
span (Jackson & McClelland, 1975). Fast readers are also more prone to adapt their
scanning routine depending on the text being read (O’Regan, 1990).
In the older population, literacy and reading ability are known to be related to
cognitive function on other tests such as the mini mental state exam, attentional
tests, verbal learning skills and memory (Barnes et al., 2004).
1.5.2 Reading with macular diseasePatients with low vision display severe impairment of reading speed (Krischer &
Meissen, 1983; Legge et al., 1985b). In particular, a very dramatic reduction in
reading speed is found in the presence of a central scotoma (Legge et al., 1985b;
Wensveen et al., 1993; Bullimore & Bailey, 1995; Bowers & Reid, 1997; Fine &
Rubin, 1999a).
Legge has suggested that three independent factors are taken into account when
considering low vision reading: text parameters such as size, font and contrast;
ocular factors; and non-visual factors such as linguistic capacity and motivation
(Legge, 1991).
Manipulation of text parameters and non-visual factors are beyond the scope of this
thesis, so only ocular factors will be considered below.
1.5.2.1 Visibility: reduction in visual acuity and contrast sensitivity
If the loss of visual acuity alone were responsible for the problems macular disease
patients experience in reading then given appropriate magnification, a normal or
near-normal reading speed should be obtained. This is not the case: for example

M.D. Crossland. Chapter 1: Introduction.
Legge’s work of 1985 revealed a median peak reading rate of 25 words/min in
patients with central field loss even when reading very large characters (of 12-24°).
Visual acuity has been shown to be a poor predictor of reading speed in a number of
studies, accounting for between 10 and 40% of the variance in reading speed
between macular disease patients (Krischer et al., 1985; Legge et al., 1992;
Bullimore & Bailey, 1995; Fletcher et al., 1999).
Contrast sensitivity reduction can not account for the variation in reading speed
(Rubin, 1986; Legge et a l, 1992; Bullimore & Bailey, 1995), although patients with
better contrast sensitivity do tend to read more quickly than others. In their review
paper, Whittaker and Lovie-Kitchin suggested that a contrast reserve of 3:1 is
required for fluent reading (that is, the contrast of the print needs to be three times
the patient’s contrast threshold) and that as much as 11:1 is needed to reading at a
“high fluent” rate of 170 words/minute (Whittaker & Lovie-Kitchin, 1991).
1.5.2.2 Number o f characters seen: reduction o f the visual span and the presence o f the scotoma
The presence of a scotoma will reduce the number of letters which can be seen in
one fixation in a variety of ways. If the subject views the text directly then the
central characters will be masked by the scotoma, whilst if they adopt a PRL then
the legibility of characters further from fixation may be reduced by the poorer
resolution ability and contrast sensitivity of the peripheral retina. As text size
increases then the effective width of the visual span shrinks: Legge, Ahn, Klitz and
Luebker demonstrated that increasing text size by a factor of six halves the number
of characters in the visual span (Legge et al., 1997). In the same paper, the length of
each fixation was examined. Patients with low vision exhibited longer fixation
durations than normal subjects. The results mimicked those seen for normal subjects
reading words at reduced luminance contrast, which is known to reduce visual span.
Bullimore and Bailey (1992) found that the number of forward saccades increased in
patients with MD. This reinforces the theory that visual span is smaller and that
fewer letters can be processed at one fixation in patients with central field loss.
However they did not find an increase in fixation duration, apparently contradicting
the findings of Legge and colleagues. It should be remembered that Legge* s group

M D. Crossland. Chapter 1: Introduction.
examined patients with a variety of diagnoses to account for their low vision, not
just macular disease.
To examine the effect of a scotoma presented in the centre of a word, as may occur
in patients who have not developed a PRL, Rayner and Bertera examined the effect
of a simulated scotoma on reading speed. They found that a gaze-contingent mask
which occupies the area of just one letter halves the reading speed (Rayner &
Bertera, 1979).
Fine and Rubin repeated this experiment with scaling of the letter size to counteract
the effect of peripheral visual acuity limiting reading speed (Fine & Rubin, 1999b).
Although the fall-off in reading speed they found was not as dramatic as that
reported by Rayner, they still found a significant reduction in reading speed even for
the smallest mask size. Fine and Rubin also report that for smaller simulated
scotomas (<7.5° diameter) the number of letters masked had a more significant
effect on reading speed than the size of the mask per se. This suggests that the
greatest possible magnification should be offered to patients with small scotomas.
Visual span is artificially reduced by the physiological blind spot when a
horizontally shifted PRL is used. If visual span reduction is the sole explanation for
the reduction in reading speed then one would expect reading speed to be better in
patients with vertically shifted fixation than those with horizontally shifted PRLs.
This is not the case (Fletcher et al., 1999). It would also be expected that the size of
the scotoma would be correlated to reading speed which is only true when very large
scotomas are included (Cummings et al., 1985) but not in a smaller range of scotoma
size (Bullimore & Bailey, 1995).
1.5.2.3 Reduction in eye movement control
As discussed in section 1.4.2 above, eye movement control is impaired in patients
with central field loss. For reading, saccadic properties are also impaired: when
compared to normal subjects, MD patients make more regressive saccades, more
forward saccades and consequently see fewer letters per forward saccade (McMahon
et a/., 1991; Bullimore & Bailey, 1995). This is also the case for normal subjects

M.D. Crossland. Chapter 1: Introduction.
with simulated visual impairment (Bowers & Reid, 1997).
If eye movement control reduces reading speed then when RSVP is used to present
words in the periphery, patients should be able to read at normal or near-normal
rates. In a series of experiments, Rubin and Turano examined RSVP reading in
normal subjects and macular disease patients. They found that although peak
reading speed is improved with RSVP reading in MD patients (from a mean of 82
words/minute to 120 words/minute), this improvement is far smaller than that for
patients with other causes of low vision (182 to 389 words/minute) and normal
subjects (303 to 1171 words/minute) (Rubin & Turano, 1992; Rubin & Turano,
1994).
1.5.2.4 Reduction in fixation stability and the use o f a PRL
Macular disease patients have poor fixation stability (Culham et al., 1993) which
will lead to retinal image motion. Simulation of retinal image motion in normal
observers is known to severely reduce visual acuity (Bedell et al., 1997). It seems
reasonable to assume that impaired fixation stability may reduce reading ability in a
similar fashion in MD patients. Rohrschneider et al (1995) found that “functional
impairment” was associated with decreased fixation stability. Rohrshneider’s group
determined fixation stability as being poor only when the standard deviation from
the mean fixation point was >3°, which is roughly equivalent to a BCEA of 100,000
minarc . This indicates exceptionally poor fixation stability.
Fletcher and colleagues devised a “PRL scoring” system based on fixation stability,
pursuit ability and “saccade to PRL” ability (Fletcher et al., 1993; Schuchard &
Fletcher, 1994). They found that this score was superior to visual acuity in
predicting reading speed and accuracy in patients with central scotomas.
1.5.3 ConclusionIt is difficult to predict reading speed based on clinical information such as visual
acuity (Legge et al., 1992) or fundus appearance, although it is known that the
presence of a central scotoma drastically reduces the ability to read (Legge et al.,
1985b; Legge eta l , 1992; Bullimore & Bailey, 1995).

M.D. Crossland. Chapter 1: Introduction.
Undoubtedly, the reduction in reading speed in patients with macular disease is
multifactorial. Although reduction in visual span is of paramount importance, many
factors, including those discussed in sections 1.5.2.1 - 1.5.2.4 above, are likely to
interact to reduce reading speed in this population.
The third hypothesis of this thesis is that the variety of variables recorded in this
study will improve prediction of reading speed in patients with macular disease.
This study*s fourth hypothesis is that the adaptive strategies discussed above (the
development of the PRL and saccadic changes) will cause reading performance to
improve over time.

M.D. Crossland. Chapter 1: Introduction. 55
1.6 Training visual behaviour in macular disease
If it is assumed that patients read more fluently when a stable PRL is used, with one
“pseudofoveating” saccade to this locus, then an obvious question is whether
patients’ visual behaviour can be modified with intervention.
Although there is not a large amount of published research on training in macular
disease, many standard low vision textbooks advocate training for patients with
central vision loss (Farrall, 1991; Dickinson, 1998). Three different training
strategies and the use of prismatic spectacles are described below.
It is important to differentiate between training visual behaviour in macular disease,
and training patients in the use of low vision devices. Only training of visual
behaviour will be discussed here.
1.6.1 Teaching awareness of the PRL locationA simple method to train patients to use eccentric viewing is the afterimage transfer
method, which was initially suggested as a method of overcoming anomalous retinal
correspondence in amblyopia (Caloroso, 1972; Ciuffreda et al., 1991). Briefly, the
optimal viewing angle for a target is determined within the clinic and a strobe light
in flashed directly at this retinal area. The patient is then instructed to superimpose
the afterimage on to a variety of targets. An extension of this technique is to ask the
patient to track moving objects (Holcomb & Goodrich, 1976). A case series of
patients using this method found that errors in tachistoscopic letter recognition were
significantly reduced and a subjective improvement was reported by patients given
this training (Holcomb & Goodrich, 1976). This study also included a control
subject who received no training.
The SLO can be used in training patients with central scotoma both by helping the
practitioner determine which retinal area the patient is using for fixation and in
increasing awareness of the optimum area for viewing a target (Schuchard et al.,
1994).

M.D. Crossland. Chapter 1: Introduction.
1.6.2 Teaching the use of an “optimal” PRL
The selection of PRL has already been discussed. The fact that patients frequently
choose a theoretically suboptimal area for fixation of their own accord suggests that
if patients were instructed to use a more logical area for fixation then their visual
performance may improve. Several methods have been suggested to teach patients
to use alternate PRLs (sometimes referred to as “TRLs” or trained retinal loci
(Nilsson et al., 1998)). These include reading cards with horizontal bars in between
each line of text to facilitate maintenance of the eccentric viewing angle (Goodrich
et al., 1985) and computer based systems (Fitzmaurice et al., 1994; Nilsson et al.,
1998). A modified typoscope can be used so that the patient is asked to keep
macular fixation upon a target deviated from the text being read (figure 1.5). The
patient would be asked to fixate the red dot on the frame of the typoscope (which
would not be seen if the scotoma is large enough) whilst reading text at an eccentric
location (Collins, 1987). This method is usually combined with a steady eye
strategy whereby the patient moves the page being read whilst keeping their fixation
stable (Dickinson, 1998).
Figure 1.5. A modified typoscope to encourage eccentric viewing (After Collins, 1987.)
Culham and colleagues attempted to train patients to use a TRL with a SLO and
found that fixation stability, distance and near visual acuity improved after six

M.D. Crossland. Chapter 1: Introduction.
hours’ training (Culham et al., 1997). Unfortunately no concurrent reading speed
improvement was found. Culham (1994) found that performance at an alternative
retinal locus never exceeds performance at the PRL for visual acuity, reading
scrolled text or fixation stability.
Nilsson and colleagues have trained many subjects to read with a retinal location
shifted vertically from the foveal centre (Nilsson et al., 1998; Nilsson et al., 2003).
They defined the optimum PRL as being one below the scotoma in visual field based
on their own clinical experience and studies of subjects with normal vision and
artificial scotomas (Petre et al., 2000). Unfortunately, patients were each prescribed
hyperocular reading spectacles at the same time at the commencement of the training
and no data are given in this paper for patients who received these spectacles but not
the Nilsson’s training. An earlier paper by the same authors included a group who
did not receive training, however these patients differed from the control group
either by having less severe AMD or having cognitive difficulties(Nilsson &
Nilsson, 1986). It is, therefore, impossible to dissociate the increase in reading
speed attributable to the hyperocular spectacles (and practice with these) from the
improvement due to training per se.
In order for eccentric viewing to be efficient at every viewing distance, the
geometric angle of rotation of the eye needs to be constant, so that the PRL is
consistently placed upon the visual axis of the eye. However when a normal subject
is trained to fixate eccentrically at one distance, the angle of eccentricity of the eye
when subsequently fixing on a closer object is greater and when looking closer it is
smaller (Yap et a l, 1986). Yap and colleagues postulate that, due to the
phenomenon of size constancy, patients may decentre their eyes by a set visual angle
and not by a constant geometric angle. This would reduce the success of eccentric
viewing, and has important implications upon the likely success of training eccentric
viewing. Unfortunately to date this hypothesis has not been investigated in patients.
1.6.3 Teaching eye movement control
Training saccadic eye movements has been suggested as a way of improving visual
performance in dyslexia (Fischer & Hartnegg, 2000) and even in enhancing sporting

M.D. Crossland. Chapter 1: Introduction.
performance in athletes with no visual deficit (Goldberg, 1991; Loran & Griffiths,
2000). When applied to subjects with macular disease, McMahon and colleagues
found a limited improvement in reading rate in some patients after a seven-week
inpatient rehabilitation program (which also incorporated the prescription of low
vision aids and counselling about the nature of the vision problem (McMahon et al.,
1993)). Again the lack of a control group is a serious limitation in this study.
1.6.4 The use of prismatic spectaclesPrismatic scanning, or prism relocation therapy, is a means of redirecting the image
away from the fovea and onto the PRL. In contrast to the other methods above, the
patient must not make any adaptive eye movements to see a target but must instead
direct their fovea toward the object of regard. Initial results indicated this technique
was remarkably effective, with one study claiming 100% of 59 patients were able to
improve their reading acuity with prism relocation therapy (Romayananda et a l,
1982). As with many other training studies, no control group was included in
Romayananda’s study. This problem was addressed in a later study by Rosenberg
(1989). 18 of 19 of patients in the treatment group (94%) demonstrated an
improvement in visual acuity, visual function or both. However, the same
improvement was recorded in 64% of the control group (7/11). Recent research in
the UK has not found the use of prismatic spectacles to be of great benefit in patients
with AMD (Cacho et al., 2003; Smith et al., 2003).
1.6.5 The use of visual training in macular diseaseSome centres, such as the Veteran’s Administration in the USA and clinics in
Sweden, provide a large amount of visual training in patients with macular disease.
All of the techniques described above require many hours of patient contact. In the
UK these resources are not available at present. Most practitioners working in NHS
(state-funded) low vision clinics will advise patients on the theory of eccentric
viewing but will not offer any formal training.
Further scientific reports are required in the field of visual training, preferably of a
prospective, double-masked design. The remarkable finding described above that
the majority of patients in a control group demonstrated some visual acuity or

M.D. Crossland. Chapter 1: Introduction.
functional improvement indicates the degree of scepticism which should be applied
to work published without the inclusion of a “sham” group (Rosenberg et al., 1989).

M D. Crossland. Chapter 1: Introduction.
1.7 This study: The development of viewing strategies in macular disease
1.7.1 Rationale
Over the four decades since von Noorden first described eccentric fixation in
macular disease (von Noorden & Mackensen, 1962), many studies have increased
our understanding of fixation in macular disease. In particular, the development of
the scanning laser ophthalmoscope in the 1980s has enabled more complete
assessment of the behaviour of patients with MD. However, very little is known
about the development of these fixation and eye movement control strategies. With
few exceptions, all subjects examined have had long standing macular scotomas who
have already developed adaptive strategies to partially ameliorate the symptoms of
the disease. A cross-sectional study design can not correct for individual differences
in behaviour between patients and does not directly assess the timescale of
development of adaptive strategies.
Many authors have suggested a longitudinal, prospective study to examine changes
in visual behaviour in patients with new macular disease (Whittaker & Cummings,
1990a; Legge et al., 1992; Schuchard & Fletcher, 1994; Culham, 1994), but to date
no human studies have been reported. The only prospective longitudinal study on
adaptation to new scotomas published is in the adult macaque monkey (Heinen et
al., 1991; see section 1.4.2.3 above). Problems with comparing the performance of
animals to that of humans with macular disease have already been discussed.
There remains a gap in our knowledge concerning the time scale over which the
visual behaviour of human patients with macular disease adapts. Knowledge of the
natural course of adaptation to MD would help in the rehabilitation and counselling
of patients with the disease. This information would also be of benefit in future
studies which examine training programs or treatment regimes in patients with MD.
1.7.2 Introduction to this projectThis thesis describes a longitudinal study of visual behaviour in human macular
disease and builds upon the cross-sectional studies of White, Whittaker, Bullimore,
Sunness, Culham and others to contribute to our understanding of the adaptations

M.D. Crossland. Chapter 1: Introduction.
which patients make to this debilitating disease.
Patients have been recruited at the point of developing a scotoma in their second
affected eye. The longitudinal nature of this study has made it possible to
investigate the timescale and pattern of the development of adaptive strategies. In
particular the development of the preferred retinal locus, changes in the
characteristics of saccades and the re-referencing of the oculomotor system are
analysed.
1.7.3 Aims
The broad goals of this study can be summarised under the following three aims.
1. To examine and quantify the adaptive strategies which are naturally
adopted by patients who have lost central vision due to macular disease, with
particular reference to fixation behaviour, the number of preferred retinal loci
used and the use of non-foveating saccades.
2. To determine the changes in these adaptive strategies which occur for a
period of twelve months immediately following visual loss in the second eye
to lose central vision.
3. To determine the relative utility of each of these adopted strategies, with
particular reference to reading speed and change in reading speed.
1.7.4 Hypotheses1.7.4.1 Hypothesis 1: A PRL will develop
After scotoma development, patients will develop a consistent preferred retinal
locus. The number of different PRLs used will reduce from many to one and
fixation stability will improve. Patients will lose awareness of the use of the PRL.
1.7.4.2 Hypothesis 2: Eye movement control will improve
The number of saccades used to locate a target will reduce over time. Foveating

M.D. Crossland. Chapter 1: Introduction. 62
saccades will be suppressed and eye movements will be made directly to the PRL
rather than to the scotoma. Eye movement control will become more efficient when
reading; with time, fewer saccades will be required to read a sentence, and the
number of regressive saccades made during a reading task will fall.
1.7.4.3 Hypothesis 3: Reading speed will be predicted more precisely
The measurement of clinical, fixation and eye movement variables in this study will
improve the prediction of reading speed in patients with central scotomas.
1.7.4.4 Hypothesis 4: Functional performance will improve
Reading performance will improve over time, in tandem with the improvements in
fixation and eye movement control described above.
1.7.4.5 Hypothesis 5: JMD patients will display superior performance
Patients with juvenile macular disease will make the adaptations described in
sections 1.7.4.1 and 1.7.4.2 above more quickly and more completely than will those
with AMD.

Chapter 2: General method
63
2.1 Patient selection
Patients were recruited from the medical retina, low vision and accident and
emergency clinics at Moorfields Eye Hospital (MEH). Control subjects were
friends, colleagues or relatives.
2.1.1 Inclusion and exclusion criteria
2.1.1.1 Inclusion criteria fo r patients
The primary inclusion criterion was that patients must have experienced significant
vision loss in their better eye within the two weeks prior to recruitment, due to
AMD, Stargardt disease with macular involvement or Best disease. The vision loss
must have been significant (a deterioration of at least 0.2 logMAR units, or a severe
limitation of reading or functional performance) and sudden (deterioration took less
than one week). Patients had to be able to read English as a first language.
Participants had to be at least 16 years old and capable of giving informed consent
2.1.1.2 Exclusion criteria
Specific exclusion criteria included the presence of diabetes mellitus, concomitant
eye disease (other than visually insignificant cataract) or a history of neurological or
psychiatric disease. If patients' neurological status was questionable, a mini mental
state exam was performed.
All patients recruited into this study had either been deemed ineligible for medical or
surgical treatment by their ophthalmologist or had declined such treatment.
After data collection commenced, it became clear that good calibration of the
eyetracker could not be achieved in patients with acuity less than 6/60 in their better
eye. Subsequently this became an exclusion criterion. In addition, two patients who
were referred into the study did not have an absolute scotoma which could be
identified on microperimetry. They were also excluded.

M.D. Crossland. Chapter 2: General method.
2.1.1.3 Inclusion criteria for control subjects
Control subjects had vision of 0.1 logMAR or better in both eyes (with spectacle
correction if appropriate) and no evidence of ophthalmological disease on
ophthalmscopy (and other tests as indicated). They had no history of
ophthalmological, neurological or psychiatric disease. All spoke and read English as
a first language, were aged over 16 years and gave their informed consent. Control
subjects were age-matched to assessed subjects in two groups: an older and a
younger control group. No attempt was made to match intelligence or educational
background between patients and control subjects.
2.1.2 Visit schedulePatients attended for a baseline assessment within one week of recruitment (i.e.
within three weeks of their visual loss). Subsequent appointments were arranged
one month, three months, six months and twelve months after the baseline visit. In
addition, some patients recruited in the early stages of the study attended for an
eighteen month follow-up visit. Control subjects attended twice: at baseline and one
year later. Participants’ travelling expenses were paid, and a voucher for the
hospital cafeteria was given at each visit.
2.1.3 Discharge point from studyPatients were discharged before their twelve month appointment when the macular
disease in the study eye deteriorated. Deterioration was defined as an increase in
scotoma area of 0.5 disc areas or more, or a loss in visual acuity of 0.2 logMAR
units (2 lines). Further, patients were removed if their study eye became the worse
of the two eyes (i.e. if the visual acuity in the contralateral eye improved).
2.1.4 Ethical committee approvalThe MEH ethics committee approved the study in November 2000, before
recruitment began. The study was given the ethical reference code “CULL1003.”
The study conformed with the Declaration of Helsinki. All patients gave their
informed consent after reading a consent form. In the case of patients under 18
years of age, the patient and a parent both gave consent. A copy of the consent form
can be found in Appendix 2.

M.D. Crossland. Chapter 2: General method.
2.2 General method
This section explains the methods used in this study. More detailed protocols can be
found in appendix 2 of this thesis.
2.2.1 Definition of study eye
The “study eye” was defined as being the eye with the better visual acuity. The
contralateral eye was occluded with a simple eye patch for all tests except for the
low vision assessment (which was performed binocularly) and distance visual acuity
measurement (which was performed monocularly in each eye).
2.2.2 Monitor setup
The PC monitor used (Trinitron GDM-F500R, Sony, Japan) had a white background
of 125 cd/m2 and a refresh frequency of 85 Hz. The monitor resolution was 800 x
600 pixels for all experiments.
2.3 Clinical method
2.3.1 Refraction
All patients were refracted by a qualified optometrist in accordance with techniques
taught on undergraduate optometry courses. Retinoscopy and subjective refraction
were performed. Refractive error was defined as the most positive spherical lens
and minimum astigmatic correction consistent with best visual acuity (Bennett &
Rabbetts, 1989). Spectacles were prescribed if patients appreciated a significant
improvement over their habitual distance correction.
2.3.2 Low Vision Assessment
Where satisfactory near visual acuity could not be achieved using a simple reading
addition a full low vision assessment was performed as described in standard texts
(Dickinson, 1998). Devices prescribed were issued on loan from MEH in
accordance with the normal hospital system.

M.D. Crossland. Chapter 2: General method.
2.3.3 Distance visual acuity measurementThe ETDRS logMAR chart (Lighthouse, New York) was used at 4 metres to
measure distance visual acuity in the standard manner (Bailey & Lovie, 1976).
Visual acuity was recorded with the optimal refractive correction. Three different
ETDRS charts were used and the same chart was not used on consecutive visits.
2.3.4 Near visual acuity measurement
Bailey-Lovie word reading cards (National Vision Research Institute of Australia,
Australia) were used for near visual acuity measurement. An addition of +4.00 DS
was made to the distance spectacle prescription and the patient was asked to hold the
test card at 25cm. The smallest line of words read with less than two errors was
recorded as the near visual acuity. The same card was not used on consecutive
visits. Patients were not permitted to use any low vision devices for this assessment.
2.3.5 Contrast sensitivityContrast sensitivity was assessed using the Pelli-Robson chart (Pelli et al., 1988) at 1
metre. Results were scored using the method described by Elliott (Elliott et al.,
1991).
2.4 Assessment of visual function
2.4.1 Suprathreshold reading speedTen 55-character sentences were displayed on the computer monitor. Sentences
were randomly selected from a database of over 500 sentences and had similar
properties to those used on the MNRead card (Legge et al., 1989) in terms of
difficulty and word order*. The sentences had a Flesch-Kincaid Grade level of 4.6.
Fourth-grade level text has been recommended for use in consent forms for
participation in medical research (Paasche-Orlow et al., 2003).
* Sentences were supplied by Dr Elisabeth Fine of Harvard Medical School, Mass., USA. Sentences containing US spellings (or references to baseball) were removed.

M.D. Crossland. Chapter 2: General method.
Sentences were displayed in Times New Roman font over two lines, with word
wrap, in the centre of the screen. The left hand side of each line was justified.
Sentences were presented at three times threshold visual acuity size as the minimum
acuity reserve reported for “high fluency” reading in macular disease patients is 3:1
(Whittaker & Lovie-Kitchin, 1991; Lovie-Kitchin e ta l , 2000; Massof, 2003).
Although it is conceded that higher reading speeds may be possible with larger text,
using text of this size also enabled the sentences to comfortably fit upon the screen
when viewed from 50cm.
Subjects were asked to read the sentences out loud as quickly as they could without
making errors. Timing commenced at the moment the sentence appeared. A
keystroke made by the investigator when the last word was read correctly stopped a
timer in the computer. A blank screen appeared in between each sentence. If the
sentence was read incorrectly then it was excluded from the analysis, unless the
patient corrected their error. The mean time to read a sentence was recorded and
reading speeds were converted into words/minute for subsequent analysis.
2.5 Laboratory methods
2.5.1 Scanning laser ophthalmoscopyA Rodenstock SLO (SLO-101, Rodenstock, Germany) was used for all scanning
laser ophthalmoscopy in this study. This SLO consists of a 633nm Helium-Neon
laser for stimulus display and an infra-red laser of wavelength 780nm for retinal
imaging. The SLO can be seen in use in figure 2.1.
Simultaneous video recording was performed during all SLO experiments using a
professional mini digital video recorder (BR-DV600E, JVC, Japan) at a frequency of
25 Hz with audio recording.
The scanning laser ophthalmoscope meets the safety criteria of the International
Electrotechnical Commission regulation 825 for the safety of laser products and is
CE marked.

M.D. Crossland. Chapter 2: General method.
r0den STCK
Figure 2.1. The Scanning Laser Ophthalmoscope in use.
2.5.1.1 Microperimetry
The size of the dense scotoma was measured using the SLO’s inbuilt microperimetry
module (Scotometry v.3.1b, Rodenstock, Germany). A full description of
microperimetry can be found elsewhere (Sunness et al., 1995; Varano & Scassa,
1998). Briefly, the patient is asked to fixate a central cross of height 2.5° whilst
reporting, by means of a button press, when they see a point target which is
presented at a retinal location selected by the investigator. The stimuli used were
Goldmann III size targets of intensity 200 cd/m and were presented for 200 msec.
Immediately after stimulus presentation, the retinal image was frozen and the
investigator marked a distinctive retinal feature (for example a vessel bifurcation).
Superimposition of these images creates a map of seeing and non-seeing retina.
2.5.1.2 Analysis o f SLO images
An example of the image produced by microperimetry is shown in figure 2.2. Seen
points are represented as dots whilst non-seen points appear as empty triangles. The
blue cross indicates the centre of fixation and the red cross the reference point used.

M.D. Crossland. Chapter 2: General method. 69
.Figure 2.2. An example microperimetry plot.

M.D. Crossland. Chapter 2: General method.
2.5.1.3 Measurement o f scotoma size
Microperimetry images were laser printed. The boundary of the optic disc was
traced onto a sheet of acetate paper (CG330, 3M, Texas, USA) and this sheet was
superimposed onto the microperimetry image. The area of the scotoma was
recorded to the nearest 0.5 disc areas.
2.5.1.4 Analysis o f fixation
The habitual location of fixation was recorded when patients had completed the
microperimetry task. Patients were asked to look at the central fixation cross for a
further thirty seconds whilst no stimuli were presented. The location of the principal
PRL was determined in the manner described below. Where patients displayed
multiple PRLs, the location of the principal PRL was recorded, being the retinal
location where patients fixated for the greatest proportion of the trial. Where
fixation was divided equally between multiple PRLs, patients were asked to sit back
from the SLO and were reassessed after a few seconds to determine the PRL which
patients would select habitually. If ambiguity still existed, videotapes were shown to
a medical retina ophthalmologist* who was asked to decide where the principal PRL
was. This ophthalmologist was masked from any patient details. The location of
the principal PRL was recorded with respect to the scotoma in visual field space, as
shown in figure 2.3.
Fixation location was then recorded under two further verbal instructions, which
were:
1. “Please look at the red cross in the centre of the screen in front of you”
2. “Please move your eyes so that you are looking straight at the cross, even
if it disappears or becomes difficult to see.”
Patients indicated when they had followed each instruction. At this point, digital
images were captured using the PC connected to the SLO. As only one retinal
image was frozen under each instruction, care was taken to ensure that the point
* Dr Stamatina Kabanarou, Fellow in Medical Retina, Moorfields Eye Hospital and Research Ophthalmologist, Institute of Ophthalmology

M.D. Crossland. Chapter 2: General method.
selected was within the centre of the locus used under each condition. If the distance
between the two centres of fixation was small then retrospective analysis of the
video recording was performed to determine whether the two locations lay within
one PRL or were within discrete loci. If ambiguity existed then Dr Kabanarou was
used as a final arbiter of whether the fixation points lay within the same PRL or
within a different retinal area. As in the previous experiment, Dr Kabanarou was
blind as to the identity or any clinical features of the patient in question.
The location of fixation was always recorded with respect to the scotoma. The
convention used was to describe the fixation location with respect to the scotoma in
visual field space (see figure 2.3).
BELOW
LEFT RIGHT
Scotoma ABOVE
Figure 2.3. Convention used to describe fixation location (right eye)
2.5.2 Eye tracking
Eye movement data was collected with a SMI Gazetracker (SensoMotoric
Instruments, Germany), running EyeLink software (v2.04). Stimulus presentation
software was written in-house using commands from the EyeLink library.

M D. Crossland. Chapter 2: General method.
2.5.2.1 Calibration and drift correction
Before each experiment, the eyetracker was calibrated and the calibration was
validated using the algorithms provided for this purpose. Only trials where the
calibration was categorised as “good” by the Eyelink software were included.
Calibration is described as “good” when minimal nonlinearity exists when fixating
different target positions (maximum ratio of gains =1.5:1 horizontally, 3:1 vertically
(personal communication, SR Research, Osgoode, Canada)).
Drift correction compensates for any slip between the gazetracker headset and the
patient’s forehead. This was performed in between each set of data collection, and
in between each sentence in the assessment of reading.
2.5.2.2 Fixation stability
Fixation stability was measured by asking patients to observe a round target
presented in each of five positions: in the centre of the screen, 18° to the left and
right and 12° above and below screen centre. These positions were used as they
correspond to 100 pixels in from the edge of the screen, so large decentration is
possible without the screen edge interfering with the target visibility.
The target was a black circle of 3° diameter with an 18’ central white detail,
presented against a plain white background on the computer monitor. The target
appeared for 10 seconds in each of the five locations, in a randomised order.
Subjects were asked to perform one practice trial at each visit before data were
recorded to familiarise themselves with the task.
Data were retrospectively analysed using a Matlab program written specifically for
this purpose. Data analysis consisted of four stages. First, the first second of data
was removed to allow patients to find the target on the screen. Second, data
recorded for 0.25sec preceding and 1 sec following the start of any blinks were
removed. Next, eye positions recorded during a saccade (velocity >30°/sec) were
removed. Finally, a bivariate contour ellipse or ellipses were calculated using the

M.D. Crossland. Chapter 2: General method.
equations given in Chapter 3.
2.5.2.3 Saccadic latency, accuracy and peak velocity
Saccadic latency was recorded separately for horizontally and vertically decentred
targets. After initial calibration, subjects fixated a central target for ten seconds. As
in previous experiments, the stimulus was a 3° black circle with an 18’ central detail
against a white screen background. The target then disappeared and immediately
reappeared 18° to the left or right of the initial target location. After 5 seconds, the
new target disappeared and reappeared instantly at the central position. This was
repeated to a total of 20 times. The computer randomly presented the stimulus in
either the left or right screen position but in each case the next presentation was
central.
For vertical saccadic profiles, the experiment was identical apart from the decentred
target being 12° above or below the central location.
EDFview software (SensoMotoric Instruments, Germany) was used for retrospective
analysis of saccades. Figure 2.4 below shows an example EDFview plot for one
second of one target presentation. The blue line represents x-position of gaze (in
pixels), the red line indicates y-position and the brown line pupil diameter. The
green stripes indicate saccades (defined as eye velocity >30°/sec or acceleration
>8000°/sec/sec). The grey squares are printed for ease of determining time and
decentration only.
Properties of the first saccade are printed below the graph. Therefore the following
measurements would be recorded from this block:
Saccadic latency = 281ms
Number of saccades to fixate target = 2
Peak saccadic velocity = 390°/sec

M.D. Crossland. Chapter 2: General method.
Figure 2.4. A typical EDFview screen.
Saccades made to the central target were not analysed as saccades to a previously
fixated location have different properties (Carpenter, 1988). Mean saccadic latency,
mean number of saccades and mean peak velocity was recorded for each position of
gaze (left, right, up and down).

M.D. Crossland. Chapter 2: General method.
2.5.2.4 Eye tracking for reading
Horizontal eye movements were recorded for reading sentences presented under the
conditions described above (section 2.4.1). Saccades were analysed using
EDFviewX. The total number of forward and regressive saccades was recorded, as
was the number of saccades to find the start of each line of text. Figure 2.5 shows an
example EDFviewX screen for reading.
£
Figure 2.5. An EDFviewX screen for a reading trial.

M.D. Crossland. Chapter 2: General method.
Only horizontal saccades were considered in this analysis, although the vertical eye
movement recording was used to determine when patients were looking towards the
second line of the text. From the example given in figure 2.5, the number of
saccades to find the start of the line was 2 for the first line and 3 for the second line;
the number of forward saccades made is 16; and the number of regressive saccades
is 11.
2.6 Software used for statistics and data analysis
JMP (v4.0.4, SAS software, Cary, NC, USA) was used for data storage, exploratory
analysis, linear regression, survival analysis and some multivariate analysis. Further
multiple regression was performed using Systat (Systat software, Richmond, CA,
USA). Odds ratios were calculated using JMP with a correction factor to account
for non-unity interval values (applied in Microsoft Excel).
Matlab programs were used to sort fixation data and to calculate the global BCEA.
Kaleidagraph (v3.51, Synergy software, Canada) was used for most of the graphs in
this thesis.

Chapter 3: Development of statistical method
77
Section 1.3.6.1 discussed the difficulties of assessing the number of preferred retinal
loci used by patients. For the longitudinal study described in this thesis,
comparisons need to be made between visits and between patients. A test for the
number of PRLs is required, and the characteristics of these PRLs need to be
defined. This requires the use of advanced statistical techniques, which are
described below.
3.1 Collaboration
The techniques used to analyse multiple PRLs described in section 3.3 below were
developed in close collaboration with Miss Michelle Sims (MS) and Dr Rex
Galbraith of the Department of Statistical Sciences, University College London.
The development of these programs was part of Miss Sims’ MSc degree in statistics.
MS also wrote the S-Plus programs used for these analyses. The application of these
programs and all data analysis was performed by MDC.
3.2 Fixation stability: The bivariate contour ellipse area (BCEA)
The BCEA describes the area of an ellipse which encompasses a given proportion
(P) of fixation points during one fixation trial (Steinman, 1965; see section 1.3.4.1).
When fixation data is normally distributed in both the x and the y dimension, the
following formula can be applied to calculate the BCEA:
BCEA = 2knoh Oy (l-jO2)14 [Eq.3.1]
Where : a H = Standard deviation of point location over the horizontal meridian
G\ = Standard deviation of point location over the vertical meridian
p - Product-moment correlation of these two position components

M.D.Crossland. Chapter 3: Development of statistical method.
The value k is dependent upon the probability area chosen (see equation 3.2).
P = l-e -k [Eq. 3.2]
where e is the base of the natural logarithm.
Therefore when it is 1 the area describes fixation for 63.2% of the time. For the
purposes of this study a P value of 0.68 (Jt=1.14) has been used.
3.3 Analysing multiple loci of fixation
In order to determine how many loci are present within one fixation trial, a test for
multimodality is required. Formal statistical tests for detecting the number of
multiple components exist (Titterington et al., 1985) but they require the distance
between the components to be large. We have used two statistical tests in the
assessment of multiple PRLs: the kernel density estimator, which provides an
estimate of how many loci are present and the expectation, maximisation algorithm
to determine the properties of these PRLs.
3.3.1 The kernel density estimatorThe kernel density estimator (KDE) is a nonparametric density estimator which can
be used to determine the number of clusters in a set of data (Silverman, 1986). A
computer program produced a smoothed kernel plot of the data points using a 50x50
grid and a set window width as suggested by Bowman and Foster (Bowman &
Foster, 1992). The number of non-overlapping peaks was recorded as the number of
PRLs present.
An example of an ambiguous data set which has been analysed with the KDE is
shown in figure 3.1.

M.D.Crossland. Chapter 3: Development o f statistical method.
I
-20 0 20 X decentrallo ri (m lr a rc )
-20 0 20 X d ecen tra tlo n Cm In a rc )
-60 -40 -2 0 0 2 0 4 0 6 0 80
X decentration (min arc)
Figure 3.1. Application of the KDE. a: scatter plot of “cleaned” data, b: global BCEA fitted to data (BCEA = 21 725 minarc2). c: contour plot produced by the KDE indicates 3 PRLs.
3.3.2 The EM algorithm
After performing the KDE calculations, a mixture of component bivariate normal
distributions was fitted to the data using the EM (expectation, maximisation)
algorithm. The number of discrete peaks seen on the contour plot produced by the
KDE was used as the number of components. The EM algorithm returns the
estimated parameters of each bivariate normal distribution, the mean position and
the standard deviation along the x and y axes, the correlation coefficient, a “local”
BCEA for each locus (using equation 3.1) and an estimate of the proportion of data
which fell into each locus. The estimated parameters are those for which the log
likelihood is highest. The algorithm calculates the value of the log likelihood and
also the Bayesian information criterion (BIC) and the integrated classification
likelihood (ICL-BIC)(McLaughlan & Peel, 2000). These can be useful to aid model
selection (for example to determine the number of components if this is not clear
from the KDE plot). The whole process was performed ten times using different
starting values in order to check that the estimates converged to the correct final

M.D.Crossland. Chapter 3: Development of statistical method,
values.
Table 3.1 shows the results of the EM algorithm, when applied to the dataset used in
figure 3.1. As can be seen, the sum of the local BCEAs is less than half of the value
of the global BCEA shown in figure 3.1.
PRL MeanX
MeanY
SDX SD Y Correlationcoefficient
P BCEA(minarc2)
1 -14.9 16.7 7.26 5.16 -0.50 0.36 24002 -13.8 -5.42 6.77 4.45 -0.65 0.31 25003 37.7 -24.9 8.63 6.17 -0.25 0.22 4340
Table 3.1 . Description of eac i PRL returned by the EM algorit lm. p=proportion ofpoints in each PRL.
3.4 Application and validation
Data were cleaned using the Matlab program described in section 2.5.2.2 above.
This dataset was saved as a text file. A program written by MS using S-Plus (v4.5,
MathSoft, Cambridge, MA, USA) was used to run the KDE on the cleaned dataset.
If the KDE indicated the presence of multiple PRLs then the number of loci was
entered into another S-Plus program which performed the EM algorithm.
Fixation stability was described by recording the sum of local BCEAs and the
number of PRLs present.
3.5 F u rth er inform ation on the statistical techniques
This section gives mathematical details of the KDE and EM algorithm. It is taken
from the Vision Research paper written by MDC and MS which can be found in
appendix 4.

M.D.Crossland. Chapter 3: Development of statistical method.
3.5.1 The kernel density estimator
The use of a kernel density estimator in multivariate data is explained in detail
elsewhere (Silverman, 1986). Briefly, if a sample of horizontal and vertical
observations V (x \n is collected with joint probability density function f(x,y)
then the kernel density estimator for bivariate data is:
1/ ( * .? ) = nh*hy 7"?I* ' x - x i y - y ^
h,(i = 1 n) (Eq. 3.3)
Where K(x,y) is the kernel function, such that:
J ^K(x,y)dxdy=l
and hx , hy are window widths or smoothing parameters.
We used the following kernel function (Silverman, 1986):
K (x,y) = - ^ — e x p f - i ( x 2 + y 2) 2n \ 2
Bowman and Foster suggested the following optimal window widths(Bowman &
Foster, 1992):U — * -W6rtx - amJ- _ A -1/6h y = O y tl
where n is the number of observations and 6 x , 6 y are estimated standard deviations of
x andy.
3.5.2. The EM algorithm
The EM algorithm is a method of calculating maximum likelihood estimates. Let y,-
denote the (x,y) coordinates for the ith observation. The observed data y/,...,y« can
be regarded as incomplete since the components to which they belong are unknown.
If Zy =1, yi has a probability density function fi (yjji/jE/), where fj (y;|ty£^) is a
bivariate normal density function with mean p/ (2x1) and convergence matrix Dj
(2x2). Let z,• = (z,7 , z,2 , ... ,z,^)T denote a multinomial vector indicating which
component y, is from. That is, exactly one of z,y,..., zik equals 1 and the others equal
0. The probability that Zy- =1 equals % (where Jt/+ 7t2 + ... +rc* = 1) so iij represents
the proportion of time that the yth PRL is occupied. A complete data sample is

MD.Crossland. Chapter 3: Development of statistical method.
( z > f z ^therefore £i
,yi> J mj. It is assumed that all n observations are independent and
have been fully categorised. The complete data log likelihood is:k
*cW = £ l o g ^ / A , ; ^ ) ) ) (Eq. 3.4)i -1 j = l
where 0 denotes the full set of parameters tij, fi/, L/ for 7=1,2,...k.
The E,M algorithm treats zy,...,zn as missing data. It is an iterative procedure
consisting of two steps, E (Expectation) and M (Maximisation).
3.5.1.1 The E-step
The E-step calculates the expectation of the complete data log likelihood with
respect to the missing data given the observed datay and current parameter values 0.
The log likelihood is linear in the zy so the E step simply replaces zy by their
expected values 7tij given y and 0. Thus:
*ij = E(Zij | y i ; 0)
Xj f j f . yplijSEj) j = 1,...,* i = 1 (Eq. 3.5)
nij is the posterior probability that an individual with observed value y< belongs to
component j (for given 0).
3.5.2.2 The M-step
The M-step maximises £c(0) with Zy having been replaced by jt#. The parameters
that maximise £c(0) can be written down explicitly:
Xj = “ 2 * 0 J = 1 .-.* (Eq. 3.6)n ,= i
mj = — 5 Xy, J = 1» - 3-?)
i j = — 2 * « /(y i - M y * J = 1--»* ^ 3-8>nJtj ,=i
These give updated estimates of the parameters 0 in the iterative procedure.
Equation 3.6 estimates the mixing proportion n,j, as the average of the posterior

M.D.Crossland. Chapter 3: Development of statistical method.
probabilities Tty of all n observations for component j. Equations 3.7 and 3.8
calculate the weighted average of the n observations and the weighted sample
covariance matrix respectively, both using weights of ny.
Before applying the EM algorithm, initial values for the parameters (f® are assigned.
The E and M steps are then repeated until some a stopping criterion is met. The
stopping criterion is based on the relative change in the log likelihood
£(0{k+X)) -£ (0 ik)) and (BCEA)(*+1) -(BCEA)W at each iteration (£=1,2,3...). The
program stops when the log likelihood is less than KT4 and the BCEA is less than 10'
3. The maximum number of iterations is set at 200. Throughout the E,M process
U jfk+l)) > L(0^k)), where (fk) are the parameter values after k iterations.
3.6 Validation and further information
As these statistical methods have not previously been applied to analyse fixation
data, validation of these techniques was performed. This validation will be
discussed in the next chapter.

84
Chapter 4: Validation of novel methods
Two new methods have been introduced in this study - the use of an infra-red
eyetracker to measure fixation stability and the statistical techniques described in the
previous chapter.
This chapter will justify the selection of these methods and will give results of
control experiments performed at the start of this project.
4.1 The use of an infra-red gazetracker to measure fixation stability*
Early studies of fixation stability such as those perfomed by Steinman (Steinman,
1965; Steinman & Cunitz, 1968) used contact-lens based eyetrackers to record eye
position and hence fixation stability. However in the last two decades, most fixation
stability tests have been administered with either the scanning laser ophthalmoscope
or a fundus camera (see section 1.3.1). Where infra-red eyetrackers have been used,
these have required rigid head immobilisation (Kosnik et ah, 1986; Eizenman et al.,
1992).
The SLO has several limitations relevant to the assessment of fixation stability.
Stimuli must be monocular, monochromatic images presented at a fixed viewing
distance, the subject’s head must be stabilised for satisfactory retinal imaging and in
some circumstances pupil dilation is required (Zangwill etal., 1997).
Conversely the infra-red eyetracker can be used with any stimulus, which can be
presented in full colour at a wide range of viewing distances under monocular or
binocular conditions. The gazetracker used in this study can compensate for head
motion so fixation stability can be measured without the need for head
immobilisation.
Anecdotally, patients seen in this study appeared to prefer using the eyetracker to the
* This work has been published in Optometry and Vision Science. A reprint of the paper can be found in Appendix 4.

M.D. Crossland. Chapter 4: Validation of novel methods.
SLO. Although the opinions of subjects were not formally assessed, several patients
preferred the free-head nature of the eyetracker and some found it difficult to hear
instructions over the noise of the scanning laser ophthalmoscope.
This control study was performed to compare the use of the eyetracker to the SLO in
the assessment of fixation stability in subjects with normal vision and those with
macular disease.
4.1.1 Methods
Six subjects without macular disease were recruited from colleagues at the Institute
of Ophthalmology. All subjects were under 40 years of age and had best corrected
visual acuity of 0.1 logMAR or better in both eyes. A further three patients with
long-standing AMD were recruited. Patients had an age range of 60-81 years and a
VA of 0.3-0.82 logMAR in the tested eye.
4.1.1.1 SLO calibration
In order to quantify the amount of retinal movement from the fundus image
produced by the SLO in terms of visual angle, calibration was performed for three of
the young subjects. Two of the subjects were emmetropic and one myopic.
A supplementary monitor was used to perform this calibration as target separation
could be measured more precisely using this technique. A semi-silvered mirror was
placed in front of the SLO so that stimuli produced on a monitor could be viewed on
the same visual axis as the SLO. Two targets of known angular separation were
presented on the computer monitor and the subject was instructed to alternate
fixation between the two points. Simultaneously, fundus images were captured from
the SLO. Software designed in-house by E. Dinu tracked retinal landmarks whilst
the video was replayed and recorded eye position (in two dimensional pixel co
ordinates) in relation to the first frame at a frequency of 12.5Hz. The movement of
the retinal image between these two fixation positions was calculated for each
subject and the distance recorded in image pixels. As the two points on the video
monitor are of known angular separation, a simple transformation can describe
retinal motion seen on the video image from the SLO in terms of visual angle.

M.D. Crossland. Chapter 4: Validation of novel methods.
4.1.1.2 Measurement o f fixation stability with the SLO
A red fixation cross of height 2.5° was produced in the SLO raster using the SLO’s
scotometry module. The subject’s head was restrained with a chin and forehead rest,
their left eye was occluded and the right eye was examined. Subjects were asked to
fixate the centre of the cross for three separate periods of ten seconds, with timing
commencing from apparently stable fixation following a blink. In between each 10
second block, subjects were asked to sit back, blink and then reposition themselves
on the SLO, When ten seconds of clear, blink-free data were not obtained, the trial
was repeated. Fundus images were recorded continuously throughout the trials on
the digital video recorder.
4.1.1.3 SLO data collection
Retrospective analysis of the video tape was made using the software developed in-
house with functions supplied with a video board (Orion Frame Grabber, Matrox,
Montreal, Canada). This software provides x- and y- axis position of the eye in
terms of pixels. The conversion factor found from the calibration stage was used to
calculate eye position in terms of degrees of visual angle. A BCEA was produced
for each trial using the formula described in section 3.2. The mean of three BCEAs
was calculated.
4.1.1.4 Eyetracker calibration
Calibration, drift correction and validation were performed using algorithms
supplied by the manufacturers of the gazetracker. Only trials where the calibration
was categorised as “good” by the Eyelink software were included. Although the
eyetracker can measure both eyes independently and simultaneously, the left eye
was again occluded in all trials to ensure similarity of testing in each condition.
4.1.1.5 Measurement o f fixation stability with the eyetracker
Fixation stability was recorded using a red cross target of height 2.5° against a dark
background. With the exception of the different target, fixation stability was
recorded as described in section 2.5.2.2. Patient instruction was identical to that in
the SLO condition. Measurements with the eyetracker and SLO were performed in
counterbalanced order. Data were cleaned using the Matlab program described in

M.D. Crossland. Chapter 4: Validation of novel methods.
section 2.5.2.1 and the mean BCEA for three trials was recorded.
4.1.2 Results
A strong linear relationship exists between fixation stability measurements made
with both instruments for control subjects (r=0.89, n=6) and for patients (r=0.99,
n=3).
Patient initials Group Mean SLO BCEA (m inarc2)
M ean ET BCEA (m inarc2)
MC Control 235 687ED Control 113 526PB Control 331 766AC Control 418 736SK Control 555 892GH Control 623 1 272RS Patient 7 040 8 257KD Patient 823 1 023MA Patient 9 370 13 125Table 4.1. Fixation stability measured for patients and control subjects using the SLO and gazetracker. BCEA: Bivariate contour ellipse area. ET: Eyetracker.
Figure 4.1 displays the results for the subjects without macular disease.
1600
1400cr
1200
1000
800
600
400700600500300
SLO BCEA (min arc squared)
400100 200
Figure 4.1. Mean BCEA measured by each instrument for the six subjects without AMD. Line fitted using least squares regression. Vertical error bars show ±1 standard deviation. ET: Eyetracker.
BCEAs recorded with the SLO were smaller than those measured by the eyetracker,
on average by a factor of 2.13 times.

M.D. Crossland. Chapter 4: Validation of novel methods.
4.1.3 DiscussionThis control study has shown that there is a high correlation between fixation
stability measurements made with our eyetracker and the SLO; individuals who
exhibit poor fixation stability when tested with a scanning laser ophthalmoscope also
have poor fixation stability on the eyetracker.
BCEAs for the eyetracking technique were consistently larger than for the SLO
condition. In the SLO, the patient’s head is secured against a chin and forehead rest
and any significant movement of the head interferes with obtaining an image of the
retina. Therefore, data are not recorded during or after head motion. In contrast, the
eyetracker is used without any head support. Although the eyetracker software will
compensate for head movements so that a true gaze position (rather than an eye
position) is recorded, there will still be more retinal motion when a head moves
compared to when it is rigidly fixed due to inefficiency in the vestibulo-ocular reflex
(Steinman et al., 1982; Carpenter, 1988). There are two factors contributing to the
increase in head motion: first, subconscious head tremor would be increased without
the stabilisation of the forehead and chin against the supports on the SLO and
second, subjects are more likely to make small, conscious head movements when it
is unsupported. Further, there is a feedback mechanism to the investigator when
using the SLO: if the retinal image is lost on the SLO display screen due to head
motion then the trial will be discarded and repeated.
The larger BCEAs produced could also be caused by eyetracker errors in the
algorithm used to correct for head movement. Another source of error could be
movement between the eyetracker headband and the forehead of the subject,
although in earlier control experiments we did not find a difference in BCEA when
subjects wore a silicone swimming cap to reduce this slip. The eyetracker software
has more degrees of freedom for measuring eye movement whereas with our SLO
program rotational motion could be erroneously recorded as small translational
movements. A previous comparison of the difference in fixation stability between
complete head immobilisation using a dental bite-board and a free-head condition
found an increase of 2-4 times in each dimension (i.e. a 4-16 x increase in BCEA)
(Steinman et al., 1982). The increase of around 2 times BCEA found in the present

M.D. Crossland. Chapter 4: Validation of novel methods.
study would therefore be expected in a comparison between less rigid head
immobilisation (head and chin rest) and the free-head situation.
The sampling rate of the eyetracker is much higher than the SLO. In order to
ascertain whether this made any difference to the size of the BCEA, three eyetracker
data files were undersampled (by retaining every twentieth line of data but
discarding all others) and the BCEA was recalculated. In each instance the BCEA
of the undersampled data was comparable to that of the full data set (for full data
sets 833,699 and 1191 minarc2, for one twentieth of those data 907, 707 and 1187
minarc2 respectively).
A systematic difference has not been found in the repeatability of measurements
with each machine. However the relatively high test-retest variability of
measurements with both instruments (~ 20% of the mean value) is a cause of some
concern. Large between-trial variability has been noted in similar experiments
before; Snodderly and Kurtz even found that subjects’ fixation stability improved
when a wager involving a milkshake was incorporated into the experimental design
(Snodderly & Kurtz, 1985). Artefactual eye position errors can be caused by a
number of factors such as blinking, accommodative change (which degrades the
quality of the SLO image) and in the case of the eyetracker, wearing mascara or
other eye make-up. Careful analysis of data is required to remove frames which
display these artefacts before BCEAs are calculated.
A major limitation of the eyetracker is that in patients with scotomas, an eyetracker
can only indicate the direction in which the retinal locus for fixation is pointing - not
the actual position of the image on the retina. The only way to accurately determine
retinal image position is to simultaneously image the retina. At present this is
something which is only possible with the scanning laser ophthalmoscope.
4.1.4 Conclusion
Despite the important limitation described in the last paragraph, the eyetracker is a
suitable instrument for the measurement of fixation stability in this experiment. The
major reasons for the selection of the eyetracker over the SLO are the increased

M.D. Crossland. Chapter 4: Validation of novel methods.
variety of targets which can be displayed and the fact that fixation stability and other
aspects of visual behaviour can be assessed simultaneously.
The SLO still has a critical role in this study: only with this instrument can the
retinal area or areas used for fixation be determined.
4.2 The kernel density estimator and EM algorithm**
4.2.1 Method
The KDE and EM algorithm described in section 3.3 have been applied to the data
sets of eight patients with macular disease. One (AP) had Stargardt disease and
seven had AMD. Fixation stability assessment was performed as described in
section 2.5.2.1.
A “global” BCEA was calculated in the manner already described. Following this,
the KDE was applied to the data. Where the KDE indicated the existence of
multiple PRLs, the EM algorithm was run to determine the parameters of these
individual loci. The sum of these “local” BCEAs was calculated and compared to
the “global” BCEA.
Repeatability of the techniques was assessed by repeating the analysis on a different
data set from the same patient.
4.2.2 Results
In five patients, the KDE indicated the presence of multiple loci of fixation. In each
of these patients the sum of the local BCEAs was less than the global BCEA, being
on average 58% of the size. Figure 4.2 shows the raw data and kernel plots for these
patients, table 4.2 shows the summarised data from all patients and table 4.3
indicates the properties of the local BCEAs for those patients with multiple PRLs.
** This work has been accepted for publication in Vision Research. A reprint of the paper can be found in Appendix 4.

M.D. Crossland. Chapter 4: Validation o f novel methods.
RS
25 -
-20•0 - 2 5 -
0-50
-20 o :
X decentration (min arc)
4 0-20 DX d ec e n tra tio n (min a rc )
-6 0 -40-60 -40
KB£ 2 0 -
%„ 3 0 ■Otoa 20 ' E
o 10 * toC o • <u o <D
> • 1 0 '
-6 0 -40 -20 0
X decentration (min arc)
-6 0 -4 0 -2 0 0
Xdecentration (min arc)
FGJ0j
® 2 0 -
I9 ° 'ttfaS -20 •STO> -4 0 -
-6 0 ■
s 4 0 ‘toI 2 0 ■ ^ 09 0 ' 0
i.............. i i ■■ i i ■
I -2 0 'oOJV -4 0 ■
-6 0 •
-6 0 -4 0 -20
X decentration (min arc)
20
X decentration (m inarc)
ro 10
Xdecentration (min arc)
-20 0 20
X decentration (min arc)

M.D. Crossland. Chapter 4: Validation of novel methods.
fTB20 -
1 0 -
2 0 *0
V -
<D
i 15 *
g
i 10 •c
( ^ ^ p )
* . ■ > - s
T " ' " 1 ----- > ,
-20
AP
8 0 -
TD - 5 .
- 1 0 -
-10 0 X decentration (min arc)
-20 -15 -10 -5 0
_____________X decentration (min arc)
V . .
-5 0 5
Xdecentration (mm arc)
10
15 0■E
-10
-10 -5 0 5 10
X decentration (min arc)
HP3 0 -
a 20-c1C 10-
J
— 1—
-10X decentration (min arc)
30
20
> -10
-20 -10 0
X d ecen tration (min a rc)
Figure 4.2. Data sets and kernel plots for patients (also previous page).
Patient Global BCEA (m inarc2)
n PRL Llocal BCEAs (m inarc2)
RS 15 900 2 7 950KB 3 170 2 2 340FG 12 700 3 9 270DP 21 700 3 9 240TB 1 770 1 1 770AP 1 150 1 1 150KD 6 340 2 3 260HP 2 160 1 2 160Table 4.2. Summarised data for all eight patients.

M.D. Crossland. Chapter 4: Validation of novel methods.
Patient P R L # P BCEA (min arc2)
RS 1 0.78 52602 0.22 2690
KB 1 0.50 9662 0.47 1370
FG 1 0.64 22202 0.20 39503 0.16 3100
DP 1 0.36 24002 0.31 25003 0.22 4340
KD 1 0.63 22502 0.37 1010
Table 4.3. Parameters of the PRLs for each patient with multiple PRLs. P=proportion of trial for which PRL is being used.
4.2.2.1 Repeatability
For six patients, the analysis was repeated on another fixation trial using the same
target and conditions. Unfortunately repeat data were not available for patients DP
and AP. Table 4.4 illustrates the repeatability of the technique for the two trials for
these five subjects. In one case there are a different number of PRLs elicited: for
patient FG there are three PRLs in the first trial and only two in the second. The
sum of local BCEAs was found to be similar between the two trials (mean difference
= 23%, standard deviation = 7%).
Subject N um ber of PRLs Elocal BCEAs (m inarc2)
T rial 1 Trial 2 T rial 1 T rial 2
RS 2 2 7950 9759
KB 2 2 2340 3259
FG 3 2 9270 7267
TB 1 1 1770 1556
KD 2 2 3260 2873
HP 1 1 2160 1736
Table 4.4. Comparisons in the number of PRLs and the sum of local BCEAs foundfor two different trials and applications of the statistical procedure.
4.2.3 Discussion
This control study indicates that the statistical techniques described in chapter 3 are

M.D. Crossland. Chapter 4: Validation of novel methods.
repeatable in finding the number of PRLs and the sum of the local BCEAs. Many
patients display multiple PRLs as defined by this statistical paradigm. Analysis of
such patients’ fixation data using a global, unimodal BCEA would be inappropriate
as the statistical assumption of normality would no longer be valid.
It is perhaps surprising that some of the patients display two or even three loci over a
relatively short fixation trial. Other authors have found multiple PRLs only during a
complex task such as reading (Duret et al., 1999) or when luminance is changed (Lei
& Schuchard, 1997). However these previous studies have only defined PRLs as
being separate when they are very well separated, and no quantitative technique was
used. The findings of the current study agree with those of Whittaker, who reports
that 39% of patients exhibit multiple PRLs (Whittaker et a l, 1988).
Unfortunately, as the absolute position of fixation is not known when using the
eyetracker, it is not possible to know where the multiple PRLs lie with respect to the
lesion. Simultaneous eyetracking and fundus imaging would solve this difficulty.
This technique is discussed further in chapters 13 and 14.
4.2.3.1 Limitations o f the KDE
The selection of the window width is critical in determining the number of PRLs
present. By changing the window width, data can be over- or undersmoothed,
giving the impression of more or fewer PRLs being present. An example of
changing the window width on one data set is given in figure 4.3. Although the
window widths used have been suggested by another group (Bowman & Foster,
1992), further research is required to confirm that this window width is ideal.
For this longitudinal study this limitation is less significant; even if the assessment
of the number of PRLs is too conservative or too liberal, changes in the number of
PRLs can be observed.

M.D. Crossland. Chapter 4: Validation of novel methods.
40a.
2 0 -
I o-G§-20 HT)>
-40
>- -40
*
TT 40
1 1 1 1 1 1--60 -40 -20 0 20 40 60
X decentration (min arc)-60 -40 -20 0 20 40 60
X decentration (rrin arc)
-60 -40 -20 0 20 40 60
X d ecen tra tio n (min arc)
80 *60 -40 -20 0 20 40 60
X d ecen tra tio n (min arc)
80
E 20 . = 20
80
Figure 4.3. The effect of changing the window width on the KDE. a: raw data, b: window width set to “ideal” width, c: window width set to 0.75 times the “ideal” width, d: window width set to 1.5 times the “ideal” width.
4.2.3.2 Limitations o f the EM algorithm
Local maximum problems can cause the loci calculated by the EM algorithm to
correspond poorly to the kernel plots in some circumstances. For this reason, the
program was run many times on each data set with random start points and the
results were always compared to the KDE plots.
A very large PRL used for a very short proportion of the trial was identified in some
trials which encompassed all of the other loci. Ad hoc data analysis revealed that the
eye was not drifting or fixating at these times but was moving in random direction at
a speed below our cut-off velocity for a saccade. Consequently PRLs which are
used for <10% of the time have been removed.
4.2.4 Conclusion
The statistical techniques described in chapter 3 are novel and have not previously

M.D. Crossland. Chapter 4: Validation of novel methods.
been applied to the analysis of fixation. The KDE and EM algorithms give
repeatable results within patients at the same visit.

97
Chapter 5: Characteristics of patients at baseline and results for control subjects
Three analyses are presented in this chapter. First, a profile of the demographic and
clinical features of all the patients and control subjects at their initial (baseline) visit
to the laboratory is described. Comparisons are made between the patients and the
age-matched control subjects, and differences in clinical features between patients
with JMD, geographic atrophy and exudative AMD are identified.
The second part of this chapter investigates the performance of control subjects at
baseline and at their 12 month visit to determine any improvement which can be
attributed to practice or learning effects.
Finally, reading speed characteristics for patients at baseline have been assessed to
determine the magnitude of a statistically significant change in reading speed
between visits.
5.1 Comparison of patients and control subjects
5.1.1 Specific methodsIn general, Student’s t-test has been used to determine differences between groups.
However, for some parameters, the variance amongst the patient group is greater
than that within the control group. O’Brien’s test can quantify the difference in
variance between two populations (Howell, 1997a). When the variances are found
to be significantly different then an alternative method is required to analyse
differences. In this chapter the Welch test was used to assess significance between
groups (Howell, 1997b) where variances were unequal.
5.1.2 Demographic features
Demographic features of patients and control subjects can be seen in table 5.1
below. A full description of each patient can be found in appendix 1.

M.D. Crossland. Chapter S: Baseline characteristics and results for control subjects. 98
There was no statistical difference in age between the disease and control group for
either older or younger participants (Student’s t-test, older group: p=0.79; younger
group: p=0.82).
AMDgroup
O ldercontrolgroup
JM DG roup
Youngercontrolgroup
N 20 5 5 3M ean ±sd age a t 75.2 74.0 29.2 31.0recruitm ent (years) ±9.3 ±3.7 ±12 ±6.2Male:female ratio 7:13 2:3 2:3 2:1Table 5.1. Demographic features of patients and control subjects.
5.1.3 Clinical features of AMD patients and older control subjects
The results are described below and are summarised in table 5.2.
Mean distance visual acuity at baseline was 0.66 logMAR for subjects with AMD.
This is significantly reduced from the values for the age-matched control subjects
(VA for control subjects: 0.05 logMAR; p<0.01). Near visual acuity was similarly
reduced from N4 in the control group to a mean of N 14 in patients (p<0.05). In
patients, a linear relationship exists between distance and near VA (r = 0.77,
p<0.0001).
Contrast sensitivity was significantly impaired (p<0.01), from a mean of 1.60 in
normals to 1.15 in patients. Contrast sensitivity was found to correlate with visual
acuity in this age-group (r= -0.56, p<0.01).
Size of the absolute scotomas in the patient group ranged from 0.5 to 5 disc
diameters (mean 1.5, sd=1.4). Although there is a trend for patients with larger
scotomas to have poorer visual acuity, this relationship does not reach significance
(i^=0.36, p>0.1).
Suprathreshold reading speed is reduced in patients, from a mean of 175
words/minute in subjects without macular disease to 82 wpm in those with AMD
(p<0.0001).

M D. Crossland. Chapter 5: Baseline characteristics and results for control subjects.
Param eter AMD patientsmean value
(±sd)
O lder control subjects
mean value (±sd)
Significance
Visual acuity (logMAR) 0.65 ±0.21 0.05 ±0.05 <0.01*Contrast sensitivity 1.15 ±0.22 1.62 ±0.067 <0.01*Reading speed (words/minute) 83 ±36 182 ±22 <0.05*Table 5.2. Performance of AMD patients at baseline. * P values calculated by Student’s T-test. NS: Not significant.
5.1.4 Clinical features of JM D patients and younger control subjects
The patients with JMD also exhibited impaired in visual acuity and reading speed
when compared to age-matched control subjects. However, contrast sensitivity was
not significantly reduced in patients with JMD when compared to the younger
control subjects (table 5.3).
Param eter JM D patientsmean value
(±sd)
Younger control subjects
mean value (±sd)
Significance
Visual acuity (logMAR) 0.70 ±0.24 -0.13 ±0.06 <0.01§Contrast sensitivity 1.08 ±0.72 1.80 ±0 NSReading speed (words/minute) 91.3 ±47 212 ±12 <0.05 §Table 5.3. Performance of JMD patients at baseline. * P values calcu ated byStudent’s T-test. § F value calculated by Welch test (accounting for heterogeneity of variances). NS: Not significant.
5.1.5 Clinical features and the type of m acular disease
Fifteen of the patients in this study (60%) suffer from exudative AMD, five (20%)
have geographic atrophy and five (20%) have juvenile macular disease. There are
no differences between these three groups of patients in terms of visual acuity
(ANOVA, F(df=2 ,24)=0.29, p=0.75), contrast sensitivity (F(df=2 ,24)=0-ll, p=0.90) or
scotoma size (F(df=2,24)=0 -73, p=0.49). These data are illustrated in figure 5.1.

M.D. Crossland. Chapter 5: Baseline characteristics and results for control subjects. 1 0 0
3.5
3
2.5
2
1.5
1
0.5
0Visual acuity Contrast sensitivity Scotom a size
Figure 5.1. A comparison of clinical features between the three types of macular disease. Units: Visual acuity: logMAR; Contrast sensitivity: log units; Scotoma size: disc areas.
There is also no difference in suprathreshold reading speed between these three
diagnoses (ANOVA, F(df=2,23>=0.52, p=0.60).
5.1.6 Discussion
As expected, a significant reduction in performance on clinical tests is found for
patients with macular disease. The correlation between visual acuity and contrast
sensitivity found in this study (r = -0.56) is very similar to previously reported
figures from the much larger Salisbury Eye Evaluation study (n = 2520, r = -0.59,
(Rubin et al., 1997)), amongst others (Rubin et al., 1993; Elliott & Situ, 1998;
McClure et al., 2000).
There is an over-representation of patients with exudative AMD in this study; only
10% of people with AMD suffer from the exudative form of the disease but more
than half of the patients recruited in this study have this diagnosis. One reason for
this is the inclusion criterion requiring patients to have experienced a sudden onset
of symptoms. This is characteristic of the development of a new lesion in exudative
AMD. Those patients with geographic atrophy who were recruited suffered from a
sudden increase in scotoma area or a sudden loss of central vision, causing a sudden
■ Exudative AMD
■ Geographic AMD
$ JMD

M.D. Crossland. Chapter 5: Baseline characteristics and results for control subjects.
drop in visual acuity. It is interesting to note that there are no differences in scotoma
size, visual acuity, contrast sensitivity or reading speed between these two groups of
patients with AMD.
Younger control subjects displayed better visual acuity and contrast sensitivity than
the older control subjects (t-test, p<0.05). Age-related decline in visual acuity and
contrast sensitivity is well documented (e.g.(Rubin et a l , 1997)). Contrary to
previous research (Akutsu et al., 1991), the older control subjects read more slowly
than the younger controls (p<0.05). The small number of control subjects assessed
in this study, particularly in the young group, makes it difficult to draw any firm
conclusions from these results.
5.1.7 SummaryPatients with newly presenting macular disease have severely impaired visual acuity,
contrast sensitivity and reading speed when compared to age-matched subjects
without macular disease. There are no differences in clinical features between
patients with wet AMD, dry AMD and juvenile macular disease.
5.2 Change in control subjects* performance over twelve months
To investigate the possibility of a learning effect confounding results found for the
patient group, control subjects’ performance was assessed twice, with an interval of
twelve months between the visits.
5.2.1 Specific method
Data for the young and older control subjects have been pooled for these
calculations. A repeated measures analysis of variance has been performed for each
variable, to determine any change between the baseline and 12-month visit for any
parameter.
A full definition of all of the parameters described in this section can be found in the
methods section and the relevant results chapter of this thesis.

M.D. Crossland. Chapter 5: Baseline characteristics and results for control subjects. 102
5.2.2 Results
As table 5.4 illustrates, there are no significant differences in performance at
baseline and at one year amongst the control subjects.
Param eter Baselinemean value
One yearMean value
P
Visual acuity (logMAR) -0.03 -0.04 0.50Contrast sensitivity 1.69 1.72 0.28Fixation stability (minarc2) 1,320 1,270 0.82Saccadic efficiency (n saccades) 1.75 1.73 0.66Saccadic latency (msec) 174 162 0.62Peak saccadic velocity (°/sec) 460 501 0.30Number of saccades to read a sentence
7.89 7.91 0.95
Proportion of regressive saccades
7.39% 7.94% 0.62
Number of saccades to find the start of a line
1.23 1.20 0.57
Fixation duration (msec) 397 406 0.62Reading speed (words/minute) 199 193 0.19Table 5.4. Differences in performance between baseline and one-year follow-up visit for control subjects.
5.2.3 Discussion
There is no evidence of any training or practice effect between the first visit and an
assessment twelve months later in the control subject group. As patients are
assessed more frequently than the control subjects there is a chance that some effects
of practice may be present which are not apparent by this examination of the control
subjects. The design of this study has attempted to minimise the chance of learning
effects by providing practice trials at each visit so that patients can refamiliarise
themselves with the task and by not repeating charts or text at consecutive visits.
5.3 Determination of a statistically significant change in reading speed
In order to determine a statistically significant change in reading speed, a test for the
variability of reading speed within one session is required (Bland & Altman, 1996b;
Bland & Altman, 1996a). As the time taken to read at least five suprathreshold
sentences (without errors) was recorded at each visit, a measure of the standard

M.D. Crossland. Chapter 5: Baseline characteristics and results for control subjects.
deviation of reading speed can be made for each subject at each visit.
53 .1 Specific methodThe standard deviation of reading speed for each patient was recorded at the baseline
assessment. As the size of the standard deviation was proportional to the mean, the
coefficient of variability (COV) was calculated for each patient, being (Howell,
1997c):
Coefficient of variability = Standard deviation of reading speedMean reading speed
The mean and 95% confidence intervals of the coefficient of variability were
calculated and were used to determine the limits for significant changes at later
visits.
5.3.2 ResultsA strong linear relationship exists between the standard deviation in reading speed
and the mean reading speed, with larger values having a larger standard deviation
(linear regression; r= 0.69, p<0.001; figure 5.2). This difference can be eliminated
by calculating the coefficient of variability (linear regression against mean reading
speed; r = 0.17, p=0.50; figure 5.3).
The mean COV was 0.14, (95% Cl: 0.03 to 0.27). These values are shown on figure
5.3 as a solid horizontal line and two broken horizontal lines.
The upper 95% confidence limit can be used to define clinically significant change
between visits (Bland & Altman, 1996b), so an improvement (or deterioration) of
27% in between visits will be determined as significant.

M.D. Crossland. Chapter 5: Baseline characteristics and results for control subjects.
50
S 40"a)o .COD>cS 3 0 -oco
>a;T3■ak_
2 0 -
3T3croCO IQ -
20 40 60 12080 100 140
Mean reading sp eed (words/minute)
Figure 5.2. Standard deviation of reading speed plotted against mean reading speed at baseline for patients. Line shows linear regression.
0.5
0.4
c 0 .3 -
£ 0.2 © o o
0.1 -
20 40 60 80 100 120
M ean reading sp eed (words/minute)
140
Figure 5.3. Coefficient of variability plotted against mean reading speed at baseline for patients. Solid line shows mean value, broken lines 95% confidence interval.

M.D. Crossland. Chapter 5: Baseline characteristics and results for control subjects.
The technique described above makes the assumption that the variance in reading
speed at baseline is greater than or equal to the variance subsequently. To ensure
that this assumption is correct, the COV in reading speed was calculated at baseline,
one month, three months, six months and twelve months for five randomly selected
patients. Linear regression indicated a decline in COV at each subsequent visit (r = -
-0.59, p<0.05). Further, COV did not increase from the baseline value for any
subject.

106
Chapter 6: The location of the PRL and awareness of its useSection 1.3 of the introduction to this thesis discussed the preferred retinal locus
(PRL) and its function in macular disease. The development of the PRL is a major
part of the adaptive process of patients with central scotomas. This chapter will
assess some aspects of the development of the PRL.
The first section of this chapter discusses the position of the PRL. Previous research
based on longitudinal studies has indicated that there is no systematic location for
the PRL (e.g. (Sunness et al., 1996; Fletcher & Schuchard, 1997)) and that PRL
position is not related to reading speed (Fletcher & Schuchard, 1997). It has been
suggested that the location of the PRL will change as patients adapt to their central
scotoma. The results in this chapter are the first to assess any change in the PRL
location in a longitudinal manner.
The second part of this chapter investigates the point at which patients lose
awareness of using the PRL; that is when they report that they are looking directly at
a target even when using an eccentric PRL. This adaptation was first described by
von Noorden more than 4 decades ago (von Noorden & Mackensen, 1962). More
recent work by White and Bedell (1990) and Schuchard (1992) found that this
adaptation had been made in 86% and 91% (respectively) of patients with
established macular disease. This chapter presents data which describe the length of
time which it takes for patients to develop this strategy. The benefit of this
adaptation is assessed with respect to suprathreshold reading speed.
This chapter will address two parts of hypothesis 1, which state:
“after scotoma development, patients will develop a consistent PRL” and “patients
will lose awareness of the use of the PRL”. Hypothesis 4, that reading performance
will improve in tandem with the development of adaptive strategies, will also be
considered in this chapter.
Raw data for this chapter can be found in appendix 1, under section A 1.6.

M.D. Crossland. Chapter 6: PRL location and awareness of its use 107
6.1 The location of the principal PRL
6.1.1 Specific methods
The SLO was used to determine the habitual fixation location when fixating a
central cross-shaped target, as described in the methods chapter (section 2.5.1).
Briefly, patients are asked to observe a central cross target of 2.5° height presented
in the centre of the SLO raster for a period of 30 seconds. All sessions were
recorded on digital video.
As subjects without MD use central fixation under all circumstances, control
subjects are not considered in this chapter.
6.1.2 Results
6.1.2.1 Location o f the principal PRL at baseline
The location of the principal PRL at the baseline assessment for all 25 patients can
be found in table 6.1. Five patients displayed central fixation; three of these used a
central “island” of residual vision in an area of geographic atrophy and two had
juvenile forms of macular disease with paracentral scotomas. O f the 20 patients who
used an eccentric PRL, 14 (70%) shifted their fixation horizontally and 6 vertically.
PRL location was not dependent on the type of disease: two JMD patients had
central fixation, one had a PRL to the left of the scotoma, one had a PRL below and
one used a PRL above their scotoma. This distribution of locations is similar to that
for AMD patients (table 6.1).
Patients who maintain central fixation have a significantly better visual acuity than
those with an eccentric PRL (p<0.01). There are no other relationships between
PRL location and visual acuity, contrast sensitivity or scotoma size.
Location of principal PRL (in visual field w rt scotoma)
Number (% ) of patients M ean (sd) reading speed (words/minute)
Below 3 (12%) 82 (49)Left 6 (24%) 91 (36)Right 8 (32%) 86 (37)Above 3 (12%) 60(49)Central 5 (20%) 74 (50)Table 6.1. Location of principal PRL at baseline, wrt: with respect to.

M.D. Crossland. Chapter 6: PRL location and awareness o f its use
Reading speed is approximately equal between the five groups at the baseline
assessment (figure 6.1). There are no significant differences between the five PRL
locations in terms of reading speed (ANOVA, F(df=4,24)=0.32, p=0.86).
The theoretically optimum PRL location of placing the PRL below the scotoma in
visual field space (described in section 1.3.2.1) was used by three patients at
baseline. Patients using this “optimum” PRL location read no faster than those 22
patients using another location (mean “optimum” = 82 words/minute; mean “not
optimum” = 81 words/minute, p>0.9).
120
100 -
Below Left Right Above Central
Location of principal PRL (wrt scotom a, in visual field sp a ce)
Figure 6.1. Mean reading speed at baseline for each patient, grouped by location of the principal PRL. Error bars show 1 standard deviation.
6.1.2.2 Location o f the principal PRL at exit point
Table 6.2 describes the location of the principal PRL at the exit point from the study.

M.D. Crossland. Chapter 6: PRL location and awareness o f its use 1 0 9
Location of principal PRL
N um ber (%) of patients M ean (sd) reading speed (words/minute)
Below 9 (36%) 75 (27)Left 11 (44%) 65 (43)Right 5 (25%) 88 (31)Above 0 -
Central 0 -
Table 6.2. Location of principal PRL at exit point from study.
By the exit point of the study, over half of the patients had changed the location of
their principal PRL location. However, there was still no significant difference in
reading speed between the three PRL locations (ANOVA, F(df=2,24)=0.67, p=0.52).
Figure 6.2 illustrates the reading speed for each PRL location at exit from the study.
120
100 -
Below Left Right
Location of principal PRL (wrt scotom a, in visual field sp ace)
Figure 6.2. Mean reading speed at exit for each patient, grouped by location of principal PRL at exit. Error bars show standard error.
There is no difference in visual acuity, scotoma size or disease type between patients
who use a PRL in each of these three locations (ANOVA; VA: F(df=2,24)=L27,
p=0.30; Scotoma size: F(df=2,24)=0.57, p=0.57; Disease type: x2= 5.79, p =0.06).
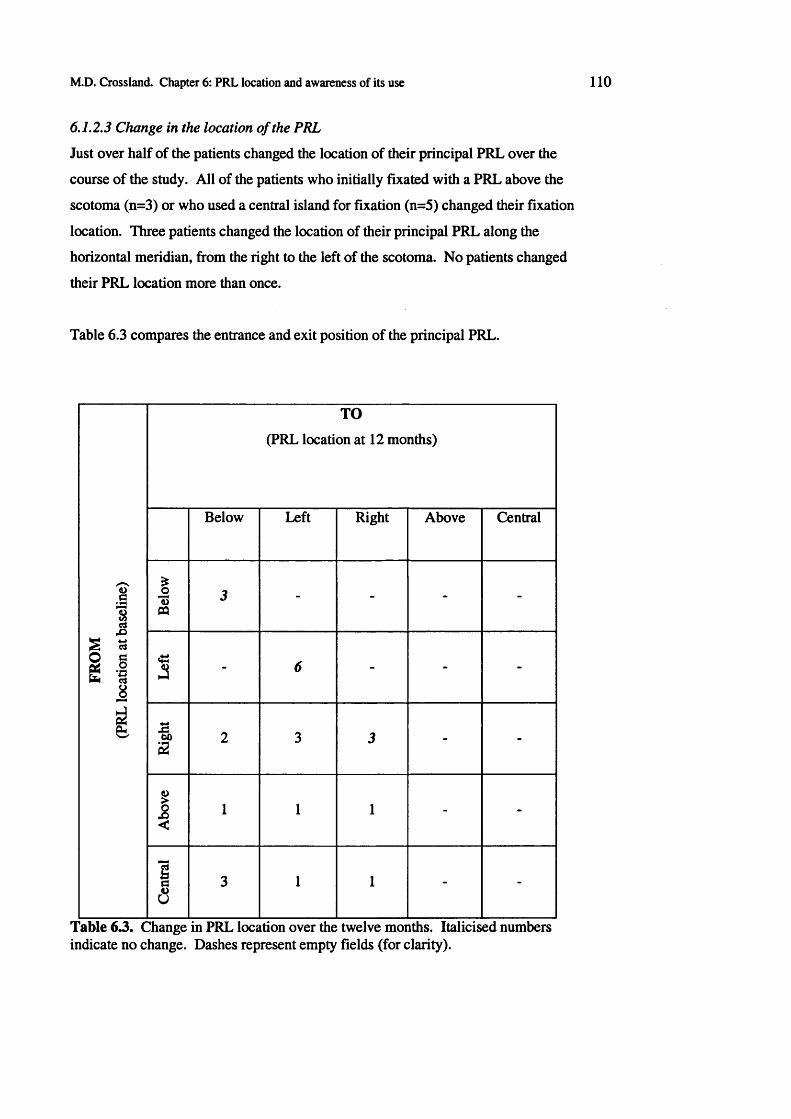
M.D. Crossland. Chapter 6: PRL location and awareness of its use
6.1.2.3 Change in the location o f the PRL
Just over half of the patients changed the location of their principal PRL over the
course of the study. All of the patients who initially fixated with a PRL above the
scotoma (n=3) or who used a central island for fixation (n=5) changed their fixation
location. Three patients changed the location of their principal PRL along the
horizontal meridian, from the right to the left of the scotoma. No patients changed
their PRL location more than once.
Table 6.3 compares the entrance and exit position of the principal PRL.
FRO
M
(PRL
loca
tion
at ba
selin
e)
TO
(PRL location at 12 months)
Below Left Right Above Central
Bel
ow 3 - - - -
Lef
t
- 6 - - -
Rig
ht
2 3 3 - -
Abo
ve
1 1 1 - -
Cen
tral
3 1 1 - -
Table 6.3. Change in PRL location over the twelve months. Italicised numbers indicate no change. Dashes represent empty fields (for clarity).

M D . Crossland. Chapter 6: PRL location and awareness of its use
Changing PRL location over the course of this study was not related to scotoma size
(logistic regression, p=0.14), visual acuity (p=0.33), contrast sensitivity (p=0.64) or
whether patients had AMD or JMD (x2 test, p=0.69).
Although a change in PRL was more likely amongst patients who had a slower
reading speed at presentation, this result did not reach significance (p>0.20).
6.1.2.4 Change in PRL location and changes in reading speed
Interestingly, there was no difference in exit reading speed between patients who
changed their PRL (mean = 65 words/minute) and those who used the same PRL
throughout (mean = 76 words/minute; t-test, p=0.48).
Section 5.3 found a statistically significant change in reading speed to be ±27% of
the baseline reading speed. At the exit point of the study, reading speed had
improved by this amount in 5 patients (20%), remained stable in eleven patients
(44%) and deteriorated by >27% in 7 patients (28%). Changing PRL location did
not predict an improvement in reading speed (x2=0.25, p=0.61), or a deterioration in
reading speed (x2=0.20, p=0.65). The ratio of exit to baseline reading speed was
similar in patients who maintained the same PRL (ratio=0.90) and those who
changed their PRL (ratio=0.97; Student’s t-test, p=0.69).
6.1.2.5 Time to use the "final” PRL
For the thirteen patients who exhibited a change in PRL location, the point at which
the final (exit) PRL was first used was recorded. The median time was 12 weeks
(IQR: 8 - 26) and all patients used their exit PRL by the 26 week assessment.
The time to find the exit PRL was not affected by the type of macular disease
present (Wilcoxon rank test, p>0.1).
6.1.3 Discussion
The results described above are the first to describe the location of the PRL when
macular disease first develops, and to describe the development of the PRL location.
These results indicate that patients make this adaptation surprisingly quickly; half of
all patients already used their “final” PRL when they were first assessed, within

M.D. Crossland. Chapter 6: PRL location and awareness of its use
three weeks of the development of the scotoma. Amongst those patients who have
not started using their final PRL by at the start of the study, the median time to start
using their final PRL is only three months. Further, no patients change the location
of their principal PRL after their scotoma has been present for six months.
Although it is possible that some of these patients will make further adaptations in
the years following their scotoma development, the distribution of PRL locations
found at exit from this study is very similar to that found in previous cross sectional
studies (see section 1.3.2 and table 6.4). These findings indicate that, from the point
of view of PRL location, the selection of 12 months as an end point for this study is
appropriate.
PRL location Data from this study W eighted m ean of other published studies
Below 36% 37%Left 44% 34%Right 20% 18%Other - 11%Table 6.4. Principal PRL location at exit point from this and published cross- sectional studies.
PRL location does not appear to be associated with reading speed. This corroborates
earlier findings from other groups (Sunness et cd., 1996; Fletcher et al., 1999).
Although half of the patients changed the location of their PRL over the course of
this study, this shift did not systematically improve their reading speed.
It has been widely reported that patients rarely use a PRL above their scotoma
(Sunness et al., 1996; Fletcher & Schuchard, 1997; Fletcher et al., 1999). All of the
patients who used a PRL in this location at the baseline assessment subsequently
moved their fixation to a location either below or to one side of the lesion.
All of the patients who initially used a central PRL in an “island” of functioning
retina within their lesion switched to another retinal area, presumably one with a
larger field of view. These patients did not experience a large drop in VA (as this
would have lead to their exclusion from the study), which implies that the same
retinal location is likely to have been used throughout for the visual acuity
measurements. There is a large size difference between the observed targets for

M.D. Crossland. Chapter 6: PRL location and awareness of its use
these two tasks; a 0.51ogMAR (~6/12) letter subtends 15 minutes of arc, ten times
smaller than the 2.5° cross displayed on the SLO.
Whereas five patients who used a PRL to the right of the scotoma moved their PRL,
none of the patients who initially fixated with an area to the left of or below fixation
changed their PRL. This reinforces the opinion that using a PRL to the right is less
efficient than using a PRL to the left of the scotoma. The reasons for this are
unclear, although it must be remembered that only a very small proportion of the
time in daily living is spent reading or studying cross-shaped targets. It may be that
the use of a PRL to the left of the scotoma is of benefit for locomotion, face
recognition or other tasks not assessed here and that some functional benefit is
gleaned from this PRL shift.
A methodological problem which affects all research of this type is that the PRL is
being assessed during a fixation trial and not whilst patients are reading. It is very
difficult to know exactly which retinal area a patient is using when reading
conventional text on a SLO as a delay exists between seeing characters in a word
and reading the word aloud. This problem is particularly acute when multiple loci of
fixation are employed as current methods do not indicate which retinal area a patient
is attending to at any given moment.
A further methodological concern is that in the cases of patients with multiple PRLs,
the position of a minor PRL may have been recorded as the principal PRL location.
This error would lead to a PRL change being described when none existed. The
method was applied rigorously to ensure that this was not the case. In practice, as
the PRL location was recorded at the end of the microperimetry test (which lasts
about 6 minutes) patients routinely fixated with one retinal area. It was the location
of this area which was recorded. Further considerations for patients with multiple
PRLs will be discussed in the next chapter.
6.1.4 Conclusion
The location of the principal PRL used for fixation does not predict reading speed.
This finding reinforces the results of several other research groups. Although half of
the patients in the present study changed the location of their principal PRL over the

M.D. Crossland. Chapter 6: PRL location and awareness of its use
course of this study, this did not have a significant effect on their reading speed.
Patients do not change the location of their principal PRL after six months.
6.2 Awareness of PRL use
6.2.1 Specific methods
After the assessment of the principal PRL, patients were asked to move their eyes to
look straight towards the target as described in section 2.5.1.4 of the methods
chapter. Briefly, patients were asked to observe the central cross target under these
two verbal instructions:
1. “Please look at the red cross in the centre of the screen in front of you”
2. “Please move your eyes so that you are looking straight at the cross, even
if it disappears or becomes difficult to see.”
The two instructions were then repeated and the retinal image was digitized under
each condition.
As only one retinal image was used for analysis under each instruction, care was
taken to ensure that the point selected was within the centre of the locus used under
each condition. For the purposes of this experiment, if patients used the same retinal
area under each of the instructions then they were said to have pseudofoveated.
“Pseudofoveation” and “re-referencing of the oculomotor system” are used as
synonyms in this section.
6.2.1.1 Specific statistical methods
Kaplan-Meier survival analysis was performed with pseudofoveation, as described
above, being the outcome. Patients who did not pseudofoveate within twelve
months were censored.
6.2.2 Results
For one patient (AS) it was impossible to tell whether pseudofoveation had occurred
or not; she displayed very unstable fixation under all circumstances. She has
therefore been removed from the following analyses.
6.2.2.1 Pseudofoveation and disease type

M.D. Crossland. Chapter 6: PRL location and awareness o f its use
At the baseline assessment, two of the JMD patients (40%) and two AMD patients
(11%) used the same retinal area under both instructions above; that is, they had
already pseudofoveated. By the twelve-month follow-up visit, 11 of the AMD
patients (58%) and all five JMD patients had psuedofoveated.
The median time to pseudofoveate was 6 months for the AMD patients and one
month for the JMD patients. A survival plot, with pseudofoveation as the outcome
is shown in figure 6.3. The difference between these groups is highly significant
(Wilcoxon rank test, %2=9.4, p<0.01).
All of the patients who pseudofoveated over the course of this study did so by six
months. No patients went from having pseudofoveated to a state of non-
pseudofoveation.
1.0 0.9 0.8 0.7
|>0.6 | 0.5 co 0.4
0.3 0.2 0.1 0.0
0 1 2 3 4 5 6 7 8 9 10 11 12Tim e to pseudofoveation (m onths)
<-------- AMD group
M-------- JMD group
Figure 6.3. Kaplan-Meier survival plot for AMD and JMD patients, with pseudofoveation as the outcome.
6.2.2.2 Reading speed and pseudofoveation
Patients who have pseudofoveated read more quickly than those who have not. At
the exit point, those who have pseudofoveated read at 89 words/minute (sd: 35)
whereas those who have not made this adaptation read suprathreshold text at only 58
words/minute (sd: 33). This difference is statistically significant (Student’s t-test,
p<0.05).

M.D. Crossland. Chapter 6: PRL location and awareness of its use
To ensure that this difference was not due to the increased likelihood of
pseudofoveation and faster reading speed in the JMD group, the analysis was
repeated with stratification by the type of disease. This indicated that the type of
disease was not confounding the results.
Of the four patients whose reading speed improved by more than 27%, three (75%)
had pseudofoveated, whilst only three of the seven patients whose reading speed
deteriorated (43%) made this adaptation.
Reading speed appears to fall in patients who have not pseudofoveated; those
without pseudofoveation read at 79% of their baseline reading speed whereas the
mean reading speed for those who have pseudofoveated did not change. However,
this finding does not reach statistical significance (p>0.05).
6.2.23 Prediction o f pseudofoveation
Juvenile macular disease patients are more likely to pseudofoveate than patients with
AMD (x2 =6.3, p<0.05). There is no association between the likelihood of re-
referencing and either visual acuity (logistic regression, p=0.71) or contrast
sensitivity at baseline (p=0.22), or scotoma size (p=0.94).
There is no relationship between the PRL location at baseline or at exit and the
likelihood of pseudofoveation (logistic regression, baseline, p=0.83; exit, p=0.33).
There is also no difference in the likelihood of pseudofoveation between the groups
of patients who changed their PRL location (7/12 pseudofoveated) and those who
kept the same PRL location (7/12 pseudofoveated).
6.2.3 Discussion
Two-thirds of the patients seen in this study reached a state whereby awareness of
using the PRL was lost. This process is quicker and more likely to occur in patients
with juvenile forms of macular disease than in AMD patients. All of the five JMD
patients seen in this study pseudofoveated, as did all eleven JMD patients in the
study by White & Bedell (1990). The first description of pseudofoveation in this
way was reported in a patient with JMD (von Noorden & Mackensen, 1962).

M.D. Crossland. Chapter 6: PRL location and awareness of its use 117
Eleven of the nineteen AMD patients (58%) in the present study pseudofoveated
within twelve months of scotoma development. This proportion is similar to that
found by White and Bedell (7/10 AMD patients). The time since onset of scotoma
in White’s study ranged from 1 to 17 years so it appears that some patients never
make this adaptation. The similarity in the proportion of patients who
pseudofoveate between these studies makes it tempting to speculate that the patients
who have not made the adaptation by the exit point from this study are not likely to
develop this strategy of re-referencing their oculomotor system to the PRL in the
future. Whether training or any other intervention could encourage these patients to
pseudofoveate is beyond the scope of this thesis but will be discussed in the general
discussion chapter of this thesis.
Some patients had already developed a state of pseudofoveation at the baseline
assessment, within three weeks of scotoma development. There are no differences
evident between these patients and those who did not develop pseudofoveation so
quickly. If it were possible to assess patients with a shorter interval between vision
loss and baseline assessment, the point at which these four patients developed
psuedofoveation could be defined. Unfortunately, due to issues of informed consent,
medical retina assessment and laboratory time, this was not possible in the current
study.
Suprathreshold reading speed is faster in those patients who have pseudofoveated,
regardless of PRL location. Reading speed appears to be more likely to deteriorate
in patients who have not made this adaptation. This finding has relevance for the
development of training programmes for patients with macular disease; if patients
are encouraged to use an alternate retinal location (rather than the location which is
naturally chosen), awareness of PRL use would be greater. This would decrease the
likelihood of pseudofoveation and may be counterproductive. The development of
training programmes is discussed in chapter 14.
The most likely reason for the difference in reading speed in patients who have re-
referenced is that the saccades of patients who have pseudofoveated will be guided
to the PRL rather than to the scotoma. This hypothesis will be investigated further
later in the thesis.

M.D. Crossland. Chapter 6: PRL location and awareness of its use
Encouragingly, pseudofoveation does not appear to be dependent upon factors such
as visual acuity, scotoma size or reading speed at presentation. These results
indicate that even patients with very large scotomas (with dense scotoma of up of
five disc diameters area) may re-reference their oculomotor system to an eccentric
locus over time. Patient symptoms were not recorded during this study, therefore it
is not possible to know whether patients’ subjective performance is related to
pseudofoveation.
It is not clear from the these results whether pseudofoveation itself increases reading
speed or whether other factors which improve reading, such as modified saccade
control, in turn lead to re-referencing of the oculomotor system. The interaction of
all of the factors investigated in this thesis will be described in chapter 10.
For the present study, pseudofoveation has been defined as the stage at which
patients do not have awareness of the use of their PRL under monocular conditions.
However it is not clear whether this is an indication of complete re-referencing of
the oculomotor system. Performing an orthoptic test such as a cover test would
indicate whether the PRL is behaving as the centre of the oculomotor system in other
respects.
6.3 Summary of chapter 6
The key finding of this chapter is the discovery of the time it takes for patients to
develop their “final” PRL. Although several studies have suggested that PRL
development takes time, this project is the first to quantify how quickly the PRL
develops. The results in this chapter show that although some patients use the same
PRL from when their scotoma first develops, half of all patients subsequently adopt
a new location for their principal PRL. On average, this adaptation takes three
months and all patients adopt their final PRL within six months of scotoma
development. Changing the PRL does not appear to be beneficial in terms of
reading speed improvement.
No association is found between reading speed and the position of the principal

M.D. Crossland. Chapter 6: PRL location and awareness of its use
PRL. Although this finding may be intuitively surprising, it confirms previous
research by other groups.
This chapter has also discussed the phenomenon of pseudofoveation; that is, the lack
of awareness of PRL use. The results found in this experiment indicate that patients
who have no awareness of using a PRL read more quickly than those who are
conscious of not looking straight ahead when they are using their PRL. These
findings provide some reinforcement for the suggestion of White and Bedell (1990)
that, with time, some patients “(show) oculomotor behaviours qualitatively more like
those of normals, although centred about a nonfoveal locus.”
This chapter supports the parts of hypothesis 1 which state that “after scotoma
development, patients will develop a consistent preferred retinal locus” and that in
many cases “patients will lose awareness of the use of the PRL”.
Further aspects of the PRL are fixation stability and the number of PRLs used.
These phenomena will be examined in the next chapter.

120
Chapter 7: Fixation stability and the number of preferred retinal lociChapter 6 examined the development of the PRL in terms of its location and
awareness of its use. The first part of this chapter will investigate the stability of
fixation within this PRL and will relate fixation stability to reading speed. The
second part of this chapter will examine patients with multiple PRLs.
7.1 Fixation stability
7.1.1 Specific methodsFixation stability was assessed using the infrared eyetracker as described in section
2.5.22 and a BCEA was calculated for each target location using the formulae given
in chapter 3. Where multiple PRLs were determined by the KDE, the sum of local
BCEAs was calculated and recorded as fixation stability. The mean BCEA (or mean
sum of local BCEAs) for all locations was recorded and used for the analyses in this
chapter.
7.1.2 Results
All of the data used for this analysis can be found in section A 1.7, appendix 1.
7.1.2.1 Fixation stability
As BCEA values for patients were not normally distributed (Shapiro-Wilk test,
W=0.53, p<0.001), a natural log transform was performed to normalise them
(W=0.99, p=0.98).
The mean BCEA for control subjects was 1,614 minarc2 at baseline (sd=1,022) and
1,270 minarc2 (sd=574) at twelve months. For patients, mean logBCEA at baseline
was 9.04 log units (sd=1.16), and 9.00 log units at the exit from the study (sd=1.44).
These log values correspond to 8,433 and 8,103 minarc2 respectively. These values
are far poorer than those for control subjects (Student’s t-test, p<0.001 at entrance
and exit).

M.D. Crossland. Chapter 7: Fixation stability and the number o f PRLs
In patients, the size of the BCEA was not associated with visual acuity (at baseline, r
= 0.38, p = 0.1; at exit, r = 0.36, p = 0.1), contrast sensitivity (baseline r = -0.09, p =
0.62; exit r = -0.10, p = 0.74) or scotoma size (baseline r= 0.13, p = 0.54; exit r =
0.20, p = 0.38). Although patients with JMD showed more precise fixation than
those with age-related forms of macular disease, this finding did not reach
significance (Mean (sd) BCEA: JMD patients: 8.54 log minarc2 (1.23); AMD
patients: 9.19 log minarc2 (0.73); p = 0.14). In patients with AMD, the type of
disease was not related to fixation stability (p = 0.56).
7.1.2.2 Change in fixation stability
There is not a significant difference between fixation stability at entrance and exit
for patients (p = 0.69) or for control subjects (p = 0.40). Figure 7.1 illustrates the
lack of a systematic change in fixation stability in patients and control subjects.
13
12
11
10
9
8
7
6136 7 8 9 10 11 12
logBCEA at entrance
Figure 7.1. Fixation stability at entrance and exit. Control subjects shown as open boxes, patients as filled circles. Line shows y=x. n=30.
Improvement in fixation stability was defined by subtracting logBCEAexit from
logBCEAbaseiine (he. calculating the ratio of fixation stability at exit to that at
baseline, with positive values corresponding to an improvement in fixation stability).
The mean change in fixation stability was -0.07 (sd: 0.93). This indicates that, on

M.D. Crossland. Chapter 7: Fixation stability and the number of PRLs
average, fixation stability decreased by 7% over the course of the study. The large
standard deviation indicates that there is no systematic change in fixation stability.
This can be confirmed by visual inspection of figure 7.1; fixation stability improves
and deteriorates in a similar number of patients.
There was no difference in the magnitude of change in fixation stability between
patients with geographic atrophy (mean change -0.04), exudative AMD (mean
change -0.15) and those with juvenile macuiar disease (mean change 0.13; between
pairs t-test, p>0.05).
7.1.2.3 Reading speed and fixation stability
For control subjects, a negative correlation was found between BCEA and reading
speed at baseline assessment (r = -0.66, p<0.05). This indicates that control subjects
with poorer fixation stability read more slowly than those with smaller BCEAs.
In patients, there was a similar association between reading speed and BCEA at the
baseline assessment (linear regression, r= -0.46, p<0.05; figure 7.2). This
correlation was maintained at subsequent visits; at the exit point of the study the
correlation coefficient between fixation stability and reading speed was -0.51
(p<0.05).
150
<D3| 100- 78o
1<DQ.(AO)| 50-
<r
129 10 116 7 8Fixation stability (logBCEA)
Figure 7.2. Reading speed and fixation stability for all patients at baseline. Line shows linear regression. n=24 (excludes AP).

M.D. Crossland. Chapter 7: Fixation stability and the number of PRLs
7.1.3 Discussion
Fixation stability is significantly impaired in patients with macular disease. This
reinforces the findings of previous research (Culham et a l, 1993; Schuchard &
Fletcher, 1994; Rohrschneider et al., 1995). The level of this impairment in stability
is not related to the type of disease present, visual acuity, contrast sensitivity or
scotoma size. The observation of a very large inter-patient difference in the size of
the BCEA has been made previously by Culham, Fitzke, Timberlake and Marshall
(Culham et al., 1993).
It is perhaps surprising that there is no relationship between scotoma size and
fixation stability, as fixation is known to be less precise as eccentricity increases
(Sansbury et al., 1973), and a larger scotoma will lead to a more eccentric PRL
being used. However, this lack of correlation has been reported previously
(Timberlake et al., 1986; White & Bedell, 1990).
This is the first study to have examined the change in fixation stability immediately
after the development of a scotoma. These results do not show any systematic
change in fixation stability over the first twelve months after the onset of macular
disease in the second affected eye. In a cross-sectional study, White and Bedell did
not find a significant correlation between duration of disease and fixation stability
(White & Bedell, 1990).
In subjects without macular disease, fixation stability is related to suprathreshold
reading speed. Research on patients with impaired reading due to dyslexia has
suggested that fixation stability is a corollary of reading speed (see e.g. (Eden et al.,
1994)) and these results reinforce the opinion that more precise fixation stability is
associated with better reading ability.
In the presence of macular disease there is a weaker relationship between reading
ability and fixation stability. Although in a review paper Schuchard has suggested
that more stable fixation may be beneficial (Schuchard & Fletcher, 1994), the results
in this thesis constitute the first evidence of a correlation between fixation stability
and reading rate.

M.D. Crossland. Chapter 7: Fixation stability and the number of PRLs
7.1.4 ConclusionFixation stability is significantly impaired in subjects with macular disease. Fixation
stability does not consistently improve over the first twelve months after developing
a scotoma. Fixation stability is related to reading speed at both the entrance and the
exit point from the study.
The results presented in this section do not support the part of hypothesis 1 which
states “ ...fixation stability will improve.”
7.2 The number of preferred retinal loci
7.2.1 Specific methodsFixation was recorded in the manner described above and data were retrospectively
assessed by the KDE, as described in chapter 3. The number of PRLs evident on
each fixation trial was calculated, and the mean number of PRLs for 5 fixation trials
was recorded. It was also noted whether patients used the same number of PRLs for
targets in any of the five postitions of gaze, or a variable number of PRLs depending
on where the target was located.
7.2.2 Results7.2.2.1 Multiple PRLs at baseline
Seven patients (28%) use more than one PRL when fixating a central target at the
baseline assessment, although a further nine patients use multiple PRLs when
viewing at least one of the non-centrally presented targets. Of the 16 patients who
use more than one PRL, the mean number of PRLs used for the five screen positions
was 1.7 (range 1.2 - 3.8).
There is no difference between the patients who use one PRL under all
circumstances and those who exhibit multiple PRLs in terms of visual acuity
(Student’s t-test, p=0.13), contrast sensitivity (p=0.60), scotoma size (p=0.97) or
disease type (x2=0.18, p=0.67). Patients with multiple PRLs tend to have poorer
fixation stability than those who used only one locus of fixation but this result does

M.D. Crossland. Chapter 7: Fixation stability and the number of PRLs
not reach statistical significance (Student’s t-test, p=0.08).
72.2.2 Change in the number o f PRLs used
Over the timescale of this study, 11 patients (69% of those with multiple PRLs)
displayed a reduction in the mean number of PRLs used. Eight of the patients who
initially used multiple PRLs used only one PRL at the exit point of the study. Three
of the 16 patients with multiple loci at baseline used the same number of PRLs at
each visit. In five patients there was an increase in the number of PRLs used. These
findings are summarised in table 7.1 below.
Single PRL a t baseline Multiple PRLs a t baseline
No change t n PRL I n PRL No change t n PRL
AP DB (1 - 2 ) AS (3 .8 -1 .8 ) BP (1.6) PF (1 .4 -2 )CA EC ( 1 - 2 ) IP (1 .8 -1 .4 ) FG (1.8) RG (1 .4 -2 )JE RS (1 - 1.7) JW (2 -1 .2 ) RH (2)JY BN (1.6-1)KD CT (1 .2 -1 )SG HP (1 .2 -1 )
JA (1 .2 -1 )JF (1 .4 -1 )JM ( 2 - 1 )
MA (1 .6 -1 )MF (1 .2 -1 )
Table 7.1. Change in the number of PRLs used by patients. nPRL = number of PRLs used. t=increase. j=decrease. Letters are patient initials. Numbers in parentheses indicate the number of PRLs used at entrance and exit (respectively).
There is an increase in the number of patients using one PRL during this study, from
9 at baseline (36%) to 14 (56%) at exit. A more pronounced increase is seen in the
proportion of patients using a repeatable number of PRLs (be it one or two) for all
fixation positions, from 12/25 patients at baseline (48%) to 19/25 (76%) at exit.
These results can be seen in figure 7.3.

M.D. Crossland. Chapter 7: Fixation stability and the number o f PRLs
m B a s e l i n e
■ Exit
Single PRL Multiple PRL Repeatable nPRL Variable nPRL
Number of PRLs Repeatability of nPRL
Figure 7.3. Number of PRLs and repeatability of the number of PRLs at baseline and exit for all patients. nPRL: number of PRLs.
7.2.23 Reading speed and the presence o f multiple PRLs
Patients who exhibit one PRL read significantly faster than those who display
multiple PRLs at baseline (Student’s t-test, p<0.05). Amongst those who use
multiple PRLs, there is no significant difference in reading speed at baseline
between those who use a repeatable number of PRLs and those who do not (t-test,
p=0.81). These results can be seen graphically in figure 7.4.
At the exit point from the study, patients with multiple PRLs read at a similar rate to
those with one PRL ( p=0.36). Patients who used the same number of PRLs for each
condition read significantly faster than those who had a variable number of PRLs
(Student’s t-test, p<0.05). There is no difference in reading speed between those
who displayed one PRL at exit and those who consistently used two PRLs (Student’s
t-test, p=0.80). These data are illustrated in figure 7.5.

M.D. Crossland. Chapter 7: Fixation stability and the number of PRLs
140
w 100
O ne PRL Variable nPRL
PRLs at baselineTwo PRLs
Figure 7.4. Reading speed and the number of preferred retinal loci at baseline. nPRL: number of PRLs. Error bars show 1 standard deviation.
— 100 “ o>3
O ne PRL Variable nPRL Two PRLs
PRLs at exit
Figure 7.5. Reading speed and number of PRLs used at exit point from the study. Error bars show one standard deviation.

M.D. Crossland. Chapter 7: Fixation stability and the number of PRLs 128
Patients can be grouped into those who change the number of PRLs which are used
and those who use the same number throughout. Comparing these groups reveals no
difference in the improvement in reading speed (Student’s t-test, p=0.80). Subgroup
analysis of those patients who reduce the number of PRLs from many to one
indicates that their reading speed does not improve any more than patients who do
not make this “optimum” adaptation (p=0.20).
7.2.2.4 Time to develop the optimal number o f PRLs
By the end of this study, 19 patients used a repeatable number of PRLs, either one or
two. If the assumption is made that this is the optimal situation, the end-point of a
patient’s adaptation, then the time taken to reach this state can be recorded for these
nineteen patients. These times are illustrated in table 7.2 below.
Time to use a non-variable num ber of PRLs N um ber (% ) of patients
Baseline 7 (28%)1 month 3 (12%)3 months 4 (16%)6 months 4 (16%)12 months 1 (4%)Always use a variable nPRL 6 (24%)Table 7.2. Time to use a non-variable number of PRLs.
There is no difference in scotoma size between the patients who use exactly one and
exactly two PRLs at exit (p=0.99). All of the patients with JMD used only one PRL.
7.2.3 Discussion
Hypothesis 1 of this thesis states that “the number of different PRLs used will reduce
from many to one”. This does not appear to be the case; at the exit point of this
study more than one in three of the patients exhibited multiple PRLs. Of these
eleven patients, five reliably used two PRLs for observing the target, regardless of
the position of gaze.
Initially it seems surprising that multiple PRLs were used by some patients for a
simple fixation task as previous researchers have only elicited multiple PRLs when

M.D. Crossland. Chapter 7: Fixation stability and the number of PRLs
patients have observed a target of variable size (Guez et al., 1993) or luminance (Lei
& Schuchard, 1997). However, the target used in this experiment was a large black
circle with a smaller (18’) central detail (described in section 2.5.2.2 and illustrated
in figure 7.6). Patients may use one PRL to find the location of the black circle on
the screen and then a second PRL with better visual acuity to examine the central
detail. As reported in chapter 6, all of these patients had an identifiable “principal”
PRL which could indicate that the secondary PRL was used for localisation of the
target, whilst the principal PRL was used for detailed target examination.
Unfortunately from the eyetracker data collected it is not possible to determine the
strategies which patients used to switch between their PRLs.
~ ' ........
-------------------------
Figure 7.6. Target used for identification of multiple PRLs.
The statistical technique to identify multiple PRLs used in this thesis is more
sensitive than that used in other research. This may cause a higher incidence of
multiple PRLs to be reported.
Whittaker suggested that patients with larger scotomas (>20°) were more likely to
display multiple PRLs (Whittaker et a l, 1988). The three patients in this study with
scotomas of this size or greater (RH, BP and JW) all displayed multiple loci at exit.
However the mean scotoma size was not significantly different between the group
using one PRL and those using multiple PRLs (p=0.29).
As elsewhere in this thesis, an assumption is made that the performance of patients
on a fixation task can be correlated to their performance on a reading task. It is very
difficult to assess how many PRLs are being used when reading as it is unclear
which retinal area a patient is attending to at any given time when the eye is moving
along a line of text. An experimental technique which may address this concern is

M.D. Crossland. Chapter 7: Fixation stability and the number of PRLs
suggested in chapter 13.
Not all patients have developed a repeatable number of PRLs by the exit point of
this study, as can be seen in figure 7.3. The median time to develop a repeatable
number of PRLs is 1 month, although 6 patients do not make this adaptation within
twelve months. Longer follow-up would determine whether all patients eventually
develop a strategy whereby one (or two) PRLs are used routinely or whether some
patients never make this adaptation. All of the patients who do not use a repeatable
PRL suffer from AMD.
There is no evidence to suggest that those patients who consistently use two PRLs
will change to using one PRL. Large cross-sectional studies have found a similar
incidence of multiple PRLs as this study (e.g. 39% in the study by Whittaker (1988),
compared with 44% in the present study). A longer period of follow-up would
confirm this impression that many patients may continue to use two PRLs.
7.2.4 ConclusionOver time, some patients develop a strategy whereby the same number of PRLs are
used for examining targets in any location. Patients with this strategy read more
quickly than those who do not use the same number of PRLs under all conditions.
The time taken to make this adaptation is variable and may exceed twelve months.
A significant proportion of patients repeatably use two PRLs for observing a target.
There is no difference in reading speed between patients who use one PRL and those
who consistently use two PRLs. The results of this section indicate that the presence
of multiple PRLs does not impair reading speed, as long as patients display a
consistent strategy for using these PRLs.
7.3 Summary of chapter 7
Fixation stability is significantly impaired in patients with macular disease but is not
related to visual acuity, contrast sensitivity, scotoma size or type of disease. There is
no consistent change in fixation stability over the course of this study.
Many patients display multiple PRLs when observing a point target. Using two

M.D. Crossland. Chapter 7: Fixation stability and the number of PRLs
PRLs does not appear to affect reading speed, as long as patients display a consistent
strategy for using these PRLs.
The section of hypothesis 1 which states “the number of different PRLs used will
reduce from many to one and fixation stability will improve” has not been
supported.

132
Chapter 8: Saccadic considerations
This chapter will assess eye movements when subjects are observing a moving
target. Saccades made by patients with central scotomas are interesting for several
reasons.
First, the number of saccades used to perform a task is a measure of how efficiently
the saccadic system is being used. McMahon and colleagues have shown that the
number of excessive saccades used by a patient for a specific task can predict a
reduction in performance on a reading task (McMahon et al., 1991; McMahon et al.,
1993). The number of saccades used can also indicate the extent to which the
oculomotor system has been re-referenced; a larger number of saccades suggests that
patients are making a saccade to the scotoma before using the PRL (White & Bedell,
1990) or that patients can not reliably “find” their PRL (Schuchard et al., 1999).
Second, the latency and velocity of saccades can determine whether patients are
using a foveating or non-foveating mechanism for guiding their saccades. Foveating
saccades are distinguishable from non-foveating saccades of the same magnitude
due to their shorter latency and higher peak velocity (section 1.4.1, (Whittaker &
Cummings, 1990b; Whittaker et al., 1991)). Patients with bilateral scotomas must
rely on non-foveating eye movements. The suppression of foveating eye
movements and the development of a non-foveating saccade mechanism is a key
part of patients’ rehabilitation.
The results in this chapter have been divided into three sections (8.2 to 8.4). First,
the relationship between the latency, velocity and number of saccades is assessed,
and differences between horizontal and vertical saccades are described. The second
section addresses the number of saccades used to perform a task (saccadic
efficiency). Section 8.4 examines the latency and velocity of saccades with
reference to whether a foveating or non-foveating system is being employed.
This chapter will address the part of hypothesis 2 which state that “the number of

M.D. Crossland. Chapter 8: Saccadic considerations
saccades used to locate a target will reduce over time. Foveating saccades will be
suppressed and eye movements will be made directly to the PRL rather than to the
scotoma.”
8.1 Specific methods
Saccadic latency, efficiency and velocity were recorded whilst observing a moving
target as described in section 2.5.2. Briefly, after calibration and drift correction, the
Eyelink gazetracker was used to record eye movements as patients followed a
jumping target of 3° diameter with an 18’central detail. In the first experiment, the
target moved from the centre of the screen to a randomly selected location either 18°
to the left or to the right of the original position. In the second experiment, the target
decentration was 12° above or below the centre. In both cases the target appeared
immediately when the previous target disappeared, and the target moved every 5
seconds. In between each presentation, the target returned to the central position for
5 seconds. There were 20 eccentric target presentations per experiment and only
saccades away from the centre were analysed, not those made to the target when it
was located in the centre of the screen.
Retrospective analysis of the data recorded by the gazetracker was performed. In
each case, the saccadic latency, number of saccades to find the target (saccadic
efficiency) and peak velocity were recorded. The mean values for all 20 trials were
calculated.
Full data can be found in appendix 1, section A 1.8.
8.2 Interaction between saccadic properties in each meridian
8.2.1 Relationships among saccadic efficiency, latency and velocity
To determine the independence of saccadic efficiency, latency and velocity, a
correlation matrix was constructed to assess association between these variables for
all patients at their baseline visit. Spearman's test was used to assess the correlation
between each parameter. Spearman’s test is a non parametric measure of association
between variables. Data are placed into rank order and the correlation coefficient p

M.D. Crossland. Chapter 8: Saccadic considerations 134
is computed using Pearson’s product-moment correlation formula. A nonparametric
test is required as saccadic latency is affected by age (Whitaker et al., 1986; Pitt &
Rawles, 1988). Only data for the horizontal dimension has been included in this
analysis. The correlation matrix can be seen in Figure 8.1. There are no significant
correlations between these variables when Spearman’s test is applied (see table 8.1.).
Variable 1 Variable 2 Spearm an p P > M
Saccadic efficiency Saccadic latency 0.124 0.55Saccadic velocity Saccadic latency 0.157 0.47Saccadic velocity Saccadic efficiency -0.251 0.24Table 8.1. Spearman’s rho coefficients between saccadic latency, efficiency and mean peak velocity in the horizontal dimension at baseline assessment for all patients.
Saccadic latency (H)
Saccadic efficiency (H)
Saccadic velocity (H)
Figure 8.1. Scatterplot matrix to compare saccadic latency, efficiency and mean peak velocity in the horizontal dimension at baseline for all patients. Ellipses show 95% confidence intervals. n=25.

M.D. Crossland. Chapter 8: Saccadic considerations
8.2.2 Systematic differences in saccades made in different directions
8.2.2.1 Saccadic latency
As there is known to be an age-related change in saccadic latency and the
distribution of age in this study is bimodal rather than normal, AMD and JMD
patients are considered separately in this analysis.
Saccadic latency is not significantly different in any of the four directions of gaze
(repeated measures ANOVA, AMD patients: p=0.45, figure 8.2; JMD patients:
p=0.71). Further analysis of saccadic latency data for all patients and control
subjects indicates that no difference exists between the latency of horizontal
saccades and of those in the vertical direction (Spearman’s test, /?=0.67, pcO.OOl).
300 ~
250~
fj= 200">» o c<D| 1 5 0 -_S)X3<a3 ioo-CD
CO
5 0 -
0 -
Left Right Up Down
Direction of sa c c a d e
Figure 8.2. Latency for saccades in different directions. Error bars show 1 standard deviation.
The location of the scotoma with respect to fixation is known from the scanning
laser ophthalmoscopy performed at each visit. When those saccades which are made
towards the scotoma are compared to saccades in the opposite direction, no
difference in latency is found (Student’s t-test, p=0.39).
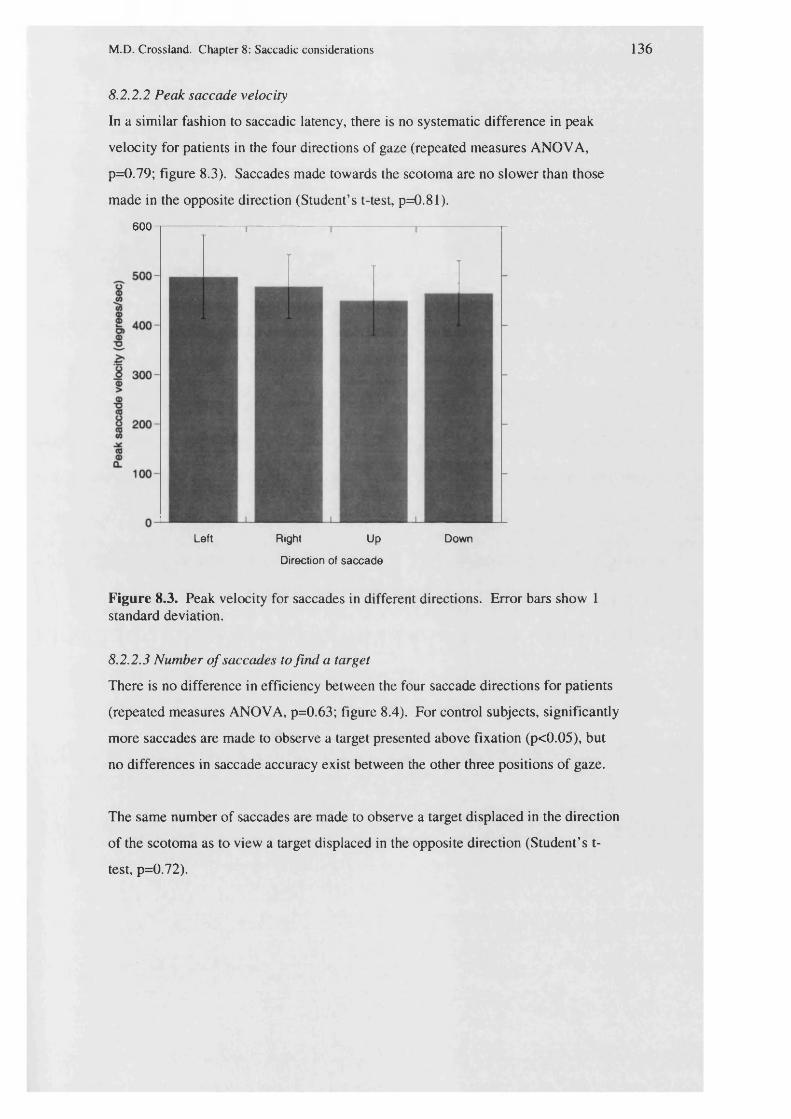
M.D. Crossland. Chapter 8: Saccadic considerations 136
8.2.2.2 Peak saccade velocity
In a similar fashion to saccadic latency, there is no systematic difference in peak
velocity for patients in the four directions of gaze (repeated measures ANOVA,
p=0.79; figure 8.3). Saccades made towards the scotoma are no slower than those
made in the opposite direction (Student’s t-test, p=0.81).
600
Left Right Up Down
Direction of sa cca d e
Figure 8.3. Peak velocity for saccades in different directions. Error bars show 1 standard deviation.
8.2.2.3 Number o f saccades to find a target
There is no difference in efficiency between the four saccade directions for patients
(repeated measures ANOVA, p=0.63; figure 8.4). For control subjects, significantly
more saccades are made to observe a target presented above fixation (p<0.05), but
no differences in saccade accuracy exist between the other three positions of gaze.
The same number of saccades are made to observe a target displaced in the direction
of the scotoma as to view a target displaced in the opposite direction (Student’s t-
test, p=0.72).

M.D. Crossland. Chapter 8: Saccadic considerations
■ Patients
Control subjects
Left Right Up
Direction of saccades
Down
Figure 8.4. Efficiency of saccades in different directions for patients and control subjects. Error bars show 1 standard deviation.
8.2.3 Discussion
This section has shown that saccadic latency, accuracy and efficiency are not
systematically different in the horizontal and vertical dimensions. Although no
differences between horizontal and vertical saccades have been previously reported
in healthy subjects (Balliet & Nakayama, 1978; Carpenter, 1988; Kubo et a l , 1991),
this is the first such comparison in patients with macular disease.
No significant association has been found between saccadic latency, accuracy and
efficiency. These parameters will be examined separately below.
8.3 Saccadic efficiency: the num ber of saccades used to view a target
When a normally sighted observer fixates a target which is decentred by more than
10°, more than one eye movement is made (Dodge & Cline, 1901; Carpenter, 1988).
The first, hypometric saccade covers about 90% of the distance towards the target

M.D. Crossland. Chapter 8: Saccadic considerations
and a second, correcting saccade brings the object onto the fovea. As the horizontal
target decentration in this experiment is 18°, it would be expected that more than one
saccade be used by patients and control subjects. However, to use three or more
saccades would be abnormal (White & Bedell, 1990).
McMahon and colleagues examined the number of saccades used when patients
were asked to look at each of five letter targets in turn (McMahon et a l , 1991).
They found that the number of saccades used was doubled in patients with AMD
when compared to control subjects.
White (1990) suggested that saccades made to the scotoma were less prevalent in
patients with very long-standing macular disease, and so fewer saccades were made
to observe a target by her patients. This impairment in the ability to make saccades
to the PRL in patients with macular disease has also been described by Schuchard
and coworkers (Schuchard et al., 1999).
This section will analyse the number of saccades used to observe a target in patients
with macular disease when compared to age-matched control subjects. It will also
address the hypothesis made above that with time, the number of saccades made to
observe a target will fall.
83.1 The effect of macular disease on saccade efficiencyThe mean number of saccades used by patients to observe a target ranged from 1.3
to 4.2 saccades (mean=2.1, sd=0.7), whilst all control subjects found the target with
less than two saccades (range 1.25-1.95, mean=1.7, sd=0.24). There is a significant
increase in the number of saccades made by patients (Welch test, F(df=i,32) =5.72,
p<0.05).
Post-hoc analysis shows that patients with juvenile macular disease make more
saccades than those with AMD (Tukey-Kramer HSD, p<0.05), although there was
no age-related difference in the number of saccades used by control subjects.
Patients with geographic atrophy make the same number of saccades as those with
exudative AMD.

M.D. Crossland. Chapter 8: Saccadic considerations
8.3.2 Saccade efficiency and reading speed
There is a strong relationship between the number of saccades used to read a
sentence and suprathreshold reading speed in patients at the baseline assessment (r =
-0.62, p<0.01; figure 8.5). This relationship, including interactions with other
factors, will be assessed in detail in chapter 10 of this thesis.
150
<D+—•3C
E-Ok -o£
100 "
" D0)CLV>O).E 5 0 “TJ(0<Dtr
1 2 2 .5 3 3 .5 4 4 .51.5
S a c c a d ic efficiency (num ber of sa c c a d e s )
Figure 8.5. Saccadic efficiency and reading speed for all patients at baseline. n=24 (excludes AP).
8.3.3 Changes in saccade efficiency with time
Control subjects’ saccade efficiency remains constant throughout this study (section
5.2.2). As figure 8.6 shows, the mean number of saccades used by patients also
remains constant at around 2.2 saccades. A repeated measures analysis of variance
was performed to determine whether differences in saccadic efficiency occurred
over time. No statistically significant differences were found over the 12 months of
this study (repeated measures ANOVA, 0-12 months, p=0.23). As the repeated
measures ANOVA excludes all patients with any missing data and some patients
were excluded from the study before their 12 month visit, the ANOVA was repeated
to compare performance at 0 and 6 months. Although this analysis had more
subjects, no change was found between these visits (repeated measures ANOVA, 0-
6 months, p=0.24).

M.D. Crossland. Chapter 8: Saccadic considerations
Although the mean value for the number of saccades used remained constant
throughout the follow-up period of this study, in individual cases the number of
saccades used changes markedly. For example, in patient BP the number fell from
2.95 to 2.15 and in patient EC the number of saccades rose from 1.35 to 2.05.
Figure 8.7 shows individual changes in saccadic efficiency.
Co■O 2
ok .<D■OEC
2>Noc®5it<DMT3
1.5
0 2 4 6 10 128
a Patients
a Control subjects
Time (months)
Figure 8.6. Change in saccade efficiency for patients (filled symbols) and control subjects (open symbols). Error bars show one standard deviation.

M.D. Crossland. Chapter 8: Saccadic considerations
3.5
"D
£ 2.5
Baseline Exit
Figure 8.7. Change in saccade efficiency between baseline and exit for individual AMD patients. Red lines show a decrease in the number of saccades used. n=20 (computational limitations).
8.3.4 Discussion
This section has found that saccadic efficiency is impaired in patients with macular
disease throughout this study. There are two possible explanations for this; first,
patients are making erroneous foveating saccades to the scotoma before making
correcting eye movements to the PRL. Second, patients may be directing their
saccades directly to the PRL but these saccades are less accurate than those made to
the fovea by individuals without macular disease.
Unfortunately, as the retina was not imaged during these experiments, it is not
possible to know which of these explanations is correct. In a similar task, Whittaker
found that only one patient of 18 made saccades to the scotoma rather than to the
PRL (Whittaker et al., 1991). However, this one patient had the shortest history of
macular disease (1 year).
To observe the target with less than two saccades indicates that patients must be
guiding their saccades directly to the PRL rather than making foveating saccades. It
can be seen from figure 8.5 that these patients read more quickly than those with

M.D. Crossland. Chapter 8: Saccadic considerations
worse saccade efficiency.
There is no systematic change in the number of saccades used to observe a target
over the course of this study. However, large changes in the number of saccades
used were observed in some individuals. By the exit point of the study, eight
patients reliably observed the target with two saccades or less; patients BN, IP, JE,
JF, JM, KD, PF and RH. There is no difference between these patients and the
remaining 17 patients in terms of visual acuity (p=0.43), scotoma size (p=0.99) or
disease type (p=0.52).
To determine whether these patients may be those who have fully re-referenced their
oculomotor system and will have pseudofoveated, in the manner described in
chapter 6, a logistic regression model was constructed for all patients at their exit
point from the study. This model determined whether the number of saccades used
to view a target could predict the likelihood of pseudofoveation. It was found that
there was no relationship between the number of saccades used to view the target
and pseudofoveation at the exit point (x2=0.12, p=0.72).
None of the patients in the present study received any training or other intervention.
McMahon and colleagues found that with saccadic training, the number of saccades
used to view a target fell, although it did not reach normal values (McMahon et al,
1993). Encouragingly, there was a concurrent improvement in reading speed in
these patients. It is tempting to speculate that with training, the saccadic efficiency
of patients in the present study can be improved. A potential training system is
discussed in chapter 14.
8.3.5 Conclusion
Throughout this study, patients with macular disease make more saccades to observe
a target than do age-matched control subjects. Although there is no systematic
change in saccade efficiency, some patients demonstrate a marked increase or
decrease in the number of saccades used to fixate a target. This change does not
appear to be related to the development of pseudofoveation.
Chapter 11 will investigate the relationship between changes in saccadic efficiency

M.D. Crossland. Chapter 8: Saccadic considerations
and changes in reading speed.
8.4 Saccadic latency and velocity
This section will examine the saccadic latency and velocity of the patients and will
compare these values to those of the age-matched control subjects. The motivation
for this section is to determine whether patients are using foveating or non-foveating
eye movements, as described by Whittaker (Whittaker & Cummings, 1990a;
Whittaker & Cummings, 1990b).
Saccadic latency in young subjects without macular disease is around 120 msec
(Carpenter, 1988; Pitt & Rawles, 1988). Saccadic latency increases by 1 to 2
msec/year over the age of 20 (Abel et a l, 1983; Carter et al., 1983; Whitaker et al.,
1986; Pitt & Rawles, 1988). Whittaker and colleagues found saccadic latency to be
increased to 402 msec in patients from a mean value of 298 msec in control subjects
(Whittaker et al., 1991). Although the control subjects in Whittaker’s study were
not exactly age-matched, the differences in age were not sufficiently large enough to
account for this large difference in latency. White & Bedell also found saccadic
latency to be increased in all but one of their AMD patients when compared to age-
matched control subjects (White & Bedell, 1990).
Saccade velocity also slows with age, although this change is less pronounced than
that in saccadic latency (Pitt & Rawles, 1988). Whittaker found the peak velocity of
saccades in patients with macular disease to be somewhat reduced, although he did
not quantify this difference in speed (Whittaker et a l , 1991). No other research
groups have reported the speed of saccades in macular disease.
Examination of the latency and speed of patients’ saccades can determine the
mechanism which patients are using to make eye movements; if the latency and
velocity is the same as that for age-matched control subjects then the foveating
saccade mechanism is being used. However if the velocity is slower then an
alternative non-foveating system for making eye movements is being employed.

M.D. Crossland. Chapter 8: Saccadic considerations 144
This section will address the part of hypothesis 2 which reads “Foveating saccades
will be suppressed and eye movements will be made directly to the PRL rather than
to the scotoma.”
8.4.1 Effect of age and m acular disease on saccadic latency and velocity
Saccadic latency and velocity for patients and age-matched control subjects at the
baseline assessment is shown in table 8.2.
Analysis of variance reveals a significant increase in saccadic latency with age
(p<0.05), regardless of the presence of disease. However, the presence of disease
does not increase saccadic latency (p=0.20). There is no interaction between age
and disease when entering these variables as an interaction term in the ANOVA
(p=0.76).
G roup Mean(sd) saccadic latency (msec)
Mean(sd) peak saccadic velocity (°/sec)
AMD 230 (79) 501 (112)Older controls 188 (58) 437(113)JMD 186 (66) 379 (73)Younger controls 137 (25) 473 (105)Table 8.2. The effect of macular disease and age on saccadic latency and velocity.
Neither age nor macular disease has any effect on the peak saccadic velocity at the
baseline assessment (ANOVA, F(df=3,32)=1.92, p=0.15; table 8.2).
8.4.2 Saccadic latency, saccadic velocity and reading speed
At the baseline assessment, there was no linear relationship between reading speed
and saccadic latency for AMD patients (r = -0.32, p=0.20) or JMD patients (r =
-0.42, p=0.58). There is no relationship between saccadic velocity and reading
speed for patients at the baseline assessment (r = -0.10, p=0.64). These data are
shown in figure 8.8.

M.D. Crossland. Chapter 8: Saccadic considerations
140
120©cE 100(/)
80
o
0 a.COos1 60asDC
a AMD patients
a JMD patients
▲▲
40
20100 150 200 250 300
Saccadic latency (m sec)
350
150
100 "
P
o>
300 400 500 600 700 800 900 1000200
S a cca d ic velocity (d eg /sec )
Figure 8.8. Upper panel: Saccadic latency and reading speed for AMD patients (filled symbols) and JMD patients (open symbols) at baseline. n=24 (excludes AP). Lower panel: Saccadic velocity and reading speed for all patients at baseline. n=24 (excludes AP).

M.D. Crossland. Chapter 8: Saccadic considerations
8.4.3 Changes in saccadic latency and velocity with timeChapter 5 of this thesis has shown that saccadic latency and velocity remain constant
over the course of the study in control subjects (table 5.4). Similarly, no systematic
change occurs over time in patients’ saccadic latency or velocity (repeated measures
ANOVAs: saccadic latency, 0-6 months, p=0.31; 0-12 months, p=0.32. Saccadic
velocity, 0-12 months, p=0.38). These data are shown graphically in figure 8.9.
It can be seen from the lower panel of figure 8.9 that there appears to be a drop in
the mean saccadic velocity value between one and three months. However, this
finding does not reach significance (repeated measures ANOVA, 0-3 months
p=0.07).
Although there is no systematic change in saccadic latency or accuracy, in some
subjects latency or velocity changed by a large amount in this study. Figure 8.10
shows the individual changes in latency and velocity between the baseline and exit
point of the study.
The hypothesis states that as patients suppress their foveating saccade mechanism,
saccadic latency will increase and the peak velocity of saccades will fall. Patients
who behaved as hypothesized are shown in red on both panels of figure 8.10.

M.D. Crossland. Chapter 8: Saccadic considerations
300
280 -
260 ~
¥«240~>.i 22° -JSt j 200 ~
W 180 ~
160-
140 _
0 2 4 6 8 10 12
Time (months)
600“
¥S 550“0 ®;o| SCO-
<D >
■6 450“
1■* 400-(o ©Q .
| 350-
300“
Figure 8.9. Upper panehChange in saccadic latency with time, by group. Error bars show one standard deviation. Open symbols show JMD patients, filled symbols show AMD patients. Lower panel: Changes in saccadic velocity with time. Error bars show one standard deviation.
Time (months)
i- - - - - - - - - - - - - - - - - r - - - - - - - - - - - - - - - - 1- - - - - - - - - - - - - - - - 1- - - - - - - - - - - - - - - - - 1- - - - - - - - - - - - - - ~ i —
a AMD patients
□ JMD patients

M.D. Crossland. Chapter 8: Saccadic considerations
450
400
350
o 300 f
-S 250
200
150
100B aseline Exit
900
800
> 600
500
400
300
200B aselin e Exit
Figure 8.10. U pper panel: Change in saccadic latency between baseline and exit for each patient. Red lines show patients where latency increased by >10%. Lower panel: Change in saccadic velocity between baseline and exit for each patient. Red lines show patients where velocity decreased by >10%. n=20 for both panels due to computational limitations.

M.D. Crossland. Chapter 8: Saccadic considerations
8.4.4 Discussion
8.4.4.1 Saccadic latency and velocity at baseline
At the baseline assessment, there is a significant increase in saccadic latency with
age but the presence of macular disease does not significantly affect saccadic
latency. Comparison of the baseline latencies for young and old subjects indicates
that the increase in saccadic latency with age is equivalent to 1.6 msec/year. This is
consistent with the results of previous studies (Abel et al., 1983; Carter et al.t 1983;
Pitt & Rawles, 1988). As patients aged by one year over the course of this study,
their saccadic latency may have risen by 1 or 2 msec between the baseline and 12
month follow up visits. This effect is too small to be observed in the data presented
in this chapter.
Although there are no between-groups differences in saccadic latency, some patients
demonstrate very long latencies (figure 8.10, upper panel). Six patients* saccadic
latency are longer than the upper 95th centile for age-matched control subjects (249
msec for the older controls, 177 msec for the younger subjects). These patients are
RG, BP, MA, KD, AP and MF.
Saccadic latencies found for patients throughout this study are shorter than those in
the Whittaker, Cummings and Swieson study (1991). One reason for this difference
is that the amplitude of the saccades was different; in Whittaker’s study, the target
was presented at a random location of between 1 and 35° decentration, whereas in
the present study target decentration was only 18°. As saccadic latency increases
with increased saccadic amplitude (Carpenter, 1988), latency will be higher for the
task described in the paper by Whittaker et al. Patient instruction was also different
between the two studies; participants in Whittaker’s study were asked to make a
judgement about the target which they were observing whereas the subjects in this
study were merely asked to “look at the target”.
The method of random target presentation in any position within 35° used by
Whittaker would sometimes project the target within the scotoma. Saccades to
unseen targets take far longer to execute than those to visible targets (Hallett, 1986;
Carpenter, 1988). This would also contribute to the longer mean latencies found in

M.D. Crossland. Chapter 8: Saccadic considerations
Whittaker’s patients.
Saccadic velocity is equal in patients and age-matched control subjects at the
baseline visit. The values for saccadic velocity for patients found in this chapter are
similar not only to those for the age-matched control subjects but also to those found
for normal observers in different studies (see Carpenter, 1988, for a review). This
implies that the difference in results is due to the patients in this study behaving
differently to those in Whittaker’s 1991 and White’s 1990 papers, rather than the
control subjects being particularly poor.
8.4.4.2 Foveating or non-foveating saccades?
The motivation for examining saccadic latency and velocity at each visit in this
study was to determine whether patients are using a foveating or non-foveating
saccade mechanism. Whittaker suggests that with time, patients suppress their
foveating saccades and that slower, non-foveating saccades are adopted.
Although there is no systematic change in saccadic latency or velocity in this study,
as figure 8.10 has shown some patients experienced large changes in these variables.
Figure 8.11 below shows the correlation between changes in saccadic latency and
velocity between the baseline and final assessment for each patient in this study. If
patients are adopting a non-foveating saccade mechanism their saccadic latency will
increase and their velocity will fall; that is, they will be clustered into the lower right
hand quadrant of figure 8.11.

M.D. Crossland. Chapter 8: Saccadic considerations
400©
1 300- 15 &O 2 0 0 “©>oT3
$ o “
1-100-15
-400-200-300 -100 0 100 200 300
Saccadic latency at exit • saccadic latency at baseline
Figure 8.11. Change in saccadic latency and velocity between baseline and exit. n=25.
It can be seen that six patients fall into this area. They are CT, HP, IP, JY, PF and
RS. A further three patients experience an increase in saccadic latency without a
corresponding decrease in saccadic velocity (patients AS, EC and SG).
The velocity of saccades in patients with macular disease has only ever been
measured by Whittaker et al (1991). Closer examination of Figure 5 in the paper by
Whittaker reveals that although there is a trend for patients’ saccades to be slower
than control subjects’, there is a very considerable overlap between the two groups.
Further, no statistically significant differences in saccadic velocity are reported by
Whittaker. It is therefore suggested that all nine of the patients whose saccadic
latency increased in the present study can be said to have developed non-foveating
saccades.
These nine patients have been added to the six patients described in section 8.4.4.1,
and are classified as those who are making non-foveating saccades. There is no
difference between these fifteen patients and the remaining ten in terms of disease
type (x2 test, p=1.00), visual acuity (p=0.93) or scotoma size (p=0.52). There was no
association with pseudofoveation (%2 test, p=0.41), and changes in saccadic latency
were not associated with changes in saccade efficiency (r"=0.09).

M.D. Crossland. Chapter 8: Saccadic considerations
All but one of the patients in the study of White and Bedell experienced a saccadic
latency outside normal limits (White & Bedell, 1990). It is unclear whether the
patients in the present study will exhibit a slower saccadic latency with more time.
The one patient in Whittaker’s study who did not display an increase in saccadic
latency had a 12-month history of AMD. This implies that the adaptation may take
longer than the follow-up period of this study in some patients.
The assumption that these patients are making non-foveating saccades is based on
data collected from the infra-red eyetracker, so the retina was not being viewed
during this experiment. The experiment was designed in this manner to allow
greater accuracy in the measurement of saccadic latency and accuracy; the temporal
resolution of the eye-tracker is 5 times more precise than the SLO.
Simultaneous high-frequency eyetracking and retinal observation would be an ideal
mechanism for determining the presence of foveating and non-foveating saccades.
Methods for this procedure are discussed in chapter 15.
8.5 Summary of chapter 8
Section 8.3 of this chapter has shown that patients display a lower saccadic
efficiency when compared to subjects without macular disease. This lower
efficiency appears to be related to the impairment in reading speed experienced by
patients with central scotomas. In eight patients, saccade efficiency reached normal
values.
Most patients (76%) still make foveating saccades at their baseline assessment.
Over time, a further nine patients modify this mechanism and by the exit point of the
study, 60% of the patients repeatably make saccades which display the latency
characteristics of non-foveating saccades.

M.D. Crossland. Chapter 8: Saccadic considerations
There is no association between these two adaptive strategies, they appear to be
independent. The benefit of each of these adaptations in terms of reading speed will
be assessed in chapters 10 and 11 of this thesis.
This chapter has shown that the first part of hypothesis 2 is true for some patients.
An updated version could read: “In certain patients, the number of saccades used to
locate a target will reduce over time, whilst in some patients foveating saccades will
be suppressed and eye movements will be made directly to the PRL rather than to
the scotoma.”

154
Chapter 9: Eye movements made whilst reading
The previous chapter has shown that more saccades are made to view a target in the
presence of a central scotoma. This chapter will investigate eye movements made
by patients and control subjects when reading. Reading speed is the primary
outcome measure of this thesis and a reduction in reading ability is the most frequent
complaint of patients with macular disease (section 1.2.3).
Bullimore and Bailey (1995) used an infrared eyetracker to examine horizontal
saccade patterns made whilst reading in 13 patients with AMD and six age-matched
control subjects. They found that the number of forward saccades was greatly
increased in patients, from one saccade per six letters of text in control subjects to
one saccade per three letters in certain patients. Bullimore attributed this difference
to a reduction in the width of the perceptual span; as fewer letters are identified per
fixation, more saccades are required. Bullimore and Bailey also found a large
increase in the number of regressive saccades in patients, although they conceded
that these right-to-left saccades may actually be eye movements made to switch
between multiple PRLs rather than true regressions.
The study of eye movements by McMahon and colleagues has already been
described in chapter 8. Although eye movements were not recorded during reading
in McMahon’s study, they were measured whilst fixating five spaced letters in
sequence, which is a similar task to reading. McMahon found that the number of
saccades used for this task was linearly related to reading speed, with a correlation
coefficient of -0.89 (McMahon et a l , 1993).
Bowers and colleagues examined both the saccadic frequency rate in the manner
described by McMahon and the number of saccades made when reading. They
found that the number of saccades used whilst reading was very strongly related to
reading speed (r = -0.97), whereas the number of saccadic properties to observe a
target were less well correlated (r= -0.57). They found a linear relationship between

M.D. Crossland. Chapter 9: Eye movements whilst reading
these two variables (r = 0.55) (Bowers et al., 2001).
The relationship between fixation duration and reading speed in macular disease is
less well established. In subjects with simulated visual impairment, the length of
each fixation duration increases from about 300 to about 450 msec as the level of
impairment is increased and reading speed slows (Bowers & Reid, 1997). Bowers
found that fixation duration is linearly related to reading speed in these observers
(r=-0.86). Further, Trauzettel-Klosinski and colleagues found an increase in fixation
duration in patients with Stargardt disease when compared to control subjects
(Trauzettel-Klosinski etal., 1994).
However, Bullimore and Bailey did not find a significant increase in fixation
duration in patients with macular scotomas; patients and control subjects had a
typical fixation length of around 300 msec.
This chapter will investigate the number of forward and regressive saccades used to
read a sentence, the number of saccades needed to find the start of each line of text
and the fixation duration of the patients examined in this study. The importance of
these parameters in determining reading speed will be investigated. This chapter
will also examine the change in these variables with time, to address the second part
of hypothesis 2: “Eye movement control will become more efficient when reading;
with time, fewer saccades will be required to read a sentence, and the number of
regressive saccades made during a reading task will also fall."
A general discussion of the results can be found in section 9.4 below. Full data can
be found in appendix 1 section A 1.9.
9.1 Specific methods
Eye movements were recorded using the Eyelink gazetracker whilst patients read
MN-Read style sentences presented at 3x acuity, as described in sections 2.4.1 and
2.5.2.4. The sentences were 55 characters long and were divided over two lines.
Retrospective analysis of the data recorded by the eyetracker identified the number
of forward saccades, the number of regressive saccades, the number of saccades to

M.D. Crossland. Chapter 9: Eye movements whilst reading
find the start of each line of text and the time taken to read the sentence. Fixation
duration was calculated using the following formula:
Fixation duration = Time taken to read the sentence (Total number of saccades +1)
This formula uses one more than the number of saccades as the denominator to
account for the fixation made after the final saccade of the trial. Several methods
exist for calculating fixation duration; this formula has been used by Bullimore and
Bailey (1995). This formula is liberal in that any time when the eye is not making a
saccade will be classified as a fixation. Fixation duration will be longer when
calculated by this formula than when using the method of, for example, Rayner
(1978). Each parameter was recorded for each sentence, and mean values for all ten
sentences were used for the analyses in this chapter.
9.2 The number of saccades used whilst reading
9.2.1 The effect of macular disease on eye movements when readingAt the baseline assessment, the number of forward saccades used to read a sentence
was doubled in patients with macular disease, from a mean value of 8.0 in control
subjects to 16.0 saccades in patients (p<0.001). The number of regressive saccades
also increased (from 0.8 to 5.0 saccades; p<0.05), as did the number of saccades
needed to find the start of a line (1.2 to 3.1 saccades; p<0.001). There is a
considerable variability in these results between patients, as can be seen in figure
9.1.
Age has no effect on any of these variables in patients or in control subjects
(Student's t-test comparing older to younger participants: patients: number of
forward saccades p=0.38; number of regressive saccades p=0.47; number of
saccades to the start of a line p=0.30. Control subjects: number of forward saccades
p=0.37; number of regressive saccades p=0.09; number of saccades to the start of a
line p=0.50).
Further, the type of macular disease has no effect on these three variables (ANOVA;
number of forward saccades F(df2,24)=0.73, p=0.49; number of regressive saccades
F(df2 , 24)=2.82, p=0.08; number of saccades to the start of a line F(df 2 ,24)=l-76,

M.D. Crossland. Chapter 9: Eye movements whilst reading
p=0.19).
157
20
15
o 10<u£Ez
5
0Forward Regressive To start
Figure 9.1. Number of forward saccades (Forward), number of regressive saccades (Regressive) and the number of saccades to the start of a line (To start) for patients and control subjects at the baseline assessment. Error bars show one standard deviation.
Figure 9.2 shows a scatterplot matrix for these three variables. It can be seen that
there is a relationship between the number of forward saccades, the number of
regressive saccades and the number of saccades used to find the start of a line.
Spearman’s test confirms there is a strong rank correlation between these variables
(table 9.1).
Variable 1 Variable 2 Correlationcoefficient
P > M
N regressive N forward 0.72 <0.0001N to start N forward 0.53 <0.01N to start N regressive 0.63 <0.001Table 9.1. Spearman’s rho coefficients between number of regressive saccades (N regressive), number of forward saccades (N forward) and number of saccades to the start of each line (N to start) for all patients at the baseline assessment.
■ Patients
■ Control subjects

M.D. Crossland. Chapter 9: Eye movements whilst reading
Forward saccades
20 H
1 5 -
Regressive saccades10 -
5 -
9 -
8 -
7 -6 -
5 -4 -
3 -
2 -
Saccades to start
1 0 1 5 2 0 2 5 3 0 5 1 0 1 5 2 0
Figure 9.2. Scatterplot matrix to compare the number of forward saccades, the number of regressive saccades and the number of saccades made to the start of each line at baseline for all patients. Ellipses show 95% confidence intervals. n=25.
9.2.2 The relationship between eye movements when reading and when observing a target
There is no relationship between the number of forward saccades used to read a
sentence and either saccadic latency or velocity when observing a target (linear
regression: saccadic latency, r= -0.08, p=0.72; saccadic velocity, r= 0.00, p=0.91).
Similarly, no relationship exists for regressive saccades (latency, r = 0.07, p=0.75;
velocity, r = 0.15, p=0.49) or for the number of saccades to the start of a line
(latency, r= 0.26, p=0.29; velocity, r= 0.26, p=0.31).
There is a linear relationship between saccadic efficiency (as described in section
8.3) and the number of forward saccades used to read a sentence (linear regression, r

M.D. Crossland. Chapter 9: Eye movements whilst reading
= 0.59, p<0.01; figure 9.3). This relationship is not as pronounced for either the
number of regressive saccades (r= 0.17, p=0.39) or for the number of saccades
required to find the start of a line (r= 0.37, p=0.07).
® 3 .5I8ccCO
o 3 -k_©nE
0 c1p® 2 -018CO
w 1 .5 “
5 10 15 20 25 30 35
Number of forward sa c c a d e s to read sen ten ce
Figure 9.3. The relationship between the number of forward saccades when reading a sentence and saccadic accuracy, for all patients at the baseline assessment. Line shows linear regression. n=24.
9.2.3 The relationship between eye movements when reading and reading speed
There is a strong linear relationship between the number of forward saccades used to
read a sentence and patients’ reading speed at the baseline assessment (r= -0.71,
figure 9.4). Similar relationships exists for the number of regressive saccades (r =
-0.72) and for the number of saccades used to find the start of a line (r= -0.80).

M.D. Crossland. Chapter 9: Eye movements whilst reading 160
140
120”
E 1 0 0 ”
8 0 “
05
^ 6 0 “
4 0 ”
205 10 15 20 25 30 35
Number of forward sa c c a d e s to read sen ten ce
Figure 9.4. The relationship between the number of forward saccades for reading a sentence and reading speed at the baseline assessment. Line shows linear regression. n=24.
9.2.4 Change in the num ber of saccades used for reading with time
In control subjects, the number of saccades used to read a sentence remained stable
over one year at 7.9 saccades (see table 5.4). In patients, no systematic change was
found in the number of forward saccades, the number of regressive saccades or the
number of saccades used to find the start of each line (repeated measures ANOVA,
table 9.2, figure 9.5). It can be seen from figure 9.5 that variance in the number of
forward saccades falls after the 3 month visit, although there is no systematic change
in the standard deviation of the number of saccades (r = -0.4; p=0.43).
Although there was no systematic change, in certain individuals the number of
saccades used for reading does change. There is a negative linear relationship
between a change in the number of forward saccades used to read a sentence and a
change in reading speed (r= -0.41). This effect is more pronounced for the number
of regressive saccades (r= -0.46) and for the number of saccades used to find the
start of the line (r=-0.53).

M.D. Crossland. Chapter 9: Eye movements whilst reading 161
These changes are not correlated with changes in saccade efficiency (linear
regression; forward saccades r = 0.00, p=0.84; regressive saccades r= 0.10, p=0.73;
to the start of a line r = 0.39, p=0.09) or saccadic latency (linear regression; forward
saccades r= -0.20, p=0.38; regressive saccades r= -0.10, p=0.67; to the start of a line
r= -0.28, p=0.23).
Param eter Repeated measures ANOVA, p value
0 to 6 months 0 to 12 months
Number of saccades 0.72 0.93Number of regressive saccades 0.26 0.16Number of saccades to start of line 0.11 0.08Table 9.2. Repeated measures ANOVA for reading parameters between 0 and 6 months and 0 and 12 months, for all patients.
2 5 “
m 2 0 “
o 1 5 “
10 “
5 “
120 2 4 6 8 10
A Forward
□ R e g re ss iv e
■ T o start
T im e (m on th s)
Figure 9.5. Changes in the number of forward saccades to read a sentence (Forward), the number of regressive saccades to read a sentence (Regressive) and the number of saccades to the start of each line (To start) over time, for all patients. Error bars show one standard deviation.

M.D. Crossland. Chapter 9: Eye movements whilst reading
9.3 Fixation duration
9.3.1 The effect of age and m acular disease on fixation duration a t baseline
Mean fixation duration for patients and control subjects can be seen in figure 9.6
below. There is no difference in fixation duration between these four groups
(ANOVA, F(df=3t3o)=1.27, p=0.30).
600
500
§ 4 0 0E,co? 3003~oco
.§ 200
100
0
Figure 9.6. Fixation duration at the baseline assessment, for all patients and control subjects. Error bars show one standard deviation.
9.3.2 The relationship between fixation duration and reading speed
Fixation duration is not related to the number of saccades used by patients to read a
sentence (linear regression, r= 0.10, p=0.61), to the number of regressive saccades (r
= 0.20, p=0.39), or to the number of saccades used to find the start of each line (r =
0.40, p=0.08). There is, however, a relationship between fixation duration and
reading speed in patients; patients with longer fixation duration read more slowly
than those with shorter fixations (r = -0.62, p<0.01; figure 9.7). A similar trend
AM D patients JM D patients Older controls Younger controls

M.D. Crossland. Chapter 9: Eye movements whilst reading
exists in control subjects (r = -0.66, p=0.05). Figure 9.7 shows both of these
relationships. The gradient of the line of best fit is -0.18 for patients and -0.27 for
control subjects.
2 50
200 "
CD3C
I"E 150o5 Patients
Control subjects1Q_</> _ o> 100 cT3CO•
DC
5 0 “
500 600 700 800300 400200
Fixation duration (m sec)
Figure 9.7. The relationship between Fixation duration and reading speed for patients (filled symbols, heavy line) and control subjects (open symbols, light line). n=33.
Under the paradigm used for determining fixation duration in this experiment, each
fixation comprises the time to identify the word or syllable being fixated and the
latency time of the following saccade. To ensure that variance in fixation duration
was not accounted for by the individual differences in saccadic latency, linear
regression was performed to compare saccadic latency length to fixation duration.
Saccadic latency accounts for 24% of the variance in fixation duration in patients, so
the length of each fixation is due in part to the latency of each saccade.
9.3.3 Changes in fixation duration with time
Chapter 5 of this thesis has shown that fixation duration remains unchanged in
control subjects throughout this study (table 5.4). Figure 9.8 shows the change in
fixation duration with time for patients. Repeated measures analysis of variance
does not indicate any systematic difference in reading speed (0-6 months, p=0.87; 0-

M.D. Crossland. Chapter 9: Eye movements whilst reading
12 months, p=0.90)
600
8? 4 5 0
4 6 8Time (months)
Figure 9.8. Change in fixation duration with time for patients. Error bars show one standard deviation.
9.4 Discussion
9.4.1 The num ber of saccades used when reading
There is an association between the number of forward saccades used to read a
sentence, the number of regressive saccades used when reading a sentence and the
number of saccades required to find the start of each line of text. These variables are
all significantly increased in the presence of macular disease.
The number of forward saccades accounts for 51% of the variance in reading speed
in this study; similar to that described by McMahon and colleagues (r2=0.80, n=
14;(McMahon et al., 1993)). The patients in McMahon’s study demonstrated a
reduction in the number of saccades used and an increase in reading speed with
training. Although there were no systematic changes in the saccadic properties
when reading for the patients in the present study, these subjects did not receive any
active intervention or training. The potential benefit of training has been alluded to
in the previous chapter and will be described fully in chapter 13.
Bullimore and Bailey’s 1995 paper described a strong linear correlation between
reading speed and the number of letters read per forward saccade (an equivalent
measure to the number of forward saccades in this analysis). Bullimore and Bailey

M.D. Crossland. Chapter 9: Eye movements whilst reading
suggested three hypotheses for this increase in the number of saccades; first that the
perceptual span is reduced so fewer letters are attended per fixation; second, that
patients’ ability to direct their eyes is impaired and finally that the ability to integrate
information across saccades is impaired.
The visual span hypothesis discussed by Bullimore and Bailey would predict that the
number of saccades used to read a sentence would increase. However, it would not
predict an increase in the number of saccades needed to find a small point target, as
the perceptual span requirement for this task is far smaller. This chapter has shown
that there is a strong relationship between the number of saccades used to read a
sentence and the number of saccades used to view a point target. These data suggest
that the difficulty in reading is not solely attributable to the shrinking visual span
hypothesis.
The data presented in this chapter lend most support to the second of Bullimore’s
hypotheses, that difficulty in guiding saccades is the primary factor which increases
the number of eye movements when reading with a central scotoma. The ability to
integrate information across saccades has not been directly assessed by this
experiment, so Bullimore’s third hypothesis can not be tested.
9.4.2 Fixation duration
This study has not found fixation duration to be significantly increased in patients
with macular disease when compared to control subjects. This finding is similar to
that of Bullimore and Bailey (1995) who found fixation rate (the reciprocal of
fixation duration) to be similar in patients with AMD and control subjects.
As figure 9.7 shows, fixation duration influences reading speed by a similar amount
in both control subjects and patients. Individual differences in fixation duration are
well known to influence reading speed (Rayner, 1978; Rayner, 1998). It is tempting
to speculate that the individual differences in fixation duration between these
patients are independent of the presence in macular disease. As the fixation duration
of these patients before the onset of the scotoma is not known, this hypothesis
remains conjecture. One method for assessing the relationship between fixation
duration and reading speed would be to remove the need for saccades, either by

M.D. Crossland. Chapter 9: Eye movements whilst reading 166
presenting text with the RSVP technique or by scrolling text whilst patients’ eyes
remained steady. This would have been an ideal control condition for this section of
the study; unfortunately this was not considered at the outset of this project.
9.4.3 The relative im portance of each variable
Variance in reading speed is related to all of the factors discussed in this chapter: the
number of forward saccades (r2 = 0.51), the number of regressive saccades (r2=0.52),
the number of saccades to find the start of a line (r2=0.64) and fixation duration
(^=0.39). To determine the relative importance of these four factors, multivariate
regression was performed using the techniques described in chapter 10. The model
was constructed using forwards and backwards regression, and is shown in table 9.3.
The model indicates that the number of forward saccades, the number of regressive
saccades and fixation duration combine to account for 87% of the variance in
reading speed.
Step Variable Cumulative r1 value
1 Number of forward saccades 0.512 Number of regressive saccades 0.593 Fixation duration 0.87Table 9 3 . Result of statistical regression
Although reading speed can be predicted to a high degree of accuracy using this
technique, this model suffers from a cause and effect problem; it is not clear whether
the increase in the number of saccades and fixation duration are a cause of slow
reading or a consequence of it. To overcome this paradox in this study, models have
been constructed to determine reading speed using variables measured for other
tasks. These findings are presented in the next chapter.
9.5 Conclusion
The number of forward saccades, number of regressive saccades and number of
saccades to find the start of a line are covariant in the patients seen in this study.
These variables are, in turn, linearly related to reading speed of patients with
macular disease. There is a strong relationship between the number of saccades used

M.D. Crossland. Chapter 9: Eye movements whilst reading
to read a sentence and the number of saccades used to view a target. This chapter
supports the hypothesis that impairment of eye movement control is a key cause of
the reduction in reading speed of patients with macular disease.
No systematic difference is found in any of these parameters over time. This chapter
has failed to support that part of hypothesis 2 which states that “eye movement
control will become more efficient when reading; with time, fewer saccades will be
used to read a sentence, and the number of regressive saccades made during a
reading task will also fall.

168
Chapter 10: Cross-sectional analysis: Factors which predict reading speed
Chapters 5 to 8 of this thesis have shown that, at the baseline assessment, the
presence of macular disease impairs performance on clinical tests, reduces the
stability of fixation and increases saccadic inefficiency. This chapter uses
multivariate statistical techniques to investigate the contribution of these factors to
the reduction in reading speed experienced by patients with central scotomas.
Previous attempts to predict reading speed in patients with AMD have had varying
degrees of success (table 10.1). (Cummings, Whittaker, Watson & Budd,
1985;Legge, Ross, Isenberg & LaMay, 1992;McMahon, Hansen, Stelmack, Oliver
& Viana, 1993;Bullimore & Bailey, 1995;Fine & Rubin, 1999;Fletcher, Schuchard
& Watson, 1999;Bowers, Lovie-Kitchin & Woods, 2001;Ergun, Maar, Radner,
Barbazetto, Schmidt-Erfurth & Stur, 2003).
G roup Predictors Patients(n)
V ariance in reading speed accounted for (r2)
Cummings et al (1985)
Scotoma size 18* 0.45
Legge et al (1992) Visual acuity Age
45 0.32
McMahon et al (1993)
Saccadic efficiency 12 0.79
Bullimore & Bailey (1995)
Letters/forwardsaccade
13 0.92
Sunness et al (1997)
Scotoma size Visual acuity
44* 0.43
Fine & Rubin (1999)
Scotoma size** Visual span**
8 0.42
Fletcher et al (1999)
Visual acuity 99 0.33“Scotomacharacteristics”
99 0.42
Bowers et al (2001)
Saccadic efficiency 21 0.34Words/forwardsaccade
21 0.94
Ergun et al (2003) Scotoma size 22 0.23Table 10.1. Previous models of reading speed in patients with MD. *: estimated, number of eyes only reported. **: simulated impairments.

^ ^HTHAUjn
•SffH STREET ^

M.D. Crossland. Chapter 10: Cross-sectional analysis of reading speed
This chapter will use the variables which have been discussed measured in chapters
5-8 to predict reading speed. The results presented in chapter 9 have not been used
in this chapter due to the cause and effect problem discussed in section 9.4.3.
Section 10.2 of this chapter will examine reading speed at the baseline assessment
and section 10.3 will predict reading speed at the exit point of the study.
The results presented in this chapter are the first to examine the factors which limit
reading speed in patients with newly developed macular disease. This section will
address hypothesis 3, that “the measurement of clinical, fixation and eye movement
variables in this study will improve the prediction of reading speed in patients with
central scotomas.”
10.1 Specific method
Multivariate statistical regression was performed on the variables measured in
chapters 5 to 8 (table 10.2) with reading speed being the outcome measure. Systat
(v. 10.2.05, Systat software, Richmond, CA, USA) was used for all of the analyses in
this section. The Systat “regress” function was used for the multivariate analysis.
Entrance and exit criteria were set to 0.15 and the model was constructed both
forwards and backwards. A constant was added into the model so that the model
was not constrained to pass through the origin.
After each model was constructed, the distribution of residual values was plotted.
Examination of the residual plot can indicate whether there is any failure of
normality, nonlinearity or heteroscedasticity amongst the data (Tabachnick & Fidell
2001, p. 120). Finally, as the sample size is relatively small when compared to the
number of variables used, the Systat “boot” command was used to bootstrap the
data. Bootstrapping is a process by which samples are drawn at random from the
data set and the validity of the model is assessed (Tabachnick & Fidell, 2001).

M.D. Crossland. Chapter 10: Cross-sectional analysis of reading speed 170
Independent variables Dependent variable (Outcome)
Distance visual acuity (logMAR)
Reading speed (sentences presented at 3x threshold acuity, words/minute)
Contrast sensitivity (log units)Scotoma size (disc areas)Fixation stability (logBCEA)Presence of pseudofoveation (yes/no; nominal variable)Using a repeatable number of PRLs (yes/no; nominal)Saccadic efficiency (number of saccades)Saccadic latency (msec)Saccadic velocity (°/sec)Table 10.2. Variables entered into the stepwise model.
10.2 Baseline reading speed
10.2.1 Model constructed
Statistical regression indicated the presence of the same model when run forwards
and when run backwards. A combination of three variables can predict reading
speed to an r2 value of 0.68. These factors were saccadic accuracy, fixation stability
and scotoma size (table 10.3).
Step Variable Cumulative r 2 value
1 Saccadic efficiency 0.392 Fixation stability 0.613 Scotoma size 0.68
Table 103. Resu t of statistical regression.
The model predicted from this analysis was:
RS = 292 - 33.7SE - 13.8 FS - 1 SS (Eq. 10.1)
Where RS=reading speed, FS= fixation stability, SE= saccadic efficiency and SS=
scotoma size. Predicted reading speed is compared to actual reading speed in figure
10.1.

M.D. Crossland. Chapter 10: Cross-sectional analysis of reading speed
1 5 0
2 1 2 5 -
n 1 0 0 -
o>cIjj 5 0 -
0 2 5 1255 0 7 5 100 1 5 0P red icted reading s p e e d (w ords/m inute)
Figure 10.1. Scatterplot of predicted reading speed (using equation 10.1) against actual reading speed for all patients at the baseline assessment.
10.2.2 Validity of the model
Multivariate analysis can be weighted by outlying data. For this reason, it is
important to assess the distribution of residual data for any analysis. This
distribution is shown in figure 10.2. There is no failure of normality, nonlinearity
heteroscedasticity amongst these data (Tabachnick 2001, p. 120).

M.D. Crossland. Chapter 10: Cross-sectional analysis o f reading speed
<IDQ
40
30
20
10
0
c/) -1 0LUDC
-20
-30
-40
-50
1 o 1o
— o —
- o -
o° o
oo
oo-
o
1 1 1 o
1 1 pol
1 1 .CL
-
oo
o
o o
-
oo
1
o
1
0 50 100ESTIMATE
150
Figure 10.2. Residual plot for the model in equation 10.1.
Statistical regression can also be biased by col linearity between the predictor values.
Pairwise analysis of the variables indicates that there is a linear relationship between
saccadic efficiency and scotoma size in these patients at the baseline assessment (r =
-0.40, p=0.05). However, the fact that the same model is constructed by forward and
backward regression confirms that both of these variables independently contribute
to the prediction of reading speed (see Tabachnick 2001, p. 142).
Bootstrapping the data, using 1000 repetitions, revealed a Durbin-Watson D statistic
of 2.34, giving a first order autocorrelation of -0.27. This indicates that the model
does not contain nonindependent errors (personal communication, Dr Edmond Ng,
2004).
10.3 Exit reading speed
Figure 10.3 below shows the difference between baseline reading speed and reading
speed at the exit point of the study for the patients seen in this study. There is a

M.D. Crossland. Chapter 10: Cross-sectional analysis o f reading speed 173
weak relationship between baseline and exit reading speed (repeated measures
ANOVA, p=0.13).
150
as1I 100IsT3k_OT3C LWo>cTJCO©tr
Baseline Exit
Figure 10.3. Difference between exit and baseline reading speed for all patients.
Using the model defined in equation 10.1, 33% of the variance in reading speed is
accounted for. As reading speed at the exit point may be predicted by factors other
than those which limit baseline reading speed, the model construction performed in
section 10.2 above was repeated, using the same independent variables, to predict
exit reading speed.
10.3.1 Model constructed
The model constructed by this analysis was similar to that in equation 10.1. Again,
the same model was created by forward and backward multiple regression. This
model can predict reading speed with an r value of 0.59. It contains three
independent variables: fixation stability, saccade efficiency and contrast sensitivity
(table 10.4).

M.D. Crossland. Chapter 10: Cross-sectional analysis of reading speed
Step Variable Cumulative r 2 value
1 Fixation stability 0.262 Saccadic efficiency 0.333 Contrast sensitivity 0.59
Table 10.4. Resu t of statistical regression
The model predicted from this analysis was:
RS = 299 - 14FS - 16.6SF + 65 CS (Eq. 10.2)
Where RS=reading speed, FS= fixation stability, SE= saccadic efficiency and
CS=contrast sensitivity.
10.3.2 Validity of the model
Figure 10.4 shows the plot of residuals against predicted values for this model.
Again, no failure of normality, nonlinearity or heteroscedasticity amongst these data
is seen.
50
<=)qanLUDC
-50
-100-50 0 50 100 150
ESTIMATE
Figure 10.4. Residual plot for the model in equation 10.2.
No colinearity exists between the variables in the model given in equation 10.2.
Bootstrapping with 1000 repetitions gives a Durbin-Watson D statistic of 1.28 and
first-order correlation of 0.23. This confirms that there are no nonindependent errors
in the model.

M.D. Crossland. Chapter 10: Cross-sectional analysis of reading speed
10.4 Discussion
The model presented here shows that nearly 70% of the variance in reading speed at
baseline can be accounted for by three variables; saccadic accuracy, fixation stability
and scotoma size.
By the exit point of the study, the relative importance of these variables has
changed; fixation stability replaces saccadic accuracy and scotoma size has been
replaced by contrast sensitivity in the model. 60% of the variance in exit reading
speed can be predicted by these variables.
One significant factor which has not been measured in this study is patients'
psychological adaptation to their vision loss. Patients are known to follow a
grieving process immediately after losing central vision (section 1.2.3). As patients
move to the stage of acceptance to their visual loss, it is likely that their motivation,
and consequently their reading speed may improve. This important limitation is
discussed further in chapter 13.
The predictor values illustrated in table 10.4 are similar to those suggested by
Schuchard, Naseer and de Castro in their “PRL scoring system” to predict
rehabilitation in macular disease. Schuchard’s system includes two of the measures
described here: fixation stability and “saccadic movement score” which determines
how many saccades are used to fixate a target with the PRL (Schuchard, Naseer &
de Castro, 1999). However, Schuchard has never applied this scoring system to
examine reading speed.
In the present study, factors measured during the reading process were deliberately
not entered into the model. This was to avoid using reading speed to predict reading
speed; for example, the increase in the number of saccades used to read a sentence
may be a predictor for slower reading but it may also be a consequence of slower
reading.
Bullimore and Bailey (1995) did not have these reservations when constructing their
model which accounts for the higher correlation coefficients found in their analysis.
M.D. Crossland. Chapter 10: Cross-sectional analysis of reading speed
Bowers and colleagues performed two separate analyses of reading speed: one using
saccadic variables from a reading task (r2 = 0.94) and one using the parameters of
saccades made during a different task (r2 = 0.34).
In a similar fashion, if the number of forward saccades whilst reading is used to
predict reading speed in the present study, 80% of the variance in exit reading speed
is accounted for.
McMahon found a stronger correlation between saccadic efficiency and reading
speed than was found in the present study (McMahon: r = -0.89; this study: r =
-0.62). However, the cohort of subjects described in table 10.1 above are those who
have received saccadic training. This may account for a stronger correlation than
that found in this study.
Scotoma size limits baseline reading speed but over time, contrast sensitivity
replaces scotoma size in the model. Contrast sensitivity and scotoma size are not
closely related (r = 0.14). This implies that although patients with larger scotomas
read more slowly immediately after scotoma development, other adaptive strategies
become more important in determining how well patients read.
These models have predicted reading speed at two points in time; at presentation and
at the exit point of the study. Figure 10.3 shows that reading speed changes over
time. The difference between the two models given above has shown that the
factors which limit reading speed, and their relative importance, also changes with
time.
Chapter 11 will examine the change in reading speed in patients in more detail and
will determine what factors account for this change in reading speed.
10.4.1 Conclusion
This chapter has performed the first analysis of which factors limit patients’ reading
speed when they first develop macular disease. At presentation, saccadic efficiency,
fixation stability and scotoma size are the most important factors in determining
reading speed, together accounting for 70% of the variance in patients’ reading

M.D. Crossland. Chapter 10: Cross-sectional analysis of reading speed
speed.
Over time, patients’ reading speed changes. At the exit point of the study, fixation
stability, saccadic efficiency and contrast sensitivity are the most powerful
predictors of reading speed, together accounting for 60% of the variance in reading
speed. This model is similar to one previously suggested by Schuchard and
colleagues.
This chapter has confirmed hypothesis 3, that “the measurement of clinical, fixation
and eye movement variables in this study will improve the prediction of reading
speed in patients with central scotomas.”

178
Chapter 11: Longitudinal analysis: Factors which predict change in reading speed
Chapter 10 has shown that reading speed changes in patients between their entrance
and exit visits. This chapter will provide a longitudinal analysis of reading speed in
each patient. It will analyse changes in the variables described in chapters 5 to 8,
and will determine which of these changes lead patients to experience an
improvement, or a deterioration, in reading speed.
Figure 11.1 shows the changes in reading speed over time for the AMD patients.
These figures have been normalised, with reading speed at each visit being shown in
relation to baseline reading speed. Patients whose reading speed ultimately
increases by more than 27% are shown in red, those who exhibit a similar decrease
are shown in blue and those with no change are shown in black. Section 5.3 has
described the basis for using 27% as the threshold for determining a clinically
significant change.
Table 11.1 below shows in which patients reading speed improves, stays the same or
deteriorates over the course of the study.
Reading speed improves by >27%
Reading speed stays within 27%
Reading speed deteriorates by >27%
AS AP JM BNFG BP JW CAPF CT KD DBRH HP MA EC
JA MF IPJE RS JYJF SG RG
Table 11.1. Reading speed change in eac i patient.

M.D. Crossland. Chapter 11: Longitudinal analysis. 179
"80CLCOO)=5 1 .5 “CO0 ----A
0_C
0CO0
CD
1300CLw 0 .5 “O)c~o0 0 0C
Time (months)
Figure 11.1. Change in reading speed for all AMD patients.
Table 11.2 below shows the magnitude of the mean deviation from the baseline
reading speed at each visit for AMD and JMD patients.
G roup M ean deviation from baseline reading speed (words/minute)
1 month 3 months 6 months 12 months
AMD 21 32 22 34JMD 12 11 11 17Table 11.2. Mean deviation from baseline reading speed at each visit.
To ensure that the change in reading speed in patients is not attributable to
regression to the mean, the magnitude of change in reading speed (|(change in
reading speed -1)|) was plotted against baseline reading speed. There is no
relationship between these two variables (r = 0.20; figure 11.2).

M.D. Crossland. Chapter 11: Longitudinal analysis.
■oa>CDQ.w 0 . 8 "o>c■OCO©
c 0 .6 "© o> c 5
0 .4 " o©■O3o) 0.2 ©2
▲ A0"
100 120 14020 4 0 60 80
B a se lin e reading sp e e d (words/m inute)
Figure 11.2. Magnitude of change in reading speed and baseline reading speed. Line shows linear regression, r2=0.04. n=22.
Examination of table 11.2 indicates that the level of change in reading speed is far
greater in patients with AMD than in those with JMD. These two groups of patients
are examined separately throughout this chapter.
11.1 Changes in reading speed for AMD patients
Stepwise multivariate analysis was applied in manner described in the previous
chapter (section 10.1) using the variables shown in table 11.3. Change in these
variables was used to predict change in reading speed over the course of the study.
Visual acuity and scotoma size were excluded from this analysis as they were by
design invariant throughout the length of follow-up of the study.

M.D. Crossland. Chapter 11: Longitudinal analysis. 181
Independent variables Dependent variable (Outcome)
Change in fixation stability (log units)
Change in reading speed (exit/baseline)
Development of pseudofoveation (nominal variable; yes/no)Development of a repeatable number of PRLs (nominal variable; yes/no)Adoption of the “final” PRL (nominal variable; yes/no)Change in saccadic latency (msec)Change in saccadic efficiency (msec)Change in saccadic velocity (°/sec)
Table 11.3. Variables entered into the multivariate model.
The events described in the table above (development of pseudofoveation,
development of a repeatable number of PRLs and adoption of the final PRL) were
only classified as “yes” when they occurred between the entrance point and the exit
point of the study; for example, patients who had already pseudofoveated at baseline
would not be classed as developing pseudofoveation during the length of follow-up
of the study.
11.1.1 Change in reading speed between entrance and exit point for AMD
patients
As figure 11.1 shows, reading speed changed by large amounts in some patients with
AMD. The patient whose reading speed improved most over the length of the study
was FG (exit reading speed = 1.95x baseline reading speed) whilst the poorest was
JY (exit reading speed = 0.05x baseline reading speed). The mean exit reading
speed was 0.91 times the baseline value (sd: 0.46). The distribution of change in
reading speed is normally distributed (Shapiro-Wilk test, W=0.97, p=0.81).
Statistical regression indicated the presence of the same model when run forwards
and when run backwards. A combination of three variables can predict change in
reading speed to an r2 value of 0.78. These factors were fixation stability, the
development of a repeatable number of PRLs and the development of
pseudofoveation (table 11.4).

M.D. Crossland. Chapter 11: Longitudinal analysis.
Step Variable Cumulative r2 value
1 Fixation stability 0.542 Development of repeatable nPRL 0.643 Development of pseudofoveation 0.78
Table 11.4. Resu t of statistical regression. nPRL: number of PRLs.
There is no interaction between these three variables. The plot of the residual data
from this model can be seen in figure 11.3.
1.0
0.5<Z )QCOLU0C
-0.5
0 . 0 ------------------------------------------ T>------------------
0.0 0.5 1.0ESTIMATE
1.5
Figure 11.3. Plot of residual data for the model above.
11.1.2 Change in reading speed between 0 and 3 months for AMD patients
Table 11.2 shows that the bulk of the change in reading speed occurs in the first
three months after recruitment. To determine what factors account for this “early
change” in reading speed, the variables in table 11.3 were entered into a stepwise
model to predict the change in reading speed for the first three months after the
development of the scotoma.
Mean reading speed at the three-month visit was 0.82 times the baseline value (sd:

M.D. Crossland. Chapter 11: Longitudinal analysis.
0.39). The distribution of change in reading speed was normal (Shapiro-Wilk test,
W=0.97, p=0.80).
The stepwise model revealed that saccadic latency and saccadic efficiency are
responsible for this “early change” in reading speed, to an r2 value of 0.46. This
model is described in table 11.5 below.
Step Variable Cumulative r 2 value
1 Change in saccadic efficiency 0.342 Change in saccadic latency 0.46
Table 11.5. Resu t of statistical regression.
There is no interaction between these two variables. The plot of the residual data
from this model can be seen in figure 11.4.
0.6
0.4
0.2<=)9 o.oCOLU
-0.4
- 0.60.0 0.5 1.0 1.5
ESTIMATE
Figure 11.4. Plot of residuals for the “early change” model.
i 1o
_o
_
o— o —o
° o O
oo oo
ooo
1
0
1
11.1.3 Change in reading speed beyond 6 months for AMD patients
Examination of figure 11.1 shows that patients’ reading speed appears to stay
relatively stable beyond the six month visit. All of the patients whose ultimate
reading speed was faster than their baseline reading speed had demonstrated this by

M.D. Crossland. Chapter 11: Longitudinal analysis.
the six month follow-up visit. However, reading speed does deteriorate in some
patients with AMD after the six month visit.
A further stepwise model was constructed to determine what factors account for this
late deterioration in reading speed in some patients.
This model revealed that fixation stability change was the only predictive value for
late changes in reading speed. Change in fixation stability was responsible for 67%
of the variance in late changes in reading speed. This relationship is shown in figure
11.5.
</>
s ■E
CO"O0)2 . 0 . 8 “ V)o>c
(0© _ CC 0 .6
xo■O0)8 - 04 "o>cTJ(C0)cr 0.2
30 2■2 1 1
log Fixation stability (exit) - log Fixation stability (6 m onths)
Figure 11.5. Relationship between changes in fixation stability and reading speed in the “late phase” of the study. n=9.
11.1.4 Discussion
This section has used multivariate modelling techniques to predict the change in
reading speed of patients over the course of this study.
Those patients whose fixation stability improves, who use a repeatable number of

M.D. Crossland. Chapter 11: Longitudinal analysis.
PRLs and who pseudofoveate are the most likely to demonstrate an improvement in
reading speed over the twelve months following the development of a scotoma. The
magnitude of this improvement is not dependent on the baseline reading speed
(figure 11.2).
The advantage of using a longitudinal design rather than a cross-sectional design for
this study is that variance in intelligence, reading ability or other cognitive factors
between patients are controlled to a large extent. However, as discussed in the
previous chapter, this study has not controlled for change in motivation or any
subsequent cognitive decline in our patients. This limitation will be addressed
further in chapter 13.
It is perhaps surprising that reading speed deteriorates so markedly in some of the
patients examined in this study, given that visual acuity and scotoma size is, by
design, stable. One reason for this change may attributable to the fact that only the
dense scotoma size has been measured in this study; those patients whose reading
speed deteriorates may have exhibited a change in the relative scotoma size. It is
tempting to speculate that a decrease in fixation stability is associated with an
increase in the size of a relative scotoma size, which will account for the late
changes in reading speed seen in some patients whose reading speed has previously
been stable.
Early changes in reading speed have been defined as those which occur in the Erst
three months following the development of a scotoma. Saccadic efficiency and
latency are the best predictors of reading speed changes in this early phase of
adaptation; patients whose saccadic latency lengthens and whose saccadic efficiency
improves are the most likely to read more quickly. This is consistent with the
research of McMahon and colleagues who found that immediately after a training
programme, patients who had modified their saccadic efficiency demonstrated an
improvement in reading speed. The data in this thesis also show that if fixation
stability subsequently falls in patients, even those who have modified their saccadic
efficiency, reading speed will deteriorate.
Interestingly there is no association between saccadic properties and the likelihood
M.D. Crossland. Chapter 11: Longitudinal analysis.
of pseudofoveation (nominal logistic regression). This lack of association will be
explored further in the general discussion section of this thesis.
After six months, reading speed is relatively stable. In the absence of visual acuity
or scotoma size changes, fixation stability is the biggest predictor of reading speed
change.
11.2 Changes in reading speed for JMD patients
As table 11.2 shows, the magnitude of change in reading speed for patients with
juvenile forms of macular disease is smaller than that for the AMD patients seen in
this study. There are two possible reasons for this. First, JMD patients may already
have made the necessary adaptations by the time of their first assessment. Second,
JMD patients may be less likely to make these adaptations than patients with age-
related macular disease. Clinical intuition supports the first of these hypotheses.
If the first of these hypotheses is correct, patients with JMD will exhibit a similar
pattern to AMD patients in the “late phase” of adaptation described above. Due to
the small sample size in this group, stepwise regression is not appropriate. However,
fixation stability is responsible for 32% of the variance in the change in reading
speed exhibited by these patients. Adding pseudofoveation or the development of
using a repeatable number of PRLs into this model does not significantly increase
this r2 value.
The differences between JMD and AMD patients will be discussed further in section
13.5 of the discussion chapter of this thesis.
11.3 Conclusion
An improvement in fixation stability, the development of pseudofoveation and the
development of a strategy by which a repeatable number of PRLs is used are the
most important factors in determining whether reading speed changes in patients
with AMD. Together these factors account for nearly 80% of the variance in the

M.D. Crossland. Chapter 11: Longitudinal analysis.
change in reading speed.
Immediately after the development of a scotoma, changes to the saccadic system are
responsible for most of the changes in reading speed.
After six months, patients’ reading speed stays stable unless their fixation stability
subsequently deteriorates. It is postulated that this change is secondary to a change
in the size of the relative scotoma.
Although too few patients with JMD have been recruited for statistical comparison,
the change in reading speed exhibited by these patients is more akin to the “late
phase” changes made by AMD patients.
Why some patients develop the adaptive strategies which cause an improvement in
reading speed whilst others do not will be explored in the next chapter of this thesis.

188
Chapter 12: Factors which predict successful rehabilitation to macular disease
Chapters 10 and 11 have shown that there is a wide range in patients’ reading speed
and that reading speed changes in patients between their entrance and exit visits.
This chapter will use statistical techniques to determine whether baseline
characteristics determine how likely patients are to read fluently at the exit point
from the study. In other words, is it possible to predict how well a patient will read
after 12 months, based on results obtained immediately after the development of a
scotoma?
Section 12.1 of this chapter will define the statistical terms used in this chapter.
These terms include logistic regression, odds ratios and the receiver operating
characteristic. Section 12.2 will assess which patients read at a fluent rate (faster
than 80 words/minute) at the exit point of the study. Section 12.3 will determine
which patients’ reading speed improves, or deteriorates, over the study. Section 12.4
is a general discussion of all of the findings of this chapter.
12.1 Specific methods
12.1.1 Logistic regressionLogistic regression is a statistical technique which allows the prediction of a
discrete, nominal outcome on the basis of a set of variables which may be
continuous, ordinal or nominal. For section 12.2 of this chapter, the outcome
variable is an exit reading speed of faster than 80 words/minute. In section 12.3, two
separate analyses have been performed. The first has an outcome variable of an
improvement in reading speed of 27% or more between entrance and exit of the
study. The second outcome is a deterioration in reading speed of the same amount
over the same time scale.

M.D. Crossland. Chapter 12: Predictive values.
12.1.2 Odds ratiosWhen the outcome variable in a logistic regression is a binary nominal variable, an
odds ratio can be computed which indicates the likelihood of an outcome given the
presence of the predictor. The formula used for this is:
OR = N(outcome +ve. predictor +ve) / N(outcome +ve. predictor -ve) N(outcome -ve, predictor +ve) / N(outcome -ve, predictor -ve)
where N is the number of cases and OR is the odds ratio (Bland & Altman, 2000).
The odds ratio indicates how likely an event is to occur over chance.
Where the predictor is a continuous variable, an interval size has to be used. The
interval size determines the amount of change which is necessary for the probability
to be increased by the given odds ratio. For example, if the interval size is 0.1 and
the odds ratio is 2, then for every 0.1 change in the predictor variable, the odds of the
outcome doubles (that is, it is twice as likely to occur).
12.1.3 The receiver operating characteristicThe receiver operating characteristic (ROC) plot is a way of determining to what
extent results from a predictive test differ amongst subjects who do, or do not, have
a positive outcome. The ROC plots sensitivity against 1 - specificity for every
patient. The area beneath the ROC curve indicates the strength of a test: a perfect
test would discriminate between all patients who have a positive outcome and all of
those who do not, and the area beneath the curve would be 100% of the plot area. A
test performing at chance would have an area beneath the curve of 0.50 (Altman &
Bland, 1994a).
12.2 Prediction of which patients will read fluently at the study exit point
This section examines patients’ baseline characteristics and relates them to their
reading speed at the exit point from the study. Demographic factors, clinical
features and baseline reading speed have been used to predict the presence of fluent
reading at the exit point of the study. Odds ratios have been calculated for each
variable.

M.D. Crossland. Chapter 12: Predictive values. 190
The minimum reading speed for fluent reading has been defined as 80 words/minute,
after the work of Whitaker and Lovie-Kitchin (1991).
Table 12.1 shows the odds ratios (with 95% confidence intervals) for reading at
greater than 80 words/minute at the exit point from the study.
Odds Ratio 95% C.I.Demographic variablesAgeSex (being female)
1.00.54
0.96 -1.03 0 .2 2 -1 .33
Clinical variablesVisual acuity Contrast sensitivity Scotoma size Having JMD Having exudative AMD
1.08 (is: 0.1) 2.40 (is: 0.15) 0.42 (is: 1)1.421.42
0 .7 2 -1 .631 .1 3 -5 .0 7 *0 .1 3 -1 .330 .5 1 -3 .930 .5 5 -3 .63
Reading variablesReading >80 words/min at baseline 3.06 0 .9 6 -9 .7 4Table 12.1. Odds ratios for reading at more than $0 words/minute at the exit pointfrom the study, is: interval size (odds per unit interval). *: statistically significant.
Odds ratios where the confidence interval includes 1 are not statistically significant
Thus contrast sensitivity is the only variable measured at baseline which
significantly predicts whether patients will read fluently at the exit point from the
study. Surprisingly, this is a better indicator than reading speed at the baseline visit.
Figure 12.1 shows the ROC plots for contrast sensitivity and baseline reading speed
respectively. The area under the ROC plot is 0.84 for contrast sensitivity and 0.72
for baseline reading speed.

M.D. Crossland. Chapter 12: Predictive values. 191
1 .00 -
0.90-
0.80-
0.70-
| 0.60- c/>S. « 0.50-
c<D mE w 0.40- h
0.30-
0 .20 -
0 . 10 -
0 .00 -
.00 .10 .20 .30 .40 .50 .60 .70 .80 .901.00 1 -Specificity
False Positive
1.00-j
0 .90-
0.80-
0.70-
£ 0 .60-><7) 0 .50-
w 0 .40-
0.30-
0.20-
0.10-
0 .00-
i— i- — i -
l 1 i 1 i 1 i 1 i 1 I 1 I 1 i 1 r 00 .10 .20 .30 .40 50 .60 .70 .80 .901.00
1 -SpecificityFalse Positive
Figure 12.1. Left: ROC curve for baseline contrast sensitivity predicting fluent reading at exit. Right: ROC curve for baseline reading speed predicting fluent reading at exit.
12.3 Predictive values for reading speed improving o r deteriorating
Similar analyses were performed using two different outcomes; an improvement in
reading speed of 27% or more; or a deterioration by a similar amount. The results of
these analyses are shown in table 12.2.
Improvement in reading speed
D eterioration in reading speed
Odds ratio 95% C.I. Odds ratio 95% C.I.Demographic variablesAge 1.18 0 .0 8 -1 2 .6 1.02 0 .9 7 -1 .08Sex (being female) 0.71 0.24 - 2.09 0.54 0 .2 2 -1 .33Clinical variablesVisual acuity (is: 0.1) 0.88 0 .5 4 -1 .4 3 1.24 0.77 - 2.02Contrast sensitivity (is: 0.15) 1.24 0 .7 1 -2 .1 6 0.83 0 .57-1 .21Scotoma size (is: 1) 0.52 0.07 - 3.5 1.02 0 .5 4 -1 .93Having exudative AMD 1 0.08 - 12.6 2.7 0.24 - 30Reading variablesReading >80 words/min at 0.95 0.33 - 2.78 1.77 0 .6 9 -4 .5 4baselineTable 12.2. Odds ratios for an improvement or a deterioration in reading speed over the course of the study, is: interval size (odds ratio per unit interval).
It was not possible to calculate odds ratios for an improvement or deterioration in
reading speed of patients with JMD as none of them demonstrated a change in
reading speed of this magnitude.

M.D. Crossland. Chapter 12: Predictive values.
12.4 Discussion
The only significant predictor for reading fluently at the exit point of the study is to
have a better contrast sensitivity. Age, sex, the type of disease, visual acuity,
scotoma size and, most surprisingly, baseline reading speed do not predict the
likelihood of fluent reading at the exit point of the study.
Baseline contrast sensitivity can predict the ability to read fluently at the exit point
of the study. The area under the ROC plot for contrast sensitivity is 0.84. This
indicates that if two patients are selected at random, one of whom reads fluently at
the exit point and one of whom does not, there is an 84% chance that the one with
the better contrast sensitivity will be the one which is able to read fluently (Bland &
Altman, 1994a).
It can be seen from table 12.2 that it is impossible to predict whether a patient’s
reading speed will improve or deteriorate based on any of the above variables
measured at the baseline assessment. This finding is clinically encouraging in that it
is possible for all AMD patients of any age, visual acuity or scotoma size to
demonstrate an improvement in reading speed over the course of the study. An
example of such a patient is FG, a 90 year old patient with a dense scotoma of 1 disc
diameter and a presenting visual acuity of 0.6 logMAR. Over the course of the
study, her reading speed improved from 44 to 87 words/minute.
The converse of this finding is that none of the factors described above (apart from
having JMD) are protective against reading speed subsequently deteriorating. These
findings will be discussed further in the general discussion chapter of this thesis.

Chapter 13: General discussion
193
This chapter will add to the specific discussion sections found in each results chapter
and will discuss the principal findings of this study in relation to the hypotheses defined
in the introduction. In particular, interactions between the results found in each chapter
are explored. Limitations of the study are raised in each section and are discussed in
section 13.6. The next chapter reports the clinical implications o f this study and makes
suggestions for future research projects.
13.1 Hypothesis 1: The development of the Preferred Retinal Locus
Hypothesis 1 o f this thesis stated that:
“A fter scotoma development, patients will develop a consistent preferred retinal locus. The number of different PRLs used will reduce from many to one and fixation stability will improve. Patients will lose awareness o f the use o f the PRL.”
The accuracy of this hypothesis is assessed in the following four subsections.
13.1.1 Development of a consistent PRL
The study presented in this thesis is the first to examine the timescale over which the
PRL develops in patients with macular disease. The development o f the PRL is
remarkably quick; half of the patients examined in this study used the same PRL at their
baseline assessment and at all subsequent visits; that is, a consistent PRL was used from
the first attendance.
This thesis has shown that the location of the principal PRL changes in approximately
half o f the patients recruited into this study. At the exit point o f the study, the
distribution of PRL locations is similar to that found in cross-sectional studies such as
those performed by Culham (1993), Sunness (1996) and Fletcher (1999). The results

M.D. Crossland. Chapter 13: Discussion. 194
presented in this thesis corroborate those of previous researchers who suggested that
using a PRL above the scotoma (in visual field space) is suboptimal; all three patients
who initially used a PRL in this location subsequently changed their PRL location.
For those patients who changed their PRL location, the median time taken was three
months. All o f the patients used their final PRL by the six month follow-up visit.
This study has corroborated the opinion of previous researchers that the location of the
PRL does not affect reading speed (Sunness et al., 1996; Fletcher et al., 1999a).
The location o f the final PRL appears to be idiosyncratic; as section 6.1.2.2 shows, there
are no differences between patients who choose to use a PRL in the three locations in
terms of visual acuity, scotoma size or disease type.
13.1.1.1 Do saccadic characteristics determine the final PRL location?
This study has measured more aspects of visual behaviour than many previous
investigations into the location of the PRL. Post-hoc analysis was performed to
determine whether the apparently idiosyncratic nature of the PRL location can be
predicted by any other factors examined in this study, in particular saccadic efficiency.
Although there is no overall difference in saccadic efficiency in any particular direction
(figure 8.4), within patients, performance was frequently better in one direction. To test
the hypothesis that saccadic efficiency will determine the final PRL location, the
direction o f the most efficient saccades at baseline and the final PRL location was
recorded for every patient. The most efficient saccades were those made towards the
location o f the final PRL in only 7/25 patients (35%). In those patients who changed
their PRL location, baseline saccade efficiency predicted the location of the final PRL in
only 4/12 patients (33%; no better than chance). This indicates that patients do not
select their PRL based on the location to which the most efficient saccades are made.

M.D. Crossland. Chapter 13: Discussion. 195
13.1.1.2 What does predict the final PRL location?
None o f the variables examined in this study can predict where the final PRL location of
a given patient will be.
The scotometry performed in this study has only exam ined the extent of the dense
scotoma and has not elicited the presence of any relative scotomas. One possibility is
that patients place their PRL in the area of best functioning retina, regardless of its
retinal position. This may explain why the PRL location changed in some patients;
although their dense scotomas remained stable, the extent o f the relative component of
their scotoma may have changed. An experiment to contribute further knowledge to the
debate over how patients select their final PRL is described later. The statement of
Timberlake and colleagues, that “there appears to be no simple rule by which patients
select a particular PRL”, is reinforced by the work in this thesis (Timberlake et al. ,
1987).
13.1.2 The number of PRLs used
The new quantitative techniques used in this thesis have enabled the num ber of PRLs to
be determined more precisely than has previously been possible. Previous researchers
have described multiple PRLs only when the loci are well separated (by at least 4° in
W hittaker’s study; in different retinal quadrants in the study by Duret and colleagues
(W hittaker et al., 1988; Duret et al.y 1999)).
Chapter 7 of this thesis has shown that although the mean num ber o f PRLs used by
patients falls in some cases, a more pronounced change is that most patients develop a
strategy o f using a repeatable number of PRLs for each position o f gaze. As figure 7.5
indicates, there is no advantage in reading speed in using one PRL rather than two.
However, to use a repeatable number o f PRLs is advantageous.
This work supports the opinion of Duret and colleagues that to use more than one PRL
is not disadvantageous, as long as a strategy for using these multiple loci is employed.

M.D. Crossland. Chapter 13: Discussion. 196
Using multiple PRLs does not preclude the chance of pseudofoveation; there is no
difference in the probability of pseudofoveating between those patients who use one
locus and those who have multiple PRLs (^= 1.78 , p=0.18).
13.1.3 Fixation stability
This work has corroborated the well known finding that fixation stability is severely
im paired in m acular disease (chapter 7; Timberlake et al., 1987; Culham et a l , 1993;
Schuchard & Fletcher, 1994a; Rohrschneider et a l , 1995).
The BCEA values recorded during this study are larger than those which have been
found by other investigators, due to the different test conditions used for measuring
fixation stability, as described in chapter 4. The method of assessing fixation stability
used in this study provides a more realistic view of patients’ natural fixational behaviour
than previous studies have done; using a bite bar or other rigid head immobilisation
techniques will suppress eye movements made to compensate for head motion.
There is a relationship between fixation stability and reading speed. This relationship
has never previously been reported, although it has been suggested in a review paper by
Schuchard (1994). Around 25% of the variance in reading speed can be accounted for
by fixation stability; chapter 10 has shown that this variable has a significant role to
play in the prediction of suprathreshold reading speed at both the entrance and the exit
point from the study.
13.1.4 Awareness of PRL use
Chapter 6 has reported that some patients lose awareness of using their PRL, which has
been defined as pseudofoveation. Sixteen (64%) of the patients made this adaptation
during the year following scotoma development. Patients who made this adaptation
read more quickly than those who do not pseudofoveate. Further, chapter 11 has shown
that the development of pseudofoveation is associated with an increase in reading speed.
Contrast sensitivity, visual acuity and scotoma size do not predict the likelihood of

M .D . Crossland. Chapter 13: D iscussion . 197
pseudofoveation. Similarly, characteristics of the PRL do not determine whether
patients pseudofoveate (PRL location: logistic regression, p=0.33; fixation stability:
Student’s t-test, p=0.55). Pseudofoveation does not occur until patients have developed
their “final” PRL location; as figure 13.1 shows, there is a delay between finding the
final PRL and losing awareness of PRL use. The median time between using the final
PRL location and pseudofoveating is 5.5 months (IQR 0 - 1 1 ) . Losing awareness of
PRL use is, therefore, a later stage of PRL development than using a repeatable PRL
location.
(/)£coE83_J£EQ_
Q)EF
12
10
8
6
4
2
0
0 2 4 6 10 128
Time to final PRL (months)
Figure 13.1. Time to find the final PRL compared to time to pseudofoveate. Line shows y=x.
13.1.5 Limitations
The scanning laser ophthalmoscope provides an excellent mechanism to assess fixation
behaviour in macular disease. However, black-on-white text can not be presented using

M.D. Crossland. Chapter 13: Discussion. 198
the SLO, the field of view of the SLO is limited and patients have to view the screen
from a fixed distance. For these reasons, reading performance was assessed in this
study using a com puter monitor and an infa-red gazetracker.
The m ajor limitation of the latter technique is that the retina has not been viewed whilst
patients have been reading. An assumption has been made that the same retinal
location, and the same number of PRLs are used during the fixation task and whilst
patients are reading. Even if the retina were imaged in this study, it would be very
difficult to determine which retinal area is used for reading as it is not known where a
patient is attending at any given moment. An experimental paradigm to address this
problem has been discussed in chapter 14 of this thesis.
A further limitation of these results is that the interaction between the two eyes has not
been assessed. Although the better eye has been assessed throughout this study, if the
contralateral eye was strongly dominant then the patient might still use their worse eye
to guide fixation (Schuchard et al., 1995). Recent experiments suggest that in patients
with incongruous scotomas due to bilateral macular disease, a difference may exist in
the fixation behaviour under monocular and binocular conditions (Kabanarou et a l ,
2003).
13.1.6 C onclusion
This section has shown that hypothesis 1 is partly correct. It is true to say that a
consistent PRL develops after the onset of the scotoma, and that with time patients lose
awareness of the PRL. However, fixation stability does not systematically improve and
the number o f PRLs does not fall from many to one.
13.2 H ypothesis 2: C hanges in eve m ovem ents
Hypothesis 2 of this thesis stated that:
‘T h e number o f saccades used to locate a target will reduce over time. Foveating saccades will be suppressed and eye movements will be made directly to the PRL rather than to the scotoma. Eye m ovement control will

M.D. Crossland. Chapter 13: Discussion. 199
becom e more efficient when reading; with time, few er saccades will be made to read a sentence, and the number of regressive saccades made during a reading task will fall.”
This hypothesis has been broken into three sections, each o f which is discussed
individually below.
13.2.1 Saccadic efficiency
Chapter 8 o f this thesis has investigated the efficiency o f saccades. A statistically
significant increase in the number of saccades used by patients to observe a target was
found, when com pared to age-matched control subjects. All of the control subjects in
this study located a target within 2 saccades, whilst patients used up to 4 saccades to
com plete the same task. Saccade efficiency improved in some patients, and by the exit
point o f the study eight patients (32%) reliably observed the target with two saccades or
less.
This task was similar to that used by McMahon (M cM ahon et a l , 1991; McMahon et
a l y 1993). M cM ahon also found that the number o f saccades used to perform a task is
doubled in patients with central scotomas when com pared to individuals with normal
vision.
13.2.2 Foveating and non-foveating saccades
This thesis has built upon the work of Stephen W hittaker in investigating foveating and
non-foveating saccades (W hittaker et al., 1988; W hittaker & Cummings, 1990a;
W hittaker & Cummings, 1990b; W hittaker et al., 1991). The introduction to Chapter 8
o f this thesis has reviewed W hittaker’s work and defined non-foveating saccades as
being those which are slower and display a longer latency than foveating eye
movements. As discussed in chapter 8 (p. 141), saccadic latency has been used as the
determinant of whether saccades are foveating or non-foveating.
Fifteen patients (60%) display non-foveating saccades at the exit point of this study.
There is no difference between these patients and those who still make foveating

M.D. Crossland. Chapter 13: Discussion. 200
saccades in terms of visual acuity, scotoma size or diagnosis. These fifteen patients do
not read any more quickly than those who do not make this adaptation (p=0.61).
13.2.3 Eye movements made whilst reading
The number o f forward saccades used to read a sentence, the number of regressive
saccades and the number of saccades used to find the start o f a line are closely related at
the baseline visit. At the baseline assessment, these variables are linearly related to the
num ber o f saccades used to view a target.
In some patients the number of saccades used to read a sentence falls. These changes
are connected to an improvement in reading speed, but are not related to a change in
other aspects o f the saccadic system such as saccadic latency or efficiency. This lack of
a transfer between the number of saccades used to find a target and the number of
saccades used to read may explain why changes in saccadic properties are not a
significant predictor of an improvement in reading speed over the course of this study.
Fixation duration has been found to be linearly related to reading speed in patients and
in control subjects in this study. This relationship is similar to that previously described
by Rayner (Rayner, 1978). Fixation duration remains unchanged over the course of this
study.
13.2.4 Limitations
The m ajor limitation of this section of the study is, once again, that the retina was not
imaged during the saccadic assessment. The infra-red eyetracker was chosen to
measure eye movements because of its high speed, to allow detailed assessment of
saccade dynamics. An alternative approach would have been to use the SLO for the
investigation of eye movements. This would have determined whether patients were
truly making foveating or non-foveating eye movements, but would have reduced the
accuracy o f the latency and velocity measurements.
The ideal solution would be to have a system which enables retinal imaging, high-speed

M.D. Crossland. Chapter 13: Discussion. 201
eyetracking and full colour stimulus display. Possible solutions to this problem have
been addressed in chapter 14.
13.2.5 C onclusion
Hypothesis 2 has been found to be partly correct. In some patients, the num ber of
saccades used to locate a target reduced with time, whilst in other patients foveating
saccades were suppressed. Eye movement control for reading became more efficient
when reading in some patients.
13.3 H ypothesis 3: P red iction o f read ing speed
Hypothesis 3 states:
“The measurement of clinical, fixation and eye movement variables in this study will improve the prediction of reading speed in patients with central scotomas.”
Chapter 10 of this thesis has used multivariate analysis to predict reading speed on the
basis of clinical features and measurements made of fixation stability and eye
movements. The model constructed is able to account for 68% of the variance in
reading speed at baseline and 59% of the variance at the exit point of the study.
Although these r2 values are smaller than those of other researchers (table 10.1;
(McMahon et al., 1993; Bullimore & Bailey, 1995; Bowers et al., 2001)), these
previous investigators have all measured various parameters whilst patients are reading.
This creates a classic cause and effect problem: it is impossible to determine whether
the reduction in a variable (e.g. the number o f letters per forward saccade) is a cause of
slower reading speed, or a consequence of slower reading speed (Dowe, 1997). If
parameters from the reading task are entered into the model, 87% of the variance in
reading speed in this study can be accounted for.
13.3.1 L im itations
In common with all previous studies of this nature, a limitation to the modelling
performed in chapter 10 is that the model has been created on the basis of a limited

M.D. Crossland. Chapter 13: Discussion. 202
num ber o f patients. Although the effect of outliers has been controlled for to some
extent by monitoring of outlying data and bootstrapping techniques, the only real way to
validate this model is to apply is prospectively to another cohort o f patients. It is
possible that the patients recruited for this study may not be representative of the
m acular disease population as a whole. This concern is addressed further in section
13.6 below.
13.3.2 Conclusion
The results in this thesis have confirmed hypothesis 3, that the measurement of clinical,
fixation and eye movement variables in this study improve the prediction of reading
speed in patients with central scotomas.
13.4 Hypothesis 4; Functional performance will improve
Hypothesis 4 states:
“Reading performance will improve over time, in tandem with the improvements in fixation and eye movement control described above.”
It can be seen from figure 11.1 that there is no systematic im provement in reading speed
in the patients recruited into this study. Although this result is initially disappointing, it
must be remembered that no training was incorporated into this study and that such
intervention may improve reading speed in the remaining patients. The factors which
influence absolute reading speed and changes in reading speed are described in chapters
10 and 11 and are shown in figure 13.2 overleaf.
Three factors were found to influence change in reading speed between the entrance and
exit point of the study; an improvement in fixation stability, the development o f a
strategy by which patients use a repeatable number of PRLs, and non-awareness of PRL
use. Together these strategies account for 78% of the variance in reading speed change.
As some patients* reading speed deteriorates over the course of this study, these factors
are also predictors for a deterioration in reading speed; an increase in fixation stability is

Figure 13.2. Factors
which
influence absolute
reading speed
and changes
in reading
speed in
patients with
AM
D.
CROSS-SECTIONAL ANALYSIS (ABSOLUTE READING SPEED)At baseline, limited by: At exit, limited by:1. Saccade efficiency 1. Fixation stability2. Fixation stability 2. Saccade efficiency3. Scotoma size 3. Contrast sensitivity
0505ooS ’C"*aa
rr
o.5orS05
CDpa9*5'era05
Ha>cl
2bn- to
aCl
nc r5•a
----------------
Early change: 0 to 3 monthsDetermined by saccadic changes
Overall change: 0 to exitDetermined by changes in fixation stability,
using a repeatable number of PRLs and developing pseudofoveation.
Late change: 6 to 12 monthsDetermined by changes in fixation stability
LONGITUDINAL ANALYSIS (CHANGE IN READING SPEED)ts>©u>

M.D. Crossland. Chapter 13: Discussion. 204
13.4.1 The difference between “early” and “overall” change in reading speed
Figure 13.2 and chapter 11 indicate that the initial changes in reading speed, made over
the first three months, are attributable largely to changes in saccadic properties. These
factors are not included in the model which predicts change in reading speed at the exit
point o f the study. However, these early changes do not adequately predict exit reading
speed; saccadic efficiency and latency are together responsible for only 18% of the
variance in reading speed change over the course of the study. This implies that there
are two separate phases to patients' adaptation; early changes are determined by
saccadic properties whilst later changes are determined by fixation characteristics. O f
the two phases, the second phase is more significant in predicting patients' ultimate
reading speed.
13.4.2 The importance of fixation stability
Change in fixation stability is the most important variable in predicting change in
reading speed over the timescale of this study. Further, it is the only factor which
significantly affects reading speed after patients have suffered from macular disease for
over six months. Examination of figure 13.2 shows that after six months, a
deterioration in reading speed is more likely than an improvement. By design the
patients who were included in the study beyond six months had stable lesions; the area
o f dense scotoma and visual acuity were unchanged. As previously discussed, the area
o f relative scotoma was not measured. It is possible that im pairm ent in fixation stability
is connected to an increase in the size of the relative scotoma. This limitation is
discussed further below in section 13.4.5.
13.4.3 The importance of contrast sensitivity
Chapter 10 has shown that contrast sensitivity is more im portant than visual acuity,
disease type or scotoma size in determining how quickly patients read at the exit point
o f the study. This reinforces previous descriptions of the importance o f contrast
sensitivity in predicting reading speed in patients with low vision (Legge et al., 1985a;
Legge et a l , 1985b; Legge et al., 1987; Rubin & Legge, 1989; Lawton et al., 1998).

M.D. Crossland. Chapter 13: Discussion. 205
Interestingly, contrast sensitivity is known to be related to subjective levels of
im pairm ent in low vision observers (Lennerstrand & Ahlstrom, 1989; M cClure et a l ,
2000).
A reduction in contrast sensitivity may be related to the presence of a relative scotoma
(Mitra, 1985). It is tempting to speculate that the level of contrast sensitivity
im pairm ent in this study is related to the size of any relative scotoma present. It would
be interesting to know whether the area of the relative scotoma is as closely related to
reading speed as contrast sensitivity is in this study. Unfortunately relative scotoma
dimensions were not recorded in the present study.
Chapter 12 has shown that contrast sensitivity is the only measurement made at baseline
which can predict whether patients will read fluently at the end o f the study. Contrast
sensitivity may precede an event which causes reading speed to become impaired; in
geographic atrophy, contrast sensitivity is impaired before the foveal centre becomes
atrophic (Sunness et a l , 1995). Relative scotoma may precede the development of a
dense scotoma from detachment of the sensory retina in patients with exudative AMD
(personal communication, Professor A.C. Bird, London, 2004).
Seven patients were withdrawn from the study earlier than the scheduled end-point
because o f disease progression (see Appendix 1). Disease progression was determined
as being a 0.2 logM AR change in visual acuity or an increase in the size o f the dense
scotoma. To determine whether low contrast sensitivity preceded progression of
disease, an odds ratio was calculated with interval size 0.15. Baseline contrast
sensitivity not predict an early exit from the study (OR: 0.91; 95% C.I.: 0.63-1.32). A
change in contrast sensitivity does not appear to precede exit from the study (OR: 0.91
(95% Cl: 0.50-1.66).
13.4.4 Other factors which predict an improvement in reading speed
The amount o f reading which patients did at home was not measured in this study.
Although patients who practise reading at home may be more likely to display an

M.D. Crossland. Chapter 13: Discussion. 206
im provement in reading speed, it is difficult to differentiate cause from effect: patients
who notice that their reading speed has improved are far more likely to attempt to read a
book or newspaper than those who do not.
13.4.4.1 Self-prescribed training
Although this thesis describes a natural history study which specifically excluded any
training or other intervention, three patients reported that they did practice fixation tasks
at home. PF reported that he practiced looking at the ends o f beams on the ceiling
(mimicking the saccade task in this study), JF practiced looking towards the red LED
light on her television set and SG tried to make objects disappear by looking at them.
Each o f these patients volunteered this information without being asked so it may be
that other patients behaved in a similar way at home but did not admit to this in the
laboratory.
The tasks practiced by PF and JF are similar to saccade training tasks such as those used
by M cM ahon and colleagues (McMahon et al., 1991; M cM ahon et a l , 1993). SG ’s
negative feedback training has not previously been described but is likely to detract
from the likelihood o f pseudofoveation so would not be recom m ended to others, based
on the results o f this thesis. Although it is impossible to statistically analyse whether
these patients perform any better than those who do not train their visual behaviour at
home (due to the small numbers involved and the fact that it is unknown whether other
patients trained at home), it is worth noting that PF’s reading speed improved by 27%
over the course o f this study, JF’s stayed constant and SG ’s fell by 16%.
13.4.4.2 CCTV use
During a retrospective trawl of patients’ notes, it was noticed that those who had a
closed circuit television low vision aid (CCTV) appeared to be more likely to read
quickly than those who did not. Post-hoc analysis did not reveal this effect to be
statistically significant but there was a trend towards an increased likelihood of reading
fluently at the exit point with CCTV use (odds ratio 2 .66 ,95% C .1.0.73 - 9.71). This
effect may be due to practice, rather than training. Further, those patients who are

M.D. Crossland. Chapter 13: Discussion. 207
capable o f reading fluently are more likely to appreciate an im provement with a CCTV
and therefore to purchase one.
13.4.4.3 Motivation
The Oxford English dictionary defines motivation as being “the general desire or
willingness o f someone to do something; drive, enthusiasm” (2nd edition, 1989). This
description matches some of the patients in this study far more than others, and patients
who appear to be more highly motivated appear to be more likely to demonstrate an
improvement in reading speed than those who are not. O f course, in the context of this
study, this observation is purely anecdotal. Although psychological instruments for
determining motivation do exist, such as the Reiss profile (Reiss & Havercamp, 1998),
they have not been applied in this study.
13.4.5 Limitations
The primary limitation of this analysis is that the area of relative scotoma was not
recorded. It could be that the deterioration in reading speed experienced by some
patients is a consequence of an increase in the size of the relative scotoma rather than
any other adaptive strategies. This change would confound the models which have been
created in chapter 11.
M easurement o f relative scotomas using the scanning laser ophthalmoscope is a slow,
fully manual procedure without the benefit of thresholding algorithms such as those
developed for the Henson field analyser (Henson, 1993). To measure a dense scotoma
manually in this patient group (using only one target intensity) took up to ten minutes.
Manual mapping isopters of different target intensity would take far longer and would
not be practical for the majority of the patients assessed in this study.
13.4.6 Conclusions
The first assumption of hypothesis 4, that reading speed will improve over time, has
been rejected by the results presented in this thesis. However, reading performance
changes, where they do occur, appear to be connected with changes in fixation stability
M.D. Crossland. Chapter 13: Discussion. 208
and eye movement control.
13.5 Hypothesis 5: Superior performance of patients with .IMP
Hypothesis 5 of this thesis reads:
“Patients with juvenile macular disease will make the adaptations described in sections 1.7.3.1 and 1.7.3.2 above more quickly and more fully than will those with AMD.”
13.5.1 Speed of adaptation
As chapters 6 and 7 have shown, the PRL appears to develop very quickly in patients
with JMD. The median time for the JMD patients to pseudofoveate was one month, and
all o f the patients use a repeatable number o f PRLs within three months.
JM D patients do not show significant changes in reading speed over the course of this
study. As section 11.2 of this thesis has described, this implies that any adaptations
have made immediately, by the time of their first laboratory assessment. The minimum
time period between vision loss and initial assessment in this study was one week, due
to the time required for patients to present, have a medical retina opinion, be informed
about this study, give informed consent and attend the laboratory for baseline
assessment. For some JMD patients this delay was two to three weeks. It was
impossible, therefore, to assess whether the younger patients did make quick adaptive
changes over these first three weeks. Unfortunately this delay is inevitable in this type
o f research.
13.5.2 Fullness of adaptation
All five o f the patients with juvenile macular disease pseudofoveated and used a
repeatable number of preferred retinal loci. In other regards, there are not differences in
the adaptive strategies exhibited between the five JMD patients and the 20 AMD
patients in this study. JMD patients are no more likely to read suprathreshold text
fluently than their compatriots with AMD. Initially, this result is surprising and
contradicts the author’s clinical intuition gained by working in a low vision clinic for

M.D. Crossland. Chapter 13: Discussion. 209
several years. However, it must be remembered that reading speed has been assessed in
this study when using magnified text on a monitor. Patients have not been required to
use any low vision devices, to correctly position the text to be read, to adjust their
viewing distance so that the text is in focus or to handle the controls on a CCTV. By
eliminating these dexterity requirements, with which clinicians in low vision clinics are
very familiar, patients with AMD are able to read just as quickly as those with JMD.
This finding is o f great importance and emphasises the need for well designed low
vision aids and careful patient instruction in their use.
Rehabilitative outcomes of patients following sensory loss in other areas of medicine do
not appear to be age dependent unless the impairment occurs in childhood. For
example, in hearing loss secondary to noise exposure, impairment is not thought to be
dependent on the age of onset (see (Syka, 2002) for a review). Similarly, the age of
onset does not affect the rehabilitation of visual neglect following cortical lesions
(Kerkhoff, 1998). It should not be surprising that patients with AMD are capable of
reading just as fast as those with JMD.
13.5.3 Limitations
The num ber of patients recruited who suffered from juvenile forms o f macular disease
was sm aller than was initially hoped. The major reasons for this were difficulty in
identifying eligible patients due to the different mode of onset and the relative rarity of
juvenile forms o f macular disease. Understandably, some patients were unwilling to
participate in this study due to their work, study or family commitments. The time at
which patients were eligible for recruitment into this study was, of course, at a very
stressful point in patients’ lives. For the same reasons, some JM D patients attended less
frequently than the AMD patients.
13.5.4 Conclusion
This section has shown that there is evidence that JMD patients adapt more quickly than
those with AMD do, but that there is no difference in the completeness of this
adaptation. Hypothesis 5 of this thesis can not be confirmed on the basis o f the research

M.D. Crossland. Chapter 13: Discussion. 210
carried out in this study.
13.6 Limitations of the study
Sections 13.1 - 13.5 of this chapter have described limitations of this study which are
specific to the five hypotheses tested. This section will describe five further potential
limitations of the study: how representative these results are of patients’ behaviour in
the “real world” ; whether the length of follow-up of this study is adequate; the onset of
disease; possible enlargement o f the relative scotoma; cognitive issues and
psychological issues.
13.6.1 Relevance of the results
This study has only attempted to examine the visual behaviour o f patients with central
field loss caused by AMD, Stargardt disease or Best disease. The results of this thesis
can not, therefore, be transferred to patients with other forms of macular disease such as
macular hole or central serous retinopathy, or to those with traumatic macular damage
such as that experienced by accidental laser injuries or solar bums. For example, the
rehabilitation of a patient with laser injury has been reported to be far quicker (Zwick et
a l, 1998). It is likely that this difference can be attributed to the circumscribed nature
of the lesion and the motivation of the patient.
The m ajor outcome measure throughout this thesis has been reading speed. Reading
was chosen as the outcome measure due to its importance, the frequency of patient
complaints about being unable to read and its predictive value for performance on other
tasks (M angione et al., 1998; W olffsohn & Cochrane, 1999; M cClure et al., 2000).
Reading speed has been measured under nearly optimal conditions; text was presented
one sentence at a time, at a large size and high contrast, on a com puter monitor placed
50cm away from the patient. Only a simple reading addition was required to read these
sentences. This task is far easier than most reading tasks which patients will perform

M.D. Crossland. Chapter 13: Discussion. 211
outside the laboratory such as reading a newspaper, checking shop prices or following a
recipe book. This reading task was designed to remove the confounding effects of
reading with low vision aids such as differences in the field of view between different
devices, or practice in the use of magnifiers. However, patients were prescribed
appropriate low vision devices at their baseline attendance and these LVAs were
reviewed at each subsequent visit. It is entirely possible that some o f the strategies
which patients adopted were not of any benefit for the rather artificial task of reading
sentences on a screen but were of use when reading with a magnifier. For example,
some patients may have developed a “steady eye strategy” for reading with their LVA
which was unhelpful when reading text on the monitor (Dickinson, 1998).
It is im portant to remember that few people spend the bulk of their time reading;
especially amongst those with vision loss. It may be that patients have developed
viewing strategies which are optimal for other tasks such as seeing facial expressions,
watching television or navigation rather than for reading. No attempt was made in this
study to determine whether patients* visual behaviour was optimised for reading or for
another task. This would be an interesting subject for future research projects to
investigate.
M obility performance has been elaborately assessed in real and virtual environments
under visual impairment by several researchers, such as Turano (Turano et al., 1998;
Turano et a l, 1999; Turano et al., 2001; Turano et a l, 2002). An assessment of real
world performance under binocular conditions was deemed to be beyond the scope of
this thesis; however such assessment would have been of considerable interest.
13.6.2 Length of follow-up
This study has only assessed visual behaviour in the first twelve months following the
development of a scotoma in each patient’s second affected eye. The location o f the
PRL at the exit point from this study matches those results found by cross-sectional
studies of visual behaviour in macular disease (see table 6.4). This suggests that by the
end o f this study, patients are displaying their final PRL location. Although

M.D. Crossland. Chapter 13: Discussion. 212
pseudofoveation does not occur in all patients within the course of this study, in those
patients where this adaptation is made, it occurs within six months. The proportion of
patients which have made this adaptation in this study (67%) is similar to that described
in previous studies (86%; W hite & Bedell, 1990). Further, the proportion o f patients
using multiple PRLs at the exit point of this study (44%) is very similar to the
proportion found by W hittaker (39%, (W hittaker et al., 1988). These findings imply
that, from the point of view of the development of the PRL, the length of follow-up for
this study is appropriate.
Saccadic properties of the patients seen in this study do not exactly match those of
previous researchers. At the exit point of this study 15 patients (60%) appeared to be
making non-foveating saccades (see chapter 8). A higher proportion of patients used
non-foveating saccades in the studies by White (95%, White & Bedell, 1990) and by
W hittaker (94%, W hittaker et al., 1991). The one patient in W hittaker’s study who did
not make non-foveating saccades had only a 12-month history o f m acular disease. It
may be that if the patients in this study were followed up for longer then their saccadic
system may adapt further.
Seven o f the patients in this study were removed from the study before the end of their
planned follow-up due to deterioration in their macular disease. The findings of this
study are contingent on the disease remaining stable. Therefore, the benefits of
lengthening a longitudinal study o f this nature would be in part counteracted by the
reduction in the number o f patients who would still exhibit unchanged macular disease.
13.6.3 The onset of disease
Patients have been recruited when they reported that their vision deteriorated and
attended the hospital. The time of recruitment is, therefore, dependent on each patient’s
individual judgem ent of when their disease worsened rather than by any objective
measure o f the onset of disease. In some instances patients had not attended the hospital
for many years prior to the visit leading to their recruitment for this study. It is
unknown whether these patients had any evidence of macular disease before their

M.D. Crossland. Chapter 13: Discussion. 213
attendance. Strictly speaking, this study has reported visual adaptation to a visual event
(being a sudden decrease in vision) rather than the onset of macular disease.
The only way to overcome this would be by repeated visits o f patients with a macular
lesion in one eye, where the healthy eye could be assessed until the disease process
became apparent. Such a study design would require a very large expense o f time on
the part of patients and investigators.
13.6.4 Potential enlargement of the area of relative scotoma
The possibility o f the relative scotoma enlarging during the course o f this study has
already been referred to. If the relative scotoma increases in the absence of an absolute
scotom a enlargement, a reduction in performance on contrast sensitivity and fixation
stability would be expected. If the enlargement was sufficiently great, PRL location and
the presence pseudofoveation may also change. As no patients in this study experienced
a change in PRL location after 6 months or went from pseudofoveating to non-
pseudofoveating, it appears unlikely relative scotoma has increased by a large extent.
13.6.5 Cognitive factors
No attempt has been made to control for cognitive decline over the course o f the study.
Given the age o f many of the participants, it is feasible that changes in reading speed
may be unrelated to visual factors, but actually be caused by a change in a patient*s
neurological condition. Although all of the patients were apparently cognitively intact
throughout the period of this study and did not have any diagnosed neurological disease,
formal assessment of their cognitive function at each visit would have been o f benefit.
13.6.7 Psychological factors
The patients assessed in this study all chose to participate and were consequently
sufficiently motivated to attend the laboratory repeatedly. The incentives given of
having frequent LVA reassessment is also likely to appeal more to those patients who
are likely to read frequently at home than to patients whose interests are less cerebral.
Although education was not formally assessed, anecdotally, the patients were more

M.D. Crossland. Chapter 13: Discussion. 214
highly educated than many patients seen in ophthalmology clinics; several held higher
degrees and nearly all worked in the professions. The results reported in this thesis may
not be transferable to patients who were less enthusiastic about reading.
Section 1.2.3.1 of the introduction to this thesis has discussed the psychological
adaptation of patients to visual loss. An inevitable consequence o f a study which
recruits patients as they report second-eye visual impairment is that they will be at the
initial stage o f the grieving process. Over the course of twelve months they would be
expected to reach the stage of acceptance to their visual loss. Psychological adaptation
may confound the visual rehabilitation which this study aims to identify.
13.7 Meeting the aims of the study
Section 1.7.3 of this thesis described the aims of the study. This section will briefly
review these three aims and will assess how fully this thesis has addressed them
13.7.1 Aim 1
The first aim of the study was “to examine and quantify the adaptive strategies which
are naturally adopted by patients who have lost central vision due to m acular disease,
with particular reference to fixation behaviour, the number of preferred retinal loci used
and the use o f non-foveating saccades.” Fixation and saccade behaviour have been
measured using sophisticated instruments, whilst a novel technique has been developed,
validated and applied to objectively determine the number o f loci used for fixation. No
intervention has been used, to determine the natural history of these adaptive strategies.
13.7.2 Aim 2
The second stated aim o f this study was “to determine the changes in these adaptive
strategies which occur for a period of twelve months immediately following visual loss
in the second eye to lose central vision.” This study has addressed this aim by
recruiting patients immediately after a significant drop in their perceived central vision

M.D. Crossland. Chapter 13: Discussion. 215
in the second eye to be affected by macular disease, and by following patients for this
length o f time.
13.7.3 Aim 3
A im 3 was “to determine the relative utility of each of these adopted strategies, with
particular reference to reading speed and change in reading speed.” Reading speed has
been carefully measured at each visit and multivariate statistical techniques have been
used to model the relative importance o f these adaptive strategies in terms of absolute
reading speed and change in reading speed.

216
Chapter 14: Clinical implications and suggestions for future research
This chapter will discuss the implications of the work presented in this thesis for
clinicians working in low vision and ophthalmology clinics. It will also suggest future
research projects to answer some of questions which this thesis has raised.
14.1 Clinical implications
The clinical implications o f this thesis can be grouped into three major categories;
advice for counselling patients with macular disease, practice in low vision clinics and
suggestions for the development of training programs.
14.1.1 Implications for low vision assessment and counselling patients with AMD
An im portant finding of this thesis is that it appears patients with AMD are able to read
just as well as those with JMD. This finding contradicts the experience o f many
practitioners working in low vision clinics. Section 13.5 of this thesis has discussed
how this difference may be attributable to the handling of low vision devices. This
reinforces the importance of patient education in the use of low vision aids, as well as
the necessity for good ergonomic design.
The importance of contrast sensitivity in determining reading speed was described in
chapter 12 and section 13.4.3. It is suggested that measurement o f contrast sensitivity
should be an integral part of every low vision assessment to gain a more complete
understanding of the level of impairment which patients with m acular disease
experience.
This thesis has shown that some patients with relatively poor visual acuity and large
scotomas managed to read fluently at the exit point of this study. The results of this
thesis suggest that patients should not be too despondent if their reading speed at

M.D. Crossland. Chapter 14: Clinical implications and suggestions for future research 217
presentation is relatively poor, as in certain patients reading speed improves markedly
over the following six months. As always, practitioners should avoid giving patients
false hope; reading speed does deteriorate in a large proportion o f patients.
Figure 13.2 illustrates that some patients experienced dramatic changes in their reading
speed over the course of the study. This has important implications for the provision of
LVAs for patients; the device selected for a patient at their baseline visit will not
necessarily be the correct device after six months. In this study LVAs were reviewed at
each patient visit. Anecdotally, several patients were prescribed devices with lower
magnification at subsequent visits, implying that as the adaptive processes described
here develop, less magnification is required to perform a task. It is therefore suggested
that all patients seen in the low vision clinic are offered review appointments after they
have adapted to their visual loss.
14.1.2 Training visual behaviour
Section 1.6 o f the introduction to this thesis introduced three training programs for
patients with macular disease; training awareness of the PRL location; teaching the use
o f an “optimal” PRL and teaching eye movement control.
The method o f training awareness of the PRL location, as advocated by Holcomb &
Goodrich (1976) and by Shuchard and colleagues (1994), is not supported by the results
presented in this thesis. Conversely, chapter 6 of this thesis has shown that non
awareness of the PRL is o f benefit in determining which patients read quickly at the exit
point o f this study. This result indicates that training awareness o f the PRL may be
counterproductive in this group of patients.
Chapter 6 of this thesis has found that the location of the PRL is not related to reading
speed at either the baseline assessment or the exit point of the study. This finding has
corroborated work by other groups (Sunness et al., 1996; Fletcher et al., 1999b). This
finding does not directly support training systems which encourage patients to use an
alternate PRL, such as those described by Goodrich or Nilsson (Goodrich et al., 1985;

M.D. Crossland. Chapter 14: Clinical implications and suggestions for future research 218
Nilsson et al., 1998). However, Culham and colleagues have shown similar techniques
to improve fixation stability (Culham et al., 1997). This may explain, in part, the
reading speed improvement described by these groups.
According to the results of this thesis, teaching eye movement control in the manner
described by M cM ahon (1993) is the training system most likely to be of use in this
patient group. Chapter 8 has shown saccadic efficiency to be related to reading speed,
and M cM ahon’s patients demonstrated an improvement in both saccade efficiency and
reading speed. However, chapter 11 has shown that although saccadic properties are
responsible for short-term changes in reading speed, fixation stability remains of more
im portance for long-term reading speed improvements.
An alternative method to training better eye movement control is to teach patients to use
the steady eye strategy whereby text is moved (either by being scrolled electronically or
by the patient moving the page) whilst the eye remains static. A ssessment of reading in
this method can help to quantify the amount of benefit which can be gained by
developing optimal eye movement strategies.
14.1.2.1 An “ideal” method fo r training visual behaviour in patients with MD?
Chapter 11 has shown that the factors which are of most importance in predicting a
long-term increase in reading speed are fixation stability, using a repeatable number of
PRLs and fixation stability. Further, chapter 10 has shown that saccadic efficiency is of
im portance in determining patients’ absolute reading speed.
The results of this thesis suggest that the most useful training program may involve
tasks which improve fixation stability, which train patients to use a repeatable number
o f PRLs, and which train patients to ignore the fact that they are using a PRL. A
suitable task may be to follow a target on a screen which progressively gets smaller (so
that m ore precise fixation is needed to identify it). This system w ould also train saccade
efficiency. Although saccade efficiency has not been shown to improve reading speed
over the course o f the study, it is of importance in the early stage o f rehabilitation.

M.D. Crossland. Chapter 14: Clinical implications and suggestions for future research 219
Further, saccadic efficiency is a predictor o f a high absolute reading speed (chapter 10).
O f course, such a training scheme would need extensive development and validation
before being introduced into clinical practice.
14.2 Suggestions for future research
14.2.1 The efficacy of training
A logical extension to this study is to investigate whether practitioner intervention can
improve patients’ adaptation to central vision loss. Several research groups have
docum ented that reading speed or other measures of visual performance can improve
with training, using a variety of methods (section 1.6, Goodrich & Mehr, 1986; Nilsson
& Nilsson, 1986; McMahon et al., 1993; Nilsson et al.t 1998). A limitation of many
previous studies in this area is the lack of control groups who receive equal contact time
with a health care professional. Patient motivation could well be a confounding factor;
those who are most highly motivated to read again are more likely to attend multiple
training sessions and to practice at home.
It is important to dissociate training from practice effects. Training is reserved for
programs by which patients receive feedback, whereas practice is repetition of a task
w ithout feedback (Chung et al., 2004).
The ideal experiment to address the success of training o f visual behaviour would be of
a double-masked design. Patients would be randomly assigned to a treatment and a
control group, with stratification based on their disease type, visual acuity and ideally
motivation (as assessed by a psychological instrument). Both the treatment and control
groups would have equal amounts of clinic time and would have “homework” to
perform. In the treatment group the contact time would involve task training and the
homework would be to perform, for example, training of eye movements. The control
group would have contact time with a rehabilitation worker and would be asked to use

M.D. Crossland. Chapter 14: Clinical implications and suggestions for future research 220
the “Learn to use your vision for reading” workbook (LUV workbook) at home. The
LUV workbook consists of reading tasks which get progressively more difficult
(W atson et a l , 1992; W right & Watson, 1995). Reading speed would be assessed at
various stages by investigators who would be masked as to the group allocation of each
patient.
14.2.2 Fixation assessment during reading
As section 13.1.5 has described, a limitation of this study is fixation behaviour was not
monitored with the SLO whilst patients were reading. The eyetracker was used for
reading assessment due to its larger field of view, higher stimulus quality and free-head
nature.
Equipm ent modifications could overcome some of these difficulties. Combining three
lasers, with long, medium and short wavelengths within the visual spectrum could
enable the production o f full-colour stimuli. Using this technique may allow black-on-
white text to be produced, although the problem of artefacts appearing within the raster
from curved letters would need to be addressed (Culham et al., 1992). Unfortunately
such a system has not been sufficiently developed (Personal communication, Prof. F.
Fitzke, London, 2003). A simpler equipment modification would be to use a semi-
silvered m irror to reflect stimuli from a computer monitor onto the viewing axis of the
SLO. This technique was applied in the validation experiment described in section 4.1.
Unfortunately the contrast of the stimulus was reduced and it was decided not to use this
approach for the current study.
Even if these technical problems are overcome, it is very difficult to know which retinal
area a patient is using for reading at any given time. As a delay exists between
attending a word and reading aloud, patients are not necessarily attending to the retinal
area corresponding to the location of the word at the time when they read it aloud. This
is particularly acute when more than one PRL is employed. A way o f overcoming this
would be to present a sentence of prose with words changing every few milliseconds
(fig 14.1). Any combination of the four words would make some sort o f sense. If

M.D. Crossland. Chapter 14: Clinical implications and suggestions for future research 221
patients are asked to read aloud, the retinal location which corresponds to the word read
when it was displayed must be that used for reading.
0 msec: Mark's car doesn't start100 msec: Mike's cat isn't asleep200 msec: Mick's dad hasn't eaten300 msec: Matt's dog wasn't cleanF ig u re 14.1. Text which could be presented on the SLO to determine which retinal area is used for reading.
14.2.3 A ssessm ent o f the choice o f P R L location
Despite the detailed analysis performed in this thesis, it is still not clear why there is no
systematic location for the patients’ final PRL location. It is still unknown whether the
PRL is selected because it is in the best functioning area o f remaining retina or whether
performance at the PRL is better because of practice in its use. Objective techniques
such as electroretinography could be used to determine retinal performance at the PRL
and at an equally eccentric non-preferred retinal location. The results of these tests
would indicate whether retinal considerations predict the location o f the PRL or
whether other factors are of more importance.
14.2.4 T he ro le o f co rtical ad ap ta tio n to m acu lar disease
The recent development of imaging techniques such as functional magnetic resonance
imaging (fMRI) provides an exciting mechanism for assessing cortical changes
associated with macular disease. In particular, the differences in activity in primary
visual cortex between those patients who adapt successfully to AMD and those who do
not would be of great interest.
14.2.5 C onclusion
Although this thesis has investigated the development of the PRL and other adaptive
strategies in some detail, there are many questions which remain unanswered. Only
with careful experimental design, elaborate equipment and a large supply o f willing
patients can further research be performed to answer the question posed in the first

M.D. Crossland. Chapter 14: Clinical implications and suggestions for future research 222
paragraph of this thesis: why do patients with apparently identical clinical features
exhibit very different levels of impairment?

Chapter 15: Conclusions
223
This thesis has described the first longitudinal study to investigate the development of
viewing strategies in patients with newly presenting macular disease. The major
conclusions o f this study are described below.
15.1 The preferred retinal locus (PRL)
This thesis has shown, for the first time, the timescale over which the preferred retinal
locus develops. The PRL is selected very early in the rehabilitative process; within two
weeks of scotoma development in many cases and within six months in all cases. The
reasons which patients have for selecting one PRL location over another remain
mysterious. M any patients become unaware that they are using a PRL rather than
viewing objects directly. This unawareness is beneficial in term s of rehabilitation.
Application o f sensitive tests for the number of retinal loci has helped to determine that
some patients use more than one fixation locus for a task. There is no difference in
performance between patients who use one PRL and those who use two PRLs.
However, patients who repeatably use the same number o f loci read more quickly than
those who do not have such a strategy.
Fixation stability does not change by large amounts over the course o f this study.
However, these small changes in fixation stability, in conjunction with other adaptive
strategies, are important in determining change in patients’ reading speed.
15.2 Eve movements
Using high-speed eyetracking, two adaptive strategies of the saccadic system have been
identified; an improvement in saccadic efficiency (that is, a reduction in the number of
saccades used to perform a task) and the adoption of non-foveating saccades. These
M.D. Crossland. Chapter 15: Conclusions. 224
two strategies occur independently of each other. These adaptations to the saccadic
system are responsible for 46% of the variance in reading speed change experienced by
patients in the first three months after their vision loss, although in the long term these
strategies do not affect the change in reading speed.
Saccade efficiency is an important determinant of absolute reading speed in patients
throughout this study.
15.3 Reading performance
Reading speed is significantly slower in those with macular disease than in age-
matched control subjects. The level of this impairment can be predicted by taking into
account patients’ saccadic efficiency, fixation stability, scotoma size and contrast
sensitivity. The only variable measured at the baseline assessment which can predict
whether patients are able to read fluently (at more than 80 words per minute) at the exit
o f the study is contrast sensitivity.
O ver the course of this study, reading performance improved in four patients (16%),
deteriorated in 7 patients (28%) and remained constant in the remaining 14 patients.
Factors which determine an improvement in reading speed are changes in fixation
stability, losing awareness of using the preferred retinal locus and using the same
num ber o f PRLs for different tasks.
15.4 Prediction of which patients rehabilitate well
It was not possible to predict which patients will exhibit an improvement in reading
speed over the first year after developing macular disease, and in which patients reading
speed will deteriorate. In particular, there are no differences in the performance of
AM D and JM D patients at the exit point of this study. Under ideal conditions, patients
with AMD can read ju st as fast as their younger counterparts.

M.D. Crossland. References.
References
Abel, L.A., Troost, B.T., & Dell'Osso, L.F. (1983) The effects of age on normal saccadic characteristics and their variability. Vision Res, 23,33-37.
Altman, D.G., & Bland, J.M. (1994a) Diagnostic tests 3: receiver operating characteristic plots. Brit Med J, 309, 188.
Altman, D.G., & Bland, J.M. (1994b) Diagnostic tests. 1: Sensitivity and specificity. Brit Med J, 308,1552.
Altpeter, E., Mackeben, M., & Trauzettel-Klosinski, S. (2000) The importance of sustained attention for patients with maculopathies. Vision Res, 40,1539-1547.
Akutsu, H., Legge, G.E., Ross, J.A., & Schuebel, K.J. (1991) Psychophysics of reading-X. Effects of age-related changes in vision. J Gerontol, 46, P325-331.
Anderson, S.J., Mullen, K.T., & Hess, R.F. (1991) Human peripheral spatial resolution for achromatic and chromatic stimuli: limits imposed by optical and retinal factors. J Physiol, 442,47-64.
Bailey, I.L., & Lovie, J.E. (1976) New design principles for visual acuity letter charts. Am J Optom Physiol Opt, 53,740-745.
Balliet, R., & Nakayama, K. (1978) Training of voluntary torsion. Invest Ophthalmol Vis Sci, 17,303-314.
Barnes, D. E., Tager, I. B., Satariano, W. A. and Yaffe, K. (2004). The relationship between literacy and cognition in well-educated elders. J Gerontol A Biol Sci Med Sci 59,390-395.
Bashinski, H.S., & Bacharach, V.R. (1980) Enhancement of perceptual sensitivity as the result of selectively attending to spatial locations. Percept Psychophys, 28,241- 248.
Bedell, H.E., Chung, S.T.L., & LaFrance, M.W. (1997) The influence of motion smear on visual acuity in simulated congenital nystagmus. Invest Ophthalmol Vis Sci, 38,3044-3044.
Bennett, A.G., & Rabbetts, R.B. (1989). Subjective refraction. In: Clinical Visual Optics (pp. 111-134). Oxford: Butterworth-Heinemann.
Bird, A. (1996) Age-related macular disease. Br J Ophthalmol, 80,2-3.
Bird, A. (1997) What is the future of Research in Age-Related Macular Disease? Arch Ophthalmol, 115,1311-1313.
Bland, J.M., & Altman, D.G. (1996a) Measurement error. Brit Med J, 313,744.

M.D. Crossland. References 226
Bland, J.M., & Altman, D.G. (1996b) Measurement error proportional to the mean. Brit Med J, 313,106.Bland, J.M., & Altman, D.G. (2000) Statistics notes. The odds ratio. Brit Med J,320,1468.
Blumenkranz, M.S., Bressler, N.M., Bressler, S.B., Donati, G., Fish, G.E., Haynes, L.A., Lewis, H., Miller, J.W., Mones, J.M., Potter, M.J., Poumaras, C., Reaves, A., Rosenfeld, P.J., Schachat, A.P., Schmidt-Erfurth, U., Sickenburg, M., Singerman, L.J., Slakter, J.S., Strong, A., & Vannier, S. (2002) Verteporfin therapy for subfoveal choroidal neovascularization in age-related macular degeneration: three- year results of an open-label extension of 2 randomized clinical trials-TAP Report no. 5. Arch Ophthalmol, 120, 1307-1314.
Bowers, A.R., & Reid, V.M. (1997) Eye movements and reading with simulated visual impairment. Ophthalmic Physiol Opt, 17,392-402.
Bowers, A.R., Lovie-Kitchin, J.E., & Woods, R.L. (2001) Eye movements and reading with large print and optical magnifiers in macular disease. Optom Vis Sci,78,325-334.
Bowman, A., & Foster, P. (1992). Density based exploration of bivariate data. In: Technical report No. 92-1 (Glasgow: Department of Statistics, University of Glasgow).
Bressler, N.M. (2000) Age related macular degeneration. New hope for a common problem comes from photodynamic therapy. Brit Med J, 321,1425-1427.
Bressler, N.M. (2001) Photodynamic therapy of subfoveal choroidal neovascularization in age-related macular degeneration with verteporfin: two-year results of 2 randomized clinical trials-tap report 2. Arch Ophthalmol, 119,198-207.
Bressler, N.M., & Gills, J.P. (2000) Age related macular degeneration. Brit Med J, 321,1425-1427.
Bullimore, M.A., & Bailey, I.L. (1995) Reading and eye movements in age-related maculopathy. Optom Vis Sci, 72,125-138.
Cacho, I., Dickinson, C.M., Smith, H.J., & Harper, R.J. (2003). Fixation characteristics and visual acuity in people with AMD. United Kingdon multidisciplinary low vision rehabilitation and research conference. (Birmingham, UK).
Caloroso, E. (1972) After-image transfer: a therapeutic procedure for amblyopia. Am J Optom Arch Am Acad Optom, 49,65-69.
Carpenter, R. (1988). Movements of the Eyes. (London: Pion).
Carter, J.E., Obler, L., Woodward, S., & Albert, M.L. (1983) The effect of increasing age on the latency for saccadic eye movements. J Gerontol, 38,318-320.

M.D. Crossland. References
Chakravarthy, U., & MacKenzie, G. (2000) External beam radiotherapy in exudative age-related macular degeneration: a pooled analysis of phase I data. B rJ Radiol, 73, 305-313.
Chong, N.H., & Bird, A.C. (1998) Alternative therapies in exudative age related macular degeneration. Br J Ophthalmol, 82,1441-1443.
Chung, S.T.L., Legge, G.E., & Cheung, S.H. (2004) Letter-recognition and reading speed in peripheral vision benefit from perceptual learning. Vision Res, 44,695-709.
Ciufffeda, K.J., Levi, D.M., & Selenow, A. (1991). Amblyopia: basic and clinical aspects. (Boston: Butterworth-Heinemann).
Ciulla, T.A., Danis, R.P., & Harris, A. (1998) Age-related macular degeneration: a review of experimental treatments. Surv Ophthalmol, 43,134-146.
Cohen, A.I. (1992). The retina. In: W.M. Hart (Ed.) Adler's physiology o f the eye (St Louis: Mosby Year Book).
Collins, J.K. (1987) Coping with the rising incidence of partial sight. Optometry Today, 27,772-779.
Culham, L.E., Fitzke, F.W., Timberlake, G.T., & Marshall, J. (1993) Assessment of fixation stability in normal subjects and patients using a scanning laser ophthalmoscope. Clin Vision Sci, 8,551-561.
Culham, L.E. (1994). An investigation o f the role o f the scanning laser ophthalmoscope in the assessment o f patients with macular disease. PhD thesis, London: University of London.
Culham, L.E., Fitzke, F.W., & Marshall, J. (1997) Training of patients with age- related macular disease (AMD) using a scanning laser ophthalmoscope (SLO). Ophthal Physiol Opt, 17,542.
Culham, L.E., Fitzke, F.W., Timberlake, G., & Marshall, J. (1992) Use of scrolled text in a scanning laser ophthalmoscope to assess reading performance at different retinal locations. Ophthal Physiol Opt, 12,281-286.
Culham, L.E., Ryan, B., Jackson, A.J., Hill, A.R., Jones, B., Miles, C., Young, J.A., Bunce, C., & Bird, A.C. (2002) Low vision services for vision rehabilitation in the United Kingdom. Br J Ophthalmol, 86,743-747.
Cummings, R.W., Whittaker, S.G., Watson, G.R., & Budd, J.M. (1985) Scanning characters and reading with a central scotoma. Am J Optom Physiol Opt, 62,833- 843.
Curcio, C.A., & Allen, K.A. (1990) Topography of ganglion cells in human retina. J Comp Neurol, 300,5-25.

M.D. Crossland. References
Deutsch, A., & Rayner, K. (1999) Initial fixation effects in reading Hebrew words. Language and Cognitive Processes, 14,393-421.
Dickinson, C. (1998). Low Vision: Principles and practice. (Oxford: Butterworth Heinemann).
Dodge, R., & Cline, T.S. (1901) The angle of velocity of eye movements. Psychological review, 8,145-147.
Dowe, P. (1997). Causal processes. The Stanford Encyclopedia o f Philosophy.
Duret, F., Issenhuth, M., & Safran, A. (1999) Combined use of several preferred retinal loci in patients with macular disorders when reading single words. Vision Res, 39,873-879.
Eden, G.F., Stein, J.F., Wood, H.M., & Wood, F.B. (1994) Differences in eye movements and reading problems in dyslexic and normal children. Vision Res, 34, 1345-1358.
Eizenman, M., Trope, G.E., Fortinsky, M., & Murphy, P.H. (1992) Stability of fixation in healthy subjects during automated perimetry. Can J Ophthalmol, 27,336- 340.
Elliott, D.B., Bullimore, M.A., & Bailey, I.L. (1991) Improving the reliability of the Pelli-Robson contrast sensitivity test. Clin Vision Sci, 6,471-475.
Elliott, D.B., Trukolo-Ilic, M., Strong, J.G., Pace, R., Plotkin, A., & Bevers, P. (1997) Demographic characteristics of the vision disabled elderly. Invest Ophthalmol Vis Sci, 38,2566-2575.
Elliott, D.B., & Situ, P. (1998) Visual acuity versus letter contrast sensitivity in early cataract. Vision Res, 38,2047-2052.
Emerson, D.L. (1984) Learning to adjust to impaired vision. In: Faye, E.E. Clinical low vision, Little, Brown, 379-94.
Ergun, E., Maar, N., Radner, W., Barbazetto, I., Schmidt-Erfurth, U., & Stur, M. (2003) Scotoma size and reading speed in patients with subfoveal occult choroidal neovascularization in age-related macular degeneration. Ophthalmology, 110,65-69.
Evans, B.J.W. (1997). Pickwell's binocular vision anomalies: Investigation and treatment. (Oxford: Butterworth-Heinemann).
Evans, J., Rooney, C., Ashwood, F., Dattani, N., & Wormald, R.P. (1996) Blindness and partial sight in England and Wales: April 1990 - March 1991. Health Trends,28,5-12.
Evans, J., & Wormald, R. (1996) Is the incidence of registrable age-related macular degeneration rising? Br J Ophthalmol, 80,9-14.

M.D. Crossland. References 229
Evans, J.R., Fletcher, A.E., & Wormald, R.P. (2004) Causes of visual impairment in people aged 75 years and older in Britain: an add-on study to the MRC Trial of Assessment and Management of Older People in the Community. Br J Ophthalmol, 88,365-370.
Farrall, H. (1991). Optometric management of visual handicap. (Oxford: Blackwell).
Fasce, F., Brancato, R., Bettin, P., Introini, U., & Pece, A. (1996) Evaluation of fixation one year after perifoveal laser treatment of subfoveal choroidal neovascularization. Int Ophthalmol, 20,251-258.
Faye, E. (1970). The low vision patient - clinical experience with adults and children. (New York: Grune and Stratton).
Faye, E.E. (1984). Clinical Low Vision. (Boston: Little, Brown and Company).
Fine, E.M., & Rubin, G.S. (1999a) The effects of simulated cataract on reading with normal vision and simulated central scotoma. Vision Res, 39,4274-4285.
Fine, E.M., & Rubin, G.S. (1999b) Reading with central field loss: number of letters masked is more important than the size of the mask in degrees. Vision Res, 39,747- 756.
Fine, E.M., & Rubin, G.S. (1999c) Reading with simulated scotomas: attending to the right is better than attending to the left. Vision Res, 39,1039-1048.
Fischer, B., & Hartnegg, K. (2000) Effects of visual training on saccade control in dyslexia. Perception, 29,531-542.
Fitzmaurice, K., Kinnear, J.F., & Chen, Y.A. (1994). ECCVUE: A computer generated method of training eccentric viewing. Conference on Low Vision: Research and New Developments in Rehabilitation. (Groningen, The Netherlands).
Fletcher, D.C., & Schuchard, R.A. (1997a) Preferred retinal loci relationship to macular scotomas in a low-vision population. Ophthalmology, 104,632-638.
Fletcher, D.C., Schuchard, R.A., Warren, M.L., Crane, W.G., & Lashkari, K. (1993) A scanning laser ophthalmoscope preferred retinal locus scoring system compared to reading speed and accuracy. Invest Ophthalmol Vis Sci (Suppl), 34,787.
Fletcher, D.C., Schuchard, R.A., & Watson, G. (1999) Relative locations of macular scotomas near the PRL: effect on low vision reading. J Rehabil Res Dev, 36,356- 364.
Forster, K.I. (1970) Visual perception of rapidly presented words of varying complexity. Percept Psychophys, 8,215-221.
Fuchs, W. (1922) Eine Pseudofovea bei Hemianopikem. Psychologische Forschung,

M.D. Crossland. References 230
Gass, J. (1987). Stereoscopic atlas of macular diseases: Diagnosis and treatment. (St Louis: CV Mosby).
Gill, J.M., & Silver, J.H. (2001). Low vision equipment. (London: RNIB scientific research unit).
Goldberg, H.K. (1991) Sports vision and vision training: myth or reality? Arch Ophthalmol, 109,315.
Goodrich, G.L., & Mehr, E.B. (1986) Eccentric viewing training and low vision aids: Current practice and implications of peripheral retinal research. Am J Optom Physiol Opt, 63,119-126.Goodrich, G.L., Overbury, O., Mehr, E.B., & Harsh, M. (1985) A low vision training manual - the VETBook. Invest Ophthalmol Vis Sci, 26,219.
Guez, J.-E., Le Gargasson, J.-F., Grail, Y., & Gaudric, A. (1995) Relation between reading and preferred retinal locus in patients with central scotoma. Vision Res, 35, S80.
Guez, J.-E., Le Gargasson, J.-F., Rigaudiere, F., & O'Regan, J.K. (1993) Is there a systematic location for the pseudo-fovea in patients with central scotoma? Vision Res, 33,1271-1279.
Hallett, P.E. (1978) Primary and secondary saccades to goals defined by instructions. Vision Res, 18,1279-1296.
Hallett, P.E. (1986). Eye movements. In: K.R. Boff, L. Kauffman, & J.P. Thomas (Eds.), Handbook o f perception and human performance, 1 (pp. 10.75 -10.101). New York: John Wiley & Sons.
Hazel, C.A., Latham Petre, K., Armstrong, R.A., Benson, M.T., & Frost, N.A.(2000) Visual function and subjective quality of life compared in subjects with acquired macular disease. Invest Ophthalmol Vis Sci, 41,1309-1315.
He, S., Cavanagh, P., & Intriligator, J. (1996) Attentional resolution and the locus of visual awareness. Nature, 383,334-337.
Heinen, S.J., & Skavenski, A.A. (1991) Adaptation of saccades and fixation to bilateral foveal lesions in adult monkey. Vision Res, 32,365-373.
Henson, D.B. (1993). Visual fields. (Oxford: Oxford Medical Publications).
Holcomb, J.G., & Goodrich, G.L. (1976) Eccentric viewing training. J Am Optom Assoc, 47,1438-1443.
Howell, D.C. (1997a). Hypothesis tests applied to means. In: Statistical methods for psychology (Belmont, CA: Duxbury).
Howell, D.C. (1997b). Simple analysis of variance. In: Statistical methods for psychology (Belmont, CA: Duxbury).

M.D. Crossland. References
Howell, D.C. (1997c). Statistical methods for psychology. (Belmont, CA: Duxbury).
International ARM Epidemiological Study Group (1995). An international classification and grading system for age-related maculopathy and age-related macular degeneration. Surv Ophthalmol 39,367-374.
Jackson, M. D. and McClelland, J. L. (1975). Sensory and cognitive determinants of reading speed. J. Verbal Learn. 14,565-574.
Kabanarou, S.A., Bellmann, C., Crossland, M.D., Culham, L.E., & Rubin, G.S. (2003) Non-foveal fixation and binocular viewing in AMD. Invest Ophthalmol Vis Sci, E-abstract 2764.
Kanski, J J . (1994). Clinical Ophthalmology. (Oxford: Butterworth-Heinemann).
Kelly, J., & Maumenee, I.H. (1999). Hereditary macular diseases. In: J.P. Dunn (Ed.) International Ophthalmology Clinics: Macular diseases, 39 (pp. 83-116). Philadelphia, PA: Lippincott Williams and Wilkins.Kerkhoff, G. (1998) Rehabilitation of visuospatial cognition and visual exploration in neglect: a cross-over study. Restorative Neurology and Neuroscience, 12,27-40.
Kosnik, W., Fikre, J., & Sekuler, R. (1986) Visual fixation stability in older adults. Invest Ophthalmol Vis Sci, 27,1720-1725.
Krieger, A. A. (1967) The partially sighted patient: a study of 917 cases. Trans Am Ophthalmolol Soc, 65,544-590.
Krischer, C.C., & Meissen, R. (1983) Reading speed under real and simulated visual impairment. J Vis Impair Blindness, 1-16.
Krischer, C.C., Stein-Arsic, M., Meissen, R., & Zihl, J. (1985) Visual performance and reading capacity of partially sighted persons in a rehabilitation center. Am J Optom Physiol Opt, 62,52-58.
Kubo, T., Saika, T., Sakata, Y., Morita, Y., Matsunaga, T., & Kasahara, T. (1991) Analysis of saccadic eye movements using an infrared video system in human subjects. Acta Otolaryngol Suppl, 481,382-387.
Latham, K., & Whitaker, D. (1996a) A comparison of word recognition and reading performance in foveal and peripheral vision. Vision Res, 36,2665-2674.
Latham, K., & Whitaker, D. (1996b) Relative roles of resolution and spatial interference in foveal and peripheral vision. Ophthalmic Physiol Opt, 16,49-57.
Lawton, T.A., Sebag, J., Sadun, A.A., & Castleman, K.R. (1998) Image enhancement improves reading performance in age-related macular degeneration patients. Vision Res, 38, 153-162.
M.D. Crossland. References 232
Legge, G.E. (1991) Glenn A. Fry award lecture 1990: three perspectives on low vision reading. Optom Vis Sci, 68,736-769.
Legge, G.E., Ahn, S.J., Klitz, T.S., & Luebker, A. (1997) Psychophysics of reading- XVI. The visual span in normal and low vision. Vision Res, 37,1999-2010.
Legge, G.E., Pelli, D.G., Rubin, G.S., & Schleske, M.M. (1985a) Psychophysics of reading—I. Normal vision. Vision Res, 25,239-252.
Legge, G.E., Ross, J.A., Isenberg, L.M., & LaMay, J.M. (1992) Psychophysics of reading. Clinical predictors of low-vision reading speed. Invest Ophthalmol Vis Sci, 33,677-687.
Legge, G.E., Ross, J.A., Luebker, A., & LaMay, J.M. (1989) Psychophysics of reading VIII: The Minnesota low-vision reading test Optom Vis Sci, 66, 843-853.
Legge, G.E., Rubin, G.S., & Luebker, A. (1987) Psychophysics of reading-V. The role of contrast in normal vision. Vision Res, 27,1165-1177.
Legge, G.E., Rubin, G.S., Pelli, D.G., & Schleske, M.M. (1985b) Psychophysics of reading—II. Low vision. Vision Res, 25,253-265.
Lei, H., & Schuchard, R.A. (1997) Using two preferred retinal loci for different lighting conditions in patients with central scotomas. Invest Ophthalmol Vis Sci, 38, 1812-1818.
Lennerstrand, G., & Ahlstrom, C.O. (1989) Contrast sensitivity in macular degeneration and the relation to subjective visual impairment. Acta Ophthalmol (Copenh), 67, 225-233.
Loran, D., & Griffiths, G. (2000) Visual performance and soccer skills in young players. Optometry Today
Lovie-Kitehin, J.E., Bowers, A.R., & Woods, R.L. (2000) Oral and silent reading performance with macular degeneration. Ophthalmic Physiol Opt, 20,360-370.
Lovie-Kitchin, J.E., & Bowman, K.J. (1985). Senile Macular Degeneration: Management and Rehabilitation. (Boston: Butterworth).
Ludvigh, E. (1941) Extrafoveal visual acuity as measured by Snellen test letters. Am J Ophthalmol, 24,303-310.
Mackeben, M. (1999) Sustained focal attention and peripheral letter recognition. Spat Vis, 12,51-72.
Mackeben, M., & Nakayama, K. (1993) Express attentional shifts. Vision Res, 33, 85-90.

M.D. Crossland. References 233
Macular Photocoagulation Study Group (1986) Argon laser photocoagulation for neovascular maculopathy: Three-year results from randomized clincal trials. Archives o f Ophthalmology, 104,694-701.
Mainster, M.A., Timberlake, G.T., Webb, R.H., & Hughes, G.W. (1982) Scanning laser ophthalmoscopy. Clinical applications. Ophthalmology, 89, 852-857.
Mangione, C.M., Berry, S., Spritzer, K., Janz, N.K., Klein, R., Owsley, C., & Lee, P.P. (1998) Identifying the content area for the 51-item National Eye Institute visual function questionnaire. Archives o f Ophthalmology, 116,227-233.
Margrain, T.H. (2000) Helping blind and partially sighted people to read: the effectiveness of low vision aids. Br J Ophthalmol, 84,919-921.
Marshall, J., Hussain, A.A., Starita, C., Moore, D.J. & Patmore, A.L. (1998). Aging and Bruch's membrane. In: The retinal pigment epithelium: function and disease. Eds.: M. F. Marmor and T. J. Wolfensberger. Oxford, Oxford University Press: 669- 692.Massof, R.W. (2003). Relation of Reading Performance to Visual Acuity and Perceived Reading Ability in Low Vision. Invest Ophthalmol Vis Sci, E-abstract 1284.
McClure, M.E., Hart, P.M., Jackson, A.J., Stevenson, M.R., & Chakravarthy, U.(2000) Macular degeneration: do conventional measurements of impaired visual function equate with visual disability? Br J Ophthalmol, 84,244-250.
McConkie, G.W., Kerr, P.W., Reddix, M.D., & Zola, D. (1988) Eye movement control during reading: I. The location of initial eye fixations on words. Vision Res, 28,1107-1118.
McConkie, G.W., & Rayner, K. (1975) The span of the effective stimulus during a fixation in reading. Percept Psychophys, 17,578-586.
McLaughlan, G.J., & Peel, D. (2000). Finite mixture models. (New York: Wiley).
McMahon, T.T., Hansen, M., Stelmack, J., Oliver, P., & Viana, M.A. (1993) Saccadic eye movements as a measure of the effect of low vision rehabilitation on reading rate. Optom Vis Sci, 70,506-510.
McMahon, T.T., Hansen, M., & Viana, M. (1991) Fixation characteristics in macular disease. Relationship between saccadic frequency, sequencing, and reading rate. Invest Ophthalmol Vis Sci, 32,567-574.
Mitra, S. (1985) Spatial contrast sensitivity in macular disorder. Doc Ophthalmol,59,247-267.
Murphy, K.S.J., & Foley-Fisher, J.A. (1988) Visual search with non-foveal vision. Ophthal Physiol Opt, 8,345-348.

M.D. Crossland. References 234
Murphy, K.S.J., & Foley-Fisher, J.A. (1989) Effect of a scotoma on eye movements during visual search. Ophthal Physiol Opt, 9, 317-321.
Nachmias, J. (1959) Two-dimensional motion of the retinal image during monocular fixation. J Opt Soc Am, 49,901-908.
Newsome, D.A., & Blacharski, P. (1988). Fundus flavimaculatus and retinitis pigmentosa. In: M.O. Tso (Ed.) Retinal disease: Biomedical foundations and Clinical Management (pp. 263-283). Philadelphia: J.B. Lippincott.
Newson, K. (1965). The art of English C l. (Huddersfield: Schofield and Sims Ltd).
Nilsson, U.L., Frennesson, C., & Nilsson, S.E.G. (2003) Patients with AMD and a large absolute central scotoma can be trained successfully to use eccentric viewing, as demonstrated in a scanning laser ophthalmoscope. Vision Res, 43,1777-1787.
Nilsson, U.L., Frennesson, C., & Nilsson, S.R.G. (1998) Location and stability of a newly established eccentric retinal locus suitable for reading, achieved through training of patients with a dense central scotoma. Optom Vis Sci, 75,873-878.
Nilsson, U.L., & Nilsson, S.R.G. (1986) Rehabilitation of the visually handicapped with advanced macular degeneration. Doc Ophthalmol, 62,345-367.
O'Regan, J.K. (1990). Eye movements and reading. In: E. Kowler (Ed.) Eye Movements and Their Role in Visual and Cognitive Processes (pp. 395-453). Paris, France: Elsevier.
Paasche-Orlow, M.K., Taylor, H.A., & Brancati, F.L. (2003) Readability standards for informed-consent forms as compared with actual readability. N Engl J Med, 348, 721-726.
Pauleikhoff, D. P., Hermans, P, Holz, F.G., & Bird, A.C. (2003a). Histopathology. In: Age-related macular degeneration, eds. F. G. Holz, D. P. Pauleikhoff, R. F. Spaide & A. C. Bird. Berlin, Springer: 47-67.
Pauleikhoff, D. P., Spital G., & Wessing, A. (2003b). Laser coagulation in AMD. In: Age-related macular degeneration, eds. F. G. Holz, D. P. Pauleikhoff, R. F. Spaide & A. C. Bird. Berlin, Springer: 128-142.
PDT Working Party (2001). Photodynamic therapy in the management of subfoveal choroidal neovascularisation secondary to age-related macular degeneration. (London: The Royal College of Ophthalmologists).
Pelli, D.G., Robson, J.G., & Wilkins, A.J. (1988) The design of a new letter chart for measuring contrast sensitivity. Clin Vision Sci, 2,187-199.
Peshori, K.R., Schicatano, E.J., Gopalaswamy, R., Sahay, E., & Evinger, C. (2001) Aging of the trigeminal blink system. Exp Brain Res, 136,351-363.

M.D. Crossland. References
Petre, K.L., Hazel, C.A., Fine, E.M., & Rubin, G.S. (2000) Reading with eccentric fixation is faster in inferior visual field than in left visual field. Optom Vis Sci, 77, 34-39.
Pitt, M.C., & Rawles, J.M. (1988) The effect of age on saccadic latency and velocity. Neuro-ophthalmology, 8,123-129.
Pollatsek, A., Tan, L.H., & Rayner, K. (2000) The role of phonological codes in integrating information across saccadic eye movements in Chinese character identification. J Exp Psychol Hum Percept Perform, 26,607-633.
Raasch, T.W., Leat, S.J., Kleinstein, R.N., Bullimore, M.A., & Cutter, G.R. (1997) Evaluating the value of low-vision services. J Am Optom Assoc, 68,287-295.
Raney, G.E., & Rayner, K. (1995) Word frequency effects and eye movements during two readings of a text. Can J Exp Psychol, 49,151-172.
Rayner, K. (1975) The perceptual span and peripheral cues in reading. Cog. Psychol., 7,65-81.
Rayner, K. (1978) Eye movements in reading and information processing. Psychol Bull, 85,618-660.
Rayner, K. (1998) Eye movements in reading and information processing: 20 years of research. Psychol Bull, 124,372-422.
Rayner, K. (2002). Eye movements and cognitive processes in reading: seminar. (London: University College London).
Rayner, K., & Bertera, J.H. (1979) Reading without a fovea. Science, 206,468-469.
Rayner, K. (1986). Eye movements and the perceptual span in beginning and skilled readers. J Exp Child Psychol 41,211-236.
Rayner, K., & Frazier, L. (1989) Selection mechanisms in reading lexically ambiguous words. J Exp Psychol Learn Mem Cogn, 15,779-790.
Rayner, K., & Morris, R.K. (1990). Do eye movements reflect higher order processes in reading? In: R. Groner, G. d'Yadwalle, & R. Parham (Eds.), From eye to mind: information acquisition in perception, search and reading (Elsevier).
Rayner, K., & Pollatsek, A. (1989). The psychology of reading. (Englewood Cliffs, NJ, USA: Prentice-Hall).
Reiss, S., & Havercamp, S.M. (1998) Toward a comprehensive assessment of fundamental motivation: Factor structure of the Reiss profiles. Psychol Assessment, 10,97-106.

M.D. Crossland. References 236
Robbins, H. G. and McMurray, N. E. (1988). Psychological and visual factors in low vision rehabilitation of patients with age related maculopathy. J Vision Rehab 2 ,11- 21.
Rohrschneider, K., Becker, M., Kruse, F.E., Fendrich, T., & Volcker, H.E. (1995) Stability of fixation: results of fundus-controlled examination using the scanning laser ophthalmoscope. Ger J Ophthalmol, 4,197-202.
Rohrschneider, K., Kiel, R., Pavlovska, V., & Blankenagel, A. (2002) [Satisfaction with low vision aids]. Klin Monatsbl Augenheilkd, 219,507-511.
Romayananda, N., Wong, S.W., Elzeneiny, I.H., & Chan, G.H. (1982) Prismatic scanning method for improving visual acuity in patients with low vision. Ophthalmology, 89,937-945.
Rosenberg, R., Faye, E., Fischer, M., & Budick, D. (1989) Role of prism relocation in improving visual performance of patients with macular dysfunction. Optom Vis Sci, 66,747-750.
Rotenstreich, Y., Fishman, G.A., & Anderson, R.J. (2003) Visual acuity loss and clinical observations in a large series of patients with Stargardt disease. Ophthalmology, 110,1151-1158.
Rovamo, J., Virsu, V., & Nasanen, R. (1978) Cortical magnification factor predicts the photopic contrast sensitivity of peripheral vision. Nature, 271,54-56.
Rubin, G.S. (1986). Predicting reading performance in low-vision patients with age- related maculopathy. In: G.C. Woo (Ed.) Low Vision: Principles and Applications (pp. 323-333). New York: Springer-Verlag).
Rubin, G.S., & Legge, G.E. (1989) Psychophysics of reading. VI~The role of contrast in low vision. Vision Res, 29,79-91.
Rubin, G.S., & Turano, K. (1992) Reading without saccadic eye movements. Vision Res, 32,895-902.
Rubin, G.S., Adamsons, I.A., & Stark, W.J. (1993) Comparison of acuity, contrast sensitivity, and disability glare before and after cataract surgery. Arch Ophthalmol, 111,56-61.
Rubin, G.S., & Turano, K. (1994) Low vision reading with sequential word presentation. Vision Res, 34,1723-1733.
Rubin, G.S., West, S.K., Munoz, B., Bandeen-Roche, K., Zeger, S., Schein, O., & Fried, L.P. (1997) A comprehensive assessment of visual impairment in a population of older Americans. The SEE Study. Salisbury Eye Evaluation Project. Invest Ophthalmol Vis Sci, 38,557-568.
Russell, W., Harper, R., Reeves, B., Waterman, H., Henson, D., & McLeod, D.(2001) Randomised controlled trial of an integrated versus an optometric low vision

M.D. Crossland. References 237
rehabilitation service for patients with age-related macular degeneration: study design and methodology. Ophthalmic Physiol Opt, 21,36-44.
Safran, A.B., Duret, F., Issenhuth, M., & Mermoud, C. (1999) Full text reading with a central scotoma: pseudo regressions and pseudo line-losses. Br J Ophthalmol, 83, 1341-1347.
Sansbury, R.V., Skavenski, A.A., Haddad, G.M., & Steinman, R.M. (1973) Normal fixation of eccentric targets. J Opt Soc Am, 63,612-614.
Sarks, JM Sarks, S., & Killingsworth, M. (1988) Evolution of geographic atrophy of the retinal pigment epithelium. Eye, 2,552-577.
Schuchard, R.A., & Fletcher, D.C. (1994a) Preferred retinal locus: a review with applications in low vision rehabilitation. Ophthalmology Clinics o f North America,7,243-256.
Schuchard, R.A., Fletcher, D.C., & Maino, J. (1994b) A scanning laser ophthalmoscope (SLO) low-vision rehabilitation system. Clin Eye Vision Care, 6, 101-107.
Schuchard, R.A., & Raasch, T.W. (1992) Retinal locus for fixation: Pericentral fixation targets. Clin Vision Sci, 7,511-520.
Schuchard, R.A., Tekwani, N., & Hu, S.Y. (1995) Bincular preferred retinal loci: Relationship of visual factors to binocular perception. Vision science and its applications (OSA technical digest series), 1,332-335.
Schuchard, R.A., Naseer, S., & de Castro, K. (1999) Characteristics of AMD patients with low vision receiving visual rehabilitation. J Rehabil Res Dev, 36,294- 302.
Schulz, P.J. (1997) Reaction to the loss of sight. In: Psychiatric problems in ophthalmology, Eds: Pearlman, J.T. and Adams, G.L. Springfield, IL: C Thomas, 38-67.
Scott, I.U., Smiddy, W.E., Schiffman, J., Feuer, W.J., & Pappas, C.J. (1999) Quality of life of low-vision patients and the impact of low-vision services. Am J Ophthalmol, 128,54-62.
Shaw, C. (1998) 1996-based national population projections for the United Kingdom and constituent countries. Popul Trends, 43-49.
Silverman, B.W. (1986). Density estimation for statistics and data analysis.(London: Chapman and Hall).
Smith, H.J., Dickinson, C.M., Reeves, B.C., Cacho, I., & Harper, R.A. (2003). Can prism spectacles reduce disability in AMD? United Kingdom multi-disciplinary low vision rehabilitation and research conference. (Birmingham, UK).

M.D. Crossland. References
Snodderly, D.M., & Kurtz, D. (1985) Eye position during fixation tasks: comparison of macaque and human. Vision Res, 25,83-98.
Steinman, B.A., Steinman, S.B., & Lehmkuhle, S. (1997) Transient visual attention is dominated by the magnocellular stream. Vision Res, 37,17-23.
Steinman, R.M. (1965) Effect of target size, luminance, and color on monocular fixation. J Opt Soc Am, 55,1158-1165.
Steinman, R.M., & Cunitz, R.J. (1968) Fixation of targets near the absolute foveal threshold. Vision Res, 8,277-286.
Steinman, R.M., Cushman, W.B., & Martins, A.J. (1982) The precision of gaze. A review. Hum Neurobiol, 1,97-109.
Stromeyer, C.F., Lee, J., & Eskew, R.T. (1992) Peripheral Chromatic Sensitivity for Flashes - a Post- Receptoral Red Green Asymmetry. Vision Research, 32, 1865- 1873.
Sunness, J.S., Applegate, C.A., Haselwood, D., & Rubin, G.S. (1996) Fixation patterns and reading rates in eyes with central scotomas from advanced atrophic age- related macular degeneration and Stargardt disease. Ophthalmology, 103,1458- 1466.
Sunness, J.S., Bressler, N.M., & Maguire, M.G. (1995) Scanning laser ophthalmoscopic analysis of the pattern of visual loss in age-related geographic atrophy of the macula. Am J Ophthalmol, 119,143-151.
Sunness, J.S., Johnson, M.A., Massof, R.W., & Marcus, S. (1988) Retinal sensitivity over drusen and nondrusen areas: a study using fundus perimetry. Arch Ophthalmol, 106,1081-1084.
Sunness, J.S., Massof, R.W., Johnson, M.A., Finkelstein, D., & Fine, S.L. (1985) Peripheral retinal function in age-related macular degeneration. Arch Ophthalmol, 103,811-816.
Sunness, J.S., Schuchard, R.A., Shen, N., Rubin, G.S., Dagnelie, G., & Haselwood, D.M. (1995) Landmark-driven fundus perimetry using the scanning laser ophthalmoscope. Invest Ophthalmol Vis Sci, 36,1863-1874.
Syka, J. (2002) Plastic changes in the central auditory system after hearing loss, restoration of function, and during learning. Physiol Rev, 82,601-636.
Tabachnick, B.G., & Fidel 1, L.S. (2001). Using multivariate statistics. (Boston:Allyn & Bacon).
Temel, A., & Kazokoglu, H. (1991) Low-vision aids in Stargardt's disease. Ophthalmologica, 202,142-146.

M.D. Crossland. References
Timberlake, G.T., Mainster, M.A., Peli, E., Augliere, R.A., Essock, E.A., & Arend, L.E. (1986) Reading with a macular scotoma. I. Retinal location of scotoma and fixation area. Invest Ophthalmol Vis Sci, 27,1137-1147.
Timberlake, G.T., Pelli, E., Essock, E.A., & Augliere, R.A. (1987) Reading with a macular scotoma. II. Retinal locus for scanning text. Invest Ophthalmol Vis Sci, 28, 1268-1274.
Titterington, D.M., Smith, A.F.M., & Makov, U.E. (1985). Statistical analysis of finite mixture distributions. (New York: Wiley).
Trauzettel-Klosinski, S., Teschner, C., Tomow, R., & Zrenner, E. (1994) Reading strategies in normal subjects and in patients with macular scotoma-assessed by two new methods of registration. Neuro-ophthalmology, 14,15-30.
Turano, K.A., & Rubin, G.S. (1988). Reading performance with peripheral viewing using rapid serial visual presentation. In: Noninvasive assessment o f the visual system, (pp. 192-195). Washington DC: Optical Society of America.
Turano, K., Geruschat, D. and Stahl, J. (1998). Mental effort required for walking: effects of retinitis pigmentosa. Optom Vis Sci 75,879-886.
Turano, K. A., Rubin, G. S. and Quigley, H. A. (1999). Mobility performance in glaucoma. Invest Ophthalmol Vis Sci 40,2803-2809.
Turano, K. A., Geruschat, D. R., Baker, F. H., Stahl, J. W. and Shapiro, M. D.(2001). Direction of gaze while walking a simple route: persons with normal vision and persons with retinitis pigmentosa. Optom Vis Sci 78,667-675.
Turano, K. A., Geruschat, D. R. and Baker, F. H. (2002). Fixation behavior while walking: persons with central visual field loss. Vision Res 42,2635-2644.
Varano, M., & Scassa, C. (1998) Scanning laser ophthalmoscope microperimetry. Seminars in Ophthalmology, 13,203-209.
Virsu, V., Nasanen, R., & Osmoviita, K. (1987) Cortical magnification and peripheral vision. J Opt Soc Am A, 4, 1568-1578.
Virtanen, P., & Laatikainen, L. (1991) Primary success with low vision aids in age- related macular degeneration. Acta Ophthalmol (Copenh), 69,484-490.
von Noorden, G.K., & Mackensen, G. (1962) Phenomenology of eccentric fixation. Am J Ophthalmol, 53,642-661.
Watson, G.R., Wright, V., & De l'Aune, W. (1992) The efficacy of comprehension training and reading practice for print readers with macular loss. J Visl Impair Blind, 86, 37-43.
Webb, R.H., Hughes, G.W., & Delori, F.C. (1987) Confocal scanning laser ophthalmoscope. Applied Optics, 26,1492-1499.

M.D. Crossland. References 240
Wensveen, J.M., Bedell, H.E., White, J.M., & Loshin, D.S. (1993) Reading Speed with Artificial Central Scotoma. Invest Ophthalmol Vis Sci, 34,1420-1420.
Weymouth, F.W., Hines, D.C., Acres, L.H., & Raaf, J.E. (1928) Visual acuity within the area centralis and its relation to eye movements and fixation. Am J Ophthalmol, 11,947-960.
Whitaker, L.A., Shoptaugh, C.F., & Haywood, K.M. (1986) Effect of age on horizontal eye movement latency. Am J Optom Physiol Opt, 63,152-155.
White, J.G., & Amos, W.B. (1987) Confocal microscopy comes of age. Nature, 328, 183-184.
White, J.M., & Bedell, H.E. (1990) The oculomotor reference in humans with bilateral macular disease. Invest Ophthalmol Vis Sci, 31,1149-1161.
Whittaker, S.G., Budd, J., & Cummings, R.W. (1988) Eccentric fixation with macular scotoma. Invest Ophthalmol Vis Sci, 29,268-278.
Whittaker, S.G., & Cummings, R.W. (1990a). Eccentric eye movements with loss of central vision. The International Conference on Low Vision.
Whittaker, S.G., & Cummings, R.W. (1990b) Foveating saccades. Vision Res, 31, 1363-1366.
Whittaker, S.G., Cummings, R.W., & Swieson, L.R. (1991) Saccade control without a fovea. Vision Res, 31,2209-2218.
Whittaker, S.G., & Lovie-Kitchin, J. (1993) Visual requirements for reading. Optom Vis Sci, 70,54-65.
Wickstrom, G., & Bendix, T. (2000) The "Hawthorne effect"—what did the original Hawthorne studies actually show? Scand J Work Environ Health, 26,363-367.
Williams, R.A., Brody, B.L., Thomas, R.G., Kaplan, R.M., & Brown, S.I. (1998) The psychosocial impact of macular degeneration. Arch Ophthalmol, 116,514-520.
Wolf, S. (1997) Recent developments in scanning laser ophthalmoscopy. Dev Ophthalmol, 29,1-7.
Wolffsohn, J.S., & Cochrane, A.L. (1999) The changing face of the visually impaired: the Kooyong low vision clinic's past, present, and future. Optom Vis Sci, 76,747-754.
Woon, W.H., Fitzke, F.W., Bird, A.C., & Marshall, J. (1992) Confocal imaging of the fundus using a scanning laser ophthalmoscope. Br J Ophthalmol, 76,470-474.

M.D. Crossland. References
World Health Organisation (1997). Fact sheet No. 144. Blindness and visual disability. Part IE of IV: other leading causes worldwide, (www.who.int/inf- fs/en/fact 144. h tm 1.
Wright, B., & Watson, G.R. (1995). Learn to use your vision for reading workbook. (Lilbum, GA: Bear Consultants).
Wu, D.Z., Wu, L., Chang, F.X., Jin, C., & Padula, W. (1995) Visual rehabilitation in low vision patients with aging macular degeneration. J Am Optom Assoc, 66,39-41.
Yap, Y.L., Bedell, H.E., & Abplanalp, P.L. (1986) Blind spot "fixation" in normal eyes: implications for eccentric viewing in bilateral macular disease. Am J Optom Physiol Opt, 63,259-264.
Zangwill, L., Irak, I., Berry, C.C., Garden, V., de Souza Lima, M., & Weinreb, R.N. (1997) Effect of cataract and pupil size on image quality with confocal scanning laser ophthalmoscopy. Arch Ophthalmol, 115,983-990.
Zeevi, Y.Y., & Peli, E. (1979) Latency of peripheral saccades. J Opt Soc Am, 69, 1274-1279.
Zwick, H., Ness, J. W., Molchany, J. M., Stuck, B. E. and Loveday, J. (1998). Neural motor strategies associated with the development of a pseudofovea following laser induced macular damage and artificial macular occlusion. Is the fovea replaceable? Journal o f laser applications 10,144-147.

242
Appendix 1: Patient characteristics, attendances and data
Tables A 1.1 to A1.4 describe demographic factors, diagnosis and attendances for
each patient. In the instance of early removal from the study, the reason for this is
given. Tables A 1.5 onward give raw data for the results presented in each chapter.
A l.l Age-related m acular disease group
Initials/sex/age
Diagnosis in study eye
Baselinedate
Discharge point, reason
1 FG/F/90 Exudative AMD 07/12/01 12 months2 KD/F/76 Geographic AMD 14/12/01 12 months3 RS/F/60 Geographic AMD 04/02/02 6 months, disease
progression4 MA/F/81 Exudative AMD 15/03/02 12 months5 EC/M/81 Exudative AMD 07/06/02 18 months6 AS/F/75 Geographic AMD 17/06/02 12 months7 DB/M/73 Exudative AMD 02/07/02 12 months8 PF/M/78 Exudative AMD 15/07/02 18 months9 JW/F/75 Geographic AMD 02/08/02 18 months10 JM/F/55 Exudative AMD and
myopic maculopathy03/09/02 6 months, disease
progression11 JY/F/71 Exudative AMD 23/09/02 6 months, disease
progression12 JF/F/87 Exudative AMD 07/10/02 6 months, disease
progression13 SG/F/73 Exudative AMD 18/10/02 12 months14 C A/M/78 Exudative AMD 08/11/02 12 months15 BN/F/56 Geographic AMD 18/11/02 6 months, disease
progression16 IP/F/75 Exudative AMD 22/11/02 3 months, disease
progression17 RH/M/84 Exudative AMD 26/11/02 12 months18 HP/M/84 Exudative AMD 03/12/02 6 months, disease
progression19 RG/M/76 Exudative AMD 20/01/03 12 months20 BP/F/75 Exudative AMD 14/03/03 6 months, poor general
healthTab e A l.l . Characteristics of AMD group. Age is in years and at the time ofrecruitment. Discharge point is the time, after baseline, of the last attendance. Disease progression is defined as a VA drop of more than 2 lines or an increase in scotoma size of 1 disc diameter or more.

M.D. Crossland. Appendix 1: Patient characteristics and data 243
A1.2 Age-matched subjects for AMD group
Initials/sex/age Baseline date Discharge point1 AR/F/72 25/03/02 12 months2 BR/M/71 25/03/02 12 months3 JC/F/80 15/10/02 12 months4 TW/M/75 18/02/03 12 months5 JH/F/72 7/03/03 12 monthsTab e A1.2. Characteristics of subjects without macu ar disease, age-matched forAMD group
A1.3 Juvenile m acular disease group
Initials/sex/age
Diagnosis in study eye
Baseline date Discharge point, reason
1 AP/M/44 Stargardt disease 16/11/01 12 months2 CT/F/17 Best disease 10/09/02 12 months3 JA/F/35 Stargardt disease 28/10/02 6 months, lost to f/up4 JE/M/17 Stargardt disease 28/03/03 6 months5 MF/F/33 Stargardt disease 17/03/03 6 monthsTable A1.3. Characteristics of subjects with early-onset macular disease. Subject JA moved out of the area and was lost to follow-up.
A 1.4 Age-matched subjects for .IM P group
Initials/sex/age Baseline date Discharge point1 PB/M/36 12/11/02 12 months2 AG/F/33 02/12/02 12 months3 GH/M/24 27/01/03 12 monthsTab e A1.4. Characteristics of subjects without macu ar disease, age-matched forJMD group

M.D. Crossland. Appendix 1: Patient characteristics and data 244
A1.5 Data for chapter 5
This table gives the baseline data for all patients as used in chapter 5.
Initials Group ETDRS CS NVA SS RSAP J 0.7 0.15 20 1 0AS A 0.72 1.2 20 1.5 34BN A 0.7 0.95 12 0.5 77BP A 0.86 0.75 20 4 25CA A 0.6 1.05 20 1 105CT J 0.74 1.65 10 0.5 124DB A 0.9 1.3 32 5 22EC A 0.56 1 10 1.5 129FG A 0.56 1.2 10 1 43HP A 0.76 1.35 10 3 136IP A 0.84 1.05 20 1 96JA J 0.34 1.6 6 2 58JE J 0.7 1.55 6 1 139JF A 0.54 1.5 8 0.5 109JM A 0.82 0.9 20 2 61JW A 0.86 1.2 25 5 48JY A 0.82 0.8 12 2 117KD A 0.22 1.55 4 2 115MA A 0.92 1.3 20 1 60MF J 1 0.45 12 3 44PF A 0.6 1.15 10 1 91RG A 0.66 1.05 16 2 100RH A 0.58 1.5 6 1 95RS A 0.5 1.05 10 4 75SG A 0.12 1.2 4 1 130
Table A1.5. Baseline information for all patients. Group: A=AMD, J=JMD; ETDRS: Distance visual acuity (logMAR units); CS: Contrast sensitivity (log units); NVA: Near visual acuity (N units); Scotoma size (disc areas); RS: Reading speed for suprathreshold text (words/minute).

M.D. Crossland. Appendix 1: Patient characteristics and data 245
A1.6 Data for chapter 6
This table gives the data used for the PRL location and awareness of PRL use
discussed in chapter 6.
Initials Group PRL baseline PRL exit PRL change? Re-ref? Re-ref time RS baseline RS exitAP J C B N Y 6 0 0AS A R L Y Y 0 34 45BN A L L N Y 6 77 63BP A L L N N 25 32CA A L L N N 105 66CT J L L N Y 1 124 142DB A A L Y N 22 10EC A R B Y Y 3 129 58FG A R B Y Y 3 43 87HP A R R N Y 3 136 123IP A R L Y N 96 69JA J C B Y Y 0 58 60JE J B B N Y 0 139 120JF A C B Y N 109 108JM A R R N N 61 63JW A B B N N 48 53JY A L L N N 117 7KD A A R Y Y 6 115 71MA A B B N Y 3 60 70MF J A B Y Y 2 44 44PF A R L Y Y 0 91 121RG A L L N Y 6 100 52RH A R R N Y 6 95 121RS A C R Y N 75 61SG A C L Y N 130 110
Table A1.6. PRL location, re-referencing and reading speed data for all patients. Group: A=AMD, J=JMD; PRL baseline: PRL location in visual field space at baseline; PRL exit: PRL location in visual field at exit; PRL change?: PRL location change over course of study, Y=Yes, N=No; Re-ref?: Re-referencing occurs over the course of the study, Y=Yes, N=No; Time to re-ref: Time in months for re- referencing to occur; RS baseline: reading speed at baseline (words/minute); RS exit: reading speed at exit (words/minute).

M.D. Crossland. Appendix 1: Patient characteristics and data 246
A1.7 D ata for chapter 7
This table gives the data used for the fixation stability and the number of PRLs used
location discussed in chapter 7.
Initials FS baselint logFS bast logFS exi nPRL base nPRL exil RepPRL base RepPRL exil multPRL bas multPRL exiAP 16482 9.71 9.83 1 1 y y n nAS 38701 10.56 10.31 3.75 1.8 n n y yBN 5232 8.56 6.63 1.6 1 n y y nBP 139246 11.84 10.7 1.6 1.6 n n y yCA 11499 9.35 8.93 1 1 y y n nCT 5526 8.62 8.43 2 1 y y y nDB 18722 9.84 10.66 1 2 y y n yEC 6381 8.76 9.4 1.2 2 n y y yFG 21384 9.97 9.42 1.8 1.8 n n y yHP 3124 8.05 7.57 1.4 1 n y y nIP 40626 10.61 12.4 1.8 1.4 n n X __ yJA 3279 8.10 8.06 1.4 1 n y y nJE 4929 8.50 8.49 1 1 ,y n nJF 6222 8.74 8.05 1.6 1 n y y nJM 12990 9.47 9.51 2 1 y y y nJW 28152 10.25 11.3 2 1.4 y n y yJY 1784 7.49 7.7 1 1 y y n nKD 4832 8.48 7.55 1 1 y. .. y n nMA 12161 9.41 10.1 1.6 1 n y y nMF 2387 7.78 7.5 1.2 1 n y. E T . .
nPF 13380 9.50 9.33 1.6 2 n y y yRG 18980 9.85 10.9 1.6 2 n y y )L .RH 7467 8.92 7.92 2 2 y y y . yRS 851 6.75 9.05 1 1.8 y n n ySG 2184 7.69 7.82 1 1 y . . ... . y________ n nTable A 1.7. Fixation sta )ility, number of PRLs anc repeatability of number ofPRLs for all patients. FS baseline: fixation stability at baseline (BCEA, minarc2); logFS base: natural logarithm of fixation stability at baseline (log minarc2); logFS exit: natural logarithm of fixation stability at exit (log minarc2); nPRL base: mean number of PRLs used at baseline; nPRL exit: mean number of PRLs used at exit; repPRL base: the use of a repeatable number of PRLs at baseline (y=yes, n=no); repPRL exit: the use of a repeatable number of PRLs at exit (y=yes, n=no); multPRL base: the use of multiple PRLs at baseline (y=yes, n=no); multPRL exit: the use of a repeatable number of PRLs at exit (y=yes, n=no).
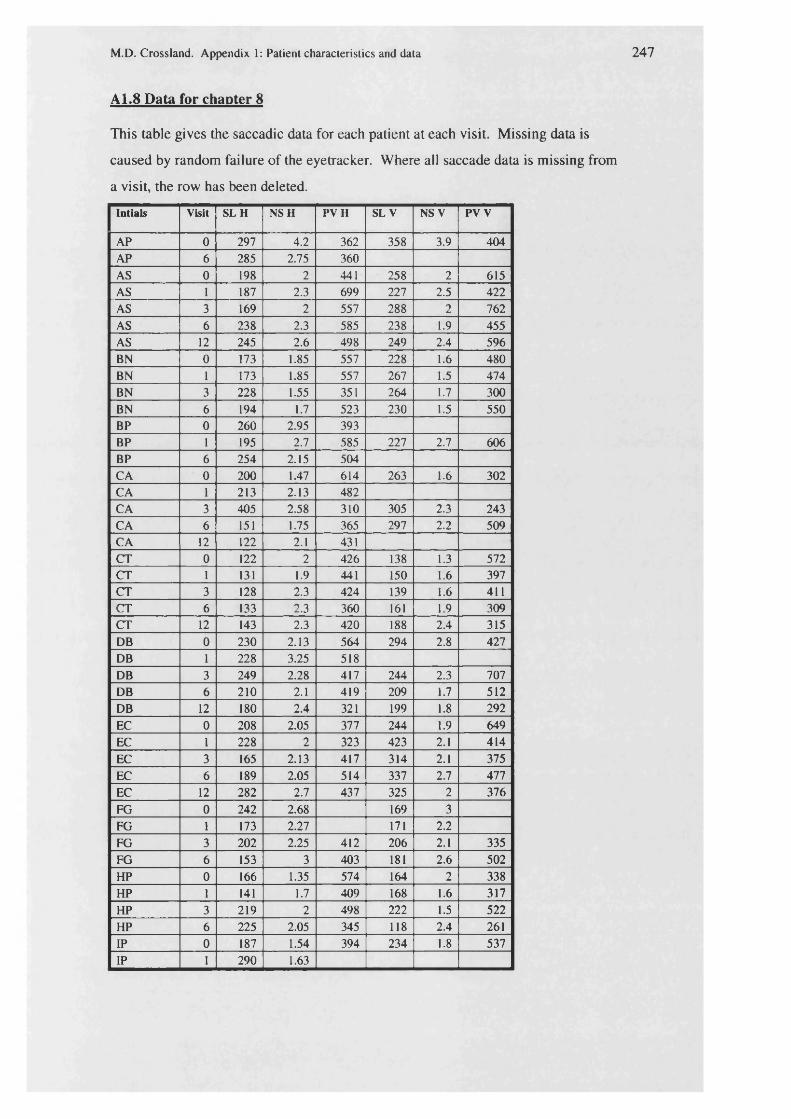
M.D. Crossland. Appendix 1: Patient characteristics and data 247
A1.8 Data for chapter 8
This table gives the saccadic data for each patient at each visit. Missing data is
caused by random failure of the eyetracker. Where all saccade data is missing from
a visit, the row has been deleted.
Intials Visit SLH NSH PVH SL V NS V PV V
AP 0 297 4.2 362 358 3.9 404AP 6 285 2.75 360AS 0 198 2 441 258 2 615AS 1 187 2.3 699 227 2.5 422AS 3 169 2 557 288 2 762AS 6 238 2.3 585 238 1.9 455AS 12 245 2.6 498 249 2.4 596BN 0 173 1.85 557 228 1.6 480BN 1 173 1.85 557 267 1.5 474BN 3 228 1.55 351 264 1.7 300BN 6 194 1.7 523 230 1.5 550BP 0 260 2.95 393BP 1 195 2.7 585 227 2.7 606BP 6 254 2.15 504CA 0 200 1.47 614 263 1.6 302CA 1 213 2.13 482CA 3 405 2.58 310 305 2.3 243CA 6 151 1.75 365 297 2.2 509CA 12 122 2.1 431CT 0 122 2 426 138 1.3 572CT 1 131 1.9 441 150 1.6 397CT 3 128 2.3 424 139 1.6 411CT 6 133 2.3 360 161 1.9 309CT 12 143 2.3 420 188 2.4 315DB 0 230 2.13 564 294 2.8 427DB 1 228 3.25 518DB 3 249 2.28 417 244 2.3 707DB 6 210 2.1 419 209 1.7 512DB 12 180 2.4 321 199 1.8 292EC 0 208 2.05 377 244 1.9 649EC 1 228 2 323 423 2.1 414EC 3 165 2.13 417 314 2.1 375EC 6 189 2.05 514 337 2.7 477EC 12 282 2.7 437 325 2 376FG 0 242 2.68 169 3FG 1 173 2.27 171 2.2FG 3 202 2.25 412 206 2.1 335FG 6 153 3 403 181 2.6 502HP 0 166 1.35 574 164 2 338HP 1 141 1.7 409 168 1.6 317HP 3 219 2 498 222 1.5 522HP 6 225 2.05 345 118 2.4 261IP 0 187 1.54 394 234 1.8 537IP 1 290 1.63

M.D. Crossland. Appendix 1: Patient characteristics and data 248
JA 0 156 2.55 353 150 2 367JA 6 170 2.5 315JE 0 174 1.3 312 171 2.1 369JE 6 167 1.45 321JF 0 225 1.32 661 157 1.5 497JF 1 168 1.65 653 189 1.6 437JF 3 198 1.55 427 188 2 449JF 6 206 1.8 458 163 1.4 396JM 0 223 1.88 553 267 2 371JM 1 188 2.03 526JM 3 190 2.45 571 254 2.1 327JM 6 214 1.53 407 253 2.4 524JW 0 199 2.03 899JW 1 210 2.17 515 300 2.7 445JW 3 170 2.45 557 240 2.5 582JW 6 201 1.93 546 237 1.8 445JW 12 176 2.1 548 187 1.3 628JY 0 211 1.88 633 272 1.8 352JY 1 228 2.45 567 297 2 385JY 3 421 2.5 425 280 1.9 420KD 0 500 1.82 274 196 1.8 583KD 1 362 2.64 335 186 2.1 422KD 3 294 1.92 347 216 2.2 461KD 6 332 1.66 409 184 1.8 496KD 12 339 1.75 440 379 1.2 453MA 0 360 1.98 591 368 2.6 395MA 3 269 2.66 313 315 2.4 574MA 6 224 1.35 509 241 1.7 558MA 12 314 2.7 318 277 2.1 423MA 18 304 2.5 222 239 3.1 279MF 0 184 3.75 303MF 1 187 2.75 500 145 4.2 461MF 6 156 2.45 399 162 3 374PF 0 185 2 417PF 1 260 1.79 398 279 2.2 326PF 3 223 1.3 506 205 1.8 417PF 6 240 1.4 648 241 1.6 354PF 12 234 1.7 307 259 1.5 188PF 18 292 1.33 431RG 0 260 2.15 567 281 1.7 618RG 1 258 2.5 530 325 2.2 254RG 3 208 2.4 394 276 2.3 351RG 6 256 2.75 425 306 2 270RH 0 248 1.55 529 275 1.8 297RH 1 246 1.45 485 274 1.6 500RH 3 248 1 291 307 1.7 229RH 6 215 2.05 334 266 2.3 335RS 0 140 2.35 443 179 1.8RS 1 254 2.72 391 196 1.8 590RS 3 237 4.26 432 201 2.4 617RS 4 270 2.1 455SG 0 184 1.84 359 166 1.5 453

M.D. Crossland. Appendix 1: Patient characteristics and data 249
SG 1 174 2.05 406 203 1.6 447SG 3 200 2.15 384 217 2.5 366SG 6 281 2.15 335SG 12 256 2.15 419
(Above and previous two pages) Table A1.8. Saccadic data for patients at each visit. Left and right saccades collapsed into horizontal, up and down saccades collapsed into vertical. Each value is the mean of 10 saccades. Visit: (months); SL: Saccade latency (msec); NS: Number of saccades; PV: Peak saccadic velocity (deg/sec); H: Horizontal, V: Vertical.

M.D. Crossland. Appendix 1: Patient characteristics and data 250
A1.9 Data for chapter 9
This section contains the data for saccades made when reading for each patient at
each visit. Missing data is related to random eyetracker misfunction. Visits where
all data are missing have been excluded.
Initials Visit F saccs Reg saccs Start saccs FD RS
AS 0 30.7 20 6.7 383 34AS 1 32 24 6.8 368 32AS 3 22 12 4 668 29AS 6 24 8 3.5 489 42AS 12 25 9 3 436 45BN 0 12.25 3 4.25 572 77BN 1 16 3 3 665 52BN 3 17.7 3 2 509 62BN 6 19.3 4 2.7 445 63BP 0 25BP 1 32BP 6 27CA 0 18 3 2.5 302 106CA 1 14.7 4 3.5 675 51CA 3 19CA 6 18.5 4 2.5 452 66CA 12 19 6 1.9 362 72CT 0 15.4 2 1.5 299 125CT 1 12.6 1 1.8 288 163CT 3 14.8 1 1.8 259 159CT 6 13.8 1 1.9 269 170CT 12 16 1 1.5 265 142DB 0 28.5 17 5.25 655 22DB 12 66 50 9 574 10EC 0 14.4 2 2.22 318 130EC 1 18.4 7 5.3 630 42EC 3 14.4 8 2.9 456 64EC 6 16 4 3.1 570 58FG 0 18 2 8 744 44FG 1 13.8 3 2.6 649 60FG 3 15.25 4 2.29 490 71FG 6 14 3 3 453 87HP 0 8.5 3 2 440 136HP 1 9.25 2 2.25 444 129HP 3 11 3 2.125 467 103HP 6 9 3 2.6 442 123IP 0 14 3 2.17 402 96IP 1 22 7 2.9 324 69JA 0 21.5 4 2.5 458 58JA 6 20 3 2.5 478 60JE 0 10.2 2 1.5 397 139JE 6 12.2 2 2.5 385 121JF 0 11 1 1.9 505 109JF 1 13.8 2 1.7 359 117

M.D. Crossland. Appendix 1: Patient characteristics and data
JF 3 13.5 2 1.9 391 109JF 6 16 2 1.7 345 108JM 0 15.3 6 3 510 61JM 1 15.5 3 3 430 81JM 3 20 6 2.75 458 56JM 6 63JW 0 20.75 15 5.125 384 48JW 1 17.6 6 4.4 436 65JW 3 23.5 6 4 439 51JW 6 18.3 5 3 571 51JW 12 22 5 4.5 459 53JY 0 13.2 1 1.9 383 120JY 1 17.4 4 2.1 449 70JY 3 80 149 5 432 7KD 0 9.3 1 2.5 548 115KD 3 11 4 1.5 428 100KD 6 11.2 3 1.4 350 135KD 12 22 6 2.7 338 71MA 0 11 7 5.25 603 60MA 3 19 14 8.75 506 39MA 12 17.3 5 2.7 477 63MA 18 18.3 4 4.3 420 70MF 0 27 5 3.6 464 44MF 1 27 4 3.1 420 51MF 3 24.4 4 1.9 422 56MF 6 26 4 2 500 44PF 0 14.3 3 2 409 91PF 1 18.75 6 2 278 96PF 3 13.5 3 1.75 371 111PF 6 12.3 1 1.7 426 116PF 12 11.8 2 1.5 406 121PF 18 14 4 2 432 85RG 0 14.4 2 1.5 407 100RG 1 11.7 1 1.8 405 125RG 3 17.5 4 2.5 430 70RG 6 20 4 1.75 520 52RH 0 10 3 2.25 541 95RH 1 11.75 2 1.6 505 93RH 3 10 1 2 517 121RH 6 12.3 2 2 372 121RS 0 14.4 9 3.1 378 75RS 3 16.75 10 3.25 398 61RS 6 19.3 12 7.4SG 0 17 2 1.5 272 131SG 1 18.3 2 1.67 281 114SG 3 16 5 2.7 336 93SG 6 110
Table A1.9 (and previous page). Reading saccade data for all patients at each visit. Visit: (months); F sacc: mean number of forward saccades to read the sentence; Reg sacc: mean number of regressive saccades per sentence; Start sacc: mean number of saccades to the start of each line; FD: fixation duration (msec); RS: suprathreshold reading speed (words/minute).

253
Appendix 2: Patient information booklet and consent formThe following pages show the patient information booklet which was read by all
participants, and the consent form which was signed prior to data collection starting.

M.D. Crossland. Appendix 2: Consent form. 254
VISUAL BEHAVIOUR IN MACULAR DISEASE:PATIENT INFORMATION BOOKLET
AND CONSENT FORM
Please read this booklet carefully.If you are unable to see the text, or if there is anything you do not understand, please ask a member of the study team for their help.You are being invited to take part in a research study. Before you decide if you want to take part it is important for you to understand why the research is being done and what it will involve. Please take time to read the following information carefully and discuss it with your friends, relatives and your GP if you wish. Ask us if there is anything that is not clear or if you would like more information. Take time to decide whether or not you wish to take part. Consumers for Ethics in Research (CERES) publish a leaflet entitled “Medical Research and You.” This leaflet gives more information about medical research and looks at some questions you may wish to ask. A copy may be obtained from CERES, PO Box 1365, London N16 OBW.
Thank you for reading this.

M.D. Crossland. Appendix 2: Consent form. 255
What is the purpose of the study?
People with macular disease are often unable to see with the central part of the vision. However, the peripheral (“side”) vision is usually good. Therefore some people with macular disease look at things with their side vision rather than by looking straight at them. The goal of this study is to find out how people with different types of macular d isease learn to use their side vision for everyday tasks like reading and recognising faces.
Why have I been chosen?
You have been chosen for this study by your doctor because you have a particular type of macular disease and your vision has recently changed. Around 40 patients in your situation have been chosen for the study.
Do I have to take part?
It is up to you to decide whether or not you want to take part. If you do decide to take part you will be given this information sheet to keep and be asked to sign a consent form. If you do decide to take part you are still free to withdraw at any time and without giving a reason. This will not affect the standard of care you receive. [If you do not wish to take part in this study you will not be at a disadvantage and will continue to receive normal clinical management.]
What will happen to me if I take part?
You will be asked to come to the Institute of Ophthalmology (next to the main part of Moorfields Eye Hospital) up to 5 times over the next year. The visits are more frequent in the first stages of the study because your use of “side vision” will be changing at this time.
Each visit will last about an hour. During each visit, som e or all of these tests will be done:
• Refraction (a normal eye test)• Measurement of your vision and reading will be tested using
different charts

M.D. Crossland. Appendix 2: Consent form. 256
• A special instrument called an SLO will be used to look at the back of the eyes. You will be asked to look at different letters, shapes or words which will be shone into your eye by the machine.
• Another instrument will look at how your eyes move while you are reading. This fits on a headband around your forehead and shines an invisible light towards your eyes.
All of these tests are safe and have been used extensively in research. None of them are painful. The tests are not difficult to do although you may be asked to keep your eyes still.
If you were not taking part in the study, only refraction would normally be performed when you visit the hospital; all of the other tests would not be part of normal clinical care.
It is important that you are able to set aside enough time for each visit.
You will also still have to attend the medical retina clinic to see your eye doctor in the usual way. We will try and make the clinic and research visits on the same day when possible.
What do I have to do?
Apart from visiting the Institute for each appointment, there are no restrictions on your lifestyle. You can continue to take any medicines or eyedrops as normal.
What are the possible benefits of taking part?
Taking part in the study may help you to learn how to use “side vision” more effectively. However the results of the research are more likely to be of benefit to other people who develop macular disease in the future.
You will be given travel expenses and some money for lunch at the Friends’ cafeteria at each visit.
You can also have a low vision assessm ent (LVA) without having to go through the normal hospital waiting system.

M.D. Crossland. Appendix 2: Consent form. 257
I can review any glasses or magnifiers that you currently use and can supply any more appropriate devices, if possible.
What happens when the research study stops?
You will still be seen in the Medical Retina Clinic in the normal manner after the study stops.
What if something goes wrong?
The research does not carry any more risks than visiting the hospital in the normal way. If taking part in this research project harms you, there are no special compensation arrangements. If you are harmed due to someone’s negligence, then you may have grounds for a legal action but you may have to pay for it. Regardless of this, if you wish to complain about any aspect of the way you have been approached or treated during the course of this study, the normal National Health Service complaints mechanisms may be available to you.
Will my taking part In this study be kept confidential?
All information that is collected about you during the course of the research will be kept strictly confidential. Any information about you which leaves the hospital or Institute will have your name and address removed so that you cannot be recognised from it.
Your general practitioner (GP) will be informed that you are taking part in this study, if you wish.
What will happen to the results of the research study?
The results will be published as part of a PhD thesis. They are also likely to be used at conferences or in papers (articles) in medical journals. You will not be identifiable from any published results of the study. If you wish, copies of research papers can be given to you.
Who is organising and funding the research?
The research is being carried out between Moorfields Eye Hospital and the Institute of Ophthalmology (part of University College London).

M.D. Crossland. Appendix 2: Consent form. 258
It is being supervised by Professor Gary Rubin of the Department of Visual Rehabilitation at the Institute. Professor Alan Bird and Dr Louise Culham at Moorfields are also involved in the study.
The study is being funded by the research fund of the Guide Dogs for the Blind Association (GDBA).
Who has reviewed the study?
The study has been approved by the Moorfields Research Ethics Committee.
Who can I contact for more information?
I am the person who will be carrying out most of the tests on you, and I can be contacted by telephone on 020-7608 6957or by e-mail at m.crossland @ ucl.ac.uk
My name is Michael Crossland and I am an optometrist working at both Moorfields and the Institute.
Thank you for taking the time to read this booklet.
Prepared by Michael Crossland Version 2/November 2000

M.D. Crossland. Appendix 2: Consent form. 259
Study Number: CULL1003Patient Identification Number for this trial:
CONSENT FORM
The development of optimal viewing strategies in Maculardisease
Principal Researcher: Michael Crossland BSc MCOptom
Pleaseinitial box
1. I confirm that I have read and understand the information sheet dated November 2000 (version 2) for the above study and have had the opportunity to ask questions.
2. I understand that my participation is voluntary and that I am free to withdraw at any time, without giving any reason, without my medical care or legal rights being affected
3 .1 agree to take part in the above study.
Name of patient Date Signature
Name of Person taking consent Date Signature(if different from researcher)
Michael Crossland Researcher Date Signature

260
Appendix 3: Protocols for methods
To ensure that the methods used in this thesis are reproducible, this chapter will give
protocols for each of the techniques described in chapter 2.
A3.1 Protocol for refraction
Patients were refracted in the vision rehabilitation research laboratory at the Institute
of Ophthalmology, a room equipped with an ETDRS logMAR visual acuity chart
positioned 4 metres from a comfortable patient chair.
Patients’ habitual distance spectacles were neutralised using a Topcon focimeter
(LM-8, Topcon, Japan). A trial frame was placed on the patient, and sphero
cylindrical retinoscopy was performed on the study eye only, from a distance of 50
cm, whilst the other eye maintained distance fixation. The lens corresponding to the
corrected retinoscopy result (i.e. without the +2.00 DS addition for the retinoscope
distance) was inserted into the trial frame. The contralateral eye was then occluded.
Subjective refraction was performed to refine the spherical component of the
prescription, using spherical lenses of the smallest increment at which patients could
appreciate a difference in vision, whilst patients observed a line of letters on the
ETDRS chart. The cylindrical axis and power was checked using a negative cross
cylinder technique whilst patients observed a letter O on the ETDRS chart. Finally
the spherical power was refined on the smallest observable line of letters. All lenses
used were full aperture glass trial lenses, placed as close to the eye as was
comfortable.
If the patient could not see any letters at the 4m viewing distance, the chart was
repositioned to 2m for the purpose of refraction.
A3.2 Protocol for visual acuity measurement
Patients viewed the ETDRS chart from a distance of 4 metres with the refractive
correction found above placed into the trial frame. The contralateral eye was
occluded. Patients were asked to read the chart from the first letter onwards. When
M.D. Crossland. Appendix 3: Protocols 261
patients claimed they were unable to read a letter, they were encouraged to guess.
When patients read two or more letters on a line correctly, they were asked to read
the next line. Scoring was achieved by recording the size of the last line of letters
which was read correcdy, with an addition of 0.02 log units for each letter on the
chart read incorrectly.
A3.3 Protocol for contrast sensitivity m easurement
Patients were asked to read the Pelli-Robson chart which was held at eye level one
metre in front of the patient chair. Patients wore their optimal refractive correction
in a trial frame with the contralateral eye occluded. Patients were asked to read from
the top of the chart downwards. When patients claimed that they could not read a
letter, they were encouraged to look at the letter for at least 20 seconds before
making a guess. Testing finished when patients failed to identify any letters of a
triad. Scoring was based on the last triad on which patients correctly identified any
letters, with a 0.05 log unit reduction for every error made on the chart. For the
purposes of scoring, O was classified as a correct response for the letter C, in the
manner described by Elliott (1991).
A3.4 Protocol for m icroperim etrv assessment
Patients were sat at the SLO with the chinrest adjusted to a comfortable height. The
test eye was observed and the contralateral eye was occluded. The background
screen luminance was set to 1 cd/m2, the fixation cross height to 2.5° and the
stimulus size to Goldmann III size. The fixation cross was displayed on the raster
and moved around to ensure that the patient was able to see and follow the target.
The cross was then set in the centre of the raster. An initial stimulus was presented
at an area with presumed visual function. A distinctive retinal feature such as a
vessel bifurcation or disc feature was used as the reference marker.
Further stimuli were presented in a roughly square array encompassing the fovea and
ensuring that the edge of the scotoma was identified in each major meridian. Stimuli
were presented in a pseudorandom order, determined by the investigator. Particular
attention was made to visible areas of atrophy, hyper- or hypo-pigmentation and the
border of the scotoma. If patients indicated that the task was becoming difficult they

M.D. Crossland. Appendix 3: Protocols
were invited to sit back and take a rest before data collection recommenced. The
same reference point was used throughout to ensure that an accurate map was
created. When the investigator was satisfied that the microperimetry map accurately
described the scotoma, a final retinal image was grabbed and the patient was invited
to sit back from the SLO.
A3.5 Protocol for gazetracker set-up and calibration
Patients were asked to sit in a chair at 50cm from centre of the display monitor.
Room lights were turned off., but the ETDRS chart was left on to provide
background illumination for safety. The monitor height was adjusted to ensure that
the centre of the screen was at the patient’s eye level. The non-examined eye was
occluded with a simple eye patch, and an appropriate refractive correction (distance
prescription +2.00DS) was placed into a trial frame using full aperture lenses. The
eyetracker headset was placed on the patient’s head and the restraining straps were
tightened until the patient reported that it felt firm yet comfortable. The camera was
adjusted so that it gave a clear image of the eye, and the eye camera was adjusted to
minimise the size of the corneal reflections from the focusing device. Pupil
threshold was set automatically by using the Eyelink command “A.” The
antireflection system was turned off.
Calibration was performed using the 5-point algorithm supplied with the eyetracker.
Targets were enlarged to be 3 degree black circle with an 18’ central detail.
Calibration was repeated, with careful instruction, until “good” calibration was
reported by the eyetracker. Validation was then performed, followed by drift
correction.

Appendix 4: Published papers
263
To date, three papers based on this thesis have been accepted for publication in peer-
reviewed journals.
The first of these described the method of using the gazetracker for the measurement
of fixation stability. This paper appeared in Optometry and Vision Science in 2002.
The second paper, describing the statistical techniques used, has been published in
Vision Research in 2004.
The third paper is currently in press at Ophthalmic and Physiological Optics. A
preprint copy of this paper can be found at the very end of this thesis.

260
Appendix 3: Protocols for methods
To ensure that the methods used in this thesis are reproducible, this chapter will give
protocols for each of the techniques described in chapter 2.
A3.1 Protocol for refraction
Patients were refracted in the vision rehabilitation research laboratory at the Institute
of Ophthalmology, a room equipped with an ETDRS logMAR visual acuity chart
positioned 4 metres from a comfortable patient chair.
Patients’ habitual distance spectacles were neutralised using a Topcon focimeter
(LM-8, Topcon, Japan). A trial frame was placed on the patient, and sphero
cylindrical retinoscopy was performed on the study eye only, from a distance of 50
cm, whilst the other eye maintained distance fixation. The lens corresponding to the
corrected retinoscopy result (i.e. without the +2.00 DS addition for the retinoscope
distance) was inserted into the trial frame. The contralateral eye was then occluded.
Subjective refraction was performed to refine the spherical component of the
prescription, using spherical lenses of the smallest increment at which patients could
appreciate a difference in vision, whilst patients observed a line of letters on the
ETDRS chart The cylindrical axis and power was checked using a negative cross-
cylinder technique whilst patients observed a letter O on the ETDRS chart. Finally
the spherical power was refined on the smallest observable line of letters. All lenses
used were full aperture glass trial lenses, placed as close to the eye as was
comfortable.
If the patient could not see any letters at the 4m viewing distance, the chart was
repositioned to 2m for the purpose of refraction.
A3.2 Protocol for visual acuity measurement
Patients viewed the ETDRS chart from a distance of 4 metres with the refractive
correction found above placed into the trial frame. The contralateral eye was
occluded. Patients were asked to read the chart from the first letter onwards. When

M.D. Crossland. Appendix 3: Protocols
patients claimed they were unable to read a letter, they were encouraged to guess.
When patients read two or more letters on a line correctly, they were asked to read
the next line. Scoring was achieved by recording the size of the last line of letters
which was read correcdy, with an addition of 0.02 log units for each letter on the
chart read incorrectly.
A3.3 Protocol for contrast sensitivity measurement
Patients were asked to read the Pelli-Robson chart which was held at eye level one
metre in front of the patient chair. Patients wore their optimal refractive correction
in a trial frame with the contralateral eye occluded. Patients were asked to read from
the top of the chart downwards. When patients claimed that they could not read a
letter, they were encouraged to look at the letter for at least 20 seconds before
making a guess. Testing finished when patients failed to identify any letters of a
triad. Scoring was based on the last triad on which patients correctly identified any
letters, with a 0.05 log unit reduction for every error made on the chart. For the
purposes of scoring, O was classified as a correct response for the letter C, in the
manner described by Elliott (1991).
A3.4 Protocol for m icroperim etrv assessment
Patients were sat at the SLO with the chinrest adjusted to a comfortable height. The
test eye was observed and the contralateral eye was occluded. The background
screen luminance was set to 1 cd/m2, the fixation cross height to 2.5° and the
stimulus size to Goldmann III size. The fixation cross was displayed on the raster
and moved around to ensure that the patient was able to see and follow the target.
The cross was then set in the centre of the raster. An initial stimulus was presented
at an area with presumed visual function. A distinctive retinal feature such as a
vessel bifurcation or disc feature was used as the reference marker.
Further stimuli were presented in a roughly square array encompassing the fovea and
ensuring that the edge of the scotoma was identified in each major meridian. Stimuli
were presented in a pseudorandom order, determined by the investigator. Particular
attention was made to visible areas of atrophy, hyper- or hypo-pigmentation and the
border of the scotoma. If patients indicated that the task was becoming difficult they

M.D. Crossland. Appendix 3: Protocols
were invited to sit back and take a rest before data collection recommenced. The
same reference point was used throughout to ensure that an accurate map was
created. When the investigator was satisfied that the microperimetry map accurately
described the scotoma, a final retinal image was grabbed and the patient was invited
to sit back from the SLO.
A3.5 Protocol for gazetracker set-up and calibration
Patients were asked to sit in a chair at 50cm from centre of the display monitor.
Room lights were turned off., but the ETDRS chart was left on to provide
background illumination for safety. The monitor height was adjusted to ensure that
the centre of the screen was at the patient’s eye level. The non-examined eye was
occluded with a simple eye patch, and an appropriate refractive correction (distance
prescription +2.00DS) was placed into a trial frame using full aperture lenses. The
eyetracker headset was placed on the patient’s head and the restraining straps were
tightened until the patient reported that it felt firm yet comfortable. The camera was
adjusted so that it gave a clear image of the eye, and the eye camera was adjusted to
minimise the size of the corneal reflections from the focusing device. Pupil
threshold was set automatically by using the Eyelink command “A.” The
antireflection system was turned off.
Calibration was performed using the 5-point algorithm supplied with the eyetracker.
Targets were enlarged to be 3 degree black circle with an 18’ central detail.
Calibration was repeated, with careful instruction, until “good” calibration was
reported by the eyetracker. Validation was then performed, followed by drift
correction.

Appendix 4: Published papers
263
To date, three papers based on this thesis have been accepted for publication in peer-
reviewed journals.
The first of these described the method of using the gazetracker for the measurement
of fixation stability. This paper appeared in Optometry and Vision Science in 2002.
The second paper, describing the statistical techniques used, has been published in
Vision Research in 2004.
The third paper is currently in press at Ophthalmic and Physiological Optics. A
preprint copy of this paper can be found at the very end of this thesis.

Available on line at w w w .scien ced irect.com
8 C I E l!NCE (c$DinEcT® Vision Research
ELSEVIER V ision Research 44 (2004) 1537-1546www.elsevier.com /locate/visres
Evaluation of a new quantitative technique to assess the number and extent of preferred retinal loci in macular disease
M.D. Crossland a’*, M. Sims b, R.F. Galbraith b, G.S. Rubin “a Division o f Vision R ehabilitation Research, Institu te o f Ophthalm ology, University C ollege London, 11-43 Bath Street, London E C 1 V 9EL, UK
b D epartm ent o f S ta tis tica l Sciences, University College London, Gower Street, London, W C 1E 6 B T U K
Received 27 M ay 2003; received in revised form 29 D ecem ber 2003
Abstract
Patients with scotomas due to macular disease may use more than one preferred retinal locus (PRL) for fixation. We have developed and evaluated an objective, quantitative technique to determine the num ber of PRLs used during an episode of fixation and the extent o f each locus. In five o f eight adults with m acular disease our techniques consistently indicated the presence of multiple PRLs. Patients with multiple PRLs were more likely to have suffered recent vision loss in the tested eye. O ur technique describes fixation more fully than the traditional method of calculating a single bivariate contour ellipse area.© 2004 Elsevier Ltd. All rights reserved.
Keywords: M acular disease; Fixation; Retina; H um an
1. Introduction
Patients with central vision loss due to macular disease are less able to hold steady fixation than those with good foveal function (Culham, Fitzke, Timberlake, & Marshall, 1993; Schuchard & Raasch, 1992; Steinman, Cushman, & M artins, 1982; W hite & Bedell, 1990; W hittaker, Budd, & Cummings, 1988). Assessment of fixation stability has been performed by many research groups interested in visual function in macular disease (Kosnik, Fikre, & Sekuler, 1986; Schuchard & Fletcher, 1994; White & Bedell, 1990; W hittaker et al., 1988).
Fixation stability has traditionally been quantified by calculating the area of an ellipse which encompasses fixation points for a given proportion (P ) of eye positions during one fixation trial. This area is known as the Bivariate C ontour Ellipse Area (BCEA) (Steinman, 1965). A smaller BCEA correlates to more stable fixation whereas if the eye “wanders” more then the BCEA will be larger. An example of a bivariate contour ellipse fitted to 10 s of fixation data in a subject with norm al vision fixating a circular target (as described in Section 2
'C orresponding author. Tel.: +44-20-7608-6957; fax: +44-20-7608- 6983.
E-m ail address: m .crossland@ ucl.ac.uk (M .D . Crossland).
0042-6989/$ - see front m atter © 2004 Elsevier Ltd. All rights reserved, doi: 10.1016/j.visres.2004.01.006
below) is shown in Fig. 1. The BCEA is 553 minarc2, consistent with data collected for subjects w ithout disease in our laboratory (Crossland & Rubin, 2002).
Patients with central scotomas from macular disease use a preferred retinal locus (PRL) by viewing targets eccentrically rather than directly (Culham et ah, 1993; Fletcher & Schuchard, 1997; Fletcher, Schuchard, & W atson, 1999; Schuchard, 1995; Schuchard & Fletcher, 1994; Schuchard, Naseer, & de Castro, 1999; von Noorden & Mackensen, 1962; W hite & Bedell, 1990; W hittaker, Cummings, & Swieson, 1991). Further, some authors have reported patients using two or more PRLs for fixation during one trial (Duret, Issenhuth, & Safran, 1999; Lei & Schuchard, 1997; W hittaker et ah, 1988).
For the purpose of this study, our operational definition of a preferred retinal locus is “a circumscribed retinal area, used for fixation of a target for ^ 10% of the duration of a trial.”
If fixation is divided between multiple retinal areas then quantifying fixation stability using the BCEA technique can underestimate patients’ fixation ability. For example, if the patient exhibits good fixation in two closely circumscribed areas, calculation of a “global” BCEA would indicate very poor fixation whereas fixation may be relatively stable within the two locations.
W hittaker and co-workers defined subjects as displaying multiple fixation loci by assuming an arbitrary

1538 M .D . Crosslcmcl e t al. / Vision Research 44 (2 0 0 4 ) 1537-1546
3 0 i
tj
c2 0-mca)oQ)T3>-
-30-4-30 0 30
X decentration (min arc)
Fig. 1. Fixation data for norm al observer PB with a P = 0.68 density ellipse. BCEA = 553 m inarc2.
maximum area for each PRL of 3° x 3° (W hittaker et al., 1988). This technique could overestimate fixation stability if the eye was drifting over a wider area without discrete loci being present. Other researchers have observed the retina during fixation but have only described multiple PRLs when very different areas of the retina were used for fixation (D uret et al., 1999; Lei & Schu- chard, 1997).
In order to determine how many loci are present within one fixation trial, a test for multimodality is required. Form al statistical tests for detecting the number of multiple components exist (Titterington, Smith, & M akov, 1985), however they require the distance between the components to be large. An informal test such as the kernel density estim ator (see Appendix A) can allow the number o f components to be visually determined from a contour plot of the kernel density estimates.
We have developed a technique to calculate the number o f PRLs during one set of fixation data and use an iterative process to determine the characteristics of each of these PRLs. We show that assigning a number of “ local” BCEAs can describe data from these sorts of experiments more completely than one global BCEA can.
2. Method
2.1. Patients
Eight patients with macular disease and macular scotomas dem onstrated on the Amsler test, were recruited from the Medical Retina and Low Vision clinics at Moorfields Eye Hospital in London. The Amsler test is not very sensitive to detecting the presence of macular scotomas (many false negatives, Schuchard, 1993) but it is reasonably specific (few false positives). Furtherm ore, the presence of a macular scotoma was subsequently
verified with a scanning laser opthalmoscope. Only those with non-treatable macular lesions, or those who had already had medical or surgical intervention, were included in the study. Exclusion criteria included diabetes mellitus, a history of psychiatric or neurological disease and ocular comorbidity other than visually insignificant cataract. The second eye to be affected was measured in recent onset cases. In long-standing macular disease the eye with the better acuity was used.
The study followed the Declaration of Helsinki and was approved by the Moorfields Eye Hospital ethics committee. Patients gave their informed consent prior to entering the study.
2.2. Assessment o ffixa tion stability
Patients were asked to fixate a round, black target of 3° diameter with an 18' white central detail displayed against a white background on a com puter m onitor (Trinitron G D M -F500R, Sony, Japan). The background screen luminance was 125 cd/m2, resolution was 800x600 pixels and the refresh frequency was 85 Hz. The target was displayed for a period of 10 s.
Eye position was measured with an SMI gazetracker (SensoM otoric Instrum ents, Germany) using Eyelink software (version 2.04). This eyetracker consists of two infra-red cameras which are mounted on a headband and record eye position using the “bright-pupil” technique. A further camera tracks head motion with respect to infra-red emitters mounted in front of the patient at the corners of the video display. Compensation for head m otion is made so that a real position of gaze can be calculated. Eye position is measured at a temporal frequency of 250 Hz and the manufacturers report a gaze position accuracy of <0.5°.
Calibration, drift correction and validation were performed prior to stimulus display using the algorithms provided for this purpose. Only trials where the calibration was categorised as “good” by the Eyelink software were included. Calibration is described as “good” when minimal nonlinearity exists when fixating different target positions (maximum ratio o f gains =1.5:1 horizontally, 3:1 vertically (personal communication, SR Research, Osgoode, Canada)).
Although the eyetracker can measure both eyes independently and simultaneously, only data from the eye of interest was recorded. The contralateral eye was occluded.
Five practice trials were performed to ensure patient understanding of the task.
2.3. Data processing
The first second o f data was discarded as it included eye movements whilst patients were finding the target on the screen. A lthough these data are of interest in terms

M .D . C rossland e t al. I Vision Research 44 (2 0 0 4 ) 1537-1546 1539
of the number o f saccades and speed with which a patient can locate a newly presented stimulus, it was felt that they would detract from pure stability of fixation measurements. Similarly data recorded during saccades (where eye movement exceeds 30°/s) were excluded. Recordings taken 0.25 s before and 0.5 s after the start of a blink were removed to avoid the vertical artefact which is elicited by lid movement with our eyetracker. To ensure that we were not undersampling our data files excessively, the gazetracker was operated at the maximum temporal frequency (250 Hz) and only trials where more than 60% o f data remained were used.
2.4. Statistical methods 1: calculation o f a “global” BCEA
A “ global” BCEA was calculated to encompass a given proportion of all fixation points, using the formula:
BCEA = 2knoHov {\ - p2) 1/2 (1)
where is the standard deviation of point location over the horizontal meridian, erv the standard deviation of point location over the vertical meridian, and p the product-m om ent correlation o f these two position components.
The value k is dependent upon the probability area chosen (see Eq. (2))
P = 1 - e~* (2)
where e is the base of the natural logarithm.Therefore when k is 1, 63.2% of the fixation positions
lie within this area.Different authors have used different values of P , such
as 0.63 (Kosnik et al., 1986; Steinman, 1965), 0.68 (Culham et al., 1993; Nachmias, 1959) or 0.95 (Schu- chard & Raasch, 1992).
For the purposes of this study, fixation data have been calculated with a P value of 0.68 {k — 1.14) in order to remain consistent with previous research performed in this laboratory.
-4Q -20 0 20X deceleration (min arc)
(b)
-20
60-60 -no 20 0 20 HO 80X decentral ion (min arc)
£ 20
>- -40
-60 -40 -20 0 20 40 60 80
X decertration (min arc)
(d)PRL Mean
XMean
YSD X SD Y Correlation
coefficientP BCEA
(minarc2)1 -14.9 16.7 7.26 5.16 -0.50 0.36 24002 -13.8 -5.42 6.77 4.45 -0.65 0.31 25003 37.7 -24.9 8.63 6.17 -0.25 0.22 4340
Fig. 2. (a) Cleaned data set, (b) global BCEA fitted to data (B C E A = 21 725 m inarc2), (c) contour plot produced by the K D E indicates three PRLs, (d) description o f each locus returned by the EM algorithm and p = proportion o f data points in each PRL.

1540 M .D . C rossland e t al. / Vision Research 44 (2 0 0 4 ) 1537-1546
2.5. Statistical methods 2: determining the number o f PRLs present
The kernel density estimator (KDE) was applied to the reduced data set using software written in S-PLUS (v4.5, M athSoft Inc., Cambridge, MA) by MS. The window width was set at the optimum level described by Bowman and Foster (1992) and a contour plot of the density estimates was produced using a 50x50 grid. Appendix A gives a more complete description of the KDE. An example of an ambiguous data set which is processed by the KDE is shown in Fig. 2.
2.6. Statistical methods 3: determining the parameters o f each PRL
After performing the K D E calculations, a mixture of component bivariate normal distributions was fitted to the data using the EM (expectation, maximisation) algorithm. The number o f discrete peaks seen on the contour plot produced by the K D E was used as the number of components. The EM algorithm returns the estimated parameters of each bivariate normal distribution, the mean position and the standard deviation along the x and y axes, the correlation coefficient, a “ local” BCEA for each locus (using Eq. (1)) and an estimate of the proportion of data which fell into each locus. The estimated parameters are those for which the log likelihood is highest. The algorithm calculates the value of the log likelihood and also the Bayesian information criterion (BIC) and the integrated classification likelihood (ICL-BIC) (M cLaughlan & Peel, 2000). These can be useful to aid model selection (for example to determine the number of components if this is not clear from the K D E plot). The whole process was performed ten times using different starting values in order to check that the estimates converged to the correct final values.
M athematical properties o f the EM algorithm are discussed in Appendix B.
Linear regression and ANOVA analyses used elsewhere were performed using JM P software (version4.0.4; SAS Institute, Cary, NC).
3. Results
3.1. Patients
One patient (aged 44 years) had Stargardt disease, a juvenile macular disease. The other seven suffered from age-related macular degeneration (mean age = 77.1 years, SD = 9.21). Four patients (50%) were male. D uration of disease varied from three weeks to many years.
The best visual acuity recorded was near normal (0.04 logMAR (20/22)) whilst the worst was 1.30 logM AR
(20/400). There was no clear relationship between VA and either age or duration of disease.
3.2. Global BCEA
Global BCEAs calculated for all subjects varied from 1150 minarc2 to 21100 m inarc2. No relationship was found between global BCEA and visual acuity (r2 = 0.19, p > 0.28) or age (r2 = 0.04, p > 0.6). However a highly significant difference was found in BCEA between those with recent vision loss (<4 months) and those with long standing m acular disease (t = 2.45, p < 0.001; Fig. 3).
3.3. Number o f PRLs
The K D E was applied to all data. In three cases (TB, AP, HP) the contour plot produced by the KDE program indicated one discrete locus of fixation. However in the remaining 5 patients, the KDE indicated the presence of two or three different fixation loci. Fig. 4 shows the kernel plots produced for each data set.
A local BCEA was calculated for each component. In each instance the sum of these local BCEAs was less than the global BCEA, being on average 58% of the size of the larger, global BCEA. Results from the EM algorithm for the 5 patients with multiple PRLs are shown in Table 2.
Visual acuity was moderately correlated with the num ber of PRLs (;* = 0.44). The correlation between acuity and sum of the local BCEAs was somewhat stronger, however neither correlation was statistically significant (p > 0.05). Due to the small sample size, a random ization test was also used to test whether visual acuity was related to the num ber of PRLs or sum of local BCEAs. These correlations was not statistically significant (Num ber o f PRLs, p = 0.28, 1000 random izations; Sum of local BCEAs, p = 0.10, 1000 random izations).
25000
w 20000H aeo 15000-
gj 10000-
5000-
< 4 months Long-standing
Duration of disease
Fig. 3. The relationship between duration o f disease and global BCEA. D iam on ds represent 95% confidence intervals.

M .D . Crosslcind e t a l I Vision Research 44 (2 0 0 4 ) 1537-1546 1541
RS 50
25
O'
-25
-40 -20 0 20 40
AP
s€ 0-
X decentration (min arc)
X decentration (min arc)
X decentration (min arc)
L’ 20 -
Xdecentration (mm arc)
$ -20 -
KD10'
0-
-10
-20
-20 0 20
X decentration (min arc)
X decentration (min arc)
30
20100
■10
■20-60 -40 0X decentration (min arc)
40
200
-20-40
-20 0 20-40
X decentra ticn (min arc)
100
-10
-20-20 0 20
X decentration (min are)
-20 -15 -10 -5 0 5
X d ecen tra tion (min arc)
•n- 10 * _____re
I 5 '
| o ■■E
1 -S'>-
-10
-10 -5 0 5X decentration (min arc) X d ecen tra tion (min a rc )
X decentration (min arc)X decentration (min arc)
Fig. 4. Kernel plots for all o f the subjects (except D P, w hose p lots can be found in Fig. 2).

1542 M .D. C rossland e t al. I Vision Research 44 (2 0 0 4 ) 1537-1546
Table 1Full data for all eight patients
Initials/age D iagnosis T im e since vision loss
V A /logM A R G lobal BC EA (m inarc2)
n PRL Y local BCEAs (m inarc2)
RS/60 A M D 3 weeks 0.74 15 900 2 7950K B/76 A M D < 4 weeks 0.22 21 100 2 2340FG /90 A M D < 4 weeks 0.56 14500 3 9270D P/76 A M D /M T S 12 weeks 1.30 2 1700 3 9240TB/80 A M D > 2 years 0.62 1770 1 1770A P/44 Stargardt >2 years 0.12 1150 1 1150K D /75 A M D >2 years 0.04 7220 2 3260HP/83 A M D >2 years 0.60 2160 1 2160
A M D = age-related macular degeneration, M TS = m acular translocation surgery.
Table 2Parameters o f the PRLs for each patient with multiple PRLs
Initials PRL # P BCEA(m inarc2)
RS 1 0.78 52602 0.22 2690
KB 1 0.50 9662 0.47 1370
FG 1 0.64 22202 0.20 39503 0.16 3100
D P 1 0.36 24002 0.31 25003 0.22 4340
K D 1 0.63 22502 0.37 1010
P = proportion o f trial for which PRL is being used.
Patients were divided into two groups (recent vision loss (less than 4 months) and long standing vision loss) and ANOVA was performed. The number of PRLs used was significantly associated to the duration of disease (t = 2.45, p < 0.05).
A summary of all the results can be found in Table 1.
3.4. Repeatability o f the statistical techniques
For six patients, we repeated the analysis on another fixation trial (using the same target and conditions). We were unable to repeat analysis for patients DP and AP as we had only collected one set of fixation data at the visit.
Table 3 illustrates the repeatability of the technique for the two trials for these five subjects. If the test is used to determine between a single PRL or multiple PRLs then perfect agreement is found between the two conditions. In one case there are a different number of PRLs elicited: for patient FG there are three PRLs in the first trial and only two in the second.
The sum of local BCEAs is well correlated between the two trials (mean decentration 23% ± 7%; Spearm an’s rho, rs = 0.89, p < 0.05).
Table 3C om parisons in the num ber o f PRLs and the sum o f local BCEAs found for tw o different trials and applications o f the statistical procedure
Subject N um ber o f PR Ls Y local BC EA s (m inarc2)
Trial 1 Trial 2 Trial 1 Trial 2
RS 2 2 7950 9759KB 2 2 2340 3259FG 3 2 9270 7267TB 1 1 1770 1556K D 2 2 3260 2873HP 1 1 2160 1736
4. Discussion
We have applied novel statistical techniques to analyse fixation characteristics o f subjects with macular disease.
Our results indicate that patients with newly presenting macular disease are more likely to display multiple PRLs, as defined by our statistical paradigm. Analysis of such patients’ fixation data using a global BCEA would be inappropriate as the statistical assumption of unimodality would no longer be valid.
It is perhaps surprising that some of our patients display two or even three loci over a relatively short fixation trial. Earlier control experiments did not find an increase in the num ber of PRLs or BCEA magnitude in longer fixation trials of 30 s (Bellmann, Feely, Crossland, K abanarou, & Rubin, 2003).
Some patients (KB, DP) appear to split their fixation evenly across their multiple PRLs whereas others (RS, KD) rely on one location for the bulk of the trial. Other authors have found multiple PRLs only during a complex task such as reading (Duret et al., 1999) or when luminance is changed (Lei & Schuchard, 1997). It could be that our statistical technique is more sensitive in detecting multiple loci than the methods used by other groups. Our findings agree with those of W hittaker, who reports that 39% of patients exhibit multiple PRLs (W hittaker et al., 1988). Our technique is repeatable in finding the number of PRLs and the sum of the local BCEAs.

M .D . Crossland e t al. / Vision Research 44 (2 0 0 4 ) 1537-1546 1543
4.1. Equipment considerations
Infra-red eyetrackers have not been widely used in the assessment of fixation stability; in general the scanning laser ophthalmoscope (SLO) has been the instrument of choice. A lthough the SLO allows visualisation of the retina, stimuli are limited to m onochromatic, monocular images presented at a fixed viewing distance. We have previously shown fixation stability measurements with these two instruments to be linearly related, with larger BCEAs being recorded by the eyetracker, which we believe to be due to its free-head nature (Crossland & Rubin, 2002). Van der Geest and co-workers found the same eyetracker to be comparable to a scleral search coil technique in the measurement of fixation position (van der Geest & Frens, 2002). The scleral coil technique was used by W hittaker in their study of multiple PRLs (W hittaker et al., 1988).
4.2. Limitations o f the statistical technique
Because the EM algorithm is an iterative procedure, it is im portant to be aware of local maxima problems. These can cause the loci described by the EM algorithm to correspond poorly to the kernel plots. The statistical procedures we have used are quantitative, but not entirely automatic. When running the EM algorithm it was found to be im portant to compare the results it produced with the contour plot created by the K D E and to repeat the EM process with different starting values for the number of loci until the likelihood is maximised.
Calculation o f a BCEA assumes that fixation points are normally distributed. Steinman (1965) found that
small departures from normality occurred when examining the fixation behaviour of normally-sighted observers and concluded that “by and large, the area of a bivariate normal ellipse seems to be a good approxim ation when used to measure the variability of the fixating eye about its mean position.” It is generally accepted that the BCEA provides a useful summary of normal fixation data. However, multimodality is a more critical departure from the assumptions o f a global BCEA than is non-normality. If the fixation data for patients are truly multimodal, as our analyses suggest, then the local BCEA will provide a better approxim ation than a global BCEA.
The selection of the window width is critical in determining the num ber o f PRLs present. By changing the window width, data can be over- or undersmoothed. The window width which we use has been described as optimal for a range of distributions by Bowman and Foster (1992, 1993a, 1993b) and has been adopted by several com puter based statistics packages, such as M atlab (M athW orks, Natick, MA). Fig. 5 compares a dataset which is smoothed by our optimal window width and by larger values. It can be seen that by m anipulating the window width, more or fewer PRLs are determined. Further research is required to confirm the selection of window width which we are using is ideal. The window width has no effect on the EM algorithm. As different starting values were input into the EM algorithm and the most likely fit was taken, the final result will not be biased by the selection of window width.
A lthough we have shown that the position of gaze can fall within multiple loci in our patients, we do not
| 2 0 -
1 • j ? \
t ? 40 ' (0§ 20 ■
1 o -E
1 - 2 0 -TJ>-
■fit ■ »
v k
s 0 ■to
£ -20 ■ OT3> -40 '
Sl >-40 -
i ' i...... r i i i .........-60 -40 -20 0 20 40 60 80 - 60 -40 -20 0 2 0 4 0 6 0 8 0
(a) X decentration (min arc) (b ) X d e c e n tra tio n (min a rc )
X decentration (min arc)X decentration (min arc)
Fig. 5. The effect o f changing the w indow width on the K DE: (a) raw data, (b) w indow width set to “ ideal” w idth, (c) w indow width set to 0.75 times the “ ideal” width, (d) w indow width set to 1.5 tim es the “ ideal” width.

1544 M.D. Crossland et al. I Vision Research 44 (2004) 1537-1546
know that the patient can see the target at all times. Indeed it may be that when two gaze positions are found using this technique one corresponds to the non-seeing foveal centre and the other to a healthy retinal area.
It is also possible that our technique is finding individual clusters of localized drift areas within one large PRL rather than true multiple loci. However, as the separation between our PRLs is of the order of 20^40' (whereas typical drift amplitudes are around 2-5', Carpenter, 1988) and our technique is repeatable with regard to the number of clusters present, we believe that the KDE is determining truly different PRLs.
4.3. Duration of disease
Although we do not have enough data to state unequivocally that the number of PRLs diminishes with time, it appears that patients with long-standing macular disease display fewer PRLs than those with newly presenting disease. This is of great interest to those working in vision rehabilitation for patients with macular disease. It is tempting to hypothesise that, over time, patients will progress from having many PRLs to having just one, or that the multiple PRLs will coalesce into one larger locus of fixation.
If fixation characteristics do indeed change with time then this may explain the difficulty in correlating visual acuity with the properties of the PRL; if these patients were all at the same stage in their rehabilitation then perhaps a stronger correlation would exist. A prospective, longitudinal study is indicated to further investigate the development of fixation with time.
5. Conclusions
supported by European Commission grant QLRT-2001- 00214. This paper has been presented, in part, at the 2002 Annual meeting of the Association for Research in Vision and Ophthalmology, Fort Lauderdale, FL, 5-10 May 2002.
Appendix A. The kernel density estimator
The use of a kernel density estimator in multivariate data is explained in detail elsewhere (Silverman, 1986). Briefly, if a sample of horizontal and vertical observa
tions ^ , . . . , ^ collected with joint probability
density function f(x ,y) then the kernel density estimator for bivariate data is:
(A.1)where K(x,y) is the kernel function, such that:
K(x,y) cbcdy = 1/ ,and hx, hy are window widths or smoothing parameters.
We used the following kernel function (Silverman, 1986): K(x,y) = ± exp(-i(x2-fy2)).
Bowman and Foster suggested the following optimal window widths (Bowman & Foster, 1992):
K = dxn~]/6 hy = c y r 1/6
where n is the number of observations and ax, ay are estimated standard deviations of x and y.
Our techniques introduce some objectivity into the assessment of fixation patterns and use less arbitrary guidelines for multimodality than previous techniques. In some circumstances it is not necessary to use such elaborate statistical tests as those described here, but in other cases it is difficult to group fixation points into neat clusters. For ambiguous data sets the quantitative technique we have described is useful to determine whether patients with macular disease use one or many PRLs. We have shown that our technique is repeatable within a subject.
With further development, we expect the kernel density estimator and expectation, maximisation algorithms to become of great benefit for researchers interested in visual behaviour in macular disease.
Acknowledgements
MDC is supported by Guide Dogs for the Blind Association ophthalmic research grant 2000-29a. GSR is
Appendix B. The EM algorithm
The EM algorithm is a method of calculating maximum likelihood estimates. Let yt denote the (x,y) coordinates for the ith observation. The observed data y i , . . . ,y n can be regarded as incomplete since the components to which they belong are unknown. If ztJ = 1, yt has a probability density function fj(y\py, I f , where fj{y\ptp I f is a bivariate normal density function with mean p f2 x 1) and covariance matrix I f 2 x 2). Let Zj = (zn,zi2, ... ,zik)T denote a multinomial vector indicating which component yt is from. That is, exactly one of z^ ,. . . , zik equals 1 and the others equal 0. Theprobability that Zy = 1 equals iij (where + n2 H----+nk = 1) so 7tj represents the proportion of time that the jth PRL is occupied. A complete data sample is there
fore [ Zl ) , . . . , ( Zn ). It is assumed that all n obser-V-Vi/ \y„Jvations are independent and have been fully categorised. The complete data log likelihood is:

M.D. Crossland et al. / Vision Research 44 (2004) 1537-1546 1545
n k
£c(o) = t p £ j) ) (B.l)/= 1 J = 1
where 6 denotes the full set of parameters iij, Hj, forj= 1,2,..., A:.
The EM algorithm treats z\, •.., z„ as missing data. It is an iterative procedure consisting of two steps, E (Expectation) and M (Maximisation).
B.l. The E-step
The E-step calculates the expectation of the complete data log likelihood with respect to the missing data given the observed data y and current parameter values 9. The log likelihood is linear in the Ztj so the E step simply replaces Zij by their expected values given y and 9. Thus:
w m njfjiyiWpZj)*0 = E{ZiJ\yt\ 9) = —k -------— ,£y=i Xjfjiyr, Up Ij)
(B.2)
iiij is the posterior probability that an individual with observed value yt belongs to component j (for given 9).
B.2. The M-step
The M-step maximises £c{9) with zy having been replaced by %ij. The parameters that maximise lc(9) can be written down explicitly:
1 n71J ~ ~ j = 1,... ,k
i=i(B.3)
(B-4)'J i = 1
xl = ~T 1L n‘J<yi - J1/) j = 1, • • •, k (B.5)nKJ t= 1These give updated estimates of the parameters 9 in the iterative procedure. Eq. (B.3) estimates the mixing proportion iij, as the average of the posterior probabilities %ij of all n observations for component j. Eqs. (B.4) and (B.5) calculate the weighted average of the n observations and the weighted sample covariance matrix respectively, both using weights of ny.
Before applying the EM algorithm, initial values for the parameters 0^ are assigned. The E and M steps are then repeated until some stopping criterion is met. The stopping criterion is based on the relative change in the log likelihood £(0(M)) - £{6{k)) and (BCEA)<*+1)- (BCEA)^ at each iteration (k = 1,2,3,...). The program stops when the log likelihood is less than 10-4 and the BCEA is less than 10-3. The maximum number of iterations is set at 200. Throughout the E, M process
L(jfk+0) ^L (0 ^ ), where 9^ are the parameter values after k iterations.
References
Bellmann, C., Feely, M., Crossland, M. D., Kabanarou, S. A., & Rubin, G. S. (2003). Fixation stability using central and pericentral fixation targets in patients with age-related macular degeneration. In III International symposium of the German Ophthalmological Society (p. 24). Baden-Baden, Germany.
Bowman, A., & Foster, P. (1992). Density based exploration of bivariate data. In Technical report No. 92-1. Glasgow: Department of Statistics, University of Glasgow.
Bowman, A., & Foster, P. (1993a). Density based estimation of bivariate data. Statistics and computing, 3, 171-177.
Bowman, A., & Foster, P. J. (1993b). Adaptive smoothing and density- based tests of multivariate normality. Journal of the American Statistical Association, 88, 529-537.
Carpenter, R. (1988). Movements of the eyes. London: Pion.Crossland, M. D., & Rubin, G. S. (2002). The use of an infrared
eyetracker to measure fixation stability. Optometry and Vision Science, 79, 735-739.
Culham, L., Fitzke, F. W., Timberlake, G. T., & Marshall, J. (1993). Assessment of fixation stability in normal subjects and patients using a scanning laser ophthalmoscope. Clinical Vision Sciences, 8, 551-561.
Duret, F., Issenhuth, M., & Safran, A. (1999). Combined use of several preferred retinal loci in patients with macular disorders when reading single words. Vision Research, 39, 873-879.
Fletcher, D. C., & Schuchard, R. A. (1997). Preferred retinal loci relationship to macular scotomas in a low-vision population. Ophthalmology, 104, 632-638.
Fletcher, D. C., Schuchard, R. A., & Watson, G. (1999). Relative locations of macular scotomas near the PRL: effect on low vision reading. Journal of Rehabilitation Research and Development, 36, 356-364.
Kosnik, W., Fikre, J., & Sekuler, R. (1986). Visual fixation stability in older adults. Investigative Ophthalmology and Visual Science, 27, 1720-1725.
Lei, H., & Schuchard, R. A. (1997). Using two preferred retinal loci for different fighting conditions in patients with central scotomas. Investigative Ophthalmology and Visual Science, 38, 1812-1818.
McLaughlan, G. J., & Peel, D. (2000). Finite mixture models. New York: Wiley.
Nachmias, J. (1959). Two-dimensional motion of the retinal image during monocular fixation. Journal of the Optical Society of America, 49, 901-908.
Schuchard, R. A. (1993). Validity and interpretation of Amsler grid reports. Archives of Ophthalmology, 111, 776-780.
Schuchard, R. A. (1995). Adaptation to macular scotomas in persons with low vision. American Journal of Occupational Therapy, 49, 870-876.
Schuchard, R. A., & Fletcher, D. C. (1994). Preferred retinal locus: a review with applications in low vision rehabilitation. Ophthalmology Clinics of North America, 7, 243-256.
Schuchard, R. A., Naseer, S., & de Castro, K. (1999). Characteristics of AMD patients with low vision receiving visual rehabilitation. Journal of Rehabilitation Research and Development, 36, 294-302.
Schuchard, R. A., & Raasch, T. W. (1992). Retinal locus for fixation: Pericentral fixation targets. Clinical Vision Sciences, 7, 511-520.
Silverman, B. W. (1986). Density estimation for statistics and data analysis. London: Chapman and Hall.
Steinman, R. M. (1965). Effect of target size, luminance, and color on monocular fixation. Journal of the Optical Society of America, 55, 1158-1165.

1546 M .D. C rossland e t al. / Vision Research 44 (2 0 0 4 ) 1537-1546
Steinm an, R. M ., Cushm an, W. B., & M artins, A. J. (1982). The precision o f gaze. A review. Human N eurobiology, 1, 97-109.
Titterington, D . M ., Sm ith, A. F. M ., & M akov, U . E. (1985).S ta tis tica l analysis o f fin ite m ixture distributions. N ew York: W iley,
van der G eest, J. N ., & Frens, M. A. (2002). R ecording eye m ovem ents with v ideo-oculography and scleral search coils: a direct com parison o f two m ethods. Journal o f Neuroscience M ethods, 114, 185-195.
von N oorden , G. K ., & M ackensen, G . (1962). Phenom enology o f eccentric fixation. American Journal o f Ophthalm ology, 53, 642-661 .
W hite, J. M ., & Bedell, H. E. (1990). The ocu lom otor reference in hum ans with bilateral m acular disease. Investigative O phthalm ology and Visual Science, 31, 1149-1161.
W hittaker, S. G ., Budd, J., & Cum m ings, R. W. (1988). Eccentric fixation with m acular scotom a. Investigative Ophthalm ology and Visual Science, 29, 268-278 .
W hittaker, S. G ., C um m ings, R. W ., & Sw ieson, L. R. (1991). Saccade control w ithout a fovea. Vision Research, 31, 22 0 9 - 2218.

Ophthal. Physiol. Opt. 2004 24: 327-333
Fixation stability and reading speed in patients with newly developed m acular disease*Michael D. Crossland, Louise E. Culham and Gary S. RubinDivision of Vision Rehabilitation Research, Institute of Ophthalmology, University College London, 11-43 Bath Street, London ECIV 9EL, and Department of Optometry, Moorfields Eye Hospital NHS Trust, London, UK
AbstractBackground: Patients with macular disease and central scotomas must use a peripheral, preferred retinal locus (PRL) in place of their damaged fovea. This paper investigates the development of the PRL, with particular reference to the stability of fixation.Methods: Twenty-five patients with age-related and juvenile macular disease were recruited. All patients had developed a scotoma in their better eye within the previous 2 weeks. Patients were assessed using a scanning laser ophthalmoscope and an infra-red gazetracker on four further occasions over the next 12 months.Results: A linear relationship exists between reading speed and fixation stability for patients and control subjects. Fixation stability was not related to scotoma size, visual acuity or contrast sensitivity. Changes in fixation stability account for 54% of the variance in change in reading speed over the course of this study.Conclusions: The deficit in reading speed in patients with macular disease can be partially attributed to impairments in fixation stability.
Keywords: low vision, macular disease, preferred retinal locus, reading
Introduction
The World Health Organisation estimates that 8 million people are severely visually impaired because of age- related macular disease (AMD) (World Health Organisation, 1997). AMD is the most common cause of blindness in the developed world and is the primary diagnosis of half of all patients registered as blind in the UK (Vingerling et al., 1995; Evans et al., 1996). The incidence of AMD appears to be increasing more
Received: 16 December 2003 Revised form : 6 April 2004 Accepted: 14 April 2004
*This paper was presented at the UK Multi-disciplinary Low Vision Rehabilitation and Research Conference held at Aston University, December 2003.
Correspondence and reprint request to: Michael D. Crossland.Tel.: 020 7608 6957; Fax: 020 7608 6983.Email address: [email protected]
rapidly than can be accounted for by the ageing of the population (Evans and Wormald, 1996). Juvenile macular diseases such as Stargardt’s and Best’s disease are less prevalent but are still a major cause of partial sight registration in the UK working age population (Evans et al., 1996).
Patients with bilateral scotomas due to macular disease must use peripheral retina in place of the damaged fovea. Many patients exhibit one discrete ‘preferred’ retinal locus (PRL) at a para- or extra-foveal location which they use for visual tasks (Timberlake et al., 1986; White and Bedell, 1990; Schuchard and Raasch, 1992; Guez et al., 1993).
Fixation stability
When the eye fixates upon a point, there is some retinal motion due to involuntary eye movements such as physiological nystagmus, drifts and microsaccades as well as correcting movements to compensate for motion of the head (Steinman et al., 1982; Carpenter, 1988). In
© 2004 The College of Optometrists 327

328 Ophthal. Physiol. Opt 2004 24: No. 4
those without eye disease, the locus of fixation will lie within the foveola. In patients with bilateral scotomas, fixation will lie within the PRL.
A bivariate contour ellipse has been shown to describe the locus of fixation in normal observers (Steinman, 1965). The area of this ellipse [bivariate contour ellipse area (BCEA)] gives an indication of fixation stability, with larger areas corresponding to poorer fixation stability. The BCEA of individuals without macular disease is around 80-1200 minarc2 (Steinman, 1965; Kosnik et al, 1986; Timberlake et al., 1986; Culham et al., 1993; Rohrschneider et al., 1995; Crossland and Rubin, 2002). With macular disease, they range from near-normal values to over 13 000 minarc2 (Culham et al., 1993; Schuchard and Fletcher, 1994; Rohrschneider et al., 1995).
Fletcher and colleagues devised a ‘PRL scoring’ system based on fixation stability, pursuit ability and ‘saccade to PRL’ ability (Fletcher et al., 1993; Schuchard and Fletcher, 1994). They found that this score was superior to visual acuity in predicting reading speed and accuracy in patients with central scotomas. Rohrschneider et al. (1995) found that ‘functional impairment’ was associated with decreased fixation stability. Rohrschneider’s group determined fixation stability as being poor only when the standard deviation from the mean fixation point was > 3°, which is roughly equivalent to a BCEA of 100 000 minarc2. This indicates exceptionally poor fixation stability.
Multiple PRLs
Initially it was assumed that most patients develop one, well-defined PRL (Cummings et al, 1985; Timberlake et al., 1986, 1987). However, more recent work has suggested that patients may use multiple PRLs1 during one task (Guez et al., 1993; Lei and Schuchard, 1997; Duret et al., 1999). It has been suggested that patients with scotomas larger than 20° are more likely to develop several PRLs than those with smaller lesions (Whittaker et al., 1988).
There are marked methodological problems with assessing whether patients display multiple PRLs. Although in some circumstances it is obvious that a patient has multiple PRLs (for instance when one horizontally shifted and one vertically shifted PRL is used), at other times it is difficult to determine whether a patient truly has multiple loci or whether fixation remains within one, poorly defined PRL. In collaboration with statisticians at University College London, we have developed a test for multimodality which can
'Although the plural of locus is loci and the correct abbreviation would be ‘PRL,’ ‘PRLs’ has been used throughout this paper for clarity.
identify the number of PRLs present during a fixation trial and the fixation stability within each of these loci (Crossland et al., 2004).
The development o f the preferred retinal locus (or loci)
Based on a cross-sectional study of patients with macular disease, White and Bedell suggested that ‘patients with longer duration since onset of [macular disease] showed oculomotor behaviours qualitatively more like those of normals’(White and Bedell, 1990).
In order to fully assess the development of viewing strategies in macular disease, a longitudinal study design is required. The study described in this paper is the first such analysis of visual behaviour in macular disease. This paper reports the development of the PRL and fixation stability in a cohort of subjects for up to 12 months following the development of a scotoma in the second eye to be affected by macular disease.
Methods
Patients
Twenty patients with age-related macular disease (AMD) and five with juvenile macular disease (JMD) were recruited from the medical retina and low vision clinics at Moorfields Eye Hospital. All patients had developed symptoms in the previous 2 weeks in their second affected eye and had a central scotoma observable on scanning laser ophthalmoscopy. Patients had a primary diagnosis of AMD, Stargardt’s disease or Best’s disease and had no ocular comorbidity other than visually insignificant cataract. Eight control subjects were recruited, in two groups: five were age matched to the AMD patients and three to the JMD group. Control subjects had normal or corrected to normal vision and no evidence of ophthalmological disease on fundoscopy (and other tests as indicated).
All patients and subjects spoke English as their first language and none had any neurological impairment. Participants gave their informed consent and the study conformed to the tenets of the Declaration of Helsinki. The study was approved by the Moorfields Eye Hospital ethics committee.
Visit schedule
Patients were assessed within 2 weeks of recruitment (that is, within 1 month of the onset of symptoms). Subsequent visits took place 1, 3, 6 and 12 months after the baseline assessment. Patients still attended their normal medical retina outpatient clinic appointments. Appropriate low vision aids (LVAs) were prescribed for all patients by the investigator at the baseline assessment
© 2004 The College of Optometrists
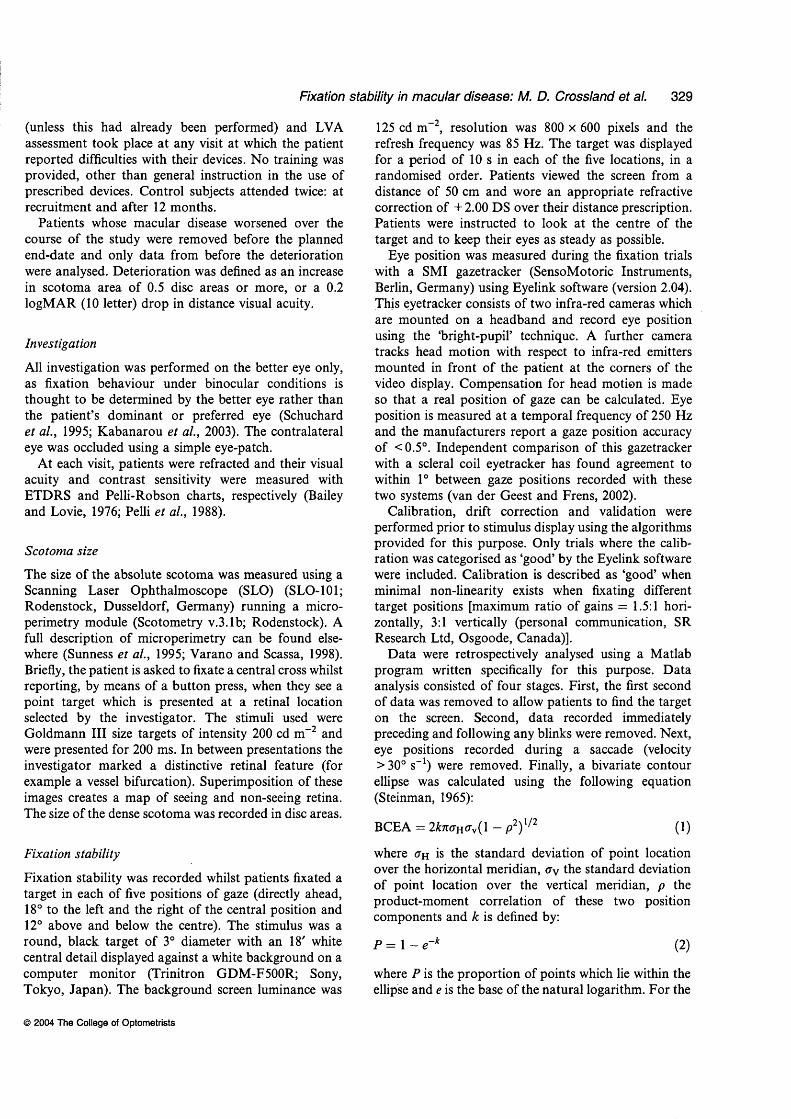
Fixation stability in macular disease: M. D. Crossiand et al. 329
(unless this had already been performed) and LVA assessment took place at any visit at which the patient reported difficulties with their devices. No training was provided, other than general instruction in the use of prescribed devices. Control subjects attended twice: at recruitment and after 12 months.
Patients whose macular disease worsened over the course of the study were removed before the planned end-date and only data from before the deterioration were analysed. Deterioration was defined as an increase in scotoma area of 0.5 disc areas or more, or a 0.2 logMAR (10 letter) drop in distance visual acuity.
Investigation
All investigation was performed on the better eye only, as fixation behaviour under binocular conditions is thought to be determined by the better eye rather than the patient’s dominant or preferred eye (Schuchard et al., 1995; Kabanarou et al, 2003). The contralateral eye was occluded using a simple eye-patch.
At each visit, patients were refracted and their visual acuity and contrast sensitivity were measured with ETDRS and Pelli-Robson charts, respectively (Bailey and Lovie, 1976; Pelli et al., 1988).
Scotoma size
The size of the absolute scotoma was measured using a Scanning Laser Ophthalmoscope (SLO) (SLO-101; Rodenstock, Dusseldorf, Germany) running a microperimetry module (Scotometry v.3.1b; Rodenstock). A full description of microperimetry can be found elsewhere (Sunness et al., 1995; Varano and Scassa, 1998). Briefly, the patient is asked to fixate a central cross whilst reporting, by means of a button press, when they see a point target which is presented at a retinal location selected by the investigator. The stimuli used were Goldmann III size targets of intensity 200 cd m-2 and were presented for 200 ms. In between presentations the investigator marked a distinctive retinal feature (for example a vessel bifurcation). Superimposition of these images creates a map of seeing and non-seeing retina. The size of the dense scotoma was recorded in disc areas.
Fixation stability
Fixation stability was recorded whilst patients fixated a target in each of five positions of gaze (directly ahead, 18° to the left and the right of the central position and 12° above and below the centre). The stimulus was a round, black target of 3° diameter with an 18' white central detail displayed against a white background on a computer monitor (Trinitron GDM-F500R; Sony, Tokyo, Japan). The background screen luminance was
125 cd m-2, resolution was 800 x 600 pixels and the refresh frequency was 85 Hz. The target was displayed for a period of 10 s in each of the five locations, in a randomised order. Patients viewed the screen from a distance of 50 cm and wore an appropriate refractive correction of + 2.00 DS over their distance prescription. Patients were instructed to look at the centre of the target and to keep their eyes as steady as possible.
Eye position was measured during the fixation trials with a SMI gazetracker (SensoMotoric Instruments, Berlin, Germany) using Eyelink software (version 2.04). This eyetracker consists of two infra-red cameras which are mounted on a headband and record eye position using the ‘bright-pupil’ technique. A further camera tracks head motion with respect to infra-red emitters mounted in front of the patient at the corners of the video display. Compensation for head motion is made so that a real position of gaze can be calculated. Eye position is measured at a temporal frequency of 250 Hz and the manufacturers report a gaze position accuracy of <0.5°. Independent comparison of this gazetracker with a scleral coil eyetracker has found agreement to within 1° between gaze positions recorded with these two systems (van der Geest and Frens, 2002).
Calibration, drift correction and validation were performed prior to stimulus display using the algorithms provided for this purpose. Only trials where the calibration was categorised as ‘good’ by the Eyelink software were included. Calibration is described as ‘good’ when minimal non-linearity exists when fixating different target positions [maximum ratio of gains = 1.5:1 horizontally, 3:1 vertically (personal communication, SR Research Ltd, Osgoode, Canada)].
Data were retrospectively analysed using a Matlab program written specifically for this purpose. Data analysis consisted of four stages. First, the first second of data was removed to allow patients to find the target on the screen. Second, data recorded immediately preceding and following any blinks were removed. Next, eye positions recorded during a saccade (velocity >30° s-1) were removed. Finally, a bivariate contour ellipse was calculated using the following equation (Steinman, 1965):
BCEA = 2&7i<rH<rv(l - p2)1/2 (1)
where o-H is the standard deviation of point location over the horizontal meridian, <rv the standard deviation of point location over the vertical meridian, p the product-moment correlation of these two position components and k is defined by:
P = l - e ~ k (2)
where P is the proportion of points which lie within the ellipse and e is the base of the natural logarithm. For the
© 2004 The College of Optometrists

330 Ophthal. Physiol. Opt. 2004 24: No. 4
purposes of this study, fixation stability was calculated with P = 0.68 (k =1.14) to remain consistent with previous research performed in this laboratory.
The BCEA was converted from pixels2 to minarc2 using a simple transformation. Mean BCEA for the five positions of gaze was recorded.
Multiple PRLs
The presence of multiple PRLs was assessed using the kernel density estimator (KDE). The KDE was applied using software written in S-PLUS (v4.5, MathSoft Inc., Cambridge, MA, USA). The window width was set at the optimum level described by Bowman and Foster(1992) and a contour plot of the density estimates was produced using a 50 x 50 grid.
Where multiple PRLs were identified, a mixture of component bivariate normal distributions was fitted to the data using the expectation, maximisation (EM) algorithm. The number of discrete peaks seen on the contour plot produced by the KDE was used as the number of components. The EM algorithm calculates a ‘local’ BCEA for each locus (using equation 1) and an estimate of the proportion of data which fell into each locus. A more thorough description of these statistical techniques can be found elsewhere (Crossland et al., 2004). Where multiple PRLs were identified, the sum of the local BCEAs was used for analysis.
Reading speed
Reading speed was recorded using text presented at three times threshold visual acuity size on a computer monitor set 50 cm in front of the patient. This print size was selected since the minimum acuity reserve reported for ‘high fluency’ reading in macular disease patients is 3:1 (Whittaker and Lovie-Kitchin, 1991; Lovie-Kitchin et al., 2000; Massof, 2003). Ten sentences were randomly selected from a database of over 500 sentences and had similar properties to those used on the MNRead card (Legge et al., 1989) in terms of difficulty, length and word order. The sentences had a Flesch-Kincaid Grade level of 4.6. Sentences were displayed in Times New Roman font over two lines, without splitting words, in the centre of the screen. The left hand side of each line was justified. Participants wore an appropriate refractive correction for the screen distance of 50 cm.
Subjects were asked to read the sentences out loud as quickly as they could without making errors. Timing commenced at the moment the sentence appeared. A keystroke made by the investigator when the last word was read correctly stopped a timer in the computer. The mean time taken to read a sentence was recorded. If the sentence was read incorrectly then it was
excluded from the analysis, unless the patient corrected their error.
Results
Length of follow-up
Eighteen patients completed 12 months of follow-up and seven were removed earlier due to their scotoma size increasing: six after 6 months and one after 3 months. All control subjects were assessed at baseline and after 1 year.
Fixation stability
As BCEA values for patients were not normally distributed (Shapiro-Wilk test, W = 0.85, p > 0.5), a natural log transform was performed to normalise them (W = 0.98, p < 0.01).
The mean BCEA for control subjects was 1614 minarc2 at baseline (S.D. = 1022) and 1270 minarc2 (S.D. = 574) at 12 months. There was no statistical difference between these values (repeated measures ANOVA, p = 0.40).
For patients, mean InBCEA at baseline was 9.04 log units (S.D. = 1.16), and 9.00 log units at the exit from the study (S.D. = 1.44). These log values correspond to 8440 and 8100 minarc2, respectively. These values are far poorer than those for control subjects (Student’s t-test, p < 0.001 at entrance and exit).
In patients, the size of the BCEA was not associated with visual acuity (at baseline, r = 0.38,/? = 0.1; at exit, r = 0.36, p = 0.1), contrast sensitivity (baseline r = -0.09, p = 0.62; exit r = -0.10, p = 0.74) or scotoma size (baseline r = 0.13, p = 0.54; exit r = 0.20, p = 0.38).
The number o f PRLs
At the baseline assessment, 16 patients (64%) displayed multiple PRLs for targets presented in at least one of the five locations. Within these 16 patients, the mean number of PRLs used for the five screen positions was 1.7 (range 1.2-3.8). Although patients with multiple PRLs tend to have poorer fixation stability than those who use only one locus of fixation this result does not reach significance (p = 0.08). By the exit point of the study, 11 patients (44%) displayed multiple PRLs.
Reading speed
At baseline, mean reading speed for patients was 85 words min-1 (S.D. = 37). By the exit point of the study, mean reading speed had fallen to 73 words min-1 (S.D. = 38). Control subjects’ reading speed remained
© 2004 The College of Optometrists

Fixation stability in macular disease: M. D. Crossland et al. 331
250-1
- * — Patients-a - Control subjectscP
200 -
2 150-
m 1 0 0 -
50-
6 7 8 9 10 1211
Fixation stability (In BCEA)
Figure 1. T h e r e l a t i o n s h ip b e t w e e n f ix a tio n s ta b i l i ty a n d r e a d in g
s p e e d a t t h e b a s e l i n e a s s e s s m e n t fo r p a t i e n t s (filled t r i a n g le s , s o lid
lin e ) a n d c o n tro l s u b j e c t s ( o p e n s q u a r e s , b r o k e n lin e ) . L in e s h o w s
l in e a r r e g r e s s io n ; p a t i e n t s : i2 = 0 .2 1 ; c o n t r o l s : r2 = 0 .4 4 .
constant th roughout the study (mean ± S.D. reading speed at baseline 187 ± 28 words m in-1; at 12 m onths 192 ± 22 words m in-1; p — 0.68).
Fixation stability and reading speed
For control subjects, a negative correlation was found between BCEA and reading speed at baseline assessment (r = -0 .66 , p < 0.05). This indicates that control subjects with poorer fixation stability read more slowly than those with smaller BCEAs. A similar relationship was found in patients at the baseline assessment (linear regression, r = -0 .45 , p < 0.05) and at the exit point (r = -0 .51 , p < 0.05). Figure 1 shows the relationship between fixation stability and reading speed for patients and control subjects at their baseline assessment.
Im provem ent in fixation stability was defined by subtracting ln(BCEA exjt) from ln(BCEA baseiine) (i.e. calculating the ratio o f fixation stability at exit to that at baseline, with positive values corresponding to an im provem ent in fixation stability). The im provem ent in fixation stability accounts for 54% of the variance in reading speed (linear regression, see Figure 2).
Discussion
Fixation stability is significantly im paired in patients with m acular disease. This reinforces the findings o f previous research (Culham et al., 1993; Schuchard and Fletcher, 1994; R ohrschneider et al., 1995). The level of this im pairm ent in stability does not appear to be associated with clinical features such as visual acuity, contrast sensitivity or scotom a size in our patients.
"o .EQ) -O CD CO CL (D V)c»
— $ 0.5 -
-4 -3 -2 •1 0 21
Improvement in fixation stability [ In BCEA (baseline) - In BCEA (exit) ]
Figure 2. I m p r o v e m e n t in r e a d i n g s p e e d c o m p a r e d w ith im p r o v e
m e n t in f ix a t io n s ta b i l i ty f o r e a c h p a t ie n t . L in e s h o w s l in e a r
r e g r e s s io n , r2 = 0 .5 4 .
It is perhaps surprising that there is no relationship between scotom a size and fixation stability, as fixation is known to be less precise as eccentricity increases (Sansbury et al., 1973), and a larger scotom a will lead to a more eccentric PR L being used. However, this lack o f correlation has been reported previously (Timberlake et al., 1986; W hite and Bedell, 1990).
It is im portant to note that only the size o f the dense scotom a has been m easured, and that the size o f any area o f relative scotom a is unknown. The apparently idiosyncratic nature o f the variation in fixation stability may be a ttribu tab le to the extent o f the relative scotoma.
In subjects w ithout m acular disease, fixation stability appears to be related to suprathreshold reading speed. A lthough the limited num ber o f control subjects assessed in this study preclude detailed analysis o f these data, our results co rroborate those for patients with reduced reading speed due to dyslexia, which suggest that fixation stability is a corollary o f reading speed (see e.g. Eden et al. 1994).
In the presence o f m acular disease there is a weaker relationship between reading ability and fixation stability, with around 20% o f the variance in reading speed being accounted for by fixation stability. A lthough there is no systematic change in fixation stability in patients, those small changes that do occur are related to changes in reading speed.
The BCEA values reported in the present study are larger than those found by researchers who have measured fixation stability using a SLO (Culham et al., 1993; Schuchard and Fletcher, 1994; Rohrschneider et al., 1995). We have previously shown that fixation stability measurem ents m ade with the infrared eyetracker are
© 2004 The College of Optometrists

332 Ophthal. Physiol. Opt 2004 24: No. 4
about 2.2 times larger than those made with the SLO and that there is a linear relationship between values obtained with these two instruments in control subjects (Crossland and Rubin, 2002) and in patients with central scotomas (Crossland et al., 2002). This difference in the size of the BCEA has been attributed to the free-head nature of the eyetracker; small eye movements are made to compensate for head motion when the head is unsupported (Steinman et al., 1982; Carpenter, 1988; Crossland and Rubin, 2002).
Unfortunately, far fewer patients with juvenile macular diseases were recruited than with AMD. Informal analysis of our data does not indicate any difference in fixation stability or reading speed between these two groups, although the low number of JMD patients recruited precludes any between groups analysis of these types of macular disease. JMD recruitment was limited by the far rarer incidence of these diseases and the different mode of onset of juvenile macular diseases.
This study is the first to have used the technique of calculating local BCEAs in the case of multiple PRLs. We have previously shown this technique to be repeat- able in determining both the number of PRLs present and the sum of the local BCEAs (Crossland et al., 2004).
These results have implications for the design and practice of training exercises used in the rehabilitation of patients with macular disease. Several research groups advocate the use of visual training in macular disease (Goodrich and Mehr, 1986; Nilsson et al., 1998, 2003). In some cases, reading speed improves dramatically with training; the most recent paper by Nilsson and colleagues reports an average increase in reading speed from 9 to 68 words min-1 (Nilsson et al., 2003). Although these investigators have not formally measured fixation stability in the manner performed in the present study, our results of this study suggest that an improvement in fixation stability may be at least partly responsible for the reported improvement in reading speed.
As changes in fixation stability only account for about half of the change in reading speed, other adaptive strategies are also likely to play a role in determining patients’ rehabilitation. These strategies are likely to include eye movement characteristics such as the number of saccades used to find the PRL and the nature of these saccades (White and Bedell, 1990; Whittaker and Cummings, 1990; McMahon et al., 1991, 1993; Whittaker et al., 1991; Fletcher et al., 1993).
Conclusion
Reading speed in control subjects and in patients with macular disease is associated with fixation stability. In patients, changes in fixation stability over the first 12 months after losing central vision account for 52% of the variance in reading speed change over the same
period. These findings have implications for the design and implementation of training programs for patients with central field loss and for clinicians involved in the counselling of patients with this debilitating disease.
Acknowledgements
The authors would like to thank Michelle Sims and Dr Rex Galbraith of the Department of Statistical Sciences, University College London for the design and programming of the test for multiple PRLs; Dr Elisabeth Fine of the Schepens Eye Research Institute, Harvard University for providing the MN-Read style sentences; and our departmental technicians, Glen Harding and Eugeniu Dinu for programming support. MDC is supported by Guide Dogs for the Blind Association Ophthalmic Research Grant 2000-29a. GSR is supported by European Community grant QLK6-CT-2002- 00214.
References
Bailey, I. L. and Lovie, J. E. (1976) New design principles for visual acuity letter charts. Am. J. Optom. Physiol. Opt. 53, 740-745.
Bowman, A. and Foster, P. (1992) Density based exploration of bivariate data. Technical report No. 92-1. Department of Statistics, University o f Glasgow, Glasgow.
Carpenter, R. (1988) M ovements o f the Eyes. Pion, London. Crossland, M. D., Culham, L. E., Kabanarou, S. A. and
Rubin, G. S. (2002) The use of an infra-red eyetracker in the assessment o f macular disease: a comparison with the scanning laser ophthalmoscope. 7th International Conference on Low Vision. Goteburg, Sweden, R4:13.
Crossland, M. D. and Rubin, G. S. (2002) The use of an infrared eyetracker to measure fixation stability. Optom. Vis. Sci. 79, 735-739.
Crossland, M. D., Sims, M., Galbraith, R. F. and Rubin, G. S. (2004) Evaluation of a new quantitative technique to assess the number and extent o f preferred retinal loci in macular disease. Vis. Res. 44, 1537-1546.
Culham, L., Fitzke, F. W., Timberlake, G. T. and Marshall, J.(1993) Assessment of fixation stability in normal subjects and patients using a scanning laser ophthalmoscope. Clin. Vis. Sci. 8, 551-561.
Cummings, R. W., W hittaker, S. G., Watson, G. R. and Budd, J. M. (1985) Scanning characters and reading with a central scotoma. Am. J. Optom. Physiol. Opt. 62, 833-843.
Duret, F., Issenhuth, M. and Safran, A. (1999) Combined use of several preferred retinal loci in patients with macular disorders when reading single words. Vis. Res. 39, 873-879.
Eden, G. F., Stein, J. F., Wood, H. M. and Wood, F. B. (1994) Differences in eye movements and reading problems in dyslexic and normal children. Vis. Res. 34, 1345-1358.
Evans, J. and Wormald, R. (1996) Is the incidence of registrable age-related macular degeneration rising?. Br. J. Ophthalmol. 80, 9-14.
© 2004 The College of Optometrists

Fixation stability in macular disease: M. D. Crossland et al. 333
Evans, J., Rooney, C., Ashwood, F., Dattani, N. and Wormald, R. P. (1996) Blindness and partial sight in England and Wales: April 1990-March 1991. Health Trends 28, 5-12.
Fletcher, D. C., Schuchard, R. A., Warren, M. L., Crane, W. G. and Lashkari, K. (1993) A scanning laser ophthalmoscope preferred retinal locus scoring system compared to reading speed and accuracy. Invest. Ophthalmol. Vis. Sci. (Suppl.) 34, 787.
van der Geest, J. N. and Frens, M. A. (2002) Recording eye movements with video-oculography and scleral search coils: a direct comparison of two methods. J. Neurosci. Methods 114, 185-195.
Goodrich, G. L. and Mehr, E. B. (1986) Eccentric viewing training and low vision aids: current practice and implications of peripheral retinal research. Am. J. Optom. Physiol. Opt. 63, 119-126.
Guez, J.-E., Le Gargasson, J.-F., Rigaudiere, F. and O’Regan, J. K. (1993) Is there a systematic location for the pseudofovea in patients with central scotoma?. Vis. Res. 33, 1271— 1279.
Kabanarou, S. A., Bellmann, C., Crossland, M. D., Culham, L. E. and Rubin, G. S. (2003) Non-foveal fixation and binocular viewing in AMD. Invest. Ophthalmol. Vis. Sci. E-abstract 2764.
Kosnik, W., Fikre, J. and Sekuler, R. (1986) Visual fixation stability in older adults. Invest. Ophthalmol. Vis. Sci. 27, 1720-1725.
Legge, G. E., Ross, J. A., Luebker, A. and LaMay, J. M. (1989) Psychophysics o f reading VIII: the Minnesota low- vision reading test. Optom. Vis. Sci. 66, 843-853.
Lei, H. and Schuchard, R. A. (1997) Using two preferred retinal loci for different lighting conditions in patients with central scotomas. Invest. Ophthalmol. Vis. Sci. 38, 1812-1818.
Lovie-Kitchin, J. E., Bowers, A. R. and Woods, R. L. (2000) Oral and silent reading performance with macular degeneration. Ophthalmic Physiol. Opt. 20, 360-370.
Massof, R. W. (2003) Relation of reading performance to visual acuity and perceived reading ability in low vision. Invest. Ophthalmol. Vis. Sci. 44, ARVO E-abstract 1284.
McMahon, T. T., Hansen, M. and Viana, M. (1991) Fixation characteristics in macular disease. Relationship between saccadic frequency, sequencing, and reading rate. Invest. Ophthalmol. Vis. Sci. 32, 567-574.
McMahon, T. T., Hansen, M., Stelmack, J., Oliver, P. and Viana, M. A. (1993) Saccadic eye movements as a measure of the effect of low vision rehabilitation on reading rate. Optom. Vis. Sci. 70, 506-510.
Nilsson, U. L., Frennesson, C. and Nilsson, S. E. G. (1998) Location and stability o f a newly established eccentric retinal locus suitable for reading, achieved through training of patients with a dense central scotoma. Optom. Vis. Sci. 75, 873-878.
Nilsson, U. L., Frennesson, C. and Nilsson, S. E. G. (2003) Patients with AM D and a large absolute central scotoma can be trained successfully to use eccentric viewing, as demonstrated in a scanning laser ophthalmoscope. Vis. Res. 43, 1777-1787.
Pelli, D. G., Robson, J. G. and Wilkins, A. J. (1988) The design of a new letter chart for measuring contrast sensitivity. Clin. Vis. Sci. 2, 187-199.
Rohrschneider, K., Becker, M., Kruse, F. E., Fendrich, T. and Volcker, H. E. (1995) Stability o f fixation: results of fundus- controlled examination using the scanning laser ophthalmoscope. Ger. J. Ophthalmol. 4, 197-202.
Sansbury, R. V., Skavenski, A. A., Haddad, G. M. and Steinman, R. M. (1973) Normal fixation of eccentric targets. J. Opt. Soc. Am. 63, 612-614.
Schuchard, R. A. and Fletcher, D. C. (1994) Preferred retinal locus: a review with applications in low vision rehabilitation. Ophthalmol. Clin. N. Am. 7, 243-256.
Schuchard, R. A. and Raasch, T. W. (1992) Retinal locus for fixation: pericentral fixation targets. Clin. Vis. Sci. 7,511-520.
Schuchard, R. A., Tekwani, N. and Hu, S. Y. (1995) Bincular preferred retinal loci: relationship of visual factors to binocular perception. Vis. Sci. Appl. ( OSA Tech. Dig. Ser.) 1, 332-335.
Steinman, R. M. (1965) Effect o f target size, luminance, and color on monocular fixation. J. Opt. Soc. Am. 55, 1158— 1165.
Steinman, R. M., Cushman, W. B. and Martins, A. J. (1982) The precision of gaze. A review. Hum. Neurobiol. 1, 97-109.
Sunness, J. S., Schuchard, R. A., Shen, N., Rubin, G. S., Dagnelie, G. and Haselwood, D. M. (1995) Landmark- driven fundus perimetry using the scanning laser ophthalmoscope. Invest. Ophthalmol. Vis. Sci. 36, 1863-1874.
Timberlake, G. T., Mainster, M. A., Peli, E., Augliere, R. A., Essock, E. A. and Arend, L. E. (1986) Reading with a macular scotoma. I. Retinal location of scotoma and fixation area. Invest. Ophthalmol. Vis. Sci. 27, 1137-1147.
Timberlake, G. T., Pelli, E., Essock, E. A. and Augliere, R. A. (1987) Reading with a macular scotoma. II. Retinal locus for scanning text. Invest. Ophthalmol. Vis. Sci. 28, 1268-1274.
Varano, M. and Scassa, C. (1998) Scanning laser ophthalmoscope microperimetry. Semin. Ophthalmol. 13, 203-209.
Vingerling, J. R., Klaver, C. C., Hofman, A. and de Jong, P. T. (1995) Epidemiology of age-related maculopathy. Epidemiol. Rev. 17, 347-360.
White, J. M. and Bedell, H. E. (1990) The oculomotor reference in humans with bilateral macular disease. Invest. Ophthalmol. Vis. Sci. 31, 1149-1161.
Whittaker, S. G. and Cummings, R. W. (1990) Eccentric eye movements with loss of central vision. In: A. W. Johnston and M. Lawrence, eds. The International Conference on Low Vision 1990\ Low Vision Ahead II: Conference Proceedings, Melbourne: Association for the Blind, pp 67-73.
Whittaker, S. G. and Lovie-Kitchin, J. (1991) Visual requirements for reading. Optom. Vis. Sci. 70, 54-65.
Whittaker, S. G., Budd, J. and Cummings, R. W. (1988) Eccentric fixation with macular scotoma. Invest. Ophthalmol. Vis. Sci. 29, 268-278.
Whittaker, S. G., Cummings, R. W. and Swieson, L. R. (1991) Saccade control without a fovea. Vis. Res. 31, 2209-2218.
World Health Organisation (1997) Fact sheet No. 144. Blindness and visual disability. Part III of IV: other leading causes worldwide, www.who.int/inf-fs/en/factl44html (accessed September 2003).
© 2004 The College of Optometrists