Adhesion formation after intracapsular myomectomy with or without adhesion barrier
Upload
khangminh22Category
view
2download
0
The Development of Novel Adhesion Promoters
for Waterborne Coatings and Polypropylene Car
Bumpers
by
Helen Louise Brannon
A thesis submitted to
The University of Birmingham
for the degree of
Doctor of Engineering
School of Chemical Engineering
College of Engineering and Physical Sciences
The University of Birmingham
March 2014

University of Birmingham Research Archive
e-theses repository This unpublished thesis/dissertation is copyright of the author and/or third parties. The intellectual property rights of the author or third parties in respect of this work are as defined by The Copyright Designs and Patents Act 1988 or as modified by any successor legislation. Any use made of information contained in this thesis/dissertation must be in accordance with that legislation and must be properly acknowledged. Further distribution or reproduction in any format is prohibited without the permission of the copyright holder.

ACKNOWLEDGEMENTS
First of all, I wish to greatly acknowledge all of my supervisors: Dr. Audree Andersen,
Dr. Christina Haaf-Kleinhubbert, Dr. Bjorn Heinz, Dr. Phil Cox, Dr. Richard Green-
wood and Professor Jon Preece, of whom without, this project would not have been such
a success. I have learnt so much from you over the last four years, and have vastly de-
veloped as a person. I was extremely lucky to have such expertise behind me. I very
much enjoyed working with you, and it has been an unforgettable experience which I will
forever treasure. I hope that we will stay in contact in the future. I will for sure miss our
meetings at the Casino!
I would also like to acknowledge Dr. Markus Hickl, who provided great encouragement
and believed in my work, organising presentations of my work within the company.
A special big thank you also goes to my mum, dad and brother, for being so support-
ive over the years and believing in me. Also my friends I met in Birmingham: Cerise,
Jenni, Isa, Tony, James and Dan who made my first year in Birmingham so enjoyable and
remained good friends throughout my time in Germany. My friends I met in Germany:
Marce, Juli, Thomas, Vero, Bo and Kristina, for being such wonderful friends and making
my time living in Germany unforgettable.
Moving to Germany and a new company was a very daunting experience at first. How-
ever, working daily with such brilliant people made it a great experience I will remember
forever. I am very grateful of Herman Hecky and Thomas Rosenkranz who made me feel

so welcome on my first days at BASF. Ralf Hauselmann, Michael Vetter, Peter Thuery,
Claudia Goebel and Stefan Wahl for making my time in B1 so much fun, as well as the
two jokers, Ralf Horn and Frank Voellinger, who made every day so funny! An extra
thank you also goes to Michael for so kindly offering to teach me how to scuba dive in his
club, which is now a new favourite past time of mine. From working in J550, I would like
to thank Dr. Herve Dietsch for all his words of wisdom, and allowing me to work in his
lab with the great people Thomas Sturm and Siegfried Muth, as well as Nicole Lichterfeld
and Pia Muehlbeier-Entzminger who always brightened up the day.
Furthermore, I was very fortunate to travel to Munster during my time at BASF, which
I thoroughly enjoyed. I would look forward to working with the fantastic people: Fred-
erik Foelling, Markus Saedler and Fatmir Raka. I thank them all for providing my initial
training and giving me such a great experience visiting Munster. I also say an extra thank
you to Frederik who assisted me with the spray gun application and to Markus and his
family for allowing me to stay with them during one of my visits.
Meeting fellow post-graduate students was also a key part of my great experience at
BASF. I would like to thank Viet Nguyen-Kim for all the fun we had sitting together in
the same office, and for all the help he provided me for finding somewhere to live, as well
as the fun we had organising the intern get-togethers. Furthermore, Simon Aben: without
the Raclette evenings, the crepes, French wine and my new favourite cheese, Comte, life
would not have been the same! I also enjoyed all the social events he organised, through
which I met some other lifelong friends.
I would also like to thank the English crew at BASF: Andrew, Mark, Nick, Neil, Kay and
Suzanne, who kept the English spirit alive on our regular lunch breaks and gatherings!

I am particularly grateful for the knowledge I gained during my research project from
the following people: Dr. Bernhard Von Vacano and Dr. Sabine Hirth, who guided me
and taught me the two surface sensitive techniques used in this study: ToF-SIMS and
XPS. Dr. Karl-Heinz Gunzelmann for all the help with GC/MS. Dr. Imke Mueller for
conducting the computational studies within this project. Dr. Walter Maier for his help
with NMR studies. Dr. Svetlana Guriyanova for her advice with mechanical testing and
allowing me to work in her lab. Dr. Thomas Frechen for his expertise on polymer stain-
ing and microscopy. Dr. Joseph Sharples from the EPR research facility at University of
Manchester for running the EPR samples (and the EPSRC for funding this).
My special thanks are also extended to all the analytical technicians at BASF who have
taught me so much and vastly extended my scientific knowledge: Guido Lupa, Peter Boe-
shans and Marion Wagner.
Another special acknowledgement is for my German teacher and new friend, Caroline
Ebert, who was very patient with me and made learning German a fun hobby.
I would like to express my very great appreciation to the EPSRC and BASF for their
funding of this project.
Lastly, but not least, I would like to thank Professor Ian Norton for all of his support
during the writing stage of my thesis.
A special thank you is also for the LATEX community, for creating such a wonderful free
typesetting system which was used to write this thesis.

Als allererstes mochte ich mich bei meinen Betreuern fur die Unterstutzung und Auf-
munterung bedanken. Ich habe die Zusammenarbeit sehr genossen.
Meine Familie, welche mich in allen Situationen sehr unterstutzet hat.
In Ludwigshafen mochte ich mich fur eine tolle Zeit mit viel Spaß in B1 bei Ralf (x2),
Michael, Peter, Claudia, Frank und Stefan bedanken.
Auch allen meinen Kollegen im J550 Labor mochte ich Danke sagen: Thomas, Siegfried,
Nicole and Pia.
Ebenfalls fur eine sehr schone Zeit mochte ich mich in Munster bei Frederik, Markus und
Fatmir bedanken.
Danke auch an meine Deutschlehrerin, Caroline, welche mir Deutsch beigebracht hat.
Ich hoffe, ich habe niemanden vergessen.
Und vielen vielen Dank an alle Freunde und Bekannte in Deutchland. Es war eine super-
tolle Zeit in Deutschland, die ich niemals vergessen werde :)
Liebe Helen

ABSTRACT
The ability of waterborne coatings to adhere to polypropylene-based substrates is a chal-
lenge in the automotive industry. This thesis seeks to explore novel methods to improve
the adhesion and provide coated substrates of an industrial standard. Two methods are
explored, whereby a physical entanglement method is found to be unsuccessful but a
chemical bonding method is found to give patentable results. It is found that the UV
curing of carbene precursors as candidate adhesion promoters, gives an adhesive force
which is comparable to the industrial state of the art method, flaming. Initially, the UV
energy initiates CH insertion reactions, which covalently graft the adhesion promoter to
the polypropylene surface. Secondly, the hydrophilic functional groups of the adhesion
promoter adhere to the waterborne basecoat, thus optimal adhesion is achieved. Sta-
tistical modelling of the results reveals that the adhesive strength depends on the UV
intensity, the adhesion promoter concentration and functional group type. To explore
the industrial applicability, the safety and stability during storage and the aesthetics of
the adhesion promoters were investigated. This research is the first step to developing a
formulation that is able to replace the current flaming method.

Contents
List of Figures xii
List of Tables xxxv
Terms and Abbreviations xl
I Introduction 1
1 Business Case 2
1.1 Adhesion Challenge: Coating Plastic . . . . . . . . . . . . . . . . . . . . . 4
1.2 Project Goal . . . . . . . . . . . . . . . . . . . . . . . . . . . . . . . . . . . 4
2 Literature Review 7
2.1 The Phenomena of Adhesion . . . . . . . . . . . . . . . . . . . . . . . . . . 7
2.1.1 Definition . . . . . . . . . . . . . . . . . . . . . . . . . . . . . . . . 8
2.1.2 Wettability . . . . . . . . . . . . . . . . . . . . . . . . . . . . . . . 9
2.1.3 Adhesion Mechanisms . . . . . . . . . . . . . . . . . . . . . . . . . 9
2.2 Why Replace Steel with Plastic? . . . . . . . . . . . . . . . . . . . . . . . . 10
2.2.1 Thermoplastic Polyolefins (TPO) . . . . . . . . . . . . . . . . . . . 11
2.3 The State of the Art . . . . . . . . . . . . . . . . . . . . . . . . . . . . . . 12
2.3.1 Flaming Pre-treatment . . . . . . . . . . . . . . . . . . . . . . . . . 12
2.3.2 Chlorinated Polyolefin Adhesion Promoters . . . . . . . . . . . . . . 13
2.4 Influence of the Substrate Microstructure on Adhesion Mechanisms . . . . 14
i
2.4.1 Microstructure of Injection Moulded TPO . . . . . . . . . . . . . . 14
2.4.2 Influence of TPO Microstructure on Adhesion . . . . . . . . . . . . 17
2.5 Characterisation of Adhesion . . . . . . . . . . . . . . . . . . . . . . . . . . 18
2.5.1 Peel Tests . . . . . . . . . . . . . . . . . . . . . . . . . . . . . . . . 18
2.5.2 Cross-Hatch Test . . . . . . . . . . . . . . . . . . . . . . . . . . . . 19
2.5.3 Steam Jet Test . . . . . . . . . . . . . . . . . . . . . . . . . . . . . 20
2.5.4 Surface Characterisation . . . . . . . . . . . . . . . . . . . . . . . . 20
2.5.5 Substrate Characterisation . . . . . . . . . . . . . . . . . . . . . . 22
2.6 Other Adhesion Improvement Methods . . . . . . . . . . . . . . . . . . . . 23
2.6.1 Oxidative Methods . . . . . . . . . . . . . . . . . . . . . . . . . . . 23
2.6.2 Block Copolymers as Adhesion Promoters . . . . . . . . . . . . . . 24
2.6.3 Grafting . . . . . . . . . . . . . . . . . . . . . . . . . . . . . . . . . 25
2.6.3.1 Maleic Anhydride (MA) . . . . . . . . . . . . . . . . . . . 25
2.6.3.2 Poly(Acrylic Acid) . . . . . . . . . . . . . . . . . . . . . . 26
2.6.4 Chemical Etching . . . . . . . . . . . . . . . . . . . . . . . . . . . . 27
2.6.5 Novel Surface Treatement . . . . . . . . . . . . . . . . . . . . . . . 27
2.7 Unsuccessful Adhesion Techniques . . . . . . . . . . . . . . . . . . . . . . . 28
2.7.1 Chemical Bonding by Catalytic Oxidation of Inactivated C-H Bonds 28
2.7.2 C-H insertion of Nitrene . . . . . . . . . . . . . . . . . . . . . . . . 28
2.8 Current Patents based on Adhesion Promoters for Plastics . . . . . . . . . 28
2.9 Diazirines as Potential Adhesion Promoters . . . . . . . . . . . . . . . . . . 29
2.10 Conclusions . . . . . . . . . . . . . . . . . . . . . . . . . . . . . . . . . . . 30
II Materials and Methods 31
3 Materials 32
3.1 Substrates . . . . . . . . . . . . . . . . . . . . . . . . . . . . . . . . . . . . 32
3.1.1 Polypropylene-based Substrates . . . . . . . . . . . . . . . . . . . . 32
3.1.2 Grafting Proof-of-Concept Substrates . . . . . . . . . . . . . . . . . 33
ii

3.2 Chlorinated Polyolefin (CPO) Adhesion Promoter . . . . . . . . . . . . . . 33
3.3 Candidate Adhesion Promoters for Physical Entanglement . . . . . . . . . 35
3.4 Candidate Adhesion Promoters for Covalent Bonding (Grafting) . . . . . . 35
3.5 Waterborne Basecoat and Topcoat . . . . . . . . . . . . . . . . . . . . . . 35
3.6 Solvents . . . . . . . . . . . . . . . . . . . . . . . . . . . . . . . . . . . . . 37
3.7 Alkane thiols . . . . . . . . . . . . . . . . . . . . . . . . . . . . . . . . . . 37
3.8 Reaction between Trimeric Isocyanate and TPDOH . . . . . . . . . . . . . 38
4 Methods 39
4.1 Scanning Electron Microscopy (SEM) and Transmission Electron Microscopy
(TEM) with a Ruthenium Tetraoxide (RuO4) Staining Technique, and En-
ergy Dispersive X-ray Spectroscopy (EDX) . . . . . . . . . . . . . . . . . . 39
4.2 ImageJ SEM Image Analysis . . . . . . . . . . . . . . . . . . . . . . . . . . 40
4.3 White Light Interferometry . . . . . . . . . . . . . . . . . . . . . . . . . . 41
4.4 Nanoindentation . . . . . . . . . . . . . . . . . . . . . . . . . . . . . . . . 43
4.5 Surface Free Energy Determination . . . . . . . . . . . . . . . . . . . . . . 44
4.5.1 Owens-Wendt Method . . . . . . . . . . . . . . . . . . . . . . . . . 44
4.5.2 Owens-Wendt Theory . . . . . . . . . . . . . . . . . . . . . . . . . 46
4.5.3 Surface Free Energy of the Basecoat (Wet): Wu Method . . . . . . 47
4.6 Wettability: Contact Angle Measurements . . . . . . . . . . . . . . . . . . 48
4.7 Automated Flaming Station . . . . . . . . . . . . . . . . . . . . . . . . . . 49
4.8 Substrate Cleaning . . . . . . . . . . . . . . . . . . . . . . . . . . . . . . . 49
4.8.1 Cleaning TPO Substrates . . . . . . . . . . . . . . . . . . . . . . . 49
4.8.2 Cleaning Gold Surfaces . . . . . . . . . . . . . . . . . . . . . . . . . 50
4.9 Self-Assembled Monolayer (SAM) Formation . . . . . . . . . . . . . . . . . 50
4.10 Adhesion Promoter (AP) Deposition for Grafting Experiments . . . . . . . 51
4.11 Doctor Blade Coating Application . . . . . . . . . . . . . . . . . . . . . . . 51
4.11.1 CPO . . . . . . . . . . . . . . . . . . . . . . . . . . . . . . . . . . . 51
4.11.2 Candidate APs . . . . . . . . . . . . . . . . . . . . . . . . . . . . . 51
iii
4.12 Spray Gun Coating Application . . . . . . . . . . . . . . . . . . . . . . . . 52
4.13 Thermal Cure . . . . . . . . . . . . . . . . . . . . . . . . . . . . . . . . . . 52
4.14 UV Cure . . . . . . . . . . . . . . . . . . . . . . . . . . . . . . . . . . . . . 53
4.15 Cross Hatch Test (CHT) . . . . . . . . . . . . . . . . . . . . . . . . . . . . 53
4.16 Steam Jet Test (SJT) . . . . . . . . . . . . . . . . . . . . . . . . . . . . . . 54
4.17 Hansen Solubility Parameters: Solvent Selection for Swelling Substrates . . 54
4.18 Solvent Swelling: Milligram Balance . . . . . . . . . . . . . . . . . . . . . . 60
4.19 Time of Flight Secondary Mass Spectrometry (ToF-SIMS) . . . . . . . . . 61
4.19.1 Surface Composition Analysis . . . . . . . . . . . . . . . . . . . . . 61
4.19.2 High Lateral Resolution Images . . . . . . . . . . . . . . . . . . . . 62
4.19.3 Mode of Failure Analysis . . . . . . . . . . . . . . . . . . . . . . . . 62
4.20 X-ray Photoelecton Spectroscopy (XPS) . . . . . . . . . . . . . . . . . . . 62
4.21 Computational Methods . . . . . . . . . . . . . . . . . . . . . . . . . . . . 63
4.21.1 Predicted 3D Structures of APs for the Prediction of the Concen-
tration Required for a Monolayer . . . . . . . . . . . . . . . . . . . 63
4.21.2 Predicted Infrared (IR) Spectrum of TPD . . . . . . . . . . . . . . 64
4.21.3 Predicted Singlet/Triplet States of Carbenes . . . . . . . . . . . . . 64
4.22 Temperature Measurement during UV Curing . . . . . . . . . . . . . . . . 65
4.23 Ultraviolet-Visible (UV-Vis) Spectroscopy . . . . . . . . . . . . . . . . . . 66
4.23.1 Thermal Degradation . . . . . . . . . . . . . . . . . . . . . . . . . . 66
4.23.2 UV Degradation . . . . . . . . . . . . . . . . . . . . . . . . . . . . 67
4.24 Nuclear Magnetic Resonance (NMR) Spectroscopy . . . . . . . . . . . . . . 67
4.25 Electron Paramagnetic Resonance Spectroscopy (EPR) . . . . . . . . . . . 67
4.25.1 UV Degradation . . . . . . . . . . . . . . . . . . . . . . . . . . . . 68
4.25.2 Thermal Degradation . . . . . . . . . . . . . . . . . . . . . . . . . . 68
4.26 Mass Spectrometry Techniques used for Solution Analysis . . . . . . . . . . 68
4.26.1 Gas Chromatography / Mass Spectrometry (GC/MS), Field Ioni-
sation (FI) (Cool-on-Column Technique) . . . . . . . . . . . . . . . 69
iv
4.26.1.1 Gas Chromatography . . . . . . . . . . . . . . . . . . . . 69
4.26.1.2 Field Ionisation (FI) . . . . . . . . . . . . . . . . . . . . . 69
4.26.1.3 Time-of-Flight (ToF) Mass Spectrometry . . . . . . . . . . 70
4.26.1.4 Mass Scale Calibration . . . . . . . . . . . . . . . . . . . . 70
4.26.2 Positive Ionisation Mass Spetrometry (MS), (LIFDI) . . . . . . . . 70
4.26.2.1 Liquid Injection Field Desorption Ionisation (LIFDI) . . . 70
4.26.2.2 Time-of-Flight Mass Spectrometry . . . . . . . . . . . . . 71
4.26.2.3 Mass scale Calibration . . . . . . . . . . . . . . . . . . . . 71
4.27 Infrared Spectroscopy (IR) . . . . . . . . . . . . . . . . . . . . . . . . . . . 71
4.27.1 Transmission Infrared Spectroscopy (IR) . . . . . . . . . . . . . . . 71
4.27.2 Attenuated Total Reflection Infrared Spectroscopy (ATR-IR) . . . . 72
4.28 Raman Spectroscopy . . . . . . . . . . . . . . . . . . . . . . . . . . . . . . 72
4.29 Colorimetry . . . . . . . . . . . . . . . . . . . . . . . . . . . . . . . . . . . 72
4.30 Differential Scanning Calorimetry (DSC) . . . . . . . . . . . . . . . . . . . 72
4.31 Simultaneous Differential Scanning Calorimetry - Thermogravimetric Anal-
ysis (DSC - TGA) . . . . . . . . . . . . . . . . . . . . . . . . . . . . . . . . 73
4.32 Impact Sensitivity Drop-Weight Test . . . . . . . . . . . . . . . . . . . . . 74
4.33 Synthesis of 3-phenyl-3-(trifluoromethyl)-3H- diazirine (or TPD) . . . . . . 74
4.34 Reaction of Trimeric Isocyanate and TPDOH . . . . . . . . . . . . . . . . 74
4.35 Exploratory Data Analysis . . . . . . . . . . . . . . . . . . . . . . . . . . . 74
4.35.1 Pearson and Spearman correlation analysis . . . . . . . . . . . . . . 75
4.35.2 ANOVA and Kruskal-Wallis . . . . . . . . . . . . . . . . . . . . . . 75
4.35.3 Rigorous Empirical Model Building using Stepwise Ordinary Least
Squares (stepOLS) yj=gj(xi) . . . . . . . . . . . . . . . . . . . . . . 78
III Results and Discussions 81
5 Substrate Characterisation 82
5.1 Overview . . . . . . . . . . . . . . . . . . . . . . . . . . . . . . . . . . . . . 82
v
5.2 Introduction . . . . . . . . . . . . . . . . . . . . . . . . . . . . . . . . . . . 82
5.3 Substrate Morphology . . . . . . . . . . . . . . . . . . . . . . . . . . . . . 83
5.3.1 EPDM Mapping . . . . . . . . . . . . . . . . . . . . . . . . . . . . 83
5.3.1.1 Untreated Substrates . . . . . . . . . . . . . . . . . . . . . 83
5.4 Physical Properties of Substrates . . . . . . . . . . . . . . . . . . . . . . . 93
5.5 Thermodynamics: Surface Energy . . . . . . . . . . . . . . . . . . . . . . . 94
5.6 The State of the Art: Adhesion of Polar Coatings to Hydrophobic PP/EPDM
(TPO) Substrates . . . . . . . . . . . . . . . . . . . . . . . . . . . . . . . . 96
5.6.1 Flaming Pre-treatment . . . . . . . . . . . . . . . . . . . . . . . . . 96
5.6.2 CPO Adhesion Promoters . . . . . . . . . . . . . . . . . . . . . . . 101
5.7 Conclusions . . . . . . . . . . . . . . . . . . . . . . . . . . . . . . . . . . . 105
6 Physical Adhesion: Surface Swelling and Interfacial Polymer Chain En-
tanglement 107
6.1 Overview . . . . . . . . . . . . . . . . . . . . . . . . . . . . . . . . . . . . . 107
6.2 Introduction . . . . . . . . . . . . . . . . . . . . . . . . . . . . . . . . . . . 107
6.3 Substrate Swelling . . . . . . . . . . . . . . . . . . . . . . . . . . . . . . . 109
6.3.1 Selecting Appropriate Solvent: Mass Change . . . . . . . . . . . . . 110
6.3.2 Mechanical Properties: Substrate Hardness and Young’s Modulus . 113
6.3.3 Surface Roughness . . . . . . . . . . . . . . . . . . . . . . . . . . . 119
6.4 Candidate Adhesion Promoter Selection . . . . . . . . . . . . . . . . . . . 124
6.4.1 Interaction of APs with PP . . . . . . . . . . . . . . . . . . . . . . 126
6.4.2 Adhesion Tests . . . . . . . . . . . . . . . . . . . . . . . . . . . . . 127
6.5 Future Work . . . . . . . . . . . . . . . . . . . . . . . . . . . . . . . . . . . 129
6.6 Conclusions . . . . . . . . . . . . . . . . . . . . . . . . . . . . . . . . . . . 130
7 Chemical Adhesion: A Proof- Of-Concept Grafting Study 131
7.1 Overview . . . . . . . . . . . . . . . . . . . . . . . . . . . . . . . . . . . . . 131
7.2 Introduction . . . . . . . . . . . . . . . . . . . . . . . . . . . . . . . . . . . 131
vi

7.3 Identifying and Characterising Adhesion Promoters (AP’s) . . . . . . . . . 132
7.3.1 CH Insertion Proof-of-Concept . . . . . . . . . . . . . . . . . . . . . 133
7.4 Grafting to Substrates . . . . . . . . . . . . . . . . . . . . . . . . . . . . . 139
7.4.1 Surface Grafting of TPD to the Model Self Assembled Monolayer
(SAM) Surface . . . . . . . . . . . . . . . . . . . . . . . . . . . . . 141
7.4.2 Surface Grafting of TPD to Polypropylene Substrates Containing
No Additives . . . . . . . . . . . . . . . . . . . . . . . . . . . . . . 146
7.4.3 Surface Grafting of TPD to Industrial TPO/0 Substrates, Contain-
ing No EPDM . . . . . . . . . . . . . . . . . . . . . . . . . . . . . . 149
7.4.4 Surface Grafting of TPD to Industrial TPO/2 Substrates, Contain-
ing EPDM . . . . . . . . . . . . . . . . . . . . . . . . . . . . . . . . 149
7.5 Modification of TPD, Tailoring for the Adhesion at the AP/Basecoat In-
terface . . . . . . . . . . . . . . . . . . . . . . . . . . . . . . . . . . . . . . 152
7.5.1 Surface Grafting of TPDOH to Industrial TPO/0 Substrates at 80 ◦C152
7.5.2 Surface Grafting of TPDCOOH to Industrial TPO/0 Substrates at
80 ◦C . . . . . . . . . . . . . . . . . . . . . . . . . . . . . . . . . . . 156
7.5.3 Surface Grafting of TPDOH to Industrial TPO/0 Substrates at 100 ◦C158
7.5.4 Surface Grafting of TPDCOOH to Industrial TPO/0 Substrates at
100 ◦C . . . . . . . . . . . . . . . . . . . . . . . . . . . . . . . . . . 159
7.5.5 Prediction of TPD Solution Concentration to Create a Monolayer . 160
7.5.6 Surface Grafting of TPDOH and TPDCOOH to Industrial TPO/0
Substrates with UV Curing at a Radiance Exposure of 1900 mJ cm−2161
7.6 Summary . . . . . . . . . . . . . . . . . . . . . . . . . . . . . . . . . . . . 163
7.7 Conclusions . . . . . . . . . . . . . . . . . . . . . . . . . . . . . . . . . . . 164
8 Chemical Adhesion: Cross-Hatch and Steam Jet Adhesion Tests 166
8.1 Overview . . . . . . . . . . . . . . . . . . . . . . . . . . . . . . . . . . . . . 166
8.2 Introduction . . . . . . . . . . . . . . . . . . . . . . . . . . . . . . . . . . . 166
8.3 Doctor Blade Application of Coatings . . . . . . . . . . . . . . . . . . . . . 171
vii

8.3.1 Thermal Curing . . . . . . . . . . . . . . . . . . . . . . . . . . . . . 171
8.3.2 UV Curing . . . . . . . . . . . . . . . . . . . . . . . . . . . . . . . 180
8.3.3 Wet-on-Wet . . . . . . . . . . . . . . . . . . . . . . . . . . . . . . . 186
8.4 Spray Gun Application of Coatings . . . . . . . . . . . . . . . . . . . . . . 188
8.4.1 Thermal Curing . . . . . . . . . . . . . . . . . . . . . . . . . . . . . 188
8.4.2 UV Curing . . . . . . . . . . . . . . . . . . . . . . . . . . . . . . . 192
8.4.2.1 Dependence of the Substrate Type and UV Radiant Ex-
posure on the Adhesion . . . . . . . . . . . . . . . . . . . 192
8.4.2.2 Dependence of the TPDCOOH Concentration, Substrate
Type and UV Radiant Exposure on the Adhesion . . . . . 196
8.4.3 UV Curing vs. Thermal Curing . . . . . . . . . . . . . . . . . . . . 199
8.4.3.1 Surface Elemental Composition . . . . . . . . . . . . . . . 199
8.4.3.2 UV-Vis Kinetics Study . . . . . . . . . . . . . . . . . . . . 201
8.4.3.3 EPR Spectrometry Study . . . . . . . . . . . . . . . . . . 206
8.4.4 Chemical Mapping of Coated Cross-Sections . . . . . . . . . . . . . 209
8.4.4.1 Basecoat and Clearcoat on an Untreated Substrate . . . . 210
8.4.4.2 Comparing TPDOH and TPDCOOH . . . . . . . . . . . . 211
8.4.4.3 Comparing the Doctor Blade and Spray Methods of Ap-
plication . . . . . . . . . . . . . . . . . . . . . . . . . . . . 211
8.4.4.4 Comparing Substrate Type . . . . . . . . . . . . . . . . . 213
8.4.4.5 Comparing Number of Primer Layers . . . . . . . . . . . . 214
8.4.4.6 Comparing the TPDCOOH Solution Concentration . . . . 215
8.5 Industrial Applicability . . . . . . . . . . . . . . . . . . . . . . . . . . . . . 216
8.5.1 Stability of TPD’s . . . . . . . . . . . . . . . . . . . . . . . . . . . 216
8.5.1.1 Storage Stability . . . . . . . . . . . . . . . . . . . . . . . 216
8.5.1.2 Ageing Effect . . . . . . . . . . . . . . . . . . . . . . . . . 218
8.5.2 Evaluation of Synthesis . . . . . . . . . . . . . . . . . . . . . . . . . 218
8.5.3 Colour of APs after CH Insertion . . . . . . . . . . . . . . . . . . . 219
viii

8.5.4 Differential Scanning Calorimetry (DSC) and Simultaneous Differ-
ential Scanning Calorimetry-Thermogravimetry (DSC-TG) . . . . . 220
8.5.4.1 Reaction Processes Occurring . . . . . . . . . . . . . . . . 222
8.5.4.2 Safety of Substances . . . . . . . . . . . . . . . . . . . . . 223
8.5.5 Impact Sensitivity . . . . . . . . . . . . . . . . . . . . . . . . . . . 225
8.5.6 Formulation into Coatings . . . . . . . . . . . . . . . . . . . . . . . 225
8.6 Conclusions . . . . . . . . . . . . . . . . . . . . . . . . . . . . . . . . . . . 228
9 Modelling Adhesion Results 230
9.1 Overview . . . . . . . . . . . . . . . . . . . . . . . . . . . . . . . . . . . . . 230
9.2 Introduction . . . . . . . . . . . . . . . . . . . . . . . . . . . . . . . . . . . 230
9.3 Exploratory Data Analysis . . . . . . . . . . . . . . . . . . . . . . . . . . . 230
9.3.1 Pearson and Spearman Correlation Analysis . . . . . . . . . . . . . 231
9.3.2 Boxplots: Understanding and Exploring the Relationship between
Lead Responses and Potential Categorical Factors Xi . . . . . . . . 237
9.4 Stepwise Ordinary Least Squares (stepOLS) . . . . . . . . . . . . . . . . . 240
9.4.1 CHT . . . . . . . . . . . . . . . . . . . . . . . . . . . . . . . . . . . 241
9.4.2 SJT . . . . . . . . . . . . . . . . . . . . . . . . . . . . . . . . . . . 242
9.5 Conclusions . . . . . . . . . . . . . . . . . . . . . . . . . . . . . . . . . . . 244
IV Final Conclusions and Future Work 247
V Appendices 252
10 Supplementary Material 253
Appendix 10.A Standard Used for Nanoindentation . . . . . . . . . . . . . . . . 254
Appendix 10.B Data Interpolation . . . . . . . . . . . . . . . . . . . . . . . . . 255
Appendix 10.C Surface Roughness of Swollen TPO/0 . . . . . . . . . . . . . . . 256
Appendix 10.D Surface Roughness of Swollen R/0 . . . . . . . . . . . . . . . . . 258
ix
Appendix 10.E Surface Roughness of Swollen R/25 . . . . . . . . . . . . . . . . 259
Appendix 10.F Substrate Characterisation . . . . . . . . . . . . . . . . . . . . . 260
10.F.1 Surface Roughness . . . . . . . . . . . . . . . . . . . . . . . . . . . 260
10.F.2 Chemical Composition . . . . . . . . . . . . . . . . . . . . . . . . . 261
10.F.2.1 Microscopy . . . . . . . . . . . . . . . . . . . . . . . . . . 261
10.F.2.2 Time of Flight Secondary Ion Mass Spectrometry (ToF-
SIMS) . . . . . . . . . . . . . . . . . . . . . . . . . . . . . 268
10.F.3 Mechanical Properties: Substrate and Young’s Modulus . . . . . . . 272
10.F.3.1 Substrate Hardness . . . . . . . . . . . . . . . . . . . . . . 272
10.F.3.2 Substrate Young’s Modulus . . . . . . . . . . . . . . . . . 278
10.F.4 Effect of Solvent Cleaning on the Substrate Morphology . . . . . . 279
10.F.4.1 Surface Roughness . . . . . . . . . . . . . . . . . . . . . . 279
Appendix 10.G Candidate Adhesion Promoter
Characterisation . . . . . . . . . . . . . . . . . . . . . . . . . . . . . . . . . 286
10.G.1 Carbene Precursors . . . . . . . . . . . . . . . . . . . . . . . . . . . 286
Appendix 10.H Self Assembled Monolayers (SAMs) on Gold Surfaces as Model
Systems . . . . . . . . . . . . . . . . . . . . . . . . . . . . . . . . . . . . . 293
Appendix 10.I Lowest Energy Conformers of Diaziridine and Diazirine (TPD) . 298
Appendix 10.J Predicted IR Sprectra of Diaziridine . . . . . . . . . . . . . . . . 299
Appendix 10.K Predicted IR Sprectra of Diazirine (TPD ) . . . . . . . . . . . . 300
Appendix 10.L Predicted Excited States of TPD, TPDOH and TPDCOOH . . . 301
Appendix 10.MAdhesion Promoter Synthesis . . . . . . . . . . . . . . . . . . . . 302
10.M.1 Synthesis of 3-phenyl-3-(trifluoromethyl)-3H-
diazirine (or TPD) . . . . . . . . . . . . . . . . . . . . . . . . . . . 302
10.M.1.1 Step 1: 2,2,2-trifluoro-1-phenylethanone oxime (2) from
2,2,2-trifluoro-1-phenylethanone (1) . . . . . . . . . . . . . 302
10.M.1.2 Step 2: 2,2,2-trifluoro-1-phenylethanone O-tosyl oxime (3)
from (2) . . . . . . . . . . . . . . . . . . . . . . . . . . . . 303
x

10.M.1.3 Step 3: 3-phenyl-3-(trifluoromethyl)diaziridine (4) from (3) 303
10.M.1.4 AB System . . . . . . . . . . . . . . . . . . . . . . . . . . 305
10.M.1.5 Step 4: 3-phenyl-3-(trifluoromethyl)-3H-diazirine (or TPD)(5)
from (4) . . . . . . . . . . . . . . . . . . . . . . . . . . . . 306
Appendix 10.N Statistical Modelling Data . . . . . . . . . . . . . . . . . . . . . 308
Appendix 10.O Stepwise Ordinary Least Squares Analysis . . . . . . . . . . . . 310
Appendix 10.P Patent Search . . . . . . . . . . . . . . . . . . . . . . . . . . . . 313
References 321
xi

List of Figures
1.1 The different divisions of BASF. Adapted from a public presentation
from BASF Investor Day Automotive, September 2012.2 . . . . . . . . . 3
1.2 A diagram highlighting the reduction of VOC by using waterborne coat-
ings. Adapted from a public presentation from BASF Investor Day
Automotive, September 2012.2 . . . . . . . . . . . . . . . . . . . . . . . 3
1.3 Top: Schematic diagram representing the mis-match in surface energy
of a waterborne basecoat (blue circles) and a PP substrate (grey tri-
angles). Bottom, left: Photograph showing a coating that has delami-
nated from a car bumper. Bottom, right: Polar and dispersion (van der
Waals forces) energy components of a wet and dry waterborne basecoat,
a flame treated substrate and an untreated PP substrate, in order of de-
creasing polar components. . . . . . . . . . . . . . . . . . . . . . . . . 5
1.4 A schematic diagram representing (1.) the production line used in in-
dustry today and (2.) the overall goal / vision of the paint formulators.
Brackets indicate that a primer is not always used. BC = basecoat,
CC= clearcoat or topcoat. . . . . . . . . . . . . . . . . . . . . . . . . . 6
1.5 The overall objective of the project. . . . . . . . . . . . . . . . . . . . . 6
2.1 Types of adhesive interactions. . . . . . . . . . . . . . . . . . . . . . . . 7
2.2 An example of an application process of a CPO primer.29 . . . . . . . . 14
2.3 Proposed chemical mechanism for adhesion between a TPO (with EPDM),
CPO and a topcoat.63,65 . . . . . . . . . . . . . . . . . . . . . . . . . . 15
xii

2.4 Three-dimensional schematic (generalised) representation of the TPO
microstructure and surface morphology. Adapted from Ryntz et al.29,30,45,64,66–68 16
2.5 A photograph of substrates after (a) a CHT test (100 % adhesion) and
(b) a SJT (40 % adhesion). . . . . . . . . . . . . . . . . . . . . . . . . . 20
2.6 A schematic diagram showing a block copolymer adhering a hydropho-
bic and hydrophilic polymer together. . . . . . . . . . . . . . . . . . . . 24
2.7 The polymers tested for improved adhesion on PP, adapted by Over-
beek.124 . . . . . . . . . . . . . . . . . . . . . . . . . . . . . . . . . . . . 25
2.8 The reaction mechanism of MA grafting to PP.40 . . . . . . . . . . . . . 26
2.9 Methylene in its (a) triplet and (b) singlet excited state. Diagram com-
posed from information in the book: Modern Physical Organic Chem-
istry.136 . . . . . . . . . . . . . . . . . . . . . . . . . . . . . . . . . . . . 29
3.1 Molecular structures of (a) TPD, (b) TPDOH and (c) TPDCOOH . . . 35
3.2 A pie chart showing the percentage of the different components in the
waterborne basecoat formulation. . . . . . . . . . . . . . . . . . . . . . 37
4.1 Schematic profile of a surface, showing the roughness parameters Ra
and Rq, for the peaks and valleys in the Z direction. An adaptation
from Bellitto et al.140 . . . . . . . . . . . . . . . . . . . . . . . . . . . . 42
4.2 A schematic representation of nano-indentation in Continuous Stiffness
Mode (CSM) from Agilent technologies. (a) A sinusoidal oscillation is
used in permanent superposition to the force signal. The oscillation
is applied directly to the shaft with the tip and produced by the coil
(shown schematically on right hand side). For elastic materials, there is
no phase shift (b) but measurement of viscoelastic materials result in a
phase shift between force and displacement signal (c). . . . . . . . . . . 45
xiii

4.3 Schematic diagram demonstrating the basic principle behind linear in-
terpolation: the line of best fit between two data points, x1 and x2, from
which x can be calculated. . . . . . . . . . . . . . . . . . . . . . . . . . 45
4.4 A schematic diagram showing cases where liquid drops are non-wetting
or wetting on a substrate surface. . . . . . . . . . . . . . . . . . . . . . 48
4.5 Schematic diagram of a laboratory flame treatment station . . . . . . . 49
4.6 Top: a summary of the coating and curing steps. Bottom: the dried
thicknesses of the coatings. . . . . . . . . . . . . . . . . . . . . . . . . . 52
4.7 The UV emission spectrum from the IST UV curing system. . . . . . . 53
4.8 Cross-Hatch Test. Setup : 1 = tape, 2 = coatings, 3 = grid, 4 =
substrate; Test details: a = length of grid is 10 mm, b = length of grid
and guidelines is 16 mm, c = the guide blades and cutting blades are
on the same plane, d = the tape is applied and smoothed/ flattened, e
= pull of direction and angle of the tape. . . . . . . . . . . . . . . . . . 55
4.9 Steam Jet Test . . . . . . . . . . . . . . . . . . . . . . . . . . . . . . . . 56
4.10 The Hansen Solubility Parameters of the selected solvents and a PP
polymer, and the ratio of the distance of the selected solvent to the
radius of the PP sphere (RED number). A perfect solvent has an RED
of 0. A solvent with an RED value < 1 should swell the polymer. . . . . 59
4.11 The Hansen Solubility Parameters of the selected solvents and an EPDM
polymer, and the ratio of the distance of the selected solvent to the
radius of the PP sphere (RED number). A perfect solvent has an RED
of 0. A solvent with an RED value < 1 should swell the polymer. . . . . 59
4.12 The Hansen Solubility Parameters, and sphere of the chosen solvents
and PP, and the ratio of the distance of the chosen solvents to the
radius of the PP sphere (RED number). . . . . . . . . . . . . . . . . . 60
4.13 Molecular structures of the carbenes generated from (a) TPD, (b) TP-
DOH and (c) TPDCOOH, with the loss of N2. . . . . . . . . . . . . . . 65
xiv
4.14 Hierarchical schematic diagram demonstrating the responses, factors
and levels tested for categorical data. . . . . . . . . . . . . . . . . . . . 79
4.15 The stepwise Ordinary Least Squares (stepOLS) modelling process. . . 80
5.1 A summary of the substrate characterisation chapter. . . . . . . . . . . 83
5.2 The oxidation reaction between osmium tetraoxide and alkene double
bonds, forming a five-membered ring: a cyclic osmate ester160 . . . . . . 84
5.3 SEM micrographs of the top cross-section of ruthenium tetraoxide (RuO4)
stained industrial substrates, schematically represented in (a), for (b)
TPO/0, (c) TPO/2 and (d) TPO/20 (insert shows backscattered elec-
trons on RHS) substrates. . . . . . . . . . . . . . . . . . . . . . . . . . 85
5.4 SEM micrographs (left) taken from the cross -section of a TPO/2 sub-
strate and images showing the traced EPDM domains and % area cov-
erage calculated (right). . . . . . . . . . . . . . . . . . . . . . . . . . . 87
5.5 SEM micrographs of ruthenium tetraoxide (RuO4) stained research PP
substrates containing (a) R/0, (b) R/5, (c) R/10, (d) R/15, (e) R/20,
(f) R/25, taken from the top part of the substrate cross section as shown
in the schematic diagram. . . . . . . . . . . . . . . . . . . . . . . . . . . 89
5.6 SEM micrographs of ruthenium tetraoxide (RuO4) stained research PP
substrates taken from the top cross-section, containing: (a) R/5, (b)
R/10, (c) R/15, (d) R/20, (e) R/25 (top) and images of the subsequent
traced EPDM domains (bottom). Table: % area coverage of EPDM
for the top, middle and bottom cross-sectional areas as shown in the
schematic diagram (top, right). . . . . . . . . . . . . . . . . . . . . . . . 90
5.7 SEM micrographs of ruthenium tetraoxide stained research PP sub-
strates taken from the surface, containing (a) R/5, (b) R/10, (c) R/15,
(d) R/20, (e) R/25 (top) and images of the subsequent traced EPDM
domains (bottom). Table: % area coverage of EPDM for the substrate
surface, as shown in the schematic diagram (top, right). . . . . . . . . . 91
xv

5.8 SEM micrographs of the surface of TPO/20 (a) before treatment and
(b) after heat treatment at 80 ◦C for 1 hour. Inset: area of EPDM
magnified. The EDX graph shows the chemical composition at point 4.
The atomic % is displayed in the table (bottom) showing the presence
of Ru (staining) on the areas appearing whiter in contrast, due to EPDM. 93
5.9 A bar graph representing the surface energy values of the labelled sub-
strates and a waterborne basecoat before and after drying. All sur-
face energy calculations were measured using the Owens-Wendt method,
with the exception of the wet basecoat which was calculated using the
Wu method. . . . . . . . . . . . . . . . . . . . . . . . . . . . . . . . . . 94
5.10 Steps of the coating application and curing process. . . . . . . . . . . . 97
5.11 Photographs displaying the cross-hatch test (adhesion test) procedure.
Reproduced with permission from BASF Coatings GmbH. . . . . . . . . 98
5.12 A bar graph representing the surface energy values of the labelled sub-
strates before and after flaming and a waterborne basecoat before and
after drying. All surface energy calculations were measured using the
Owens-Wendt method, with the exception of the wet basecoat which
was calculated using the Wu method. . . . . . . . . . . . . . . . . . . . 100
5.13 Normalised negative ToF-SIMS data taken from a R/15 research sub-
strate before and after flaming, and 6 hours after the flaming treatment. 101
5.14 Left: Negative, high lateral resolution mode ToF-SIMS image of a 200
µm2 area taken from a cross section of TPO/CPO/basecoat/topcoat/epoxy-
glue substrate, cut with a cryo-microtome; Graph overlay: Line graph
showing the chloride (Cl−) ion distribution across the coatings; Image
overlay: Magnified cross-section showing the Cl− diffusion into the TPO
and basecoat. Right: Schematic diagram showing the positioning of the
layered coatings. ToF-SIMS data were normalised to the total ion count.
Image resolution is 1.6 µm/pixel. . . . . . . . . . . . . . . . . . . . . . . 103
xvi

6.1 A summary of the physical adhesion chapter. . . . . . . . . . . . . . . . 108
6.2 The mass change with the square root of time, after TPO/2 substrates
were firstly (a) exposed to the four solvent types selected by HSP pa-
rameters for 1 hour, and (b) left to air dry for 1 hour. Presented data
are averaged values taken from 3 different substrates. Lines of best fit
are shown for deviations from Fick’s Law. . . . . . . . . . . . . . . . . . 112
6.3 Surface hardness profile of a (a) TPO/0, (b) R/0 and a (c) R/25 sub-
strate, before and after swelling for 1 hour, 10 minutes, and 1 minute.
Top right: schematic diagram showing solvent migration into the sur-
face of a substrate, with the solvent molecules (orange spheres) pushing
apart the substrate polymer chains, increasing their mobility. . . . . . . 114
6.4 Surface hardness profile of a (a) R/0 and (b) R/25 substrate, before and
after swelling for 1 minute, and drying for 6 hours and for 3 days. . . . 116
6.5 Summary of surface hardness profiles of a (a) TPO/0, (b) R/0 and (c)
R/25 substrate, before and after swelling for 1 minute, and drying for
6 hours. Bottom: Average hardness change of TPO/0, R/0 and R/25
substrates before and after swelling for 1 minute and drying for 6 hours. 118
6.6 Top: 2D and 3D images of surface roughness and x and y profiles of
R/0 after (a) 10 minute swelling time, (b) after it was left to dry for 5
hours and (c) R/25 after 1 minute swelling time, (d) after it was left
to dry for 5 hours. Bottom: Average root mean square roughness (Rq)
of the TPO/0, R/0 and R/25 substrates before and after swelling for
10 minutes and drying for 5 hours, and after swelling for 1 minute and
drying for 5 hours. . . . . . . . . . . . . . . . . . . . . . . . . . . . . . . 120
xvii

6.7 Schematic diagram demonstrating the hypothesis that the regions of
EPDM found at the surface of a substrate could swell at a greater rate
than the surrounding PP matrix, causing a greater deviation in peaks
and valleys at the surface as demonstrated by the orange area (different
parts of the surface will swell at different rates). . . . . . . . . . . . . . 123
6.8 Schematic diagram demonstrating the hypothesis of achieving improved
adhesion between a hydrophilic waterborne basecoat and a hydrophobic
PP-based substrate, via molecular chain entanglement with a candidate
AP and subsequent interactions between function groups of the AP and
the basecoat. . . . . . . . . . . . . . . . . . . . . . . . . . . . . . . . . . 125
6.9 A scatter graph showing the surface tension (x-axis) and wettability (y-
axis) of the candidate APs on a TPO/2 substrate. The polymers chosen
for adhesion tests are highlighted with blue dashed circles. . . . . . . . 126
7.1 A summary of the chemical adhesion, a proof-of-concept chapter. . . . . 132
7.2 The mass spectrum of the reaction products after a highly concentrated
solution of TPD in cyclohexane (1.3 M) was refluxed for 8h. Cyclohex-
ane was in excess to TPD by 7:1. . . . . . . . . . . . . . . . . . . . . . 134
7.3 19F NMR spectra of thermally reacted (80 ◦C, 8h) 3 mM TPD solutions
in (a) cyclohexane and (b) D12-cyclohexane. Inserts show magnified
doublet peaks, labelled with chemical shift (ppm) and coupling constant,
J (Hz). Chemical shifts were calculated relative to 100 % CF3COOH. . 136
7.4 19F NMR spectra of UV reacted (2.2 mW, 8h) 3 mM TPD solutions
in (a) cyclohexane and (b) D12-cyclohexane. Inserts show magnified
doublet peaks, labelled with chemical shift (ppm) and coupling constant,
J (Hz). Chemical shifts were calculated relative to 100 % CF3COOH . 137
xviii

7.5 A systematic approach to testing the grafting ability of TPD to solid sur-
faces: (a) model alkane-thiol-gold self-assembled monolayer surface of
differing chain lengths, (b) polypropylene sheet containing no pigment,
(c) industrial TPO polypropylene substrate containing all additives in-
cluding pigment. . . . . . . . . . . . . . . . . . . . . . . . . . . . . . . . 140
7.6 Experimental protocol for the grafting proof-of-concept experiment. . . 140
7.7 Thermal grafting of TPD at 80 ◦C on the model SAM surface. ToF-
SIMS results show normalised F− intensity found at the surface and
XPS results show F wt.% found at the surface: (a) normalised F− in-
tensity, 24 h cure; (b) *F wt.% , 24 h cure; (c) normalised F− intensity
, 30 min cure; (d) *F wt.%, 30 min cure: for surfaces A-F as repre-
sented in Figure 7.6 (substrate C was not measured in XPS (d) to avoid
contamination). *A1 represents the gold surface before plasma cleaning
and SAM formation and A2 after plasma cleaning and SAM formation. 142
7.8 XPS peaks taken from the survey spectrum of a TPD-grafted SAM
surface (80 ◦C, 24h) showing the F 1s peak (LHS), and the C1s peak
(RHS), and the subsequent modelling highlighting the binding energies
due to the C-F3 bonding at 687.9 eV and 292.3 eV. This shows strong
evidence that the TPD moiety can be distinguished from inorganic C-
F surface contamination and other C bonding from the surface. For
comparing the different surfaces, the F wt.% was taken from the F
1s peak (spectra were fitted by assuming a Gaussian/Lorentzian-Sum-
Shape (90/10) for all components). . . . . . . . . . . . . . . . . . . . . 144
7.9 Top: the mechanism of carbene generation via thermal activation and
the subsequent C-H insertion into the substrate surface, highlighting the
fragmentation; bottom: negative ToF-SIMS peak at m/z = 173 due to
the fragmentation of the C-H insertion product past the newly formed
C-C bond, proving a covalent bond is formed during the grafting process. 145
xix
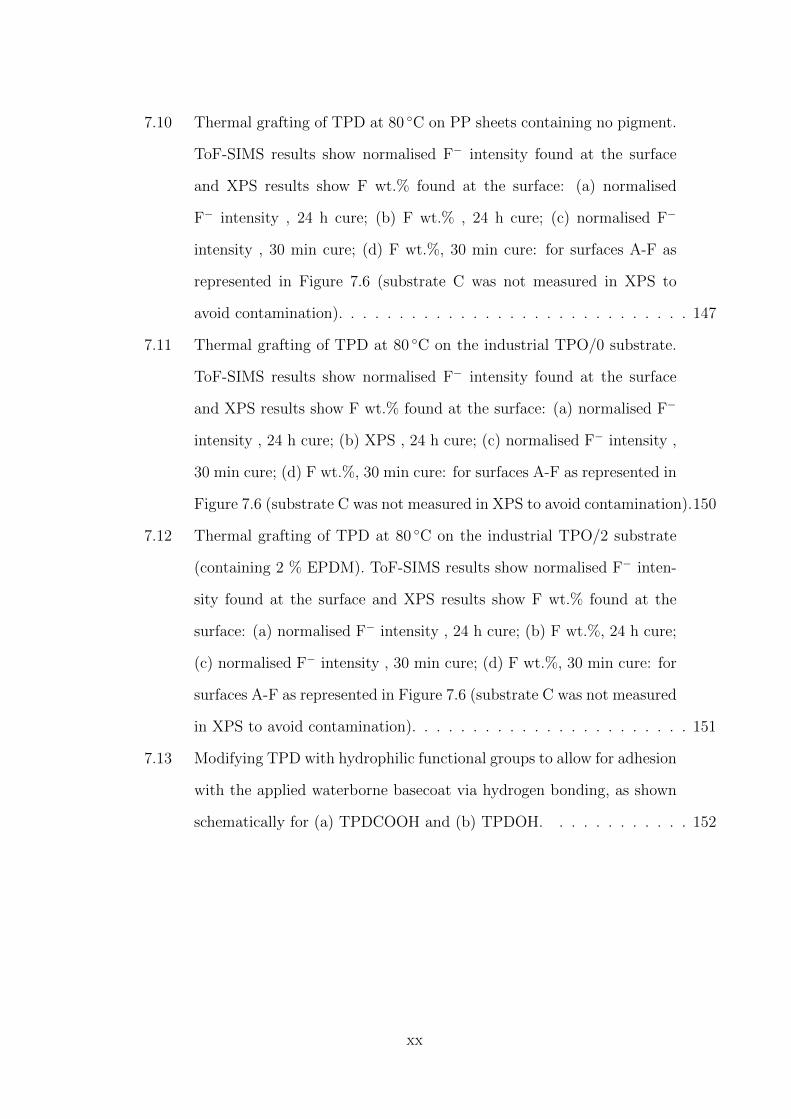
7.10 Thermal grafting of TPD at 80 ◦C on PP sheets containing no pigment.
ToF-SIMS results show normalised F− intensity found at the surface
and XPS results show F wt.% found at the surface: (a) normalised
F− intensity , 24 h cure; (b) F wt.% , 24 h cure; (c) normalised F−
intensity , 30 min cure; (d) F wt.%, 30 min cure: for surfaces A-F as
represented in Figure 7.6 (substrate C was not measured in XPS to
avoid contamination). . . . . . . . . . . . . . . . . . . . . . . . . . . . . 147
7.11 Thermal grafting of TPD at 80 ◦C on the industrial TPO/0 substrate.
ToF-SIMS results show normalised F− intensity found at the surface
and XPS results show F wt.% found at the surface: (a) normalised F−
intensity , 24 h cure; (b) XPS , 24 h cure; (c) normalised F− intensity ,
30 min cure; (d) F wt.%, 30 min cure: for surfaces A-F as represented in
Figure 7.6 (substrate C was not measured in XPS to avoid contamination).150
7.12 Thermal grafting of TPD at 80 ◦C on the industrial TPO/2 substrate
(containing 2 % EPDM). ToF-SIMS results show normalised F− inten-
sity found at the surface and XPS results show F wt.% found at the
surface: (a) normalised F− intensity , 24 h cure; (b) F wt.%, 24 h cure;
(c) normalised F− intensity , 30 min cure; (d) F wt.%, 30 min cure: for
surfaces A-F as represented in Figure 7.6 (substrate C was not measured
in XPS to avoid contamination). . . . . . . . . . . . . . . . . . . . . . . 151
7.13 Modifying TPD with hydrophilic functional groups to allow for adhesion
with the applied waterborne basecoat via hydrogen bonding, as shown
schematically for (a) TPDCOOH and (b) TPDOH. . . . . . . . . . . . 152
xx

7.14 Thermal grafting of TPDOH at 80 ◦C for 30 min on the industrial
TPO/0 substrate. ToF-SIMS results show normalised F− intensity
found at the surface and XPS results show F wt.% found at the surface:
(a) normalised F− intensity, TPDOH pure; (b) F wt.%, TPDOH pure;
(c) normalised F− intensity, 0.5 M TPDOH; (d) F wt.%, 0.5 M TPDOH:
for surfaces A-F as represented in Figure 7.6 (substrate C was not mea-
sured in XPS to avoid contamination). Due to the lower volatility of
TPDOH compared to TPD, the intensity of substrate C for TPDOH is
larger. . . . . . . . . . . . . . . . . . . . . . . . . . . . . . . . . . . . . 155
7.15 XPS narrow region scans of (a) F 1s peak and (b) C 1s peak, before
and after TPDCOOH grafting, and ToF-SIMS spectra of (c) the TPO/0
substrate before and (d) after TPDCOOH grafting. The spectra show
that F and O containing species are unique to TPDCOOH, (the C 1s
spectrum shows a peak at 285 eV characteristic of C—C/C—H present
in both TPO/0 and TPDCOOH.) . . . . . . . . . . . . . . . . . . . . . 157
7.16 Thermal grafting of TPDCOOH at 80 ◦C for 30 min on the indus-
trial TPO/0 substrate. ToF-SIMS results show normalised F− intensity
found at the surface and XPS results show F wt.% found at the sur-
face: (a) normalised F− intensity, 0.5 M TPDCOOH; (b) F wt.%, 0.5
M TPDCOOH: for surfaces A-F as represented in Figure 7.6 (substrate
C was not measured in XPS to avoid contamination). . . . . . . . . . . 158
7.17 Thermal grafting of TPDOH at 100 ◦C for 30 min on the industrial
TPO/0 substrate. ToF-SIMS results show normalised F− intensity
found at the surface and XPS results show F wt.% found at the sur-
face: (a) normalised F− intensity, TPDOH pure; (b) F wt.%, TPDOH
pure; (c) normalised F− intensity, 0.5 M TPDOH; (d) F wt.%, 0.5 M
TPDOH: for surfaces A-F as represented in Figure 7.6 (substrate C was
not measured in XPS to avoid contamination). . . . . . . . . . . . . . . 159
xxi

7.18 Thermal grafting of TPDCOOH at 100 ◦C for 30 min on the indus-
trial TPO/0 substrate. ToF-SIMS results show normalised F− intensity
found at the surface and XPS results show F wt.% found at the sur-
face: (a) normalised F− intensity, 0.5 M TPDCOOH; (b) F wt.%, 0.5
M TPDCOOH: for surfaces A-F as represented in Figure 7.6 (substrate
C was not measured in XPS to avoid contamination). . . . . . . . . . . 160
7.19 Theoretical calculations for the concentration required of each AP for
one monolayer on the surface, the concentration % excess of the 0.5 M
solutions used, and the number of layers that would be present in a 5 µm
thickness. Calculations of the molecule diameter were calculated using
Cosmo, assuming an energetically lower conformer is favoured in the gas
phase. The volume occupied by one molecule of AP was modelled as a
cube and rigidity of the AP molecules was assumed, so that layers of
cubes stack on top of each other without collapsing. Calculations were
based on a 5 µm layer thickness, and an area of 8 x 8 cm. . . . . . . . . 161
7.20 UV grafting of TPDOH and TPDCOOH at 1900 mJ cm−2 radiant ex-
posure on the industrial TPO/0 substrate. ToF-SIMS results show nor-
malised F− intensity found at the surface and XPS results show F wt.%
found at the surface: (a) normalised F− intensity, 0.5 M TPDOH; (b) F
wt.%, 0.5 M TPDOH; (c) normalised F− intensity, 0.5 M TPDCOOH;
(d) F wt.%, 0.5 M TPDCOOH: for surfaces A-F as represented in Figure
7.6 (substrate C was not measured in XPS to avoid contamination). . . 163
8.1 A summary of the chemical adhesion tests chapter. . . . . . . . . . . . . 167
8.2 A schematic diagram showing the cross-section of a finished coated sub-
strate, and the thicknesses of the wet coatings. . . . . . . . . . . . . . . 168
8.3 A flow diagram showing the progression of application methods and
adhesion tests performed. . . . . . . . . . . . . . . . . . . . . . . . . . . 170
xxii

8.4 A bar graph showing the dispersion and polar components of the surface
energy (together making the total surface energy) of a TPO/0 substrate
surface after various AP’s were applied with a doctor blade and cured
at (a) 80 ◦C for 30 min (b) 80 ◦C for 24h (c) 100 ◦C for 30 min and (d)
100 ◦C for 24h. The results of each chart are displayed in descending
order of AP polar contribution from the left-hand side of the chart, with
the two state-of-arts displayed at the right-hand side of the chart. . . . 172
8.5 Schematic diagram demonstrating (a) good adhesion, (b) cohesive fail-
ure, and adhesive failure at the (c) AP/basecoat interface and (d) sub-
strate/AP interface. . . . . . . . . . . . . . . . . . . . . . . . . . . . . . 175
8.6 The F− intensities measured from the delaminated surfaces of the sub-
strate and basecoat after the AP primer layer was cured thermally at (a)
80 ◦C for 30 mins, (b) 80 ◦C for 24h, (c) 100 ◦C for 30 minutes and (d)
100 ◦C for 24h, before the baseocat and clearcoat were applied, cured
and left for a 7 day post-cure. . . . . . . . . . . . . . . . . . . . . . . . 176
8.7 2D chemical maps showing the normalised F− intensity measured from
the delaminated side of the basecoat from the samples: (a) 0.5 M TP-
DOH cured at 80 ◦C for 24 h, (b) 0.5 M TPDCOOH cured at 80 ◦C
for 24 h, (c) 0.5 M TPDOH cured at 80 ◦C for 30 min and (d) 5 mM
TPDCOOH cured at 80 ◦C for 30 min. The line scans represent a sum
of the line scans in the x-direction (pixel by pixel). . . . . . . . . . . . . 179
8.8 A bar graph showing the dispersion and polar components of the surface
energy (together making the total surface energy) of a TPO/0 substrate
surface after various AP’s were applied with a doctor blade and cured at
(a) 1900 mJ cm−2 (b) 630 mJ cm−2 and (c) 122 mJ cm−2. The results
of each chart are displayed in descending order of AP polar contribution
from the left-hand side of the chart, with the two state-of-arts displayed
at the right-hand side of the chart. . . . . . . . . . . . . . . . . . . . . . 180
xxiii

8.9 The F− intensities measured from the delaminated surfaces of the sub-
strate and basecoat after the AP primer layer was UV cured at (a) 1900
mJ cm−2, (b) 630 mJ cm−2 and (c) 122 mJ cm−2, before the basecoat
and clearcoat were applied, cured thermally and left for a 7 day post-cure.183
8.10 The temperature generated during UV curing at the various radiant
exposures measured. The cure at 2300 mJ cm−2 took ∼2 seconds. . . . 185
8.11 2D chemical maps showing the normalised F− intensity measured from
the delaminated side of the substrate from (a) 5 mM TPDCOOH cured
at 1900 mJ cm−2 and (b) 5 mM TPDOH cured at 1900 mJ cm−2, and
from the delaminated side of the basecoat from the samples:(c) 5 mM
TPDOH cured at 1900 mJ cm−2 and (d) 0.5 M TPDOH cured at 1900
mJ cm−2. The line scans represent a sum of the line scans in the x-
direction (pixel by pixel). . . . . . . . . . . . . . . . . . . . . . . . . . . 186
8.12 The F−intensities measured from the delaminated surfaces of the sub-
strate and basecoat after the AP primer layer was applied wet-on-
wet with basecoat and cured before the application and curing of the
clearcoat, which was left for a 7 day post-cure. . . . . . . . . . . . . . . 187
8.13 A bar graph showing the dispersion and polar components of the surface
energy (together making the total surface energy) of a TPO/0 substrate
surface after (a) 5 mM TPDCOOH and (b) 5 mM TPDOH was applied
with a spray gun and cured at 80 ◦C, and (c) 5 mM TPDCOOH and
(d) 5 mM TPDOH was applied with a spray gun and cured at 100 ◦C.
The two state-of-arts are displayed at the right-hand side of the chart. . 189
xxiv
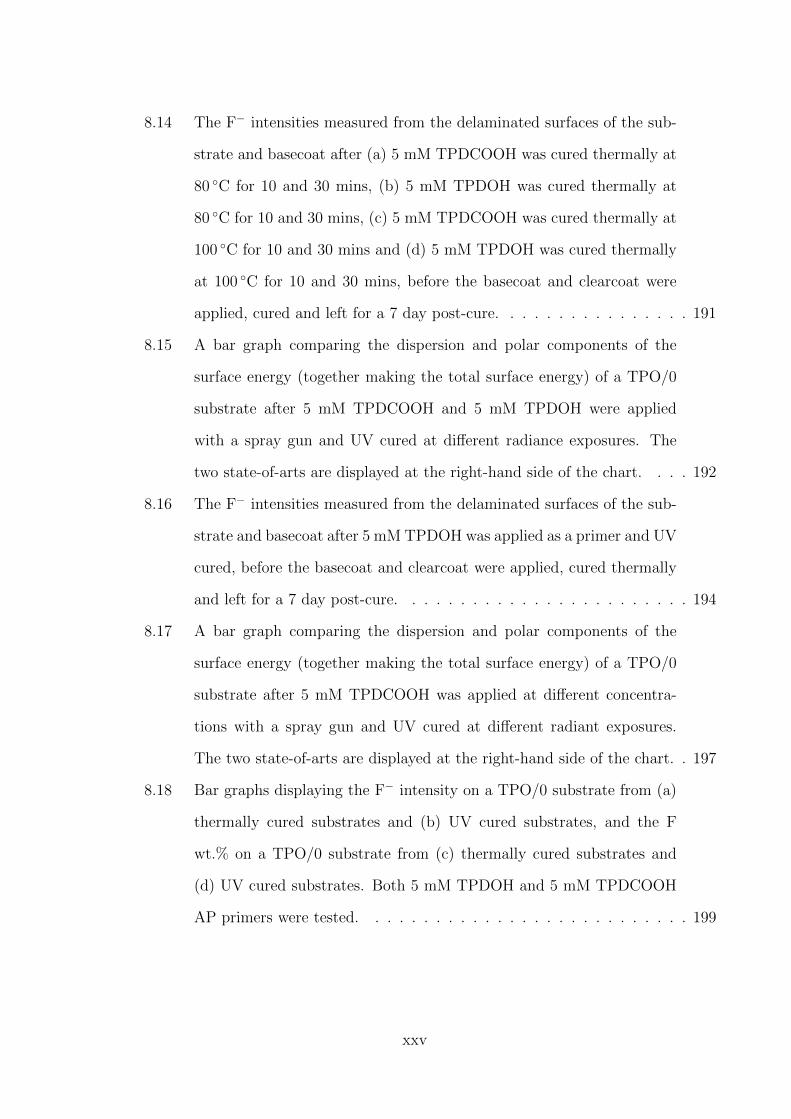
8.14 The F− intensities measured from the delaminated surfaces of the sub-
strate and basecoat after (a) 5 mM TPDCOOH was cured thermally at
80 ◦C for 10 and 30 mins, (b) 5 mM TPDOH was cured thermally at
80 ◦C for 10 and 30 mins, (c) 5 mM TPDCOOH was cured thermally at
100 ◦C for 10 and 30 mins and (d) 5 mM TPDOH was cured thermally
at 100 ◦C for 10 and 30 mins, before the basecoat and clearcoat were
applied, cured and left for a 7 day post-cure. . . . . . . . . . . . . . . . 191
8.15 A bar graph comparing the dispersion and polar components of the
surface energy (together making the total surface energy) of a TPO/0
substrate after 5 mM TPDCOOH and 5 mM TPDOH were applied
with a spray gun and UV cured at different radiance exposures. The
two state-of-arts are displayed at the right-hand side of the chart. . . . 192
8.16 The F− intensities measured from the delaminated surfaces of the sub-
strate and basecoat after 5 mM TPDOH was applied as a primer and UV
cured, before the basecoat and clearcoat were applied, cured thermally
and left for a 7 day post-cure. . . . . . . . . . . . . . . . . . . . . . . . 194
8.17 A bar graph comparing the dispersion and polar components of the
surface energy (together making the total surface energy) of a TPO/0
substrate after 5 mM TPDCOOH was applied at different concentra-
tions with a spray gun and UV cured at different radiant exposures.
The two state-of-arts are displayed at the right-hand side of the chart. . 197
8.18 Bar graphs displaying the F− intensity on a TPO/0 substrate from (a)
thermally cured substrates and (b) UV cured substrates, and the F
wt.% on a TPO/0 substrate from (c) thermally cured substrates and
(d) UV cured substrates. Both 5 mM TPDOH and 5 mM TPDCOOH
AP primers were tested. . . . . . . . . . . . . . . . . . . . . . . . . . . 199
xxv

8.19 Bar graphs displaying the (a) F− intensity and (b) F wt.% after a 5
mM TPDCOOH AP primer was applied at varying concentrations and
cured with two different UV radiant exposures. . . . . . . . . . . . . . . 200
8.20 Top: UV-Vis spectra taken at 80 ◦C of the -N=N- chromophore, from (a)
TPD in Toluene, (b) TPDOH in Toluene, (c) TPDCOOH in Toluene.
Bottom: Concentration vs. time curves at 80 ◦C for (d) TPD , (e) TP-
DOH and (f) TPDCOOH. All reactions are first order: rate of reaction
is directly proportional to the concentration of TPD/OH/COOH. The
decomposition of TPD is a unimolecular process. . . . . . . . . . . . . . 202
8.21 Top: UV-Vis spectra taken at 100 ◦C of the -N=N- chromophore, from
(a) TPD in Toluene, (b) TPDOH in Toluene, (c) TPDCOOH in Toluene.
Bottom: Concentration vs. time curves at 100 ◦C for (d) TPD , (e) TP-
DOH and (f) TPDCOOH. All reactions are first order: rate of reaction
is directly proportional to the concentration of TPD/OH/COOH. The
decomposition of TPD is a unimolecular process. . . . . . . . . . . . . . 203
8.22 Top: UV-Vis spectra of the -N=N- chromophore, taken at 2 mW cm−2
from (a) TPD in Toluene, (b) TPDOH in Toluene, (c) TPDCOOH in
Toluene. Bottom: Time for 99 % reaction completion vs. power of UV
source in mW cm−2 for (d) TPD , (e) TPDOH and (f) TPDCOOH.
All reactions are first order: rate of reaction is directly proportional to
the concentration of TPD/OH/COOH. The decomposition of TPD is a
unimolecular process. . . . . . . . . . . . . . . . . . . . . . . . . . . . . 204
8.23 The UV reaction scheme for TPD showing the formation of the diazo
isomer and subsequent indirect formation of the carbene. Adapted from
Brunner et al.135 . . . . . . . . . . . . . . . . . . . . . . . . . . . . . . . 205
8.24 Structures of the products identified with GC-MS from the thermal and
UV activated reactions of 3 mM solutions of TPD (a-c), TPDOH (d-e)
and TPDCOOH (f-g) in toluene. . . . . . . . . . . . . . . . . . . . . . . 206
xxvi

8.25 X-band EPR spectra recorded at 293 K (experimental conditions: fre-
quency was 9.87 GHz; power was 20 mW) for a non-irradiated (red),
irradiated with UV LED (black) and thermally activated at 80 ◦C (blue)
sample. . . . . . . . . . . . . . . . . . . . . . . . . . . . . . . . . . . . . 208
8.26 (a)ToF-SIMS image showing the clearcoat from the NCO− ion (m/z =
42) and the basecoat from the C2N3− ion (m/z = 66), normalised against
total ion counts, (b) image: magnified area of basecoat/clearcoat; over-
lay: line graph of F− (m/z = 19) normalised intensity, and (c) schematic
diagram of basecoat/clearcoat with estimated coating thicknesses. . . . 210
8.27 ToF-SIMS images showing the clearcoat from the NCO− ion (m/z = 42),
the basecoat from the C2N3− ion (m/z = 66), and the TPO substrate
from the C28H42PO4− ion (m/z = 473), with an overlay of the F− (m/z
= 19) for a UV cured (1900 mJ cm−2) (a) 5 mM TPDCOOH and (b)
0.5 M TPDOH primer layer, applied with a doctor blade. All intensities
were normalised against total ion count. . . . . . . . . . . . . . . . . . . 211
8.28 ToF-SIMS images showing the clearcoat from the NCO− ion (m/z = 42),
the basecoat from the C2N3− ion (m/z = 66), and the TPO substrate
from the C28H42PO4− ion (m/z = 473), with an overlay of the F− (m/z
= 19) for a primer of 5 mM TPDCOOH which was cured by UV at 1900
mJ cm−2 and applied with a (a) doctor blade and (b) spray gun. All
intensities were normalised against total ion count. . . . . . . . . . . . . 212
8.29 ToF-SIMS images showing the clearcoat from the NCO− ion (m/z = 42),
the basecoat from the C2N3− ion (m/z = 66), and the TPO substrate
from the C28H42PO4− ion (m/z = 473), with an overlay of the F−(m/z
= 19) for a primer of 5 mM TPDCOOH which was cured by UV at
1900 mJ cm−2 and spray applied to the following substrates:(a)R/0, (b)
R/10 and (c) R/20. All intensities were normalised against the total
ion count. . . . . . . . . . . . . . . . . . . . . . . . . . . . . . . . . . . 214
xxvii

8.30 ToF-SIMS images showing the clearcoat from the NCO−ion (m/z = 42),
the basecoat from the C2N3− ion (m/z = 66), and the TPO substrate
from the C28H42PO4− ion (m/z = 473), with an overlay of the F− (m/z
= 19) for a primer of 5 mM TPDCOOH which was spray applied (a) 2
x, (b) 3 x, and (c) 5 x, to a TPO/0 substrate and cured by UV at 1900
mJ cm−2. All intensities were normalised against the total ion count. . 215
8.31 ToF-SIMS images showing the clearcoat from the NCO− ion (m/z = 42),
the basecoat from the C2N3− ion (m/z = 66), and the TPO substrate
from the C28H42PO4− ion (m/z = 473), with an overlay of the F− (m/z
= 19) for a primer of (a) 5 mM TPDCOOH and (b) 10 mM TPDCOOH
which was spray applied and UV cured at 1900 mJ cm−2. All intensities
were normalised against the total ion count. . . . . . . . . . . . . . . . 216
8.32 Stability study measuring UV-Vis spectra of 3 mM solutions in toluene,
over a six month period, for solutions of (a) TPD, (b) TPDOH and (c)
TPDCOOH stored in the refrigerator at 3 ◦C, and solutions of (d) TPD,
(e) TPDOH and (f) TPDCOOH stored in transparent glass vials on a
windowsill at room temperature. . . . . . . . . . . . . . . . . . . . . . 217
8.33 LHS: DSC results, RHS: simultaneous DSC-TGA for (a) TPD, (b) TP-
DOH and (c) TPDCOOH. . . . . . . . . . . . . . . . . . . . . . . . . . 221
8.34 The reaction of trimeric isocyanate with three equivalents of TPDOH. . 226
8.35 The reaction of HDI trimeric isocyanate with three equivalents of TP-
DOH, monitored by IR spectroscopy at 0h and after 96h of stirring at
room temperature. . . . . . . . . . . . . . . . . . . . . . . . . . . . . . 227
9.1 A summary of the chemical adhesion tests chapter. . . . . . . . . . . . . 231
9.2 Pearson correlation heat-map, r = ±1 is perfect correlation ; r = 0 is
no correlation. . . . . . . . . . . . . . . . . . . . . . . . . . . . . . . . . 232
9.3 Spearman correlation heat-map, r = ±1 is perfect correlation ; r = 0 is
no correlation. . . . . . . . . . . . . . . . . . . . . . . . . . . . . . . . . 233
xxviii

9.4 Radar graph showing greatest Spearman and Pearson correlation coef-
ficients for the CHT, where r = ±1 is perfect correlation ; r = 0 is no
correlation. . . . . . . . . . . . . . . . . . . . . . . . . . . . . . . . . . . 234
9.5 Radar graph showing greatest Spearman and Pearson correlation coef-
ficients for the SJT, where r = ±1 is perfect correlation ; r = 0 is no
correlation. Note: Elastic Modulus and Hardness are negative correla-
tion coefficients. . . . . . . . . . . . . . . . . . . . . . . . . . . . . . . . 237
9.6 Boxplots of (a) CHT vs Cure Method [ANOVA.F = 100.0835, p.kruskal
= 0], (b) CHT vs AP Type [ANOVA.F = 83.7393, p.kruskal = 0], (c)
CHT vs Substrate Type [ANOVA.F = 21.3075, p.kruskal = 0], (d) SJT
vs Substrate Type [ANOVA.F = 7.0076, p.kruskal = 0.003] and (e) CHT
vs AP Application Method [ANOVA.F = 3.9211, p.kruskal = 0.889]. . . 239
9.7 Schematic diagram highlighting the donor and acceptor sites for H-
bonding for (a) carboxylic acids and (b) alcohols. . . . . . . . . . . . . 240
9.8 StepOLS results on standardised data for CHT=f(xi). R2 = 0.981. . . . 241
9.9 Boxplot of CHT vs the combined interaction between the cure method
and the AP type [ANOVA.F = 303.7315, p.kruskal = 0]. The com-
bination of TPDCOOH and UV was unique at maximising the CHT
result in accordance with stepOLS analysis. The red numbers display
the number of results for each variable. . . . . . . . . . . . . . . . . . . 242
9.10 stepOLS results on standardised data for SJT=f(xi). R2 = 0.34 (non-
linear). . . . . . . . . . . . . . . . . . . . . . . . . . . . . . . . . . . . . 243
9.11 A trellis plot showing standardised correlation between the SJT results
and the UV radiant exposure, number of primer sprays for varying con-
centration: (a) Low concentration, (b) middle concentration and (c)
high concentration. . . . . . . . . . . . . . . . . . . . . . . . . . . . . . 244
9.12 A summary of the results chapters, highlighting the flow of the work
and the interactions between the chapters. . . . . . . . . . . . . . . . . 248
xxix

9.13 The overall objective of the project, highlighting the goals achieved
during this study. The technology is patent pending. . . . . . . . . . . . 250
10.1 Graphs of (a) the Young’s modulus profile and (b) the hardness profile
of the reference material, polycarbonate, over a displacement of 5 µm
from the substrate surface. . . . . . . . . . . . . . . . . . . . . . . . . . 254
10.2 2D and 3D images of surface roughness and x and y profiles of TPO/0
after (a) 10 minute swelling time and (b) after it was left to dry for 5
hours. . . . . . . . . . . . . . . . . . . . . . . . . . . . . . . . . . . . . . 256
10.3 2D and 3D images of surface roughness and x and y profiles of TPO/0
after (a) 1 minute swelling time and (b) after it was left to dry for 5
hours. . . . . . . . . . . . . . . . . . . . . . . . . . . . . . . . . . . . . . 257
10.4 2D and 3D images of surface roughness and x and y profiles of R/0 after
(a) 1 minute swelling time and (b) after it was left to dry for 5 hours. . 258
10.5 2D and 3D images of surface roughness and x and y profiles of R/25
after (a) 10 minute swelling time and (b) after it was left to dry for 5
hours. . . . . . . . . . . . . . . . . . . . . . . . . . . . . . . . . . . . . . 259
10.6 2D and 3D images of the surface roughness and x and y profiles of (a)
TPO/0, (b) TPO/2 and (c) TPO/20 substrates. . . . . . . . . . . . . . 262
10.7 2D and 3D images of the surface roughness and x and y profiles of (d)
R/0, (e) R/5 and (f) R/10 substrates. . . . . . . . . . . . . . . . . . . . 263
10.8 2D and 3D images of the surface roughness and x and y profiles of (g)
R/15, (h) R/20 and (i) R/25 substrates. . . . . . . . . . . . . . . . . . 264
10.9 Average root mean square roughness (Rq) of the different polymer sub-
strates . . . . . . . . . . . . . . . . . . . . . . . . . . . . . . . . . . . . 265
10.10 TEM micrographs taken from a stained RuO4 ultra-thin section (cross-
section) of a TPO/2 substrate, (a) showing talc (top) and carbon black
(bottom), at 20,000 x magnification, (b) the same but 50,000 x magni-
fication, (c) carbon black spherical partiles, 50,000 x magnification . . . 265
xxx

10.11 Typical fillers found in TPO plastics: (a) Schematic representation of
carbon black spherical particles, with hydrophilic functional groups at
the surface, (b) a 3D lattice of CaCO3 and (c) a 2D representation of
talc and the different interactions between the layered structure171 . . . 268
10.12 The positive ion ToF-SIMS spectrum of the TPO/0 substrate surface . 269
10.13 The negative ion ToF-SIMS spectrum of the TPO/0 substrate surface . 270
10.14 Irgafos 168 . . . . . . . . . . . . . . . . . . . . . . . . . . . . . . . . . . 271
10.15 Schematic diagram showing the generation of the m/z = 69 fragment
characteristic of PP: (a) dimethylcyclopropyllium ion or (b) and (c) allyl
ion, which are stabilised through the inductive effective of the methyl
groups or by resonance stabilisation. . . . . . . . . . . . . . . . . . . . 273
10.16 Top: (a) Surface hardness profile of all substrates and (b) Young’s mod-
ulus profile of all substrates, measured using nano-indentation. Bottom:
(c) Average hardness fo all substrates and (d) average Young’s modulus
for all substrates. . . . . . . . . . . . . . . . . . . . . . . . . . . . . . . 277
10.17 2D and 3D images of the surface roughness and x and y profiles of
untreated (a) TPO/0, (b) R/0 and (c) R/25 substrates. . . . . . . . . . 281
10.18 2D and 3D images of the surface roughness and x and y profiles of
solvent wiped (c) TPO/0, (d) R/0 and (e) R/25 substrates. . . . . . . . 282
10.19 2D and 3D images of the surface roughness and x and y profiles of non-
abrasive solvent cleaned (c) TPO/0, (d) R/0 and (e) R/25 substrates. . 283
10.20 The effect of substrate cleaning on the Rq surface roughness parameter. 284
10.21 Plots of (a)1H NMR of TPD , (b)13C NMR of TPD, (c)1H NMR of
TPDOH , (d)13C NMR of TPDOH, (e)1H NMR of TPDCOOH and
(f)13C NMR of TPDCOOH. . . . . . . . . . . . . . . . . . . . . . . . . 287
xxxi

10.22 The IR spectra of (a) TPD, (b) TPDOH and (c) TPDCOOH. For TPD,
the measured spectrum is shown in black, and the red overlay stick spec-
tra shows the predicted IR spectrum. IR symbols: between 2 atoms: ν=
stretch; between 3 atoms: δ = symmetric bending, a = anti-symmetric
bending, ω = out of plane bending/wagging, ρ = rocking; between 4
or more atoms: τ = torque, δ = in plane deformation and γ = out of
plane deformation. . . . . . . . . . . . . . . . . . . . . . . . . . . . . . . 288
10.23 The UV-Vis spectra of 3 mM solutions of (a) TPD, (b) TPDOH and
(c) TPDCOOH in toluene, measured at 25 ◦C. . . . . . . . . . . . . . . 290
10.24 The mass spectra measured of (a) TPD, (b) TPDOH and (c) TPDCOOH.292
10.25 A schematic diagram showing a self assembled monolayer (SAM) cova-
lently bonded to a gold surface (left). A mixture of alkyl thiols, C9 and
C18, in a ratio of 4:1 were used to form the SAM. After the TPD was
thermally reacted with the SAM surface it was likely to graft to the
exposed top part of the C18 chain due to less steric hindrances (right).
The fluorine atoms of the CF3 group on the TPD moiety, chemically
distinguished the TPD from the rest of the surface, and was used in
ToF-SIMS and XPS to characterise the grafting efficiency. . . . . . . . . 293
10.26 A schematic diagram showing three ways in which mixed chain length
SAMs can form: (a) ordered, highly packed domains of alike chain
lengths, (b) highly packed ordered chains at the surface and lower or-
dering diffuse chains at the outer surface with mixing of the two chain
lengths and (c) a less packed, disordered surface where longer chains fold.294
10.27 Regions of the negative ion ToF-SIMS spectrum of the mixed thiol
(C9:C18 → 4:1) SAM on a gold surface, after 24 hours of adsorption,
highlighting the characteristic peaks. . . . . . . . . . . . . . . . . . . . 296
10.28 Optimised lowest energy conformers of diaziridine (top) and diazirine
(=TPD) (bottom), used to calculate the predicted IR spectra. . . . . . 298
xxxii

10.29 IR vibrational spectrum output from control file of Diaziridine . . . . . 299
10.30 IR vibrational spectrum output from control file of Diazirine . . . . . . 300
10.31 Predicted electronic excited states of TPD, TPDOH and TPDCOOH.
The energy of the optimised states is given in atomic units (au). The
difference between the excited states was convert from the atomic unit
of energy, called Hartree: 1 Hartree = 2625.5 kJ/mol. Geometry opti-
misation method = BP86/def2-SV(P). . . . . . . . . . . . . . . . . . . 301
10.32 Reaction scheme for synthesis of 3-phenyl-3-(trifluoromethyl)-3H-diazirine
(or TPD) . . . . . . . . . . . . . . . . . . . . . . . . . . . . . . . . . . . 302
10.33 Reaction set-up for addition of liquid ammonia to reaction mixture: 1.
Gas release bottle containing acetic acid (50 % in water); 2. Empty
safety pressure release (in case acid jumps from other bottle under pres-
sure); 3. Over pressure release (containing metal balls to maintain pres-
sure); 4. Thermometer; 5. Mechanical stirrer; 6. Cold finger (containing
dry ice, −78.5 ◦C); 7. Ammonia gas cylinder; 8. 4-necked round bot-
tomed flask containing reaction dispersion; 9. Dish filled with dry ice &
acetone to maintain cold reaction dispersion and keep ammonia in its
liquid phase as long as possible. . . . . . . . . . . . . . . . . . . . . . . 304
10.34 Possible stereoisomers of 2,2,2-Trifluoromethyl-3-phenyldiaziridine. 3D
images: energy minimisation ran through chemBio3D version 12.0, us-
ing implemented MM2 energy minimise option (pink sphere = lone pair
of electrons, yellow = fluorine, blue = nitrogen, white = hydrogen, grey
= carbon). . . . . . . . . . . . . . . . . . . . . . . . . . . . . . . . . . . 305
10.35 NMR spectra of diaziridine, 4: (a) 1H NMR spectrum (insert of NH
protons, AB system), (b) 1H NMR spectrum before and after D2O shake
up, (c) 2D COSY 1H NMR spectrum and (d) 2D NOSEY spectrum. . . 307
xxxiii

10.36 A list of the numerical, catagorical data. Red = lead responses yj. Blue
= factors xi (that were controlled), potentially affecting yj. Black =
variables measured. . . . . . . . . . . . . . . . . . . . . . . . . . . . . . 308
10.37 The number of samples measured from the adhesion tests, demonstrat-
ing the slicing of data that occured. . . . . . . . . . . . . . . . . . . . . 309
10.38 Rigorous empirical model building using stepwise Ordinary Least Squares
(stepOLS) Yj=CHT(xi) . . . . . . . . . . . . . . . . . . . . . . . . . . 310
10.39 Rigorous empirical model building using stepwise Ordinary Least Squares
(stepOLS) Yj=SJT(xi) . . . . . . . . . . . . . . . . . . . . . . . . . . . 311
10.40 Top 10 variables that were found to have the greatest influence on the
CHT and SJT results, based on standard linear regression. . . . . . . . 312
10.41 Patent search summary part 1. Available on CD for magnified view. . . 317
10.42 Patent search summary part 2. Available on CD for magnified view. . . 318
10.43 Patent search summary part 3. Available on CD for magnified view. . . 319
10.44 Patent search summary part 4. Available on CD for magnified view. . . 320
xxxiv

List of Tables
3.1 Summary of substrates, including predetermined properties of the indus-
trial substrates available from the manufacturers. For the DaplenTM EE103AE
and SABIC R© PP 108MF10 substrates, the density was measured using ISO
1183 and the Vicat softening temperature was measured using ISO 306. For
the SABIC R© PP 95610 substrate, the denisty was measured using ASTM
D792 and the Vicat softening temperature was measured using ASTM D1525. 34
3.2 A list of commercially available active polymers provided from BASF and
their descriptions. . . . . . . . . . . . . . . . . . . . . . . . . . . . . . . . . 36
4.1 Predetermined polar and dispersion components of the surface tension of
the probe liquids used to determine the surface energy of the substrates. . 46
4.2 yj lead responses, for yj=mxi + c. . . . . . . . . . . . . . . . . . . . . . . . 76
4.3 Numerical xi factors, for yj=mxi + c. . . . . . . . . . . . . . . . . . . . . . 76
4.4 Other numerical responses (App = application.) . . . . . . . . . . . . . . . 76
4.5 Categorical xi factors . . . . . . . . . . . . . . . . . . . . . . . . . . . . . . 77
5.1 Adhesion results before and after flaming pre-treatment. The basecoat and
topcoat were dried at 80 ◦C for 10 minutes and 30 minutes respectively.
All adhesion tests were performed after a 7 day post-cure period after the
topcoat was applied. . . . . . . . . . . . . . . . . . . . . . . . . . . . . . . 99
xxxv

5.2 CHT adhesion results from before and after CPO (40 % solids in xylene)
primer application. The CPO was applied with varying thickness’s and
dried at 80 ◦C for 10 minutes or applied wet-on-wet with the basecoat. The
basecoat and topcoat were dried at 80 ◦C for 10 minutes and 30 minutes
respectively. All CHT tests were performed after a 7 day post-cure period
after the topcoat was applied. . . . . . . . . . . . . . . . . . . . . . . . . . 103
6.1 CHT adhesion results after the candidate AP primer layer was applied to
a dried substrate and to a substrate that was pre-swollen in cyclohexane
for one minute. All adhesion tests were performed after a 7 day post-cure
period after the topcoat was applied. No improvement in adhesion was
observed for all variables tested. . . . . . . . . . . . . . . . . . . . . . . . 128
7.1 GC relative peak-to-TPD ratios of CH insertion products. [* indicates
product in excess.] . . . . . . . . . . . . . . . . . . . . . . . . . . . . . . . 138
7.2 Summary of the TPO/0 substrate surface after the grafting of TPD, TP-
DOH and TPDCOOH under the various conditions tested (thermal and
UV exposure) and after washing with tetrahydrofuran (THF) (= step F in
Figure 7.6). . . . . . . . . . . . . . . . . . . . . . . . . . . . . . . . . . . . 164
8.1 The variables of the AP type, concentration, thickness and application
method that were tested to investigate their affect on adhesion. . . . . . . 169
8.2 The variables of each curing method that were tested to investigate their
affect on adhesion. . . . . . . . . . . . . . . . . . . . . . . . . . . . . . . . 171
8.3 CHT results after various AP’s were applied with a doctor blade and ther-
mally cured before the basecoat and clearcoat were applied, cured and left
for a 7 day post-cure. . . . . . . . . . . . . . . . . . . . . . . . . . . . . . . 173
xxxvi

8.4 Summary of the modes of failure observed for each tested sample, after the
coated surface had delaminated from the substrate during the adhesion
test. The AP primer was applied with a doctor blade and thermally cured
before the basecoat and clearcoat were applied and cured, and left for a 7
day post-cure. . . . . . . . . . . . . . . . . . . . . . . . . . . . . . . . . . . 177
8.5 CHT results after various AP’s were applied with a doctor blade and cured
with UV before the basecoat and clearcoat were applied, cured and left for
a 7 day post-cure. . . . . . . . . . . . . . . . . . . . . . . . . . . . . . . . . 182
8.6 Summary of the modes of failure observed for each tested sample after the
coated surface had delaminated from the substrate during the adhesion
test. The AP primer was applied with a doctor blade and UV cured before
the basecoat and clearcoat were applied and cured, and left for a 7 day
post-cure. . . . . . . . . . . . . . . . . . . . . . . . . . . . . . . . . . . . . 184
8.7 CHT results after various AP’s were applied with a doctor blade wet-on-
wet with the basecoat, which was cured before the clearcoat was applied,
cured and left for a 7 day post-cure. . . . . . . . . . . . . . . . . . . . . . . 187
8.8 Summary of the modes of failure observed for each tested sample after the
coated surface had delaminated from the substrate during the adhesion
test. The AP primer was applied with a doctor blade and applied wet-on-
wet with the basecoat before applying the clearcoat which was cured and
left for a 7 day post-cure. . . . . . . . . . . . . . . . . . . . . . . . . . . . . 188
8.9 CHT results after various AP’s were applied with a spray gun and thermally
cured before the basecoat and clearcoat were applied, cured and left for a
7 day post-cure. . . . . . . . . . . . . . . . . . . . . . . . . . . . . . . . . . 190
xxxvii

8.10 CHT results after 5 mM TPDCOOH and 5 mM TPDOH were applied
with a spray gun and cured with UV before the basecoat and clearcoat
were applied, cured and left for a 7 day post-cure. These CHT results were
obtained for all tested substrates: TPO/0, TPO/2, TPO/20, R/0, R/5,
R/10, R/15, R/20, R/25 (no CHT variance occured). . . . . . . . . . . . . 193
8.11 SJT results after 5 mM TPDCOOH was applied with a spray gun to various
types of substrates, and cured with UV before the basecoat and clearcoat
were applied, cured and left for a 7 day post-cure. . . . . . . . . . . . . . . 195
8.12 SJT results after 5 mM TPDCOOH was applied with a spray gun to var-
ious types of substrates, and cured with UV at 2837 mJ cm−2, before the
basecoat and clearcoat were applied, cured and left for a 7 day post-cure. . 198
8.13 SJT results after 5 mM TPDCOOH was applied with a spray gun to var-
ious types of substrates, and cured with UV at 1278 mJ cm−2, before the
basecoat and clearcoat were applied, cured and left for a 7 day post-cure. . 198
8.14 Summary of the kinetic study from thermal and UV reactions of TPD,
TPDOH and TPDCOOH. . . . . . . . . . . . . . . . . . . . . . . . . . . . 204
8.15 (a) Working backwards, the 1:1 mole ratios for each step were used to
calculate the mass required of each step for synthesising the 2.7 g TPD
that was produced [*Assuming £1,870 per 1 kg (AnalR Normapur, VWR,
as of January 2014), **Assuming £112.00 per 100 g (ALFA (AESAR),
VWR, as of January 2014], (b) Estimating the cost on the basis of the
starting material (1) and the silver oxide required to generate TPD. It is
assumed in mass production that the solvent costs and other chemicals
used would be minimal. . . . . . . . . . . . . . . . . . . . . . . . . . . . . 219
8.16 Calorimeter results using Hazen-Farbzahl method (calibrated against H2O
= 0) for 3 mM TPD, TPDOH, and TPDCOOH in toluene after 1h reflux
and 1h UV (1 mW cm−2). Scale = 1 – 1000. . . . . . . . . . . . . . . . . . 220
8.17 Expected mass losses from the APs . . . . . . . . . . . . . . . . . . . . . . 223
xxxviii

8.18 Summary of DSC results. . . . . . . . . . . . . . . . . . . . . . . . . . . . . 224
8.19 The impact sensitivity results from each AP. . . . . . . . . . . . . . . . . . 225
9.1 ANOVA.F and p.kruskal values sorted list in order of decreasing discrimi-
nation (=relevance of xi) . . . . . . . . . . . . . . . . . . . . . . . . . . . . 238
xxxix

List of Terms and Abbreviations
AFM Atomic Force Microscopy
ANOVA Analysis of Variance
AP Adhesion Promoter
ATR-IR Attenuated Total Reflection Infrared Spectroscopy
CHT Cross Hatch Test
COC Cool-on-Column
CPO Chlorinated Polyolefin
DSC Differential Scanning Calorimetry
EDX Energy Dispersive X–ray Spectroscopy
ehc Emitter Heating Current
EPDM Ethylene-Propylene-Diene-Monomer
FD Field Desorption
FI Field Ionisation
GC Gas Chromatography
GC/MS Gas Chromatography/ Mass Spectrometry
HSP Hansen Solubility Parameters
ID Inside Diameter
IR Infrared Spectroscopy
xl

LIFDI Liquid Injection Field Desorption
MEK Methyl Ethyl Ketone
OD Outside Diameter
OW Owens-Wendt
PP Polypropylene
R/0 Polypropylene Research Substrate (0 % EPDM)
R/10 Polypropylene Research Substrate (10 % EPDM)
R/15 Polypropylene Research Substrate (15 % EPDM)
R/20 Polypropylene Research Substrate (20 % EPDM)
R/25 Polypropylene Research Substrate (25 % EPDM)
R/5 Polypropylene Research Substrate (5 % EPDM)
Ra Average Roughness
RED Relative Energy Difference
Rq Root Mean Square Roughness
SAM Self Assembled Monolayer
SEM Scanning Electron Microscopy
SJT Steam Jet Test
STD Standard Deviation
stepOLS stepwise Ordinary Least Squares
TEM Transmission Electron Microscopy
TGA Thermogravimetric Analysis
THF Tetrahydrofuran
ToF Time of Flight
ToF-SIMS Time of Flight Secondary Ion Mass Spectrometry
TPD 3-Phenyl-3-(trifluoromethyl)-3H-diazirine
TPDCOOH 4-[3-(Trifluoromethyl)-3H-diazirin-3-yl]benzoic Acid
xli

TPDOH 4-[3-(Trifluoromethyl)-3H-diazirin-3-yl]benzyl Alcohol
TPO Thermoplastic Polyolefins
TPO/0 Daplen EE103AE (0 % EPDM)
TPO/2 Sabic PP 108MF10 (2 % EPDM)
TPO/20 Sabic PP 95610 (20 % EPDM)
UV-Vis Ultraviolet-Visible Spectroscopy
XPS X-ray Photoelectron Spectroscopy
xlii

Part I
Introduction
1
Chapter 1
BUSINESS CASE
The automotive market today. A recent worldwide marketing study1 claimed that
in the year 2012, 11 - 14 % of a passenger vehicle was constructed from plastic. Replacing
steel components of cars with plastic benefits both the consumer and the manufacturer
with a lighter weight vehicle gaining a greater fuel economy and reduced carbon emissions
(as required by EU regulations). According to this study, the global automotive plastics
consumption is expected to grow at a compound annual growth rate of 8.5 % from 6.7
million tons in 2011 to 10.2 million tons in 2016.
The industrial sponsors of this EngD project were BASF SE and BASF Coatings
GmbH. The BASF group is divided into different divisions, with coatings accounting for
4 % of the sales in 2012, as shown in Figure 1.1. BASF is a leading player in coatings, and
due to the increasing volatile organic compound (VOC) regulations worldwide, they look
to pioneer waterborne technology, which was used in this study. Figure 1.2 highlights the
benefits of using waterborne coatings which is estimated to reduce the VOC content of
conventional coatings by up to 66 %.2
This study combines the use of both waterborne coatings and plastic components of
cars used in the industry today.
2

€72.1
billion
Oil & Gas
18%
Coatings
4%
Functional Materials
& Solutions
24%
Performance
Products
22%
Ag. Solutions
6%
Chemicals
25% Other
5%
Figure 1.1: The different divisions of BASF. Adapted from a public presentation fromBASF Investor Day Automotive, September 2012.2
VOC* in kg/car (average)
8.4 2.8
-66%
Conventional
coatings process
Waterborne
coatings process
Waterborne coatings process reduces VOC by 66 %
Figure 1.2: A diagram highlighting the reduction of VOC by using waterborne coatings.Adapted from a public presentation from BASF Investor Day Automotive, September2012.2
3

1.1 Adhesion Challenge: Coating Plastic
The replacement of steel by plastic components of vehicles created a unique challenge for
paint formulators.3 Polypropylene (PP) is the most widely used plastic in the automotive
industry, accounting for 37 % of the global consumption of automotive plastics in 2013.4
PP is non-polar and has a low surface energy whereas a polar waterborne basecoat has
a high surface energy, particularly of the polar component, as can be seen in Figure 1.3.
The schematic diagram emphasises the mismatch in polar surface energy, which is one
reason for the poor adhesion observed when a waterborne basecoat is applied and cured
directly to an untreated PP substrate (as shown in the photograph).
One current state of art used in the industry today is the use of a flaming step. It
partially oxidises the PP surface, increasing the polar surface energy as seen in Figure 1.3,
which then more closely matches to the polar surface energy of the waterborne basecoat.
This allows for good wetting of the surface by the basecoat, and good adhesion is achieved.5
The disadvantage of the flame pre-treatment is the added costs to the production line.
Other oxidative methods also exist, such as plasma treatments.
An alternative state of the art is the use of chlorinated polyolefin (CPO) adhesion
promoters (APs), which adhere to both the PP-based substrate surface and to the applied
basecoat. The disadvantage of the use of CPOs is the fact that both the chlorinated
products and the organic solvents used are undesirable from an environmental point of
view.6 Therefore, alternative, cost effective APs are sought.
1.2 Project Goal
The goal of this study was to develop novel APs to improve the adhesion of waterborne
basecoats and topcoat systems to plastic components of vehicles, such as car bumpers.
Rather than creating a new production process for the car components, it was in
BASF’s interest to develop an integrated process that utilised the current production
4
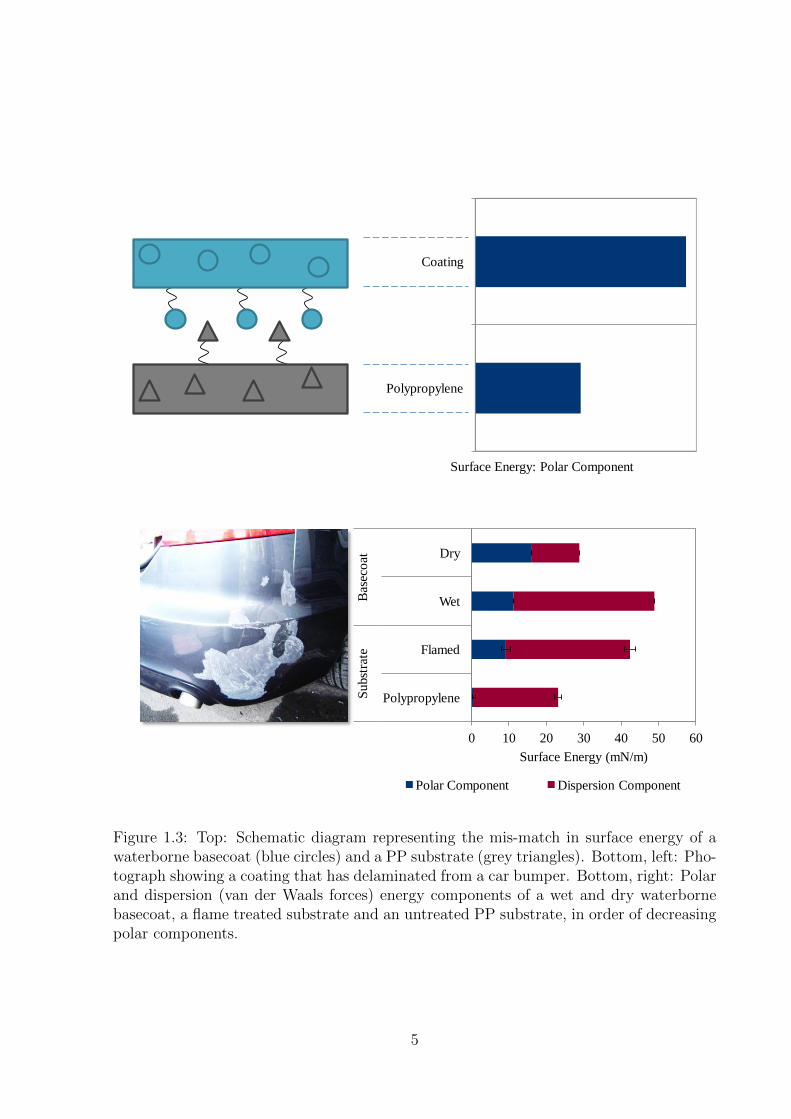
Polypropylene
Coating
Surface Energy: Polar Component
0 10 20 30 40 50 60
Polypropylene
Flamed
Wet
Dry
Subst
rate
B
asec
oat
Surface Energy (mN/m)
Polar Component Dispersion Component
Figure 1.3: Top: Schematic diagram representing the mis-match in surface energy of awaterborne basecoat (blue circles) and a PP substrate (grey triangles). Bottom, left: Pho-tograph showing a coating that has delaminated from a car bumper. Bottom, right: Polarand dispersion (van der Waals forces) energy components of a wet and dry waterbornebasecoat, a flame treated substrate and an untreated PP substrate, in order of decreasingpolar components.
5

line, as shown in Figure 1.4, where step 1 schematically represents the current production
line implemented in industry and step 2 represents the overall goal: an integrated system
to reduce the number of steps in the production line from three / four (depending if a
primer is used) to just two. The coatings division is a leader in integrating processes
which reduce the total energy consumption in car production. This saves the company
time and money. It is estimated that an integrated process can save up to 17 % of
the total energy required for car production.2 Therefore, the APs were to be developed
without altering the coatings process already implemented. Hence, the ultimate goal of
this overall objective would be to formulate the AP into the existing basecoat. However,
the practical goal of this study was to identify potential APs, before testing the adhesion
of the AP to the substrate and to the basecoat, as shown in Figure 1.5. This meant the
AP was applied as a primer for the initial adhesion and suitability tests.
Flaming +Primer Cure
(10 min) +BC
Cure
(10 min) +CC
Cure
(30 min)
2. Remove from production line & formulate into basecoat
BC + AP Cure
(10 min) +CC
Cure
(30 min)
1. Develop a new adhesion promoter (AP)
Figure 1.4: A schematic diagram representing (1.) the production line used in industrytoday and (2.) the overall goal / vision of the paint formulators. Brackets indicate thata primer is not always used. BC = basecoat, CC= clearcoat or topcoat.
1
Identify candidate APs
2
Test adhesion to substrate
3
Test adhesion to basecoat
4
Formulate into basecoat
Figure 1.5: The overall objective of the project.
6

Chapter 2
LITERATURE REVIEW
2.1 The Phenomena of Adhesion
ADHESION
Dispersive
Mechanical
Diffusive
Chemical
Electrostatic
Figure 2.1: Types of adhesive interactions.
7

2.1.1 Definition
Adhesion is a complex field.7–13 The Academic Press Dictionary of Science and Technology
defines adhesion as ”the sticking together of two surfaces in contact”.14
The thermodynamic definition of adhesion, shown in Equation 2.115 (WA = work of
adhesion, γS1 = surface free energy of material 1 (e.g. substrate), γS2 = surface free
energy of material 2 (e.g. film), γS1S2 = interfacial free energy) signifies the change in
free energy when an interface is formed or separated to infinity. It is related to all of the
interfacial intermolecular interactions between the contacting materials.16–18
Alternatively for liquid coatings, WA can be determined by the Young-Dupre Equation
2.219–21 (γLV = surface free energy of the liquid, θ = contact angle of liquid coating on
the substrate).
However, in reality many factors influence adhesion (see Figure 2.1), which affect the
value of WA. Therefore, the definition of WA cannot be used as described, because the
calculation is difficult as the various parameters of the phenomena affecting the adhesion
are not known.16–18,22 Therefore, the different techniques used to measure adhesion, such
as the cross hatch test (CHT) and the steam jet test (SJT), have been described by Mittal
et al.16 as measuring practical adhesion, which is a function of the work of adhesion plus
the other influential factors (Equation 2.3).
WA = γS1 + γS2 − γS1S2 (2.1)
WA = γLV + (1 + cosθ) (2.2)
Practical Adhesion = f(WA, other factors) (2.3)
8

2.1.2 Wettability
The wettability of a liquid on a substrate (described in Section 4.6) depends on the surface
energy or surface tension difference. An assessment can be made using contact angle
measurements.23 Derived from the Young-Dupre equation,15 an equilibrium of surface
tensions can be described by Equation 2.4, where ∆γ = wettability, γSG = surface tension
at the solid / gas interface and γSL = surface tension at the solid / liquid interface.
The wettability of a coating on a substrate surface is important to ensure the maximum
interaction between the coating and the substrate (this is also affected by the coating
viscosity which must be low enough for spreading), thus producing the best adhesion.24
∆γ = γSG − γSL (2.4)
2.1.3 Adhesion Mechanisms
Several types of adhesion mechanisms are possible, as shown in Figure 2.1.25
Diffusive adhesion can occur when two polymers penetrate into one another so that
polymer chain entanglement occurs, creating an interlocking mechanism.26 An analogy of
this is spaghetti, where the mixing of the strands improves the strength and increases the
force to pull them apart due to the entanglement. This type of adhesion mechanism has
been suggested for a CPO AP on a thermoplastic polyolefin (TPO) substrate (although
it is a speculative topic in research27), when it was found that the diffusion of a CPO
into the substrate lead to inter-chain entanglement which caused the improved adhesion
without any chemical bonding.28–30
Mechanical adhesion is similar but on a larger scale, taking into account the sur-
face porosity and roughness which can effect the adhesive properties.31 An analogy to
this mechanism is velcro, in which the small features significantly increase the surface
roughness, and greater adhesion is obtained. This type of adhesion mechanism has been
observed on a plasma treated PP surface. The impact of gaseous species with the PP
9

surface caused by the plasma etching increases the surface roughness which induces a
greater surface wettability, thus adhesion is improved.32
Dispersive adhesion takes into account van der Waals forces, which is observed in
nature on a gecko’s foot. The foot has small features known as setae which are arranged
in lamellae. Each small feature is hair-like, which creates a significantly large surface
area. Therefore, the low attraction force of van der Waals is vastly multiplied, creating
high adhesive forces, hence their ability to stand vertical on glass.33,34 Many current
research areas focus on bio-inspired adhesion mechanisms. The gecko is no exception,
with the creation of surfaces based on a gecko’s foot.35–37 A group from The University
of Massachusetts Amherst have developed an adhesive pad called GeckskinTM
, which is
claimed to hold up to 700 pounds.38
Chemical adhesion is achieved by interactions between two surfaces such as forming a
covalent bond or hydrogen bonding. An example is epoxy resins which are often used in the
food packaging industry.39 They can form ester bond linkages with polymer substrates.
Furthermore, grafting of a PP surface has also been studied, to create a new covalent bond
between a functional molecule and the PP surface. For example, the grafting of maleic
anhydride to PP significantly improves the adhesion and hydrophilicity of the substrate
surface.40
Electrostatic adhesion is the final type of adhesion described. This is when charge
transfer occurs between the mobile phase and the substrate surface, so that they are held
together by the attractive opposite charges. Such adhesion mechanisms occur between
surfaces and toner particles during electrophotography (a printing technique).41
2.2 Why Replace Steel with Plastic?
Car bumpers are important in the protection of vehicles in low speed collisions. They
can be aesthetically pleasing and offer advantages to both the designers and the drivers.
Despite the low paintability, car bumpers made of plastic have many advantages over the
10

traditional steel:3,42
• Reduced costs
• Weight reduction (greater fuel economy)
• Improved vehicle safety
• Styling potential
• Reduced maintenance
• Corrosion resistance
• Recyclability
2.2.1 Thermoplastic Polyolefins (TPO)
PP is a widely used semi-crystalline thermoplastic with excellent processability properties
but poor impact strength.43 To improve the impact strength and toughness of PP for
industrial use, blends of PP are created known as TPO substrates in North America,
or PP-ethylene-propylene-diene-monomer (EPDM) or ethylene propylene rubber (EPR)
in Europe and Asia (it is referred to as TPO during this study). TPO substrates are a
family of blends of isotactic PP containing elastomers such as EPDM rubber, as well as
additional fillers and additives such as thermal and process stabilisers, ultraviolet (UV)
stabilisers and pigments.44,45 Also several fillers may be used such as glass fibres, lime,
talc, carbon black and pigments. Different grades have different characteristic properties
such as Young’s modulus, Izod impact strength test (standard method) and density.
For car bumpers, the main requirements are high flow (for injection moulding), good
dimension stability (retain shape), high resistance to UV radiation (prevent degradation
by sun light), high impact strength at low temperatures (important in the case of an
accident) and good paintability (this being the most challenging property). Fiat and
Citroen first started using TPO for flexible bumper covers in the mid 1970s.46 Their
11
light weight, low cost, good mechanical properties, recyclabilty and ease of moulding
into complex shapes means they have become an increasingly popular alternative to steel
for automotive applications such as car bumpers. TPOs are commonly blended in a
high-speed mixer or a twin-screw extruder, and the parts are fabricated by injection
moulding.3,44,47
The adhesion of coatings to a TPO car bumper is not only important for the manufac-
turer who wants a reputation for good quality products, as well as lower production costs
and various regulations to be met, but it is also important for the consumer who does not
want a car bumper to be easily damaged during a light collision or due to environmental
exposure. The consumer also wants a vehicle which is aesthetically pleasing. Therefore,
state of the art techniques exist to improve the adhesion of coatings to TPO components
of cars, such as the car bumper.3
2.3 The State of the Art
2.3.1 Flaming Pre-treatment
Flame treatment is the most widely used technique in the industry to accomplish paint
adhesion to TPO parts in Europe. The process oxidises a thin layer of the surface of
the PP substrate in a controlled manner, forming oxygen containing chemical groups
on the surface which undergo cross-linking and chain scission.44 Therefore, adhesion to
a flamed substrate involves short-range interactions with the chemical groups found at
the surface.48 ESCA (Electron spectroscopy for chemical analysis, also known as X-ray
photoelectron spectroscopy (XPS)) has shown that the depth of oxidation for typical
flame treatments is 5 -10 nm,49 although it depends on the flame parameters used.
The technique has many advantages over other oxidative techniques such as corona
discharge: reliability, efficiency, ease of operation, energy consumption, equipment space
requirements, the ability to achieve great wettability without a significant loss of treatment
with ageing, and very importantly no generation of toxic, corrosive ozone.49 It is also the
12

preferred method for treating three-dimensional shapes over corona treatment.50
However, flaming can be a very complex technique due to several different chemical
groups forming on the surface during the treatment. Furthermore, it has been observed
that other modified PP surfaces containing the same amount of oxygen exhibited different
adhesive properties. This implies that the surface chemistry is a very important factor
and that it is indeed the chemical nature of the functional groups found at the surface
that is important for adhesion rather than the amount of oxygen on the surface.48
Several studies that have looked into the adhesion mechanism of functionalised sub-
strates have found that hydrogen bonding occurring with OH groups at the surface is a
key factor to the improvement of adhesion.48,51–56 Sheng et al.57,58 estimated that ap-
proximately (∼) 20 - 30 % of the oxygen added to a PP surface could be in the form
of hydroxyl species. Furthermore, secondary ion mass spectrometry (SIMS) studies have
shown that chemical bonds involving double bonds (for example in EPDM) are created
by the flame treatment, thus EPDM may facilitate the adhesion.59,60
2.3.2 Chlorinated Polyolefin Adhesion Promoters
Chlorinated polyolefins are an alternative treatment to a flame pre-treatment.61,62 They
are a type of AP that are used around the world, with the exception of Europe where
EU regulations forbid their use.6,63 They are most common in North America, where
they are usually applied to the substrate surface as a primer before coating. The CPO
thin film increases the surface free energy which promotes adhesion to the coatings.29
Although there are many types of CPO APs available, it is believed anchoring into the
TPO substrate surface is the dominant adhesion mechanism.45,64 Although the use of a
CPO requires an additional coating layer to be applied, it is the method of choice for
North America because of its flexibility for diverse applications and types of TPOs and
topcoats it can be used with.63 Figure 2.2 shows the process of how a CPO can be applied
to a TPO substrate and cured.
As well as a physical entanglement adhesion mechanism between the CPO and the
13

CPO:
Sprayed onto TPO surface
(about 7.5 µm thick)
Bake:
Aids the diffusion of the solvent-borne CPO into the
TPO
Molecular entanglement:
CPO + EPDM in TPO
substrate
Surface energy increased:
Good adhesion obtained
Figure 2.2: An example of an application process of a CPO primer.29
substrate, a chemical adhesion mechanism has also been proposed.63,65 The mechanism in
shown in Figure 2.3. It was proposed that the topcoat H-bonds to the CPO. Furthermore,
non-polar interactions also occur at the CPO/TPO interface between the aliphatic parts
of the two layers. The chlorides in the CPO are unstable when the system is heated to high
temperatures during curing of the coatings, and a weak base from the topcoat diffuses
into the CPO and catalyses the elimination of HCl from the CPO (dehydrohalogenation),
resulting in the formation of alkenes in the CPO layer. Esters and carboxylic acids can
also be formed in the CPO layer by the attack of the anhydride in the CPO from an
OH in the topcoat. In the mechanism shown, the system lost one H-bond but gained
a covalent ester linkage and at least two more H-bonds from the new carboxylic acid in
the CPO. Other interactions include π − π interactions between EPDM in the TPO and
alkenes in the CPO. All these interactions collectively result in better adhesion for the
entire system.
2.4 Influence of the Substrate Microstructure on Ad-
hesion Mechanisms
2.4.1 Microstructure of Injection Moulded TPO
Research by Ryntz et al.29,30,45,64,66–68 in the last two decades has focused on understand-
ing the relationship between the morphology of TPO and the adhesion performance by
14

Δ
80 °C
HCl
Figure 2.3: Proposed chemical mechanism for adhesion between a TPO (with EPDM),CPO and a topcoat.63,65
15

CPO APs. The microstructure and morphology of an injection moulded TPO is schemat-
ically represented in Figure 2.4. A series of techniques such as differential scanning
calorimetry (DSC), X-ray microfocus fluoroscopy and differential interference contrast
(DIC) microscopy were utilised by Ryntz et al.45,64 to assess the TPO blend morphology.
Due to the shearing forces and thermal gradients induced in the melt as a TPO is injected
into a mould, the crystallinity of the PP varies at the surface relative to the bulk. Non-
ideal nucleation of the PP occurs at the surface due to rapid cooling as it encounters the
low temperature mould. This results in a thin trans-crystalline PP region at the surface
which is phase separated by the elastomer. The PP nucleates in more ideal conditions
under the trans-crystalline layer, resulting in a thick layer of large PP spherulite crystals.
The next layer is elastomer-rich, containing EPDM domains. These domains are found to
be elliptical nearer the surface, with the long axis of domains following the flow direction
of the TPO melt. Below the elastomer-rich region, the bulk TPO dominates in which
globular shaped EPDM domains are inter-dispersed in the bulk PP matrix. The TPO
surface morphology is shown to be highly dependent on the manufacturing process pa-
rameters such as temperature, flow rate, injection pressure, mould geometry and mould
temperature, which in turn, influence the adhesive properties of an AP applied to the
surface.67,68
Cross-section
Heterogeneous Spherical
EPDM Domains
Polypropylene Matrix
PP Rich Surface
EPDM Rich Sub-Surface
Bulk Composite
Elliptical EPDM
Domains
Figure 2.4: Three-dimensional schematic (generalised) representation of the TPO mi-crostructure and surface morphology. Adapted from Ryntz et al.29,30,45,64,66–68
16

2.4.2 Influence of TPO Microstructure on Adhesion
Although the specific mechanism of how CPOs promote adhesion is unknown, it is often
speculated in the literature that the presence of the EPDM elastomer not only improves
the impact strength of the TPO substrates, but it also aids the improvement of the
adhesion. It is therefore important that the EPDM-rich layers lay close to the surface,
as it is believed that this sub-surface region accounts for the paintability of TPO when
using CPO APs. When an AP is able to swell and diffuse into the PP surface to improve
adhesion via molecular chain entanglement, the surface composition such as crystallinity,
depth of the EPDM sub-surface layer and thickness of the different sub-surface regions,
have a significant impact on the ability of the AP to improve the paintability of the
surface.3,45,64 For example, a highly crystalline layer of PP would tend to retard diffusion
and therefore result in poor adhesion. In contrast, an amorphous PP layer would tend to
permit swelling and aid diffusion of the AP and solvents into the EPDM-rich phase, thus
improving adhesion by allowing for mechanical interlocking.
The distribution of the EPDM-rich sub-surface layer may also play a vital role in
the cohesive strength of the painted TPO substrate. It is important to gain the correct
balance between TPO swelling and cohesive integrity. Therefore, solvents which swell the
TPO, but evaporate soon after application and allow the EPDM to de-swell, are likely
to achieve better adhesion results.27,45,62,64,69–71 Contrary to this hypothesis, Schuman et
al. discovered that the ability of a solvent to swell the TPO substrate was not as well
correlated to adhesion, as was the ability of the solvent to change the surface roughness of
the substrate. The improvement in adhesion is likely to be due to the large surface area
of the rougher surfaces, thus increasing the interfacial contact between the CPO and the
TPO.27
It is difficult to predict the improvement of adhesion using a diffusion model of a CPO
due to the heterogeneous nature of TPO substrates. As well as solvent swelling, it has
been shown that baking the CPO on the TPO substrates above room temperature also
17

improved adhesion by promoting diffusion and mechanical interlocking of the CPO into
the EPDM regions of the TPO.72,73 However, the diffusion length scale was a function of
the local TPO structure, CPO structure and solvent, thus not the temperature alone.3,73
For added complication, significant correlations between the adhesion properties of a CPO,
the solvent used and the top-coat toughness have also been demonstrated.74 Adhesion
is therefore a function of the total system attributes (the substrate characteristics, the
CPO, the applied basecoat and top coat), rather than an individual factor.
Unpublished results from BASF Coatings have demonstrated an improvement of ad-
hesion with the presence of EPDM in TPOs, when using a flaming pre-treatment.75 It is
thought that the oxidation effect of the flaming pretreatment reaches the depths of the
EPDM-rich subsurface and is more easily able to break double bonds within the EPDM
structure, increasing the number of oxygen containing species on the TPO surface. This
increases the polar surface energy and thus, compatibility with a waterborne basecoat.
Therefore, adhesion is greater on a TPO substrate compared to a pure PP substrate.
2.5 Characterisation of Adhesion
2.5.1 Peel Tests
Peel tests are a common industrially relevant method to assess the adhesion of a coating
to a surface.76–82 Adhesive tape is applied onto the surface of the substrate, pressure
is applied, and either the force required to delaminate the coating from the surface is
measured or the force is at a set value and the degree of delamination is assessed.
For example, Peel tests have been used to assess the adhesion strength of a plasma
treated substrate, where it was found that a treatment of less than one minute resulted
in a decrease of the adhesion but treatments of greater than one minute resulted in an
increase of adhesion with time.79
Although peel tests are a popular method to measure adhesion, many problems exist
and data analysis can be complex. Firstly, the test can cause cohesive failure within the
18

substrate, therefore, the force that is measured is not only the force required to delaminate
the coating. Secondly, a significant amount of energy is dissipated during the bending
of the peel tape, making the comparison of different measurements difficult (the energy
dissipated would have to be the same each time). Lastly, the type of tape that is used
can influence the adhesion results obtained.83,84
2.5.2 Cross-Hatch Test
In contrast to the peel test, the CHT85 is a simple empirical test which can be used
qualitatively to assess the adhesion of coated substrates.86 According to the German
standard ISO2409: a bladed knife is scored into the coated surface in one direction, and
again in the perpendicular direction, as shown in Figure 2.5(a). An adhesive tape is then
applied to the grid formed on the surface, and the tape is pulled with a standardised
force. The number of squares delaminated is calculated to a percentage, and a grade is
determined (0 = 100 % adhesion and 5 = 0 % adhesion).
The test has previously been used to assess the adhesion of coated substrates after
they had been exposed to petroleum, depending on the topcoat type used and the location
that the substrate sample had been released from the injection mould. The adhesion of
the areas closer to the edge of the injection mould with topcoats of lower glass transition
temperatures gave better adhesion due to the lower penetration of petroleum.67
The test has the advantage that it is quick to perform and acts as a good preliminary
test to assess the adhesion with many samples. Furthermore, the forces applied are
lower than that of the peel test, thus cohesive failure of the substrate is less likely to
occur. However, this can be checked using surface sensitive techniques such as time-of-
flight secondary ion mass spectrometry (ToF-SIMS) or XPS to measure the delaminated
surfaces.70
19

2.5.3 Steam Jet Test
A steam jet test is often used in the automotive industry as a more vigorous, yet also
qualitative, adhesion test. The parameters used for the test are chosen by the customer.
In the cases when good adhesion is achieved with cross-hatch tests, further tests with the
steam jet are often performed. The high temperature and high pressured steam is designed
to mimic a car wash to assess how well the coatings would withstand the conditions.87
To perform the test, a knife is used to score the surface in two diagonals (called Andreas
Cross) on a rectangular substrate, as shown in Figure 2.5(b). The steam is then applied
to the pre-damaged area, and the amount of delamination of the coating is assessed to
give a grade (0 = 100 % adhesion and 5 = 0 % adhesion).87
A comparative steam jet test study of the adhesive performance of untreated and
treated TPO substrates subjected to a flame and plasma pre-treatment showed that the
treated substrates gave the better adhesion.88
(a)
(b)
Figure 2.5: A photograph of substrates after (a) a CHT test (100 % adhesion) and (b) aSJT (40 % adhesion).
2.5.4 Surface Characterisation
Many surface sensitive techniques have been used to investigate the adhesive properties or
mechanisms of coated substrates.7,10,48,89–93 These include ToF-SIMS, XPS, atomic force
20

microscopy (AFM), scanning electron microscopy (SEM) and attenuated total reflection
infrared spectroscopy (ATR-IR) to characterise polarity and chemical composition, as well
as using contact angles to calculate the surface energy. Other mechanical property mea-
surements include interferometry to measure the surface roughness and nano-indentation
to measure a substrate’s hardness or Young’s modulus.
ToF-SIMS and XPS The techniques, ToF-SIMS and XPS, are often used together
to complement one-another for the chemical characterisation of a surface. They both
have advantages and disadvantages. ToF-SIMS is a technique that measures the mass of
fragments from a sample surface, generated by an ion source. It is a qualitative technique
due the so-called matrix effect, which is when the ionisation yield (shown in Equation 2.5
where Im = secondary ion current of species m, Ip = primary flux, Ym = sputter yield, α+
= ionisation probability to positive ions, θm = fractional concentration of the chemistry
m in the surface layer and η = transmission of the analysis system) is dependent on the
chemical nature of the sample being analysed.94 However, an advantage that ToF-SIMS
has over XPS is that the sampling depth is much smaller, approximately the first 1 - 3
atomic layers (∼ 10 A) compared to ∼30 - 100 A for XPS.95 Therefore, ToF-SIMS is a true
representation of the surface. However, this can be a disadvantage when contaminants
are present at the surface. An advantage of XPS is that it is a quantitative technique. It
involves the irradiation of a sample with X-rays of a characteristic energy and it measures
the flux of ejected (secondary) electrons from the sample surface. Each element has a
characteristic binding energy, therefore, the chemical composition of a surface can be
determined, using Equation 2.696 (where Ekinetic = kinetic energy of the photoelectron, h
= Planck’s constant , ν = frequency of the radiation (hν = energy of photon), Ebinding =
binding energy of the photoelectron , Φspectrometer = work function of the spectrometer).
Im = IpYmα+θmη (2.5)
21

Ekinetic = hν − Ebinding − Φspectrometer (2.6)
Both techniques have been used to investigate adhesion mechanisms as well as investi-
gating the location of the locus of failures when delamination occurs. Through extensively
researching the capabilities of ToF-SIMS and XPS in adhesion research, Watts et al. have
demonstrated the ability to investigate polymer interfaces buried below the surface of
a substrate using a low angle tapered section,97 the ability to look at adhesive failure
between two surfaces at a joint,98 and the ability to characterise the adhesion of various
APs on aluminium surfaces.99–101
Furthermore, Garbassi et al.102 have used ToF-SIMS and XPS to characterise the
adhesive behaviour of a flame pre-treatment. It was found that the depth of oxidation
increased as the number of flame treatments increased. They characterised the change by
monitoring the formation of polar groups using XPS,103 as well as the change in surface
chemistry with depth using ToF-SIMS analysis.
Clemens et al. used ToF-SIMS and XPS to study the mode of failures that occurred
between a coating and a substrate on which a CPO primer had been applied.70 In all
cases, the quantitative data acquired using XPS was complemented by the qualitative
data acquired using ToF-SIMS.
2.5.5 Substrate Characterisation
One method that has previously been used to differentiate EPDM from the PP matrix is
the use of OsO4 and RuO4 to stain the EPDM so that it is visible in SEM or transmis-
sion electron microscopy (TEM): techniques which show surface morphology.44,62,104–110
Energy dispersive X–ray spectroscopy (EDX) is an analytical technique used for elemen-
tal analysis that can be used in conjunction with SEM and TEM, to verify which areas
contain the heavy metals (Os or Ru),111 and hence identify the EPDM domains.
ToF-SIMS can be used to identify additives present at the polymer surfaces such as
22

Irgafos 168 (BASF R©) and Irganox 1010 (BASF R©), which are often added to TPOs as
antioxidants.112,113
Mechanical characterisation of the substrates has been previously achieved with nano-
indentation to determine the Young’s modulus and hardness.114 As previously mentioned,
the hardness of a substrate may determine if an AP is able to penetrate and mechanically
interlock into the substrate surface.
For calculating surface energy, the Owens-Wendt theory is often used. For example,
an increase in the polar contribution of flamed TPO substrates occurs after a flame pre-
treatment. After the flaming, the TPO surface energy closer matches the surface energy
of the basecoat, enabling improved wetting of the basecoat on the substrate surface, thus
improving adhesion.115
The surface roughness of a TPO substrate also plays an important role in the adhesion
of an applied coating, as previously mentioned.27 Rougher surfaces enable a greater
contact area between the basecoat and the substrate, which may increase any adhesion
interactions or reactions occuring. White light interferometry was used in this study
to investigate the surface roughness of the different substrates, link the results to the
substrate composition, and predict any influences on adhesion.
2.6 Other Adhesion Improvement Methods
2.6.1 Oxidative Methods
As previously mentioned, plasma116 treatment can be used as an alternative oxidation
method to the state of the art flame pre-treatment. Other methods used to improve
adhesion to non-polar polymer surfaces include, corona discharge,117,118 UV radiation119
and chemical oxidation.120,121
Plasma is created when an electric field is applied to a gas, and positively charged
(ionised) atoms and detached electrons are generated, creating a charged gas that is able
to conduct electricity due to the movement of the charges. Corona is a type of plasma
23

generated when a voltage is applied to two electrodes separated by air. The oxygen
in the air generates ozone, therefore, this technique can be considered environmentally
unfriendly. It is thought that the high energy of the charged electrical corona is able
to break bonds at a substrate surface, which then recombine with free radicals from
the corona creating polar groups at the surface. The surface energy and wettability
of the surface is then increased which improves the adhesion to polar coatings. For
plasma treatment, the gases are injected into the corona discharge to modify the chemical
composition of the corona plasma which changes the reaction with the substrate.122
Another way to oxidise a PP surface is the use of UV treatment. It has been studied
in air with and without the presence of ozone. The oxygen content at the surface was
found to be the same as would be achieved by corona treatment, and the contact angle
(see Section 4.6) decreased to near 0 ◦ (water was wetting the surface).123
A disadvantage of using oxidative methods to improve adhesion is the ageing effect,
where the hydrophilicity at the surface decreases over time. Therefore, the coating must
be applied soon after the treatment due to the short life time of the radical species
generated. Furthermore, non-uniform coverage can sometime occur which often leads to
cohesive failure near the surface of the TPO.70
2.6.2 Block Copolymers as Adhesion Promoters
Blockcopolymers are often used as adhesion promoters to join together hydrophobic and
hydrophilic surfaces, as shown in Figure 2.6.
Hydrophilic Polymer
Hydrophobic Polymer
Block A/B Copolymer
Figure 2.6: A schematic diagram showing a block copolymer adhering a hydrophobic andhydrophilic polymer together.
24

It has been shown that controlling polymer properties enables the achievement of good
adhesion to untreated PP substrates.124,125 Figure 2.7 shows an example of three different
types of polymer blend that were tested for their effect on the adhesion of waterborne
coatings to untreated PP surfaces. Only the block copolymer of an acrylic acid (AA)
and a block of isobornyl acrylate polymer (iBOA), with a butyl methacrylate (BMA) and
butyl acrylate (BA) polymer, showed good adhesive properties, where a cross-hatch test
of 0 (100 % adhesion) was achieved. The single phase or inverse phase shell morphologies
shown were found to give poor adhesion. The first block copolymer showed the best
adhesive properties because the first block polymer (AA and iBOA) which was the AP,
was very brittle in nature and any mechanical forces resulted in the loss of the adhesion
property of the polymer. By co-polymerising it with the second block polymer (BMA /
BA), which had a much lower glass transition temperature, it allowed for flexibility which
retained the adhesion property. It was thought that the kinetics of the reactions were
another reason for the adhesion differences observed. In the first system, the hydrophobic
adhering blocks were able to diffuse through the acid to the surface. For the other two
structures, the adhering blocks were buried and not able to diffuse to the surface in time
to create an improved adhesion. Thus, the kinetics and the tailoring of an AP system are
important factors to consider when designing new adhesive systems.
AA-block-iBOA BMA/BA/iBOA/AA BMA/BA/AA-iBOA/AA
Block Polymer Single Phase Inverse Phase
BMA/BA
iBOA
AA
BMA/BA/AA
iBOA/AA
Figure 2.7: The polymers tested for improved adhesion on PP, adapted by Overbeek.124
2.6.3 Grafting
2.6.3.1 Maleic Anhydride (MA)
In this study, the term graft refers to the bonding of an AP to a substrate surface.
25
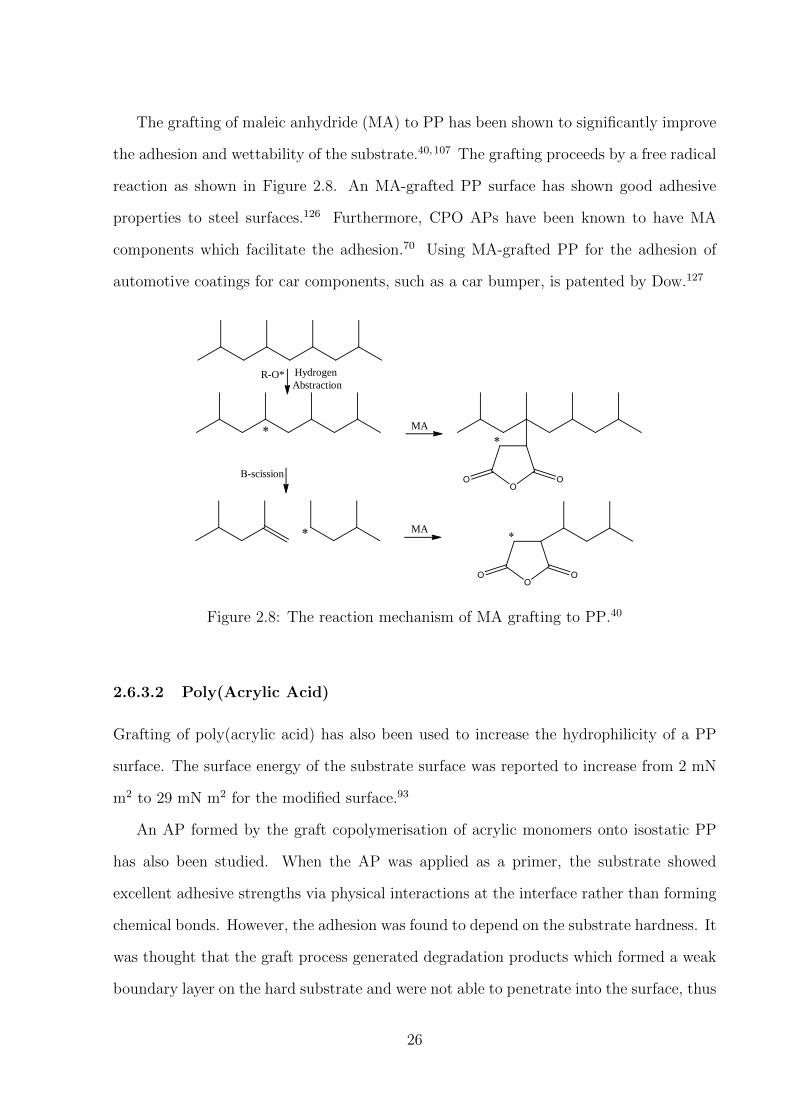
The grafting of maleic anhydride (MA) to PP has been shown to significantly improve
the adhesion and wettability of the substrate.40,107 The grafting proceeds by a free radical
reaction as shown in Figure 2.8. An MA-grafted PP surface has shown good adhesive
properties to steel surfaces.126 Furthermore, CPO APs have been known to have MA
components which facilitate the adhesion.70 Using MA-grafted PP for the adhesion of
automotive coatings for car components, such as a car bumper, is patented by Dow.127
Hydrogen
Abstraction R-O*
Β-scission
MA
MA
Figure 2.8: The reaction mechanism of MA grafting to PP.40
2.6.3.2 Poly(Acrylic Acid)
Grafting of poly(acrylic acid) has also been used to increase the hydrophilicity of a PP
surface. The surface energy of the substrate surface was reported to increase from 2 mN
m2 to 29 mN m2 for the modified surface.93
An AP formed by the graft copolymerisation of acrylic monomers onto isostatic PP
has also been studied. When the AP was applied as a primer, the substrate showed
excellent adhesive strengths via physical interactions at the interface rather than forming
chemical bonds. However, the adhesion was found to depend on the substrate hardness. It
was thought that the graft process generated degradation products which formed a weak
boundary layer on the hard substrate and were not able to penetrate into the surface, thus
26

causing adhesive failure. In contrast, it was thought that the degradation products may
have penetrated into the softer substrate so no boundary layer was present, thus leading
to improved adhesion.107
2.6.4 Chemical Etching
Another technique which has previoulsy been researched and patented is the technique
of chemical etching with 1,1,1-trichloroethane (TCE).128–131 It is believed that TCE has
several roles during the adhesion improvement process: firstly it degreases the TPO car
bumper which removes any weak boundary layers which could cause adhesive failure,
secondly it etches the surface which extensively roughens the surface and thirdly it swells
the TPO.
2.6.5 Novel Surface Treatement
A recent study revealed a new surface treatment called Accelerated Thermo-molecular
adhesion Process (ATmaP). The technique grafts functional groups to the PP surface de-
rived from an atomised and vaporised nitrogen-containing coupling agent. It is a modified
flame treatment where nitrogen functional groups are generated by passing a stream of
n-methylpyrrolidone solution through the burner with the gas mixture. The adhesion of
the surface was found to significantly improve to a magnitude comparable to the conven-
tional flame pre-treatment. ToF-SIMS and XPS analysis revealed the treatment resulted
in chain scission, reactions with the air and the grafting of NO functional groups at the
substrate surface.132
27
2.7 Unsuccessful Adhesion Techniques
2.7.1 Chemical Bonding by Catalytic Oxidation of Inactivated
C-H Bonds
The functionalisation of TPO substrates by a catalyst medium comprising of pyridine,
acetic acid, hydrogen peroxide with iron(III) chloride hexahydrate, did not significantly
improve adhesion, despite a significant accumulation of OH groups at the surface (verified
by XPS) and a significant increase in the surface roughness. It was thought the method
degraded the surface which created a weak boundary layer and hindered the adhesion.107
2.7.2 C-H insertion of Nitrene
An azido based organic solution was applied to a TPO substrate in its pure form and cured
with UV. It was predicted that the decomposition of the azido group (R-N=N+=N−)
would afford a nitrene (analogous to a carbene) which could C-H insert into the PP
surface. However, no improvement was observed. It was thought that the nitrene group
had reacted with other components found at the surface, because it was not orientated
towards the non-polar PP, and that the lifetime of the nitrenes was not long enough for
reorientation to occur.107
2.8 Current Patents based on Adhesion Promoters
for Plastics
The most recent patents report waterborne coating compositions for promoting adhesion
to plastic surfaces. Uses of functionalised homopolymers or copolymers having a single
unsaturation, a terminal succinic anhydride moiety and additional succinic anhydride
substitutions on the PP backbone have been reported.133 A CPO-containing a thermally
curable waterborne coating formulation has also been reported, containing one urethane
28

acrylic hybrid resin in a correct balance with water.134
2.9 Diazirines as Potential Adhesion Promoters
Diazirines are precursors of carbenes which are known to be capable of C-H insertion
reactions. They have the advantage that they are stable to store and safer to work
with compared to their analogous linear isomers, diazo compounds.135 Upon excitation,
carbenes can be formed in a singlet or triplet excited state, as shown by the example of
the carbene methylene in Figure 2.9.
Many applications of carbenes generated from diazirines already exist. A patent
search, of which the results can be found in Appendix 10.P, revealed their main ap-
plication was in the field of photoaffinity labelling. Other applications included the use in
biomedical devices such as contact lenses and implants, cosmetics, anti-fouling of ships,
as well as modifying many types of surfaces.
(a) Triplet Carbene (b) Singlet Carbene
Figure 2.9: Methylene in its (a) triplet and (b) singlet excited state. Diagram composedfrom information in the book: Modern Physical Organic Chemistry.136
29
2.10 Conclusions
The literature review demonstrated that many methods had previously been tested to
improve the adhesion of coatings to non-polar polymer substrates. Although some novel
methods have been shown to be successful, it is often the cost of implementing the new
technologies into the industry that is their main disadvantage. For a new method to
replace a state of the art technique, it has to be cost-effective for the industry.
This study investigates the ability of two different methods to improve the adhesion
of waterborne coatings to PP-based substrates: a physical entanglement method and a
grafting method, utilising the knowledge gained from the literature review.
30

Part II
Materials and Methods
31
Chapter 3
MATERIALS
3.1 Substrates
3.1.1 Polypropylene-based Substrates
All the substrates used in this research were supplied in the form of plaques. Two groups
of substrates were examined.
The first group were industrial grade TPO substrates, commercially available and
used for the manufacture of car bumpers and other exterior parts, used in Europe.
They were created by injection moulding and were black in colour. TPO/0 refers to
DaplenTMEE103AE, a 10 % mineral filled, 0 % EPDM modified PP compound, provided
by Borealis. TPO/2 refers to SABIC R© PP 108MF10, a high impact PP copolymer con-
taining 2 % EPDM, provided by Sabic. TPO/20 refers to SABIC R© PP 95610, a high
impact PP copolymer containing 20 % EPDM, provided by Sabic. These plaques were
supplied with the dimensions 118 x 122 x 3 mm.
The second group of substrates were created by injection moulding for research pur-
poses, to assess the effect of EPDM elastomer content on the adhesion of coatings to the
substrates (they are not used in industry). They were supplied by BASF Schweiz AG
(in Basel) and produced to contain only PP, a mould release agent, and EPDM (when
present). They are white in colour, but increase in opacity with increasing amounts of
32
EPDM. These plaques were supplied with the dimensions 118 x 118 x 3 mm. These sub-
strates are referred to as R/x, where x = percentage of (%) EPDM, and x was 0, 5, 10,
15, 20 or 25.
The substrates are summarised in Table 3.1. The density and the Vicat softening
point are shown for the industrial substrates (defined by the manufacturer). The Vicat
softening point is the determination of the softening point for materials that have no
definite melting point, such as plastics. It is taken as the temperature at which the
specimen is penetrated to a depth of 1 mm under a specified load and heat rate, by a flat-
ended needle with a 1 mm2 circular cross-section.137 It was important that no adhesion
tests or curing of the coatings went above this temperature to avoid deformation of the
substrates which would leave them unsuitable for industrial use.
3.1.2 Grafting Proof-of-Concept Substrates
Gold coated silicon wafers were supplied by BASF SE. Chromium (1 nm) was applied to
each silicon wafer to improve the adhesion of the 50 nm gold coating applied to the wafer.
A glass-cutting knife was used to create 1 x 1 cm squares for the grafting study.
PP sheets (2 mm thickness) containing no pigments were supplied by Direct Plastics
(UK).
3.2 Chlorinated Polyolefin (CPO) Adhesion Promoter
A CPO, 515-2 (40 % solids in xylene) was supplied by Eastman Chemical Company
(USA). It contained approximately 30 wt.% chlorine. The best adhesion results were
found when the CPO was applied as a primer, wet-on-wet, with the waterborne basecoat.
33

Table 3.1: Summary of substrates, including predetermined properties of the industrialsubstrates available from the manufacturers. For the DaplenTM EE103AE and SABIC R©
PP 108MF10 substrates, the density was measured using ISO 1183 and the Vicat soft-ening temperature was measured using ISO 306. For the SABIC R© PP 95610 substrate,the denisty was measured using ASTM D792 and the Vicat softening temperature wasmeasured using ASTM D1525.
°
°
°
34
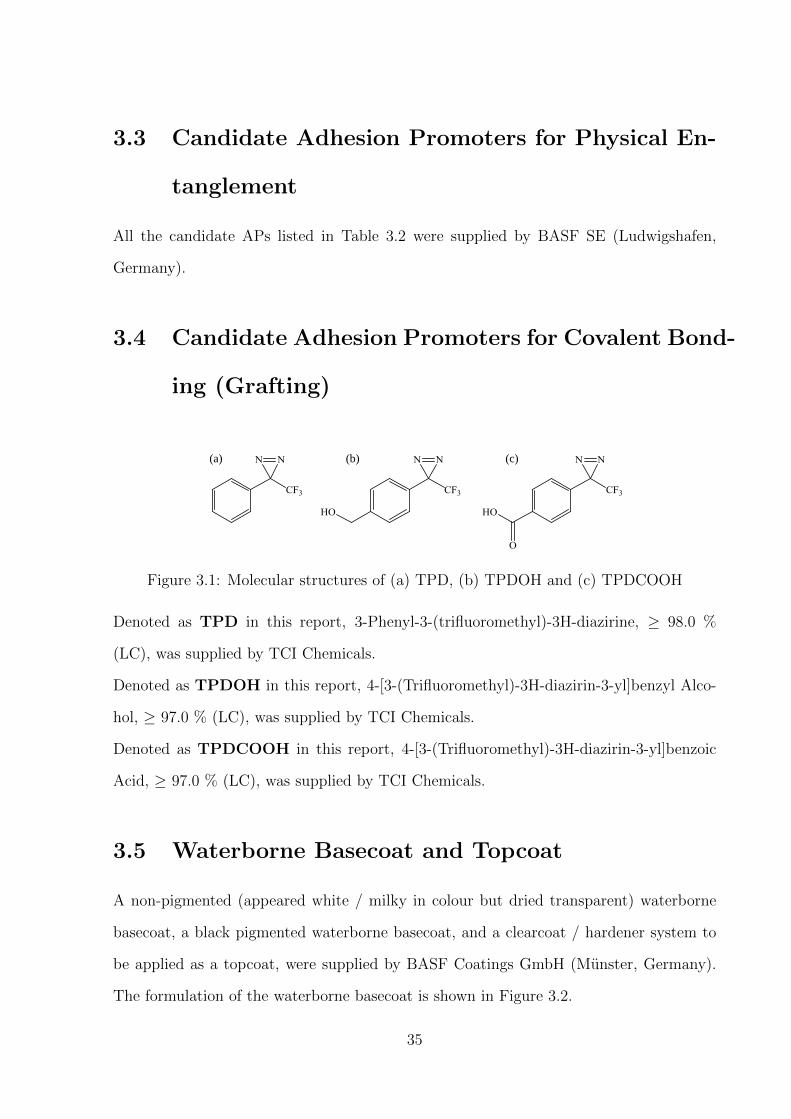
3.3 Candidate Adhesion Promoters for Physical En-
tanglement
All the candidate APs listed in Table 3.2 were supplied by BASF SE (Ludwigshafen,
Germany).
3.4 Candidate Adhesion Promoters for Covalent Bond-
ing (Grafting)
(a) (b) (c)
Figure 3.1: Molecular structures of (a) TPD, (b) TPDOH and (c) TPDCOOH
Denoted as TPD in this report, 3-Phenyl-3-(trifluoromethyl)-3H-diazirine, ≥ 98.0 %
(LC), was supplied by TCI Chemicals.
Denoted as TPDOH in this report, 4-[3-(Trifluoromethyl)-3H-diazirin-3-yl]benzyl Alco-
hol, ≥ 97.0 % (LC), was supplied by TCI Chemicals.
Denoted as TPDCOOH in this report, 4-[3-(Trifluoromethyl)-3H-diazirin-3-yl]benzoic
Acid, ≥ 97.0 % (LC), was supplied by TCI Chemicals.
3.5 Waterborne Basecoat and Topcoat
A non-pigmented (appeared white / milky in colour but dried transparent) waterborne
basecoat, a black pigmented waterborne basecoat, and a clearcoat / hardener system to
be applied as a topcoat, were supplied by BASF Coatings GmbH (Munster, Germany).
The formulation of the waterborne basecoat is shown in Figure 3.2.
35

Table 3.2: A list of commercially available active polymers provided from BASF and theirdescriptions.
36

63%
12%
73%
2% Water
Solvents
Binder Resins
Additives
Figure 3.2: A pie chart showing the percentage of the different components in the water-borne basecoat formulation.
3.6 Solvents
Cyclohexane, puriss, purity (GC) ≥ 99.5 %, was supplied by Sigma-Aldrich.
Toluene, anhydrous, 99.8 %, was supplied by Sigma-Aldrich.
Solvesso 150 and Solvesso 200 were provided by BASF SE, but supplied by ExxonMobil.
(They are crude mixtures of aromatic hydrocarbons (aromatic content>99 wt.%). Solvesso
150 has a distillation range of 182 − 207 ◦C and Solvesso 200 has a distillation range of
232− 287 ◦C.)
Ethanol ACS reagent, ≥ 99.5 %, (200 proof), absolute, was supplied by Sigma-Aldrich.
THF, anhydrous, ≥ 99.9 %, inhibitor-free, was supplied by Sigma-Aldrich.
Acetone, Chromasolv R© for HPLC, ≥ 99.9 %, was supplied by Sigma-Aldrich.
Isopropanol, LC-MS Chromasolv R© grade, was obtained from Sigma Aldrich.
Methyl ethyl ketone (MEK), ACS reagent, ≥ 99.9 %, was supplied by Sigma-Aldrich.
3.7 Alkane thiols
1-Nonanethiol, 96 %, was supplied by Sigma Aldrich.
1-Octadecanethiol, 98 %, was supplied by Sigma Aldrich.
37

3.8 Reaction between Trimeric Isocyanate and TP-
DOH
BasonatTM100, a solvent-free aliphatic polyisocyanate, was provided by BASF SE.
TPDOH was supplied by TCI chemicals.
38

Chapter 4
METHODS
4.1 Scanning Electron Microscopy (SEM) and Trans-
mission Electron Microscopy (TEM) with a Ruthe-
nium Tetraoxide (RuO4) Staining Technique, and
Energy Dispersive X-ray Spectroscopy (EDX)
The morphologies of the TPO and research substrate blends were studied by SEM and
TEM. The plane or face of the desired cross-section was cryogenically cut through the
sample using Histo knives in a Leica cryomicrotome Ultracut S.
For SEM in the back-scattered mode, the contrast between the blend components
of the cryo-sectioned face was achieved by staining the samples with ruthenium tetrox-
ide (RuO4) vapour for 30 minutes at room temperature, where the RuO4 solution was
prepared according to the procedure described by Montezinos et al.104 The samples were
then measured with an Zeiss Ultra 55 SEM operated at 20kV (in the back-scattered mode,
areas of higher density, higher atomic number or smaller porosity appear brighter).
For TEM, ultrathin sections were cryo-microtomed with a Leica microtome Ultracut
S, using a Diatome ultra diamond knife. During sectioning with the diamond knife, the
samples floated on to the surface of the water / DMSO solution in a boat, and were
39

collected for analysis with TEM. The sections were put on a copper grid with a carbon
support layer.
Contrast between the blend components was also achieved by exposing the samples to
RuO4 vapour. The staining procedure was applied after cutting the thin sections, rather
than to a bulk substrate prior to cutting. The stained sections were examined in a TEM
(Zeiss Libra 120) operated at 120 kV.
To confirm the presence of ruthenium (Ru) in the contrasted samples, elemental mi-
croanalysis, based on EDX, was conducted on the SEM Zeiss Ultra 55 operated at 20
keV, equipped with a Thermo Fisher EDX detector.
For heat treatment of the substrates, a conventional oven was heated to 80 ◦C and
the substrates heated in the oven for one hour before analysis with the SEM. Ideally,
measurements would be done on the substrates as soon as they had been heated, however,
due to practical limitations, the SEM measurements were done within one week of heating.
4.2 ImageJ SEM Image Analysis
To assess the distribution of the EPDM domains on the substrate surface and on the
cross-section relative to the position from the surface, ImageJ,138 a Java-based public
domain image processing and analysis program, developed at the National Institute of
Health (NIH) (USA), was utilised. Each image to be processed was first loaded as a TIFF
file, consisting of the image to be analysed and a scale bar (already created from the SEM
/ TEM software). The image dimensions were calibrated using the Set Scale tool in the
software.
The newly scaled images were then used for analysis. It was found that enhancing the
contrast of the coloured images gave the best results. The colour threshold was adjusted
so that the particles of interest were adequately covered. The Analyze Particles command
was selected from the Analyze menu, the size (pixel2) set to 0-Inifinity (defining the size of
the particles to be searched for and analysed; in this case covering all possibilities of sizes)
40

and the circularity range set to 0-1. Circularity = 4π( [Area] / [Perimeter]2). A value of
1.0 indicates a perfect circle and as the value approaches 0.0, it indicates an increasingly
elongated shape (software states values may not be valid for very small particles.) Other
options selected were Display Results (measurements for each particle were displayed in
the Results Table), Clear results (any previous measurements listed in the Results Table
were cleared), and Summarize (particle count, total particle area, average particle size,
area fraction and the mean of all parameters listed in the Set Measurements dialog box
were displayed in a separate Summary table).
The option Mask for the image display was selected, generating an 8-bit image con-
taining simple black-filled shapes of the measured particles (graylevels: Outlines : 0; Back-
ground : 255). The resolution of each image was 0.2 µm/pixel. The Set Measurements
window found on the Analyze menu enabled the measurement of Area to be selected, dis-
playing the area of each particle in µm2. The data from the Results window was exported
to Microsoft Excel139 for further statistical analysis. The particle areas were summed up
and divided by the total area measured, to give the estimated % coverage area from the
EPDM particles.
Due to the calculation of the % area of coverage from the EPDM particles depending
on the image threshold set (to insure good contrast between the PP matrix and EPDM
particles), the accuracy of the program (identifying the areas and making the calculations),
and the resolution of the image itself, it was not possible to calculate the errors in the
calculations. Therefore, the values calculated were used only as an approximation.
4.3 White Light Interferometry
Surface roughness measurements were carried out using a WYKO NT9300 surface profiler
(Veeco Instruments, USA) in the vertical-scanning interferometry (VSI) mode. The back-
scan and scanning distance were set at 5 and 15 µm, respectively. A 120 x 90 µm area was
scanned by choosing a magnification of 50 x 1. The saturation value was chosen in a range
41

of 0.01 - 0.05 %. For the VSI mode, the vertical resolution was up to 3 nm for a single
measurement and the largest vertical distance that could be measured was 500 µm. Two
parameters describing the surface roughness (or smoothness) are the average roughness
(Ra) and the root mean square roughness (Rq). Ra is the mean height variation calculated
over the whole measurement array, as shown in Equation 4.1. Rq is the root mean square
average of the measured height deviations taken within the evaluation length or area,
and measured from the mean linear surface, as shown in Equation 4.2. A schematic
representation of these values is shown in Figure 4.1. Higher values of Ra or Rq indicate
a rougher surface.
Ra =1
L
L∫0
|Z(x)|dx (4.1)
Rq =
√√√√√ 1
L
L∫0
|Z2(x)|dx (4.2)
For each sample, images were obtained from 10 different areas on the surface, and
the surface roughness parameters were averaged and the standard deviations were calcu-
lated. Measurements were taken before and after solvent swelling. An advantage of the
WYKO surface profiling system is that it allows surface roughness measurements to be
taken without contact to the sample. Measurements were also tested in the phase-shift
interferometry (PSI) mode, which is optimal for smoother surfaces.
Mean Line
Ra
X
Z
Rq
Figure 4.1: Schematic profile of a surface, showing the roughness parameters Ra and Rq,for the peaks and valleys in the Z direction. An adaptation from Bellitto et al.140
42

However, a greater surface roughness contrast could be seen in VSI mode (often more
useful for rough surfaces and surfaces with steep steps), and was therefore the method
of choice. In VSI mode, a white line beam passes through a microscope objective to
the sample surface. A beam splitter reflects half of the incident beam to the reference
surface. The beams reflected from the sample and from the reference surface recombine
at the beam splitter to form interference fringes, where the best contrast fringe occurs at
the best focus.
4.4 Nanoindentation
Data Measurements Nanoindentation measurements were carried out using an
Agilent Nano indenter G200 (Agilent Technologies, USA) with a diamond indenter tip
with Berkovich geometry.
The measurements were done in Continuous Stiffness Mode (CSM), which produced
repeatable results compliant with ISO 14577 standards. The Young’s modulus and hard-
ness profiles were measured with a displacement range of 0.3 - 3 µm from the substrate
surface (with nano-depth resolution).
During the CSM measurement, the nano-indenter applied a load to the indenter tip,
which forced the tip into the surface whilst simultaneously superimposing an oscillating
force with a force amplitude, generally several orders of magnitude smaller than the nomi-
nal load, as shown in Figure 4.2. The CSM measuring method separates the in-phase and
out-of-phase components of the load-displacement history. This separation provides an
accurate measurement of the location of initial surface contact and continuous measure-
ment of contact stiffness as a function of depth or frequency, thus eliminating the need
for unloading cycles. Since the contact stiffness is determined directly, no assumptions
(such as mechanical equilibrium) are required to correct for elasticity.141
Ten measurements were taken on each sample to generate hardness and moduli data.
Details of how the Young’s modulus and hardness have been calculated from the
43

measurements can be found elsewhere.142,143
The measurements were calibrated against a polycarbonate reference material (see
Appendix 10.A), which showed an average linear progression of Young’s modulus and
Hardness in the displacement range 300 - 5 µm. The average Young’s modulus measured
corresponded exactly with the literature value of 2.4 GPa.
Data interpolation for creating graphs of average values The nanoindenter
measured the force and displacement every 0.2 seconds; hence the Young’s modulus and
hardness calculations were time dependent and not displacement dependent. Therefore,
different displacement depths were recorded for each measurement. To be able to average
the data from each 10 measurements for each sample, an interpolation mathematical
equation was utilised. Although interpolation could be a subject for speculation, the
values and graphs created were verified against each individual measurement, and were
found to be in the correct range, and so can be considered an accurate account. The basic
principle behind the interpolation calculation is shown in Figure 4.3. When two known
values are (x1,y1) and (x2,y2), the values for (x,y) are calculated using Equation 4.3. Full
details of how the interpolation was calculated can be found in Appendix 10.B.
y = y1 + (x− x1)y2 − y1x2 − x1
(4.3)
4.5 Surface Free Energy Determination
4.5.1 Owens-Wendt Method
Contact angles were obtained using the sessile drop method with an OCAH 200 contact
angle device from Dataphysics (Germany). Three liquids of known surface tension were
used as a probe for the surface free energy calculations: diiodomethane (Merck, >96 %),
ethylene glycol (Merck, >99.5 %) and distilled water (Table 4.1 shows the predetermined
values used.)
44

Load
/ m
N
Time/ s
(a) Excitation Force
Nominal Force
Ex
cita
tion F
orc
e
Time/ s
(b) Elastic
Disp
lacemen
t
Disp
lacemen
t
Ex
cita
tion
Forc
e Time/ s
(c) Viscoelastic
Figure 4.2: A schematic representation of nano-indentation in Continuous Stiffness Mode(CSM) from Agilent technologies. (a) A sinusoidal oscillation is used in permanent super-position to the force signal. The oscillation is applied directly to the shaft with the tipand produced by the coil (shown schematically on right hand side). For elastic materials,there is no phase shift (b) but measurement of viscoelastic materials result in a phaseshift between force and displacement signal (c).
+
X1 X2 X
Y1
Y
Y2
Figure 4.3: Schematic diagram demonstrating the basic principle behind linear interpo-lation: the line of best fit between two data points, x1 and x2, from which x can becalculated.
45

Table 4.1: Predetermined polar and dispersion components of the surface tension of theprobe liquids used to determine the surface energy of the substrates.
γ γ γ
For improved accuracy, ten drops were measured for each liquid probe on each surface
(over 1000 contact angles), and the values were averaged. The drop image was stored
by a video camera, which commenced recording upon an optical trigger, as soon as the
drop was deposited. It recorded 360 images for 12 s for each drop. The contact angle
(average of the left and the right) from the shape of the drop was calculated from the
video after it was recorded, using an image analysis system in the equipment software.
Contact angles could be measured over a short time scale by initially recording the video,
to limit the influence of any reaction between the drop and the substrate. This method
also limited the volume reduction of the drop due to evaporation, which could cause
inaccurate results.144 If the contact angle was <20 ◦, a circle fitting was used. For a
contact angle between 20− 80 ◦, an ellipse fitting was used. For a contact angle >80 ◦, a
tangent fitting was used. A 0.72 mm diameter syringe needle was used to create a drop
of constant volume. All contact angles were measured at room temperature. The surface
roughness values of the substrates (Ra) were <0.5 µm, a generally accepted value which
is known not to significantly affect the accuracy of the results.144
4.5.2 Owens-Wendt Theory
The surface free energies of the different substrates were calculated using the theoretical
model, Owens-Wendt (OW), shown in Equation 4.4.
The equation can be rearranged to give a linear equation, in the form of y = mx+ c,
as shown in Equation 4.5.
46
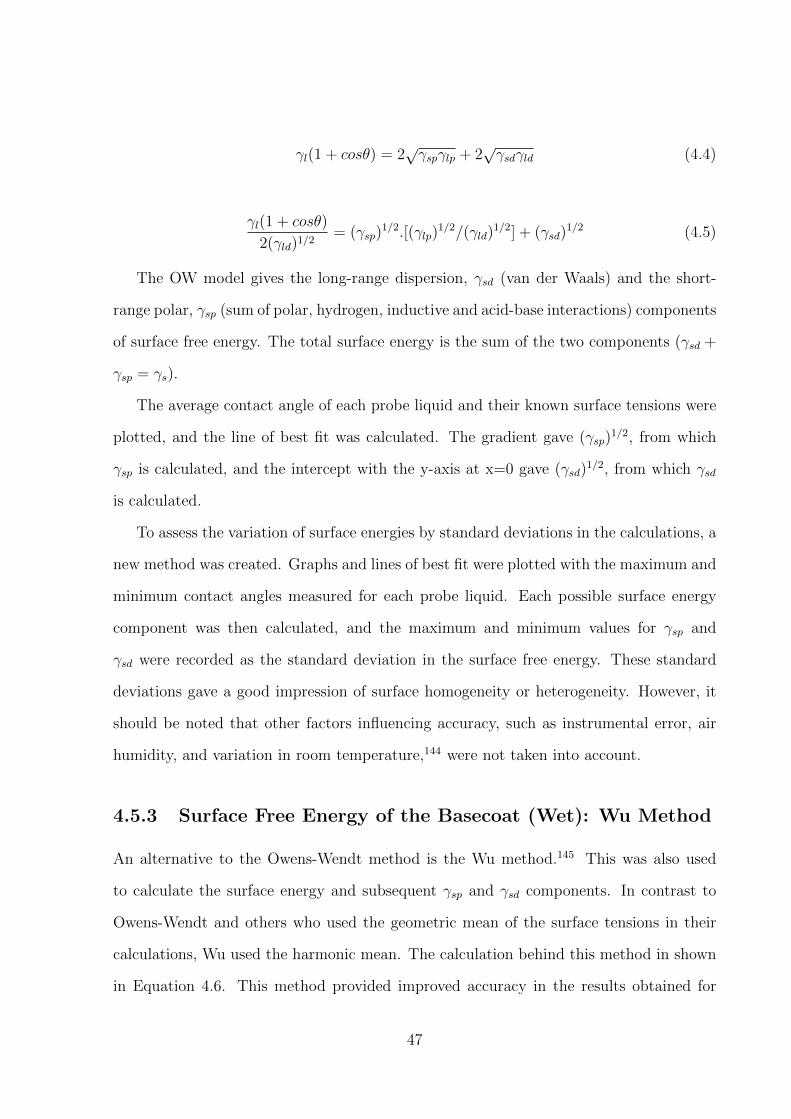
γl(1 + cosθ) = 2√γspγlp + 2
√γsdγld (4.4)
γl(1 + cosθ)
2(γld)1/2= (γsp)
1/2.[(γlp)1/2/(γld)
1/2] + (γsd)1/2 (4.5)
The OW model gives the long-range dispersion, γsd (van der Waals) and the short-
range polar, γsp (sum of polar, hydrogen, inductive and acid-base interactions) components
of surface free energy. The total surface energy is the sum of the two components (γsd +
γsp = γs).
The average contact angle of each probe liquid and their known surface tensions were
plotted, and the line of best fit was calculated. The gradient gave (γsp)1/2, from which
γsp is calculated, and the intercept with the y-axis at x=0 gave (γsd)1/2, from which γsd
is calculated.
To assess the variation of surface energies by standard deviations in the calculations, a
new method was created. Graphs and lines of best fit were plotted with the maximum and
minimum contact angles measured for each probe liquid. Each possible surface energy
component was then calculated, and the maximum and minimum values for γsp and
γsd were recorded as the standard deviation in the surface free energy. These standard
deviations gave a good impression of surface homogeneity or heterogeneity. However, it
should be noted that other factors influencing accuracy, such as instrumental error, air
humidity, and variation in room temperature,144 were not taken into account.
4.5.3 Surface Free Energy of the Basecoat (Wet): Wu Method
An alternative to the Owens-Wendt method is the Wu method.145 This was also used
to calculate the surface energy and subsequent γsp and γsd components. In contrast to
Owens-Wendt and others who used the geometric mean of the surface tensions in their
calculations, Wu used the harmonic mean. The calculation behind this method in shown
in Equation 4.6. This method provided improved accuracy in the results obtained for
47

the higher energy waterborne basecoat. The measurements were done by an analytical
group in BASF Munster GmbH. A Kruss Tensiometer K12 (Germany), using the ring
method, was used to the determine the surface tension of the basecoat. The contact angle
of the basecoat on a Teflon surface of known polar and dispersion components was then
calculated, and the Wu method was used to calculate the polar and dispersive components
of the surface energy of the basecoat.
γ(12) = σl + σs − 4(σld.σsdσld + σsd
+σlp.σspσlp + σsp
) (4.6)
4.6 Wettability: Contact Angle Measurements
Contact angles were obtained using the sessile drop method with an OCAH (optical con-
tact angle high speed) 200 instrument from Dataphysics (DataPhysics Instruments GmbH,
Germany). Each candidate AP was placed into a syringe with 0.72 mm diameter (GLT,
Nordson EFD, Germany), and deposited onto the surface of the substrate. The contact
angles were measured by video, as described above for surface free energy measurements.
Contact angles > 90 ◦ were said to be non-wetting and contact angles < 90 ◦ were said to
be wetting, as shown in Figure 4.4.
Θ > 90° Θ < 90°
Non-wetting Wetting
Figure 4.4: A schematic diagram showing cases where liquid drops are non-wetting orwetting on a substrate surface.
48
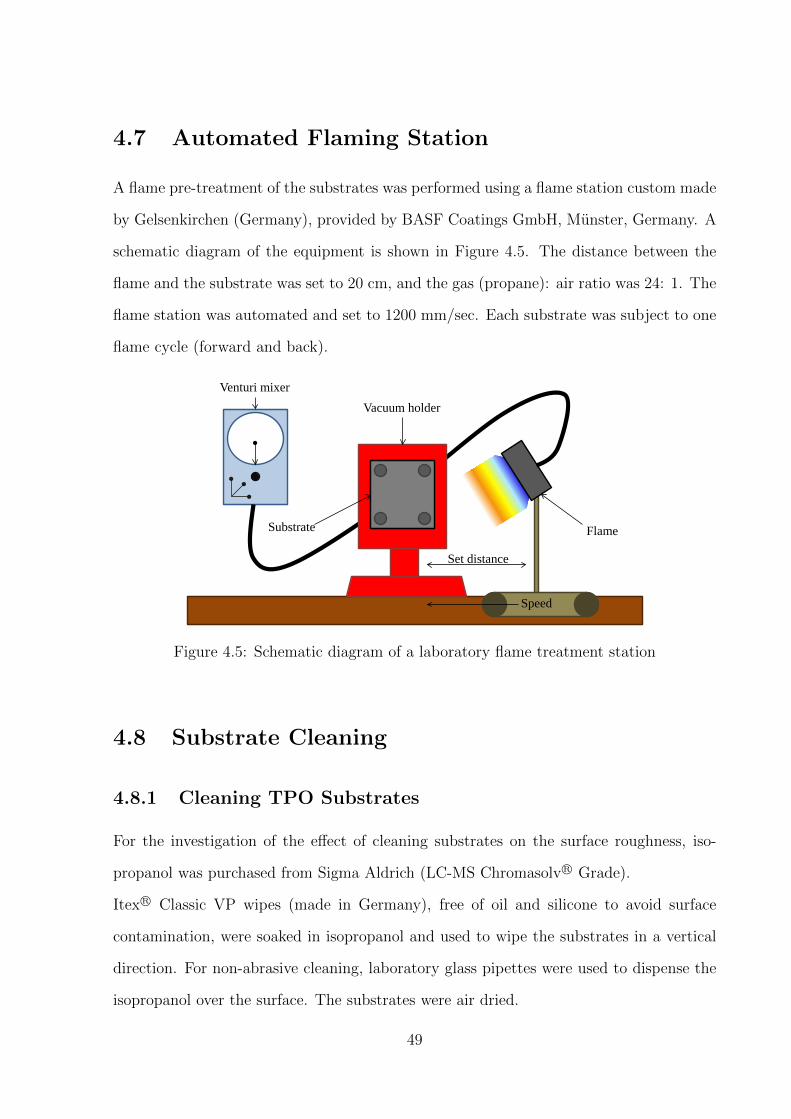
4.7 Automated Flaming Station
A flame pre-treatment of the substrates was performed using a flame station custom made
by Gelsenkirchen (Germany), provided by BASF Coatings GmbH, Munster, Germany. A
schematic diagram of the equipment is shown in Figure 4.5. The distance between the
flame and the substrate was set to 20 cm, and the gas (propane): air ratio was 24: 1. The
flame station was automated and set to 1200 mm/sec. Each substrate was subject to one
flame cycle (forward and back).
Vacuum holder
Flame Substrate
Venturi mixer
Speed
Set distance
Figure 4.5: Schematic diagram of a laboratory flame treatment station
4.8 Substrate Cleaning
4.8.1 Cleaning TPO Substrates
For the investigation of the effect of cleaning substrates on the surface roughness, iso-
propanol was purchased from Sigma Aldrich (LC-MS Chromasolv R© Grade).
Itex R© Classic VP wipes (made in Germany), free of oil and silicone to avoid surface
contamination, were soaked in isopropanol and used to wipe the substrates in a vertical
direction. For non-abrasive cleaning, laboratory glass pipettes were used to dispense the
isopropanol over the surface. The substrates were air dried.
49

4.8.2 Cleaning Gold Surfaces
The gold-coated silicon wafers (used for the grafting model system) were cleaned using
a FEMTO plasma cleaner (Diener Electronic GmbH, Germany) directly before being
submersed in the thiol solution to form a self assembled monolayer (SAM). A standard
procedure was used where the chamber was evacuated to 0.2 mbar, rinsed with argon gas
for one minute, plasma was generated at 20 % power (= 50 watts) for ten minutes at
a controlled by-pressure of 0.3 mbar, before air was re-released into the chamber for 2
minutes.
4.9 Self-Assembled Monolayer (SAM) Formation
The standard procedure used to form the SAM on the gold surfaces can be found else-
where.146 The thiol solution was made so that the concentration of the C18 and C9 alkane
thiols were in a ratio of 1:4.
The SAM thickness was measured using an alpha-SE R©Ellipsometer ( J. A. Woollam
Company Incorporated, USA). The amplitude change (∆Ψ) and phase difference (∆λ)
between orthogonally polarised light from a white-light source was spectroscopically mea-
sured upon reflection at 70 ◦ from the surface. Using the Fresnel-Equations,147 a physical
model was fitted to the experimental data. Measurements were taken on the cleaned gold
surface before and after SAM formation, and the difference in thicknesses were calculated
to give the thickness of the SAM. Five measurements were taken on different areas of
three samples, and an average thickness was calculated for each experiment. Details on
the measurement and procedure are detailed elsewhere.148–150
50

4.10 Adhesion Promoter (AP) Deposition for Graft-
ing Experiments
AP solutions were made with acetone at the desired concentrations. A glass syringe was
used to deposit three 10 µL droplets of the solution onto the substrate surface. The
substrate was left to dry at room temperature for 15 minutes before the next stage.
4.11 Doctor Blade Coating Application
4.11.1 CPO
The coatings were applied using an R K303 multicoater by Erichsen (Hemer, Germany).
The CPO primer was applied with a 4 µm doctor blade and the waterborne basecoat
was applied with a 50 µm doctor blade, producing a dried thickness of 15 - 18 µm. The
CPO and basecoat were applied with a wet-on-wet method, where no curing step was
implemented between coatings. The CPO and basecoat were then dried at 80 ◦C, for ten
minutes. After ten minutes of drying, the topcoat was applied with a 100 µm doctor
blade, producing a dried thickness of 42 - 45 µm. The topcoat was dried at 80 ◦C, for 30
minutes and left to cool. The substrate was stored at room temperature, in a ventilated
atmosphere for 7 days post-curing, prior to the adhesion tests. The coating application
process and dried thicknesses of the coatings are summarised in Figure 4.6.
4.11.2 Candidate APs
The coatings were applied using an R K303 multicoater by Erichsen (Hemer, Germany).
The candidate AP primers were applied with a 4 µm doctor blade. The primer was either
applied wet-on-wet with the basecoat, or dried at 80 ◦C for ten minutes. The waterborne
basecoat was applied with a 50 µm doctor blade, and dried at 80 ◦C for ten minutes,
producing a dried thickness of 15 - 18 µm. After ten minutes of air drying / cooling, the
51

topcoat was applied with a 100 µm doctor blade, producing a dried thickness of 42 - 45
µm. The topcoat was dried at 80 ◦C for 30 minutes and left to cool. The substrate was
stored at room temperature in a ventilated atmosphere for 7 days post-curing, prior to
the adhesion tests. The coating application process and dried thicknesses of the coatings
are summarised in Figure 4.6.
Primer/
Surface
Treatment
Cure +Basecoat
Cure
80°C
10 min
+Clearcoat
Cure
80°C
30 min
Substrate
~4 μm 15 – 18 μm
42 – 45 μm
Figure 4.6: Top: a summary of the coating and curing steps. Bottom: the dried thick-nesses of the coatings.
4.12 Spray Gun Coating Application
A hand-held Satajet 4000 B RP spray gun (SATA GmbH, Germany) with a 1.4 mm nozzle
was used at 3 bar pressure for primer and coating application. The coatings were applied
in a climate control room at 23 ◦C, 65 % humidity. The coating and curing process is
summarised in Figure 4.6. The thickness of the coatings were measured by ultrasonic
reflection according to ISO 2808 at BASF Coatings GmbH. Unless stated otherwise, the
substrates were not cleaned prior to the application of the primer / coatings.
4.13 Thermal Cure
A conventional oven with a solvent extraction unit was used to thermally cure samples
at the desired temperature for a set time. The substrates were protected from dirt using
glass Petri dishes.
52
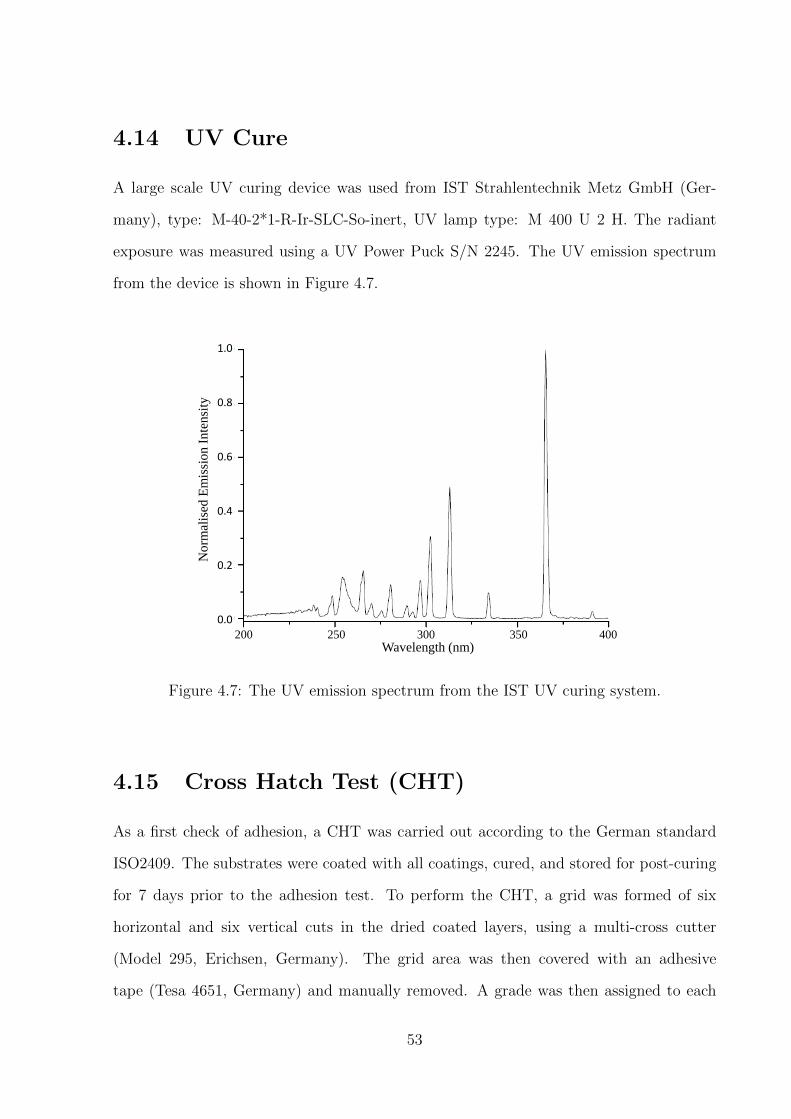
4.14 UV Cure
A large scale UV curing device was used from IST Strahlentechnik Metz GmbH (Ger-
many), type: M-40-2*1-R-Ir-SLC-So-inert, UV lamp type: M 400 U 2 H. The radiant
exposure was measured using a UV Power Puck S/N 2245. The UV emission spectrum
from the device is shown in Figure 4.7.
Wavelength (nm) 200 250 300 350 400
1.0
0.8
0.6
0.4
0.2
0.0
No
rmal
ised
Em
issi
on
In
ten
sity
Figure 4.7: The UV emission spectrum from the IST UV curing system.
4.15 Cross Hatch Test (CHT)
As a first check of adhesion, a CHT was carried out according to the German standard
ISO2409. The substrates were coated with all coatings, cured, and stored for post-curing
for 7 days prior to the adhesion test. To perform the CHT, a grid was formed of six
horizontal and six vertical cuts in the dried coated layers, using a multi-cross cutter
(Model 295, Erichsen, Germany). The grid area was then covered with an adhesive
tape (Tesa 4651, Germany) and manually removed. A grade was then assigned to each
53

substrate which ranged between 5, the worst (more than 65 % of the grid squares were
removed) and 0, the best (no square was removed), as shown in Figure 4.8.
4.16 Steam Jet Test (SJT)
In the cases when good adhesion was observed in the CHT’s, further tests were performed
with a steam jet. The adhesion of the coated system (primer, base coat, clear coat)
was evaluated by a SJT according to Daimler-Chrysler specifications. The experiments
were performed with paint test equipment provided by Walter Gertebau (Sachsenheim-
Ochsenbach, Germany) using a power wash jet (Nr. 14MEG2506, Spraying Systems,
Remshalden, Germany). A cross (2 x 13 mm length at ∼19 ◦C, creating a rectangle
outline of 118 x 36 mm) was made in the coated layer using a graver (Sikkens graver, type
463, blade 1 mm; Sikkens, Stuttgart, Germany) prior to the test. The steam-jet (steam
temperature = 60 ◦C; steam pressure = 67 bar, test period = 60 s, distance between jet
and substrate = 100 mm) impinged on the substrate perpendicularly. When no delami-
nation of the paint layer was visible, the paint adhesion was considered to meet industrial
standards, according to the specification. The results were graded as shown in Figure 4.9.
4.17 Hansen Solubility Parameters: Solvent Selec-
tion for Swelling Substrates
The solvents used to swell the substrates were chosen based on their Hansen Solubility
Parameters (HSPs).151 Three HSP parameters are commonly described: δD (dispersion
contribution), δH (hydrogen contribution) and δP (polar contribution). Together these
parameters form a theory which can be used to predict the solubility of a polymer. All
three parameters add up to the enthalpy of vaporisation of the material and the theory
is based on the principle of two systems mixing at no enthalpy cost. For example, the
evaporation of a proportion of a solvent A and replacing it with a proportion of a solvent
54

≤
≤
≤
≤
≤
⁰
Figure 4.8: Cross-Hatch Test. Setup : 1 = tape, 2 = coatings, 3 = grid, 4 = substrate;Test details: a = length of grid is 10 mm, b = length of grid and guidelines is 16 mm, c= the guide blades and cutting blades are on the same plane, d = the tape is applied andsmoothed/ flattened, e = pull of direction and angle of the tape.
55
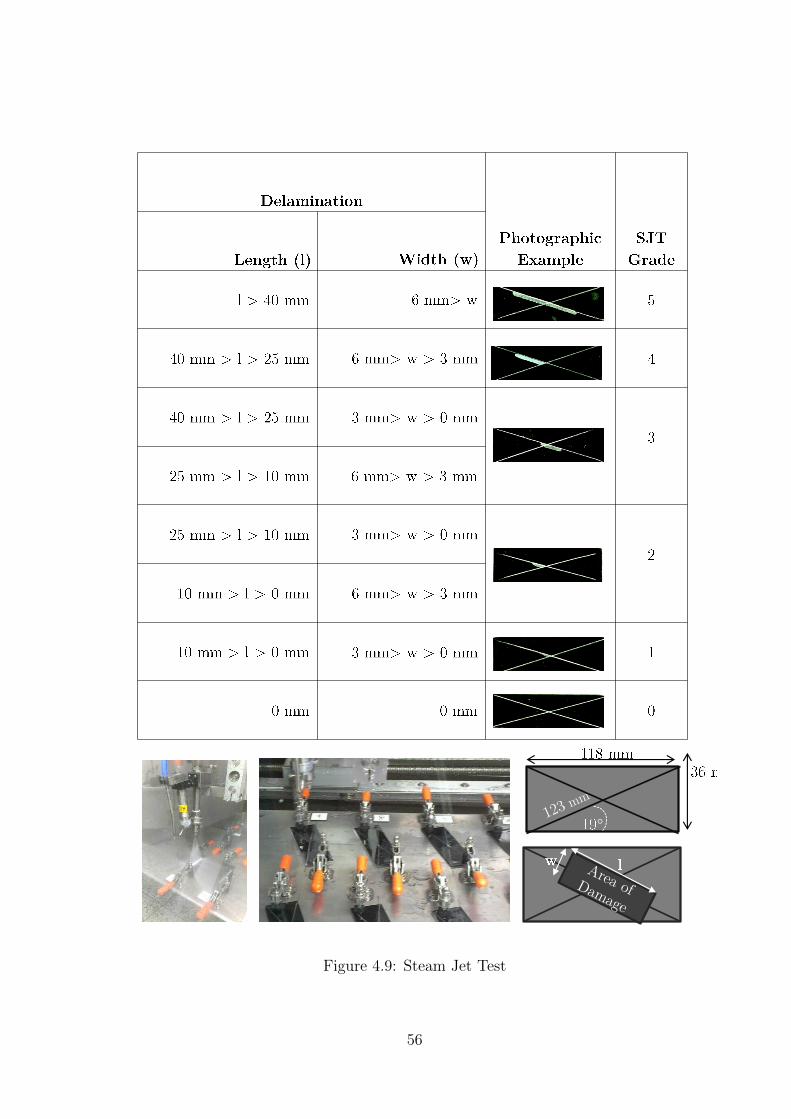
°
Figure 4.9: Steam Jet Test
56

B, leads to no enthalpy cost because the enthalpies of vaporisation of both solvents are
the same; hence the so-called theory like dissolves like.
The most commonly cited and alternative theory for the prediction of the solubility
of a polymer is the Hildebrand theory (defined as the square root of the internal energy
of vaporisation divided by the molar volume or cohesive energy density).152,153 However,
this theory was not used because it only takes into account the dispersion properties of
a molecule and does not account for the polar contribution. The advantage of the HSP
parameters is that they do take into account the extra polar component and are not
restricted to the behaviour of only hydrocarbon solvents. Although it was acknowledged
that the HSPs are an approximation, they proved useful to select which solvents were
suitable for swelling the PP-based substrates.
For visualisation, the HSPiP software (version 3.1.14, copyright 2008/11)151 imple-
ments a green sphere with a set radius for a chosen polymer, the centre of which represents
the optimum HSP for good solvency / swellability of the selected polymer. According to
the theory, any solvents with HSP values inside the green sphere will swell the polymer.
In this case, a PP polymer standard, implemented in the software (δD = 18, δP = 0,
δH = 1), was used as a model for the substrates. The results were also calculated for
an EPDM substrate (also implemented in the software, δD = 18.6, δP = 3.4, δH = 4.4),
to predict what effect the EPDM content of the substrates would have on the solvent
selection for swellability. The radius of the green sphere was set to 8 for the PP and 10.7
for the EPDM (predefined in the software). The HSP distance of the solvent from the
optimum HSP value (centre of sphere) in 3D space was calculated using Equation 4.7.
A second parameter, known as the Relative Energy Difference (RED), was calculated
for a list of solvents and a selected substrate. The value was used to characterise the
swellability or solubility of the chosen substrate. The software was used to generate the
RED values using Equation 4.8, by calculating the 3D distance between each solubility
parameter of a list of selected solvents and the PP (or EPDM) substrate. It is the ratio
of the distance of the solvent to the radius of the sphere, which gives an indication of how
57

good the solvent would be at swelling the PP or EPDM (an RED value of 0 indicates a
perfect solvent, where a solvent at the edge of the sphere would have an RED value of
1). Any solvent with an RED value < 1 indicated a solvent that should swell the PP or
EPDM.
Figure 4.10 shows the HSPs for selected solvents (chosen on their availability and cost)
and PP. The solid blue spheres represent the solvents inside the green sphere of the PP,
that have RED < 1 and therefore should swell the PP. The open blue spheres represent the
solvents not inside the sphere (RED > 1) that are predicted to have no swelling effect on
PP. The top three solvents, toluene, cyclohexane and aromatic solvents, were chosen for
further tests. To verify their compatibility with the EPDM component of the substrates,
the RED values were also calculated for the same solvent list and EPDM, as shown in
Figure 4.11. It can be seen that all three solvents also have RED < 1 for EPDM, and
so were expected to swell the EPDM component of the substrates as well as the PP. A
summary of the chosen substrates is shown in Figure 4.12. The ’aromatic solvents’ refer
to Solvesso solvents (ExxonMobil) which were initially tested for swellability, having the
advantage that they are mixed aromatic hydrocarbon products from the thermal cracking
of crude oil, which are cost-effective and good for industrial products. However, due to
their low volatility (could cause cohesive failure within substrate) and high pungency they
were ruled out as possibilities.
Distance2 = 4(δDA − δDB)2 + (δPA − δPB)2 + (δHA − δHB)2 (4.7)
Relative Energy Difference = Distance/Radius (4.8)
58

δ δ δ
δ δ δ δ δ δ
Figure 4.10: The Hansen Solubility Parameters of the selected solvents and a PP polymer,and the ratio of the distance of the selected solvent to the radius of the PP sphere (REDnumber). A perfect solvent has an RED of 0. A solvent with an RED value < 1 shouldswell the polymer.
δ δ δ
δ δ δ δ δ δ
Figure 4.11: The Hansen Solubility Parameters of the selected solvents and an EPDMpolymer, and the ratio of the distance of the selected solvent to the radius of the PPsphere (RED number). A perfect solvent has an RED of 0. A solvent with an RED value< 1 should swell the polymer.
59
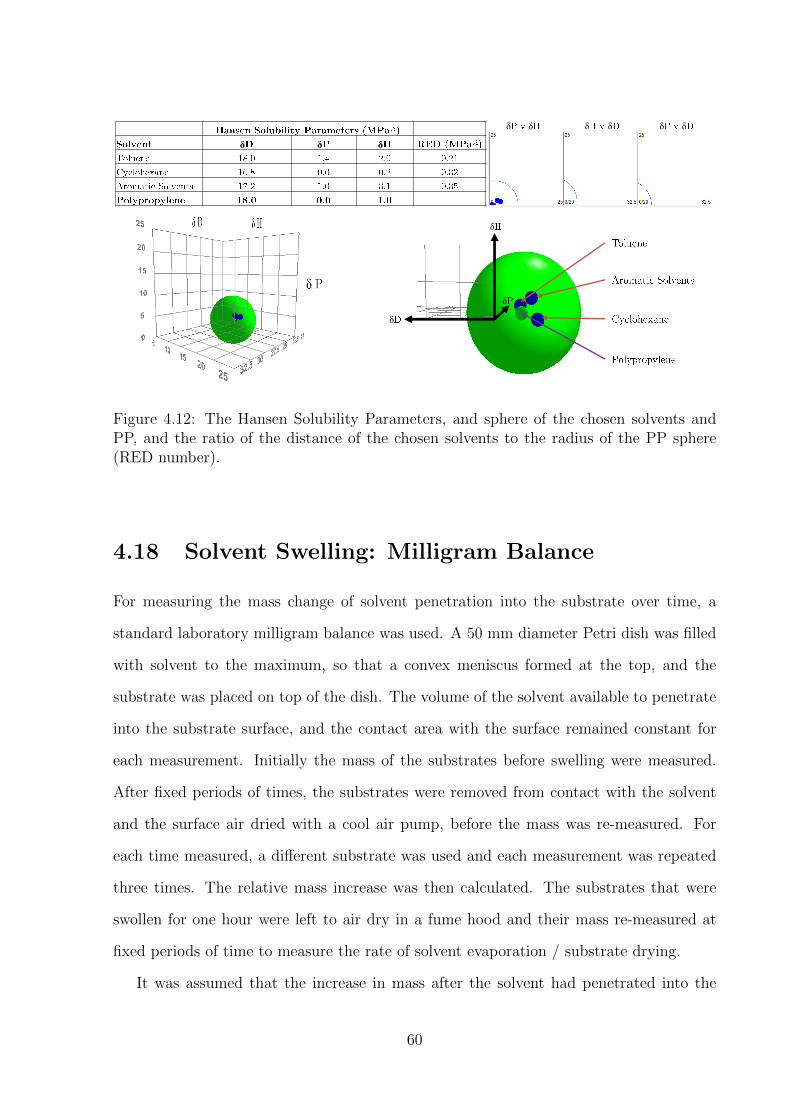
δ δ δ
δ δ δ δ δ δ
δ
δ
δ
Figure 4.12: The Hansen Solubility Parameters, and sphere of the chosen solvents andPP, and the ratio of the distance of the chosen solvents to the radius of the PP sphere(RED number).
4.18 Solvent Swelling: Milligram Balance
For measuring the mass change of solvent penetration into the substrate over time, a
standard laboratory milligram balance was used. A 50 mm diameter Petri dish was filled
with solvent to the maximum, so that a convex meniscus formed at the top, and the
substrate was placed on top of the dish. The volume of the solvent available to penetrate
into the substrate surface, and the contact area with the surface remained constant for
each measurement. Initially the mass of the substrates before swelling were measured.
After fixed periods of times, the substrates were removed from contact with the solvent
and the surface air dried with a cool air pump, before the mass was re-measured. For
each time measured, a different substrate was used and each measurement was repeated
three times. The relative mass increase was then calculated. The substrates that were
swollen for one hour were left to air dry in a fume hood and their mass re-measured at
fixed periods of time to measure the rate of solvent evaporation / substrate drying.
It was assumed that the increase in mass after the solvent had penetrated into the
60

substrate surface was due to polymer swelling. Other effects, such as immediate solvent
evaporation out of the substrate may have occurred in a competing process. However,
the interest was in the time dependence of the substrate mass change (irrespective of the
competing processes) and subsequently the substrate swelling, which may have affected
the adhesion of candidate APs to the substrate.
4.19 Time of Flight Secondary Mass Spectrometry
(ToF-SIMS)
A TOF.SIMS-5 mass spectrometer (ION-TOF GmbH, Munster, Germany), was used in
this study, equipped with a liquid metal ion gun (LMIG) generating Bi+ primary ions,
operating at 25 kV. The average pulsed current was set to 1.00 µA with a 25.0 ns pulse
width. The analysis was performed under so-called static conditions94 with an ion dose
of the order of 9 x 10¹¹ ions cm−2. Sample charge up was compensated by low energy
electron flooding provided by the built in flood gun.
4.19.1 Surface Composition Analysis
Three ToF-SIMS spectra were collected and analysed for areas of 2.0 x 2.0 mm2 on each
sample, in positive and negative modes. Each experiment was repeated three times.
Values presented are mean values and standard deviations of the three spots, and three
repeats. The ToF-SIMS data were analysed using ION-TOF software. Spectra m/z values
were mass calibrated using H+, C+, CH2+, CH3
+ and C2H3+ peaks in positive mode, and
C−, CH−, CH2−, O− and OH− peaks in negative mode. Although care was taken to
work in clean conditions, it should be noted that inorganic peaks such as Na+ and 37Cl−,
as well as characteristic polydimethylsiloxane (PDMS) peaks such as C5H15OSi2+ and
C5H15O4Si3−, were sometimes observed in the acquired spectra due to contamination.
The standard deviation on all the detected peaks was <10 milliatomic mass units. Data
presented were normalised against the total ion count. Spectra were collected using high
61

mass resolution conditions (bunched beam mode, m/∆m >6000 for Si).
4.19.2 High Lateral Resolution Images
High-resolution images were obtained with the instrument in the so-called burst alignment
mode, in which smaller focus of the primary ion beam is obtained (200 - 300 nm), however,
at the expense of significantly lower mass resolution (m/∆m∼350).154 Secondary ion
images were acquired using the Bi3+ primary ion gun. During acquisition, the primary
ion beam was scanned in a raster pattern (128 x 128 pixels) over an analysis area of 200 x
200 µm. Thus the image resolution was 1.6 µm/pixel, unless otherwise stated. For some
measurements, analysis areas varied, depending on the thickness of the coatings.
4.19.3 Mode of Failure Analysis
Surface composition analysis was performed as described above, with the exception of
the F− ion count being normalised against the C− ion count. This was because the total
ion count from the underside of a delaminated basecoat and the surface of a delaminated
substrate was significantly different due to the so-called matrix effect (where the ion
yield is dependent on the electronic state of the material being analysed).94 Therefore,
normalising against the total ion counts to compare both surfaces would not have given a
good estimation of the mode of failure. The total C− count from both surfaces was closer
in value, so a better estimation of the mode of failure could be obtained.
4.20 X-ray Photoelecton Spectroscopy (XPS)
XPS analysis was carried out under ultra-high vacuum conditions (5 x 10⁻⁸ Torr) using
a Kratos Axis NOVA equipped with a hemispherical analyser and a monochromatised
radiation source (Al K, 15.0 kV, 150 W). The analysed area was 800 x 300 µm2, allowing
the acquisition of three spectra on each sample. Spectra were taken at a 90 ◦ take-off
angle. Pass energies used for survey scans and high-resolution elemental scans were 160
62

eV and 40 eV, respectively. Spectra were referenced to C-C/C-H at 284.8 eV for PP in
the C 1s spectrum. Sample charge up was compensated by the built in neutraliser leading
to an average shift of the C 1s peak maximum of 4 eV from the reference value of 284.8
eV.
Data reduction was performed by applying Casa XPS software96 version 2.3.16. Back-
ground subtraction in the survey spectra was performed using the implemented routine
with a Shirley background, as implemented in the Casa XPS software. Elemental concen-
tration was calculated from the peak areas by using the sensitivity factors provided by
the instrument manufacturer.
Spectra were fitted by assuming a Gaussian/Lorentzian-Sum-Shape (90/10) for all
components. A variation of the position of the peak maximum of ± 0.5 eV was allowed
for the binding energy of the spectrum components as well as a full width at half-maximum
(FWHM) variation of ± 2 eV around a mean of 1.0, 1.6 and 1.6 eV for C 1s, N 1s & F
1s. In the case of the PP C-C peak, the FWHM was in the range 0.8-1.1 eV.
4.21 Computational Methods
4.21.1 Predicted 3D Structures of APs for the Prediction of the
Concentration Required for a Monolayer
To calculate an estimate of the solution concentration required for one monolayer of AP on
a substrate surface, the 3D volume of each AP was modelled on a cube, using coordinates
calculated with COSMOconf software by COSMOlogic GmbH & Co KG (Germany). The
energetically favourable lower energy conformer (in the gas phase) was used for the model.
An area of 8 x 8 cm was used, a 1:1 reaction stoichiometry was assumed, where a
molecule of area x would react to one polymer of area x. The thickness of the film applied
was selected as 5 µm, representing the area and thickness covered by a dried coating after
a doctor blade application method (used in Chapter 8). The 3D area of a TPD, TPDOH
63
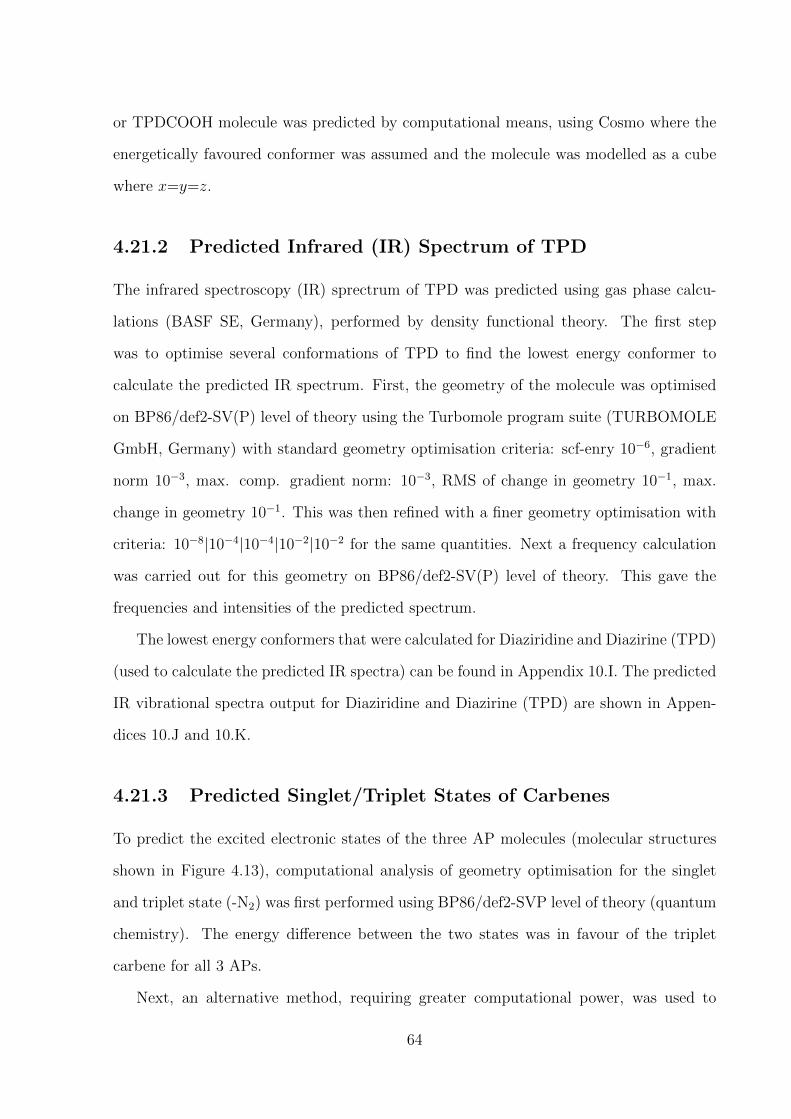
or TPDCOOH molecule was predicted by computational means, using Cosmo where the
energetically favoured conformer was assumed and the molecule was modelled as a cube
where x=y=z.
4.21.2 Predicted Infrared (IR) Spectrum of TPD
The infrared spectroscopy (IR) sprectrum of TPD was predicted using gas phase calcu-
lations (BASF SE, Germany), performed by density functional theory. The first step
was to optimise several conformations of TPD to find the lowest energy conformer to
calculate the predicted IR spectrum. First, the geometry of the molecule was optimised
on BP86/def2-SV(P) level of theory using the Turbomole program suite (TURBOMOLE
GmbH, Germany) with standard geometry optimisation criteria: scf-enry 10−6, gradient
norm 10−3, max. comp. gradient norm: 10−3, RMS of change in geometry 10−1, max.
change in geometry 10−1. This was then refined with a finer geometry optimisation with
criteria: 10−8|10−4|10−4|10−2|10−2 for the same quantities. Next a frequency calculation
was carried out for this geometry on BP86/def2-SV(P) level of theory. This gave the
frequencies and intensities of the predicted spectrum.
The lowest energy conformers that were calculated for Diaziridine and Diazirine (TPD)
(used to calculate the predicted IR spectra) can be found in Appendix 10.I. The predicted
IR vibrational spectra output for Diaziridine and Diazirine (TPD) are shown in Appen-
dices 10.J and 10.K.
4.21.3 Predicted Singlet/Triplet States of Carbenes
To predict the excited electronic states of the three AP molecules (molecular structures
shown in Figure 4.13), computational analysis of geometry optimisation for the singlet
and triplet state (-N2) was first performed using BP86/def2-SVP level of theory (quantum
chemistry). The energy difference between the two states was in favour of the triplet
carbene for all 3 APs.
Next, an alternative method, requiring greater computational power, was used to
64

calculate the ground electronic states. The method was based on a previous study of
an unsubstituted diazirine.155 Multi-configurational self-consistent field theory (MC-
SCF) numbers were used with a small reference space and def2-SV(P) basis set, with
the BP86/derf2-SV(P)-optimised geometries (the MCSCF program was implemented in
Gaussian software). This calculation method has the advantage of analysing many dif-
ferent arrangements of electrons in the spin orbitals. The energy difference between the
two states calculated with MSCSCF was also in favour of the triplet carbene for all 3
APs, thus both calculations were in agreement. Further details on the MCSCF theory for
excited states can be found elsewhere.156
The results are shown in Appendix 10.L. For the initial geometry optimisation: the
triplet carbene was favoured for TPD, TPDOH, TPDCOOH by -38.2 kJ mol−1, -32.2 kJ
mol−1 and -47.1 kJ mol−1, respectively. For the MCSCF-numbers and def2-SV(P) basis
set, the triplet carbene was also favoured for TPD, TPDOH, TPDCOOH by -27.9 kJ
mol−1, -15.3 kJ mol−1 and -32.4 kJ mol−1, respectively.
(a) (b) (c)
Figure 4.13: Molecular structures of the carbenes generated from (a) TPD, (b) TPDOHand (c) TPDCOOH, with the loss of N2.
4.22 Temperature Measurement during UV Curing
The temperature change during UV curing was measured using a V-M.O.L.E Thermal
Profiler by Electronic Controls Design Incorporated (USA).
65
4.23 Ultraviolet-Visible (UV-Vis) Spectroscopy
4.23.1 Thermal Degradation
Ultraviolet-visible spectroscopy (UV-Vis) was used to test the thermal degradation of
AP solutions. A Varian Cary 5000 UV-Vis-NIR Spectrophotometer equipped with a
temperature control was used. The temperature was controlled with the Varian software
via an external temperature controller which drove a Peltier heat pump attached to the
sample holder for both the sample and reference beams. Thermocouples in the sample
holders were used to provide feedback to regulate the sample temperature.
AP solutions were prepared in toluene (b.p 110 − 111 ◦C) because a solvent with a
higher boiling point than the experiment temperature (80/100 ◦C) was needed to avoid
rapid evaporation of the solvent. To compensate for any pressure build up, a quartz
cuvette closed with a septum sealed cap (Starna Scientific Limited, UK) was connected
to a syringe and balloon, to which excess gas could escape.
The solutions were placed into the quartz cuvette and heated to the correct tem-
perature. A blank measurement was taken at room temperature before the instrument
measured the spectra over a set repeating period of time. The sample time was chosen
depending on the measurement conditions. For example, less measurements were needed
at 100 ◦C than 80 ◦C due to the higher rate of reaction. Sample measurement commenced
once the required temperature was reached.
The same experiment was repeated at room temperature to test for any degradation in
the room light and temperature. It was concluded no degradation of the solution occurred
at room temperature in the time period of the experiment.
Calibration solutions were prepared and measured. Calibration curves were generated
and the absorbance change with time was converted to the concentration change over
time.
66

4.23.2 UV Degradation
To test the effect of UV power on the degradation of AP solutions over time, an external
UV cabinet by MRC systems GmbH (Germany) was used. Samples were manually taken
over time and the UV-Vis spectra were measured with an Ocean Optics (USA) UV-Vis
USB 4000 detector. The UV cabinet was equipped with four Philips (Netherlands) Actinic
TL 20W/10, G13 Lampholder, 590 mm length lamps with a λmax at 370 nm and spectral
output from ∼340 - 400 nm.
The power was varied from 0.1 mW cm−2 up to the maximum 2 mW cm−2. The
temperature was monitored and never exceeded 30 ◦C.
The change in absorbance intensity was measured over time, and converted to a change
in concentration over time using calibration curves. The relationship between the rate of
reaction and the UV power was then investigated.
4.24 Nuclear Magnetic Resonance (NMR) Spectroscopy
Bruker NMR instruments (Bruker BioSpin GmbH, Germany) were used to record various
types of nuclear magnetic resonance (NMR) spectroscopy: 1H NMR (500 MHz), 13C NMR
(125 MHz), 19F NMR (376 MHz), 2D 1H COSY NMR (500 MHz) and 2D 1H NOESY
NMR (500 MHz), respectively. The spectra were analysed using Mestrenova software,
version 8.1 (Mestrelab Research, Spain).
4.25 Electron Paramagnetic Resonance Spectroscopy
(EPR)
Electron paramagnetic resonance spectroscopy (EPR) was used to detect the formation of
triplet carbenes (unpaired electron species) upon thermal or UV activation of TPDCOOH.
The measurements were performed at the national EPR research facility at the University
67

of Manchester.
4.25.1 UV Degradation
The TPDCOOH sample was measured as provided (pure, white powder), being loaded
into a 4 mm outside diameter (OD) quartz tube. Spectra were recorded using a Bruker
(USA) EMX Micro spectrometer equipped with a Premium-X microwave bridge (9.87
GHz, X-band frequency) at room temperature (power 20 mW, 10 dB attenuation; 60 dB
receiver gain, 4 G modulation amplitude). Two scans were recorded for each sample over
the range 0 - 6800 G. The first sample was recorded with no irradiation, whereas the
second sample was run after five minutes of irradiation using a 365 nm LED, guided by
fibre-optic cable into the sample tube. This was maintained whilst running the spectrum.
4.25.2 Thermal Degradation
The sample was measured as provided, being loaded into a 4 mm OD quartz tube. Spectra
were recorded using a Bruker (USA) EMX Micro spectrometer equipped with a Premium-
X microwave bridge (9.87 GHz, X-band frequency). The power was varied between 2 mW
and 20 mW; the attenuation varied between 10 dB and 20 dB; the receiver gain was tested
between 10 dB and 60 dB; the modulation amplitude was set at 4 G. The temperature
was set at 80 ◦C. Samples were also measured at 100 ◦C but no differences were observed.
4.26 Mass Spectrometry Techniques used for Solu-
tion Analysis
General All experiments were carried out on a Micromass GCT instrument (Waters,
USA) with an orthogonal acceleration time-of-flight (ToF) mass spectrometer, equipped
with a HP6890 gas chromatograph and a Linden CMS (Germany) Liquid Injection Field
Desorption (LIFDI) probe, respectively.
68

4.26.1 Gas Chromatography / Mass Spectrometry (GC/MS),
Field Ionisation (FI) (Cool-on-Column Technique)
4.26.1.1 Gas Chromatography
The gas chromatography (GC) column used in this study was a 10-m ZB-1 HT (Zebron
Inferno, Phenomenex USA) with 0.25 µm film thickness and 0.25 mm inside diameter (ID)
capillary (Zorbax), connected to a 0.53 mm x 10 cm guard column, which itself is con-
nected to a cool-on-column (COC) injector. About 1 µm of the sample was deposited via
the COC injector directly into the guard column. The temperature of the GC-ToF inter-
face was maintained at 250 ◦C. The initial GC oven temperature was typically controlled
at 60 ◦C and ramped up to 250 ◦C at 80 ◦C/min to ensure the separation of low-boiling
species and the elution of high-boiling molecules.
4.26.1.2 Field Ionisation (FI)
Field ionisation (FI) is used to ionise molecules eluting from the GC. The FI emitter
(CARBOTEC, Germany) consists of a 5 µm tungsten wire onto which short carbon mi-
croneedles (length approx. 5 µm) have been grown. The FI emitter is carefully aligned
with the end of the GC capillary column so that effluent molecules pass near the tips
of the carbon dendrites. The emitter (at ground voltage) is approx. 2 mm away from
a pair of extraction rods held at high potential (-12 kV), producing very high electric
fields (107-108 V cm−1) around the tips of the carbon dendrites. It is generally believed
that, under the influence of these fields an electron can be removed from the molecule via
quantum tunneling effects, generating radical molecular ions with minimal fragmentation.
The FI emitter current was typically set at 0 mA during the scan. The emitter is flashed
by a current of 9 mA during an interscan cycle (0.3 s) to regenerate the emitter.
69

4.26.1.3 Time-of-Flight (ToF) Mass Spectrometry
Ions generated by FI are accelerated and focused into a pusher region of the ToF. A
voltage pulse of 960 V is applied, ejecting ions orthogonal to the original ion path. The
ion packet drift occurred through a ToF with a path length of approx. 0.45 m. A reflectron
reflects ions back to a dual microchannel plate detector. Ion arrivals are recorded using
a time-to-digital converter (TDC) with a sampling rate of 3.6 GHz. The voltage pulse is
applied at a frequency of 30 kHz. A full spectrum is generated every 40 µs. The mass
range is normally set at 10-700 Da. The scan duration time / spectrum accumulation
time is 1.2 s (i.e. every scan is an accumulation of 30,000 spectra).
4.26.1.4 Mass Scale Calibration
Perfluoro tributylamine (PFTBA, FC43) was used as a reference compound to calibrate
a mass range from 50 to 614 Da. The calibrant was introduced into the ion source via a
reference inlet and was pumped out after the calibration.
4.26.2 Positive Ionisation Mass Spetrometry (MS), (LIFDI)
4.26.2.1 Liquid Injection Field Desorption Ionisation (LIFDI)
LIFDI is used to ionise molecules which are dissolved in volatile solvents (in this work
THF). The sample solution is introduced via a deactivated fused silica capillary (ID 50
µm) and its droplets are deposited directly onto the carbon microneedles. After self-
evaporation of the solvent (high vacuum, ∼1−5 mbar), the analytes stay at the surface of
the carbon dendrites. The field desorption (FD) emitter (Linden CMS GmbH, Germany)
consists of a 13 µm tungsten wire onto which long carbon microneedles (length approx.
60 µm) have been grown. The FI emitter is carefully aligned to the extraction rods held
at high potential (-12 kV), producing very high electric fields (107-108 V cm−1) around
the tips of the carbon dendrites. It is generally believed that, under the influence of
these fields, an electron can be removed from the molecule via quantum tunneling effects,
70

followed by the desorption of the resulting radical molecular ions into the gas phase.
An emitter heating current (ehc) can be applied to support the ionisation / desorption
process. The ehc varies depending on the nature of the analytes, therefore, it was typically
ramped from 0 - 100 mA during the data aqcuisition. The ramping rate was set manually
and halted when higher currents of ion desorption occurred to avoid too much thermal
influence. When an ehc ramp is applied, an emitter regeneration cycle is not possible.
This was done at the end of the ramp at higher values of approx. 70-100 mA. Additional
information about the LIFDI process can be found elsewhere.157
4.26.2.2 Time-of-Flight Mass Spectrometry
ToF mass spectrometry was performed as described in Section 4.26.1.3. The parameters
were the same with the following exceptions. The voltage pulse is applied at a frequency
of 16.7 kHz. A full spectrum is generated every 60 µs. The mass range is normally set at
10 - 2000 Da. The scan duration time or spectrum accumulation time is 1.8 s (i.e. every
scan is an accumulation of 30,000 spectra).
4.26.2.3 Mass scale Calibration
Mass scale calibration was performed as described in Section 4.26.1.4.
4.27 Infrared Spectroscopy (IR)
4.27.1 Transmission Infrared Spectroscopy (IR)
The IR spectra were recorded with 4 cm−1 resolution, using a potassium bromide (KBr)
window and Thermo Fischer Scientific (USA) 6700-2 Fourier Transform (FT) infrared
spectrometer, equipped with a deuterated triglycine sulfate (DTGS) detector and a KBr
beamsplitter.
71

4.27.2 Attenuated Total Reflection Infrared Spectroscopy (ATR-
IR)
All ATR-IR spectra were recorded on a Nicolet Nexus FTIR spectrometer (Thermoscien-
tific, USA) equipped with DTGS detector using a commercial Diamond-ATR unit (Smart
Orbit, Thermoscientific, USA). Spectra were obtained by accumulating 32 scans at 4 cm−1.
The angle of incidence and the active reflections were close to 45 ◦ and 1, respectively.
The experiments were performed using unpolarized light. The ATR-IR measurements
were carried out at room temperature.
4.28 Raman Spectroscopy
Raman spectra were obtained with a Witec alpha 300 R (Witec GmbH, Germany) spec-
trometer containing a green Nd:YAG (neodymium-doped yttrium aluminum garnet) laser
(compass 315-50) of wavelength 532 nm, and power of ∼ 25 mW.
4.29 Colorimetry
The yellowness of AP solutions was tested using a LICO 400 colorimeter (analis, Belgium).
The solutions were placed into 1 mm round cuvettes. The Hazen-Farbzahl method was
selected (DIN ISO 6271, ASTM D 1209) and the measurements were calibrated against
water (=0). The scale ranged from 0 - 1000.
4.30 Differential Scanning Calorimetry (DSC)
DSC is a technique in which the difference in energy inputs into a substance and a reference
material is measured as a function of temperature, while the substance and reference
material are subjected to a controlled temperature program.
The test method used complies with DIN 51007. A TA 800 heatflux DSC (Mettler,
72
USA) was used with a closed high-pressure glass cell. Liquid samples (TPD and TPDOH)
were measured under a nitrogen atmosphere, whilst the white powder solid (TPDCOOH)
was measured in air. An empty cell was used as a reference. The evaluated temperature
range was 30 − 500 ◦C, the heating rate was 2.5 K min−1 and the sensitivity was set at
either 20 mW or 50 mW.
The onset temperature refers to the point at which a deflection from the established
baseline is first observed.
The peak temperature corresponds to the maximum deflection of the DSC curve.
Peaks observed above the baseline refer to exothermic processes (chemical reactions
accompanied by the evolution of heat).
4.31 Simultaneous Differential Scanning Calorimetry
- Thermogravimetric Analysis (DSC - TGA)
The principles of DSC and thermogravimetric analysis (TGA) were combined by mounting
the sample and the reference sensor system of a DSC instrument on either side of a TGA
scale, thus enabling the simultaneous measurements of mass and enthalpy changes of a
sample relative to an inert reference.
The test method complies with DIN 51006 and DIN 51007. A 449 C simultaneous ther-
mal analyser (STA) (Netzch GmbH, Germany), which is a heat-flow differential scanning
calorimeter combined with a compensating thermal balance, was used with an aluminium
oxide (Al2O3) open crucible. An empty crucible was used as a reference. Liquid samples
(TPD and TPDOH) were measured under a nitrogen atmosphere, whilst the white pow-
der solid (TPDCOOH) was measured in air. A gas flow rate of 20.0 cm3 min−1 was used.
The temperature range measured was 30− 500 ◦C. The heating rate was 2.0 K min−1.
The principle behind DSC is described in Section 4.30. TGA is a technique in which
the difference in mass change of a substance and reference material is measured as a
function of temperature, while the substance and reference are subjected to a controlled
73

temperature program. The onset and peak temperatures were measured, as described
above.
One disadvantage of the DSC-TGA measurement was that an open cell was required.
Therefore, volatile substances such as TPD were likely to evaporate during the measure-
ment, rendering the results inaccurate / unreliable.
4.32 Impact Sensitivity Drop-Weight Test
Each AP was impacted by a drop-weight, falling from different given heights. It was ob-
served whether the impact initiates explosive decomposition of the substance, as detected
by a recognisable bang. This method is used in the chemical industry to determine the
safety measures needed for different substances. The test method can be found in the EC
Commission Directive 92/69/EEC, Annex A.14.
4.33 Synthesis of 3-phenyl-3-(trifluoromethyl)-3H- di-
azirine (or TPD)
The details of the synthesis of TPD can be found in Appendix 10.M.
4.34 Reaction of Trimeric Isocyanate and TPDOH
BasonatTM100, a solvent-free aliphatic polyisocyanate, was provided by BASF SE. TP-
DOH was supplied by TCI chemicals as described above. HI 100 (1.29 g, 15mmol) was
mixed with 3 x TPDOH (0.5 g, 15mmol), and stirred in a bronze, foil-coated glass vial
for 96 hours.
4.35 Exploratory Data Analysis
A list of the data variable names that were tested can be found in Appendix 10.N.
74

4.35.1 Pearson and Spearman correlation analysis
The two lead responses tested were the CHT and the SJT, as shown in Table 4.2. The
numerical (xi) factors (parameters controlled as part of the experimental design) are
shown in Table 4.3 and the other numerical responses (parameters that were measured)
are shown in Table 4.4.
The Pearson correlation coefficient was calculated using Equation 4.9. It was assumed
that the data were linearly related and bivariate normally distributed.
r =n(∑xiyj)− (
∑xi)(
∑yj)
[n∑x2i − (
∑xi)2][n
∑yj2 − (
∑yj)2]
(4.9)
The Spearman’s rank-order correlation is the non-parametric version of the Pearson
correlation. It was calculated using Equation 4.10, where di = xi−yi (the distance between
two numbers in each pair of ranks) and n = the number of pairs of data. Spearmans
correlation coefficient is a statistical measure of the strength of a monotonic relationship
(no repeating data, i.e. no ”ties”) between paired data.
r = 1− (6∑di
2
n(n2 − 1)) (4.10)
Both the Pearson and Spearman correlation coefficients were calculated and their
values compared. Accordance between the Pearson and Spearman coefficient indicated
”normality” of the data (a difference between the Pearson and Spearman coefficient would
have indicated the presence of outliers / clusters, i.e. ”non-normality”).
The data were also checked visually by observing the bivariate scatter plots for yj =
mxi + c, and the data were concluded reliable.
4.35.2 ANOVA and Kruskal-Wallis
Two lead responses were tested: the CHT and the SJT, as shown in Table 4.2. The
categorical factors (xi) (parameters controlled as part of the experimental design) are
75
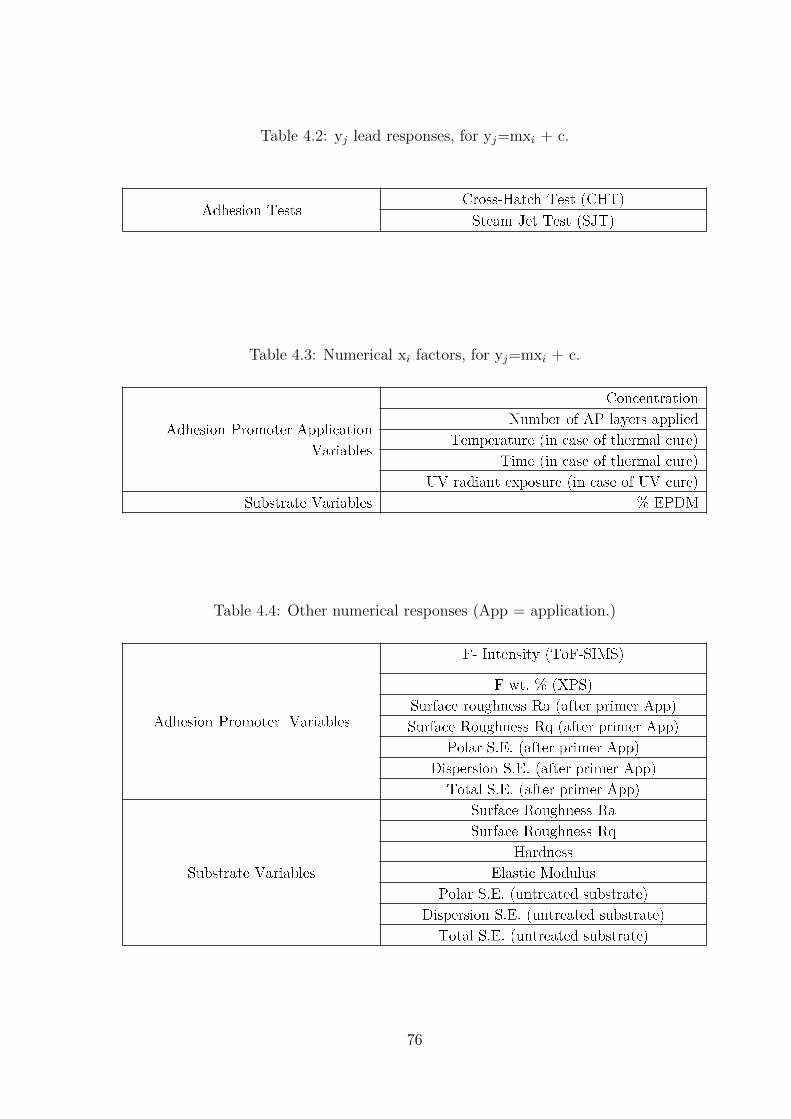
Table 4.2: yj lead responses, for yj=mxi + c.
Table 4.3: Numerical xi factors, for yj=mxi + c.
Table 4.4: Other numerical responses (App = application.)
76

shown in Table 4.5. A summary of how the categorical data was split into lead responses,
factors and levels, is shown in Figure 4.14.
Table 4.5: Categorical xi factors
Two principle statistical models were used to understand and explore the relationship
between lead responses and potential categorical (text) factors (xi): analysis of variance
(ANOVA) and Kruskal-Wallis. For visual representation of the data, boxplots were cre-
ated.
The difference between the two methods is that ANOVA is a parametric test and
Kruskal-Wallis is a non-parametric test. In simpler terms, non-parametric statistics do not
assume the data / population follows a Gaussian (normal) distribution whereas parametric
statistics do assume a Gaussian distribution. For example, if a school class took an exam
under a time limit, non-parametric statistics could be used for assessing the order in which
pupils completed the exam (1st, 2nd, 3rd etc.) and parametric statistics could be used
for looking at the scores of the exams. Hence the order (or rank) of the values are used
for non-parametric tests whereas the values themselves are used in parametric tests.
The two adhesion reponses (CHT or SJT) in Table 4.2 and the numerical responses in
Table 4.4 were experimentally determined. The ANOVA test was used to evaluate if the
population means (of the data measured) were equal, so that the null hypothesis was H=
µ1 = µ2 = ... = µk. It assumed the population variance was equal and that the data were
normally distributed. Subsequently, an ANOVA F-test could give inaccurate results when
the data were not normally distributed, therefore, the non-parametric Kruskall-Wallis test
77
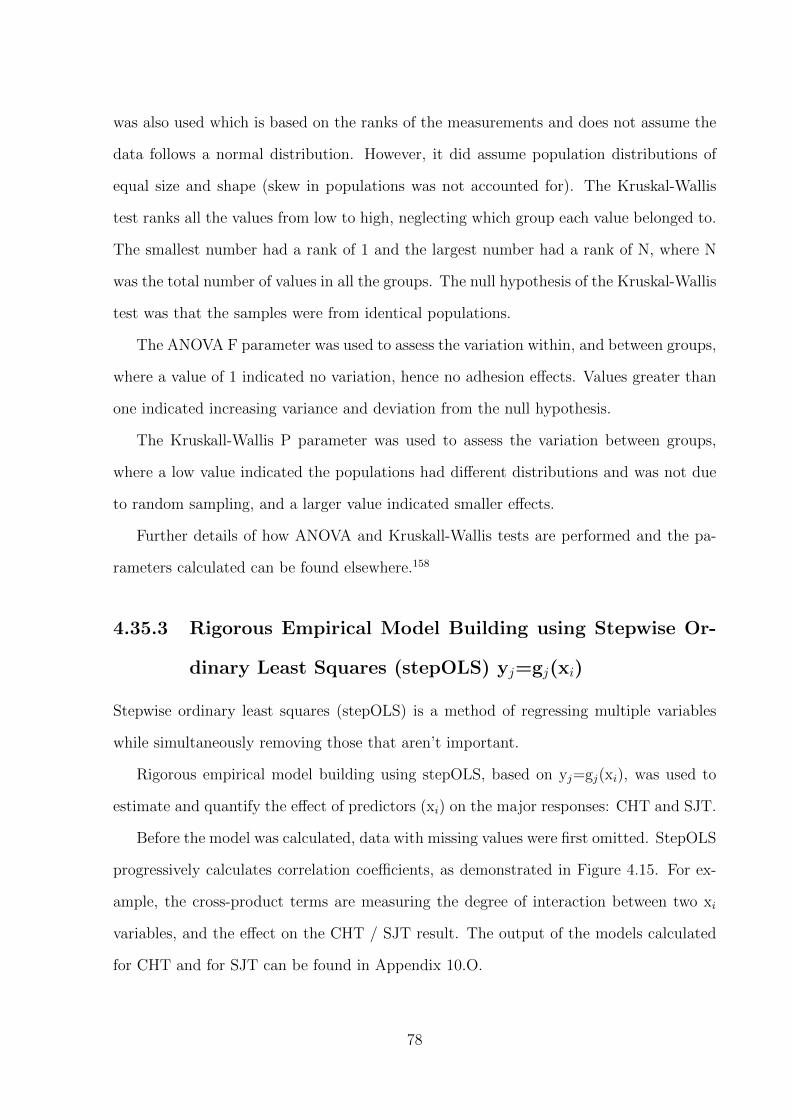
was also used which is based on the ranks of the measurements and does not assume the
data follows a normal distribution. However, it did assume population distributions of
equal size and shape (skew in populations was not accounted for). The Kruskal-Wallis
test ranks all the values from low to high, neglecting which group each value belonged to.
The smallest number had a rank of 1 and the largest number had a rank of N, where N
was the total number of values in all the groups. The null hypothesis of the Kruskal-Wallis
test was that the samples were from identical populations.
The ANOVA F parameter was used to assess the variation within, and between groups,
where a value of 1 indicated no variation, hence no adhesion effects. Values greater than
one indicated increasing variance and deviation from the null hypothesis.
The Kruskall-Wallis P parameter was used to assess the variation between groups,
where a low value indicated the populations had different distributions and was not due
to random sampling, and a larger value indicated smaller effects.
Further details of how ANOVA and Kruskall-Wallis tests are performed and the pa-
rameters calculated can be found elsewhere.158
4.35.3 Rigorous Empirical Model Building using Stepwise Or-
dinary Least Squares (stepOLS) yj=gj(xi)
Stepwise ordinary least squares (stepOLS) is a method of regressing multiple variables
while simultaneously removing those that aren’t important.
Rigorous empirical model building using stepOLS, based on yj=gj(xi), was used to
estimate and quantify the effect of predictors (xi) on the major responses: CHT and SJT.
Before the model was calculated, data with missing values were first omitted. StepOLS
progressively calculates correlation coefficients, as demonstrated in Figure 4.15. For ex-
ample, the cross-product terms are measuring the degree of interaction between two xi
variables, and the effect on the CHT / SJT result. The output of the models calculated
for CHT and for SJT can be found in Appendix 10.O.
78
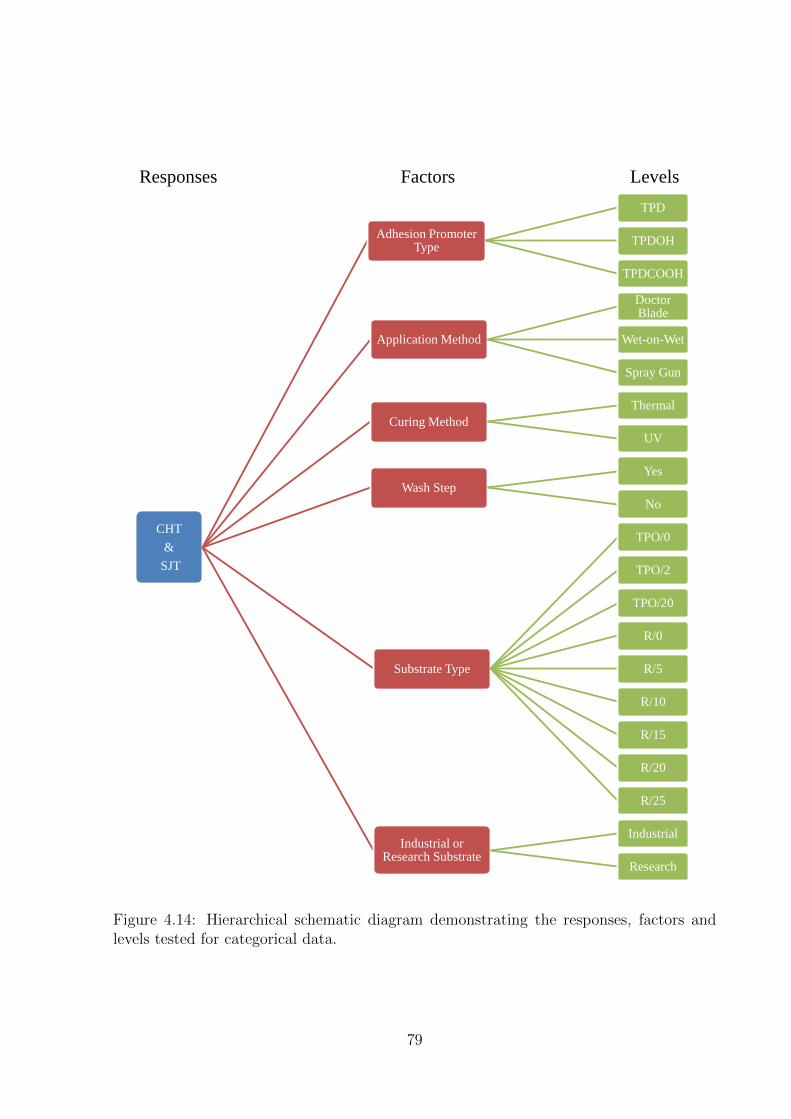
CHT
&
SJT
Adhesion Promoter Type
TPD
TPDOH
TPDCOOH
Application Method
Doctor Blade
Wet-on-Wet
Spray Gun
Curing Method
Thermal
UV
Wash Step
Yes
No
Substrate Type
TPO/0
TPO/2
TPO/20
R/0
R/5
R/10
R/15
R/20
R/25
Industrial or Research Substrate
Industrial
Research
Responses Factors Levels
Figure 4.14: Hierarchical schematic diagram demonstrating the responses, factors andlevels tested for categorical data.
79

CHT or SJT
1. Test Linear Terms with Xi
2. Test Cross-Product Terms
(interaction between 2 Xi)
3. Test Univariate order terms
(interaction between multiple Xi)
Insignificant Terms Deleted
Linear Terms Added
Cross-Product Terms Added
Higher Order Terms Added
Necessary
?
Necessary
?
Sufficient
?
Model Created
Necessary
?
Refit M
od
el an
d R
etest A
ll Ter
ms
Yes
Yes
Yes
No
No
No
No
Yes
Figure 4.15: The stepwise Ordinary Least Squares (stepOLS) modelling process.
80

Part III
Results and Discussions
81

Chapter 5
SUBSTRATE CHARACTERISATION
5.1 Overview
An overview of this chapter to guide the reader through the results is shown in Figure
5.1. The main focus of this chapter was to predict the adhesive properties of various
types of PP-based substrates, based on the characterisation of the surface and sub-surface
properties (and the previous work of others discussed in Section 2.4). Additionally, the
adhesive properties of flaming the substrates, and the use of a CPO AP were investigated,
to be used as standards.
5.2 Introduction
Various research groups have linked surface and sub-surface properties of TPO substrates
to the adhesion performance of applied coatings.3,67,68,72,73,73 It is thought that the pres-
ence of an elastomer (such as EPDM) in a TPO substrate strongly influences the adhesive
properties. Other surface properties such as chemical composition, surface roughness, sur-
face free energy as well as the substrate hardness and Young’s modulus, have all been
previously linked to the paintability of TPO substrates, as discussed in Section 2.4.
82

Substrate
Characterisation
Surface
Surface Roughness Flow of Adhesive & Surface Area of
Contact
Surface Energy Compatibility with
Waterborne Coatings
Chemical Structure Surface Chemistry
Hardness Surface
Penetrability
Sub-Surface
State-of-Art Adhesion Tests Adhesion Standard
Expected
Theme Topics Measurements Knowledge Gained
Figure 5.1: A summary of the substrate characterisation chapter.
5.3 Substrate Morphology
5.3.1 EPDM Mapping
5.3.1.1 Untreated Substrates
As discussed in Section 2.4, literature suggests that EPDM effects the adhesion of polar
coatings to TPO substrates. It is believed that CPO APs are able to anchor into the
EPDM subsurface domains, which modifies the TPO surface, and increases the adhe-
sion to waterborne coatings. Likewise, the flame pretreatment is more effective on TPO
substrates containing EPDM. The double bonds within EPDM are broken by the flame,
and the surface oxidises. Thus, the adhesion to waterborne coatings is improved. A
method was therefore developed, to assess the microstructure of the substrates to locate
the EPDM domains within the PP matrix. Based on these findings, hypotheses could be
made predicting the adhesive behaviour of the substrates.
Literature suggests in co-extruded PP / EPDM injection moulded TPOs, the EPDM
83
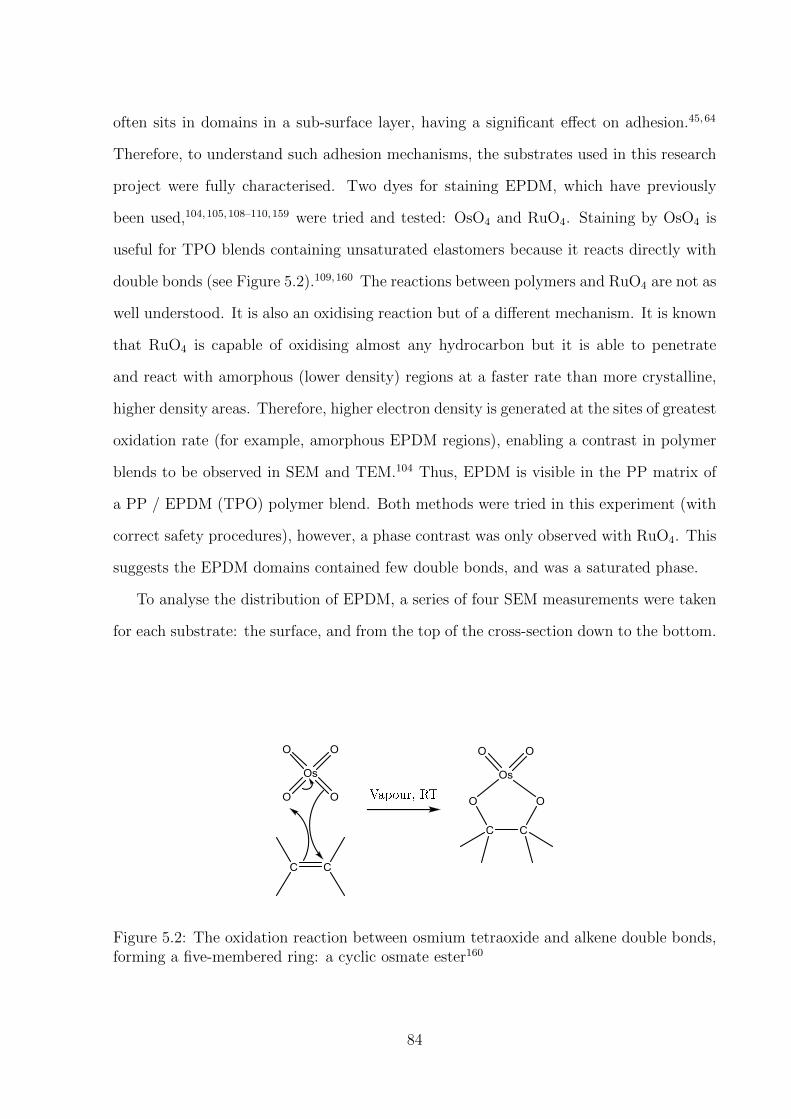
often sits in domains in a sub-surface layer, having a significant effect on adhesion.45,64
Therefore, to understand such adhesion mechanisms, the substrates used in this research
project were fully characterised. Two dyes for staining EPDM, which have previously
been used,104,105,108–110,159 were tried and tested: OsO4 and RuO4. Staining by OsO4 is
useful for TPO blends containing unsaturated elastomers because it reacts directly with
double bonds (see Figure 5.2).109,160 The reactions between polymers and RuO4 are not as
well understood. It is also an oxidising reaction but of a different mechanism. It is known
that RuO4 is capable of oxidising almost any hydrocarbon but it is able to penetrate
and react with amorphous (lower density) regions at a faster rate than more crystalline,
higher density areas. Therefore, higher electron density is generated at the sites of greatest
oxidation rate (for example, amorphous EPDM regions), enabling a contrast in polymer
blends to be observed in SEM and TEM.104 Thus, EPDM is visible in the PP matrix of
a PP / EPDM (TPO) polymer blend. Both methods were tried in this experiment (with
correct safety procedures), however, a phase contrast was only observed with RuO4. This
suggests the EPDM domains contained few double bonds, and was a saturated phase.
To analyse the distribution of EPDM, a series of four SEM measurements were taken
for each substrate: the surface, and from the top of the cross-section down to the bottom.
Figure 5.2: The oxidation reaction between osmium tetraoxide and alkene double bonds,forming a five-membered ring: a cyclic osmate ester160
84

Figure 5.3 shows topographical micrographs of the RuO4 stained substrate cross-
sections taken from the top part of the substrate cross–section, generated with SEM
using back-scattered electrons to provide image contrast (areas of higher density, higher
atomic number or smaller porosity appear brighter). An industrial TPO/0 substrate was
used as a blank, and two industrial substrates were analysed: TPO/2 and TPO/20.
A description of the substrates can be found in Table 3.1. Globularly shaped EPDM
domains were observed in both the TPO/2 and TPO/20 substrates, characterised by
the presence of Ruthenium (Ru) from the dye, verified by EDX. They were found to
have an interpenetration phase morphology structure (the EPDM interpenetrates with
the PP).161–164 The EPDM domains that were observed in SEM were not observed in the
TEM micrographs collected.
50µm Talc
EPDM
CaCO3 5µm
7500:1
500:1
50µm
Top
50µm
750:1
EPDM
Talc 5µm 5µm
7500:1 7500:1
Su
bst
rate
Cro
ss-S
ecti
on
Bottom
Surface
Middle
(a)
(d) (c)
750:1
50µm
(b)
Figure 5.3: SEM micrographs of the top cross-section of ruthenium tetraoxide (RuO4)stained industrial substrates, schematically represented in (a), for (b) TPO/0, (c) TPO/2and (d) TPO/20 (insert shows backscattered electrons on RHS) substrates.
85

The cross section of TPO/0 verified no EPDM domains were present. On the cross-
section of the TPO/2, the EPDM domains were found to be inhomogeneously distributed,
varying in size, with an average diameter of 10 µm. Figure 5.3 (c) highlights five EPDM
domains found at the top part of the cross-section. To calculate the approximate per-
centage (%) of EPDM coverage area, the SEM micrographs of TPO/2 were processed, as
described in the Section 4.2. Figure 5.4 shows the traced outlines of EPDM regions and
the approximate area coverage. The presence of the other additives in the TPO, which
may contribute to the calculation makes verification of this prediction difficult, however,
it could be observed that there was no significant accumulation of EPDM near the surface,
contradicting the findings of Ryntz et al.29,30,45,64,66,67 The distance between the EPDM
domains varied between 50 - 100 µm, explaining the reason why they were not observed
in TEM (they were beyond the field of view). The presence of EPDM was also checked
at the surface of the RuO4 stained substrates but no evidence of EPDM on the surface
was observed. Therefore, in the case of these industrial TPO substrates, it was expected
that EPDM would have little effect on adhesion.
For the TPO/20 substrate (Figure 5.3 (d)), the EPDM domains were also found to
be inhomogeneously distributed over the cross-section, with an average diameter of 1 µm,
smaller than that of TPO/2 (average diameter of 10 µm). Reasons for this are likely
to be the large difference in EPDM content, or different processing conditions in which
the substrates are manufactured and/or possibly the use of different grades of EPDM. It
was unexpectedly found that compared to TPO/2, less EPDM was detected in TPO/20
and the EPDM distribution in the micrographs did not match the given composition.
However, both samples contained a significant amount of calcium carbonate (CaCO3)
and talc, which both also appear lighter in contrast to the PP matrix, and therefore likely
hampered the interpretation of EPDM in the back-scattered micrographs. For this reason,
the micrographs of TPO/20 were not processed to predict the % coverage area of EPDM.
To eliminate the hindrance of other additives, substrates containing EPDM and only a
mould releasing agent were analysed with SEM. The change of substrate morphology as
86

50µm
500:1
Talc
EPDM
500:1
50µm
EPDM Area:
0.7%
EPDM Area:
0.5%
Up
per
U
pp
er M
idd
le
Lo
wer
Mid
dle
EPDM Area:
0.5%
EPDM Area:
0.6%
Lo
wer
Top Surface
Bottom Surface
Su
bstrate C
ross-sectio
n
Figure 5.4: SEM micrographs (left) taken from the cross -section of a TPO/2 substrateand images showing the traced EPDM domains and % area coverage calculated (right).
87

the % of EPDM increased was investigated and checked against the structure previously
described by Ryntz et al.29,30,45,64,66,67
The substrates in Figure 5.5 were manufactured for research purposes (they are not
used in the automotive industry), to assess the influence of EPDM on adhesion. They
contained varying percentages of EPDM (0 - 25 %) and were denoted as R/x, where x was
the % of EPDM. The only extra additive used other than EPDM, was a mould-releasing
agent needed for the production process. Again, RuO4 was found to be the best staining
method for the EPDM/PP contrast, and a combination of SEM and EDX was the best
technique to view the topography and composition. All samples, with the exception of
R/0 (blank), showed a clear visible phase separation between the PP matrix and the
EPDM dispersed phase, which due to the RuO4 staining, appeared bright in the image
contrast (backscattered electron mode). EDX confirmed the lighter domains were the
areas containing Ru from the dye. The blank substrate (R/0) verified the method.
Figure 5.5 shows that the EPDM was distributed inhomogeneously throughout the
matrix of the substrates, whereas the bulk EPDM appeared more spherical. As the % of
EPDM increased, elliptical shaped EPDM domains became more apparent towards the
surface, due to the shear forces imposed during the injection mould process.45,64 EPDM
particle dimensions varied and were typically between 1 and 10 µm, with some up to 50
µm. No larger domains of EPDM could be seen in the cross-section of (R/25), suggesting
a possible % of EPDM boundary at which only smaller domains were formed (however,
further experiments are required to prove this).
The SEM micrographs were processed as described in Section 4.2, to calculate the
approximate % area coverage of EPDM from the upper, middle and lower parts of the
substrates. The SEM micrographs displayed in Figure 5.6 are from the upper part of the
cross-section. The area of EPDM traced for calculation is displayed directly below each
micrograph. The table in Figure 5.6 shows the % area of EPDM calculated for each part
of the cross-section analysed. It was found that % area of EPDM calculated from each
section of each substrate did not match that of the given composition. However, a clear
88

Substrate Cross-section
50 µm 750 : 1 750 : 1
750 : 1
750 : 1 750 : 1
750 : 1 50 µm
50 µm
50 µm
50 µm
50 µm
Top
Su
rface
Botto
m S
urface
(a) (b)
(c) (d)
(e) (f)
Figure 5.5: SEM micrographs of ruthenium tetraoxide (RuO4) stained research PP sub-strates containing (a) R/0, (b) R/5, (c) R/10, (d) R/15, (e) R/20, (f) R/25, taken fromthe top part of the substrate cross section as shown in the schematic diagram.
89

50 µm
750 : 1 (a)
00
Substrate Cross-
Section
Top
Bott
om
% EPDM % Area
Top % Area Middle
% Area Bottom
0 0.0 0.0 0.0
5 0.7 1.8 2.5
10 2.3 5.7 4.7
15 13.0 10.9 11.7
20 10.0 14.5 15.9
25 19.5 21.3 16.8
(c)
(d) (e)
50 µm
750 : 1
50 µm
750 : 1
50 µm
750 : 1
50 µm
750 : 1
(b)
Figure 5.6: SEM micrographs of ruthenium tetraoxide (RuO4) stained research PP sub-strates taken from the top cross-section, containing: (a) R/5, (b) R/10, (c) R/15, (d)R/20, (e) R/25 (top) and images of the subsequent traced EPDM domains (bottom).Table: % area coverage of EPDM for the top, middle and bottom cross-sectional areas asshown in the schematic diagram (top, right).
% area increase was observed as the given % of EPDM increased. Since EPDM is 3D in
nature and these calculations are from a 2D image, the discrepancy in values could be
due to the directional nature of EPDM. Perhaps in an alternative direction (i.e. a cross-
section from an alternative plane), the % of EPDM would be greater. The irregularity of
% areas calculated also confirmed the inhomogeneous nature of the substrates. As with
the industrial TPOs, no significant accumulation of EPDM near the surface was observed,
differing from the structures observed by Ryntz et al.29,30,45,64,66,67 A difference between
the injection moulding parameters used in this study and by Ryntz et al. could be a
reason for the different morphologies observed.
90

50 µm
750 : 1 (a)
00
Substrate
Surface
% EPDM % Area at
Surface
0 0
5 2.4
10 4.9
15 13.4
20 18.5
25 41.0
(c)
(d) (e)
50 µm
750 : 1
50 µm
750 : 1
50 µm
750 : 1
50 µm
750 : 1
(b)
Figure 5.7: SEM micrographs of ruthenium tetraoxide stained research PP substratestaken from the surface, containing (a) R/5, (b) R/10, (c) R/15, (d) R/20, (e) R/25 (top)and images of the subsequent traced EPDM domains (bottom). Table: % area coverageof EPDM for the substrate surface, as shown in the schematic diagram (top, right).
Figure 5.7 shows the RuO4 stained SEM micrographs (top) and traced EPDM area
coverage images (bottom) of each research substrate surface. Although not displayed, no
image contrast was seen for the blank (R/0) substrate, verifying the method. No evidence
of EPDM at or near the surface on the cross-section of the R/5 substrate could be seen
in Figure 5.5(b), however, this was found not to be the case when looking at the stained
surface of the substrate, as shown in Figure 5.7(a). A clear contrast between EPDM and
the PP matrix was observed and the % of EPDM coverage was calculated to be 2.4 %.
All substrates were found to have EPDM domains at the surface (with the exception
of R/0). As the given % of EPDM increased, the % area coverage of the substrate surface
also increased. A clear difference in surface composition was seen between all substrates,
91
and from 10 - 25 % of EPDM, the direction of flow during the injection mould process
became apparent as the EPDM domains were found to be directional and elliptical in
nature (as previously described).
The calculation of the approximate area of EPDM coverage was found to be more
problematic as the given % of EPDM increased due to the EPDM and PP phase becoming
less distinguishable (may account for the large % of EPDM coverage area calculated for the
25 % EPDM substrate). However, the calculations indicate that adhesion was expected
to increase with given % of EPDM, if the EPDM at the surface was a significant factor
determining adhesion.
Heat Treatment It has previously been shown that heat treatment of a TPO substrate
promotes EPDM migration.72,73 This was important to analyse because the substrates
were subjected to two heat treatments at 80 ◦C during the basecoat and clearcoat curing
process (a ten minute treatment and a thirty minute treatment). When EPDM migrates
towards the surface of the substrate, it may play a significant role in an adhesion mech-
anism. To test this theory, all three industrial substrates, and all six EPDM research
substrates were subjected to a heat treatment at 80 ◦C for one hour, before being stained
with RuO4 and measured with SEM/EDX. No significant difference before and after
treatment could be seen for all substrates, with the exception of the TPO/20. Before
treatment, no EPDM was found at the surface, but Figure 5.8 shows that EPDM mi-
gration occurred during the heat treatment of the TPO/20 substrate. A large % of Ru
(confirmed by EDX) was found at the white areas of the treated TPO/20 substrate, due
to the stained EPDM domains. It was therefore hypothesised that if adhesion was signif-
icantly better for TPO/20 substrates compared to TPO/2 and TPO/0, it was likely that
the heat treatment during the coating process caused EPDM migration, which played a
role in the adhesion mechanism.
92

50µm 750:1
50µm 750:1
Point % C % O % Na % Mg % Al % Si % S % Ca % Ru
1 60.5 15.9 0.9 - - 0.7 1.2 6.1 14.7
2 58.2 14.2 - 0.4 0.4 0.5 - 6.7 19.7
3 61.4 13.8 - 0.8 0.5 1.1 - 5.3 17.1
4 43.1 21.6 - 0.4 0.5 0.4 - 9.4 24.6
5 69.6 9.0 - - 0.4 - - 4.9 16.1
OC
MgAl
Si
Ru
Ca
Ca
Point 4
50µm 750:1
(a) (b)
200
150
100
50
Counts
0
0 1 2 3 4 5
keV
1 2 3
4 5
Figure 5.8: SEM micrographs of the surface of TPO/20 (a) before treatment and (b)after heat treatment at 80 ◦C for 1 hour. Inset: area of EPDM magnified. The EDXgraph shows the chemical composition at point 4. The atomic % is displayed in the table(bottom) showing the presence of Ru (staining) on the areas appearing whiter in contrast,due to EPDM.
5.4 Physical Properties of Substrates
Further studies of the substrate properties can be found in Appendix 10.F. Hypotheses
were made to predict the adhesion of a substrate based on the influence of the substrates
surface roughness, chemical composition, mechanical properties (substrate hardness and
Young’s modulus) as well as the effect of abrasive and non-abrasive cleaning.
93
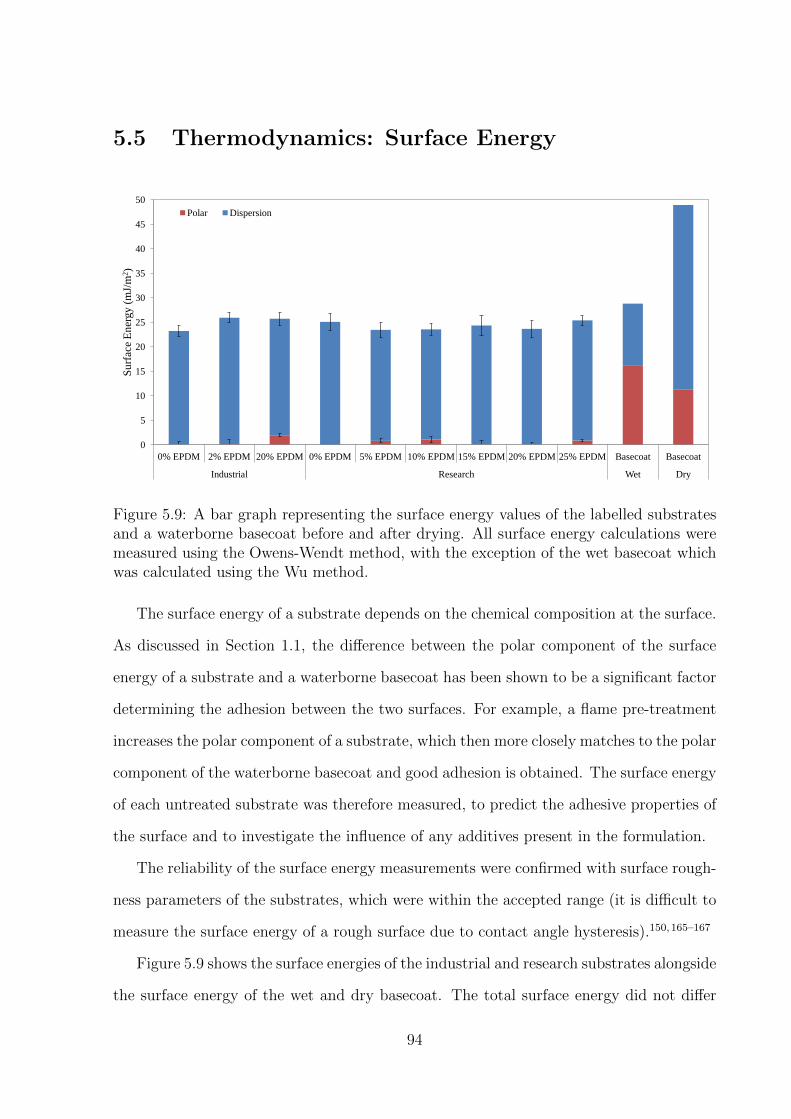
5.5 Thermodynamics: Surface Energy
0
5
10
15
20
25
30
35
40
45
50
0% EPDM 2% EPDM 20% EPDM 0% EPDM 5% EPDM 10% EPDM 15% EPDM 20% EPDM 25% EPDM Basecoat Basecoat
Industrial Research Wet Dry
Su
rfac
e E
ner
gy (
mJ/
m2)
Polar Dispersion
Figure 5.9: A bar graph representing the surface energy values of the labelled substratesand a waterborne basecoat before and after drying. All surface energy calculations weremeasured using the Owens-Wendt method, with the exception of the wet basecoat whichwas calculated using the Wu method.
The surface energy of a substrate depends on the chemical composition at the surface.
As discussed in Section 1.1, the difference between the polar component of the surface
energy of a substrate and a waterborne basecoat has been shown to be a significant factor
determining the adhesion between the two surfaces. For example, a flame pre-treatment
increases the polar component of a substrate, which then more closely matches to the polar
component of the waterborne basecoat and good adhesion is obtained. The surface energy
of each untreated substrate was therefore measured, to predict the adhesive properties of
the surface and to investigate the influence of any additives present in the formulation.
The reliability of the surface energy measurements were confirmed with surface rough-
ness parameters of the substrates, which were within the accepted range (it is difficult to
measure the surface energy of a rough surface due to contact angle hysteresis).150,165–167
Figure 5.9 shows the surface energies of the industrial and research substrates alongside
the surface energy of the wet and dry basecoat. The total surface energy did not differ
94

significantly between substrates within error. All substrates had a total surface energy of
a value close to 25 mJ m−2, which is a typical value for an inert, unreactive substrate.
The dispersive component (due to van der Waals forces) of the surface energy was
found to be the main contributing component and all substrates had a low polar compo-
nent. However, the industrial TPO/20 substrate, as well as the three research substrates
R/5, R/10 and R/25, showed higher polar component values compared to the other
substrates. The SEM micrographs (Section 5.3) of the substrate cross-sections, shown
in Figure 5.3, showed more talc and CaCO3 present near the surface of the industrial
TPO/20 substrate.
As discussed in Appendix 10.F.2, particles of talc have the shape of platelets due to
the layered structure of the mineral. The basal surfaces are hydrophobic168,169 and the
edge surfaces are hydrophilic.170–173 Therefore, the extra amount of talc observed in the
TPO/20 substrate, could be a reason for the larger polar contribution observed compared
to the other TPO substrates.
The CaCO3 particles are often coated with stearic acid174 because they have a tendency
to agglomerate in a TPO substrate (due to their large surface energy). This has the effect
of lowering the surface energy of the particles. It was not known if the CaCO3 had been
coated in the analysed substrates, however, the presence of uncoated CaCO3 at the surface
of the TPO/20 substrate could also have been a reason for the higher polar component
of the surface energy observed.
EPDM is reported to have a low surface energy of 23 mJ m−2 with a low polar
component,175,176 so it was unlikely that the EPDM contributed to the polar component
of the substrate surface energy. Furthermore, Figure 5.7 showed an increase in % of EPDM
at the surface of the substrates as the given % of EPDM of the substrates increased, but
this trend was not observed for the polar component of the surface energy with increasing
% of EPDM, also suggesting EPDM did not play a role in the increase of the polar
component of the surface energy of the substrates.
95
Overall, the polar contribution from the untreated substrates was low when compared
to the value of the waterborne basecoat (dry and wet). The surface energy difference
was too large, thus the basecoat was not able to wet the surface of the substrates. This
was found to be a main contributing factor which determined the poor adhesion observed
between a waterborne basecoat and untreated substrate.
5.6 The State of the Art: Adhesion of Polar Coatings
to Hydrophobic PP/EPDM (TPO) Substrates
As discussed in Section 2.4, two state of the art techniques to improve adhesion of polar
coatings to non-polar substrates are currently utilised in the automotive industry world-
wide. One is a flaming pre-treatment that is used to oxidise the surface, increasing the
interaction with subsequent applied coatings. The other is the use of liquid CPO APs,
which are thought to mechanically interlock into the substrate surface, thus increase inter-
actions with the subsequent coatings applied. They were discussed in greater detail in the
literature review found in Section 2.4. Both of the state of the art techniques were tried
and tested to find the correct parameters to obtain adhesion results that met industrial
standards. These techniques were then used as adhesion test standards, to compare with
newly developed APs.
5.6.1 Flaming Pre-treatment
Flaming is the current state of the art technique used in the European automotive indus-
try, as discussed in Section 2.3.1. It is used to physically modify the surface of the plastic
via oxidation. Many oxygen-containing species on the surface are formed as a result of the
flame. This makes the surface compatible with the waterborne basecoat, thus adhesion
to an industrial standard TPO is significantly improved. The change in surface energy
upon the flaming treatment, particularly of the polar component, has been shown to be
a key contributing factor to the improvement of adhesion.
96

Flaming +BC
Cure
80 ⁰C
10 min
+CC
Cure
80 ⁰C
30 min
Figure 5.10: Steps of the coating application and curing process.
To predict the adhesion on a flamed substrate, and test the hypothesis of a higher
polar component of the surface energy resulting in good adhesion, the surface energy was
measured of all substrates before and after flaming. As a first test to assess the adhesion
of the substrates before and after flaming, an ISO standard CHT was performed,85 as
described in Section 4.15. Before the adhesion test, all coatings were applied and cured,
as shown in Figure 5.10 (no substrate cleaning procedures were used).
It was important to test the adhesion after all coatings had been applied and cured,
because the adhesion was measured as a function of the whole system. For example, good
adhesion between a treated substrate and a waterborne basecoat did not necessarily result
in good adhesion after the top coat had been applied and cured. Furthermore, previous
work by Ryntz et al. found that various topcoat attributes effected the adhesion of a CPO
AP applied as a thin layer onto a TPO substrate.64 However, it was not an individual
property that affected the overall adhesion, but rather the whole system attributes.
The coatings were left to post-cure for 7 days after the final topcoat was applied,
prior to the adhesion tests. Figure 5.11 shows the setup of the cross-hatch test (CHT).
Tesa R© tape was applied to a grid on the coated surface, created by a 8-bladed knife,
and manually pulled away to assess the adhesion (number of squares delaminated), as
described in Section 4.15. The % of squares remaining in the grid determined the grade
of adhesion: 5 was the worst (0 % adhesion) and 0 was the best (100 % adhesion). When
good adhesion was obtained with the CHT, a further SJT test with Daimler-Chrysler
specifications was performed, as described in Section 4.16. When no delamination of the
painted layer was visible, the paint adhesion was considered as sufficient, meeting the
required industrial standards set by Daimler-Chrysler.
97

Figure 5.11: Photographs displaying the cross-hatch test (adhesion test) procedure. Re-produced with permission from BASF Coatings GmbH.
The surface energy measurements taken of the flamed and untreated substrates are
shown in Figure 5.12. The flaming pre-treatment was carried out on all types of substrates
using laboratory equipment with a setup shown in the schematic diagram in Figure 4.5.
The errors were calculated using maximum and minimum contact angles of the three
test liquids, as described in Section 4.5.1. As expected, it was found that the flaming
treatment significantly increased the overall surface energy of the substrates compared to
the untreated substrates. The increase in the polar component of the surface energy was
the greatest contributing factor, caused by the new oxygen containing species that were
created on the surface of the plastic substrate during the flaming treatment.
The results of the CHT and SJT from before and after flaming are displayed in Table
5.1. A correlation between the results of the CHT and the SJT was observed, and in
general, a poor CHT usually resulted in a poor SJT for the same flaming conditions. The
research substrates containing EPDM produced the best adhesion results compared to the
industrial TPO substrates. The substrate that produced the best results out of all the
substrates was the R/15 substrate, with a CHT score of 0 and a SJT score of 1 (for the
grading of the CHT and SJT, see Section 4.15 and Section 4.16). It was evident from the
surface energy result of the 15 % EPDM research substrate after flaming (shown in Figure
5.12), as to why the adhesion was greatly improved. The increase in polar component
of the surface energy was the greatest compared to all other substrates, and the value
was the closest match to the polar component of the wet basecoat. Therefore, when the
98
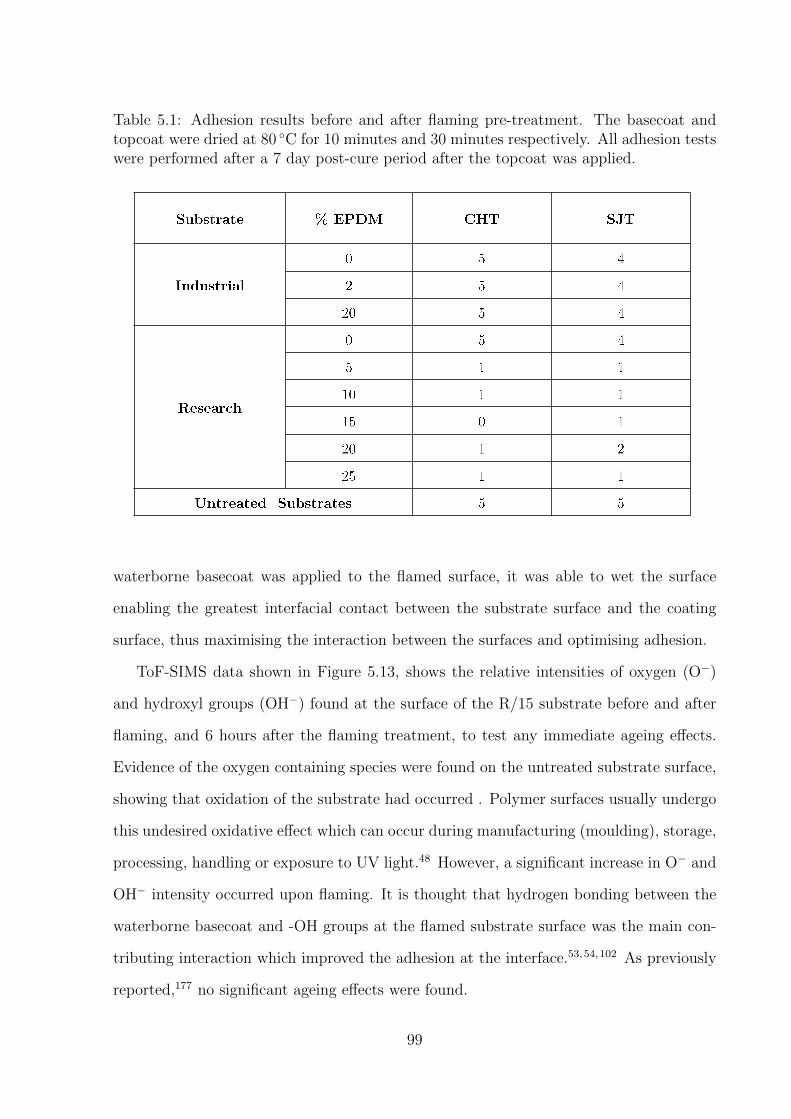
Table 5.1: Adhesion results before and after flaming pre-treatment. The basecoat andtopcoat were dried at 80 ◦C for 10 minutes and 30 minutes respectively. All adhesion testswere performed after a 7 day post-cure period after the topcoat was applied.
waterborne basecoat was applied to the flamed surface, it was able to wet the surface
enabling the greatest interfacial contact between the substrate surface and the coating
surface, thus maximising the interaction between the surfaces and optimising adhesion.
ToF-SIMS data shown in Figure 5.13, shows the relative intensities of oxygen (O−)
and hydroxyl groups (OH−) found at the surface of the R/15 substrate before and after
flaming, and 6 hours after the flaming treatment, to test any immediate ageing effects.
Evidence of the oxygen containing species were found on the untreated substrate surface,
showing that oxidation of the substrate had occurred . Polymer surfaces usually undergo
this undesired oxidative effect which can occur during manufacturing (moulding), storage,
processing, handling or exposure to UV light.48 However, a significant increase in O− and
OH− intensity occurred upon flaming. It is thought that hydrogen bonding between the
waterborne basecoat and -OH groups at the flamed substrate surface was the main con-
tributing interaction which improved the adhesion at the interface.53,54,102 As previously
reported,177 no significant ageing effects were found.
99

0
5
10
15
20
25
30
35
40
45
50
Untr
eate
d
Fla
med
Untr
eate
d
Fla
med
Untr
eate
d
Fla
med
Untr
eate
d
Fla
med
Untr
eate
d
Fla
med
Untr
eate
d
Fla
med
Untr
eate
d
Fla
med
Untr
eate
d
Fla
med
Untr
eate
d
Fla
med
Bas
ecoat
Bas
ecoat
0% EPDM 2% EPDM 20% EPDM 0% EPDM 5% EPDM 10% EPDM 15% EPDM 20% EPDM 25% EPDM Wet Dry
Industrial Research
Su
rfac
e E
ner
gy (
mJ/
m2)
Polar Dispersion
Figure 5.12: A bar graph representing the surface energy values of the labelled substratesbefore and after flaming and a waterborne basecoat before and after drying. All surfaceenergy calculations were measured using the Owens-Wendt method, with the exceptionof the wet basecoat which was calculated using the Wu method.
It was not clear why the R/15 substrate gave the largest increase in polar component of
the surface energy after flaming, because no significant difference between the microstruc-
ture of the R/15 and other research substrates was observed (the surface morphology,
chemical composition, surface roughness, mechanical properties and surface energy be-
fore treatment were all analysed). Thus, no unique properties of R/15 had been found, so
it was likely that a combination of properties determined the adhesion, rather than one
single property.
One possible reason for the better adhesion results obtained for R/15, could have been
that the substrate hardness and Young’s modulus were optimum values. The adhesion
tests on the softer substrates could have lead to cohesive failure within the substrates.
The harder substrates (found to have a lower surface roughness) could have resulted in a
lower depth of oxidation during flaming, or lower surface area of oxidation, resulting in a
lower amount of hydroxyl groups (considered the main promoter of paint adhesion).102
Although the R/15 substrate gave the best adhesion results after flaming, evidence of a
small delamination after the SJT was observed. Overall, none of the substrates produced
100

a non-damaged surface after the SJT. The Daimler-Chrysler SJT is a very tough adhesion
test, designed to mimic a car wash applying steam and pressure to an already damaged
coated surface, and it is difficult to achieve 100 % adhesion with this test.87 Varying
the flame parameters could have resulted in a greater SJT result, however, the flaming
parameters that were selected (described in Section 4.7) are those typically used in the
industry and were therefore chosen as a standard. Based on the results, the flamed R/15
substrate was selected to be the standard benchmark test, to compare with adhesion
results from novel APs.
0
20
40
60
80
100
Non flamed Flamed 6 hours after flame
No
rmal
ised
Inte
nsi
ty ‰
O- OH-
Figure 5.13: Normalised negative ToF-SIMS data taken from a R/15 research substratebefore and after flaming, and 6 hours after the flaming treatment.
5.6.2 CPO Adhesion Promoters
A second state of the art used in the industry to improve the adhesion between TPO
substrates and waterborne basecoats, is the use of CPO APs, as described in Section
2.3.2 (although, as previously mentioned, their use in Europe is limited due to the change
in environmental laws6). One type of CPO, supplied by Eastman, was tried and tested
to be used as a second standard benchmark ( in conjunction with a flamed substrate)
to compare with the adhesion of novel APs. Many papers that focus on understanding
the mechanism of adhesion with CPOs can be found.29,30,45,64,66–68 The mechanism is a
subject of speculation and is a complex topic. More details of the postulated mechanisms
101

can be found in the Literature review, Chapter 2.3.2.
Only one substrate type was tested (TPO/2, industrial and containing EPDM which
may improve CPO adhesive properties3,45,64 as discussed in Section 2.4.2) and research
effort was focused on finding the correct curing conditions to achieve good adhesion with
the CPO. It was reported that some types of CPO are able to penetrate into the substrate
surface, enabling a physical-mechanical interlocking-type adhesion mechanism. A cross-
sectional analysis of the cured substrate was performed using ToF-SIMS to analyse the
adhesion characteristics and generate ideas for new APs based on the same mechanism.
Although CPO APs can be used as an additive for a coating formulation, the best
results were obtained by applying the CPO directly to the substrate as a primer, followed
by the subsequent basecoat and topcoat.178 It was recommended in the CPO product
specification178 that the CPO worked best when prepared as a 8 - 10 % solid solution.
However, 8 %, 9 % and 10 % solid solutions were tested, and no good adhesion was
obtained. The application method was likely the reason for this, as preliminary tests
were done using a Doctor blade to apply the coatings, whereas the spray gun application
often yields the best results due to better controllability.
When the solution was applied as 40 wt.% solids in xylene, improved adhesion results
were obtained. Several primer layer thicknesses and two curing conditions were tested:
applying the CPO primer and allowing it to dry at 80 ◦C for ten minutes or applying the
CPO and basecoat wet-on-wet (that is, the basecoat is applied without drying the CPO
primer layer first). The results are shown in Table 5.2. Only the CHT was performed,
however, this was sufficient for having a standard for preliminary tests. The optimum
thickness for adhesion was found to be a 4 µm wet thickness and the wet-on-wet appli-
cation method was found to be the best curing condition, giving a CHT grade of 0. It
was not unexpected for the thicker primer layers to have poor adhesion because cohesive
failure occurred within the CPO primer layer itself.70
The cross-sectional image generated by ToF-SIMS of the TPO/CPO/basecoat/topcoat
is displayed in Figure 5.14. An additional layer is present: an epoxy-glue on top of the
102
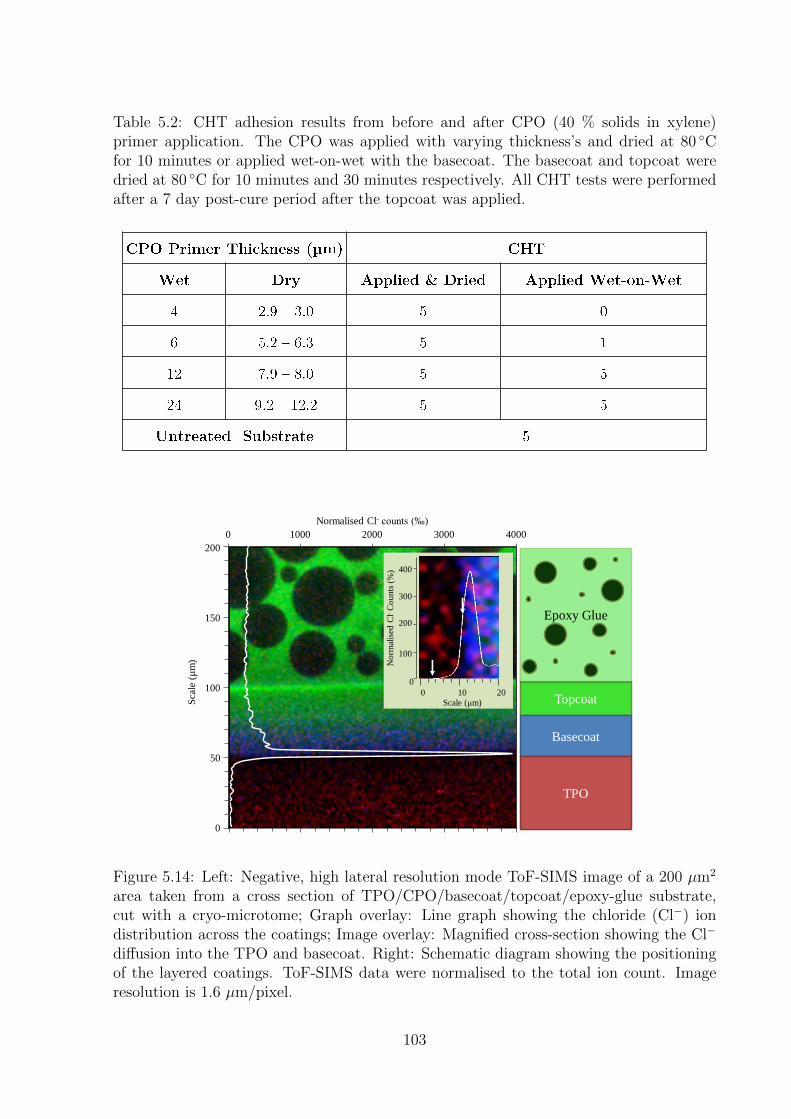
Table 5.2: CHT adhesion results from before and after CPO (40 % solids in xylene)primer application. The CPO was applied with varying thickness’s and dried at 80 ◦Cfor 10 minutes or applied wet-on-wet with the basecoat. The basecoat and topcoat weredried at 80 ◦C for 10 minutes and 30 minutes respectively. All CHT tests were performedafter a 7 day post-cure period after the topcoat was applied.
0 1000 2000 3000 4000
Normalised Cl- counts (‰)
0
50
100
150
200
Sca
le (
µm
)
Topcoat
Basecoat
TPO
Epoxy Glue
0 10
Scale (μm)
0
100
200
300
400
No
rmal
ised
Cl-
Co
unts
(%
)
20
Figure 5.14: Left: Negative, high lateral resolution mode ToF-SIMS image of a 200 µm2
area taken from a cross section of TPO/CPO/basecoat/topcoat/epoxy-glue substrate,cut with a cryo-microtome; Graph overlay: Line graph showing the chloride (Cl−) iondistribution across the coatings; Image overlay: Magnified cross-section showing the Cl−
diffusion into the TPO and basecoat. Right: Schematic diagram showing the positioningof the layered coatings. ToF-SIMS data were normalised to the total ion count. Imageresolution is 1.6 µm/pixel.
103

topcoat which was applied only for the microtome cutting process. Individual images
and characterisations were made for each layer, and a characteristic, unique mass peak
was identified in the ToF-SIMS spectrum to differentiate the topcoat, basecoat, CPO and
TPO substrate. The image was generated by a 3-colour scheme which was implemented in
the ToF-SIMS software, differentiating the TPO, basecoat and topcoat, as demonstrated
in the schematic diagram. The CPO Cl− ion intensity is shown as a line graph overlaying
the image. The white arrows shown on the magnified image of the CPO distribution
highlight the boundaries where the CPO may have penetrated into the TPO substrate.
Although, the 1.6 µm/pixel resolution limits the information available, the results
suggest CPO penetrated into the TPO by ∼ 6 - 8 µm, similar to that found by Ryntz
et al.28 and others.179 The penetration depth and diffusion rate of a CPO primer was
previously found to be dependent on the CPO molecular weight and molecular weight
distribution, as well as the degree of chlorination, maleation and crystallinity.28,67,180
Comparing the experimental results with the literature results suggests there was no effect
of the CPO layer thickness on the penetration depth as the thicknesses were different in
each study: 10 - 15 µm,28 50 µm179 and 4 µm in this study.
The mechanism of how the CPO APs improve adhesion has been speculated on over
the last several years. Clemens et al.70 also used ToF-SIMS as well as XPS and TEM
analysis, to attempt to elucidate an adhesion mechanism. It was determined that CPO
primers did not penetrate deeply into the PP and TPO substrates, and that adhesion was
likely to be due to the improved wetting of the substrate allowing for sufficient dispersion
interactions. However, several publications by Ryntz et al.28,45,64,69,71 suggest penetration
of CPO via solvent swelling and chain entanglement into the TPO substrate plays a key
role in the adhesion mechanism. The results obtained in Figure 5.14 suggest a similar
model, however, further work using an alternative method with higher lateral resolution
to analyse the cross-section would be required to verify the data obtained (this was not
the focus of this study).
104

5.7 Conclusions
One of the main influences on the adhesion of a TPO substrate cited in literature was
the EPDM content. Therefore, this was the first investigation. The characterisation of
the substrates to determine the EPDM content showed that the domains were inhomo-
geneously distributed and only little amounts were present in a subsurface layer, which
differed to the model previously suggested by Ryntz et al. It was thought that a differ-
ence in the processing conditions used to produce the injection-moulded substrates was
the main cause of the differences observed. Predicting the adhesion behaviour of a sub-
strate based on the given % of EPDM was therefore challenging, due to the inhomogeneity
of each substrate.
Based on the characterisation of the substrates used in this study (in addition, see Ap-
pendix 10.F), several hypotheses were made for determining the substrate characteristics
that would lead to greater adhesion. Better adhesion results were expected for:
• Research substrates with EPDM present at the surface: the AP is able to penetrate
into the EPDM domains causing polymer chain entanglement (mechanical adhesion
mechanism)
• TPO/20 substrate during thermal curing: EPDM migrates to the substrate sur-
face, allowing the AP to penetrate into the EPDM domains, causing polymer chain
entanglement (mechanical adhesion mechanism)
• Substrates containing EPDM or additives: creates a higher surface roughness which
allows for a higher contact area between the substrate and AP / basecoat, or sub-
strates have a lower hardness and Young’s modulus to allow an AP to penetrate into
the substrate surface causing a polymer chain entanglement (mechanical adhesion
mechanism)
• Substrates with CaCO3 and talc present at the surface: chemical reactions or inter-
actions with AP or basecoat (chemical adhesion mechanism)
105

• Substrates without the Irgafos 168 additive present at the surface→ its hydrophobic
and bulky nature causes steric hindrances with the AP or basecoat
• TPO substrates: they have a lower hardness and Young’s modulus, which enables
the AP, solvent or basecoat to penetrate into substrate surface allowing a higher
contact area and greater interactions, or the anchoring of an AP into the substrate
causing polymer chain entanglement (mechanical adhesion mechanism)
• Substrates cleaned with an abrasive method: creates a higher surface roughness
allowing for a higher contact area between the substrate and the AP or basecoat
The next chapter will investigate the ability of a group of candidate APs to physically
adhere to a substrate surface (swollen and non-swollen) via a polymer chain entanglement
mechanism, based on the believed mechanism of the state of the art CPO AP.
106

Chapter 6
PHYSICAL ADHESION: SURFACE SWELLING
AND INTERFACIAL POLYMER CHAIN
ENTANGLEMENT
6.1 Overview
An overview of this chapter to guide the reader through the results is shown in Figure
6.1. The main focus of this chapter was to identify suitable solvents to swell the PP-
based substrates, and test the ability of candidate APs to anchor into swollen or non-
swollen substrates, facilitating adhesion via a molecular chain entanglement (between the
substrate and AP polymer chains) mechanism. This adhesion mechanism was based on
CPO state of the art APs.
6.2 Introduction
APs are often dissolved in a solvent to aid wettability and reduce viscosity when they
are applied to the substrate surface. This increases the surface contact area and thus,
adhesion. Some solvents are able to swell the substrate surface, which could allow an AP to
penetrate into the substrate, enabling a mechanical interlocking adhesion mechanism.28–30
107

Theme Topics Measurements Knowledge Gained
Adhesion
via
Molecular
Chain
Entanglement
Surface Swelling from AP Solvent
Hansen Solubility Parameters
Which Solvents Swell Substrate
Mass Change over Time
Best Solvents to Swell Substrate
Surface Roughness
Change
Flow of Adhesive & Surface Area of
Contact
Change in Hardness
Change in Surface Penetrability
Adhesion Tests Degree of AP Entanglement
Screening of BASF Library for
Candidate APs
Wettability Degree of AP Coverage on
Surface
Surface Tension Compatibility of
AP with Substrate
Figure 6.1: A summary of the physical adhesion chapter.
It is important that the chosen solvent system evaporates at a reasonable rate, so that
the fully cured system is no longer swollen; if the substrate remained swollen, this could
result in a possible cohesive failure within the substrate material.45,74
Ryntz et al.45,64 demonstrated that adhesion to TPO is strongly influenced by the type
and amount of solvent within a CPO primer, as well as the TPO surface morphology. It
was suggested that the CPO is able to penetrate through a PP surface layer to the rubber
EPDM domains in a subsurface layer, where entanglements between CPO and substrate
polymer chains occur. An alternative perspective by Schuman et al.27 suggests not only
does the solvent need to swell the substrate, but it also needs to induce topographical
changes at the surface for an improved adhesion.
Jaehnichen et al.88 found that solvent swelling played a significant role in the improve-
ment of adhesion via a flaming pre-treatment. It was discovered that not only was the
108

increase in polarity at the surface a necessary condition for improved adhesion, but the
increase in polymer chain mobility upon solvent swelling (which occurred from the organic
solvent component of the waterborne basecoat) was important to improve the miscibility
between the waterborne basecoat components and the substrate polymer. This formed a
type of inter-phase.
As well as solvents found in AP solutions, solvents from subsequent coatings applied,
such as the topcoat, could also swell the substrate.45 The system studied in this report
used the same basecoat and topcoat, so it was assumed that the same solvent effect from
these coatings occurred for all adhesion tests. The focus on this chapter was to identify
possible solvents to be used for candidate AP solutions, with the aim to induce substrate
swelling and create a physical entanglement adhesion with the substrate polymer chains
(mimicking the adhesion mechanism of a CPO AP).
6.3 Substrate Swelling
HSPs151 were used to predict the best solvents to swell PP, as described in Section 4.17.
Initially, the relative mass change over time, was measured for one substrate type upon
exposure to four different solvents (selected by their HSPs). Cyclohexane was then se-
lected for further tests. To predict the adhesion behaviour on swollen substrates, the
effect of surface roughness and surface hardness upon exposure to cyclohexane (inducing
swelling of the substrates) was measured as a function of time. It should be noted that
measurements were not used to assess the surface energy change after solvent swelling,
due to the increased surface roughness upon exposure to the solvent which caused hys-
teresis in the contact angles measured, and impeded the surface energy values calculated
on the hydrophobic surfaces.150,165–167
As discussed in Appendix 10.F.3, the mechanical and physical properties of the sub-
strate are likely to have an effect on solvent penetration of the substrate surface. When
highly crystalline PP regions reside at the surface, the rate of penetration is likely to
109

be slower. When amorphous regions are present at the surface, such as EPDM rubber
domains or semi-crystalline PP regions, the solvent penetration rate is likely to increase
due to the lower density of the material. Measuring the effect of solvent swelling was
important because initial adhesion to a TPO substrate is said to be a function of PP
crystallinity at the surface, as it relates to the ability of a solvent and AP to permeate
through and into the rubber layers beneath.28,45,64,69,181
6.3.1 Selecting Appropriate Solvent: Mass Change
The solvent selection process for swelling the PP-based substrates is described in Section
4.17. Out of the four solvents selected by HSP parameters, the best solvent was chosen
by initial mass increase tests, upon exposure to solvent. A TPO/2 substrate was chosen
to select the best solvent because it was a good representation for the materials used
in industry and contained EPDM, which was predicted to increase the swelling rate. It
was assumed that the solvent selected would swell all the other substrate types also. The
effect of substrate type was then later tested with nano-indentation and surface roughness
measurements (see below).
The effect of cyclohexane, Toluene, Solvesso 150 and Solvesso 200 exposure to TPO/2
substrates is shown in Figure 6.2. During substrate swelling, the mass increased with
time as shown in Figure 6.2(a). Toluene was found to have the greatest swelling rate,
cyclohexane and Solvesso 150 had a lower but similar swelling rate, and Solvesso 200 had
the slowest swelling rate and was the least effective. Although the area and volume of
solvent exposure to the substrate was controlled and kept constant, the data for each
solvent did not follow a straight line (mass uptake plotted against the square root of
time), which would be expected if the swelling effect of the solvent followed Fick’s law
of diffusion (where the larger the area and difference in concentration and the thinner
the surface, the quicker the rate of diffusion). However, non-Fickian behaviour for the
TPO/2 substrate would not be unexpected due to the heterogeneous nature and phase
separation of the EPDM in the PP matrix as well as other additives (discussed in Chapter
110

5). For example, it was postulated that if the solvent initially penetrated into an area
of the substrate lower in density, but then reached an area higher in density, the solvent
swelling rate would decrease. This inhomogeneity in the substrate is therefore reflected
in the changing swelling rates.
After the substrates were exposed to solvent for one hour, and subsequently air dried
for one hour, their mass decreased with drying time as shown in Figure 6.2(b). This
was explained by the evaporation of the solvent over time. Although toluene had the
greatest swelling rate, cyclohexane was found to be the solvent that evaporated the fastest.
However, it was observed that the substrates did not return to their original mass after
the one hour drying period. The substrates swollen with Solvesso 200 and Solvesso 150
remained 18.6 mg and 28.1 mg heavier than before swelling. The substrates swollen with
toluene and cyclohexane remained 48 mg and 15.6 mg heavier than before swelling. The
inhomogeneity of the substrates was likely to be a reason for this, and it was thought that
solvent molecules may have been trapped in different phases, such as the lower density
EPDM within the substrate, and could not readily evaporate through the denser phases.
As previously discussed in Section 2.4.2, a solvent that does not readily evaporate from
the substrate after treatment could cause a cohesive failure at the surface. Therefore,
cyclohexane was chosen as a good solvent for further tests due to its good swellability of
the substrate and importantly, its fast rate of evaporation (which would be accelerated
in any thermal curing processes of subsequent coatings applied). Environmental factors
were also considered, where alternative solvents which were more environmentally friendly
would better suit new industrial products. However, cyclohexane was used as a proof-of-
concept with the scope that in the event of successful adhesion via swelling and molecular
chain entanglement, the HSP solvent optimiser built into the HSPiP software151 could be
used to select more environmentally friendly solvents or a mixture of solvents with similar
properties (HSP parameters) to cyclohexane.
111

0
20
40
60
80
100
0 1 2 3 4 5 6 7 8
Rel
ativ
e M
ass
Incr
ease
(m
g)
-50
-40
-30
-20
-10
0
0 1 2 3 4 5 6 7 8
Rel
ativ
e M
ass
Dec
reas
e (m
g)
Solvesso 150 Solvesso 200 Toluene Cyclohexane
21
min / Time
21
min / Time
Figure 6.2: The mass change with the square root of time, after TPO/2 substrates werefirstly (a) exposed to the four solvent types selected by HSP parameters for 1 hour, and(b) left to air dry for 1 hour. Presented data are averaged values taken from 3 differentsubstrates. Lines of best fit are shown for deviations from Fick’s Law.
112

6.3.2 Mechanical Properties: Substrate Hardness and Young’s
Modulus
Nanoindentation was used to assess the change in the substrate surface hardness and
Young’s modulus before and after substrate swelling with cyclohexane. As the indenter
tip was pushed into the surface, the parameters were measured from 300 nm - 3000 nm
below the surface. Figure 6.3 shows a schematic diagram of polymer chains before and
after swelling (top right). The solvent molecules penetrate into the surface of the substrate
and diffusion occurs (Fick’s law), pushing the polymer chains apart. Consequently, the
chains increase in mobility, and the force required for indenting the surface decreases.
This analogy can also relate to an AP applied to the surface, where penetration into a
softer, more mobile polymer phase would be more likely to occur than into a rigid (non
swollen) substrate. Therefore, polymer chain entanglement between an AP and a swollen
polymer surface is more likely to occur than with an unswollen surface.
This was the hypothesis in the first part of this research report, where candidate APs
were screened and applied to swollen substrates, with the aim of modifying the substrate
surface properties via a physical chain entanglement adhesion, mimicking the type of
adhesion mechanism of a CPO AP. The vision was that hydrophilic functional groups
attached to the AP (anchored into the substrate surface) would then interact with the
hydrophilic basecoat and adhesion would be improved.
The hardness values of (a) TPO/0, (b) R/0, and (c) R/25 substrates were measured
before and after swelling, as shown in Figure 6.3. These three substrates were selected
to investigate the difference between substrates containing no EPDM (TPO/0 and R/0),
the effect of EPDM (R/25), as well as the effect of other additives (TPO/0). The average
Young’s modulus values measured over the depth of 300 - 3000 nm are also displayed in
Figure 6.3, overlaying the graph. The solvent treatment time was found to be unimportant
as it didn’t matter if the solvent treatment with cyclohexane was for one hour, ten minutes
or one minute for the industrial TPO/0 substrate, as shown in Figure 6.3(a). The impact
113

8
10
12
14
16
18
20
22
24
300 1200 2100 3000
Har
dnes
s (M
Pa)
Displacement (nm)
Untreated 1h cyclo direct 10min cyclo direct 1min cyclo direct
10
15
20
25
30
35
40
45
50
55
60
300 1200 2100 3000
Har
dnes
s (M
Pa)
Displacement (nm)
(a)
(b)
5
10
15
20
25
30
35
40
300 1200 2100 3000
Har
dnes
s (M
Pa)
Displacement (nm)
(c)
E modulus: 0.60 ± 0.06 GPa
E modulus: 0.33 ± 0.04 GPa
E modulus: 0.23 ± 0.06 GPa
E modulus: 0.24 ± 0.02 GPa
E modulus: 1.45 ± 0.04 GPa
E modulus: 0.96 ± 0.07 GPa
E modulus: 0.66 ± 0.09 GPa
E modulus: 0.49 ± 0.13 GPa
E modulus: 0.72 ± 0.07 GPa
E modulus: 0.37 ± 0.09 GPa
E modulus: 0.32 ± 0.06 GPa
E modulus: 0.20 ± 0.03 GPa
Substrate
Solvent
Untreated Polymer Swollen Polymer
Solvent
Migration
Figure 6.3: Surface hardness profile of a (a) TPO/0, (b) R/0 and a (c) R/25 substrate,before and after swelling for 1 hour, 10 minutes, and 1 minute. Top right: schematic dia-gram showing solvent migration into the surface of a substrate, with the solvent molecules(orange spheres) pushing apart the substrate polymer chains, increasing their mobility.
114

of solvent penetration on the surface hardness was apparent after just one minute. As
expected, the substrate hardness decreased after exposure to cyclohexane (the solvent
will have diffused into the substrate, pushing the polymer chains apart, increasing their
mobility and hence making the substrate softer). After one minute swelling time, the
TPO substrate hardness decreased by ∼ 50 %, as did the Young’s modulus.
As discussed in Appendix 10.F.3, the untreated R/0 substrate is significantly harder
than the TPO/0 and R/25 substrate (see Figure 10.16). However, a swelling effect was
observed. Also, a difference between the swelling times for the R/0 substrate was observed,
shown in Figure 6.3(b). The longer the exposure time of the substrate to the solvent, the
softer the substrate became as expected. After one minute of swelling of the R/0 substrate,
the hardness value decreased by ∼47 %, but was ∼3 times higher than the hardness value
of the TPO/0 after one minute swelling and ∼2.3 times higher than the hardness value of
R/25 substrate after one minute swelling. This suggested that the degree of crystallinity
in the R/0 substrate remained higher than the other substrates (as discussed in Section
10.F.3). It was therefore expected that improved adhesion between an AP and a substrate
would be observed for the TPO/0 and R/25 substrates, assuming that the adhesion was
dependent on penetration ability of the AP into the surface of the substrate. Due to
higher hardness values of R/0, an improvement in adhesion after solvent swelling was not
expected. The same trends were observed for the Young’s modulus results. Values of
∼0.3 GPa were expected to give improved adhesion if an AP functioned like that of a
CPO,68 as discussed in Appendix 10.F.3.2.
It was interestingly observed that the hardness depth profile of the R/0 substrate
changed upon solvent exposure (Figure 6.3(b)). As discussed in Appendix 10.F, the initial
increase in hardness with penetration depth into the surface of the untreated substrate,
was suspected to be due to a higher degree of crystallinity in a subsurface layer. This
effect was removed after solvent swelling, suggesting the structure changed in the initial
surface layers, and the polymer chains rearranged, decreasing the degree of crystallinity.
Therefore, the solvent used in an AP solution would be likely to have a large impact on
115

the adhesion to the substrate surface for the R/0 substrate (the swelling may allow for
the penetration of an AP to entangle with the surface polymer chains of the substrate).
Although the substrate hardness significantly decreased after one hour swelling time
of the R/25 substrate (by ∼76 %), as shown in Figure 6.3(c), little difference between the
substrate hardness obtained after ten minutes and one minute swelling times occurred,
and the hardness decreased by ∼56 % compared to the untreated substrate.
Figure 6.4 shows the effect of drying times after swelling the substrate for one minute.
The hardness profile changes after the (a) R/0 and the (b) R/25 substrates were swollen
for one minute, and left to dry for six hours and for three days. As expected, the hardness
values increased with increasing drying time (demonstrated in the schematic representa-
tion in Figure 6.4, left hand side), as the solvent evaporated out of the substrate surface
and the polymer chain mobility within the substrate reduced.
10
15
20
25
30
35
300 1200 2100 3000
Har
dn
ess
(MP
a)
Displacement (nm)
Untreated 1min cyclo direct1min cyclo, after 6 hours drying 1min cyclo, after 3 days drying
25
30
35
40
45
50
55
60
300 1200 2100 3000
Har
dn
ess
(MP
a)
Displacement (nm)
(a) (b)
E modulus: 0.72 ± 0.07 GPa
0.37 ± 0.09 GPa
Har
dnes
s
Sw
ell
Dry
Figure 6.4: Surface hardness profile of a (a) R/0 and (b) R/25 substrate, before and afterswelling for 1 minute, and drying for 6 hours and for 3 days.
116

After 3 days drying time, the hardness value of the R/0 substrate (Figure 6.4(a))
increased to ∼ 73 % of its original value before swelling (with the exception of the 300
- 1200 nm region, where the untreated substrate increased in hardness), and the R/25
substrate increased to ∼66 % of its original value before swelling. The hardness profile of
the dried substrate remained the same shape as the swollen substrate, and in the case of
the R/0 substrate (Figure 6.4(a)), it appeared solvent swelling had permanently changed
the surface structure as no evidence to return to the initial profile (with an increase in
hardness at the surface) was observed.
A summary of the hardness profiles of all tested substrates before and after swelling
for one minute, and allowing the substrates to dry for six hours is shown in Figure 6.5.
The bar graph displayed at the bottom of Figure 6.5 emphasises the higher hardness
values for the R/0 substrate compared to the other substrates. Figure 6.5(a) shows that
the change in hardness profile for the TPO/0 substrate is similar to that of the R/25
substrate, although the hardness value of TPO/0 increased at a greater rate after 6 hours
of drying. As discussed in Chapter 5 and Appendix 10.F.2, additives are present in the
TPO/0 (talc, CaCO3, carbon black and irgafos 168) and R/25 substrates (EPDM), which
is likely to be the reason why the hardness profiles have similar values compared to the
R/0 substrate which contains no additives.
Assuming that the substrate hardness played a key role in the adhesion mechanism
of AP solutions applied to a substrate, it was expected a greater adhesion would be
observed between an AP and a TPO/0 substrate or R/25 substrate, compared to the
R/0 substrate. This hypothesis assumes a higher % of EPDM or the presence of fillers
and additives to lower the substrate hardness and Young’s modulus was important for
improving the mechanical properties of substrates which would lead to a greater degree
of swelling, allowing for molecular chain entanglement with an AP.
117

10
300 1200 2100 3000
Untreated 1min cyclo direct 1min cyclo, after 6 hours drying
25
30
35
40
45
50
55
60
300 1200 2100 3000
Har
dn
ess
(MP
a)
Displacement (nm)
9
14
19
24
29
34
39
300 1200 2100 3000
Har
dn
ess
(MP
a)
Displacement (nm)
8
10
12
14
16
18
20
22
24
300 1200 2100 3000
Har
dn
ess
(MP
a)
Displacement (nm)
(a) (b) (c)
0.72 ± 0.07 GPa
Untreated 1 min Cyclohexane Directly 1 min Cyclohexane After 6 Hours Drying
0
10
20
30
40
50
60
Direct 1 min
cyclo
1 min
cyclo, 6h
drying
Direct 1 min
cyclo
1 min
cyclo, 6h
drying
Direct 1 min
cyclo
1 min
cyclo, 6h
drying
0% EPDM Inustrial 0% EPDM Research 25% EPDM Research
Av
erag
e H
ard
nes
s (M
Pa)
R/0 R/25 TPO/0
Figure 6.5: Summary of surface hardness profiles of a (a) TPO/0, (b) R/0 and (c) R/25substrate, before and after swelling for 1 minute, and drying for 6 hours. Bottom: Averagehardness change of TPO/0, R/0 and R/25 substrates before and after swelling for 1 minuteand drying for 6 hours.
118

6.3.3 Surface Roughness
The change in surface topography upon exposure to solvents was thought to be an im-
portant contributing factor for achieving good adhesion, as discussed in Appendix 10.F.4.
White light interferometry was used to assess the change in surface topography (i.e. sur-
face roughness) during solvent swelling. The same three types of substrates (TPO/0,
R/0 and R/25) that were used for assessing the change in surface hardness during sol-
vent swelling were used to assess the change in surface roughness during swelling. These
three substrates were selected to investigate the difference between substrates containing
no EPDM (TPO/0 and R/0), the effect of EPDM (R/25), as well as the effect of other
additives (TPO/0). Swelling times of one and ten minutes with five hours drying time
were investigated. Two surface roughness parameters (described in Section 4.3), Ra and
Rq, were used to assess the change in surface roughness . The bar chart in Figure 6.6
summarises the change in Rq (this parameter was chosen because it was more sensitive
to substrates containing valleys).
Figure 6.6(e) shows Rq values for the different substrates tested, before and after
swelling for ten minutes and for one minute, and after five hours drying time. The 2D
and 3D images of the roughness profiles for the TPO/0 substrate after swelling, as well
as the 2D and 3D roughness profiles of the R/0 and R/25 substrates after swelling for ten
minutes can be found in Appendices 10.C - 10.E. The 2D and 3D roughness profiles of
the untreated substrates are discussed in Appendix 10.F.
Before swelling, the TPO/0 substrate had roughness values of Ra = 258 nm and Rq =
329 nm. The substrate appeared to have areas with craters or valleys scattered across the
surface, suspected to be due to the additives, as discussed in Appendix 10.F.1. After the
substrate was immersed in cyclohexane for ten minutes, these craters no longer existed,
but the surface roughness increased by ∼ 50 % (Ra = 391 nm and Rq = 500 nm). A clear
difference in surface topography was observed when looking at the 2D and 3D profiles.
The surface was re-measured after five hours of drying time. Just as the surface
119

Untreated 10min Cyclohexane Directly 1 min Cyclohexane Directly
10min Cyclohexane After 5 Hours Drying 1min Cyclohexane After 5 Hours Drying
0
100
200
300
400
500
600
700
Daplen 0% EPDM Res 25% EPDM Res
Ro
ot M
ean S
qu
are
Ro
ug
hnes
s (R
q)
/ nm
TPO/0 R/0 R/25
0
90
0 120
y (μ
m)
x (μm)
Ra = 19 ± 6 nm
Rq= 36 ± 21 nm
-0.2
0
0.2
0 90
z (μ
m)
y (μm)
-0.2
0
0.2
0 120
z (μ
m)
x (μm)
0
90
0 120
y (μ
m)
x (μm)
Ra = 22 ± 5 nm
Rq= 36 ± 9 nm
-0.2
0
0.2
0 120
z (μ
m)
x (μm)
-0.2
0
0.2
0 90
z (μ
m)
y (μm)
0
90
0 120
y (μ
m)
x (μm)
Ra = 327 ± 19 nm
Rq= 421 ± 22 nm
-2
0
2
0 90
z (μ
m)
y (μm)
-2
0
2
0 120
z (μ
m)
x (μm)
0
90
0 120
y (μ
m)
x (μm)
Ra = 378 ± 21 nm
Rq= 488 ± 32 nm
-2
0
2
0 90
z (μ
m)
y (μm)
-2
0
2
0 120
z (μ
m)
x (μm)
(a) (b)
(c) (d)
(e)
Figure 6.6: Top: 2D and 3D images of surface roughness and x and y profiles of R/0 after(a) 10 minute swelling time, (b) after it was left to dry for 5 hours and (c) R/25 after 1minute swelling time, (d) after it was left to dry for 5 hours. Bottom: Average root meansquare roughness (Rq) of the TPO/0, R/0 and R/25 substrates before and after swellingfor 10 minutes and drying for 5 hours, and after swelling for 1 minute and drying for 5hours. 120
hardness did not return to the original values, the topography also did not return to the
original state after drying for five hours, and visually appeared indifferent to the 2D and
3D profiles of the measurement directly after swelling. However, the surface roughness
decreased with drying time by ∼10 % (Ra = 352 nm, Rq = 448 nm). It was not tested
if the surface would eventually return to its original state, as it was the immediate time
at swelling that would have the greatest impact on adhesion. The large increase observed
for Ra and Rq, and the change in surface topography observed, all suggested an improved
adhesion would be observed upon cyclohexane swelling.
After only one minute of swelling the TPO/0 substrate, the surface topography had
changed compared to the untreated substrate and the surface roughness increased by ∼30
% (Ra = 334 nm, Rq = 428 nm). The significant change in the surface topography, also
observed in the hardness profile and Young’s modulus profiles of the substrate after just
one minute swelling time, suggested cyclohexane would facilitate adhesion mechanisms
at a fast time scale once in contact with the substrate surface. This was based on the
assumption that the increase in surface roughness would lead to a greater contact area
between an AP and the substrate surface, allowing a greater adhesive interaction. How-
ever, the substrate was found to dry at a slower rate compared to the substrate that was
in cyclohexane for ten minutes (surface roughness decreased by ∼7 %, Ra = 311 nm, Rq
= 400 nm), which could affect the cohesive integrity of the substrate surface, and could
cause cohesive failure. It was again observed that the change in topography induced by
swelling remained after five hours of drying time.
As discussed in Appendix 10.F, the untreated R/0 substrate was significantly smoother
(by 10-fold) compared to the industrial TPO/0 and R/25 substrate. It was suggested that
this was due to the absence of EPDM, and the higher degree of crystallinity suggested by
the nanoindentation data (also found in Appendix 10.F). After ten minutes of immersion
time in cyclohexane the surface roughness parameter Ra increased by ∼56 % (Ra = 9nm)
whilst Rq increased by ∼100 % (Rq = 21 nm). However, the values are 10 times lower
than that of the TPO/0, which could result in a significant difference between adhesion
121
results of the two substrates. The difference between the R/0 substrate, and the TPO/0
and R/25 substrates, was further emphasised when comparing the 2D and 3D profiles.
Unlike the TPO/0 and R/25 substrates, there appeared to be no significant difference
after swelling. After five hours drying time, the surface roughness decreased by ∼23 %
(Ra = 21 nm, Rq = 38 nm), but as with the other substrates, it did not return to its
original value.
The 2D and 3D surface roughness profiles for the R/0 substrate after one minute
swelling time and five hours drying time, are shown in Figure 6.6 (a) and (b). Swelling
the R/0 substrate for ten minutes and one minute had little effect on the surface rough-
ness compared with the other substrates measured. As discussed in Appendix 10.F.1, the
EPDM and additives in the other substrates were found to be the cause of the change in
surface roughness when subjected to solvent, therefore, the lack of additives or EPDM in
R/0 explained why the surface roughness did not significantly change. Furthermore, the
hardness depth profiles shown in Figure 6.3 showed that all substrates changed to lower
hardness values after solvent subjection, therefore, a difference in solvent penetration as
being a reason for the difference in surface roughness was ruled out. Therefore, it was
assumed that if the substrate hardness was the dominating factor of adhesion (penetra-
tion of an AP into the substrate surface), the R/0 substrate would have good adhesive
properties, however if the surface topography change upon swelling was the dominating
factor (increase in surface contact area between AP and surface), the R/0 substrate would
not have improved adhesive properties, compared to TPO/0 and R/25.
Furthermore, the scratch resistance of the R/0 substrate appeared to decrease after
solvent swelling, as many scratches were observed in the topography (likely to be caused
from sample handling), suggesting the substrate became brittle in nature upon swelling.
The effect of the scratches could be seen in the difference between Ra and Rq: the Rq
value was higher because it was more sensitive to the valleys caused by the scratches at
the surface, compared to Ra. This would have a detrimental effect on the efficacy of a car
component. The higher Young’s modulus values obtained for R/0 compared to the other
122

substrates, shown in Figure 6.5, also supported this claim.
The behaviour of the R/25 substrate after substrate swelling for ten minutes, one
minute and drying for five hours was very similar to that observed from the TPO/0.
After a swelling time of ten minutes, the surface roughness increased by ∼85 % (Ra =
440 nm, Rq = 558 nm). Rq increased more than Ra, due to a greater deviation in peaks
and valleys from the mean surface roughness. This could have been caused by the large
amount of amorphous EPDM domains found at the surface of the substrate that was
previously observed in SEM measurements (Section 5.3, Figure 5.7). They were likely to
have swollen to a greater extent than the surrounding PP matrix, causing the large peaks
and valleys at the surface. This hypothesis is represented schematically in Figure 6.7. As
previously discussed, this significant change in topography is likely to improve adhesive
properties to the surface,27 by increasing the contact area between the substrate surface
and the AP. After five hours drying time, the surface roughness decreased by ∼14 % (Ra
= 377 nm and Rq = 481 nm).
The 2D and 3D surface roughness profiles for the R/25 substrate after one minute
swelling time and five hours drying time, are shown in Figure 6.6 (c) and (d). After one
minute of swelling time, the surface roughness increased by ∼61 % (Ra = 378 nm, Rq =
488 nm) and after five hours drying time it decreased by ∼14 % (Ra = 327 nm and Rq
= 422 nm).
Solvent
(a) Untreated Surface (b) Swollen Surface
Cro
ss-S
ecti
on
Figure 6.7: Schematic diagram demonstrating the hypothesis that the regions of EPDMfound at the surface of a substrate could swell at a greater rate than the surrounding PPmatrix, causing a greater deviation in peaks and valleys at the surface as demonstratedby the orange area (different parts of the surface will swell at different rates).
123

Although there was a difference between a swelling time of ten minutes and one minute
for the TPO/0 and R/25 substrates, shown in the bar graph summary of the Rq change
upon swelling (Figure 6.6), the Rq value significantly increased after a swelling time of
just one minute. This suggested the adhesion of an AP/cyclohexane solution applied to
a substrate would significantly improve on a fast time scale, assuming the topographical
changes at the surface are a main contributing factor upon substrate swelling . A drying
time of five hours decreased the Rq value, however, the substrates’ roughness remained
significantly higher compared to the untreated substrate. It was assumed that this did not
cause a problem for the cohesive integrity of the substrates, because the subsequent coat-
ings applied were thermally cured at 80 ◦C (see Figure 4.6) which should have accelerated
the substrate drying process.
6.4 Candidate Adhesion Promoter Selection
A range of candidate AP molecules were selected from a list of functional molecules readily
available from BASF. The business drive in this case was to screen molecules already in
production from BASF, with the scope that the company would save time and money if
the project was to be successful.
The molecules chosen were commonly used as surfactants and were amphiphilic in
nature. Hence bi-functional molecules were chosen: a hydrophobic component for inter-
action with the hydrophobic substrate, and a hydrophilic component for interaction with
the hydrophilic basecoat that would be applied. The hypothesis was that if cyclohexane
was used to swell the substrates and increase the substrate polymer chain mobility, and
subsequently apply an AP: the hydrophobic part of the candidate AP would entangle
with the substrate polymer chains and anchor into the surface (like the mechanism pos-
tulated for CPO APs) and the hydrophilic part would interact/react with the hydrophilic
basecoat. This matching of the interfacial properties with the candidate AP would then
increase the adhesion between the applied coatings and the substrate. This hypothesis is
124

Substrate
Coating
Functional blocks
adhere to coating
Anchoring groups
facilitate entanglement
and adhesion to substrate
Hydrophilic
Hydrophobic
Figure 6.8: Schematic diagram demonstrating the hypothesis of achieving improved adhe-sion between a hydrophilic waterborne basecoat and a hydrophobic PP-based substrate,via molecular chain entanglement with a candidate AP and subsequent interactions be-tween function groups of the AP and the basecoat.
demonstrated in Figure 6.8
A list of the commercial names of the candidate APs and their description is shown
in Table 3.2. Due to confidentiality, the exact structure of each polymer is not disclosed,
however, an idea of the functionalities is given in the description. The number added to
the commercial name indicates chain length differences in the monomer units, for example
Plurafac LF1300 contains larger monomer units than Plurafac LF223. The structures of
each type of polymer varies as does the locality of the hydrophobic and hydrophilic func-
tions. For example, the Pluronic polymers consist of EO/PO block copolymers, therefore,
switch between hydrophilic and hydrophobic sections along the polymer backbone. To
deduce which polymers were best for testing adhesion, the surface tension and the wetta-
bility of the polymers on a TPO/2 substrate were tested. A TPO/2 substrate was chosen
as it represented an industrial sample containing all additives and EPDM which could
influence the swelling and entanglement adhesive behaviour. The results are shown in Fig-
ure 6.9. To achieve surface coverage, the wettability of the AP on the substrate surface
was important, and a lower contact angle represented a greater wetting of the substrate.
The polymers with the best wettability characteristics tended to have lower surface ten-
125

sion values as expected (the forces holding the polymer droplets together were weaker
enabling spreading at the surface of the substrate compared to the polymers with higher
surface tension). Seven polymers were selected for adhesion tests, which are highlighted
in Figure 6.9. Five were chosen because of their lower contact angles (higher wettability)
and two were chosen because of their low surface tension values.
20
30
40
50
60
70
25 30 35 40
Con
tact
An
gle
(°)
Surface Tension (mN/m)
EFKA 3580
EFKA 3570
Emulan EL
Emulan P
Emulan TO2080
Emulphor FAS30
Lupasol PO100
Lutensol AP9
Lutensol ON70
Plurafac LF1300
Plurafac LF223
Plurafac LF224
Plurafac LF403
Pluriol A10R
Pluriol A1350P
Pluriol A23R
Pluriol A308R
Pluriol A 520E
Pluriol P900
Pluronic PE 6200
Pluronic RPE 3110
Pluronic RPE2520
Figure 6.9: A scatter graph showing the surface tension (x-axis) and wettability (y-axis)of the candidate APs on a TPO/2 substrate. The polymers chosen for adhesion tests arehighlighted with blue dashed circles.
6.4.1 Interaction of APs with PP
The modelling of the interaction of the candidate APs with PP substrates was attempted
using a quartz crystal micro balance with dissipation (QCM-D). PP surfaces were made
by spin coating gold quartz sensors, and the thickness was measured using ellipsometry.
The sensors vibrated and the resonant frequencies were measured. The AP solution was
126

rinsed across the surface of the sensors and the frequency dampened upon contact with
the solution. This damping effect indicated an increase of mass at the surface, however,
it was not distinguished if it was due to the solvent and swelling, or the anchoring of
an AP. An alternative problematic scenario was that the solvent or AP penetrated into
the PP, but then was trapped between the sensor and the PP layer, in which case the
interaction results would have been false. The solution concentrations were kept constant
to test a qualitative comparison between the different APs. However, a second problem
was encountered, which was that it could not be judged if the PP was dissolving into the
cyclohexane and washing away, therefore, also having an effect on the dampening of the
frequency, hence mass change. An idea to overcome this problem was to graft SAMs with
hydrophobic tail ends to the gold sensor surface and then spin coat the PP to improve
adhesion between the PP and the sensor. However, due to other experimental priorities,
time did not permit this experiment and it remains as possible future work.
6.4.2 Adhesion Tests
Adhesion tests were performed for all seven selected polymers. For preliminary studies,
a non-pigmented basecoat was used to minimise competing interfaces (previous work in
BASF often found candidate APs to react at the pigment/basecoat interface, rather than
the substrate/basecoat interface.) Adhesion tests were performed on industrial TPO/0
and research R/0 and R/25 substrates, to look at the effect of EPDM and other additives.
As a proof-of-concept, the APs were applied as primer layers to check for any improve-
ments in adhesion at the substrate/basecoat interface. APs were applied in pure form and
as 5 wt.% solutions in cyclohexane. They were tested ’wet-on-wet’ with the basecoat (no
intermediate drying step) and with a drying step (ten minutes, 80 ◦C) before the basecoat
application. All these variables were performed on untreated substrates, and substrates
that had been swollen in cyclohexane for one minute. The adhesion (CHT) was tested
seven days post-cure time after the application of the clearcoat (all substrates were coated
with both basecoat and topcoat and fully cured before adhesion tests were performed)
127

and compared to the two standards (flame and CPO), as well as a blank substrate which
did not have any primer or pre-treatment.
The adhesion results are shown in Table 6.1. For all experimental variables, the CHT
grade was 5 (65 - 100 % delamination). Although the effect of swelling was tested by both
a pre-swelling step in cyclohexane for one minute, and by having the AP in a cyclohexane
solution, no significant adhesion promotion was observed. It was also thought that the
drying step after the primer layer application may have locked the anchored AP into the
substrate surface. However, it appeared not to be the case, assuming that adhesive failure
occurred and not cohesive failure within the substrate surface.
Table 6.1: CHT adhesion results after the candidate AP primer layer was applied to adried substrate and to a substrate that was pre-swollen in cyclohexane for one minute.All adhesion tests were performed after a 7 day post-cure period after the topcoat wasapplied. No improvement in adhesion was observed for all variables tested.
128

Due to the poor adhesion results, a decision was made to stop looking for adhesion im-
provement via molecular chain entanglement, and the failure mode of the coating was not
measured. However, future work could be to use ToF-SIMS and XPS (surface sensitive
techniques) to measure the two delaminated surfaces and compare the intensities of a
signal characteristic of the AP, to conclude if adhesive failure or cohesive failure occurred.
6.5 Future Work
Future work to find a successful AP for physical adhesion, could be to tailor-make a
molecule or polymer with the desired structure and properties. The surface energy and
polar/dispersion components could be measured using the Wu method (how the wet
basecoat was measured, see Section 4.5.3) to look for matching properties to the substrate
and basecoat.
Future experiments were designed where model surfaces would be used to test the
orientation and interaction of the candidate APs with AFM, based on similar experiments
by Gourianova et al.92 For example, a silicon wafer could be coated with PP and used as
a hydrophobic surface, and the candidate AP applied. A hydrophilic functionalised AFM
tip could then be used to measure the adhesive attractive forces across the surface, giving
an indication if the AP is anchored into the PP surface and to what extent. However,
the fundamental flaw with this experiment design was ensuring the AP remained at the
hydrophobic wafer surface, otherwise if it would be pulled away by the AFM tip, the
tip would be ’contaminated’ and the remaining adhesive forces measured at the surface
would be false. A possible solution could be to have the AP grafted to the AFM tip,
and measure the adhesive attractive forces with a hydrophobic surface, however, this also
required a lot of work to implement and test, and due to other experimental priorities,
time did not permit these tests. A further idea could also be to freeze the substrate,
trying to trap the AP in the substrate surface after swelling, as a proof-of-concept before
testing the adhesion.
129

6.6 Conclusions
HSP parameters were successfully implemented to determine suitable solvents to swell the
PP-based substrates. Evidence of surface swelling was determined through mass increase
measurements as well monitoring the change of the substrate hardness, Young’s modulus
and surface roughness. The substrates containing additives or EPDM were found to
have the lowest hardness and Young’s modulus profiles before and after swelling. They
were also found to have the greatest surface roughness increase after solvent swelling.
Therefore, it was hypothesised that these two substrates, TPO/0 and R/25, would lead
to greater adhesion than the R/0 substrate which contained no additives.
However, despite the identification of several bi-functional candidate APs based on
their surface tensions and ability to wet the substrate surfaces, poor adhesion results
were obtained after they were applied as a primer (100 wt.% or 5 wt.%) on swollen and
non-swollen substrates.
Adhesion via polymer chain entanglement, based on the believed mechanism of CPO
APs, was not successful. Therefore, the research was taken into a new direction to search
for candidate APs that could graft to the substrate surface via covalent bonding, mim-
icking the adhesion mechanism of the flaming state of the art technique, as discussed in
Chapter 7.
130

Chapter 7
CHEMICAL ADHESION: A PROOF-
OF-CONCEPT GRAFTING STUDY
7.1 Overview
An overview of this chapter to guide the reader through the results is shown in Figure
7.1. The main focus of this chapter was to identify candidate APs, capable of forming
covalent bonds with the PP-based substrates, for improved adhesion with a waterborne
basecoat. The adhesion mechanism was inspired by the flame pre-treatment state of the
art, in which oxygen-containing species are covalently bonded to the substrate surface.
The APs were characterised, and their ability to graft to various substrates was tested,
focusing on the adhesion at the substrate/AP interface.
7.2 Introduction
Alternative adhesion mechanisms were investigated after the adhesion of candidate APs
to swollen and nonswollen substrates was unsuccessful in Chapter 6. Since a mechanism
inspired by state of the art CPO APs was unsuccessful, a mechanism based on the flame
pre-treatment was investigated, where hydrophilic reactive groups are covalently bonded
(O and OH) to the substrate surface during treatment.
131

Adhesion
via
Covalent Bonding
Identification
of APs
Reflux AP in Cyclohexane
CH Insertion Ability of APs
Characterisation
of APs
NMR, IR, UV-Vis, Mass Spectrometry
Confirm Structure
of APs
Grafting of AP to Substrates
Quantity of AP on Surface (XPS &
ToF-SIMS)
Assess % of AP that Forms Covalent
Bond to Substrate
Theme Topics Measurements Knowledge Gained
Figure 7.1: A summary of the chemical adhesion, a proof-of-concept chapter.
7.3 Identifying and Characterising Adhesion Promot-
ers (AP’s)
Carbenes are highly reactive species, as described in the Literature Review (Section 2.9).
Diazirines are a group of carbene-generating species that can be relatively stable with the
correct functional groups. The parent compound in this study, denoted as TPD (shown in
Figure 3.1), contains an electron-withdrawing trifluoromethyl (CF3) group which is able
to pull electron density from the carbene generated. It also contains a phenyl ring which is
able to de-localise the electron density from the carbene generated. Both of these groups
contribute towards the stability of the carbene, giving a lifetime that enables CH insertion
reactions.135 Therefore, TPD was thought to be an ideal candidate AP for potential CH
insertion reactions into a PP-based substrate (creating a covalent bond). Furthermore,
it could be readily functionalised on the phenyl ring to add hydrophilic groups, account-
ing for adhesion with the waterborne basecoat (for example, forming H-bonds with the
basecoat like that of the flaming pre-treatment discussed in Section 5.653,54,102). A full
characterisation of the candidate APs can be found in Appendix 10.G.
The grafting ability (CH insertion into the substrate) of TPD to substrate surfaces
was first tested, concentrating on the adhesion at the AP/substrate interface (via covalent
132

bonding). The next progression, once this was achieved, was to modify TPD with an OH
and COOH functional group (shown in Figure 3.1). These molecules, denoted at TP-
DOH and TPDCOOH, were grafted to the substrate and the adhesion to the waterborne
basecoat was tested, concentrating on the adhesion at the AP/basecoat interface.
7.3.1 CH Insertion Proof-of-Concept
Once the candidate APs were identified and characterised, their ability to generate car-
benes and undergo CH insertion reactions was assessed. Brunner et al.135 had previously
performed this investigation with TPD, identifying successful insertion products from
UV initiated reactions with cyclohexane and methanol. The procedure used here was
adapted from this study, and used cyclohexane to test the ability of the TPD. Cyclo-
hexane was the preferred choice of solvent for the reaction with TPD due to the limited
number of CH insertion products possible (cyclohexane is a small simple molecule), which
aided the subsequent analysis of the products formed. Furthermore, the boiling point is
81 ◦C, close to the curing temperature of the coatings used in this study (80 ◦C). For the
carbene-precursors to be formulated into the coatings system, the carbene would have to
be thermally active at this temperature. Therefore, the reflux reaction between TPD and
cyclohexane was a good test for the suitability of TPD. As well as thermal activation, UV
activation of the carbene in cyclohexane was also tested and compared.
Figure 7.2 schematically represents the CH insertion reaction between TPD and cy-
clohexane, and the expected insertion product (assuming multiple TPD molecules do not
insert into each other, and assuming only one TPD molecule would react with one cy-
clohexane molecule). A trade-off was made between excess cyclohexane to decrease the
competition between the TPD and cyclohexane molecules (competing reaction sites) and
the concentration of TPD to ensure enough product was formed in the required concen-
tration for successful analysis. The ratio was chosen to be seven cyclohexane molecules
available per TPD molecule.
After an eight hour reflux, the reaction products were separated and their mass spec-
133

tra recorded using GC/MS. There were eight components identified with GC (GC chro-
matogram not shown); one component was cyclohexane as expected (present in excess)
and all other components were a mixture of products. The mass spectrum of the compo-
nent containing the desired CH insertion product is displayed in Figure 7.2 and shows the
molecular ion peak from the expected CH insertion product at m/z = 242 (10 % abun-
dance). The base peak (greatest intensity, 100 % abundance) was due to cyclohexane
(m/z = 83) which had not been fully separated from the reaction mixture by GC. A peak
due to the fragmented TPD moiety from the insertion product was also observed at m/z
= 159 (5 % abundance). It was therefore concluded that TPD was active at ∼80 ◦C and
was a suitable candidate AP for the coatings system studied.
Mr = 242.1
CH insertion
Δ or hυ
m/z: 83.1 (100%),159.0(5%), 242.1 (10%)
TOF MS EI+
100
%
83.1
55.1
109.0
115.1 140.0 159.0
242.1 (M.+)
m/z 40 60 80 100 120 140 160 180 200 200 240 260 280
TPD
Figure 7.2: The mass spectrum of the reaction products after a highly concentratedsolution of TPD in cyclohexane (1.3 M) was refluxed for 8h. Cyclohexane was in excessto TPD by 7:1.
134

The reaction mixtures from an eight hour and two hour reflux and eight hour UV illu-
mination (2.2 mW) were analysed by 19F NMR. The reactions were then repeated using
deuterated (D12) cyclohexane and also analysed with 19F NMR. The results are displayed
in Figure 7.3 (eight hour reflux) and Figure 7.4 (UV). As found by Brunner et al.,135 the
large number of peaks observed in the spectra reveal many components were present. Al-
though not displayed, the spectra from the two hour reflux products were found to be the
same. The doublets present in Figure 7.3(a) and Figure 7.4(a) indicate the insertion prod-
ucts in normal cyclohexane reactions. The coupling constants displayed from the doublets
are in the range expected for vicinal fluorine-proton coupling.182 Repeating the reactions
in D12-cyclohexane showed a loss of these doublets to singlets, as shown in Figure 7.3(b)
and Figure 7.4(b). This was consistent with vicinal fluorine-deuterium coupling,135 thus
giving confidence that these resonance peaks were due to fluorine from the TPD coupling
with vicinal protons from the cyclohexane, hence further proving insertion reactions had
occurred. It should be noted that 1H NMR spectra were also measured, but many peaks
were revealed indicating many products and making analysis difficult.
When comparing the spectra of the thermal reaction products shown in Figure 7.3 with
the UV reaction products shown in Figure 7.4, interestingly they appear quite different.
The UV products show prominent peaks at ∼14 ppm (suggested to be due to the parent
TPD) and ∼6 ppm which were also observed by Brunner et al.135 However, the spectrum
also revealed a prominent peak at ∼10 ppm which had not been observed previously.
Furthermore, the peak observed by Brunner et al. at ∼-2 ppm was not observed in this
study. Therefore, the reaction mixture appeared to be different than observed previously
by Brunner et al.
The spectra obtained from the thermal products appear significantly different, with
chemical shifts on a different range compared to the products from the UV reaction. The
most prominent peaks were observed at ∼15 ppm, ∼13 ppm and ∼11 ppm, suggesting
different reaction products were formed depending on the activation method.
Despite the product mixtures appearing different in 19F NMR for thermal and UV
135

7.07.58.08.59.09.510.010.511.011.512.012.513.013.514.014.515.015.516.016.517.0f1 (ppm)
0
100
200
300
400
500
600
700
800
900
1000
1100
1200
1300
1400
A (d)15.3
J(8.15)
A (d)15.1
J(10.32)
A (d)12.6
J(9.21)
A (d)8.7
J(7.61)
A (d)7.4
J(7.53)
A (d)7.3
J(7.01)
(a)
7.07.58.08.59.09.510.010.511.011.512.012.513.013.514.014.515.015.516.016.517.0f1 (ppm)
0
100
200
300
400
500
600
700
800
900
1000
1100
1200
1300
1400
1500
1600
(b)
Figure 7.3: 19F NMR spectra of thermally reacted (80 ◦C, 8h) 3 mM TPD solutions in(a) cyclohexane and (b) D12-cyclohexane. Inserts show magnified doublet peaks, labelledwith chemical shift (ppm) and coupling constant, J (Hz). Chemical shifts were calculatedrelative to 100 % CF3COOH.
136

A (d)3.3
J(6.40)
B (d)4.1
J(6.58)
-12-10-8-6-4-202468101214161820f1 (ppm)
0100200300400500600700800900100011001200130014001500160017001800190020002100
A (d)14.5
J(10.15)
A (d)1.9
J(6.86)
B (d)1.6
J(6.49)
C (d)1.3
J(6.41)
D (d)0.9
J(6.86)
A (d)-0.6
J(6.73)
A (d)-1.0
J(6.15)
(a)
-12-10-8-6-4-202468101214161820f1 (ppm)
0
100
200
300
400
500
600
700
800
900
1000
1100
1200
1300
1400
1500
1600
(b)
Figure 7.4: 19F NMR spectra of UV reacted (2.2 mW, 8h) 3 mM TPD solutions in (a)cyclohexane and (b) D12-cyclohexane. Inserts show magnified doublet peaks, labelledwith chemical shift (ppm) and coupling constant, J (Hz). Chemical shifts were calculatedrelative to 100 % CF3COOH
137

Table 7.1: GC relative peak-to-TPD ratios of CH insertion products. [* indicates productin excess.]
°
°
°
°
reactions, GC/MS revealed that the expected insertion product was a major fraction of
the mixtures from both reactions. Table 7.1 displays the relative ratio of the insertion
product : TPD, obtained from the GC peaks for two reflux reactions (two hours and
eight hours), and for the UV initiated reaction at 2.2 mW for eight hours. As expected,
the longer reflux time led to a greater proportion of the inserted product, indicating the
reaction was incomplete after two hours. After the eight hour reflux in cyclohexane, the
insertion product was found to be in excess of the TPD reactant. This was also observed
for the eight hour UV reaction in cyclohexane. The D12-cyclohexane revealed a similar
pattern with the eight hour reactions both containing a greater proportion of insertion
product than the two hour reflux, however, not in excess of TPD.
These preliminary results successfully showed that TPD was able to generate a car-
bene and undergo CH insertion reactions. It was assumed that the modified TPDOH
and TPDCOOH would also undergo CH insertions in the same manor. Following these
findings, the CH insertion ability of TPD into solid surfaces, referred to as grafting, was
assessed for the suitability of TPD as an AP for polar coatings onto plastic substrates.
138

7.4 Grafting to Substrates
A systematic approach was used to investigate the grafting ability of TPD to various
substrates, as shown in Figure 7.5. The substrates became progressively more complex,
starting with a model system (Figure 7.5(a)), which was designed to test the proof-of-
concept of grafting TPD to simple alkane chains with no additives, then moving to a PP
substrate (Figure 7.5(b)) closer in characteristics to that used in industry, but containing
no additives, and finally using industrial PP based substrates containing all additives
(Figure 7.5(c)).
The proof-of-concept study was conducted by comparing several different surfaces
before and after TPD deposition, and after various washing steps, as shown in Figure
7.6, taken from the concept by Leonard et al.183–185 Substrate A (before cleaning) was
measured to check for any surface contamination and substrate B (A after cleaning) was
measured to check the reduction of contaminations after a washing step at the surface.
Substrate C (deposition of TPD without cure) was measured to assess the presence of the
TPD, and substrate E (C after wash) was measured to verify the washing step and check
the selected solvent, THF, washed all TPD away from the surface. Substrate D (C after
cure) was used to assess the amount of TPD at the surface after the cure and substrate
F (D after wash) was used to assess how much TPD remained at the surface after any
ungrafted TPD was washed away (ability to graft to the surface only).
To test the grafting, three drops of pure TPD were deposited via a glass syringe onto
the surface and cured. Initially, thermal curing was of great interest because both the
waterborne basecoat and topcoat utilised in this study were thermally cured. Therefore,
using the same curing method would reduce the number of steps in the coating production
line; this being one of the goals of this research topic, as described in Section 1.2.
As a first test, a long curing time of 24 hours was selected, and the temperature was
set to 80 ◦C (the same curing temperature as the basecoat and clearcoat). Secondly, a
shorter realistic curing time of 30 minutes was tested and compared.
139

GOLD
(a) (b) (c)
Figure 7.5: A systematic approach to testing the grafting ability of TPD to solid surfaces:(a) model alkane-thiol-gold self-assembled monolayer surface of differing chain lengths, (b)polypropylene sheet containing no pigment, (c) industrial TPO polypropylene substratecontaining all additives including pigment.
+ TPD
Washed
Substrate Substrate
+ TPD
+Δ or λ
+ TPD
+Δ or λ
+Wash
+ TPD
+Wash
Δ (Heat)
or
λ (UV)
24h or 30min
Wash in THF
(5 min ultrasonic bath)
Wash in THF
(5 min ultrasonic bath)
Deposition
Pure drop (purity>98%)
Wash in THF
(5 min ultrasonic bath)
A B
C
E F
D
TPD
Figure 7.6: Experimental protocol for the grafting proof-of-concept experiment.
140
Two surface sensitive complementary techniques were used to compare the surfaces:
ToF-SIMS which is qualitative, but extremely surface sensitive, measuring only the up-
permost 1 - 2 atomic layers (approx. 10 A), and XPS which is quantitative, but not as
sensitive having a depth penetration of approx. 10 - 30 A.95,186
The marker signal used to compare the surfaces was selected as fluorine (F) because it
distinguished the TPD from the rest of the surface (i.e. the element was unique to TPD)
and the substrate surfaces were found to only be lightly contaminated with F-containing
substances, regarded as insignificant when compared to the grafted surfaces.
7.4.1 Surface Grafting of TPD to the Model Self Assembled
Monolayer (SAM) Surface
After verifying the SAM had successfully formed on the gold surface to create the model
(full details can be found in Appendix 10.H), the different surfaces A-F (Figure 7.6) were
created and the ToF-SIMS and XPS spectra measured. The results are shown in Figure
7.7, where the F− intensity was measured using ToF-SIMS and normalised against the
total ion count, so that a qualitative comparison could be performed. The F wt.% was
measured using XPS, so that a quantitative comparison could be performed. The two
techniques were compared to verify results. Figure 7.8 shows a magnified XPS spectra
from substrate F after 24 hour curing at 80 ◦C. It demonstrates how the presence of TPD
was identified through the use of modelling and matching binding energies which enabled
the identification of the organic C-F3 bond from the F 1s peak and the CF3 bond from
the C 1s peak, distinguishing it from any inorganic F-containing contaminants.
Firstly, the difference between the different substrates A-F were compared and dis-
cussed. It should be noted that the large error bars found in Figure 7.7(a) and (b) were
due to surface inhomogeneity merely from the deposition method (glass syringe) not cre-
ating a uniform thickness of TPD on the surface (this was sufficient for a proof-of-concept
study; however, film homogeneity becomes important when assessing adhesion in the later
chapters).
141

0
50
100
150
200
250
A B C D E F
No
rmal
ised
Inte
nsi
ty ‰
0
4
8
12
16
20
A1 B1 A2 B2 C D E F
At.
% F
0
50
100
150
200
250
A B C D E F
No
rmal
ised
Inte
nsi
ty (
‰)
0
2
4
6
8
10
12
14
A1 A2 B D E F
At.
% F
(a) (b)
(d) (c)
Figure 7.7: Thermal grafting of TPD at 80 ◦C on the model SAM surface. ToF-SIMSresults show normalised F− intensity found at the surface and XPS results show F wt.%found at the surface: (a) normalised F− intensity, 24 h cure; (b) *F wt.% , 24 h cure;(c) normalised F− intensity , 30 min cure; (d) *F wt.%, 30 min cure: for surfaces A-F asrepresented in Figure 7.6 (substrate C was not measured in XPS (d) to avoid contami-nation). *A1 represents the gold surface before plasma cleaning and SAM formation andA2 after plasma cleaning and SAM formation.
Initially, the untreated substrates were checked for fluorine contamination, which if
present, would render the identification of TPD via fluorine intensity inaccurate. With
the exception of the F−intensity shown in Figure 7.7(c), little fluorine contamination
of the ungrafted, uncleaned substrate A was found. It was not known what caused
the contamination of the surface during the ToF-SIMS measurement, however, washing
the surface to give substrate B showed a significant effect and the contamination was
successfully washed away. Two substrate A’s were produced for XPS analysis when using
SAM model surfaces, to compare the gold surface before plasma cleaning (A1) and after
142

plasma cleaning and SAM formation (A2). A small increase in F wt.% was observed after
SAM formation, as shown in Figure 7.7(d) (cause of contamination unknown). However,
washing the surface to give substrate B, showed a significant effect and the contamination
was successfully washed away.
The stability of ungrafted TPD in the ultra-high vacuum conditions required for ToF-
SIMS and XPS measurements was initially unknown, however, due to the high volatility
of TPD, measurement of substrate C (ungrafted TPD deposited) caused some challenges.
It was found to contaminate the vacuum chamber for XPS during the measurement of the
24 hour cure experiment, and so was no longer measured for the other XPS experiments.
However, an increase in signal intensity from substrate B to substrate C was found for the
24 hour and the 30 minute cure, shown by the F− intensity change in 7.7(a) and 7.7(c),
and the F wt.% change in 7.7(b) indicating the presence of TPD.
As expected, a signal intensity increase was observed from substrate B to substrate
D (addition of TPD and thermal curing), indicating the presence of TPD after grafting.
The signal intensity also increased from substrate C to substrate D, further demonstrating
the volatility of TPD. Thermal curing was thought to create covalent bonds between the
TPD and the substrate surface, so that it could not readily evaporate as it could from
substrate C, accounting for the greater signal intensity.
To confirm a C-C covalent bond had formed during the grafting of TPD, a peak
from the fragmentation of a C-C bond past the newly formed C-C bond of the C-H
inserted product was highlighted in the negative ToF-SIMS spectra, shown in Figure 7.9.
Fragments of C17H24F3S− from an intact C9 SAM chain with one TPD molecule grafted
were also evident at m/z = 317, proving the grafting theory had worked. This also
demonstrated the TPD remained intact after the thermal curing at 80 ◦C and no evidence
of further decomposition, other than to the carbene intermediate, occurred. Although it
was expected that grafting of TPD to the longer chain would be more likely to occur due to
lower steric hindrances, there was no evidence of an intact C18 SAM with a TPD molecule
(expected C26H42F3S− at m/z 443). This was likely to be due to the lower fraction of
143
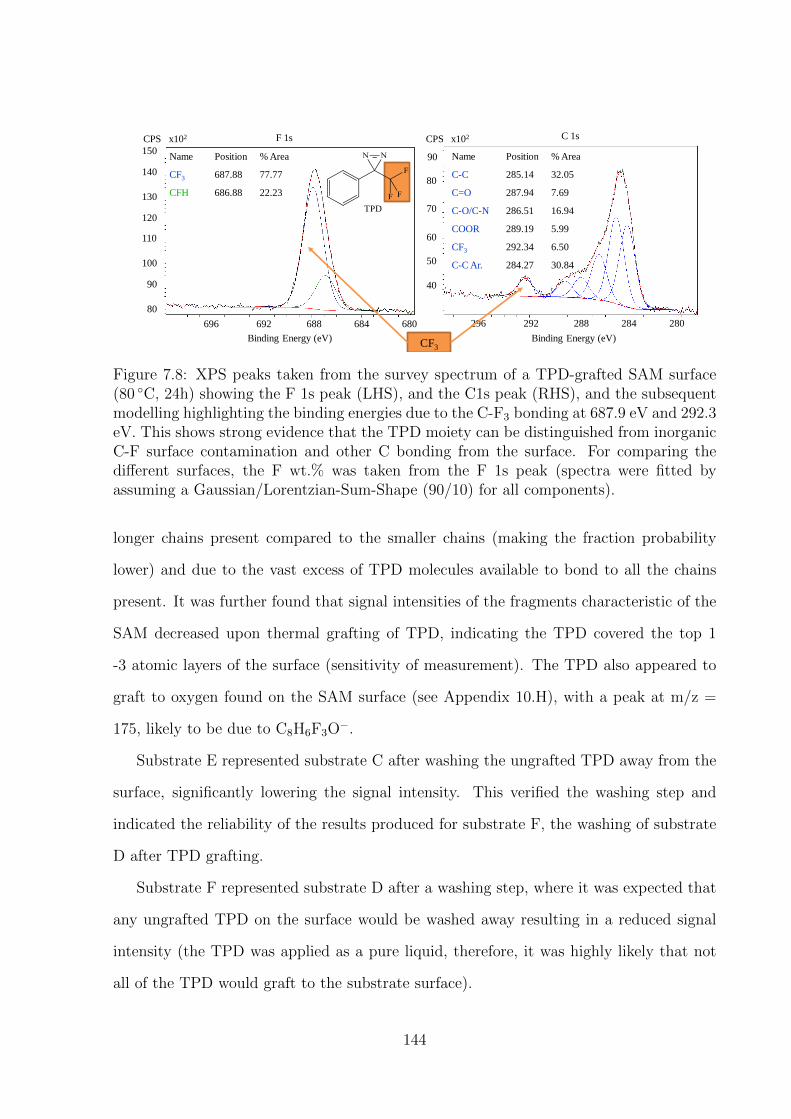
150
140
130
120
110
100
090
080
696 692 688 684 680 296 292 288 284 280
90
80
70
60
50
40
x102 CPS
Binding Energy (eV)
x102 CPS
Binding Energy (eV)
F 1s C 1s
Name Position % Area
CF3 687.88 77.77
CFH 686.88 22.23
Name Position % Area
C-C 285.14 32.05
C=O 287.94 7.69
C-O/C-N 286.51 16.94
COOR 289.19 5.99
CF3 292.34 6.50
C-C Ar. 284.27 30.84
TPD
CF3
Figure 7.8: XPS peaks taken from the survey spectrum of a TPD-grafted SAM surface(80 ◦C, 24h) showing the F 1s peak (LHS), and the C1s peak (RHS), and the subsequentmodelling highlighting the binding energies due to the C-F3 bonding at 687.9 eV and 292.3eV. This shows strong evidence that the TPD moiety can be distinguished from inorganicC-F surface contamination and other C bonding from the surface. For comparing thedifferent surfaces, the F wt.% was taken from the F 1s peak (spectra were fitted byassuming a Gaussian/Lorentzian-Sum-Shape (90/10) for all components).
longer chains present compared to the smaller chains (making the fraction probability
lower) and due to the vast excess of TPD molecules available to bond to all the chains
present. It was further found that signal intensities of the fragments characteristic of the
SAM decreased upon thermal grafting of TPD, indicating the TPD covered the top 1
-3 atomic layers of the surface (sensitivity of measurement). The TPD also appeared to
graft to oxygen found on the SAM surface (see Appendix 10.H), with a peak at m/z =
175, likely to be due to C8H6F3O−.
Substrate E represented substrate C after washing the ungrafted TPD away from the
surface, significantly lowering the signal intensity. This verified the washing step and
indicated the reliability of the results produced for substrate F, the washing of substrate
D after TPD grafting.
Substrate F represented substrate D after a washing step, where it was expected that
any ungrafted TPD on the surface would be washed away resulting in a reduced signal
intensity (the TPD was applied as a pure liquid, therefore, it was highly likely that not
all of the TPD would graft to the substrate surface).
144

n32014_0
n32015_0
n32016_0
n32017_0
n32018_0
n32013_0
C9H8F3
Mass (u)172.90 172.95 173.00 173.05 173.10 173.15 173.20
3x10
0.5
1.0
1.5
2.0
Inte
nsity
(cou
nts)
n32014_0
n32015_0
n32016_0
n32017_0
n32018_0
n32013_0
C9H8F3
Mass (u)172.90 172.95 173.00 173.05 173.10 173.15 173.20
3x10
0.5
1.0
1.5
2.0
Inte
nsity
(cou
nts)
103
2.0
1.5
1.0
0.5
173.00 173.05 173.10
Mass (u)
Inte
nsi
ty
Figure 7.9: Top: the mechanism of carbene generation via thermal activation and the sub-sequent C-H insertion into the substrate surface, highlighting the fragmentation; bottom:negative ToF-SIMS peak at m/z = 173 due to the fragmentation of the C-H insertionproduct past the newly formed C-C bond, proving a covalent bond is formed during thegrafting process.
The only exception to this was found in the XPS spectrum for the 30 min cure shown
in Figure 7.7(d), where the signal intensity of substrate F remained approximately the
same as substrate D, implying no TPD was washed from the surface. Therefore, the TPD
could have grafted to TPD layers already grafted to the substrate, forming a multi-layered
structure which could not be washed away. Grafting between TPDOH molecules and
between TPDCOOH molecules was observed in their mass spectra (see Appendix 10.G.1).
However, this was not observed in the mass spectrum of TPD. It was found, however,
that TPD was extremely sensitive and could only be detected using low energy ionisation
145

techniques. This grafting experiment suggests grafting between TPD molecules may have
occurred, but were unable to be detected during mass spectrometry measurements.
Having compared the different substrates A-F to prove the grafting of TPD was pos-
sible, the difference in curing times displayed in Figure 7.7 were compared. The 24 hour
curing time is shown in Figure 7.7(a)-(b) (in blue) and the 30 min curing time is shown in
Figure 7.7(c)-(d) (in red). The difference between the F wt.% found on substrate D after
24 hour and 30 minute curing was approximately 3 %. The difference after the washing
step on substrate F was nearer 0 %. The F− intensity change also showed little difference,
suggesting no significant difference between the two curing times.
Overall, the XPS and ToF-SIMS data shown in Figure 7.7, complement each other
and proved that TPD was able to graft to a model SAM surface via thermal curing at
80 ◦C. A curing time of greater than 30 minutes did not significantly improve the grafting
efficiency.
7.4.2 Surface Grafting of TPD to Polypropylene Substrates Con-
taining No Additives
The SAM model surface proved the ability of the TPD to thermally graft to the simple
polymer brush-like surface. The next progression was to assess the grafting ability to a PP
substrate closely related to substrates used in the industry, but containing no additives
including pigments. The identification of the TPD grafting efficiency on progressively
increasing complex substrates, enabled the assessment of any probable causes for a de-
crease in grafting efficiency. It was predicted that the grafting efficiency of TPD to the
PP model surfaces would be less than the SAM model surface, due to a decrease in the
order and possible higher density of polymer chains, hence, higher steric hinderances.
Figure 7.10 shows the F− intensity taken from ToF-SIMS data and the F wt.% taken
from XPS data measured on the various surfaces A-F (experimental protocol shown in
Figure 7.6). The thermally cured substrates D and F were cured at 80 ◦C for 24 hours
and 30 minutes to be compared with the SAM model surface.
146

0
20
40
60
80
100
120
140
160
180
200
A B C D E F
No
rmal
ised
in
ten
sity
(‰
)
0
0.1
0.2
0.3
0.4
0.5
0.6
0.7
A B D E F
At.
% F
0
10
20
30
40
50
60
70
A B C D E F
No
rmal
ised
Inte
nsi
ty ‰
(a) (b)
(d) (c)
0
0.5
1
1.5
2
2.5
3
3.5
4
A B D E F
At.
% F
Figure 7.10: Thermal grafting of TPD at 80 ◦C on PP sheets containing no pigment. ToF-SIMS results show normalised F− intensity found at the surface and XPS results show Fwt.% found at the surface: (a) normalised F− intensity , 24 h cure; (b) F wt.% , 24 h cure;(c) normalised F− intensity , 30 min cure; (d) F wt.%, 30 min cure: for surfaces A-F asrepresented in Figure 7.6 (substrate C was not measured in XPS to avoid contamination).
As expected, a similar trend to the SAM model surfaces was observed. Evidence
of a low level of contamination from F-containing species was evident on substrates A
and B (before and after cleaning), however, again once the TPD was deposited onto
the PP surface in substrate C, there was a significant increase in signal intensity of F−.
The volatility of TPD was again evident from the significant increase of the intensity
after thermal curing for substrate D. Step E verified the washing step giving F− and F
wt.% intensities on the scale of substrate B (before TPD deposition). For the 24 hour
cure, the F− intensity of substrate F after a washing step of substrate D unexpectedly
increased. However, analysis of the positive ToF-SIMS data revealed significant silicone
contamination on the surface of substrate D (from an unknown source), which likely
147

hindered the signal. The F wt.% in the XPS data contradicts this and shows the expected
pattern with substrate F having a lower intensity than substrate D, due to the washing
away of any ungrafted TPD from the surface (and also the depth of analysis from XPS is
larger than ToF-SIMS which may improve the F wt.% signal).
Interestingly when comparing the two curing times, the intensity of the data from
the grafted substrates (D and F) of the 30 minute cure was significantly larger than the
24 hour cure. Comparing the ratios of the F− and F wt.% intensity from substrate D:
substrate E and substrate F: substrate E, they were significantly larger for the 30 minute
cure than the 24 hour cure, also showing that more TPD had grafted at the surfaces after
30 minutes. Analysis of the positive ToF-SIMS spectrum equivalent to Figure 7.10(a)
revealed significant silicone-based contamination of the substrates D and F, being a likely
explanation for the cause of the lower intensities after 24 hours (significant contamination
was not present on substrates after 30 minute cure). However, it was not necessary
to repeat the experiment because 24 hours would not be a plausible curing time in an
industrial set-up, and the positive results shown after the 30 minute cure were of greater
interest. It should also be noted that silicon-containing compounds were not of interest
as APs because they cause the undesired effect of craters in the coating.87
When comparing the grafting results from the model SAM surface in Figure 7.7 and
the PP surface with no additives in Figure 7.10, a clear intensity drop was evident moving
to the PP surface. For example, the F wt.% of substrate F after a 30 minute cure was
∼ 11 % on a SAM surface and ∼ 2.5 % on the PP surface, a significant difference. As
previously mentioned, this was likely to be due to an increased steric hindrance of the
randomly orientated, well-packed polymer chains of the PP surface, making it difficult for
a TPD molecule to graft to an exposed chain, compared to the less hindered, vertically
orientated polymer chains of the SAM surface. Overall, TPD was successfully grafted to
a PP surface containing no additives.
148

7.4.3 Surface Grafting of TPD to Industrial TPO/0 Substrates,
Containing No EPDM
The next natural progression was to assess the grafting of TPD to industrial substrates.
Firstly, the ability of TPD to graft to a TPO substrate containing no EPDM (which could
potentially influence grafting properties) was assessed. To compare the various substrates
tested, the same curing times of 24 hours and 30 minutes were used.
Figure 7.11 shows the F− intensity and F wt.% of the various substrates shown in
Figure 7.6. Little evidence of surface contamination was found, and as expected the
overall intensities of the substrates were larger for the 24 hour curing time than for the
30 minute curing time. Between the substrates A-F, the same pattern was found as for
the SAM model surface and PP surface. Clear evidence of TPD grafting was found, when
comparing the signal intensities of substrate F and substrate B for both the 24 hour cure
and the 30 minute cure. There was a 0.7 wt.% difference between substrate F after 30
minutes curing time on the TPO/0 substrate in Figure 7.11 (d) and the PP substrate in
Figure 7.10 (d), suggesting the addition of the additives to PP-based substrates hindered
the grafting ability to an extent. However, successful thermal grafting was observed at
80 ◦C.
7.4.4 Surface Grafting of TPD to Industrial TPO/2 Substrates,
Containing EPDM
The addition of 2 % EPDM to a TPO substrate (TPO/2) was tested subsequently, as
shown in Figure 7.12. A decrease in signal intensity of the substrates D and F after a 24
hour cure compared to the 30 minute cure were again observed, as was found with the
PP surfaces. Analysis of the positive ToF-SIMS spectra of these surfaces suggested this
was due to signal hindrance from silicone contamination at the surface. However, it was
not necessary to reproduce since successful TPD grafting evidence was found after the 30
minute cure (closer to industrial time scales).
149

0
10
20
30
40
50
60
70
80
A B C D E F
No
rmal
ised
Inte
nsi
ty (
‰)
0
50
100
150
200
250
300
350
A B C D E F
No
rmal
ised
Inte
nsi
ty ‰
(a) (b)
(d) (c)
0
0.5
1
1.5
2
2.5
A B D E F
At.
% F
0
0.2
0.4
0.6
0.8
1
1.2
1.4
A B D E F
At.
% F
Figure 7.11: Thermal grafting of TPD at 80 ◦C on the industrial TPO/0 substrate. ToF-SIMS results show normalised F− intensity found at the surface and XPS results show Fwt.% found at the surface: (a) normalised F− intensity , 24 h cure; (b) XPS , 24 h cure;(c) normalised F− intensity , 30 min cure; (d) F wt.%, 30 min cure: for surfaces A-F asrepresented in Figure 7.6 (substrate C was not measured in XPS to avoid contamination).
Despite taking precaution when handling the samples, often silicone surface contami-
nation was present. This could have been due to a number of reasons, such as the contact
with personal care products like hairspray or hand cream, however, it was not possible
to identify the contamination source. The industrial laboratory limited the cleanliness
that was possible when handling the samples, however, for the purpose of the study, the
significance of the data was sufficient for all purposes.
A small difference in the signal intensity of the F wt.% of substrate F after a 30
minute cure on the TPO/2 surface (∼ 0.7 %) and the TPO/0 surface (∼ 0.9 %) was
found, however when accounting for the low silicone contamination found at the surfaces,
the significance of this difference is debatable. When comparing to the equivalent non-
150

pigmented PP surface (2.6 wt.%), the 0.2 wt.% difference between the TPO/0 and TPO/2
substrates can be considered as negligible. Therefore, future grafting experiments were
carried out on the industrially relevant TPO/0 substrate.
Overall, TPD was successfully grafted to the industrial TPO/2 substrate at 80 ◦C.
0
5
10
15
20
25
30
35
40
A B C D E F
Norm
alis
ed I
nte
nsi
ty (
‰)
0
0.1
0.2
0.3
0.4
0.5
0.6
0.7
0.8
0.9
A B D E F
At.
% F
0
0.1
0.2
0.3
0.4
0.5
0.6
A B D E F
At.
% F
0
5
10
15
20
25
30
35
40
A B C D E F
Norm
alis
ed I
nte
nsi
ty ‰
(a) (b)
(d) (c)
Figure 7.12: Thermal grafting of TPD at 80 ◦C on the industrial TPO/2 substrate (con-taining 2 % EPDM). ToF-SIMS results show normalised F− intensity found at the surfaceand XPS results show F wt.% found at the surface: (a) normalised F− intensity , 24 hcure; (b) F wt.%, 24 h cure; (c) normalised F− intensity , 30 min cure; (d) F wt.%, 30min cure: for surfaces A-F as represented in Figure 7.6 (substrate C was not measured inXPS to avoid contamination).
151

7.5 Modification of TPD, Tailoring for the Adhesion
at the AP/Basecoat Interface
Having successfully grafted TPD to various substrates including industrially relevant sub-
strates, the next step was taken to modify TPD with hydrophilic functional groups to
account for adhesion between the newly grafted surface and the waterborne basecoat. Fig-
ure 7.13 shows the two structures that were chosen, denoted as TPDCOOH and TPDOH,
which could potentially H-bond to other hydrophilic components found in the waterborne
basecoat.
(a) Substrate (b) Substrate
Figure 7.13: Modifying TPD with hydrophilic functional groups to allow for adhesionwith the applied waterborne basecoat via hydrogen bonding, as shown schematically for(a) TPDCOOH and (b) TPDOH.
7.5.1 Surface Grafting of TPDOH to Industrial TPO/0 Sub-
strates at 80 ◦C
As with TPD, TPDOH is a liquid, and can be easily applied in pure form or diluted
with a solvent. To move the grafting conditions towards an industrial relevant protocol,
TPDOH diluted with solvent was tested (more economical for industrial application), as
well as TPDOH in its pure form for fundamental purposes.
The F− and F wt.% intensities for pure TPDOH are shown in Figure 7.14(a)-(b),
and for 0.5 M TPDOH in acetone are shown in Figure 7.14(c)-(d). Previous grafting
152

experiments with TPD showed that a grafting time of 30 minutes was sufficient to obtain
significant results, therefore, this curing time was used for TPDOH and TPDCOOH tests.
Applying acetone solutions on a lab scale via syringe application for this proof-of-
concept was not problematic, but it was known that in industrial practice, when applying
acetone solutions (classified as highly flammable) to substrates using spray application
systems, it can be dangerous and correct grounding (or earthing) and bonding (connection
of two or more conductive objects by a conductor) procedures are very important. The
solution passing through the nozzle of the spray gun would generate a static charge and
the acetone would cause flammable vapours to evolve into the area where the spraying is
conducted. This could cause a potential explosion. Thus, the spray gun must be bonded
to the substrate and the substrate must be bonded to the ground (grounded) in order to
prevent potential ignition of the flammable vapours generated by the acetone when using
a spray application. Although it was known that acetone would not be a desirable solvent
in an industrial application, a solvent with such a high volatility rate was desirable for
the proof-of-concept, so that it would evaporate away from the surface leaving behind
the TPDOH and eliminating the possible side reaction of TPDOH grafting with solvent
molecules.
Figure 7.14(a) shows the F− intensity for the substrates A-F, when the grafting ability
of pure TPDOH was tested. Substrates A and B showed a minimal signal intensity,
showing that very little fluorine-containing surface contamination was present before and
after the substrate cleaning. The large signal intensity from substrate C, which was
comparable in intensity to substrate D, showed that TPDOH was significantly less volatile
than TPD, and a strong signal was measured when the TPDOH was deposited on the
surface without grafting. A signifantly larger signal intensity was present at surface D
compared to surface B, after thermal curing. Substrate E again verified the washing
step. Substrate F had a small intensity decrease compared to substrate D, due to any
ungrafted TPDOH molecules being washed away, but had a significantly larger intensity
than substrate B, demonstrating that TPDOH was able to thermally graft to TPO/0.
153
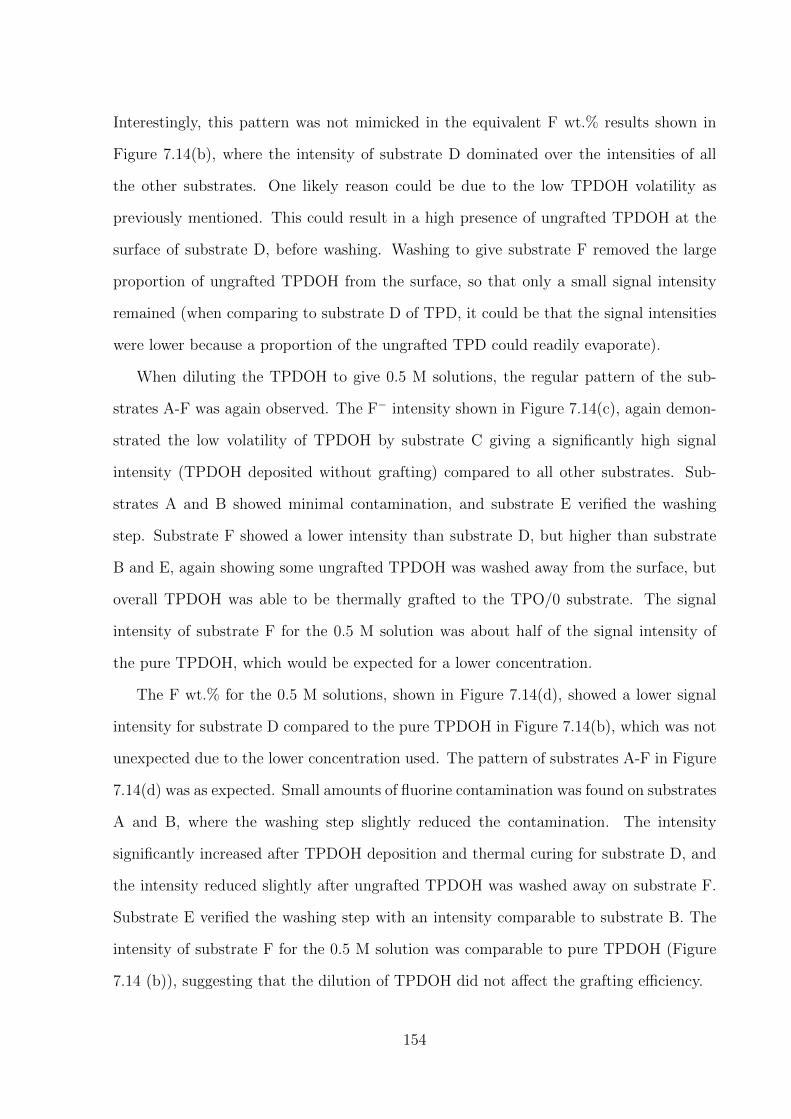
Interestingly, this pattern was not mimicked in the equivalent F wt.% results shown in
Figure 7.14(b), where the intensity of substrate D dominated over the intensities of all
the other substrates. One likely reason could be due to the low TPDOH volatility as
previously mentioned. This could result in a high presence of ungrafted TPDOH at the
surface of substrate D, before washing. Washing to give substrate F removed the large
proportion of ungrafted TPDOH from the surface, so that only a small signal intensity
remained (when comparing to substrate D of TPD, it could be that the signal intensities
were lower because a proportion of the ungrafted TPD could readily evaporate).
When diluting the TPDOH to give 0.5 M solutions, the regular pattern of the sub-
strates A-F was again observed. The F− intensity shown in Figure 7.14(c), again demon-
strated the low volatility of TPDOH by substrate C giving a significantly high signal
intensity (TPDOH deposited without grafting) compared to all other substrates. Sub-
strates A and B showed minimal contamination, and substrate E verified the washing
step. Substrate F showed a lower intensity than substrate D, but higher than substrate
B and E, again showing some ungrafted TPDOH was washed away from the surface, but
overall TPDOH was able to be thermally grafted to the TPO/0 substrate. The signal
intensity of substrate F for the 0.5 M solution was about half of the signal intensity of
the pure TPDOH, which would be expected for a lower concentration.
The F wt.% for the 0.5 M solutions, shown in Figure 7.14(d), showed a lower signal
intensity for substrate D compared to the pure TPDOH in Figure 7.14(b), which was not
unexpected due to the lower concentration used. The pattern of substrates A-F in Figure
7.14(d) was as expected. Small amounts of fluorine contamination was found on substrates
A and B, where the washing step slightly reduced the contamination. The intensity
significantly increased after TPDOH deposition and thermal curing for substrate D, and
the intensity reduced slightly after ungrafted TPDOH was washed away on substrate F.
Substrate E verified the washing step with an intensity comparable to substrate B. The
intensity of substrate F for the 0.5 M solution was comparable to pure TPDOH (Figure
7.14 (b)), suggesting that the dilution of TPDOH did not affect the grafting efficiency.
154
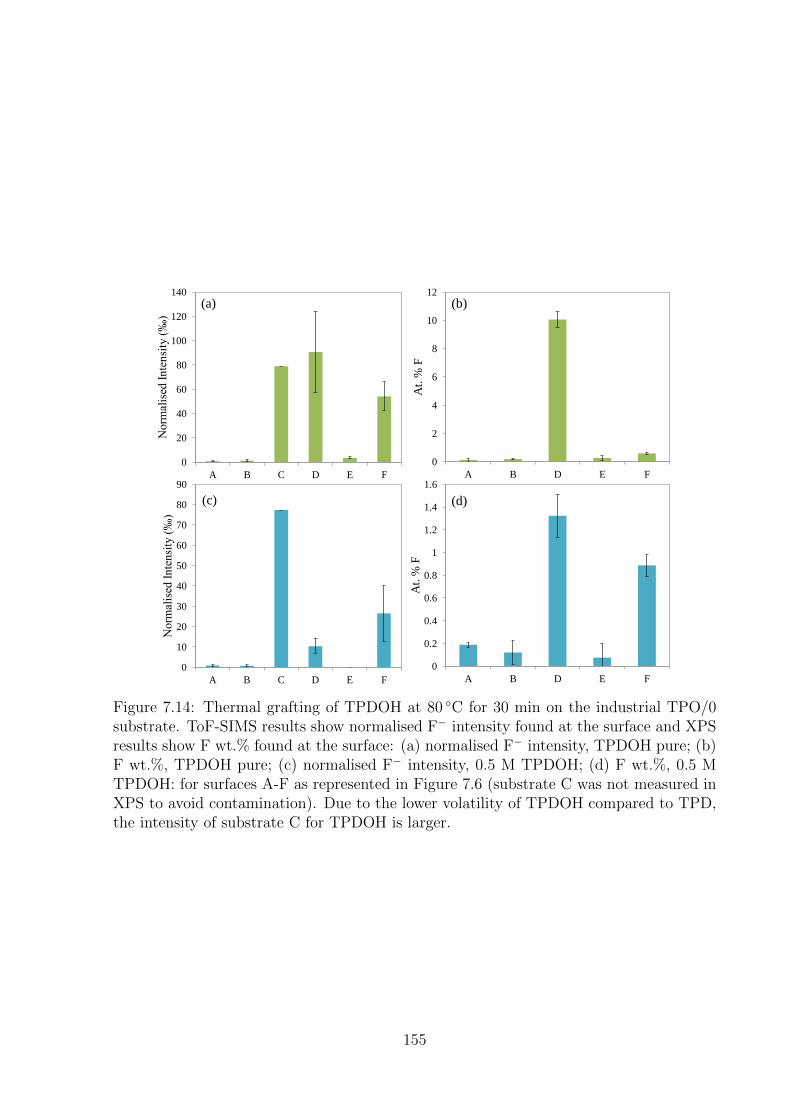
0
10
20
30
40
50
60
70
80
90
A B C D E F
Norm
alis
ed I
nte
nsi
ty (
‰)
0
2
4
6
8
10
12
A B D E F
At.
% F
0
20
40
60
80
100
120
140
A B C D E F
Norm
alis
ed I
nte
nsi
ty (
‰)
(a) (b)
(d) (c)
0
0.2
0.4
0.6
0.8
1
1.2
1.4
1.6
A B D E F
At.
% F
Figure 7.14: Thermal grafting of TPDOH at 80 ◦C for 30 min on the industrial TPO/0substrate. ToF-SIMS results show normalised F− intensity found at the surface and XPSresults show F wt.% found at the surface: (a) normalised F− intensity, TPDOH pure; (b)F wt.%, TPDOH pure; (c) normalised F− intensity, 0.5 M TPDOH; (d) F wt.%, 0.5 MTPDOH: for surfaces A-F as represented in Figure 7.6 (substrate C was not measured inXPS to avoid contamination). Due to the lower volatility of TPDOH compared to TPD,the intensity of substrate C for TPDOH is larger.
155
This was expected since the acetone would readily evaporate, preventing possible side
reactions with TPDOH (TPDOH would preferentially react with the mobile, less sterically
hindered solvent molecules over the polymer substrate) as previously mentioned, and the
amount of TPDOH molecules available to react at the surface was in large excess.
Overall, the grafting of TPDOH via thermal curing to an industrial TPO/0 substrate
was possible after a 30 minute curing time at 80 ◦C, whilst the dilution with acetone did
not significantly affect the grafting efficiency.
7.5.2 Surface Grafting of TPDCOOH to Industrial TPO/0 Sub-
strates at 80 ◦C
Unlike TPD and TPDOH, TPDCOOH is a solid white powder. Therefore, it was not
applied in pure form and only a 0.5 M solution in acetone was tested. Once again the
curing temperature remained 80 ◦C and the curing time was 30 minutes.
Figure 7.15 shows XPS and ToF-SIMS spectra before and after the grafting of TPD-
COOH.Figure 7.16 shows the F− and F wt.% intensity for the substrates A-F.
Minimal fluorine contamination was found on substrates A and B, and Figure 7.16(a)
shows that a signal was detected after the TPDCOOH was deposited without curing on
substrate C, because the TPDCOOH remained at the surface after the solvent evaporated
(this was visually observed by the presence of a white layer). After thermal curing, a
significant intensity was found on substrate D which was reduced after the washing step
to give substrate F. However, the intensity of substrate F remained larger than substrate B
or E, proving TPDCOOH was able to thermally graft to the industrial TPO/0 substrate.
The intensity of substrate E was comparable to substrate B, verifying the washing step.
Comparing substrate F in Figure 7.16(b) and 7.14(d) showed little difference between the
grafting efficiency of 0.5 M TPDOH and 0.5 M TPDCOOH.
Overall, a solution of 0.5 M TPDCOOH in acetone is able to thermally graft at 80 ◦C
for 30 minutes to an industrial TPO/0 substrate.
156

F 1s
= No AP
= With AP
C 1s
696 692 688 684 680
Binding Energy (eV)
35
30
25
20
15
10
5
0
x 103
CP
S
296 292 288 284 280
Binding Energy (eV)
0
10
20
30
40
50
70
80
60
CP
S
x 103
x106
x106
x102
Norm
alis
ed
Inte
nsi
ty
Norm
alis
ed
Inte
nsi
ty
Norm
alis
ed
Inte
nsi
ty
5 10 15 20 25 30 35 40 45 Mass (u)
60 70 80 90 100 110 120 130 140 Mass (u)
160 180 200 220 240 260 280
Mass (u)
x106
x106
x102
Norm
alis
ed
Inte
nsi
ty
Norm
alis
ed
Inte
nsi
ty
Norm
alis
ed
Inte
nsi
ty
Carboxyl functionalities
C4H5O2-
CF3-
O- OH-
F-
5 10 15 20 25 30 35 40 45 Mass (u)
60 70 80 90 100 110 120 130 140 Mass (u)
160 180 200 220 240 260 280
Mass (u)
TPD
(a) (b)
(c) (d)
CF3
Figure 7.15: XPS narrow region scans of (a) F 1s peak and (b) C 1s peak, before and afterTPDCOOH grafting, and ToF-SIMS spectra of (c) the TPO/0 substrate before and (d)after TPDCOOH grafting. The spectra show that F and O containing species are uniqueto TPDCOOH, (the C 1s spectrum shows a peak at 285 eV characteristic of C—C/C—Hpresent in both TPO/0 and TPDCOOH.)
157
0
0.5
1
1.5
2
2.5
A B D E F
At.
% F
0
20
40
60
80
100
120
140
160
A B C D E F
Norm
alis
ed I
nte
nsi
ty (
‰)
(a) (b)
Figure 7.16: Thermal grafting of TPDCOOH at 80 ◦C for 30 min on the industrial TPO/0substrate. ToF-SIMS results show normalised F− intensity found at the surface and XPSresults show F wt.% found at the surface: (a) normalised F− intensity, 0.5 M TPDCOOH;(b) F wt.%, 0.5 M TPDCOOH: for surfaces A-F as represented in Figure 7.6 (substrateC was not measured in XPS to avoid contamination).
7.5.3 Surface Grafting of TPDOH to Industrial TPO/0 Sub-
strates at 100 ◦C
Thus far, the grafting ability of TPD, TPDOH and TPDCOOH was tested at 80 ◦C. This
temperature was the most relevant since the waterborne basecoat and topcoat, used later
in this study, cure at this temperature. Therefore, the number of steps would be reduced in
the production line if the AP could be formulated into the basecoat. However, to explore
how the curing temperature would influence the grafting efficiency, the experiment using
TPDOH and TPDCOOH was repeated at 100 ◦C.
The F − and F wt.% intensities for substrates A-F for pure TPDOH are shown in
Figure 7.17(a)-(b), and for 0.5 M TPDOH are shown in Figure 7.17(c)-(d). The ratios
of signal intensity for substrates A-F was as expected and as seen previously. The signal
intensity for substrate F after the grafting of pure TPDOH was found to be higher at
100 ◦C (Figure 7.17 (b)) than at 80 ◦C (Figure 7.14 (b)) by ∼ 6 wt.%, however the signal
intensity for substrate F after the grafting of 0.5 M TPDOH at 100 ◦C (Figure 7.17 (b))
was slightly less than at 80 ◦C (Figure 7.14 (b)) by ∼ 0.5 wt.% (a value close to the
standard deviation) . Therefore, increasing the temperature by 20 ◦C only significantly
158
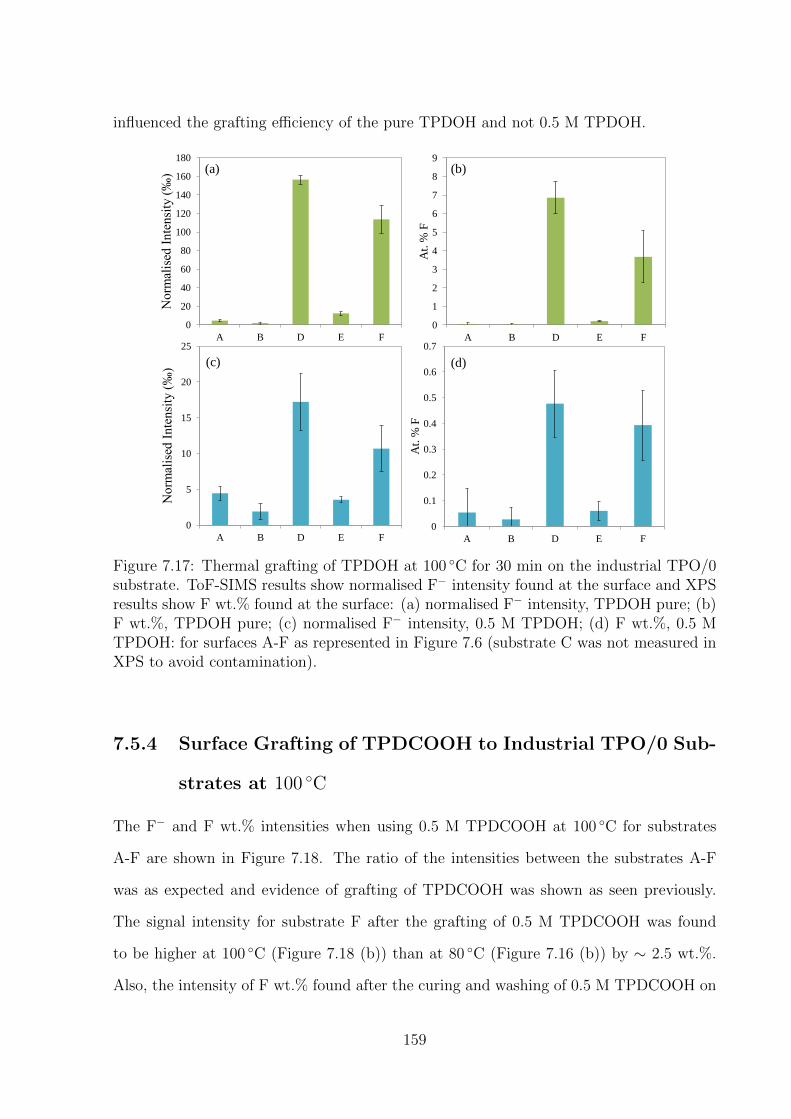
influenced the grafting efficiency of the pure TPDOH and not 0.5 M TPDOH.
0
20
40
60
80
100
120
140
160
180
A B D E F
No
rmal
ised
In
ten
sity
(‰
)
0
1
2
3
4
5
6
7
8
9
A B D E F
At.
% F
0
5
10
15
20
25
A B D E F
No
rmal
ised
In
ten
sity
(‰
)
(a) (b)
(d) (c)
0
0.1
0.2
0.3
0.4
0.5
0.6
0.7
A B D E F
At.
% F
Figure 7.17: Thermal grafting of TPDOH at 100 ◦C for 30 min on the industrial TPO/0substrate. ToF-SIMS results show normalised F− intensity found at the surface and XPSresults show F wt.% found at the surface: (a) normalised F− intensity, TPDOH pure; (b)F wt.%, TPDOH pure; (c) normalised F− intensity, 0.5 M TPDOH; (d) F wt.%, 0.5 MTPDOH: for surfaces A-F as represented in Figure 7.6 (substrate C was not measured inXPS to avoid contamination).
7.5.4 Surface Grafting of TPDCOOH to Industrial TPO/0 Sub-
strates at 100 ◦C
The F− and F wt.% intensities when using 0.5 M TPDCOOH at 100 ◦C for substrates
A-F are shown in Figure 7.18. The ratio of the intensities between the substrates A-F
was as expected and evidence of grafting of TPDCOOH was shown as seen previously.
The signal intensity for substrate F after the grafting of 0.5 M TPDCOOH was found
to be higher at 100 ◦C (Figure 7.18 (b)) than at 80 ◦C (Figure 7.16 (b)) by ∼ 2.5 wt.%.
Also, the intensity of F wt.% found after the curing and washing of 0.5 M TPDCOOH on
159

substrate F was found to be ∼3 wt.% greater than for the substrate F after the curing
and washing of 0.5 M TPDOH.
Overall, the curing temperature was shown to have a positive effect on the grafting
efficiency of 0.5 M TPDCOOH, which was found to be better than 0.5 M TPDOH. It
was therefore hypothesised that the adhesive effects of TPDCOOH would be greater than
TPDOH, after thermal curing.
0
0.5
1
1.5
2
2.5
3
3.5
4
4.5
5
A B D E F
0
5
10
15
20
25
30
35
40
45
50
A B D E F
Norm
alis
ed I
nte
nsi
ty (
‰)
(a) (b)
Figure 7.18: Thermal grafting of TPDCOOH at 100 ◦C for 30 min on the industrialTPO/0 substrate. ToF-SIMS results show normalised F− intensity found at the surfaceand XPS results show F wt.% found at the surface: (a) normalised F− intensity, 0.5 MTPDCOOH; (b) F wt.%, 0.5 M TPDCOOH: for surfaces A-F as represented in Figure7.6 (substrate C was not measured in XPS to avoid contamination).
7.5.5 Prediction of TPD Solution Concentration to Create a
Monolayer
The concentration of a TPD, TPDOH or TPDCOOH solution required to create a mono-
layer were predicted, as described in Section 4.21.1. This gave an estimation of the extent
to which the TPD, TPDOH or TPDCOOH molecules were in excess in the solutions used
during the grafting experiment.
The results are displayed in Figure 7.19. It was found that all three 0.5 M solutions
that had been used in the grafting study were largely in excess, by ∼60,000 %. Assuming
the film thickness formed was that of a 5 µm doctor blade, and all molecules stacked on
top of one another in the form of cuboids, ∼4000 layers of each molecule would be present.
160

This was a crude estimation, but it was useful to show that under the conditions used,
the whole surface of the substrate would be expected to be covered by the TPD, TPDOH
or TPDCOOH if the grafting efficiency at the set conditions was sufficient.
Figure 7.19: Theoretical calculations for the concentration required of each AP for onemonolayer on the surface, the concentration % excess of the 0.5 M solutions used, andthe number of layers that would be present in a 5 µm thickness. Calculations of themolecule diameter were calculated using Cosmo, assuming an energetically lower con-former is favoured in the gas phase. The volume occupied by one molecule of AP wasmodelled as a cube and rigidity of the AP molecules was assumed, so that layers of cubesstack on top of each other without collapsing. Calculations were based on a 5 µm layerthickness, and an area of 8 x 8 cm.
7.5.6 Surface Grafting of TPDOH and TPDCOOH to Indus-
trial TPO/0 Substrates with UV Curing at a Radiance
Exposure of 1900 mJ cm−2
So far, only thermal grafting of TPD, TPDOH or TPDCOOH had been considered be-
cause from an industrial point of view, having the curing method the same as the water-
borne basecoat and topcoat (used in this study) would reduce the number of steps in the
production line.
An alternative curing method sometimes used in the coatings industry is the use of UV
light. It has the advantage that UV curing can be used in cool conditions so that substrates
prone to deformation at high temperatures can be coated. However, a disadvantage is
that it introduces an extra step into the production line (see Figure 1.4).
161

Positive UV initiated CH insertion reactions between TPD and cyclohexane had previ-
ously been observed in Section 7.3.1. As a last proof-of-concept in the grafting study, the
grafting efficiency of 0.5 M TPDOH and 0.5 M TPDCOOH cured with UV at a radiance
exposure of 1900 mJ cm−2 was tested and compared to the results of thermal curing at
80 ◦C and 100 ◦C.
The results are shown in Figure 7.20 for substrates A-F. Since UV light could generate
oxygen radicals which could have a potential influence on the adhesive properties at the
surface of the substrates,117 an extra substrate, B(UV), was tested which was a washed
substrate B that had been exposed to UV. Although only the F− and F wt.% intensities
are displayed in Figure 7.20, the oxygen content was also monitored at the surface via the
O− and O wt.% intensities, but no significant difference was found before and after UV
treatment.
The ratio of the intensities of substrates A-F show the expected pattern previously
observed. The significantly larger F− and F wt.% intensities for substrate F compared to
B and E showed that TPDOH and TPDCOOH successfully grafted to a TPO/0 substrate
via UV curing.
The F wt.% (quantitative) of substrate F after 0.5 M TPDCOOH was cured (Figure
7.20(d)) is ∼10 times greater than for the 0.5 M TPDOH (Figure 7.20(b)). The F−
intensity (qualitative) of substrate F after 0.5 M TPDCOOH (Figure 7.20(c)) was cured
is ∼2 times greater than the 0.5 M TPDOH (Figure 7.20(a)). Therefore, TPDCOOH
showed a significantly greater grafting efficiency compared to TPDOH.
When comparing the F wt.% intensities between the different curing methods, the UV
curing produced similar results found for thermal curing of TPDCOOH and TPDOH at
100 ◦C (and greater intensities than thermal curing at 80 ◦C).
162

0
20
40
60
80
100
120
140
A B B(UV) C D E F
Norm
alis
ed I
nte
nsi
ty (
‰)
0
10
20
30
40
50
60
A B B(UV) C D E F
Norm
alis
ed I
nte
nsi
ty (
‰)
0.0
0.1
0.2
0.3
0.4
0.5
0.6
0.7
0.8
0.9
A B B (UV) C D E F
At.
% F
(a) (b)
(d) (c)
0.0
2.0
4.0
6.0
8.0
10.0
12.0
A B B (UV) C D E F
At.
% F
Figure 7.20: UV grafting of TPDOH and TPDCOOH at 1900 mJ cm−2 radiant exposureon the industrial TPO/0 substrate. ToF-SIMS results show normalised F− intensityfound at the surface and XPS results show F wt.% found at the surface: (a) normalisedF− intensity, 0.5 M TPDOH; (b) F wt.%, 0.5 M TPDOH; (c) normalised F− intensity, 0.5M TPDCOOH; (d) F wt.%, 0.5 M TPDCOOH: for surfaces A-F as represented in Figure7.6 (substrate C was not measured in XPS to avoid contamination).
7.6 Summary
A direct comparison between the F wt.% and F− intensities of substrate F for the different
curing methods tested, is shown in Table 7.2. Overall, TPDCOOH had a greater grafting
efficiency than TPDOH and TPD. Furthermore, the thermal curing at 100 ◦C and UV
curing at 1900 mJ cm−2 gave better yields than thermal curing at 80 ◦C. Therefore,
it was hypothesised that the adhesion of a waterborne basecoat would be greater to a
TPDCOOH-modified substrate compared to TPDOH. Due to the lack of hydrophilic
functional groups on TPD, it was expected that the adhesion of a waterborne basecoat
would be poor to a TPD-modified substrate.
163
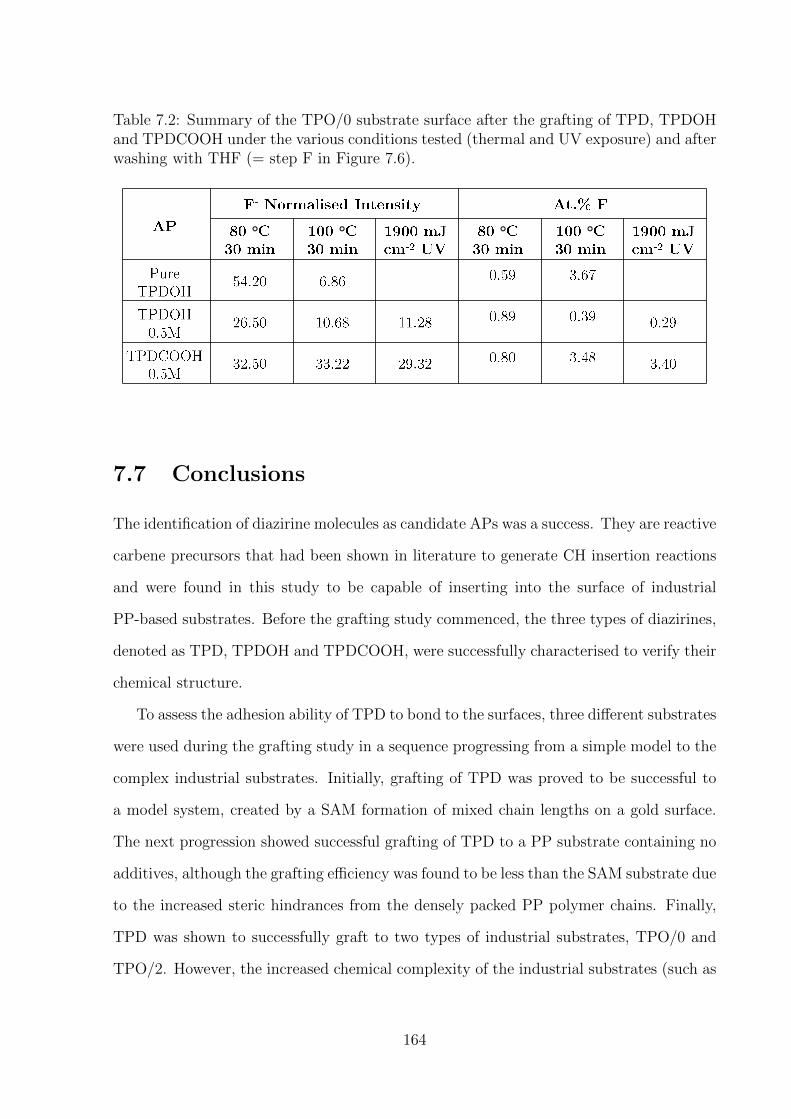
Table 7.2: Summary of the TPO/0 substrate surface after the grafting of TPD, TPDOHand TPDCOOH under the various conditions tested (thermal and UV exposure) and afterwashing with THF (= step F in Figure 7.6).
° ° ° °
7.7 Conclusions
The identification of diazirine molecules as candidate APs was a success. They are reactive
carbene precursors that had been shown in literature to generate CH insertion reactions
and were found in this study to be capable of inserting into the surface of industrial
PP-based substrates. Before the grafting study commenced, the three types of diazirines,
denoted as TPD, TPDOH and TPDCOOH, were successfully characterised to verify their
chemical structure.
To assess the adhesion ability of TPD to bond to the surfaces, three different substrates
were used during the grafting study in a sequence progressing from a simple model to the
complex industrial substrates. Initially, grafting of TPD was proved to be successful to
a model system, created by a SAM formation of mixed chain lengths on a gold surface.
The next progression showed successful grafting of TPD to a PP substrate containing no
additives, although the grafting efficiency was found to be less than the SAM substrate due
to the increased steric hindrances from the densely packed PP polymer chains. Finally,
TPD was shown to successfully graft to two types of industrial substrates, TPO/0 and
TPO/2. However, the increased chemical complexity of the industrial substrates (such as
164

additives including pigments) compared to the other substrates caused a decrease in the
grafting efficiency compared to the PP substrate containing no additives. Grafting for all
three substrates was found to be successful with thermal and UV curing.
After the successful grafting of TPD was achieved, two modified versions with hy-
drophilic functional groups for adhesion with the basecoat were tested (TPDOH and
TPDCOOH). Grafting was found to be successful on a TPO/0 substrate, however, UV
curing at 1900 mJ cm−2 and curing at 100 ◦C were the two conditions that gave the high-
est grafting efficiency from F wt.% data, and the TPDCOOH AP gave a higher grafting
efficiency than TPDOH. Therefore, it was hypothesised that the grafting of TPDCOOH
at 100 ◦C for 30 minutes or 1900 mJ cm−2 UV would give the best adhesion performance
with a waterborne basecoat. Also, the UV cure takes approximately 2 seconds, therefore,
it would be the most efficient curing method in terms of time.
Furthermore, the calculation of the required AP concentration to produce one mono-
layer showed that the concentrations tested were in large excess. Therefore, it was ex-
pected that the AP would cover the substrate surface, assuming that grafting was effective.
165

Chapter 8
CHEMICAL ADHESION: CROSS-HATCH AND
STEAM JET ADHESION TESTS
8.1 Overview
An overview of this chapter to guide the reader through the results is shown in Figure
8.1. The main focus of this chapter was to test the adhesion ability of the newly grafted
TPDCOOH and TPDOH surfaces to a waterborne basecoat, focusing on the adhesion at
the AP/basecoat interface. Two tests were used to assess the adhesion of substrates that
were coated and cured in a range of different conditions.
8.2 Introduction
After the grafting ability of TPD, TPDOH and TPDCOOH was tested in Chapter 7, a
waterborne basecoat and clearcoat were applied to freshly grafted substrates to test the
adhesion properties. Two adhesion tests were performed: the CHT and the SJT. The
CHT is often used in industry as a preliminary step to determine if adhesion has been
improved. When the adhesion of the CHT gave a good result (=0), then a further more
rigorous test, the SJT, was performed. This high-pressured steam test can give variable
results, which was demonstrated by the reproducibility tests performed. Although all
166

Adhesion Tests
Doctor Blade Application
(UV, thermal, wet on-wet cure)
Surface Energy of New Surface
Compatibility with Waterborne Coatings
Mode of Failure Interface of Failure
Spray Gun Application
(UV, Thermal Cure)
Kinetics UV-Vis Time Study Rates of Reaction
Carbene Generation EPR Study Triplet or Singlet
State Carbene
Cross-Sectional Analysis
Chemical Mapping Coating Thicknesses
& AP Penetration
Industrial Applicability
Stability of APs Storage Requirements
Synthesis Industrial Scale-up
Possibility
Colour Effect on Coating
Colour
Safety Safe Handling & Industrial Process
Suitability
Formulation Ideas to Formulate
into Basecoat
Theme Topics Measurements Knowledge Gained
Figure 8.1: A summary of the chemical adhesion tests chapter.
167

CHT tests were reproducible, all SJT tests were reproducible within ± 2 gradings. Each
condition tested was performed three times and the analysis below was performed on the
coated substrates from the first CHT and SJT.
A schematic representation of the cross-section of a coated substrate is shown in Figure
8.2. As mentioned in Chapter 7, the first step was to apply the AP as a primer layer
to test the adhesive ability at the substrate/AP interface and the AP/basecoat interface.
The adhesion tests were therefore testing the AP’s ability to function as a covalent bridge
between a hydrophobic substrate and a hydrophilic basecoat. It was expected that grafting
functional molecules to the substrate surface would improve the adhesion by the same
mechanism as the state of the art flame pre-treatment. The polar functional groups
introduced to the substrate surface would increase the polar component of the surface
energy, to better match the polar surface energy component of the applied waterborne
basecoat, thus adhesion is improved.
The application variables of the applied primer layer are displayed in Table 8.1. Firstly,
the adhesion of TPD was tested as a proof-of-concept and the lack of hydrophilic group
was hypothesised to lead to adhesive failure at the AP/basecoat interface. Next, TPDOH
and TPDCOOH were tested which were hypothesised to give good adhesion through
hydrogen bond interactions with the basecoat at the AP/basecoat interface, as shown in
Figure 7.13.
Clearcoat = ~30 μm
Basecoat = ~15 μm
AP (Primer) = ~5 μm
PP Substrate
Hydrophilic
Bridge
Hydrophobic
Figure 8.2: A schematic diagram showing the cross-section of a finished coated substrate,and the thicknesses of the wet coatings.
168

Table 8.1: The variables of the AP type, concentration, thickness and application methodthat were tested to investigate their affect on adhesion.
The liquid APs were tested in pure form (TPD and TPDOH) and all three APs
were diluted with solvent to test a relatively high concentration (0.5 M) and a lower
concentration (5 mM).
The solvent chosen for the tests was MEK. There were several reasons for this choice:
1. It is a solvent that is used in the formulation of the basecoat, therefore, could be
easily adapted to new basecoat formulations.
2. MEK was found to have the highest evaporation rate (= 3.3 using DIN 53170, where
ether =1 ) out of all the solvents in the basecoat formulation, with the exception of
Acetone (= 2.1 using DIN 53170 where ether =1 ), which was too dangerous to use
in spray gun applications as mentioned in Section 7.5.1. (A solvent with a higher
relative evaporation rate was desired to minimise possible side reactions of the AP
with the solvent molecules.)
3. The surface tension of MEK (= 24.60 mN/m) was found to be the closest matching
value to a TPO/0 substrate (24.55 mN/m) out of all the solvents in the basecoat for-
169
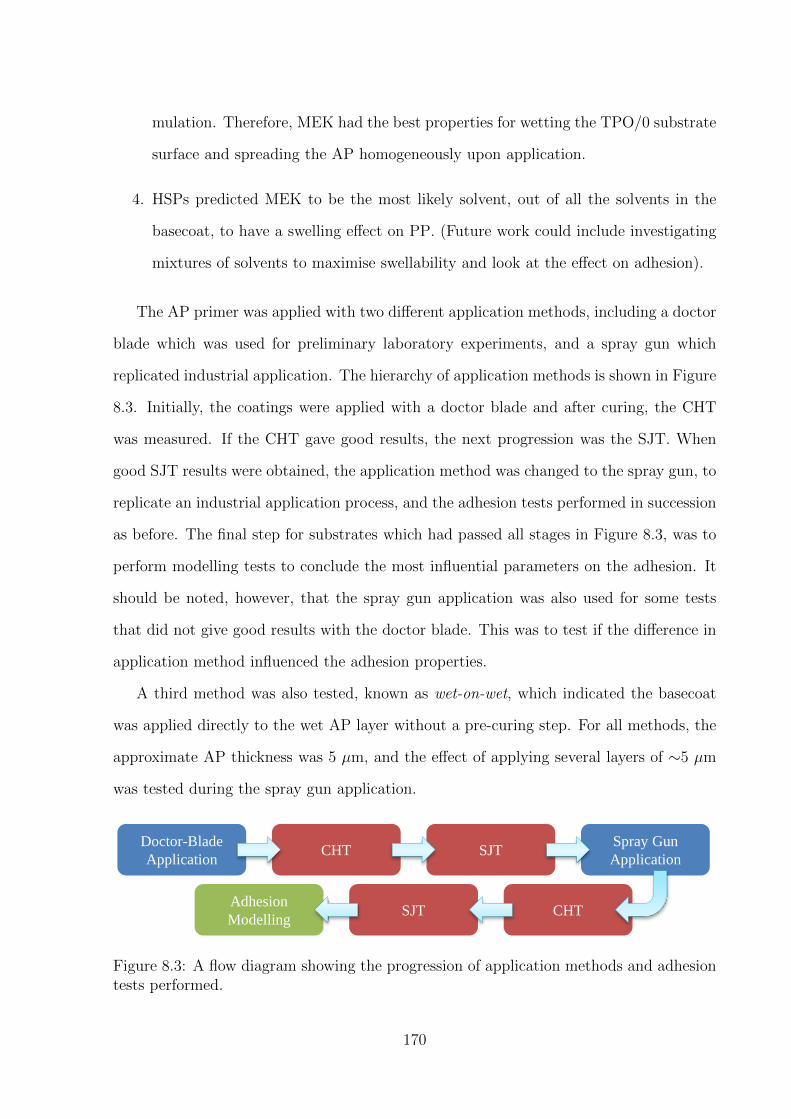
mulation. Therefore, MEK had the best properties for wetting the TPO/0 substrate
surface and spreading the AP homogeneously upon application.
4. HSPs predicted MEK to be the most likely solvent, out of all the solvents in the
basecoat, to have a swelling effect on PP. (Future work could include investigating
mixtures of solvents to maximise swellability and look at the effect on adhesion).
The AP primer was applied with two different application methods, including a doctor
blade which was used for preliminary laboratory experiments, and a spray gun which
replicated industrial application. The hierarchy of application methods is shown in Figure
8.3. Initially, the coatings were applied with a doctor blade and after curing, the CHT
was measured. If the CHT gave good results, the next progression was the SJT. When
good SJT results were obtained, the application method was changed to the spray gun, to
replicate an industrial application process, and the adhesion tests performed in succession
as before. The final step for substrates which had passed all stages in Figure 8.3, was to
perform modelling tests to conclude the most influential parameters on the adhesion. It
should be noted, however, that the spray gun application was also used for some tests
that did not give good results with the doctor blade. This was to test if the difference in
application method influenced the adhesion properties.
A third method was also tested, known as wet-on-wet, which indicated the basecoat
was applied directly to the wet AP layer without a pre-curing step. For all methods, the
approximate AP thickness was 5 µm, and the effect of applying several layers of ∼5 µm
was tested during the spray gun application.
Doctor-Blade
Application CHT SJT
Spray Gun
Application
CHT SJT Adhesion
Modelling
Figure 8.3: A flow diagram showing the progression of application methods and adhesiontests performed.
170
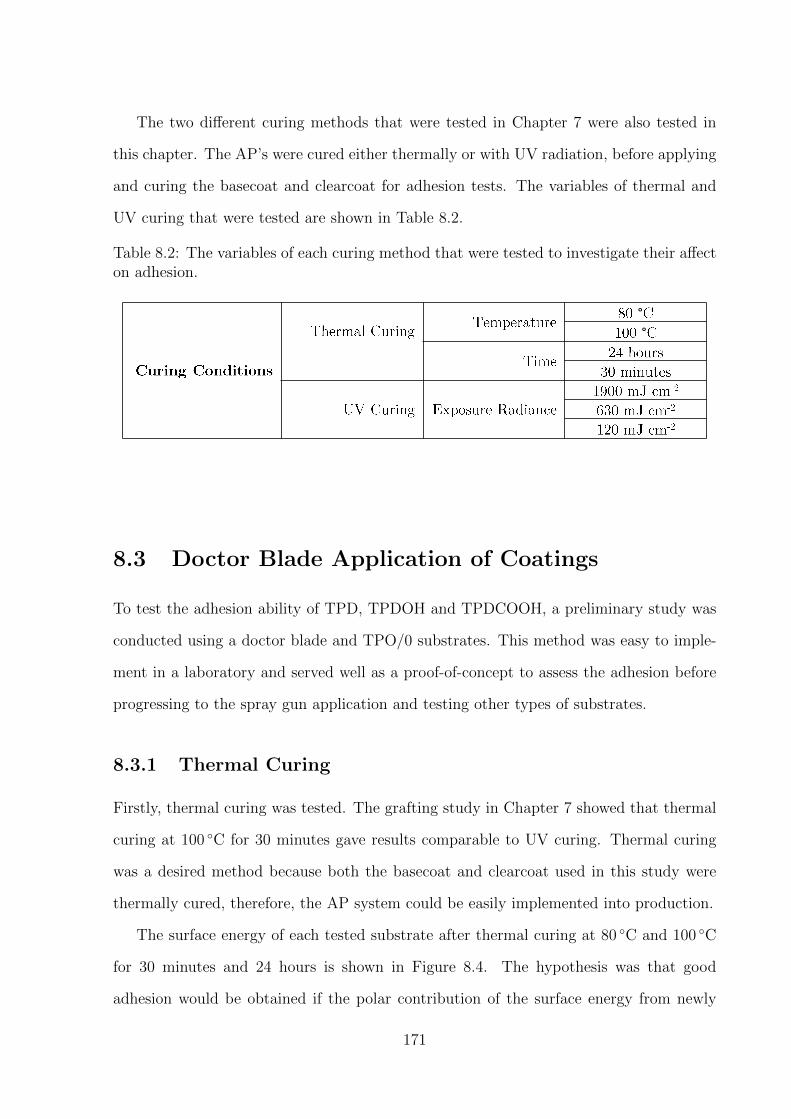
The two different curing methods that were tested in Chapter 7 were also tested in
this chapter. The AP’s were cured either thermally or with UV radiation, before applying
and curing the basecoat and clearcoat for adhesion tests. The variables of thermal and
UV curing that were tested are shown in Table 8.2.
Table 8.2: The variables of each curing method that were tested to investigate their affecton adhesion.
°
°
8.3 Doctor Blade Application of Coatings
To test the adhesion ability of TPD, TPDOH and TPDCOOH, a preliminary study was
conducted using a doctor blade and TPO/0 substrates. This method was easy to imple-
ment in a laboratory and served well as a proof-of-concept to assess the adhesion before
progressing to the spray gun application and testing other types of substrates.
8.3.1 Thermal Curing
Firstly, thermal curing was tested. The grafting study in Chapter 7 showed that thermal
curing at 100 ◦C for 30 minutes gave results comparable to UV curing. Thermal curing
was a desired method because both the basecoat and clearcoat used in this study were
thermally cured, therefore, the AP system could be easily implemented into production.
The surface energy of each tested substrate after thermal curing at 80 ◦C and 100 ◦C
for 30 minutes and 24 hours is shown in Figure 8.4. The hypothesis was that good
adhesion would be obtained if the polar contribution of the surface energy from newly
171

grafted surfaces was comparable in magnitude to the polar contribution from the flamed
substrate (used as a standard).
Substrates cured for 24 h at 80 ◦C, or 24 h / 30 min at 100 ◦C, showed the 0.5 M
TPDCOOH primer to have the largest polar contribution of the surface energy after
curing (the surfaces were not washed after AP application). However, the 80 ◦C, 30
minute cure showed pure TPDOH to have the largest polar contribution, which was the
only result comparable in magnitude to the polar contribution of the flamed surface.
0
5
10
15
20
25
30
35
40
45
50
Su
rfac
e E
ner
gy (
mN
/m)
0
5
10
15
20
25
30
35
40
45
Su
rfac
e E
ner
gy (
mN
/m)
0
5
10
15
20
25
30
35
40
45
50
Su
rfac
e E
ner
gy (
mN
/m)
(b)
Dispersion Component Polar Component
(a)
(c) (d)
0
5
10
15
20
25
30
35
40
45
50
Su
rfac
e E
ner
gy (
mN
/m)
Figure 8.4: A bar graph showing the dispersion and polar components of the surfaceenergy (together making the total surface energy) of a TPO/0 substrate surface aftervarious AP’s were applied with a doctor blade and cured at (a) 80 ◦C for 30 min (b)80 ◦C for 24h (c) 100 ◦C for 30 min and (d) 100 ◦C for 24h. The results of each chartare displayed in descending order of AP polar contribution from the left-hand side of thechart, with the two state-of-arts displayed at the right-hand side of the chart.
172

Table 8.3: CHT results after various AP’s were applied with a doctor blade and thermallycured before the basecoat and clearcoat were applied, cured and left for a 7 day post-cure.
° ° ° °
However, a poor adhesion result was obtained for the coated sample, as shown in Table 8.3.
The 80 ◦C 30 minute cure conditions were the lowest temperature and shortest time tested
so it was expected that the rate of reaction would be the lowest. Furthermore, TPDOH
pure was the purest and least volatile AP tested. Therefore, one plausible explanation for
this result, which goes against the hypothesis, was that the TPDOH had not fully grafted
to the surface due to the lack of reactivity/energy at 80 ◦C for 30 minutes, but some or
all of it remained unbound at the surface causing the large polar contribution measured
and it was easily removed from the surface.
Table 8.3 shows that only poor adhesion results were obtained for the thermally cured
APs tested. The results were comparable to the blank substrate, which did not have an
AP primer applied.
Several different types of delamination can occur during an adhesion test. Figure
8.5 shows a schematic diagram demonstrating good adhesion, cohesive failure, adhesive
173
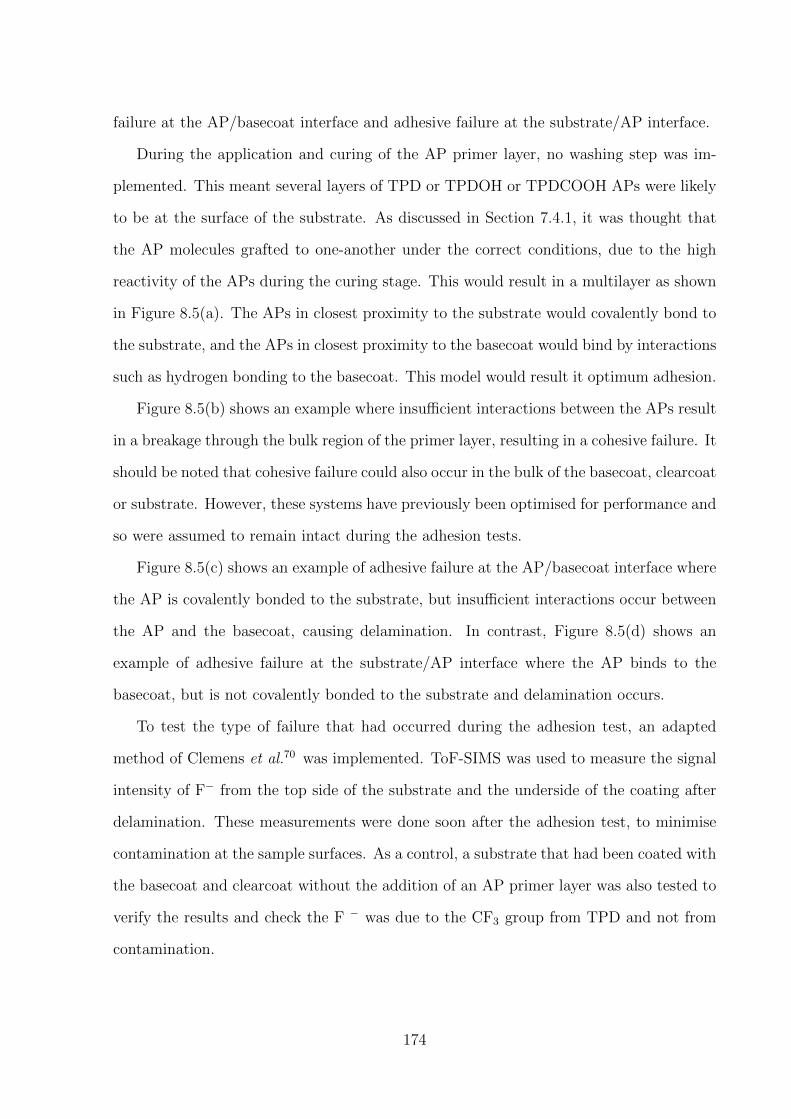
failure at the AP/basecoat interface and adhesive failure at the substrate/AP interface.
During the application and curing of the AP primer layer, no washing step was im-
plemented. This meant several layers of TPD or TPDOH or TPDCOOH APs were likely
to be at the surface of the substrate. As discussed in Section 7.4.1, it was thought that
the AP molecules grafted to one-another under the correct conditions, due to the high
reactivity of the APs during the curing stage. This would result in a multilayer as shown
in Figure 8.5(a). The APs in closest proximity to the substrate would covalently bond to
the substrate, and the APs in closest proximity to the basecoat would bind by interactions
such as hydrogen bonding to the basecoat. This model would result it optimum adhesion.
Figure 8.5(b) shows an example where insufficient interactions between the APs result
in a breakage through the bulk region of the primer layer, resulting in a cohesive failure. It
should be noted that cohesive failure could also occur in the bulk of the basecoat, clearcoat
or substrate. However, these systems have previously been optimised for performance and
so were assumed to remain intact during the adhesion tests.
Figure 8.5(c) shows an example of adhesive failure at the AP/basecoat interface where
the AP is covalently bonded to the substrate, but insufficient interactions occur between
the AP and the basecoat, causing delamination. In contrast, Figure 8.5(d) shows an
example of adhesive failure at the substrate/AP interface where the AP binds to the
basecoat, but is not covalently bonded to the substrate and delamination occurs.
To test the type of failure that had occurred during the adhesion test, an adapted
method of Clemens et al.70 was implemented. ToF-SIMS was used to measure the signal
intensity of F− from the top side of the substrate and the underside of the coating after
delamination. These measurements were done soon after the adhesion test, to minimise
contamination at the sample surfaces. As a control, a substrate that had been coated with
the basecoat and clearcoat without the addition of an AP primer layer was also tested to
verify the results and check the F − was due to the CF3 group from TPD and not from
contamination.
174
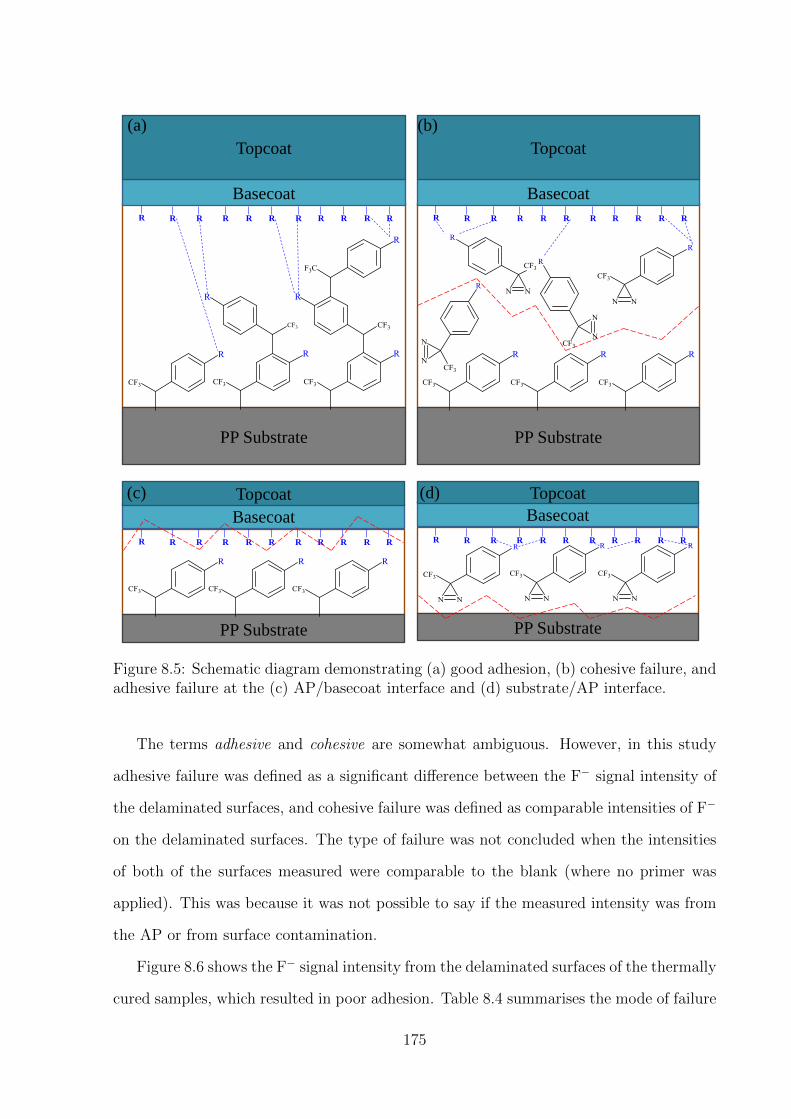
PP Substrate
Basecoat
R R R R R R R R R R R
Topcoat
PP Substrate
Basecoat
R R R R R R R R R R R
Topcoat
PP Substrate
Basecoat
R R R R R R R R R R R
Topcoat
PP Substrate
Basecoat
R R R R R R R R R R R
Topcoat
(a) (b)
(c) (d)
Figure 8.5: Schematic diagram demonstrating (a) good adhesion, (b) cohesive failure, andadhesive failure at the (c) AP/basecoat interface and (d) substrate/AP interface.
The terms adhesive and cohesive are somewhat ambiguous. However, in this study
adhesive failure was defined as a significant difference between the F− signal intensity of
the delaminated surfaces, and cohesive failure was defined as comparable intensities of F−
on the delaminated surfaces. The type of failure was not concluded when the intensities
of both of the surfaces measured were comparable to the blank (where no primer was
applied). This was because it was not possible to say if the measured intensity was from
the AP or from surface contamination.
Figure 8.6 shows the F− signal intensity from the delaminated surfaces of the thermally
cured samples, which resulted in poor adhesion. Table 8.4 summarises the mode of failure
175

concluded for each sample. The coating was easily removed from the surface of the
substrate, therefore, no forced removing was necessary which may have resulted in false
modes of failures.
0.0
0.5
1.0
1.5
2.0
2.5
3.0
3.5
4.0
4.5
No
rmal
ised
In
ten
sity
of
F- (‰
)
0
0.5
1
1.5
2
2.5
3N
orm
alis
ed I
nte
nsi
ty o
f F
- (‰
)
Substrate Surface Underside of Coating
(b) (a)
(d) (c)
0
5
10
15
20
25
30
No
rmal
ised
In
ten
sity
of
F- (‰
)
0
0.5
1
1.5
2
2.5
3
3.5
4
4.5
5
No
rmal
ised
In
ten
sity
of
F- (‰
)
Figure 8.6: The F− intensities measured from the delaminated surfaces of the substrateand basecoat after the AP primer layer was cured thermally at (a) 80 ◦C for 30 mins, (b)80 ◦C for 24h, (c) 100 ◦C for 30 minutes and (d) 100 ◦C for 24h, before the baseocat andclearcoat were applied, cured and left for a 7 day post-cure.
Several samples showed signal intensities that were comparable to the magnitudes of
the blank and therefore were concluded negligible. Across all the thermal curing conditions
tested, TPD was found to have the lowest signal intensities. This was likely to be due
to the high volatility of TPD compared to the other APs, resulting in the evaporation of
TPD from the substrate surface at a higher rate than the rate of grafting. As expected,
adhesive failure at the AP/BC interface occurred in the cases where sufficient intensities
176

Table 8.4: Summary of the modes of failure observed for each tested sample, after thecoated surface had delaminated from the substrate during the adhesion test. The APprimer was applied with a doctor blade and thermally cured before the basecoat andclearcoat were applied and cured, and left for a 7 day post-cure.
° ° ° °
were measured for TPD. The lack of a hydrophilic functional group present in TPD,
resulting in no interactions with the basecoat, caused this type of failure.
After the AP primer was cured at 80 ◦C for 30 minutes, the majority of the samples
showed an adhesive failure at the AP/basecoat interface. This indicated insufficient bind-
ing between the AP and the basecoat. Furthermore, the magnitudes of signal intensities
measured were relatively low and comparable to the results from the grafting proof-of-
concept in Chapter 7. Therefore, it was likely that the grafting efficiency was inadequate
with not enough TPDOH/TPDCOOH molecules grafted at the surface for good adhesive
interactions with the basecoat.
After the TPDOH pure primer was cured at 80 ◦C for 30 minutes, a significant inten-
sity on both the substrate and coating surface after delamination was observed, suggesting
a cohesive failure within the primer bulk. The results in Section 7.3.1 revealed that car-
177

benes were generated at 80 ◦C, therefore, it was thought that a low rate of thermal energy
transfer was insufficient to induce any reactions/interactions between the high concen-
tration of the bulk TPDOH molecules within the primer. This resulted in a breakage
through the primer leaving a layer of TPDOH on the basecoat and substrate surfaces.
The interactions between the TPDOH and the basecoat/substrate were therefore greater
than the interactions between the TPDOH molecules within the primer.
The 0.5 M TPDCOOH primer cured at 80 ◦C for 30 minutes showed an adhesive
failure at the substrate/AP interface. The higher concentration of the primer solution
was likely to be the reason for this result. The rate of thermal energy transferred to the
concentrated layer to induce grafting at the substrate surface was insufficient and the
interaction between TPDCOOH and the basecoat was greater than with the substrate.
In contrast, the 5 mM TPDCOOH primer had a lower density of molecules, allowing a
faster rate of thermal energy transfer and grafting to occur. The interaction between
the substrate and TPDCOOH was greater than the TPDCOOH and the basecoat, thus
resulting in adhesive failure at the AP/basecoat interface.
The modes of failure observed after the AP primer was cured at 80 ◦C for 24 h were the
same as the cure for 30 minutes, with the exception of 5 M and 5 mM TPDOH. In this case,
adhesive failure was observed at the AP/substrate interface. This mode of failure was also
observed for the TPDOH substrates that had been cured at 100 ◦C for 30 minutes, and all
substrates that had been cured at 100 ◦C for 24 h. (The higher concentration AP solutions
cured for 24 h at 100 ◦C, which caused delamination, were measured to be compared
with the other curing conditions.) The reasons why this failure occurred were not known.
However, one plausible reason could be that contamination of the primer surface occurred
over the long period of time in the conventional oven, causing delamination (which could
occur in an industrial process). Furthermore, the hydrophilic functional groups present
at the primer surface would attract a greater amount of contamination than the bare
substrate surface, therefore, the TPDCOOH and TPDOH grafted surfaces were likely to
attract dirt during the curing time.
178
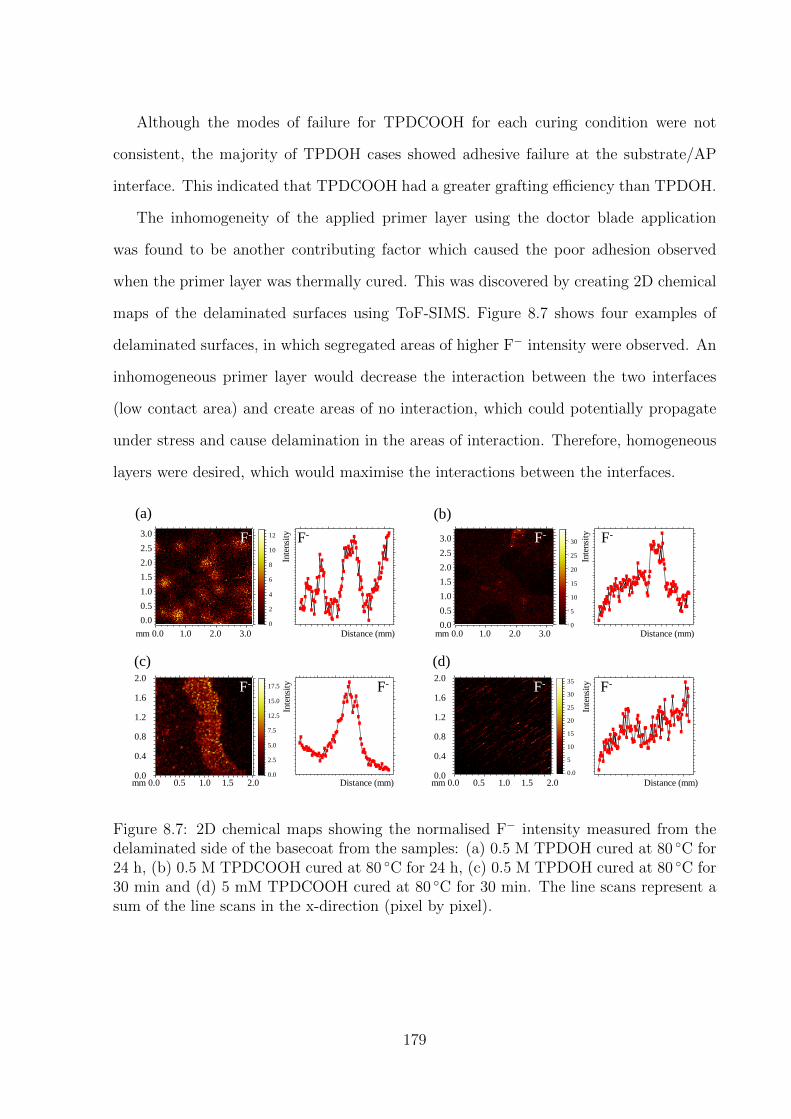
Although the modes of failure for TPDCOOH for each curing condition were not
consistent, the majority of TPDOH cases showed adhesive failure at the substrate/AP
interface. This indicated that TPDCOOH had a greater grafting efficiency than TPDOH.
The inhomogeneity of the applied primer layer using the doctor blade application
was found to be another contributing factor which caused the poor adhesion observed
when the primer layer was thermally cured. This was discovered by creating 2D chemical
maps of the delaminated surfaces using ToF-SIMS. Figure 8.7 shows four examples of
delaminated surfaces, in which segregated areas of higher F− intensity were observed. An
inhomogeneous primer layer would decrease the interaction between the two interfaces
(low contact area) and create areas of no interaction, which could potentially propagate
under stress and cause delamination in the areas of interaction. Therefore, homogeneous
layers were desired, which would maximise the interactions between the interfaces.
2.0
1.6
1.2
0.8
0.4
0.0
2.01.51.00.50.0mm
F-MC: 19; TC: 1.419e+004
17.5
15.0
12.5
10.0
7.5
5.0
2.5
0.0Distance [mm]1.20.80.40.0
Inte
nsity
400
300
200
100
F-
(c)
3.0
2.5
2.0
1.5
1.0
0.5
0.0
3.02.01.00.0mm
F-MC: 36; TC: 1.966e+004
35
30
25
20
15
10
5
0
Distance [mm]2.01.00.0
Inte
nsity
200
160
120
80
40
F-
(d)
F-
Distance (mm)
Inte
nsi
ty 2.0
1.6
1.2
0.8
0.4
0.0 mm 0.0 0.5 1.0 1.5 2.0
F- 17.5
15.0
12.5
7.5
5.0
2.5
0.0
Distance (mm)
2.0
1.6
1.2
0.8
0.4
0.0 mm 0.0 0.5 1.0 1.5 2.0
F- F-
Inte
nsi
ty 35
30
25
20
15
10
5
0.0
3.0
2.5
2.0
1.5
1.0
0.5
0.0
3.02.01.00.0mm
F-MC: 13; TC: 2.801e+004
12
10
8
6
4
2
0
Distance [mm]2.01.00.0
Inte
nsity
275
250
225
200
175
150
F-
3.0
2.5
2.0
1.5
1.0
0.5
0.0
3.02.01.00.0mm
F-MC: 34; TC: 3.344e+004
30
25
20
15
10
5
0
Distance [mm]2.01.00.0
Inte
nsity
320
280
240
200
160
F-
(b)
3.0
2.5
2.0
1.5
1.0
0.5
0.0
mm 0.0 1.0 2.0 3.0
(a)
Distance (mm)
Inte
nsi
ty
3.0
2.5
2.0
1.5
1.0
0.5
0.0 mm 0.0 1.0 2.0 3.0
Inte
nsi
ty
Distance (mm)
12
10
8
6
4
2
0
30
25
20
15
10
5
0
F- F- F- F-
Figure 8.7: 2D chemical maps showing the normalised F− intensity measured from thedelaminated side of the basecoat from the samples: (a) 0.5 M TPDOH cured at 80 ◦C for24 h, (b) 0.5 M TPDCOOH cured at 80 ◦C for 24 h, (c) 0.5 M TPDOH cured at 80 ◦C for30 min and (d) 5 mM TPDCOOH cured at 80 ◦C for 30 min. The line scans represent asum of the line scans in the x-direction (pixel by pixel).
179

8.3.2 UV Curing
UV curing was found to be to be significantly more effective than thermal curing at 80 ◦C
in the grafting study in Chapter 7. Therefore, adhesion tests were performed on samples
that contained UV-cured primers. The adhesive properties were then investigated.
0
5
10
15
20
25
30
35
40
45
50
Su
rfac
e E
ner
gy (
mN
/m)
0
5
10
15
20
25
30
35
40
45
50
Su
rfac
e E
ner
gy (
mN
/m)
0
5
10
15
20
25
30
35
40
45
50
Su
rfac
e E
ner
gy (
mN
/m)
(b)
Dispersion Component Polar Component
(a)
(c)
Figure 8.8: A bar graph showing the dispersion and polar components of the surfaceenergy (together making the total surface energy) of a TPO/0 substrate surface aftervarious AP’s were applied with a doctor blade and cured at (a) 1900 mJ cm−2 (b) 630 mJcm−2 and (c) 122 mJ cm−2. The results of each chart are displayed in descending orderof AP polar contribution from the left-hand side of the chart, with the two state-of-artsdisplayed at the right-hand side of the chart.
Figure 8.8 shows the surface energy of each tested substrate after UV curing at 1900,
630 and 122 mJ cm−2. The hypothesis was that if the polar contribution from the surface
180

energy of the newly grafted surface was comparable to the polar contribution from the
flamed substrate (standard), good adhesion would be obtained.
It was clearly observed that the polar component of surface energies from the UV
grafted surfaces were significantly higher than the polar contributions from the thermal
grafted surfaces (shown in Figure 8.4). Furthermore, several samples had polar component
contributions on the same order of magnitude as the flamed substrate.
The primers with higher concentrations of APs cured at 1900 mJ cm−2 gave the
greatest polar components of surface energy. Therefore, only pure and 0.5 M AP primers
were cured at 630 and 122 mJ cm−2, to investigate the dependence of UV radiant exposure.
It was hypothesised that the pure TPDOH, 0.5 M TPDOH and the 0.5 M TPDCOOH
would give good adhesion results due to their high polar component of surface energy.
Initially, the tests were performed using a non-pigmented basecoat to minimise possible
side reactions of the AP with pigments found within the basecoat. The adhesion results
were found to be good at 1900 mJ cm−2, therefore, the test was repeated with a black
pigmented basecoat which gave the CHT results shown in Table 8.5. As expected, TPD
at both concentrations (0.5 M and 5 mM) gave poor adhesion results due to the lack of a
hydrophilic functional group for interaction with the basecoat. Furthermore, it was clear
that UV curing of TPDOH/TPDCOOH gave significantly better adhesion results than
that of thermal curing.
It was observed that the higher UV radiant exposure (1900 mJ cm−2) gave the best
adhesion results, and the adhesive properties decreased with decreasing UV radiant expo-
sure. This can be explained in terms of activation energy. The larger UV radiant exposure
provided a greater energy to the AP molecules which overcame the energy barriers for a
reaction. This induced the decomposition of the diazirine group to allow for CH inser-
tion/grafting to take place. The UV radiant exposure at 630 mJ cm−2 provided a lower
energy so that less AP molecules were able to overcome the energy barrier in the given
time, hence the adhesion was not as good. The poor adhesion observed at 122 mJ cm−2
indicated the energy was too low for any grafting reaction to occur.
181

Table 8.5: CHT results after various AP’s were applied with a doctor blade and cured withUV before the basecoat and clearcoat were applied, cured and left for a 7 day post-cure.
A decrease in the AP concentration also correlated with a decrease in adhesion results,
due to the smaller amount of molecules available to graft to the surface and interact with
the basecoat.
A second application step was introduced when looking at UV radiant exposures of
630 and 122 mJ cm−2. This was a washing step after the cure of the primer layer but
before the application of the basecoat/clearcoat. It was thought that washing away any
ungrafted APs from the substrate surface (which may have hindered adhesion) may im-
prove the adhesive properties. However, it was found that the washing step decreased
the adhesive properties as shown in Table 8.5. Therefore, the solvent molecules may have
remained/adhered to the newly grafted surface rather than washed or evaporated away
from the surface, causing a type of contamination which caused delamination of the coat-
ings. The mode of failure results shown in Table 8.9 also suggest this, showing AP/BC
182

adhesive failures for all washed samples.
The delaminated surfaces of the samples that had poor adhesion were again analysed
using ToF-SIMS. The results are shown in Figure 8.9 and a summary of the modes of
failures can be found in Table 8.6. It was found that the majority of the 5 mM TPDCOOH
sample had good adhesion and the results shown were obtained from only a small part
of the sample that had delaminated. The results suggest there was an area with a lower
proportion of APs which resulted with insufficient adhesion to the basecoat, causing the
delamination.
0
2
4
6
8
10
12
14
No
rmal
ised
In
ten
sity
of
F- (‰
)
0
0.5
1
1.5
2
2.5
No
rmal
ised
In
ten
sity
of
F- (‰
)
0
5
10
15
20
25
30
35
40
45
No
rmal
ised
In
ten
sity
of
F- (‰
)
Substrate Surface Underside of Coating
(b) (a)
(c)
Figure 8.9: The F− intensities measured from the delaminated surfaces of the substrateand basecoat after the AP primer layer was UV cured at (a) 1900 mJ cm−2, (b) 630mJ cm−2 and (c) 122 mJ cm−2, before the basecoat and clearcoat were applied, curedthermally and left for a 7 day post-cure.
183
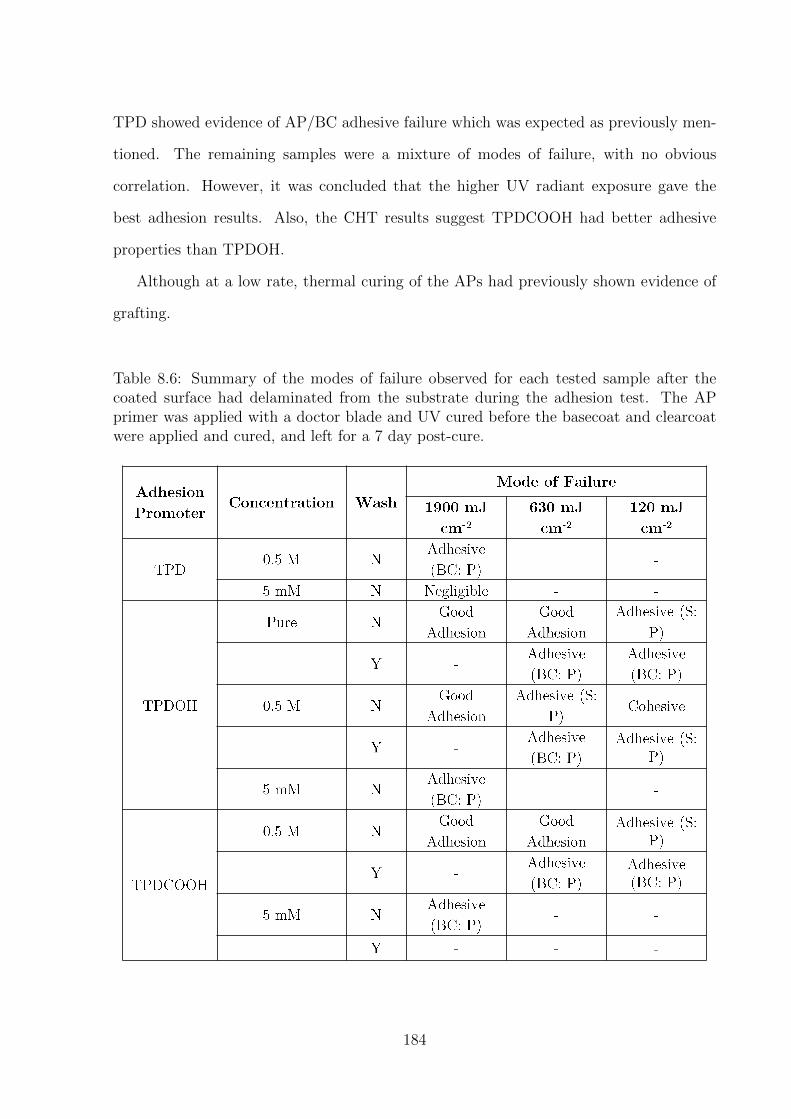
TPD showed evidence of AP/BC adhesive failure which was expected as previously men-
tioned. The remaining samples were a mixture of modes of failure, with no obvious
correlation. However, it was concluded that the higher UV radiant exposure gave the
best adhesion results. Also, the CHT results suggest TPDCOOH had better adhesive
properties than TPDOH.
Although at a low rate, thermal curing of the APs had previously shown evidence of
grafting.
Table 8.6: Summary of the modes of failure observed for each tested sample after thecoated surface had delaminated from the substrate during the adhesion test. The APprimer was applied with a doctor blade and UV cured before the basecoat and clearcoatwere applied and cured, and left for a 7 day post-cure.
184

20
30
40
50
60
70
80
90
100
110T
emp
erat
ure
[°C
]
630 mJ cm-2
1320 mJ cm-2
2300 mJ cm-2
0 +ve -ve
Distance from UV Lamps
630 mJ cm-2
1320 mJ cm-2
2300 mJ cm-2
Tmax = 80 ⁰C
Tmax = 58 ⁰C
Tmax = 103 ⁰C
Figure 8.10: The temperature generated during UV curing at the various radiant expo-sures measured. The cure at 2300 mJ cm−2 took ∼2 seconds.
Therefore, to test for any thermal contributions from the UV lamps during the curing step
which may have influenced the grafting of APs, the temperature was measured at each UV
radiant exposure. The results are shown in Figure 8.10. It was found that the temperature
increased as the radiant exposure increased, which was expected due to the increasing UV
exposure times. The heat generated was from infrared radiation emitted from the UV
lamps. It had previously been shown that poor adhesion occurred at 100 ◦C, which was
the temperature reached at 1900 mJ cm−2. Therefore, the temperature influence during
UV curing was regarded as negligible.
Another contributing factor of the poor adhesion obtained by some of the samples,
was found to be inhomogeneity of the AP primer layer, which was previously observed
for the thermal cure using the doctor blade application method. Figure 8.11 shows four
delaminted surface examples of varying homogeneity. Although the use of the doctor
blade had served its purpose for a proof-of-concept for coatings application in a laboratory
environment, the production of a homogeneous layer was found to be difficult. The method
did allow, however, the production of the encouraging positive results obtained by UV
curing. Before alternative application methods were explored to improve homogeneity, a
wet-on-wet application method was tested (which was also used for the state-of-the-art
CPO AP).
185

Distance [mm]1.20.80.40.0
Inte
nsity
2400
2000
1600
1200
800
400
F-
2.0
1.6
1.2
0.8
0.4
0.0
2.01.51.00.50.0mm
F-MC: 50; TC: 1.353e+005
50
40
30
20
10
0Distance [μm]12080400
Inte
nsity
40
35
30
25
20
15
F-
Distance [μm]12080400
Inte
nsity
80
60
40
20
F-
200
160
120
80
40
0
2001000μm
F-MC: 9; TC: 2.949e+003
8
6
4
2
0
200
160
120
80
40
0
2001000μm
F-MC: 6; TC: 2.821e+003
6.0
5.0
4.0
3.0
2.0
1.0
0.0
Distance [μm]12080400
Inte
nsity
100
90
80
70
60
F-
200
160
120
80
40
0
2001000μm
F-MC: 7; TC: 6.858e+003
7.0
6.0
5.0
4.0
3.0
2.0
1.0
0.0
(c) (d)
F-
Distance (m)
Inte
nsi
ty
F- 6
5
4
3
2
1
0 Distance (m)
F- F-
Inte
nsi
ty 50
40
30
20
10
0
(b) 200
160
120
80
40
0 m 0.0 100 200
(a)
Distance (m)
Inte
nsi
ty
Inte
nsi
ty
Distance (m)
8
6
4
2
0
7
6
5
4
3
2
1
0
200
160
120
80
40
0 m 0.0 100 200
F- F- F- F-
200
160
120
80
40
0 m 0.0 100 200
200
160
120
80
40
0 m 0.0 100 200
Figure 8.11: 2D chemical maps showing the normalised F− intensity measured from thedelaminated side of the substrate from (a) 5 mM TPDCOOH cured at 1900 mJ cm−2 and(b) 5 mM TPDOH cured at 1900 mJ cm−2, and from the delaminated side of the basecoatfrom the samples:(c) 5 mM TPDOH cured at 1900 mJ cm−2 and (d) 0.5 M TPDOH curedat 1900 mJ cm−2. The line scans represent a sum of the line scans in the x-direction (pixelby pixel).
8.3.3 Wet-on-Wet
As previously shown in Section 5.6, the state-of-the-art CPO was found to give the best
adhesion results when applied using a wet-on-wet method with a doctor blade. This
method is when the basecoat is applied directly to the primer layer without any pre-
curing of the primer layer.
It was not possible to measure accurate surface energies (using the OW method) of
the wet primer layers to predict the adhesion, due to uneven surfaces and the possibility
of interactions between the test solutions of known surface tension and the wet surface.
The CHT adhesion results are shown in Table 8.7. As a first test, only higher con-
centrations were tested using TPDOH and TPDCOOH. However, the adhesion results
obtained were poor and comparable to the blank substrate which contained no AP primer
layer. Therefore, no further tests were done using this method of application.
186
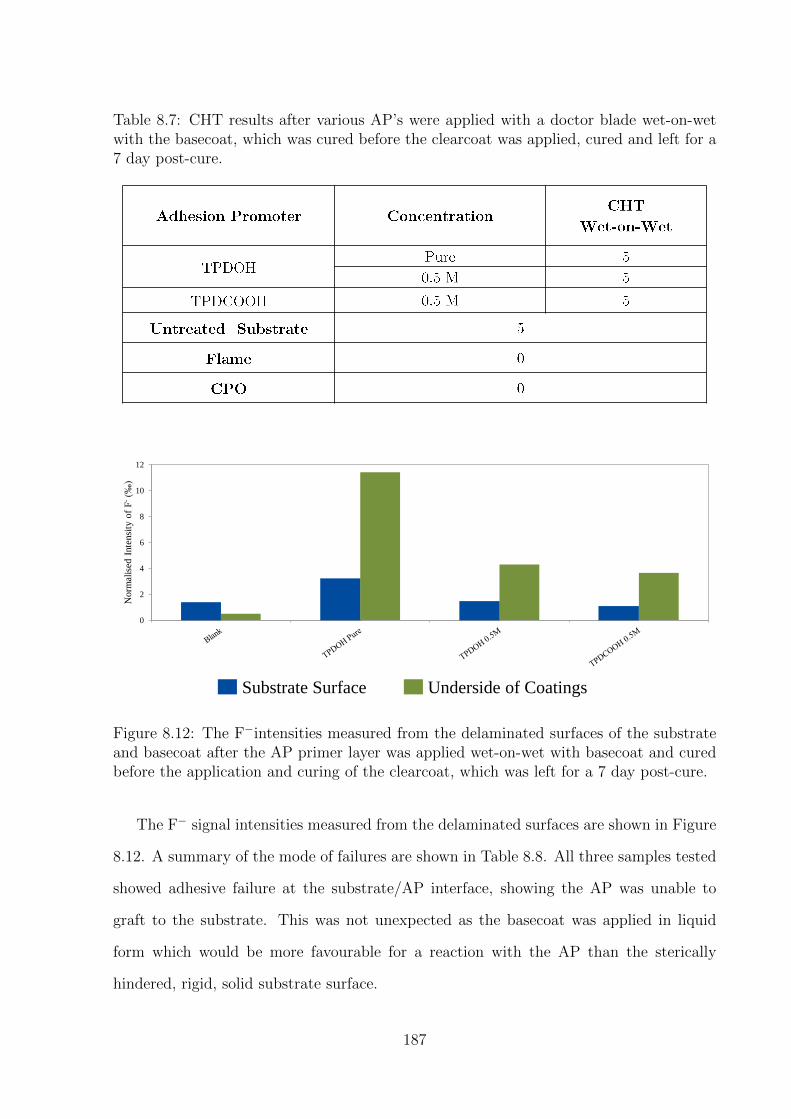
Table 8.7: CHT results after various AP’s were applied with a doctor blade wet-on-wetwith the basecoat, which was cured before the clearcoat was applied, cured and left for a7 day post-cure.
Substrate Surface Underside of Coatings
0
2
4
6
8
10
12
No
rmal
ised
Inte
nsi
ty o
f F
- (‰
)
Figure 8.12: The F−intensities measured from the delaminated surfaces of the substrateand basecoat after the AP primer layer was applied wet-on-wet with basecoat and curedbefore the application and curing of the clearcoat, which was left for a 7 day post-cure.
The F− signal intensities measured from the delaminated surfaces are shown in Figure
8.12. A summary of the mode of failures are shown in Table 8.8. All three samples tested
showed adhesive failure at the substrate/AP interface, showing the AP was unable to
graft to the substrate. This was not unexpected as the basecoat was applied in liquid
form which would be more favourable for a reaction with the AP than the sterically
hindered, rigid, solid substrate surface.
187

Table 8.8: Summary of the modes of failure observed for each tested sample after thecoated surface had delaminated from the substrate during the adhesion test. The APprimer was applied with a doctor blade and applied wet-on-wet with the basecoat beforeapplying the clearcoat which was cured and left for a 7 day post-cure.
8.4 Spray Gun Application of Coatings
The spray gun application method is used to apply automotive coatings in the industry. It
allows a better control of the coatings applied. Primers of TPDOH and TPDCOOH were
spray applied and cured, before subsequent coatings were applied and the adhesion tested.
The different research substrates containing 0 - 25 % EPDM, as well as the 3 industrial
TPO substrates (TPO/0, TPO/2 and TPO/20) were used to look for correlations between
the adhesion and the substrate properties that were calculated in Chapter 5.
8.4.1 Thermal Curing
Although thermal curing of the AP primer with the doctor blade application gave poor
adhesion results, it was decided to repeat the experiment using a spray gun to test if
the adhesive properties could be improved. Greater control of the applied coating was
achieved using a spray gun rather than a doctor blade. The coatings generated had
improved consistency and homogeneity. Thinner, more uniform layers are also obtained.
TPDOH and TPDCOOH solutions were tested with the spray gun. TPD had previ-
ously shown bad adhesion properties with the doctor blade, due to the lack of a hydrophilic
group for interaction with the basecoat. Therefore, TPD was not tested with the spray
gun.
188
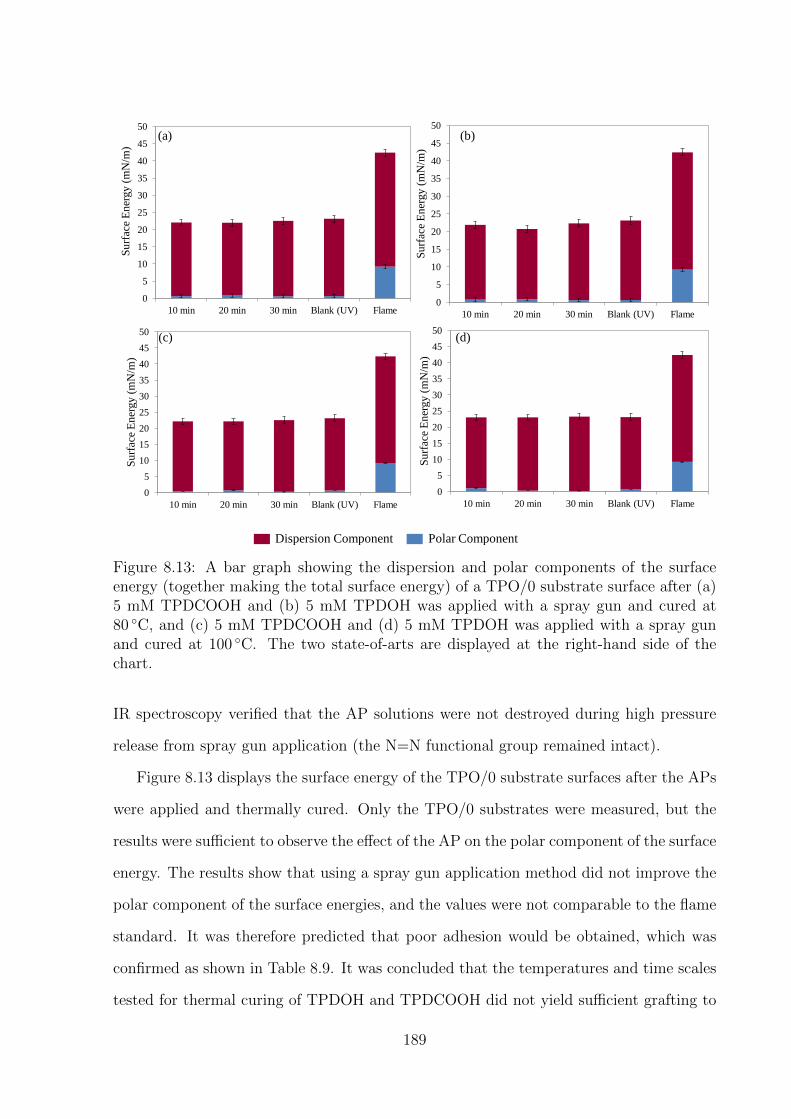
(b)
Dispersion Component Polar Component
(a)
(c) (d)
0
5
10
15
20
25
30
35
40
45
50
10 min 20 min 30 min Blank (UV) Flame
Su
rfac
e E
ner
gy (
mN
/m)
0
5
10
15
20
25
30
35
40
45
50
10 min 20 min 30 min Blank (UV) Flame
Su
rfac
e E
ner
gy (
mN
/m)
0
5
10
15
20
25
30
35
40
45
50
10 min 20 min 30 min Blank (UV) Flame
Su
rfac
e E
ner
gy (
mN
/m)
0
5
10
15
20
25
30
35
40
45
50
10 min 20 min 30 min Blank (UV) Flame
Su
rfac
e E
ner
gy (
mN
/m)
Figure 8.13: A bar graph showing the dispersion and polar components of the surfaceenergy (together making the total surface energy) of a TPO/0 substrate surface after (a)5 mM TPDCOOH and (b) 5 mM TPDOH was applied with a spray gun and cured at80 ◦C, and (c) 5 mM TPDCOOH and (d) 5 mM TPDOH was applied with a spray gunand cured at 100 ◦C. The two state-of-arts are displayed at the right-hand side of thechart.
IR spectroscopy verified that the AP solutions were not destroyed during high pressure
release from spray gun application (the N=N functional group remained intact).
Figure 8.13 displays the surface energy of the TPO/0 substrate surfaces after the APs
were applied and thermally cured. Only the TPO/0 substrates were measured, but the
results were sufficient to observe the effect of the AP on the polar component of the surface
energy. The results show that using a spray gun application method did not improve the
polar component of the surface energies, and the values were not comparable to the flame
standard. It was therefore predicted that poor adhesion would be obtained, which was
confirmed as shown in Table 8.9. It was concluded that the temperatures and time scales
tested for thermal curing of TPDOH and TPDCOOH did not yield sufficient grafting to
189

Table 8.9: CHT results after various AP’s were applied with a spray gun and thermallycured before the basecoat and clearcoat were applied, cured and left for a 7 day post-cure.
° °
improve adhesive properties of the coatings applied to the substrate.
The F− intensity was measured on the substrate and underside of the basecoat of
the delaminated surfaces cured for 10 and 30 minutes. The intensities measured on the
majority of the surfaces, shown in Figure 8.14(a), were comparable to the blank measured,
suggesting a little amount of the AP remained at the surface. The mode of failure did
not depend on the substrate types that contained additives, although when comparing
Figure 8.14(b)-(d), the R/0 substrates were distinguishable from the other substrates with
larger F− intensities and an adhesive mode of failure at the AP/BC interface. Previously,
the physical properties of the substrates were compared in Chapter 5 and one property
which particularly distinguished R/0 from the other substrates was the significantly large
hardness. This could result in the AP not being able to penetrate into the surface, which
could be a controlling factor determining the delamination behaviour.
The only other substrate which showed a significant intensity on a delaminated surface
was R/20 with the TPDOH 5 mM primer after an 80 ◦C cure for 30 min. The results
suggest adhesive failure at the AP/substrate interface. The reason for this anomaly is not
known and could have been caused by contamination. The intensities measured from the
190

other delaminated substrates of the 80 and 100 ◦C cure for TPDOH and TPDCOOH 5
mM showed little significance when compared to the blank. Overall, the low magnitude of
signal intensities obtained suggested the low grafting efficiency from thermal curing was
the dominating factor for poor adhesion. Although not displayed, the chemical mapping
of F− intensity from the delaminated surfaces revealed that the primer was homogeneous,
an improvement from the doctor blade application.
0.00
5.00
10.00
15.00
20.00
25.00
30.00
35.00
Blank TPO/0 R/0 R/10 R/20 TPO/0 R/0 R/10 R/20
10 min 30 min
No
rmal
ised
In
ten
sity
of
F- (‰
)
Substrate Type / Curing Time
Substrate Surface Underside of Coating
(b) (a)
(d) (c)
0.00
0.10
0.20
0.30
0.40
0.50
0.60
Blank TPO/0 R/0 R/10 R/20 TPO/0 R/0 R/10 R/20
10 min 30 min
No
rmal
ised
In
ten
sity
of
F- (‰
)
Substrate Type / Curing Time
0
1
2
3
4
5
6
7
8
9
Blank TPO/0 R/0 R/10 R/20 TPO/0 R/0 R/10 R/20
10 min 30 min
No
rmal
ised
In
ten
sity
of
F- (‰
)
Substrate Type / Curing Time
0
2
4
6
8
10
12
14
16
Blank TPO/0 R/0 R/10 R/20 TPO/0 R/0 R/10 R/20
10 min 30 min
No
rmal
ised
In
ten
sity
of
F- (‰
)
Substrate Type / Curing Time
Figure 8.14: The F− intensities measured from the delaminated surfaces of the substrateand basecoat after (a) 5 mM TPDCOOH was cured thermally at 80 ◦C for 10 and 30mins, (b) 5 mM TPDOH was cured thermally at 80 ◦C for 10 and 30 mins, (c) 5 mMTPDCOOH was cured thermally at 100 ◦C for 10 and 30 mins and (d) 5 mM TPDOHwas cured thermally at 100 ◦C for 10 and 30 mins, before the basecoat and clearcoat wereapplied, cured and left for a 7 day post-cure.
191

8.4.2 UV Curing
Previous results with the doctor blade application method showed that UV curing of the
AP primer was successful at improving the adhesive properties of the applied coatings to
the modified substrates. The reproducibility of these results was tested using the spray
gun application method. It was expected that better the quality of coatings produced by
the spray gun would improve the adhesion.
8.4.2.1 Dependence of the Substrate Type and UV Radiant Exposure on the
Adhesion
UV Exposure Radiance, mJ cm-2
0
5
10
15
20
25
30
35
40
45
50
Su
rfac
e E
neg
ry (
mN
/m)
2837 1969 1278 989 720 602 Flame/Blank
Dispersion Component TPDCOOH 5mM
Polar Component TPDCOOH 5mM Dispersion Component TPDOH 5mM
Polar Component TPDOH 5mM
Figure 8.15: A bar graph comparing the dispersion and polar components of the surfaceenergy (together making the total surface energy) of a TPO/0 substrate after 5 mMTPDCOOH and 5 mM TPDOH were applied with a spray gun and UV cured at differentradiance exposures. The two state-of-arts are displayed at the right-hand side of the chart.
192

Table 8.10: CHT results after 5 mM TPDCOOH and 5 mM TPDOH were applied witha spray gun and cured with UV before the basecoat and clearcoat were applied, curedand left for a 7 day post-cure. These CHT results were obtained for all tested sub-strates: TPO/0, TPO/2, TPO/20, R/0, R/5, R/10, R/15, R/20, R/25 (no CHT varianceoccured).
Initially, the TPDCOOH and TPDOH primers were applied to different types of sub-
strates and cured at varying UV radiant exposures. Positive adhesion results were ob-
tained in Section 8.3.2 using a concentration of 5 mM, therefore, this was the chosen
concentration for these tests. Furthermore, high concentrations were undesirable for in-
dustrial use (greater costs), therefore, the lower concentrations were desired.
Figure 8.15 shows the surface energies of the TPO/0 substrate after the primers were
applied and cured. The polar components of the surface energies from the TPDCOOH
on TPO/0 substrates were comparable in magnitude to the flamed standard for all ra-
diant exposures, 2937 - 602 mJ cm−2. Therefore, good adhesion was predicted for these
substrates and not for TPDOH on TPO/0 substrates.
The CHT results from the different substrate types with varying radiant exposures
used for curing the 5 mM TPDCOOH and 5 mM TPDOH primers are displayed in Table
8.10. The results from the doctor blade application indicated that TPDCOOH had a
higher grafting efficiency than TPDOH. The CHT results from the spray gun application
further confirmed this, with good adhesion results found for all substrates with a 5 mM
TPDCOOH primer, but poor adhesion results found for the 5 mM TPDOH primer.
193

Substrate Surface Underside of Coating
0
2
4
6
8
10
12
14
16
Blank TPO/0 R/0 R/10 R/20 TPO/0 R/0 R/10 R/20 TPO/0 R/0 R/10 R/20
1969 mJ cm⁻² 989 mJ cm⁻² 602 mJ cm⁻²
No
rmal
ised
In
ten
sity
of
F- (‰
)
Substrate Type / UV Exposure Radiance
Figure 8.16: The F− intensities measured from the delaminated surfaces of the substrateand basecoat after 5 mM TPDOH was applied as a primer and UV cured, before thebasecoat and clearcoat were applied, cured thermally and left for a 7 day post-cure.
The F− intensity of the 5 mMTPDOH delaminated surfaces were measured to inves-
tigate the mode of failure. Due to the high volume of samples, only four surfaces from
different substrate types and three UV radiant exposures were measured. The results are
shown in Figure 8.16. In all cases, the intensity measured was larger than the blank,
proving that TPDOH was present at the surface. Futhermore, all substrates showed evi-
dence of adhesive failure at the AP/basecoat interface. This suggested either the grafting
efficiency of TPDOH was lower than TPDCOOH (which had good adhesion) and insuf-
ficient interactions with the basecoat occurred, or the grafting efficiency of TPDOH was
comparable to TPDCOOH, but the interaction between a TPDOH and the basecoat was
lower than that of TPDCOOH and the basecoat. Inhomogeneity of the primer was ruled
out as a possible cause of poor adhesion, because chemical mapping of the surface showed
the primer to be homogeneous.
194

Table 8.11: SJT results after 5 mM TPDCOOH was applied with a spray gun to varioustypes of substrates, and cured with UV before the basecoat and clearcoat were applied,cured and left for a 7 day post-cure.
Due to the poor adhesion results from the 5 mM TPDOH primer, further adhesion
tests were performed only with TPDCOOH primers.
Since a CHT result of 0 (the best possible grade) was achieved for all the tested
substrates with a 5 mM TPDCOOH primer, the next test, a harsher SJT was performed.
The results are displayed in Table 8.11.
The best SJT result obtained was on a R/20 substrate after the primer was cured with
the largest UV radiant exposure tested, 2387 mJ cm−2. However, as previously mentioned,
the SJT did not yield reproducible results. Two further tests for each substrate were
performed which gave results within ±2 gradings. The steam jet parameters were set to
one of the harshest standards known in the automotive industry, so it was not surprising
to see such variations. In the reproducibility tests, a SJT grading of 2 was achieved for
the R/20 substrate, cured at 2387 mJ cm−2. Better and worse adhesion compared to the
195

first SJT test was observed. Nevertheless, a significant improvement in the adhesion of
the applied coatings to the grafted substrates was evident.
8.4.2.2 Dependence of the TPDCOOH Concentration, Substrate Type and
UV Radiant Exposure on the Adhesion
A second experiment was performed to investigate the influence of concentration of TPD-
COOH on the adhesion of the coatings to the grafted substrate. Two different ways of
varying the concentration were tested: increasing the molar concentration of the solution
from 5 mM to 10 mM, and increasing the number of primer layers applied. To compare
the adhesion performance with radiant exposure, a radiant exposure which gave the best
adhesion results in the previous experiment, 2837 mJ cm−2 and a lower one, 1278 mJ
cm−2, were tested. To reduce the sample volume, three substrate types were selected, and
to make the experiment industrially relevant, TPO types were chosen that are currently
used in the automotive industry.
The surface energy measured on the TPO/0 substrates is shown in Figure 8.17. The
polar component of the surface energy from all the substrates tested was found to be
larger than the flamed standard, indicating good adhesion could be obtained. The CHT
results were all found to be a grading of 0 (100 % adhesion). Therefore, a SJT was
performed. Table 8.12 shows the SJT results from the substrates with primers cured at
2837 mJ cm−2. It was found that the higher molar concentration, 10 mM, and the higher
number of primer layers applied, improved the adhesion. The type of substrate did not
appear to have a significant influence on the results. Reproducibility SJT tests produced
results within ± 2 gradings.
Table 8.13 shows the SJT results from the substrates with primers cured at 1278 mJ
cm−2. As observed in the previous experiment, the lower UV radiant exposure resulted in
poorer adhesion results. The higher molar concentration, 10 mM, again showed improved
adhesion results compared to 5 mM. However, it was found that the lower number of
primer layers, 2, gave the best adhesion result for the 1278 mJ cm−2 cure, whereas a
196

0
5
10
15
20
25
30
35
40
45
50 S
urf
ace
Eneg
ry (
mN
/m)
No. Primer Sprays
2 3 4 5 Flame/Blank
Dispersion Component 2837 mJcm-2, 5mM
Polar Component 2837 mJcm-2, 5mM
Dispersion Component 2837 mJcm-2, 10mM
Polar Dispersion 2837 mJcm-2, 10mM
Dispersion Component 1278 mJcm-2, 5mM
Polar Component 1278 mJcm-2, 5mM
Dispersion Component 1278 mJcm-2, 10mM
Polar Component 1278 mJcm-2, 10mM
Figure 8.17: A bar graph comparing the dispersion and polar components of the surfaceenergy (together making the total surface energy) of a TPO/0 substrate after 5 mMTPDCOOH was applied at different concentrations with a spray gun and UV cured atdifferent radiant exposures. The two state-of-arts are displayed at the right-hand side ofthe chart.
higher number of primer layers gave the best adhesion results for substrates cured at 2837
mJ cm−2. Therefore, optimum adhesion was achieved with the correct balance of the
number of primer layers and UV radiant exposure. The same trends were observed in the
reproducibility tests, in which the results agreed within ± 2 gradings. One reason for this
observation could be that the lower UV radiant exposure was able to better penetrate
the smaller AP primer thickness (from the low number of primer applications) to induce
significant grafting and adhesion. The larger number of primer layers applied would result
in a thicker layer through which the UV may not have been able to penetrate and hence
activate the APs. On the contrary, the higher radiant exposure of 2837 mJ cm−2 may
have been sufficient to penetrate the thicker primer layers to allow for better adhesion.
197

Table 8.12: SJT results after 5 mM TPDCOOH was applied with a spray gun to varioustypes of substrates, and cured with UV at 2837 mJ cm−2, before the basecoat and clearcoatwere applied, cured and left for a 7 day post-cure.
Table 8.13: SJT results after 5 mM TPDCOOH was applied with a spray gun to varioustypes of substrates, and cured with UV at 1278 mJ cm−2, before the basecoat and clearcoatwere applied, cured and left for a 7 day post-cure.
198

The modes of failure from the substrates which gave poor SJT results were not able to
be measured. This was because the coating and substrate had to be forced apart, which
could have resulted in a false interpretation of the mode of failure. For example, the high
force used to manually pull the coatings away from the substrate surface was different
to the high pressure steam in SJT which caused delamination, so the methods were not
comparable.
8.4.3 UV Curing vs. Thermal Curing
8.4.3.1 Surface Elemental Composition
020406080
100120140160180
10 min 20 min 30 min 10 min 20 min 30 min
80 °C 100 °C
No
rmal
ised
F- In
ten
sity
(‰
)
Temperature / Time
0
20
40
60
80
100
120
140
160
180
2837 1969 1278 989 720 602
No
rmal
ised
F- In
ten
sity
(‰
)
UV Exposure Radiance, mJ cm-2
0
2
4
6
8
10
12
14
10 min 20 min 30 min 10 min 20 min 30 min
80 °C 100 °C
F w
t.%
Temperature / Time
(b)
0
2
4
6
8
10
12
14
2837 1969 1278 989 720 602
F w
t. %
UV Exposure Radiance, mJ cm-2
(d)
TPDCOOH 5mM TPDOH 5mM
(a)
(c)
Figure 8.18: Bar graphs displaying the F− intensity on a TPO/0 substrate from (a)thermally cured substrates and (b) UV cured substrates, and the F wt.% on a TPO/0substrate from (c) thermally cured substrates and (d) UV cured substrates. Both 5 mMTPDOH and 5 mM TPDCOOH AP primers were tested.
Figure 8.18 compares the F− intensity and the F wt.% from thermally cured and
UV cured TPO/0 substrates after 5 mM TPDOH and 5 mM TPDCOOH were applied
as primers. These measurements were taken directly after the primers were cured (no
199

other coatings had been applied). The y-axes have the same scale, enabling a direct
comparison between the curing methods. It was immediately apparent that the signal
intensities from the UV cured samples were significantly larger than the thermally cured
samples. The F wt.% after UV curing is on the order of 10 times higher than the thermal
curing. Therefore, it can be concluded with confidence that UV grafting yields a better
efficiency (grafted molecule per area over time) than thermal grafting, in the conditions
tested. Furthermore, TPDCOOH showed higher F− and F wt.% intensities after UV
curing, compared to TPDOH, as previously observed. No obvious trend between the F−
intensity / F wt.% and the UV radiant exposure was observed. Surface contamination
from silicone or dust particles found in the laboratory atmosphere is a likely reason for
the lack of trend.
0
20
40
60
80
100
120
140
160
180
200
2 3 4 5
Norm
alis
ed F
- In
ten
sity
(‰
)
Number of Primer Layers
0
2
4
6
8
10
12
14
2 3 4 5
F w
t. %
Number of Primer Layers
5mM, 2837 mJ cm-2 10mM, 2837 mJ cm-2 5mM, 1278 mJ cm-2 10mM, 1278 mJ cm-2
(a)
(b)
Figure 8.19: Bar graphs displaying the (a) F− intensity and (b) F wt.% after a 5 mMTPDCOOH AP primer was applied at varying concentrations and cured with two differentUV radiant exposures.
Figure 8.19 shows the F− intensity and the F wt.% from UV cured TPO/0 substrates
after 5 mM TPDCOOH was applied at different concentrations as the primer. Again, no
200

obvious trend was observed between the numbers of sprays and the molar concentration
of TPDCOOH, likely to be due to low levels of surface contamination.
8.4.3.2 UV-Vis Kinetics Study
To further investigate why UV curing gave greater grafting efficiencies than thermal cur-
ing, a UV-Vis kinetic study was performed to calculate the rates of reaction at the various
curing conditions. To investigate thermal curing, the AP solutions were heated up in the
UV-Vis chamber and the absorbance spectrum was measured over time, monitoring the
decrease of the absorbance due to the N=N chromophore (as discussed in Appendix
10.G.1). Figure 8.20 shows the results measured at 80 ◦C and Figure 8.21 shows the re-
sults measured at 100 ◦C. Calibration curves were used to calculate the concentration
change over time, to monitor the loss of the diazirine functional group as a carbene was
generated.
It should be noted that in all measurements, the product generated from the loss of
the diazirine group (-N2) appeared to absorb by a low level at the maximum wavelength
characteristic of the diazirine (N=N). Kinetic studies were, however, calculated at the
maximum wavelength. Therefore, the time scales presented in Table 8.14 are for a rule of
thumb only, and cannot be relied upon for accuracy.
To investigate the UV reaction kinetics, a UV LED chamber was used. The sample was
measured over time to measure the change in UV-Vis absorbance, for powers of 0.1, 0.3,
0.5, 0.7, 0.9 and 2 mW cm−2. Figure 8.22 shows the absorbance spectra change over time
with a UV power of 2 mW cm−2. Calibration curves were used to calculate the change
in concentration over time. The relationship between the rate of decomposition and UV
power was then calculated, as shown in Figure 8.22. All the decomposition reactions were
found to be first order, as expected for a uni-molecular process.
In the region of 400 - 600 nm (not displayed on the Figure) during the UV kinetics
study, small absorptions (all below 0.1) due to the diazo isomer of the diazirine were
observed.135 The UV reaction of the TPD-based molecules to the diazo compound was a
201

competing process, as shown in Figure 8.23. This may have reduced the carbene gener-
ation efficiency, because in a previous study by Brunner et al.,135 it was found that the
diazo isomer converted to the carbene but at a slower rate than the diazirine. Using a 450
W mercury lamp at a 4 cm distance, the half life of diazirine was found to be 25 seconds,
whilst the half life of the diazo compound was 22 minutes (UV cure lasted approximately
2 seconds). These absorptions due to the diazo isomer were only observed during UV
reactions and not the thermal reactions, suggesting different reaction pathways for each
method.
0
0.1
0.2
0.3
0.4
0.5
0.6
0.7
0.8
0.9
1
300 350 400
Abso
rban
ce
Wavelength (nm)
0
0.1
0.2
0.3
0.4
0.5
0.6
0.7
0.8
0.9
1
300 350 400
Ab
sorb
ance
Wavelength (nm)
0
0.2
0.4
0.6
0.8
1
300 350 400
Ab
sorb
ance
Wavelength (nm)
Tim
e (ho
urs)
λmax = 356 nm λmax = 359 nm
Tim
e (ho
urs)
λmax = 348 nm
Tim
e (ho
urs)
(a) (b) (c)
(d) (e) (f) y = 0.00x2 - 0.14x + 2.97
R² = 1.00
1
1.2
1.4
1.6
1.8
2
2.2
2.4
2.6
2.8
3
0 5 10 15 20
Co
nce
ntr
atio
n (
mM
)
Time (hours)
y = 0.00x2 - 0.19x + 2.46
R² = 1.00
0.5
1
1.5
2
2.5
0 5 10 15 20
Conce
ntr
atio
n (
mM
)
Time (hours)
y = 0.00x2 - 0.05x + 2.47
R² = 1.00
1.5
1.6
1.7
1.8
1.9
2
2.1
2.2
2.3
2.4
2.5
0 5 10 15 20
Co
nce
ntr
atio
n (
mM
)
Time (hours)
Figure 8.20: Top: UV-Vis spectra taken at 80 ◦C of the -N=N- chromophore, from (a)TPD in Toluene, (b) TPDOH in Toluene, (c) TPDCOOH in Toluene. Bottom: Con-centration vs. time curves at 80 ◦C for (d) TPD , (e) TPDOH and (f) TPDCOOH. Allreactions are first order: rate of reaction is directly proportional to the concentration ofTPD/OH/COOH. The decomposition of TPD is a unimolecular process.
202

0
0.1
0.2
0.3
0.4
0.5
0.6
0.7
0.8
0.9
1
300 350 400
Ab
sorb
ance
Wavelength (nm)
0
0.1
0.2
0.3
0.4
0.5
0.6
0.7
0.8
0.9
300 350 400
Ab
sorb
ance
Wavelength (nm)
Tim
e (hours)
λmax = 356 nm λmax = 359 nm
Tim
e (ho
urs)
λmax = 348 nm
Tim
e (ho
urs)
(a) (b) (c)
(d) (e) (f)
0
0.1
0.2
0.3
0.4
0.5
0.6
0.7
0.8
0.9
1
300 350 400
Ab
sorb
ance
Wavelength (nm)
y = 2.84e-0.43x
R² = 0.99
0
0.5
1
1.5
2
2.5
3
3.5
0 2 4
Co
nce
ntr
atio
n (
mM
)
Time (hours)
y = 2.27e-0.01x
R² = 0.99
0
0.2
0.4
0.6
0.8
1
1.2
1.4
1.6
50 100 150 200 250
Co
nce
ntr
atio
n (
mM
)
Time (Min)
y = 2.63e-0.27x
R² = 1.00
0
0.5
1
1.5
2
2.5
3
3.5
0 5 10
Co
nce
ntr
atio
n (
mM
) Time (hours)
Figure 8.21: Top: UV-Vis spectra taken at 100 ◦C of the -N=N- chromophore, from (a)TPD in Toluene, (b) TPDOH in Toluene, (c) TPDCOOH in Toluene. Bottom: Concen-tration vs. time curves at 100 ◦C for (d) TPD , (e) TPDOH and (f) TPDCOOH. Allreactions are first order: rate of reaction is directly proportional to the concentration ofTPD/OH/COOH. The decomposition of TPD is a unimolecular process.
A summary of thermal vs. UV curing kinetics is found in Table 8.14. A power of 400
mW cm−2 was calculated to be the equivalent of 1900 mJ cm−2, which was used during
the adhesion tests. The results highlight the significantly faster UV kinetics compared
to the thermal kinetics. UV curing was found to be on the order of 105 times faster
than thermal curing. This therefore explained the higher grafting efficiency and better
adhesion results found for UV curing compared to thermal curing during the adhesion
tests.
It was found that TPDOH reacted faster than TPD, which reacted faster than TPD-
COOH. This was not the expected order since the best adhesion results had been obtained
with TPDCOOH. However, it was thought that the higher volatility of TPDOH compared
203

y = 1712.09x-1.02
R² = 0.90
0
5000
10000
15000
20000
25000
30000
0 0.5 1 1.5 2
Tim
e fo
r 9
9.9
% r
eact
ion c
om
ple
tio
n (
seco
nd
s)
Power UVA source mW cm-2
0
0.2
0.4
0.6
0.8
1
1.2
300 350 400
Ab
sorb
ance
Wavelength (nm)
0
0.1
0.2
0.3
0.4
0.5
0.6
0.7
0.8
300 350 400
Ab
sorb
ance
Wavelength (nm)
Tim
e (ho
urs)
λmax = 356 nm λmax = 359 nm
Tim
e (ho
urs)
λmax = 348 nm
Tim
e (ho
urs)
(a) (b) (c)
(d) (e) (f)
0
0.2
0.4
0.6
0.8
1
1.2
330 350 370 390
Ab
sorb
nac
e
Wavelenth (nm)
y = 773.67x-1.19
R² = 1.00
0
2000
4000
6000
8000
10000
12000
14000
0 0.5 1 1.5 2
Tim
e fo
r 9
9.9
% r
eact
ion c
om
ple
tio
n (
seco
nd
s)
Power UVA source mW cm-2
y = 1,762.49x-1.10
R² = 1.00
0
5000
10000
15000
20000
25000
0 0.5 1 1.5 2T
ime
for
99
.9%
rea
ctio
n c
om
ple
tio
n (
seco
nd
s)
Power UVA source mW cm-2
Figure 8.22: Top: UV-Vis spectra of the -N=N- chromophore, taken at 2 mW cm−2 from(a) TPD in Toluene, (b) TPDOH in Toluene, (c) TPDCOOH in Toluene. Bottom: Timefor 99 % reaction completion vs. power of UV source in mW cm−2 for (d) TPD , (e)TPDOH and (f) TPDCOOH. All reactions are first order: rate of reaction is directlyproportional to the concentration of TPD/OH/COOH. The decomposition of TPD is aunimolecular process.
Table 8.14: Summary of the kinetic study from thermal and UV reactions of TPD, TP-DOH and TPDCOOH.
⁰ ⁰⁰⁰
⁰
204

hν
Figure 8.23: The UV reaction scheme for TPD showing the formation of the diazo isomerand subsequent indirect formation of the carbene. Adapted from Brunner et al.135
to TPDCOOH could have been a reason for the differences in adhesion, or the TPDOH
may have reacted on a time scale that was too fast to allow for CH insertion reactions
with the substrate to occur.
To test if further decomposition of the AP’s had occurred during the reaction with
toluene, the products from the kinetic study (3 mM AP in toluene) which were cured
at 100 ◦C for eight hours under reflux (thermal) and 2 mW for 180s (UV) were analysed
with GC/MS. A cool-on-column technique (described in Section 4.26.1) was used for the
prevention of thermal decomposition of the samples during the analysis process, although
a temperature ramp and a heated interface between the gas chromatograph and mass
spectrometer could not be avoided.
The expected target compounds were identified without decomposition, as shown in
Figure 8.24. Therefore, the UV-Vis absorptions were confirmed to be from the N=N
chromophore of the diazirine functional group, and not any decomposition side products.
The AP’s were found to have undergone regioselective CH insertion reactions with the
methyl group of toluene only (Figure 8.24 (b), (e) and (g)) and no evidence of CH insertion
into the phenyl ring was observed.
205

Figure 8.24: Structures of the products identified with GC-MS from the thermal and UVactivated reactions of 3 mM solutions of TPD (a-c), TPDOH (d-e) and TPDCOOH (f-g)in toluene.
This regioselectivity has also been observed from different carbenes reacting with toluene
in previous studies.187 The reaction is selective because the methyl group of toluene is
the most sterically accessible group for the TPD to react with. Evidence of oxidation
reactions from all AP’s were also observed, which generated ketone derivatives as shown
in Figure 8.24 (a), (d) and (f). TPD was also found to have CH inserted into another
TPD molecule generating the structure with Mr = 344 (Figure 8.24 (c)). No differences
between thermal or UV activated reaction products were observed.
8.4.3.3 EPR Spectrometry Study
To take the investigation further, EPR spectroscopy measurements were performed to see
if reactive triplet carbene species could be detected upon thermal and UV activation of
TPDCOOH. Although computational calculations (described in Section 4.21.3) predicted
all three APs to form triplet carbenes, it was thought that the electronic state of the
carbene may vary depending on the curing method used to generate the carbene. EPR
206

does not detect singlet carbenes, therefore, the difference (if any) between the carbene
ground state generated, depending on whether the reaction was thermally or UV activated,
could be tested. Any observable differences in the ground states of carbenes formed,
determined by the signal generated in EPR, would aid the understanding of why UV
initiated reactions had such significantly faster time scales than thermal reactions.
Few cases exist in the literature where both UV and thermal activation have been used
to generate a carbene and the reaction mechanisms compared. However, previous inves-
tigations show striking differences in the products produced, depending on whether the
carbenes were generated thermally or by UV. Various carbene precursors have been found
to have mixed singlet and triplet carbene processes during CH insertion reactions.188–190
Furthermore, significant differences in the insertion products and the distribution of iso-
mers formed upon UV and thermal reactions of TPDs have been observed.191,192 This
was also observed during the proof of concept experiment in Section 7.3.1, where the
19F NMR spectra of the products from the thermal or UV reaction between cyclohexane
and TPD were significantly different. It has been postulated that the higher reactivity
of the carbenes generated by UV activation compared to thermal activation is due to
vibrationally excited carbenes (hot radicals) generated by UV irradiation.188
UV degradation Two scans were recorded before and after TPDCOOH was subjected
to the UV LED. The first (red line, as shown in Figure 8.25) was recorded with no
irradiation, whereas the second (black line in Figure 8.25) was run after five minutes of
irradiation using a 365 nm LED, guided by fibre-optic cable into the sample tube. This
was maintained whilst running the spectrum. In Figure 8.25, these two data sets are offset
on the y-axis for clarity (these being otherwise overlapping), which represents intensity
in arbitrary units.
The similarity of the two measurements in Figure 8.25 suggested either a singlet (dia-
magnetic/spin paired) species was being formed which wouldn’t be detected in EPR, or
potentially a carbene species wasn’t being formed in the reaction conditions. However,
207
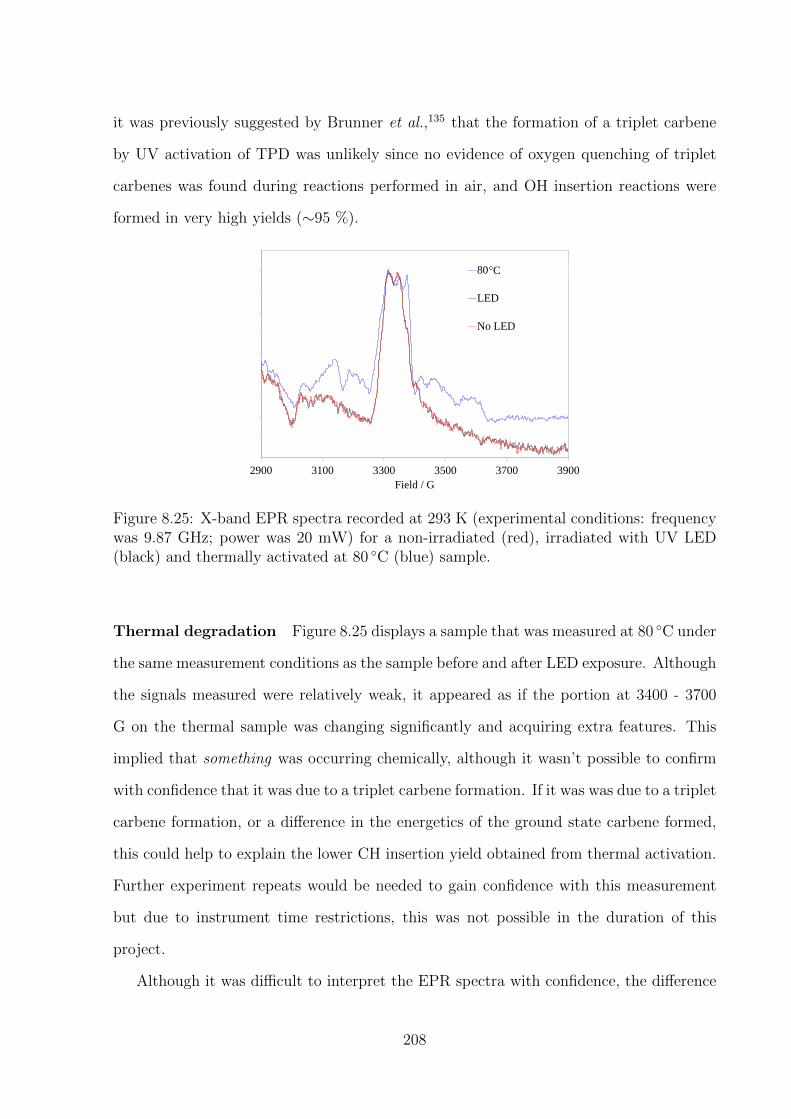
it was previously suggested by Brunner et al.,135 that the formation of a triplet carbene
by UV activation of TPD was unlikely since no evidence of oxygen quenching of triplet
carbenes was found during reactions performed in air, and OH insertion reactions were
formed in very high yields (∼95 %).
2900 3100 3300 3500 3700 3900
Field / G
80 Degrees Celcius
LED
No LED
°C
Figure 8.25: X-band EPR spectra recorded at 293 K (experimental conditions: frequencywas 9.87 GHz; power was 20 mW) for a non-irradiated (red), irradiated with UV LED(black) and thermally activated at 80 ◦C (blue) sample.
Thermal degradation Figure 8.25 displays a sample that was measured at 80 ◦C under
the same measurement conditions as the sample before and after LED exposure. Although
the signals measured were relatively weak, it appeared as if the portion at 3400 - 3700
G on the thermal sample was changing significantly and acquiring extra features. This
implied that something was occurring chemically, although it wasn’t possible to confirm
with confidence that it was due to a triplet carbene formation. If it was was due to a triplet
carbene formation, or a difference in the energetics of the ground state carbene formed,
this could help to explain the lower CH insertion yield obtained from thermal activation.
Further experiment repeats would be needed to gain confidence with this measurement
but due to instrument time restrictions, this was not possible in the duration of this
project.
Although it was difficult to interpret the EPR spectra with confidence, the difference
208

measured between thermal and UV curing, as shown in Figure 8.25, suggested a difference
in the energetics of the carbenes or reactive species formed during the reaction which could
have been a reason for the difference in adhesion observed, with UV curing generating
the best results.
Future experiments to further understand the electronic states of the carbenes gen-
erated in different conditions, could include determining the yield of a thermal or UV
reaction in methanol under an air atmosphere, which would help to determine if any
triplet species were formed because oxygen quenching by triplets would result in a lower
yield than expected.135 IR spectroscopy has also been used to characterise the electronic
state of TPD molecules, using flash pyrolysis as the activation method. Future work could
use the predicted spectra for a singlet and triplet carbene to compare with the measured
IR spectra, as investigated by Fischer et al.193
8.4.4 Chemical Mapping of Coated Cross-Sections
To assess the adhesion mechanisms of the AP primers applied at the substrate/basecoat
interface, ToF-SIMS was used to measure the F− intensity of a defined area from cross-
sections of coated and cured substrates that showed good CHT or SJT results. Charac-
teristic ions of the basecoat, clearcoat and substrate were chosen. NCO− was found in
polyisocyanates from the clearcoat, C2N3− was found in the basecoat formulation, and
C28H42PO4− was from the Irgafos 168 additive in the substrate (Appendix 10.F.2).
Initially, a spray gun was used to coat a blank substrate (no AP) with a basecoat
and clearcoat, which were cured using the standard procedure. A small sectioned piece
of the delaminated coating was then set in a resin to be held in place for cutting with a
microtome. By careful handling of the sample, a cross-section was cut and immediately
placed into the ultra high vacuum (UHV) chamber for ToF-SIMS analysis. It was impor-
tant to measure the cross-sectioned surfaces on the same day to avoid contamination at
the surface. However, an argon cluster ion gun was used to etch the surface clean before
analysis as a precaution, to remove any contamination that reached the surface in the
209

short transfer time.
8.4.4.1 Basecoat and Clearcoat on an Untreated Substrate
It was important to measure a delaminated basecoat and clearcoat to check if a significant
F− intensity could be detected, which could have hindered any signals from the AP primer.
The results are shown in Figure 8.26. The basecoat was clearly identified with the
C2N3− ion, and the clearcoat was clearly identified using the CNO− ion. All intensities
were normalised against the total ion counts. The overlay of the F− intensity in Figure
8.26(b) shows a low signal. This was then compared with the coated substrates containing
a primer layer.
0 5F- Intensity
0
20
40
60
80
0 20 40 60
Topcoat
Basecoat
46 µ
m
47 µ
m
µm 0 40 80 120
150
125
100
75
50
25
0 µm
(a) (b) (c)
Figure 8.26: (a)ToF-SIMS image showing the clearcoat from the NCO− ion (m/z = 42)and the basecoat from the C2N3
− ion (m/z = 66), normalised against total ion counts,(b) image: magnified area of basecoat/clearcoat; overlay: line graph of F− (m/z = 19)normalised intensity, and (c) schematic diagram of basecoat/clearcoat with estimatedcoating thicknesses.
An estimation of the coating thickness was measured using Ion-ToF software. However,
the basecoat and clearcoat mixed during the thermal curing stage, therefore, no clear
interface existed between the layers. The total thickness of the coatings was almost
double than the expected thickness. The low accuracy of a hand held spray gun (human
210

error) may have caused this.
8.4.4.2 Comparing TPDOH and TPDCOOH
The F− intensity images shown in Figure 8.27 show a clear difference between the graft-
ing abilities of TPDOH and TPDCOOH. The TPDCOOH primer was applied with a
concentration 100 times lower than the TPDOH, and the signal intensity from F− of the
TPDCOOH was found to be significantly higher than TPDOH. Furthermore, the F− in-
tensity found on the primer coated substrates was between 100 times (TPDOH) or 500
times (TPDCOOH) larger than the blank coatings shown in Figure 8.26. This proved
that the F− intensity was from the AP and not any components in the coatings.
0
50
100
150
0 50 100 1500
20
40
60
0 20 40 60
0 500 1000 1500 2000 2500F- Intensity
0 500 1000 1500 2000 2500
F- Intensity
Topcoat
Basecoat
PP
(a) Fixing Glue
m
(b)
CHT:0 CHT:0
Figure 8.27: ToF-SIMS images showing the clearcoat from the NCO− ion (m/z = 42), thebasecoat from the C2N3
− ion (m/z = 66), and the TPO substrate from the C28H42PO4−
ion (m/z = 473), with an overlay of the F− (m/z = 19) for a UV cured (1900 mJ cm−2)(a) 5 mM TPDCOOH and (b) 0.5 M TPDOH primer layer, applied with a doctor blade.All intensities were normalised against total ion count.
8.4.4.3 Comparing the Doctor Blade and Spray Methods of Application
Two substrates, one which had coatings applied with a doctor blade and the other with
a spray gun, were cross-sectioned and imaged to compare the two application methods.
The results are shown in Figure 8.28. The F− axis was set to the same scale for both
measurements, so that a direct comparison between the application methods could be
211
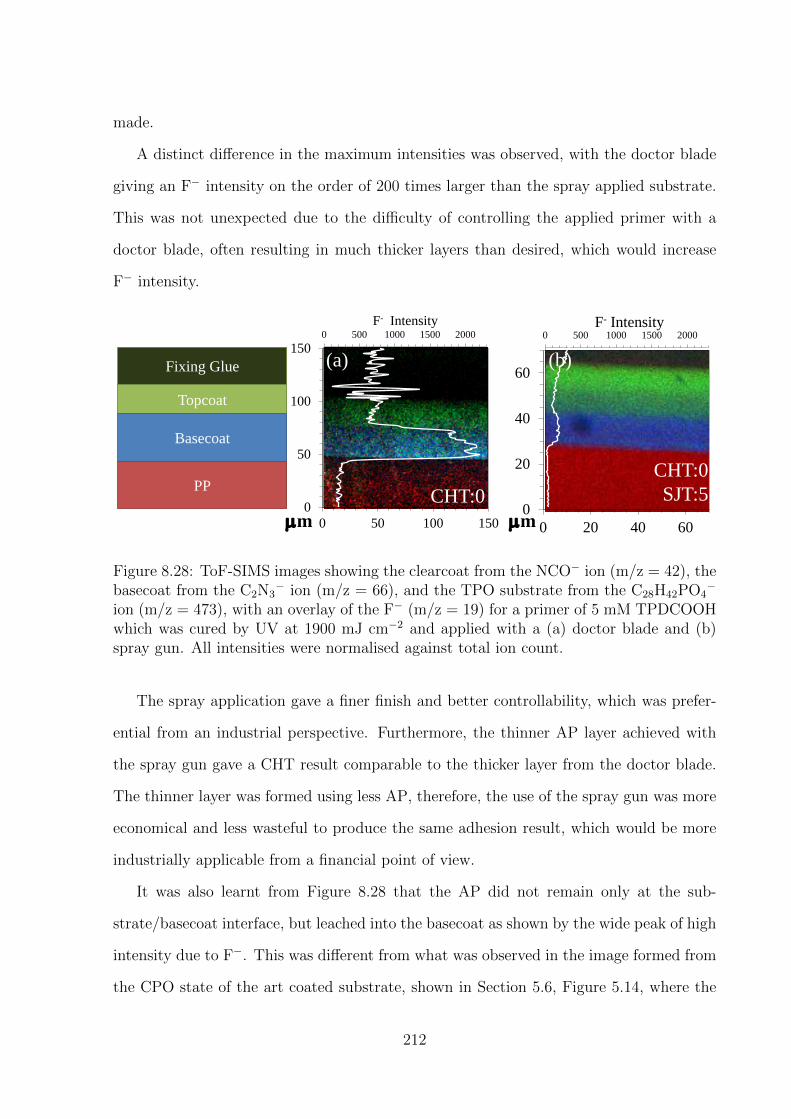
made.
A distinct difference in the maximum intensities was observed, with the doctor blade
giving an F− intensity on the order of 200 times larger than the spray applied substrate.
This was not unexpected due to the difficulty of controlling the applied primer with a
doctor blade, often resulting in much thicker layers than desired, which would increase
F− intensity.
0
20
40
60
0 20 40 60
0 500 1000 1500 2000F- Intensity
0 500 1000 1500 2000
F- Intensity
0
50
100
150
0 50 100 150
Topcoat
Basecoat
PP
(a)
CHT:0
SJT:5
(b) Fixing Glue
m m
CHT:0
Figure 8.28: ToF-SIMS images showing the clearcoat from the NCO− ion (m/z = 42), thebasecoat from the C2N3
− ion (m/z = 66), and the TPO substrate from the C28H42PO4−
ion (m/z = 473), with an overlay of the F− (m/z = 19) for a primer of 5 mM TPDCOOHwhich was cured by UV at 1900 mJ cm−2 and applied with a (a) doctor blade and (b)spray gun. All intensities were normalised against total ion count.
The spray application gave a finer finish and better controllability, which was prefer-
ential from an industrial perspective. Furthermore, the thinner AP layer achieved with
the spray gun gave a CHT result comparable to the thicker layer from the doctor blade.
The thinner layer was formed using less AP, therefore, the use of the spray gun was more
economical and less wasteful to produce the same adhesion result, which would be more
industrially applicable from a financial point of view.
It was also learnt from Figure 8.28 that the AP did not remain only at the sub-
strate/basecoat interface, but leached into the basecoat as shown by the wide peak of high
intensity due to F−. This was different from what was observed in the image formed from
the CPO state of the art coated substrate, shown in Section 5.6, Figure 5.14, where the
212
Cl− had a sharp intensity increase at the interface. When considering the estimated con-
centration for a monolayer of TPDCOOH at the substrate surface (calculated in Section
4.21.1, shown in Table 7.19), this result was not unexpected due to the high concentration
of molecules at the surface. Either single unbound molecules leached into the basecoat
or the excess molecules grafted to one-another, forming a brush-like structure that was
grafted to the substrate surface. If this structure was mobile once the basecoat was ap-
plied, it could have set in the coating during the curing stage, increasing the adhesion by
locking the two layers together. The kinetics study indicated that it would take in the
order of 2.4 s for 99.9 % conversion of TPDCOOH to the active carbene. Therefore, the
APs are very likely to have reacted and the brush like structure is quite possible. Fur-
thermore, the mass spectra results discussed in Section 7.4.1 also support the multilayer
model suggested.
8.4.4.4 Comparing Substrate Type
Further analysis was done to look for any differences between the types of substrates used.
Figure 8.29 compares a R/0, R/10 and R/20 substrate. All the substrates had given a
CHT result of 0 (the best), however, only the R/20 substrate gave the highest result
possible from the SJT (100 % adhesion). It could not be seen why the R/20 substrate
gave the best adhesion results when comparing the F− intensity, which was of a similar
magnitude for all substrates. Therefore, the improved adhesion was likely to be due to the
physical properties of the R/20 substrate that distinguished it from the other substrates.
The physical properties of the substrates, (see Appendix 10.F), revealed that the R/20
was significantly softer than the other substrates. This could have resulted in the pene-
tration of the TPDCOOH into the surface of the substrate during the application/curing
process, allowing a type of mechanical adhesion as well as forming a covalent bond at the
surface. The basecoat could have also penetrated into the substrate, allowing a better in-
teraction with the grafted surface compared to the other substrates. The resolution of the
images and the deviations of the coating interfaces from a straight line limited ToF-SIMS
213

0
20
40
60
0 20 40 60
0 100 200 300F- Intensity
0
20
40
60
0 20 40 60
0 100 200F- Intensity
CHT: 0 SJT: 0
µm
Topcoat
Basecoat
PP 0
20
40
60
0 20 40 60
CHT:0 SJT:5
0 100 200F- Intensity
(a) Fixing Glue
µm
CHT: 0 SJT: 5
µm
(b) (c)
Figure 8.29: ToF-SIMS images showing the clearcoat from the NCO− ion (m/z = 42), thebasecoat from the C2N3
− ion (m/z = 66), and the TPO substrate from the C28H42PO4− ion
(m/z = 473), with an overlay of the F−(m/z = 19) for a primer of 5 mM TPDCOOH whichwas cured by UV at 1900 mJ cm−2 and spray applied to the following substrates:(a)R/0,(b) R/10 and (c) R/20. All intensities were normalised against the total ion count.
as a measurement technique for detecting penetration of the AP or basecoat. Future ex-
periments could include measuring the cross-sections at a higher lateral resolution using
ToF-SIMS (accredited for its high spacial resolution abilities194).
8.4.4.5 Comparing Number of Primer Layers
The concentration of the primer applied was varied in two ways: by changing the solution
concentration and by applying multiple primer layers (number of sprays). Cross-sections
of TPO/0 substrates containing varying numbers of 5 mM TPDCOOH primer layers
were prepared and measured. The results are shown in Figure 8.30. A clear difference
was observed and the F− intensity increased with the number of sprays, as expected.
Although a significantly low AP intensity was detected for the substrate containing two
primer layers (shown in Figure 8.30(a)), a CHT grading of 0 was achieved, suggesting it
wasn’t only the F− that determined the adhesion results. It appeared that the AP had
leached into the basecoat and clearcoat during the coatings application, which could have
enchanced the adhesion by locking the layers together, as discussed previously.
A higher AP intensity was detected for the substrate containing three primer layers
(shown in Figure 8.30(b)), and the AP had leached into the basecoat as observed before,
yet the same adhesion results were obtained as the substrate with two primer layers.
214

0 100 200 300F- Intensity
0
20
40
60
80
100
0 20 40 60
0 100 200 300F- Intensity
Topcoat
Basecoat
PP
Fixing Glue
µm
0 100 200 300F- Intensity
CHT: 0 SJT: 5
(a)
0
20
40
60
80
100
0 20 40 60µm
CHT: 0 SJT: 5
(b)
0
20
40
60
80
100
0 20 40 60
CHT: 0 SJT: 3
µm
(c)
Figure 8.30: ToF-SIMS images showing the clearcoat from the NCO−ion (m/z = 42), thebasecoat from the C2N3
− ion (m/z = 66), and the TPO substrate from the C28H42PO4−
ion (m/z = 473), with an overlay of the F− (m/z = 19) for a primer of 5 mM TPDCOOHwhich was spray applied (a) 2 x, (b) 3 x, and (c) 5 x, to a TPO/0 substrate and cured byUV at 1900 mJ cm−2. All intensities were normalised against the total ion count.
However, a significant improvement in adhesion was noted when five primer layers were
applied (shown in Figure 8.30(c)). This substrate was distinguishable from the others by a
sharp F− intensity at the substrate/basecoat interface, similar to that previously observed
for CPO (shown in Figure 5.14). This indicated a greater % grafting of the AP at the
substrate surface, of which less migrated into the basecoat. Therefore, it was proposed
that the greater adhesion was caused by a brush-like structure of grafted AP existing at
the substrate surface which was able to extend into the basecoat and enhance adhesion,
as well as a higher intensity of the AP at the substrate/basecoat interface for greater
interactions.
8.4.4.6 Comparing the TPDCOOH Solution Concentration
Figure 8.31 compares the two solution concentrations of TPDCOOH: 5 mM and 10 mM.
Unlike the 5 primer layered substrate in Figure 8.30, no sharp F− intensity at the interface
was observed and the intensity appeared broad due to the leaching of the AP into the
basecoat. No significant difference between the cross-sections from the two solutions was
observed and the increase in TPDCOOH concentration did not improve the SJT result
(5 for both substrates).
215

0 100 200 300 400
F- Intensity
0
20
40
60
0 20 40 60
0 100 200 300 400F- Intensity
Topcoat
Basecoat
PP
(a) Fixing Glue
m
CHT: 0
SJT: 5 0
20
40
60
0 20 40 60
m
CHT: 0
SJT: 5
(b)
Figure 8.31: ToF-SIMS images showing the clearcoat from the NCO− ion (m/z = 42), thebasecoat from the C2N3
− ion (m/z = 66), and the TPO substrate from the C28H42PO4−
ion (m/z = 473), with an overlay of the F− (m/z = 19) for a primer of (a) 5 mMTPDCOOH and (b) 10 mM TPDCOOH which was spray applied and UV cured at 1900mJ cm−2. All intensities were normalised against the total ion count.
8.5 Industrial Applicability
8.5.1 Stability of TPD’s
8.5.1.1 Storage Stability
To assess the stability of the APs over time when stored in a refrigerator or in day light, 3
mM solutions in toluene were stored and measured with UV-Vis over a six month period.
As shown in Figure 8.32, the solutions stored on the windowsill at room temperature
decomposed at a significantly higher rate than the solutions stored in the dark refrigerator
at 3 ◦C, due to exposure to the higher temperature and the daylight. Furthermore, TPD
showed a greater decomposition in the refrigerator than TPDOH and TPDCOOH, which
both showed minimal decomposition over the 6 month period. The storage of APs in
a refrigerator is a costly process in industry. Therefore, further storage tests at room
temperature would be performed. However, TPDCOOH was the most stable at room
temperature in daylight and therefore is the most suitable for industrial application in
this study.
216

0
0.2
0.4
0.6
0.8
1
1.2
300 350 400
Ab
sorb
ance
Wavelength (nm)
0
0.2
0.4
0.6
0.8
1
1.2
300 350 400
Ab
sorb
ance
Wavelength (nm)
(a)
0.0
0.2
0.4
0.6
0.8
1.0
1.2
300 350 400
Ab
sorb
ance
Wavelength (nm)
(b) (c)
0 Months 1 Month 2 Months 3.5 Months 6 Months
0
0.2
0.4
0.6
0.8
1
1.2
300 350 400
Ab
sorb
ance
Wavelength (nm)
0.0
0.2
0.4
0.6
0.8
1.0
1.2
300 350 400
Ab
sorb
ance
Wavelength (nm)
0
0.2
0.4
0.6
0.8
1
1.2
300 350 400
Ab
sorb
ance
Wavelength (nm)
(d) (e) (f)
0
0.5
1
1.5
2
2.5
3
3.5
4
0 2 4 6
Co
nce
ntr
atio
n (
mM
)
Time (Months)
0
0.5
1
1.5
2
2.5
3
3.5
4
4.5
5
0 2 4 6
Co
nce
ntr
atio
n (
mM
)
Time (Months)
0
0.5
1
1.5
2
2.5
3
3.5
4
0 2 4 6
Co
nce
ntr
atio
n (
mM
)
Time (Months)
Fridge
Daylight
(g) (h) (i)
Figure 8.32: Stability study measuring UV-Vis spectra of 3 mM solutions in toluene, overa six month period, for solutions of (a) TPD, (b) TPDOH and (c) TPDCOOH stored inthe refrigerator at 3 ◦C, and solutions of (d) TPD, (e) TPDOH and (f) TPDCOOH storedin transparent glass vials on a windowsill at room temperature.
217

8.5.1.2 Ageing Effect
Corona discharge and plasma treatments have been demonstrated to have an ageing effect,
where the wettability of the functionalised surface decreases over time.49,195 This has an
industrial impact as the treated substrates cannot be stored for long and must be coated
within a particular time period. Therefore, to test the industrial applicability of the
TPDCOOH functionalised surface, an ageing test was performed where the TPDCOOH
was applied with a doctor blade, cured with UV at 1900 mJ cm−2, and stored at room
temperature in a closed Petri dish for 7 days, before the basecoat and topcoat were applied
and cured. The adhesion was tested with the CHT, and a grading of 0 was achieved (100
% adhesion). Therefore, these preliminary tests suggested the ageing of a TPDCOOH
graft would not cause any potential problems.
8.5.2 Evaluation of Synthesis
The synthesis of TPD is described in Appendix 10.M. It was performed for an under-
standing of the synthesis process and its industrial applicability. TPD was successfully
synthesised and characterised, producing a yield of 2.7 g (∼90 %). Table 8.15 shows the
amount of material required for each step (described in Appendix 10.M) to generate 2.7
g of TPD and an estimation of the cost based on the initial starting material from step 1
and the silver oxide required to generate TPD (the two materials assumed to be the most
costly for the synthesis), summing to a total of £20.87. This results is a cost of £7.73 per
gram of TPD. Assuming MEK was the solvent that would be used for a coating solution,
which cost £90.90 per 2.5 L (Signal Aldrich), it would cost £22.05 for a 500 ml 5 mM
TPD solution (based on the solution that gave the best adhesion results). The amount
of substrate that could be sprayed with this volume was tested, and the cost of solution
per m2 was found to be £12.25 (£0.18 per 12 x 12 cm square substrate).
218
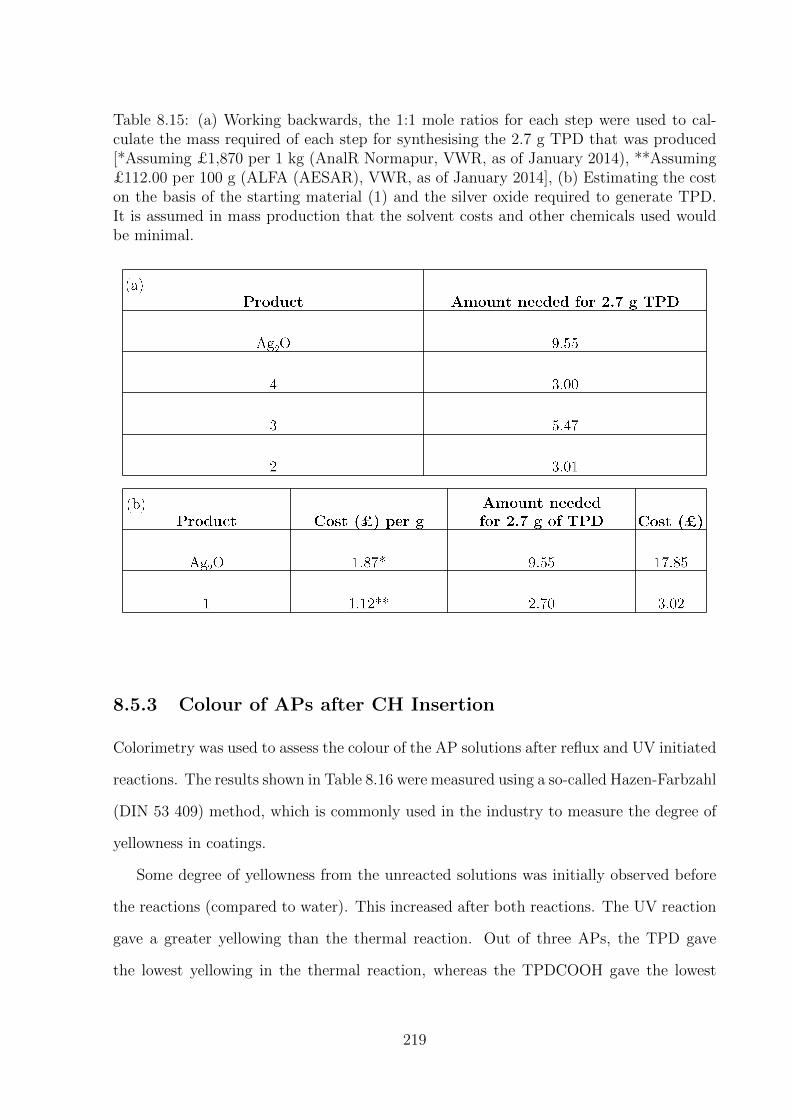
Table 8.15: (a) Working backwards, the 1:1 mole ratios for each step were used to cal-culate the mass required of each step for synthesising the 2.7 g TPD that was produced[*Assuming £1,870 per 1 kg (AnalR Normapur, VWR, as of January 2014), **Assuming£112.00 per 100 g (ALFA (AESAR), VWR, as of January 2014], (b) Estimating the coston the basis of the starting material (1) and the silver oxide required to generate TPD.It is assumed in mass production that the solvent costs and other chemicals used wouldbe minimal.
8.5.3 Colour of APs after CH Insertion
Colorimetry was used to assess the colour of the AP solutions after reflux and UV initiated
reactions. The results shown in Table 8.16 were measured using a so-called Hazen-Farbzahl
(DIN 53 409) method, which is commonly used in the industry to measure the degree of
yellowness in coatings.
Some degree of yellowness from the unreacted solutions was initially observed before
the reactions (compared to water). This increased after both reactions. The UV reaction
gave a greater yellowing than the thermal reaction. Out of three APs, the TPD gave
the lowest yellowing in the thermal reaction, whereas the TPDCOOH gave the lowest
219

Table 8.16: Calorimeter results using Hazen-Farbzahl method (calibrated against H2O =0) for 3 mM TPD, TPDOH, and TPDCOOH in toluene after 1h reflux and 1h UV (1mW cm−2). Scale = 1 – 1000.
°
yellowing in the UV reaction. This was encouraging because TPDCOOH gave the best
adhesion results with UV curing. Furthermore, the scale ranged from 0 - 1000, therefore,
the degree of yellowness of the AP solutions was relatively low (water = 0).
The difference between the intensities that were measured for both of the curing meth-
ods were further indicative that different reactions had proceeded, as previously discussed
in Section 8.4.3.3.
Future work could include the consideration of the colour and if it would affect the
pigments in the coatings, affecting the refinish of vehicles.
8.5.4 Differential Scanning Calorimetry (DSC) and Simultane-
ous Differential Scanning Calorimetry-Thermogravimetry
(DSC-TG)
DSC was used as a rapid screening test to detect any potentially hazardous reactions and
for identifying the temperatures at which these reactions occur. DSC-TG was used to
look at the gas evolution rate at the peak temperatures observed in DSC.
These measurements were not only crucial for learning how to safely handle the sub-
stances, but also for learning how such substances could be used in an industrial process.
220

Integral 12.93 x 10³ mJ
normalised 852.10 J g-1
Peak 127.51 °C
Integral 3648.36 mJ
normalised 240.50 J g-1
Peak 345.82 °C
Integral 8172.09 mJ
normalised 740.23 J g-1
Peak 138.15 °C Integral 5267.83 mJ
normalised 477.16 J g-1
Peak 419.05 °C
Integral 16.97 x 10³ mJ
normalised 1116.66 J g-1
Peak 127.90 °C
Integral 8703.62 mJ
normalised 572.61 J g-1
Peak 490.54 °C
Onset 70°C
Onset 295°C
Onset 85°C
Onset 310°C
Onset 270°C Onset 95 °C
40 80 120 160 200 240 280 320 360 400 440 460°C
50
mW
(a) TPD, Glass, 2.5 °C/min, 15.20 mg
40 80 120 160 200 240 280 320 360 400 440 460°C
(b) TPDOH, Glass, 2.5 °C/min, 15.17 mg
20
mW
40 80 120 160 200 240 280 320 360 400 440 460°C
(c) TPDCOOH, Glass, 2.5 °C/min, 11.04 mg
20
mW
TG/%
Mass Change: -0.1 %
Mass Change: -36.0 %
Mass Change: -56.0 %
DTG /(%/min)
DSC /(mW/mg)
Exc
7
6
5
4
3
2
1
0
0.00
-2.00
-4.00
-6.00
-8.00
-10.00
100
80
60
40
20
0
-20
-40
-60
-80
50 100 150 200 250 300 350 400 450
Temperature / °C
TG/% DTG /(%/min)
DSC /(mW/mg)
Exc Mass Change: -0.6 %
Mass Change: -2.6 %
100
95
90
85
80
50 100 150 200 250 300 350 400 450
Temperature / °C
50 100 150 200 250 300 350 400 450
Temperature / °C
5
4
3
2
1
0
0.00
-1.00
-2.00
-3.00
-4.00
-5.00
TG/% DTG /(%/min)
DSC /(mW/mg)
Exc
Mass Change: 0.2 %
Mass Change: -20.5 %
Mass Change: -47.8 %
8
6
4
2
0
0.00
-2.00
-4.00
-6.00
-8.00
-10.00
100
80
60
40
20
0
-20
-40
Temperature / °C
Temperature / °C
Temperature / °C
Figure 8.33: LHS: DSC results, RHS: simultaneous DSC-TGA for (a) TPD, (b) TPDOHand (c) TPDCOOH.
221

8.5.4.1 Reaction Processes Occurring
Figure 8.33 shows the DSC plots recorded for the three APs (TPD, TPDOH and TPD-
COOH). For all three plots, two exothermic reactions can be observed: one at a lower
temperature and one at a higher temperature. It is likely, and in line with literature,196–198
that the lower temperature exothermic peak occurring at an onset between 70 - 85 ◦C was
due to the N2 loss from the diazirine moiety during carbene formation.
Han et al. studied the temperature effect (∼100− 400 ◦C) of annealing carbon-based
fluorinated films. The thermal release from the breaking of C-F bonds increased as the
annealing temperature increased. Thus it was plausible that the second exothermic re-
actions observed in DSC analysis from the APs could be due to the C-F bonds breaking
from the CF3 functional group. Furthermore, it was unlikely that any thermal decompo-
sition of benzene occurred at temperatures lower than 500 ◦C,199 as oxidation of benzene
derivatives can occur at temperatures as high as 1300 ◦C without any phenyl ring decom-
position.200 Therefore, it was unlikely that the phenyl ring of the APs was affected during
the DSC measurement.
The data obtained from the DSC-TGA for TPD, shown in Figure 8.33(a), was found
to be inconclusive, due to the evaporative loss of the sample preventing the establishment
of a stable baseline at the start of the experiment. This lead to discrepancies in the
recorded mass losses (See Table 8.17).
However, clearer DSC-TGA plots were obtained for TPDOH and TPDCOOH, al-
though the quantitative data was not as expected. The expected mass losses are displayed
in Table 8.17. The mass change observed for the first exothermic reaction of TPDOH was
significantly less than expected for the N2 loss, suggesting it was not reactive. However,
the mass change of the first exothermic reaction from TPDCOOH was ∼ 2 times larger
than expected. Alternative reactions could have occurred or be a result of the loss of the
material by evaporation. For TPDCOOH, the melting point (125 ◦C quoted by TCI chem-
icals materials data sheet) occurs at the same temperature of the first reaction observed
in DSC, and so in its molten state it could have evaporated.
222

Table 8.17: Expected mass losses from the APs
Interestingly, an endothermic event due to melting was not observed in the DSC and could
have been masked by the first exothermic reaction.
The mass changes at the second exothermic reactions from both TPDOH and TPD-
COOH were also larger than expected. When comparing with predicted values in Table
8.17, the mass losses were more closely matched the loss of the phenyl ring, however, due
to the relatively low temperatures this was unlikely as previously mentioned.
8.5.4.2 Safety of Substances
For all three AP’s tested, two reactions were observed, all of which were exothermic and
showed self-accelerating behaviour. For non-self-accelerating reactions, the material can
be considered as safe if the difference between the onset and peak temperature is greater
than 100 ◦C. However, higher safety measures were needed as the reaction was found to
be self-accelerating (reaction proceeded at constant temperature).
According to TRAS 410 (German guideline for plant safety), an exotherm of less than
100 J g−1, which is equivalent to an adiabatic temperature rise of about 50 ◦C, presents
no safety problems. As a general rule (from previous unpublished in-house experiments),
reactions with an energy content of less than 200 J g−1 may be considered as safe. However,
all exothermic reactions from the AP’s, shown in Figure 8.33, had an energy content of
greater than 200 J g−1, as shown in Table 8.18. Therefore, careful safety considerations
had to be taken.
223

Table 8.18: Summary of DSC results.
° °
° °
For handling regulations, the second reactions of TPD and TPDCOOH were less
than 500 J g−1 and would be considered safe. However, the first reactions of TPD and
TPDCOOH, as well as both reactions observed from TPDOH, had decomposition energies
above 500 J g−1 and would be considered unsafe and would need further investigation.
Therefore, safety of these molecules is a key factor in determing the industrial applica-
bility of the APs. Further work to investigate the safety of the AP’s in diluted forms would
be recommended and a thorough investigation into how the safety could be improved for
a plausible industrial coatings process to be achievable.
224

8.5.5 Impact Sensitivity
A drop-weight was used to assess what effect the impact would have on the APs. The
results are shown in Table 8.19. TPD was found to be the most dangerous AP, with
explosive properties (bang and/or inflammation) observed from as little as 2 J of impact
energy. TPDOH was the second most dangerous AP with an explosive effect observed
from impact energies of 7.5 J and higher. Both TPD and TPDOH were concluded to be
dangerous and cautious handling care was needed. TPDCOOH, the AP which showed
the best adhesive results, showed no impact sensitivity at the energies tested. Therefore,
in accordance with this test, further tests and formulations containing TPDCOOH would
be recommended (when used as pure molecules). However, it should be noted that the
impact sensitivity may be different once the AP is grafted to a surface.
Table 8.19: The impact sensitivity results from each AP.
8.5.6 Formulation into Coatings
Further work was begun to investigate possible TPD modifications that could be used in
the waterborne basecoat formulation. Trimeric isocyanates are often found in automo-
tive coatings as a cross-linker. Therefore, an idea of reacting three equivalent TPDOH
225

molecules with one equivalent of trimeric isocyanate to form the structure shown in Fig-
ure 8.34 was formed (a known reaction between an isocyanate and an alcohol to form a
urethane bond), with the future scope of formulating the structure into the basecoat.
+ Stir at RT
Figure 8.34: The reaction of trimeric isocyanate with three equivalents of TPDOH.
IR spectroscopy was used to monitor the reaction using characteristic bands which
were monitored over time. Bands due to the urethane bond (-NH-COO-)that was formed
between the OH of TPDOH and the C=O of NCO increased over time, and bands due to
the NCO decreased over time as the reaction progressed, as shown in Figure 8.35. After
96 h of stirring the reaction at room temperature, the IR spectrum showed evidence of the
desired structure, although the reaction had not gone to completion. The structure was
further verified with 1H NMR (400 Mz, CDCl3):δ 7.51 (1H, d), 7.26 (1H, d), 6.38 (1H, s),
5.10 (2H, s), 3.85 (2H, t), 3.38 (2H, t), 1.63 (4H, m), 1.41 (4H, t), which contained the extra
features due to the addition of TPDOH compared to the 1H NMR of the starting trimeric
isocyanate: δ 3.84 (2H, t), 3.37 (3H, t), 1.64 (4H, m), 1.40 (4H, m). Mass spectrometry
was not measured but it could be in future work to further verify the structure that had
been formed and confirm that it wasn’t two separate molecules of TPDOH and trimeric
isocyanate that were being measured.
226

The resulting solution after 96 h was applied as a primer layer to a TPO/0 substrate
using a doctor blade for a provisional adhesion test. The primer was then cured with
UV at 1900 mJ cm−2 before the subsequent basecoat and clearcoat were applied and
thermally cured. After 7 days, a CHT was performed on 5 areas of the coated substrate,
which all gave a grading of 0, comparable to that of the flame and CPO standard. This
was a very positive result, being the last adhesion test performed in the duration of this
project, and providing a future pathway for integrating a TPD structure into the basecoat
formulation. Further work would be to check reproducibility of this test, optimise the
reaction rate between trimeric isocyanate and TPDOH, and to test the formulation with
a spray gun application and a SJT, firstly as a primer, and secondly after formulating
it into the basecoat. It would first be tested as a direct additive in the basecoat, but in
the event that it would react with the basecoat before reaching the substrate interface
causing bad adhesion, encapsulation mechanisms would be investigated to prevent this.
isocyanates
(of trimer)
Aliphatic hydrocarbons
CF3
From TPDOH
TPDOH + HI 100, 0h TPDOH + HI 100, 96h
3500 3000 2500 2000 1800 1600 1400 1200 1000 800 600
wavenumber (cm-1)
0.0
-0.2
1.2
1.0
0.8
0.6
0.4
0.2
Abso
rban
ce
Figure 8.35: The reaction of HDI trimeric isocyanate with three equivalents of TPDOH,monitored by IR spectroscopy at 0h and after 96h of stirring at room temperature.
227

8.6 Conclusions
It was hypothesised in Chapter 7 that two curing conditions, 100 ◦C for 30 minutes and
1900 mJ cm−2 of UV, would give the best adhesion results due to their higher grafting
efficiency, compared to the other conditions tested. However, for both the doctor blade
and spray gun application methods, poor adhesion was obtained for thermal curing. The
best adhesion results were obtained for UV curing, particularly at higher intensities when
using the doctor blade.
The hypothesis of a higher polar contribution of surface energy from a grafted surface,
comparable to the waterborne basecoat, leading to improved adhesion was found to be
false. It was found in some cases that ungrafted AP at the surface of a substrate caused
a high polar component of the surface energy to be measured, however, adhesive failure
at the substrate/AP primer interface occurred due to the lack of bonding.
It was also hypothesised in Chapter 7 that TPDCOOH would give greater adhesion
results than TPD or TPDOH, due to the higher grafting efficiency observed. Although
the doctor blade application could not distinguish so well between TPDCOOH and TP-
DOH, the spray gun application method showed that TPDCOOH gave significantly better
adhesion results than TPDOH. This was not expected from the UV-Vis kinetics study
which revealed TPDOH reacted on a faster time scale than TPDCOOH. However, it was
thought that either the higher volatility of TPDOH caused evaporation during the graft-
ing stage which lead to a decreased adhesion, or the reaction rate was too fast for CH
insertion reactions to occur with the substrates.
A difference in optimal AP concentration was observed when using the doctor blade,
which showed that a higher concentration of TPDCOOH lead to greater adhesion. How-
ever, a greater adhesion was obtained at lower UV intensities and lower AP concentrations
for the spray gun compared to the doctor blade application method. It was thought that
this was due to the improved coatings quality generated by the spray gun method, which
lead to homogeneous layers.
228

The wet-on-wet application method with the basecoat, as well as the introduction of a
washing step after curing of the AP primer, were also tested but were found to give poor
adhesion results.
TPD gave poor adhesion results in all cases due to the lack of hydrophilic functional
group available to H-bond to the waterborne basecoat.
The industrial applicability study revealed that TPDCOOH was the safest AP to
handle and it decomposed the least when stored in solution, making it the ideal AP
out of TPDOH and TPD. However, TPDOH was successfully modified with a trimer
isocyanate to give a new AP as a possible additive (based on already used additives) to
go into a basecoat formulation, which gave promising CHT results. Synthesis of TPD was
successful, however it would have to be further optimised for successful industrial scale-up
and to make it more cost-effective than a flame pre-treatment or CPO state of the art
alternative.
229

Chapter 9
MODELLING ADHESION RESULTS
9.1 Overview
An overview of this chapter to guide the reader through the results is shown in Figure 9.1.
The main focus of this chapter was to test hypotheses claimed in Chapter 5. A statistical
study was performed to assess the effect of different variables on the adhesion results
obtained from the newly grafted TPDCOOH and TPDOH surfaces after a waterborne
basecoat and clearcoat had been applied and cured.
9.2 Introduction
A statistical study was made to investigate the effect of various parameters on the adhesion
of the basecoat/clearcoat to the TPDCOOH or TPDOH-grafted substrates. Based on the
hypotheses stated in Chapter 5, conclusions could be made stating the most influential
parameters that affected the adhesion measured.
9.3 Exploratory Data Analysis
Exploratory data analysis (EDA) was used to look at relationships between numerical
data and categorical data, shown in Tables 4.3 - 4.5 (described in Appendix 10.N).
230

Modelling Adhesion Results
Correlation Analysis
Pearson Correlation
Between All Data
Spearman Correlation
Between Data Excluding Outliers
Boxplots
ANOVA
Significance of Variance in Data
Kruskal-Wallis
Modelling
Adhesion Results
Step-wise Least Squares
Quantify Effects of Variables on
Adhesion Results
Theme Topics Measurements Knowledge Gained
Figure 9.1: A summary of the chemical adhesion tests chapter.
Firstly, to understand the mutual dependencies of all numerical variables, Pearson
and Spearman correlation analysis was used, in which no hypothesis or assumptions were
made, only pure data analysis to look for the greatest contributing factors. Secondly, the
correlation between the numerical variables measured and the adhesion results from both
the CHT and the SJT were analysed.
ANOVA and Kruskal-Wallis tests were also performed, to explore and understand the
relationship between lead responses and potential categorical factors (text based) xi using
boxplots.
9.3.1 Pearson and Spearman Correlation Analysis
Pearson correlation took into account all data including possible outliers and produced
a line of best fit for all the data present, whereas the Spearman correlation didn’t take
into account outliers. No large differences between the regression coefficients from both
methods were calculated.
231
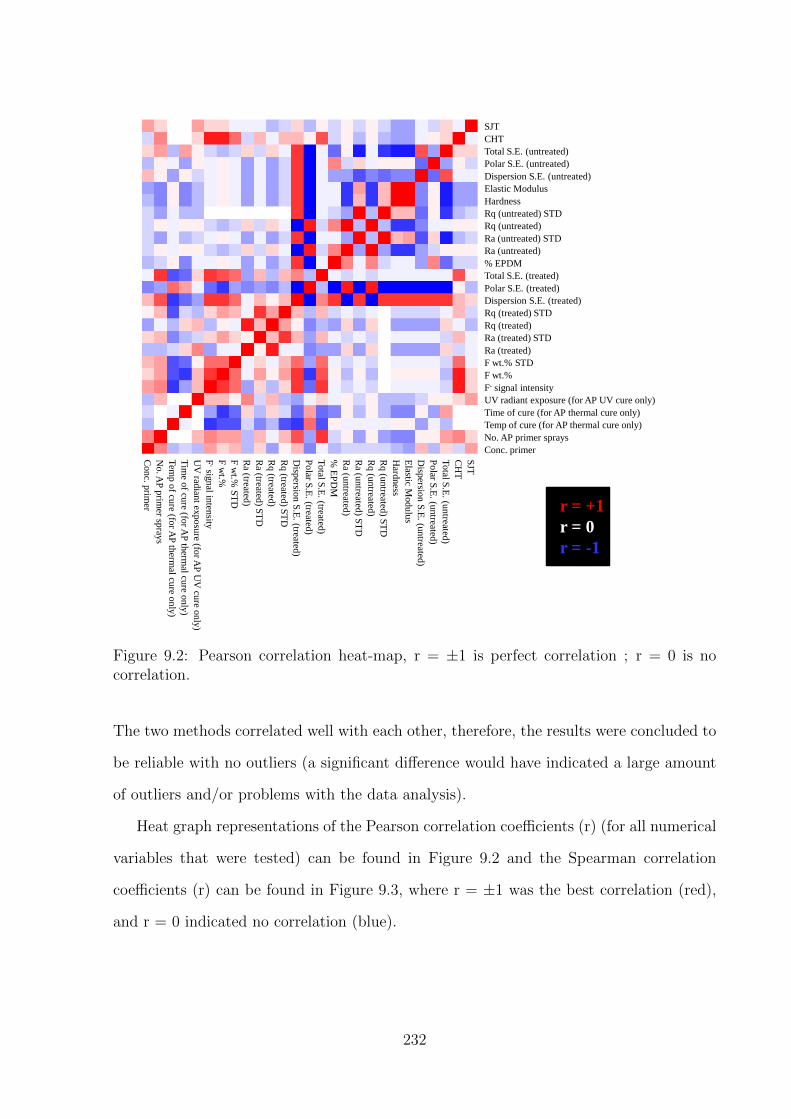
r = +1
r = 0
r = -1
SJT
CH
T
To
tal S.E
. (un
treated)
Polar S
.E. (u
ntreated
)
Disp
ersion S
.E. (u
ntreated
)
Elastic M
odulu
s
Hard
ness
Rq (u
ntreated
) ST
D
Rq (u
ntreated
)
Ra (u
ntreated
) ST
D
Ra (u
ntreated
)
% E
PD
M
Total S
.E. (treated
)
Polar S
.E. (treated
)
Disp
ersion S
.E. (treated
)
Rq (treated
) ST
D
Rq (treated
)
Ra (treated
) ST
D
Ra (treated
)
F w
t.% S
TD
F w
t.%
F- sig
nal in
tensity
UV
radian
t exposu
re (for A
P U
V cu
re only
)
Tim
e of cu
re (for A
P th
ermal cu
re only
)
Tem
p o
f cure (fo
r AP
therm
al cure o
nly
)
No. A
P p
rimer sp
rays
Co
nc. p
rimer
SJT
CHT
Total S.E. (untreated)
Polar S.E. (untreated)
Dispersion S.E. (untreated)
Elastic Modulus
Hardness
Rq (untreated) STD
Rq (untreated)
Ra (untreated) STD
Ra (untreated)
% EPDM
Total S.E. (treated)
Polar S.E. (treated)
Dispersion S.E. (treated)
Rq (treated) STD
Rq (treated)
Ra (treated) STD
Ra (treated)
F wt.% STD
F wt.%
F- signal intensity
UV radiant exposure (for AP UV cure only)
Time of cure (for AP thermal cure only)
Temp of cure (for AP thermal cure only)
No. AP primer sprays
Conc. primer
Figure 9.2: Pearson correlation heat-map, r = ±1 is perfect correlation ; r = 0 is nocorrelation.
The two methods correlated well with each other, therefore, the results were concluded to
be reliable with no outliers (a significant difference would have indicated a large amount
of outliers and/or problems with the data analysis).
Heat graph representations of the Pearson correlation coefficients (r) (for all numerical
variables that were tested) can be found in Figure 9.2 and the Spearman correlation
coefficients (r) can be found in Figure 9.3, where r = ±1 was the best correlation (red),
and r = 0 indicated no correlation (blue).
232

r = +1
r = 0
r = -1
SJT
CHT
Total S.E. (untreated)
Polar S.E. (untreated)
Dispersion S.E. (untreated)
Elastic Modulus
Hardness
Rq (untreated) STD
Rq (untreated)
Ra (untreated) STD
Ra (untreated)
% EPDM
Total S.E. (treated)
Polar S.E. (treated)
Dispersion S.E. (treated)
Rq (treated) STD
Rq (treated)
Ra (treated) STD
Ra (treated)
F wt.% STD
F wt.%
F- signal intensity
UV radiant exposure (for AP UV cure only)
Time of cure (for AP thermal cure only)
Temp of cure (for AP thermal cure only)
No. AP primer sprays
Conc. primer
SJT
CH
T
To
tal S.E
. (un
treated)
Polar S
.E. (u
ntreated
)
Disp
ersion S
.E. (u
ntreated
)
Elastic M
odulu
s
Hard
ness
Rq (u
ntreated
) ST
D
Rq (u
ntreated
)
Ra (u
ntreated
) ST
D
Ra (u
ntreated
)
% E
PD
M
Total S
.E. (treated
)
Polar S
.E. (treated
)
Disp
ersion S
.E. (treated
)
Rq (treated
) ST
D
Rq (treated
)
Ra (treated
) ST
D
Ra (treated
)
F w
t.% S
TD
F w
t.%
F- sig
nal in
tensity
UV
radian
t exposu
re (for A
P U
V cu
re only
)
Tim
e of cu
re (for A
P th
ermal cu
re only
)
Tem
p o
f cure (fo
r AP
therm
al cure o
nly
)
No. A
P p
rimer sp
rays
Co
nc. p
rimer
Figure 9.3: Spearman correlation heat-map, r = ±1 is perfect correlation ; r = 0 is nocorrelation.
For some of the variables, the standard deviation (STD) was also included in the
analysis. It was hypothesised that a correlation between the adhesion results and the
variation of a variable across the substrate would indicate significance. For example, the
substrate roughness was measured on an area of 120 x 90 µm, 10 times on different areas
of the surface. The standard deviation of the 10 measurements would therefore indicate
if there was greater deviance of the roughness over the whole substrate, which could have
influenced the adhesion (where an AP could penetrate into some areas of the substrate
at a greater rate than other areas).
233

The list of the top ten variables with the greatest Pearson and Spearman correlation
coefficient values, indicating the greatest influence on the CHT and SJT results, can
be found in Apendix 10.L. The highest correlation coefficients from the Spearman and
Pearson analysis for correlation between the variables and the CHT results are shown in
the radar graph in Figure 9.4.
It was found that the CHT results correlated the best with the F wt.% from the
XPS data (Spearman r = 0.849, Pearson r = 0.875) and the F− intensity from the ToF-
SIMS data (Spearman r = 0.810, Pearson r = 0.875). Both these measurements represent
the amount of TPD/TPDOH/TPDCOOH grafted onto the substrate surface. Therefore,
transitivity occurred, meaning the F wt.% and the F− intensity correlated with each other.
This can be seen in the area of red squares where these variables crossover in Figure 9.2
and Figure 9.3, representing this correlation.
0
0.1
0.2
0.3
0.4
0.5
0.6
0.7
0.8
0.9
F- Intensity
F wt.%
F wt.% STD Total S.E.
(treated)
No. Primers
sprayed
Spearman
Pearson
Figure 9.4: Radar graph showing greatest Spearman and Pearson correlation coefficientsfor the CHT, where r = ±1 is perfect correlation ; r = 0 is no correlation.
234

Another variable with a correlation coefficient greater than 0.5 included the STD of
the F wt.%. The greater CHT results were achieved for homogeneously covered surfaces
(represented by a lower STD) whereas the lower CHT results were obtained from inhomo-
geneous surfaces (represented a higher STD) due to the areas of non-interaction (where
no was AP present) which resulted in delamination. The total surface energy after the
AP application (greater adhesion observed for a greater surface energy) and number of
AP primer spray applications (the thicker the AP primers had greater CHT results) were
also found to significantly correlate with the CHT results.
Another variable in the top 10 correlation coefficients for the CHT was called the
observation number. As part of the analysis, this number was included automatically. It
was simply a number assigned in ascending order (starting at one) to each of the variables
in the given data for analysis. Therefore, it represented a type of time scale which usually
would allow for identification of experimental errors over time (for example, if the efficiency
of a spectrometer depreciates with time, it would be identified from a correlation between
the observation number and the spectrometer output). However, due to a slicing of data,
the observation number was not useful in this study because the experimental variables
were decreased with time as the conditions found to give poor adhesion were eliminated.
Therefore, an increase of the CHT results was automatically correlated to the observation
number. Future work could be to measure the variables for all of the data, to make the
observation number a useful parameter and allow for identification of such errors on a
time scale.
The top correlation coefficients from the Spearman and Pearson analysis looking at
the SJT results are shown in the radar graph in Figure 9.5. The correlation coefficients
from both the Spearman and Pearson analysis were less than 0.5, lower than that of
the analysis of the CHT results. This was not unexpected for the SJT results, which
were known for difficult reproducibility (the reproducibility tests in Chapter 8 gave values
within ± 2 gradings), particularly at high pressures.87 However, there was some evidence
of correlation. The UV radiant exposure gave the best correlation (Spearman r = 0.395,
235
Pearson r = 0.398) between the SJT results and the variables measured. In general, a
larger radiant exposure gave better adhesion results due to a greater grafting efficiency of
the AP to the surface which resulted in greater adhesion to the waterborne basecoat.
The AP concentration and F− intensity (from ToF-SIMS data) were found to give
correlation coefficients of ∼ 0.3. The higher AP concentration lead to a greater F− inten-
sity, which then lead to greater adhesion due to the higher interactions between the AP
grafted to the surface and the waterborne basecoat. The Young’s modulus and substrate
hardness gave negative correlation coefficients of ∼ -0.3, because a lower Young’s modulus
and a lower substrate hardness gave greater adhesion results. Therefore, the hypothesis
stated in Chapter 5, claiming a substrate of lower hardness and Young’s modulus values
was predicted to improve adhesion, was correct. This was also discussed in Appendix
10.F.3, where it was suggested an AP could penetrate into substrates of lower hardness
and Young’s modulus values (corresponding to a lower crystallinity) at a faster rate than
a harder and higher modulus substrate. Therefore, the AP could have improved adhesion
via a physical entanglement mechanism with the substrate polymers, or the penetration
of the AP into the surface could have increased the contact area between the AP and the
waterborne basecoat, improving the adhesion by a greater number of chemical bonds to
the surface via covalent bonding, thus increasing the reactions or interactions with the
basecoat.
236

0.0
0.1
0.2
0.3
0.4
UV radiant
exposure
AP conc.
F- Intensity Elastic
Modulus
Hardness
Spearman
Pearson
Figure 9.5: Radar graph showing greatest Spearman and Pearson correlation coefficientsfor the SJT, where r = ±1 is perfect correlation ; r = 0 is no correlation. Note: ElasticModulus and Hardness are negative correlation coefficients.
9.3.2 Boxplots: Understanding and Exploring the Relationship
between Lead Responses and Potential Categorical Fac-
tors Xi
As described in Section 4.35.2, two analysis methods were used to perform a statistical
analysis on categorical data (text): ANOVA where the ANOVA.F parameter was mea-
sured and the Kruskal-Wallis test where the kruskal.p parameter was measured, to assess
the effect of xi (categorical factors) on yj (lead responses, CHT and SJT results) and
determine which levels varied the most significantly between the factors (the levels and
factors are described in Figure 4.14).
237
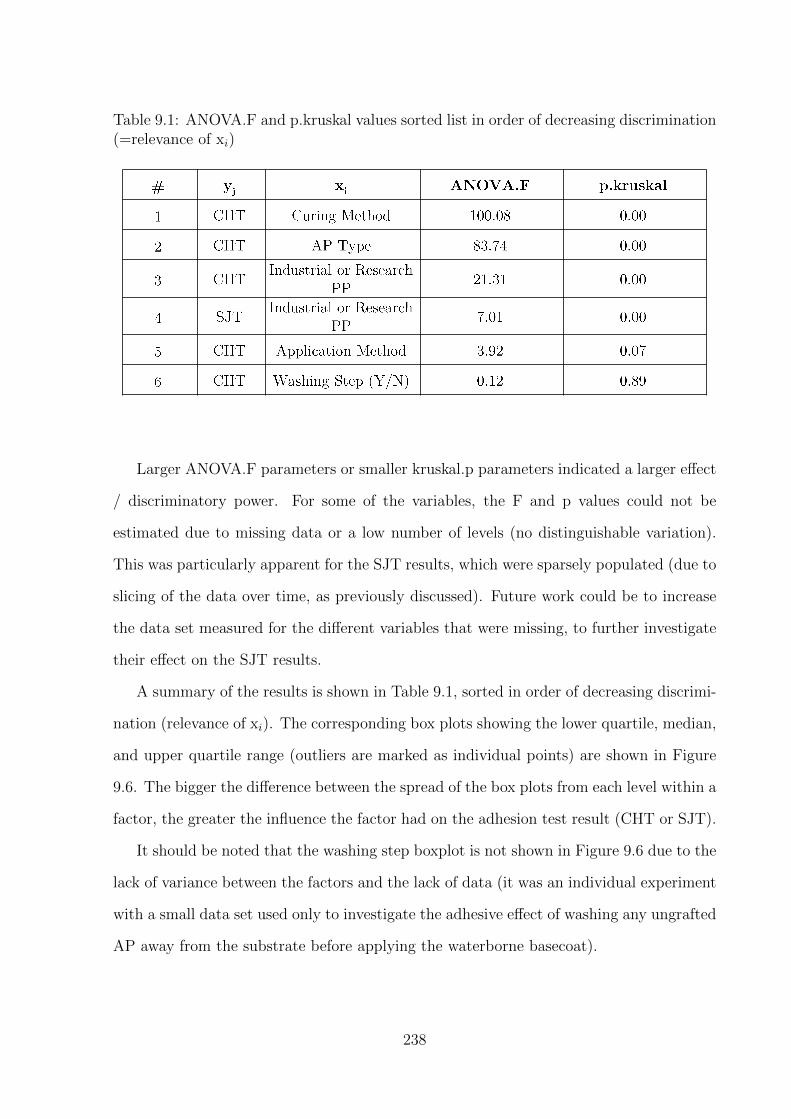
Table 9.1: ANOVA.F and p.kruskal values sorted list in order of decreasing discrimination(=relevance of xi)
Larger ANOVA.F parameters or smaller kruskal.p parameters indicated a larger effect
/ discriminatory power. For some of the variables, the F and p values could not be
estimated due to missing data or a low number of levels (no distinguishable variation).
This was particularly apparent for the SJT results, which were sparsely populated (due to
slicing of the data over time, as previously discussed). Future work could be to increase
the data set measured for the different variables that were missing, to further investigate
their effect on the SJT results.
A summary of the results is shown in Table 9.1, sorted in order of decreasing discrimi-
nation (relevance of xi). The corresponding box plots showing the lower quartile, median,
and upper quartile range (outliers are marked as individual points) are shown in Figure
9.6. The bigger the difference between the spread of the box plots from each level within a
factor, the greater the influence the factor had on the adhesion test result (CHT or SJT).
It should be noted that the washing step boxplot is not shown in Figure 9.6 due to the
lack of variance between the factors and the lack of data (it was an individual experiment
with a small data set used only to investigate the adhesive effect of washing any ungrafted
AP away from the substrate before applying the waterborne basecoat).
238

Spray
Doctor Blade
UV
Thermal
Wet-on-Wet
0
20
40
60
80
10
0
TPDOH
TPDCOOH
TPD
0
20
40
60
80
10
0
Research
Industrial
0
20
40
60
80
10
0
Research
Industrial
0
20
40
60
80
10
0
0
20
40
60
80
10
0
(a) (b)
(c) (d) (e)
CHT Adhesion (%) CHT Adhesion (%)
CHT Adhesion (%) SJT Adhesion (%) CHT Adhesion (%)
Figure 9.6: Boxplots of (a) CHT vs Cure Method [ANOVA.F = 100.0835, p.kruskal =0], (b) CHT vs AP Type [ANOVA.F = 83.7393, p.kruskal = 0], (c) CHT vs SubstrateType [ANOVA.F = 21.3075, p.kruskal = 0], (d) SJT vs Substrate Type [ANOVA.F =7.0076, p.kruskal = 0.003] and (e) CHT vs AP Application Method [ANOVA.F = 3.9211,p.kruskal = 0.889].
The AP type and curing method were found to have the greatest influence on the CHT
results out of the five factors shown in Figure 9.6. In order of decreasing CHT results
(decreasing adhesion), where n = sample size:
• AP Type: TPDCOOH (Sample size, n=155) � TPDOH(n=115) ≈ TPD(n=9)
• Curing Method: UV(n=164) � Thermal(n=112) ≈ Wet-on-Wet(n=3)
Although slicing of data resulted in samples of different sizes for each level, the vari-
ance was observable. The difference between the curing methods was visually evident
during the adhesion testing, when it was observed that thermal curing and applying wet-
on-wet were unsuccessful compared to UV curing, which the statistical analysis further
confirmed. The analysis also confirmed that the TPDCOOH AP produced better adhesion
results than TPDOH and TPD (although poor adhesion was expected for TPD due to
239

the lack of polar sites for hydrogen bonding to the waterborne basecoat). The difference
between TPDOH and TPDCOOH could be explained by the difference in the number
of sites available for hydrogen bonding to the waterborne basecoat, as shown in Figure
9.7. TPDOH has just one donor site (H) and one acceptor site (O) whereas TPDCOOH
has one donor site (H) and three acceptor sites (C=O x2 and O). Therefore, TPDCOOH
could potentially have double the interaction of TPDOH with the waterborne basecoat,
thus better adhesion.
(a) (b)
Figure 9.7: Schematic diagram highlighting the donor and acceptor sites for H-bondingfor (a) carboxylic acids and (b) alcohols.
9.4 Stepwise Ordinary Least Squares (stepOLS)
StepOLS was used to estimate and quantify the effects of the potential predictors xi on
the major responses: the CHT and SJT results, based on yj=gj(xi). All x variables with
missing data were omitted and the software automatically removed parameters that had
no correlation. The x variables were tested for their individual influence on CHT and SJT
results, as well as the combined influence with other x variables to test their interaction.
All data was standardised by subtracting the mean value and dividing by the standard
deviation.
240
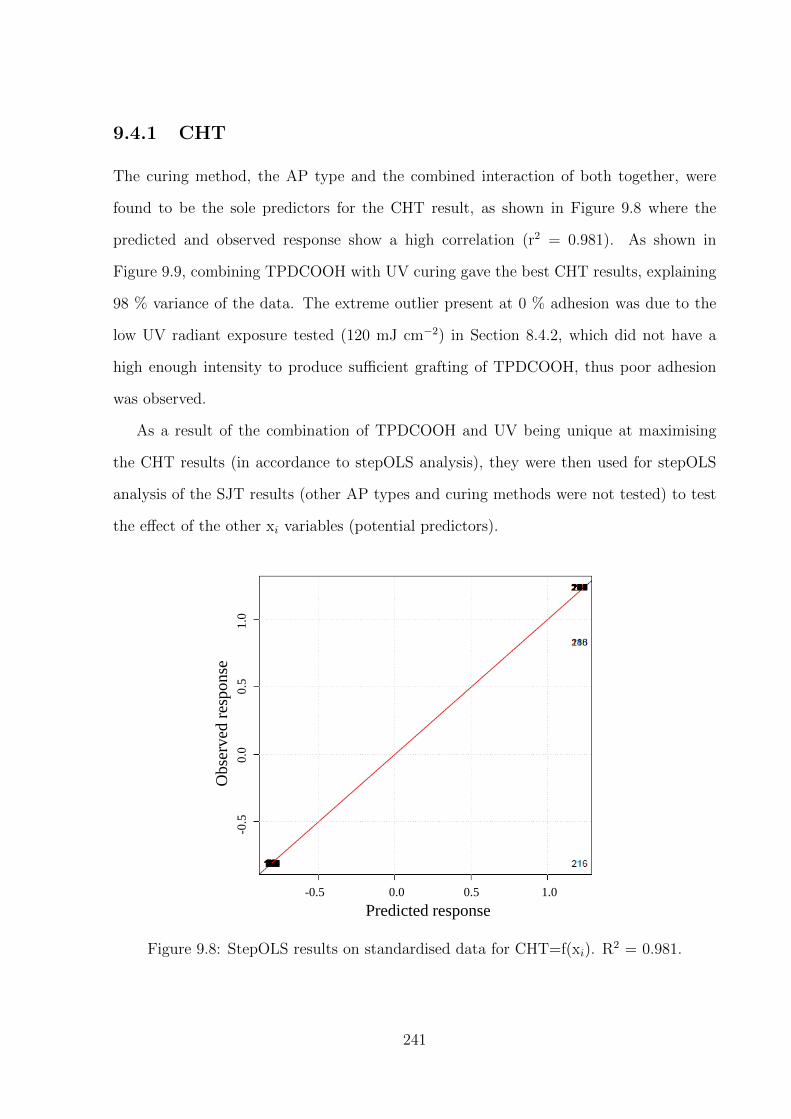
9.4.1 CHT
The curing method, the AP type and the combined interaction of both together, were
found to be the sole predictors for the CHT result, as shown in Figure 9.8 where the
predicted and observed response show a high correlation (r2 = 0.981). As shown in
Figure 9.9, combining TPDCOOH with UV curing gave the best CHT results, explaining
98 % variance of the data. The extreme outlier present at 0 % adhesion was due to the
low UV radiant exposure tested (120 mJ cm−2) in Section 8.4.2, which did not have a
high enough intensity to produce sufficient grafting of TPDCOOH, thus poor adhesion
was observed.
As a result of the combination of TPDCOOH and UV being unique at maximising
the CHT results (in accordance to stepOLS analysis), they were then used for stepOLS
analysis of the SJT results (other AP types and curing methods were not tested) to test
the effect of the other xi variables (potential predictors).
Ob
serv
ed r
esp
on
se
Predicted response
-0.5 0.0 0.5 1.0
-0.5
0
.0
0
.5
1
.0
Figure 9.8: StepOLS results on standardised data for CHT=f(xi). R2 = 0.981.
241

App. Wet_TPDCOOH
App. Wet_TPDOH
Thermal_TPD
Thermal_TPDCOOH
Thermal_TPDOH
UV_TPD
UV_TPDCOOH
UV_TPDOH
0
20
40
60
80
10
0
cure.prom ~ cht; prob.kruskal=0; F=303.7315
1
2
6
52
54
3
102
59UV, TPDOH
UV, TPDCOOH
UV, TPD
Thermal, TPDOH
Thermal, TPDCOOH
Thermal. TPD
Wet-on-Wet, TPDOH
Wet-on-Wet, TPDCOOH
0
20
40
60
80
10
0
CHT Adhesion (%)
Figure 9.9: Boxplot of CHT vs the combined interaction between the cure method andthe AP type [ANOVA.F = 303.7315, p.kruskal = 0]. The combination of TPDCOOH andUV was unique at maximising the CHT result in accordance with stepOLS analysis. Thered numbers display the number of results for each variable.
9.4.2 SJT
The x variables that contained only one level or had missing data were omitted (due
to the lack of variance). The modelling of the SJT results was not as successful as the
CHT results, explaining only 34 % variance in the data. It was thought that it was due
to the lack of data and/or the unreliable nature of the SJT (difficult reproducibility).
Another plausible reason for the difference could be due to the adhesion mechanism. The
CHT measures adhesive forces whereas the SJT measures energy dissipation. The AP
concentration, the number of AP layers applied, the UV radiant exposure, as well as the
interaction between the number of AP layers applied and the UV radiant exposure, were
found to show some significance and a non-linear trend, as shown in Figure 9.10.
242

Obse
rved
res
ponse
Predicted response
-1.0 -0.5 0.0 0.5 1.0 1.5
-0.5
0
.0
0.5
1
.0 1
.5 2
.0
2.5
3.0
Figure 9.10: stepOLS results on standardised data for SJT=f(xi). R2 = 0.34 (non-linear).
The interaction can be explained in terms of UV intensity, where a higher UV intensity
(radiant exposure) would be able to penetrate a thicker AP layer and induce more re-
actions of the AP to the substrate surface, hence improving adhesion. Whereas a lower
intensity would not be able to penetrate an AP layer of the same thickness at the same
rate, thus the rate of reaction would be slower (poorer adhesion). Therefore, it was sug-
gested that the ability of the UV to penetrate the AP layer was an influencing factor
determining the adhesion results obtained.
Figure 9.11 shows a trellis plot that shows the interaction between the SJT results, the
number of AP layers applied, the UV radiant exposure as well as the AP concentration. A
high SJT was achieved by applying a high number of AP primer sprays and using a high
UV radiant exposure. The third plot (RHS) shows that the maximum SJT was achieved
at the highest concentration of the AP tested.
243

(a) (b)
(c)
SJT SJT SJT
UV
Radiant
Exposure
UV
Radiant
Exposure
No.
AP Primer
Sprays
No.
AP Primer
Sprays
No.
AP Primer
Sprays
UV
Radiant
Exposure
Figure 9.11: A trellis plot showing standardised correlation between the SJT results andthe UV radiant exposure, number of primer sprays for varying concentration: (a) Lowconcentration, (b) middle concentration and (c) high concentration.
9.5 Conclusions
Statistical modelling was successfully implemented to learn the main contributing factors
that affected the adhesion results obtained.
Several hypotheses were made in Chapter 5 to predict the adhesion properties of the
studied substrates based on their characterisation. The statistical modelling enabled the
following conclusions of each stated hypothesis:
• Research substrates with EPDM present at the surface: the AP is able to penetrate
into the EPDM domains causing polymer chain entanglement (mechanical adhesion
mechanism)
6 The industrial substrates were found to give greater adhesion results than the
research substrates, therefore, the EPDM at the surface of a substrate did not seem
to have a significant effect on the adhesion.
• TPO/20 substrate during thermal curing: EPDM migrates to the substrate surface,
allowing the AP to penetrate into the EPDM domains, causing polymer chain en-
tanglement (mechanical adhesion mechanism)
6 The % EPDM did not come up as a main factor affecting the adhesion results,
and furthermore the thermal curing did not produce any positive adhesion results.
Therefore, it was assumed that EPDM migration did not significantly influence the
244

adhesion.
• Substrates containing EPDM or additives: creates a higher surface roughness which
allows for a higher contact area between the substrate and AP / basecoat, or sub-
strates have a lower hardness and Young’s modulus to allow an AP to penetrate into
the substrate surface causing a polymer chain entanglement (mechanical adhesion
mechanism)
4 The surface roughness was found not be a significant contributing factor. How-
ever, the softness and low modulus caused by the EPDM and other additives in the
substrates were found to play a significant role in the improvement of adhesion.
• Substrates with CaCO3 and talc present at the surface: chemical reactions or inter-
actions with the AP or basecoat (chemical adhesion mechanism)
6 A distinct difference between the industrial substrates was not made when explor-
ing the correlation of properties with the adhesion results, therefore, it was assumed
no chemical reactions occurred with the additives.
• Substrates without the Irgafos 168 additive present at the surface: its hydrophobic
and bulky nature causes steric hindrances with the AP or basecoat
6 The irgafos 168 additive did not appear to have an effect since it was observed
that adhesion was improved on the industrial substrates compared to the research
substrates.
• TPO substrates: they have a lower hardness and Young’s modulus, which enables
the AP, solvent or basecoat to penetrate into substrate surface allowing a higher
contact area and greater interactions, or the anchoring of an AP into the substrate
causing polymer chain entanglement (mechanical adhesion mechanism)
4 Industrial TPO substrates were found to have better adhesion results than the
research substrates. It was assumed that the significantly softer and low modulus
properties of these substrates resulted in the penetration and perhaps anchoring of
the AP, which generated greater interactions with the basecoat.
245

• Substrates cleaned with an abrasive method: creates a higher surface roughness
allowing for a higher contact area between the substrate and the AP or basecoat
6 All washings steps that were implemented caused delamination of the coatings.
It was thought to be due to contamination of the solvent, which would hinder any
effects of an increase in surface roughness.
Based on the hypotheses above, the physical properties of the substrates appeared to
have the greatest influence on the adhesion results obtained, such as substrate roughness,
hardness and modulus. One can draw the conclusion that the EPDM content of the
substrate only appeared to influence the adhesion by increasing the surface roughness
along with other additives present. Therefore, a molecular chain entanglement theory,
suggested by Ryntz et al28,45,64,67,69,74 for the adhesion of a CPO, did not seem to be a
main contributing factor in this study.
The modelling of the CHT results was more successful than the SJT results. The
AP type and curing method were found to be the sole predictors for the CHT results,
explaining 98 % of the data. The concentration of the AP, the number of AP primers
applied and the UV radiant exposure were found to be the greatest influence on the SJT
results, explaining only 34 % of the data. Other experimental measurements which were
found to have an effect the adhesion results were:
• F− intensity (from ToF-SIMS data)
• F wt.% (from XPS data)
• F wt.% STD (from XPS data)
• Total surface energy (from OW theory)
• Substrate Young’s modulus (from nano-indentation data)
• Substrate hardness (from nano-indentation data)
246

Part IV
Final Conclusions and Future Work
247

This project achieved its goal of identifying novel candidate APs for improving the
adhesion of a waterborne basecoat to an untreated PP-based substrate. A summary of
the results chapters can be found in Figure 9.12. The first stage of the overall objective
was achieved, as shown by stages 1 - 3 in Figure 9.13.
In a previous study by Hintze-Bruning et al.,107 it had been found that nitrogen
analogues to carbenes, known as nitrenes, formed from linear azido functional groups
were unsuccessful at promoting adhesion via CH-insertion reactions. However, the APs
identified in this study were diazirine-based carbene precursors (three-membered ring
functional groups) which were able to C-H insert into the substrate surface under the
correct curing conditions. Therefore, this study proved that adhesion promotion was
possible via C-H insertion.
The main contributing factors found to influence the adhesion results obtained, were
the AP type, the curing method used, the UV intensity (when UV curing was used) and
the concentration of the AP, both in terms of the solution concentration or the number
of primer layers applied.
Substrate Characterisation:
Adhesion Hypotheses
Adhesion:
Polymer Chain Entanglement
Proof-of-Concept
Adhesion:
Covalent Bonding
Proof-of-Concept
(Patent Pending)
Adhesion Tests
Modelling:
Greatest Influences on
Adhesion
Figure 9.12: A summary of the results chapters, highlighting the flow of the work and theinteractions between the chapters.
248

The best adhesion results were obtained with UV curing, which caused diazirine car-
bene precursors to covalently bond to the substrate surface, and adhere to the waterborne
basecoat through H-bonding between hydrophilic functional groups on the AP as well as
the basecoat. The best AP was found to be TPDCOOH, which also demonstrated the
best industrial applicability properties.
To better implement TPDCOOH into the industrial coating production line, future
work could be to test alternative basecoats and topcoats which are cured via UV rather
than thermally. This would then reduce the number of curing steps in the production
line, as shown in Figure 1.4.
Alternatively, future work could include optimising TPDCOOH, or other candidate
APs, for thermal curing. The AP could then be implemented into the production step
currently studied without the need for the extra UV curing step. This work would include
optimising the molecular structure of the AP, so that it is reactive enough at 80 ◦C, but
stable enough to store and use safely. The possibility of higher curing temperatures to
increase the reactivity of the AP could also be explored, however, the range to which
one could increase the temperature would be limited due to the melting point of the
substrates, which would deform at too high temperatures.
Other future work includes the formulation of the AP into the basecoat, as shown by
step 4 of the overall objective in Figure 9.13. During the last months of this project,
work began to investigate the ability of creating TPD-based structures using additives
already present in the coatings formulation. The trimeric molecule developed in Section
8.5.6 showed a very promising future, producing a CHT results of 0 (100 % adhesion).
Future work would be to perform a SJT (the next level of more rigorous adhesion testing)
to see if the coating could withstand the harsher conditions, and to apply the primer and
coatings using a spray gun application method rather than a doctor blade, for improved
control and homogeneity of the coatings.
The formulation of the TPD-based APs into the basecoat without any protective
layering, could result in unwanted reactions with the pigments and other additives in the
249

basecoat, rather than the substrate surface. Therefore, encapsulation of the APs would
also be a suggested future exploration. The idea would be to have the AP encapsulated,
and the curing step would trigger the release of the AP. Therefore, a time scale would have
to be accounted for to allow the release and the reaction of the AP, and the movement of
the encapsulated AP would have to be accounted for to ensure that the AP is released at
the correct coating/substrate interface (a challenge). For example, a denser encapsulated
AP (compared to the rest of the coating) could migrate to the substrate interface by
gravitational forces, which could be encouraged by higher temperatures which would
decrease the viscosity of the coating and increase the mobility of the AP. Then once
a particular temperature was reached, the thermal release of the AP could be triggered.
Previous work by Overbeek,124 discussed in Section 2.6.2, showed that tailoring polymeric
systems such as using block copolymers, can result in the correct properties and kinetics
to release an AP for successful adhesion. Encapsulation of the TPD based APs could be
developed based on a similar block copolymer system.
An alternative idea is to formulate the basecoat with the AP so that it would self-
stratify without the need for encapsulation. This is when two incompatible polymers are
mixed, and upon an external trigger, they phase separate. In this case, the development
of a coating in which the AP would separate to the substrate/coating interface could be
explored.201,202
1
Identify candidate APs
2
Test adhesion to substrate
3
Test adhesion to basecoat
4
Formulate into basecoat
Figure 9.13: The overall objective of the project, highlighting the goals achieved duringthis study. The technology is patent pending.
250
It should be noted that future work would be likely to concentrate on the development
of APs to be formulated into the basecoat, rather than looking at ways to improve the
adhesion by modifying the substrate formulation. This is due to the industrial nature of
the project, where the company would benefit from a competitive coatings formulation in
the market, and not from a change in the substrate formulation which was manufactured
elsewhere.
The successful adhesion improvement with UV curing could also be implemented into
alternative industries, which often use UV curing. For example, the packaging industry,
which often utilises UV curing,203 had already shown interest in this work and had planned
to do some testing using the results obtained in this study. Therefore, a promising future
was not limited only to the automotive industry.
It was found that the adhesive properties of candidate APs applied to swollen or non-
swollen substrates was poor. It was therefore concluded that under the conditions tested,
adhesion via polymer chain entanglement was unsuccessful.
The results from this study have resulted in a pending patent application, for the use
of TPD derivatives as APs. This signifies the importance and success of this work and its
industrial applicability.
251
Part V
Appendices
252
Chapter 10
SUPPLEMENTARY MATERIAL
253

Appendix 10.A Standard Used for Nanoindentation
0.1
0.11
0.12
0.13
0.14
0.15
0.16
0.17
0.18
0.19
0.2
300 1300 2300 3300 4300
Har
dn
ess
(GP
a)
Displacement Into Surface (nm)
Test 001
Test 002
Test 003
Test 004
Test 005
Test 006
Test 007
Test 008
Average
1.5
1.7
1.9
2.1
2.3
2.5
2.7
2.9
3.1
3.3
3.5
300 1300 2300 3300 4300
Mo
du
lus
(GP
a)
Displacement Into Surface (nm)
0.10
0.11
0.12
0.13
0.14
0.15
0.16
0.17
0.18
0.19
0.20
300 1300 2300 3300 4300
Har
dn
ess
(GP
a)
Displacement Into Surface (nm)
(a)
(b)
Figure 10.1: Graphs of (a) the Young’s modulus profile and (b) the hardness profile ofthe reference material, polycarbonate, over a displacement of 5 µm from the substratesurface.
254
Appendix 10.B Data Interpolation
Data interpolation was performed in Microsoft Excel.139 Interpolation was used to
calculate to the average of the modulus and hardness measurements (experimentally de-
termined in Section 4.4) for a defined displacement range (the displacement range varied
for each measurement, therefore, a defined displacement range was needed to calculate an
average).
The following formula was used in Excel:
=FORECAST(NewX,OFFSET(KnownY,MATCH(NewX,KnownXa,1)-1,0,2),
OFFSET(KnownXb,MATCH(NewX,KnownXa,1)-1,0,2))
Where the NewX was replaced with the cell reference containing the displacement to
interpolate, the KnownXa was replaced with the cell range of experimentally measured
modulus or hardness values, the KnownXb was replaced with the cell reference containing
the first experimentally measured modulus or hardness value and the KnownY was re-
placed with the cell reference containing the first experimentally measured displacement
value. Modulus or hardness values were calculated for a displacement range of 0.3 - 3 µm,
every 50 nm, for 10 measurements from each substrate. Average and standard deviations
were then calculated, and the average modulus and hardness profiles were plotted against
displacement.
255

Appendix 10.C Surface Roughness of Swollen TPO/0
±
±
0
90
0 120
y (μ
m)
x (μm) -2.5
0
2.5
0 90
z (μ
m)
y (μm)
-2.5
0
2.5
0 120
z (μ
m)
x (μm)
-2.5
0
2.5
0 90
z (μ
m)
y (μm)
0
90
0 120
y (μ
m)
y (μm)
±
±
-2.5
0
2.5
0 120
z (μ
m)
x (μm)
Figure 10.2: 2D and 3D images of surface roughness and x and y profiles of TPO/0 after(a) 10 minute swelling time and (b) after it was left to dry for 5 hours.
256

(b)
(a)
±
±
0
90
0 120
y (μ
m)
x (μm)
-2.5
0
2.5
0 90
z (μ
m)
y (μm)
-2.5
0
2.5
0 120
z(μ
m)
x (μm)
±
±
0
90
0 120
y (μ
m)
x (μm)
-2.5
0
2.5
0 90
z (μ
m)
y (μm)
-2.5
0
2.5
0 120
z (μ
m)
x (μm)
Figure 10.3: 2D and 3D images of surface roughness and x and y profiles of TPO/0 after(a) 1 minute swelling time and (b) after it was left to dry for 5 hours.
257

Appendix 10.D Surface Roughness of Swollen R/0
(b)
(a)
0
90
0 120
±
±
-0.2
0
0.2
0 90
z (μ
m)
y (μm)
-0.2
0
0.2
0 120
z (μ
m)
x (μm)
0
90
0 120
±
±
-0.2
0
0.2
0 120
z (μ
m)
x (μm)
-0.2
0
0.2
0 90
z (μ
m)
y (μm)
Figure 10.4: 2D and 3D images of surface roughness and x and y profiles of R/0 after (a)1 minute swelling time and (b) after it was left to dry for 5 hours.
258

Appendix 10.E Surface Roughness of Swollen R/25
(b)
(a)
0
90
0 120
y (μ
m)
x (μm)
±
±
-2.5
0
2.5
0 90
z (μ
m)
y (μm)
-2.5
0
2.5
0 120
z (μ
m)
x (μm)
-2.5
0
2.5
0 120
z (μ
m)
x (μm)
0
90
0 120
y (μ
m)
x (μm)
±
±
-2.5
0
2.5
0 90
z (μ
m)
y (μm)
Figure 10.5: 2D and 3D images of surface roughness and x and y profiles of R/25 after(a) 10 minute swelling time and (b) after it was left to dry for 5 hours.
259

Appendix 10.F Substrate Characterisation
10.F.1 Surface Roughness
As discussed in Section 2.4, the surface roughness of a substrate has been shown to
influence the adhesion of coatings to the substrate surface. A rougher surface has a
greater surface area, thus greater contact between the surface and a coating is achieved
maximising the adhesion interactions.
Figures 10.6 - 10.8 displays the 2D and 3D images of the surface roughness profiles
of all the untreated substrates (both industrial and research). The x and y profiles were
taken from midway across the substrate in both x and y directions. The scale of the x
and y profiles are alike so direct comparisons can be made.
The different surface roughness parameters that were measured are described in Sec-
tion 4.3. The bar graph in Figure 10.9 shows the average Rq values of the different
substrates. The Rq parameter was used for comparing the substrates, because it was
more sensitive to peaks and valleys observed at the surface (due to the squaring of the
amplitude in its calculation), compared to the average roughness (Ra). The results pro-
vide evidence that the surface roughness of a substrate had a strong dependence on it’s
composition.
The smoothest substrate was the R/0, containing PP and no additives other than a
mould releasing agent. The x and y profiles were relatively straight, and the 3D image
looked smooth apart from one peak which may have been caused during the mould release
process. The 2D image showed a mesh-like pattern which may have also been caused from
the mould used.
A clear difference between the surface roughness profile of the R/0 substrate and the
other substrates could be seen. The profile for TPO/0 (Figure 10.6(a)) had a similar
profile to R/20 (Figure 10.8(h)), showing that it was not only the presence of EPDM that
influenced the surface roughness, but also the other additives present in a TPO substrate.
260

This was further verified by the fact that the Ra and Rq values of the TPO/0 substrate
were higher than the TPO/2 and TPO/20.
However, a clear difference in the surface roughness profile was observed as the %
of EPDM increased in the research substrates (Figure 10.7(d)-(f) and 10.8(g)-(i)). The
EPDM caused valleys in the substrate surface which became more frequent as the given
% of EPDM increased, causing an increase in Ra and Rq values. This suggested it was
solely the EPDM that caused the valleys, contrary to findings previously published,66
where it was suggested that the removal of the substrates from the mould in the injection
mould process caused the increase in surface roughness (as the substrates were torn,
creating the craters). Therefore, the EPDM that was identified at the substrate surfaces
in the SEM measurements (Section 5.3), was found to have a significant impact on the
surface roughness. This was likely to be a significant contributing factor to the adhesion
properties of the substrates.
It was hypothesised that substrates containing a higher content of EPDM or additives,
which results in a higher surface roughness, would enable a greater contact area between
the substrate surface and a waterborne coating or AP, resulting in higher adhesive in-
teractions compared to a smoother substrate. Therefore, greater adhesion was expected
for the TPO substrates and higher % EPDM research substrates. Poor adhesion was ex-
pected for the R/0 substrate, which was significantly smoother than the other substrates.
10.F.2 Chemical Composition
10.F.2.1 Microscopy
The chemical nature of each substrate surface will determine the surface energy, as well
any reactions or interactions with the applied basecoat. Therefore, techniques were used
to assess the chemical nature of the substrate surfaces (other than EPDM which was
characterised in Section 5.3) and predict any influences on the adhesive properties.
261

(a)
0
90
0 120 y
(μm
) x (μm)
Ra = 258± 15 nm
Rq= 329 ± 19 nm
-1.8
0
1.8
0 90
z (μ
m)
y (μm)
-1.8
0
1.8
0 120
z (μ
m)
x (μm)
0
90
0 120
y (μ
m)
x (μm)
Ra = 197± 6 nm
Rq= 253 ± 6 nm
-1.8
0
1.8
0 120
z (μ
m)
x (μm)
-1.8
0
1.8
0 90
z (μ
m)
y (μm)
(c)
0
90
0 120
y (μ
m)
x (μm)
Ra = 149 ± 18 nm
Rq= 200 ± 28 nm
-1.8
0
1.8
0 90
z (μ
m)
y (μm)
(b)
-1.8
0
1.8
0 120
z (μ
m)
x (μm)
Figure 10.6: 2D and 3D images of the surface roughness and x and y profiles of (a) TPO/0,(b) TPO/2 and (c) TPO/20 substrates.
262

0
90
0 120
y (μ
m)
x (μm)
Ra = 85 ± 99 nm
Rq= 143 ± 122 nm
-1.8
0
1.8
0 120
z (μ
m)
x (μm)
-1.8
0
1.8
0 90
z (μ
m)
y (μm)
(e)
0
90
0 120
y (μ
m)
x (μm)
Ra = 156 ± 40 nm
Rq= 244 ± 41 nm
-1.8
0
1.8
0 120
z (μ
m)
x (μm)
-1.8
0
1.8
0 90
z (μ
m)
y (μm)
(f)
(d)
0
90
0 120
y (μ
m)
x (μm)
Ra = 16 ± 3 nm
Rq= 21 ± 5 nm
-1.8
0
1.8
0 90
z (μ
m)
y (μm)
-1.8
0
1.8
0 120
z (μ
m)
x (μm)
Figure 10.7: 2D and 3D images of the surface roughness and x and y profiles of (d) R/0,(e) R/5 and (f) R/10 substrates.
263

g(
0
90
0 120
y (μ
m)
x (μm)
Ra = 232 ± 26 nm
Rq= 301 ± 29 nm
-1.8
0
1.8
0 90
z (μ
m)
y (μm)
(g)
-1.8
0
1.8
0 120
z (μ
m)
x (μm)
0
90
0 120
y (μ
m)
x (μm)
Ra = 244 ± 36 nm
Rq= 318 ± 43 nm
h
-1.8
0
1.8
0 90
z (μ
m)
y (μm)
(h)
-1.8
0
1.8
0 120
z (μ
m)
x (μm)
(i)
0
90
0 120
y (μ
m)
x (μm)
Ra = 234 ± 18 nm
Rq= 303 ± 19 nm
-1.8
0
1.8
0 90
z (μ
m)
y (μm)
-1.8
0
1.8
0 120
z (μ
m)
x (μm)
Figure 10.8: 2D and 3D images of the surface roughness and x and y profiles of (g) R/15,(h) R/20 and (i) R/25 substrates.
264
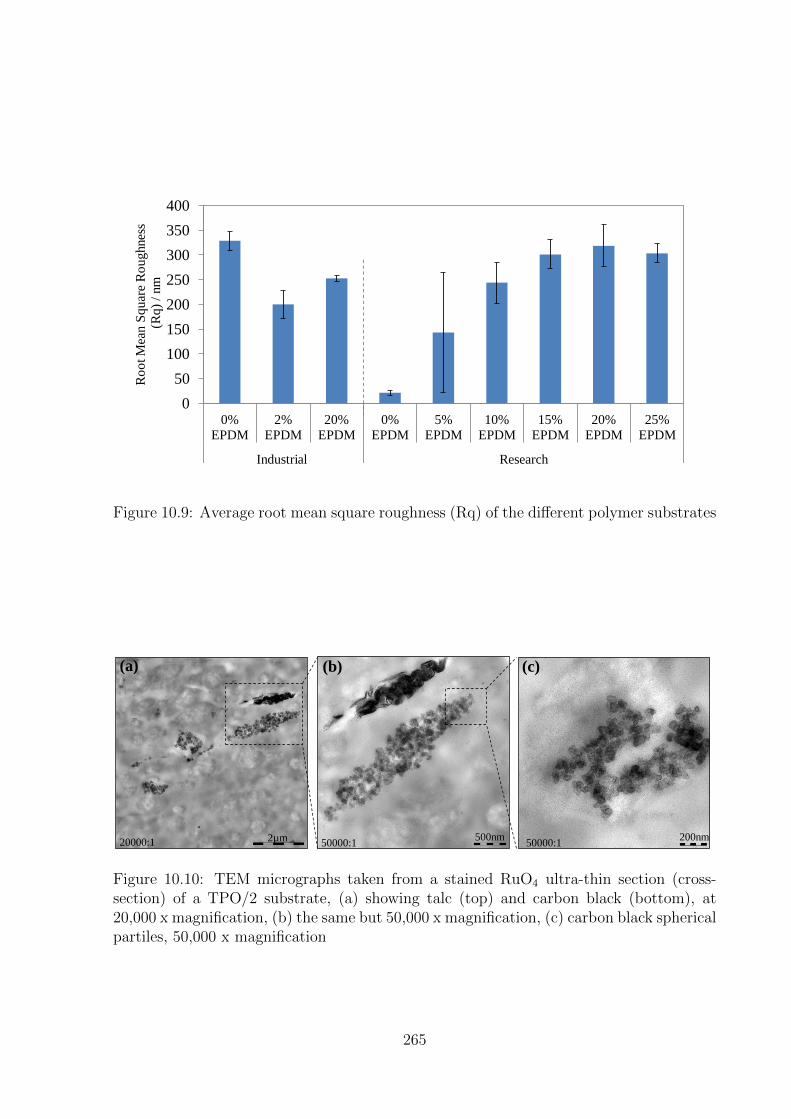
0
50
100
150
200
250
300
350
400
0%
EPDM
2%
EPDM
20%
EPDM
0%
EPDM
5%
EPDM
10%
EPDM
15%
EPDM
20%
EPDM
25%
EPDM
Industrial Research
Ro
ot M
ean S
quar
e R
oughnes
s
(R
q)
/ nm
Figure 10.9: Average root mean square roughness (Rq) of the different polymer substrates
2µm 20000:1 500nm
50000:1 200nm
50000:1
(a) (b) (c)
Figure 10.10: TEM micrographs taken from a stained RuO4 ultra-thin section (cross-section) of a TPO/2 substrate, (a) showing talc (top) and carbon black (bottom), at20,000 x magnification, (b) the same but 50,000 x magnification, (c) carbon black sphericalpartiles, 50,000 x magnification
265

Although TEM was not successful to analyse EPDM in Section 5.3, it was useful to
identify other additives in the composition of the TPO substrates. An ultrathin section
(cross-section of the substrate) was prepared, stained with RuO4 and imaged with TEM.
Figure 10.10(a)-(c) shows a series of TEM micrographs from a TPO/2 substrate. Figure
10.10(b)-(c) are magnified micrographs from Figure 10.10(a). Two components were
identified: carbon black, and talc.
Carbon black is a form of amorphous carbon which was identified by its characteristic
colloidal suspension, showing carbon agglomerates204 of spheric particles fused together
(Figure 10.10(c)), schematically represented in Figure 10.11(a). It is added to TPO
substrates for increased resistance to UV light (which usually degrades the PP over time)
and it also acts a pigment, giving the substrate its dark colour.205 The surface chemistry of
carbon black varies, and is dependent on the particle size, the structure, and the number
of functional groups found at the surface. Carbon blacks are produced from hydrocarbons,
and the dangling bonds at the edges of the carbon layers are saturated mostly by hydrogen.
Other elements are also found in the carbon black. The most important of these is oxygen.
Whereas sulfur and nitrogen originate from the oil precursor, oxygen can also be taken
up during carbon black formation or storage.206 Therefore, it is likely the addition of
carbon black to a TPO substrate creates a small number of hydroxyl groups present on
the surface of the TPO. Carbon black could therefore enhance adhesion menchanisms of
the substrate to the polar coatings applied.
Talc is a mineral filler composed of hydrated magnesium silicate (Figure 10.11(c)). It
is darker in contrast because it contains silicon (Si) and magnesium (Mg) which have a
higher atomic number compared to the carbon (C) in the PP matrix. It is added to the PP
for higher stiffness and rigidity. It also reduces shrinkage, lowers the thermal expansion
and controls the morphology (important for painting) and a better flow of parts during
moulding.174,207 It has also been shown that talc acts as a nucleating agent in crystalline
polymers and the addition of talc to PP increases the crystallinity of the polymer.208 This
influences the swellability of the substrate, which may therefore have an influence on the
266
adhesive nature of the polymer to the coatings.
Also, the surface chemistry of talc present at the substrate surface may influence
adhesive properties. Particles of talc have the shape of platelets due to the layered struc-
ture of the mineral. The basal surfaces are hydrophobic, while the edge surfaces are
hydrophilic.168,169 The hydrophobicity of the basal surfaces arises from the fact that the
atoms exposed on the surface are linked together by siloxane (Si-0-Si) bonds and hence,
do not form strong hydrogen bonds with water.168,209 The edge surfaces are composed of
hydroxyl ions, magnesium, silicon and substituted cations, all of which undergo hydrol-
ysis. As a result, the edges are hydrophilic, and upon surface fracture, can form strong
hydrogen bonds with water molecules and polar substances.170–173,208,210 Therefore, it is
possible that chemical reactions or interactions between hydrophilic coatings and a TPO
substrate with exposed talc surfaces could improve adhesion.
Although the properties of cohesion within a TPO substrate (adhesion between the
mineral fillers and PP matrix) has been extensively studied,211,212 no previous reports were
found on the topic of adhesion of polar coatings to the talc and carbon black component
of a TPO surface. If such reactions are possible, it would be a significant contributing
factor to the understanding of the adhesion mechanism between a PP-based substrate,
an AP and a polar coating.
Calcium carbonate (CaCO3) was another additive identified in the SEM images taken
from the industrial TPO substrates (see Figure 5.3(c)). A schematic 3D representation
is shown in Figure 10.11(b). It is one of the most popular mineral fillers in the plastics
industry, and it is typically added to a TPO substrate. It provides opacity and surface
gloss, which improves surface finish. When the particle size is carefully controlled, CaCO3
also increases both impact strength and flexural modulus (stiffness) of a TPO substrate.
Although it is hydrophilic in nature,210 which would be beneficial to adhesion mechanisms
to polar coatings at the TPO surface, it is usually treated with stearic acid to reduce the
surface energy and prevent particle agglomeration, hence improve compatibility with the
hydrophobic PP in a TPO substrate.174 In the SEM/TEM with EDX measurements, it
267

was not possible to know to what extent to the CaCO3 had been treated, thus what effect
it was likely to have on adhesion. For a better understanding of whether the additives have
an effect on the surface energy of the substrates, the polar and dispersion components of
the surface energy were measured in Section 5.5.
COOH
OH
OH
Oxygen
Hydroxyl
Magnesium
Silicon
van der Waals forces
Oxygen
Calcium
Carbon
(a) (b)
(c)
Figure 10.11: Typical fillers found in TPO plastics: (a) Schematic representation of carbonblack spherical particles, with hydrophilic functional groups at the surface, (b) a 3D latticeof CaCO3 and (c) a 2D representation of talc and the different interactions between thelayered structure171
10.F.2.2 Time of Flight Secondary Ion Mass Spectrometry (ToF-SIMS)
For further surface characterisation of the industrial PP substrates, ToF-SIMS was used
to identify additives not previously identified with alternative techniques. Figure 10.12
and Figure 10.13 show the positive and negative ion spectra for the industrial TPO/0
substrate. Both spectra show typical fragments of the antioxidant additive Irgafos 168,213
shown in Figure 10.14. It was found to be present in all three industrial TPO substrates.
Irgafos 168 is an organophosphite of low volatility which is resistant to hydrolysis. It
is an anti-oxidant and is used to protect polymers which are prone to oxidation during
processing steps (compounding/pelleting, fabrication and recycling), molecular weight
change (e.g. chain scission/cross-linking) and it also prevents discolouration.214 ToF-
268

x105
4.0
3.0
2.0
1.0
x10
5
5 10 15 20 25 30 35 40 45 50
Mass (u)
4.0
3.0
2.0
1.0
x10
3
60 70 80 90 100 110 120 130 140 150
Mass (u)
1.5
1.0
0.5
x10
3
160 180 200 220 240 260 280 300
Mass (u)
0.8
0.6
0.4
0.2
x10
2
320 340 360 380 400 420 440 460 480 500
Mass (u)
5.0
4.0
3.0
2.0
1.0
550 600 650 700 750
Mass (u)
Irgafos 168 Polypropylene Contamination
Inte
nsi
ty (
cou
nts
) In
ten
sity
(co
un
ts)
Inte
nsi
ty (
cou
nts
) In
ten
sity
(co
un
ts)
Inte
nsi
ty (
cou
nts
)
Figure 10.12: The positive ion ToF-SIMS spectrum of the TPO/0 substrate surface
269

Inte
nsi
ty
In
ten
sity
Inte
nsi
ty
In
ten
sity
x106
1.0
0.8
0.6
0.4
0.2
x10
4
5 10 15 20 25 30 35 40 45 50
Mass (u)
1.0
0.8
0.6
0.4
0.2
x10
3
60 70 80 90 100 110 120 130 140 150
Mass (u)
1.0
0.8
0.6
0.4
0.2
x10
3
160 180 200 220 240 260 280 300
Mass (u)
2.5
2.0
1.5
1.0
0.5
320 340 360 380 400 420 440 460 480 500
Mass (u)
Irgafos 168 Polypropylene Oxidation
Figure 10.13: The negative ion ToF-SIMS spectrum of the TPO/0 substrate surface
270
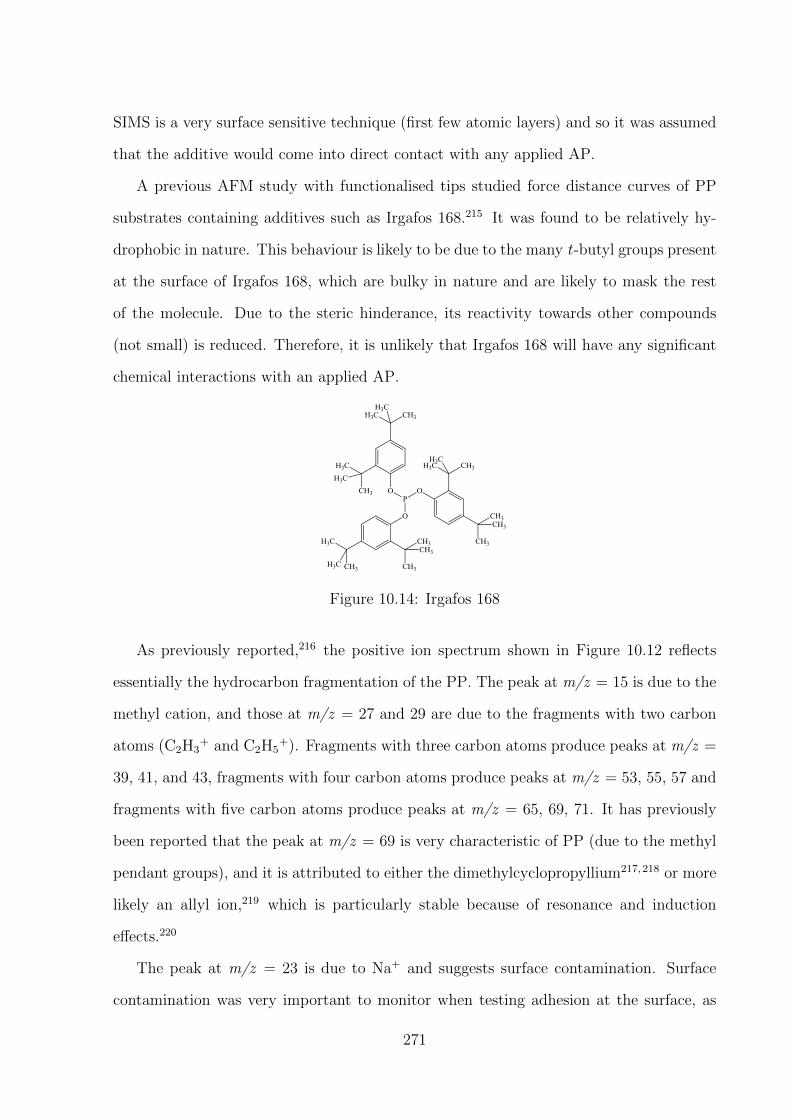
SIMS is a very surface sensitive technique (first few atomic layers) and so it was assumed
that the additive would come into direct contact with any applied AP.
A previous AFM study with functionalised tips studied force distance curves of PP
substrates containing additives such as Irgafos 168.215 It was found to be relatively hy-
drophobic in nature. This behaviour is likely to be due to the many t-butyl groups present
at the surface of Irgafos 168, which are bulky in nature and are likely to mask the rest
of the molecule. Due to the steric hinderance, its reactivity towards other compounds
(not small) is reduced. Therefore, it is unlikely that Irgafos 168 will have any significant
chemical interactions with an applied AP.
Figure 10.14: Irgafos 168
As previously reported,216 the positive ion spectrum shown in Figure 10.12 reflects
essentially the hydrocarbon fragmentation of the PP. The peak at m/z = 15 is due to the
methyl cation, and those at m/z = 27 and 29 are due to the fragments with two carbon
atoms (C2H3+ and C2H5
+). Fragments with three carbon atoms produce peaks at m/z =
39, 41, and 43, fragments with four carbon atoms produce peaks at m/z = 53, 55, 57 and
fragments with five carbon atoms produce peaks at m/z = 65, 69, 71. It has previously
been reported that the peak at m/z = 69 is very characteristic of PP (due to the methyl
pendant groups), and it is attributed to either the dimethylcyclopropyllium217,218 or more
likely an allyl ion,219 which is particularly stable because of resonance and induction
effects.220
The peak at m/z = 23 is due to Na+ and suggests surface contamination. Surface
contamination was very important to monitor when testing adhesion at the surface, as
271

such cations could potentially hinder any adhesion mechanism by separating the interfaces
and interfering with chemical reactions/interactions. Polydimethylsiloxane (PDMS) was
also a typical surface contaminant often found in ToF-SIMS spectra when samples had not
been cleaned or handled correctly.94 Day to day toiletries such as hand cream, hand soap
and hairspray are known to cause such contamination. Some spectra showed evidence of
PDMS fragments on untreated substrates, however, after a cleaning step with isopropanol
the peak intensities were greatly reduced or eliminated. However, it must not be forgotten
that solvent cleaning induces other surface changes (reported in Appendix 10.F.4) such
as surface roughness, which could also potentially have an effect on adhesion.
The negative ion spectrum shown in Figure 10.13 is also dominated by hydrocarbon
fragmentation from the PP. Peaks at m/z = 12, 13, 14 are due to C−, CH−, CH2−
fragments and the peaks at m/z = 24, 25, 26 are due to C2−, C2H
−, C2H2− fragments.
Peaks from m/z = 36 onwards are due to the fragments with three carbon atoms, the
peaks from m/z = 48 onwards are due to fragments with four carbon atoms and the peaks
from m/z = 60 onwards are due to fragments with five carbon atoms. The peaks at m/z
= 16 and 17 in the negative spectra are due to O− and OH− . The presence of oxygen
containing species in PP is well known,221 as the injection moulding process sometimes
causes oxidation at the surface (as previously mentioned, Irgafos 168 is often added to
prevent oxidation).
10.F.3 Mechanical Properties: Substrate and Young’s Modulus
10.F.3.1 Substrate Hardness
Crystallinity has been shown to influence the adhesive properties of TPO substrates when
using CPO APs, as discussed in Section 2.4. The degree of crystallinity at the substrate
surface determines the penetrability of the CPO, which subsequently determines the ad-
hesion performance.64,67 Therefore, the mechanical properties of the substrates were
272
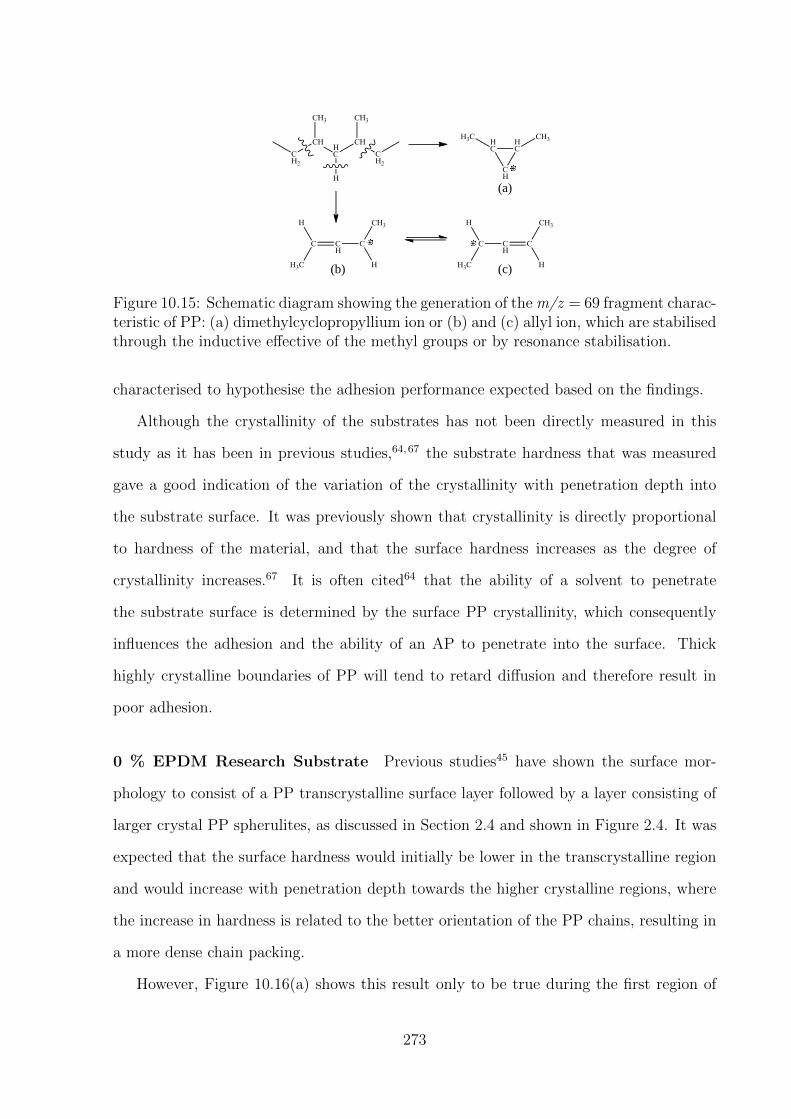
(a)
(c) (b)
Figure 10.15: Schematic diagram showing the generation of the m/z = 69 fragment charac-teristic of PP: (a) dimethylcyclopropyllium ion or (b) and (c) allyl ion, which are stabilisedthrough the inductive effective of the methyl groups or by resonance stabilisation.
characterised to hypothesise the adhesion performance expected based on the findings.
Although the crystallinity of the substrates has not been directly measured in this
study as it has been in previous studies,64,67 the substrate hardness that was measured
gave a good indication of the variation of the crystallinity with penetration depth into
the substrate surface. It was previously shown that crystallinity is directly proportional
to hardness of the material, and that the surface hardness increases as the degree of
crystallinity increases.67 It is often cited64 that the ability of a solvent to penetrate
the substrate surface is determined by the surface PP crystallinity, which consequently
influences the adhesion and the ability of an AP to penetrate into the surface. Thick
highly crystalline boundaries of PP will tend to retard diffusion and therefore result in
poor adhesion.
0 % EPDM Research Substrate Previous studies45 have shown the surface mor-
phology to consist of a PP transcrystalline surface layer followed by a layer consisting of
larger crystal PP spherulites, as discussed in Section 2.4 and shown in Figure 2.4. It was
expected that the surface hardness would initially be lower in the transcrystalline region
and would increase with penetration depth towards the higher crystalline regions, where
the increase in hardness is related to the better orientation of the PP chains, resulting in
a more dense chain packing.
However, Figure 10.16(a) shows this result only to be true during the first region of
273

the surface hardness profile of the R/0 substrate. Three distinct regions were identified
for this substrate. The first region, between 300 - 850 nm from the surface, increased in
hardness by ∼3 MPa, which was thought to be due to an increase in crystallinity with
penetration depth. This would be caused by the decrease in cooling rate from the surface
of the substrate, as it entered the mould during the injection moulding process. The
second region, between 850 - 2600 nm from the surface, showed a decrease in hardness
with penetration depth by about 6.5 MPa, suggesting a layer of a second softer phase
that formed as a subsurface layer during the injection mould process. This differs from
the morphology described in previous studies.45,64
Without doing further investigation of the injection mould apparatus used (to which
no access was possible), it was not possible to conclude the reason why this second region
exists, although it was likely to be due to the thermal gradients present in the mould
as the rotating screw was used to drive the TPO into the mould during the injection
process. As described in Section 2.4, the substrate microstructure heavily depends on the
moulding conditions in which the plastic part is made.
Hardness values of ∼50 MPa for the R/0 research substrate indicated isotactic PP in
a semi-crystalline phase (hardness values for crystalline α-iPP (monoclinic) = 111 MPa;
crystalline β-iPP (hexagonal) = 90 MPa; amorphous iPP = ∼30MPa222), however, further
investigation such as determining the melting points in the different regions and DSC
analysis would further determine the crystallinity of the different regions. In this study,
it was sufficient to determine the effect of substrate hardness variation with substrate
composition, to better understand adhesion mechanisms.
The substrate hardness varied very little from 2600 - 500 nm below the surface in the
third region identified, as it tended to a relatively stable value between 50.7 - 52.7 MPa,
in which the temperature was likely to be relatively consistent in the moulding process
(representing the bulk of the polymer).
274

5 % - 25 % EPDM Research Substrates The effect of EPDM in the other re-
search substrates, shown in Figure 10.16(a), was apparent when comparing the hardness
profiles with the blank substrate (R/0). All 5 substrates (5 - 25 % of EPDM) showed
a clear decrease in hardness, which did not support the structure suggested by Ryntz
et al.29,30,45,64,66,67 (an initial increase in hardness was expected, corresponding to an
increase in crystallinity). Furthermore, contrary to the previous findings, the steady
decrease in hardness suggested no skin was present at the substrate surface within the
depths measured. However, it was not known if the postulated microstructure in Figure
2.4 was within the depth scale measured. Therefore, this could have been the reason for
the mismatch in TPO models, or it could be due to a difference in the process parameters
of the injection moulding process (as discussed in Chapter 2.4).
For all 5 research substrates containing EPDM, there was an initial decrease of hard-
ness, before levelling at a relatively steady value in the bulk material. The hardness values
were less than the blank R/0 substrate, showing that EPDM had a significant effect. Be-
tween 1800 - 5000 nm, assumed to be the bulk below the surface, the hardness values
decreased as the % of EPDM increased, for all substrates with the exception of R/15
and R/20, where the hardness value for both substrates was ∼34 MPa. The amorphous
rubber EPDM component is added to TPOs for improved impact strength, so a decrease
of substrate hardness with increasing % of EPDM was expected. However, the position
of the EPDM domains relative to the surface had a large influence on the hardness val-
ues recorded. The lack of trend observed between the hardness and the % of EPDM in
the substrate, further demonstrated the inhomogeneous nature of the substrates that was
previously seen in the SEM measurements (Section 5.3). Assuming that the substrate
hardness correlated to the amount of EPDM at the point of measurement, the hardness
depth profiles in Figure 10.16 suggest the amount of EPDM at different points in the
cross-section of the substrate relative to the surface, varied for each substrate.
In conclusion, the R/20 and R/25 research substrates were expected to have the great-
est adhesive properties, due to a solvent or AP being able to penetrate into the substrates
275

at a greater degree compared to the other harder research substrates (influencing the
amount of contact between the EPDM domains and the AP). The hardest substrate,
R/0, was expected to have the worst adhesive properties. Furthermore, the adhesive
properties were not able to be predicted based on the given % of EPDM in a substrate,
due to the lack of trend observed with the hardness values obtained.
Industrial Substrates As measured in Appendix 10.F.2, many components were present
in the PP matrix of the industrial substrates, including talc, carbon black, calcium car-
bonate and Irgafos 168, as well as the EPDM rubber. The influence of these components
on the substrate hardness was clearly observed, as shown in Figure 5.7. When comparing
the industrial substrates TPO/0, TPO/2 and TPO/20 with the research substrates (0 -
25 % of EPDM). The hardness profiles of all three industrial substrates were lower than
all research substrates, by ∼10 MPa in the near surface region and ∼6 MPa in the bulk
region, when compared to the softest research substrate (R/25). When comparing the
R/0 and TPO/0 substrates, it was clear that the additives (other than EPDM) within
the PP matrix in the industrial substrate had a great influence on the substrate hardness,
decreasing the value from ∼55 to ∼20 MPa.
The hardness profile of the industrial TPO/0 substrate followed the same depth profile
shape as all the other substrates containing EPDM: an initial decrease in hardness, differ-
ing from the research R/0 substrate. This showed that the EPDM alone did not have a
significant effect on hardness when other additives were present in the matrix, but rather
the collective presence of additives determined a substrates hardness. Furthermore, all
three industrial substrates had relatively similar values of hardness, showing that the %
of EPDM did not have such a significant effect.
The TPO substrates had lower hardness values compared to the research substrates,
therefore, it was expected that a solvent or AP would be able to better penetrate TPO
substrates resulting in greater adhesive effects.
276
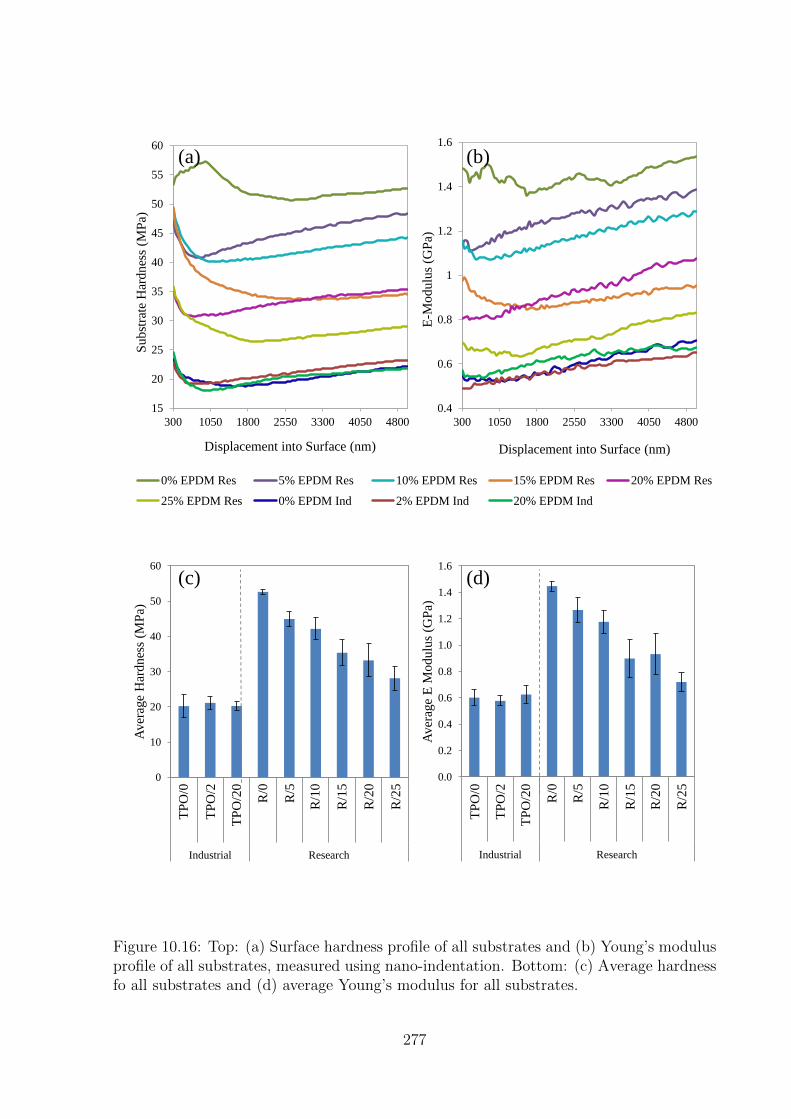
15
20
25
30
35
40
45
50
55
60
300 1050 1800 2550 3300 4050 4800
Subst
rate
Har
dnes
s (M
Pa)
Displacement into Surface (nm)
0% EPDM Res 5% EPDM Res 10% EPDM Res 15% EPDM Res 20% EPDM Res
25% EPDM Res 0% EPDM Ind 2% EPDM Ind 20% EPDM Ind
0.4
0.6
0.8
1
1.2
1.4
1.6
300 1050 1800 2550 3300 4050 4800E
-Modulu
s (G
Pa)
Displacement into Surface (nm)
0.0
0.2
0.4
0.6
0.8
1.0
1.2
1.4
1.6
0%
EP
DM
2%
EP
DM
20%
EP
DM
0%
EP
DM
5%
EP
DM
10%
EP
DM
15%
EP
DM
20%
EP
DM
25%
EP
DM
Industrial Research
Aver
age
E M
odulu
s (G
Pa)
0
10
20
30
40
50
60
0%
EP
DM
2%
EP
DM
20%
EP
DM
0%
EP
DM
5%
EP
DM
10%
EP
DM
15%
EP
DM
20%
EP
DM
25%
EP
DM
Industrial Research
Aver
age
Har
dnes
s (M
Pa)
(a)
(c) (d)
(b)
TP
O/0
TP
O/2
TP
O/2
0
R/0
R/5
R/1
0
R/1
5
R/2
0
R/2
5
TP
O/0
TP
O/2
TP
O/2
0
R/0
R/5
R/1
0
R/1
5
R/2
0
R/2
5
Figure 10.16: Top: (a) Surface hardness profile of all substrates and (b) Young’s modulusprofile of all substrates, measured using nano-indentation. Bottom: (c) Average hardnessfo all substrates and (d) average Young’s modulus for all substrates.
277

10.F.3.2 Substrate Young’s Modulus
A previous study concluded that increasing the amount of rubber, such as EPDM, in a
TPO leads to a layer of higher elasticity within the substrate. Thus, a higher cohesive
energy was attained before reaching its yield stress and delamination occurred.45,64 It was
also found that lower modulus (higher rubber content) TPO materials exhibited better
adhesion than those with a higher modulus.68 TPO substrates with a modulus value
of 1.2 GPa were found to give poor adhesion using a CPO primer layer, where as TPO
substrates with a modulus of 0.3 GPa gave good adhesion (independent of the two types
of clear coats tested). Hence, the selection of the TPO modulus in determining the ability
to accommodate for external stresses was important when assessing adhesion.
Figure 10.16(d) shows the Young’s modulus of the substrates. As expected, the mod-
ulus decreased as the % of EPDM increased, for all research substrates with the exception
of R/20. When assessing the trend, the R/15 substrate had a lower modulus than ex-
pected, whilst the R/20 substrate had a higher modulus than expected. As was found
for the hardness measurements, Figure 10.16(b) shows that the modulus depth profiles
highly depended on the point of penetration and whether EPDM was present or not at
that particular point. Initially, the modulus of R/20 was lower than that of R/15 as
expected. However, at 1300 nm into the substrate, the modulus exceeded that of R/15,
further supporting the heterogeneous nature of the EPDM distribution in the injection
moulded substrates.
The modulus did not vary linearly as expected with the given EPDM compositions of
the substrates. For example, the TPO/20 industrial substrate contained 10 times more
EPDM than the TPO/2 substrate, yet the modulus measured was larger for TPO/2. As
it was found with the substrate hardness values, additives in the TPO formulation of the
substrates were found to have a large influence on the Young’s modulus. Furthermore,
the modulus values for the industrial substrates containing all additives were lower than
that of the research substrates containing only EPDM.
The substrates studied almost covered the range of modulus values studied by Ryntz et
278

al.,68 although no substrate reached a value as low as 0.3 GPa which was previously shown
to give good adhesion . However, the values did go below 1.2 GPa at which previously
poor adhesion was observed, therefore, assuming the adhesion mechanisms functioned in
the same way as the CPO, an improved adhesion was expected for the substrates with
lower modulus values (the industrial TPO substrates had the lowest modulus range).
10.F.4 Effect of Solvent Cleaning on the Substrate Morphology
10.F.4.1 Surface Roughness
It is common practice in industrial laboratories to prepare TPO substrates by wiping them
clean with solvent-soaked clothes before they are coated. This is to prevent contamination
of dirt particles and/or mould-releasing agents at the surface of the substrate, which may
hinder adhesion. However, solvent wiping/rinsing is not a viable step in the production
line of a vehicle due to the added costs and environmental impact. For research purposes,
however, implementing a washing step was helpful to establish if contamination was caus-
ing delamination (assuming the solvent was clean and did not contaminate the surface
itself).
It was previously found that such cleaning procedures have an impact on the adhesion
properties at the surface of the substrate. Firstly, solvent wiping removes contaminants
such and oil and grease which can form weak boundary layers at the surface, causing poor
adhesion.94,223 Secondly, it was found that some solvents can introduce hydroxyl groups
to the surface which were thought to facilitate adhesion via an acid-base interaction.71
A third important impact of solvent cleaning, which was previously reported, was the
change in surface roughness of TPO substrates. Solvent wiping significantly increased
the surface roughness of the TPO substrate measured, which influenced the penetration
of a CPO AP.66 It was found from model experiments that the pure PP was relatively
unaffected by solvent wiping, whereas the surface roughness change of the elastomer (such
as EPDM) had a similar value to that of the TPO (PP and EPDM). Therefore, it was
279
concluded that the surface roughness change of the elastomers caused the overall TPO
surface roughness change.
To assess the effects of solvent cleaning on the substrates used in this study, the
surface roughness was measured before and after solvent wiping and solvent rinsing with
isopropanol. The experiments were carried out on three different types of substrate: an
industrial TPO/0, and two research substrates looking at the effect of EPDM: R/0 and
R/25. One set of substrates were wiped once with a fabric soaked in isopropanol, and
another set of substrates were rinsed with isopropanol, preventing any abrasive contact
to the surface. Uncleaned surfaces were also examined for comparison. All samples were
immediately measured after cleaning.
For each sample, images were obtained from 10 different areas on the surface. Values
for Ra and Rq were taken from the combined data of all 10 measurements, and the average
values were calculated, shown in Figure 10.17 - 10.19.
The 2D average surface roughness profiles and 3D surface images of each substrate
without a cleaning procedure are shown in Figure 10.17(a)-(c). In both the 2D and
3D images, peaks and valleys on the substrate were observed. (Although the surface
roughness initially appears severe in the images of Figure 10.17(a) and (c), the z-axis is
highly magnified). The Ra and Rq values indicated the roughness was on a fine scale. For
comparison, a standard Aluminium-Oxide 100 sand paper (typically used to sand bare
wood) has an Ra value of 35.83 µm and Rq value of 49.89 µm,224 an order of magnitude
greater than the studied substrates.
A clear difference was observed between the industrial TPO (Figure 10.17(a)), R/0
(Figure 10.17(b)) and R/25 (Figure 10.17(c)). As discussed in Appendix 10.F.1, the R/0
substrate is significantly less rough (smoother) than the other two substrates, indicating
the effect of additives which increase the substrate roughness. The industrial TPO and
R/25 substrates had surface roughness parameters on a similar scale, where as the R/0
substrate had surface roughness parameters over 10 times lower.
This difference was also emphasised in the 2D images: R/0 showed a relatively smooth
280
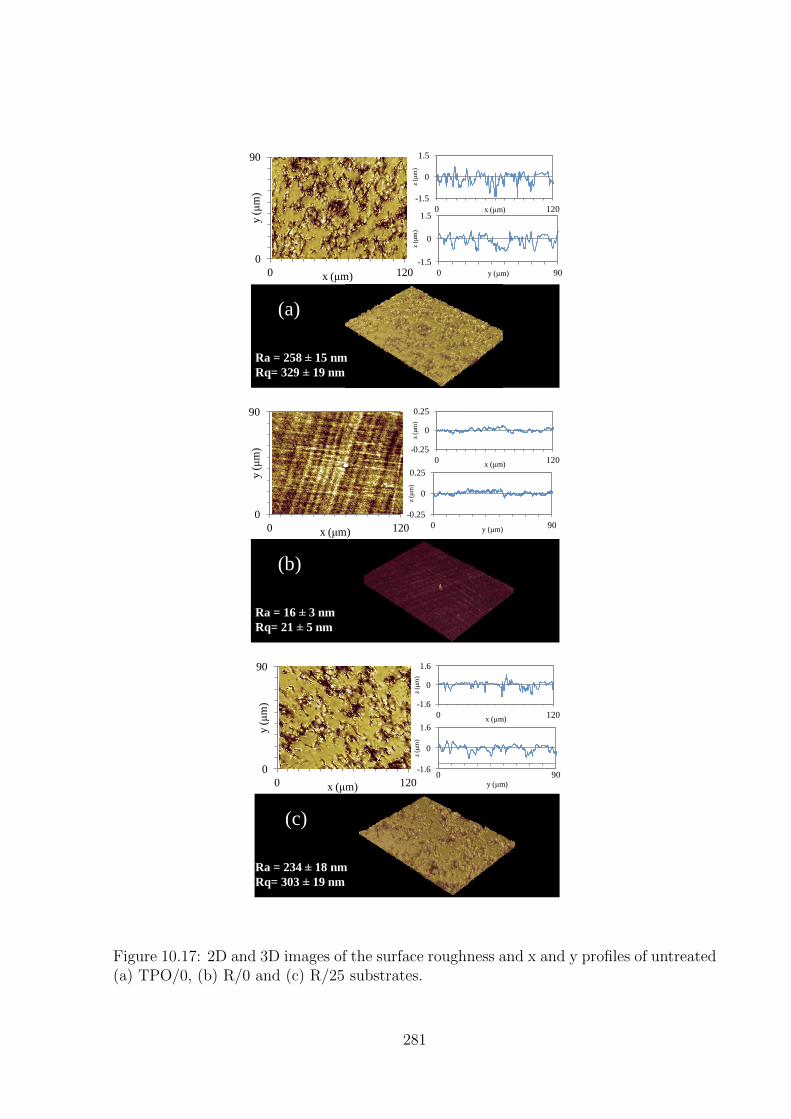
0
90
0 120
y (μ
m)
x (μm)
Ra = 258 ± 15 nm
Rq= 329 ± 19 nm
-1.5
0
1.5
0 120
z (μ
m)
x (μm)
-1.5
0
1.5
0 90
z (μ
m)
y (μm)
(a)
-0.25
0
0.25
0 90
z (μ
m)
y (μm)
0
90
0 120
y (μ
m)
x (μm)
Ra = 16 ± 3 nm
Rq= 21 ± 5 nm
-0.25
0
0.25
0 120
z (μ
m)
x (μm)
(b)
0
90
0 120
y (μ
m)
x (μm)
Ra = 234 ± 18 nm
Rq= 303 ± 19 nm
-1.6
0
1.6
0 120
z (μ
m)
x (μm)
-1.6
0
1.6
0 90
z (μ
m)
y (μm)
(c)
Figure 10.17: 2D and 3D images of the surface roughness and x and y profiles of untreated(a) TPO/0, (b) R/0 and (c) R/25 substrates.
281
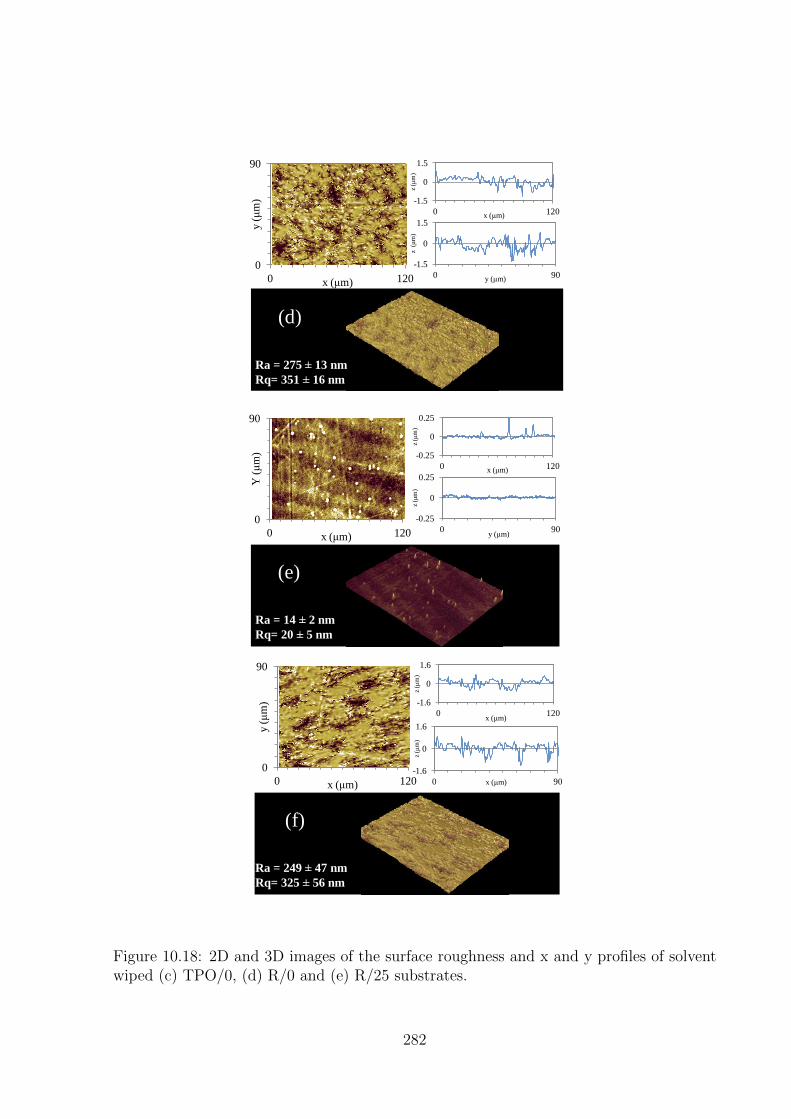
0
90
0 120
Y (μ
m)
x (μm)
Ra = 14 ± 2 nm
Rq= 20 ± 5 nm
-0.25
0
0.25
0 90
z (μ
m)
y (μm)
-0.25
0
0.25
0 120
z (μ
m)
x (μm)
(e)
0
90
0 120
y (μ
m)
x (μm)
Ra = 275 ± 13 nm
Rq= 351 ± 16 nm
-1.5
0
1.5
0 90
z (μ
m)
y (μm)
-1.5
0
1.5
0 120
z (μ
m)
x (μm)
(d)
0
90
0 120
y (μ
m)
x (μm)
Ra = 249 ± 47 nm
Rq= 325 ± 56 nm
-1.6
0
1.6
0 90
z (μ
m)
x (μm)
-1.6
0
1.6
0 120
z (μ
m)
x (μm)
(f)
Figure 10.18: 2D and 3D images of the surface roughness and x and y profiles of solventwiped (c) TPO/0, (d) R/0 and (e) R/25 substrates.
282

0
90
0 120
y (μ
m)
x (μm)
Ra = 21 ± 10 nm
Rq= 30 ± 18 nm
-0.25
0
0.25
0 90
z (μ
m)
y (μm)
-0.25
0
0.25
0 120
z (μ
m)
x (μm)
(h)
0
90
0 120
y (μ
m)
x (μm)
Ra = 251 ± 15 nm
Rq= 320± 18 nm
-1.5
0
1.5
0 90
z (μ
m)
y (μm)
-1.5
0
1.5
0 120
z (μ
m)
x (μm)
(g)
0
90
0 120
y (μ
m)
x (μm)
Ra = 215 ± 29 nm
Rq= 288 ± 31 nm
-1.6
0
1.6
0 90
z (μ
m)
y (μm)
-1.6
0
1.6
0 120
z (μ
m)
x (μm)
(i)
Figure 10.19: 2D and 3D images of the surface roughness and x and y profiles of non-abrasive solvent cleaned (c) TPO/0, (d) R/0 and (e) R/25 substrates.
283

0
50
100
150
200
250
300
350
400
450
0% EPDM 0% EPDM 25% EPDM
Industrial Research
Root
Mea
n S
quar
e R
ough
nes
s (R
q)
/ nm
Before Solvent Cleaning After Solvent Wiping After Solvent Rinsing
Figure 10.20: The effect of substrate cleaning on the Rq surface roughness parameter.
profile with a linear pattern on the surface (could be due the injection moulding direction
of flow), where as the TPO/0 and R/25 showed a rough crater-like surface profile. There
was no indication that the crater-like features formed in the pattern of the injection
mould direction, as they appeared uniform in both x and y directions. The increase in
surface roughness with increased % of EPDM was likely to have a contributing factor to
the adhesion mechanisms at the surface, by creating a greater contact area between the
substrate and a waterborne basecoat or AP, as discussed in Appendix 10.F.1.
The surface roughness profiles of the substrates after the abrasive cleaning method,
solvent wiping, are shown in Figure 10.18(d)-(f). There was no significant visual difference
between the substrates before and after the wiping procedure for the TPO and the R/25
substrates. However, the R/0 substrate showed several peaks on the surface, possibly due
to dirt that had been transferred during the wiping process.
The bar graph summarising Rq shown in Figure 10.20, reveals that for the TPO/0 and
R/25 substrates, solvent wiping resulted in an average increase of Rq by 22 nm. However,
the solvent wiping did not affect Rq (= 20 nm) of the R/0 substrate.
The SEM micrographs in Section 5.3 revealed that EPDM was present at the surface
of R/25, therefore, the roughness results fitted well with the previous study, suggesting
PP itself was not affected but it was the elastomer (EPDM) that induced a change in the
surface roughness.66 This was likley to be because of the density difference between EPDM
and PP. The substrate hardness results in Appendix 10.F.3.1 revealed that EPDM had a
284

softening effect of the substrates. Therefore, it was likely that the solvent would penetrate
into the EPDM more readily than the PP, inducing the change of the roughness. Also,
the mechanical nature of the cleaning procedure could have induced physical changes of
the softer EPDM domains present at the substrate surface.
It was expected that a similar scenario occured for TPO/0, where it was not EPDM
that induced the surface roughness change after solvent wiping, but the other additives
that were present (described in Section 5.3).
As expected, the less abrasive technique of rinsing the TPO and R/25 substrates with
solvent to avoid physical contact with the surface, lead to a smaller difference in Rq values
from before and after cleaning, as shown in Figure 10.19(g) and (i). However, interestingly
the Rq of R/0 increased after non-abrasive cleaning, which was likely to have resulted
from partial contamination suggested by the large error bar shown in Figure 10.19(h).
Nevertheless, the Rq of R/0 remained significantly lower than the Rq of TPO and R/25.
Counter to the previous increase in the Rq value upon abrasive solvent wiping, a small
decrease of Rq by 5 and 9 nm was observed for the TPO and R/25 substrates after
non-abrasive cleaning. This was explained by the solvent rinsing step removing any dirt
contamination from the surface, and the EPDM at the surface remaining unchanged due
to the non abrasive nature of this cleaning step. Therefore, it was concluded that the
mechanical changes induced by solvent wiping were the dominating factor for the changes
observed for additive-containing substrates.
Based on the results, solvent wiping of the TPO and R/25 substrates was hypothesised
to improve adhesion to waterborne coatings or APs, by increasing the surface roughness
which increased the contact area, maximising reactions or interactions. However, non-
abrasive solvent cleaning was expected to have no effect on the adhesive properties of the
substrates due to the lack of change is surface roughness. Furthermore, neither cleaning
method was expected to effect the adhesive properties of the R/0 substrate which did not
change after cleaning.
285

Appendix 10.G Candidate Adhesion Promoter
Characterisation
10.G.1 Carbene Precursors
The three candidate APs used in this study (TPD, TPDOH and TPDCOOH) were pur-
chased from TCI chemicals, as described in Section 3.4. To verify their purity and struc-
ture, analysis was performed with NMR, IR and UV-Vis spectroscopy as well as mass
spectrometry.
Figure 10.21 shows the 1H and 13C NMR spectra for all three AP’s. These spec-
troscopic techniques were used to clarify the AP structures by identifying the carbon-
hydrogen framework. In the case of 1H NMR analysis, the presence of the aromatic
protons was confirmed for all three AP’s. The OH proton was also visible for TPDOH,
however the signal was too weak to be detected for the TPDCOOH. Furthermore, the
spectra measured suggested TPD and TPDCOOH had a purity >95 %, however, the
spectra from TPDOH suggest the purity was lower at ∼90 - 95 %. The 13C NMR spectra
further confirmed the structures of the three AP’s with successful assignments of all C
atoms in each structure at the expected chemical shifts. Evidence of C-F coupling was
observed from the carbon in the CF3 group, also assisting the assignment of the spectra.
To further clarify the AP’s structure, IR spectra were measured as shown in Figure
10.22. Figure 10.22(a) shows the measured IR spectrum for the parent compound, TPD.
The red overlay stick spectra shows the predicted IR spectrum, which helped to assign
the absorptions specific to TPD. The Sadtler handbook225 was also used to clarify the
regions expected for the various functional groups.
Four regions of the spectrum identified the mono-substituted phenyl group: between
2997 - 3146 cm−1, CH stretching characteristic of a benzene ring was observed; weak
overtones from the mono-substituted benzene were shown between 1673 - 1978 cm−1;
four characteristic absorptions highlighted as 1-4 in the insert in Figure 10.22(a) due to
286
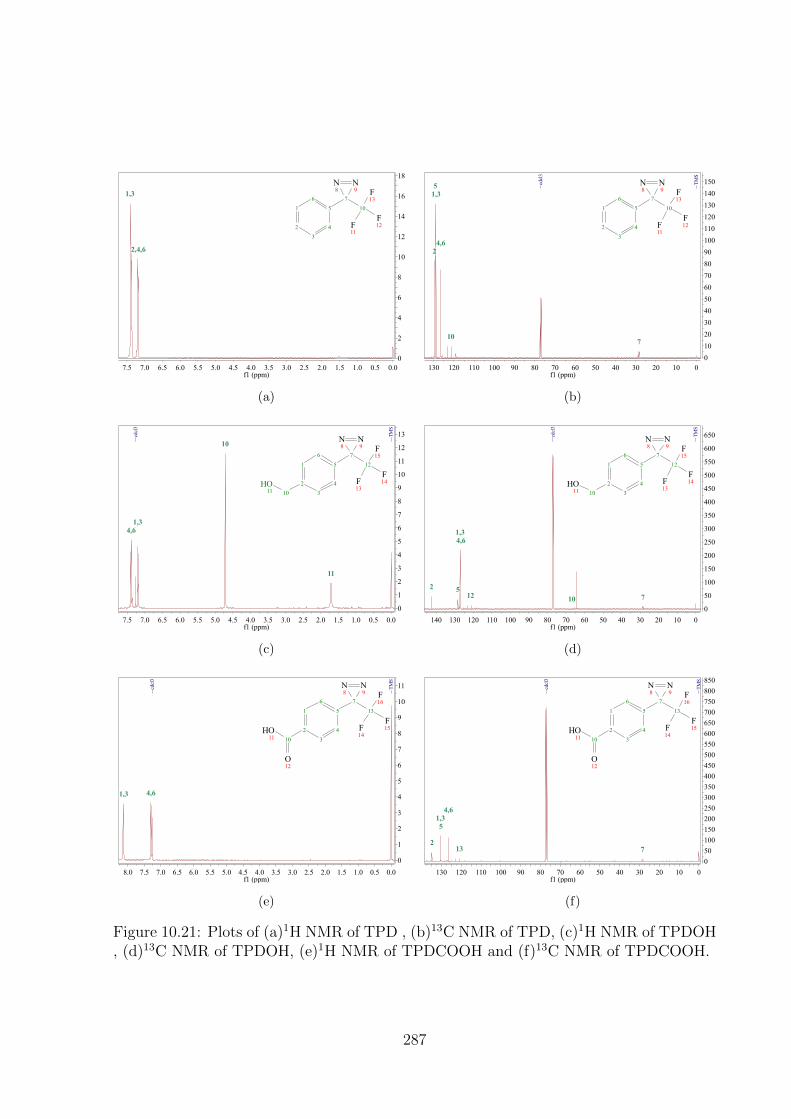
0.00.51.01.52.02.53.03.54.04.55.05.56.06.57.07.5f1 (ppm)
0
2
4
6
8
10
12
14
16
18
1,3
2,4,6
1
23
4
56 7
N8
N9
10
F11
F12
F13
(a)
0102030405060708090100110120130f1 (ppm)
0102030405060708090100110120130140150TM
S
cdcl
3
1,35
24,6
107
1
23
4
56 7
N8
N9
10
F11
F12
F13
(b)
0.00.51.01.52.02.53.03.54.04.55.05.56.06.57.07.5f1 (ppm)
0
1
2
3
4
5
6
7
8
9
10
11
12
13TMS
cdcl
3
10
4,61,3
11
1
23
4
56 7
N8
N9
10OH11
12
F13
F14
F15
(c)
0102030405060708090100110120130140f1 (ppm)
0
50
100
150
200
250
300
350
400
450
500
550
600
650TMS
cdcl
3
4,61,3
2 512 710
1
23
4
56 7
N8
N9
10OH11
12
F13
F14
F15
(d)
0.00.51.01.52.02.53.03.54.04.55.05.56.06.57.07.58.0f1 (ppm)
0
1
2
3
4
5
6
7
8
9
10
11TMS
cdcl
3
4,61,3
1
23
4
56 7
N8
N9
10OH11
O12
13
F14
F15
F16
(e)
0102030405060708090100110120130f1 (ppm)
050100150200250300350400450500550600650700750800850
TMS
cdcl
3
51,34,6
213 7
1
23
4
56 7
N8
N9
10OH11
O12
13
F14
F15
F16
(f)
Figure 10.21: Plots of (a)1H NMR of TPD , (b)13C NMR of TPD, (c)1H NMR of TPDOH, (d)13C NMR of TPDOH, (e)1H NMR of TPDCOOH and (f)13C NMR of TPDCOOH.
287

400 800 1200 1600 2000 2400 2800 3200
0
20
40
60
80
100 %
Tra
nsm
itta
nce
Wavenumbers (cm-1)
Measured Predicted
νCF
νCH
ωCH ωCH
sνCN
+
νNN
+
sνCF
νCC
1 2
3 4
78
83
88
93
98
1300 1500 1700
Abso
rban
ce
Wavenumbers (cm-1)
νNN
νCC
1 2
3
4
νNN
40
50
60
70
80
90
100
400 800 1200 1600 2000 2400 2800 3200 3600
% T
ransm
itta
nce
Wavenumbers (cm-1)
sνCN
+
νNN
+
sνCF
νring
νCC
νCC νCC
νOH
+
νCH
(from COOH and aromatic)
νCO
νCO
δOH
γOH
νCF
νCF
νNN
0
20
40
60
80
100
400 800 1200 1600 2000 2400 2800 3200 3600
% T
ransm
itta
nce
Wavenumber (cm-1)
νCO
νring
aνCH sνCH
νOH
νring
δOH
δCH
νNN
sνCN
+
νNN
+
sνCF
νCF
γNO / γSiO
νCF
γCC
(a)
(c)
(b)
Figure 10.22: The IR spectra of (a) TPD, (b) TPDOH and (c) TPDCOOH. For TPD,the measured spectrum is shown in black, and the red overlay stick spectra shows thepredicted IR spectrum. IR symbols: between 2 atoms: ν= stretch; between 3 atoms: δ= symmetric bending, a = anti-symmetric bending, ω = out of plane bending/wagging,ρ = rocking; between 4 or more atoms: τ = torque, δ = in plane deformation and γ =out of plane deformation.
288
C=C in-plane vibrations were observed between 1449 - 1611 cm−1; two absorptions at 693
and 755 cm−1 were observed due to CH out-of-plane bending from the mono-substituted
benzene.
TPDOH and TPDCOOH contain ortho-disubstituted benzene rings, changing the
absorption of the overtones compared to TPD, and more noticeably the absorption of the
out-of-plane CH bending. A characteristic peak for an ortho-disubstituted benzene ring
was found at 805 cm−1 for TPDOH and at 843 cm−1 for TPDCOOH.
The presence of the OH group in TPDOH was confirmed with IR by the broad char-
acteristic absorption due to the OH stretch at 3327 cm−1. Although still present, the OH
absorption was found to be not as strong for TPDCOOH, and also interfered with CH
stretching from the aromatic ring.
The N=N stretching frequency did not show at the absorption position expected from
the predicted spectra. One plausible reason could be that the prediction did not take
into account interactions with other TPD molecules and was made assuming one TPD
molecule was present in vacuum. For comparison, an IR spectrum was measured of
the diaziridine TPD parent compound, containing an HN-NH three-membered ring with
C, which is oxidised to give the N=N three-membered ring in TPD. The absorption at
1631 cm−1, shown in the insert in Figure 10.22(a), was found to be the absorption that
distinguished TPD from its parent molecule. Therefore, the absorption at 1631 cm−1
was assigned to the N=N stretch, in agreement with the Infrared Characteristic Group
Frequencies book.226 The N=N stretch was found at 1632 cm−1 for both TPDOH and
TPDCOOH.
There was a strong unassigned absorption at 936 cm−1 found in the TPDOH spectrum,
shown in Figure 10.22(b). It was thought to be evidence of an oxime present (C=N-OH)
from characteristic absorptions at 1616 cm−1 due to C=N stretching, 936 cm−1 due to N-
O stretching and a broad OH band at ∼3325 cm−1, or evidence of silicone contamination
due to Si-O stretching at 963 cm−1. The NMR spectra of TPDOH previously showed
∼95 % purity, therefore, these stretches could be due to small amounts of decomposed
289
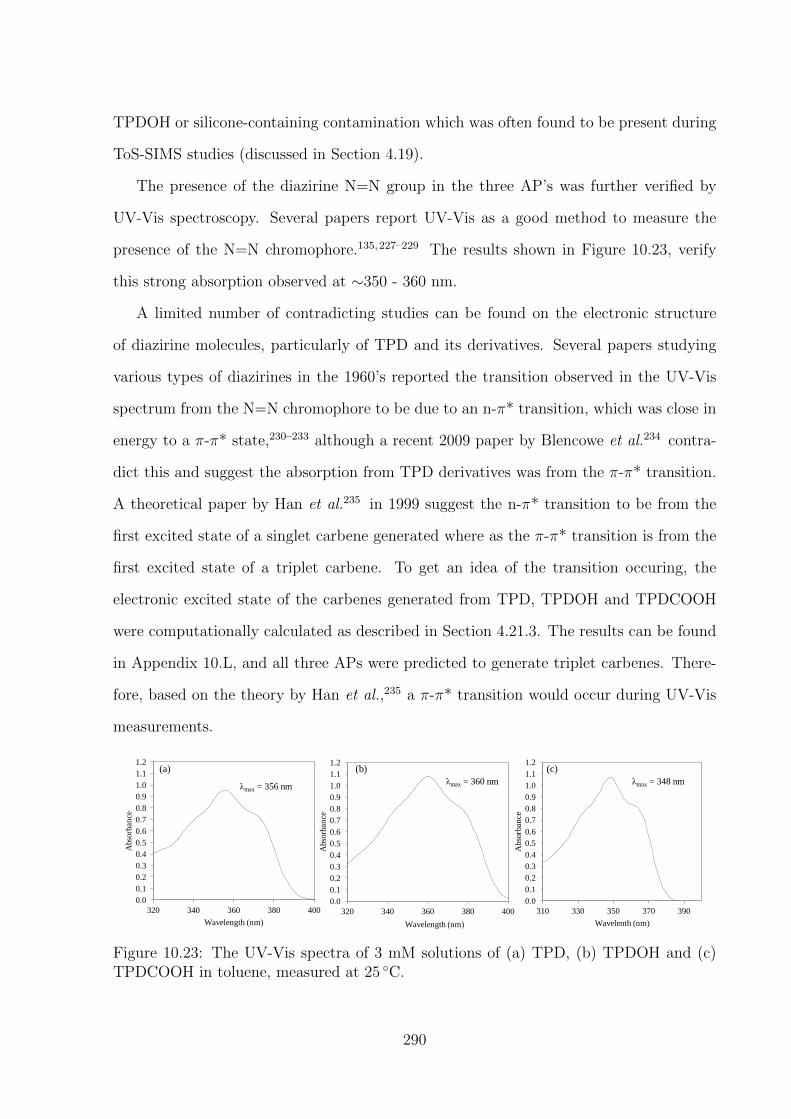
TPDOH or silicone-containing contamination which was often found to be present during
ToS-SIMS studies (discussed in Section 4.19).
The presence of the diazirine N=N group in the three AP’s was further verified by
UV-Vis spectroscopy. Several papers report UV-Vis as a good method to measure the
presence of the N=N chromophore.135,227–229 The results shown in Figure 10.23, verify
this strong absorption observed at ∼350 - 360 nm.
A limited number of contradicting studies can be found on the electronic structure
of diazirine molecules, particularly of TPD and its derivatives. Several papers studying
various types of diazirines in the 1960’s reported the transition observed in the UV-Vis
spectrum from the N=N chromophore to be due to an n-π* transition, which was close in
energy to a π-π* state,230–233 although a recent 2009 paper by Blencowe et al.234 contra-
dict this and suggest the absorption from TPD derivatives was from the π-π* transition.
A theoretical paper by Han et al.235 in 1999 suggest the n-π* transition to be from the
first excited state of a singlet carbene generated where as the π-π* transition is from the
first excited state of a triplet carbene. To get an idea of the transition occuring, the
electronic excited state of the carbenes generated from TPD, TPDOH and TPDCOOH
were computationally calculated as described in Section 4.21.3. The results can be found
in Appendix 10.L, and all three APs were predicted to generate triplet carbenes. There-
fore, based on the theory by Han et al.,235 a π-π* transition would occur during UV-Vis
measurements.
0.0
0.1
0.2
0.3
0.4
0.5
0.6
0.7
0.8
0.9
1.0
1.1
1.2
320 340 360 380 400
Abso
rban
ce
Wavelength (nm)
λmax = 356 nm
0.0
0.1
0.2
0.3
0.4
0.5
0.6
0.7
0.8
0.9
1.0
1.1
1.2
320 340 360 380 400
Abso
rban
ce
Wavelength (nm)
λmax = 360 nm
0.0
0.1
0.2
0.3
0.4
0.5
0.6
0.7
0.8
0.9
1.0
1.1
1.2
310 330 350 370 390
Abso
rban
ce
Wavelenth (nm)
λmax = 348 nm
(a) (b) (c)
Figure 10.23: The UV-Vis spectra of 3 mM solutions of (a) TPD, (b) TPDOH and (c)TPDCOOH in toluene, measured at 25 ◦C.
290

The three AP’s were distinguishable in UV-Vis by their maximum absorptions: TPD
λ max = 356 nm; TPDOH λ max = 360 nm; TPDCOOH λ max = 348 nm.
Mass spectrometry was the final technique used to verify the structure of the three APs.
Due to the high reactivity of the TPD molecules, a low ionisation technique was used for
the prevention of decay or any side reactions, other than fragmentation. However, it was
not possible to prevent heat generation during the measurement, which could have resulted
in the decomposition of TPD. Nevertheless, the mass spectra shown in Figure 10.24
provided evidence of the intact-AP molecules, showing the molecular ion peaks for all three
AP’s (TPDCOOH also appeared protonated at m/z = 231). Evidence of decomposition
was also observed with the loss of N2 observed for all AP’s. An isomer of TPD at
m/z = 344 was observed and a suggested structure is shown in Figure 10.24(a). The
corresponding isomers were not observed for TPDOH and TPDCOOH. However, evidence
of TPDOH and TPDCOOH clusters were observed in their spectra, with fragments up
to three times the molecular ion mass observed for TPDOH and two times the molecular
ion mass for TPDCOOH. Decomposition of the carboxylic acid in TPDCOOH with the
loss of H2O was also found.
All four characterisation techniques verified the structure of the three APs purchased.
Therefore, further experiments were performed with the certainty of their structures.
291
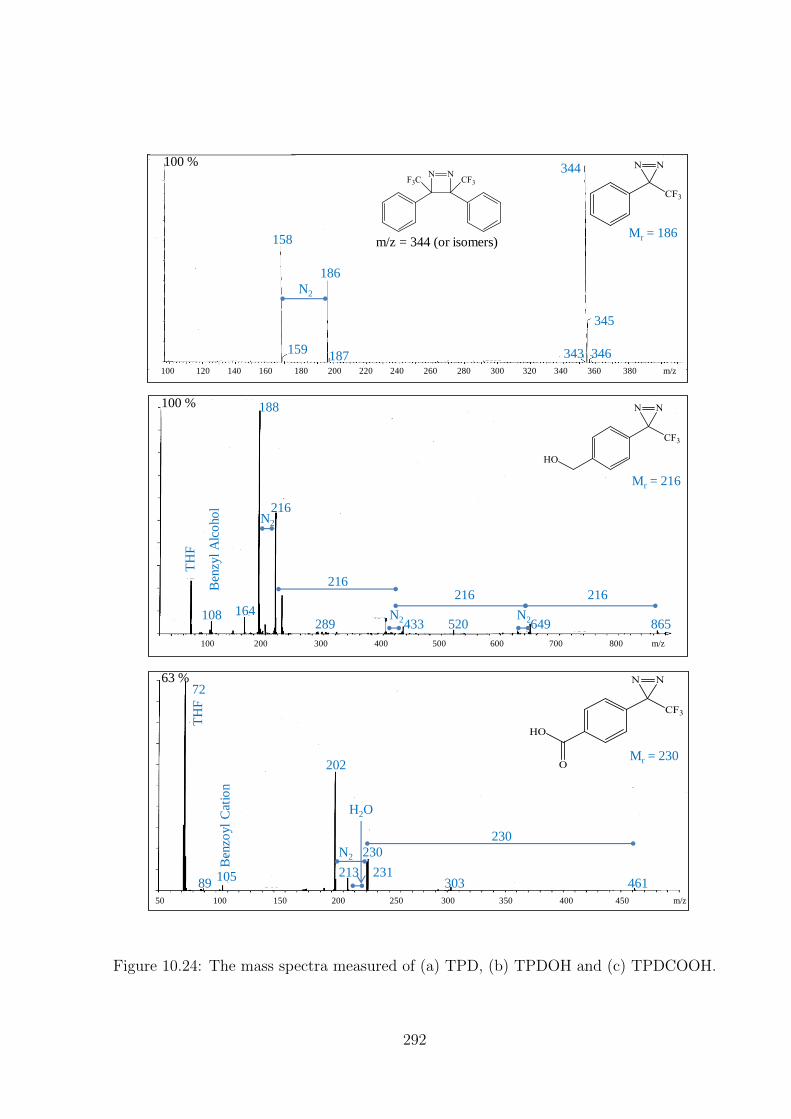
865 520 433
404
289
164 108
TH
F
Ben
zyl
Alc
oho
l 216 N2
216 216 216
N2 649
N2
Mr = 216
100 % 188
100 200 300 400 500 600 700 800 m/z
105
Ben
zoyl
Cat
ion
TH
F
202
303 461
230
Mr = 230
N2
213
H2O
231
230
50 100 150 200 250 300 350 400 450 m/z
63 % 72
89
N2
m/z = 344 (or isomers) Mr = 186
345
344
346 343 187
186
158
159
100 %
100 120 140 160 180 200 220 240 260 280 300 320 340 360 380 m/z
Figure 10.24: The mass spectra measured of (a) TPD, (b) TPDOH and (c) TPDCOOH.
292
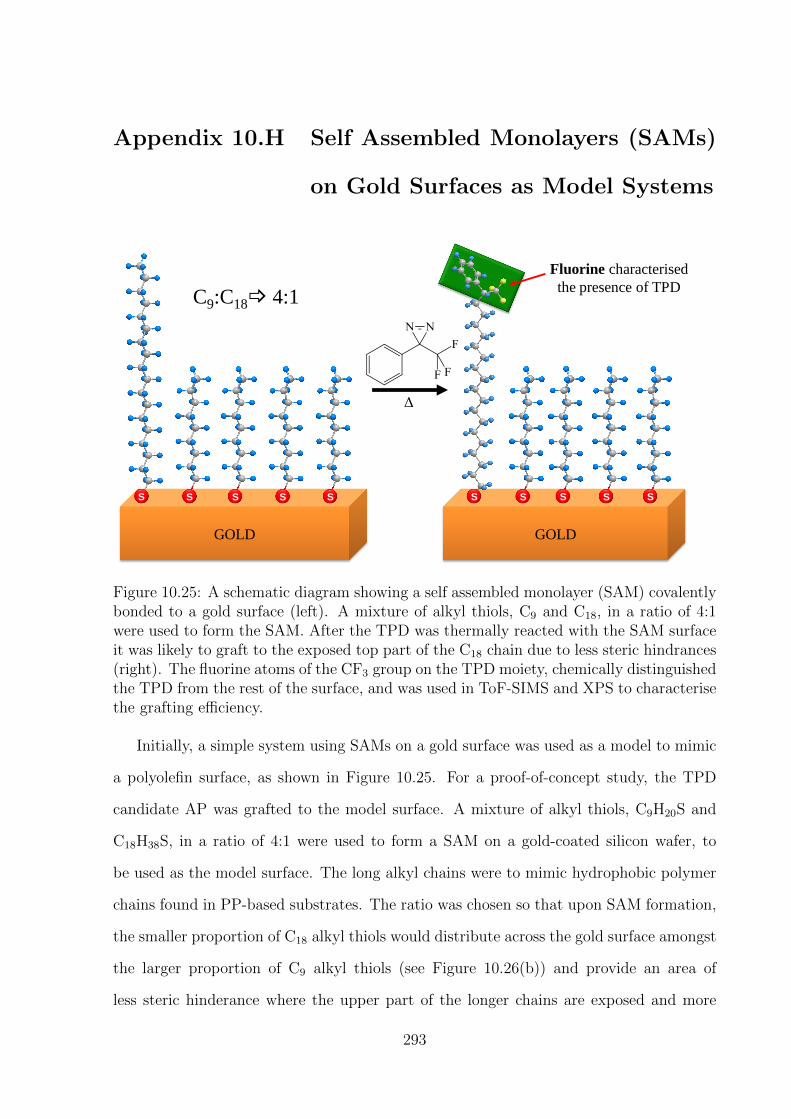
Appendix 10.H Self Assembled Monolayers (SAMs)
on Gold Surfaces as Model Systems
C9:C18 4:1
GOLD GOLD
S
Δ
S
S
S
S
S
S
S
S
S
Fluorine characterised
the presence of TPD
Figure 10.25: A schematic diagram showing a self assembled monolayer (SAM) covalentlybonded to a gold surface (left). A mixture of alkyl thiols, C9 and C18, in a ratio of 4:1were used to form the SAM. After the TPD was thermally reacted with the SAM surfaceit was likely to graft to the exposed top part of the C18 chain due to less steric hindrances(right). The fluorine atoms of the CF3 group on the TPD moiety, chemically distinguishedthe TPD from the rest of the surface, and was used in ToF-SIMS and XPS to characterisethe grafting efficiency.
Initially, a simple system using SAMs on a gold surface was used as a model to mimic
a polyolefin surface, as shown in Figure 10.25. For a proof-of-concept study, the TPD
candidate AP was grafted to the model surface. A mixture of alkyl thiols, C9H20S and
C18H38S, in a ratio of 4:1 were used to form a SAM on a gold-coated silicon wafer, to
be used as the model surface. The long alkyl chains were to mimic hydrophobic polymer
chains found in PP-based substrates. The ratio was chosen so that upon SAM formation,
the smaller proportion of C18 alkyl thiols would distribute across the gold surface amongst
the larger proportion of C9 alkyl thiols (see Figure 10.26(b)) and provide an area of
less steric hinderance where the upper part of the longer chains are exposed and more
293

susceptible to grafting with the TPD (by covalent bonding via C-H insertion).
However, it was shown in previous studies of mixed thiol SAMs that often the solution
composition doesn’t match the final SAM composition on the surface. The degree of order
of the SAM composition and the degree of homogeneity can also vary, as demonstrated in
Figure 10.26. This can be due to preferential absorbance of a particular chain length due
to lower solubility in the solution, a difference in diffusion time scales between the different
chain lengths, and/or greater interactions between longer chains causing domains to form
(larger dispersion forces between longer chains).236,237 It was also demonstrated that a
greater difference between the chain lengths lead to preferential absorbance of the longer
chain length,236 therefore, the proportion of long chains in this study was kept small.
(a)
(b)
(c)
Figure 10.26: A schematic diagram showing three ways in which mixed chain length SAMscan form: (a) ordered, highly packed domains of alike chain lengths, (b) highly packedordered chains at the surface and lower ordering diffuse chains at the outer surface withmixing of the two chain lengths and (c) a less packed, disordered surface where longerchains fold.
294

Furthermore, the so called ”odd-even” effect was also taken into account, as it was
previously shown that there is a difference between the tilt angle of SAMs formed from
an odd or even number of CH2 groups.238 Therefore, a mixture of odd and even chain
lengths were used in this study to influence the packing of the chains, the effect of which
is to create a more diffuse surface due to the difference in tilt angles of C9 (odd) and C18
(even) chains which could aid the grafting of TPD (less steric hindrances at the surface,
allowing better access for TPD to graft).
The SAMs formed were assumed to be well mixed, with a higher order of packing of
the chains closer to the gold surface and a lower degree of order at the outer surface, where
the extra chain length of the longer chains were assumed to be diffuse, as in Figure 10.26
(b). For the purpose of this study, it was sufficient to measure the average film thickness
using ellipsometry, which gave a value of 1.27 ± 0.30 nm. This value is between the film
thickness formed by single C9 (1.1 nm) SAM and a single a C18 (2.0 nm) SAM, previously
reported in literature,239 concluding both the short and longer chains were present.
To verify the SAM formation, ToF-SIMS spectra of the gold substrate before and af-
ter SAM formation were measured. Both positive and negative spectra were measured,
however, the negative spectra gave the most useful information. This was because the
electronegativity of sulphur (from the SAM) favoured negative ion formation. The neg-
ative spectra of the surface after SAM formation is shown in Figure 10.27, highlighting
several characteristic peaks.240
In the low mass region of the negative spectrum, small fragmentations of CH−(m/z =
13), C2H− (m/z = 25), S− (m/z = 32) and SH− (m/z = 33) were enhanced after the SAM
formation. The small intensity of these peaks on the plasma cleaned gold surface indicated
a low hydrocarbon and sulphur contamination, often found on cleaned gold surfaces once
they are exposed to a laboratory atmosphere. However, the enhancement of the these
peaks after the SAM formation indicated the presence of the organosulphur molecules
from the SAM. The positive spectra also indicated the presence of the SAM through the
enhancement of hydrocarbon fragmentation peaks (CxHy+), particularly of CH3
+(m/z =
295

Inte
nsi
ty (
cou
nts
) In
ten
sity
(co
un
ts)
Inte
nsi
ty (
cou
nts
) In
ten
sity
(co
un
ts)
x106
x106
x105
x105
1.0
0.8
0.6
0.4
0.2
5.0
4.0
3.0
2.0
1.0
1.2
1.0
0.8
0.6
0.4
0.2
1.2
1.0
0.8
0.6
0.4
0.2
5 10 15 20 25 30 35 40 45 50 Mass (u)
Mass (u)
Mass (u)
Mass (u)
60 180 200 220 240 260 280 300
550 600 650 700 750
H-
O- OH-
C-
C2H-
CN-
S-
SH-
35Cl-
Au-
C9H19SO3-
M9Au-
Au2-
Au2H-
Au2S-
Au2SH-
M18Au-
(M9-H)Au2-
Au3-
Au3S-
(M18-H)Au2-
M9 = C9H20S
M18 = C18H38S
CH2-
(M9-H)2Au-
Figure 10.27: Regions of the negative ion ToF-SIMS spectrum of the mixed thiol (C9:C18
→ 4:1) SAM on a gold surface, after 24 hours of adsorption, highlighting the characteristicpeaks.
296

15) due to the methyl terminating groups at the surface from the alkanethiols of the SAM.
In the negative spectra in Figure 10.27, the strong peak due to gold was still observed
after the SAM formation at m/z = 197, as well as gold clusters (Au2− and Au3
− at m/z =
394 and 591) and several gold-sulphur fragments such as Au2S− (m/z = 426) and Au2SH−
(m/z = 427).
The smaller fragments merely indicated the presence of the alkanethiols, but it was the
larger peaks at higher m/z values due to fragmentations of the intact thiol molecules that
proved the SAM formation (alkanethiols covalently bonded to the gold surface) and the
presence of both chain lengths, as shown in Figure 10.27. The fragment M9Au−, (denoting
M9 as C9H20S) is shown at m/z = 357, due to the intact smaller chain bonded to gold, and
likewise the fragment M18Au−, (denoting M18 as C18H38S) is shown at m/z = 483, due to
the intact larger chain bonded to gold. The smaller chain clusters with gold, (M9-H)Au2−
and the larger chain clusters with gold, (M18-H)Au2− were also found at m/z = 553 and
679 respectively, as was the smaller chain dimer, (M9-H)2Au− at m/z = 515. This proves
not only were the thiols covalently bonded to the gold, but also that both chain lengths
were present in the SAM formed. The intensity of the dimer suggests the surface is almost
fully covered with a packed SAM with the chains in a vertical orientation, as described
in a previous study by Houssiau et al.240 The mass spectral range was not measured high
enough to see evidence of the longer chain dimer, however, the intensity would likely be
lower due to the smaller amount of longer chains present in the SAM. At higher mass
ranges, trimers formed with gold could also be possible, further demonstrating the packing
of the SAM.240
SAM oxidation was also evident, indicated by the presence of the fragment C9H19SO3−
at m/z = 207 (the Au-S bond is attacked by oxygen atoms241) and the large intensity of
O− and OH− at m/z = 16 and 17 respectively.
297

Appendix 10.I Lowest Energy Conformers of Diaziri-
dine and Diazirine (TPD)
Figure 10.28: Optimised lowest energy conformers of diaziridine (top) and diazirine(=TPD) (bottom), used to calculate the predicted IR spectra.
298
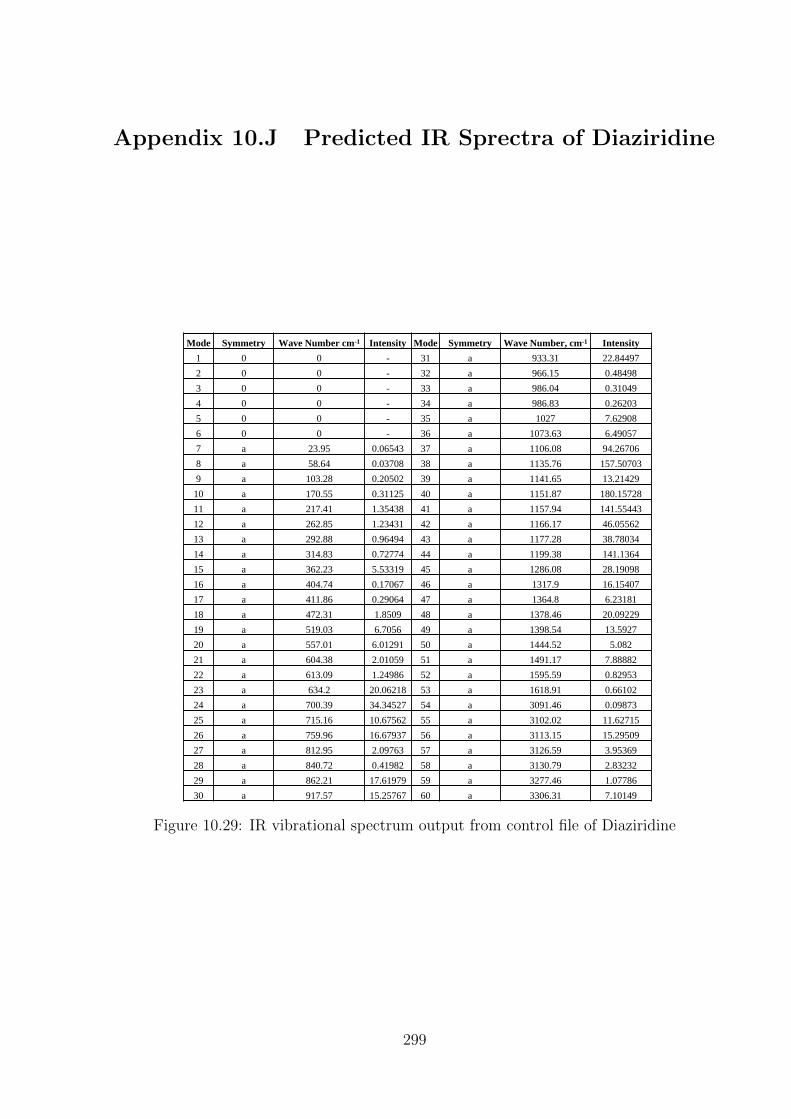
Appendix 10.J Predicted IR Sprectra of Diaziridine
Mode Symmetry Wave Number cm-1 Intensity Mode Symmetry Wave Number, cm-1 Intensity
1 0 0 - 31 a 933.31 22.84497
2 0 0 - 32 a 966.15 0.48498
3 0 0 - 33 a 986.04 0.31049
4 0 0 - 34 a 986.83 0.26203
5 0 0 - 35 a 1027 7.62908
6 0 0 - 36 a 1073.63 6.49057
7 a 23.95 0.06543 37 a 1106.08 94.26706
8 a 58.64 0.03708 38 a 1135.76 157.50703
9 a 103.28 0.20502 39 a 1141.65 13.21429
10 a 170.55 0.31125 40 a 1151.87 180.15728
11 a 217.41 1.35438 41 a 1157.94 141.55443
12 a 262.85 1.23431 42 a 1166.17 46.05562
13 a 292.88 0.96494 43 a 1177.28 38.78034
14 a 314.83 0.72774 44 a 1199.38 141.1364
15 a 362.23 5.53319 45 a 1286.08 28.19098
16 a 404.74 0.17067 46 a 1317.9 16.15407
17 a 411.86 0.29064 47 a 1364.8 6.23181
18 a 472.31 1.8509 48 a 1378.46 20.09229
19 a 519.03 6.7056 49 a 1398.54 13.5927
20 a 557.01 6.01291 50 a 1444.52 5.082
21 a 604.38 2.01059 51 a 1491.17 7.88882
22 a 613.09 1.24986 52 a 1595.59 0.82953
23 a 634.2 20.06218 53 a 1618.91 0.66102
24 a 700.39 34.34527 54 a 3091.46 0.09873
25 a 715.16 10.67562 55 a 3102.02 11.62715
26 a 759.96 16.67937 56 a 3113.15 15.29509
27 a 812.95 2.09763 57 a 3126.59 3.95369
28 a 840.72 0.41982 58 a 3130.79 2.83232
29 a 862.21 17.61979 59 a 3277.46 1.07786
30 a 917.57 15.25767 60 a 3306.31 7.10149
Figure 10.29: IR vibrational spectrum output from control file of Diaziridine
299

Appendix 10.K Predicted IR Sprectra of Diazirine
(TPD )
Mode Symmetry Wave Number cm-1 Intensity Mode Symmetry Wave Number cm-1 Intensity
1 0 0 - 28 a 864.16 0.40827
2 0 0 - 29 a 910.8 0.11312
3 0 0 - 30 a 929.66 32.91528
4 0 0 - 31 a 953.69 0.44715
5 0 0 - 32 a 983.14 0.14576
6 0 0 - 33 a 983.23 0.03399
7 a 12.4 0.01893 34 a 1032.4 2.46951
8 a 60.8 0.12007 35 a 1063.86 31.46868
9 a 123.43 0.09125 36 a 1097.75 22.02153
10 a 133.92 0.62525 37 a 1145.9 14.0319
11 a 227.56 1.07858 38 a 1148.55 237.84775
12 a 253.32 1.08038 39 a 1169.87 163.98502
13 a 313.21 0.54211 40 a 1184 39.65147
14 a 326.14 0.48139 41 a 1221.27 144.82524
15 a 365.21 0.54212 42 a 1313.16 30.58312
16 a 398.85 0.01041 43 a 1329.27 60.54378
17 a 435.28 0.8971 44 a 1368.66 0.50716
18 a 440.82 3.7604 45 a 1445.86 3.15285
19 a 535.06 6.30241 46 a 1496.29 16.52787
20 a 559.93 2.60523 47 a 1591.83 7.49672
21 a 594.6 1.77371 48 a 1619.32 2.08003
22 a 611.55 0.02023 49 a 1682.14 68.97216
23 a 641.01 16.59432 50 a 3095.66 0.05604
24 a 692.57 32.10916 51 a 3105.29 8.60974
25 a 727.44 6.77702 52 a 3116.27 13.40557
26 a 759.48 23.18838 53 a 3124.98 5.75669
27 a 823.7 0.46838 54 a 3141.89 1.58023
Figure 10.30: IR vibrational spectrum output from control file of Diazirine
300

Appendix 10.L Predicted Excited States of TPD, TP-
DOH and TPDCOOH
Molecule
Geometry Optimization - both
individually
[atomic units (au)] T-S [kJ mol-1]
MSSCF
(frozen 11, closed 37
(total occupied: 40)
MSSCF
(frozen 11, closed 37
(total occupied: 40) T-S [kJ mol-1]
Singlet (S) Triplet (T) Singlet (S) T-S [kJ mol-1]
TPD -606.833 -606.848 -38.2 -603.685 -603.696 -27.0
TPDOH -721.273 -721.285 -32.2 -717.490 -717.496 -15.3
TPDCOOH -795.282 -795.300 -47.1 -791.156 -791.168 -32.4
Figure 10.31: Predicted electronic excited states of TPD, TPDOH and TPDCOOH. Theenergy of the optimised states is given in atomic units (au). The difference between theexcited states was convert from the atomic unit of energy, called Hartree: 1 Hartree =2625.5 kJ/mol. Geometry optimisation method = BP86/def2-SV(P).
301

Appendix 10.M Adhesion Promoter Synthesis
10.M.1 Synthesis of 3-phenyl-3-(trifluoromethyl)-3H-
diazirine (or TPD)
Figure 10.32 shows the synthesis steps for the synthesis of 3-phenyl-3-(trifluoromethyl)-
3H-diazirine (TPD). Each step is described below.
Δ or hυ
1 2 3
4 5 6
Figure 10.32: Reaction scheme for synthesis of 3-phenyl-3-(trifluoromethyl)-3H-diazirine(or TPD)
10.M.1.1 Step 1: 2,2,2-trifluoro-1-phenylethanone oxime (2) from 2,2,2-trifluoro-
1-phenylethanone (1)
2,2,2-trifluoro-1-phenylethanone (1) (ALFA AESAR, VWR) (20.9 g, 0.12 mol) and 9.17
g (0.13 mol) of hydroxyl ammonium chloride were dissolved in 120 ml ethanol. The pH
was continuously adjusted to 5 with a 4 M NaOH solution whilst refluxing the mixture
for 5 hours. Precipitated sodium chloride was removed by filtration, washed with 10 ml
302

of ethanol and the filtrates evaporated to dryness. The residue was dissolved in 400 ml
ethyl acetate and extracted 3 times with water (400 ml) before being dried with Na2SO4.
Evaporation of the solvent yielded the crude 2,2,2-trifluoro-1-phenylethanone oxime (2) in
86 % yield, 1H NMR (CDCl3): 2.1 (OH), 7.5-7.6 (aromatic). Chemical analysis calculated
for C8H6F3NO (%): C (50.8); H(3.2); N (7.4); F (30.1); O (8.5) and chemical analysis
measured (%):C (50.6); H(3.4); N (7.5); F (30.0); O (8.4).
10.M.1.2 Step 2: 2,2,2-trifluoro-1-phenylethanone O-tosyl oxime (3) from (2)
Oxime (2) (19.5 g, 0.10 mol) and 23.11 g (0.12 mol) p-toluenesulphonylchloride were
dissolved in 200 ml pyridine and refluxed for 6 hours. The solvent was removed at reduced
pressure, and the remaining solid was dissolved in 300 ml ethyl acetate to give pH = 5.
The solution was extracted with water (1x 100 ml) to give pH = 3, 0.1 M HCl (2 x 50
ml) to give pH = 1 and a concentrated solution of NaHCO3 (2 x 50 ml) to give pH = 10.
The organic layer was dried over Na2SO4. Evaporation of the solvent yielded the crude
tosylate (3). To purify the oxime, 3 g (9 mmol) of crude tosylate (3) was dissolved in 45
ml toluene and lightly stirred in a water bath at 58 ◦C. 50 ml of cyclohexane was added
to the solution dropwise to afford the recrystallised product precipitate from the solution.
Yield: 75 % based oxime (26.5 g); 1H NMR (CDCl3): 2.4 (CH3), 7.2-7.8 (aromatic).
Chemical analysis calculated for C15H12NO3F3S (%): C (52.5); H(3.5); N (4.1); O (14.0);
F (17.1); S (9.3) and chemical analysis measured (%):C (52.7); H(3.6); N (4.0); O (14.0);
F (17.1); S (9.5).
10.M.1.3 Step 3: 3-phenyl-3-(trifluoromethyl)diaziridine (4) from (3)
2,2,2-trifluoro-1-phenylethanone O-tosyl oxime (3) (14.0 g, 0.04 mol) was dissolved in 80
ml THF and cooled to −78 ◦C using dry ice. The apparatus used for the addition of liquid
ammonia is shown in Figure 10.33. Approximately 6 ml of liquid ammonia was added and
the mixture stirred in the flask at room temperature for 12 hours, allowing the gas to be
leave through the pressure release system built. The crystallised p-tolenesulfonylamide
303

9.
1. 2.
3.
4.
5.
6.
7.
8.
1. 2.
3.
4.
5.
6.
7. 8.
9.
Figure 10.33: Reaction set-up for addition of liquid ammonia to reaction mixture: 1. Gasrelease bottle containing acetic acid (50 % in water); 2. Empty safety pressure release (incase acid jumps from other bottle under pressure); 3. Over pressure release (containingmetal balls to maintain pressure); 4. Thermometer; 5. Mechanical stirrer; 6. Cold finger(containing dry ice, −78.5 ◦C); 7. Ammonia gas cylinder; 8. 4-necked round bottomedflask containing reaction dispersion; 9. Dish filled with dry ice & acetone to maintain coldreaction dispersion and keep ammonia in its liquid phase as long as possible.
304

was removed by filtration and washed with THF. The remaining solution was dissolved
in 100 ml ethyl acetate, and the organic phase was extracted twice with water (2 x
50 ml) and dried over Na2SO4. Evaporation of the solvent yielded a red/orange oil
(4), which crystallised overnight at room temperature. To purify the crude product,
it was dissolved in a minimum amount of cyclohexane using a water bath at 45 ◦C (mp is
30 − 33 ◦C, therefore, product was melted) and then the solution was allowed to cool to
room temperature, allowing clean crystal formation. The crystals were filtered and dried.
Crude yield = 9.08 g (containing starting material and product, 118 %), recrystallised
product (purified) = 4.92 g (64 %); 1H NMR (CDCl3): 4.03 and 4.14 (AB-system, J=8
Hz, 2H), 7.4-7.6 (multiplet, 5H). Chemical analysis calculated for C8H7N2F3(%): C (51.1);
H(3.8); N (14.9); F (30.3) and chemical analysis measured (%):C (51.3); H(4.0); N (14.3);
F (30.1) [evidence of O (<0.5 %) was also observed].
Figure 10.34: Possible stereoisomers of 2,2,2-Trifluoromethyl-3-phenyldiaziridine. 3D im-ages: energy minimisation ran through chemBio3D version 12.0, using implemented MM2energy minimise option (pink sphere = lone pair of electrons, yellow = fluorine, blue =nitrogen, white = hydrogen, grey = carbon).
10.M.1.4 AB System
The AB quartet system observed from the NH protons was found to be due to a trans
stereoisomer shown in Figure 10.34. Figure 10.35 shows the 1H NMR, highlighting the NH
protons, which were confirmed by a D2O shake (in which the NH protons were substituted
305
by deuterium, resulting in the loss of the NH resonance signals). The coupling between
the HH protons and the aromatic protons was confirmed with 2D COSY, whilst the
2D NOSEY spectrum assessed the stereo information of the diaziridine and showed a
strong nuclear overhauser effect (NOE) signal between an ortho (o-) aromatic H and only
1 NH proton. Therefore, this NH and o-H were within a 5 A proximity (limit for an
NOE detection) and the distance between the other NH proton and aromatic protons was
greater, suggesting a trans isomer as shown in the 3D diagrams in Figure 10.34.
AB quartet systems are often observed when two protons couple to one-another, and
the difference in coupling constant (JAB) is negligible compared to the difference in chem-
ical shift (dAB). The AB quartet is described by second order arithmetic and JAB was
calculated to be 8.18 Hz (average). Coalescence, defined as the temperature at which the
appearance of the spectrum changes from that of two separate peaks to a single peak, was
not observed at temperatures up to 120 ◦C. Two well resolved doublets were observed
due the angular strain within the three-membered ring of the diaziridine functional group,
which hindered the change of the bond angle to 120 ◦ for the transition state required for
nitrogen inversion (energy too high).
10.M.1.5 Step 4: 3-phenyl-3-(trifluoromethyl)-3H-diazirine (or TPD)(5) from
(4)
Silver oxide was made by boiling a solution of silver nitrate (AnalaR Normapur, VWR)
(17.0 g, 0.1 mol) in 50 ml water and adding 100 ml NaOH slowly, dropwise. The silver
oxide was filtered on sintered glass and washed thoroughly with water, acetone and THF.
Silver oxide (7.0 g, 0.03 mol) was added to a solution of 3.0 g (16 mmol) diaziridine (4)
in 65 ml THF, and the dispersion stirred at room temperature for 5 hours. Although
the vessel was covered in foil to avoid light decomposition, it was later found this was
not necessary. Progress of the reaction was followed by TLC (cyclohexane: methylene
chloride: methanol, 19:2:1, Rf (diazirine)=0.7, Rf (diaziridine)=0.3), and measured by the
UV-Vis absorbance at 356 nm (Eλ=356nm (diaziridine) = 0; Eλ=356nm (diazirine) = 263.5
306

M−1cm−1). Yield based on λ356nm = 90 - 95 % (∼ 2.7 g). Silver oxide was removed by
filtration and washed with THF. The combined filtrates were dried over Na2SO4 and the
solvent was evaporated under reduced pressure at room temperature to approximately 50
wt.%. The yellow liquid was separated by column chromatography and monitored with
TLC (eluent = cyclohexane: methylene chloride: methanol, 19:2:1 as mentioned above).
The product was stored in the dark at 3 ◦C. 1H NMR (CDCl3): 7.2-7.6 (aromatic),
λmax (toluene) = 356 nm, Eλ=356nm = 263.5 M−1cm−1. Chemical analysis calculated for
C8H5F3N2 (%): C (51.6); H(2.7); N (15.1); F (30.6) and chemical analysis measured (%):
C (51.5); H (2.8); N (15.1); F (30.4).
NHNH
0.00.51.01.52.02.53.03.54.04.55.05.56.06.57.07.5f1 (ppm)
-0.0
0 TM
S
2.51
DM
SO
3.42
HD
O
16,17,18,19,20 14,15
3.984.024.064.104.14f1 (ppm)
A (d)4.14
J(8.22)
B (d)4.03
J(8.14)
1.12
1.00
8.22 8.14
1
23
4
56 7
8F9
F10
F11
N12
N13
H14
H15H
16
H17
H18
H19
H20
5H, Aromatic H's
Impurity
AB System
(a)
0.00.51.01.52.02.53.03.54.04.55.05.56.06.57.07.5f1 (ppm)
2.22.32.42.52.62.72.8f1 (ppm)
NH NH
(b)
3.954.004.054.104.154.207.107.157.207.257.307.357.407.457.507.55f2 (ppm)
4.0
4.1
4.2
4.3
7.3
7.4
7.5
7.6
f1 (p
pm)
Coupling between aromatic H's
Coupling between NH's
(c)
3.63.84.04.24.44.64.85.05.25.45.65.86.06.26.46.66.87.07.27.47.6f2 (ppm)
4.0
4.5
5.0
5.5
6.0
6.5
7.0
7.5
8.0
f1 (p
pm)
1
2
3
4
5
6 7
8F9
F10
F11
N12
N13
H14
H15H
16
H17
H18
H19
H20
NH's
NH's
Aromatic H's
Aromatic H's
7.407.447.487.52f2 (ppm)
3.9
4.0
4.1 f1 (p
pm)
3.954.004.05f2 (ppm)
7.4
7.5
7.6
f1 (p
pm)
(d)
Figure 10.35: NMR spectra of diaziridine, 4: (a) 1H NMR spectrum (insert of NH protons,AB system), (b) 1H NMR spectrum before and after D2O shake up, (c) 2D COSY 1HNMR spectrum and (d) 2D NOSEY spectrum.
307

Appendix 10.N Statistical Modelling Data
# Var Type label1 label2 label3 N Mean Median Stddev Min Max
1 obsnr integer 279 140.00 140.00 80.68 1.00 279.00
2 cht integer Adhesion
Tests
CHT (%
Adhesion) 279 37.13 0.00 48.04 0.00 100.00
3 sjt integer SJT (%
Adhesion) 96 16.25 0.00 28.33 0.00 100.00
4 prom character
Adhesion
Promoter
Application
Adhesion
Promoter Type 279 nlevels=4 --- --- --- ---
5 conc numeric Concentration
(M) 279 0.31 0.01 1.36 0.01 7.00
6 meth character Application
method 279 nlevels=2 --- --- --- ---
7 cure character Curing Method 279 nlevels=3 --- --- --- ---
8 spray integer No. Sprays 240 2.30 2.00 0.78 2.00 5.00
9 temp integer Temperature
(°C) 112 88.57 80.00 9.94 80.00 100.00
10 time numeric Time (hours) 112 12.46 10.00 7.11 0.50 30.00
11 uv integer
UV Radiant
exposure
(mJ/cm2)
164 1541.34 1278.00 860.79 120.00 2837.00
12 intens numeric
Normalised ToF
SIMS F-
Intensity
40 80.12 89.50 59.41 0.99 182.00
13 xps numeric
XPS F wt.% 40 4.62 2.31 4.59 0.00 12.00
14 xps.sd numeric ± 40 0.40 0.27 0.44 0.00 1.98
15 ra numeric Surface
Roughness After
Primer
Application
Ra 40 234.65 236.41 15.30 205.67 267.28
16 ra.sd numeric ± 40 13.47 13.12 6.71 2.44 28.38
17 rq numeric Rq 40 294.56 296.66 25.47 223.93 352.72
18 rq.sd numeric ± 40 23.21 18.55 17.97 4.08 92.98
19 wash character
Surface Energy
After Primer
Application
Wash Step? 12 nlevels=3 --- --- --- ---
20 disp numeric S.E. (disp) 74 20.70 25.00 13.25 0.10 44.84
21 polar numeric S.E. (polar) 74 11.57 10.83 9.22 0.01 24.73
22 total numeric S.E. (total) 74 30.12 29.54 5.93 20.72 46.00
23 type character
Substrate
Substrate Type 279 nlevels=10 --- --- --- ---
24 epdm integer %EPDM 279 8.16 2.00 8.72 0.00 25.00
25 pp character Industrial or
Research PP 279 nlevels=2 --- --- --- ---
26 ra2 integer Surface
Roughness
Untreated
Substrate
Ra 279 173.66 156.00 71.51 16.00 258.00
27 ra2.sd integer ± 279 26.69 18.00 24.39 3.00 99.00
28 rq2 integer Rq 279 232.72 244.00 87.72 21.00 329.00
29 rq2.sd integer ± 279 33.28 28.00 29.35 5.00 122.00
30 hard numeric
Substrate
Hardhness
(Gpa) at 800
nm
279 0.03 0.02 0.01 0.01 0.06
31 modul numeric
Substrate E
modulus (Gpa)
at 800 nm
279 0.74 0.58 0.36 0.41 1.46
32 disp2 numeric Surface Energy
of Untreated
Substrate
S.E. (disp) 279 24.27 24.26 1.20 22.51 25.81
33 polar2 numeric S.E. (polar) 279 0.39 0.12 0.52 0.00 1.91
34 total2 numeric S.E. (total) 279 25.04 25.36 0.98 23.46 25.93
Responses Yj
Factors Xi potentially affecting Yj
Figure 10.36: A list of the numerical, catagorical data. Red = lead responses yj. Blue =factors xi (that were controlled), potentially affecting yj. Black = variables measured.
308

Cure
AP Wet-on-Wet Thermal UV
TPD 0 6 3
TPDCOOH 1 52 102
TPDOH 2 54 59
Figure 10.37: The number of samples measured from the adhesion tests, demonstratingthe slicing of data that occured.
309
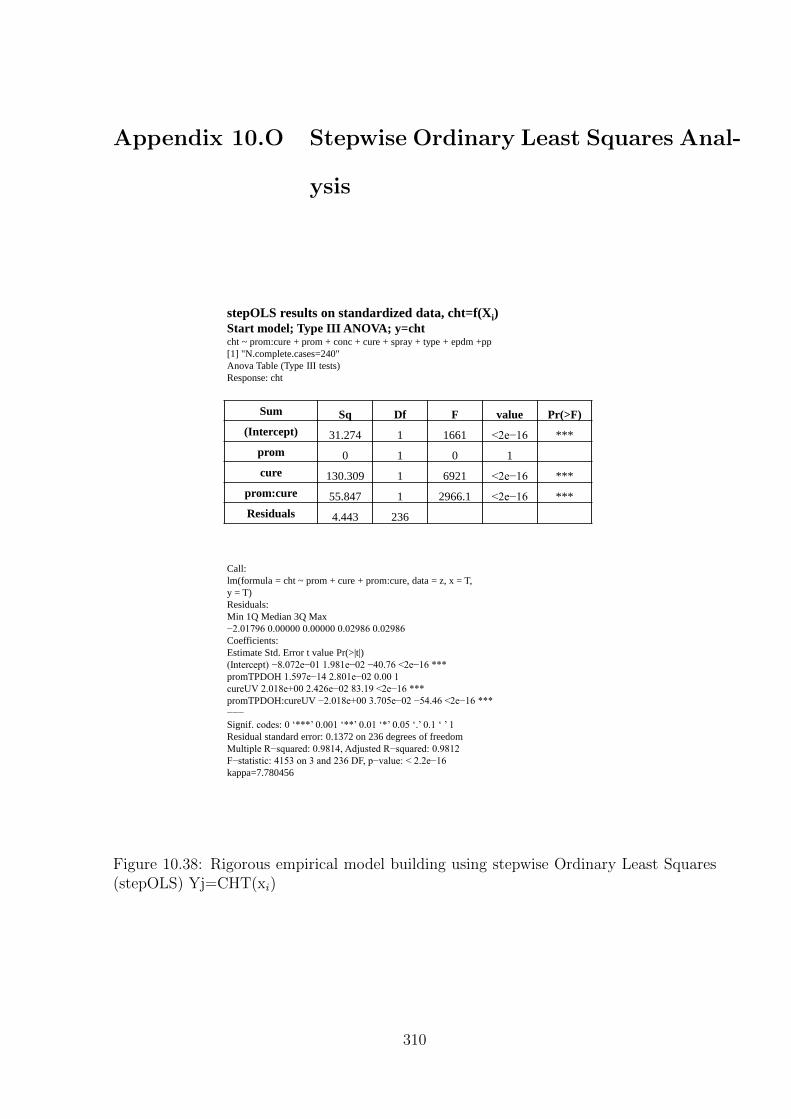
Appendix 10.O Stepwise Ordinary Least Squares Anal-
ysis
stepOLS results on standardized data, cht=f(Xi)
Start model; Type III ANOVA; y=cht cht ~ prom:cure + prom + conc + cure + spray + type + epdm +pp
[1] "N.complete.cases=240"
Anova Table (Type III tests)
Response: cht
Signif. codes: 0 ‘***’ 0.001 ‘**’ 0.01 ‘*’ 0.05 ‘.’ 0.1 ‘ ’ 1
Sum Sq Df F value Pr(>F)
(Intercept) 31.274 1 1661 <2e−16 ***
prom 0 1 0 1
cure 130.309 1 6921 <2e−16 ***
prom:cure 55.847 1 2966.1 <2e−16 ***
Residuals 4.443 236
Call:
lm(formula = cht ~ prom + cure + prom:cure, data = z, x = T,
y = T)
Residuals:
Min 1Q Median 3Q Max
−2.01796 0.00000 0.00000 0.02986 0.02986
Coefficients:
Estimate Std. Error t value Pr(>|t|)
(Intercept) −8.072e−01 1.981e−02 −40.76 <2e−16 ***
promTPDOH 1.597e−14 2.801e−02 0.00 1
cureUV 2.018e+00 2.426e−02 83.19 <2e−16 ***
promTPDOH:cureUV −2.018e+00 3.705e−02 −54.46 <2e−16 ***
−−−
Signif. codes: 0 ‘***’ 0.001 ‘**’ 0.01 ‘*’ 0.05 ‘.’ 0.1 ‘ ’ 1
Residual standard error: 0.1372 on 236 degrees of freedom
Multiple R−squared: 0.9814, Adjusted R−squared: 0.9812
F−statistic: 4153 on 3 and 236 DF, p−value: < 2.2e−16
kappa=7.780456
Figure 10.38: Rigorous empirical model building using stepwise Ordinary Least Squares(stepOLS) Yj=CHT(xi)
310

Sum Sq Df F value Pr(>F)
(Intercept) 0.643 1 0.9335 0.336525
conc 8.448 1 12.2606 0.000719 ***
spray 0.201 1 0.2923 0.590094
uv 9.904 1 14.3744 0.000269 ***
spray:uv 8.518 1 12.3629 0.000685 ***
Residuals 62.7 91
stepOLS results on standardized data, sjt=f(Xi)
Start model; Type III ANOVA; y=sjt sjt ~ (conc + spray + uv + type + epdm + pp)^2 + I(conc * conc) + I(spray * spray) +
I(uv * uv) + I(epdm * epdm)
[1] "N.complete.cases=96"
Anova Table (Type III tests)
Response: sjt
Call:
lm(formula = sjt ~ conc + spray + uv + spray:uv, data = z, x = T,
y = T)
Residuals:
Min 1Q Median 3Q Max
−2.2481 −0.3814 −0.1956 0.3370 3.0404
Coefficients:
Estimate Std. Error t value Pr(>|t|)
(Intercept) −0.08513 0.08811 −0.966 0.336525
conc 0.32913 0.09400 3.502 0.000719 ***
spray −0.05269 0.09747 −0.541 0.590094
uv 0.33854 0.08929 3.791 0.000269 ***
spray:uv 0.32179 0.09152 3.516 0.000685 ***
−−−
Signif. codes: 0 ‘***’ 0.001 ‘**’ 0.01 ‘*’ 0.05 ‘.’ 0.1 ‘ ’ 1
Residual standard error: 0.8301 on 91 degrees of freedom
Multiple R−squared: 0.34,Adjusted R−squared: 0.311
F−statistic: 11.72 on 4 and 91 DF, p−value: 1.014e−07
kappa=1.76137
sjt
Figure 10.39: Rigorous empirical model building using stepwise Ordinary Least Squares(stepOLS) Yj=SJT(xi)
311
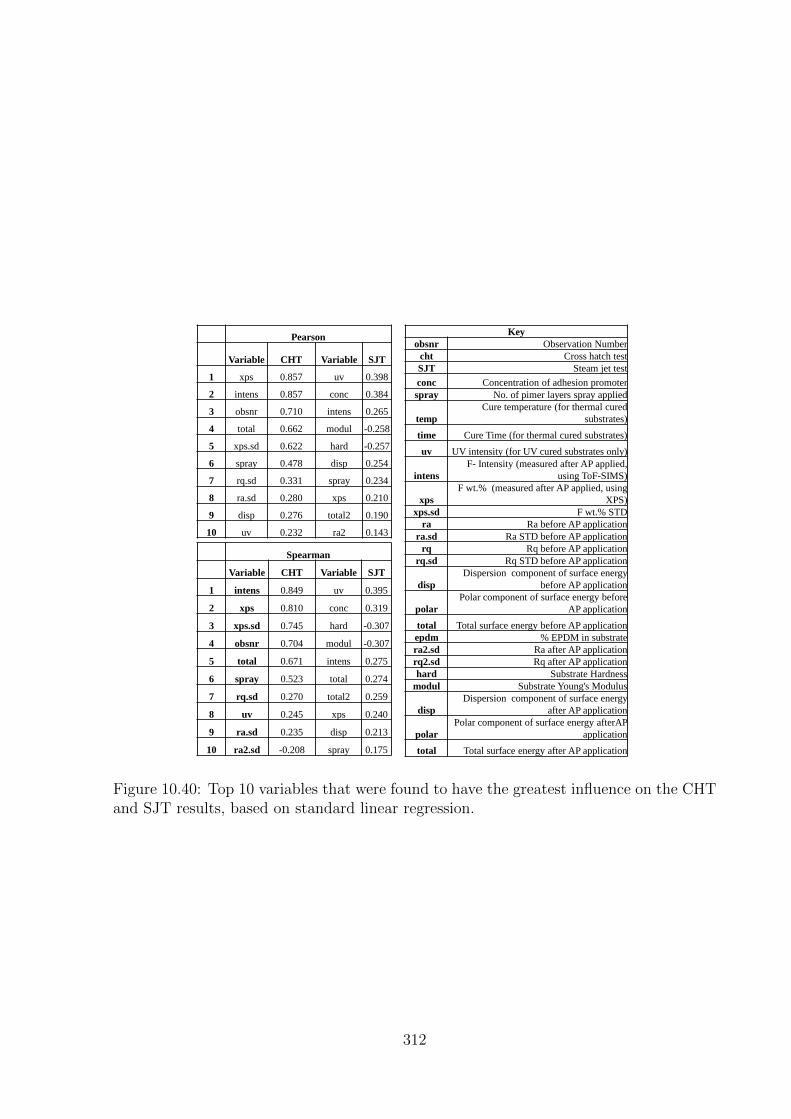
Spearman
Variable CHT Variable SJT
1 intens 0.849 uv 0.395
2 xps 0.810 conc 0.319
3 xps.sd 0.745 hard -0.307
4 obsnr 0.704 modul -0.307
5 total 0.671 intens 0.275
6 spray 0.523 total 0.274
7 rq.sd 0.270 total2 0.259
8 uv 0.245 xps 0.240
9 ra.sd 0.235 disp 0.213
10 ra2.sd -0.208 spray 0.175
Pearson
Variable CHT Variable SJT
1 xps 0.857 uv 0.398
2 intens 0.857 conc 0.384
3 obsnr 0.710 intens 0.265
4 total 0.662 modul -0.258
5 xps.sd 0.622 hard -0.257
6 spray 0.478 disp 0.254
7 rq.sd 0.331 spray 0.234
8 ra.sd 0.280 xps 0.210
9 disp 0.276 total2 0.190
10 uv 0.232 ra2 0.143
Key
obsnr Observation Number
cht Cross hatch test
SJT Steam jet test
conc Concentration of adhesion promoter
spray No. of pimer layers spray applied
temp
Cure temperature (for thermal cured
substrates)
time Cure Time (for thermal cured substrates)
uv UV intensity (for UV cured substrates only)
intens
F- Intensity (measured after AP applied,
using ToF-SIMS)
xps
F wt.% (measured after AP applied, using
XPS)
xps.sd F wt.% STD
ra Ra before AP application
ra.sd Ra STD before AP application
rq Rq before AP application
rq.sd Rq STD before AP application
disp
Dispersion component of surface energy
before AP application
polar
Polar component of surface energy before
AP application
total Total surface energy before AP application
epdm % EPDM in substrate
ra2.sd Ra after AP application
rq2.sd Rq after AP application
hard Substrate Hardness
modul Substrate Young's Modulus
disp
Dispersion component of surface energy
after AP application
polar
Polar component of surface energy afterAP
application
total Total surface energy after AP application
Figure 10.40: Top 10 variables that were found to have the greatest influence on the CHTand SJT results, based on standard linear regression.
312

Appendix 10.P Patent Search
Patent Search 2012 Summary of Findings
Criteria:
Functionalized photo- or thermoreactive (carbene) precursors as adhesion promoters for
coatings which can be coupled to nonpolar polymer surfaces (especially PP or polyethylene
(PE))
1. *Thermal or Unspecified Curing*, carbene generating species, on non-reactive sur-
faces (e.g. Plastics) [see Figures 10.42 - 10.43 for patent number references]
(a) Patent no. 55 (DERWENT database) Production of substrate having adhesive
surface for wide variety of substrate with carbene precursor, generating carbene
reactive intermediate and converting precursor; Carbene precursor compound
(specific compounds include diazo compounds); substrates can be polyolefins,
rubbers etc (covers PP and PP with EPDM); Curing of carbene not stated
(b) Patent no. 41 (PATBASE search) Process for surface functionalisation of poly-
meric substrates using diaryl carbenes as reactive intermediates; solid surface
is not specific; photolytic or thermolytic
(c) Patent no. 16 (CA database) Method for modifying a surface of plastic con-
tact lenses during molding; methylene derivative carbene; modifying surface;
hydrophilic coatings; plastics; does not specify curing conditions of carbene
but it is put in to the mold of the lens
(d) Patent no. 36 (PATBASE search) Functional Surface Coatings; various solid
substrates; preparing functional thin films or coatings; provides surface coat-
ings that specifically recognises target proteins, many carbene generating species
listed incl. Diazirines
(e) Patent no. 49 (DERWENT search) New functionalised compound useful e.g.
as an agent for producing a chemically-bound three-dimensional network on or
313

within a substrate; carbene reactive intermediates; disposing a coating formu-
lation onto the surface of a substrate; diazo carbenes listed; BUT PP is not in
long list of polymers but thermoplastic elastomer is listed
(f) Patent no. 64 (DERWENT search) Formation of electrically conductive im-
pregnated fibres for radio-frequency shielded plastic articles inlvolves feeding
electrically conductive fibres into bath containing organic wetting agent and
applying thermoplastic tor thermoset sheath; Sheath can be PP or elastomer;
coupling agent can be carbene
(g) Patent no. 71 (DERWENT search) Modifying substrate with covalently bonded
polymer by coating with polymer containing latent reactive group, then activat-
ing, useful for implants in humans; Active forms include carbene; stimulation
is by heating or electromagnetic radiation incl. UV, Visible and IR; wide va-
riety of substrates; latent group is covalently bonded to polymer molecules of
substrate
MAYBE OF INTEREST for the EPDM containing substrates:
(h) Patent No. 76 (DERWENT search) Adhesives for bonding natural or synthetic
rubber to solid supports; Halo or dichlorocarbene is the preferred carbene; the
rubbers contain double bonds but it is the nitroso compounds added that
improve the adhesion (Nitroso compounds are a class of organic compounds
containing the nitroso functional group, RN=O)
2. *UV Curing or other*, Carbene generating species, on non-reactive surfaces (e.g.
Plastics)
(a) Patent no. 14 (CA search) Photocurable coating compositions with good adhe-
sion and scratch resistance for Plastics; BUT substrate is described in abstract
as a polycarbonate (not as inhert as PP?- contains O); good adhesion of coat-
ing; No mention of PP; metal halide lamp irradiation; Diazonium compounds
314

(b) Patent no. 6 (Web of Science search) Oriented and covalent immobilization
of target molecules to solid supports synthesis and application of a light-
activatable and thiol-reactive cross-linking reagent; covalent bond; Diazirine;
light activation; coupling of carbene to inert support; carbene-mediated inser-
tion into the surface materials; Glass and Polystyrene as substrates (polystyrene
is hydrophobic);; inhert surfaces
(c) Pantent no. 11 (CA search) Methods for modification of surfaces with nanopar-
ticles; UV irradiation grafting of nanopartles; mentions phenyl diazirine as link-
ing agent for nanoparticles and polystyrene substrate (hydrophobic substrate);
nanoparticles are spin-coated onto polystyrene substrate
(d) Patent no. 12 (CA search) Novel photoreactive copolymers for surface modifi-
cation for increasing hydrophilicty, reducing adsorption and providing substance-
immobilizing sites; UV radiation; photoreactive group is described by diazirine;
coating of surface; Biological adhesion is mentioned but the inhibition of sur-
face adhesion!
(e) Patent no. 15 (CA search) Photocoupling of medical polymers with good sur-
face lubricity by photocoupling optically active group-containing copolymers;
e.g. of medical polymer is polyethylene (hydrophobic); UV light coupling of
copolymer to medical polymer; PP also listed; Azido (N3 functional group)
photoactive group- can it form carbenes?
(f) POI: Patent no. 3 (Web of Science search) Activation of bifunctional coupling
agents in fiberglass/polyethylene composites by electron beam; Diazo com-
pounds; Adhesion is a key word; BUT its for coupling between fiberglass and
plastic phases
3. Grey Area:
(a) Carbene generating species, any type of curing (UV and thermal), on unreac-
tive solid surfaces (not specific), *adhesion promoter for coatings*
315

(b) Carbene generating species, any type of curing (UV and thermal), on unreac-
tive surfaces (e.g. Plastics), *adhesion promoter for coatings*
316

Web
of
Scie
nce
Resu
lt(H
ITS
/Perh
ap
s o
f In
terest
)R
ea
cti
ve s
pecie
sA
dh
esi
on
?C
urin
g m
eth
od
co
ati
ng
s m
en
tio
ned
?P
ho
toa
ffin
ity l
ab
ell
ing
?S
urfa
ce?
PP
?J
ou
rn
al/
Pa
ten
tA
uto
mo
tive?
11
HD
iazo
carb
on
yl
com
pou
nd
sN
Pd
-com
ple
xes
YN
Met
al
NJ
N
22
HD
iazi
rin
eN
UV
NY
Pro
tein
s/N
ucl
eic
aci
dN
JN
33
HD
iazo
com
pou
nd
NE
lect
ron
bea
m a
nd
hea
t tr
eatm
ent
NN
Poly
eth
yle
ne/
Fib
regla
ssN
JN
44
HD
iazi
rin
eN
UV
NY
HIV
-1 r
ever
se t
ran
scri
pta
seN
JN
55
HD
iazi
rin
eN
Lig
ht
NY
An
tib
od
ies
NJ
N
66
HD
iazi
rin
eN
Lig
ht
YN
Gla
ss a
nd
Poly
styre
ne
NJ
N
17
PoI
Dia
zo r
esin
NU
VY
NJu
st s
ays
sub
stra
te!
NJ
N
CA
18
HD
iazo
met
han
eY
UV
YN
Cro
ss-l
ink
ing
NP
N
29
HC
arb
enes
e (m
erh
yle
ne
der
ivati
ves
, n
itre
nes
, azi
des
)N
Does
not
say
N
N (
poly
pro
pyle
ne
com
posi
tion
for
mu
ltip
layer
ed p
ipes
)P
oly
pro
pyle
ne
YP
N
31
0H
Dia
ziri
ne
NU
V a
nd
hyd
rogen
YN
NN
PN
41
1H
Dia
ziri
ne
NU
VY
NP
oly
styre
ne
NP
N
51
2H
Dia
ziri
ne
YU
VY
NN
(so
lid
su
rface
)N
PN
61
3H
Dif
luoro
carb
ene
NH
ot
wir
e ch
emic
al
vap
ou
r d
eposi
tion
YN
Sil
icon
wafe
rsN
JN
71
4H
Dia
zom
eth
an
eY
Ph
oto
cura
ble
YN
Pla
stic
sC
ou
ld b
eP
N
81
5H
3-a
zid
ost
yre
ne
NU
VN
N
Med
ical
poly
mer
sY
PN
91
6H
Carb
enes
(m
eth
yle
ne
der
ivati
ve)
ND
oes
not
say
YN
Pla
stic
con
tact
len
ses
NP
N
10
17
HP
eroxid
ase
is
men
tion
edY
rad
ical
gra
ftin
g
wate
r so
lub
le v
arn
ish
bu
t
the
word
coati
ngs
is n
ot
men
tion
edP
oly
eth
yle
ne,
Poly
pro
pyle
ne
YP
N
11
18
HD
iazo
ace
tate
Y (
pre
ven
tion
of
ad
h o
f b
act
eria
)P
lasm
aY
NP
rost
het
ic m
ate
rials
(im
pla
nts
etc
)N
JN
12
19
HC
arb
ene
(met
hyle
ne
der
ivati
ves
, azi
de,
dia
zo c
om
pou
nd
s)Y
Ad
ded
in
poly
mer
mel
tN
NM
ixed
in
poly
ole
fin
s (m
enti
on
s p
oly
eth
yle
ne)
NP
N
13
20
HC
arb
ene
NU
V o
r vis
ible
lig
ht
irra
dia
tion
YN
Con
tact
Len
sN
PN
14
21
HD
iazi
rin
eN
Ph
oto
cura
ble
N (
pri
mer
is)
YH
IVN
JN
15
22
HC
arb
ene
(or
Nit
ren
e)N
Not
men
tion
edY
NC
on
tact
Len
s/ B
iom
edic
al
art
icle
sN
PN
16
23
HA
zid
eN
Gra
fted
YN
Th
erm
op
last
ic b
len
d c
om
posi
tion
sC
ou
ld b
eP
N
17
24
HD
iazi
rin
eN
Ph
oto
cura
ble
N (
inte
rmed
iate
layer
)Y
(b
iose
nso
r)D
extr
an
NC
on
fere
nce
N
18
25
HD
iazi
rin
eN
Ph
oto
cura
ble
N (
inte
rmed
iate
layer
)Y
(b
iose
nso
r)D
extr
an
NJ
N
19
26
HD
iazi
rin
eN
Ph
oto
cura
ble
YB
ioco
mp
ati
ble
su
rface
sD
iam
on
d-l
ike
NP
N
20
27
HC
PO
YP
hoto
cura
ble
YN
Non
-pola
r p
last
icC
ou
ld b
eP
N
21
28
HD
iazi
rin
eN
Lig
ht
act
ivate
dN
(in
term
edia
te l
ayer
)Y
(b
iose
nso
r)D
extr
an
NJ
N
22
29
HD
iazi
rin
eN
Ph
oto
cura
ble
NY
HIV
-1 r
ever
se t
rasc
rip
tase
NJ
N
23
30
HC
arb
ene
NT
her
mal
NN
Carb
ene
exis
ts i
n t
he
soli
d p
oly
mer
NJ
N
24
31
HD
iazo
met
han
eY
Not
men
tion
edO
nly
Pri
mer
NM
etal
NJ
N
25
32
HD
iazo
YU
V r
ad
iati
on
YN
Poly
eth
yle
ne
coate
d p
ap
erN
PN
26
33
HC
arb
ene
(ket
o d
iazi
des
)N
Ph
oto
cura
ble
YN
Not
sure
- p
rin
tin
g p
late
sN
PN
27
34
HD
iazi
rin
eN
Ph
oto
lysi
sN
Nole
fin
sN
JN
28
35
HD
iazo
YE
lect
rost
ati
c d
isch
arg
e or
UV
lam
pY
Nvari
ou
s so
lid
su
rface
sY
PN
PA
TB
AS
E
13
6H
Dia
ziri
ne,
azi
des
etc
N (
fun
ctio
nal
surf
ace
)D
oes
not
say
YN
not
spec
ific
- s
oli
d s
urf
ace
sN
PN
23
7H
Azi
des
NP
hoto
react
ive
YN
not
spec
ific
- s
ub
stra
tes
NP
N
33
8H
Dia
ziri
ne
NP
hoto
act
ive
NN
Cosm
etic
com
posi
tion
NP
N
43
9H
Carb
enes
NP
hoto
react
ive
NN
not
spec
ific
- s
ub
stra
tes
NP
N
54
0H
Azi
des
NE
lect
roly
tic
dep
osi
tion
YN
Met
al
surf
ace
s
N (
not
as
the
sub
stra
te,
bu
t as
the
coati
ng(
PN
64
1H
Carb
enes
Np
hoto
lyti
c or
TH
ER
MO
LY
TIC
NN
Soli
d s
urf
ace
(n
ot
spec
ific
)N
PN
74
2H
Carb
enes
NP
hoto
act
ivate
dN
NC
ovale
nt
inorg
an
ic n
itri
de
NP
N7
42
HC
arb
enes
NP
hoto
act
ivate
dN
NC
ovale
nt
inorg
an
ic n
itri
de
NP
N
84
3H
Dia
zom
eth
yl
YP
hoto
act
ivate
dY
NF
lou
rece
nt
part
icle
sN
PN
94
4H
Dia
ziri
nes
NP
hoto
act
ivate
dN
Nch
emic
all
y i
nh
ert
surf
ace
s in
clu
din
g p
last
ics
Cou
ld b
eP
N
10
45
HC
arb
enes
(D
iazo
an
d n
itre
ne
Ngro
up
s)N
ligh
t act
ivate
dN
Nm
old
ed h
igh
poly
mer
art
icle
s C
ou
ld b
eP
N
11
46
HD
iazo
met
hyl
NH
ea
t -
80
ᵒC
NN
Poly
oxyet
hyle
ne
NP
N
DE
RW
EN
TR
esu
lt(H
ITS
/Perh
ap
s o
f In
terest
)R
ea
cti
ve s
pecie
sA
dh
esi
on
?C
urin
g m
eth
od
co
ati
ng
s m
en
tio
ned
?P
ho
toa
ffin
ity l
ab
ell
ing
?S
urfa
ce?
PP
?J
ou
rn
al/
Pa
ten
tA
uto
mo
tive?
14
7H
Dia
zon
ium
(ra
dic
al
trea
tmen
t) b
ut
wit
h o
xid
isin
g t
reatm
ent!
So n
ot
rele
ven
t!Y
Not
spec
ific
bu
t ju
st s
pec
ifie
s n
on
elec
troch
emic
al
con
dit
ion
sN
NN
ot
spec
ific
- S
oli
d s
up
port
su
rface
Cou
ld n
e?P
N
24
8H
Mon
ora
dic
als
YD
oes
not
say
YN
Not
spec
ific
?P
N
34
9H
Carb
enes
(D
iazo
)N
Does
not
say
YN
Not
spre
cifi
c (s
ub
stra
te)
Cou
ld n
e?P
N
45
0H
Dia
ziri
din
e, D
iazo
ace
tate
NU
VN
Bio
sen
sor
No P
oly
ole
fin
su
bst
rate
s! (
inorg
an
ics
such
as
gold
etc
)N
PN
55
1H
Dia
ziri
ne
NP
hoto
react
ive
YY
Pro
tein
sN
PN
65
2H
Dia
zo (
rad
ical)
ND
oes
not
say
YN
(an
ti-i
cin
g c
om
posi
tion
)W
ind
ow
pan
els
an
d V
ehic
les
Cou
ld n
e?P
Y
75
3H
Dia
ziri
ne,
dia
zo,
azi
de
NP
hoto
react
ive
YN
(b
iom
edic
al
dev
ices
)S
ub
stra
te c
on
tain
s an
in
org
an
ic m
ate
rial
NP
N
85
4H
Dia
ziri
ne
NP
hoto
chem
icall
y o
t th
erm
all
yN
N (
mic
rofl
uid
ic d
evic
e)C
eram
ics
an
d g
lass
NP
N
95
5H
Dia
zoY
Does
not
say
N
N (
pro
du
cin
g s
ub
stra
te w
ith
ad
hes
ive
surf
ace
)P
oly
ole
fin
s in
cl.
am
on
gst
sev
eral
oth
ers
Cou
ld b
eP
N
10
56
HC
erb
ene
(nit
ren
e, d
iazo
niu
m)
ND
oes
not
say
YN
Cou
pli
ng a
gen
t fo
r fl
uoro
poly
mer
sN
PN
11
57
HD
iazi
rid
ine
NU
V i
llu
min
ati
on
NB
iose
nso
rM
etal
NP
N
12
58
HD
iazi
rin
eN
UV
irr
ad
iati
on
N
to f
orm
poly
am
ine
shee
ts f
or
DN
A c
hip
sP
oly
pro
pyle
ne
YP
N
13
59
HD
iazi
rin
eN
Lig
ht
irra
dia
tion
NY
Res
ins
NP
N
14
60
HD
iazi
rin
eN
Ph
oto
react
ive
YC
ross
lin
kin
g a
gen
tA
lum
iniu
m m
enti
on
edN
PN
15
61
HD
iazi
rin
eN
UV
lig
ht
irra
dia
tion
YY
Pla
stic
Cou
ld b
eP
N
16
62
HD
iazi
rin
eN
Does
not
say
YN
Con
tact
len
ses
NP
N
17
63
HC
arb
enes
NP
hoto
gra
ftin
gY
NB
iom
edic
al
dev
ices
(eg
. C
on
tact
len
s)N
PN
18
64
HC
arb
enes
ND
oes
not
say
NN
Th
erm
op
last
ics
incl
. P
PY
PN
19
65
HC
arb
enes
ND
oes
not
say
YN
Bio
med
ical
dev
ice
such
as
con
tact
Len
sN
PN
20
66
HC
arb
enes
(D
iazi
rin
e)N
Blu
e li
gh
t ir
rad
iati
on
YN
Bio
med
ical
dev
ices
- a
ttach
ing t
o l
ivin
g t
issu
eN
PN
21
67
HD
iazi
rin
esN
Ph
oto
act
ive
YN
Man
y i
ncl
. P
PY
PN
22
68
HD
iazi
rin
e (m
enti
on
ed i
n t
itle
)N
UV
lig
ht
irra
dia
tion
YN
Just
says
poly
mer
( i
t is
a s
enso
r fo
r d
etec
tin
g p
rote
in)
Cou
ld b
e?P
N
23
69
HC
arb
enes
(ra
dic
als
)N
Does
not
say
NN
Org
an
ic m
agn
etic
fil
mN
PN
24
70
HD
iazo
met
han
eN
Ph
oto
sen
siti
ve
NN
elec
tron
ic d
evic
es a
nd
pri
nti
ng p
late
sN
PN
25
71
HC
arb
enes
N
Hea
tin
g o
r el
ectr
om
agn
etic
rad
iati
on
(in
cl.
UV
an
d I
R)
YN
Bio
med
ical
dev
ices
su
ch a
s co
nta
ct l
ense
s/ i
mp
lan
tsN
PN
26
72
HD
iazi
rid
ine
YIr
rad
iati
on
of
vis
ible
or
UV
rays
YB
iose
nso
r
Org
an
ic t
hin
fil
m -
bin
din
g t
o a
pro
tein
(re
ferr
ed t
o a
s b
ase
pla
te)
NP
N
27
73
HD
iazo
ket
on
e (c
arb
enes
)N
Just
says
it i
s d
emp
ose
d t
o f
orm
carb
ene
NN
Magn
etic
rec
ord
ing d
isc
or
magn
etic
tap
eN
PN
28
74
HA
zid
e or
Dia
zo c
om
pou
nd
(n
iren
e or
carb
ene)
YP
hoto
chem
icall
y a
ctiv
ati
ng
YN
Poly
mer
su
rface
NP
N
29
75
HD
iazo
com
pou
nd
NJu
st s
ays
N2
lib
erate
d o
n e
xp
osu
reY
NP
rim
ary
tra
nsl
usc
ent
sub
stra
teN
PN
30
76
HC
arb
ene
(pre
ferr
ed c
arb
ene
is D
ich
loro
carb
ene)
YD
oes
not
say
NN
Soli
d s
up
port
sC
ou
ld b
eP
N
Figure 10.41: Patent search summary part 1. Available on CD for magnified view.
317

Oth
er S
ea
rch
es
Resu
lt(H
ITS
/Perh
ap
s o
f In
terest
)R
ea
cti
ve s
pecie
sA
dh
esi
on
?C
urin
g m
eth
od
co
ati
ng
s m
en
tio
ned
?P
ho
toa
ffin
ity l
ab
ell
ing
?S
urfa
ce?
PP
?J
ou
rn
al/
Pa
ten
tA
uto
mo
tive?
ToF
SIM
S P
ap
er 1
PO
ID
iazi
rin
eG
raft
ing
ligh
t ir
rad
iati
on
NN
sili
con
, si
lico
n n
itri
de
an
d d
iam
on
dN
JN
ToF
SIM
S P
ap
er 2
PO
ID
iazi
rin
eG
raft
ing
ligh
t ir
rad
iati
on
NN
dia
mon
dN
JN
ToF
SIM
S P
ap
er 3
PO
ID
iazi
rin
eG
raft
ing
ligh
t ir
rad
iati
on
NN
dia
mon
dN
JN
Het
erocy
cles
Vol
79
. 2
00
9P
OI
Dia
ziri
ne
Gra
ftin
gli
gh
t ir
rad
iati
on
NN
Poly
pro
pyle
ne
(to i
mm
ob
ilais
e p
rote
ins)
YJ
N
e CA
17
7P
OI
NO
carb
enes
Res
ista
nce
to
-Y
NA
nti
fou
lin
g (
mari
ne)
NP
N
27
8P
OI
Ph
oto
cata
lyst
Y-
YN
Poly
pro
pyle
ne
is m
enti
on
edY
PN
37
9P
OI
Met
al
oxid
e b
enzo
ph
enon
eN
-N
NT
her
mop
last
ics
men
tion
ed (
for
circ
uit
board
s)C
ou
ld b
eP
N
48
0P
OI
Ph
oto
gra
fted
hyd
rogel
sp
ecie
sY
Ph
oto
gra
fted
YN
Blo
od
com
pati
tbil
ty o
f co
ati
ng
NJ
N
58
1P
OI
An
tifo
uli
ng c
oati
ngs
- D
iazo
met
han
eY
-Y
NA
nti
fou
lin
g (
mari
ne)
NP
N
68
2P
OI
Male
ic a
nh
yd
rid
e an
d p
eroxid
esY
Ch
emic
al
YN
Poly
ole
fin
s an
d p
last
ic s
ub
stra
tes
Cou
ld b
eP
N
78
3P
OI
Ad
hes
ion
res
inY
Hea
t tr
an
sfer
?Y
NP
oly
eth
yle
ne
an
d p
oly
pro
pyle
ne
poly
mer
sY
PN
88
4P
OI
Blo
cked
Dii
oso
cyan
ate
sN
-N
Nre
act
ive
cou
pli
ng a
gen
t p
ine
fib
er p
oly
pro
pyle
ne
com
posi
teY
JN
98
5P
OI
Carb
enes
(b
ut
com
ple
tely
dif
fere
nt
pu
rpose
)
(ad
h o
f ca
rben
e to
to s
ilic
on
e co
ati
ngs
to
rem
ove
them
fro
m p
last
ic m
ate
rials
)D
oes
not
say
Y (
rem
oval
of)
NP
last
ic m
ate
rial
Cou
ld b
eP
N
10
86
PO
IV
inyl
mon
om
ers
Yra
dia
tion
gra
ftin
g t
ech
niq
ue
Y (
met
all
ic c
oati
ngs)
NP
oly
eth
yle
nes
NJ
N
11
87
PO
IA
cryli
c m
on
om
er l
ayer
sY
Coro
na d
ish
carg
eY
NF
lou
rop
oly
mer
su
bst
rate
sN
PN
12
88
PO
IN
-het
erocy
clic
carb
ene
YD
oes
not
say
NN
Ch
ip p
ack
agin
g c
om
posi
tion
s w
ith
res
ins
(als
o m
enti
on
s
'pla
stic
s')
Y (
bu
t p
art
s,
pack
agin
g o
f th
em)
13
89
PO
Iis
op
rop
ylt
hio
xan
thon
e (p
hoto
inati
ato
r) a
nd
ben
zop
hen
on
eY
UV
rad
iati
on
YB
ioco
mp
ati
bil
ity
Poly
pro
pyle
ne
(as
alt
ern
ati
ve
for
Tit
an
ium
)Y
JN
14
90
PO
IP
oly
eth
yle
ne
gly
col
dia
cryla
te (
an
d h
yd
rogel
s)Y
Pla
sma a
ssis
ted
by U
VY
NP
oly
carb
on
ate
ura
than
es (
call
ed C
hro
nofl
ex)
NJ
N
15
91
PO
Icy
an
oacr
yla
tes
an
d s
ilan
esY
(an
d n
o p
rim
er)
Does
not
say
NN
EP
DM
an
d o
ther
th
erm
op
last
ic e
last
om
ers
Cou
ld b
eP
N
16
92
PO
IO
nly
sp
ecif
ies
the
poss
ible
pre
sen
ce o
f an
ad
hes
ion
pro
mote
rY
Does
not
say
N (
lab
elin
g i
s m
enti
on
ed)
NT
her
mofo
rmab
le f
lat
film
sY
PN
17
93
PO
IG
raft
en m
eth
acr
yli
c aci
d w
ith
blo
ck r
ub
ber
sY
cure
d'
YN
Poly
ole
fin
s an
d p
last
ic s
ub
stra
tes
Cou
ld b
eP
N
18
94
PO
IE
last
om
er g
raft
ed p
oly
mer
Yju
st s
ays
that
it w
as
pri
nte
dY
Net
hzl
ene-
bu
ten
e an
d H
DP
EN
PN
19
95
PO
Ion
ium
com
pu
nd
s an
d o
rgan
ic c
ou
pli
ng a
gen
tsN
-N
NP
oly
ole
fin
s co
nta
inin
g o
niu
m c
om
pou
nd
sN
PY
20
96
PO
I
gra
ftin
g o
f u
nsa
tura
ted
carb
oxyli
c aci
ds
(als
o m
enti
on
s m
ale
ic
an
hyd
rid
e)Y
UV
rad
iati
on
YN
Poly
olf
efin
sC
ou
ld b
e?P
N
21
97
PO
I
Gra
ft o
f N
-vin
yl
Pyrr
oli
don
e (i
n m
elt)
bu
t p
ain
t ad
h i
ncr
ease
d w
ith
pre
sen
ce o
f P
P-g
-NV
P a
s ad
dit
ive
YIn
th
e m
elt
YN
Poly
pro
pyle
ne
cop
oly
mer
Y b
ut
cop
oly
mer
JN
22
98
PO
IS
urf
ace
gra
ft i
ncl
. D
MA
, K
SP
A,
hep
ari
in-m
an
nit
ol-
pre
dn
ison
e m
ixY
(b
ut
it s
eak
s le
ss a
dh
)gra
ftin
gY
Nm
edic
al
an
d p
rost
het
ic s
urf
ace
s (m
od
ifie
d s
ilic
on
e su
rface
)N
PN
23
99
PO
In
atu
ral
rub
ber
, M
MA
, d
i-M
e p
hth
ala
te,
terp
ene
ph
enol
YH
ea
t se
nsi
tive
YN
Poly
ole
fin
Cou
ld b
eP
N
24
10
0P
OI
Ch
loro
sulf
on
ate
d p
oly
eth
yle
ne,
AP
TE
S,
CL
PT
MS
, G
PT
MS
Hea
t co
up
lin
g a
gen
dN
NS
ilic
on
NJ
N
25
10
1P
OI
iron
-ary
lcarb
ene
com
ple
xes
ND
oes
not
say
NN
C-C
l an
d C
-C b
on
d a
ctiv
ati
on
NJ
N
26
10
2P
OI
dia
mon
d l
ike
carb
on
con
tain
ing c
arb
enes
(m
eth
yle
ne
der
ivati
ves
)Y
Vap
or
dep
osi
tion
NN
Si,
SU
S 3
04
ste
el,
Cr,
Ni,
Pla
stic
Cou
ld b
eP
N
27
10
3P
OI
gra
ft p
oly
mer
isati
on
- m
enti
on
s A
zob
isis
ob
uty
ron
itri
leY
Hea
tY
Bio
com
pati
bil
ity
med
ical
an
d p
rost
het
ic s
urf
ace
s (m
od
ifie
d s
ilic
on
e su
rface
)N
PN
Oth
er S
ea
rch
es
Resu
lt(H
ITS
/Perh
ap
s o
f In
terest
)R
ea
cti
ve s
pecie
sA
dh
esi
on
?C
urin
g m
eth
od
co
ati
ng
s m
en
tio
ned
?P
ho
toa
ffin
ity l
ab
ell
ing
?S
urfa
ce?
PP
?J
ou
rn
al/
Pa
ten
tA
uto
mo
tive?
28
10
4P
OI
Met
al
carb
ene
com
ple
xes
(im
idazo
lyli
den
e)N
(ca
rben
e is
cou
pli
ng a
gen
t in
fil
m)
Does
not
say
YN
cera
mic
su
bst
rate
NP
N
29
10
5P
OI
hyd
roxy m
od
ifie
d t
her
mop
last
ic e
last
om
er (
sub
stra
te i
s m
od
ifie
d)
Y (
poly
ura
than
e co
ati
ngs)
In t
he
mel
tY
NT
her
mop
last
ic e
last
om
er c
om
posi
tion
sY
PN
30
10
6P
OI
Dia
zoace
tate
sN
-N
NS
ilan
es (
stu
dy o
f in
sert
ion
rea
ctio
ns
in t
o S
i-H
)N
JN
31
10
7P
OI
Azo
com
pou
nd
an
d m
ale
ic a
nh
yd
rid
eY
film
all
ow
ed t
o s
etY
NP
oly
este
r fi
lmN
PN
32
10
8P
OI
Ph
CO
C(O
me)
2P
hY
ther
mal
or
rad
ioch
emic
al
gra
ftin
gY
NA
nti
bact
eria
l co
ati
ng g
raft
ing
NP
N
33
10
9P
OI
wate
r re
sist
an
t re
sisn
layer
con
tain
ing T
itan
ia a
nd
sil
an
e co
up
lin
g a
gen
tY
Does
not
say
YN
Ph
oto
gra
ph
ic p
ap
er s
up
port
NP
N
34
11
0P
OI
Ben
zop
hen
on
e so
ln i
n d
iacr
yla
te m
on
om
erY
UV
cu
rin
gY
NP
oly
mer
ic m
ate
rials
, p
oly
ole
fin
s m
enti
on
edC
ou
ld b
eP
N
35
11
1P
OI
Gra
fted
poly
este
r P
rim
ers
YS
elf
cross
lin
kab
le,
rad
icall
y p
oly
mer
isab
leY
NP
last
ic f
ilm
sC
ou
ld b
eP
N
36
11
2P
OI
N-v
inylc
arb
oxam
ide
Yir
rad
iate
d w
ith
rad
iati
on
YN
Poly
ole
fin
sC
ou
ld b
eP
N
37
11
3P
OI
am
ine
cure
d e
poxy r
esin
N (
just
says
cou
pli
ng l
ayer
s)U
V l
igh
tY
NP
last
ics
Cou
ld b
eP
N
38
11
4P
OI
N-v
inylc
arb
oxyli
c am
ide
gra
fted
Y (
wit
h P
U c
oati
ng)
elec
tron
bea
m i
rrad
iati
on
YN
Poly
ole
fin
sC
ou
ld b
eP
N
39
11
5P
OI
carb
oxl-
react
ive
hard
ener
YC
oati
ng a
pp
lied
YN
Poly
este
r (p
hoto
gra
ph
ic)
NP
N3
91
15
PO
Ica
rboxl-
react
ive
hard
ener
YC
oati
ng a
pp
lied
YN
Poly
este
r (p
hoto
gra
ph
ic)
NP
N
40
11
6P
OI
eth
yle
ne-
pro
pen
e-tr
imet
hoxyvin
yls
ilan
e gra
ftN
-N
(b
end
)N
tou
gh
ened
res
ins
for
mold
ings
NP
Y
41
11
7P
OI
epoxy r
esin
Yel
ectr
on
bea
m i
rrad
iati
on
NN
UH
MW
PE
NJ
N
42
11
8P
OI
Ble
nd
of
ther
mop
last
ics
wit
h m
ult
iph
ase
gra
ft c
op
oly
mer
s w
ith
pola
r
an
d n
on
pola
r p
art
s- s
o m
od
ific
ati
on
of
the
sub
stra
te)
Y (
coate
d w
ith
poly
ofe
lin
pri
mer
an
d
acr
yli
c to
pco
at)
YN
Ble
nd
s of
ther
mop
last
ics
Yes
(as
on
e
com
pon
ent)
PY
(b
um
pers!
)
43
11
9P
OI
react
ive
surf
act
an
cts
gra
fted
(p
rod
uce
s w
ate
r re
sist
an
t su
rface
)Y
mala
ted
an
d m
elte
dY
Nca
rboxyli
c aci
d/a
nh
yd
rid
e m
od
ifie
d p
oly
ole
fin
sM
ay c
on
tain
PN
44
12
0P
OI
3-a
zid
op
rop
ylt
riet
hoxysi
lan
eY
Does
not
say
YN
Gla
ss s
urf
ace
sN
PN
45
12
1P
OI
gra
ftin
g o
f m
on
om
ers
YH
eat,
80
deg
rees
, 1
hY
NF
loro
poly
mer
sN
PN
46
12
2P
OI
OH
con
tain
ing v
inyl
mon
om
ers
an
d c
hlo
rin
ati
on
YH
eat
YN
ole
fin
poly
mer
sY
PN
47
12
3P
OI
Isocy
an
ate
s w
ith
rea
ctiv
e si
lan
e co
up
lin
g a
gen
tsY
Hea
t, 8
0 d
egre
esY
NF
luoro
poly
mer
NP
N
48
12
4P
OI
Aci
ds
YU
VY
NP
oly
ole
fin
Cou
ld b
eP
N
49
12
5P
OI
male
ic a
cid
or
acr
yli
c aci
dY
Does
not
say
NN
Poly
pro
pyle
ne
(Pla
stic
-pla
stic
or
pla
stic
-met
al
ad
hes
ion
)Y
PN
50
12
6P
OI
acr
yli
c aci
d a
nd
hyd
roxyet
hylm
eth
acr
yla
teY
rad
iati
on
gra
ftin
g t
ech
niq
ue
YN
Poly
pro
pyle
ne
YJ
N
51
12
7P
OI
male
ic a
nh
yd
rid
e Y
Does
not
say
YN
Poly
pro
pyle
ne
YP
Y
52
12
8P
OI
react
ing a
ctiv
ate
d s
urf
ace
wit
h r
ad
icals
of
react
ive
gas
or
coati
ng a
gen
tN
UV
or
lase
r b
eam
irr
ad
iati
on
YN
Pla
stic
s m
enti
on
edC
ou
ld b
e?P
N
53
12
9P
OI
Org
an
op
oly
silo
xan
esY
rad
iati
on
gra
ftin
g t
ech
niq
ue
YN
poly
mer
su
pp
ort
sY
PN
54
13
0P
OI
inorg
an
ic f
ille
rs t
reate
d w
ith
sil
an
e co
up
lers
(P
hC
6H
4N
2+
BF
4-)
YU
VY
NP
MM
A p
late
NP
N
55
13
1P
OI
org
an
ic s
ilan
e d
eriv
ati
ves
YH
ot
mel
tY
NS
hri
nk
ab
le m
ate
rial
NP
N
56
13
2P
OI
acr
yla
mid
es a
nd
aci
dic
acr
yli
c aci
d-i
sooct
yl
acr
yla
teY
(as
ad
h.
Pri
mer
)el
ectr
on
bea
m i
rrad
iati
on
gra
ftin
g t
ech
niq
ue
NN
Poly
eth
yle
ne
NJ
N
57
13
3P
OI
un
satu
rate
d b
on
d a
nd
ep
oxy g
rou
p,
per
oxid
eY
Does
not
say
YN
mold
ing e
g.
Poly
pro
pyle
ne
YP
N
58
13
4P
OI
vin
yl
sila
ne
Nra
dic
al
gra
ftin
gY
NP
oly
ole
fin
s, p
oly
pro
pyle
ne
YP
N
59
13
5P
OI
rad
ical
poly
mer
isab
le c
om
pou
nd
sY
(or
elec
trole
ssly
pla
ted
met
al
film
s)D
oes
not
say
YN
Pla
stic
su
rface
sC
ou
ld b
eP
N
60
13
6P
OI
gra
fted
poly
acr
yli
c aci
dY
(in
k)
Hg v
ap
or
lam
pY
NP
oly
ole
fin
su
rface
sC
ou
ld b
eP
N
61
13
7P
OI
acr
yla
te g
raft
edY
rad
iati
on
gra
ftin
g t
ech
niq
ue
NN
Poly
eth
yle
ne
NJ
N
62
13
8P
OI
gra
fted
wit
h a
mon
om
erY
rad
iati
on
gra
ftin
g t
ech
niq
ue
NN
Poly
eth
yle
ne
shee
tsN
PN
63
13
9P
OI
un
satu
rate
d p
oly
eth
ers
Yio
niz
ing r
ad
iati
on
gra
ftin
gN
NP
oly
am
ide
an
d p
oly
este
r su
bst
rate
sN
PN
64
14
0P
OI
Man
y g
rou
ps
incl
ud
ing c
ast
or
oil
, li
nse
ed o
il,
ole
ic a
cid
, b
isp
hen
ol
A e
tc
der
ivati
ves
- a g
raft
ing t
ech
niq
ue
that
lead
s to
carb
oxyla
te g
rou
ps
on
th
e
surf
ace
YH
eat
an
d t
ime
YN
Poly
eth
yle
ne,
poly
styre
ne,
poly
pro
pyle
ne,
poly
vin
yl
chlo
rid
e,
vin
yl
poly
mer
YP
N
65
14
1P
OI
gra
fted
mon
om
eric
aci
ds
or
este
rsY
Hea
t w
ith
fre
e ra
dic
al
cata
lyst
YN
Poly
eth
yle
ne
NP
N
66
14
2P
OI
Dif
luro
rcarb
ene
ND
oes
not
say
YN
Met
al
surf
ace
sN
JN
67
14
3P
OI
Dia
zon
ium
salt
s (d
iazo
ace
tate
s att
ack
C-C
dou
ble
bon
d o
f α
, β
un
sat.
Com
pd
.)-
rad
ical
react
ion
Nte
mp
, an
d t
imes
NN
α, β
un
sat.
Com
pd
.N
JN
68
14
4P
OI
1-6
,hex
an
dio
l w
as
gra
fted
on
to s
urf
ace
wit
h b
enzo
ph
enon
e an
d
isop
rop
ylt
hio
xan
thon
e p
hoto
init
iato
rsY
UV
rad
iati
on
YN
Poly
pro
pyle
ne
shee
tsY
JN
69
14
5P
OI
ben
zop
hen
on
e t
yp
e p
hoto
init
iato
rsY
UV
rad
iati
on
YN
Poly
pro
pyle
ne
sub
stra
tes
YJ
N
14
6P
OI
Carb
enes
(u
sed
to r
emove
a c
oati
ng)
Y (
bu
t w
an
t to
rem
ove
a c
oati
ng f
or
recy
clin
g)
Does
not
say
Y (
bu
t re
moval
of
for
recy
clin
g)
NP
oly
ole
fin
sC
ou
ld b
eP
N
DE
RW
EN
TR
esu
lt(H
ITS
/Perh
ap
s o
f In
terest
)R
ea
cti
ve s
pecie
sA
dh
esi
on
?C
urin
g m
eth
od
co
ati
ng
s m
en
tio
ned
?P
ho
toa
ffin
ity l
ab
ell
ing
?S
urfa
ce?
PP
?J
ou
rn
al/
Pa
ten
tA
uto
mo
tive?
Figure 10.42: Patent search summary part 2. Available on CD for magnified view.
318
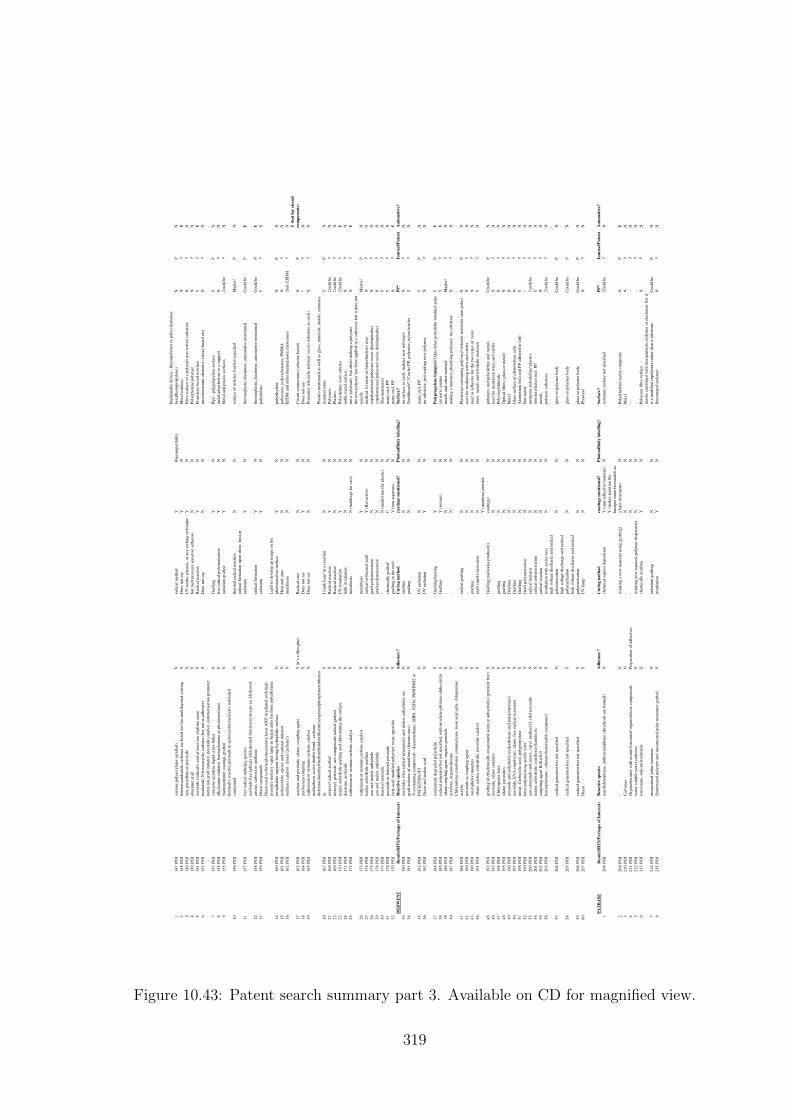
11
47
PO
Ivari
ou
s p
oly
acr
yla
tes
(gra
fted
)N
rad
ical
met
hod
YB
ioco
mp
ati
bil
ity
Imp
lan
tab
le d
evic
e -
flu
oro
poly
mer
or
poly
(vin
yli
den
e
hex
afl
uoro
pro
pyle
ne)
NP
N
21
48
PO
Ib
enzo
niu
md
iazo
le c
arb
enes
are
lis
ted
for
this
mu
ltil
ayer
ed c
oati
ng
YD
oes
not
say
YN
Met
al
surf
ace
sN
PY
31
49
PO
Iazo
, p
ersu
lfate
or
per
oxid
eN
UV
ozo
ne,
pla
sma,
or
an
y e
tch
ing t
ech
niq
ue
YN
Fib
re s
urf
ace
of
a p
oly
mer
non
woven
su
bst
rate
NP
N
41
50
PO
Ioli
gom
er g
raft
Yh
ot
mel
t p
ress
ure
sen
siti
ve
ad
hes
ive
NN
Poly
eth
yle
ne
poly
mer
NP
N
51
51
PO
Ip
eroxid
e (r
ad
icals
) an
d a
t le
ast
on
e gra
ftin
g a
gen
t Y
Rad
ical
react
ion
YN
Pro
pyle
ne
base
d p
oly
mer
YP
Y
61
52
PO
Iim
idazo
le,
N-h
eter
ocy
clic
carb
ene
(bu
t n
ot
in a
dh
esiv
e)Y
Does
not
say
NN
mic
roel
ectr
on
ic e
lem
ents
(ci
rcu
it b
oard
etc
)N
PN
71
53
PO
I
met
al
ion
gra
ft i
nit
iato
r, p
eroxid
e ca
taly
st..
poly
mer
isati
on
pro
mote
r
con
tain
s azi
rid
ine
liqu
id c
ross
-lin
ker
NG
raft
ing
YN
Pip
e -
poly
pro
pyle
ne
surf
ace
YP
N
81
54
PO
Ialk
yla
min
o i
nit
iato
r, b
enzo
ph
on
on
e as
ph
oto
sen
siti
zer
Yfr
ee r
ad
ical
poly
mer
isati
on
YN
met
al
ad
sorb
ed o
n t
o a
su
pp
ort
NP
N
91
55
PO
Ifl
uoro
poly
mer
coati
ngs
gra
fted
Nra
dia
tion
gra
fted
YN
Met
al
an
d p
last
ic s
urf
ace
sC
ou
ld b
eP
N
10
15
6P
OI
ther
mall
y r
eact
ive
per
oxid
e or
per
oxyes
ter(
rad
icals
), i
od
inate
d
com
pou
nd
Nth
erm
al
rad
ical
react
ion
NN
surf
ace
of
'art
icle
s' b
ut
not
spec
ifie
dM
ayb
e?P
N
11
15
7P
OI
free
rad
ical
ind
uci
ng s
pec
ies
Y
rad
ical
form
ati
on
up
on
sh
eer,
hea
t or
rad
iati
on
YN
ther
mop
last
ic e
last
om
er,
au
tom
oti
ve
men
tion
edC
ou
ld b
eP
Y
12
15
8P
OI
per
oxid
e fr
ee r
ad
icals
wit
h d
esir
ed f
un
ctio
nal
gro
up
s eg
. H
yd
roxyl,
am
ino,
carb
oxl
or
ure
than
eY
rad
ical
form
ati
on
YN
ther
mop
last
ic e
last
om
er,
au
tom
oti
ve
men
tion
edC
ou
ld b
eP
Y
13
15
9P
OI
Dia
zo c
om
pou
nd
sN
rad
iati
on
YN
poly
ole
fin
sY
PN
14
16
0P
OI
Dia
zo u
sed
to f
orm
ph
oto
sen
siti
ve
layer
AN
D i
rrad
iate
d w
ith
hig
h
pre
ssu
re m
ercu
ry v
ap
or
lam
p i
n A
rgon
atm
s fo
r fo
rm p
oly
eth
yle
ne
tere
pth
ala
te s
up
port
havin
g h
yd
rop
hil
ic s
urf
ace
N
Lig
ht
to d
evel
op
an
im
age
on
th
e
ph
oto
sen
siti
ve
surf
ace
YN
poly
eth
yle
ne
NP
N
15
16
1P
OI
poly
acr
yla
te,
epoxy a
nd
cati
on
ic i
nit
iato
rY
Hea
t an
d t
ime
NN
poly
este
rs,
poly
carb
on
ate
s, P
MM
AN
PN
16
16
2P
OI
met
hes
is c
ata
lyst
(m
etal
carb
ene!
)N
met
ath
esis
NN
EP
DM
an
d o
ther
th
erm
op
last
ic e
last
om
ers
On
ly E
PD
MP
N
17
16
3P
OI
acr
yla
te a
nd
per
oxid
e, s
ilan
e, c
ou
pli
ng a
gen
tY
(it
’s a
fil
m g
lue)
Rad
ical
cure
NN
Cir
cuit
con
nec
tion
s (s
ilic
on
e b
ase
d)
NP
Y (
bu
t fo
r c
ircu
it
co
mp
on
en
ts)
18
16
4P
OI
per
oxy/a
zo c
ou
pli
ng
YD
oes
not
say
YN
Does
not
say
?P
N
19
16
5P
OI
ruth
eniu
m o
r osm
ium
carb
ene
cata
lyst
ND
oes
not
say
NN
Pre
pari
ng t
elec
hel
ic p
oly
mer
(so
no s
ub
stra
te a
s su
ch)
NP
N
20
16
7P
OI
met
hath
esis
act
ive
dou
ble
bon
d -
carb
ene:
dic
hlo
ro(d
imet
hylv
inylm
eth
yli
din
e)b
is(t
ricy
clop
enty
lph
osp
hin
e)ru
then
iu
mY
I th
ink
hea
t/ i
n a
rea
ctio
nN
N
Pla
stic
s m
enti
on
ed a
s w
ell
as
gla
ss,
min
erals
, m
etals
, ce
ram
ics,
nea
tura
l st
on
eY
PN
21
16
8P
OI
nit
roxyl
rad
ical
gra
fted
YR
ad
ical
react
ion
YN
Poly
mer
sC
ou
ld b
eP
N
22
16
9P
OI
nit
roxyl,
per
oxid
e, a
zo c
om
pou
nd
s ra
dic
al
gra
fted
YR
ad
ical
react
ion
NN
Pla
stic
s C
ou
ld b
eP
N
23
17
0P
OI
male
ic a
nh
yd
rid
e gra
ftin
g a
nd
ch
lori
nati
ng t
he
surf
ace
NU
V i
rrad
iati
on
YN
Poly
ole
fin
ic r
esin
art
icle
sC
ou
ld b
eP
Y
24
17
1P
OI
dia
ziri
ne,
ary
lazi
de
Nli
gh
t ir
rad
iati
on
NN
nob
le m
etal
surf
ace
NP
N
25
17
2P
OI
ruth
eniu
m o
r osm
ium
carb
ene
cata
lyst
Ym
etath
esis
N (
mold
ings
for
cars
)N
not
a s
ub
stra
te,
bu
t ab
ou
t m
ak
ing a
poly
mer
NP
Y
26
17
3P
OI
ruth
eniu
m o
r osm
ium
carb
ene
cata
lyst
Ym
etath
esis
YN
the
new
poly
mer
has
bee
n a
pp
lied
to a
su
bst
rate
bu
t it
does
not
spec
ify
Mayb
e?P
N
27
17
4P
OI
male
ic a
nh
yd
rid
e gra
ftin
gN
rad
ical
or
ther
mal
gra
ftY
(B
io-a
ctiv
e)N
med
ical,
hygie
ne
or
bio
tech
nolo
gy u
ses
NP
N
28
17
5P
OI
azo
an
d m
ale
ic a
nh
yd
rid
eY
gra
ft-p
oly
mer
isati
on
NN
cop
oly
mer
ised
poly
este
r re
sin
s (h
yd
rop
hob
ic)
NP
N
29
17
6P
OI
azo
an
d m
ale
ic a
nh
yd
rid
eY
gra
ft-p
oly
mer
isati
on
NN
cop
oly
mer
ised
poly
este
r re
sin
s (h
yd
rop
hob
ic)
NP
N
30
17
7P
OI
ben
zoyl
per
oxid
eN
-N
(m
od
ifyin
g t
he
pla
stic
)N
Th
erm
op
last
ics
YP
N
31
17
8P
OI
per
oxid
e or
ben
zoyl
per
oxid
eY
chem
icall
y g
raft
edC
Nm
an
y i
ncl
, P
PY
PN
32
17
9P
OI
fatt
y-a
cid
mod
ifie
d p
oly
este
r re
sin
, ep
oxid
esY
gra
ftin
g i
n t
he
mel
tY
(n
on
-aqu
eou
s)N
man
y i
ncl
, P
PN
PY
DE
RW
EN
TR
esu
lt(H
ITS
/Perh
ap
s o
f In
terest
)R
ea
cti
ve s
pecie
sA
dh
esi
on
?C
urin
g m
eth
od
co
ati
ng
s m
en
tio
ned
?P
ho
toa
ffin
ity l
ab
ell
ing
?S
urfa
ce?
PP
?J
ou
rn
al/
Pa
ten
tA
uto
mo
tive?
33
18
0P
OI
per
oxid
es (
free
rad
ical
gen
erato
rs)
an
d m
ale
ic a
nh
yd
rid
es e
tcN
gra
ftin
gN
Nn
o s
urf
ace
as
such
, m
ak
ing n
ew p
oly
mer
sN
PN
34
18
1P
OI
gra
ft i
nit
iato
r of
met
al
ion
s (f
erro
us
ion
s)N
gra
ftin
gN
NT
ooth
bru
sh!!
! C
an
be
PP
, p
oly
este
r, n
ylo
n b
rist
les
YP
N
35
18
2P
OI
N-c
on
tain
ing c
om
pou
nd
s -
dia
zom
eth
an
e, A
IBN
, N
2H
4,
Ph
NH
NH
2 o
r
Ph
CH
2N
Me3
Cl
NU
V r
ad
iati
on
NN
man
y i
ncl
, P
PY
PN
36
18
3P
OI
Dia
zo a
nd
male
ic a
cid
NU
V r
ad
iati
on
YN
no s
ub
stra
te,
just
mak
ing n
ew p
oly
mer
NP
N
37
18
4P
OI
oxid
ati
vel
y d
egra
ded
poly
ole
fin
YG
raft
ing/h
eati
ng
YN
Po
lyp
ro
pyle
ne b
um
pers!
! Q
ne
oth
er p
oly
ole
fin
mou
lded
part
sY
PY
38
18
5P
OI
rad
ical
gen
erato
r b
ut
not
spec
ifie
d,
wit
h p
royle
ne-
eth
yle
ne-
alp
ha o
lefi
nY
Gra
ftin
gY
(p
rim
er)
Nca
r p
art
s co
ati
ng
YP
Y
39
18
6P
OI
sila
ne
cou
pli
ng a
gen
t, o
rgan
ic p
eroxid
eY
-N
Nm
etals
an
d o
ther
mate
rial
Mayb
e?P
N3
91
86
PO
Isi
lan
e co
up
lin
g a
gen
t, o
rgan
ic p
eroxid
eY
-N
Nm
etals
an
d o
ther
mate
rial
Mayb
e?P
N
40
18
7P
OI
acr
ylo
xy,
org
an
osi
loxan
eN
-N
Nm
ak
ing a
mois
ture
ab
sorb
ing p
oly
mer
- n
o s
ub
stra
teN
PN
41
18
8P
OI
Ch
loro
pre
ne
cop
oly
mer
com
posi
tion
s, r
osi
n a
cid
salt
s, c
hlo
rop
ren
e
acr
yli
cY
rad
ical
gra
ftin
gN
NP
last
icis
er c
on
tain
ing p
oly
vin
yl
chlo
rid
e m
ate
rials
(n
on
pola
r)N
PN
42
18
9P
OI
per
oxid
e as
cou
pli
ng a
gen
tN
-N
Nu
sed
for
insu
lati
ng w
ires
an
d c
ab
les
NP
N
43
19
0P
OI
vin
yl-
ph
enyl
moie
ties
Ygra
ftin
gN
Nu
sed
as
ad
hes
ive
for
the
two t
yp
es o
f r
esin
NP
N
44
19
1P
OI
sila
ne,
male
ic a
nh
yd
rid
e, p
eroxid
e ca
taly
stY
gra
ft c
op
oly
mer
isati
on
NN
gla
ss,
met
als
an
d p
lyole
fin
mate
rials
YP
N
45
19
2P
OI
gra
ftin
g o
f et
hyle
nic
all
y u
nsa
tura
ted
aci
ds
or
an
hyd
rid
es (
per
oxid
e fr
ee)
YG
raft
ing (
rad
icals
a p
rod
uce
d)
Y (
men
tion
s p
ow
der
coati
ngs)
Np
oly
mer
s in
cl p
oly
ole
fin
s an
d m
etals
Cou
ld b
eP
N
46
19
3P
OI
per
oxid
e, s
ilan
e co
up
lers
N-
NN
use
d f
or
insu
lati
ng w
ires
an
d c
ab
les
NP
N
47
19
4P
OI
Ch
loro
pre
ne
late
xY
gra
ftin
gN
NP
oly
vin
ylc
hlo
rid
eN
PN
48
19
5P
OI
sila
ne,
per
oxid
esY
gra
ftin
gN
NO
pti
cal
fib
res
(gla
ss o
r m
etal)
NP
N
49
19
6P
OI
per
oxid
e an
d p
oly
ole
fin
(p
oly
eth
yle
ne
an
d p
oly
pro
pyle
ne)
YG
raft
ing
NN
Met
al
NP
N
50
19
7P
OI
per
oxid
e, E
VA
cop
oly
mer
, si
lan
e, f
ree
rad
ical
scaven
ger
YG
raft
ing
NN
Gla
ss s
urf
ace
of
ph
oto
volt
aic
cel
lsN
PN
51
19
8P
OI
un
sat.
Carb
oxyli
c aci
d,
poly
pro
pyle
ne
YG
raft
ing
NN
Alu
min
ium
foil
(an
d P
P a
dh
ered
to f
oil
)Y
PN
52
19
9P
OI
late
x p
oly
mer
isin
g a
cryli
c es
ter
YG
raft
poly
mer
isati
on
NN
Not
state
d?
PN
53
20
0P
OI
azo
com
pu
nd
s an
d e
poxy,
vin
yl,
met
hacr
yl,
sil
yl
per
oxid
eN
rad
ical
init
iato
rN
Nm
enti
on
s p
oly
ole
fin
s/ p
last
ics
Cou
ld b
eP
N
54
20
1P
OI
male
ic a
nh
yd
rid
e, (
met
h)a
cryla
mid
e et
cN
rad
ical
poly
mer
isati
on
NN
tub
ula
r p
last
ics
incl
. P
PY
PN
55
20
2P
OI
cou
pli
mg a
gen
t R
(Si)
(X)3
Yra
dic
al
react
ion
NN
met
als
NP
N
56
20
3P
OI
ben
zop
hen
on
e -
ph
oto
poly
mer
isab
le c
om
pou
nd
Yir
rad
iati
on
wit
h a
ctiv
e ra
ys
NN
poly
mer
su
bst
rate
C
ou
ld b
eP
N
57
20
4P
OI
rad
ical
gen
erato
r b
ut
not
spec
ifie
dN
hig
h v
olt
age
dis
charg
e an
d r
ad
ical
poly
mer
isati
on
NN
gla
ss o
r p
oly
mer
bod
yC
ou
ld b
eP
N
58
20
5P
OI
rad
ical
gen
erato
r b
ut
not
spec
ifie
dY
hig
h v
olt
age
dis
charg
e an
d r
ad
ical
poly
mer
isati
on
NN
gla
ss o
r p
oly
mer
bod
yC
ou
ld b
eP
N
59
20
6P
OI
rad
ical
gen
erato
r b
ut
not
spec
ifie
dY
hig
h v
olt
age
dis
charg
e an
d r
ad
ical
poly
mer
isati
on
NN
gla
ss o
r p
oly
mer
bod
yC
ou
ld b
eP
N
60
20
7P
OI
Dia
zoY
UV
lam
pN
NP
lyw
ood
NP
N
PA
TB
AS
ER
esu
lt(H
ITS
/Perh
ap
s o
f In
terest
)R
ea
cti
ve s
pecie
sA
dh
esi
on
?C
urin
g m
eth
od
co
ati
ng
s m
en
tio
ned
?P
ho
toa
ffin
ity l
ab
ell
ing
?S
urfa
ce?
PP
?J
ou
rn
al/
Pa
ten
tA
uto
mo
tive?
12
08
PO
In
ap
thale
nop
han
e, a
nth
race
nop
han
e (d
irad
icals
are
form
ed)
Nch
emic
al
vap
ou
r d
eposi
tion
Y (
an
ti-r
efle
ctiv
e co
ati
ngs)
Nsu
bst
rate
su
rface
not
spec
ifie
dC
ou
ld b
eP
N
22
09
PO
I-
N(m
ak
ing a
new
mate
rial
usi
ng g
raft
ing)
Y (
mak
es p
ain
tin
g t
he
bu
mp
er m
ore
favou
rab
le a
s
a l
ate
r tr
eatm
ent)
NP
oly
eth
yle
ne/
nylo
n c
om
posi
te
NP
Y
32
10
PO
IC
arb
enes
N-
NN
Met
al
NP
N
42
11
PO
IO
rgan
ob
ora
nes
wit
h a
min
o f
un
ctio
nal
org
an
osi
lico
n c
om
pou
nd
sP
rep
ara
tion
of
ad
hes
ives
-N
N-
-P
N
52
12
PO
Iw
ate
r so
lub
le m
etal
carb
enes
N(m
ak
ing n
ew a
qu
esou
poly
mer
dis
per
sion
)N
N-
-P
N
62
13
PO
Iis
ocy
an
ate
, so
diu
m h
yd
roxid
eN
chem
icall
y g
raft
ing
YN
Poly
este
r fi
bre
su
rface
NP
N
72
14
PO
Iu
nsa
tura
ted
pola
r m
on
om
erN
rad
iati
on
gra
ftin
gN
N
mayb
e co
mb
ined
wit
h t
her
mop
last
ic p
oly
mer
or
elast
om
er b
ut
it
is a
mod
ifie
d c
op
oly
mer
rath
er t
han
a s
ub
stra
teC
ou
ld b
eP
N
82
15
PO
Ifl
uoro
nate
d p
oly
mer
an
d u
nsa
tura
ted
pola
r m
on
om
er g
raft
edN
irra
dia
tion
YN
flou
ron
ate
d p
oly
mer
NP
N
Figure 10.43: Patent search summary part 3. Available on CD for magnified view.
319

92
16
PO
Ith
erm
op
last
ic r
esin
wit
h g
raft
cop
oly
mer
(n
ot
spec
ifie
d)
NG
raft
ing
Y (
as
pri
mer
or
coati
ng
agen
t)N
can
be
a m
od
ifie
r fo
r p
oly
ole
fin
s or
surf
ace
/pri
mer
/coati
ng
trea
tin
g a
gen
tM
ayb
e?P
N
10
21
7P
OI
nit
roxyl
term
inate
d o
liger
ms
or
poly
mer
sN
mix
ed i
n t
he
mel
t (a
nd
gra
ftin
g)
NN
ther
mop
last
ic p
oly
mer
sC
ou
ld b
eP
N
11
21
8P
OI
un
satu
rate
d m
on
om
erN
Irra
dia
tion
gra
fted
NN
A h
ose
(m
ad
e fr
om
flu
oro
poly
mer
) an
d p
oly
ole
fin
ou
terl
ayer
On
e of
the
layer
s
cou
ld b
eP
N
12
21
9P
OI
ph
oto
chem
ical
att
ach
men
t of
bio
mole
cule
s b
ut
noth
ing s
pec
ifie
d -
ju
st
carb
on
yl-
con
tain
ing p
hoto
sen
siti
ser
NP
hoto
chem
ical
att
ach
men
t of
bio
mole
cule
s N
NN
ot
spec
ifie
d b
ut
e.g i
s in
ner
su
rface
of
cap
illa
ry
Mayb
e?P
N
13
22
0P
OI
Dia
zom
eth
an
eN
pH
reg
ula
tion
agen
t is
dec
om
pose
d
(dia
zom
eth
an
e?)
YN
does
not
spec
ify
Cou
ld b
eP
N
14
22
1P
OI
acr
yla
te a
nd
gra
ftin
g i
nit
iato
rN
UV
cu
rin
gY
Nan
y w
ood
or
pla
stic
Cou
ld b
eP
N
15
22
2P
OI
Ru
carb
ene
cata
lyst
YM
etath
esis
an
d c
ata
lyst
rea
ctio
ns
YN
does
not
spec
ify
Cou
ld b
eP
N
16
22
3P
OI
Dia
zo e
ster
(p
hoto
sen
siti
ser)
ND
oes
not
say
NN
No s
ub
stra
te,
just
a n
ew c
om
posi
tion
-P
N
17
22
4P
OI
poly
mer
ic c
ou
pli
ng c
om
pou
nd
an
d p
hoto
der
ivati
zed
poly
mer
wit
h
ph
oto
chem
ical
react
ive
gro
up
sN
chem
icall
y r
eact
edN
Nn
o p
oly
ole
fin
sN
PN
18
22
5P
OI
ole
fin
poly
mer
, b
uty
l p
oly
mer
, acr
yla
te,
per
oxid
e, B
A,
male
ic a
nh
yd
rid
eY
hea
tin
gY
NM
etall
ic a
nd
oth
er s
urf
ace
sC
ou
ld b
eP
N
19
22
6P
OI
rad
ical
form
ing s
pec
ies
bu
t d
oes
not
spec
ify
Nra
dic
al
poly
mer
isati
on
NN
--
PN
20
22
7P
OI
hin
der
ed a
min
e li
gh
t st
ab
iliz
er m
oie
ty a
nd
fre
e ra
dic
al
poly
mer
isati
on
init
iato
rsN
rad
ical
poly
mer
isati
on
NN
--
PN
21
22
8P
OI
react
ive
gro
up
s ca
pab
le o
f re
act
ing w
ith
mon
o-c
arb
oxyli
c aci
d
Y
Gra
ftin
g (
so m
od
ifyin
g s
urf
ace
in
stea
d o
f
coati
ng!)
YN
au
tmoti
ve
ap
pli
cati
on
s (t
her
mop
last
ics)
Cou
ld b
eP
Y
22
22
9P
OI
sulf
on
ic a
nd
carb
oxyli
c aci
ds
- ep
oxy a
dh
esiv
e
Y (
bu
t n
ot
a n
ew a
dh
esiv
e, j
ust
to h
elp
con
tact
wit
h a
dh
esiv
e)
gra
ft p
oly
mer
isati
on
- i
t is
to h
elp
con
tact
wit
h
an
ep
oxy a
dh
esiv
eN
NE
poxy a
dh
esiv
es-
PN
23
23
0P
OI
Dia
zo e
ster
of
ben
zola
cton
e, d
iazo
su
lfon
yl
ND
oes
not
spec
ify
NN
Ph
oto
resi
stN
PN
24
23
1P
OI
ph
osp
hati
zed
poly
epoxid
eY
gra
ftin
gY
(a
nd
wa
terb
orn
e!)
Nth
erm
op
last
ic p
oly
mer
sC
ou
ld b
eP
N
25
23
2P
OI
per
oxid
ati
on
Np
eroxid
ati
on
NN
Coal
NP
N
26
23
3P
OI
Dia
zo g
rou
p -
nap
thoqu
inon
edia
zid
oY
UV
rad
iati
on
NN
Ph
oto
resi
stN
ot
sure
PN
27
23
4P
OI
Dia
zo g
rou
p -
nap
thoqu
inon
edia
zid
oY
UV
rad
iati
on
NN
Ph
oto
resi
stN
ot
sure
PN
28
23
5P
OI
Dir
ad
ical
spec
ies
(not
spec
ifie
d)
Pre
ven
tion
of
Not
spec
ifie
dY
Nce
llu
lar
mate
rial
NP
N
29
23
6P
OI
dir
ad
icals
- f
rom
ara
lkyle
ne
an
d a
ryle
ne
Nd
uri
ng m
elt
pro
cess
ing
On
ly f
or
wir
esN
Flu
oro
poly
mer
sN
PN
30
23
7P
OI
dir
ad
icals
(n
ot
spec
ifie
d)
Np
-xyle
ne
vap
ou
r p
hase
poly
mer
isati
on
NN
elec
trost
ati
ogra
oh
ic p
oly
mer
sN
PN
31
23
8P
OI
Dia
zom
eth
yle
ne,
iso
cyan
ate
s, m
elei
mid
eN
Does
not
spec
ify
NN
no p
oly
ole
fin
s! (
bio
logy b
ase
d a
pp
lica
tion
)N
PN
32
23
9P
OI
epoxy,
Isocy
an
ate
, si
lico
ne
bon
ds
ND
oes
not
spec
ify
YN
am
orp
hou
s su
bst
rate
wit
h f
luid
ou
term
ost
layer
(p
erh
ap
s
bio
logic
al
ap
pli
cati
on
alt
hou
gh
does
n’t
say)
NP
N
33
24
0P
OI
dia
zom
eth
an
, es
teri
fica
tion
, m
eth
yl
este
rsN
Does
not
spec
ify
NN
--
PN
Figure 10.44: Patent search summary part 4. Available on CD for magnified view.
320

References
[1] Marketsandmarkets, “Automotive Plastics Market for Passenger Cars: Global
Trends and Forecasts to 2016 - By Types and Geography,” April 18, 2012. Market-
ing study.
[2] M. Kamieth, “Presentation: BASF’s Coatings Division: Focusing on Growth and
Value,” September 5th, 2012.
[3] J. E. Lawniczak, K. A. Williams, and L. T. Germinario, “Characterisation of Adhe-
sion Performance of Topoats and Adhesion Promoters on TPO Substrates,” Journal
of Coatings Technology and Research, vol. 2, no. 5, pp. 399–405, 2005.
[4] Markets and Markets, “Automotive Plastics Market for Passenger Cars by Type,
Application & Geography- Trends & Forecasts to 2018,” June 2013. Global Mar-
keting Study.
[5] R. A. Ryntz, “Coating Adhesion to Low Surface Free Energy Substrates,” Progress
in Organic Coatings, vol. 25, pp. 73–83, 1994.
[6] “The Council of the European Union.” Council Regulation (EU) No 1344/2011,
December 2011. (Non-legislative acts).
[7] R.-Y. Qin and H. Schreiber, “Adhesion at Partially Restructured Polymer Surfaces,”
Colloids and Surfaces, vol. 156, pp. 85–93, 1999.
[8] H. Brown, “Polymer Adhesion,” Materials Forum, vol. 24, pp. 49–58, 2000.
[9] N. M. Bikales, Adhesion and Bonding. Wiley-Interscience, 1971.
321
[10] W. Wake, Adhesion and the Formulation of Adhesives. Applied Science Publishers,
2nd ed., (1982).
[11] Y. Lipatov, Polymer Reinforcement. ChemTec Publishing, 1995.
[12] D. Myers, Surfaces, Interfaces, and Colloids: Principles and Applications. VCH,
Weinheim, 1991.
[13] M. C. an der Leeden and G. Frens, “Surface Properties of Plastic Materials in
Relation to their Adhering Performance,” Advanced Engineering Materials, vol. 4,
no. 5, pp. 280–289, 2002.
[14] C. G. Morris, Academic Press Dictionary of Science and Technology. Academic
Press Inc., 1992.
[15] A. Dupre, Theorie Mecanique de la Chaleur. Gauthier-Villars, 1869.
[16] K. L. Mittal, “Adhesion Measurement of Thin Films,” Electrocomponent Science
and Technology, vol. 3, pp. 21–42, 1976.
[17] K. L. Mittal, Adhesion Measurement of Thin Films, Thick Films and Bulk Coatings.
ASTM International, 1978.
[18] K. L. Mittal, Adhesion Measurement of Films and Coatings, vol. 2. VSP, 2001.
[19] A. V. Pocius, Adhesion and Adhesives Technology: An Introduction. Hanser, 2002.
[20] N. K. Adam and G. Jessop, “Angles of Contact and Polarity of Solid Surfaces,”
Journal of the Chemical Society, vol. 127, pp. 1863–1868, 1925.
[21] D. H. Bangham and R. I. Razouk, “Adsorption and the Wettability of Solid Sur-
faces,” Transactions of the Faraday Society, vol. 33, no. 2, pp. 1459–1462, 1937.
[22] M. E. Schrader, “Young–Dupre Revisited,” Langmuir, vol. 11, pp. 3585–3589, 1995.
322

[23] J. Rouquerol, F. Rouquerol, P. Llewellyn, G. Maurin, and K. S. Sing, Adsorption by
Powders and Porous Solids: Principles, Methodology and Applications. Academic
Press, Google eBook, 2013.
[24] M. Berins, Plastics Engineering Handbook of the Society of the Plastics Industry.
Springer, 1991.
[25] D. M. Brewis and I. Mathieson, Adhesion and Bonding to Polyolefins, vol. 12.
iSmithers Rapra Publishing, 2002.
[26] R. Forch, H. Schonherr, and A. T. A. Jenkins, Surface Design: Applications in
Bioscience and Nanotechnology. John Wiley and Sons, 2009.
[27] T. Schuhman and S. F. Thames, “Coating Solvent Effects Producing Adhesion to
Molded Plastic Parts,” Journal of Adhesion Science and Technology, vol. 19, no. 13–
14, pp. 1207–1235, 2005.
[28] R. A. Ryntz, “Attaining Durable Painted Plastic Components,” Journal of Coatings
Technology and Research, vol. 2, no. 5, pp. 351–360, 2005.
[29] H. R. Morris, B. Munroe, R. A. Ryntz, and P. J. Treado, “Fluorescence and Raman
Chemical Imaging of Thermoplastic Olefin (TPO) Adhesion Promotion,” Langmuir,
vol. 14, pp. 2426–2434, 1998.
[30] H. R. Morris, J. F. Turner, B. Munroe, R. A. Ryntz, and P. J. Treado, “Chemical
Imaging of Thermoplastic Olefin (TPO) Surface Architecture,” Langmuir, vol. 15,
pp. 2961–2972, 1999.
[31] A. J. Kinloch, Adhesion and Adhesives: Science and Technology. Springer, 1987.
[32] S. Mirabedini, H. Arabi, A. Salem, and S. Asiaban, “Effect of Low-Pressure O2
and Ar Plasma Treatments on the Wettability and Morphology of Biaxial-Oriented
Polypropylene (BOPP) Film,” Progress in Organic Coatings, vol. 60, pp. 105–111,
2007.
323
[33] K. Autumn and A. M. Peattie, “Mechanisms of Adhesion in Geckos,” Integrative
and Comparative Biology, vol. 42, no. 6, pp. 1081–1090, 2002.
[34] M. Zhou, N. Pesika, H. Zeng, Y. Tian, and J. Israelachvili, “Recent Advances in
Gecko Adhesion and Friction Mechanisms and Development of Gecko-Inspired Dry
Adhesive Surfaces,” Friction, vol. 1, no. 2, pp. 114–129, 2013.
[35] M. D. Bartlett, A. B. Croll, D. R. King, B. M. Paret, D. J. Irschick, and A. J.
Crosby, “Looking Beyond Fibrillar Features to Scale Gecko-Like Adhesion,” Ad-
vanced Materials, vol. 24, pp. 1078–1083, 2012.
[36] M. Bartlett, D. Irschick, and A. Crosby, eds., Scaling Reversible Adhesion in Syn-
thetic and Natural Adhesive Systems, 3 - 6th March, 2013.
[37] D. King, M. D. Bartlett, D. Irschick, and A. Crosby, eds., Comparing the Perfor-
mance of Draping Adhesives to Geckos on Various Surfaces, 3 - 6th March, 2013.
[38] A. Drane, “Sticking to Science, GeckskinTM
Revolutionizes the Field of Adhesion,”
Feature Stories, University of Massachusetts Amherst, 2012.
[39] Oil and C. C. Association, Surface Coatings: Volume 1 Raw Materials and their
Usage. Springer, 1993.
[40] B. LU and T. C. CHUNG, “Synthesis of Maleic Anhydride Grafted Polyethylene and
Polypropylene, with Controlled Molecular Structures,” Journal of Polymer Science:
Part A: Polymer Chemistry, vol. 38, pp. 1337–1343, 2000.
[41] H. Morgan, Electrostatics 2003. Proceedings of the Institute of Physics Conference
Edinburgh, 23 - 27 March 2003. CRC Press, 2003.
[42] K. Bellman and A. Khare, “European Response to Issues in Recycling Car Plastics,”
Technovation, vol. 19, pp. 721–734, 1999.
[43] R. R. Tiwari and D. R. Paul, “Polypropylene-Elastomer (TPO) Nanocomposites:
1. Morphology,” Polymer, vol. 52, pp. 4955–4969, 2011.
324
[44] K. Deng, N. Felorzabihi, M. A. Winnik, Z. Jiang, Z. Yin, Y. Liu, P. V. Yaneff,
and R. A. Ryntz, “Influence of Position and Composition on Adhesion to Injection-
Molded TPO Plaques as Model Automotive Parts,” Polymer, vol. 50, pp. 5084–5093,
2009.
[45] R. A. Ryntz, “The Effects of Thermoplastic Poly(olefin) (TPO) Morphology on
Subsequent Paintability and Thermal Shock Performance,” Progress in Organic
Coatings, vol. 27, pp. 241–254, 1996.
[46] J. Maxwell, Plastics in the Automotive Industry. Woodhead Publishings, 1994.
[47] Y. S. Lin and H. K. Yasuda, “Low-Temperature Cascade Arc Torch Treatments
for Enhanced Adhesion of Primer to Thermoplastic Olefins,” Journal of Applied
Polymer Science, vol. 67, no. 5, pp. 855–863, 1998.
[48] A. P. Pijpers and R. J. Meier, “Adhesion Behaviour of Polypropylenes after Flame
Treatment Determined by XPS(ESCA) Spectral Analysis,” Journal of Electron
Spectroscopy and Related Phenomena, vol. 121, pp. 299–313, 2001.
[49] M. Strobel, M. C. Branch, M. Ulsh, R. S. Kapaun, S. Kirk, and C. S. Lyons,
“Flame Surface Modification of Polypropylene Film,” Journal of Adhesion Science
and Technology, vol. 20, no. 6, pp. 515–539, 1996.
[50] S. Farris, S. Pazzoli, P. Biagioni, L. Duo, S. Mancinelli, and L. Piergiovanni, “The
Fundamentals of Flame Treatment for the Surface Activation of Polyolefin Polymers
- A Review,” Polymer, vol. 51, pp. 3591–3605, 2010.
[51] D. K. Owens, “Mechanism of Corona-Induced Self-Adhesion of Polyethylene Film,”
Journal OF Applied Polymer Science, vol. 19, no. 1, pp. 265–271, 1975.
[52] D. Briggs and C. R. Kendall, “Derivatization of Discharge-Treated LDPE: an Ex-
tension of XPS Analysis and a Probe of Specific Interactions in Adhesion,” Inter-
national Journal of Adhesion and Adhesives, vol. 2, no. 1, pp. 13–17, 1982.
325
[53] D. Briggs and C. R. Kendall, “Chemical Basis of Adhesion to Electrical Discharge
Treated Polyethylene,” Polymer, vol. 20, pp. 1053–1054, 1979.
[54] D. Briggs and C. R. Kendall, “Electrical Discharge Treatement of Polyproylene
Film,” Polymer, vol. 24, pp. 47–52, 1983.
[55] D. Briggs, “New Developments in Polymer Surface-Analysis,” POLYMER, vol. 25,
no. 10, pp. 1379–1391, 1984.
[56] J. A. Lanauze and D. L. Myers, “Ink Adhesion on Corona-Treated Polyethylene
Studied by Chemical Derivatization of Surface Functional-Groups,” Journal of Ap-
plied Polymer Science, vol. 40, no. 3–4, pp. 595–611, 1990.
[57] E. Sheng, I. Sutherland, and D. M. Brewis, “Effects of Flame Treatment on Propy-
lene Ethylene Copolymer Surfaces,” Surface and Interface Analysis, vol. 19, no. 1–2,
pp. 151–156, 1992.
[58] E. Sheng, I. Sutherland, and D. M. Brewis, “An X-ray Photoelectron-Spectroscopy
Study of Flame Treatment of Polypropylene,” Applied Surface Science, vol. 78,
no. 3, pp. 249–254, 1994.
[59] Y. D. Puydt, D. Leonard, P. Bertrand, and K. L. Mittal, Metallized Plastics 3:
Fundamental and Applied Aspects. Plenum Press, 1992.
[60] E. Papirer, D. Y. Wu, and J. Schultz, “Adhesion of Flame-Treated Polyolefins to
Styrene-Butadiene Rubber,” Journal OF Adhesion Science and Technology, vol. 7,
no. 4, pp. 343–362, 1993.
[61] E. Tomasetti, D. Daoust, R. Legras, P. Bertrand, and P. G. Rouxhet, “Diffu-
sion of Adhesion Promoter (CPO) into Polypropylene/EthylenePropylene (PP/EP)
Ccopolymer Blends: Mechanism,” Journal of Adhesion Science and Technology,
vol. 15, no. 13, pp. 1589–1600, 2001.
326

[62] H. Tang and D. C. Martin, “Microstructural Studies of Interfacial Deformation in
Painted Thermoplastic Polyolefins (TPOs),” Journal of Material Science, vol. 37,
pp. 4783–4791, 2002.
[63] D. Choi, T. S. December, T. Glogovsky, G. Menovcik, W. Merritt, and B. T. Nguyen,
The Effects of TPO Composition an Adhesion and Proposed Chemical Mechanism,
Paintings and Coatings Industry (PCI). 2008.
[64] R. A. Ryntz, Q. Xie, and A. C. Ramamurthy, “Effects of Coating Solvents on the
Morphology of Thermoplastic Polyolefins (tpo),” Journal of Coatings Technology,
vol. 67, no. 843, pp. 45–55, 1995.
[65] T. S. December, B. Nguyen, G. G. Menovcik, and W. H. Merritt, “Coatings and
Methods for Improved Adhesion to Plasticc,” 2009. Patent No. 20090258252, BASF
Corporation.
[66] Y. Ma and M. A. Winnik, “Surface and Interface Characterization of Chlorinated
Polyolefin Coated Thermoplastic Polyolefin,” Journal of Coatings Technology, vol. 2,
no. 5, pp. 407–416, 2005.
[67] R. A. Ryntz, “The Influence of Compositional Variations in Compounded Ther-
moplastic (TPOs) on the Physical and Mechanical Attributes of Injection Molded
Plaques,” Journal of Vinyl and Additive Technology, vol. 3, no. 4, pp. 295–300, 1997.
[68] R. A. Ryntz and B. Buzdon, “The Realtionship between Clearcoat Permeability
and Adhesion Promoter Penetration to the Gasoline Resistance of Painted TPO
Substrates,” Progress in Organic Coatings, vol. 32, pp. 167–172, 1997.
[69] R. A. Ryntz, “Bring Back the Steel? The Growth of Plastics in Automotive Ap-
plications,” Journal of Coatings Technology and Research, vol. 3, no. 1, pp. 3–14,
2006.
327

[70] R. J. Clemens, G. N. Batts, J. E. Lawniczak, K. P. Middleton, and C. Sass, “How
do Chlorinated Poly(olefins) Promote Adhesion of Coatings to Poly(propylene)?,”
Progress in Organic Coatings, vol. 24, pp. 43–54, 1994.
[71] S. Waddington and D. Briggs, “Adhesion Mechanisms between Polymer-Coatings
and Polypropylene Studies by XPS and SIMS,” Polymer Communications, vol. 32,
no. 16, pp. 506–508, 1991.
[72] F. M. Mirabella, N. Dioh, and C. G. Zimba, “Theoretical Analysis and Experimental
Characterization of the TPO/Adhesion Promoter/Paint Interface of Painted Ther-
moplastic Polyolefins (TPO),” Polymer Engineering and Science, vol. 40, no. 9,
pp. 2000–2006, 2000.
[73] A. M. Forster, C. A. Michaels, L. Sung, and J. Lucas, “Modulus and Chemical
Mapping of Multilayer Coatings,” Applied Materials and Interfaces, vol. 1, no. 3,
pp. 597–603, 2009.
[74] R. A. Ryntz, D. Britz, D. M. Mihora, and R. Pierce, “Measuring Adhesion to
Poly(olefins): The Role of Adhesion Promoter and Substrate,” Journal of Coatings
Technology and Research, vol. 73, no. 921, pp. 107–115, 2001.
[75] A. Andersen, “Adhesion of Coatings: An Interfacial Challenge.” Improvement of
Adhesion with Increasing Levels of EPDM in PP, 10th Coatings Science Interna-
tional 2011, Hotels van Oranje Noordwijk , the Netherlands, June 2011.
[76] A. Vasconcellos, J. Oliveira, and R. Baumhardt-Neto, “Adhesion of Polypropylene
Treated with Nitric and Sulfuric Acid,” European Polymer Journal, vol. 33, no. 10–
12, pp. 1731–1734, 1997.
[77] T. Ebeling, A. Hiltner, and E. Baer, “Effect of Peel Rate and Temperature on
Delamination Toughness of PC-SAN Microlayers,” Polymer, vol. 40, no. 6, pp. 1525–
1536, 1999.
328

[78] C. Poon, S. Chum, A. Hiltner, and E. Baer, “Adhesion of Polyethylene Blends to
Polypropylene,” Polymer, vol. 45, no. 3, pp. 893–903, 2004.
[79] N. V. Bhat and D. J. Upadhyay, “Plasma-Induced Surface Modification and Adhe-
sion Enhancement of Polypropylene Surface,” Journal of Applied Polymer Science,
vol. 86, no. 4, pp. 925–936, 2002.
[80] R. Mahlberg, H. Niemi, F. Denes, and R. Rowell, “Application of AFM on the
Adhesion Studies of Oxygen-Plasma-Treated Polypropylene and Lignocellulosics,”
Langmuir, vol. 15, no. 8, pp. 2985–2992, 1999.
[81] L. Carrino and W. P. G. Moroni, “Cold Plasma Treatment of Polypropylene Surface:
A Study on Wettability and Adhesion,” Journal of Materials Processing Technology,
vol. 121, no. 2–3, pp. 373–382, 2002.
[82] C. Boullanger, J. Chapel, L. Danel, and J. Fournier, “Adhesion Mechanisms of
EnamelVarnishes on Copper: Adhesion Promoter versus Corrosion Inhibitor,” Jour-
nal of Applied Polymer Science, vol. 89, no. 4, pp. 952–958, 2003.
[83] D. E. Packham, Handbook of Adhesion. John Wiley and Sons, 2006.
[84] R. Lacombe, Adhesion Measurement Methods: Theory and Practice. CRC Press,
2006.
[85] DIN, “Paints and Varnishes - Cross-Cut Test (ISO 2409:2007),” tech. rep., DIN
Deutsches Institut fur Normung e.V., Berlin, 2007.
[86] A. J. Goldschmidt and H.-J. Streitbege, BASF Handbook on Basics of Coating
Technology. BASF, 2003.
[87] H.-J. Streitberger and K.-F. Dossel, Automotive Paints and Coatings. Wiley-VCH,
2008.
329

[88] K. Jaehnichen, J. Frank, D. Pleul, and F. Simon, “A Study of Paint Adhesion to
Polymeric Substrates,” Journal of Adhesion Science and Technology, vol. 17, no. 12,
pp. 1635–1654, 2003.
[89] J. H. Clint, “Adhesion and Components of Solid Surface Energies,” Current Opinion
in Colloid and Interface Science, vol. 6, no. 1, pp. 28–33, 2001.
[90] G. Grundmeier and M. Stratmann, “Adhesion and De-adhesion Mechanisms at
Polymer/Metal Interfaces: Mechanistic Understanding Based on In Situ Studies
of Buried Interfaces,” Annual Review of Materials Research, vol. 35, pp. 571–615,
2005.
[91] R. Jones, H. M. Pollock, J. A. S. Cleaver, and C. S. Hodges, “Adhesion Forces
between Glass and Silicon Surfaces in Air Studied by AFM: Effects of Relative
Humidity, Particle Size, Roughness, and Surface Treatment,” Langmuir, vol. 18,
no. 21, pp. 8045–8055, 2002.
[92] S. Gourianova, N. Willenbacher, , and M. Kutschera, “Chemical Force Microscopy
Study of Adhesive Properties of Polypropylene Films: Influence of Surface Polarity
and Medium,” Langmuir, vol. 21, pp. 5429–5438, 2005.
[93] G. Tao, A. Gong, J. Lu, H.-J. Sue, and D. E. Bergbreiter, “Surface Functional-
ized Polypropylene: Synthesis, Characterization, and Adhesion Properties,” Macro-
molecules, vol. 34, pp. 7672–7679, 2001.
[94] J. C. Vickerman and D. Briggs, ToF-SIMS Surface Analysis by Mass Spectrometry.
IM Publications, 2001.
[95] E. D. F. A. Society, Microelectronic Failure Analysis: Desk Reference : 2002 Sup-
plement. ASM International, 2002.
[96] N. Fairley, CasaXPS Manual 2.3.15 Introduction to XPS and AES. Casa Software
Ltd., 2009.
330

[97] S. J. Hinder, C. Lowe, J. T. Maxted, and J. F. Watts, “A ToF-SIMS Investigation
of a Buried Polymer/Polymer Interface Exposed by Ultra-Low-Angle Microtomy,”
Surface and Interface Analysis, vol. 36, pp. 1575–1581, 2004.
[98] S. J. Davis and J. F. Watts, “Interfacial Chemistry of Adhesive Joint Failure: an In-
vestigation by Small Area XPS, Imaging XPS and ToF-SIMS,” Journal of Materials
Chemistry, vol. 6, no. 3, pp. 479–493, 1996.
[99] A. Rattana, M.-L. Abel, and J. F. Watts, “ToF-SIMS Studies of the Adsorption
of Epoxy Resin Molecules on Organosilane-Treated Aluminium: Adsorption Kinet-
ics and Adsorption Isotherms,” International Journal of Adhesion and Adhesives,
vol. 26, pp. 28–39, 2006.
[100] K. Shimizu, C. Phanopoulos, R. Loenders, M.-L. Abela, and J. F.Watts, “The Char-
acterization of the Interfacial Interaction between Polymericmethylene Diphenyl Di-
isocyanate and Aluminum: A ToF-SIMS and XPS Study,” Surface Interface Anal-
ysis, vol. 42, pp. 1432–1444, 2010.
[101] M.-L. Abel, J. F. Watts, and R. P. Digby, “The Adsorption of Alkoxysilanes on
Oxidised Aluminium Substrates,” International Journal of Adhesion and Adhesives,
vol. 18, pp. 179–192, 1998.
[102] F. Garbassi, E. Occhiello, F. Polato, and A. Brown, “Surface Effect of Flame Treat-
ments on Polypropylene, Part 2,” Journal of Materials Science, vol. 22, pp. 1450–
1456, 1987.
[103] F. Garbassi, E. Occhiello, and F. Polato, “Surface Effect of Flame Treatments on
Polypropylene, Part 1,” Journal of Materials Science, vol. 22, pp. 207–212, 1987.
[104] D. Montezinos, B. G. Wells, and J. L. Burns, “The use of Ruthenium in Hypochlorite
as a Stain for Polymeric Materials,” Journal of Polymer Science: Polymer Letters
Edition, vol. 23, no. 8, pp. 421–425, 1985.
331

[105] J. S. Trent, J. I. Scheinbeim, and P. R. Couchman, “Ruthenium Tetraoxide Staining
of Polymers for Electron Microscopy,” Macromolecules, vol. 16, pp. 589–598, 1983.
[106] J. S. Trent, “Rhuthenium Tetraoxide Staining of Polymers: New Preparative Meth-
ods for Electron Microscopy,” Macromolecules, vol. 17, pp. 2930–2931, 1984.
[107] H. Hintze-Bruning and H. Borgholte, “Coating of Untreated Polypropylene with
Halogen Free Aqueous Materials,” Progress in Orgnanic Coatings, vol. 40, pp. 49–
54, 2000.
[108] G. M. Brown and J. H. Butler, “New Method for the Characterisation of Domain
Morphology of Polymer Blends using Ruthenium Tetraoxide Staining and Low Volt-
age Scanning Electron Microscopy (LVSEM),” Polymer, vol. 38, no. 15, pp. 3937–
3945, 1997.
[109] L. L. Ban and K. S. Campo, “Determining the Polymer Domain Structure of Ther-
moplastic Elastomer Blends by Microscopy Techniques,” Rubber World, vol. 207,
no. 4, pp. 20–22, 1993.
[110] R. M. A. l’Abee, A. M. J. T. Vissers, J. G. P. Goosens, A. B. Spoelstra, and M. van
Duin, “Characterization of the Morphology of Co-Extruded, Thermoplastic/Rubber
Multi-Layer Tapes,” Analytica Chimica Acta, vol. 654, pp. 11–19, 2009.
[111] Z. Yin, J. Yang, N. Coombs, M. A. Winnik, R. A. Ryntz, and P. V. Yaneff, “Quan-
titative Probing the Interfacial Structure of TPO/CPO Blends by Transmission
Electron Microscopy via EDX,” Polymer, vol. 48, pp. 1297–1305, 2007.
[112] N. Meedard, C. Poleunis, X. V. Eynde, and P. Bertrand, “Characterization of Ad-
ditives at Polymer Surfaces by ToF-SIMS,” Surface and Interface Analysis, vol. 34,
pp. 565–569, 2002.
332

[113] M. Haunschmidt, C. W. Klampfl, W. Buchberger, and R. Hertsens, “Rapid Indenti-
fication of Stabilisers in Polypropylene using Time-of-Flight Mass Spectroscopy and
DART as Ion Source,” Analyst, vol. 135, pp. 80–85, 2010.
[114] U. D. Cakmak and T. Schoberl, “Nanoindentation of Polymers,” Meccanica, vol. 47,
pp. 707–718, 2012.
[115] I. Sutherland, D. M. Brewis, R. J. Heath, and E. Sheng, “Modification of Polypropy-
lene Surfaces by Flame Treatment,” Surface and Interface Analysis, vol. 17, pp. 507–
510, 1991.
[116] Y. S. Lin and H. K. Yasuda, “Surface Modification on Thermoplastic Olefins by
Low–Temperature Cascade Arc Discharge-Air Plasmas for Enhanced Adhesion with
Primer,” Jurnal of Polymer Science Part B-Polymer, vol. 40, no. 7, pp. 623–637,
2002.
[117] S. Wu, Polymer Interface and Adhesion. CRC Press, 1982.
[118] F. Garbassi, M. Morra, and E. Occhiello, Polymer Surfaces: From Physics to Tech-
nology. Wiley, 1994.
[119] J. Meister, Polymer Modification: Principles, Techniques, and Applications. Marcel
Dekker, 2000.
[120] E. Kiss, J. Samu, and A. Toth, “Novel Ways of Covalent Attachment of
Poly(ethylene oxide) onto Polyethylene: Surface Modification and Characterization
by XPS and Contact Angle Measurements,” Langmuir, vol. 12, no. 6, pp. 1651–1657,
1996.
[121] L. G. Beholz, C. L. Aronson, and A. Zand, “Adhesion Modification of Polyolefin
Surfaces with Sodium Hypochlorite in Acidic Media,” Polymer, vol. 46, no. 13,
pp. 4604–4613, 2005.
333

[122] L. W. McKee, Fluorinated Coatings and Finishes Handbook: The Definitive User’s
Guide. William Andrew, 2006.
[123] M. J. Walzak, S. Flynn, R. Foerch, J. M. Hill, E. Karbashewski, A. Lin, and M. Stro-
bel, “UV and Ozone Treatment of Polypropylene and Poly(ethylene Terephtha-
late),” Journal of Adhesion Science and Technology, vol. 9, no. 9, pp. 1229–1248,
1995.
[124] A. Overbeek, “Polymer Heterogeneity in Waterborne Coatings,” Journal of Coat-
ings Technology and Research, vol. 7, no. 1, pp. 1–21, 2010.
[125] M. A. J. Schellekens, G. C. Overbeek, T. Nabuurs, and J. Geurts, “Adhesion to
Plastic with Block Copolymers obtained using RAFT,” PCT/EP2009/053891, Oc-
tober 8th, 2009.
[126] C.-W. Lin and W.-L. Lee, “An Investigation on the Modification of Polypropylene
by Grafting of Maleic Anhydride Based on the Aspect of Adhesion,” Journal of
Applied Polymer Science, vol. 70, pp. 383–387, 1998.
[127] D. L. Malotky, S. Hofmann, C. F. Diehl, M. D. Read, A. Batistini, H. C. Silvis, and
C. Bette, “Adhesion Promoter System, and Method of Producing the Same,” April
20th, 2011. Patent EP20110717141, Dow Global Technologies LLC.
[128] D. M. Brewis and D. Briggs, “Adhesion to Polyethylene and Polypropylene,” Poly-
mer, vol. 22, no. 7–16, 1981.
[129] Y. Komatsu, J. Kamimura, O. Aoki, D. B. Chung, and M. S. Wiseman, “New TPO
and Coating Technology for Bumper without 1.1.1-Trichloroethane,” Tech. Rep.
Paper 940187, SAE Technical Papers, 1994.
[130] K. Manabe, Y. Sato, and R. Muroi, “Process for the Pretreatment of a Polyolefin
Product Before Coating,” August 14th 1984. Patent No. 4465715, Toyoda Gosei
Co Ltd.
334

[131] H. Harada, Y. Ikezawa, S. Kanzaki, H. Shinonaga, and S. Sogabe, “Polypropylene
Resin Composititon,” April 29th 1997. Patent No. 5624991, Sumitomo Chemical
Company Limited.
[132] F. Awaja, M. Gilbert, G. Kelly, B. Fox, R. Brynolf, and P. Pigram, “Surface Prop-
erties of Polypropylene following a Novel Industrial Surface-Treatment Process,”
Surface Interface Analysis, vol. 40, pp. 1454–1462, 2008.
[133] S. Hofmann, C. F. Diehl, and D. L. Malotky, “Adhesion Promoter System, and
Method of Producing the Same,” 7th March, 2013. Patent No. 20130059149, Dow
Global Technologies.
[134] J. W. Power and M. Thompson, “Waterborne Coating Composition Useful for Pro-
moting Adhesion to Plastic Surfaces,” August 15th, 2013. Patent US20130209792
A1, W.M. Barr & Company.
[135] J. Brunner, H. Senn, and F. M. Richards, “3-Trifluoromethyl-3-phenyldiazirine,”
The Journal of Biological Chemistry, vol. 255, no. 8, pp. 3313–3318, 1980.
[136] E. V. Anslyn, Modern Physical Organic Chemistry. University Science Books,
Wilsted and Taylor Publishing Services, 2006.
[137] M. Akay, Introduction to Polymer Science and Technology. Mustafa Akay and
Ventus Publishing ApS, 2012.
[138] W. Rasband, “Research Services Branch, National Institute of Mental Health,
Bethesda, Maryland, USA..” Source code freely available. Accessed July 2013.
http://rsbweb.nih.gov/ij/index.html.
[139] Microsoft R©, “Office Excel.” 2007.
[140] V. Bellitto, Atomic Force Microscopy - Imaging, Measuring and Manipulating Sur-
faces at the Atomic Scale. InTech, 2012.
335

[141] Aglient Technologies, “Agilent Continuous Stiffness Measurement (CSM)
Option Data Sheet,” tech. rep., Agilent Technologies, Inc. 2011,
http://cp.literature.agilent.com/litweb/pdf/5990-4183EN.pdf, 2011.
[142] W. Oliver and G. Pharr, “Measurement of Hardness and Elastic Modulus by Instru-
mented Indentation: Advances in Understanding and Refinements to Methodology,”
Journal of Materials Research, vol. 19, no. 1, pp. 3–20, 2004.
[143] W. C. Oliver and G. M. Pharr, “An Improved Technique for Determining Hardness
and Elastic Modulus using Load and Displacement Sensing Indentation Experi-
ments,” Journal of Materials Research, vol. 7, no. 6, pp. 1594–1583, 1992.
[144] A. Rudawska and E. Jacniacka, “Analysis for Determining Surface Free Energy
Uncertainty by the OwenWendt Method,” International Journal of Adhesion &
Adhesives, vol. 29, pp. 451–457, 2009.
[145] S. Wu, “Calculation of Interfacial Tension in Polymer Systems,” Journal of Polymer
Science Part C: Polymer Symposia, vol. 34, no. 1, pp. 19–30, 1971.
[146] Sigma-Aldrich, “Preparing Self-Assembled Monolayers (SAMs) A Step-by-Step
Guide for Solution-Based Self-Assembly,” tech. rep., Technical Bulletin AL-266,
Accessed 2013.
[147] H. H. Telle, A. G. Urena, and R. J. Donovan, Laser Chemistry: Spectroscopy,
Dynamics and Applications, ch. Chapter 10: Reflection, Refraction and Diffraction,
p. 152. John Wiley and Sons, 2007.
[148] H. Fujiwara, Spectroscopic Ellipsometry: Principles and Applications. John Wiley
and Sons, 2007.
[149] M. Prato, R. Moroni, F. Bisio, R. Rolandi, L. Mattera, O. Cavalleri, and M. Canepa,
“Optical Characterization of Thiolate Self-Assembled Monolayers on Au(111),” The
Journal of Physical Chemistry, vol. 112, pp. 3899–3906, 2008.
336

[150] G. Bracco and B. Holst, Surface Science Techniques. 663, Springer, xxiii ed., 2013.
ISBN 978-3-642-34242-4.
[151] S. Abbott, C. M. Hansen, H. Yamamoto, and R. S. V. III, Hansen Solubility Pa-
rameters in Practice: Software, Datasets, eBook. Hansen-Solubility.com, 2008-2010.
ISBN 978-0-9551220-2-6.
[152] H. J. Vandenburg, A. A. Clifford, K. D. Bartle, and S. A. Zhu, “Factors Affect-
ing High-Pressure Solvent Extraction (Accelerated Solvent Extraction) of Additives
from Polymers,” Analytical Chemistry, vol. 70, pp. 1943–1948, 1998.
[153] H. J. Vandenburg, A. A. Clifford, K. D. Bartle, R. E. Carlson, J. Carroll, and I. D.
Newton, “A Simple Solvent Selection Method for Accelerated Solvent Extraction of
Additives from Polymers,” The Analyst, vol. 124, pp. 1707–1710, 1999.
[154] R. N. S. Sodhi, “Time-of-Flight Secondary Ion Mass Spectrometry (TOF-SIMS):
Versatility in Chemical and Imaging Surface Analysis,” The Analyst, pp. 483–487,
2004.
[155] N. Yamamoto, F. Bernardi, A. Bottoni, M. Olivucci, M. A. Robb, and S. Wilsey,
“Mechanism of Carbene Formation from the Excited States of Diazirine and Di-
azomethane: An MC-SCF Study,” Journal of the American Chemical Society,
vol. 116, no. 5, pp. 2064–2074, 1994.
[156] G. Das, “Multiconfiguration Selfconsistent Field (MCSCF) Theory for Excited
States,” The Journal of Chemical Physics, vol. 58, no. 11, pp. 5104–5110, 1973.
[157] L. CMS, “www.fdms.de,” tech. rep., official website of Linden CMS, Accessed Jan-
uary 2013.
[158] R. G. Lomax and D. L. Hahs-Vaughn, An Introduction to Statistical Concepts.
Tailor and Francis Group, LLC, Third Edition ed., 2012.
337
[159] Y. Jinghua, Z. Enle, J. Guiping, J. Feng, and H. Boatong, “Morphology of Vul-
canized EPDM/PP Blend Thermoplastic Elastomers,” Scientia Sinica (Series B),
vol. XXIX, no. 12, pp. 1233–1238, 1986.
[160] J. Maitland Jones, Organic Chremistry. New York & London: W. W. Norton &
Company, 3rd ed., 2005. Page 472.
[161] T. Nedvok and F. Lednicky, “Morphologies of Polyethylene-
Ethylene/Propylene/Diene Monomer Particles in Polypropylene-Rich Polyolefin
Blends: Flake Structure,” Journal of Applied Polymer Science, vol. 90, pp. 3087–
3092, 2003.
[162] N. Holz, G. S. Goizueta, and N. J. Capiati, “Linear Low Density Polyethylene Addi-
tion to Polypropylene/Elastomer Blends: Phase Structure and Impact Properties,”
Polymer Engineering and Science, vol. 36, no. 22, pp. 2765–2770, 1996.
[163] W.-J. Ho and R. Salovey, “Processing of Polyolefin Blends,” Polymer Engineering
and Science, vol. 21, no. 13, pp. 839–843, 1981.
[164] F. C. Strehling, T. Huff, C. S. Speed, and G. Wissler, “Structure and Properties
of Rubber–Modified Polypropylene Impact Blends,” Journal of Applied Polymer
Science, vol. 26, pp. 2693–2711, 1981.
[165] R. N. Wenzel, “Resistance of Solid Surfaces to Wetting by Water,” Industrial and
Engineering Chemistry, vol. 28, no. 8, pp. 988–994, 1936.
[166] A. B. D. Cassie and S. Baxter, “Wettability of Porous Surfaces,” Transactions of
the Faraday Society, vol. 40, pp. 546–551, 1944.
[167] M. C. Hsieh, J. P. Youngblood, W. Chen, and T. J. McCarthy, “Ultrahydrophobic
Polymeric Surfaces Prepared using Plasma Chemistry,” vol. 2, pp. 77–90, 2000.
ISBN 9067643270.
338

[168] S. Yariv, M. E. Schrader, and G. I. Loeb, Modern Approaches to Wettability. Plenum
Press, New York, 1992. pp. 279–326.
[169] S. Chander, J. M. Wie, and D. W. Fuerstenau, “Advances in Interfacial Phenomena
of Particulate/Solution/Gas Systems: Application to Flotation Research,” AIChE
Symposium Series 150, pp. 183–188, 1975.
[170] M. C. Fuerstenau, A. Lopez-Valdiviezo, and D. W. Fuerstenau, “Role of Hydrolyzed
Cations in the Natural Hydrophobicity of Talc,” International Journal of Mineral
Processing, vol. 23, pp. 161–170, 1988.
[171] J. H. Rayner and G. Brown, “Crystal Structure of Talc,” Clays and Clay Minerals,
vol. 21, no. 2, pp. 103–114, 1973.
[172] P. A. Ciullo, Minerals and their Uses – A Handbook and Formulary. New Jersey,
1996.
[173] B. Pukansky, Polypropylene: Structure, Blends and Composites, vol. 3. Chapman
and Hall, London, 1995.
[174] P. Durfton, Functional Additives for the Plastics Industry: Trends in Use and Tech-
nology. Rapra Technology Limited, 1998.
[175] D. M. Brewis, ed., Pretreatments of Polymers to Enhance Adhesion in Transport Ap-
plications, (Brussels, Belgium), Polymers in Mass Transit Conference 2001, Rapra
Technology, 2001.
[176] N. P. Cheremisinoff, Handbook of Engineering Polymeric Materials. Marcel Dekker
Inc., 1997.
[177] M. Strobel, V. Jones, C. S. Lyons, M. Ulsh, M. J. Kushner, R. Dorai, and
M. C. Branch, “A Comparison of Corona-Treated and Flame-Treated Polypropy-
lene Films,” Plasmas and Polymers, vol. 8, no. 1, pp. 61–95, 2003.
339

[178] Eastman, How to Use Eastman CPOs As Adhesion Promoters. North America,
publication GN-408B ed., September 1998.
[179] J. C. Riviere and S. Myhra, Handbook of Surface and Interface Analysis. CRC
Press, 2nd ed., 2009.
[180] F. Fujimoto, “Properties and Applications of Chlorinated Polypropylene,” Paint &
Resin, pp. 36–40, 1986.
[181] S. Paul, “Painting of Plastics: New Challenges and Possibilities,” Surface Coatings
International Part B: Coatings Transactions, vol. 85, no. B2, pp. 79–168, 2002.
[182] O. Zerbe and S. Jurt, Applied NMR Spectroscopy for Chemists and Life Scientists.
John Wiley and Sons, 2013.
[183] D. Leonard, Y. Chevolot, O. Bucher, H. Sigrist, and H. J. Mathieu, “ToF-
SIMS and XPS Study of Photoactivatable Reagents Designed for Surface Glyco-
engineering, Part i. N -(m-(3-(Trifluoromethly)diazirine-3-yl)phenyl)-4-maleimido-
butyramide (MAD) on Silicon, Silicon Nitride and Diamond,” Surface and Interface
Analysis, vol. 26, pp. 783–792, 1998.
[184] D. Leonard, Y. Chevolot, O. Bucher, W. Haenni, H. Sigrist, and H. J. Math-
ieu, “ToF-SIMS and XPS Study of Photoactivatable Reagents Designed for Sur-
face Glycoengineering, Part II. N -[m-(3-(Trifluoromethly)diazirine-3-yl)phenyl]-4-
(-3-thio(1-d-galactopyrannosyl)-maleimidyl)butyramide (MAD-Gal) on Diamond,”
Surface and Interface Analysis, vol. 26, pp. 793–799, 1998.
[185] D. Leonard, Y. Chevolot, F. Heger, J. Martins, D. H. G. Crout, H. Sigrist,
and H. J. Mathieu, “ToF-SIMS and XPS Study of Photoactivatable Reagents
Designed for Surface Glycoengineering, Part III. 5-Carboxamidopentyl-N -[m-
[3-(Trifluoromethly)diazirine-3-yl]phenyl]-β-d-galactopyranosyl]-(1->4)-1-thio-β-
d-glucopyranoside (lactose aryl diazirine) on Diamond,” Surface and Interface
Analysis, vol. 31, pp. 457–464, 2001.
340

[186] S. Ebnesajjad and C. Ebnesajjad, Surface Treatment of Materials for Adhesion
Bonding. William Andrew Incorporated, 2006.
[187] G. C. Lloyd-Jones, R. W. Alder, and G. J. J. Owen-Smith, “Intermolecular Insertion
of an N,N-Heterocyclic Carbene into a Nonacidic C-H Bond: Kinetics, Mechanism
and Catalysis by (K-HMDS)2 (HMDS = Hexamethyldisilazide),” Chemistry - A
European Journal, vol. 12, pp. 5361–5375, 2006.
[188] K. T. Chang and H. Shechter, “Roles of Multiplicity and Electronic Excitation on
Intramolecular Reactions of Alkylcarbenes in Condensed Phases,” Journal of the
American Chemical Society, vol. 101, no. 17, pp. 5082–5084, 1979.
[189] A. Mansoor and I. D. R. Stevens, “Hot Radical Effects in Carbene Reactions,”
Tetrahedron Letters, vol. 7, no. 16, pp. 1733–1737, 1966.
[190] J. J. Havel, “Carbene Multiplicity in Decompositions of 2-Methyl-2-
phenyldiazopropane,” Journal of Organic Chemistry, vol. 41, no. 8, pp. 1464–1465,
1976.
[191] J. F. Arenas, I. Lopez-Toc’on, J. C. Otero, and J. Soto, “Carbene Formation in its
Lower Singlet State from Photoexcited 3H-Diazirine or Diazomethane. A Combined
CASPT2 and ab Initio Direct Dynamics Trajectory Study,” Journal of the American
Chemical Society, vol. 124, no. 8, pp. 1728–1735, 2002.
[192] J. M. Figuera, J. M. Perez, and A. Tobar, “Energy Distribution and Mechanism in
3-Chloro-3-methyldiazirine Photolysis,” Journal of the Chemical Society, Faraday
Transactions 1: Physical Chemistry in Condensed Phases, vol. 74, pp. 809–817,
1978.
[193] K. H. Fischer, P. Hemberger, I. Fischer, and A. M. Rijs, “Infrared Spectra of Reac-
tive Species Generated by Flash Pyrolysis in a Free Jet,” ChemPhysChem, vol. 11,
pp. 3228–3230, 2010.
341

[194] K. Adamsons, “Chemical Surface Characterization and Depth Proling of Automo-
tive Coating Systems,” Progress in Polymer Science, vol. 25, pp. 1363–1409, 2000.
[195] L. Carrino, W. Polini, and L. Sorrentino, “Ageing Time of Wettability on Polypropy-
lene Surfaces Processed by Cold Plasma,” Journal of Materials Processing Technol-
ogy, vol. 153–154, pp. 519–525, 2004.
[196] A. Y. Vainer, K. M. Dyumaev, S. A. Mareeva, R. M. Dragunskaya, N. V. Efimova,
and Z. A. Slyusarenko, “Synthesis and Thermo and Photochemical Reactions of Un-
saturated Fluorene Containing Poly(arylene ether)s with Pendant Trifluoromethyl-
diazirine Groups,” Doklady Physical Chemistry, vol. 445, pp. 123–127, 2012.
[197] C. N. Sanrame, C. P. Suhrada, H. Dang, and M. A. Garcia-Garibay, “Photochem-
istry of Crystalline Chlorodiazirines: The Influence of Conformational Disorder
and Intermolecular Cl—N=N Interactions on the Solid-State Reactivity of Singlet
Chlorocarbenes,” The Journal of Physical Chemistry A, vol. 107, pp. 3287–3294,
2003.
[198] G. Wagner, W. Knoll, M. M. Bobek, L. Brecker, H. W. G. van Herwijnen, and
U. H. Brinker, “Structure–Reactivity Relationships: Reactions of a 5-Substituted
Aziadamantane in a Resorcin[4]arene-based Cavitand,” Organic Letters, vol. 12,
no. 2, pp. 332–335, 2010.
[199] J. E. Zanetti and G. Eglopf, “The Thermal Decomposition of Benzene,” The Journal
of Industrial and Engineering Chemistry, vol. 9, no. 4, pp. 350–356, 1917.
[200] C.-Y. Lin and M. C. Lin, “Thermal Decomposition of Methyl Phenyl Ether in
Shock Waves: The Kinetics of Phenoxy Radical Reactions,” Journal of Physical
Chemistry, vol. 90, pp. 425–431, 1986.
[201] A. Toussaint, “Self-Stratifying Coatings for Plastic Substrates,” Progress in Organic
Coatings, vol. 28, pp. 183–195, 1996.
342
[202] V. Verkholantsev, “Self-Stratifying Coatings for Industrial Applications,” Pigment
and Resin Technology, vol. 32, no. 5, pp. 300–306, 2003.
[203] G. L. Robertson, Food Packaging: Principles and Practice. CRC Press, Third
Edition ed., 2012.
[204] E. Hu, X. Hu, T. Liu, Y. Liu, R. Song, and Y. Chen, “Investigation of Morphology,
Structure and Composition of Biomass-oil Soot Particles,” Applied Surface Science,
vol. 270, pp. 596–603, 2013.
[205] M. A. Chinelatto and J. A. M. Agnelli, “Effect of the Chemical Stabilization Sys-
tem on the Photooxidation of Polypropylene containing Talc and Carbon Black,”
Polymer Degradation and Stability, vol. 50, pp. 13–19, 1995.
[206] H. P. Boehm, “Some Aspects of the Surface Chemistry of Carbon Blacks and Other
Carbons,” Carbon, vol. 32, no. 5, pp. 759–769, 1994.
[207] J. Brydson, Plastics Materials. Butterworth-Heinemann, A member of the Reed
Elsevier plc group, 7th ed., 1999.
[208] H. G. Karian, Handbook of Polypropylene and Polypropylene Composites. Taylor $
Francis, 2nd, revised and expanded ed., 2009.
[209] M. E. Schrader and S. Yariv, “Wettability of Clay Minerals,” Journal of Colloid
and Interface Science, vol. 136, no. 1, pp. 85–94, 1990.
[210] M. Xanthos, Functional Fillers for Plastics. Whiley-VCH, 2nd, updated and en-
larged edition ed., 2010.
[211] Y.-C. Ou, T.-T. Guo, X.-P. Fang, and Z.-Z. Yu, “Toughening and Reinforcing
Polypropylene with Core-Shell Structured Fillers,” Journal of Applied Polymer Sci-
ence, vol. 74, no. 10, pp. 2397–2403, 1999.
[212] Y. U. Long and R. A. Shanks, “PP/Elastomer/Filler Hybrids. II. Morphologies and
Fracture,” Journal of Applied Polymer Science, vol. 62, no. 4, pp. 639–646, 1996.
343
[213] B. SE, “ToF-SIMS Database.” Polymer Addtive ToF SIMS Spectra, 2013.
[214] Ciba, “Ciba IRGAFOS 168 Datasheet,” tech. rep., Ciba Inc, 2009.
[215] D. Mobius and R. Miller, Novel Methods to Study Interfacial Layers. Elsevier, 2001.
[216] W. L. Baun, “Ion Beam Methods for the Surface Characterisation of Polymers,”
Pure and Applied Chemistry, vol. 54, no. 2, pp. 323–336, 1982.
[217] D. Briggs, “Analysis of Polymer Surfaces by SIMS,” Surface and Interface Analysis,
vol. 4, no. 4, pp. 151–155, 1982.
[218] W. J. van Ooij and R. H. G. Brinkhuis, “Interpretation of the Fragmentation Pat-
terns in Static SIMS Analysis of Polymers. Part I. Simple Aliphatic Hydrocarbons,”
Surface and Interface Analysis, vol. 11, pp. 430–440, 1988.
[219] D. Briggs, “Analysis of Polymer Surfaces by SIMS. Part 14. Aliphatic Hydrocarbons
Revisited,” Surface and Interface Analysis, vol. 15, pp. 734–738, 1990.
[220] L. Lianos, C. Quet, and T. M. Duc, “Surface Structural Studies of Polyethylene,
Polypropylene and their Copolymers with ToF SIMS,” Surface and Interface Anal-
ysis, vol. 21, pp. 14–22, 1994.
[221] Y. Kato, D. J. Carlsson, and D. M. Wiles, “The Photo-Oxidation of Polypropylene:
Some Effects of Molecular Order,” Journal of Applied Polymer Science, vol. 13,
no. 7, pp. 1447–1458, 1969.
[222] A. M. Cunha and S. Fakirov, Structure Development During Polymer Processing.
Springer; Softcover reprint of the original 1st ed. 2000 edition, 2000.
[223] R. D. Adams, Adhesive Bonding: Science, Technology and Applications. Woodhead
Publishing Limited, 2005.
344

[224] A. T. Asbeck, S. Kim, M. R. Cutkosky, W. R. Provancher, and M. Lanzetta, “Scal-
ing Hard Vertical Surfaces with Compliant Microspine Arrays,” The International
Journal of Robotics Research, vol. 25, pp. 1165–1179, 2006.
[225] “Sadtler handbook of infrared spectra.” Sadtler Research Laboratories, as imple-
mented in KnowItAll software 9.0 by Bio-rad Laboratories 2001-2012.
[226] G. Socrates, “Infrared Characteristic Group Frequencies.” Wiley, 1980.
[227] B. Latli, E. Wood, and J. E. Casida, “Insecticidal Quinazoline Derivatives with
(Trfluoromethyl)diazirinyl and Azido Subsituents as NADH:Ubiquinone Oxidore-
ductase Inhibitors and Candidate Photoaffinity Probes,” Chemical Research in Tox-
icology, vol. 9, no. 2, pp. 445–450, 1996.
[228] T. Weber and J. Brunner, “2-(Tributylstannyl)-4- [ 3-(trifluoromethyl)-3h-diazirin-
3-yl] Benzyl Alcohol: A Building Block for Photolabeling and Cross-Linking
Reagents of Very High Specific Radioactivity,” Journal of the American Chemi-
cal Society, vol. 117, no. 11, pp. 3084–3095, 1995.
[229] M. Yamada, K. Harada, Y. Maeda, and T. Hasegawa, “A Versatile Approach to
Functionalisation of [60]Fullerene using 3-Trifluoromethyl-3-phenyldiazirine Deriva-
tives as Photolabelling Reagents,” New Journal of Chemistry, vol. 37, pp. 3762–
3769, 2013.
[230] L. C. Robertson and J. A. Maerritt, “The Electronic Absorption Spectra of n-
Diazirine, N115-Diazirine, d1-Diazirine and d2-Diazirine,” Journal of Molecular
Spectroscopy, vol. 19, pp. 372–388, 1966.
[231] L. C. Robertson and J. A. Maerritt, “The Electronic Absorption Spectra of Bro-
momethyldiazirine and Chloromethyldiazirine,” Journal of Molecular Spectroscopy,
vol. 24, pp. 44–61, 1967.
345

[232] L. C. Robertson and J. A. Maerritt, “Electronic Absorption Spectra of 3-
Methyldiazirine and 3-Methyl-d3-Diazirine,” The Journal of Chemical Physics,
vol. 57, no. 2, pp. 941–947, 1972.
[233] L. C. Robertson and J. A. Maerritt, “Electronic Absorption Spectra of 3,3’-
Dimethyldiazirine,” The Journal of Chemical Physics, vol. 56, no. 6, pp. 2919–2924,
1972.
[234] A. Blencowe, K. Cosstick, and W. Hayes, “Surface Modification of Nylon 6,6 using a
Carbene Insertion Approach,” New Journal of Chemistry, vol. 30, pp. 53–58, 2006.
[235] M. S. Han, H.-G. Cho, and B.-S. Cheong, “Theoretical Studies of the Low-Lying
Electronic States of Diazirine and 3,3’-Dimethyldiazirine,” The Korean Chemical
Society, vol. 20, no. 11, pp. 1281–1287, 1999.
[236] C. D. Bain and G. M. Whitesides, “Formation of Monolayers by the Coadsorption
of Thiols on Gold: Variation in the Length of the Alkyl Chain,” Journal of the
American Chemical Society, vol. 111, no. 18, pp. 7164–7175, 1989.
[237] J. P. Folkers, P. E. Laibinis, and G. M. Whitesides, “Self-Assembled Monolayers of
Alkanethiols on Gold: Comparisons of Monolayers Containing Mixtures of Short-
and Long-chain Constituents with CH3 and CH2OH Terminal Groups,” Langmuir,
vol. 8, pp. 1330–1341, 1992.
[238] Z. G. Hu, P. Prunici, P. Patzner, and P. Hess, “Infrared Spectroscopic Ellipsome-
try of n-Alkylthiol (C5-C18) Self-Assembled Monolayers on Gold,” The Journal of
Physical Chemistry B, vol. 110, pp. 14824–14831, 2006.
[239] L. V. Protsailo and W. R. Fawcett, “Studies of Electron Transfer through
Self-Assembled Monolayers using Impedance Spectroscopy,” Electrochimica Acta,
vol. 45, pp. 3497–3505, 2000.
346

[240] L. Houssiau and P. Bertrand, “ToF-SIMS Study of Alkanethiol Adsorption and
Ordering on Gold,” Applied Surface Science, vol. 175-176, pp. 399–406, 2001.
[241] D. A. Hutt and G. J. L. E. Cooper, “Structure and Mechanism of Photooxidation
of Self-Assembled Monolayers of Alkylthiols on Silver Studied by XPS and Static
SIMS,” The Journal of Physical Chemistry. B, vol. 102, pp. 174–184, 1998.
347
Copyright © 2022 FDOKUMEN