The Development of a Generic Scale to Measure the Social Impacts of Events
23
1 Developing a Generic Scale to Measure Social Impacts of Events: Methodological Issues L. Fredline, L. Jago and M. Deery ABSTRACT Tourism destination managers are increasingly looking at events as an important mechanism for enhancing tourism development in their regions (Jago & Shaw, 1998). Whilst it is clear that events have the potential to generate positive economic impacts, a balanced appraisal of the success of an event needs to consider the total cost/benefit package including social impacts. Unlike economic impacts, social impacts of events can be difficult to measure objectively as many of them cannot be quantified, and they often have a differential effect on different members of the community. For this reason, social impacts are frequently examined through investigation of residents' perceptions of the impacts (Fredline, 2000). Little research, however, has undertaken a systematic evaluation of these social impacts and the aim of this study, which has been funded by the CRC for Sustainable Tourism, is to provide a framework within which to assess these impacts. This paper documents the processes involved in developing a scale to be used in assessing the social impacts of three different events. The development process began with a review of literature to generate items. Items generated through focus groups supplemented this process. The overall aim of the studies is to test and validate an instrument that can be used to compare the social impacts of a variety of events and ultimately to inform knowledge in the area of social impact assessment in tourism more generally. INTRODUCTION In recent decades, substantial work has been conducted examining residents' perceptions of the impacts of tourism and, to a lesser extent, events. Through this work, considerable light has been shed on many of the potential impacts of tourism and also on some of the variables that tend to be associated with positive and negative reactions to tourism activity. However, not all tourism is equal; tourism is a nebulous concept that manifests its impact differently across communities. Therefore, more information is required about the differential effects of alternative types of tourism on local hosts. Within the multitude of case studies that have been undertaken, the impacts of many different forms of tourism have been investigated. However, these investigations have taken place in different contexts, making it difficult to attribute variations in community reaction solely to the variations in tourism activity. Additionally, the multitude of different methods used impedes comparison. Public planners and decision makers encourage tourism because it brings benefits to the community. It is, therefore, logical that they will promote the type of tourism that maximises positive impacts and minimises negative impacts, but they need suitable information about relative costs and benefits in order to make informed decisions. The substantial body of research investigating economic impact assessment of tourism is driven by a desire to identify the “best” type of tourism from an economic perspective, or at least, to make the best of the tourism activity that exists. While a range of economic impact assessment techniques exists,
Transcript of The Development of a Generic Scale to Measure the Social Impacts of Events
1
Developing a Generic Scale to Measure Social Impacts of Events: Methodological Issues
L. Fredline, L. Jago and M. Deery
ABSTRACT
Tourism destination managers are increasingly looking at events as an important mechanism for enhancing
tourism development in their regions (Jago & Shaw, 1998). Whilst it is clear that events have the potential to
generate positive economic impacts, a balanced appraisal of the success of an event needs to consider the total
cost/benefit package including social impacts. Unlike economic impacts, social impacts of events can be
difficult to measure objectively as many of them cannot be quantified, and they often have a differential effect
on different members of the community. For this reason, social impacts are frequently examined through
investigation of residents' perceptions of the impacts (Fredline, 2000). Little research, however, has
undertaken a systematic evaluation of these social impacts and the aim of this study, which has been funded by
the CRC for Sustainable Tourism, is to provide a framework within which to assess these impacts.
This paper documents the processes involved in developing a scale to be used in assessing the social impacts
of three different events. The development process began with a review of literature to generate items. Items
generated through focus groups supplemented this process. The overall aim of the studies is to test and
validate an instrument that can be used to compare the social impacts of a variety of events and ultimately to
inform knowledge in the area of social impact assessment in tourism more generally.
INTRODUCTION
In recent decades, substantial work has been conducted examining residents' perceptions of the impacts of
tourism and, to a lesser extent, events. Through this work, considerable light has been shed on many of the
potential impacts of tourism and also on some of the variables that tend to be associated with positive and
negative reactions to tourism activity. However, not all tourism is equal; tourism is a nebulous concept that
manifests its impact differently across communities. Therefore, more information is required about the
differential effects of alternative types of tourism on local hosts. Within the multitude of case studies that
have been undertaken, the impacts of many different forms of tourism have been investigated. However,
these investigations have taken place in different contexts, making it difficult to attribute variations in
community reaction solely to the variations in tourism activity. Additionally, the multitude of different
methods used impedes comparison.
Public planners and decision makers encourage tourism because it brings benefits to the community. It is,
therefore, logical that they will promote the type of tourism that maximises positive impacts and minimises
negative impacts, but they need suitable information about relative costs and benefits in order to make
informed decisions. The substantial body of research investigating economic impact assessment of tourism
is driven by a desire to identify the “best” type of tourism from an economic perspective, or at least, to make
the best of the tourism activity that exists. While a range of economic impact assessment techniques exists,
2
the need for comparison across cases has led to a call for consistency in approach. A similar consistent
approach needs to be developed to investigate and compare the social impacts of events and other forms of
tourism. The development and refinement of a suitable method will require considerable testing and
validation, but the study reported in this paper aims to undertake some of the preliminary work and lay a
foundation for future advances.
Objectives
This project aimed to develop and test a generic scale to assess the social impacts of special events. To
achieve this aim, the scale was tested in a number of different situations, thus specific objectives include:
1. Examination of how residents in the same community (Melbourne) perceive the impacts of
different types of events;
2. Comparison of the reactions of residents of a small regional community with those of a large
urban community;
Given the length of instruments that have been utilised in this area to date, including the one used in the
study described in this paper, an additional aim is to develop a more parsimonious measure which can be
simply employed to gauge the relative impacts on quality of life of different types of events. If a suitable
compressed scale with appropriate levels of validity and reliability can be developed, this could be employed
in conjunction with economic and environmental impact assessment methods to create a more thorough
basis for comparing the relative costs and benefits of events. Ultimately, it may also be possible to adapt the
scale for use in the assessment of social impacts of other forms of tourism beyond events.
LITERATURE REVIEW
Social Impacts of Tourism
Teo (1994, 126) defines social and cultural impacts of tourism as:
the ways in which tourism is contributing to changes in the value systems, morals and their conduct,
individual behaviour, family relationships, collective lifestyles, creative expressions, traditional
ceremonies and community organization.
The issue of the social impacts of tourism has, more recently, attracted the attention of researchers and
practitioners. The expanding literature on sustainable tourism development and ecotourism is testimony to
this – for example, journals such as The Journal of Sustainable Tourism provide a platform for academic
research and industry interests. There is a growing acceptance of the concept of “social responsibility”, of
responsible tourism and alternative forms of tourism (Pearce, Morrison & Rutledge, 1998). At the same time
there has been increasing community opposition to tourism developments that harm both the social and
natural environment.

3
The social impacts of tourism provide a good example of “a double-edged sword”. Marcouiller (1997), in
his study of tourism development in US rural communities, argues that the injection of tourists into a rural
community can divide a previously homogenous community because the influx changes the dynamics of the
community. Glasson’s (1994) study of the UK heritage city, Oxford, found that, although the overall effect
of tourism on the city was positive, many of the local respondents stated that tourism increased
overcrowding, noise, litter and crime. The costs of tourism have been documented under a number of
themes. For example, King and Stewart (1996), among others, discuss the negative effects associated with
the commodification of a destination’s culture and the negative impact of tourist activities such as sex-
tourism. Doxey’s (1975) Irridex Model has been tested in a number of tourism environments to determine
the level of resident irritation generated by tourism. Teo (1994), in using Doxey’s instrument, for example,
found a reasonably high level of intolerance for tourists in Singapore and that residents associated tourism
with higher levels of crime. Other negative social impacts such as the impact of the cultural and behavioural
differences between tourists and residents and, the often, high inequality between the wealth of tourists and
residents, are well documented (Weaver & Opperman, 2000).
On the other hand, Marcouiller (1997, 351) argues that:
Other important sociological effects of tourism development on rural communities include
developing a local sense of place, community pride or image, and local quality of life.
This sense of community pride, wellbeing and stability is an indicator of the social capital of a community.
Onyx and Leonard (2000) argue that there is a growing recognition of the importance of social capital in
maintaining a healthy and vibrant civil society. Tourism is often perceived as increasing the economic and,
therefore, the social wellbeing of communities. Tourism also provides an incentive to preserve culture and
heritage, although this does not necessarily add to the social capital of the community. Teo’s (1994) study of
Singapore found that the conservation projects of the city had preserved the cultural heritage, but,
unfortunately, local residents did not identify with the environment created by these projects and moved out.
So the “double-edged sword” of tourism can both preserve cultural aspects, but can also disperse the
community in the process.
Definition of Events
Within the tourism field, the term ‘event’ is used to describe a wide range of event categories, many of
which have quite different characteristics. Such events range from the Olympic Games at the mega-event
end of the scale to small regional festivals. Even within these sub-groupings, there is substantial debate as to
the definitions that should be adopted (see, for example, Getz 1991; Jago & Shaw 1998; Arcodia & Robb
2000). The definition that has been adopted here is that proposed by Jago and Shaw (1998, 29), namely, “a
onetime or infrequently occurring event of limited duration that provides the consumer with a leisure and
social opportunity beyond everyday experience”. This definition is taken as embracing the other
subcategories of events, including community festivals and mega-events.
4
Social Impacts of Festivals and Events
Although there has been a strong focus on economic impacts, there are other types of impacts of events and
festivals particularly those of social impacts. These impacts can include reinvigorating existing facilities and
creating an image for the tourist destination, as well as promoting tourism sustainability (Getz, 1991). While
there is a reasonable amount of literature on the social impacts of tourism, particularly through the
sustainable tourism literature, less research has concentrated on the social impacts of events and festivals.
Issues such as safety, trust and “a sense of personal and collective efficacy” (Onyx & Bullen, 2000) form
part of the social capital concept and would appear to have relevance in an investigation of the social
impacts of events and community festivals. Delamere’s (1997) social impacts instrument for community
festivals investigates a number of key elements pertinent to this study. These embrace the concepts of the
impact of the festival on the friendliness, safety, tolerance and creativity of the community. Delamere
concentrates his questionnaire on the social costs and the social benefits of community festivals.
Another relevant concept to be incorporated into the current study, is that of the “triple bottom line”. While
this concept has been largely driven by government agencies, it has received some attention in academic
research. Rogers and Ryan (2001) in their discussion of the “triple bottom line” concept, argue that there are
nine basic, universal, human needs that require satisfaction if a healthy community is to be achieved. These
include the need for sustenance, protection, affection, idleness, creativity, freedom, understanding,
participation and identity. How well these needs can be evaluated through events is discussed in the
following section.
For the purposes of this paper, social impacts are defined as any impacts which potentially influence the
quality of life for local residents. Thus economic outcomes of events (such as employment opportunities)
and environmental affects (such as litter) are included in the study because perceptions of such impacts are
likely to contribute to residents’ overall reactions to the event. This is consitent with most of the previous
work in this area.
Ritchie (1984), and later Hall (1989, 1992) suggested a classification of potential event impacts comprising
six dimensions; economic, tourism/commercial, physical, socio-cultural, psychological, and political. Some
examples of positive and negative manifestations of these impacts are shown in Table 1 with references as
applicable to other examples in the literature.
Table 1 about here
Extrinsic vs Intrinsic studies
5
As mentioned in the introduction, there has been a growing awareness of the need for assessing all of the
potential impacts of tourism activity, and this has led to a recent proliferation of research into social impacts
of tourism on the host community. Generally speaking, two types of social impact studies have been
conducted.
The first type, sometimes referred to as stage-based models (Pearce, Moscardo & Ross,1996), or "extrinsic"
studies (Faulkner & Tideswell,1997), investigate the impact of tourism on the community as a whole and,
therefore, assume a level of homogeneity among the residents of a region. These models consider the effects
of variables such as the stage of tourism development in a community, the tourist / resident ratio, the cultural
distance between hosts and guests, and the seasonality of the tourist activity. A good example is Doxey's
Irridex Model (1975) that suggests that residents' responses to tourism will pass through a series of stages
(euphoria, apathy, irritation, and antagonism) as continued exposure to negative impacts is reflected by
increasing annoyance. These models tend to be overly simplistic, ignoring the diversity of communities and
the undeniable potential for tourism to impact various subgroups in different ways. However, their value lies
in the contribution they have made in highlighting the fact that negative social impacts will lead to resident
dissatisfaction unless appropriately managed.
The second type of research, described as "intrinsic" (Faulkner & Tideswell, 1997), does consider the
heterogeneity of communities by measuring social impacts through the perception of members of the host
community and then investigating differences in perception held by different subsectors of the community.
These studies acknowledge that subgroups may be affected by tourism differentially, and also that differing
value systems may be responsible for variations in perceptions. The intrinsic dimension in an important one,
and will be investigated in this study; however the aim of this paper is to explore convergence in resident
reaction to different events thus assessing the potential for development of a compressed generic scale for
use in extrinsic comparison by event planners and managers. Further discussion of the intrinsic dimension is
therefore beyond the scope of this article.
METHODOLOGICAL CONSIDERATIONS
Rationale for resident perception approach
The resident perceptions approach to measuring tourism impacts is clearly subjective and, therefore, gives
no verifiable indication of the quantification of costs and benefits accruing to the community under
investigation. Therefore, the objective measurement of impacts, where possible, remains an important
research ambition. Objective measurement, however, is not possible for some types of impacts and provides
no indication of the effects on the quality of life of local residents. Thus, the resident perceptions approach
provides useful additional data for understanding the costs and benefits of event tourism.
Previous work in impact scale development

6
Little previous work has been undertaken in the development of a scale to measure the social impacts of
events. The one comprehensive attempt known to the authors is work by Delamere (undertaken with
colleagues) in Canada (Delamere, 1997, 2001; Delamere, Wankel & Hinch, 2001). However, this research
concentrated on the impacts of small community festivals rather than larger scale events. Thus, the emphasis
in the 47 item scale was on the potential of a festival to develop social capital type benefits and on costs
associated with the disruption and burden on the community. No items in the scale related to short or long
term economic and business development benefits which are some of the principal motivations for hosting
larger scale events.
In the broader context of general tourism, there have been a number of studies aimed at developing a tourism
impact scale, most notably Lankford and Howard (1994) and Ap and Crompton (1998), the latter paper
containing a thorough review of this literature. Much of this work has utilised multi item Likert type scales
which present respondents with a series of biased impact statements which are worded in either a positive or
a negative way. Typically a roughly even number of positive and negative items are presented in an effort to
claim that the scale is balanced. However, Ap and Crompton, suggest that this approach encourages
response set, and ultimately the delineation of impacts into two major groupings; benefits and costs. They
also identify other issues of concern with the Likert scale approach such as its inability to discern the level of
change in an impact from the level of concern about the change. For these reasons their study utilised a two-
part scale firstly measuring level of change followed by a measure of like or dislike of the change.
The dimensions identified in Ap and Crompton’s (1998) study were somewhat consistent with the
taxonomical framework of event impacts proposed by Ritchie (1984) as shown in Table 1. Using Principal
Components Analysis, they identified seven factors which they labelled as social and cultural, economic,
crowding and congestion, environmental, services, taxes and community attitudes.
CASE STUDIES
A case study approach was used to implement and test the research instrument. The events included were
representative of medium to large scale events located in both metropolitan and regional areas within the
state of Victoria, Australia. The intention was to include a variety of themes namely sporting, cultural and
community based events. Two of the events were hosted in Melbourne, the capital city of Victoria, which is
a large city by Australian standards with the conurbation around Melbourne comprising a population in
excess of three million residents. The third event took place in Horsham, a town in rural Victoria
(approximately 250 kilometers from the outskirts of Melbourne) with a population of about 6000. The three
cases included in this study were:
• The Australian Formula One Grand Prix 2002 in Melbourne
• The 2002 Melbourne Moomba Festival

7
• The Horsham Art Is….. Festival 2002
In using case studies as the preferred methodology, the project recognised the need to gain an in-depth
understanding of community perceptions of specific types of events. However, the inclusion of a range of
cases studies investigated using similar methods, enabled a degree of generalisability to the extent that
consistencies or rational differences were observed.
METHODOLOGY
Definition of Population and Selection of Sampling Frame
The population of interest in each of the case studies was defined as the permanent local population of the
urban areas in which the events take place. However, finding a sampling frame that accurately represents
this population is difficult. The two obvious choices are the telephone directory and electoral rolls, but each
of these has their disadvantages. The principal disadvantage with telephone directories is that, because the
unit of analysis is individuals, and households vary in size, the chances of inclusion in the sample are not the
same for all members of the population. Also, where the same telephone number represents more than one
member of the population, an additional sampling stage is required to select which of those members should
be included. This problem does not exist with electoral rolls, as they contain names and addresses of
individuals. In Australia, enrolling to vote is compulsory for those who are citizens, therefore, in theory, this
frame should include all residents who fit into this category. However, permanent residents who have not
taken citizenship are not included, and Australians who have not complied with this law will not be
represented either. Additionally, as the rolls are only updated as required for electoral purposes, they may be
somewhat out of date, depending on the timing of the survey.. It is likely, therefore, that the use of this frame
will underrepresent recent migrants from other countries, as well as those who have recently moved within
Australia. Also, there is evidence to suggest that young people are not well represented on the electoral rolls.
A third option, and the one chosen for this study, is the use of a proprietary list such as the National
Consumer File maintained by Prime Prospects List Marketing. This list is based on the electoral roll but is
supplemented with information from the census in an effort to overcome the representation issues associated
with the rolls. This list is also updated on a more frequent basis.
An arbitrary decision was made to include only residents with a 15 km radius of the centre of the event
precinct. This was because of the localised nature of many event impacts such as noise and traffic
congestion.
Sampling methods

8
Given the decision to use the National Consumer File to provide the sampling frame, a variety of
stratification options were possible. Previous work in this area has employed disproportionate stratified
sampling based on geographical strata, with the aim of over-representing those living closest to the events in
an effort to illuminate the importance of proximity (Fredline & Faulkner, 2002a, 2002b). However, there is
already substantial evidence of the relationship between proximity and impacts, and, therefore, in the
proposed study this over-representation was not required. In the case of the two Melbourne based events,
simple random sampling within the defined population was employed. In the Horsham case study, a slightly
different approach was adopted because of the small population size. An entire population listing for the area
was obtained (6000 residents) and residents were systematically selected using a sampling fraction of one in
five.
Administration method
The instrument was administered via a postal survey. Although this method is not without its shortcomings,
given resource limitations, it is often the most effective method for collecting data adequate for analysis. The
most serious problems associated with postal surveys are low response rates, self-completion errors and
missing data. Previous studies in this area would suggest that response rates in the order of 30% are possible
in this type of research (Fredline, 2000). However, any non-response is an issue of concern. Although it is
difficult to investigate, it seems logical to suggest that non-response to a survey investigating perceptions of
the impacts of events on quality of life would be associated with a lack of concern. In keeping with social
representation theory as outlined in the literature review, the analytical techniques employed in this study
aimed to identify groups of residents with different social representations of the events rather than to
calculate an overall effect on the population. Therefore, although the non-response bias may have led to a
distortion in the relative sizes of the different groups identified, the basic knowledge of ‘who’ and ‘why’
should still be accurate.
The second major problem associated with a postal survey is erroneous or missing data. The most effective
tactics for minimising this problem include employing good instrument design principles and pilot testing,
and these strategies were utilised this study.
Instrument Design
The instrument was designed utilising statements from previous event and tourism literature with the
inclusion of additional items from the social capital literature. The basic format of the questionnaire is
outlined in Table 2 below. Three slightly different versions of the instrument were developed for the three
different events, the only differences being variation as necessary to allow for differences in the types of
event and locations.
Table 2 about here
9
Following the methods of Fredline (2000) the main dependant variables, residents’ perceptions of the
impacts of events, were measured using a three part scale as shown in Table 3. The scale includes 45 impact
statements (42 of which are common to all instruments), and residents were first asked to assess whether
they believe the item had changed because of the event and to identify the direction of the change. If
residents did perceive a change, they were subsequently asked to assess the affect on their personal quality
of life, and also the affect on the community as a whole. These latter two assessments were measured on a
seven point Likert type scale ranging from -3 (very negative impact) to +3 (very positive impact).
Table 3 about here
Sections C - H included the questions measuring the independent variables and demographic information.
These variables were included to examine variations in perceptions within communities; however, this part
of the study is not reported in this paper.
Given that the instrument used in this study drew very heavily upon an instrument used successfully in
previous research (Fredline, 2000; Fredline, 2002a), it was considered that there was no need to employ an
extensive pre/pilot testing phase. However, prior to the data collection phase, the instrument was tested with
an appropriate group for comprehension and ease of completion.
The final instrument, which would be considered long by any standards, included approximately 80
questions and spread over 12 pages. Pilot testing indicated that it would take between 15 and 30 minutes to
fully complete. In an effort to boost response, an incentive was offered in the form of a $500 lottery for full
completion by the specified date. However, given the length and complexity of the instrument, a low
response rate was anticipated.
As previously mentioned, non-response creates concerns about representativeness and bias. Nevertheless,
such a large instrument was considered necessary to fully consider all of the potential impacts of the events
and to assess the differences and similarities across events. At this stage of scale development therefore, it
was decided that, in the trade-off between parsimony and thoroughness, thoroughness should be prioritised.
In subsequent stages, once a suitable level of understanding has been reached about the underlying
dimensions of event impacts as perceived by the host community, this lengthy scale will be replaced a
compressed scale which is easier to administer and promotes higher rates of response.
RESPONSE
Given the anticipation of low response, large numbers of survey packages were dispatched for each event,
with the ambition of achieving datasets in the order of 200-300 responses for each event. For each the two

10
Melbourne based events 2400 questionnaires were distributed, while in Horsham, 1400 packages were sent
out. The usable returns for the Grand Prix, the Moomba Festival, and the Horsham Art Is…Festival were
279, 181 and 96 respectively, representing effective response rates of 12.96%, 8.23%, and 8.26%.
Where possible, the demographic characteristics of the sample were compared to known population
parameters from the 2001Census. Not all variables could be compared because only initial releases of
Census data were available at the time. As can be seen in Table 4, young people are substantially
underrepresented in the sample, as are non-Australian born residents. This is to be expected as was referred
to at the beginning of the method section. Other demographic groups appear to be adequately represented.
Table 4 about here
However, demographic representativeness does not necessarily imply adequate representation in terms of
variation in perceptions of event impacts. Based on previous research it would be expected that at least three
different subgroups would exist within the community; those who have largely negative perceptions of the
impacts of the event(s) on their personal quality of life, those who are predominantly positively disposed,
and those who are largely unconcerned, perceiving little or no impacts of the event(s). Given the high non-
response, it would seem likely that the latter group would be underrepresented, as their motivation to
participate in the survey would probably be lower than those whose feelings were more intense. Previous
research has also tended to indicate that the unconcerned sector of the community is the largest.
This likely lack of proportional representation at this stage of scale development is not of major concern.
The main aim is to ensure that the range of perceptions is covered, and indeed, adequate proportional
representation would be likely to yield very low sample sizes at the extreme ends of the spectrum, hindering
statistical comparison.
The preliminary results presented below should therefore not be considered as absolute indicators of the
impacts of events on the quality of life of Melbourne and Horsham residents. However, given that the same
methods have been used in each case study, it can be assumed that any biases are fairly consistent across the
data sets. Thus the results can be used as an indicator of issues of relative importance and as a mechanism
for comparison across events, communities, and community sub-groups.
RESULTS
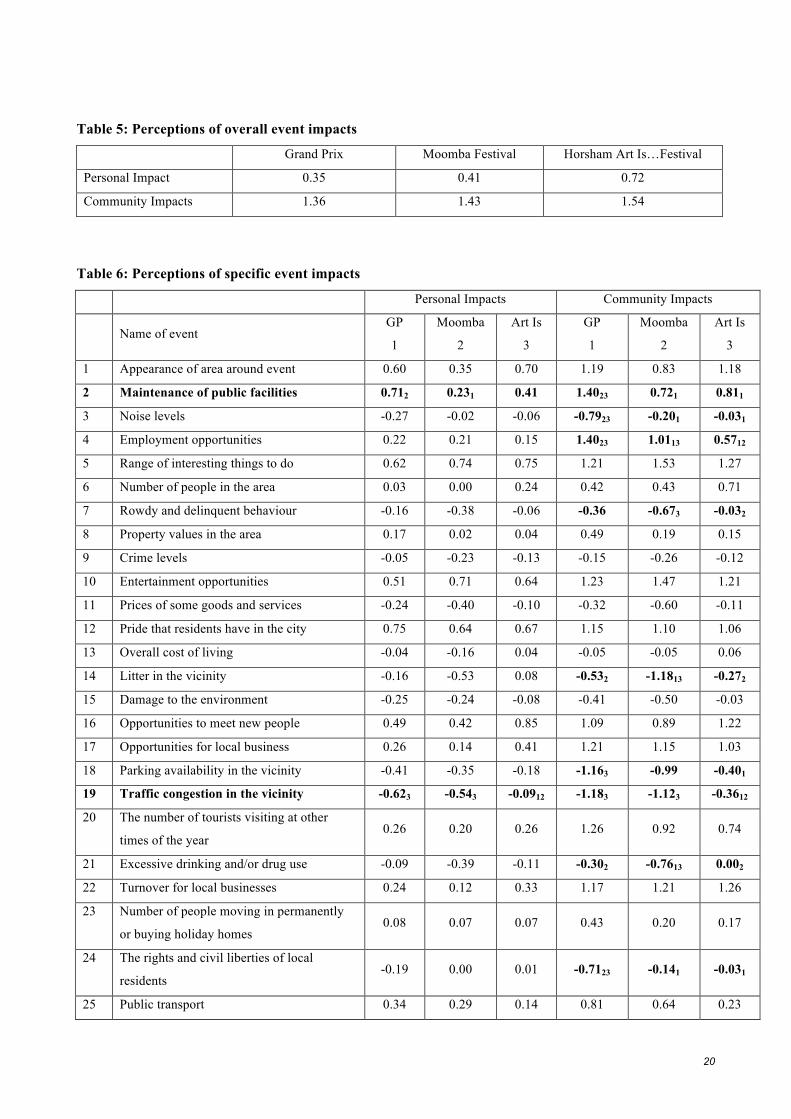
In terms of overall perception of the impacts, similar patterns were observed across the three events as
shown in Table 5. Respondents were asked to rate the overall impact on their personal quality of life and
also about the overall impact on the community as a whole on a scale ranging from very negative (-3) to

11
very positive (+3). A consistent pattern is observed with residents tending to rate the overall impact on the
community as being more positive than the personal impacts.
Table 5 about here
With regard to specific impacts, a substantial amount of commonality was observed across the three events
as shown in Table 6. Again it can be seen than positive impacts tend to be rated more positively at the
community level than at the personal level, but negative impacts are rated more negatively. Clearly there
tends to be a stronger perception of impact on the community as a whole. The differences between events
were compared using Oneway ANOVA. Given the large number of comparisons being made, a conservative
alpha level was used (α=0.001) to maintain an acceptable family wise Type I error rate. The comparisons
shown in bold indicate significant differences and the subscripts denote where the differences lie based on
post hoc comparisons using Tukey’s test.
Table 6 about here
Looking at community level perception of impacts, which are of greater relevance in this context, some of
the major differences observed are summarised below. Understandably, noise associated with the Grand Prix
is perceived more negatively, but this event is also seen as creating more substantial employment benefits.
This is logical as the Grand Prix is a much larger event with a far greater international focus than the other
two events studied. The Moomba festival appears to be associated with higher levels of littering and
excessive drinking/drug use. This may be because it is a large free community festival staged by the City of
Melbourne which does not have the same resources as to control these negative externalities as a profit
oriented event such as the Grand Prix. The Art Is…Festival in Horsham is perceived as creating fewer traffic
and parking problems but also fewer employment opportunities.
These preliminary results suggest that similar impacts are associated with quite different types of event,
although to varying extents, which supports the appropriateness of the use of a generic instrument. In an
effort to refine and reduce the scale, a series of three steps was used to identify and eliminate redundant
items and summarise the remaining items into a smaller number of dimensions which could be used as the
basis for a compressed scale. The data used in this analysis were the perceptions of impacts at a community
level. This was considered appropriate for two reasons. Firstly, as observed above, a stronger response was
observed at the community level than at the personal level. Secondly, the aim is to develop an indicator of
the social impacts of events that can be used by public and private sector events organisations to compare
impacts across different types of events and communities. While it is interesting from both an academic and
a management perspective, to understand variation in impacts within a community, and this has been (and
12
will continue to be) investigated in other papers, the aggregated community level impact is of primary
interest here.
The first step involved the identification of impacts which were not perceived to have a substantial affect on
quality of life in any of these events. This was achieved through a series of one sample t-tests which
compared the mean impact ratings with the neutral mid point of the scale. Four items failed to differ
significantly from zero (no impact) for any event at either the personal or the community level. These impact
statements relating to crime levels, overall cost of living, social and moral values, and the event bringing too
many people into the community, were, therefore, eliminated at this stage. The next step involved inspection
of the bivariate correlation matrix of all remaining items, the aim of this process being to identify and
remove any statements which failed to correlate with others. However all statements correlated significantly
and substantially (r>0.3) with at least 2 other items, therefore no statements were deleted at this stage.
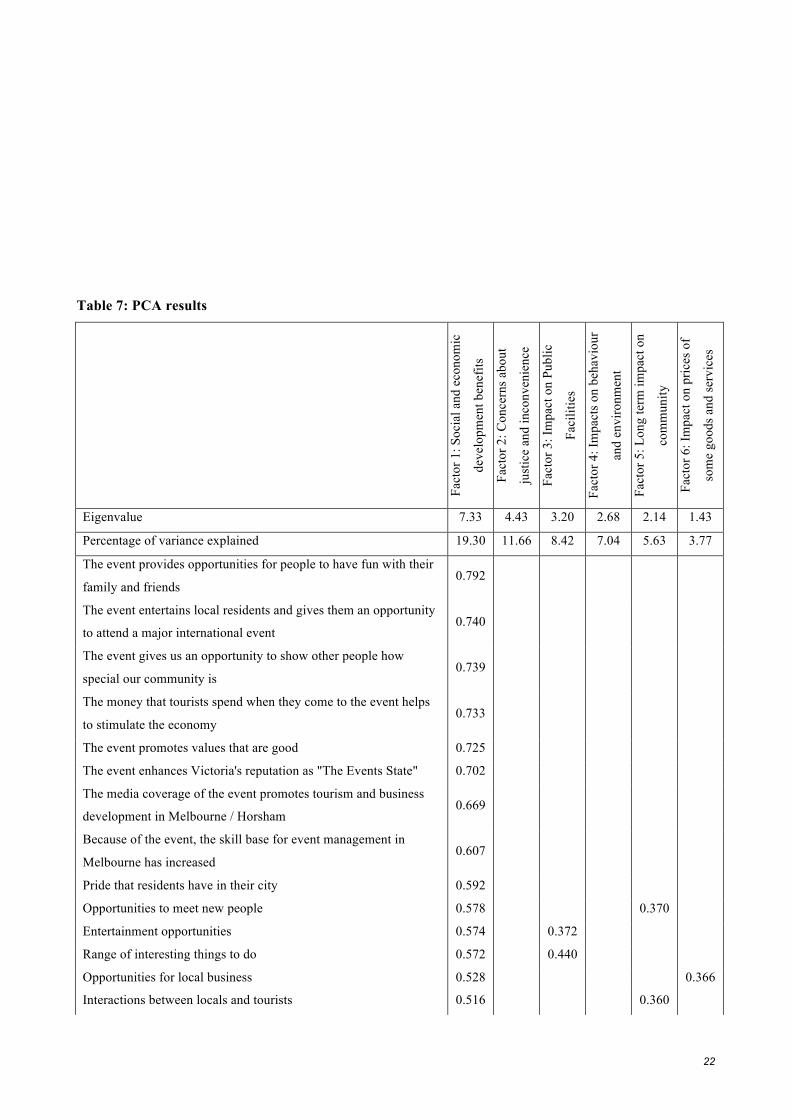
The remaining 39 items were then factor analysed using Principal Components Analysis. Preliminary
diagnostics indicated that the data set was suitable (KMO measure of sampling adequacy = 0.936, Bartlett’s
test of sphericity p<0.000). The analysis identified 6 factors explaining 55.8% of variance. A varimax
rotation was performed to aid in the interpretation of factors. Factor loadings greater than 0.35 are reported
in Table 7. Some complexity is observed as can be seen in the Table; however the solution provides a solid
basis for the development of a compressed scale. Some commonality can be observed with the conceptual
classification proposed by Ritchie (1984) and with Ap and Crompton’s (1998) Tourism Impact Scale
although the distinct characteristics of event tourism substantially limit the potential for comparison.
Table 7 about here
The first factor, which accounts for 19.3% of variance, can be interpreted as representing the social and
economic development impacts of the events. These are all benefits which are perceived quite strongly
across the sample. Although statistically, the response to all of these items is similar, with moderate to high
correlations amongst all of these pairs of variables, there appears to be at least four sets of impacts within
this group that are conceptually different. A number of the items relate to entertainment benefits, while
another set highlights the social opportunities associated with events (in terms of known and new group
association). There are also several items which deal with skill and economic development, and there are
some which relate to pride and community esteem. Despite the evidence that suggests that these impacts are
perceived in a similar way across these three events it would still seem appropriate, that in a compressed
instrument, they be represented by separate items, as the creation of an item attempting to represent all of
these impacts would have to be either vague or cumbersome.
13
The second factor, which accounts for 11.7% of variance, deals with concerns about injustice and
inconvenience (particularly negative externalities such as traffic and noise). These fit well together, as they
are the major concerns associated with these events, but for the purposes of the scale they could be separated
into two items. The third factor deals with the impact of events on facilities. These impacts were generally
felt to be quite positive although the depth of feeling was not as strong as those benefits which loaded on
Factor 1. This may explain why employment loaded here rather than on the first factor (although there is a
cross loading of 0.374). For the purposes of the compressed scale, it would seem appropriate to have
employment impacts as an individual item.
The fourth factor again seems to cover two interrelated but conceptually distinct dimensions, bad behaviour
and environmental impacts, while Factor 5 seems to represent longer term impacts which occur beyond the
time at which the event is staged. Factor 6 appears to cover the impact on the price of selected goods and
services; however, it must be noted that the sample as a whole did not believe that any events had a
substantial impact of overall cost of living, and therefore care will need to be taken to ensure that this item
does not imply a more general inflationary effect.
CONCLUSION
Aligned with the increasing prominence given to events during the 1990s there has been an increased
interest in assessing their impacts, although the vast majority of impact studies have focused entirely on
economic issues. This can be attributed largely to the fact that government agencies supporting events were
focussed on the economic benefits that flowed from attracting visitors to a host region to attend an event.
There is now a greater recognition of the fact that specific events have a low likelihood of lasting more than
a couple of years if they are not aligned to the social and environmental values of the local community. This
move is related to the public sector’s increased interest in the “triple bottom line”, as opposed to simply an
economic perspective.
Although many events attract a sizable number of tourists to the host region to attend the event, the
overwhelming number of attendees at most events are members of the local community. Therefore, it is
crucial that events are consistent with the needs of the local community. Understanding the social impact of
events on residents and being able to measure or monitor such impacts is vital to event viability. Advances
in knowledge in this area will enable event organisers to develop or modify events to ensure that they are
better aligned to the needs of the host community and at the same time enhance greatly the likely
profitability for the event organiser.
Based on this Principal Components Analysis, there would appear to be substantial potential for developing
a compressed scale with approximately 12 items. Clearly substantial effort will need to be expended on pre
14
and pilot testing such a scale to ensure construct and content validity. Work will continue in this regard and
findings will be reported in the future.
References
Ap, J. and Crompton, J.L. (1998) Developing and Testing a Tourism Impact Scale. Journal of Travel
Research, 37(2), 120-130.
Arcodia, C. and Robb, A. (2000). A Future for Event Management: A Taxonomy of Event Management
Terms in J. Allen, R. Harris, L. Jago and A. Veal (eds), Events Beyond 2000: Setting the Agenda, Australian
Centre for Event Management, Sydney, 154-160.
Burns, J. P. A., & Mules, T. J. (1986). A Framework for the Analysis of Major Special Events, in J. P. A.
Burns, J. H. Hatch, & T. J. Mules (editors) The Adelaide Grand Prix: The Impact of a Special Event (pp. 5-
38). Adelaide: The Centre for South Australian Economic Studies.
Delamere, T. A. (1997). Development of scale items to measure the social impact of community festivals,
Journal of Applied Recreation Research 22 (4): 293 - 315.
Delamere, T. A. (2001). Development of a Scale to Measure Residents Attitudes Toward the Social Impacts
of Community Festivals, Part 2: Verification of the Scale. Event Management, 7(1), 25-38.
15
Delamere, T. A., Wankel, L. M., & Hinch, T. D. (2001). Development of a Scale to Measure Residents
Attitudes Toward the Social Impacts of Community Festivals, Part 1: Item Generation and Purification of
the Measure. Event Management, 7(1), 11-24.
Doxey, G. V. (1975). A Causation Theory of Visitor Resident Irritants: Methodology and Research
Inferences. Travel and Tourism Research Association Sixth Annual Conference Proceedings (pp. 195-198).
Faulkner, B., & Tideswell, C. (1997). A Framework for Monitoring Community Impacts of Tourism.
Journal of Sustainable Tourism, 5(1), 3-28.
Fischer, A., Hatch, J., & Paix, B. (1986). Road Accidents and the Grand Prix, in J. P. A. Burns, J. H. Hatch,
& T. J. Mules (editors) The Adelaide Grand Prix: The Impact of a Special Event (pp. 151-168). Adelaide:
The Centre for South Australian Economic Studies.
Fredline, E. (2000) Host Community Reactions to Major Sporting Events: The Gold Coast Indy and the
Australian Formula One Grand Prix in Melbourne, Unpublished Doctoral Thesis, Griffith University, Gold
Coast.
Fredline, E., & Faulkner, B. (2002). Residents' Reactions to the Staging of Major Motorsport Events Within
Their Communities: A Cluster Analysis. Event Management, 7(2), 103-114.
Fredline, E., & Faulkner, B. (2002). Variations in Residents' Reactions to Major Motorsport Events: Why
Residents Percieve the Impacts of Event Differently. Event Management, 7(2), 115-126.
Getz, D. (1991). Festivals, Special Events, and Tourism, Van Nostrand Reinhold, New York.
Glasson, J. (1994). Oxford: a heritage city under pressure. Visitors, impacts and management responses.
Tourism Management, 15 (2): 137-144.
Hall, C. M. (1989). Hallmark Events and the Planning Process, in G. J. Syme, B. J. Shaw, D. M. Fenton, &
W. S. Mueller (editors), The Planning and Evaluation of Hallmark Events (pp. 20-42). Aldershot: Avebury.
Hall, C. M. (1992). Hallmark Tourist Events: Impacts, Management and Planning. London: Bethaven Press.
Hall, C. M. (1995). Urban Redevelopment Policy and Imaging Strategies: The Sydney 2000 Olympics and
the Melbourne Formula One Grand Prix. Public Policy Network Conference.
Hiller, H. (1989). Impact and Image: The Convergence of Urban Factors in Preparing for the 1988 Calgary
Winter Olympics, in G. J. Syme, B. J. Shaw, D. M. Fenton, & W. S. Mueller (editors), The Planning and
16
Evaluation of Hallmark Events (pp. 119-131). Aldershot: Avebury.
Jago, L. and Shaw, R. (1998). Special Events: A Conceptual and Definitional Framework, Festival
Management and Event Tourism, 5 (1/2), 21-32.
King, D. and Stewart, W. (1996). Ecotourism and Commodification: Protecting People and Places,
Biodiversity and Conservation, 5: 293-305.
Krippendorf, J. (1987). The Holiday Makers. London: Heinemann.
Lankford, S. V., & Howard, D. R. (1994). Developing a Tourism Impact Attitude Scale. Annals of Tourism
Research, 21(1), 121-139.
McCool, S. F., & Martin, S. R. (1994). Community Attachment and Attitudes Toward Tourism
Development. Journal of Travel Research, 32(3), 29-34.
Marcouiller, D. (1997). Toward integrative tourism planning in rural America, Journal of Planning
Literature, 11 (3), 337-358.
Onyx, J. and Bullen, P. (2000). Measuring social capital in five communities, Journal of Applied
Behavioural Science, 36 (23): 23-42.
Onyx, J. and Leonard, R. (2000). Women, volunteering and social capital, in J. Warburton and M.
Oppenheimer, (ed), Volunteers and Volunteering, Sydney: The Federation Press, pp. 113-124.
Pearce, P., Morrison, A. and Rutledge, J. (1998). Tourism: Bridges Across Continents, McGraw-Hill,
Sydney.
Pearce, P. L., Moscardo, G., & Ross, G. F. (1996). Tourism Community Relationships. Oxford: Pergamon.
Ritchie, J. (1984). Assessing the Impact of Hallmark Events: Conceptual and Research Issues. Journal of
Travel Research, 22(1), 2-11.
Ritchie, J. R. B., & Beliveau, D. (1974). Hallmark Events: An Evaluation of a Strategic Response to
Seasonality in the Travel Market. Journal of Travel Research, 14(2), 14-20.
Rogers, M. and Ryan, R. (2001). The triple bottom line for sustainable community development. Local
Environment, 6 (3),279-289

17
Teo, P. (1994). Assessing socio-cultural impacts: the case of Singapore, Tourism Management, 15 (2): 126-
136.
Weaver, D. and Oppermann, M. (2000). Tourism Management, John Wiley & Sons, Brisbane.
Table 1: A taxonomy of potential event impacts
Positive Negative
Economic Small community festivals may generate internal
surpluses
It is unusual for large events to recoup their
enormous capital and operating expenditures -
many require extensive public funding
Visitor expenditure and associated multiplier
effects - increased demand for goods and services
Increased prices for locals
Creation of direct and indirect employment Opportunity Costs
Tourism/
Commercial
‘Showcase effect’ (Hiller, 1989) - magnification
of the region’s profile which may have
implications for increasing tourism and other
business activities
Acquisition of a poor reputation if the event is
unsuccessful
Extension of tourist season - smooth out cyclical
demand (Ritchie & Beliveau, 1974)
Physical Construction of new facilities and infrastructure -
the extent of this benefit depends on the long term
usefulness of these facilities to the community
Dislocation of lower socioeconomic groups during
the creation of new “desirable middle class
environments” (Hall, 1995)
Regeneration and beautification of run down areas Architectural pollution
Environmental damage
Overcrowding, traffic congestion, noise, litter, and
access restrictions
Socio-Cultural Entertainment and social opportunities for local
residents
Dissatisfaction especially where the theme of the
event does not fit the socio-cultural milieu of the
community
Increase in the level of local interest in the activity
associated with the event (Ritchie, 1984)
Commodification and commercialisation of
traditional local events

18
Opportunity for intercultural contact Potential for intercultural misunderstanding
Volunteerism - improved local social support
networks
May contribute to general social problems such as
crime, prostitution and changing moral values
Crowding can exacerbate rowdy behaviour,
drinking, drug use and violence (Getz, 1991; Hall,
1992) ‘Hoon effect’ (Fischer, Hatch & Paix, 1986)
Psychological Bring a sense of belonging and sharing to the
community (Getz, 1991)
Rapid development may bring disruptions which
may lead to feelings of alienation, and the loss of a
sense of belonging or attachment to the
community (McCool & Martin, 1994)
Excitement, spectacle, pride and self esteem
brought about by being the focus of international
attention (Burns & Mules, 1986)
Political Enhance certain images and ideologies (Hall,
1992) - may be either positive or negative
depending on the extent to which residents concur
with these
Where conflicting interests exist it is likely that
the interests of the politically powerful will win
out over the interests of the politically weak
Career enhancement of specific political figures
(Hall,1992)
Loss of local autonomy (Krippendorf, 1987)
Formation of protest groups - “rebellion of the
hosts” (Krippendorf, 1987)
Source: Adapted from Ritchie, 1984 and Hall, 1989 &1992
Table 2: Format of Instrument
Section A Overall Impacts of the event including opportunities for open ended comment
Section B Three-part scale measuring specific impacts of the event
Sections C- H Measurement of Independent Variables
1. Contact
2. Participation
3. Identification with theme
4. Community attachment
5. Socio-political values
6. Demographics

19
Table 3: Example of Section B Questions
1a. Because of the
event, noise levels
in and around the
Grand Prix have….
Decreased → 1b. How has this affected your
personal quality of life? -3 –2 –1 0 +1 +2 +3
Increased→
No changeê go to 2a 1c How has this affected the
community as a whole? -3 –2 –1 0 +1 +2 +3
Don’t know ê go to 2a
Table 4: Response for All Events
Frequency Percent
Population
Proportion χ2
Gender Female 263 48.8 51.05
Male 276 51.2 48.95 0.2 (3.841)
Age 18-29 years 31 6.0 23.48
(Mean = 50.9 years) 30-39 years 99 19.0 21.23
40-49 years 135 26.0 19.17
50-59 years 114 21.9 15.04
60-69 years 73 14.0 9.58
70-79 years 55 10.6 7.46
80 years and over 13 2.5 4.03 22.8 (12.592)
Highest education level
completed
No formal qualifications 34 6.4
Completed year 10 at school 60 11.2
Completed year 12 88 16.4
Trade Qualification 55 10.3
Technical College/TAFE
Diploma 66 12.3
Undergraduate Degree 91 17.0
Post Graduate Degree 122 22.8
Employment status Employed 303 60.4
Unemployed 21 4.2
Retired 109 21.7
Student 11 2.2
Student/part-time work 16 3.2
Home duties 42 8.4
Where were you born? Melbourne 259 47.7 Total born in
Australia
65.75
Elsewhere in Victoria 116 21.4
Elsewhere in Australia 61 11.2
In another country 107 19.7 34.25 9.4 (3.841)
*The calculated value of χ2 appears first, with the appropriate critical value enclosed in parentheses.
20
Table 5: Perceptions of overall event impacts
Grand Prix Moomba Festival Horsham Art Is…Festival
Personal Impact 0.35 0.41 0.72
Community Impacts 1.36 1.43 1.54
Table 6: Perceptions of specific event impacts
Personal Impacts Community Impacts
Name of event
GP
1
Moomba
2
Art Is
3
GP
1
Moomba
2
Art Is
3
1 Appearance of area around event 0.60 0.35 0.70 1.19 0.83 1.18
2 Maintenance of public facilities 0.712 0.231 0.41 1.4023 0.721 0.811
3 Noise levels -0.27 -0.02 -0.06 -0.7923 -0.201 -0.031
4 Employment opportunities 0.22 0.21 0.15 1.4023 1.0113 0.5712
5 Range of interesting things to do 0.62 0.74 0.75 1.21 1.53 1.27
6 Number of people in the area 0.03 0.00 0.24 0.42 0.43 0.71
7 Rowdy and delinquent behaviour -0.16 -0.38 -0.06 -0.36 -0.673 -0.032
8 Property values in the area 0.17 0.02 0.04 0.49 0.19 0.15
9 Crime levels -0.05 -0.23 -0.13 -0.15 -0.26 -0.12
10 Entertainment opportunities 0.51 0.71 0.64 1.23 1.47 1.21
11 Prices of some goods and services -0.24 -0.40 -0.10 -0.32 -0.60 -0.11
12 Pride that residents have in the city 0.75 0.64 0.67 1.15 1.10 1.06
13 Overall cost of living -0.04 -0.16 0.04 -0.05 -0.05 0.06
14 Litter in the vicinity -0.16 -0.53 0.08 -0.532 -1.1813 -0.272
15 Damage to the environment -0.25 -0.24 -0.08 -0.41 -0.50 -0.03
16 Opportunities to meet new people 0.49 0.42 0.85 1.09 0.89 1.22
17 Opportunities for local business 0.26 0.14 0.41 1.21 1.15 1.03
18 Parking availability in the vicinity -0.41 -0.35 -0.18 -1.163 -0.99 -0.401
19 Traffic congestion in the vicinity -0.623 -0.543 -0.0912 -1.183 -1.123 -0.3612
20 The number of tourists visiting at other
times of the year 0.26 0.20 0.26 1.26 0.92 0.74
21 Excessive drinking and/or drug use -0.09 -0.39 -0.11 -0.302 -0.7613 0.002
22 Turnover for local businesses 0.24 0.12 0.33 1.17 1.21 1.26
23 Number of people moving in permanently
or buying holiday homes 0.08 0.07 0.07 0.43 0.20 0.17
24 The rights and civil liberties of local
residents -0.19 0.00 0.01 -0.7123 -0.141 -0.031
25 Public transport 0.34 0.29 0.14 0.81 0.64 0.23

21
26 Interactions between locals and tourists 0.29 0.29 0.31 0.75 0.86 0.71
27 Facilities available to local residents 0.27 0.19 0.29 0.66 0.38 0.45
28 Social and moral values -0.08 0.18 0.08 0.01 0.17 0.13
29 The media coverage of the event promotes
tourism and business development in
Melbourne / Horsham
0.41 0.34 0.41 1.50 1.36 1.23
30 The public money spent on the event
would be better spent on other things -0.2723 -0.011 -0.011 -0.3823 -0.051 -0.011
31 The event entertains local residents and
gives them an opportunity to attend a major
international event
0.51 0.57 0.75 0.98 1.20 1.47
32 The event disrupts the lives of local
residents and causes them stress -0.19 -0.04 -0.05 -0.8523 -0.261 -0.071
33 Because of the event, the skill base for event
management in Melbourne has increased 0.37 0.15 0.30 1.27 0.87 1.28
34 The event increases social inequity because
it provides benefits to the rich, but none to
the poor
-0.06 -0.01 0.01 -0.32 -0.18 -0.04
35 The event gives us an opportunity to show
other people how special our community is 0.50 0.50 0.63 1.18 1.08 1.37
36 The event brings too many people into our
community -0.02 0.01 0.05 0.02 0.01 0.14
37 The event enhances Victoria's reputation as
"The Events State" 0.68 0.52 0.52 1.41 1.29 0.93
38 Because of the event, friends come and visit
me 0.36 0.12 0.31 0.38 0.14 0.32
39 Ordinary residents get no say in the
planning and management of the event -0.22 -0.15 -0.02 -0.773 -0.55 -0.081
40 The event promotes values that are good 0.383 0.57 0.801 0.6723 1.181 1.391
41 The event provides opportunities for people
to have fun with their family and friends 0.68 0.83 1.00 1.382 1.771 1.70
42 The money that tourists spend when they
come to the event helps to stimulate the
economy
0.56 0.41 0.50 1.70 1.62 1.49
22
Table 7: PCA results
Fact
or 1
: Soc
ial a
nd e
cono
mic
deve
lopm
ent b
enef
its
Fact
or 2
: Con
cern
s abo
ut
just
ice
and
inco
nven
ienc
e
Fact
or 3
: Im
pact
on
Publ
ic
Faci
litie
s
Fact
or 4
: Im
pact
s on
beha
viou
r
and
envi
ronm
ent
Fact
or 5
: Lon
g te
rm im
pact
on
com
mun
ity
Fact
or 6
: Im
pact
on
pric
es o
f
som
e go
ods a
nd se
rvic
es
Eigenvalue 7.33 4.43 3.20 2.68 2.14 1.43
Percentage of variance explained 19.30 11.66 8.42 7.04 5.63 3.77
The event provides opportunities for people to have fun with their
family and friends 0.792
The event entertains local residents and gives them an opportunity
to attend a major international event 0.740
The event gives us an opportunity to show other people how
special our community is 0.739
The money that tourists spend when they come to the event helps
to stimulate the economy 0.733
The event promotes values that are good 0.725
The event enhances Victoria's reputation as "The Events State" 0.702
The media coverage of the event promotes tourism and business
development in Melbourne / Horsham 0.669
Because of the event, the skill base for event management in
Melbourne has increased 0.607
Pride that residents have in their city 0.592
Opportunities to meet new people 0.578 0.370
Entertainment opportunities 0.574 0.372
Range of interesting things to do 0.572 0.440
Opportunities for local business 0.528 0.366
Interactions between locals and tourists 0.516 0.360

23
Because of the event, friends come and visit me 0.493
The rights and civil liberties of local residents 0.754
The event disrupts the lives of local residents and causes them
stress 0.716
The public money spent on the event would be better spent on
other things 0.671
Ordinary residents get no say in the planning and management of
the event 0.656
Noise levels 0.649
Parking availability in the vicinity of the event precinct 0.624 0.432
Traffic congestion in the vicinity of the event precinct 0.619 0.436
The event increases social inequity because it provides benefits to
the rich, but none to the poor 0.562
Maintenance of public facilities 0.742
Appearance of area around event precinct 0.664
Public transport 0.573
Employment opportunities 0.374 0.526
Facilities available to local residents 0.487
Number of people in the area around the event precinct 0.381
Litter in the vicinity of the event precinct 0.699
Excessive drinking and/or drug use 0.669
Rowdy and delinquent behaviour 0.649
Damage to the environment 0.437 0.522
Number of people moving in permanently or buying holiday
homes 0.725
The number of tourists visiting at other times of the year 0.351 0.607
Turnover for local businesses 0.451 0.508
Property values in the vicinity of the event precinct 0.602
Prices of some goods and services 0.451 0.455