THE DETERMINANTS OF EXECUTIVE COMPENSATION IN FAMILY-OWNED FIRMS
29
THE DETERMINANTS OF EXECUTIVE COMPENSATION IN FAMILY-OWNED FIRMS LUIS R. GOMEZ-MEJIA Dept. of Management Arizona State University Main Campus, PO Box 874006 Tempe, AZ 85287-4006 [email protected] 480-965-8221 (ph) 480-965-8314 (fax) MARTIN LARRAZA-KINTANA Dept. de Gestión de Empresas Universidad Publica De Navarra Campus de Arrosadia, 31006, Pamplona (Navarra), Spain [email protected] +34-948-168931 (ph) +34-948-169404 (fax) MARIANNA MAKRI Dept. of Management Arizona State University Main Campus, PO Box 874006 Tempe, AZ 85287-4006 [email protected] 480-965-7289 (ph) 480-965-8314 (fax)
Transcript of THE DETERMINANTS OF EXECUTIVE COMPENSATION IN FAMILY-OWNED FIRMS
THE DETERMINANTS OF EXECUTIVE COMPENSATION IN
FAMILY-OWNED FIRMS
LUIS R. GOMEZ-MEJIADept. of Management
Arizona State UniversityMain Campus, PO Box 874006
Tempe, AZ [email protected]
480-965-8221 (ph)480-965-8314 (fax)
MARTIN LARRAZA-KINTANADept. de Gestión de Empresas
Universidad Publica De NavarraCampus de Arrosadia,
31006, Pamplona (Navarra), [email protected]
+34-948-168931 (ph)+34-948-169404 (fax)
MARIANNA MAKRIDept. of Management
Arizona State UniversityMain Campus, PO Box 874006
Tempe, AZ [email protected]
480-965-7289 (ph)480-965-8314 (fax)
1
THE DETERMINANTS OF EXECUTIVE COMPENSATION IN
FAMILY-OWNED FIRMS
ABSTRACT
Family-owned firms use different executive compensation policies depending on whether or
not the CEO is a family member. Family CEOs receive less total income. While family CEOs
receive lower compensation, their pay tends to be more insulated from risk and increases faster than
that of their non-family counterparts as systematic (less controllable) business risk increases. The
presence of institutional investors and R&D intensity play an important moderating role in these
relationships. The amount and mix of long-term income for family CEOs decrease as the ownership
position of institutional investors improves. R&D intensity has less impact on compensation level
and pay mix for family vis-à-vis professional CEOs.
Key words: executive compensation, agency relationship, family ownership
2
Despite a wealth of research on CEO pay, largely grounded in agency or managerialist
perspectives, little is known about its determinants in family-owned firms (Tosi, Werner, Katz &
Gomez-Mejia, 2000). We address this gap by examining a variant of the traditional executive
compensation contract, one that involves family ties between principal and agent, and contrast it to
situations where such ties are absent. To this end, we collected data during a four-year period on
253 family-owned firms; 148 (59%) of these were led by a family CEO and 105 (41%) had a non-
family CEO at the helm. We find that the presence of CEO family ties influences the magnitude and
composition of the executive pay package. We also observe strong interaction effects on CEO pay
design between CEO family ties and three contextual factors, namely the presence of institutional
blockholders, R&D investments, and the firm’s systematic risk exposure. Our results confirm that
principal-agent family ties exert a major influence on how much and how executives are paid, but
these effects are complex.
This study offers several contributions to the literature on executive pay. First, we extend
agency theory in a new and meaningful way to better understand incentive alignment issues that are
unique to CEO pay in family-owned firms. Second, we use a population that is inherently
interesting given the pervasiveness of family controled firms, and the lack of information on their
executive pay practices. While estimates may vary, in the United States (where the corporate form
described by Berle & Means [1932] and subsequent “managerialists” is most prevalent), families
own approximately 80% of firms, with some estimates being as high as 95% (Beehr, Drexler &
Faulkner, 1997; Daily & Dollinger, 1992). While the vast majority are small businesses with less
than 500 workers, family-owned firms are often found among the largest corporations across a
broad range of industries, both in terms of sales volume and number of employees (James, 1999; La
Porta, Lopez-de-Silanes, & Shleifer, 1999). By some estimates, these businesses employ more than
85% of the American labor force (Oster, 1999). Third, we contribute to the theoretical and empirical

3
literature on corporate governance by showing how a wide array of agency relations within family
owned firms (involving family CEOs, professional managers, family shareholders, and external
investors) differentially affect CEO pay design. Lastly, we argue and empirically support the notion
that important variables that have been shown in the past to predict CEO pay (namely R&D
intensity and business risk) behave differently as a function of family ties at the top.
THEORETICAL FRAMEWORK AND HYPOTHESES
Family Ties and Executive Pay
We expect that the family CEO should receive a lower level of total compensation than a
professional CEO. There are several reasons for this expectation. First, both anecdotal (Applegate,
1994; Kets de Vries, 1993) and empirical (Allen & Panian, 1982; Gomez-Mejia et al., 2001;
Schulze et al., 2001) evidence suggest that incumbents with family ties to owners enjoy greater
employment security than professional managers. The latter are not sheltered by common family
bonds as would be the case when the executive is related to the firm’s owners. As argued by Beehr
et al. (1997), the family executive inherently plays two overlapping and interdependent roles: a
work role (as steward of the company) and a non-work role (fulfillment of family obligations). In
reciprocity for this role duality, the family CEO is rewarded with a relatively assured job (Allen &
Panian, 1982; Kets de Vries, 1993; Gomez-Mejia et al., 2001). Moreover, the performance
expectations of family CEOs are probably less demanding than those of professional managers who
are often asked to play the role of “turnaround artists.” As noted by Smith and Amoako-Adu (1999:
342), “a poorly performing family firm looking for a turnaround would rank its choice of CEOs as
first being an outsider, second a non-family insider, and third a family member.” Thus, professional
CEOs tend to be at the helm when the firm faces difficult prospects, implying a more challenging
assignment for the incumbent, with a greater probability of failure.
4
The performance appraisal literature also suggests that evaluators are more likely to make
positive performance attributions to employees when there are emotional ties between monitors and
those being judged. The reverse is also true: scapegoating is more likely to occur when there are
weak affective ties between supervisors and subordinates (see review by Cardy & Dobbins, 1993).
By implication, one would expect that in family-owned firms board members in their role as
monitors may be less inclined to attribute disappointing results to the family CEO vis-a-vis a
professional executive. The board may also respond more forcefully against the professional
manager when interpreting ambiguous performance data giving the benefit of the doubt to the
family CEO (e.g., bad luck or unfortunate circumstances) but not to the outsider (who may be
judged to be incompetent).
Applying agency theory’s logic, the above scenario suggests that in family owned firms risk
averse agents would trade higher job security for lower earnings if they are related to principals.
Conversely, professional executives would exchange higher pay for lower employment security and
the greater performance expectations placed on them. Other attributes of the family agency contract
also contribute to this pay gap. The family CEO is more likely to be emotionally attached to the
firm than its professional counterpart so the agency contract should be more calculative and
utilitarian for the latter than the former (Gomez-Mejia, et al., 2001; James, 1999). Another way of
looking at this is that pecuniary “quid pro quo” motives in the agency relation should not loom as
large for family executives. Consequently, they should be willing to accept a lower remuneration
package in return for their services. This tendency is reinforced by the fact that family CEOs are
unlikely to compete in the external market, while professional executives are free to chose the best
offer among available alternatives open to them. This “family handcuff” lessens the need to reward
the family CEO with a pay package that is comparable to that of a professional executive. As a
result, their pay is likely to remain depressed. The preceding arguments lead to our first hypothesis:

5
Hypothesis 1a: Family CEOs receive lower total compensation than professional CEOs.
As a corollary to Hypothesis 1a, it seems reasonable to expect that the greater the
concentration of ownership in the hands of the family, the more protection can be afforded to a
family CEO, and conversely the greater the risk exposure of a professional CEO. In other words,
unencumbered family members should be able to offer greater employment security to one of its
members and act more decisively and unilaterally to discipline the professional CEO for real or
alleged incompetence. Agency theory logic would again suggest that this should depress the relative
compensation of the family CEO (who would be more sheltered from employment risk by powerful
family members), and increase it for the professional CEO (who should require a pay premium to
take on the riskier assignment). Thus:
Hypothesis 1b: The greater the concentration of ownership in the hands of family members,the greater the compensation gap between family CEOs (who are paid less) and professionalCEOs (who are paid more).
The Moderating Role of Institutional Investors
Recent research suggests that agency problems may be substantial in family owned firms
and that these manifest in different forms depending on CEO family ties (e.g., Gomez-Mejia et al.,
2001; Schulze et al., 2001). Consistent with prior literature (Tosi et al., 1999), institutional investors
should play an active policing role to reduce these agency problems for family firms in their
portfolio. Accordingly, as discussed next, we believe that the design of the CEO compensation
package will vary by family status as a function of the ownership position of institutional investors.
One important factor for institutional investors to consider in CEO compensation design is
the timeframe for decision making. The broader literature on corporate governance suggests that
institutional investors are particularly concerned with agency costs associated with “managerial
myopia” (Hansen & Hill, 1991; see also review by Laverty, 1996). These investors are interested in
long-term value (Davis & Thompson, 1994), while “managers may favor short-term results and lack

6
commitment to long-term investments” (David, Hitt, & Gimeno, 2001: 144). The reason for these
conflicting goals lie in the fact that CEOs often have a more immediate time horizon for decision
making than that of institutional investors. As noted by David et al. (2001: 145) “although long-
term investments can increase firm value for owners, such investments may be suboptimal from the
perspective of managers…managers are likely to enjoy larger personal benefits from investments
with faster payoffs that enable them to enhance their reputations speedily and thereby hasten career
advancement.” Consistent with this view, several studies have shown a positive impact of
institutional ownership on the use of equity-based compensation to foster a long-term managerial
perspective (e.g., Tosi & Gomez-Mejia, 1989; David, Kochhar & Levitas, 1998).
Family relationships at the top are likely to change this picture. For family CEOs, “family
ties, loyalty, [employment] insurance, and stability are expected to be effective in lengthening the
horizons of managers, and in providing the incentives for family managers to make efficient long-
term investments in the family business” (James, 1999: 41). Based on in-depth interviews with over
300 executives associated with family firms, Kets de Vries (1993: 62) notes that a key
distinguishing feature between family CEOs and professional executives is that the former “…are
not hunted by quarterly results. They are under less pressure…they worry less about takeover
threats. There is less need to create elaborate schemes with poison pills and golden parachutes. They
are more willing to plow profits back into the business…” Given that a long-term perspective of
family managers is a natural outgrowth of membership in the family system, from the point of view
of institutional investors the advantages of long-term pay (i.e., the creation of a “common fate”
between the CEO and the firm; Murphy, 2000) are greatly diminished for family CEOs.
Emphasizing long-term pay for family CEOs may not only provide dubious benefits to
shareholders, but may inadvertently promote agency problems associated with managerial
entrenchment. An ever present danger with family CEOs is that the executive may stay in power

7
even though continued tenure may not be justified based on performance results (Kets de Vries,
1993). Unfortunately, “because ownership rights and the formal authority of office combine with
family status to reduce turnover…the CEOs of most family firms are firmly entrenched” (Shulze et
al., 2001: 104).1 Emotional ties between the CEO and the board (Schroeder, 2001), and family
altruism (Casson, 1999) tend to prolong this tenure. Gomez-Mejia et al. (2001) document how
entrenched family CEOs set in motion sub-optimal risk taking and lower performance. This same
study also suggests that those family firms that have procedures in place to prevent this from
happening (e.g., appointing professional CEOs when profitability falls below industry norms)
perform better and survive longer. In other words, entrenched family CEOs either through
incompetence or the pursuit of non-economically motivated preferences (e.g., vetoing a new venture
because it threatens the status quo, investing in pet projects, or showing favoritism for particular
relatives) “may take actions that do not advance the common (economic) good and still remain at
the helm” (Schulze et al., 2001: 101).
Designing a compensation package for the family CEO that is heavily oriented towards
long-term incentives augments the incumbent’s already high equity position (e.g. in the present
study it exceeds 17% of the firm’s equity). This should enhance his/her ownership rights vis-à-vis
other stakeholders in the firm, increasing the possibility of entrenchment (Shulze et al., 2001). Thus,
any agency benefits that may be potentially gained through increased equity ownership for family
CEOs (e.g., greater performance accountability) could be offset by excessive control and moral
hazard problems. Compounding this problem, family ownership tends to shield the firm from the
disciplinary pressure of the market for corporate control and it is more difficult for the stock market
to appropriately value the firm’s stock prices in response to “hidden actions” (Stulz, 1988). This
provides family executives with greater latitude of action to pursue their own agendas sheltered
1 Three data sets using very different samples indicate that the tenure of family CEOs is on average more than double

8
from market pressures. Given closer monitoring by the family, entrenchment is a less serious pitfall
for the non-family CEO. Thus, in addition to fostering a longer time horizon, greater ownership
rights for the professional CEO should strengthen the incumbent’s leverage position vis-à-vis that of
influential family members.
In summary, the instrumentality of long-term income to reduce potential agency problems in
family owned firms depends on the family status of the CEO. If the CEO is a professional manager,
long-term income may help tie the fortunes of the CEO to those of the firm, helping resolve the
problems of managerial myopia, information asymmetry and potential conflict of interest between
principal-agent. In the case of family CEOs, strengthening the ownership rights of the incumbent
may reinforce a natural tendency toward entrenchment, thereby having a negative impact on
shareholders’ welfare. Thus, we posit that institutional shareholders who are vigilant of their
interests should press for lower emphasis on long-term income in the case of family CEOs, with the
opposite being the case for professional managers. This leads to our second hypothesis:
Hypothesis 2a: The greater the percent of stock ownership in the hands of institutionalinvestors, the lower the long-term income received by family CEOs.
Hypothesis 2b: The greater the percent of stock ownership in the hands of institutionalinvestors, the lower the proportion of long-term income as a percent of the totalcompensation package for family CEOs.
The Moderating Role of R&D Intensity
Several empirical studies in the compensation strategy literature (Balkin & Gomez-Mejia,
1987, 1990; Mikovich, Gerhart & Hannon, 1991) report that firms which invest heavily in R&D pay
more to their executives but tend to emphasize the variable components of pay, particularly long-
term income. In this manner, these firms compensate executives for the higher risks involved in
R&D activities (due to greater ambiguity in cause-effect relations, greater uncertainty of longer
that of professional CEOs (Gomez-Mejia et al., 2001; Schulze et al., 2001; and the present study).

9
term R&D investments, more dependence on trial and error and such, cf. Balkin, Markman &
Gomez-Mejia, 2000). Long-term pay in turn forges a common destiny between the executive and
shareholders. In these firms “self-monitoring” rather than external monitoring becomes very
important as information asymmetries between professional managers and shareholders increase on
a par with R&D investments (due to specialized knowledge required, greater complexity of
processes, difficulty in judging the appropriateness of managerial decisions within a short-time
frame, and the like, cf., Milkovich et al., 1991; Balkin et al., 2000). Thus, long-term incentives that
tie the executive’s financial gains to shareholders’ welfare through appreciation of stock holdings,
“serve a crucial self-monitoring control function for CEOs of firms with high R&D intensity”
(Balkin et al., 2000: 1120). This is buttressed by the fact that most of these firms are dependent on
entrepreneurial talent that is attracted to this type of compensation scheme (Chandler, 1993).
Among family-owned firms, we expect to find a different situation. That is, we anticipate
uncovering an interaction effect between CEO family membership status, R&D intensity and both
level and mix of the executive compensation package. Specifically, we predict that the positive
influence of R&D intensity on CEO’s total pay, and long-term income as a proportion of total pay
should be lower for family CEOs. There are several reasons for this expectation as noted below.
Firms with high R&D intensity are more dependent on specialized managerial talent where
management of innovation, knowledge generation and boundary spanning activities become an
integral part of the executive’s job (Duysters & Hagedoorn, 2000; Gopalakrishman, 2000). As
argued by Henderson and Fredrikson (2001:100), “as R&D activity increases, the number of
investment projects grows and/or the size and complexity of the average project increases…the long
multiyear lags between technology expenditures and potential future revenues further complicates
[managerial] decisions...to make informed choices among competing projects, executives need a
deep understanding of technological and competitive risks…[and] the emerging contingencies that
10
may demand large scale redirection of resources across projects.” Lifetime CEO family experience
is not as valuable an asset in firms facing these challenges and could even be a drawback. As noted
by Casson (1999) “…the advantage of the dynastic firm lies in the special training that it gives to
family members, who have the opportunity to learn about all the different aspects of the production
process…it is assumed that this family training is of greatest value in traditional industries… by
contrast, dynastic firms are likely to suffer most in science based industries, since the family
training is of little value, whilst the sacrifice of foregone professional expertise is high.”
In other words, as R&D intensity increases the advantages of CEO family ties (e.g., greater
loyalty and commitment) may not overcome two serious potential liabilities. One is a more limited
set of managerial skills for the firm to choose from. The other is that a “home-grown” family
executive may face greater cognitive constraints resulting from a narrower market exposure, more
parochial work experience, and a firm-specific knowledge base. To insist on retaining direct
managerial control by a family member, the firm may have to opt for a lesser qualified CEO, a
policy that would not be very rational for a situation that demands technical savvy and in some
cases may call for esoteric acumen that can only be drawn from a competitive labor market.
Relatedly, the economic value of a personal style of management in which trust, loyalty, service and
reciprocity are heavily weighted, as is usually the case for family CEOs, is likely to diminish as
knowledge creation and innovation are key to achieving a sustainable competitive advantage in
these firms (Gopalakrishman, 2000). Moreover, family CEOs are typically selected several years
prior to the founder or current CEO’s departure so that they are carefully groomed to take over the
position (Vancil, 1987). This internal training may be of little use in firms with very short life
cycles, exposed to very rapid change, and dependent on innovation for their survival.
As an extension of the above arguments, it seems reasonable that as R&D intensity increases
the family-owned firm should offer a greater pay premium to the non-family CEO in order to enable

11
the firm to compete for talent in an open labor market. At the same time, the firm is more likely to
convert a greater share of the professional CEO’s pay into a long-term income form as R&D
intensity rises. Such a pay strategy would make more sense in this situation when a family outsider
is at the helm. Relying on an agency logic, Milkovich et al. (1991: 137) noted that: “R&D intensive
firms are subject to an exacerbation of the owner-manager information asymmetry…managers’
behavior and information cannot be as readily observed and controlled in R&D intensive firms due
to the very nature of the innovative process. R&D inputs at one time period may not show readily
observable results for several periods. Furthermore, interim [short-term] performance measures may
be misguided…” Thus, long-term incentives as a proportion of total pay should be lower for family
versus professional CEOs as R&D intensity increases given that information asymmetries would be
greater for the latter than the former. The next set of hypotheses follow from the preceding
arguments:
Hypothesis 3a: The positive effect of R&D intensity on CEO compensation level will belower for family CEOs than professional CEOs.
Hypothesis 3b: Long-term income as a proportion of total pay will rise slower as a functionof a firm’s R&D intensity for family than professional CEOs.
The Moderating Role of Business Risk
Given the assumption of agent’s risk aversion, agency theory predicts that as uncontrollable
business risk increases, the total pay of the CEO should increase accordingly. But we expect that the
risk-pay relations will depend on CEO family ties. Simply put, we predict that family CEOs will
experience greater sensitivity of their compensation to business risk.
Unlike their non-family counterparts, family CEOs face additional personal risks as business
risk increases, and this means that their remuneration should increase accordingly. The failure rate
of family-owned firms tends to be higher when faced with greater business risks because the firm is
often precluded from obtaining funds from outside sources, which means that more internal sources

12
are used, and often exclusively rely on reinvestment of profit (Casson, 1999). This implies limited
portfolio diversification and a higher cost of capital due to higher risk premium which exacerbate
the probability of business failure (Galve-Gorriz & Salas-Fumas, 1996). The family executive,
unlike an outsider who works for a fee, has concentrated all his/her risks into one business. These
risks are not only financial, but also socio-emotional as the family’s name is at stake, a living
symbol of its generational or multigenerational achievement. Family CEOs are likely to “have made
the firm the true object of their devotion and have spent most of their working lives within the
company” (James, 1999: 44). If the company fails, their external employment prospects are likely to
be limited as their human capital is firm-specific and other firms are unlikely to offer a similar or
better job to the family ex-CEO of a demised company.
Unlike the family CEO, the professional executive is not intrinsically tied to one firm neither
financially nor emotionally. This CEO will hold the position as long as it is personally
advantageous, and would receive a pay premium over a family CEO while at the helm (as argued in
Hypothesis 1a). Further, the non-family executive has more employment options outside the firm
and has more freedom to exit the firm unencumbered long before the possibility of business failure
materializes. As noted by Daily and Dollinger (1993: 120) “professional (non-family) managers
seldom maintain loyalty to any organization. Therefore, the loss of one’s job, or more importantly
the failure of the business, are not as catastrophic to the professional manager.”
Given the above considerations, at the same time that the family firm will pay a
compensation premium to the non-family CEO (as per Hypothesis 1a), as evidence of business risk
beyond the executive’s control increases, the compensation of the family CEO will increase faster
than that of a professional CEO. Altruistic motives are likely to play a role here as the family firm
would lean towards rewarding the “underpaid” CEO family member for business risks that lie
beyond his/her control and that may lead to great personal hardships. Formally, stated:

13
Hypothesis 4a: The overall compensation of family CEOs will rise faster than that ofprofessional CEOs as business risk increases.
We believe that the stronger hypothesized relationship between total compensation level of
family executives and business risk will be more pronounced in the case of environmental
(systematic) than firm specific (unsystematic) risk. The reason for this is that systematic risk, by
definition, exposes the CEO to performance uncertainty that is exogenous to the firm and over
which the executive exerts very little if any influence, particularly in family owned firms where the
opportunities for diversification are rather limited. While family CEOs may be “underpaid” (as per
Hypothesis 1a), their compensation should be more closely pegged to external (systematic) risk
following the logic that underlies Hypothesis 4a (lack of employment options, commitment to a
single firm, altruistic motives on the part of family members and such). Thus:
Hypothesis 4b: The overall compensation of family CEOs vis-à-vis that of professionalCEOs will rise faster as a function of exogenous (systematic) than firm specific(unsystematic) business risk.
METHODS
Sample and Data Collection
We tested our hypotheses with a sample of 253 family-owned firms during a four-year
period (1995-1998). These firms were identified through a painstaking and tedious process that
involved manual inspection of a randomly selected set of 3000 proxies of publicly traded
companies included in the COMPUSTAT database. While not exhaustive, this large randomized
sample was considered adequate given the labor intensity involved in data collection. Following
standard criteria in the literature on family businesses, a firm was considered as “family-owned” if
both of the following two conditions are met: two or more directors must have a family

14
relationship2 (Daily & Dollinger, 1993), and family members must own or control at least 5% of the
voting stocks (Allen & Panian, 1982). For 148 (59%) of those firms, the CEO was also a family
member, while for the remaining firms he/she was not.3 Information for each firm was obtained
from two sources during the period 1995-1998. Firms’ proxy statements were used to collect data
about CEO and firm characteristics, ownership structure, board composition, and CEO pay.
Financial information for the same period was downloaded from the COMPUSTAT database.
Measures
CEO Compensation. We include measures of both compensation level (total compensation,
salary, bonuses and long-term income [LTI]), and compensation mix (salary/total compensation,
bonus/total compensation and LTI/total compensation) for the 1995-1998 period.4
CEO Family Status. This is a dummy variable that has a value of 1 when the CEO belongs
to the family that “controls” the firm (N = 148, as per our definition of family ties in footnote 2).
This variable takes a value of 0 when the CEO is not a member of the family (N = 105).
Ownership structure. We used firms’ proxy statements to measure the percent of stock
owned by the CEO, the percent of stock owned by family members (excluding the CEO), and the
percent of stock owned by institutional investors.5
2 Two individuals are considered to have a family relationship if they are members of the same descendent group(Zeitlin, 1974; Gomez-Mejia et. al., 2001; Schulze et.al., 2001; Daily & Dollinger, 1993). This would include father,mother, sister, brother, son, daughter, spouse, in-laws, aunt, uncle, niece, nephew and cousin.3 Sample statistics indicate that the median for firms led by a family CEO was 45.6% smaller in annual dollar sales,69.3% smaller in workforce, one and a half years younger, 5.8 times lower in R&D investments, 18.2% lower in thesystematic risk (beta) measure, and 7 years longer (2.8 times higher) in terms of CEO tenure, as compared to firms ledby a professional CEO. None of the industry sectors at the 4 digit SIC code account for more than 5% of the firms. Noindustry differences were detected by family status. As a whole, these statistics suggest that family owned firms tend tohire professional executives as the complexity of the managerial task increases (i.e., greater scale of operations, moreR&D intensity, increased systematic risk and the like); and that family CEOs tend to remain at the helm much longer.4 The cash compensation components (i.e., salary, bonuses) are valued in U.S. dollars. Following previous work (e.g.,Finkelstein and Boyd, 1998), the value of stock options is calculated as the number of options granted to the CEOmultiplied by 25 percent of the exercise price.
5 Institutional investors include public pension funds, mutual funds, insurance companies, banks, non-banks trusts, andcorporate pension funds (David et al., 1998). Family trusts and/or foundations are not considered as institutional

15
Firm Risk. Consistent with much of prior work, we defined business risk as variability in
firms’ stock market returns and measured it in two ways: as systematic and unsystematic risk
(Bloom & Milkovich, 1998), using monthly adjusted stock data from 1995 through 1998. Monthly
adjusted data on the S&P 500 index was used to capture the market portfolio return.
R&D Intensity. This was measured as the ratio of R&D expenditures during the 1995-1998
period divided by sales.
Control Variables. Several measures were used as control variables as many of these have
been found in prior studies to relate to CEO pay (see review by Tosi et al., 2000; Gomez-Mejia &
Wiseman, 1997). Firm size was measured as the average value of firm sales for the 1995-1998
period. Firm performance was measured as average ROA and average Excess Stock Returns
(relative to Standard and Poor’s 500) during the period 1995-1998. Miscellaneous firm
characteristics include industry, firm age, and extent of international diversification.6 CEO
Characteristics include CEO tenure, and a set of dummy variables to denote whether the CEO was
also the chair of the board of directors (CEO Chair), the founder of the firm (CEO Founder), or a
member of the compensation committee (CEO Compensation Committee). We also controlled for
other family-related characteristics, including the proportion of family members on the board and
whether or not a family member (who is not the CEO) is also a member of the compensation
committee (1 = yes, 0 = no).
Based on each firm’s SIC code, we included a dummy variable that differentiates between
manufacturing (1) and non-manufacturing firms (0) (Tosi & Gomez-Mejia, 1994). We did not use
investors. Due to limitations in the information available, we could only identify institutional investors that own 5% ormore of the company stock.
6 International diversification was measured using a dummy variable (1 if the firm has at least one foreign subsidiary, 0otherwise). We used a dummy variable because only 76 (out of 253) firms in the sample had a foreign subsidiary.Among those 76 firms, 42 had a family CEO (55%) and 34 (45%) had a non-family CEO. The median number ofsubsidiaries was slightly higher for firms with a non-family CEO (four) than a family CEO (three) at the helm.

16
finer industry breakdowns in the analysis because given that no significant differences were found,
we opted to conserve degrees of freedom in the regression equations.
Analysis
The hypotheses were tested via regression analysis, with the CEO pay measures as
dependent variables.7 First, all the control variables and main effects were entered as a block. Next,
the interaction terms were entered. These included the multiplicative terms for CEO family
membership and: % family ownership (hypothesis 1b), % institutional ownership (Hypotheses 2a
and 2b), R&D intensity (Hypothesis 3a and 3b), and both business risk measures (Hypotheses 4a
and 4b). A positive sign for the interaction term means that the effect of that variable on CEO pay is
stronger for the family CEO (and vice versa in the case of a negative coefficient).
RESULTS
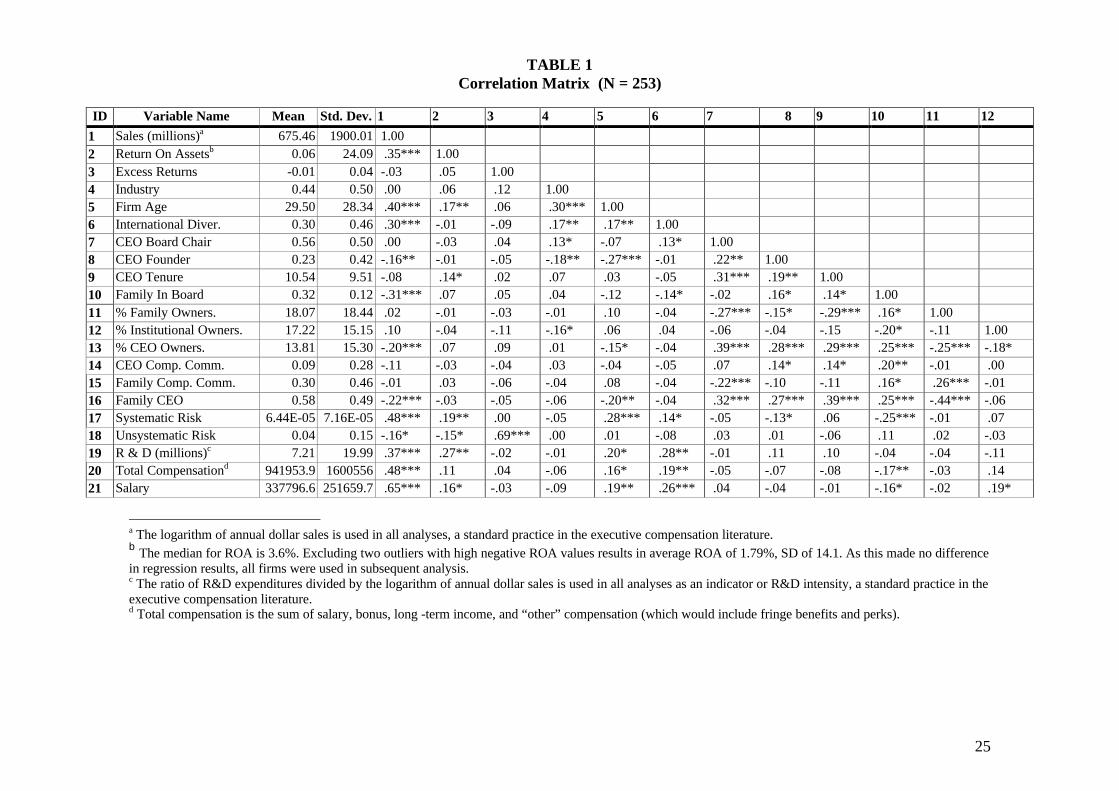
Table 1 shows the correlation matrix, while Table 2 summarizes the regression results. The
correlation coefficients for family CEOs in Table 1 indicate that their compensation tends to be
lower than that of professional CEOs. This is corroborated by the regression results in Table 2,
which shows that family CEOs receive lower total compensation than professional CEOs (beta = -
.25, P < .10), providing moderate support for Hypothesis 1a. In support of Hypothesis 1b, the pay
disadvantage of the family CEO grows as family ownership increases (beta = - .21, P < .05). Table
2 also shows that as the percent of stock ownership in the hands of institutional investors increases,
both the relative amount (beta = - .36, P < .05) and mix (beta = - .58, P < .01) of long-term income
decreases for family CEOs supporting hypotheses 2a and 2b. Turning our attention to R&D as a
moderator in Table 2, the effect of R&D investments on total CEO pay is lower for family CEOs
7 Some authors report that agency problems are associated with ownership in a non-linear fashion. For example, Morck,Shleifer, and Vishny (1998) found that Tobin’s Q tends to decrease under moderate CEO stock ownership (5-25%range) due to entrenchment, and increases under high ownership (greater than 25%) due to the symmetrical consonanceof interest between the CEO and the firm. In the present sample of family owned firms, none of the non-linear terms for

17
(beta = - .93, P < .001), and these family CEOs are paid in cash (beta= .47, P < .05) rather than
through long-term pay (beta = -.90, P < .001) as a proportion of total compensation as R&D rises
supporting hypotheses 3a-3b. Lastly, the results in Table 2 indicate that systematic risk has a much
stronger positive effect on the total compensation of family CEOs (beta = .69, P < .001), while
unsystematic risk seems to make no difference, supporting hypotheses 4a and 4b. With the
exception of firm size, the control variables as a whole had little effect on CEO pay.
While not shown in Table 2, the “practical” differences associated with the statistically
significant interaction terms tend to be rather large. For example, professional CEOs on average
receive almost four times more income in the form of long-term pay if they work for a family
owned firm that falls in the top versus the lowest quartile in institutional investments. For family
CEOs, we find exactly the opposite, with family CEOs receiving less than half as much in long-
term pay if their firm falls in the top versus the lowest quartile of the institutional investment
distribution. Among firms in the top quartile of R&D intensity, family CEOs earn approximately
one fourth of their professional CEO counterparts, with the difference reaching a 9 to 1 ratio in the
case of long-term income. Lastly, the pay gap narrows considerably between the family CEO and
the professional CEO in the top versus the low quartile of the systematic (beta) risk distribution,
with the family CEO earning approximately one half of the professional CEO’s earnings in the top
beta quartile versus approximately one-third in the lowest beta quartile. All things considered the
family CEO earns slightly less than half the annual income of a non-family CEO ($635 thousand
versus $1.3 million on average).
CONCLUSIONS AND DISCUSSION
Our results indicate that executives with family ties to owners receive lower total pay than
professional managers. This relative pay disadvantage increases as the family ownership position
CEO, family and institutional ownership variables were found to be significantly related to the dependent variables.

18
improves and R&D investments increase, conditions which induce these firms to pay more to
outsiders in order to secure their services. On the other hand, family ties protect the CEO from
bearing excessive pay risk as indicated by a greater compensation premium as uncontrollable
(systematic) business risk increases. These results point towards an interesting and complex agency
dynamics –where altruistic family motives are at work when family CEOs are at the helm, but these
motives manifest themselves not in higher pay but rather in risk protection.
This study also suggests that institutional investors play a major role in the compensation
policies of family owned firms. The evidence is consistent with theoretical expectations that agency
problems from the point of view of external investors differ depending on family ties at the top.
Managerial myopia in the case of professional managers may be reduced through long-term income.
On the other hand, managerial entrenchment in the case of family CEOs may be held in check by
failing to provide these executives with greater equity based compensation (which would strengthen
their ownership position). These findings indicate that prior research showing a positive impact of
institutional ownership on CEO performance contingent pay (see Tosi et al., 1999) should be
reconsidered in family owned firms. In other words, institutional investors seem to express different
preferences as to how incentive alignment systems are designed depending on CEO family
relations.
The results noted above present an interesting theoretical challenge. The literature on agency
theory suggests that performance contingent pay systems could become a two-edge sword: on the
one hand, they create greater incentive alignment between principal and agent but on the other hand
they may accentuate a natural propensity toward risk adversity on the part of the agent leading to
suboptimal returns to shareholders. (For an extended discussion of this issue, see Gomez-Mejia &
Wiseman, 1997). This dilemma acquires special significance to institutional shareholders of family
Therefore, only linear regression models are calculated and shown in this study.
19
owned firms seeking to maximize investors’ returns. Given that both family shareholders and
family CEOs bear greater risks from the consequences of executive actions (i.e., their wealth is
closely tied to one firm and external employment possibilities are limited), it seems reasonable that
institutional investors would avoid paying the family executive with equity based income as this
would give them greater influence to make conservative decisions in an already risk averse, family
business context. This is an exciting area for future research.
Three prior studies using non-family firms report that unsystematic rather than systematic
risk is related to executive pay (Gray & Cannella, 1997; Bloom & Milkovich, 1998; Miller, et al., in
press). Instead, we find the opposite results in the case of family CEOs and a lack of significance
for unsystematic risk in general as a predictor of CEO pay. This suggest that how firm risk
influences CEO compensation design depends not only on how we measure risk, but also on family
ownership and CEO family ties. As argued here, while family CEOs tend to earn less they are
compensated for assuming greater uncontrollable risks given their fewer employment options in an
open labor market. The unexpected absence of connection between firm specific (unsystematic) risk
and CEO pay in this study, in contrast to prior studies, may be the result of two counterveiling
tendencies among family-owned firms. On the one hand, the innate conservatism of family firms
(Galve-Gorriz & Salas-Fumas, 1996) may bias CEO compensation contracts to reinforce
conservative managerial decisions. On the other hand, some CEO risk taking is needed in order to
ensure survival and to achieve a minimum return of shareholders. Therefore, family firms wouldn’t
use incentives to promote risk taking, but neither can they afford to dissuade CEOs for adopting
necessary risks. The existence of these two opposite forces could explain the lack of a significant
relationship between unsystematic risk and CEO pay in our study. Again, the role of family
ownership on CEO compensation risk bearing offers an interesting avenue for future theory
development and empirical research on corporate governance.

20
This study raises some other exciting issues that may be pursued in future research. The “so
what” question immediately comes to mind in terms of the implications of these executive pay
policies for family-owned firms: Do these pay strategies make a difference in terms of observed
firm performance? How do these policies affect decision making for family versus non-family
CEOs?. There is also a growing literature on trust that may be extended to analyze the pay related
consequences of familiarity between principals and the CEO. Broadening the scope of this study
beyond compensation per se, given that the competitive success of firms depends more and more on
innovation, rapid response time, ability to survive in fast cycle markets and the like, is the family
CEO losing ground as a potentially viable strategic leader in this type of environment? Our data
hints that this may be true as the median R&D intensity of firms led by a professional CEO is more
than seven times greater than those with a family CEO at the helm. Similarly, the median systematic
(beta) risk measure is more than a third higher under a professional versus a family CEO. Do the
“best” family CEOs survive under these conditions? Other areas that may be pursued in the future
would include, for example, an examination of the profile of non-family executives that are
attracted to family-owned firms (e.g., are they more risk prone?) and the characteristics of those
family CEOs that survive in the challenging environments noted above. Simply put, family owned
firms still represent a black box in the scholarly management literature, opening the door to much
needed pioneering research.
In closing, it is important to note that this study has relied on family owned firms that are
publicly traded. Thus, there is a possibility that the results may not generalize to privately held
family owned firms. This presents both an opportunity and a challenge to future research as access
to data from a large sample of these firms is severely limited. Another caution worth noting is that
the years for this study (1995-1998) corresponds to an unprecedented period of economic

21
prosperity, a bull market, and the so called “internet buble.” Further research may try to ascertain if
some of our findings reflect these unique market conditions.
22
References
Allen, M.P., & Panian, S.K., 1982. Power, performance and succession in the large Corporation.Administrative Science Quarterly, 27: 538-547.
Applegate, J. 1994. Keep your firm in the family. Money, 23: 88-91.
Balkin, D. B. & Gómez-Mejía, L. R., 1987. Toward a Contingency Theory of CompensationStrategy. Strategic Management Journal, 8: 169-182.
Balkin, D. B. & Gómez-Mejía, L. R., 1990. Matching Compensation and Organization Strategies.Strategic Management Journal, 11: 153-169.
Balkin, D. B., Markman, G. & Gomez-Mejia, L. R., 2000. Is CEO Pay in High Technology FirmsRelated to Innovation? Some Empirical Evidence. Academy of Management Journal: (in press).
Beehr, T.A., Drexler, J.A.Jr. & Faulkner, S., 1997. Working in small family businesses: empiricalcomparisons to non-family businesses. Journal of Organizational Behavior, 18: 297-312.
Berle, A. & Means, G., 1932. The modern corporation and private property. NY: MacMillan.
Bloom, M. & Milkovich, G. T., 1998. Relationships Among Risk, Incentive Pay, andOrganizational Performance. Academy of Management Journal, 41: 283-297.
Cardy, R. L. & Dobbins, G., 1993. Performance Appraisal. Cincinnati, OH: South-Western.
Casson, M., 1999. The Economics of Family Firm. Scandinavian Economic History Review, 47 (1):10-23.
Chandler, G.N. 1993. Reward perceptions and the performance of emerging technology dependentand non-technology dependent firms. Journal of High Technology Management Research, 4(1), 63-77.
Ciscel, D.H., & Carroll, T.M. 1980. The determinants of executive salaries: An econometric survey.Review of Economics and Statistics, 62, 7-13.
Daily, C. M., & Dollinger, M. J., 1992. An Empirical Examination of Ownership Structure inFamily and Professionally Managed Firms. Family Business Review, 5 (2): 117-136.
Daily, C. M. & Dollinger, M. J., 1993. Alternative Methodologies for Identifying Family-VersusNon-family-Managed Businesses. Journal of Small Business Management, 31 (2): 79-90.
David, P., Hitt, M.A., & Gimeno, J. 2001. The Influence of Activism by Institutional Investors onR&D. Academy of Management Journal, 44: 144-158.
David, P., Kochhar, R, & Levitas, E., 1998. The Effects of Institutional Investors on the Level andMix of CEO Compensation. Academy of Management Journal, 41 (2): 200-208.

23
Davis, G.F., & Thompson, T.A. 1994. A Social Movement Perspective on Corporate Control.Administrative Science Quarterly, 39: 141-173.
Duysters, G., & Hagedoorn, J. (2000). Core competence and company performance in the world-wide computer industry. Journal of High Technology Management Research, 11(1), 75-92.
Firebaugh, G., & Gibbs, J.P. 1985. User’s guide to ratio variables. American Sociological Review,50, 713-722.
Galve-Górriz, C. & Salas-Fumás, V., 1996. Ownership Structure and Firm Performance: SomeEmpirical Evidence from Spain. Managerial and Decision Economics, 17: 575-586.
Gómez-Mejía, L. R. & Wiseman, R. M., 1997. Reframing Executive Compensation: AnAssessment and Outlook. Journal of Management, 23(3): 291-374.
Gomez-Mejia, L. R., Nuñez-Nickel, M., & Gutierrez, I., 2001. The Role of Family Ties in AgencyContracts. Academy of Management Journal, 44: 81-96.
Gopalakrishman, S. (2000). Unraveling the links between dimensions of innovation andorganizational performance. Journal of High Technology Management Research, 11(1), 137-152.
Gray, S. R. & Cannella, Jr. A. A., 1997. The Role of Risk in Executive Compensation. Journal ofManagement, 23(4): 517-540.
Hansen, G.S., & Hill, C.W.L. 1991. Are Institutional Investors Myopic? A Time-Series Study ofFour Technology-Driven Industries. Strategy Management Journal, 12: 1-16.
Henderson, A.D., & Fredrikson, J.W. 2001. Top Management Team Coordination Needs and theCEO Pay Gap: A Competitive Test of Economic and Behavioral Views. Academy of ManagementJournal, 44: 96-118.
James, H. S. Jr., 1999. Owner as Manager, Extended Horizons and the Family Firm. InternationalJournal of the Economics of Business, 6 (1): 41-55.
Kets de Vries, M. F. R., 1993. The Dynamics of Family Controlled Firms: The Good and the BadNews. Organizational Dynamics, 21 (3): 59-71.
LaPorta, R., Lopez-De-Salanes, F., & Shleifer, A. 1999. Corporate ownership around the world.Journal of Finance, 54(April): 471-517.
Laverty, K.J. 1996. Economic “Short-Termism”: The Debate, the Unresolved Issues, and theImplications for Management Practice and Research. Academy of Management Review, 21: 825-860.
Milkovich, G.T., Gerhart, B., & Hannon, J. 1991. The effects of research and development intensityon managerial compensation in large organizations. Journal of High Technology ManagementResearch, 2(1): 133-145.

24
Miller, J.S., Wiseman, R.M., & Gomez-Mejia, L.R. in press. The fit between CEI compensationdesign and firm risk. Academy of Management Journal.
Murphy, K.J. 2000. Performance standards in incentive contracts. Journal of Accounting andFinance, 30(3), 245-278.
Oster, S.M. 1999. Modern Competitive Analysis. New York: Oxford University Press.
Schroeder, D. 2001. Membership and Mission Concerns of the Board. Corporate Governance, 1:15-26.
Schulze, W., Lubalkin, M.H., Dino, R.N., & Buchholtz, A.K. 2001. Agency relationships in familyfimrs. Organization Science, 12(2), 99-116.
Silva, P. 1999. Managerial discretion, compensation strategy, and firm performance: The case forthe ownership structure. Research in Personnel and Human Resources Management, 17: 162-208.
Smith, B.F. & Amoako-Adu, B.,1999. Management succession and financial performance of familycontrolled firms. Journal of Corporate Finance, 5: 341-368.
Stulz, R.M. 1988. On takeover resistance, managerial discretion, and shareholder wealth. Journal ofFinancial Economics, 20, 25-54.
Tosi, H. L. & Gómez-Mejía, L. R., 1989. The Decoupling of CEO Pay and Performance: AnAgency Theory Perspective. Administrative Science Quarterly,34: 169-189.
Tosi, H. L. & Gómez-Mejía, L. R. 1994. CEO monitoring and firm performance. Academy ofManagement Journal, 37(4): 1002-1016.
Tosi, H.L., Gomez-Mejia, L.R., Loughry, M.L., Werner, S., Banning, K., Katz, J., Harris, R. &
Tosi, H.L., Werner, S., Katz, J.P., & Gomez-Mejia, L.R., 2000. The determinants of CEOcompensation: A Meta-analysis of firm size and performance. Journal of Management, 26(2): 301-339.
Vancil, R.F., 1987. A Look at CEO Succession. Harvard Business Review, 65(2): 107-117.
Zeitlin, M., 1974. Corporate ownership control: The large corporation and the capitalist class.American Journal of Socilogy, 79:1073-1119.
25
TABLE 1Correlation Matrix (N = 253)
ID Variable Name Mean Std. Dev. 1 2 3 4 5 6 7 8 9 10 11 12
1 Sales (millions)a 675.46 1900.01 1.002 Return On Assetsb 0.06 24.09 .35*** 1.003 Excess Returns -0.01 0.04 -.03 .05 1.004 Industry 0.44 0.50 .00 .06 .12 1.005 Firm Age 29.50 28.34 .40*** .17** .06 .30*** 1.006 International Diver. 0.30 0.46 .30*** -.01 -.09 .17** .17** 1.007 CEO Board Chair 0.56 0.50 .00 -.03 .04 .13* -.07 .13* 1.008 CEO Founder 0.23 0.42 -.16** -.01 -.05 -.18** -.27*** -.01 .22** 1.009 CEO Tenure 10.54 9.51 -.08 .14* .02 .07 .03 -.05 .31*** .19** 1.0010 Family In Board 0.32 0.12 -.31*** .07 .05 .04 -.12 -.14* -.02 .16* .14* 1.0011 % Family Owners. 18.07 18.44 .02 -.01 -.03 -.01 .10 -.04 -.27*** -.15* -.29*** .16* 1.0012 % Institutional Owners. 17.22 15.15 .10 -.04 -.11 -.16* .06 .04 -.06 -.04 -.15 -.20* -.11 1.0013 % CEO Owners. 13.81 15.30 -.20*** .07 .09 .01 -.15* -.04 .39*** .28*** .29*** .25*** -.25*** -.18*14 CEO Comp. Comm. 0.09 0.28 -.11 -.03 -.04 .03 -.04 -.05 .07 .14* .14* .20** -.01 .0015 Family Comp. Comm. 0.30 0.46 -.01 .03 -.06 -.04 .08 -.04 -.22*** -.10 -.11 .16* .26*** -.0116 Family CEO 0.58 0.49 -.22*** -.03 -.05 -.06 -.20** -.04 .32*** .27*** .39*** .25*** -.44*** -.0617 Systematic Risk 6.44E-05 7.16E-05 .48*** .19** .00 -.05 .28*** .14* -.05 -.13* .06 -.25*** -.01 .0718 Unsystematic Risk 0.04 0.15 -.16* -.15* .69*** .00 .01 -.08 .03 .01 -.06 .11 .02 -.0319 R & D (millions)c 7.21 19.99 .37*** .27** -.02 -.01 .20* .28** -.01 .11 .10 -.04 -.04 -.1120 Total Compensationd 941953.9 1600556 .48*** .11 .04 -.06 .16* .19** -.05 -.07 -.08 -.17** -.03 .1421 Salary 337796.6 251659.7 .65*** .16* -.03 -.09 .19** .26*** .04 -.04 -.01 -.16* -.02 .19*
a The logarithm of annual dollar sales is used in all analyses, a standard practice in the executive compensation literature.b The median for ROA is 3.6%. Excluding two outliers with high negative ROA values results in average ROA of 1.79%, SD of 14.1. As this made no differencein regression results, all firms were used in subsequent analysis.c The ratio of R&D expenditures divided by the logarithm of annual dollar sales is used in all analyses as an indicator or R&D intensity, a standard practice in theexecutive compensation literature.d Total compensation is the sum of salary, bonus, long -term income, and “other” compensation (which would include fringe benefits and perks).

26
22 Bonus 213513.0 455125.0 .41*** .12* .05 .01 .13* .12 -.04 -.04 .00 -.12 -.05 .1423 Long Term Income (LTI) 325470.3 1113301 .34*** .06 .05 -.06 .09 .16* -.07 -.07 -.11 -.14* -.01 .0524 Salary / Total Comp. 0.59 0.25 -.49*** -.13* -.03 -.02 -.20** -.10 .07 .13* .16** .21*** .00 -.1525 Bonus / Total Comp. 0.17 0.16 .34*** .17** .02 .13* .16* .07 .03 .00 .06 -.06 -.07 .0726 LTI / Total Comp. 0.17 0.22 .32*** -.01 .03 -.05 .06 .10 -.13* -.14* -.32*** -.21*** .02 .10

24
TABLE 1 (cont.)Correlation Matrix (N = 253)
ID Variable Name 13 14 15 16 17 18 19 20 21 22 23 24 25 26
13 % CEO Owners. 1.00
14 CEO Comp. Comm. .11 1.00
15 Family Comp Comm. -.16** .15* 1.00
16 Family CEO .52** .14* -.26*** 1.00
17 Systematic Risk -.15* -.05 .01 -.09 1.00
18 Unsystematic Risk .13* -.01 .03 .02 -.16* 1.00
19 R & D -.07 .04 -.01 -.08 .23* -.11 1.00
20 Total Compensation -.16* -.06 -.06 -.20** .37*** -.07 .22* 1.00
21 Salary -.10 -.05 -.04 -.11 .38*** -.10 .28*** .70*** 1.00
22 Bonus -.08 -.03 -.06 -.11 .29*** -.07 .24** .71*** .60*** 1.00
23 Long Term Income (LTI) -.17** -.07 -.03 -.19** .30*** -.05 .17 .90*** .49*** .37*** 1.00
24 Salary / Total Comp. .23*** .12 -.03 .28*** -.31*** .11 -.25** -.57*** -.39*** -.50*** -.45*** 1.00
25 Bonus / Total Comp. .02 -.06 .00 -.03 .22*** -.10 .21* .21*** .33*** .57*** -.03 -.47*** 1.00
26 LTI / Total Comp. -.32*** -.14* .01 -.31*** .19** -.03 .15 .47*** .21*** .14* .56*** -.70*** -.15* 1.00
* P < .05** P < .01***P < .001

25
TABLE 2PREDICTORS OF CEO PAY LEVEL AND PAY MIX
Salary Bonus LTIMain Effects Total Pay Amount % Mix Amount % Mix Amount % Mix
1 Sales .37** .44** -.59*** .48*** .50** .19 .33+
2 Return on Assets -.12 -.05 .10 -.12 .01 -.11 -.18 3 Excess Returns .06 .08 .03 .11 .06 .03 .02 4 Industry -.10 -.20+ -.08 .04 .11 -.09 .05 5 Firm Age -.24* -.19* .04 -.21+ -.04 -.19 -.03 6 International Diversification -.06 -.04 -.08 .18 .15 -.14 -.04 7 CEO Board Chair -.07 .08 .06 -.11 -.12 -.08 .01 8 CEO Founder -.01 -.18 -.09 -.20 .02 .09 .06 9 CEO Tenure .15 .35** .22 .28* -.12 .02 -.1610 Family in Board .05 -.02 -.00 -.01 -.11 .05 .0711 % Family Ownership .01 .04 .06 -.01 -.22 -.01 .0512 Institutional Ownership -.05 .14 .14 .06 .04 -.10 -.1513 % CEO Ownership .01 .01 .01 .02 .09 .01 -.0514 CEO Com. Committee -.04 .06 .10 .07 .08 -.09 -.2415 Family Comp. Committee -.06 -.08 -.11 .03 .16 -.07 .0316 Family CEO -.25+ -.15 .19 -.16 -.03 -.22+ -.1317 Systematic Risk .37** .20* -.08 .12 -.16 .38* .2018 Unsystematic Risk -.03 -.00 -.02 -.03 -.09 -.03 .0819 Research & Development .22+ .13 -.06 .03 -.00 .23+ .07
Adj. R2 .33*** .43*** .28*** .31*** .03 .08 .02Interaction with CEOFamilySystematic Risk (17*16) .69*** .25 -.27 -.10 -.38 .81*** .52*Unsystematic Risk (18*16) .32 .10 -.23 -.33 -.45 .41 .20R&D (14*16) -.93*** -.18 .47* -.15 .38 -.46*** -.90***% Inst. Ownership (12*16) -.19 .23 .14 .15 .45+ -.36* -.58**% Family Ownership (11*16) -.21* -.32** .27+ -.26+ -.36* .10 -.05∆ Adj. R2 .39*** .05* .05* .00 .08* .53*** .17**
+P < .10*P < .05
**P < .01 ***P < .001
Standardized regression coefficients are shown in the table