How do firms adjust director compensation?
12
Finance Department Finance Department Faculty Publications University of Nebraska - Lincoln Year How do firms adjust director compensation? Kathleen A. Farrell * Geoffrey C. Friesen † Philip L. Hersch ‡ * University of Nebraska Lincoln, [email protected] † University of Nebraska-Lincoln, [email protected] ‡ Wichita State University, [email protected] This paper is posted at DigitalCommons@University of Nebraska - Lincoln. http://digitalcommons.unl.edu/financefacpub/16
-
Upload
independent -
Category
Documents
-
view
1 -
download
0
Transcript of How do firms adjust director compensation?
Finance Department
Finance Department Faculty Publications
University of Nebraska - Lincoln Year
How do firms adjust director
compensation?
Kathleen A. Farrell∗ Geoffrey C. Friesen†
Philip L. Hersch‡
∗University of Nebraska Lincoln, [email protected]†University of Nebraska-Lincoln, [email protected]‡Wichita State University, [email protected]
This paper is posted at DigitalCommons@University of Nebraska - Lincoln.
http://digitalcommons.unl.edu/financefacpub/16
153
Published in Journal of Corporate Finance 14 (2008), pp. 153-162; doi: 10.1016/j.jcorpfin.2008.02.004 ; and pp. 753–754; doi: 10.1016/j.jcorpfin.2008.09.013. Copyright © 2008 Elsevier B.V. Used by permission. http://www.elsevier.com/locate/corpfin
The first publication of this article in JCF omitted Tables 3 & 4 and contained errors in the paragraph following Equation (1) in section 3.2. These were addressed in an Erratum published in December 2008. The complete article in corrected form is presented here.
Submitted September 20, 2007; revised February 25, 2008; accepted February 25, 2008; published online March 4, 2008
How do firms adjust director compensation?
Kathleen A. Farrell Department of Finance, University of Nebraska–Lincoln, Lincoln, NE 68588-0490, USA 1,2
Corresponding author — tel 402 472-3005, fax 402 472-5140, email [email protected]
Geoffrey C. FriesenDepartment of Finance, University of Nebraska–Lincoln, Lincoln, NE 68588-0490, USA
tel 402 472-2330, fax 402 472-5140, email [email protected]
Philip L. HerschDepartment of Economics, Barton School of Business, Wichita State University, Wichita, KS 67260-0078, USA
tel 316 978-7096, fax 316 978-3308, email [email protected]
Abstract This paper examines outside director compensation for a sample of 237 Fortune 500 firms over the 1998-2004 period. We docu-ment a trend towards fixed-value equity compensation and away from cash only and fixed-number equity compensation. Ad-justments to director compensation are consistent with firms targeting a market level of compensation, and firms that deviate from their market wage symmetrically adjust compensation back toward the market level. We also document the relation be-tween changes in compensation and changes in equity values, and find that upward adjustments begin sooner than downward adjustments. When equity values rise, we find virtually no immediate offset to director compensation. However, when equity values fall, fixed-number equity compensation is adjusted in the same period (by awarding more shares or options) to offset the loss of income by almost one-third. Thus, the magnitude of adjustments towards the market wage level is symmetric, but the timing is not.
Keywords: board of directors, board compensation, director compensation, contracting
1. Introduction
Unlike CEO compensation, outside (non-employee) director compensation is designed for a group of individuals. Depend-ing on the firm, outside directors may receive an annual retainer, meeting fees, committee fees, and equity awards.3 Any differ-ences that may exist in compensation across individual outside directors for a given firm in a given year typically result from serving on different committees, serving as chair of a committee, serving as lead director, or differences in meeting attendance. Director compensation is not designed based on the unique characteristics that a particular director brings to the board.
Another important feature of director compensation is that equity compensation may be awarded either as fixed-value grants or fixed-number grants (e.g., Hall, 1999; O’Byrne, 1995). If the equity award is fixed-value, it is set at an explicit dollar amount (e.g., 50% of the annual $50,000 retainer is awarded as stock), then the specific dollar level of compensation is divided by share or option price to determine the number of shares or options granted in a given year.4 Fixed-number grants give the director the
1. We would like to thank Stoyu Ivanov and Rashiqa Kamal for their research assistance. We appreciate the helpful comments and sugges-tions of an anonymous referee for Journal of Corporate Finance, and Gennaro Bemile and seminar participants at the University of Nebraska–Lincoln and the 2007 Financial Management Association meetings. We are responsible for all errors in the manuscript.
2. Kathleen Farrell acknowledges receiving support from the 2005 Hicks Foundation Summer Research Grant and 2005 Layman Grant. 3. Inside directors are not compensated for their service on the board. 4. The plan may further award the equity at a discount from face value such as 85% of fair market value. The specifics of director compensation
plans are outlined in the director compensation plan document but may not be outlined in the proxy statement.
154 Far r e ll, Fr i es e n, & He r s cH i n Jou r na l of Cor p or a te fi n a nC e 14 (2008)
same number of options (or shares) each year. The firm’s choice of fixed value versus fixed number is important, since the latter allows compensation to fluctuate with stock or option prices without any explicit action or change to the compensation contract.
Much of the existing empirical research on director compensation has focused on determinants of director compensation (e.g., Bryan et al., 2000; Brick et al., 2006), the relation between the firm’s investment opportunities and director compensation (e.g., Linn and Park, 2005), firm responses to changes in the regulatory environment (e.g., Ryan and Wiggins, 2004; Linck et al., 2006; Becher et al., 2005), and the market reaction to the adoption of equity-based director incentive plans (e.g., Vafeas, 1999; Gerety et al., 2001; Fich and Shivdasani, 2005). Despite the expanding literature regarding director compensation, few have fo-cused on analyzing the design and structure of outside director compensation (notable exceptions include Yermack, 2004; Ad-ams and Ferreira, 2004).
The purpose of this paper is to document recent changes and trends in the design and structure of outside director compen-sation, and to analyze how firms adjust director compensation on an annual basis. We first identify the individual components of director compensation and document changes in these components through time. Our sample consists of compensation data for 237 Fortune 500 firms during the sample period 1998 to 2004. We find that total compensation rises nearly 45% over the seven-year sample period compared to roughly a 16% increase in the consumer price index. In addition, both the use and structure of equity compensation changes substantially over the sample period. Specifically, we document an increase in the relative use of fixed-value equity versus fixed-number equity awards.
Next, we examine changes in director compensation over time and assess whether firm behavior is consistent with firms targeting a market level of director compensation. The underlying premise of our analysis is that firms seek to maximize share-holder value, and optimal director compensation is one aspect of this process. We also assume that a value-maximizing equi-librium will produce cross-sectional variation in director compensation related to variation in firm characteristics. We begin by modeling the market level of director compensation for a given firm as a function of firm characteristics the board may con-sider when determining director compensation.
Using these predicted values as a proxy for the firm’s target market compensation, we examine changes in director com-pensation as they relate to deviations from the predicted market level of compensation. We first analyze whether adjustments to compensation depend on whether the firm is above or below its market level of compensation. We find no such asymmetry. Our results indicate that for every $1000 deviation from the target level of compensation, total compensation is adjusted down-ward or upward by $259, on average, depending on whether the firm is above or below the target, respectively. This finding is consistent with firms behaving as if they gauge a market wage and adjust compensation relative to that wage. However, the adjustment process appears to take the average firm at least 4 years to completely adjust to market.
Next we analyze how firms respond to changes in director compensation that result from changes in equity value. For firms already at their market level of compensation, abnormal equity returns may drive compensation away from the target (if the firm uses fixed-number equity grants), and we examine how firms respond to such deviations. We find an asymmetric re-lation between changes in director compensation and changes in equity value, and that the asymmetry is driven by changes in fixed-number compensation. Specifically, when the market value of the fixed-number equity component of compensation is increasing, total director compensation increases virtually dollar for dollar. In other words, if equity values are rising, there is virtually no immediate offset to compensation in the form of fewer shares or options awarded or reduced cash payments. If eq-uity values are falling, however, fixed-number equity compensation is simultaneously adjusted (by awarding more shares or options) to offset the loss of income by almost one-third.
We also find that firms are increasingly likely to integrate fixed-value equity grants into director compensation plans over our sample period. Relative to fixed-number compensation, fixed-value compensation increases transparency by explicitly separat-ing the wealth and income effects associated with equity compensation: it awards equity to link director utility to changes in firm value, yet the value of the annual equity award does not fluctuate with changes in the equity value. Thus director wealth is sen-sitive to changes in firm value, but director income is not. We speculate that the continuation of this trend will likely weaken the asymmetry documented in our empirical results if firms also begin eliminating the use of fixed-number equity awards.
The remainder of the paper proceeds as follows. In Section 2, we discuss the sample selection and the associated descrip-tive statistics. In Section 3, we develop the empirical methodology for predicting the target market level of director compensa-tion and analyzing changes in director compensation. Section 4 presents our conclusions.
2. Sample selection and descriptive statistics
2.1. Sample construction
We first identify firms that appear on ExecuComp for a minimum of four fiscal years between 1998 and 2004. We begin with 1998 because Ryan and Wiggins (2004) note that in 1996 the Securities and Exchange Commission liberalized Rule 16b-3. The rule change eliminated the requirement of obtaining shareholder approval of director compensation plans and formula grants giving firms more discretion to grant stock and options to top executives and directors. By beginning our sample period in 1998, we eliminate the possibility of capturing a structural shift in the design of director compensation that is driven by regu-lation. We also extend our sample beyond 2003 which includes the passage of Sarbanes-Oxley (SOX). Although the passage of SOX likely impacts the level of director compensation, it does not explicitly relate to the design of director compensation.
Following Hermalin and Weisbach (1988), and Fich and Shivdasani (2005), we restrict our analysis primarily to non-regu-lated industries since boards of directors for regulated firms may be systematically different from boards of directors of non-
Ho w d o F i r ms ad j us t d i r e c to r c o mp e n s ati o n? 155
regulated firms (e.g., Baysinger and Zardkoohi. 1986; Subrahmanyam et al., 1997). We eliminate all financial institutions, in-surance companies, and real estate firms defined as SIC codes 6000-6799, and all electric, gas, and sanitary services (utilities) defined within the 4900 SIC codes.
2.2. Data and definitions for director compensation
We further restrict our sample to Fortune 500 firms (based on the Fortune list as of 2000) due to the cost associated with hand collecting data from proxy statements. We use the proxy statements to identify firms that issue fixed-value and fixed-number equity compensation since this is not available in ExecuComp. From ExecuComp we collect data on annual retainer, board meeting fees, shares of stock granted, and stock options granted. We also modify the ExecuComp data for inconsisten-cies with proxy statements.5 For firms that have directors elected on staggered terms and award equity grants upon election to the board, we annualize the one-time equity grants over the length of the director’s term, which is typically 3 years.
For fixed-value stock and option grants, the explicit values for the awards are reported in the proxy statements. As noted by Yermack (2004), most company disclosures in proxy statements for equity pay are much briefer for directors than for execu-tives. As a result, the basic terms of these awards such as the date, the stock price when awarded, vesting requirements, or re-strictions on sale are not reported in the proxy.6 Therefore, to obtain a value for fixed-number option grants, we follow Becher et al. (2005) and Brick et al. (2006). We use the Black-Scholes value adjusted for dividends for CEO grants relying on Execu-Comp data and then determine the per grant value for the year.7 Based on the per grant value, we multiply by the number of grants awarded to directors to arrive at the total option value.8 For similar reasons, we value fixed-number stock grants by multiplying the number of shares awarded times the market price of a share at fiscal year end preceding the proxy date.9
We construct director compensation in a given year to reflect compensation for a representative director serving on a board. Cash compensation consists of any cash retainer, plus board and committee meeting fees. Because we focus on compensation structure, we impute a fixed value for number of board and committee meetings for each firm in the sample.
Specifically, we calculate the mean number of board meetings for each firm over the applicable sample period for the firm. For committee meetings, we obtain data regarding the fee per committee meeting and/or the committee retainer from the proxy statements. We calculate the committee fees by summing the committee retainer, if one is paid, plus the product of the meeting fee times the firm’s average number of board meetings over the sample period.10
Effectively, we calculate the cash compensation paid to a representative director of a given firm in our sample who serves on one committee, holding constant the number of board and committee meetings for a given firm. This allows us to capture changes in the total fees paid across firms and across years while eliminating differences in director compensation that arise simply due to the number of committee or board meetings varying over time for an individual firm. Our approach eliminates the problem of capturing changes in board size or composition (inside versus outside directors) that would result if we mea-sured total director compensation expense for the firm from year to year.
Total director compensation is the sum of the annual retainer, standardized meeting fees, and stock and option grants for a representative director. Equity compensation is the sum of fixed-value and fixed-number stock and option grants. The sum of cash and fixed-value equity is fixed-value compensation. To a large extent, fixed-value compensation is a component of a di-rector’s retainer, with the retainer awarded as cash plus a dollar amount of equity compensation (e.g., the retainer is split 50-50 between cash and equity). The primary exceptions occur when options are awarded in explicit dollar amounts.
The ExecuComp and proxy data is merged with Compustat to provide additional firm level data to complement the direc-tor compensation data. To provide a sufficient time series to analyze changes in director compensation, we require a complete set of data for a given firm for a minimum of 4 years during our sample period. Although this restriction imposes a survivor-ship bias on the sample, it is necessary to capture variation in the dependent variable.
5. Inconsistencies with proxy statements were primarily found for firms that award fixed-value equity. ExecuComp imputed the number of stock or option grants awarded and the option values differed substantially from our own estimates. Approximately 5% of the firm-year ob-servations for fixed-value options were incorrectly reported in ExecuComp relative to the proxy statements. Approximately 20% of the firm-year observations included estimates for fixed-value stock grants. As a result, we captured the actual value of the equity awarded instead of trying to impute the number of options or shares awarded. Approximately 46% of the firms in the sample use fixed-value compensation (see Table 1). In general. ExecuComp under-reported fixed-value equity awards. Thus, previous studies utilizing ExecuComp data will tend to under-report the level of director compensation for firms that utilize fixed-value equity compensation.
6. The SEC adopted new disclosure requirements for executive and director compensation and security ownership for officers and directors on July 26, 2006. Firms will be required to adopt the new disclosure requirements for fiscal years ending after December 15, 2006. See Wood and Ellis (2007) for a discussion of the disclosure changes.
7. One potential limitation to using CEO option values is the possibility that the CEO option values are impacted by backdating as described in Heron and Lie (2007). However. Bebchuk et al. (2006) also find evidence of opportunistic timing of director option grants (over 9% of their sample observations were grants falling on days where the stock price was at a monthly low).
8. If the CEO was not awarded options in a year in which directors are awarded options, we analyze grants made to any of the top five execu-tives and arrive at an average of the per grant value for the top five executives.
9. Perry (1999) uses the preceding fiscal year end price and Yermack (2004) assumes that stock is awarded when the average price equals the average price for the year, computed from the twelve monthly closing stock prices. Less than 20% of our sample observations include fixed-number stock grants.
10. In some firms, committee fees are higher for serving on committees such as audit or compensation. We ignore these additional committee fees. Some firms do not pay committee meeting fees but may pay a retainer for serving on a committee. We include committee retainers but assume that each board member served on only one committee. Also, we exclude any additional fees paid to committee chairs. We use the average number of board meetings to determine the number of committee meetings because most committees (with the exception of the au-dit committee) meet before board meetings.
156 Far r e ll, Fr i es e n, & He r s cH i n Jou r na l of Cor p or a te fi n a nC e 14 (2008)
2.3. Descriptive statistics for director compensation variables
The design of director compensation (particularly the form in which equity is granted) influences how director compensation may change over time. For example, even if boards do not explicitly change compensation design, the value of fixed-number eq-uity awards automatically fluctuates with firm value, thus allowing the level of director compensation to change over time with-out explicit board action. Effectively, higher (lower) share prices result in passive increases (decreases) in board compensation.
To illustrate, Champion Enterprises paid no cash retainer during the period 1998 to 2002, but paid directors with 4800 shares of stock. The value of the annual stock awards, however, fluctuated between $131,000 in 1998 to $13,680 in 2002 due to changes in the stock price. In 2003, Champion began paying a cash retainer of $30,000 and raised the number of shares of stock awarded to 5000 (which had a market value of $35,000). In 2004, the retainer remained constant but number of shares awarded was increased again to 7000, raising equity compensation to $82,740. Thus, Champion began the sample period paying only fixed-number equity compensation and then explicitly modified the compensation plan to include both cash and fixed-number equity compensation.
Champion Enterprises’ decision to increase the retainer and increase the number of shares awarded represented an explicit action by the board; the fluctuation in the value of the fixed-number equity compensation during the period 1998 to 2002 repre-sented passive swings in compensation that result from changes in stock price. To change the value of fixed-value equity awards requires an explicit action by the board. In contrast, fixed-number equity awards change value every time the equity values change. Thus, our empirical analysis below distinguishes between passive changes in compensation that result from fluctuations in the firm’s stock or option price, and explicit changes that result from board actions that modify the compensation contract.
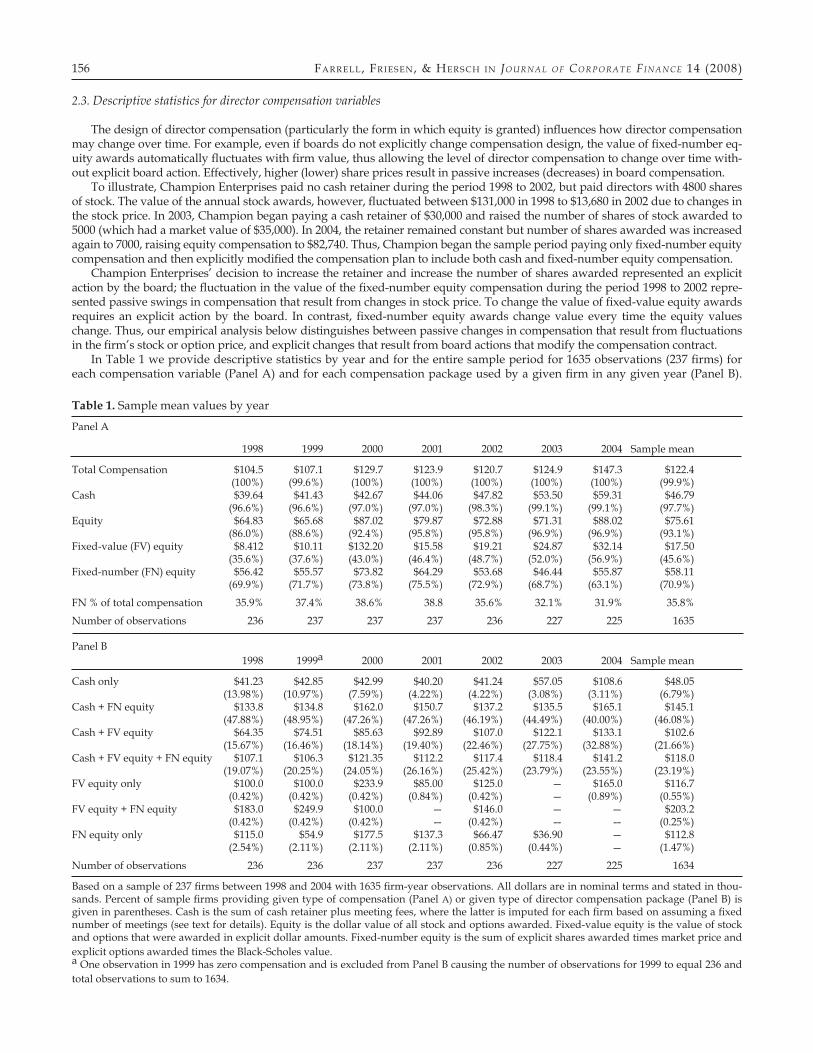
In Table 1 we provide descriptive statistics by year and for the entire sample period for 1635 observations (237 firms) for each compensation variable (Panel A) and for each compensation package used by a given firm in any given year (Panel B).
Table 1. Sample mean values by year
Panel A
1998 1999 2000 2001 2002 2003 2004 Sample mean
Total Compensation $104.5 $107.1 $129.7 $123.9 $120.7 $124.9 $147.3 $122.4 (100%) (99.6%) (100%) (100%) (100%) (100%) (100%) (99.9%)Cash $39.64 $41.43 $42.67 $44.06 $47.82 $53.50 $59.31 $46.79 (96.6%) (96.6%) (97.0%) (97.0%) (98.3%) (99.1%) (99.1%) (97.7%)Equity $64.83 $65.68 $87.02 $79.87 $72.88 $71.31 $88.02 $75.61 (86.0%) (88.6%) (92.4%) (95.8%) (95.8%) (96.9%) (96.9%) (93.1%)Fixed-value (FV) equity $8.412 $10.11 $132.20 $15.58 $19.21 $24.87 $32.14 $17.50 (35.6%) (37.6%) (43.0%) (46.4%) (48.7%) (52.0%) (56.9%) (45.6%)Fixed-number (FN) equity $56.42 $55.57 $73.82 $64.29 $53.68 $46.44 $55.87 $58.11 (69.9%) (71.7%) (73.8%) (75.5%) (72.9%) (68.7%) (63.1%) (70.9%)
FN % of total compensation 35.9% 37.4% 38.6% 38.8 35.6% 32.1% 31.9% 35.8%
Number of observations 236 237 237 237 236 227 225 1635 Panel B 1998 1999a 2000 2001 2002 2003 2004 Sample mean
Cash only $41.23 $42.85 $42.99 $40.20 $41.24 $57.05 $108.6 $48.05 (13.98%) (10.97%) (7.59%) (4.22%) (4.22%) (3.08%) (3.11%) (6.79%)Cash + FN equity $133.8 $134.8 $162.0 $150.7 $137.2 $135.5 $165.1 $145.1 (47.88%) (48.95%) (47.26%) (47.26%) (46.19%) (44.49%) (40.00%) (46.08%)Cash + FV equity $64.35 $74.51 $85.63 $92.89 $107.0 $122.1 $133.1 $102.6 (15.67%) (16.46%) (18.14%) (19.40%) (22.46%) (27.75%) (32.88%) (21.66%)Cash + FV equity + FN equity $107.1 $106.3 $121.35 $112.2 $117.4 $118.4 $141.2 $118.0 (19.07%) (20.25%) (24.05%) (26.16%) (25.42%) (23.79%) (23.55%) (23.19%)FV equity only $100.0 $100.0 $233.9 $85.00 $125.0 — $165.0 $116.7 (0.42%) (0.42%) (0.42%) (0.84%) (0.42%) — (0.89%) (0.55%)FV equity + FN equity $183.0 $249.9 $100.0 — $146.0 — — $203.2 (0.42%) (0.42%) (0.42%) — (0.42%) — — (0.25%)FN equity only $115.0 $54.9 $177.5 $137.3 $66.47 $36.90 — $112.8 (2.54%) (2.11%) (2.11%) (2.11%) (0.85%) (0.44%) — (1.47%)
Number of observations 236 236 237 237 236 227 225 1634
Based on a sample of 237 firms between 1998 and 2004 with 1635 firm-year observations. All dollars are in nominal terms and stated in thou-sands. Percent of sample firms providing given type of compensation (Panel A) or given type of director compensation package (Panel B) is given in parentheses. Cash is the sum of cash retainer plus meeting fees, where the latter is imputed for each firm based on assuming a fixed number of meetings (see text for details). Equity is the dollar value of all stock and options awarded. Fixed-value equity is the value of stock and options that were awarded in explicit dollar amounts. Fixed-number equity is the sum of explicit shares awarded times market price and explicit options awarded times the Black-Scholes value. a One observation in 1999 has zero compensation and is excluded from Panel B causing the number of observations for 1999 to equal 236 and total observations to sum to 1634.
Ho w d o F i r ms ad j us t d i r e c to r c o mp e n s ati o n? 157
Based on the last column of Panel A, average total board compensation for an average director over the entire sample period is $122,400 in nominal terms.11 Cash and equity compensation average $46,790 and $75,610, respectively. Although not reported in the table, the maximum cash compensation of $200,000 in our sample was paid by Electronic Data Systems Corporation in 2004. EDS paid an all-cash retainer with no other director compensation. In contrast, in 1998, Dell Computers awarded only options to directors, valued at $1,142,300 per director, representing the maximum value in the sample for total compensation and the equity and fixed-number equity categories.12
Analyzing the sample mean values by year in Panel A of Table 1, we document an increase from 35.6% in 1998 to 56.9% in 2004 in the percentage of sample firms that provide fixed-value equity compensation. The trend in the data of a greater reliance on fixed-value equity compensation is further illustrated by the dollar amounts increasing from $8,412 to $32,140. We docu-ment a sharp increase in total compensation in 2004, likely due to the implementation of Sarbanes-Oxley. This increase is con-sistent with evidence documented by Linck et al. (2006) who show median total director compensation for a sample of IRRC firms’ increases from $73,517 to $93,015 between 2003 and 2004. Overall, director compensation is trending upward over our sample period in all categories of compensation except fixed-number equity.
In Panel B of Table 1 we identify all of the various compensation packages that exist in our sample of firms. Our data sug-gest that firms are moving toward director compensation packages that include cash plus fixed-value equity compensation (rising from 15.7% in 1998 to 32.9% in 2004) and are moving away from the use of cash only (declining from 14% in 1998 to 3% in 2004). The most common types of compensation packages in 2004 include cash plus fixed-number equity (40%), cash plus fixed-value (33%), and cash plus fixed-value and fixed-number equity (24%). The trend towards fixed-value compensation sug-gests that the equity component of director compensation is becoming more transparent, since fixed-value compensation ex-plicitly separates the wealth and income effects associated with equity compensation. Over time, directors accumulate eq-uity that is sensitive to changes in equity value, yet the value of the annual fixed-value equity award does not fluctuate with changes in equity value. Although no form of compensation is more transparent than cash, we also document a movement away from both cash only and cash plus fixed-number compensation packages. This suggests that firms are balancing a move-ment towards greater transparency with a desire to maintain the incentives associated with equity compensation.
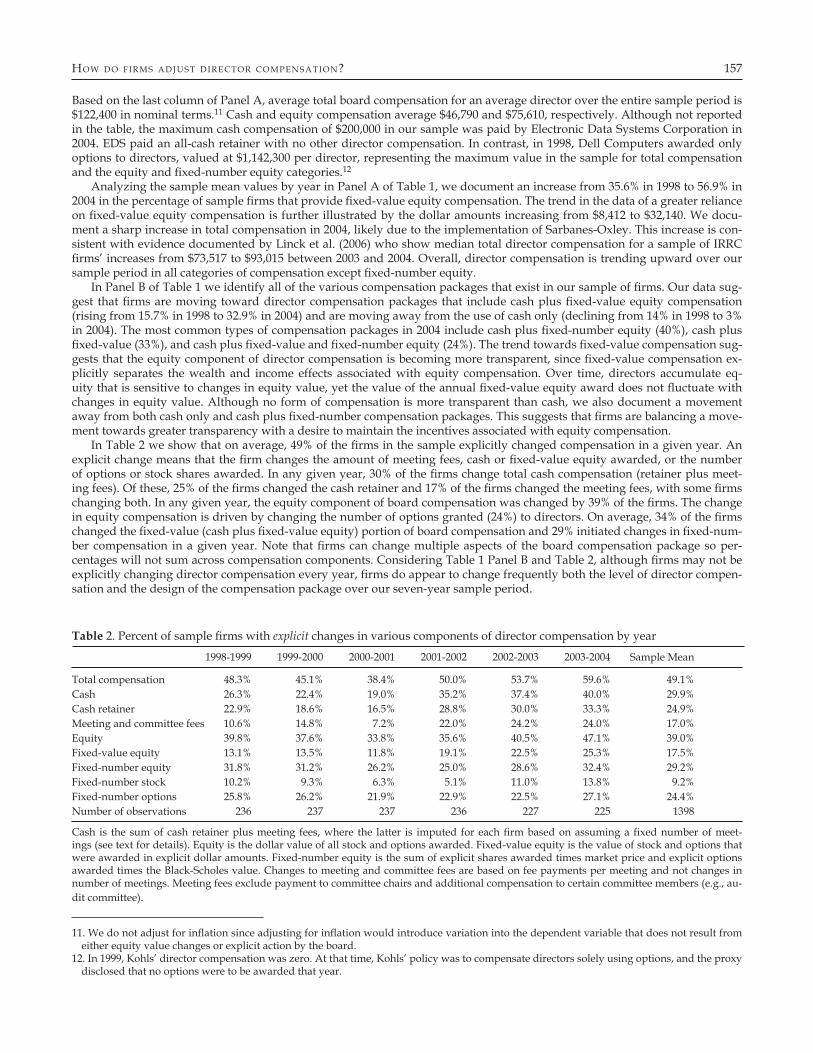
In Table 2 we show that on average, 49% of the firms in the sample explicitly changed compensation in a given year. An explicit change means that the firm changes the amount of meeting fees, cash or fixed-value equity awarded, or the number of options or stock shares awarded. In any given year, 30% of the firms change total cash compensation (retainer plus meet-ing fees). Of these, 25% of the firms changed the cash retainer and 17% of the firms changed the meeting fees, with some firms changing both. In any given year, the equity component of board compensation was changed by 39% of the firms. The change in equity compensation is driven by changing the number of options granted (24%) to directors. On average, 34% of the firms changed the fixed-value (cash plus fixed-value equity) portion of board compensation and 29% initiated changes in fixed-num-ber compensation in a given year. Note that firms can change multiple aspects of the board compensation package so per-centages will not sum across compensation components. Considering Table 1 Panel B and Table 2, although firms may not be explicitly changing director compensation every year, firms do appear to change frequently both the level of director compen-sation and the design of the compensation package over our seven-year sample period.
Table 2. Percent of sample firms with explicit changes in various components of director compensation by year
1998-1999 1999-2000 2000-2001 2001-2002 2002-2003 2003-2004 Sample Mean
Total compensation 48.3% 45.1% 38.4% 50.0% 53.7% 59.6% 49.1%Cash 26.3% 22.4% 19.0% 35.2% 37.4% 40.0% 29.9%Cash retainer 22.9% 18.6% 16.5% 28.8% 30.0% 33.3% 24.9%Meeting and committee fees 10.6% 14.8% 7.2% 22.0% 24.2% 24.0% 17.0%Equity 39.8% 37.6% 33.8% 35.6% 40.5% 47.1% 39.0%Fixed-value equity 13.1% 13.5% 11.8% 19.1% 22.5% 25.3% 17.5%Fixed-number equity 31.8% 31.2% 26.2% 25.0% 28.6% 32.4% 29.2%Fixed-number stock 10.2% 9.3% 6.3% 5.1% 11.0% 13.8% 9.2%Fixed-number options 25.8% 26.2% 21.9% 22.9% 22.5% 27.1% 24.4%Number of observations 236 237 237 236 227 225 1398
Cash is the sum of cash retainer plus meeting fees, where the latter is imputed for each firm based on assuming a fixed number of meet-ings (see text for details). Equity is the dollar value of all stock and options awarded. Fixed-value equity is the value of stock and options that were awarded in explicit dollar amounts. Fixed-number equity is the sum of explicit shares awarded times market price and explicit options awarded times the Black-Scholes value. Changes to meeting and committee fees are based on fee payments per meeting and not changes in number of meetings. Meeting fees exclude payment to committee chairs and additional compensation to certain committee members (e.g., au-dit committee).
11. We do not adjust for inflation since adjusting for inflation would introduce variation into the dependent variable that does not result from either equity value changes or explicit action by the board.
12. In 1999, Kohls’ director compensation was zero. At that time, Kohls’ policy was to compensate directors solely using options, and the proxy disclosed that no options were to be awarded that year.
158 Far r e ll, Fr i es e n, & He r s cH i n Jou r na l of Cor p or a te fi n a nC e 14 (2008)
3. Changes in director compensation
3.1. Predicting a firm’s market level of director compensation
In this section we examine changes in director compensation. We begin by considering whether firms behave as if they tar-get an equilibrium market wage in their determination of director compensation. To do so, we specify an empirical model that predicts the level of total director compensation for a representative director based on a number of firm characteristics that have been shown to be determinants of director compensation.13 The error term in the model captures the deviation in board compensation from the predicted market level of director compensation. We then test whether firms target market compensa-tion levels by relating changes in director compensation to deviations from the predicted value.
Since the first step is to specify a model that predicts the market level of director compensation for a given firm, we draw upon previous literature that analyzes the determinants of director compensation (e.g., Bryan et al., 2000; Ryan and Wiggins, 2004; Brick et al., 2006). Larger, more complex firms are more difficult to monitor. Thus, larger firms are likely to have higher levels of outside director compensation and more equity based compensation (e.g., Bryan et al., 2000; Ryan and Wiggins, 2004). Our proxy for firm size is sales revenue, and we use log of sales to minimize the effects of extreme values (e.g., Bizjak et al., 2007; Fich and Shivdasani, 2005).
Linn and Park (2005) find that the structure of director compensation depends on the growth opportunities of the firm. Di-rectors of firms with greater growth opportunities receive greater levels of total director compensation and derive a signifi-cantly greater proportion of compensation from incentive based compensation than low-growth firms. We control for growth opportunities defined as the market to book ratio and measured as the market value of equity plus total liabilities divided by total assets (e.g., Ryan and Wiggins, 2004; Bryan et al.. 2000; Linck et al.. 2006).
Since the agency costs of debt may influence compensation design (e.g., Bryan et al., 2000; Brick et al., 2006), we also control for leverage, defined as total debt to total assets. We control for firm performance using ROA defined as net income to total as-sets per ExecuComp (e.g., Becher et al., 2005).14 We also include one-digit SIC industry dummies to control for industry effects on director compensation.
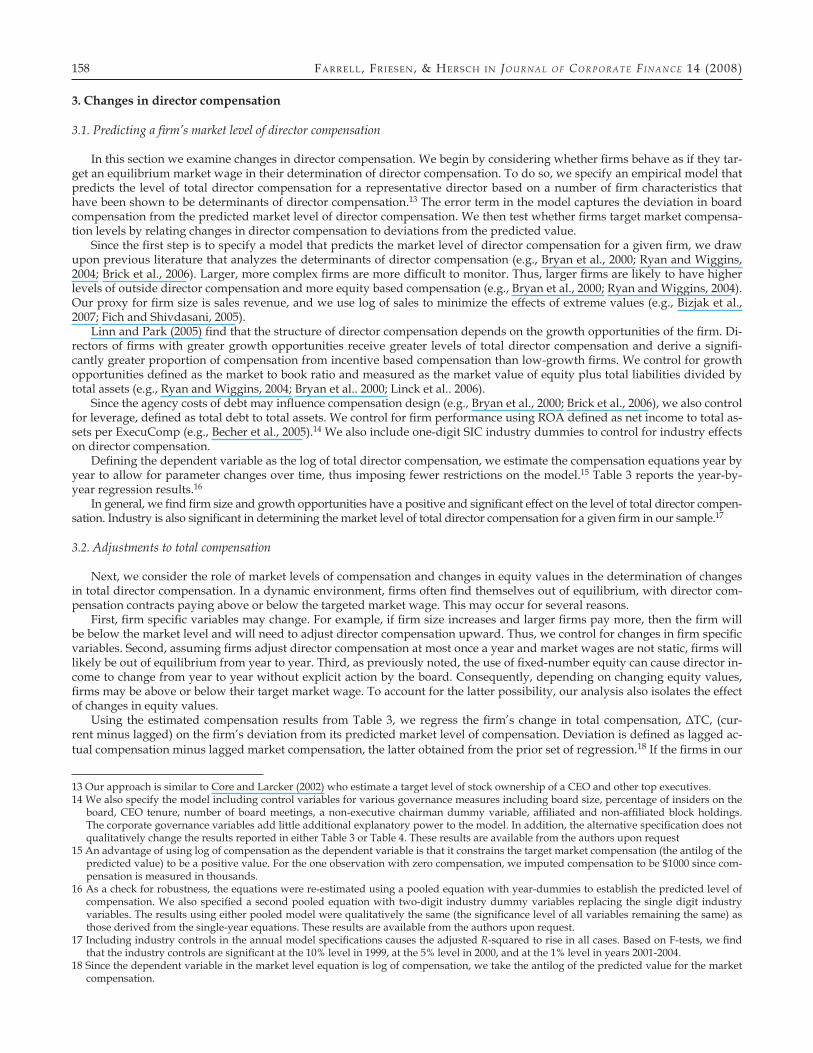
Defining the dependent variable as the log of total director compensation, we estimate the compensation equations year by year to allow for parameter changes over time, thus imposing fewer restrictions on the model.15 Table 3 reports the year-by-year regression results.16
In general, we find firm size and growth opportunities have a positive and significant effect on the level of total director compen-sation. Industry is also significant in determining the market level of total director compensation for a given firm in our sample.17
3.2. Adjustments to total compensation
Next, we consider the role of market levels of compensation and changes in equity values in the determination of changes in total director compensation. In a dynamic environment, firms often find themselves out of equilibrium, with director com-pensation contracts paying above or below the targeted market wage. This may occur for several reasons.
First, firm specific variables may change. For example, if firm size increases and larger firms pay more, then the firm will be below the market level and will need to adjust director compensation upward. Thus, we control for changes in firm specific variables. Second, assuming firms adjust director compensation at most once a year and market wages are not static, firms will likely be out of equilibrium from year to year. Third, as previously noted, the use of fixed-number equity can cause director in-come to change from year to year without explicit action by the board. Consequently, depending on changing equity values, firms may be above or below their target market wage. To account for the latter possibility, our analysis also isolates the effect of changes in equity values.
Using the estimated compensation results from Table 3, we regress the firm’s change in total compensation, ΔTC, (cur-rent minus lagged) on the firm’s deviation from its predicted market level of compensation. Deviation is defined as lagged ac-tual compensation minus lagged market compensation, the latter obtained from the prior set of regression.18 If the firms in our
13 Our approach is similar to Core and Larcker (2002) who estimate a target level of stock ownership of a CEO and other top executives. 14 We also specify the model including control variables for various governance measures including board size, percentage of insiders on the
board, CEO tenure, number of board meetings, a non-executive chairman dummy variable, affiliated and non-affiliated block holdings. The corporate governance variables add little additional explanatory power to the model. In addition, the alternative specification does not qualitatively change the results reported in either Table 3 or Table 4. These results are available from the authors upon request
15 An advantage of using log of compensation as the dependent variable is that it constrains the target market compensation (the antilog of the predicted value) to be a positive value. For the one observation with zero compensation, we imputed compensation to be $1000 since com-pensation is measured in thousands.
16 As a check for robustness, the equations were re-estimated using a pooled equation with year-dummies to establish the predicted level of compensation. We also specified a second pooled equation with two-digit industry dummy variables replacing the single digit industry variables. The results using either pooled model were qualitatively the same (the significance level of all variables remaining the same) as those derived from the single-year equations. These results are available from the authors upon request.
17 Including industry controls in the annual model specifications causes the adjusted R-squared to rise in all cases. Based on F-tests, we find that the industry controls are significant at the 10% level in 1999, at the 5% level in 2000, and at the 1% level in years 2001-2004.
18 Since the dependent variable in the market level equation is log of compensation, we take the antilog of the predicted value for the market compensation.
Ho w d o F i r ms ad j us t d i r e c to r c o mp e n s ati o n? 159
sample target market levels of director compensation, the coefficient on Deviation will be negative in the ΔTC equation, sug-gesting that firms, on a relative basis, adjust compensation toward their predicted value.19
Firms may respond differently to compensation that is above or below the predicted market compensation. Previous re-search suggests that there is some downward rigidity in CEO compensation, particularly with regards to salary.20 Director compensation may also exhibit similar downward rigidity, particularly with regards to cash or cash and fixed-value equity.
Thus, we also specify a dummy variable, Above, equal to one if the deviation from the predicted value is above zero and multiply it by Deviation. A positive coefficient on this interaction term indicates that a firm above the market adjusts less than a firm below the market (assuming the coefficient on Deviation is negative).
We also attempt to isolate the purely passive, equity-driven component of changes in director compensation that arise solely due to changes in the firm’s equity value. Empirically, the value of fixed-number contracts is sensitive to changes in eq-uity values during the year, while the value of fixed-value contracts is not. The value of a fixed-number award is the number of shares awarded (S) times the fiscal year end market price of a share (P). For options, it’s the number of options (O) awarded times the Black-Scholes value (B). Arithmetically, the change in fixed-number equity compensation (ΔFNC) is:
ΔFNC = Δ(PS) + Δ(OB) = St–1 ΔP + Pt ΔS + Ot–1ΔB + BtΔO (1)
For clarity, ΔB is the difference between the Black-Scholes value of an option awarded in period t and the Black-Scholes value of an option award in period t – 1. It is not the year to year change in the value of a given option awarded in period t – 1. The purely passive, equity-driven, component of ΔFNC is St–1 ΔP + Ot–1ΔB, which we define as ΔPassive, is entered as an ex-planatory variable in the change in compensation equation.21 A coefficient of 1.0 would signify that passive equity changes in compensation are reflected in total compensation changes on a one-to-one basis.
Since firms may respond differently to rising or falling equity values, we also test whether changes in firm value (ΔPassive) have an asymmetric effect on changes in director compensation. To test for asymmetry, we define a dummy variable, Rising, equal to one if ΔPassive is greater than zero, and we interact the dummy variable with ΔPassive. To interpret the interaction term, consider the
19 Agrawal and Walkling (1994), in an examination of executive compensation for CEOs targeted in acquisitions, modeled “normal” compen-sation to calculate abnormal or excess compensation. If our residuals measure abnormal rather than out-of-equilibrium compensation, then we would not expect them to have explanatory power in determining annual changes in director compensation. If they do, however, repre-sent deviations from a targeted market level, then we should observe firms adjusting toward the target market level.
20 According to Murphy (1999). the executive compensation contract often includes a guaranteed minimum increase in base salary over a five-year period. Similarly. Hayes and Schaefer (1999) note that we rarely observe pay cuts for CEOs.
21 A problem with this approach occurs when a firm engages in a stock split and utilizes fixed-number equity grants as part of director com-pensation. For example, ceteris paribus, in a two for one split, stock price (P) would fall by approximately 50% and although not required, we would expect S to double virtually mechanistically, leaving Δ(PS) unchanged, that is, a 100% offset. Consequently, the presence of stock splits in the data will bias the coefficient of ΔPassive to zero. To avoid this problem we eliminate eighty-eight firm-year observations with stock splits, where the firm had also awarded fixed-number equity grants to directors in the prior year (i.e., St –1 > 0).
Table 3. Target level of director compensation, 1998-2004; dependent variable is log of director total compensation
1998 1999 2000 2001 2002 2003 2004
Intercept 2.42 a 2.28 a 1.66 a 2.52 a 2.66 a 3.27 a 3.21 a (7.06) (5.88) (5.74) (7.63) (8.39) (16.8) (16.5)Log of sales 0.182 a 0.212 a 0.248 a 0.184 a 0.188 a 0.135 a 0.4.54 a (4.44) (5.42) (7.56) (5.59) (6.30) (6.55) (7.14)Market to book 0.138 a 0.0986 a 0.147 a 0.243 a 0.171 a 0.155 a 0.140 a (6.59) (3.73) (8.07) (8.15) (3.96) (4.84) (4.02)ROA –0.0121 b 0.00284 0.0049 –0.0116 b 0.00082 –0.0040 –0.00119 (2.10) (0.330) (1.63) (2.47) (0.147) (0.719) (0.208)Leverage 0.481 c 0.193 0.0112 –0.136 –0.222 0.170 –0.0735 (1.70) (0.655) (0.039) (0.687) (1.18) (0.902) (0.365)Industry controls Yes Yes Yes Yes Yes Yes YesNumber of observations 236 237 237 237 236 227 225Adjusted R 2 0.270 0271 0.474 0.436 0.378 0.317 0.254Model p-value 0.000 0.000 0.000 0.000 0.000 0.000 0.000
Based on a sample of 237 firms. Total Compensation is in thousands of dollars. T-statistics in parentheses are based on robust (White estima-tor) standard errors.
Total compensation is the sum of the cash retainer plus standardized meeting fees plus total equity compensation including the dollar value of all stock and options awarded. For the one observation where Total compensation was zero, we imputed a value of 1 (i.e., $1,000).
Log of sales is log of nominal sales revenue (in millions of dollars).Market to book is market value of equity plus total liabilities divided by total assets. ROA is return on assets measured as the ratio of net income to total assets.Leverage is measured as the ratio of total debt to total assets. Industry controls are based on one-digit SIC industry definitions. a Denotes significant at the 1 % level. b Denotes significant at the 5% level. c Denotes significant at the 10% level.
160 Far r e ll, Fr i es e n, & He r s cH i n Jou r na l of Cor p or a te fi n a nC e 14 (2008)
following example. In the ΔTC equation, if the coefficient of ΔPassive is 0.6 and that of the interaction is 0.3, then a $1000 increase in compensation due to rising stock or option values would be offset by a $100 explicit reduction in total compensation. In contrast, a $1000 decrease in compensation due to falling equity values would be offset $400 by an explicit increase in total compensation.
In addition to the predicted values and the equity value variables, we include other control variables that may impact changes in director compensation. Given that previous evidence suggests that director compensation is positively associated with growth opportunities of the firm (e.g., Linn and Park, 2005), we would expect changes in growth opportunities to be pos-
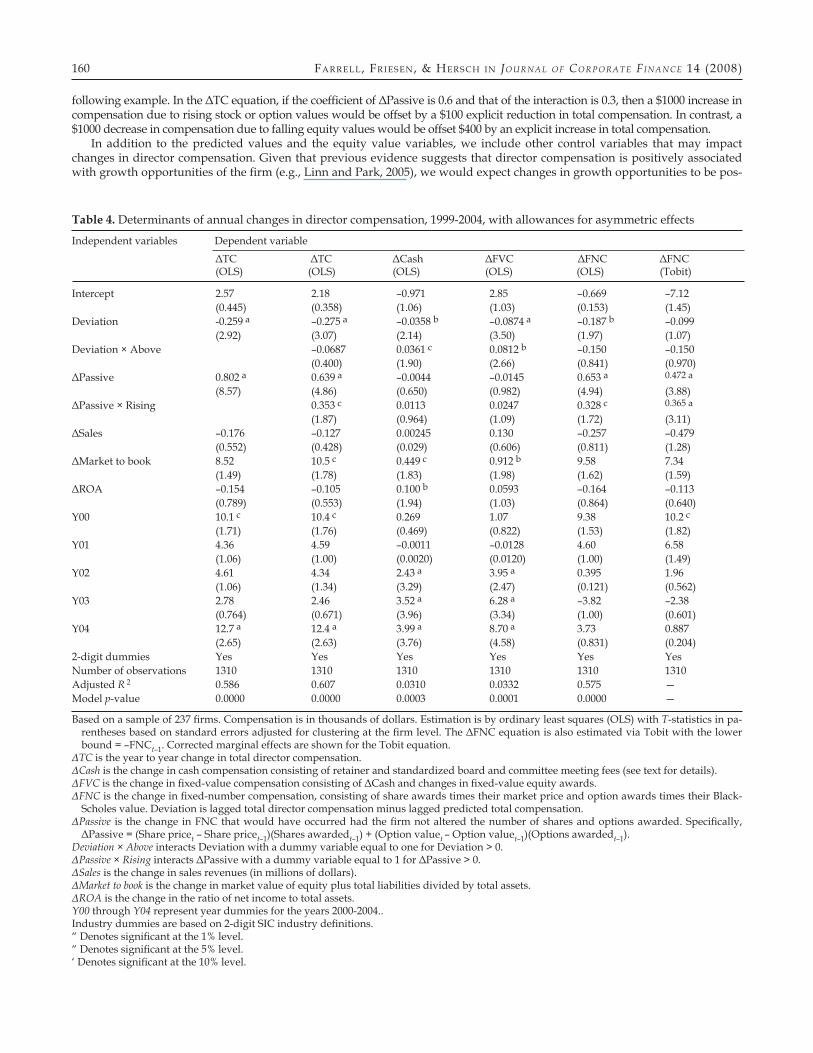
Table 4. Determinants of annual changes in director compensation, 1999-2004, with allowances for asymmetric effects
Independent variables Dependent variable
ΔTC ΔTC ΔCash ΔFVC ΔFNC ΔFNC (OLS) (OLS) (OLS) (OLS) (OLS) (Tobit)
Intercept 2.57 2.18 –0.971 2.85 –0.669 –7.12 (0.445) (0.358) (1.06) (1.03) (0.153) (1.45)Deviation -0.259 a –0.275 a –0.0358 b –0.0874 a –0.187 b –0.099 (2.92) (3.07) (2.14) (3.50) (1.97) (1.07)Deviation × Above –0.0687 0.0361 c 0.0812 b –0.150 –0.150 (0.400) (1.90) (2.66) (0.841) (0.970)ΔPassive 0.802 a 0.639 a –0.0044 –0.0145 0.653 a 0.472 a
(8.57) (4.86) (0.650) (0.982) (4.94) (3.88)ΔPassive × Rising 0.353 c 0.0113 0.0247 0.328 c 0.365 a
(1.87) (0.964) (1.09) (1.72) (3.11)ΔSales –0.176 –0.127 0.00245 0.130 –0.257 –0.479 (0.552) (0.428) (0.029) (0.606) (0.811) (1.28)ΔMarket to book 8.52 10.5 c 0.449 c 0.912 b 9.58 7.34 (1.49) (1.78) (1.83) (1.98) (1.62) (1.59)ΔROA –0.154 –0.105 0.100 b 0.0593 –0.164 –0.113 (0.789) (0.553) (1.94) (1.03) (0.864) (0.640)Y00 10.1 c 10.4 c 0.269 1.07 9.38 10.2 c
(1.71) (1.76) (0.469) (0.822) (1.53) (1.82)Y01 4.36 4.59 –0.0011 –0.0128 4.60 6.58 (1.06) (1.00) (0.0020) (0.0120) (1.00) (1.49)Y02 4.61 4.34 2.43 a 3.95 a 0.395 1.96 (1.06) (1.34) (3.29) (2.47) (0.121) (0.562)Y03 2.78 2.46 3.52 a 6.28 a –3.82 –2.38 (0.764) (0.671) (3.96) (3.34) (1.00) (0.601)Y04 12.7 a 12.4 a 3.99 a 8.70 a 3.73 0.887 (2.65) (2.63) (3.76) (4.58) (0.831) (0.204)2-digit dummies Yes Yes Yes Yes Yes YesNumber of observations 1310 1310 1310 1310 1310 1310Adjusted R 2 0.586 0.607 0.0310 0.0332 0.575 —Model p-value 0.0000 0.0000 0.0003 0.0001 0.0000 —
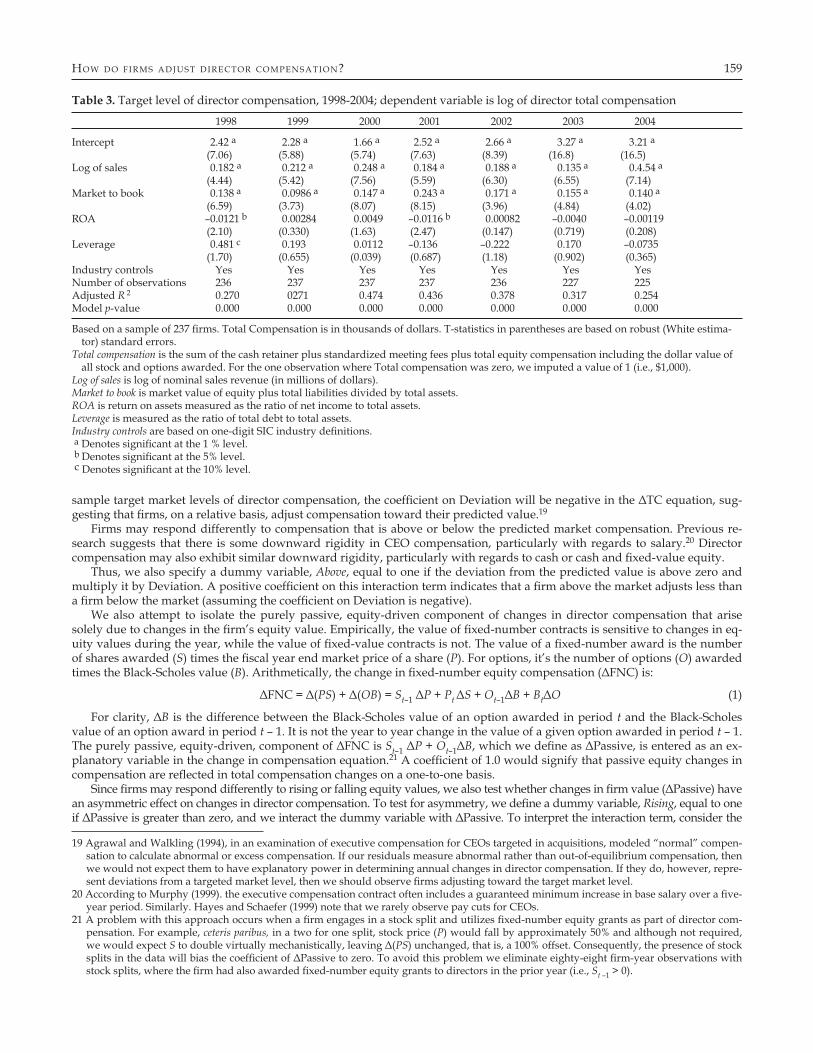
Based on a sample of 237 firms. Compensation is in thousands of dollars. Estimation is by ordinary least squares (OLS) with T-statistics in pa-rentheses based on standard errors adjusted for clustering at the firm level. The ΔFNC equation is also estimated via Tobit with the lower bound = –FNCt–1. Corrected marginal effects are shown for the Tobit equation.
ΔTC is the year to year change in total director compensation. ΔCash is the change in cash compensation consisting of retainer and standardized board and committee meeting fees (see text for details). ΔFVC is the change in fixed-value compensation consisting of ΔCash and changes in fixed-value equity awards. ΔFNC is the change in fixed-number compensation, consisting of share awards times their market price and option awards times their Black-
Scholes value. Deviation is lagged total director compensation minus lagged predicted total compensation. ΔPassive is the change in FNC that would have occurred had the firm not altered the number of shares and options awarded. Specifically,
ΔPassive = (Share pricet – Share pricet–1)(Shares awardedt–1) + (Option valuet – Option valuet–1)(Options awardedt–1). Deviation × Above interacts Deviation with a dummy variable equal to one for Deviation > 0. ΔPassive × Rising interacts ΔPassive with a dummy variable equal to 1 for ΔPassive > 0. ΔSales is the change in sales revenues (in millions of dollars). ΔMarket to book is the change in market value of equity plus total liabilities divided by total assets. ΔROA is the change in the ratio of net income to total assets. Y00 through Y04 represent year dummies for the years 2000-2004.. Industry dummies are based on 2-digit SIC industry definitions.“ Denotes significant at the 1% level. “ Denotes significant at the 5% level.‘ Denotes significant at the 10% level.
Ho w d o F i r ms ad j us t d i r e c to r c o mp e n s ati o n? 161
itively related to changes in director compensation. For similar reasons we include changes in firm size (sales) and firm perfor-mance (ROA).22 Also controlled for are industry (2-digit SIC) and year effects.
We present regression results in Table 4 for the determinants of annual changes in director compensation. Standard errors are adjusted for clustering at the firm level. Columns 1 and 2 of Table 4 show the results for changes in total compensation (ΔTC) re-gressed on deviations from the target and changes in firm value, with and without the interaction terms described above. Column 1 provides evidence consistent with firms setting director compensation levels relative to a market level of director compensation, indicated by the negative coefficient on Deviation. If total compensation is $1000 above (below) the market level of compensation, this yields a $259 adjustment downward (upward) in total compensation. Therefore, assuming no changes in the market wage, the average firm takes at least 4 years to fully adjust to its market level.23 Note that earlier we documented that our sample firms, on average, adjusted total compensation every other year suggesting that one might expect an average 50% adjustment in a given year. Possible explanations for the documented adjustment rate are that boards set their own compensation which they may be reluctant to reduce, while shareholder pressure on boards restrains compensation increases.24
Based on the coefficients of Column 1 and setting all of the variables to their mean values, a representative firm at its market level of compensation increased total compensation, on average, $7710 in a given year, consistent with the observed upward trend in director compensation over the sample period. A firm $10,000 below (above) its market level increased total compensation by approximately $10,300 ($5120). Essentially, the more a firm was above its market compensation level, the smaller was the increase in its director compensation. Analyzing the coefficient for ΔPassive, we find that when the market value of the equity award falls (rises), total compensation also falls (rises). The coefficient on ΔPassive is significantly different from 1.0 at the 5% level of signif-icance (t-statistic = 2.16) suggesting director compensation changes when equity values change but not dollar for dollar. Specifi-cally, for every $1000 fall (rise) in the market component of compensation, total compensation only falls (rises) $802.
Column 2 presents results from a regression that includes both interaction terms: Deviation × Above and ΔPassive × Rising. The coefficient on the Deviation × Above interaction term is not significantly different from zero. This suggests that there is no asym-metry in firms adjusting towards their target level of total compensation. A positive coefficient on the interaction term would have been consistent with a “keeping up with the Joneses” effect, with firms above their market wage tending to stay there (or perhaps rise further) and firms below racing to catch up. Such an effect, if it existed, could have contributed to the observed upward trend in director compensation over the sample period. The lack of the observed asymmetry, therefore, supports the findings of others who attribute rising compensation to supply and demand factors, such as the changing risk characteristics associated with serving as a director and the need to attract more highly qualified directors to the board (e.g., Linck et al., 2006; Chen, 2007).
The coefficient on the ΔPassive × Rising interaction term differs significantly from zero, suggesting asymmetry in how firms respond to changing equity values. For every $1000 fall in the equity component of compensation, total compensation falls $639 (0.639 is significantly different from one with a t-value of 2.75). When the equity value is rising, however, total com-pensation increases nearly dollar for dollar as denoted by the sum of the coefficients 0.639 and 0.353, where 0.353 is the signifi-cant coefficient for the interaction term between ΔPassive and Rising. The sum of the coefficients (0.639 and 0.353) is not signifi-cantly (or meaningfully) different from one, indicating a complete pass-through to directors when equity values are rising.25
To isolate further the changes in director compensation as they relate to market levels of compensation and changes in eq-uity value, we present regression results for three additional compensation variables in Table 4, Columns 3 through 6: change in cash (ΔCash); change in fixed-value compensation (ΔFVC); and change in fixed-number compensation (ΔFNC), where ΔFVC and ΔFNC sum to ΔTC.26 FVC includes changes in cash (cash retainer plus standardized meeting fees) and changes in fixed-value equity awards.27
22 We also specify the model including additional control variables such as changes in the number of board meetings, CEO tenure, percentage of inside directors on the board, the number of new outside directors added to the board since the prior proxy statement, the percent of af-filiated and non-affiliated block holdings, using the lagged values of these variables. The results are basically the same with the additional control variables, and do not change the overall inferences associated with the model specification reported in Table 4. The results are avail-able from the authors upon request.
23 Agrawal and Walkling (1994) analyze executive compensation for CEOs targeted in acquisitions. Among other things, they analyze the change in post-bid CEO compensation relative to pre-bid estimated abnormal compensation. They find that target firm executives that had positive (negative) unexplained compensation prior to the acquisition bid experience relative declines (increases) in compensation. Their re-sults could be interpreted to suggest a one-third adjustment in compensation per year for these target firm executives. In a similar vein, Ci-cero et al. (2007) analyze the speed of adjustment toward target levels of board size and independence. They find over a two-year period, boards close between 45% and 63% of the gap between actual and target levels.
24 This explanation is similar to one provided by Bebchuk and Fried (2004) regarding executive compensation. They argue that top executives effectively set their own pay because they have power over the board but that they are constrained by outrage costs.
25 To gauge the contributions of the Deviation and Deviation × Above variables in explaining changes in director compensation, we re-ran the column 2 equation in Table 4 excluding the two variables: R 2 falls from 0.607 to 0.548. In contrast, when ΔPassive and ΔPassive × Rising are excluded. R 2 drops from 0.607 to 0.321. These changes to R 2 suggest that market swings in equity values play the predominant role in ex-plaining variation in annual changes in director compensation.
26 A limitation of our analysis of the individual components of total compensation is that we do not estimate our market equation for each com-ponent. Thus, we are assuming that when director compensation is compared to the market, comparisons are not made separately for each in-dividual compensation component, but rather are done at the level of total compensation. We feel this is a plausible assumption. Changes, of course, must be made through specific components, and the regression analysis enables us to identify which components firms actually use.
27 In addition to ΔCash we could also separate out the change in fixed-value equity from ΔFVC. We included it with cash, however, for two reasons. First, less than 50% of the firms in the sample awarded fixed-value equity. Second, for many firms the fixed-value equity award is part of the retainer. For example, it is not uncommon for the retainer to be split evenly between cash and stock. If one excludes the retainer portion of FVC, the remainder (mostly fixed-value options) is zero for the vast majority of observations.
162 Far r e ll, Fr i es e n, & He r s cH i n Jou r na l of Cor p or a te fi n a nC e 14 (2008)
Columns 3 and 4 analyze changes in cash and total fixed-value compensation, respectively. The notable results from these specifications relate to the size of the coefficient for Deviation and the significance of the interaction term that captures the ef-fect of a positive deviation from the market level of total compensation. For changes in cash (Column 3), the negative and sig-nificant coefficient for Deviation (0.0358) is almost exactly offset by the positive and significant coefficient associated with the interaction term Deviation × Above (0.0361). This suggests that cash compensation is not typically adjusted downward to the market but is adjusted upward if the firm is below the market. Specifically, if the firm is above or below the market, total com-pensation adjusts symmetrically, but the adjustment does not appear to be made through cash compensation when total com-pensation is above the market.
Similarly for total fixed-value compensation (Column 4), if a firm is above the market level, then there is no downward cor-rection via reducing fixed-value compensation. But for every $1000 a firm is below the market, fixed-value compensation rises $87.28 These results are similar to the downward rigidity associated with CEO cash compensation (i.e., Murphy 1999; Hayes and Schaefer, 1999). Not surprisingly, changes in cash and fixed-value compensation are unrelated to changes in equity value as supported by the insignificant coefficients on ΔPassive and ΔPassive × Rising in Columns 3 and 4.
Columns 5 and 6 report results for changes in fixed-number compensation. Many observations for fixed-number equity are zero due to censoring from below. Fixed-number compensation cannot fall by more than the amount given in the prior year which is often zero. Thus, we report the results of an OLS model in Column 5 and the results of a Tobit model in Column 6.29 To allow for direct comparison with the other equations, the marginal coefficients for the Tobit model are presented.
For the OLS specification, we find a negative and significant coefficient associated with Deviation. For every $1000 the firm is above (below) the market level compensation, fixed-number compensation falls (rises) $187. The insignificance of the interac-tion term Deviation × Above suggests there is no asymmetry in fixed-number compensation as it pertains to adjusting towards a market level of compensation. In the Tobit, the coefficient of Deviation is negative, but insignificant. However, if the insignif-icant interaction term is removed (not reported), the coefficient of Deviation is -0.210 and significant at the 1% level (t = 3.26), indicating a $210 rise (fall) in fixed-number compensation for firms below (above) their market compensation level.30
The results from Columns 5 and 6 document that the asymmetry in total director compensation arising from changes in equity value (ΔPassive × Rising) is driven solely, by changes in fixed-number compensation. From Column 5, the coefficient on ΔPassive × Rising is 0.328; in Column 6 it is 0.365. The corresponding estimate in Column 2 for total director compensation is 0.353.
This asymmetry might be interpreted as evidence of wealth expropriation by directors (e.g., Bebchuk et al., 2006), in which director compensation contracts possess a “heads I win, tails I don’t lose” quality.31 However, this finding simply indicates an asymmetric response to changes in equity value in the year the value change occurs. The results in Table 4 also indicate that firms beginning the year above or below their market wage symmetrically adjust compensation toward the market. Taken to-gether, these findings suggest that firms that fall below the market level (due to passive declines in the stock or option price) begin adjusting compensation back to the market immediately. In contrast, there is no immediate downward-adjustment when compensation rises above the market level due to passive increases in equity values.32 Waiting one period before beginning downward adjustments is costly to shareholders, but this cost is temporary since the deviation from the market level is subse-quently corrected.
4. Conclusion
This study analyzes how firms adjust director compensation. We find behavior consistent with firms adjusting to a targeted market level of compensation, although the adjustment process appears, on average, to take approximately 4 years. During our sample period there was an upward trend in director compensation, with a representative firm (estimated to be at the preced-ing year’s market level of compensation) increasing annual total compensation, on average, by $7710. For every $10,000 a firm was below (above) the estimated market level, total compensation increased (decreased) by approximately $2590 relative to the average change in director compensation.
We also identify an asymmetric relation between changes in director compensation and changes in the value of firm eq-uity. If equity values are rising, firms tend not to change fixed-number equity (either the number of stock or options awarded).
28 To the extent that dollar denominated equity is awarded through the retainer, the results of Columns 3 and 4 should mirror each other, as the retainer is often split evenly between cash and stock. For such firms, adding $1000 in cash also adds $1000 in stock suggesting that the coefficients of Column 4 would be approximately two times those of Column 3. However, not all firms give equity as a part of the retainer and some firms may award fixed-value options also.
29 The lower bound for the Tobit model is equal to the negative value of fixed-number equity awarded in the previous period. 30 If the Deviation × Above interaction term is removed from the OLS fixed-number equation, the coefficient of Deviation becomes –0.296 with
a t-value of 3.36. 31 CEO compensation has also been shown to exhibit asymmetry (e.g., Garvey and Milbourn, 2006; Bizjak et al., 2007). 32 To illustrate, consider two hypothetical firms (A and B), both at their market level of compensation, and suppose firm A experiences an ab-
normal positive return that drives compensation above the market level. Our results suggest that there is no immediate “offsetting adjust-ment.” so compensation rises $1 for $1 and the firm ends the year above the predicted market level of compensation. The firm begins the next year above the market, and only then begins to adjust compensation back towards the market. In contrast suppose firm B experiences an abnormal negative return that drives compensation below the market level. There is an immediate “partially offsetting adjustment”, but this may not be sufficient to prevent the compensation from ending the year below the market. If firm B begins the next year below market, compensation will continue to be adjusted upward.
Ho w d o F i r ms ad j us t d i r e c to r c o mp e n s ati o n? 163
However, if equity values are falling, then fixed-number equity is adjusted to partially offset the declining level of director compensation. Thus, firms tend to explicitly change or “cushion” director compensation to partially shield director compensa-tion from reductions in equity value, but allow compensation to increase dollar for dollar when equity value rises.
Taken together, our findings suggest that the magnitude of adjustments to the market compensation level is symmetric but that the timing of the adjustments is not. Firms that fall below the market level (due to passive declines in equity value) begin adjusting compensation back to the market immediately. In contrast, there is no immediate downward-adjustment when com-pensation rises above the market level due to passive increases in the equity value.
We also document a trend towards increased utilization of fixed-value equity compensation in the design of director com-pensation plans. One explanation for this trend is that firms are balancing a movement towards greater transparency with a desire to maintain the incentives associated with equity compensation. If this trend continues, it may weaken the asymmetry documented in our empirical results if firms also begin eliminating the use of fixed-number equity awards. A promising area of future research will be to see how the trend towards fixed-value equity pay affects director and firm performance.
References
Adams, R. B., Ferreira. D., 2004. Do directors perform for pay? Working paper. University of Stockholm. Agrawal, A., Walkling, R., 1994. Executive careers and compensation surrounding takeover bids. Journal of Finance 49, 985-1014. Baysinger, B., Zardkoohi, A., 1986. Technology, residual claimants and corporate control. Journal of Law, Economics, and Organization 2, 339-349. Bebchuk, L., Grinstein, Y., Peyer, U., 2006. Lucky directors. Working paper. Harvard Law School. Bebchuk, L., Fried, J., 2004. Pay Without Performance: The Unfulfilled Promise of Executive Compensation. Harvard University Press. Cambridge.
Massachusetts. Becher, D. A., Campbell, T. L., Frye, M. B., 2005. Incentive compensation for bank directors: The impact of deregulation. Journal of Business 78,
1753-1777. Bizjak, J., Lemmon, M., Naveen, L., 2007. Does the use of peer groups contribute to higher pay and less efficient compensation? Working pa-
per. Portland State University. Brick, I. E., Palmon, O., Wald, J. K., 2006. CEO compensation, director compensation, and firm performance: Evidence of cronyism? Journal of
Corporate Finance 12, 403-423. Bryan, S., Hwang, L., Klein, A., Lilien, S., 2000. Compensation of outside directors: An empirical analysis of economic determinants. Working
paper. Baruch College. City University of New York. Chen, D., 2007. The monitoring and advisory functions of corporate boards: Theory and evidence. Working paper. Duke University. Cicero, D., Wintoki, M., Yang, T., 2007. Do firms adjust to a target board structure? Working paper. Terry College. University of Georgia. Core, J., Larcker, D., 2002. Performance consequences of mandated increases in executive stock ownership. Journal of Financial Economics 64,
317-340. Fich, E. M., Shivdasani, A., 2005. The impact of stock-option compensation for outside directors on firm value. Journal of Business 78, 2229-2254. Garvey, G. T., Milbourn, T. T., 2006. Asymmetric benchmarking in compensation: Executives are rewarded for good luck but not penalized for
bad. Journal of Financial Economics 82, 197-225. Gerety, M., Hoi, C., Robin, A., 2001. Do shareholders benefit from the adoption of incentive pay for directors? Financial Management 30, 45-61. Hall, B., 1999. The design of multi-year stock option plans. Journal of Applied Corporate Finance 12, 97-106. Hayes, R. M., Schaefer, S., 1999. How much are differences in managerial ability worth? Journal of Accounting and Economics 27, 125-148. Hemalin, B. E., Weisbach, M. S., 1988. The determinants of board composition. RAND Journal of Economics 19, 589-606. Heron, R. A., Lie, E., 2007. Does backdating explain the stock price pattern around executive stock option grants? Journal of Finance Economics
83, 271-295. Linck, J. S., Netter, J. M., Yang, T., 2006. Effects and unintended consequences of the Sarbanes-Oxley act on corporate boards. Working paper.
University of Georgia. Linn, S. C., Park, D., 2005. Outside director compensation policy and the investment opportunity set. Journal of Corporate Finance 11, 680-715. Murphy, K. J., 1999. Executive Compensation. In: Ashenfelter, O., Card, D. (eds.). Handbook of Labor Economics, vol. 3. Elsevier Science. New
York (chapter 38). O’Byrne, S., 1995. Total compensation strategy. Journal of Applied Corporate Finance 8, 185-197. Perry, T., 1999. Incentive compensation for outside directors and CEO turnover. Working paper. Arizona State University. Ryan Jr., H. E., Wiggins III, R. A., 2004. Who is in whose pocket? Director compensation, board independence, and barriers to effective moni-
toring. Journal of Financial Economics 73, 497-524. Subrahmanyam, V., Rangan, N., Rosenstein, S., 1997. The role of outside directors in bank acquisitions. Financial Management 26, 23-36. Vafeas, N., 1999. Determinants of the adoption of director incentive plans. Journal of Accounting. Auditing and Finance 14, 453-474. Woods, R. E., Ellis, D. J., 2007. The SEC’s new executive and director compensation and related party disclosure rules: A guide for companies
and compensation committees. Benefits Law Journal 20, 4-32. Yermack, D., 2004. Remuneration, retention, and reputation incentives for outside directors. Journal of Finance 59, 2281-2308.