多核心嵌入式軟體自動化測試工具設計與實作The Design and ...
59
國立臺中教育大學資訊科學研究所碩士論文 多核心嵌入式軟體自動化測試工具 設計與實作 The Design and Implementation of Automatic Testing Tool for Multi-Core Embedded Software 指導教授:孔崇旭 博士 研究生:賴竑睿 撰 中華民國九十九年七月
-
Upload
khangminh22 -
Category
Documents
-
view
0 -
download
0
Transcript of 多核心嵌入式軟體自動化測試工具設計與實作The Design and ...
國立臺中教育大學資訊科學研究所碩士論文
多核心嵌入式軟體自動化測試工具
設計與實作
The Design and Implementation of
Automatic Testing Tool for Multi-Core
Embedded Software
指導教授孔崇旭 博士
研究生賴竑睿 撰
中華民國九十九年七月
I
誌謝
本論文的完成最要感謝的是指導教授孔崇旭老師在這兩年裡不管在做研究的訓練
學習的方法以及待人處事上都教導我很多實驗室完備的研究環境也讓我學到很多修
課以外的知識同時也要感謝系上所有老師們的指導
此外也由衷地感謝系上的學長和同學們首先要特別感謝的是卓翰學長及健傑學長
當我遇到問題時他們都會很樂意指導我當然也很謝謝學弟們承翰益華一起幫忙國
科會計畫書與研討會的事務還有謝謝在軟工實驗室的同學及學弟們總是可以跟你們多多
的討論關於研究上的問題當然也很感謝同學們東穎瑋成英哲豐旭為我研究以外的
生活帶來許多的樂趣真的很感謝你們曾經帶給我許多程式設計技巧以及歡笑時光有大家
一起互相學習成長讓我這兩年的研究學習特別充實另外也很感謝口試委員黃世昆教授
徐國勛教授熊博安教授薛念林教授百忙抽空給予指導
最後更謝謝我的家人一直默默的支持我有了他們的強力後盾才能讓我全心全意地完
成碩士生涯感謝我所愛的人有妳一路上給予我的支持及鼓勵才能讓我完成這篇論文
謝謝
II
摘要
在多核心嵌入式軟體的軟體開發的過程中軟體測試是一項龐大的工程更
是軟體產品執行品質控管的重要關鍵然而軟體測試工作往往需要花費很多的人
力及物力加上嵌入式系統的硬體資源的限制使得嵌入式軟體的測試較為困
難然而目前大部分嵌入式軟體開發環境也較缺乏自動化的軟體測試工具來輔
助 為 了 減 輕 上 述 的 這 些 問 題 本 研 究 建 構 了一 個 支 援 嵌 入 式 軟 體 開 發 的
cross-testing 自動化測試系統來降低測試工程師的負擔增進嵌入式系統執行
測試工作的效率本系統能根據剖析原始碼後的資訊可自動 instrument source
code自動產生 test case test driver 及支援 CC++自動產生 primitive types
structure types 和 object types 的 test data提供單元測試及自動化多回合覆蓋率
測試平行程式的效能量測我們也將以文字及視覺化圖形輔助顯示測試報告
讓測試工程師易於了解測試的結果最後我們針對資料結構 C++範例及平行
程式範例來當作待測程式利用我們所開發出來的系統在 ARM11 的多核心平
台上做實際的測試並以測試結果來呈現我們所發展的 cross-testing 系統架構是
可運作的
關鍵字自動化測試嵌入式軟體測試覆蓋率測試單元測試cross-testing測試工具測
試案例產生物件測試
III
Abstract
Software testing during the process of developing software of embedded software not only is
a complicated task but also is the crux of quality control However software testing often takes lots
of efforts coupled with embedded systems hardware resource constraints making the testing
embedded software more difficult In addition currently the embedded software development
environment lacks of automatic tools to support embedded software testing To alleviate these
problems this study has developed an automatic cross-testing environment to support embedded
software testing Basing on the parsed source code the system can automatically instrument source
code generate test case and test driver and support generating primitive structure and object types
of test data Other functions such as supporting unit test and coverage test visualizing test results
and automatically performing multi-round testing are developed to both reduce the burden of test
engineer and enhance efficiency when embedded software testing is in process Further we have
selected some programs of data structures examples and concurrent program examples as target
testing programs By using our constructed testing environment in the ARM11 multi-core platform
to do testing experiments the test results show that our constructed testing environment is
workable
Keywordsautomatic testing embedded software testing coverage testing unit testing
cross-testing testing tool test case generating object testing
IV
內容目次
第一章 緒論 1
11 研究背景 1
12 研究動機與目的 1
13 章節概要 3
第二章 相關研究 4
21 軟體測試方法 4
22 嵌入式軟體自動化測試工具 5
221 嵌入式軟體自動化測試工具問題與討論 6
23 Open source library 7
第三章 自動化測試方法 8
311 自動化單元測試 8
312 Multi-round coverage testing 13
313 TBB Pipeline 自動化效能量測 15
第四章 系統架構 17
41 系統模組說明 17
411 前置處理模組 (Pre-Processing Module PRPM) 18
412 主機端自動化測試模組 (Host-Side Auto Test Module HSATM) 19
413 後置處理模組 (Post-Processing Module POPM) 19
414 目的端自動化測試模組 (Target-Side Test Controller Module TSATM) 20
42 系統設計 21
421 前置處理模組 (Pre-processing Module PRPM) 21
422 主機端自動化測試模組 (Host-Side Auto Test Module HSATM) 24
423 目的端自動化測試模組 (Target-side Auto Test Module TSATM) 27
424 後置處理模組 (Post-processing Module POPM) 29
第五章 實驗設計與實驗結果分析 31
51 實驗環境 31
52 系統使用介面展示 31
53 實驗及分析 35
531 實驗一 - 自動化覆蓋率測試 35
532 實驗二 - 單元測試實驗 37
533 實驗三 - 多核心效能監控 38
534 實驗四 - 不同 CPU core 數目在 TBB pipeline 技術下的效能量測 40
535 實驗五 - TBB pipeline 效能分析 44
V
54 實驗分析及討論 47
第六章 結論與未來發展方向 48
61 結論 48
62 未來發展方向 48
參考文獻hellip 49
VI
表目次
表 1 PRPM class diagram 說明 22
表 2 PRPM 狀態轉換和反應 23
表 3 HSATM class diagram 說明 25
表 4 HSATM 狀態轉換和反應 26
表 5 TSATM class diagram 的說明 27
表 6 TSATM 狀態轉換和反應 28
表 7 POPM class diagram 說明 29
表 8 POPM 狀態轉換和反應 30
表 9 Line Coverage 測試結果 36
表 10 Branch Coverage 測試結果 36
表 11 單元測試結果 38
表 12 Multi-core CPU utilization 39
表 13 以 1 個 CPU core 執行 TBB pipeline 的 CPU utilization 效能量測 41
表 14 以 2 個 CPU core 執行 TBB pipeline 的 CPU utilization 效能量測 42
表 15 以 3 個 CPU core 執行 TBB pipeline 的 CPU utilization 效能量測 43
表 16 以 4 個 CPU core 執行 TBB pipeline 的 CPU utilization 效能量測 43
表 17 TBB pipeline 1~12 stage 執行時間 45
表 18 TBB pipeline 1~12 stage 建議的 token 數 45
VII
圖目次
圖 1 自動產生 test data 演算法 9
圖 2 自動產生 test case 演算法 11
圖 3 Test case 產生範列 12
圖 4 Test driver 產生範列 12
圖 5 多回合 coverage test 流程 14
圖 6 多回合 coverage test 演算法 14
圖 7 Instrument code 至 TBB 平行程式 15
圖 8 TBB 效能量測時間分布範例 16
圖 9 TBB pipeline 效能量測方法 16
圖 10 ATEMES 系統架構 17
圖 11 ATEMES 系統階層式架構 18
圖 12 PRPM 模組架構 18
圖 13 HSATM 模組架構 19
圖 14 POPM 模組架構 20
圖 15 TSATM 模組架構 20
圖 16 PRPM 模組的 class diagram 21
圖 17 Sequence diagram - 自動產生 test case 22
圖 18 PRPM 模組的 state diagram 23
圖 19 HSATM 模組的 class diagram 24
圖 20 Sequence diagram - 自動產生 test driver 25
圖 21 Sequence diagram - 效能監控 26
圖 22 HSATM 模組的 state diagram 26
圖 23 TSATM 模組的 class diagram 27
圖 24 Sequence diagram - 執行自動化多回合測試 28
圖 25 TSATM 模組的 state diagram 28
圖 26 POPM 模組的 class diagram 29
圖 27 Sequence diagram -產生測試報告 30
圖 28 POPM 模組的 state diagram 30
圖 29 開啟測試專案介面 31
圖 30 待測程式編輯介面 32
圖 31 Test case 和 test driver 產生器介面 32
圖 32 產生 test case 選單介面 33
圖 33 執行 coverage test 選單介面 33
圖 34 執行單元測試選單介面 34
VIII
圖 35 測試結果視覺化介面 34
圖 36 Coverage test 測試結果介面 36
圖 37 Unit test 測試結果介面 37
圖 38 多核心 CPU 使用率視覺化介面 39
圖 39 TBB pipeline 以 1~4 CPU core 執行的效能量測 40
圖 40 TBB pipeline 以 1 個 CPU core 執行的效能量測 41
圖 41 TBB pipeline 以 2 個 CPU core 執行的效能量測 42
圖 42 TBB pipeline 以 3 個 CPU core 執行的效能量測 42
圖 43 TBB pipeline 以 4 個 CPU core 執行的效能量測 43
圖 44 TBB pipeline 1~12 stage 效能量測 44
圖 45 使用 1 個 pipeline stage 執行的時間 45
圖 46 使用 2 個 pipeline stage 執行的時間 45
圖 47 使用 3 個 pipeline stage 執行的時間 46
圖 48 使用 4 個 pipeline stage 執行的時間 46
圖 49 使用 5 個 pipeline stage 執行的時間 46
圖 50 使用 6 個 pipeline stage 執行的時間 46
圖 51 使用 7 個 pipeline stage 執行的時間 46
圖 52 使用 8 個 pipeline stage 執行的時間 46
圖 53 使用 9 個 pipeline stage 執行的時間 47
圖 54 使用 10 個 pipeline stage 執行的時間 47
圖 55 使用 11 個 pipeline stage 執行的時間 47
圖 56 使用 12 個 pipeline stage 執行的時間 47
1
第一章 緒論
11 研究背景
隨著電腦軟體技術的發展嵌入式軟體應用的範圍越來越廣客製化的需求也越來越多
也使得嵌入式軟體品質的控管也越來越被重視[1]有鑒於軟體系統開發過程中常因人為疏
失所造成規格不符設計錯誤程式撰寫疏漏等問題不僅延誤開發時間更導致成本增加
嚴重影響軟體品質對於現今的軟體工業改善軟體的品質為一個重要的議題[2]可藉由軟
體測試來提升軟體的品質及可靠度[3]然而測試在軟體開發過程中需要花費非常多的人
力和物力可透過自動化或半自動化測試的方法及工具來節省測試時間[4]
Random testing[5 6]為常被用來評估軟體品質可靠度的測試方法之一以random為基礎的
測試方法從所有可能的輸入集合中以隨機的方式自動產生大量的測試案例(test case)[7
8]Adaptive random testing (ART) [9-12]為進階random testing方法也是現今很流行的測試方
法並且可藉由覆蓋率測試 [13](coverage test)技術來量化軟體測試的品質而concolic
testing[14]為提升測試覆蓋率的方法之一一些學術研究指出當測試的覆蓋率增加相對地代
表軟體的可靠度被提升
軟體的效能也是多核心嵌入式系統開發中一個重要的關鍵我們可以監控各個核心
的使用率程式執行時間來得知軟體的效能本論文將利用現在的 open source 工具
整合單元測試覆蓋率測試平行程式效能量測針對測試工程師不同的需求來提供
軟體測試服務
12 研究動機與目的
目前大部分軟體開發環境都缺乏整合性的軟體測試工具之輔助或測試工具僅侷限於程
式中的特定部分無法有較完整的測試管理提供一個軟體測試的整合環境嵌入式系統通常
2
比一般桌上型電腦的軟硬體的資源限制較多因此在測試嵌入式軟體時測試者需花費更
多的心力來測試及改進嵌入式軟體的品質[15]此外傳統的單元測試工具主要針對單一平
台並且使用人工輸入或自動產生的方法產生 test case 及 test data但是自動產生 test case 的
方法仍然需要加強[16]因為大多數的單元測試(unit test)工具都只會自動產生 test case 的程式
框架或只能支援原生的資料型態使得測試工程師需要手動在產生的程式框架內撰寫測試
程式碼及輸入 test data或人工來產生 test case[17]然而測試工作往往需要重複多次的測
試動作造成工作量的負擔且以手動輸入 test data 進行測試既沒有效率容易出錯也很
難提升測試的覆蓋率[18]在測試執行效能部分測試工程師很難得知軟體在嵌入式平台上
執行的狀況所以要改進執行時的效能也較為困難[19]
為了降低嵌入式平台執行測試負荷及減少測試工程師的負擔本研究建構了一個支援
cross-testing 的自動化測試工具其主要區分為功能性測試包含單元測試覆蓋率測試非
功能性測試包含平行程式的效能量測其目的說明如下
1 建構 Host-Side 及 Target-Side 的測試環境來實現自動化嵌入式軟體測試的工作
所有測試的工作不必完全在嵌入式系統平台上執行可增進測試的效率有效
地利用嵌入式硬體資源減輕測試工程師的負擔
2 發展一個支援 CC++複雜資料型態(primitive typestructure type object type)自動
產生 test datatest casetest driver
讓自動化單元測試覆蓋率測試不受資料型態的限制
3 自動執行多回合 line coverage 測試branch coverage 測試
測試工程師不必重覆多次相同的測試動作
4 可在 runtime 時去監控程式在多核心嵌入式平台上執行的效能及自動化多回合平行程
式(TBB)效能量測
使測試工程師容易得知軟體在嵌入式平台上執行的效能
5 以文字及視覺化介面輔助呈現每回合的測試結果
使測試工程師容易理解測試報告
3
13 章節概要
本論文共分為六個章節第一個章節為緒論與介紹本論文的動機與目的第二個章節為
軟體測試技術工具之介紹及相關文獻探討第三章節是說明關於本論文所發展的自動化測
試方法包含自動產生 test datatest case 及 test driver 方法多回合覆蓋率測試方法平行
程式效能量測方法在第四章節的部份將介紹整個自動化測試系統架構及各個模組設計細
節說明在第五章節的部分主要為軟體測試之實驗設計及實驗結果分析最後將在第六章
提出結論與未來的研究方向
4
第二章 相關研究
本章節將介紹關於軟體測試的方法及技術相關的嵌入式軟體自動化測試工具如何在嵌
入式平台上進行較有效率的測試及降低測試工程師負擔的方法並說明其工具之優缺點
21 軟體測試方法
由於軟硬體技術的進步軟體系統也越來越複雜功能也越來越多導致執行測試所需
要的時間也逐漸增多因而軟體測試的技術也越來越重要軟體測試的方法可以用多種角度
來分類最簡單的可分為黑箱測試(black box testing)及白箱測試(white box testing)兩種黑箱
測試的方法是將「待測軟體模組」組視為一個黑盒子主要在測試「待測軟體模組」的外在
功能及行為而白箱測試的方法則根據「待測軟體模組」的結構來進行測試通常是參考「待
測軟體模組」的原始程式來設計測試案例比起黑箱測試白箱測試更能充分測試到「待測
軟體模組」也因此單元測試通常都採用白箱測試的技術以下將簡單描述相關的測試方法
(1) Unit testing
單元測試(unit testing)[20]是軟體測試中最常見也最基本的測試方法目的在測試「待測
軟體模組」中每一個單元(通常為一個類別或一個函式)是否設計正確以目前較進步的高階
程式語言其語言結構上都會包含測試框架(testing framework)以方便及輔助測試人員來產
生單元測試
(2) Random testing
Random Testing[6 21]的方法是以隨機的方式產生大量的測試輸入資料並觀察程式在這
些測試輸入資料之下執行所發生的現象這些現象是否有被程式設計師所掌握用random
testing來作測量時它所產生的overhead可能會高於執行程式本身而且也不保證程式執行的
正確性若是程式的功能範圍廣大則它的覆蓋率更是趨近於零
5
22 嵌入式軟體自動化測試工具
M E Delamaro[22]發展一個測試手機軟體覆蓋率的測試工具 JaBUTiME
主要支援 java程式碼解決行動裝置效能的限制和儲存空間的限制由於行動裝
置必須考慮memory limitationspersistent storagenetwork connection availability
等情況所以在手機裝置進行 testing較為困難此工具不僅可應用於 emulators
也可在實際的手機裝置上執行測試測試工程師只需使用桌上型電腦即可對
mobile執行測試在電腦端 instrument class及產生測試活動 (test session)藉由測
試伺服器使得桌上型電腦能和mobile裝置溝通互相傳遞訊息當 instrumented code
在mobile上執行時透過網路連結傳送 trace data來追蹤 test case在手機裝置上的執
行狀況此方法可降低行動裝置執行測試時的負擔並以視覺化介面顯示測試結
果可清楚地讓測試工程師知道程式有多少行沒被執行到但是較不著重於測試
的自動化自動產生 test data test case方法使測試工程師需花費額外的時間編
寫測試程式碼及手動產生 test data
Jooyoung Seo[23]提出一個可運行在嵌入式開發板上的 automated scheme of
嵌入式軟體 interface test lsquoJustitiarsquo對於嵌入式軟體測試工程師可以利用設置
中斷點的方法來除錯但如果測試工程師對測試並不是很有經驗或是不知道整個
嵌入式系統的架構則需要更多的時間來進行測試 Justitia主要著重在自動測試
程式的 interface是否有錯誤結合 emulator現有的 monitoring和除錯技術來測試
embedded software 可 找 出 程 式 碼 interface 的 位 置 來 做 測 試 透 過 預 先 定 義
embedded software的 interface pattern自動產生 test case(interface test feature
location of interface symbol to be monitored at the interface input data and
expected output)並以 emulation 測試技術來執行 test case支援記憶體測試中斷
測試且執行完測試會以視覺化介面顯示 test coverage及 interface錯誤報告
6
Yongyun Cho[24]提出 Multi-paradigm views 基於 host-target 架構的嵌入式軟體測試工具
在 host-side 提供測試工程師方便的 GUI並在 target-side 嵌入式開發板執行軟體效能的測試
其中包含記憶體測試覆蓋率測試及效能量測此外作者設計一個 xml-based DTDs(Document
type definitions)來提升 test script 的可用性及重覆使用性此工具主要由 GUIhosttarget-side
agentcode analyzertest suite generatorresult analyzerreport viewer 所組成host-side 為 java
2 平台提供測試工程師容易操作的 GUI測試工程師可在 host-side 透過 test script wizard
及 test driver wizard 來產生 test scripttest suite 及 test driver並可選擇不同的視覺化圖形觀
看測試結果target-side 為 embedded Linux 的 HRP-SC2410(Ami)平台為嵌入式軟體 test
engine主要包含了 real-time monitorexecution controllerdata analyzer 及 report generator
藉由 code analyzer 來產生 parse tree 並將所擷取 test informationtest suite generator 及 test driver
產生再藉由 cross-compiler 來產生 target-executable file 給 test engine 執行測試當測試完成
host-side agent 將從 target-side 接受到的字串型式的結果存儲到 Database 裡並以視覺化圖表顯
示測試結果
221 嵌入式軟體自動化測試工具問題與討論
在上述的測試工具中我們做個結論「 JaBUTiME」系統主要針對單次測試缺
少了多回合的自動化測試對於提升測試覆蓋率需花費額外的時間去執行測試
「 Justitia」工具可降低行動裝置執行測試時的負擔並以視覺化介面顯示測試結
果可清楚地讓測試工程師知道程式有多少行沒被執行到但是較不著重於測試
的自動化自動產生 test data test case 方法使測試工程師需花費額外的時間
編寫測試程式碼及手動產生 test data「Multi-paradigm views 嵌入式軟體測試工具」
使得測試工程師可以容易的修改 test script 去嘗試不同的測試並且可以依自己的需求選擇不
同視覺化圖表來觀看測試結果透過圖形的表示測試工程師可以直覺的分析軟體測試的結
果此篇論文為發展方便的 test driver wizard 使測試工程師容易開發 test scripttest suite 及 test
7
driver有效改進開發嵌入式軟體效率然而此工具較不著重於自動產生 test scripttest driver
及多回合自動化測試測試工程師需每次再花費額外的時間編輯 test scripttest driver
23 Open source library
(1) Pin tool
Pin tool[25]為binary dynamically instrumentation工具支援平台有x86x86-64Itanium
LinuxWindows透過Pin可在程式執行時動態地加入片段程式碼來收集執行時的資訊不需
要source coderecompilationpost-linkingPin提供CC++APIs讓測試工程師開發自己的
instrumentation tools透過Pin tool可以做到code coverage分析memory 分析performance
analysisinstruction profilingdata dependence profiling及thread analysis
(2) CppUnit
CppUnit[26]是個基於 LGPL 的開放原始碼項目最初版本移植自 JUnit支援 CC++半自
動的單元測試框架主要功能為單元測試功能測試並提供了幾種測試環境一種基於文
字模式另一種基於 GUI(MFC TestRunner)
(3) GCOV
Gcov[27]為GNU發所展的工具之一為測試覆蓋率的工具其中包含函數覆蓋(function
coverage)語句覆蓋(statement coverage)和分支覆蓋(branch coverage)藉由在使用gcc編譯時
加入「-fprofile-arcs -ftest-coverage」參數編譯成執行檔當程式執行完會產生gcno和gcda
兩個檔案gcov再透過分析gcno和gcda兩個檔案來得知程式執行的覆蓋率
(4) TBB
Threading Building Blocks(TBB)[28]是Intel推出的針對多執行緒平行開發的一個open
source library支援平行運算及pipeline技術提供C++ template library讓使用者不需要關注
低階的執行緒建立或是分配工作只需要關注所要執行的任務可應用於不同的多核心平台
可執行於LinuxWindowsMac作業系統所支援的編譯器包含MicrosoftGNU and Intel
8
第三章 自動化測試方法
在本章節中我們將說明本研究實現包含功能性及非功能性自動化測試主要的方法在
功能性測試中我們將說明在單元測試中自動產生支援 CC++複雜資料型態的 test datatest
casetest driver 方法讓自動化測試能支援複雜的資料型態並且介紹在覆蓋率測試中結合
自動化多回合測試機制的方法可減少測試需重覆多次執行的負擔最後在非功能性測試中
則說明 TBB 平行程式效能量測方法幫助測試工程師找出適合 TBB pipeline 平行化所需的參
數值
311 自動化單元測試
在單元測試中我們將測試程式中每一個 function 是否會發生錯誤在進行測試前必須
先產生測試所需的 test datatest case 及 test driver首先我們說明如何自動產生支援 CC++
複雜資料型態的 test data其資料型態包含 primitive typestructure typeobject type 的 test data
此外也可以產生 array type 的 test data而產生的 test data 將作為 test case 及 test driver 的輸入
資料圖 1 為自動產生 test data 的演算法在演算法中相關名詞說明如下
(1) Function-List
儲存待測程式中所有 function 的資訊包含名稱參數型態及回傳型態
(2) Object-List
儲存待測程式中所有 object type 的屬性
(3) Parameter-List
儲存所有 function 的參數型態
(4) TestInputDataGenerationMainFunction
擷取待測程式所有 function 的參數型態及回傳值型態
(5) TestInputDataGenerator
產生與 function 參數型態及回傳值型態的 test data
9
演算法執行的步驟
Step 1TestInputDataGenerationMainFunction procedure會從 function list中取得method
nameparameter type 及 return type並將 parameter typereturn type 代入
TestInputDataGenerator procedure
Step 2TestInputDataGenerator 根據 parameter type
Step 2-1若為 primitive 則直接產生對應型態的 test data
Step 2-2若為 array type則會擷取出 array 的 dimension計算出所需產生的資
料量再產生對應型態的 test data
Step 2-3若為 object type則會以遞迴的方式來找出在 object 中所有的 primitive
type再產生對應型態的 test data
圖 1 自動產生 test data 演算法
10
當 test data 產生之後需再產生所有待測 function 的 test case而每一組 test case 皆包含
一組 test data再根據 test data 的資料型態產生 test case所產生的 test case 將會在測試執行
時驗證待測程式是否有會例外錯誤或是否輸出符合使用者所輸入的期望值圖 2 為自動產生
test case 的演算法其演算法中相關名詞說明如下
Function-List
儲存待測程式中所有 function 的資訊包含名稱參數型態及回傳型態
Object-List
儲存待測程式中所有 object type 的屬性
Parameter-List
儲存所有 function 的參數型態
TestCaseGenerationFunction
產生與 function 參數型態及回傳值型態的 test data
演算法執行的步驟
Step 1從 function list 中取得 method nameparameter type 及 return type
Step 2產生 test case 的 function signature 程式碼
Step 3判斷 parameter type 是否為 primitive typestructure typeobject type
Step 4依據 parameter type instrument 一個變數(variable)宣告的程式碼
Step 4-1若 parameter type 為 primitive type則 instrument 讀取一筆 test data 給此變
數的程式碼
Step 4-2若 parameter type 為 object type 或 structure type則取出所有的 primitive type
attribute並且 instrument 讓所有 attribute 可讀取 test data 的程式碼
Step 4-3若 parameter type 為 array type 則計算出所需讀入的 test data 數目並產生
利用 loop 將所有 test data 讀入的程式碼
Step 5判斷此 method 的回傳型態(return type)
Step 5-1若為 primitive typestructure typeobject type 則 instrument 讀取 test data
的程式碼呼叫待測程式 function 的程式碼及 assertion 的程式碼
assertion 的程式碼可用來判斷待測程式的 method 的回傳值是否符合期望
值
Step 5-2判斷此 method 的回傳型態(return type)若為 void 則產生呼叫待測程式
11
function 的程式碼
Step 5-3若都不是則產生以 null 代入待測程式 method 的程式碼或以人工指定
圖 2 自動產生 test case 演算法
接著我們將說明自動產生以 cppunit為基礎的 test case程式範例如圖 3所示binsearch()
為待測 function其參數型態分別為 structure array type整數整數回傳值型態為整數此
test case 會去讀取與參數型態對應的 test data並透過 CPPUNIT_ASSERT function 測試輸出是
否符合使用者所輸入的預期值若不為預期值此 test case 將會發出測試未通過之訊息
12
圖 3 Test case 產生範列
最後我們需再產生 test driver圖 4 為自動產生的以 cppunit 為基礎的 test driver 範例
藉由 test driver 可以控制所有 test case 執行並擷取測試時待測程式所發生的錯誤當測試完成
並將測試結果寫入 XML 檔案中但目前對於自動產生 test datatest case 仍有些限制例如
CC++的 template 型態或是指標
圖 4 Test driver 產生範列
13
312 Multi-round coverage testing
本研究所發展的多回合覆蓋率測試技術主要是以 GNOME gcov 為基礎結合多回合
cross-testing 機制藉由多回合的機制來提高測試的覆蓋率並且在執行測試時測試工程
師可在 Host-Side 端以圖形化介面動態觀察每一回合測試的 line coverage 及 branch coverage
多回合覆蓋率測試的流程如圖 5 所示以下為執行步驟
Step 1讀取待測程式
Step 2剖析待測程式擷取 function 資訊其中包含參數型態
Step 3自動產生 test datatest case 及 test driver
Step 4將其待測程式與 test driver 編譯為執行檔其編譯時額外加入 gcov 編譯參數
Step 5將測試程式test case 及 gcov 產生的gcon 檔上傳至 Target-Side 上執行
Step 6測試執行完成下載 gcov 所產生的 test log
Step 7分析 test log 判斷是否符合 coverage 的門檻值
Step 7-1若達到所設定的 coverage 門檻值則停止測試並顯示每回合的視覺化測試
報告給工程師
Step 7-2若未達到所設定的 coverage 門檻值則自動產生 test case並回到 step 5 繼續
下一回合測試並且顯示每回合的視覺化測試報告給工程師
接著我們將說明如何實作多回合覆蓋率測試圖 6 為多回合覆蓋率測試演算法此演
算法需要 2 個輸入分別為 gcov 所產生的 test log 及我們自己新增的 totalCoverage log在此
我們將使用 flag 集合來記錄程式每一行或每一分支執行過或未執行過當檢查至程式的第 i
行或分支在這一回合是否有被執行過若是則將 flag[i]設定為 1若否則檢查 totalCoverage log
是否在之前的回合已被執行過若是則將 flag[i]設定為 1否則設定為 0當所有 flag 設定完
成則開始計算 line coverage 或 branch coverageflag 集合大小為總行數或總分支數所以
coverage 為(flag 集合裡為 1 的數目)(flag 集合的大小)最後 flag 集合寫入 totalCoverage log
中
14
圖 5 多回合 coverage test 流程
圖 6 多回合 coverage test 演算法
15
313 TBB Pipeline 自動化效能量測
本章節將說明 Thread Building Block(TBB)平行程式 pipeline 效能量測方法TBB pipeline
可以讓使用者去決定平行化的程度此為 pipeline token 數對於選擇一個正確的 pipeline token
數需要經驗的累積若所設定的 token 數太小則會限制平行的程度而 token 數太大則會耗費
不必要的資源(例如需要更多的 buffer)一般若要找出最佳的 pipeline token 數目測試工程師
需要多次手動修改 pipeline token 的參數對此我們提出自動建議一個合適的 pipeline token 數
目節省使用者花費額外的時間在測試 pipeline 平行化的效率並能更精準的提升平行程式
的效能
測試工程師需先選取包含 TBB pipeline 函式 source code本研究將自動 instrument 測試
程式片段來擷取效能資訊如圖 7 所示包含了 TBB 所提供的 timer 來擷取 pipeline 程式執
行時間及取代原程式 pipeline 執行的參數(pplinerun(int))使其能代入自動產生的 pipeline token
number test case最後再藉由 Target-Host 機制來實現自動化多回合測試當程式執行完在
Host-Side 會顯示出執行時間的分布圖及 CPU 每個核心的使用率最後我們將會自動分析
所收集的測試資料提供測試工程師一個建議平行化門檻值範圍使 pipeline 平行程式達到
較好的效能
圖 7 Instrument code 至 TBB 平行程式
16
經過我們多次的分析我們發現量測 token 數目對於程式執行時間的分布大都如圖 8 所
示因此我們以五個 token 數為單位計算其平均值並找出一個建議的 token 數範圍以圖
9 所示量測的 token 數為 1~10我們取 token 數 1~5 執行時間的平均值為 176 毫秒token
數 2~6 執行時間的平均值為 124 毫秒以此類推當我們發現下一次的平均值大於目前的平
均值(Token No 4~8 的執行時間大於 Token No 3~7 的執行時間)因此我們建議的 token 數為
目前取平均數的範圍以圖 9 為例我們所建議的 token 數為 3~7
圖 8 TBB 效能量測時間分布範例
圖 9 TBB pipeline 效能量測方法
17
第四章 系統架構
本 章 節 我 們 介 紹 我 們 所 發 展 的 嵌 入 式 軟 體 自 動 化 測 試 環 境 (ATEMES
automatic testing environment for multi-core embedded software)本系統 (ATEMES)
主要分成四個部分分別為前置處理模組 (Pre-processing Module PRPM)主機端自動
測試模組(Host-Side Auto Testing Module HSATM)目的端自動測試模組(Target-Side Auto
Testing Module TSATM)後置處理模組(Post-processing Module POPM)透過這四個模組來
實現遠端自動化測試(cross-testing)嵌入式軟體系統提供的測試功能包含了單元測試覆蓋
率測試平行程式效能量測系統架構如圖 10所示
圖 10 ATEMES 系統架構
41 系統模組說明
本系統 ATEMES 共分為五層如圖 11 所示最底層為硬體平台在 Host-side 我們使用
X86 平台Target-Side 為 ARM11 MPCore 平台第二層為 linux 作業系統第三層為我們所
使用的 open source library包含了GCOVCppunitJfreechartPin toolTBB第四層
第五層為我們所發展的模組前者為 ATEMES 系統的模組後者為 Host-side 在 JAVA 平台上
執行的圖型化的操作介面
18
圖 11 ATEMES 系統階層式架構
411 前置處理模組 (Pre-Processing Module PRPM)
PRPM 為測試的前置處理首先讀取待測程式透過 Code Analyzer 來剖析(parse)及切割
(tokenize)原始程式碼擷取出程式內部資訊(例如 function 名稱參數Key-Word)而 Test Case
Generation Module 會依據測試需求(unit testingcoverage testingperformance monitor)自動產
生 test case 及 test case 所需的 test dataCode Analyzer 會找出需插入程式片段(instrument code)
的位置使 Code Instrumentation Module 能產生測試所需的 instrumented program此外測試工
程師也可自行輸入 test casetest data 及 instrument code 所需的資訊此模組架構如圖 12 所
示
圖 12 PRPM 模組架構
19
412 主機端自動化測試模組 (Host-Side Auto Test Module HSATM)
HSATM 為實現自動化測試主要的模組Test Driver Generate Manage 接收 PRPM 模組所
產生的 test case 及 instrumented code並依據測試需求執行所需的測試模組來產生 test driver
包含 Unit Test ModuleCoverage Test Module 及 Performance Monitor Module當 test driver
產生Host-Side Automatic Test Controller 會將 PRPM 所產生的 instrumented code 及 test driver
編譯為測試用的執行檔(test program)最後再將 test program 及 test case 傳送給 TSATM 模組
本模組會動態通知 PRPM 模組以產生新的 test case來達到動態測試此模組架構如圖 13
所示
圖 13 HSATM 模組架構
413 後置處理模組 (Post-Processing Module POPM)
本模組主要是在分析及處理測試的結果將其測試結果分類成各個項目並產生文字
及圖形的報表Test Log Manager會依據測試需求執行不同的剖析器(Parser)即時分析 Test
Log的資訊包含Coverage Test Log ParserUnit Test Log ParserPerformance Monitor Log
Parser並且將分析後的結果動態的回饋給PRPM及HSATM做為下一步測試的參考此
外測試工程師可在測試執行時即時地觀察coverage test結果或performance monitor結果
Test Result Presentation Module會將測試結果以文字描述及圖形化介面的方式來呈現結
20
果模組架構如圖 14所示
圖 14 POPM 模組架構
414 目的端自動化測試模組 (Target-Side Test Controller Module TSATM)
本模組為一個測試執行環境透過Target-side Test Controller來觸發test driver及Profiler
執行並可即時與HSATM互相傳遞訊息包含test casetest driver等等在執行測試的程式
時Profiler會依據測試需求即時收集資料並將測試過程及結果相關的資料記錄在test log
上test log可能存在記憶體中或是一個檔案最後將test log傳回至POPM執行結果的分析及
測試記錄的輸出模組架構如圖 15所示
圖 15 TSATM 模組架構
21
42 系統設計
本章節將以PRPM的類別圖(class diagram)描述本系統的靜態結構並描述各物件之定
義內容特性與關係並依據外界行為及時間順序用循序圖(sequence diagram)描述本系統
內各物件之間的互動關係最後以狀態圖(state diagram)來描述系統因為於外界觸發而造
成的狀態轉換及回應
421 前置處理模組 (Pre-processing Module PRPM)
PRPM 接收原始程式碼透過程式碼管理器 (Code Manager)來剖析 (parse)及切割
(tokenize)原始程式碼CodeParser 擷取出程式的資訊(例如 function 名稱參數key-word)
給 UnitTestCaseGenerator 來自動產生 test case 並且找出需 instrument 程式片段的位置使得
InstrumentCodeEditor 能產生測試所需的 instrumented code此外測試工程師也可透過一個
介面自行輸入 test case 及 instrument code 所需的資訊class diagram 如圖 16 所示
圖 16 PRPM 模組的 class diagram
關於每一個 Class 的內容描述說明如表 1
22
表 1 PRPM class diagram 說明類別物件 說明
CodeManager 讀取待測程式可依使用者需求來驅動不同的測試 CodeParser 對來源程式碼進行切割及擷取資訊function的型態參數回傳值
並可擷取出使用者自行定義的test case和程式片段所插入的正確位置
ParseInformation 為一資料儲存結構記錄所有function的資訊 TestCaseEditor 一個可讓使用者自行定義的test case編輯器此編輯器可將使用者所
輸入的測試input資料及synchronize test sequence寫入測試案例的檔案
InstrumentCodeEditor 可讓使用者依指定的條件(function name等等)插入程式片段TestCaseGenerator 可依使用者需求自動產生測試案例UnitTestCaseGenerator 自動產生以隨機方式產生的input data
關於PRPM模組的sequencial diagram如圖 17所示下列將說明目的及執行的步驟
Scenario 1
目的自動產生test case
Step 1 Code Manager讀取待測程式碼
Step 2 CodeParser剖析並擷取出程式的function名稱參數程式內部結構及其他相關等資
訊
Step 3 UnitTestCaseGeneratror依據step3剖析後所擷取的資訊來做分析
Step 4 UnitTestCaseGeneratror分析程式後自動產生test data
Step 5 UnitTestCaseGeneratror針對class method來產生test case並寫入檔案
圖 17 Sequence diagram - 自動產生 test case
23
PRPM模組的state diagram如圖 18所示
圖 18 PRPM 模組的 state diagram
對於上圖各向外界觸發所造成的狀態轉換和反應相關說明如表 2所示
表 2 PRPM 狀態轉換和反應狀態 說明
Read file 讀取測試所需檔案狀態直到讀取完畢 Scan and analysis program info 掃描及分析待測程式狀態擷取測試所需資訊Instrument code segment 插入收集測試資訊的程式片段 Generate unit test Case 根據使用者在編輯器上輸入的 test data 來產生
test caseGenerate random test case 針對 coverage test 自動產生亂數的 test data並
產生相對應的 test caseWrite file 寫入檔案的狀態當已產生測試案例及程式片段
已插入待測程式則將其寫入檔案
24
422 主機端自動化測試模組 (Host-Side Auto Test Module HSATM)
在此模組部分AutomaticTestHost 依據測試需求呼叫所需的測試模組並藉由
TestDriverGenerator 會依據 test case 資訊自動產生 test driver最後並將其程式碼編譯成執
行檔傳送給 TSATM本模組會動態通知 Test Case Generation Module以產生新的 test
case來達到動態測試class diagram 如圖 19 所示
圖 19 HSATM模組的class diagram
關於每一個 class 的內容描述說明如表 3
25
表 3 HSATM class diagram 說明 類別物件 說明
AutomaticTestHost 負責將 test driverinstrumented program 編譯成執行檔並傳送至 TSATM 執行測試或與 TSATM 即時傳遞訊息可控制測試執行的開始及結束
FileOperation 主要負責檔案的操作例如讀取 test caseinstrumented program 及測試驅動所需的資訊並將自動產生的 test driver寫入檔案
TestRunner 為一個測試執行介面用來控制測試的執行及停止 SocketClient 主要實作網路 socket 傳輸可傳輸檔案整數字串等資料
型態 TestDriverGenerator 根據使用者測試的需求來自動產生 test driver PerformanceMonitor 可監控軟體在嵌入式平台上執行的效能
關於HSATM模組的sequential diagram如圖 20圖 21所示下列將說明目的及執行的步驟
Scenario 1
目的自動產生 test driver
Step 1 Test Driver Generator讀入PRPM所產生的test case資訊
Step 2 Test Driver Generator 依據剖析test case 資訊產生test driver
Step 3 AutomaticTestHost讀入PRPM所產生的instrumented source code
Step 4 AutomaticTestHost編譯instrumented source code及test driver成Target-Side執行檔
Step 5 AutomaticTestHost將執行檔傳送給TSATM去開始執行測試
Step 6 測試完畢之後接收test log
Step 7 將test log傳送至POPM
圖 20 Sequence diagram - 自動產生 test driver
26
Scenario 2
目的自動量測待測程式執行時 CPU 的使用率並動態顯示結果
Step 1 AutomaticTestHost 產生自動化測試CPU使用率的test driver
Step 2 AutomaticTestHost讀入PRPM所產生的instrumented source code
Step 3 AutomaticTestHost編譯instrumented source code及test driver成Target-Side執行檔並傳
送給TSATM去執行測試
Step 4 AutomaticTestHost將執行檔Host-Side Automatic Test Module接收TSATM即時回傳的
CPU utilization
Step 5 Host-Side Automatic Test Module即時傳送CPU utilization給POPM顯示結果
Step 6 重覆step56直到結束測試
圖 21 Sequence diagram - 效能監控
HSATM模組的state diagram圖 22所示
圖 22 HSATM 模組的 state diagram
對於上圖各項外界觸發所造成的狀態轉換和反應相關說明如表 4所示
表 4 HSATM 狀態轉換和反應 狀態 說明
Read file 讀取 test case 及 instrumented Code 檔案狀態直到讀取完畢Generate test driver 分析待測程式來自動產生 test driver 狀態Compile the program Test driver 及 instrumented source code 程式編譯的狀態 Transfer file 傳送檔案至 TSATM 狀態將其編譯好的 test driver 及 instrument
program 和 test case 傳送至 TSATM 執行測試
27
423 目的端自動化測試模組 (Target-side Auto Test Module TSATM)
本模組為一個測試執行環境透過Target-side Test Controller來觸發Test Driver及Profiler
Manager執行Test Driver會根據手動或自動新增的Test Case即時產生新的Test Input data來
做動態測試在執行測試的程式時Profiler Manager會去觸發Performance Profiler及Test
Coverage Profiler即時收集資料並將測試過程及結果相關的資料記錄在test log上test log可
能存在記憶體中或是一個檔案最後將test log傳回至POPM的Test Log Manager進行下一步執
行結果的分析及測試報告的輸出class diagram如圖 23所示
圖 23 TSATM 模組的 class diagram
關於每一個 class 的內容描述說明如表 5 所示
表 5 TSATM class diagram 的說明類別物件 說明
FileOperation 檔案的讀寫處理TargetSideTestController 負責與 HSATM 溝通即息傳遞訊息並且控制 Test Driver 的執
行及 Profile 收集測試資料FileTransfer 透過 FTP 協定來接收 Test Driver 及 Instrument Program及傳送
Test Log 至 HSATMProfiler 負責收集測試結果的資訊程式是否通過測試及測試的覆蓋率PerformanceMonitorProfiler 收集程式執行的效率其中包含擷取 CPU utilization 及程式執
行時間
關於 TSATM 模組的 sequencial diagram 如圖 21 所示下列將說明目的及執行的步驟
28
Scenario 1
目的自動化多回合測試
Step 1 從 HSATM 接收測試相關資訊(instrumented source codetest driver test case)
Step 2 TargetSideTestController 觸發 Test Driver 開始執行測試
Step 3 TargetSideTestController 觸發 Test Driver 去呼叫 instrumented source code 來測試
Step 4 TargetSideTestController 觸發 Profile Manager 收集測試資料
Step 5 Profiler 一直持續收集測試結果
Step 6 Profiler 將所收集測試資料及結果寫入 test log
Step 7 TargetSideTestController 將測試結果資料傳送給 HSATM
Step 8 重覆執行 step4 至 step7直到使用者停止測試
圖 24 Sequence diagram - 執行自動化多回合測試
TSATM模組的state diagram圖 25所示
圖 25 TSATM 模組的 state diagram
對於上圖各項外界觸發所造成的狀態轉換和反應相關說明如表 6所示
表 6 TSATM 狀態轉換和反應狀態 說明
Receive 系統處在接收檔案狀態直到檔案接收完畢 Run 開始執行 test driver 來測試待測程式 Profile the test information 測試程式執行時收集測試結果Send test log 測試執行完畢將其 test log 傳送至 HSATM
29
424 後置處理模組 (Post-processing Module POPM)
本模組主要是在分析及處理測試的結果將其測試結果分類成各個項目並產生文字及
圖形的報表TestLogParser 會依據 test log 的資訊來分類分別為單元測試覆蓋測試效能
量測並即時將分析的結果動態的回饋給 PRPM 及 HSATM做為下一步測試的參考
PaintChart 可依據測試需求來採取動態或靜態顯示測試結果class diagram 如圖 26 所示
圖 26 POPM 模組的 class diagram
關於每一個 class的內容描述說明如表 7
表 7 POPM class diagram 說明類別物件 說明
FileIO 檔案讀寫的處理讀寫測試記錄寫入測試結果等等PaintChart 負責顯示圓餅圖直方圖或線條圖的視覺化介面JfreeChart 呼叫繪圖的函示庫可畫出圓餅圖直方圖或線條圖PerformanceMonitorLogParser 剖析 performance monitor log取得效能量測資訊UnitTestLogParser 剖析 cppunit 測試結果擷取出 test case 測試的結果CoverageTestLogParser 剖析 coverage 測試結果擷取出 line coverage 及 branch
coverage
關於 POPM 的 sequencial diagram 圖 27 所示下列將說明目的及執行的步驟
30
Scenario 1
目的動態顯示圖形化的測試結果
Step 1 TestLogParser讀取TSATM所回傳的test log
Step 2 TestLogParser取得測試結果的種類並將其寫入testResultInfotestLogInfo及
TestDriverLog
Step 3 當測試完成PaintChart讀取testResultInfo
Step 4 PaintChart依據測試需求顯示不同的視覺化測試報告
圖 27 Sequence diagram -產生測試報告
POPM模組的state diagram如圖 28所示
圖 28 POPM模組的state diagram
對於上圖各項外界觸發所造成的狀態轉換和反應相關說明如表 8所示
表 8 POPM 狀態轉換和反應狀態 說明
Read file 系統處在讀取檔案狀態直到檔案讀取完畢 Test log analysis 開始進行 test log 分析將其測試結果分類整理 Feedback to PRPM 將其測試案例分析結果資訊傳送至 PRPMFeedback to HSATM 將其 test driver 分析結果資訊傳送至 HSATM Report view 當測試執行完畢將其測試結果以文字及圖形化方式顯示出來
31
第五章 實驗設計與實驗結果分析
51 實驗環境
我們將 ATEMES 系統分為 Host-Side 及 Target-SideHost-Side 以 JAVA 程式開發而
Target-Side 則以 C++開發兩端以網路 socket 傳遞訊息嵌入式系統平台為 ARM 11 MPCore
baseboard四核心的 CPU我們在嵌入式開發板上執行單元測試覆蓋率測試在效能量測
部分可監控每個核心的使用率使測試工程師可以了解軟體在嵌入式平台上執行效能為何
並且可量測 TBB pipeline 平行化的效率以下將列出我們所使用的軟硬體平台
1 主機端硬體平台 Intelreg Coretrade 2 Duo CPU P8400
2 主機端作業系統 Linux Ubuntu 910
3 目標端硬體平台 The platform baseboard for ARM 11 MPCore with 4
ARM11MPCore CPUs
4 目標端作業系統 Linux Kernel 2624
52 系統使用介面展示
在本節中我們展示 ATEMES system 實際使用的過程步驟說明如下
Step 1 在 Host-side 執行 ATEMES system選擇專案執行路徑如圖 29 所示
圖 29 開啟測試專案介面
32
Step 2 開啟測試程式編輯介面左邊可列出所有待測程式的檔案右邊可列出所選
擇的待測程式的 source code使用者可在此編輯新增刪除待測程式的
source code如圖 30 所示
圖 30 待測程式編輯介面
Step 3 測試工程師可以使用rdquoTest Case and Driver Generatorrdquo功能自動產生 test case
及 test driver 的 source codeATEMES 在執行rdquoTest Case and Driver Generatorrdquo
功能時rdquoCode Analyzerrdquo會去 parse 待測程式的所有 method 的 signature包
含 method nameparameter typereturn type 等資訊並自動產生 test case and
test driver作為呼叫待測程式及讀 test data 用此外使用者也可以再編輯
待測程式中每個 function 的 test case如圖 31 所示左邊可列出所有待測
程式的檔案右邊為系統自動產生的 test case 的 source code
圖 31 Test case 和 test driver 產生器介面
33
Step 4 測試工程師可以使用rdquoGenerate Random Test Caserdquo功能來自動產生隨機測
試案例且使用者可自行決定測試案例產生的數目如圖 32 所示
圖 32 產生 test case 選單介面
Step 5 測試工程師可以使用rdquoRun Coverage Testrdquo功能執行 Coverage Test系統會
自動將待測試程式test case and test driver 做 cross-compile並將執行檔及
test data file 傳送至 target-side (embedded system)執行測試工作測試工作可
以是 single-round也可做 multi-round 的測試在測試時測試工程師可在
host-side 即時的觀察及接收測試結果如圖 33 所示
圖 33 執行 coverage test 選單介面
Step 6 測試工程師可以使用rdquoRun Unit Testrdquo功能如圖 34 所示執行 Unit Test
測試工程師可根據待測程式裡的 function新增編輯 test driver 所要讀入
的 test data and result編輯完成即產生 test case and test driver 的 source
code系統會自動將待測試程式test case and test driver 做 cross-compile
並將執行檔及 test data file 傳送至 target-side (embedded system)執行並等待
接收測試結果
34
圖 34 執行單元測試選單介面
Step 7 ATEMES system 在執行測試時target-side 的 Profiler 會在 runtime 時收集資
訊並傳回 host-sidehost-side 會即時的將 test result information 做分析並
做視覺化的呈現如圖 35 所示為執行 coverage testingunit testing
performance monitorpipeline performance monitor 的結果
圖 35 測試結果視覺化介面
35
53 實驗及分析
本章節將做六組實驗分別為以 CC++資料結構範例執行自動化覆蓋率測試及單元測
試以矩陣相乘平行程式範例執行多核心效能監控最後以 TBB pipeline 實作影像處理範例
針對不同 CPU core 數目的 TBB pipeline 效能量測及針對不同的 stage 數目的 TBB pipeline
效能量測
531 實驗一 - 自動化覆蓋率測試
本實驗以 13 個 functions 當做待測程式為挑自 CC++資料結構參考書籍的範例程式碼
參數輸入的型態包含 primitive type 及 object type測試環境採用 random testing 的方式產生 test
data對每一個 function 而言每一回合產生 3 組 test data執行 20 回測試在 runtime 時
使用者可觀察每一回合的 test coverage 圖 36 及最後的測試結果系統並會記錄每一回合程式
執行的資訊包含 line coveragebranch coverageexecuting time 及失敗的 test case 內容等
實驗結果
由圖 36表 9表 10 所示就 insertion_sort()而言當到第五回合line coverage 及 branch
coverage 皆可達到 100每一個 round 測試完成後就其它 function 而言對於 line coverage
及 branch coverage 皆有提升但是就 fractionCalculator()來看 line coverage 和 branch coverage
到了第四回合時為 92及 65且 coverage 很難再提升會有這樣的瓶頸是因為我們所採
用的演算法為 random testing我們將會再利用其它的演算法來提升 coverage
36
圖 36 Coverage test 測試結果介面
表 9 Line Coverage 測試結果 Round
Function 1st 2nd 3rd 4th 5th 6th 7th 8th 9th 10th 20th
seqsearch 92 100 100 100 100 100 100 100 100 100 100binsearch 79 100 100 100 100 100 100 100 100 100 100insertion_sort 91 91 91 91 100 100 100 100 100 100 100merge 100 100 100 100 100 100 100 100 100 100 100merge_pass 92 100 100 100 100 100 100 100 100 100 100merge_sort 92 100 100 100 100 100 100 100 100 100 100quicksort 26 100 100 100 100 100 100 100 100 100 100heapsort 92 92 92 92 92 92 92 92 92 100 100adjust 100 100 100 100 100 100 100 100 100 100 100rollDiceGame 72 83 83 83 83 94 94 94 100 100 100getRollDiceSum 100 100 100 100 100 100 100 100 100 100 100fractionCalculator 55 63 80 92 92 92 92 92 92 92 92Execute Time (ms) 958 907 939 889 980 891 994 926 1006 977 909
表 10 Branch Coverage 測試結果
Round Function 1st 2nd 3rd 4th 5th 6th 7th 8th 9th 10th 20th
seqsearch 83 100 100 100 100 100 100 100 100 100 100binsearch 60 90 90 90 90 90 90 90 90 90 90insertion_sort 90 90 90 90 100 100 100 100 100 100 100merge 100 100 100 100 100 100 100 100 100 100 100merge_pass 88 100 100 100 100 100 100 100 100 100 100merge_sort 75 100 100 100 100 100 100 100 100 100 100quicksort 17 100 100 100 100 100 100 100 100 100 100heapsort 83 83 83 83 83 83 83 83 83 100 100adjust 100 100 100 100 100 100 100 100 100 100 100rollDiceGame 64 82 82 82 82 91 91 91 100 100 100getRollDiceSum 100 100 100 100 100 100 100 100 100 100 100fractionCalculator 29 41 53 65 65 65 65 65 65 65 65Execute Time(ms) 958 907 939 889 980 891 994 926 1006 977 909
37
532 實驗二 - 單元測試實驗
本實驗同樣以實驗一的 functions 當做待測程式經過我們測試環境分析原始程式碼後
自動找出要需要測試的 function並可利用 test data 編輯介面由使用者輸入所需的 test data
及預期結果值接著本系統會自動產生 test cases 及 test drivers並自動做 cross-compile
上傳測試執行檔至 ARM 11 MPCore platform當傳送成功將會自動開始測試工作測試結果
的資訊也是可在測試執行時傳回 host-site 做即時的分析系統並會記錄每一回合程式執行的
資訊包含執行時間成功的 test case 及失敗的 test case 內容等
實驗結果
如表 11 所示以文字描述測試結果包含了測試案例成功失敗錯誤的資訊在介面
的右邊則以圓餅圖總結測試結果以本實驗為例通過的測試案例總共佔 67 (20 test cases)
失敗的測試案例總共佔 165 (5 test cases)最後為發生錯誤的 test case 總共佔 165 (5 test
cases)
圖 37 Unit test 測試結果介面
38
表 11 單元測試結果
Function name Test case
0 1 2 3 4
getSubString success exception out of range
success success exception out of range
electricityTraiff success assertion failed
success assertion failed
success
factorial success success assertion failed
assertion failed
success
insertion_sort success success Segment fault
Segment fault Segment fault
seqsearch success success success success success fractionCalculator success assertion
failed success success success
533 實驗三 - 多核心效能監控
本實驗將測試 2 維矩陣乘法運算的範例程式效能矩陣大小為 256128 及 128256本
系統將會自動分析待測程式碼並 instrument 程式片段使得能夠監控執行時間並且自動
將 cross-compile 後的測試執行檔上傳至 ARM 11MPCore 開發板上自動執行測試在程式執行
時使用者能夠即時觀看 CPU 每個核心的使用率且同時測試結果也會自動回傳至 Host-Side
做即時的分析
實驗結果
程式執行的效能如圖 38及表 12所示由圖 38可以看出core 1的效能一直保持穩定狀
態而core 2使用率較低由表 12可以看出對於CPU平均的使用率core 3和core 4相對於
另外兩個核心還要高再來為core1最後為core4如此一來可以清楚看出程式執行時使
用core3及core4為最頻繁的且可發現對於CPU的使用率還有可以加強的地方
39
(a) (b)
(c) (d)
圖 38 多核心 CPU 使用率視覺化介面
表 12 Multi-core CPU utilizationCore No Average () Max () Min () core 1 2505969 28 22core 2 1897810 62 0core 3 2993431 76 0core 4 3105839 75 0
40
534 實驗四 - 不同 CPU core 數目在 TBB pipeline 技術下的效能量測
本實驗主要目的為運用我們所發展的工具來觀測 TBB pipeline 技術在不同的 CPU core 數
目執行的效率且不同的 token 數對效能的影響以 TBB 使用影像處理範例將不同階段的
影像處理以 pipeline 方式處理預處理的圖片大小為 12801024對影像做邊緣化及去雜訊
在此我們將 pipeline 分為四個階段分別為讀取影像邊緣化去雜訊輸出影像讀取影
像輸出影像我們設定以循序方式執行(serial)而邊緣化去雜訊為平行處理(parallel)本系
統將會自動產生 pipeline token number 的 test case每個 test case 為 100 組資料集合分別為
123hellip100 的 token 數目自動執行多回合效能量測並找出一個建議的 pipeline 平行化門
檻值及顯示各個 CPU 核心數的使用率
實驗結果
實驗結果如圖 39 所示我們可以得知使用的 CPU core 數目越多則效率越高以 pipeline
token 數來看當 token 數小於 5 時效率皆較差當 token 數大於 5 時則效率明顯提升很多
因此我們可以發現 pipeline token 數越多則效率越佳但對於 TBB pipelinetoken 數到了某個
數目則不會再有明顯的效率提升反而會增加系統的負擔以下(1)~(4)我們將分別說明以不
同的 CPU core 數及不同的 token 數執行狀況及建議使用的 token 數目
圖 39 TBB pipeline 以 1~4 CPU core 執行的效能量測
41
(1) TBB pipeline 效能量測 1 - 以 1 個 CPU core 執行
如圖 40 所示待測程式平均執行時間約為 271 秒當 pipeline token 數為 1 效率最差需
463 秒才執行完成而 pipeline token 數大約為 21 至 25 時能達到較高的效率pipeline token
數大於 21 皆到平穩狀態很難再提升效率了在 CPU 的使用率如表 13 所示core 1core2
core 4 的使用率階不高這是因為我們設定軟體執行時使用的 CPU core 數目為 1core 2 的平
均使用率最高
圖 40 TBB pipeline 以 1 個 CPU core 執行的效能量測
表 13 以 1 個 CPU core 執行 TBB pipeline 的 CPU utilization 效能量測 CPU utilization
Core No Min () Max () Average ()
core 1 0 30 25 core 2 0 100 99 core 3 0 0 0 core 4 0 0 0
(2) TBB pipeline 效能量測 2 - 以 2 個 CPU core 執行
如圖 41 所示待測程式平均執行時間約為 127 秒當 pipeline token 數為一時效率最差
需 239 秒才執行完成而 pipeline token 數大約為 26 至 30 時能達到較高的效率pipeline token
數大於 26 皆到平穩狀態很難再提升效率了在 CPU 的使用率如表 14 所示core1 及 core2
及 core3 的使用率平穩core4 的平均使用率最低
42
圖 41 TBB pipeline 以 2 個 CPU core 執行的效能量測
表 14 以 2 個 CPU core 執行 TBB pipeline 的 CPU utilization 效能量測 CPU utilization
Core No Min () Max () Average ()
core 1 0 57 49 core 2 0 100 99 core 3 0 100 99 core 4 0 0 0
(3) TBB pipeline 效能量測 3 - 以 3 個 CPU core 執行
如圖 41 所示我們可以看出效率有明顯的改進待測程式平均執行時間約為 85 秒當
pipeline token 數為 1 效率最差需 225 秒才執行完成而 pipeline token 數大約為 36 至 40 時
能達到較高的效率pipeline token 數大於 36 皆到平穩狀態很難再提升效率了在 CPU 的
使用率如表 15 所示core1corecore3 及 core4 的 CPU 使用率平均皆算高效率較好
圖 42 TBB pipeline 以 3 個 CPU core 執行的效能量測
43
表 15 以 3 個 CPU core 執行 TBB pipeline 的 CPU utilization 效能量測 CPU utilization
Core No Min () Max () Average ()
core 1 0 78 68 core 2 0 100 85 core 3 0 100 90 core 4 0 100 96
(4) TBB pipeline 效能量測 4 - 以 4 個 CPU core 執行
如圖 43 所示我們可以看出效率有明顯的改進待測程式平均執行時間約為 71 秒當
pipeline token 數為 1 效率最差需 200 秒才執行完成而 pipeline token 數大約為 31 至 35 時
能達到較高的效率pipeline token 數大於 30 皆到平穩狀態很難再提昇效率了在 CPU 的
使用率如表 16 所示4 個 core 的使用率平均算高執行的效率最好
圖 43 TBB pipeline 以 4 個 CPU core 執行的效能量測
表 16 以 4 個 CPU core 執行 TBB pipeline 的 CPU utilization 效能量測 CPU utilization
Core No Min () Max () Average ()
core 1 0 100 91 core 2 0 100 72 core 3 0 100 95 core 4 0 100 99
44
535 實驗五 - TBB pipeline 效能分析
本實驗將以 TBB pipeline 實作影像處理程式測試不同的 stage 數目的效能為何並使用
4 個 CPU core 執行預處理的影像大小為 128128共執行 12 種不同的影像處理主要工作為
以不同的演算法達到影像的邊緣化(gradientlaplacianPrewitt)去雜訊(smoothmedian)
去除影像不連續的接點(erosiondilation)細線化(thinning)旋轉(rotation)及二值化(threshold)
在 pipeline 中需循序處理的包含讀取影像輸出影像可平行處理的為 gradientlaplacian
Prewittthinningsmoothmedianerosiondilationrotationthreshold量測的 stage 數目
為 1~12在此我們去比較 1~12stage 的執行時間CPU 使用率並量測出一個建議的 pipeline
token 數
實驗結果
圖 44表 17 為 1-12 個 stage 分別輸入 1-36 個 token 數的執行時間由此可以看出當
使用 1 個 stage 時效率最差其次為使用 2 個 stage且當 stage 的數目大於 3 時程式所執行
的時間都是差不多的圖 45~圖 56 將個別列出使用不同 stage 及不同 token 數的執行時間分
布
圖 44 TBB pipeline 1~12 stage 效能量測
45
由於本實驗其中包含影像的輸入及輸出因此只使用 1 個 stage 及 2 個 stage 執行 pipeline
為循序執行導致執行的時間較慢如圖 45圖 46而其它 stage 數執行的時間的差距不
大表 18 為本實驗針對 stage1 至 stage12 所建議的 token 數
表 17 TBB pipeline 1~12 stage 執行時間Token No
Stage No 1 2 3 4 5 6 7 8 9 10 11 12 13 14 15 20 25 30 35 36
1 9578 9016 9575 8947 8902 8867 9595 9123 8877 9603 9259 8914 8890 8914 8897 9023 8895 8940 9042 8945
2 9028 9037 8958 9054 9039 9190 9230 9084 9004 9022 9176 9037 9090 9114 9100 9076 9011 9035 9077 9145
3 8942 4633 3679 2777 2734 2797 2713 2766 2716 2776 2746 2812 2738 2768 3018 2744 2726 2703 2708 2810
4 8988 4751 3579 2826 2702 2721 2754 2710 2863 2700 2768 2722 2736 2751 2729 2706 2687 2689 2725 2693
5 9304 4613 3709 3055 2802 2723 2724 2731 2710 2704 2680 2779 2709 2763 3025 2702 2714 2670 2839 2685
6 9220 4797 3649 3759 3833 3435 3380 3674 3551 3369 3309 3509 3565 3576 3429 3486 3385 3414 3431 3562
7 9235 4693 3586 2778 2981 2861 2726 2751 2710 2803 2938 2744 2722 2732 2710 2754 2726 2755 2749 2742
8 9188 5042 3605 2834 2753 2760 2750 2732 2793 2753 2720 2719 2696 2749 2744 2757 2842 2729 2745 2732
9 9030 4848 3612 2708 2757 2848 2994 2739 2783 2693 2751 2784 2601 2755 2734 2715 2732 2707 2808 2750
10 8995 4579 3859 2823 2951 2740 2743 2758 2738 2701 2738 2701 2699 2784 2757 2842 2732 2904 3007 2772
11 8986 4800 3704 3035 2724 2773 2720 2747 2749 2718 2752 2731 2779 2771 2718 2866 2719 2756 2771 2711
12 8876 4889 3664 2917 2847 2773 2756 2763 2801 2718 2745 2753 2712 2769 2804 2717 2763 2712 2759 2722
單位毫秒
表 18 TBB pipeline 1~12 stage 建議的 token 數
Stage No 1 2 3 4 5 6 7 8 9 10 11 12
Token No 2~6 5~10 5~10 5~10 6~9 7~11 7~11 8~12 4~8 4~8 5~10 7~11
圖 45 使用 1 個 pipeline stage 執行的時間 圖 46 使用 2 個 pipeline stage 執行的時間
46
圖 47 使用 3 個 pipeline stage 執行的時間 圖 48 使用 4 個 pipeline stage 執行的時間
圖 49 使用 5 個 pipeline stage 執行的時間 圖 50 使用 6 個 pipeline stage 執行的時間
圖 51 使用 7 個 pipeline stage 執行的時間 圖 52 使用 8 個 pipeline stage 執行的時間
47
圖 53 使用 9 個 pipeline stage 執行的時間 圖 54 使用 10 個 pipeline stage 執行的時間
圖 55 使用 11 個 pipeline stage 執行的時間 圖 56 使用 12 個 pipeline stage 執行的時間
54 實驗分析及討論
實驗一及實驗二的實驗結果說明了我們所開發的系統是可運作的而且由於自動及半自
動的產生 test data自動的產生 test cases 及 test drivers 及多回合測試的機制且測試皆以視
覺化介面表現測試結果能方便並減輕使用者的負擔實驗三說明了在程式執行時可動態監
控 CPU 使用率能使得測試工程師容易得知軟體在嵌入式板上執行的效能更容易去改進
軟體效能最後實驗四及五為測試 TBB 平行化的效率讓測試工程師得知一個建議的 token
數使得測試工程師不需花額外時間測試 TBB pipeline 平行化的效率
48
第六章 結論與未來發展方向
61 結論
本研究建構了一個支援嵌入式軟體開發的 cross-testing 的自動化測試環境系統此系統能
根據剖析原始碼後的資訊能自動 instrument source code自動產生 test casetest driver 及支
援自動產生 primitive typesstructure types and object types 的 test data但對於 CC++template
型態指標型態尚未完全支援本系統能提供單元測試覆蓋測試及平行程式(TBB)效能量測
及監控測試結果也能以視覺化圖形顯示並且也能提供自動執行多回合測試機制此外
我們在 ARM11 的多核心平台上做實際的測試在實驗一及實驗二中我們針對 CC++資料
結構範例程式進行測試測試結果呈現我們所發展的系統是可運作的實驗三為監控平行測
試在嵌入式平台上執行的 CPU 使用率使得測試工程師能夠清楚了解軟體執行狀況實驗四
及實驗五為 TBB pipeline 平行效率自動化測試可使測試工程師不需花額外的時間手動輸入
test data 來測試 TBB pipeline 效率利用我們所開發出來的系統來減少測試的負擔並增加測
試的效率
62 未來發展方向
本研究目前是採用 random testing 的方式未來我們將發展更精準的演算法來自動產生
input datatest case 及 test driver例如支援自動產生 CC++template 或指標的 test data 方法
此外也將針對多核心嵌入式軟體擴充系統測試的功能例如增加 multi-thread 的 race
condition detector 功能在 TBB 的 pipeine 平行效率量測精準度的部分可加入其它判斷條件
例如CPU 的延遲時間或等待時間
49
參考文獻
[1] Y Yongfeng and L Bin A Method of Test Case Automatic Generation for Embedded
Software in 2009 International Conference on Information Engineering and Computer
Science (ICIECS 2009) 2009 pp 1-5
[2] G Tassey The economic impacts of inadequate infrastructure for software testing
National Institute of Standards and Technology Tech RepMay 2002
[3] P S Brent Hailpern Software Debugging Testing and Verification IBM Systems Journal
vol 41 pp 4-12 2002
[4] R-K Doong and P G Frankl The ASTOOT approach to testing object-oriented
programs ACM Trans Softw Eng Methodol vol 3 pp 101-130 1994
[5] P Godefroid et al DART directed automated random testing presented at the
Proceedings of the 2005 ACM SIGPLAN conference on Programming language design and
implementation Chicago IL USA 2005
[6] D L Bird and C U Munoz Automatic generation of random self-checking test cases
IBM Syst J vol 22 pp 229-245 1983
[7] G J Myers The Art of Software Testing second ed New York John Wiley amp Sons Inc
2004
[8] R Hamlet Random Testing in Encyclopedia of Software Engineering John Wiley amp
Sons 1994 pp 970--978
[9] P Carlos et al Feedback-Directed Random Test Generation presented at the Proceedings
of the 29th international conference on Software Engineering 2007
[10] K P Chan et al Restricted random testing adaptive random testing by exclusion
International Journal of Software Engineering and Knowledge Engineering vol 16 pp
553-584 2006
[11] T Y Chen et al Adaptive Random Testing The ART of test case diversity Journal of
Systems and Software vol 83 pp 60-66 2010
[12] T Y Chen et al Adaptive Random Testing in Advances in Computer Science - ASIAN
2004 2005 pp 320-329
[13] X Wu et al Coverage-Based Testing on Embedded Systems presented at the
Proceedings of the Second International Workshop on Automation of Software Test 2007
[14] S Koushik et al CUTE a concolic unit testing engine for C presented at the
Proceedings of the 10th European software engineering conference held jointly with 13th
ACM SIGSOFT international symposium on Foundations of software engineering Lisbon
Portugal 2005
50
[15] M Roper Software testing London New York McGraw-Hill 1994
[16] J B Michael et al Metrics for measuring the effectiveness of software-testing tools in
Software Reliability Engineering 2002 ISSRE 2002 Proceedings 13th International
Symposium on 2002 pp 117-128
[17] L Zhenyu An Automate Test Case Generation Approach Using Match Technique 2005
pp 922-926
[18] Q Yang et al A Survey of Coverage-Based Testing Tools The Computer Journal p
bxm021 May 25 2007 2007
[19] H Shih-Hao New Tracing and Performance Analysis Techniques for Embedded
Applications 2008 pp 143-152
[20] R Per (2006) A Survey of Unit Testing Practices 22-29 Available
httpdoiieeecomputersocietyorg101109MS200691
[21] K Claessen and J Hughes QuickCheck a lightweight tool for random testing of Haskell
programs presented at the Proceedings of the fifth ACM SIGPLAN international
conference on Functional programming 2000
[22] M E Delamaro et al A strategy to perform coverage testing of mobile applications
presented at the Proceedings of the 2006 international workshop on Automation of software
test Shanghai China 2006
[23] K Yuhoon et al Tool support for new test criteria on embedded systems Justitia
presented at the Proceedings of the 2nd international conference on Ubiquitous information
management and communication Suwon Korea 2008
[24] Y Cho and J Choi An Embedded Software Testing Tool Supporting Multi-paradigm
Views 2008 pp 780-789
[25] Pin - A Dynamic Binary Instrumentation Tool Available httpwwwpintoolorg
[26] CppUnit Available httpcppunitsourceforgenet
[27] GCOV Available httpgccgnuorg
[28] Intelreg Threading Building Blocks (TBB) Available
httpwwwthreadingbuildingblocksorg
- fb160412152156
- fb160412152159
- fb160412152202
- fb160412152204
- fb160412152207
- fb160412152210
- fb160412152212
- fb160412152214
-
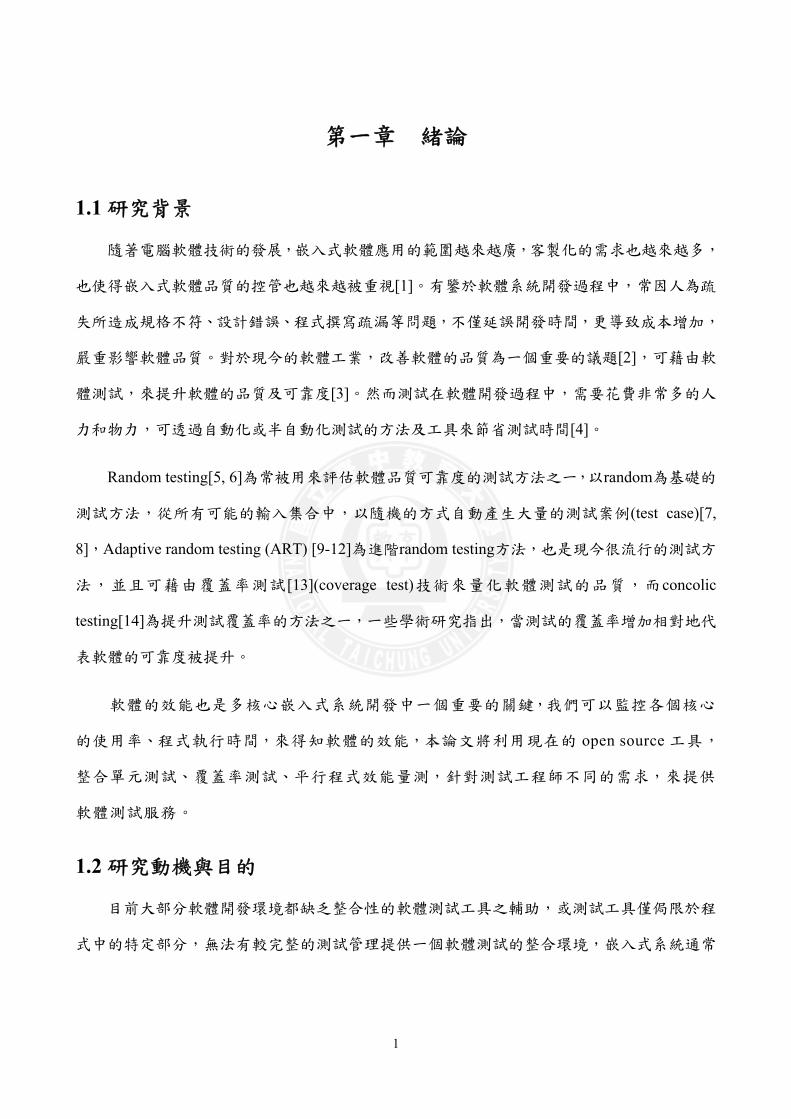
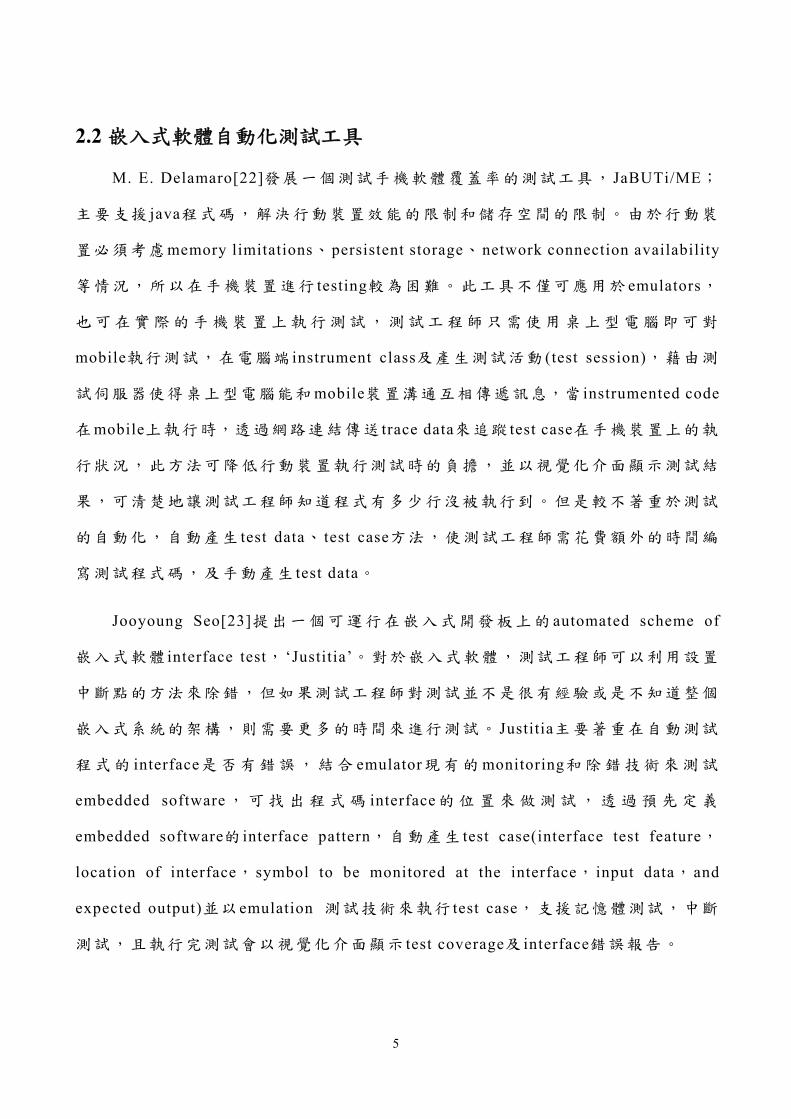
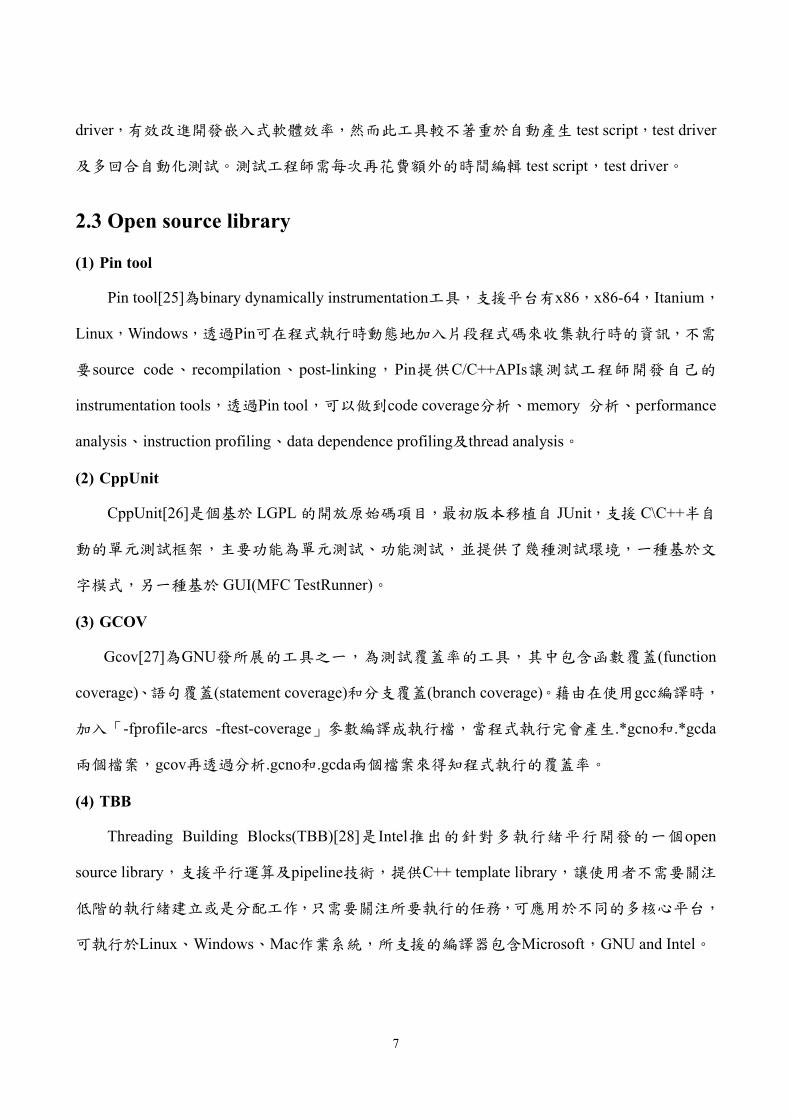
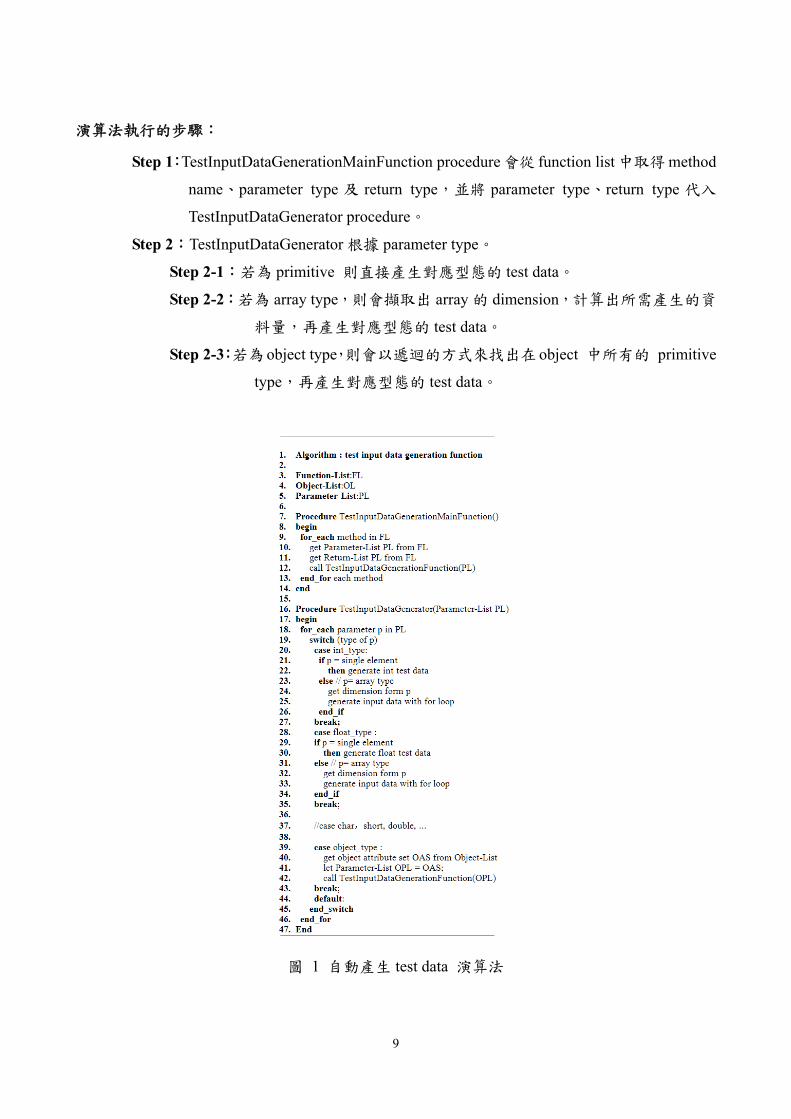
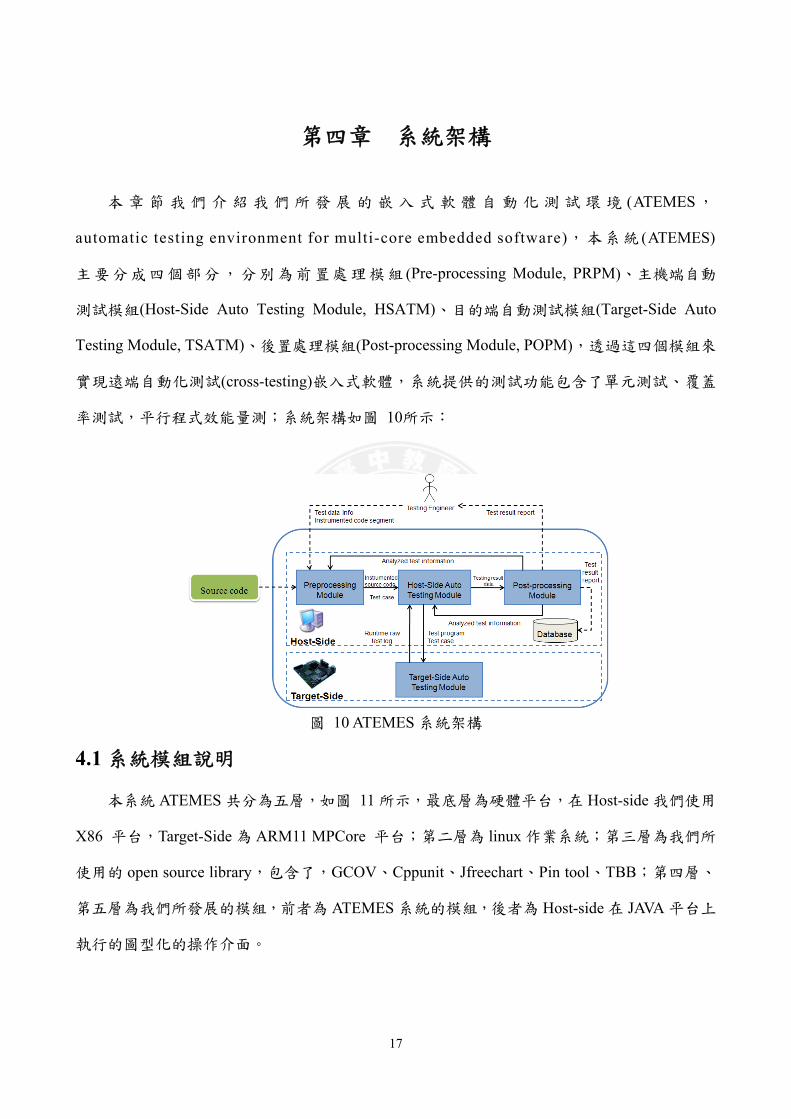
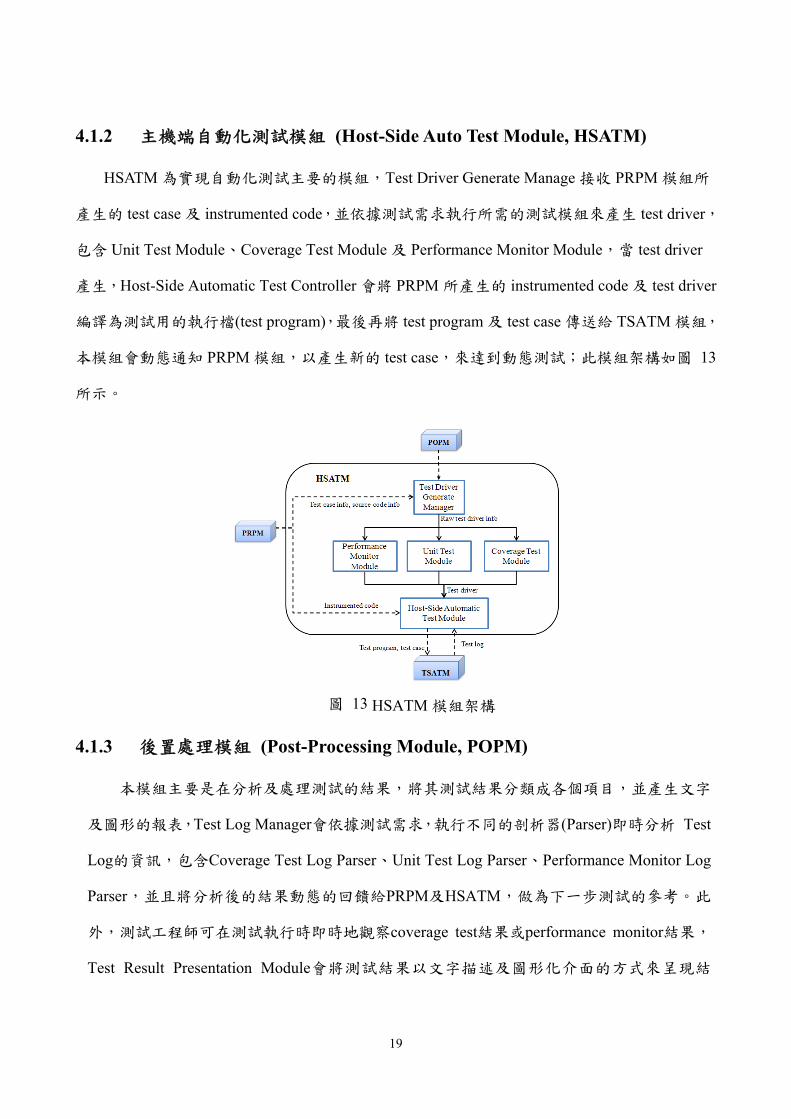
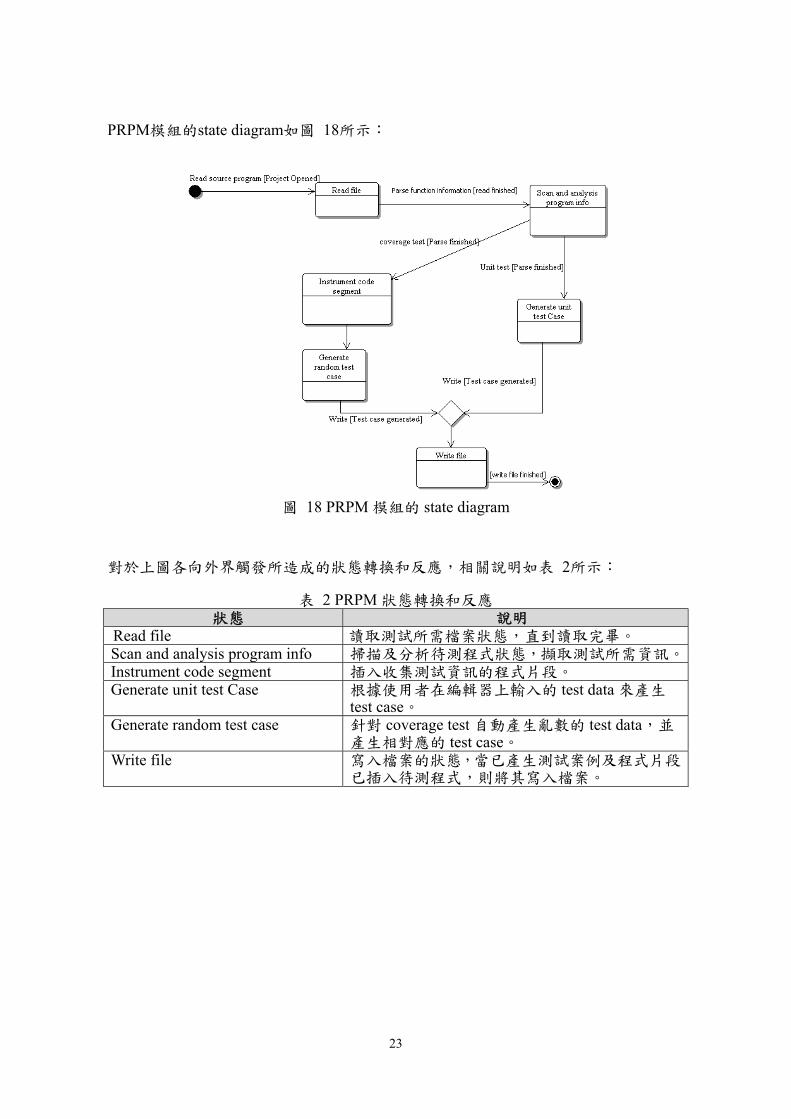
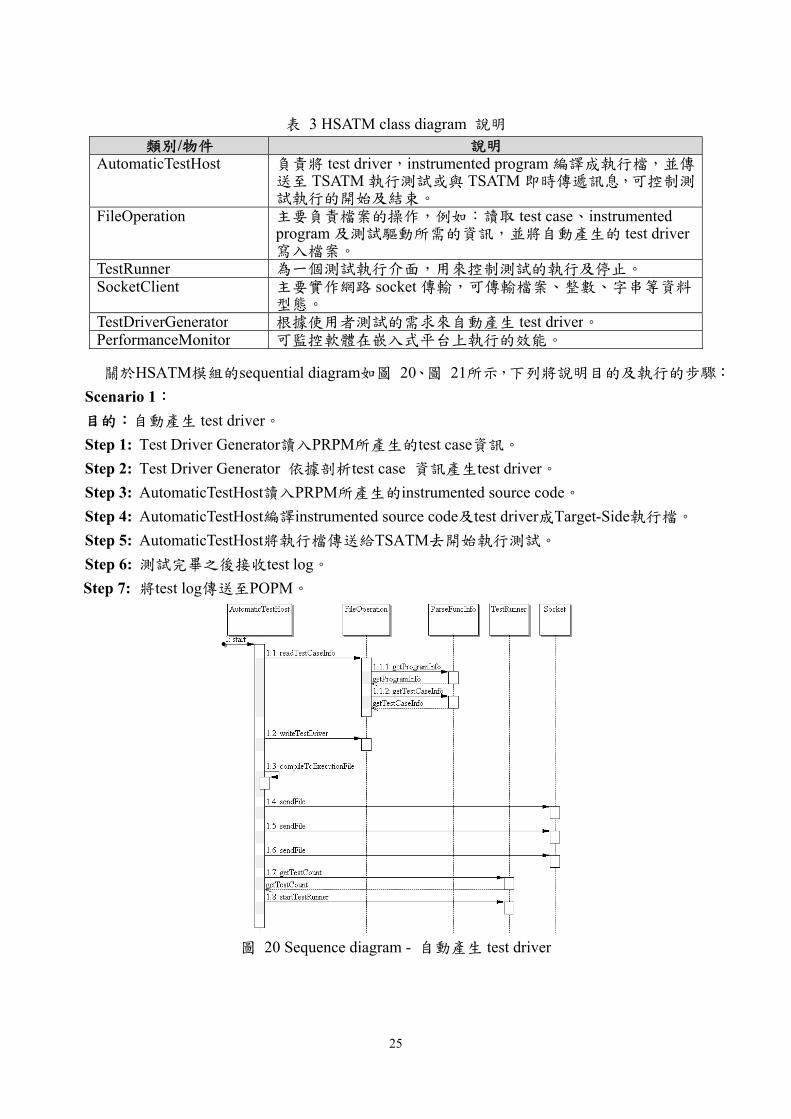
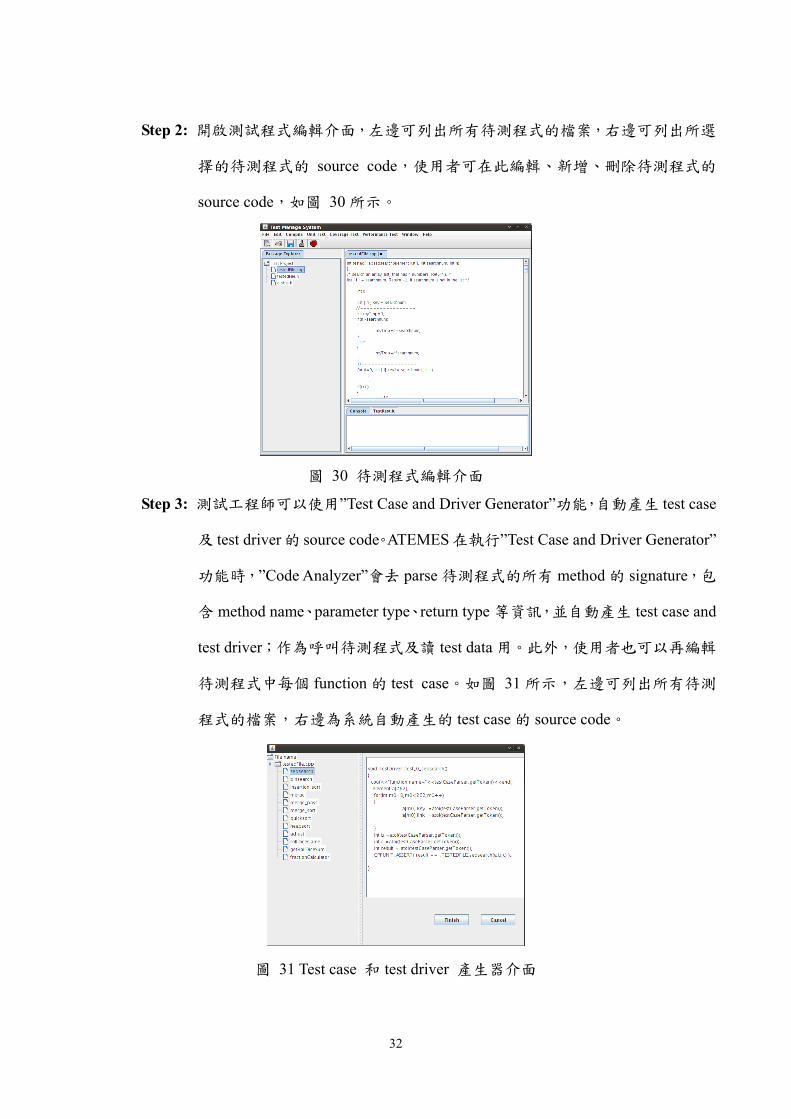
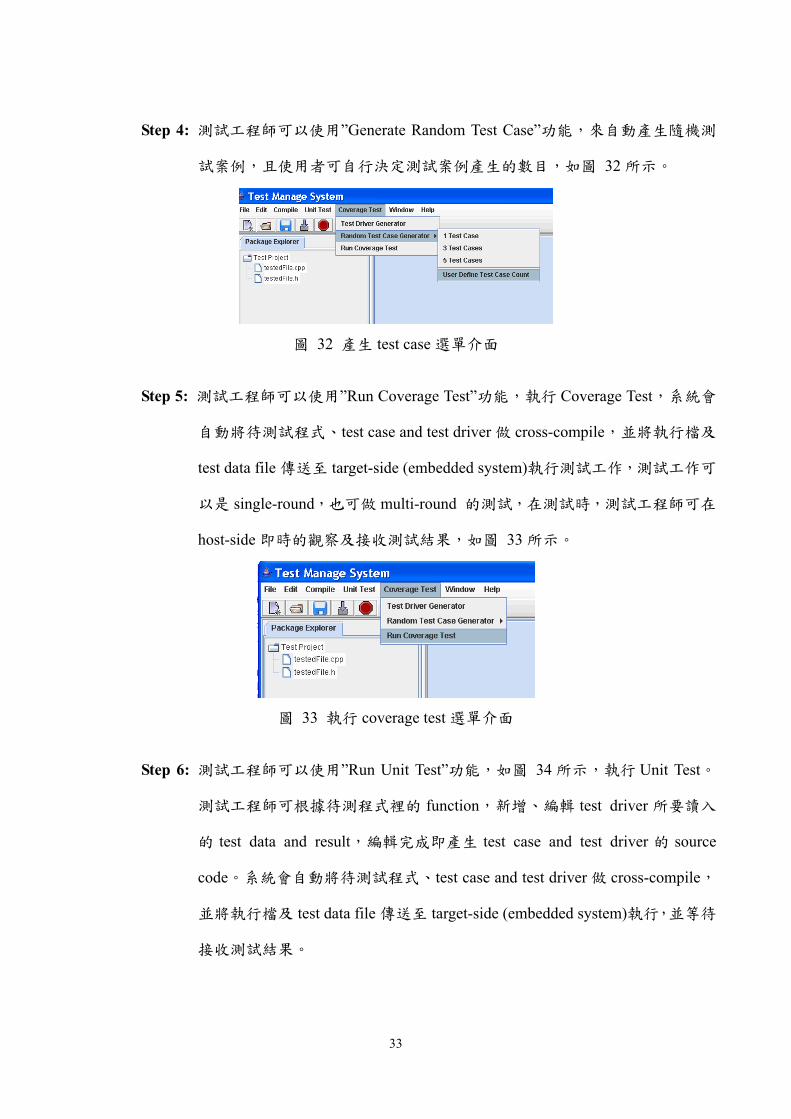
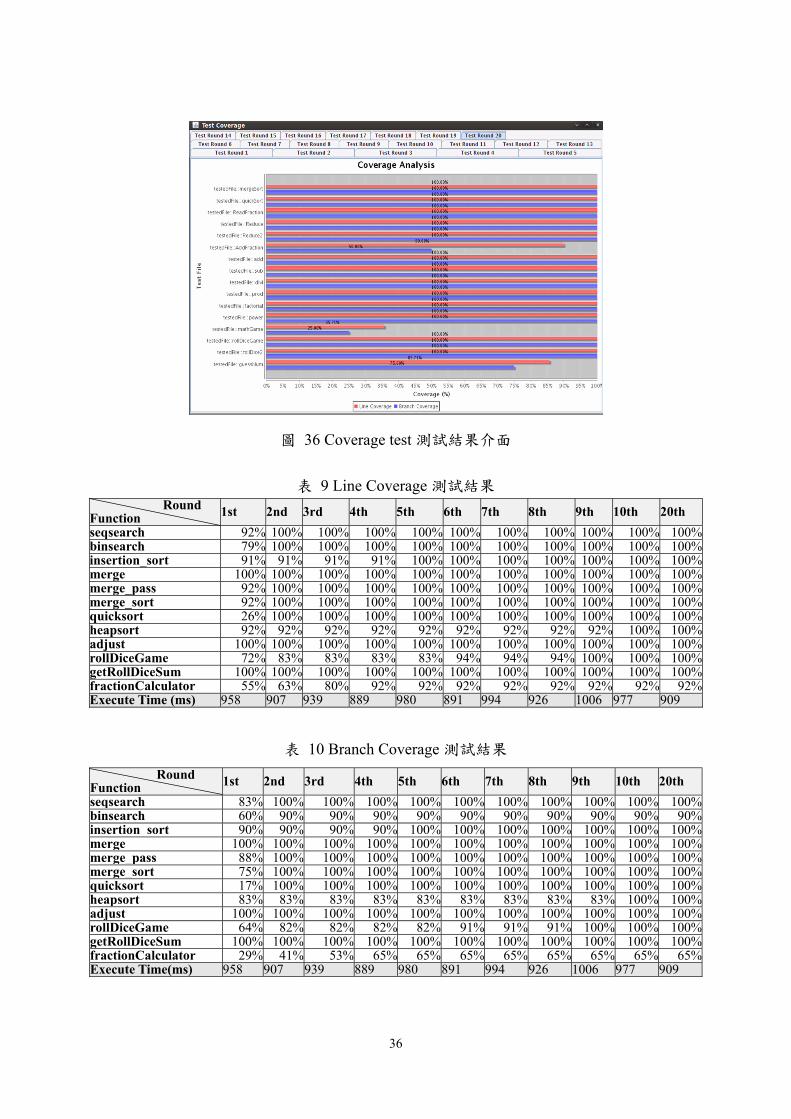
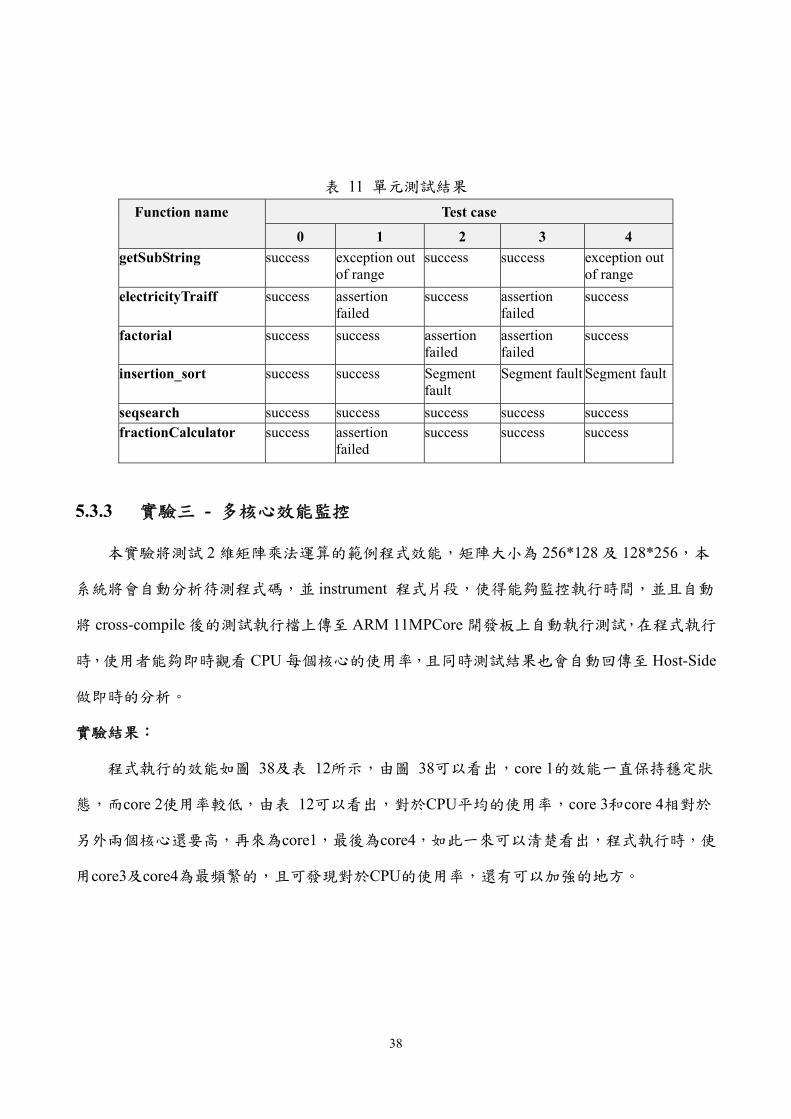
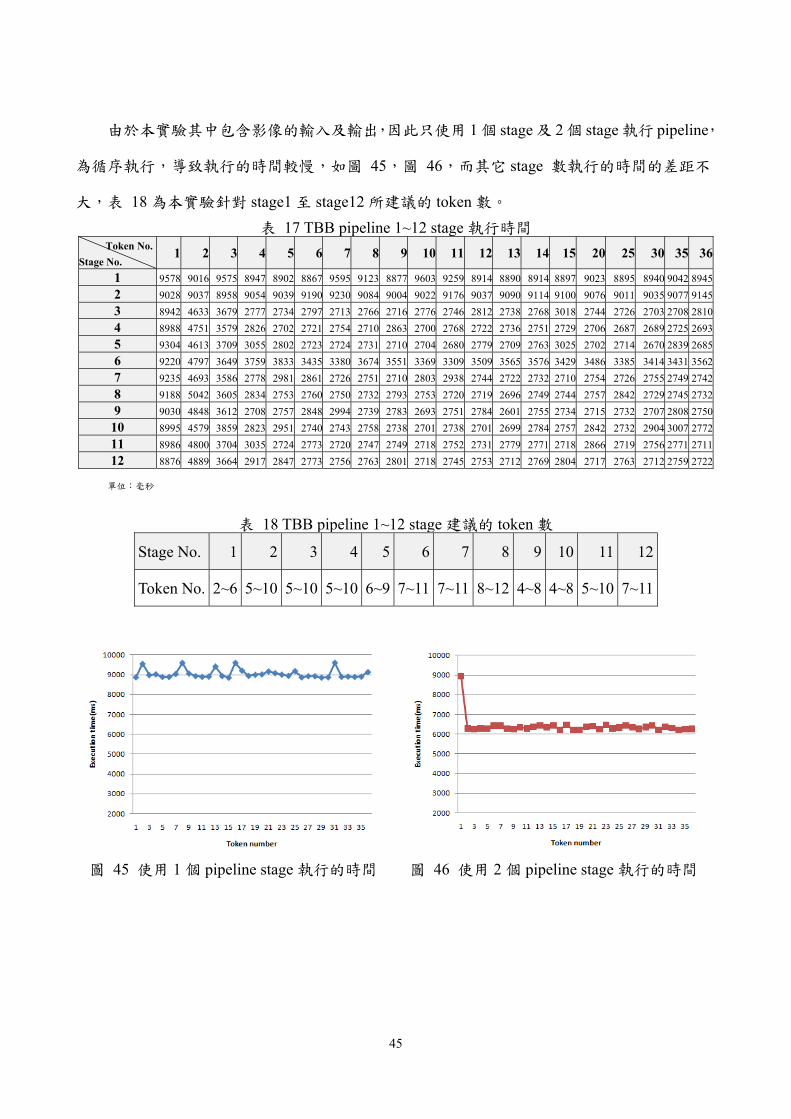
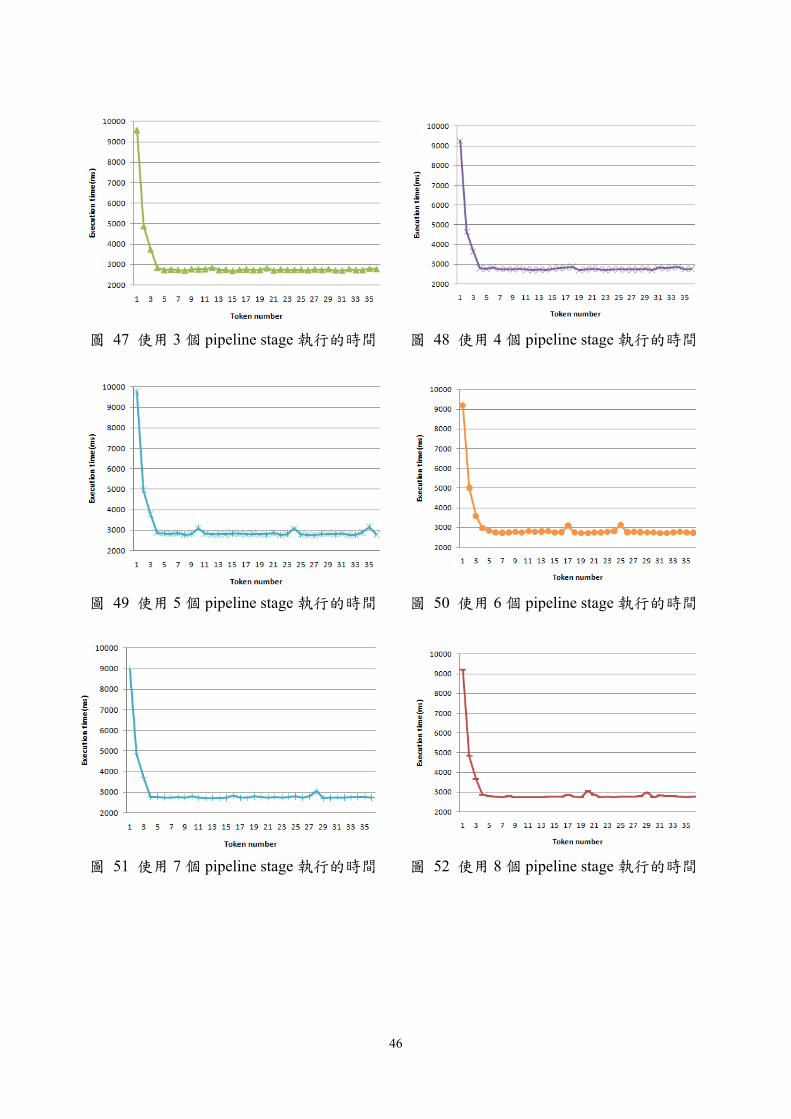