駿利亨德森資產管理基金 2021 年 12 月 31 日年報 (經查核 ...
426
- 1 - [RV/CL/C:/Fund/Janus/2021 年年報/5/18/2022] 駿利亨德森資產管理基金/西元 2021 年 12 月 31 日 駿利亨德森資產管理基金 2021 年 12 月 31 日年報 (經查核) 中文簡譯文
-
Upload
khangminh22 -
Category
Documents
-
view
0 -
download
0
Transcript of 駿利亨德森資產管理基金 2021 年 12 月 31 日年報 (經查核 ...

- 1 -
[RV/CL/C:/Fund/Janus/2021 年年報/5/18/2022] 駿利亨德森資產管理基金/西元 2021 年 12 月 31 日
駿利亨德森資產管理基金
2021 年 12 月 31 日年報
(經查核)
中文簡譯文

- 2 -
[RV/CL/C:/Fund/Janus/2021 年年報/5/18/2022] 駿利亨德森資產管理基金/西元 2021 年 12 月 31 日
資產負債表* 駿利亨德森 駿利亨德森 駿利亨德森 駿利亨德森 平衡基金 環球生命科技基金 環球研究基金 環球科技創新基金
2021年12月31日 2020年12月31日 2021年12月31日 2020年12月31日 2021年12月31日 2020年12月31日 2021年12月31日 2020年12月31日 (美元) (美元) (美元) (美元) (美元) (美元) (美元) (美元)
資產:
公平價值變動列入
損益之金融資產 8,615,155,931 5,488,285,197 4,652,239,666 3,876,475,738 84,527,918 72,791,777 529,387,670 443,342,615
現金及外幣 68,584,742 147,025,132 9,483,669 21,584,859 182,662 355,571 5,704,512 13,103,781
保證金 - - - - - - - -
現金擔保品 - - - - - - - -
應收帳款:
所售投資 147,124,719 - 14,859,032 6,248,839 86,406 - - -
待交割外匯即期契約 - 18,506 1,548 10,810 - - - 2,087
所售基金股份 58,143,441 31,556,172 12,134,128 25,711,650 - 178 3,730,181 2,428,143
股利 1,684,704 1,628,907 1,330,864 1,780,362 19,946 25,274 117,374 124,793
利 息 10,881,338 10,704,560 - - - - - -
投資經理應收帳款 - 64 16,172 43,550 9,046 22,423 - -
其他應收款 - - 650,575 638,675 10,197 8,904 - -
資產總計 8,901,574,875 5,679,218,538 4,690,715,654 3,932,494,483 84,836,175 73,204,127 538,939,737 459,001,419
負債(一年內到期者)
應付帳款:
公平價值變動列入
損益之金融負債 667,227 189,672 358,951 98,475 823 874 185,185 108,136
銀行透支及外幣 323,732 1 126 1 - 360 - -
保證金 - - - - - - - -
現金擔保品 - - - - - - - -
買入投資 496,075,139 128,519,815 289,977 17,326,259 - - 614,385 -
待付款外匯即期契約 30,732 - - - - - 6,555 -
買回基金股份 21,156,420 6,162,186 15,198,233 3,234,033 - - 1,247,872 1,491,434
投資經理費用 6,561,383 4,334,863 4,622,743 3,714,759 6,929 6,962 619,828 538,807
股東服務費 4,253,746 2,801,185 702,423 617,550 1,198 1,136 229,557 200,168
銷售費 7,930 7,425 7,471 8,953 - - 5,013 5,606
會計、行政及過戶代理人費 906,005 786,395 439,690 395,469 12,726 3,818 80,105 34,589
管理費 159,686 103,573 88,116 73,138 1,608 1,379 10,158 8,661
累計費用 1,627,081 816,165 680,059 487,270 62,278 54,334 154,734 123,770
總負債(排除屬可贖回普
通股持有人之淨資產) 531,769,081 143,721,280 22,387,789 25,955,907 85,562 68,863 3,153,392 2,511,171
可贖回普通參與股持有
人之淨資產 8,369,805,794 5,535,497,258 4,668,327,865 3,906,538,576 84,750,613 73,135,264 535,786,345 456,490,248
*僅顯示在中華民國境內登記銷售之基金

- 3 -
[RV/CL/C:/Fund/Janus/2021 年年報/5/18/2022] 駿利亨德森資產管理基金/西元 2021 年 12 月 31 日
駿利亨德森 駿利亨德森 駿利亨德森 駿利亨德森
美國逆勢機會基金 美國40基金 美國研究基金 美國價值中小基金
2021年12月31日 2020年12月31日 2021年12月31日 2020年12月31日 2021年12月31日 2020年12月31日 2021年12月31日 2020年12月31日 (美元) (美元) (美元) (美元) (美元) (美元) (美元) (美元)
資產:
公平價值變動列入
損益之金融資產 33,972,049 23,113,091 1,198,129,468 718,757,926 10,471,561 8,942,948 212,549,484 125,821,794
現金及外幣 64,044 398,574 9,449,159 25,095,261 24,383 75,675 953,122 5,962,074
保證金 - - - - - - - -
現金擔保品 - - - - - - - -
應收帳款:
所售投資 - 80,868 - 5,082,063 10,653 - - -
待交割外匯即期契約 9 10 - - - - 199 -
所售基金股份 48,989 16,371 2,754,244 7,603,787 50,208 19,090 118,836 1,777,091
股利 17,982 15,262 250,557 108,980 1,512 3,383 175,825 119,672
利 息 - - - - - - - -
投資經理應收帳款 496 3,723 - - 6,770 3,614 28 47
其他應收款 - - - - - - - -
資產總計 34,103,569 23,627,899 1,210,583,428 756,648,017 10,565,087 9,044,710 213,797,494 133,680,678
負債(一年內到期者)
應付帳款:
公平價值變動列入
損益之金融負債 8,836 665 82,099 14,689 757 211 12,086 5,748
銀行透支及外幣 - - - 22 - - - -
保證金 - - - - - - - -
現金擔保品 - - - - - - - -
買入投資 - - - 15,250,602 - - - 1,142,660
待付款外匯即期契約 - - 147 131 - 324 - 17
買回基金股份 74,300 66,976 1,680,334 552,029 - 61,183 320,992 194,784
投資經理費用 33,587 24,194 1,004,227 613,386 8,452 13,540 174,259 104,474
股東服務費 18,218 14,060 170,648 133,473 4,843 4,366 39,374 29,212
銷售費 1,568 1,659 8,555 7,541 98 82 982 937
會計、行政及過戶代理人費 11,982 24 135,136 58,497 9,672 – 36,564 16,797
管理費 667 441 23,260 13,756 197 168 4,158 2,428
累計費用 39,871 47,196 160,172 128,448 44,238 27,705 61,436 61,641
總負債(排除屬可贖回普
通股持有人之淨資產) 189,029 155,215 3,264,578 16,772,574 68,257 107,579 649,851 1,558,698
可贖回普通參與股持有
人之淨資產 33,914,540 23,472,684 1,207,318,850 739,875,443 10,496,830 8,937,131 213,147,643 132,121,980
- 4 -
[RV/CL/C:/Fund/Janus/2021 年年報/5/18/2022] 駿利亨德森資產管理基金/西元 2021 年 12 月 31 日
駿利亨德森 駿利亨德森 駿利亨德森 駿利亨德森
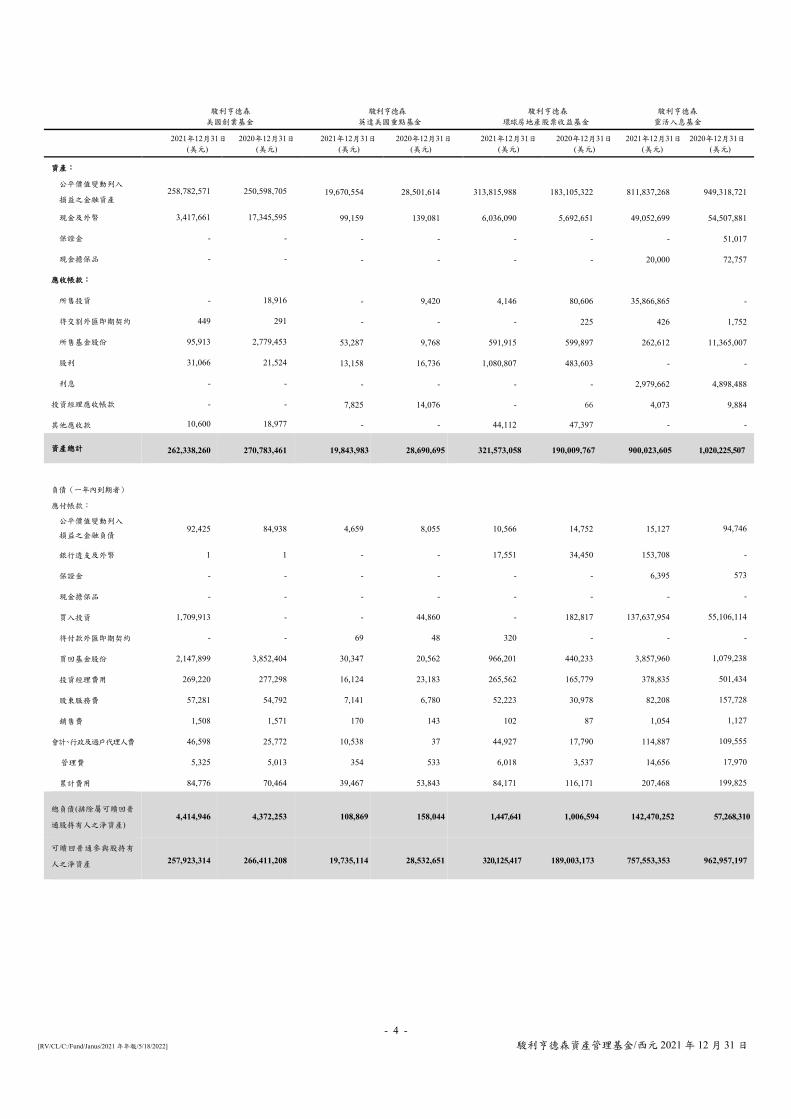
美國創業基金 英達美國重點基金 環球房地產股票收益基金 靈活入息基金
2021年12月31日 2020年12月31日 2021年12月31日 2020年12月31日 2021年12月31日 2020年12月31日 2021年12月31日 2020年12月31日 (美元) (美元) (美元) (美元) (美元) (美元) (美元) (美元)
資產:
公平價值變動列入
損益之金融資產 258,782,571 250,598,705 19,670,554 28,501,614 313,815,988 183,105,322 811,837,268 949,318,721
現金及外幣 3,417,661 17,345,595 99,159 139,081 6,036,090 5,692,651 49,052,699 54,507,881
保證金 - - - - - - - 51,017
現金擔保品 - - - - - - 20,000 72,757
應收帳款:
所售投資 - 18,916 - 9,420 4,146 80,606 35,866,865 -
待交割外匯即期契約 449 291 - - - 225 426 1,752
所售基金股份 95,913 2,779,453 53,287 9,768 591,915 599,897 262,612 11,365,007
股利 31,066 21,524 13,158 16,736 1,080,807 483,603 - -
利 息 - - - - - - 2,979,662 4,898,488
投資經理應收帳款 - - 7,825 14,076 - 66 4,073 9,884
其他應收款 10,600 18,977 - - 44,112 47,397 - -
資產總計 262,338,260 270,783,461 19,843,983 28,690,695 321,573,058 190,009,767 900,023,605 1,020,225,507
負債(一年內到期者)
應付帳款:
公平價值變動列入
損益之金融負債 92,425 84,938 4,659 8,055 10,566 14,752 15,127 94,746
銀行透支及外幣 1 1 - - 17,551 34,450 153,708 -
保證金 - - - - - - 6,395 573
現金擔保品 - - - - - - - -
買入投資 1,709,913 - - 44,860 - 182,817 137,637,954 55,106,114
待付款外匯即期契約 - - 69 48 320 - - -
買回基金股份 2,147,899 3,852,404 30,347 20,562 966,201 440,233 3,857,960 1,079,238
投資經理費用 269,220 277,298 16,124 23,183 265,562 165,779 378,835 501,434
股東服務費 57,281 54,792 7,141 6,780 52,223 30,978 82,208 157,728
銷售費 1,508 1,571 170 143 102 87 1,054 1,127
會計、行政及過戶代理人費 46,598 25,772 10,538 37 44,927 17,790 114,887 109,555
管理費 5,325 5,013 354 533 6,018 3,537 14,656 17,970
累計費用 84,776 70,464 39,467 53,843 84,171 116,171 207,468 199,825
總負債(排除屬可贖回普
通股持有人之淨資產) 4,414,946 4,372,253 108,869 158,044 1,447,641 1,006,594 142,470,252 57,268,310
可贖回普通參與股持有
人之淨資產 257,923,314 266,411,208 19,735,114 28,532,651 320,125,417 189,003,173 757,553,353 962,957,197

- 5 -
[RV/CL/C:/Fund/Janus/2021 年年報/5/18/2022] 駿利亨德森資產管理基金/西元 2021 年 12 月 31 日
駿利亨德森 駿利亨德森 總金額 美國短期債券基金 非投資等級債券基金
2021年12月31日 2020年12月31日 2021年12月31日 2020年12月31日 2021年12月31日 2020年12月31日 (美元) (美元) (美元) (美元) (美元) (美元)
資產:
公平價值變動列入
損益之金融資產 305,293,397 285,771,873 547,916,555 464,568,214 18,715,324,707 15,418,760,246
現金及外幣 12,697,775 11,869,523 14,842,502 22,371,882 214,785,365 385,212,589
保證金 55,124 - - - 571,316 718,583
現金擔保品 250,000 60,000 99,979 711,000 2,093,982 7,775,585
應收帳款:
所售投資 11,660,018 - 2,264,061 2,780,701 224,157,837 19,383,391
待交割外匯即期契約 184 4 335 - 3,282 39,100
所售基金股份 195,220 1,427,456 220,089 2,617,592 78,745,016 91,385,192
股利 - - - - 4,817,568 5,451,724
利 息 942,960 1,709,740 7,524,465 7,367,955 27,285,239 31,073,679
投資經理應收帳款 27 205 13,922 9,571 178,093 446,161
其他應收款 - - - - 1,554,108 1,649,128
資產總計 331,094,705 300,838,801 572,881,908 500,426,915 19,269,516,513 15,961,895,378
負債(一年內到期者)
應付帳款:
公平價值變動列入
損益之金融負債 87,608 9,918 7,902 15,887 2,825,562 10,847,263
銀行透支及外幣 68,654 - 4 - 988,381 41,158
保證金 - 9,582 78,343 504,476 446,457 932,342
現金擔保品 - - - - 300,000 340,000
買入投資 42,499,414 9,940,051 6,696,040 6,190,672 781,851,371 303,640,154
待付款外匯即期契約 - - - 19 37,998 574
買回基金股份 2,227,021 913,247 751,700 268,716 52,266,321 19,292,021
投資經理費用 111,470 110,299 323,887 271,777 14,710,123 11,137,178
股東服務費 36,262 34,914 96,051 81,220 5,825,527 4,266,531
銷售費 174 325 18,929 22,647 53,554 58,103
會計、行政及過戶代理人費 52,342 32,355 84,253 82,955 2,176,618 1,791,914
管理費 5,887 5,583 10,938 9,217 344,542 287,151
累計費用 109,412 100,711 188,567 144,272 4,335,763 3,362,878
總負債(排除屬可贖回普
通股持有人之淨資產) 45,198,244 11,156,985 8,256,614 7,591,858 866,162,217 355,997,267
可贖回普通參與股持有
人之淨資產 285,896,461 289,681,816 564,625,294 492,835,057 18,403,354,296 15,605,898,111

- 6 -
[RV/CL/C:/Fund/Janus/2021 年年報/5/18/2022] 駿利亨德森資產管理基金/西元 2021 年 12 月 31 日
損 益 表*
駿利亨德森
平衡基金
駿利亨德森
環球生命科技基金
駿利亨德森
環球研究基金
駿利亨德森
環球科技創新基金
迄2021年12月31日之年度 (美元)
迄2020年12月31日 之年度 (美元)
迄2021年12月31日 之年度 (美元)
迄2020年12月31日 之年度 (美元)
迄2021年12月31日 之年度 (美元)
迄2020年12月31日 之年度 (美元)
迄2021年12月31日 之年度 (美元)
迄2020年12月31日 之年度 (美元)
收入:
利息收入 51,629,415 49,287,763 (6,176) 24,835 578 506 24,112 6,611
股利收入 51,324,768 43,455,506 44,761,301 33,476,871 1,122,764 868,719 2,206,602 2,070,816
其他收入 109,906 - 3,368,256 60,102 5,672 37 71,768 840
公平價值變動列入損益
之金融資產及負債淨利 894,169,807 613,959,085 214,754,129 757,431,774 13,292,328 11,542,420 70,354,442 155,680,625
投資收入總計 997,233,896 706,702,354 262,877,510 790,993,582 14,421,342 12,411,682 72,656,924 157,758,892
費用:
投資經理費 64,291,940 41,481,607 51,988,771 33,301,283 110,355 28,351 7,084,027 4,654,027
股東服務費 41,783,813 27,148,647 8,388,384 5,789,817 14,955 11,489 2,673,693 1,719,600
銷售費 90,245 86,500 98,840 45,826 - - 64,439 26,148
管理費 1,619,877 575,227 1,051,925 390,396 19,862 7,434 120,917 48,009
會計、行政及過戶代理人費 3,182,828 3,198,641 1,358,633 1,627,899 55,307 23,998 338,561 230,044
保管費 565,971 465,721 456,843 340,756 32,252 24,898 88,083 70,951
查核費 19,083 24,502 20,228 26,295 22,498 29,433 20,986 26,939
印刷費 163,780 (53,190) 108,265 (56,614) 2,467 3,148 9,471 984
法律及其他專業費用 2,331,389 1,915,067 755,541 589,921 11,792 24,441 164,767 109,461
其他費用 627,070 593,336 261,652 321,961 27,822 18,360 59,271 80,220
費用總計 114,675,996 75,436,058 64,489,082 42,377,540 297,310 171,552 10,624,215 6,966,383
扣除所補償費用 - (100) (264,026) (274,011) (147,454) (128,401) - -
扣除補償費用之淨費用 114,675,996 75,435,958 64,225,056 42,103,529 149,856 43,151 10,624,215 6,966,383
淨營運收益/(損失) 882,557,900 631,266,396 198,652,454 748,890,053 14,271,486 12,368,531 62,032,709 150,792,509
財務支出:
對可贖回普通股
持有人分派總額 (39,235,191) (26,901,751) - (43,978) (738,979) (660,908) (56) (28)
交換利息費用 - - - - - - - -
股利及其他投資收入扣繳稅 (15,650,613) (12,796,569) (10,283,345) (11,862,896) (236,024) (180,206) (580,577) (654,474)
營運所致屬可贖回普通股
持有人淨資產淨增加 827,672,096 591,568,076 188,369,109 736,983,179 13,296,483 11,527,417 61,452,076 150,138,007
*僅顯示在中華民國境內登記銷售之基金。

- 7 -
[RV/CL/C:/Fund/Janus/2021 年年報/5/18/2022] 駿利亨德森資產管理基金/西元 2021 年 12 月 31 日
駿利亨德森
美國逆勢機會基金
駿利亨德森
美國研究基金
駿利亨德森
美國40基金
駿利亨德森
美國創業基金
迄2021年12月31日之年度 (美元)
迄2020年12月31日 之年度 (美元)
迄2021年12月31日 之年度 (美元)
迄2020年12月31日 之年度 (美元)
迄2021年12月31日 之年度 (美元)
迄2020年12月31日 之年度 (美元)
迄2021年12月31日 之年度 (美元)
迄2020年12月31日 之年度 (美元)
收入:
利息收入 (829) 7,226 22,664 942 39,501 7,162 22,276 6,960
股利收入 452,581 231,478 122,901 2,055,603 5,109,291 3,522,452 821,371 697,113
其他收入 51,360 292 32,302 2,865 273,476 58,862 74,817 -
公平價值變動列入損益
之金融資產及負債淨利 4,751,496 5,134,616 2,163,409 (7,231,567) 186,394,042 194,974,180 12,931,008 64,973,875
投資收入總計 5,254,608 5,373,612 2,341,276 (5,172,157) 191,816,310 198,562,656 13,849,472 65,677,948
費用:
投資經理費 411,830 246,347 104,281 146,397 9,727,335 5,344,024 3,549,617 2,314,911
股東服務費 230,337 145,846 56,708 50,187 1,815,834 1,387,988 756,918 456,680
銷售費 20,375 16,359 1,090 509 98,835 3,4760 18,593 15,268
管理費 8,088 2,438 2,532 1,088 230,741 72,297 66,964 24,814
會計、行政及過戶代理人費 62,248 20,950 51,773 75,495 416,211 313,175 170,679 125,869
保管費 20,366 18,826 35,164 31,090 112,561 76,322 63,580 46,710
查核費 18,883 23,424 21,332 26,967 18,765 24,198 18,765 24,180
印刷費 692 2,665 5,127 5,451 15,895 (2,221) 4,188 (1,144)
法律及其他專業費用 12,378 26,948 12,843 28,105 165,080 123,702 61,211 53,763
其他費用 13,465 8,125 20,185 2,881 59,219 84,893 39,301 8,546
費用總計 798,662 511,928 311,035 368,170 12,660,476 7,459,138 4,749,816 3,069,597
扣除所補償費用 (2,907) (22,155) (103,290) (119,716) - - - -
扣除補償費用之淨費用 795,755 489,773 207,745 248,454 12,660,476 7,459,138 4,749,816 3,069,597
淨營運收益/(損失) 4,458,853 4,883,839 2,133,531 (5,420,611) 179,155,834 191,103,518 9,099,656 62,608,351
財務支出:
對可贖回普通股
持有人分派總額 - - (97) (68) - (1) - -
交換利息費用 - - - - - - - -
股利及其他投資收入扣繳稅 (129,904) (70,340) (34,914) (671,842) (1,279,382) (945,707) (239,404) (192,485)
營運所致屬可贖回普通股
持有人淨資產淨增加 4,328,949 4,813,499 2,098,520 (6,092,521) 177,876,452 190,157,810 8,860,252 62,415,866

- 8 -
[RV/CL/C:/Fund/Janus/2021 年年報/5/18/2022] 駿利亨德森資產管理基金/西元 2021 年 12 月 31 日
駿利亨德森
美國價值中小基金 駿利亨德森
英達美國重點基金
駿利亨德森
環球房地產股票收益基金
駿利亨德森
美國短期債券基金
迄2021年12月31日之年度 (美元)
迄2020年12月31日 之年度 (美元)
迄2021年12月31日 之年度 (美元)
迄2020年12月31日 之年度
(美元)
迄2021年12月31日之年度
(美元)
迄2020年12月31日 之年度
(美元)
迄2021年12月31日之年度 (美元)
迄2020年12月31日 之年度
(美元)
收入:
利息收入 19,090 3,005 20,744 218 142,190 - 5,082,411 4,829,146
股利收入 3,860,890 2,505,186 443,349 568,766 8,910,895 5,094,808 - -
其他收入 14,246 63,406 12,360 55,622 5,000 - 733 7,427
公平價值變動列入損益
之金融資產及負債淨利 31,518,069 4,567,721 3,268,729 3,858,655 48,417,026 1,721,976 (5,245,180) 6,538,175
投資收入總計 35,412,295 7,139,318 3,745,182 4,483,261 57,475,111 6,816,784 (162,036) 11,374,747
費用:
投資經理費 1,930,583 1,065,764 209,162 277,761 2,806,401 1,797,681 1,389,975 1,098,195
股東服務費 496,800 312,805 85,276 81,433 522,878 362,318 453,996 350,947
銷售費 12,314 10,625 1,909 788 1,153 850 2,455 3,001
管理費 47,501 13,262 5,068 3,301 65,617 22,122 73,474 30,595
會計、行政及過戶代理人費 126,351 78,701 55,224 23,014 156,703 112,134 221,016 159,871
保管費 29,700 27,360 11,898 32,656 60,030 63,906 39,945 49,908
查核費 22,773 29,696 21,262 26,937 22,791 29,734 19,231 24,421
印刷費 2,564 705 574 1,254 3,745 3,514 4,540 2,387
法律及其他專業費用 37,305 47,164 8,737 26,680 45,852 56,195 97,478 7,3347
其他費用 32,779 8,140 15,315 (659) 37,241 54,964 51,087 29,371
費用總計 2,738,670 1,594,222 414,425 473,165 3,722,411 2,503,418 2,353,197 1,822,043
扣除所補償費用 - (48) (65,539) (41,481) - (66) (158) (305)
扣除補償費用之淨費用 2,738,670 1,594,174 348,886 431,684 3,722,411 2,503,352 2,353,039 1,821,738
淨營運收益/(損失) 32,673,625 5,545,144 3,396,296 4,051,577 53,752,700 4,313,432 (2,515,075) 9,553,009
財務支出:
對可贖回普通股
持有人分派總額 - (1,267) - - (2,560,322) (2,045,338) (370,210) (510,492)
交換利息費用 - - - - - - - -
股利及其他投資收入扣繳稅 (1,114,763) (706,029) (134,911) (241,360) (1,984,385) (1,055,443) (90,846) -
營運所致屬可贖回普通股
持有人淨資產淨增加 31,558,862 4,837,848 3,261,385 3,810,217 49,207,993 1,212,651 (2,976,131) 9,042,517

- 9 -
[RV/CL/C:/Fund/Janus/2021 年年報/5/18/2022] 駿利亨德森資產管理基金/西元 2021 年 12 月 31 日
駿利亨德森
靈活入息基金
駿利亨德森
非投資等級債券基金
迄2021年12月31日 之年度 (美元)
迄2020年12月31日 之年度 (美元)
迄2021年12月31日 之年度 (美元)
迄2020年12月31日 之年度
(美元)
迄2021年12月31日 之年度
(美元)
迄2020年12月31日 之年度
(美元)
收入:
利息收入 20,763,582 21,893,949 27,108,211 27,966,987 129,919,214 124,600,534
股利收入 180,179 93,619 528,364 262,815 136,630,788 121,515,790
其他收入 10,213 20,278 281,084 214,018 4,479,372 564,686
公平價值變動列入損益 之金融資產及負債淨利
(29,758,401) 58,277,141 3,210,619 (343,095) 1,555,067,737 2,064,338,854
投資收入總計 (8,804,427) 80,284,987 31,128,278 28,100,725 1,826,097,111 2,311,019,864
費用:
投資經理費 5,207,039 4,464,370 3,469,577 3,171,267 156,250,816 102,821,503
股東服務費 1,340,009 1,207,218 975,984 1,014,726 60,693,922 41,250,508
銷售費 12,840 8,375 240,900 153,226 663,988 402,235
管理費 207,325 104,312 126,075 55,948 4,005,444 1,587,250
會計、行政及過戶代理人
費 354,039 460,365 226,929 369,710 7,786,334 7,715,362
保管費 122,784 128,705 68,666 93,611 2,325,573 2,258,070
查核費 22,769 29,857 23,322 30,395 573,037 727,199
印刷費 20,153 (3,356) 15,395 (1,474) 409,336 (46,530)
法律及其他專業費用 159,388 163,583 86,722 119,800 4,173,298 3,878,076
其他費用 73,776 85,156 52,701 152,358 1,723,060 1,812,279
費用總計 7,520,122 6,648,585 5,286,271 5,159,567 238,604,808 162,405,952
扣除所補償費用 (49,060) (95,957) (50,218) (59,988) (2,832,383) (3,525,909)
扣除補償費用之淨費用 7,471,062 6,552,628 5,236,053 5,099,579 235,772,425 158,880,043
淨營運收益/(損失) (16,275,489) 73,732,359 25,892,225 23,001,146 1,590,324,686 2,152,139,821
財務支出:
對可贖回普通股
持有人分派總額 (11,629,670) (12,665,265) (16,977,246) (18,183,322) (86,301,833) (72,542,366)
交換利息費用 (24,596) (26,229) (368,979) (193,534) (694,025) (583,923)
股利及其他投資收入扣繳稅 (423,904) (250,994) (152,372) (278,735) (35,292,333) (35,530,761)
營運所致屬可贖回普通股
持有人淨資產淨增加 (28,353,659) 60,789,871 8,393,628 4,345,555 1,468,036,495 2,043,482,771
總金額

- 10 -
[RV/CL/C:/Fund/Janus/2021 年年報/5/18/2022] 駿利亨德森資產管理基金/西元 2021 年 12 月 31 日
屬可贖回普通股股東之 淨資產變動表*
*僅顯示在中華民國境內登記銷售之基金。
駿利亨德森 平衡基金
駿利亨德森 環球生命科技基金
迄2021年12月31日
之年度 (美元)
迄2020年12月31日 之年度
(美元)
迄2021年12月31日 之年度
(美元)
迄2020年12月31日之年度
(美元)
迄2021年12月31日 之年度
(美元)
迄2020年12月31日 之年度
(美元)
迄2021年12月31日 之年度 (美元)
迄2020年12月31日 之年度
(美元)
自營運增加屬可贖回普通股
持有人之淨資產 827,672,096 591,568,076 188,369,109 736,983,179 13,296,483 11,527,417 61,452,076 150,138,007
可贖回普通股股本交易:
出售可贖回普通股價金 3,582,144,594 2,872,679,438 1,633,168,356 1,457,727,740 5,146,682 5,880,244 234,033,058 332,318,077
贖回可贖回普通股 (1,575,508,154) (1,524,860,968) (1,059,748,176) (876,357,956) (6,831,513) (401,223) (216,189,037) (225,063,448)
稀釋調整 - - - - 3,697 4,047 - -
可贖回普通股股本交易
之淨增加 2,006,636,440 1,347,818,470 573,420,180 581,369,784 (1,681,134) 5,483,068 17,844,021 107,254,629
屬可贖回普通股持有人
之淨資產淨增加 2,834,308,536 1,939,386,546 761,789,289 1,318,352,963 11,615,349 17,010,485 79,296,097 257,392,636
屬可贖回普通股持有人
之期初淨資產 5,535,497,258 3,596,110,712 3,906,538,576 2,588,185,613 73,135,264 56,124,779 456,490,248 199,097,612
名目外匯(損失) /利得 - - - - - - - -
屬可贖回股普通股持有人
之期末淨資產 8,369,805,794 5,535,497,258 4,668,327,865 3,906,538,576 84,750,613 73,135,264 535,786,345 456,490,248
駿利亨德森 環球研究基金 駿利亨德森
環球科技創新基金

- 11 -
[RV/CL/C:/Fund/Janus/2021 年年報/5/18/2022] 駿利亨德森資產管理基金/西元 2021 年 12 月 31 日
駿利亨德森 美國逆勢機會基金
駿利亨德森 美國研究基金
迄2021年12月31日
之年度 (美元)
迄2020年12月31日 之年度
(美元)
迄2021年12月31日之年度 (美元)
迄2020年12月31日之年度
(美元)
迄2021年12月31日 之年度
(美元)
迄2020年12月31日之年度
(美元)
迄2021年12月31日 之年度
(美元)
迄2020年12月31日之年度
(美元)
自營運增加屬可贖回普通股
持有人之淨資產 4,328,949 4,813,499 2,098,520 (6,092,521) 177,876,452 190,157,810 8,860,252 62,415,866
可贖回普通股股本交易:
出售可贖回普通股價金 19,040,868 4,093,256 5,044,854 10,497,485 438,521,709 332,215,921 75,791,662 86,920,052
贖回可贖回普通股 (12,936,239) (8,812,260) (5,586,021) (300,101,500) (148,959,398) (162,710,467) (93,158,166) (69,460,992)
稀釋調整 8,278 396 2,345 2,969 4,644 - 18,358 8,815
可贖回普通股股本交易
之淨增加 6,112,907 (4,718,608) (538,822) (289,601,046) 289,566,955 169,505,454 (17,348,146) 17,467,875
屬可贖回普通股持有人
之淨資產淨增加 10,441,856 94,891 1,559,699 (295,693,567) 467,443,407 359,663,264 (8,487,894) 79,883,741
屬可贖回普通股持有人
之期初淨資產 23,472,684 23,377,793 8,937,131 304,630,698 739,875,443 380,212,179 266,411,208 186,527,467
名目外匯(損失) /利得 - - - - - - - -
屬可贖回股普通股持有人
之期末淨資產 33,914,540 23,472,684 10,496,830 8,937,131 1,207,318,850 739,875,443 257,923,314 266,411,208
駿利亨德森 美國 40 基金
駿利亨德森 美國創業基金

- 12 -
[RV/CL/C:/Fund/Janus/2021 年年報/5/18/2022] 駿利亨德森資產管理基金/西元 2021 年 12 月 31 日
駿利亨德森 美國價值中小基金
駿利亨德森 英達美國重點基金
駿利亨德森 環球房地產股票收益基金 駿利亨德森
短期債券基金
迄2021年12月31日
之年度 (美元)
迄2020年12月31日 之年度
(美元)
迄2021年12月31日之年度
(美元)
迄2020年12月31日之年度
(美元)
迄2021年12月31日之年度
(美元)
迄2020年12月31日之年度
(美元)
迄2021年12月31日 之年度
(美元)
迄2020年12月31日 之年度
(美元)
自營運增加屬可贖回普通股
持有人之淨資產 31,558,862 4,837,848 3,261,385 3,810,217 49,207,993 1,212,651 (2,976,131) 9,042,517
可贖回普通股股本交易:
出售可贖回普通股價金 108,770,715 32,014,677 1,236,533 2,388,306 173,270,431 100,021,532 162,354,587 219,378,705
贖回可贖回普通股 (59,315,888) (25,615,286) (13,303,459) (13,607,720) (91,440,265) (71,618,751) (163,192,582) (133,767,975)
稀釋調整 11,974 2,319 8,004 390 84,085 48,281 28,771 51,017
可贖回普通股股本交易
之淨增加 49,466,801 6,401,710 (12,058,922) (11,219,024) 81,914,251 28,451,062 (809,224) 85,661,747
屬可贖回普通股持有人
之淨資產淨增加 81,025,663 11,239,558 (8,797,537) (7,408,807) 131,122,244 29,663,713 (3,785,355) 94,704,264
屬可贖回普通股持有人
之期初淨資產 132,121,980 120,882,422 28,532,651 35,941,458 189,003,173 159,339,460 289,681,816 194,977,552
名目外匯(損失) /利得 - - - - - - - -
屬可贖回股普通股持有人
之期末淨資產 213,147,643 132,121,980 19,735,114 28,532,651 320,125,417 189,003,173 285,896,461 289,681,816

- 13 -
[RV/CL/C:/Fund/Janus/2021 年年報/5/18/2022] 駿利亨德森資產管理基金/西元 2021 年 12 月 31 日
駿利亨德森 靈活入息基金
駿利亨德森 非投資等級債券基金
迄2021年12月31日
之年度 (美元)
迄2020年12月31日 之年度
(美元)
迄2021年12月31日之年度 (美元)
迄2020年12月31日之年度
(美元)
迄2021年12月31日之年度 (美元)
迄2020年12月31日之年度
(美元)
自營運增加屬可贖回普通股
持有人之淨資產 (28,353,659) 60,789,871 8,393,628 4,345,555 1,468,036,495 2,043,482,771
可贖回普通股股本交易:
出售可贖回普通股價金 114,683,078 474,208,579 157,136,643 128,312,009 6,866,380,105 6,794,634,024
贖回可贖回普通股 (291,733,263) (235,689,323) (93,751,171) (158,347,176) (5,525,780,118) (4,036,131,367)
稀釋調整 - 102,100 11,137 40,495 331,535 989,566
可贖回普通股股本交易
之淨增加 (177,050,185) 238,621,356 63,396,609 (29,994,672) 1,340,931,522 2,759,492,223
屬可贖回普通股持有人
之淨資產淨增加 (205,403,844) 299,411,227 71,790,237 (25,649,117) 2,808,968,017 4,802,974,994
屬可贖回普通股持有人
之期初淨資產 962,957,197 663,545,970 492,835,057 518,484,174 15,605,898,111 10,789,529,305
名目外匯(損失) /利得 - - - - (11,511,832) 13,393,812
屬可贖回股普通股持有人
之期末淨資產 757,553,353 962,957,197 564,625,294 492,835,057 18,403,354,296 15,605,898,111
總金額

- 14 -
[RV/CL/C:/Fund/Janus/2021 年年報/5/18/2022] 駿利亨德森資產管理基金/西元 2021 年 12 月 31 日
獨立會計師查核報告
致 駿利亨德森資產管理基金成員之獨立會計師稽核報告
財務報表查核報告
意見
依本所之意見,駿利亨德森資產管理基金之財務報表:
真實且允當表達該公司及各基金 2021年 12月31日之資產、負債及財務狀況,
暨截至該日之年度經營結果;
已依據愛爾蘭一般公認會計實務準則(英國財務報告理事會頒佈之會計準則,
包括財務報告準則 102「英國及愛爾蘭共和國適用之財務報告準則」, 以及愛
爾蘭法律)妥為編製;及
已依據 2014 年公司法及 2011 年歐洲共同體(可轉讓證券集體投資事業)規
範(及其修訂)之規定妥為編製。
本所已稽查年度報告及財務報告中之財務報表,包括:
公司合併及其各檔基金截至 2021 年 12 月 31 日之資產負債表;
公司合併及其各檔基金當年度之損益表;
當年度屬公司合併及各檔基金可贖回普通股股東之淨資產變動表;
各檔基金截至 2021 年 12 月 31 日之投資組合;及
公司及各檔基金之財務報表附註,包括重要會計政策說明。
意見基礎
本所係依國際審計準則(愛爾蘭)(下稱「ISA(愛爾蘭)」)與相關法律進行查核。
本所於 ISA(愛爾蘭)規定下應負之責任詳載於本報告中「會計師查核財務報表
之責任」一節。本所認為,本所取得之查核憑證,足以做為查核意見之適當依據。
獨立性
本所依愛爾蘭之財務報表查核相關倫理規範(包括 IAASA’s Ethical Standard)獨
立於公司,並已遵循前述規範履行其他倫理責任。
重要事項-採用非永續經營會計準則編製財務報表

- 15 - [RV/CL/C:/Fund/Janus/2021 年年報/5/18/2022] 駿利亨德森資產管理基金/西元 2021年 12 月 31日
本所就(未修訂)財務報告出具意見時,提請注意財務報表附註一載有採用非永
續經營會計準則編製駿利亨德森環球適應資本升值基金*、駿利亨德森環球適應
保本基金*、駿利亨德森英達全球最小方差重點基金*、駿利亨德森英達環球絕對
報酬基金*、駿利亨德森英達環球全國低波動基金*、駿利亨德森英達美國重點基
金、駿利亨德森絕對報酬入息基金(歐元)*及駿利亨德森環球高收益基金*之財
務報表之原因。
永續經營相關結論
除於「重要事項-採用永續經營以外會計準則編製財務報表」所述採用非永續經
營會計準則編製之駿利亨德森環球適應資本升值基金 ∗、駿利亨德森環球適應保
本基金*、駿利亨德森英達全球最小方差重點基金*、駿利亨德森英達環球絕對報
酬基金*、駿利亨德森英達環球全國低波動基金*、駿利亨德森英達美國重點基金、
駿利亨德森絕對報酬入息基金(歐元)*及駿利亨德森環球高收益基金*之財務報
表者外,依本所進行之工作,本所並未發現任何與重大不確定因素相關之事件或
情況,其單獨或整體觀之,可能對公司與各檔基金自經授權公布財務報表之日起
至少 12 個月內,持續採用永續經營會計準則之能力產生重大疑慮。
除於「重要事項-採用永續經營以外會計準則編製財務報表」所述採用非永續經
營會計準則編製之駿利亨德森環球適應資本升值基金*、駿利亨德森環球適應保
本基金*、駿利亨德森英達全球最小方差重點基金*、駿利亨德森英達環球絕對報
酬基金*、駿利亨德森英達環球全國低波動基金*、駿利亨德森英達美國重點基金、
駿利亨德森絕對報酬入息基金(歐元)*及駿利亨德森環球高收益基金*之財務報
表者,於查核財務報表之過程中,本所認為董事會編製財務報表採用永續經營會
計準則係屬適當。
然而,鑑於無法預測所有的未來事件或情況,本結果不擔保公司及各檔基金持續
經營之能力。
本所及董事會就永續經營之責任載於本報告相關章節。
其他資訊之報告
其他資訊係包含除財務報表和本所就財務報表之查核報告以外,年度報告與財務
報告內的所有資訊。董事會對其他資訊負責。本所對財務報表之意見並未涵蓋其
他資訊,從而本所亦未對此表達查核意見或(除本報告另有載明外)任何形式的
保證。就財務報表查核而言,本所之責任在於閱讀其他資訊,並在過程中考量其
他資訊是否與財務報表有重大不一致,或是抵觸本所基於查核過程中取得之資訊,
或有重大不實陳述。倘發現明顯重大抵觸之處或重大不實陳述,本所應執行相關
程序,以判斷出財務報表中是否有重大不實陳述,或是其他資訊之是否有重大不
實陳述。於作業中,本所若判定其他資訊確有重大不實陳述,應據實以報。就前
∗本基金未在中華民國境內登記銷售

- 16 - [RV/CL/C:/Fund/Janus/2021 年年報/5/18/2022] 駿利亨德森資產管理基金/西元 2021年 12 月 31日
述責任而言,本所並無應呈報之事項。
就董事會報告而言,本所亦須考量是否已納入 2014 年公司法規定之揭露事項。
基於上述責任以及本所於查核過程中從事之工作,ISA(愛爾蘭)與 2014 年公司
法規定本所亦應呈報下列意見及事項:
依據查核過程中所從事之工作,本所認為涵蓋至 2021 年 12 月 31 日止一年期
間之董事會報告所提供資訊與財務報表相符,且確已依據適用法律規定編
製。
依本所於查核過程中所取得對公司及其狀況之認知與暸解,未發現董事會報告
有任何重大不實陳述。
財務報表與查核之責任
董事對財務報表之責任
如英文版年報第 8 頁董事責任報告所詳述,董事之責任在於依適用之架構編製財
務報表,並就該等報表已作出真實且公允之反映一事取得確信。
董事亦應負責與財務報表編製有關之必要內部控制,俾使財務報表之編製無因詐
欺或錯誤所致之重大不實表達。
於編製財務報表時,董事負責評估公司與各基金永續經營之能力、揭露(如有適
用)與永續經營相關事項,且除計畫對公司進行清算或停止公司之營運或無其他
可行選項外,採用永續經營之會計準則。
會計師查核財務報表的責任
本所的目標在於,合理確保財務報表整體內容並無因詐欺或錯誤所導致的重大不
實陳述,並提出包含查核意見的會計師報告。合理確保雖屬高度保證,但無法保
證依據 ISA(愛爾蘭)進行的查核,必能發現存在的重大不實陳述。不實陳述可
能因詐欺或錯誤所引起,且不實陳述單獨或綜合觀之,若合理預期可能影響財務
報表使用者據此所作出的經濟上決定,則視為重大。
本所查核測試可能包含對特定交易及損益之整個母體進行測試,可能採用資訊查
核技術。然而,一般而言係選擇以有限數量之項目進行測試,而非測試整個母體。
本所經常依規模或風險特徵,尋找進行測試之特定目標項目。於其他情況,本所
將使用抽樣查核,俾使本所得自所選樣本中對母體作出結論。
關於本所就查核財務報表的責任,詳情請連結至 IAASA 網站:
https://www.iaasa.ie/getmedia/b2389013-1cf6-458b-9b8f-a98202dc9c3a/Description_of_auditors_responsibilities_for_audit.pdf.

- 17 - [RV/CL/C:/Fund/Janus/2021 年年報/5/18/2022] 駿利亨德森資產管理基金/西元 2021年 12 月 31日
該項說明亦構成本會計師查核報告之一部分。
本報告書之使用
本報告暨查核意見,係依 2014 年公司法第 391 條規定,且僅以公司所有成員為
對象而彙編,概無其他目的。除經本所事前明確書面同意外,本所不因出具意見,
而為任何其他目的或就經提示本報告或取得本報告之其他任何人接受或承擔責
任。
其他應報告事項
2014 年公司法下對其他事項的意見
本所業已取得本所認為查核所需之所有必要資料與說明。
本所認為,公司之會計記錄足以對財務報表進行迅速與適當之查核。
財務報表與會計記錄一致。
2014 年公司法之特殊情事報告
董事薪酬與交易
依 2014 年公司法,本所應向貴成員報告,該法第 305 至 312 條所載之董事薪酬與
交易依本所意見是否未經揭露。就此項報告義務,本所無應報告之特殊情事。
(簽名)
Fíona de Búrca
代表資誠聯合會計師事務所
特許會計師暨法定稽核事務所
愛爾蘭都柏林
簽署日期:2022 年 4 月 28 日

ANNUAL REPORT& ACCOUNTSFor the year from 1 January 2021 to 31 December 2021 (audited)
10 Earlsfort TerraceDublin 2
Ireland
Janus Henderson Capital Funds plcJanus Henderson Capital Funds plc is an investment company with variable capital incorporated with limited liability in Ireland under registration number 296610 and established as an umbrella fund with segregated liability between sub-funds.
DocuSign Envelope ID: 521655BF-9BE3-47DC-A9A3-494932954338

Who are Janus Henderson Investors?
Source: Janus Henderson Investors, Staff and assets under management (AUM) data as at 31 December 2021. AUM data excludes Exchange-Traded Note (‘ETN’) assets.
Who we areJanus Henderson Investors (‘Janus Henderson’) is a global asset manager offering a full suite of actively managed investment products across asset classes.
As a company, we believe the notion of ‘connecting’ is powerful – it has shaped our evolution and our world today. At Janus Henderson, we seek to benefit clients through the connections we make. Connections enable strong relationships based on trust and insight as well as the flow of ideas among our investment teams and our engagement with companies. These connections are central to our values, to what active management stands for and to the long-term outperformance we seek to deliver.
Our commitment to active management offers clients the opportunity to outperform passive strategies over the course of market cycles. Through times of both market calm and growing uncertainty, our managers apply their experience weighing risk versus reward potential – seeking to ensure clients are on the right side of change.
Why Janus Henderson Investors?At Janus Henderson, we believe in linking our world-class investment teams and experienced global distribution professionals with our clients around the world.
Active because active mattersWe selectively invest in what we believe are the most compelling opportunities. Our investment teams are free to form their own views and seek to actively position portfolios to connect clients with their financial goals.
Global strength to deliver local solutionsWe offer true global reach with a presence in all major markets, combined with the responsiveness, tailored solutions and personal touch you would expect from a local partner.
Empowering clients through knowledge sharedWe connect our clients with insights and knowledge that empower them to make better investment and business decisions.
DocuSign Envelope ID: 521655BF-9BE3-47DC-A9A3-494932954338

Table of Contents
Directors and Other Information (unaudited) 1
Background of the Company 3
Market Review (unaudited) 6
Report of the Directors 8
Report of the Depositary to the Shareholders 12
Independent Auditors’ Report 13
Combined Company Financial Statements 16
Janus Henderson Balanced Fund 19
Janus Henderson Global Adaptive Capital Appreciation Fund 38
Janus Henderson Global Adaptive Capital Preservation Fund 44
Janus Henderson Global Adaptive Multi-Asset Fund 55
Janus Henderson Global Life Sciences Fund 67
Janus Henderson Global Research Fund 80
Janus Henderson Global Technology and Innovation Fund 92
Janus Henderson US Contrarian Fund 103
Janus Henderson US Balanced 2026 Fund 114
Janus Henderson US Forty Fund 130
Janus Henderson US Research Fund 139
Janus Henderson US Small-Mid Cap Value Fund 148
Janus Henderson US Venture Fund 158
Janus Henderson Intech All-World Minimum Variance Core Fund 169
Janus Henderson Intech European Core Fund 175
Janus Henderson Intech Global Absolute Return Fund 186
Janus Henderson Intech Global All Country Low Volatility Fund 192
Janus Henderson Intech US Core Fund 198
Janus Henderson Global Real Estate Equity Income Fund 207
Janus Henderson Absolute Return Income Fund 219
Janus Henderson Absolute Return Income Fund (EUR) 233
Janus Henderson Absolute Return Income Opportunities Fund 239
Janus Henderson Flexible Income Fund 251
Janus Henderson Global High Yield Fund 266
Janus Henderson Global Investment Grade Bond Fund 273
Janus Henderson High Yield Fund 287
Janus Henderson Multi-Sector Income Fund 304
Janus Henderson US Short-Term Bond Fund 321
Notes to the Financial Statements 334
Fund Expense Limits (unaudited) 383
Supplementary Notes (unaudited) 384
Non-Financial Risks (unaudited) 385
Securities Financing Transactions Regulations (unaudited) 386
Share Class Distribution Policy (unaudited) 393
Additional Information for Hong Kong Investors (unaudited) 396
DocuSign Envelope ID: 521655BF-9BE3-47DC-A9A3-494932954338

Directors and Other Information (unaudited)for the financial year ended 31 December 2021
1Janus Henderson Capital Funds plc / 31 December 2021
Board of DirectorsIan Dyble (UK)Carl O’Sullivan (Ireland)*Peter Sandys (Ireland)* Matteo Candolfini (Luxembourg)Jane Challice (UK)
Registered Office 10 Earlsfort TerraceDublin 2Ireland
Independent AuditorsPricewaterhouseCoopersChartered AccountantsOne Spencer DockNorth Wall QuayDublin 1Ireland
Manager and DistributorHenderson Management, S.A. (“HMSA”) 2 rue de Bitbourg L-1273LuxembourgGrand Duchy of Luxembourg
Investment Adviser Janus Henderson Investors International Limited ("JHIIL") 201 BishopsgateLondon EC2M 3AE United Kingdom
Sub-Investment Advisers Janus Henderson Investors US LLC ("JHIUS")***151 Detroit Street Denver, Colorado 80206United States of America
Intech InvestmentManagement LLC (“Intech”)CityPlace Tower525 Okeechobee BoulevardSuite 1800West Palm Beach, FL 33401United States of America
Perkins Investment Management LLC (“Perkins”)****311 S. Wacker Drive, Suite.6000, Chicago, Illinois 60606,United States of America
Janus Henderson Investors (Singapore) Limited (“JHISL”) 138 Market Street#34-03/04 CapitaGreen Singapore 048946
Janus Henderson Investors UK Limited ("JHIUKL")201 BishopsgateLondon EC2M 3AEUnited Kingdom
Kapstream Capital PTYLimited (“Kapstream”)Level 5, 151 Macquarie Street Sydney NSW 2000 Australia
DistributorsJanus Henderson Investors UK Limited201 BishopsgateLondon EC2M 3AEUnited Kingdom
Janus Henderson Investors International Limited201 BishopsgateLondon EC2M 3AEUnited Kingdom
PromoterJanus Henderson Investors International Limited201 BishopsgateLondon EC2M 3AEUnited Kingdom
AdministratorJ.P. Morgan Administration Services (Ireland) Limited200 Capital Dock79 Sir John Rogerson’s QuayDublin 2Ireland
Transfer AgentInternational Financial Data Services (Ireland) LimitedBishops SquareRedmond’s HillDublin 2Ireland
Depositary**J.P. Morgan SE – Dublin Branch200 Capital Dock79 Sir John Rogerson’s QuayDublin 2Ireland
Securities Lending AgentJ.P. Morgan Chase Bank, National Association (London Branch)25 Bank Street CanaryWharf London, E14 5JPUnited Kingdom
Legal AdvisersArthur Cox LLP10 Earlsfort TerraceDublin 2Ireland
Company Secretary Bradwell Limited10 Earlsfort TerraceDublin 2Ireland
*Independent Director
**Following a restructure within J.P Morgan, the Depositary changed from J.P.Morgan Bank (Ireland) PLC to J.P. Morgan SE – Dublin Branch on 22 January 2022.
***Janus Capital Management LLC changed its name to Janus Henderson Investors US LLC on 3 January 2022.
****Perkins Investment Management LLC relationship has been terminated with effect from 30 September 2021.
DocuSign Envelope ID: 521655BF-9BE3-47DC-A9A3-494932954338

Directors and Other Information (unaudited) (continued)
for the financial year ended 31 December 2021
Janus Henderson Capital Funds plc / 31 December 20212
Below is a list of the Funds’ Representatives/Paying Agents as of 31 December 2021.
Country Representative/Paying Agent
Hong Kong Janus Henderson Investors Hong KongLimited Suites 706-707Chater House8 Connaught Road CentralCentralHong Kong
Switzerland Swiss RepresentativeFirst Independent Fund ServicesKlausstrasse 338008 ZurichSwitzerland
Swiss Paying AgentBanque Cantonale de GenèveCase Postale 22511211 Genève Switzerland
DocuSign Envelope ID: 521655BF-9BE3-47DC-A9A3-494932954338

Background of the Company
3Janus Henderson Capital Funds plc / 31 December 2021
Janus Henderson Capital Funds plc (the “Company”) is an open ended investment company with variable capital incorporated in Ireland on 19 November 1998, under Registration No. 296610. Unless otherwise provided for in this report, all capitalised terms shall have the same meaning herein as in the prospectus of the Company dated 30 September 2021 (the “Prospectus”).
The Company is authorised by the Central Bank of Ireland (the “Central Bank”), as an Undertaking for Collective Investment in Transferable Securities (“UCITS”) under the European Communities UCITS Regulations 2011, as amended and the Central Bank (Supervision and Enforcement) Act 2013 (Section 48(1)) (Undertakings for Collective Investment in Transferable Securities) Regulations 2019 (“UCITS Regulations”). The Company has been structured as an umbrella fund with segregated liability between Funds so that separate Classes of Shares representing interests in different Funds may be authorised for issue from time to time by the Manager with the prior approval of the Central Bank. A separate portfolio of assets will be maintained for each Fund. The assets of each of the Funds will be invested in accordance with the investment objective and policies applicable to that Fund as disclosed in the relevant Supplement. The Company may issue multiple Classes in respect of each Fund upon prior approval of the Central Bank. A separate pool of assets shall not be maintained for each Class within the same Fund. Additional Funds may be established by the Manager with the prior approval of the Central Bank.
The Company has thirty seven constituent sub-funds (individually a “Fund”, collectively the “Funds”) as follows:
Equity & Allocation Funds Janus Henderson Balanced FundJanus Henderson Emerging Markets Leaders Fund(a)
Janus Henderson Europe Fund(a)
Janus Henderson Global Adaptive Capital Appreciation Fund(b)
Janus Henderson Global Adaptive Capital Preservation FundJanus Henderson Global Adaptive Multi-Asset FundJanus Henderson Global Life Sciences FundJanus Henderson Global Research FundJanus Henderson Global Technology and Innovation Fund
Janus Henderson US Contrarian FundJanus Henderson US Balanced 2026 FundJanus Henderson US Research FundJanus Henderson US Forty FundJanus Henderson US Venture FundJanus Henderson Global Value Fund(a)
Janus Henderson US Small-Mid Cap Value Fund
Intech Sub-Advised FundsJanus Henderson Intech All-World Minimum Variance Core Fund(c)
Janus Henderson Intech Emerging Markets Managed Volatility Fund1
Janus Henderson Intech European Core FundJanus Henderson Intech Global Absolute Return Fund(d)
Janus Henderson Intech Global All Country Low Volatility Fund(e)
Janus Henderson Intech Global All Country Managed Volatility Fund1
Janus Henderson Intech Global Income Managed Volatility Fund(a)
Janus Henderson Intech US Core Fund
Alternative Investment FundsJanus Henderson Global Diversified Alternatives Fund(a)
Janus Henderson Global Real Estate Equity Income Fund
Fixed Income FundsJanus Henderson Absolute Return Income FundJanus Henderson Absolute Return Income Fund (EUR) (f)
Janus Henderson Absolute Return Income Opportunities FundJanus Henderson Flexible Income FundJanus Henderson Fixed Maturity Bond Fund I1
Janus Henderson Global Flexible Income Fund(a)
Janus Henderson Global High Yield Fund(g)
Janus Henderson Global Investment Grade Bond FundJanus Henderson High Yield FundJanus Henderson Multi-Sector Income FundJanus Henderson US Short-Term Bond Fund
Other Relevant Information(i) Details of the investment objectives and policies of those Funds that have not yet launched are set out in the relevant supplement to the Prospectus.
1Not yet launched.
(a) This Fund is closed to new subscriptions (including exchanges into the Fund), and is in the process of being terminated.
(b) This Fund ceased investment activities on 27 May 2021.
(c) This Fund ceased investment activities on 09 July 2021.
(d) This Fund ceased investment activities on 03 March 2021.
(e) This Fund ceased investment activities on 18 May 2021.
(f) This Fund merged with High Yield Fund and ceased investment activities on 10 November 2021.
(g) This Fund ceased investment activities on 8 October 2021.
DocuSign Envelope ID: 521655BF-9BE3-47DC-A9A3-494932954338

Background of the Company (continued)
Janus Henderson Capital Funds plc / 31 December 20214
(ii) Copies of audited annual reports and unaudited interim reports may be obtained from the registered office of the Company at 10 Earlsfort Terrace, Dublin 2, Ireland free of charge or may be inspected at the office of the Company during normal business hours on any business day. The reports are also available on the below website:
https://www.janushenderson.com/en/row/documents/
(iii) Banque Cantonale de Genève, carries out the function of Swiss paying agent and First Independent Fund Services Limited, with its seats in Zurich, carries out the function of Swiss representative of the Company in relation to the Shares marketed in, or from Switzerland. Swiss investors may obtain the latest extract prospectus for investors in Switzerland, key investor information documents for Swiss investors, the Company’s memorandum and articles of association, the latest audited annual reports and unaudited interim reports as applicable and the list of purchases and sales that the Company has undertaken during the financial period upon simple request and free of charge from the Swiss representative, First Independent Fund Services Limited, address for enquiries: First Independent Fund Services Limited, 33 Klausstrasse, 8008 Zurich, Switzerland.
(iv) As at 31 December 2021 the following Funds are not authorised in Hong Kong and are not available to the public in Hong Kong:
1. Janus Henderson Global Adaptive Capital Appreciation Fund2. Janus Henderson Global Adaptive Capital Preservation Fund3. Janus Henderson Global Adaptive Multi-Asset Fund4. Janus Henderson US Balanced 2026 Fund5. Janus Henderson US Research Fund* 6. Janus Henderson Intech All-World Minimum Variance Core Fund7. Janus Henderson Intech European Core Fund8. Janus Henderson Intech Global Absolute Return Fund9. Janus Henderson Intech Global All Country Low Volatility Fund10. Janus Henderson Global Diversified Alternatives Fund11. Janus Henderson Absolute Return Income Fund12. Janus Henderson Absolute Return Income Fund (EUR)13. Janus Henderson Absolute Return Income Opportunities Fund14. Janus Henderson Global High Yield Fund15. Janus Henderson Global Investment Grade Bond Fund*16. Janus Henderson Europe Fund17. Janus Henderson Global Value Fund18. Janus Henderson Intech Global Income Managed Volatility Fund19. Janus Henderson Emerging Markets Leaders Fund20. Janus Henderson Global Flexible Income Fund
(v) As at 31 December 2021 the following active Funds are not registered in the Federal Republic of Germany and are not marketed to German investors:
1. Janus Henderson Global Adaptive Capital Preservation Fund2. Janus Henderson Intech All-World Minimum Variance Core Fund*3. Janus Henderson Intech Global All Country Low Volatility Fund*4. Janus Henderson US Balanced 2026 Fund
*Funds closed during the year.
*The funds were deregistered in Hong Kong in September 2021.
DocuSign Envelope ID: 521655BF-9BE3-47DC-A9A3-494932954338

Background of the Company (continued)
5Janus Henderson Capital Funds plc / 31 December 2021
Summary of share class launches during the financial yearThe below share classes launched during the financial year:
Share Class Launch Date
Launch Price
(Local Currency)
Janus Henderson Global Life Sciences Fund I2 HKD 14 April 2021 10Janus Henderson Global Life Sciences Fund A2 EUR 14 April 2021 10Janus Henderson Global Life Sciences Fund I2 HAUD 14 April 2021 10Janus Henderson Global Technology and Innovation Fund A2 EUR 14 April 2021 10Janus Henderson Global Technology and Innovation Fund H2 EUR 14 April 2021 10Janus Henderson Global Technology and Innovation Fund E2 USD
28 September 2021 10
Janus Henderson US Contrarian Fund A2 HCHF 17 June 2021 10Janus Henderson US Contrarian Fund H2 HCHF 17 June 2021 10Janus Henderson US Contrarian Fund I2 HCHF 17 June 2021 10Janus Henderson US Venture Fund V2 USD 14 April 2021 10Janus Henderson US Venture Fund V2 HEUR 14 April 2021 10Janus Henderson Global Real Estate Equity Income Fund V5m USD
28 September 2021 10
Janus Henderson Global Real Estate Equity Income Fund V2 USD
28 September 2021 10
Janus Henderson Global Real Estate Equity Income Fund A5m USD
28 September 2021 10
Janus Henderson Global Real Estate Equity Income Fund I3m USD 8 November 2021 10Janus Henderson High Yield Fund A3m HEUR 10 August 2021 10Janus Henderson High Yield Fund H1m HEUR 10 August 2021 10Janus Henderson High Yield Fund I1m HEUR 10 August 2021 10Janus Henderson US Short-Term Bond Fund A3m USD 14 April 2021 10Janus Henderson US Short-Term Bond Fund I3m USD 14 April 2021 10
Summary of share class closures during the financial yearThe below share classes closed during the financial year:
Janus Henderson Global Adaptive Capital Appreciation Fund
Share Class Closure DateA2 USD 27 May 2021I2 USD 27 May 2021Z1 USD 27 May 2021
Janus Henderson Intech All-World Minimum Variance Core Fund
Share Class Closure DateZ2 GBP 09 July 2021
Janus Henderson Intech Global Absolute Return Fund
Share Class Closure DateA2 USD 03 March 2021H2 USD 03 March 2021I2 USD 03 March 2021
Janus Henderson Intech Global All Country Low Volatility Fund
Share Class Closure DateZ2 GBP 18 May 2021
Janus Henderson Absolute Return Income Fund (EUR)
Share Class Closure DateA2 EUR 10 November 2021G2 EUR 10 November 2021G2 HCHF 10 November 2021I2 EUR 10 November 2021S2 EUR 10 November 2021
Janus Henderson Global High Yield Fund
Share Class Closure DateA2 HEUR 08 October 2021A2 USD 08 October 2021A3 m HEUR 08 October 2021A3 m USD 08 October 2021E2 HEUR 08 October 2021E3 m HEUR 08 October 2021H1 m HEUR 08 October 2021H1 m USD 08 October 2021I1 m HEUR 08 October 2021I1 m USD 08 October 2021Z1 s USD 08 October 2021
DocuSign Envelope ID: 521655BF-9BE3-47DC-A9A3-494932954338

Market Review (unaudited)
Janus Henderson Capital Funds plc / 31 December 20216
OverviewGlobal equity markets rose strongly during the year to 31 December 2021 (MSCI World Index +22.4% in US dollar terms), on the roll-out of COVID-19 vaccines, positive earnings momentum, and relief that the impact of the Omicron variant of COVID-19 would probably not be as bad as initially feared. Markets had sold off towards the end of November as it was announced that the more infectious Omicron strain had been discovered. Rising energy costs and supply concerns about inflation, which prompted major central banks to turn increasingly hawkish. Towards year end, tensions between the West and Moscow rose over the build-up of Russian troops on the border with Ukraine.
EquitiesUKThe FTSE All-Share Index gained 18.3% in sterling terms, buoyed by the rapid roll-out of COVID-19 vaccines, loosening lockdown restrictions in the spring, and some favourable corporate results. The market sold off towards the end of November as it was announced that the Omicron strain had been detected, although the subsequent moderation in these worries allowed investors to shrug off concerns about record high COVID-19 infections in the UK and the return of some restrictions. Persistently high inflation – the annual rate hit a 10-year high of 5.1% in November, up from just 0.7% in January – prompted the Bank of England to announce in December that it would raise interest rates by 15 basis points to 0.25%. The UK economy remained smaller than its pre-pandemic level as growth slowed to 1.1% over the third quarter, from 5.4% over the second quarter.
EuropeStocks strengthened (FTSE World Europe ex UK Index +24.5% in euro terms), as they benefited from solid corporate results, receding worries about the Omicron variant, and continued monetary policy support. The slow pace of vaccinations in the European Union in early 2021; a tightening of COVID-19 restrictions in March, which was repeated towards the end of the year; and the emergence of the Omicron variant rattled markets. Rising prices – the eurozone annual inflation rate hit a record 5.0% in December, up from 0.9% in January – added further pressure. The European Central Bank maintained its monetary policy support. However, it said in December that it would halt its pandemic emergency purchase programme in early 2022, although it would continue to buy bonds under an older scheme. Eurozone GDP expanded by 2.2% over the third quarter, unchanged from the previous quarter.
USThe S&P 500 Index increased by 28.7% in US dollar terms, having hit a series of record highs during the year, on optimism about new economic stimulus measures, generally strong corporate results, and easing worries about the pandemic at the end of the year. The spread of the Delta variant of COVID-19 and the subsequent emergence of Omicron, combined with surging prices – annual inflation reached a near 40-year high of 6.8% in November, up from 1.4% in January – created volatility in 2021. In response
to the pricing pressures, the US Federal Reserve (Fed) said in December that it would bring forward plans to halt its huge asset-purchasing scheme and expected to raise interest rates three times in 2022. US GDP expanded by an annualised 2.3% in the third quarter, down from 6.7% growth in second quarter. The US dollar strengthened, helped by the prospect of monetary policy tightening.
JapanThe TOPIX rose by 12.7% in yen terms, as the roll-out of COVID-19 vaccinations and optimism about further government stimulus measures outweighed worries about rises in infections during the year and the Omicron variant. The resignation of Prime Minister Yoshihide Suga triggered a rally in September on expectations that his successor would implement new measures to boost the economy. The new prime minister, Fumio Kishida, won a snap general election at the end of October and, subsequently, announced a huge new spending package. Core inflation rate, which excludes fresh food prices, rose for the first time in 18 months in September and continued to increase in the following two months. The Bank of Japan said in December that it would wind down its emergency asset-purchasing programme, although it maintained other policy measures. The economy contracted by an annualised 3.6% in the third quarter, following 1.5% growth in the second quarter.
AsiaThe MSCI AC Asia Pacific ex Japan Index fell by 2.7% in US dollar terms, led by declines in China, and worries about economic slowdown and the Omicron strain. Chinese equities slumped as COVID-19 outbreaks in the country, a cooling economy, the property sector’s debt problems, electricity rationing, and a regulatory crackdown weighed on sentiment. South Korean shares declined on concerns about the Omicron strain and record high COVID-19 infections in the country. Rallying technology shares and solid corporate results boosted Taiwan’s market. Australian stocks gained as easing lockdown restrictions and rises in commodity prices buoyed sentiment.
Emerging marketsThe MSCI Emerging Markets Index declined by 2.2% in US dollar terms, on concerns about monetary policy tightening and the pandemic. India’s market was sharply higher as easing restrictions helped GDP rebound, and economic optimism propelled the benchmark S&P BSE Sensex Index to record highs. Brazilian shares were sharply lower on discontent over the leadership of President Jair Bolsonaro and concerns about the government plans to increase welfare spending. Russian stocks made strong gains as the benefits of energy commodity price rises outweighed worries about increased tensions between Moscow and the West. Turkey’s market slumped in sterling and US dollar terms as the central bank cut interest rates despite soaring inflation, which pushed the lira to record lows against the US dollar. South African equities moved higher, as relief that the Omicron strain appears to have a milder health impact than previous variants helped stocks rally towards the end of 2021.
DocuSign Envelope ID: 521655BF-9BE3-47DC-A9A3-494932954338

Market Review (unaudited) (continued)
7Janus Henderson Capital Funds plc / 31 December 2021
Fixed income and commoditiesWithin fixed income, the JPM Global Government Bond Index dropped by 6.5% in US dollar terms. Yields on core government bond markets – including the US, UK, Germany and Japan – rose, spiking in February as investors grew increasingly concerned about inflation. Yields moved higher again towards year end, as some major central banks turned increasingly hawkish. The US benchmark 10-year Treasury yield finished 2021 at about 1.5%, up by more than 60%. In corporate debt markets, companies issued about US$5.5trn in bonds in 2021, down by less than 3% from the previous year, as they continued to take advantage of historically low borrowing costs.
In commodity markets, oil prices were sharply higher. Robust demand and tightening supplies helped lift prices to multi-year highs in October, although they slumped the following month as the Omicron variant was discovered, before recovering in December. US benchmark West Texas Intermediate (WTI) ended the year above US$75 per barrel, up by more than 50%. Spot gold prices were marginally lower, as vaccine-led economic optimism reduced the precious metal’s appeal. However, elevated inflation – and gold’s use as a hedge against rising prices – and uncertainty about the pandemic limited the losses. Copper prices rallied as strong demand helped the commodity hit record highs in May. Prices subsequently came under pressure as Chinese demand waned, although they rose sharply in October as supplies tightened.
Index returns are sourced from Refinitiv Datastream and are presented in local currency total return terms unless otherwise stated. Past performance is not a guide to future performance.
DocuSign Envelope ID: 521655BF-9BE3-47DC-A9A3-494932954338

Report of the Directors
Janus Henderson Capital Funds plc / 31 December 20218
The Directors submit their report together with the audited financial statements for the financial year ended 31 December 2021.
Connected PersonsIn accordance with the requirements of the UCITS Regulations, the Board of Directors (the “Board”) confirms that there are arrangements (evidenced by written procedures) in place, to ensure:
(i) that any transaction carried out with the Company by Janus Henderson Investors International Limited ("JHIIL"), the Depositary and/or associated or group companies of these (“connected persons”) were carried out as if negotiated at arm’s length and that such transactions were in the best interests of the shareholders; and
(ii) that these arrangements were applied to all transactions with connected parties during the year. The Board is satisfied that transactions with connected persons entered into during the year were carried out as if negotiated at arm’s length and were in the best interests of the shareholders.
Please refer to Note 3 “Related Party Transactions” for details of transactions with the Directors’ during the financial year.
Directors’ ResponsibilitiesThe Directors are responsible for preparing the annual report and the financial statements in accordance with FRS 102 the Financial Reporting Standard applicable in the UK and Republic of Ireland issued by the Financial Reporting Council (FRC) (“FRS 102”) and the UCITS Regulations 2011 as amended and the Central Bank (Supervision and Enforcement) Act 2013 (Section 48(1)) (Undertakings for Collective Investment in Transferable Securities) Regulations 2019 (the “Central Bank UCITS Regulations”).
Irish company law requires the Directors to prepare financial statements for each financial year which give a true and fair view of the assets, liabilities and financial position of the Company as at the end of the financial year, and profit or loss, for the financial year. In preparing those financial statements, the Directors are required to:
• select suitable accounting policies and then apply them consistently;
• make judgments and estimates that are reasonable and prudent;
• state whether the financial statements have been prepared in accordance with applicable accounting standards and identify the standards in question, subject to any material departures from those standards being disclosed and explained in the notes to the financial statements; and
• prepare the financial statements on the going concern basis unless it is inappropriate to presume that the Company will continue in business.
The Directors confirm that they have complied with the above requirements in preparing the financial statements.
The Directors are responsible for keeping adequate accounting records that are sufficient to correctly record and explain the transactions of the Company; enable, at any time, the assets, liabilities, financial position and profit or loss of the Company to be determined with reasonable accuracy; and enable them to ensure that the financial statements comply with the Companies Act 2014 and the UCITS Regulations. They are also responsible for safeguarding the assets of the Company and hence for taking reasonable steps for the prevention and detection of fraud and other irregularities.
The Directors are also responsible for confirming so far as they are aware that there is no relevant audit information of which the Company’s statutory auditors are unaware. The Directors have taken all the steps that they ought to have taken as directors in order to make themselves aware of any relevant audit information and to establish that the Company’s statutory auditors are aware of that information.
Under the UCITS Regulations, the Directors are required to entrust the assets of the Company to a trustee for safe-keeping. In carrying out this duty, the Company has delegated custody of the Company’s assets to J.P Morgan Bank (Ireland) PLC Designated Activity Company.
The Directors are responsible for the maintenance and integrity of the corporate and financial information of the Company included on the website of Janus Henderson Investors (www.janushenderson.com). Legislation in the Republic of Ireland governing the preparation and dissemination of financial statements may differ from legislation in other jurisdictions.
Corporate Governance StatementThe Company has adopted the ‘Corporate Governance Code for Collective Investment Schemes and Management Companies’ issued by the Irish Funds Industry Association (the “IF Code”) which can be obtained from the Irish Funds’ website at www.irishfunds.ie. The Company is also subject to corporate governance practices imposed by:
• The Irish Companies Act 2014 which is available for inspection at the registered office of the Company; and may also be obtained at www.irishstatutebook.ie.
• The Articles of Association of the Company which are available for inspection at the registered office of the Company and at the Companies Registration Office in Ireland; and
DocuSign Envelope ID: 521655BF-9BE3-47DC-A9A3-494932954338

Report of the Directors (continued)
9Janus Henderson Capital Funds plc / 31 December 2021
• The Central Bank of Ireland (the “Central Bank”) in their UCITS Regulations which can be obtained from the Central Bank’s website at: www.centralbank.ie and are available for inspection at the registered office of the Company.
The Company is subject to the Companies Act and the UCITS Regulations, as applicable to investment funds. The Company does not apply additional corporate governance requirements beyond those required by the above. Each of the service providers engaged by the Company is subject to its own corporate governance requirements.
Directors’ Compliance StatementIt is the policy of the Company to comply with its relevant obligations (as defined in the Companies Act 2014). As required by Section 225(2) of the Companies Act 2014, the Directors acknowledge that they are responsible for securing the Company’s compliance with the relevant obligations. The Directors have drawn up a compliance policy statement as defined in Section 225(3)(a) of the Companies Act 2014 and a compliance policy which refers to the arrangements and structures that are in place and which are, in the Directors’ opinion, designed to secure material compliance with the Company’s relevant obligations. In discharging their responsibilities under Section 225, the Directors relied upon, among other things, the services provided, advice and/or representations from third parties whom the Directors believe have the requisite knowledge and experience in order to secure material compliance with the Company’s relevant obligations.
Financial Reporting Process – Description of Main FeaturesThe Board is ultimately responsible for overseeing the establishment and maintenance of adequate internal control and risk management systems of the Company in relation to the financial reporting process. The Company has no employees and has delegated all functions, including the preparation of the financial statements, to Henderson Management S.A. (the “Manager”) which has in turn delegated responsibility for certain functions to other parties as outlined herein. The Manager has appointed J.P Morgan Administration Services (Ireland) Limited (the “Administrator”) as the Company’s administrator. The Administrator has functional responsibility for the preparation of the Company’s interim and annual financial statements and the maintenance of its accounting records. On appointing the Administrator, the Board and the Manager noted that it was regulated by the Central Bank and in the Board’s and the Manager’s opinion, had significant experience as an administrator. The Board and the Manager also noted the independence of the Administrator from the Company’s investment adviser and the Manager. Subject to the supervision of the Manager and the overall supervision of the Board, the appointment of the Administrator is intended to manage rather than eliminate the risk of failure to achieve the Company’s financial reporting objectives and can only provide reasonable and
not absolute assurance against material misstatement or loss.
The Board evaluates and discusses significant accounting and reporting issues as the need arises. The Board reviews the financial statements prior to their approval, though it should be noted that such review does not include verification of information in the financial statements to source documents. The annual financial statements are subject to independent audit by PricewaterhouseCoopers and the Board receives and considers a report from PricewaterhouseCoopers as to the audit process.
Risk AssessmentThe Board is responsible for assessing the risk of irregularities whether caused by fraud or error in financial reporting and for ensuring that processes are in place for the timely identification of internal and external matters with a potential effect on financial reporting. The Board is advised by the Administrator as to changes in accounting rules and provides recommendations as to how these changes are best reflected in the Company’s financial statements. The Board’s appointment of an administrator independent of the investment adviser to the Company and which is regulated by Central Bank is intended to mitigate though not eliminate the risk of fraud or irregularities which may impact the financial statements of the Company.
MonitoringThe Board receives and reviews regular reporting from the Depositary, Investment Adviser and Administrator. The Board also has an annual process to ensure that appropriate measures are taken to consider and address any control weaknesses identified and measures recommended by the independent auditors.
Capital StructureNo individual person or individual company has a significant direct or indirect holding of securities in the Company. No individual person or individual company has any special rights of control over the Company’s share capital. There are no restrictions on voting rights.
For the appointment and replacement of Directors, the Company is governed by its Articles of Association. The Articles of Association themselves may be amended by special resolution of the shareholders.
Composition and Operation of the Board of Directors Each of the Directors have entered into a letter of appointment with the Company.
All related party transactions during the financial year are detailed in Note 3 to the financial statements. The Articles of Association do not provide for retirement of Directors by rotation. However, the Directors may be removed by the shareholders by ordinary resolution in accordance with the procedures established under the Companies Act. The Board meets at least quarterly. There are no sub-committees of the Board.
DocuSign Envelope ID: 521655BF-9BE3-47DC-A9A3-494932954338

Report of the Directors (continued)
Janus Henderson Capital Funds plc / 31 December 202110
The Board is responsible for managing the overall business affairs of the Company. Under the Articles of Association, the Board has appointed the Depositary to act as depositary to the Company and has delegated certain of its powers, duties and functions to the Manager which has in turn delegated certain of its powers, duties and functions to the Administrator, the Transfer Agent, the Distributors, and the Investment Adviser.
Shareholder MeetingsThe annual general meeting (the “AGM”) of the Company will usually be held in Dublin as determined by the Directors, normally during the month of June, in any event it shall be held within six months of the Company’s financial year-end as determined by the Directors. Notice convening the AGM in each year at which the audited financial statements of the Company will be presented (together with the Directors’ and Independent Auditors’ Reports of the Company) will be sent to Shareholders at their registered addresses with 21 clear days notice before the date fixed for the meeting. Other general meetings may be convened from time to time by the Directors in such manner as provided by Irish law and the Articles of Association.
Each of the Shares entitles the holder to attend and vote at meetings of the Company and of the Funds represented by those Shares. Matters may be determined by a meeting of Shareholders on a show of hands unless a poll is requested by at least five Shareholders present or by Shareholders present holding 10% or more of the Shares in issue having the right to vote at the meeting or unless the chairman of the meeting requests a poll. Each Shareholder has one vote on a show of hands. Each Share gives the holder one vote in relation to any matters relating to the Company which are submitted to Shareholders for a vote by poll.
No Class confers on the holder thereof any preferential or preemptive rights or any rights to participate in the profits and dividends of any other Class or any voting rights in relation to matters relating solely to any other Class.
The quorum for any general meeting shall be two shareholders present in person or by proxy save that where it is proposed to vary the rights attached to a particular class of Shares, unless otherwise provided, the quorum at such general meeting shall be two or more shareholders of that class present in person or by proxy together holding at least one-third of the Shares of that class.
Each of the Shares other than subscriber shares entitles the Shareholder to participate equally on a pro-rata basis in the dividends and net assets of the Company in respect of which the Shares have been issued, save in the case of dividends declared prior to becoming a Shareholder.
Accounting RecordsTo ensure that adequate accounting records are kept in accordance with Section 281 to 285 of the Companies Act 2014, the Board has employed a service organisation, J.P. Morgan Administration Services (Ireland) Limited (the “Administrator”). The accounting records are kept at J.P.
Morgan Administration Services (Ireland) Limited , 200 Capital Dock, 79 Sir John Rogerson’s Quay, Dublin 2, Ireland.
Principal ActivitiesThe Company is an investment company with variable capital incorporated under the laws of Ireland as a public limited company pursuant to the Companies Act 2014, and the UCITS Regulations. The Company is an umbrella fund with segregated liability between Funds.
Review of the Development of the Business and Future DevelopmentsThe business of the Company is reviewed in detail in the Investment Adviser’s Fund Overviews. The performance of the various Classes on offer is detailed in the Fund Performance section. Details of changes to the Prospectus and changes to various Funds and share classes are detailed in the Other Relevant Information section to the Background of the Company and in the Significant Events During the Financial Year section (See Note 17). The Company intends to continue promoting and generating interest in its business in the future.
During the year, the Company has entered into a securities lending programme. Please refer to note 7 of the financial statements for further details. Please refer to note 1 of the financial statements for details of Fund closures during the year.
Risk Management Objectives and PoliciesDetails of the risks applicable to an investment in the Company are listed in Note 14 Financial Instruments and Financial Derivative Instruments, including market price risk, foreign currency risk, interest rate risk, liquidity risk and credit risk. In order to manage such risks, the Company shall comply with the investment restrictions and diversification limits provided for in the Prospectus and the UCITS Regulations.
Results and DividendsThe results for the financial year and particulars relating to distributions are stated in the Statement of Comprehensive Income included in the individual Fund’s section of the financial statements. Particulars relating to the issue and redemption of Shares are set out in the Capital Share Transactions section of the financial statements located in the individual fund sections.
Audit CommitteeThe Company has decided that there is no requirement to form an audit committee as there are two independent Directors on the Board. The activities of the company have been delegated to a number of service providers and there is a robust due diligence procedure in place for these service providers.
Brexit UpdateThe United Kingdom (UK) left the European Union (EU) on 31 January 2020, a transition period was in place until 31 December 2020, during which all EU rules and laws
DocuSign Envelope ID: 521655BF-9BE3-47DC-A9A3-494932954338

Report of the Directors (continued)
11Janus Henderson Capital Funds plc / 31 December 2021
continued to apply to the UK. On 1 January 2021, the transition period came to an end, and the new rules entered into force.
The EU and the UK have agreed to establish a structured regulatory co-operation on financial services, with the aim of establishing a durable and stable relationship between autonomous jurisdictions. A Memorandum of Understanding, establishing the framework for the co-operation, allows the fund to continue to delegate investment management to a UK based firm.
COVID-19The outbreak of the novel coronavirus (‘COVID-19’) and subsequent global pandemic began impacting financial markets and economies during the first quarter of 2020. The worldwide spread of the virus led to uncertainty on an unprecedented scale. The impact of COVID-19 has been taken into account in the recognition and measurement of the primary statements for the year to 31 December 2021.
The Russia/Ukraine conflict is closely monitored and assessed by various business units which has not required activation of the business continuity plans or a change from regular business processes up to the date of signing. The Fund did not have any direct exposure to Russia and /or Ukraine as at 31 December 2021. The secondary market impact resulting in an increase in overall market volatility influences risk levels of the Funds. The Funds continues to be managed according to their investment objective through this period of uncertainty with currently no areas of concern identified. The Funds valuations are carried out without any necessary deviation from the valuation policy. The situation is regularly changing and monitored by the Investment Manager. The overall impact is not yet known.
Significant Events During the Financial YearPlease refer to Note 17 for details of significant events during the financial year.
Significant Events Since Financial Year EndPlease refer to Note 18 for details of significant events since the financial year end.
DirectorsThe names of the persons who were Directors at any time during the financial year ended 31 December 2021 are listed below.Carl O’Sullivan (Ireland)* Peter Sandys (Ireland)* Ian Dyble (UK)Matteo Candolfini (Luxembourg) Jane Challice (UK) *Independent Director
Directors’ and Company Secretary’s InterestsNone of the Directors or the Company Secretary, at the date of this report, holds or held, on the date of his appointment or at 31 December 2021, or 31 December 2020 any beneficial interest in the Shares of the Company.
Independent AuditorsThe auditors, PricewaterhouseCoopers, will continue in office in accordance with Section 383 of the Companies Act 2014.
On behalf of the Board:
Carl O’SullivanDirector
Matteo CandolfiniDirector
28 April 2022
DocuSign Envelope ID: 521655BF-9BE3-47DC-A9A3-494932954338

Report from the Depositary to the Shareholders
Janus Henderson Capital Funds plc / 31 December 202112
We, J.P. Morgan SE - Dublin Branch, appointed Depositary to Janus Henderson Capital Funds plc (“the Company”) provide this report solely in favour of the Shareholders of the Company from 1 January 2021 to 31 December 2021 (“the Accounting Period”).
This report is provided in accordance with the UCITS Regulations – European Communities (Undertakings for Collective Investment in Transferable Securities) Regulations 2011, as amended, (“the Regulations”). We do not, in the provision of this report, accept nor assume responsibility for any other purpose or to any other person to whom this report is shown.
In accordance with our Depositary obligation as provided for under the Regulations, we have enquired into the conduct of the Company for the Accounting Period and we hereby report thereon to the Shareholders of the Company as follows; We are of the opinion that the Company has been managed during the Accounting Period, in all material respects:
(i) in accordance with the limitations imposed on the investment and borrowing powers of the Company by the constitutionaldocuments and the Regulations; and
(ii) otherwise in accordance with the provisions of the constitutional documents and the Regulations.
For and on behalf ofJ.P. Morgan SE - Dublin Branch 200 Capital Dock79 Sir John Rogerson’s Quay Dublin 2, D02 RK57IrelandDate: 28 April 2022
DocuSign Envelope ID: 521655BF-9BE3-47DC-A9A3-494932954338

Independent auditors’ report to the members of Janus Henderson Capital Funds plc
Report on the audit of the financial statements
Opinion
In our opinion, Janus Henderson Capital Funds plc’s financial statements:
• give a true and fair view of the Company’s and Funds’ assets, liabilities and financial position as at 31 December2021 and of their results for the year then ended;
• have been properly prepared in accordance with Generally Accepted Accounting Practice in Ireland (accountingstandards issued by the Financial Reporting Council of the UK, including Financial Reporting Standard 102 “TheFinancial Reporting Standard applicable in the UK and Republic of Ireland” and Irish law); and
• have been properly prepared in accordance with the requirements of the Companies Act 2014 and the EuropeanCommunities (Undertakings for Collective Investment in Transferable Securities) Regulations 2011 (as amended).
We have audited the financial statements, included within the Annual Report & Accounts, which comprise:
• the Statement of Financial Position of the Combined Company and each of its Funds as at 31 December 2021;
• the Statement of Comprehensive Income of the Combined Company and each of its Funds for the year thenended;
• the Statement of Changes in Net Assets Attributable to Redeemable Ordinary Shareholders for the CombinedCompany and each of its Funds for the year then ended;
• the Portfolio Investments for each of the Funds as at 31 December 2021; and
• the notes to the financial statements for the Company and for each of its Funds, which include a description of thesignificant accounting policies.
Basis for opinion
We conducted our audit in accordance with International Standards on Auditing (Ireland) (“ISAs (Ireland)”) and applicable law.
Our responsibilities under ISAs (Ireland) are further described in the Auditors’ responsibilities for the audit of the financial statements section of our report. We believe that the audit evidence we have obtained is sufficient and appropriate to provide a basis for our opinion.
Independence
We remained independent of the Company in accordance with the ethical requirements that are relevant to our audit of the financial statements in Ireland, which includes IAASA’s Ethical Standard, and we have fulfilled our other ethical responsibilities in accordance with these requirements.
Emphasis of matter - financial statements prepared on a basis other than going concern
In forming our opinion on the financial statements, which is not modified, we draw attention to note 1 to the financial statements which describes the reasons why the financial statements of Janus Henderson Global Adaptive Capital Appreciation Fund, Janus Henderson Global Adaptive Capital Preservation Fund, Janus Henderson Intech All- World Minimum Variance Core Fund, Janus Henderson Intech Global Absolute Return Fund, Janus Henderson Intech Global All Country Low Volatility Fund, Janus Henderson Intech US Core Fund, Janus Henderson Absolute Return Income Fund (EUR) and Janus Henderson Global High Yield Fund, have been prepared on a basis other than going concern.
Conclusions relating to going concern
With the exception of Janus Henderson Global Adaptive Capital Appreciation Fund, Janus Henderson Global Adaptive Capital Preservation Fund, Janus Henderson Intech All- World Minimum Variance Core Fund, Janus Henderson Intech Global Absolute Return Fund, Janus Henderson Intech Global All Country Low Volatility Fund, Janus Henderson Intech US Core Fund, Janus Henderson Absolute Return Income Fund (EUR) and Janus Henderson Global High Yield Fund,

where a basis of accounting other than going concern has been adopted as set out in the Emphasis of matter - financial statements prepared on a basis other than going concern above, based on the work we have performed, we have not identified any material uncertainties relating to events or conditions that, individually or collectively, may cast significant doubt on the Company’s and Funds’ ability to continue as a going concern for a period of at least twelve months from the date on which the financial statements are authorised for issue.
With the exception of Janus Henderson Global Adaptive Capital Appreciation Fund, Janus Henderson Global Adaptive Capital Preservation Fund, Janus Henderson Intech All- World Minimum Variance Core Fund, Janus Henderson Intech Global Absolute Return Fund, Janus Henderson Intech Global All Country Low Volatility Fund, Janus Henderson Intech US Core Fund, Janus Henderson Absolute Return Income Fund (EUR) and Janus Henderson Global High Yield Fund, where a basis of accounting other than going concern has been adopted as set out in the Emphasis of matter - financial statements prepared on a basis other than going concern above, in auditing the financial statements, we have concluded that the directors’ use of the going concern basis of accounting in the preparation of the financial statements is appropriate.
However, because not all future events or conditions can be predicted, this conclusion is not a guarantee as to the Company’s and Funds’ ability to continue as a going concern.
Our responsibilities and the responsibilities of the directors with respect to going concern are described in the relevant sections of this report.
Reporting on other information
The other information comprises all of the information in the Annual Report & Accounts other than the financial statements and our auditors’ report thereon. The directors are responsible for the other information. Our opinion on the financial statements does not cover the other information and, accordingly, we do not express an audit opinion or, except to the extent otherwise explicitly stated in this report, any form of assurance thereon. In connection with our audit of the financial statements, our responsibility is to read the other information and, in doing so, consider whether the other information is materially inconsistent with the financial statements or our knowledge obtained in the audit, or otherwise appears to be materially misstated. If we identify an apparent material inconsistency or material misstatement, we are required to perform procedures to conclude whether there is a material misstatement of the financial statements or a material misstatement of the other information. If, based on the work we have performed, we conclude that there is a material misstatement of this other information, we are required to report that fact. We have nothing to report based on these responsibilities.
With respect to the Report of the Directors, we also considered whether the disclosures required by the Companies Act 2014 have been included.
Based on the responsibilities described above and our work undertaken in the course of the audit, ISAs (Ireland) and the Companies Act 2014 require us to also report certain opinions and matters as described below:
• In our opinion, based on the work undertaken in the course of the audit, the information given in the Report ofthe Directors for the year ended 31 December 2021 is consistent with the financial statements and has beenprepared in accordance with applicable legal requirements.
• Based on our knowledge and understanding of the Company and its environment obtained in the course of theaudit, we have not identified any material misstatements in the Report of the Directors.
Responsibilities for the financial statements and the audit
Responsibilities of the directors for the financial statements
As explained more fully in the Directors’ Responsibilities set out on page 8, the directors are responsible for the preparation of the financial statements in accordance with the applicable framework and for being satisfied that they give a true and fair view.
The directors are also responsible for such internal control as they determine is necessary to enable the preparation of financial statements that are free from material misstatement, whether due to fraud or error.
In preparing the financial statements, the directors are responsible for assessing the Company’s and Funds’ ability to continue as going concerns, disclosing as applicable, matters related to going concern and using the going concern basis of accounting unless the directors either intend to liquidate the Company or to cease operations, or have no realistic alternative but to do so.

Auditors’ responsibilities for the audit of the financial statements
Our objectives are to obtain reasonable assurance about whether the financial statements as a whole are free from material misstatement, whether due to fraud or error, and to issue an auditors’ report that includes our opinion. Reasonable assurance is a high level of assurance, but is not a guarantee that an audit conducted in accordance with ISAs (Ireland) will always detect a material misstatement when it exists. Misstatements can arise from fraud or error and are considered material if, individually or in the aggregate, they could reasonably be expected to influence the economic decisions of users taken on the basis of these financial statements.
Our audit testing might include testing complete populations of certain transactions and balances, possibly using data auditing techniques. However, it typically involves selecting a limited number of items for testing, rather than testing complete populations. We will often seek to target particular items for testing based on their size or risk characteristics. In other cases, we will use audit sampling to enable us to draw a conclusion about the population from which the sample is selected.
A further description of our responsibilities for the audit of the financial statements is located on the IAASA website at:
https://www.iaasa.ie/getmedia/b2389013-1cf6-458b-9b8f-a98202dc9c3a/Description_of_auditors_responsibilities_for_audit.pdf.
This description forms part of our auditors’ report.
Use of this report
This report, including the opinions, has been prepared for and only for the Company’s members as a body in accordance with section 391 of the Companies Act 2014 and for no other purpose. We do not, in giving these opinions, accept or assume responsibility for any other purpose or to any other person to whom this report is shown or into whose hands it may come save where expressly agreed by our prior consent in writing.
Other required reporting
Companies Act 2014 opinions on other matters
• We have obtained all the information and explanations which we consider necessary for the purposes of our audit.
• In our opinion the accounting records of the Company were sufficient to permit the financial statements to be readily and properly audited.
• The financial statements are in agreement with the accounting records.
Companies Act 2014 exception reporting
Directors’ remuneration and transactions
Under the Companies Act 2014 we are required to report to you if, in our opinion, the disclosures of directors’ remuneration and transactions specified by sections 305 to 312 of that Act have not been made. We have no exceptions to report arising from this responsibility.
Fíona de Búrca for and on behalf of PricewaterhouseCoopers Chartered Accountants and Statutory Audit Firm Dublin, Ireland 28 April 2022

Janus Henderson Capital Funds plc / 31 December 202116
The accompanying notes are an integral part of the financial statements.
Combined Company Financial Statements
Statement of Financial PositionAs of
31 December 2021
(USD)**
As of 31 December
2020 (USD)*
Assets:Financial assets at fair value through profit or loss . . . . . . . . . . . . . . . . . . . . . . . . . . . . . . . . . . . . . . . . . . . . . . . . . . . . . . . 18,715,324,707 15,418,760,246Cash and foreign currency . . . . . . . . . . . . . . . . . . . . . . . . . . . . . . . . . . . . . . . . . . . . . . . . . . . . . . . . . . . . . . . . . . . . . . . 214,785,365 385,212,589Margin cash . . . . . . . . . . . . . . . . . . . . . . . . . . . . . . . . . . . . . . . . . . . . . . . . . . . . . . . . . . . . . . . . . . . . . . . . . . . . . . . . . 571,316 718,583Collateral cash . . . . . . . . . . . . . . . . . . . . . . . . . . . . . . . . . . . . . . . . . . . . . . . . . . . . . . . . . . . . . . . . . . . . . . . . . . . . . . . 2,093,982 7,775,585Receivables:
Investments sold . . . . . . . . . . . . . . . . . . . . . . . . . . . . . . . . . . . . . . . . . . . . . . . . . . . . . . . . . . . . . . . . . . . . . . . . . . . . 224,157,837 19,383,391Spot foreign exchange contracts awaiting settlement . . . . . . . . . . . . . . . . . . . . . . . . . . . . . . . . . . . . . . . . . . . . . . . . . . . . 3,282 39,100Funds shares sold . . . . . . . . . . . . . . . . . . . . . . . . . . . . . . . . . . . . . . . . . . . . . . . . . . . . . . . . . . . . . . . . . . . . . . . . . . . 78,745,016 91,385,192Dividends . . . . . . . . . . . . . . . . . . . . . . . . . . . . . . . . . . . . . . . . . . . . . . . . . . . . . . . . . . . . . . . . . . . . . . . . . . . . . . . . . 4,817,568 5,451,724Interest . . . . . . . . . . . . . . . . . . . . . . . . . . . . . . . . . . . . . . . . . . . . . . . . . . . . . . . . . . . . . . . . . . . . . . . . . . . . . . . . . . . 27,285,239 31,073,679
Receivable from Investment Manager . . . . . . . . . . . . . . . . . . . . . . . . . . . . . . . . . . . . . . . . . . . . . . . . . . . . . . . . . . . . . . . . 178,093 446,161Other debtors . . . . . . . . . . . . . . . . . . . . . . . . . . . . . . . . . . . . . . . . . . . . . . . . . . . . . . . . . . . . . . . . . . . . . . . . . . . . . . . . 1,554,108 1,649,128
Total Assets . . . . . . . . . . . . . . . . . . . . . . . . . . . . . . . . . . . . . . . . . . . . . . . . . . . . . . . . . . . . . . . . . . . . . . . . . 19,269,516,513 15,961,895,378
Liabilities (amounts falling due within one year)Payables:
Financial liabilities at fair value through profit or loss . . . . . . . . . . . . . . . . . . . . . . . . . . . . . . . . . . . . . . . . . . . . . . . . . . . . 2,825,562 10,847,263Bank overdraft and foreign currency . . . . . . . . . . . . . . . . . . . . . . . . . . . . . . . . . . . . . . . . . . . . . . . . . . . . . . . . . . . . . . . 988,381 41,158Margin cash . . . . . . . . . . . . . . . . . . . . . . . . . . . . . . . . . . . . . . . . . . . . . . . . . . . . . . . . . . . . . . . . . . . . . . . . . . . . . . . 446,457 932,342Collateral cash . . . . . . . . . . . . . . . . . . . . . . . . . . . . . . . . . . . . . . . . . . . . . . . . . . . . . . . . . . . . . . . . . . . . . . . . . . . . . . 300,000 340,000Investments purchased . . . . . . . . . . . . . . . . . . . . . . . . . . . . . . . . . . . . . . . . . . . . . . . . . . . . . . . . . . . . . . . . . . . . . . . . 781,851,371 303,640,154Spot foreign exchange contracts awaiting payment . . . . . . . . . . . . . . . . . . . . . . . . . . . . . . . . . . . . . . . . . . . . . . . . . . . . . 37,998 574Fund shares repurchased . . . . . . . . . . . . . . . . . . . . . . . . . . . . . . . . . . . . . . . . . . . . . . . . . . . . . . . . . . . . . . . . . . . . . . 52,266,321 19,292,021Investment Management fees . . . . . . . . . . . . . . . . . . . . . . . . . . . . . . . . . . . . . . . . . . . . . . . . . . . . . . . . . . . . . . . . . . . 14,710,123 11,137,178Shareholder Service fees . . . . . . . . . . . . . . . . . . . . . . . . . . . . . . . . . . . . . . . . . . . . . . . . . . . . . . . . . . . . . . . . . . . . . . 5,825,527 4,266,531Distribution fees . . . . . . . . . . . . . . . . . . . . . . . . . . . . . . . . . . . . . . . . . . . . . . . . . . . . . . . . . . . . . . . . . . . . . . . . . . . . . 53,554 58,103Accounting, Administration and Transfer Agent fees . . . . . . . . . . . . . . . . . . . . . . . . . . . . . . . . . . . . . . . . . . . . . . . . . . . . 2,176,618 1,791,914Management fees . . . . . . . . . . . . . . . . . . . . . . . . . . . . . . . . . . . . . . . . . . . . . . . . . . . . . . . . . . . . . . . . . . . . . . . . . . . 344,542 287,151Accrued expenses . . . . . . . . . . . . . . . . . . . . . . . . . . . . . . . . . . . . . . . . . . . . . . . . . . . . . . . . . . . . . . . . . . . . . . . . . . . 4,335,763 3,362,878
Total Liabilities (excluding Net Assets attributable to holders of redeemable ordinary shares) . . . . . . . . . . . . 866,162,217 355,997,267
Net Assets attributable to holders of redeemable ordinary participating shares . . . . . . . . . . . . . . . . . . . . . . 18,403,354,296 15,605,898,111
____________________________Director28 April 2022
________________________Director28 April 2022
* Included within the 2020 figures are balances that relate to Janus Henderson Global Diversified Fund which ceased investment activity during the year ended31 December 2020.
** Included within the 2021 figures are balances that relate to Janus Henderson Global Adaptive Capital Appreciation Fund, Janus Henderson Global High Yield Fund, Janus Henderson Intech All World Minimum Variance Core Fund, Janus Henderson Intech Global Absolute Return Fund, Janus Henderson Intech Global All Country Low Volatility Fund and Janus Henderson Absolute Return Income Fund (EUR) which ceased investment activity during the year ended 31 December 2021.
DocuSign Envelope ID: 521655BF-9BE3-47DC-A9A3-494932954338

17Janus Henderson Capital Funds plc / 31 December 2021
Combined Company Financial Statements (continued)
The accompanying notes are an integral part of the financial statements.
Statement of Comprehensive IncomeYear ended
31 December 2021
(USD)**
Year ended 31 December
2020 (USD)*
Year ended Year endedRevenue:Interest income . . . . . . . . . . . . . . . . . . . . . . . . . . . . . . . . . . . . . . . . . . . . . . . . . . . . . . . . . . . . . . . . . . . . . . . . . . . . . . . 129,919,214 124,600,534Dividend income . . . . . . . . . . . . . . . . . . . . . . . . . . . . . . . . . . . . . . . . . . . . . . . . . . . . . . . . . . . . . . . . . . . . . . . . . . . . . . 136,630,788 121,515,790Other income . . . . . . . . . . . . . . . . . . . . . . . . . . . . . . . . . . . . . . . . . . . . . . . . . . . . . . . . . . . . . . . . . . . . . . . . . . . . . . . . 4,479,372 564,686
Net gain on financial assets and liabilities at fair value through profit or loss . . . . . . . . . . . . . . . . . . . . . . . . . . . . . . . . . . . . . . 1,555,067,737 2,064,338,854 Total Investments Income . . . . . . . . . . . . . . . . . . . . . . . . . . . . . . . . . . . . . . . . . . . . . . . . . . . . . . . . . . . . . . . 1,826,097,111 2,311,019,864
Expenses:Investment Management fees . . . . . . . . . . . . . . . . . . . . . . . . . . . . . . . . . . . . . . . . . . . . . . . . . . . . . . . . . . . . . . . . . . . . . 156,250,816 102,821,503Shareholder Service fees . . . . . . . . . . . . . . . . . . . . . . . . . . . . . . . . . . . . . . . . . . . . . . . . . . . . . . . . . . . . . . . . . . . . . . . . 60,693,922 41,250,508Distribution fees . . . . . . . . . . . . . . . . . . . . . . . . . . . . . . . . . . . . . . . . . . . . . . . . . . . . . . . . . . . . . . . . . . . . . . . . . . . . . . 663,988 402,235Management fees . . . . . . . . . . . . . . . . . . . . . . . . . . . . . . . . . . . . . . . . . . . . . . . . . . . . . . . . . . . . . . . . . . . . . . . . . . . . . 4,005,444 1,587,250Accounting, Administration and Transfer Agent fees . . . . . . . . . . . . . . . . . . . . . . . . . . . . . . . . . . . . . . . . . . . . . . . . . . . . . . 7,786,334 7,715,362Custodian fees . . . . . . . . . . . . . . . . . . . . . . . . . . . . . . . . . . . . . . . . . . . . . . . . . . . . . . . . . . . . . . . . . . . . . . . . . . . . . . . 2,325,573 2,258,070Audit fees . . . . . . . . . . . . . . . . . . . . . . . . . . . . . . . . . . . . . . . . . . . . . . . . . . . . . . . . . . . . . . . . . . . . . . . . . . . . . . . . . . 573,037 727,199Printing expenses . . . . . . . . . . . . . . . . . . . . . . . . . . . . . . . . . . . . . . . . . . . . . . . . . . . . . . . . . . . . . . . . . . . . . . . . . . . . . 409,336 (46,530)Legal and other professional fees . . . . . . . . . . . . . . . . . . . . . . . . . . . . . . . . . . . . . . . . . . . . . . . . . . . . . . . . . . . . . . . . . . 4,173,298 3,878,076Other fees . . . . . . . . . . . . . . . . . . . . . . . . . . . . . . . . . . . . . . . . . . . . . . . . . . . . . . . . . . . . . . . . . . . . . . . . . . . . . . . . . . 1,723,060 1,812,279
Total Expenses . . . . . . . . . . . . . . . . . . . . . . . . . . . . . . . . . . . . . . . . . . . . . . . . . . . . . . . . . . . . . . . . . . . . . . . 238,604,808 162,405,952Less Expense Reimbursement . . . . . . . . . . . . . . . . . . . . . . . . . . . . . . . . . . . . . . . . . . . . . . . . . . . . . . . . . . . (2,832,383) (3,525,909)Net Expenses after Expense Reimbursement . . . . . . . . . . . . . . . . . . . . . . . . . . . . . . . . . . . . . . . . . . . . . . . . 235,772,425 158,880,043Net Operating Profit . . . . . . . . . . . . . . . . . . . . . . . . . . . . . . . . . . . . . . . . . . . . . . . . . . . . . . . . . . . . . . . . . . . 1,590,324,686 2,152,139,821
Finance Costs:Total distributions to holders of redeemable ordinary shares. . . . . . . . . . . . . . . . . . . . . . . . . . . . . . . . . . . . . . . . . . . . . . . . . (86,301,833) (72,542,366)Swap interest expense . . . . . . . . . . . . . . . . . . . . . . . . . . . . . . . . . . . . . . . . . . . . . . . . . . . . . . . . . . . . . . . . . . . . . . . . . . (694,025) (583,923)
Withholding tax on dividends and other investment income . . . . . . . . . . . . . . . . . . . . . . . . . . . . . . . . . . . . . (35,292,333) (35,530,761)
Net Increase in Net Assets attributable to holders of redeemable ordinary shares resulting from operations . 1,468,036,495 2,043,482,771
. .
. .. . .
* Included within the 2020 figures are balances that relate to Janus Henderson Global Diversified Fund which ceased investment activity during the year ended 31 December 2020.
** Included within the 2021 figures are balances that relate to Janus Henderson Global Adaptive Capital Appreciation Fund, Janus Henderson Global High Yield Fund, Janus Henderson Intech All World Minimum Variance Core Fund, Janus Henderson Intech Global Absolute Return Fund, Janus Henderson Intech Global All Country Low Volatility Fund and Janus Henderson Absolute Return Income Fund (EUR) which ceased investment activity during the year ended 31 December 2021.
Gains and losses are solely from continuing operations except for the Funds which ceased operations during the financial year ended 31 December 2021 or 31 December 2020. There were no gains and losses other than those dealt with in the Statement of Comprehensive Income.
DocuSign Envelope ID: 521655BF-9BE3-47DC-A9A3-494932954338

Janus Henderson Capital Funds plc / 31 December 202118
Combined Company Financial Statements (continued)
The accompanying notes are an integral part of the financial statements.
Statement of Changes in Net Assets Attributable to Redeemable Ordinary ShareholdersYear ended
31 December 2021
(USD)**
Year ended 31 December
2020 (USD)*
Increase in Net Assets attributable to holders of redeemable ordinary shares resulting from operations . . . . . . . . . . . . . . . . . . . . 1,468,036,495 2,043,482,771
Capital Share Transactions of redeemable ordinary shares:Proceeds from redeemable ordinary shares sold . . . . . . . . . . . . . . . . . . . . . . . . . . . . . . . . . . . . . . . . . . . . . . . . . . . . . . . 6,866,380,105 6,794,634,024Redemption of redeemable ordinary shares . . . . . . . . . . . . . . . . . . . . . . . . . . . . . . . . . . . . . . . . . . . . . . . . . . . . . . . . . . (5,525,780,118) (4,036,131,367)Dilution Adjustment. . . . . . . . . . . . . . . . . . . . . . . . . . . . . . . . . . . . . . . . . . . . . . . . . . . . . . . . . . . . . . . . . . . . . . . . . . . 331,535 989,566
Net Increase from Capital Share Transactions of redeemable ordinary shares . . . . . . . . . . . . . . . . . . . . . . . . 1,340,931,522 2,759,492,223
Net Increase in Net Assets attributable to holders of redeemable ordinary shares . . . . . . . . . . . . . . . . . . . . . . . . . . . . . . . . . . . 2,808,968,01 7 4,802,974,994Net Assets attributable to holders of redeemable ordinary shares at the beginning of the financial year . . . . . . . . . . . . . . . . . . . . 15,605,898,111 10,789,529,305
Notional FX (Loss)/Gain . . . . . . . . . . . . . . . . . . . . . . . . . . . . . . . . . . . . . . . . . . . . . . . . . . . . . . . . . . . . . . . . . . . . . . (11,511,832) 13,393,812
Net Assets attributable to holders of redeemable ordinary shares at the end of the financial year . . . . . . . . . 18,403,354,296 15,605,898,111
* Included within the 2020 figures are balances that relate to Janus Henderson Global Diversified Fund which ceased investment activity during the year ended 31 December 2021.
** Included within the 2021 figures are balances that relate to Janus Henderson Global Adaptive Capital Appreciation Fund, Janus Henderson Global High Yield Fund, Janus Henderson Intech All World Minimum Variance Core Fund, Janus Henderson Intech Global Absolute Return Fund, Janus Henderson Intech Global All Country Low Volatility Fund and Janus Henderson Absolute Return Income Fund (EUR) which ceased investment activity during the year ended 31 December 2021.
DocuSign Envelope ID: 521655BF-9BE3-47DC-A9A3-494932954338

Janus Henderson Balanced Fund
19Janus Henderson Capital Funds plc / 31 December 2021
Fund Overview (unaudited)Investment Objective and Policy
The Fund aims to provide a return, from a combination of capital growth and income, while seeking to limit losses to capital (although not guaranteed).
Performance target: To outperform the `Balanced´ Index (55% S&P 500 + 45% Bloomberg Barclays US Aggregate Bond) by 1.5% per annum, before the deduction of charges, over any 5 year period.
The Fund invests between 35%-65% of its assets in the shares (equities) of mainly US companies, and between 35%-65% of its assets in bonds of any quality, including up to 35% in high yield (non-investment grade) bonds and loans (non-investment grade) issued mainly by US companies or the US government.
The Fund is actively managed with reference to the `Balanced´ Index (55% S&P 500 + 45% Bloomberg Barclays US Aggregate Bond), which is broadly representative of the companies and bonds in which it may invest, as this forms the basis of the Fund’s performance target. The investment manager has a high degree of freedom to choose individual investments for the Fund.
How Sustainability Risks are part of the investment processThe investments underlying this financial product (referred to as the Fund) do not take into account the EU criteria for environmentally sustainable economic activities, although the Manager and the Investment Manager have agreed a decision making process that will apply to investment decisions relating to the Fund as further detailed in the Prospectus.
The likely impacts of sustainability risks on the returns of the FundWhile the analysis of (Environmental, Social and Governance) ESG factors is an integral component across the Investment Manager’s investment capabilities and one of a number of inputs to the selection of investments and portfolio construction, the investment process of the Investment Manager is primarily designed to maximise long-term risk-adjusted returns for investors. Therefore, in managing the Fund, the Investment Manager does not maximise portfolio alignment with sustainability risks as a separate goal in its own right nor does it precisely attribute the impact of ESG factors on returns for the Fund.
Fund Overview
Jeremiah Buckley, Greg Wilensky, Michael Keough and David Chung, portfolio managers
For the year ended 31 December 2021, the Janus Henderson Balanced Fund H2 USD share returned 16.64% (Net) and 17.66% (Gross) in US dollar terms compared with 14.32% (Net) and 16.04% Target (Gross) for its benchmark,
the Balanced Index, an internally calculated benchmark that combines the total returns from the S&P 500® Index (55%) and the Bloomberg US Aggregate Bond Index (45%). Over the period, the S&P 500 Index returned 28.71%, and the Bloomberg Barclays US Aggregate Bond Index returned -1.54%.
The fund’s ability to dynamically adjust its allocation with changing market conditions proved beneficial given the portfolio managers’ decision to overweight equities as the economic recovery continued. On average, 64% of the fund was invested in stocks throughout the year (based on month-end data). Asset class allocations may vary based on market conditions, and positioning near the maximum mandated equity exposure reflected the portfolio managers’ belief that equities offered greater risk-adjusted opportunities versus fixed income throughout the year.
The equity portion outperformed the S&P 500 Index. Stock selection drove the relative outperformance, particularly in the information technology, health care and consumer staples sectors. Technology company Nvidia was the largest individual equity contributor. As large technology platform companies continued to increase capital spending on network data centers and infrastructure, Nvidia – a leading producer of graphics processing units – benefited. Semiconductor company Lam Research was another relative contributor. Demand forecasts for wafer fabrication equipment increased during the year, and the company benefited near year-end from a stabilization of memory prices.
Detracting from relative results was sector positioning, including a lack of exposure to energy – the best-performing benchmark sector during the year – and an underweight to the strong-performing real estate sector. Credit card service provider Mastercard was the top individual equity detractor. The Delta and Omicron variants of COVID-19 dashed investor optimism that cross-border travel spending would see a sizable recovery during the year. Comcast was another detractor given slower subscriber growth for high-speed cable internet in 2021 versus the prior year.
The fixed income portion outperformed the Bloomberg US Aggregate Bond Index. Although we consistently trimmed the fixed income portion’s allocation to corporate bonds during the year, our overall favorable view on the US economy led us to maintain its overweight exposure to corporate bonds (including high yield) and securitized credit such as asset-backed securities (ABS) and commercial mortgage-backed securities (CMBS). We maintained an underweight exposure to mortgage-backed securities (MBS) and, for much of the year, US Treasuries.
Our decision to reduce corporate credit exposure was primarily due to credit spreads narrowing as the year progressed. Corporate bond sales were focused on the investment-grade market given our view that the relatively tight level of spreads diminished their attractiveness on
DocuSign Envelope ID: 521655BF-9BE3-47DC-A9A3-494932954338

Janus Henderson Capital Funds plc / 31 December 202120
Janus Henderson Balanced Fund (continued)
Fund Overview (unaudited) (continued)
a risk-adjusted basis compared to high yield. Within high yield, we adjusted positions, emphasizing names believed to have the potential to be ‘rising stars’ – securities that could see sufficient rating improvement to push them into the investment-grade market. We added floating rate products such as bank loans. We were also active within our ABS and CMBS allocations, focusing on relative-value opportunities identified through individual security analysis. Within Treasury Inflation-Protected Securities (TIPS), we adjusted the allocation with changing inflation expectations throughout the year.
Our asset allocation decisions drove relative outperformance versus the Bloomberg US Aggregate Bond Index. The fund’s out-of-index allocation to high-yield corporate bonds performed well as the economic outlook continued to improve and investors’ demand for yield remained intact. Out-of-index exposure to TIPS was also a strong contributor. An underweight to MBS and strong security selection further benefited relative performance. The fund’s positioning relative to the US Treasury yield curve and a lack of exposure to government-related securities detracted.
As always, we will continue to dynamically adjust each sleeve of the fund, as well as overall asset allocation, based on market conditions and the investment opportunities our equity and fixed income teams identify through their bottom-up, fundamental research.
Thank you for investing in Janus Henderson Balanced Fund.
January 2022
DocuSign Envelope ID: 521655BF-9BE3-47DC-A9A3-494932954338

21Janus Henderson Capital Funds plc / 31 December 2021
The accompanying notes are an integral part of the financial statements.
Janus Henderson Balanced Fund (continued)
s
Statement of Financial PositionAs of
31 December 2021
(USD)
As of 31 December
2020 (USD)
Assets:Financial assets at fair value through profit or loss . . . . . . . . . . . . . . . . . . . . . . . . . . . . . . . . . . . . . . . . . . . . . . . . . . . . . . . 8,615,155,931 5,488,285,197Cash and foreign currency . . . . . . . . . . . . . . . . . . . . . . . . . . . . . . . . . . . . . . . . . . . . . . . . . . . . . . . . . . . . . . . . . . . . . . . 68,584,742 147,025,132Receivables:
Investments sold . . . . . . . . . . . . . . . . . . . . . . . . . . . . . . . . . . . . . . . . . . . . . . . . . . . . . . . . . . . . . . . . . . . . . . . . . . . . 147,124,719 –Spot foreign exchange contracts awaiting settlement . . . . . . . . . . . . . . . . . . . . . . . . . . . . . . . . . . . . . . . . . . . . . . . . . . . . – 18,506Funds shares sold . . . . . . . . . . . . . . . . . . . . . . . . . . . . . . . . . . . . . . . . . . . . . . . . . . . . . . . . . . . . . . . . . . . . . . . . . . . 58,143,441 31,556,172Dividends . . . . . . . . . . . . . . . . . . . . . . . . . . . . . . . . . . . . . . . . . . . . . . . . . . . . . . . . . . . . . . . . . . . . . . . . . . . . . . . . . 1,684,704 1,628,907Interest . . . . . . . . . . . . . . . . . . . . . . . . . . . . . . . . . . . . . . . . . . . . . . . . . . . . . . . . . . . . . . . . . . . . . . . . . . . . . . . . . . . 10,881,338 10,704,560
Receivable from Investment Manager . . . . . . . . . . . . . . . . . . . . . . . . . . . . . . . . . . . . . . . . . . . . . . . . . . . . . . . . . . . . . . . . – 64
Total Assets . . . . . . . . . . . . . . . . . . . . . . . . . . . . . . . . . . . . . . . . . . . . . . . . . . . . . . . . . . . . . . . . . . . . . . . . . 8,901,574,875 5,679,218,538 Liabilities (amounts falling due within one year)Payables:
Financial liabilities at fair value through profit or loss . . . . . . . . . . . . . . . . . . . . . . . . . . . . . . . . . . . . . . . . . . . . . . . . . . . . 667,227 189,672Bank overdraft and foreign currency . . . . . . . . . . . . . . . . . . . . . . . . . . . . . . . . . . . . . . . . . . . . . . . . . . . . . . . . . . . . . . . 323,732 1Investments purchased . . . . . . . . . . . . . . . . . . . . . . . . . . . . . . . . . . . . . . . . . . . . . . . . . . . . . . . . . . . . . . . . . . . . . . . . 496,075,139 128,519,815Spot foreign exchange contracts awaiting payment . . . . . . . . . . . . . . . . . . . . . . . . . . . . . . . . . . . . . . . . . . . . . . . . . . . . . 30,732 –Fund shares repurchased . . . . . . . . . . . . . . . . . . . . . . . . . . . . . . . . . . . . . . . . . . . . . . . . . . . . . . . . . . . . . . . . . . . . . . 21,156,420 6,162,186Investment Management fees . . . . . . . . . . . . . . . . . . . . . . . . . . . . . . . . . . . . . . . . . . . . . . . . . . . . . . . . . . . . . . . . . . . 6,561,383 4,334,863Shareholder Service fees . . . . . . . . . . . . . . . . . . . . . . . . . . . . . . . . . . . . . . . . . . . . . . . . . . . . . . . . . . . . . . . . . . . . . . 4,253,746 2,801,185Distribution fees . . . . . . . . . . . . . . . . . . . . . . . . . . . . . . . . . . . . . . . . . . . . . . . . . . . . . . . . . . . . . . . . . . . . . . . . . . . . . 7,930 7,425Accounting, Administration and Transfer Agent fees . . . . . . . . . . . . . . . . . . . . . . . . . . . . . . . . . . . . . . . . . . . . . . . . . . . . 906,005 786,395Management fees . . . . . . . . . . . . . . . . . . . . . . . . . . . . . . . . . . . . . . . . . . . . . . . . . . . . . . . . . . . . . . . . . . . . . . . . . . . 159,686 103,573Accrued expenses . . . . . . . . . . . . . . . . . . . . . . . . . . . . . . . . . . . . . . . . . . . . . . . . . . . . . . . . . . . . . . . . . . . . . . . . . . . 1,627,081 816,165
Total Liabilities (excluding Net Assets attributable to holders of redeemable ordinary shares) . . . . . . . . . . . . 531,769,081 143,721,280 Net Assets attributable to holders of redeemable ordinary participating shares . . . . . . . . . . . . . . . . . . . . . . 8,369,805,794 5,535,497,258
.
DocuSign Envelope ID: 521655BF-9BE3-47DC-A9A3-494932954338

Janus Henderson Capital Funds plc / 31 December 202122
Janus Henderson Balanced Fund (continued)
The accompanying notes are an integral part of the financial statements.
Statement of Comprehensive IncomeYear ended
31 December 2021
(USD)
Year ended 31 December
2020 (USD)
Year ended Year endedRevenue:Interest income . . . . . . . . . . . . . . . . . . . . . . . . . . . . . . . . . . . . . . . . . . . . . . . . . . . . . . . . . . . . . . . . . . . . . . . . . . . . . . . 51,629,415 49,287,763Dividend income . . . . . . . . . . . . . . . . . . . . . . . . . . . . . . . . . . . . . . . . . . . . . . . . . . . . . . . . . . . . . . . . . . . . . . . . . . . . . . 51,324,768 43,455,506Other income . . . . . . . . . . . . . . . . . . . . . . . . . . . . . . . . . . . . . . . . . . . . . . . . . . . . . . . . . . . . . . . . . . . . . . . . . . . . . . . . 109,906 –
Net gain on financial assets and liabilities at fair value through profit or loss . . . . . . . . . . . . . . . . . . . . . . . . . . . . . . . . . . . . . . 894,169,807 613,959,085 Total Investments Income . . . . . . . . . . . . . . . . . . . . . . . . . . . . . . . . . . . . . . . . . . . . . . . . . . . . . . . . . . . . . . . 997,233,896 706,702,354
Expenses:Investment Management fees . . . . . . . . . . . . . . . . . . . . . . . . . . . . . . . . . . . . . . . . . . . . . . . . . . . . . . . . . . . . . . . . . . . . . 64,291,940 41,481,607Shareholder Service fees . . . . . . . . . . . . . . . . . . . . . . . . . . . . . . . . . . . . . . . . . . . . . . . . . . . . . . . . . . . . . . . . . . . . . . . . 41,783,813 27,148,647Distribution fees . . . . . . . . . . . . . . . . . . . . . . . . . . . . . . . . . . . . . . . . . . . . . . . . . . . . . . . . . . . . . . . . . . . . . . . . . . . . . . 90,245 86,500Management fees . . . . . . . . . . . . . . . . . . . . . . . . . . . . . . . . . . . . . . . . . . . . . . . . . . . . . . . . . . . . . . . . . . . . . . . . . . . . . 1,619,877 575,227Accounting, Administration and Transfer Agent fees . . . . . . . . . . . . . . . . . . . . . . . . . . . . . . . . . . . . . . . . . . . . . . . . . . . . . . 3,182,828 3,198,641Custodian fees . . . . . . . . . . . . . . . . . . . . . . . . . . . . . . . . . . . . . . . . . . . . . . . . . . . . . . . . . . . . . . . . . . . . . . . . . . . . . . . 565,971 465,721Audit fees . . . . . . . . . . . . . . . . . . . . . . . . . . . . . . . . . . . . . . . . . . . . . . . . . . . . . . . . . . . . . . . . . . . . . . . . . . . . . . . . . . 19,083 24,502Printing expenses . . . . . . . . . . . . . . . . . . . . . . . . . . . . . . . . . . . . . . . . . . . . . . . . . . . . . . . . . . . . . . . . . . . . . . . . . . . . . 163,780 (53,190)Legal and other professional fees . . . . . . . . . . . . . . . . . . . . . . . . . . . . . . . . . . . . . . . . . . . . . . . . . . . . . . . . . . . . . . . . . . 2,331,389 1,915,067Other fees . . . . . . . . . . . . . . . . . . . . . . . . . . . . . . . . . . . . . . . . . . . . . . . . . . . . . . . . . . . . . . . . . . . . . . . . . . . . . . . . . . 627,070 593,336
Total Expenses . . . . . . . . . . . . . . . . . . . . . . . . . . . . . . . . . . . . . . . . . . . . . . . . . . . . . . . . . . . . . . . . . . . . . . . 114,675,996 75,436,058Less Expense Reimbursement . . . . . . . . . . . . . . . . . . . . . . . . . . . . . . . . . . . . . . . . . . . . . . . . . . . . . . . . . . . – (100)Net Expenses after Expense Reimbursement . . . . . . . . . . . . . . . . . . . . . . . . . . . . . . . . . . . . . . . . . . . . . . . . 114,675,996 75,435,958Net Operating Profit . . . . . . . . . . . . . . . . . . . . . . . . . . . . . . . . . . . . . . . . . . . . . . . . . . . . . . . . . . . . . . . . . . . 882,557,900 631,266,396
Finance Costs: 39,235,191 26,901,751
Total distributions to holders of redeemable ordinary shares. . . . . . . . . . . . . . . . . . . . . . . . . . . . . . . . . . . . . . . . . . . . . . . . . (39,235,191) (26,901,751) Withholding tax on dividends and other investment income . . . . . . . . . . . . . . . . . . . . . . . . . . . . . . . . . . . . . (15,650,613) (12,796,569)
Net Increase in Net Assets attributable to holders of redeemable ordinary shares resulting from operations . 827,672,096 591,568,076
. .
. .. . .
Statement of Changes in Net Assets Attributable to Redeemable Ordinary ShareholdersYear ended
31 December 2021
(USD)
Year ended 31 December
2020 (USD)
Increase in Net Assets attributable to holders of redeemable ordinary shares resulting from operations . . . . . . . . . . . . . . . . . . . . 827,672,096 591,568,076
Capital Share Transactions of redeemable ordinary shares:Proceeds from redeemable ordinary shares sold . . . . . . . . . . . . . . . . . . . . . . . . . . . . . . . . . . . . . . . . . . . . . . . . . . . . . . . 3,582,144,594 2,872,679,438Redemption of redeemable ordinary shares . . . . . . . . . . . . . . . . . . . . . . . . . . . . . . . . . . . . . . . . . . . . . . . . . . . . . . . . . . (1,575,508,154) (1,524,860,968)
Net Increase from Capital Share Transactions of redeemable ordinary shares . . . . . . . . . . . . . . . . . . . . . . . . 2,006,636,440 1,347,818,470
Net Increase in Net Assets attributable to holders of redeemable ordinary shares . . . . . . . . . . . . . . . . . . . . . . . . . . . . . . . . . . . 2,834,308,536 1,939,386,546Net Assets attributable to holders of redeemable ordinary shares at the beginning of the financial year . . . . . . . . . . . . . . . . . . . . 5,535,497,258 3,596,110,712
Net Assets attributable to holders of redeemable ordinary shares at the end of the financial year . . . . . . . . . 8,369,805,794 5,535,497,258
Gains and losses are solely from continuing operations except for the Funds which ceased operations during the financial year ended 31 December 2021 or 31 December 2020. There were no gains and losses other than those dealt with in the Statement of Comprehensive Income. Please refer to note 1 which details the Fund closures during the year.
DocuSign Envelope ID: 521655BF-9BE3-47DC-A9A3-494932954338

23Janus Henderson Capital Funds plc / 31 December 2021
Janus Henderson Balanced Fund (continued)
Portfolio Investments
The accompanying notes are an integral part of the financial statements.
Shares or Principal Amount
Percentage of Net Assets
(%)Fair Value
(USD)
Financial Assets at fair value through profit or lossAsset-Backed/Commercial Mortgage-Backed Securities (2020: 3.19% USD 176,838,670)
5,141,778 280 Park Avenue Mortgage Trust, 0.9898%, due 15/9/34 0.06 5,140,782
850,000 BAMLL Commercial Mortgage Securities Trust, 0.9600%, due 15/9/34 0.01 849,316
9,617,003 BANK, 4.2550%, due 15/5/61 0.13 10,866,4933,315,000 BANK, 4.2170%, due 15/8/61 0.04 3,743,3311,680,000 BBCMS Mortgage Trust, 0.9597%, due
15/8/36 0.02 1,680,6266,197,000 BBCMS Mortgage Trust, 4.3140%, due
15/12/51 0.08 7,046,9201,966,000 BBCMS Trust, 4.1970%, due 10/8/35 0.03 2,175,1763,902,000 BXP Trust, 3.3790%, due 13/6/39 0.05 4,162,690
10,860,499 CHT Mortgage Trust, 1.0397%, due 15/11/36 0.13 10,863,824
5,435,000 COMM Mortgage Trust, 4.2280%, due 10/5/51 0.07 6,111,093
919,638 Connecticut Avenue Securities Trust, 2.5019%, due 25/4/31 0.01 923,053
535,409 Connecticut Avenue Securities Trust, 2.4028%, due 25/8/31 0.01 537,460
691,518 Connecticut Avenue Securities Trust, 2.2528%, due 25/9/31 0.01 693,774
335,393 Connecticut Avenue Securities Trust, 2.1027%, due 25/7/39 0.00 335,404
893,279 Connecticut Avenue Securities Trust, 2.2028%, due 25/10/39 0.01 895,071
4,104,000 Connecticut Avenue Securities Trust, 1.5997%, due 25/10/41 0.05 4,110,305
2,956,000 Connecticut Avenue Securities Trust, 1.7000%, due 25/12/41 0.04 2,962,728
380,261 Connecticut Avenue Securities Trust, 2.2019%, due 25/6/39 0.00 380,271
1,907,216 Connecticut Avenue Securities Trust, 2.1027%, due 25/1/40 0.02 1,911,078
1,182,775 DB Master Finance LLC, 4.3520%, due 20/5/49 0.01 1,255,889
829,898 DB Master Finance LLC, 4.0210%, due 20/5/49 0.01 859,197
7,030,770 Domino's Pizza Master Issuer LLC, 3.6680%, due 25/10/49 0.09 7,410,334
694,925 Domino's Pizza Master Issuer LLC, 4.1180%, due 25/7/47 0.01 728,649
2,608,330 Domino's Pizza Master Issuer LLC, 4.1160%, due 25/7/48 0.03 2,666,038
1,621,840 Domino's Pizza Master Issuer LLC, 4.3280%, due 25/7/48 0.02 1,704,274
21,347 Drive Auto Receivables Trust, 3.5300%, due 15/12/23 0.00 21,363
9,881,526 GS Mortgage Securities Corp. II, 4.1550%, due 10/7/51 0.13 11,113,990
9,952,000 GS Mortgage Securities Trust, 3.9920%, due 10/3/51 0.13 11,030,895
2,402,843 Jack in the Box Funding LLC, 4.9700%, due 25/8/49 0.03 2,567,037
2,647,990 Jack in the Box Funding LLC, 3.9820%, due 25/8/49 0.03 2,658,175
5,477,608 Jack in the Box Funding LLC, 4.4760%, due 25/8/49 0.07 5,672,111
10,657,000 Morgan Stanley Capital I Trust, 3.8090%, due 15/12/48 0.14 11,434,333
10,687,000 Morgan Stanley Capital I Trust, 2.7820%, due 15/8/49 0.13 11,077,288
Shares or Principal Amount
Percentage of Net Assets
(%)Fair Value
(USD)
1,998,000 Morgan Stanley Capital I Trust, 4.4070%,
due 15/10/51 0.03 2,273,9989,719,927 Morgan Stanley Capital I Trust, 4.3100%,
due 15/12/51 0.13 11,041,3399,855,147 Morgan Stanley Capital I Trust, 4.1770%,
due 15/7/51 0.13 11,075,3685,167,283 Morgan Stanley Capital I Trust, 6.0143%,
due 11/6/42 0.06 5,167,283428,017 New Residential Mortgage Loan Trust,
4.5000%, due 25/2/58 0.01 457,1383,038,000 Newday Funding Master Issuer plc,
1.1495%, due 15/3/29 0.04 3,060,9841,890,000 Newday Funding Master Issuer plc,
0.9996%, due 15/7/29 0.02 1,890,6943,215,125 NRZ Excess Spread-Collateralized
Notes, 3.1040%, due 25/7/26 0.04 3,209,0222,963,926 Oak Street Investment Grade Net Lease
Fund, 1.8500%, due 20/11/50 0.04 2,934,083401,000 OneMain Direct Auto Receivables Trust,
3.8500%, due 14/10/25 0.00 401,370410,000 OneMain Direct Auto Receivables Trust,
4.4000%, due 14/1/28 0.00 410,4322,644,040 Planet Fitness Master Issuer LLC,
3.8580%, due 5/12/49 0.03 2,711,5912,132,370 Planet Fitness Master Issuer LLC,
4.2620%, due 5/9/48 0.03 2,132,370638,547 Sequoia Mortgage Trust, 2.5000%, due
25/5/43 0.01 647,3783,793,260 Taco Bell Funding LLC, 4.9700%, due
25/5/46 0.05 3,958,9843,429,000 Taco Bell Funding LLC, 1.9460%, due
25/8/51 0.04 3,329,6583,145,710 Taco Bell Funding LLC, 4.9400%, due
25/11/48 0.04 3,428,0284,168,000 Taco Bell Funding LLC, 2.2940%, due
25/8/51 0.05 4,071,4541,551,120 Wendy's Funding LLC, 3.7830%, due
15/6/49 0.02 1,604,4791,794,980 Wendy's Funding LLC, 2.3700%, due
15/6/51 0.02 1,764,8741,527,360 Wendy's Funding LLC, 3.8840%, due
15/3/48 0.02 1,583,0933,212,855 Wendy's Funding LLC, 2.7750%, due
15/6/51 0.04 3,208,9183,444,000 WFRBS Commercial Mortgage Trust,
3.6310%, due 15/11/47 0.04 3,630,3852,951,170 Wingstop Funding LLC, 2.8410%, due
5/12/50 0.04 2,989,6823,368,558 Zaxby's Funding LLC, 3.2380%, due
30/7/51 0.04 3,406,040Total Asset-Backed/Commercial Mortgage-Backed Securities 2.57 215,977,613
Common Stock (2020: 62.25% USD 3,446,498,055)IrelandBuilding Products
102,304 Trane Technologies plc 0.25 20,668,477
Health Care Equipment & Supplies256,402 Medtronic plc 0.32 26,524,787
IT Services166,789 Accenture plc, A 0.83 69,142,380
JerseyAuto Components
189,229 Aptiv plc 0.37 31,213,324
DocuSign Envelope ID: 521655BF-9BE3-47DC-A9A3-494932954338

Janus Henderson Capital Funds plc / 31 December 202124
The accompanying notes are an integral part of the financial statements.
Janus Henderson Balanced Fund (continued)
Portfolio Investments
Shares or Principal Amount
Percentage of Net Assets
(%)Fair Value
(USD)
United KingdomPharmaceuticals
331,570 AstraZeneca plc 0.23 19,313,953
United StatesAerospace & Defense
257,200 General Dynamics Corp. 0.64 53,618,484150,108 L3Harris Technologies, Inc. 0.38 32,009,030
1.02 85,627,514
Air Freight & Logistics437,210 United Parcel Service, Inc., B 1.12 93,711,591
Airlines417,201 Southwest Airlines Co. 0.21 17,872,891
Banks2,700,752 Bank of America Corp. 1.44 120,156,456
Beverages94,948 Constellation Brands, Inc., A 0.28 23,829,100
705,890 Monster Beverage Corp. 0.81 67,793,6761.09 91,622,776
Biotechnology522,920 AbbVie, Inc. 0.85 70,803,368
Capital Markets437,059 Charles Schwab Corp. (The) 0.44 36,756,662294,080 CME Group, Inc. 0.80 67,185,5171,189,704 Morgan Stanley 1.40 116,781,345
41,236 S&P Global, Inc. 0.23 19,460,5052.87 240,184,029
Chemicals115,427 Sherwin-Williams Co. (The) 0.49 40,648,772
Communications Equipment147,472 Motorola Solutions, Inc. 0.48 40,068,142
Consumer Finance517,251 American Express Co. 1.01 84,622,264
Electrical Equipment110,931 Rockwell Automation, Inc. 0.46 38,698,279
Electronic Equipment, Instruments & Components668,099 Corning, Inc. 0.30 24,873,326
Entertainment408,352 Activision Blizzard, Inc. 0.32 27,167,659
44,554 Netflix, Inc. 0.32 26,841,112434,196 Walt Disney Co. (The) 0.80 67,252,618
1.44 121,261,389
Food & Staples Retailing215,163 Costco Wholesale Corp. 1.46 122,148,035347,911 Sysco Corp. 0.33 27,328,409
1.79 149,476,444
Food Products202,816 Hershey Co. (The) 0.47 39,238,812
Health Care Equipment & Supplies594,782 Abbott Laboratories 1.00 83,709,61939,956 Align Technology, Inc. 0.31 26,258,284
333,955 Edwards Lifesciences Corp. 0.52 43,263,87077,681 Intuitive Surgical, Inc. 0.33 27,910,783
111,597 Stryker Corp. 0.36 29,843,2702.52 210,985,826
Health Care Providers & Services399,710 UnitedHealth Group, Inc. 2.40 200,710,379
Shares or Principal Amount
Percentage of Net Assets
(%)Fair Value
(USD)
Hotels, Restaurants & Leisure
20,166 Booking Holdings, Inc. 0.58 48,382,872370,359 Hilton Worldwide Holdings, Inc. 0.69 57,772,300430,332 McDonald's Corp. 1.38 115,359,099485,500 Starbucks Corp. 0.68 56,788,935
3.33 278,303,206
Household Products499,080 Procter & Gamble Co. (The) 0.98 81,639,506
Industrial Conglomerates376,943 Honeywell International, Inc. 0.94 78,596,385
Insurance851,757 Progressive Corp. (The) 1.04 87,432,856
Interactive Media & Services106,494 Alphabet, Inc., C 3.68 308,149,973
Internet & Direct Marketing Retail72,208 Amazon.com, Inc. 2.88 240,766,023
IT Services242,219 Fidelity National Information Services,
Inc. 0.32 26,438,204490,234 Mastercard, Inc., A 2.10 176,150,881
2.42 202,589,085
Leisure Products371,437 Hasbro, Inc. 0.45 37,804,858
Life Sciences Tools & Services59,572 Illumina, Inc. 0.27 22,663,572
119,679 Thermo Fisher Scientific, Inc. 0.95 79,854,6161.22 102,518,188
Machinery234,014 Deere & Co. 0.96 80,241,06078,674 Parker-Hannifin Corp. 0.30 25,027,773
1.26 105,268,833
Media1,934,256 Comcast Corp., A 1.16 97,351,104
Multiline Retail339,813 Dollar General Corp. 0.96 80,138,100
Personal Products64,217 Estee Lauder Cos., Inc. (The), A 0.28 23,773,133
Pharmaceuticals413,822 Eli Lilly & Co. 1.37 114,305,913681,536 Merck & Co., Inc. 0.62 52,232,91945,778 Zoetis, Inc. 0.13 11,171,205
2.12 177,710,037
Real Estate Management & Development241,971 CBRE Group, Inc., A 0.31 26,256,273
Semiconductors & Semiconductor Equipment373,431 Advanced Micro Devices, Inc. 0.64 53,736,721194,849 Lam Research Corp. 1.67 140,125,658225,192 Marvell Technology, Inc. 0.24 19,702,048542,162 NVIDIA Corp. 1.91 159,455,266355,351 Texas Instruments, Inc. 0.80 66,973,003
5.26 439,992,696
Software231,452 Adobe, Inc. 1.57 131,247,171210,394 Cadence Design Systems, Inc. 0.47 39,206,922
1,387,103 Microsoft Corp. 5.57 466,510,481
DocuSign Envelope ID: 521655BF-9BE3-47DC-A9A3-494932954338

25Janus Henderson Capital Funds plc / 31 December 2021
The accompanying notes are an integral part of the financial statements.
Janus Henderson Balanced Fund (continued)
Portfolio Investments
Shares or Principal Amount
Percentage of Net Assets
(%)Fair Value
(USD)
190,300 salesforce.com, Inc. 0.58 48,360,939
8.19 685,325,513
Specialty Retail265,147 Home Depot, Inc. (The) 1.31 110,038,656
Technology Hardware, Storage & Peripherals1,813,217 Apple, Inc. 3.85 321,972,943
Textiles, Apparel & Luxury Goods450,513 NIKE, Inc., B 0.90 75,087,002
Total Common Stock 64.50 5,398,139,549
Corporate Bonds (2020: 19.51% USD 1,079,916,734)AustraliaBanks
8,314,000 National Australia Bank Ltd., 2.9900%, due 21/5/31 0.10 8,346,893
6,131,000 Westpac Banking Corp., 2.6680%, due 15/11/35 0.07 5,979,611
0.17 14,326,504
BermudaProfessional Services
2,116,000 IHS Markit Ltd., 4.7500%, due 15/2/25 0.03 2,309,339
CanadaHotels, Restaurants & Leisure
10,481,000 1011778 BC ULC, 4.0000%, due 15/10/30 0.12 10,319,383
Cayman IslandsTechnology Hardware, Storage & Peripherals
185,000 Seagate HDD Cayman, 4.8750%, due 1/6/27 0.00 201,835
2,068,000 Seagate HDD Cayman, 4.0910%, due 1/6/29 0.03 2,144,144
861,000 Seagate HDD Cayman, 3.1250%, due 15/7/29 0.01 843,108
6,080,000 Seagate HDD Cayman, 4.1250%, due 15/1/31 0.08 6,334,357
0.12 9,523,444
FranceBanks
8,107,000 BNP Paribas SA, 2.5880%, due 12/8/35 0.09 7,775,718
IrelandConsumer Finance
4,601,000 AerCap Ireland Capital DAC, 4.6250%, due 15/10/27 0.06 5,093,548
3,537,000 AerCap Ireland Capital DAC, 3.0000%, due 29/10/28 0.04 3,589,766
3,625,000 AerCap Ireland Capital DAC, 3.3000%, due 30/1/32 0.04 3,696,088
2,659,000 AerCap Ireland Capital DAC, 3.4000%, due 29/10/33 0.03 2,710,483
2,020,000 AerCap Ireland Capital DAC, 3.8500%, due 29/10/41 0.03 2,107,814
0.20 17,197,699
LuxembourgFood Products
3,280,000 JBS Finance Luxembourg SARL, 3.6250%, due 15/1/32 0.04 3,298,007
Shares or Principal Amount
Percentage of Net Assets
(%)Fair Value
(USD)
NetherlandsPharmaceuticals
1,894,000 Teva Pharmaceutical Finance Netherlands III BV, 4.7500%, due 9/5/27 0.02 1,879,075
2,417,000 Teva Pharmaceutical Finance Netherlands III BV, 5.1250%, due 9/5/29 0.03 2,373,615
0.05 4,252,690
South KoreaSemiconductors & Semiconductor Equipment
4,170,000 SK Hynix, Inc., 1.5000%, due 19/1/26 0.05 4,083,4512,647,000 SK Hynix, Inc., 2.3750%, due 19/1/31 0.03 2,550,590
0.08 6,634,041
SupranationalFood Products
2,219,000 JBS USA LUX SA, 6.7500%, due 15/2/28 0.03 2,397,496
7,543,000 JBS USA LUX SA, 6.5000%, due 15/4/29 0.10 8,310,048
5,804,000 JBS USA LUX SA, 5.5000%, due 15/1/30 0.08 6,321,601
3,009,000 JBS USA LUX SA, 3.7500%, due 1/12/31 0.04 3,058,453
3,847,000 JBS USA LUX SA, 3.0000%, due 15/5/32 0.05 3,851,809
0.30 23,939,407
United KingdomBeverages
2,698,000 Diageo Capital plc, 1.3750%, due 29/9/25 0.03 2,685,410
2,541,000 Diageo Capital plc, 2.0000%, due 29/4/30 0.03 2,516,974
2,039,000 Diageo Capital plc, 2.1250%, due 29/4/32 0.02 2,025,149
0.08 7,227,533
Pharmaceuticals4,075,000 Royalty Pharma plc, 2.1500%, due
2/9/31 0.05 3,853,7854,774,000 Royalty Pharma plc, 3.5500%, due
2/9/50 0.06 4,744,4822,028,000 Royalty Pharma plc, 3.3500%, due
2/9/51 0.02 1,944,6010.13 10,542,868
United StatesAerospace & Defense
1,652,000 Boeing Co. (The), 4.8750%, due 1/5/25 0.02 1,808,8081,709,000 Boeing Co. (The), 2.1960%, due 4/2/26 0.02 1,709,9841,823,000 Boeing Co. (The), 3.2500%, due 1/2/28 0.02 1,901,1132,471,000 Boeing Co. (The), 3.6250%, due 1/2/31 0.03 2,638,0812,381,000 Boeing Co. (The), 3.9500%, due 1/8/59 0.03 2,480,8151,751,000 General Dynamics Corp., 3.5000%,
due 1/4/27 0.02 1,907,5194,447,000 TransDigm, Inc., 4.6250%, due 15/1/29 0.05 4,440,285
0.19 16,886,605
Air Freight & Logistics3,722,000 GXO Logistics, Inc., 1.6500%, due
15/7/26 0.04 3,635,6312,462,000 GXO Logistics, Inc., 2.6500%, due
15/7/31 0.03 2,435,1520.07 6,070,783
DocuSign Envelope ID: 521655BF-9BE3-47DC-A9A3-494932954338

Janus Henderson Capital Funds plc / 31 December 202126
The accompanying notes are an integral part of the financial statements.
Janus Henderson Balanced Fund (continued)
Portfolio Investments
Shares or Principal Amount
Percentage of Net Assets
(%)Fair Value
(USD)
Automobiles
7,348,000 Ford Motor Co., 3.2500%, due 12/2/32 0.09 7,539,048
Banks1,722,000 Bank of America Corp., 5.2000%, due
1/6/23 0.02 1,779,0416,419,000 Bank of America Corp., 6.2500%, due
5/9/24 0.08 6,912,4613,836,000 Bank of America Corp., 3.7050%, due
24/4/28 0.05 4,165,9832,836,000 Bank of America Corp., 3.9700%, due
5/3/29 0.04 3,105,6786,371,000 Bank of America Corp., 2.0870%, due
14/6/29 0.08 6,331,05614,882,000 Bank of America Corp., 2.5920%, due
29/4/31 0.18 15,049,5064,349,000 Citigroup, Inc., 5.9500%, due 30/1/23 0.05 4,490,3432,095,000 Citigroup, Inc., 5.3500%, due 15/5/23 0.03 2,139,519
478,000 Citigroup, Inc., 6.3000%, due 15/5/24 0.01 502,2011,985,000 Citigroup, Inc., 5.9500%, due 15/5/25 0.03 2,128,9139,839,000 Citigroup, Inc., 3.8870%, due 10/1/28 0.13 10,672,855
7,117,000 Citigroup, Inc., 4.4120%, due 31/3/31 0.10 8,136,2161,370,000 First Republic Bank, 4.6250%, due
13/2/47 0.02 1,705,0081,720,000 JPMorgan Chase & Co., 5.0000%, due
1/8/24 0.02 1,768,3751,815,000 JPMorgan Chase & Co., 4.6000%, due
1/2/25 0.02 1,864,9132,249,000 JPMorgan Chase & Co., 2.0830%, due
22/4/26 0.03 2,284,3766,969,000 JPMorgan Chase & Co., 3.9600%, due
29/1/27 0.09 7,533,8756,932,000 JPMorgan Chase & Co., 2.9560%, due
13/5/31 0.09 7,184,80411,293,000 SVB Financial Group, 4.2500%, due
15/11/26 0.14 11,472,2766,887,000 SVB Financial Group, 4.1000%, due
15/2/31 0.08 6,845,6786,868,000 US Bancorp, 2.4910%, due 3/11/36 0.08 6,849,124
1.37 112,922,201
Beverages5,068,000 Anheuser-Busch Cos. LLC, 4.9000%,
due 1/2/46 0.08 6,420,378
Building Products1,628,000 Standard Industries, Inc., 4.3750%, due
15/7/30 0.02 1,664,272
Capital Markets8,707,000 Bank of New York Mellon Corp. (The),
4.7000%, due 20/9/25 0.11 9,309,96015,708,000 Charles Schwab Corp. (The), 5.3750%,
due 1/6/25 0.21 17,160,9903,142,000 Charles Schwab Corp. (The), 4.0000%,
due 1/12/30 0.04 3,177,3481,433,000 Goldman Sachs Group, Inc. (The),
4.9500%, due 10/2/25 0.02 1,490,32010,588,000 Goldman Sachs Group, Inc. (The),
3.5000%, due 1/4/25 0.13 11,204,0187,239,000 Morgan Stanley, 2.1880%, due 28/4/26 0.09 7,386,5733,471,000 Morgan Stanley, 4.3500%, due 8/9/26 0.05 3,841,016
6,533,000 Morgan Stanley, 3.9500%, due 23/4/27 0.09 7,197,5972,740,000 Morgan Stanley, 1.5930%, due 4/5/27 0.03 2,714,4354,752,000 Morgan Stanley, 1.7940%, due 13/2/32 0.05 4,503,3749,525,000 Morgan Stanley, 2.2390%, due 21/7/32 0.11 9,326,31010,177,000 Morgan Stanley, 2.4840%, due 16/9/36 0.12 9,810,688
364,000 MSCI, Inc., 4.0000%, due 15/11/29 0.00 380,984
Shares or Principal Amount
Percentage of Net Assets
(%)Fair Value
(USD)
7,448,000 MSCI, Inc., 3.6250%, due 1/9/30 0.09 7,627,0505,122,000 MSCI, Inc., 3.8750%, due 15/2/31 0.06 5,341,196
1.20 100,471,859
Chemicals6,586,000 Axalta Coating Systems LLC, 3.3750%,
due 15/2/29 0.08 6,381,669347,000 CF Industries, Inc., 5.1500%, due
15/3/34 0.00 420,2533,358,000 CF Industries, Inc., 4.9500%, due
1/6/43 0.05 4,058,368752,000 CF Industries, Inc., 5.3750%, due
15/3/44 0.01 949,4086,308,000 Element Solutions, Inc., 3.8750%, due
1/9/28 0.08 6,348,5920.22 18,158,290
Commercial Services & Supplies7,364,000 Aramark Services, Inc., 6.3750%, due
1/5/25 0.09 7,704,769
Consumer Finance7,616,000 Capital One Financial Corp., 3.7500%,
due 28/7/26 0.10 8,175,684
Diversified Telecommunication Services3,117,000 AT&T, Inc., 3.8000%, due 1/12/57 0.04 3,252,389516,000 AT&T, Inc., 3.6500%, due 15/9/59 0.01 522,117
7,002,000 CCO Holdings LLC, 4.2500%, due 1/2/31 0.08 7,077,797
10,811,000 CCO Holdings LLC, 4.5000%, due 1/5/32 0.13 11,139,817
1,304,000 Lumen Technologies, Inc., 5.8000%, due 15/3/22 0.02 1,315,430
0.28 23,307,550
Electric Utilities4,236,000 Duquesne Light Holdings, Inc.,
2.7750%, due 7/1/32 0.05 4,191,9027,667,000 NextEra Energy Capital Holdings, Inc.,
1.8750%, due 15/1/27 0.09 7,717,1502,279,000 NextEra Energy Capital Holdings, Inc.,
2.4400%, due 15/1/32 0.03 2,286,0681,309,000 NRG Energy, Inc., 6.6250%, due
15/1/27 0.02 1,362,4075,542,000 NRG Energy, Inc., 3.3750%, due
15/2/29 0.06 5,438,5594,671,000 NRG Energy, Inc., 3.6250%, due
15/2/31 0.05 4,562,2120.30 25,558,298
Electronic Equipment, Instruments & Components4,494,000 Trimble, Inc., 4.7500%, due 1/12/24 0.06 4,875,1842,762,000 Trimble, Inc., 4.9000%, due 15/6/28 0.04 3,143,932
0.10 8,019,116
Equity Real Estate Investment Trusts (REITs)2,778,000 Agree LP, 2.0000%, due 15/6/28 0.03 2,723,6251,766,000 Agree LP, 2.9000%, due 1/10/30 0.02 1,796,928
2,083,000 Agree LP, 2.6000%, due 15/6/33 0.02 2,047,9662,268,000 Equinix, Inc., 2.1500%, due 15/7/30 0.03 2,207,3211,022,000 GLP Capital LP, 5.2500%, due 1/6/25 0.01 1,120,6002,237,000 GLP Capital LP, 5.3750%, due 15/4/26 0.03 2,493,964
291,000 GLP Capital LP, 5.3000%, due 15/1/29 0.00 330,7545,524,000 GLP Capital LP, 3.2500%, due 15/1/32 0.07 5,562,7515,032,000 Invitation Homes Operating Partnership
LP, 2.0000%, due 15/8/31 0.06 4,744,0389,845,000 Iron Mountain Information Management
Services, Inc., 5.0000%, due 15/7/32 0.12 10,095,408
DocuSign Envelope ID: 521655BF-9BE3-47DC-A9A3-494932954338

27Janus Henderson Capital Funds plc / 31 December 2021
The accompanying notes are an integral part of the financial statements.
Janus Henderson Balanced Fund (continued)
Portfolio Investments
Shares or Principal Amount
Percentage of Net Assets
(%)Fair Value
(USD)
6,540,000 MPT Operating Partnership LP,
3.5000%, due 15/3/31 0.08 6,623,6475,851,000 Rexford Industrial Realty LP, 2.1500%,
due 1/9/31 0.07 5,530,8345,394,000 Sun Communities Operating LP,
2.7000%, due 15/7/31 0.06 5,356,0260.60 50,633,862
Food & Staples Retailing8,060,000 Performance Food Group, Inc.,
4.2500%, due 1/8/29 0.10 8,009,061
Food Products5,450,000 Kraft Heinz Foods Co., 3.8750%, due
15/5/27 0.07 5,893,2183,597,000 Kraft Heinz Foods Co., 5.0000%, due
4/6/42 0.05 4,484,252716,000 Kraft Heinz Foods Co., 4.3750%, due
1/6/46 0.01 840,2621,673,000 Kraft Heinz Foods Co., 4.8750%, due
1/10/49 0.03 2,105,626611,000 Mondelez International, Inc., 2.7500%,
due 13/4/30 0.01 630,3325,711,000 Pilgrim's Pride Corp., 3.5000%, due
1/3/32 0.07 5,777,5900.24 19,731,280
Health Care Providers & Services5,957,000 Centene Corp., 4.2500%, due 15/12/27 0.07 6,220,4784,410,000 Centene Corp., 2.4500%, due 15/7/28 0.05 4,350,6414,638,000 Centene Corp., 3.0000%, due 15/10/30 0.06 4,722,5971,414,000 Centene Corp., 2.5000%, due 1/3/31 0.02 1,378,9051,952,000 Centene Corp., 2.6250%, due 1/8/31 0.02 1,916,2102,189,000 CVS Health Corp., 5.0500%, due
25/3/48 0.03 2,867,0253,816,000 DaVita, Inc., 4.6250%, due 1/6/30 0.05 3,913,5377,346,000 DaVita, Inc., 3.7500%, due 15/2/31 0.09 7,170,7243,416,000 HCA, Inc., 4.7500%, due 1/5/23 0.04 3,579,0371,870,000 HCA, Inc., 5.3750%, due 1/2/25 0.02 2,057,561
984,000 HCA, Inc., 5.8750%, due 15/2/26 0.01 1,111,0791,973,000 HCA, Inc., 5.3750%, due 1/9/26 0.03 2,219,7242,187,000 HCA, Inc., 5.6250%, due 1/9/28 0.03 2,559,1621,648,000 HCA, Inc., 5.8750%, due 1/2/29 0.02 1,966,3289,931,000 HCA, Inc., 3.5000%, due 1/9/30 0.13 10,515,688
895,000 HCA, Inc., 5.5000%, due 15/6/47 0.01 1,173,9551,342,000 HCA, Inc., 5.2500%, due 15/6/49 0.02 1,726,808
6,054,000 HCA, Inc., 3.5000%, due 15/7/51 0.07 6,186,38313,396,000 Molina Healthcare, Inc., 4.3750%, due
15/6/28 0.17 13,820,7200.94 79,456,562
Hotels, Restaurants & Leisure429,000 MGM Resorts International, 7.7500%,
due 15/3/22 0.01 434,905
Industrial Conglomerates4,617,000 General Electric Co., 3.5327%, due
15/3/22 0.05 4,593,915
Insurance9,241,000 Athene Global Funding, 1.7300%, due
2/10/26 0.11 9,075,3498,912,000 Athene Global Funding, 2.6460%, due
4/10/31 0.11 8,813,0097,981,000 Prudential Financial, Inc., 3.7000%,
due 1/10/50 0.10 8,082,6700.32 25,971,028
Shares or Principal Amount
Percentage of Net Assets
(%)Fair Value
(USD)
IT Services
4,408,000 Broadridge Financial Solutions, Inc., 2.6000%, due 1/5/31 0.05 4,429,201
2,775,000 Global Payments, Inc., 4.8000%, due 1/4/26 0.04 3,083,727
3,137,000 Global Payments, Inc., 2.1500%, due 15/1/27 0.04 3,151,268
4,706,000 Global Payments, Inc., 2.9000%, due 15/11/31 0.06 4,778,394
1,904,000 PayPal Holdings, Inc., 1.6500%, due 1/6/25 0.02 1,928,740
0.21 17,371,330
Leisure Products7,623,000 Hasbro, Inc., 3.9000%, due 19/11/29 0.10 8,413,3741,636,000 Hasbro, Inc., 6.3500%, due 15/3/40 0.03 2,265,4311,043,000 Hasbro, Inc., 5.1000%, due 15/5/44 0.02 1,301,163
0.15 11,979,968
Machinery2,602,000 Westinghouse Air Brake Technologies
Corp., 4.9500%, due 15/9/28 0.04 2,960,259
Media3,891,000 Charter Communications Operating
LLC, 2.8000%, due 1/4/31 0.05 3,854,894851,000 Charter Communications Operating
LLC, 6.4840%, due 23/10/45 0.01 1,164,6472,216,000 Charter Communications Operating
LLC, 4.8000%, due 1/3/50 0.03 2,487,1941,614,000 Comcast Corp., 3.7500%, due 1/4/40 0.02 1,810,3476,312,000 CSC Holdings LLC, 4.1250%, due
1/12/30 0.07 6,172,3151,536,000 CSC Holdings LLC, 4.6250%, due
1/12/30 0.02 1,456,0363,423,000 CSC Holdings LLC, 3.3750%, due
15/2/31 0.04 3,210,3292,386,000 CSC Holdings LLC, 5.0000%, due
15/11/31 0.03 2,302,9672,063,000 Fox Corp., 4.0300%, due 25/1/24 0.03 2,179,7419,604,000 GCI LLC, 4.7500%, due 15/10/28 0.12 9,869,983
0.42 34,508,453
Metals & Mining3,422,000 Allegheny Technologies, Inc., 5.8750%,
due 1/12/27 0.04 3,572,4651,884,000 Reliance Steel & Aluminum Co.,
4.5000%, due 15/4/23 0.02 1,950,6590.06 5,523,124
Multiline Retail2,678,000 Dollar General Corp., 4.1250%, due
3/4/50 0.04 3,099,446
Multi-Utilities3,416,000 Dominion Energy, Inc., 4.3500%, due
15/1/27 0.04 3,535,560
Oil, Gas & Consumable Fuels3,061,000 Cheniere Energy Partners LP, 4.0000%,
due 1/3/31 0.04 3,215,2294,375,000 Cheniere Energy Partners LP, 3.2500%,
due 31/1/32 0.05 4,427,5005,920,000 Continental Resources, Inc., 5.7500%,
due 15/1/31 0.08 6,981,456149,000 Energy Transfer LP, 4.9500%, due
15/6/28 0.00 167,7546,875,000 Hess Midstream Operations LP,
5.1250%, due 15/6/28 0.09 7,168,631
DocuSign Envelope ID: 521655BF-9BE3-47DC-A9A3-494932954338

Janus Henderson Capital Funds plc / 31 December 202128
The accompanying notes are an integral part of the financial statements.
Janus Henderson Balanced Fund (continued)
Portfolio Investments
Shares or Principal Amount
Percentage of Net Assets
(%)Fair Value
(USD)
1,537,000 Hess Midstream Operations LP,
4.2500%, due 15/2/30 0.02 1,528,0934,324,000 Southwestern Energy Co., 4.7500%,
due 1/2/32 0.05 4,561,9930.33 28,050,656
Pharmaceuticals4,719,000 Elanco Animal Health, Inc., 5.2720%,
due 28/8/23 0.06 5,025,971
Semiconductors & Semiconductor Equipment2,392,000 Analog Devices, Inc., 2.9500%, due
1/4/25 0.03 2,513,6973,526,000 Broadcom, Inc., 4.3000%, due 15/11/32 0.05 3,967,6764,388,000 Broadcom, Inc., 3.4190%, due 15/4/33 0.05 4,604,8819,591,000 Broadcom, Inc., 3.4690%, due 15/4/34 0.12 10,051,3203,140,000 Marvell Technology, Inc., 1.6500%, due
15/4/26 0.04 3,107,1234,651,000 Marvell Technology, Inc., 4.8750%, due
22/6/28 0.06 5,332,9225,479,000 Microchip Technology, Inc., 2.6700%,
due 1/9/23 0.07 5,597,7413,951,000 Micron Technology, Inc., 2.7030%, due
15/4/32 0.05 3,962,3000.47 39,137,660
Software1,400,000 Cadence Design Systems, Inc.,
4.3750%, due 15/10/24 0.02 1,505,965
Specialty Retail8,848,000 Lithia Motors, Inc., 3.8750%, due
1/6/29 0.11 9,047,301
Thrifts & Mortgage Finance5,146,000 Rocket Mortgage LLC, 2.8750%, due
15/10/26 0.06 5,114,3013,826,000 Rocket Mortgage LLC, 3.6250%, due
1/3/29 0.05 3,845,8386,970,000 Rocket Mortgage LLC, 3.8750%, due
1/3/31 0.08 7,085,2845,263,000 Rocket Mortgage LLC, 4.0000%, due
15/10/33 0.06 5,338,7350.25 21,384,158
Trading Companies & Distributors5,534,000 Air Lease Corp., 1.8750%, due 15/8/26 0.07 5,448,0893,450,000 Air Lease Corp., 3.0000%, due 1/2/30 0.04 3,447,292
0.11 8,895,381
Wireless Telecommunication Services4,030,000 T-Mobile USA, Inc., 3.5000%, due
15/4/25 0.05 4,272,6203,789,000 T-Mobile USA, Inc., 3.7500%, due
15/4/27 0.05 4,105,0070.10 8,377,627
Total Corporate Bonds 10.19 849,478,958
Government Obligations (2020: 7.40% USD 409,545,676)US Treasury Notes/Bonds
93,065,000 0.1250%, due 28/2/23 1.11 92,697,830122,555,000 0.1250%, due 31/3/23 1.46 122,004,46069,676,000 0.1250%, due 30/4/23 0.83 69,311,28918,233,000 0.1250%, due 30/6/23 0.22 18,111,209
138,475,000 0.1250%, due 31/8/23 1.64 137,268,75347,926,000 0.3750%, due 31/10/23 0.57 47,650,8008,487,000 0.2500%, due 15/5/24 0.10 8,372,293
10,840,000 0.3750%, due 15/9/24 0.13 10,687,98655,090,000 0.3750%, due 31/1/26 0.64 53,310,335
Shares or Principal Amount
Percentage of Net Assets
(%)Fair Value
(USD)
50,014,000 0.5000%, due 28/2/26 0.58 48,601,49548,322,000 0.7500%, due 30/4/26 0.57 47,368,77357,834,000 0.8750%, due 30/6/26 0.68 56,923,56619,102,000 0.6250%, due 31/7/26 0.22 18,575,9492,760,800 0.7500%, due 31/8/26 0.03 2,699,221
41,874,600 0.8750%, due 30/9/26 0.49 41,141,79556,305,000 1.2500%, due 30/11/26 0.67 56,278,607
1,972,100 1.2500%, due 30/4/28 0.02 1,954,6134,063,000 1.2500%, due 30/6/28 0.05 4,022,370
160,822,900 1.3750%, due 15/11/31 1.90 158,837,74210,217,000 1.3750%, due 15/11/40 0.11 9,314,232
94,570,000 1.7500%, due 15/8/41 1.10 91,718,1236,582,000 2.0000%, due 15/11/41 0.08 6,659,13322,192,400 2.7500%, due 15/8/42 0.30 25,294,135
46,608,000 1.3750%, due 15/8/50 0.49 40,845,72246,351,800 1.6250%, due 15/11/50 0.52 43,199,51627,239,700 1.8750%, due 15/2/51 0.32 26,960,9199,518,000 2.3750%, due 15/5/51 0.13 10,515,903
14,190,000 2.0000%, due 15/8/51 0.17 14,469,366311,200,000 0.0000%, due 4/1/22 3.72 311,200,302
11,719,000 0.1250%, due 15/7/31 0.16 13,602,200
Total Government Obligations 19.01 1,589,598,637
Mortgage-Backed Securities (2020: 5.84% USD 323,269,119)Fannie Mae
365,800 3.0000%, due 1/10/34 0.00 384,687872,224 2.5000%, due 1/11/34 0.01 908,565156,303 3.0000%, due 1/11/34 0.00 165,157177,893 3.0000%, due 1/12/34 0.00 187,75528,363 6.0000%, due 1/2/37 0.00 32,764
1,155,107 3.0000%, due 1/9/42 0.01 1,220,976245,738 4.5000%, due 1/11/42 0.00 270,828142,250 3.0000%, due 1/1/43 0.00 149,932
1,618,485 3.0000%, due 1/1/43 0.02 1,710,778649,058 3.0000%, due 1/2/43 0.01 686,070
48,112 3.0000%, due 1/2/43 0.00 50,8871,813,350 3.0000%, due 1/3/43 0.02 1,917,959562,424 3.0000%, due 1/3/43 0.01 594,870454,022 3.0000%, due 1/5/43 0.01 480,214
191,191 3.0000%, due 1/5/43 0.00 202,22014,554 5.0000%, due 1/7/44 0.00 16,252
596,414 4.5000%, due 1/10/44 0.01 665,255887,463 4.5000%, due 1/3/45 0.01 989,898482,783 4.5000%, due 1/6/45 0.01 534,039
2,555,229 3.0000%, due 1/7/45 0.03 2,702,636429,616 3.5000%, due 1/12/45 0.01 458,949
27,081 3.0000%, due 1/1/46 0.00 28,460970,329 4.5000%, due 1/2/46 0.01 1,069,400330,814 3.5000%, due 1/7/46 0.00 357,092
1,128,401 3.0000%, due 1/9/46 0.01 1,192,7472,274,502 3.0000%, due 1/9/46 0.03 2,395,747
303,145 3.0000%, due 1/11/46 0.00 322,55684,852 3.0000%, due 1/1/47 0.00 90,285
1,482,598 3.0000%, due 1/2/47 0.02 1,561,630366,541 3.5000%, due 1/3/47 0.00 391,567710,370 3.0000%, due 1/3/47 0.01 749,158322,247 3.5000%, due 1/7/47 0.00 344,249142,046 3.5000%, due 1/8/47 0.00 155,289107,435 3.5000%, due 1/8/47 0.00 113,88540,362 3.5000%, due 1/12/47 0.00 44,12572,859 3.5000%, due 1/12/47 0.00 79,651
349,034 3.5000%, due 1/1/48 0.00 374,8051,501,758 4.0000%, due 1/1/48 0.02 1,635,340754,005 4.0000%, due 1/1/48 0.01 818,389
DocuSign Envelope ID: 521655BF-9BE3-47DC-A9A3-494932954338

29Janus Henderson Capital Funds plc / 31 December 2021
The accompanying notes are an integral part of the financial statements.
Janus Henderson Balanced Fund (continued)
Portfolio Investments
Shares or Principal Amount
Percentage of Net Assets
(%)Fair Value
(USD)
287,676 3.0000%, due 1/2/48 0.00 304,57459,633 3.5000%, due 1/3/48 0.00 65,09029,452 4.5000%, due 1/3/48 0.00 31,543
488,973 4.0000%, due 1/3/48 0.01 531,788992,050 5.0000%, due 1/5/48 0.01 1,079,700
8,563,189 3.5000%, due 1/7/48 0.11 9,129,33419,002 4.5000%, due 1/8/48 0.00 20,346
280,753 4.0000%, due 1/2/49 0.00 301,189174,273 3.0000%, due 1/8/49 0.00 184,081198,940 3.0000%, due 1/9/49 0.00 208,272565,986 2.5000%, due 1/1/50 0.01 580,444882,560 2.5000%, due 1/10/50 0.01 901,360
4,406,379 2.5000%, due 1/1/51 0.05 4,500,242141,251 2.5000%, due 1/8/51 0.00 144,423
1,320,094 3.5000%, due 1/5/56 0.02 1,435,3613,115,129 3.5000%, due 1/8/56 0.04 3,387,1341,189,956 3.5000%, due 1/8/56 0.02 1,293,8602,074,341 3.0000%, due 1/2/57 0.03 2,201,379
47,839 3.0000%, due 1/6/57 0.00 50,7673,010,347 5.0028%, due 25/11/24 0.04 3,123,9731,784,936 4.4028%, due 25/2/25 0.02 1,816,7743,013,802 4.1028%, due 25/5/25 0.04 3,066,7751,845,620 5.1028%, due 25/7/25 0.02 1,891,1211,053,849 5.8028%, due 25/4/28 0.01 1,110,0141,482,770 4.3527%, due 25/4/29 0.02 1,529,2133,121,315 3.6528%, due 25/7/29 0.04 3,192,226
8,950,000 2.0500%, due 25/11/41 0.11 8,965,6782,227,827 3.0000%, due 25/5/48 0.03 2,320,048
3,032,588 3.0000%, due 25/11/49 0.04 3,156,1800.95 82,577,955
Freddie Mac249,885 3.5000%, due 1/1/47 0.00 269,525
6,810,275 3.0528%, due 25/11/49 0.08 6,811,8391,810,250 3.2028%, due 25/3/50 0.02 1,830,892
5,724,000 2.2997%, due 25/8/33 0.07 5,762,753278,176 2.0527%, due 25/10/49 0.00 278,954634,795 3.2528%, due 25/9/50 0.01 636,180
3,801,000 2.0497%, due 25/12/50 0.05 3,826,2931,448,000 2.3497%, due 25/8/33 0.02 1,471,8895,574,206 2.6497%, due 25/11/50 0.07 5,628,7831,010,185 5.6527%, due 25/7/28 0.01 1,047,826
0.33 27,564,934
Freddie Mac Pool2,629,723 3.0000%, due 1/5/31 0.03 2,761,722
745,246 3.0000%, due 1/9/32 0.01 783,287415,549 3.0000%, due 1/10/32 0.01 435,857466,751 3.0000%, due 1/1/33 0.01 490,577
2,493,641 2.5000%, due 1/12/33 0.03 2,586,041766,919 3.0000%, due 1/10/34 0.01 807,707311,492 3.0000%, due 1/10/34 0.00 327,589
1,293,135 2.5000%, due 1/11/34 0.02 1,347,068918,673 2.5000%, due 1/11/34 0.01 956,988394,449 6.0000%, due 1/4/40 0.01 457,843161,923 3.5000%, due 1/7/42 0.00 174,613183,338 3.5000%, due 1/8/42 0.00 197,706204,879 3.5000%, due 1/8/42 0.00 220,936191,043 3.5000%, due 1/2/43 0.00 206,194
5,349 3.0000%, due 1/2/43 0.00 5,6592,459 3.0000%, due 1/3/43 0.00 2,602
590,442 3.0000%, due 1/3/43 0.01 622,02679,871 3.0000%, due 1/6/43 0.00 83,121
4,769,060 3.0000%, due 1/11/43 0.06 5,042,463212,359 3.5000%, due 1/2/44 0.00 229,200
Shares or Principal Amount
Percentage of Net Assets
(%)Fair Value
(USD)
318,316 4.5000%, due 1/5/44 0.00 352,128
1,444,934 3.5000%, due 1/12/44 0.02 1,551,134362,892 3.0000%, due 1/1/45 0.00 381,549867,295 3.0000%, due 1/1/46 0.01 923,298303,254 3.5000%, due 1/7/46 0.00 326,253601,548 3.0000%, due 1/10/46 0.01 631,750277,566 4.0000%, due 1/3/47 0.00 300,349112,773 3.5000%, due 1/4/47 0.00 121,781
384,762 3.0000%, due 1/4/47 0.00 402,996501,992 3.5000%, due 1/9/47 0.01 532,175658,506 3.5000%, due 1/12/47 0.01 709,688260,634 3.5000%, due 1/2/48 0.00 278,872
30,193 4.5000%, due 1/3/48 0.00 32,336420,620 4.0000%, due 1/3/48 0.01 457,456302,677 4.0000%, due 1/4/48 0.00 322,265352,619 4.0000%, due 1/4/48 0.00 382,297418,484 4.0000%, due 1/5/48 0.01 446,154254,112 4.5000%, due 1/7/48 0.00 272,21520,577 5.0000%, due 1/9/48 0.00 22,485
349,850 4.5000%, due 1/12/48 0.00 380,2811,340,550 4.5000%, due 1/5/49 0.02 1,442,543
58,457 3.0000%, due 1/8/49 0.00 61,750111,079 3.0000%, due 1/8/49 0.00 116,249414,748 3.0000%, due 1/12/49 0.01 430,191178,842 3.0000%, due 1/12/49 0.00 185,501231,573 2.5000%, due 1/1/50 0.00 237,501
400,282 3.5000%, due 1/3/50 0.01 422,155778,728 3.0000%, due 1/3/50 0.01 806,769
1,312,727 2.5000%, due 1/8/51 0.02 1,341,2450.36 31,610,565
Ginnie Mae1,606,096 4.0000%, due 15/1/45 0.02 1,754,9841,780,099 4.5000%, due 15/8/46 0.02 2,015,389
251,204 4.0000%, due 15/7/47 0.00 270,07341,079 4.0000%, due 15/8/47 0.00 44,16525,513 4.0000%, due 20/8/47 0.00 27,387
183,863 4.0000%, due 20/8/47 0.00 196,38321,462 4.0000%, due 20/8/47 0.00 22,923
54,963 4.0000%, due 15/11/47 0.00 59,09295,727 4.0000%, due 15/12/47 0.00 102,918
219,557 4.5000%, due 20/2/48 0.00 236,0073,814,975 4.0000%, due 20/5/48 0.05 4,040,189
48,962 4.5000%, due 20/5/48 0.00 52,309431,626 4.5000%, due 20/5/48 0.01 461,130
1,989,730 4.0000%, due 20/6/48 0.03 2,106,5701,130,559 5.0000%, due 20/8/48 0.01 1,205,699
20,331,630 2.0000%, due 15/1/52 0.25 20,520,16817,928,480 2.5000%, due 15/1/52 0.22 18,376,563
0.61 51,491,949
UMBS923,898 1.5000%, due 25/1/37 0.01 927,103
8,308,407 2.0000%, due 25/1/37 0.10 8,512,9654,704,900 2.5000%, due 25/1/37 0.06 4,868,20773,347,726 2.0000%, due 25/1/52 0.87 73,146,01157,859,853 2.5000%, due 25/1/52 0.71 59,076,93484,583,209 3.0000%, due 25/1/52 1.05 87,647,77127,991,783 3.5000%, due 25/2/52 0.35 29,446,050
3.15 263,625,041
Total Mortgage-Backed Securities 5.40 456,870,444
Preferred Stock (2020: 0.24% USD 12,926,083)
DocuSign Envelope ID: 521655BF-9BE3-47DC-A9A3-494932954338

Janus Henderson Capital Funds plc / 31 December 202130
The accompanying notes are an integral part of the financial statements.
Janus Henderson Balanced Fund (continued)
Portfolio Investments
Shares or Principal Amount
Percentage of Net Assets
(%)Fair Value
(USD)
Tranche Loans (2020: 0.12% USD 6,636,604)NetherlandsChemicals
5,128,947 Alpha 3 BV, 3.0000%, due 18/3/28 0.06 5,125,5627,410,000 Diamond (BC) BV, 3.5000%, due
29/9/28 0.09 7,396,6620.15 12,522,224
United StatesBuilding Products
3,319,154 Standard Industries, Inc., 3.0000%, due 22/9/28 0.04 3,326,074
Diversified Financial Services14,828,000 Trans Union LLC, 2.7500%, due
1/12/28 0.18 14,809,465
Health Care Equipment & Supplies13,464,869 Mozart Borrower LP, 3.7500%, due
23/10/28 0.16 13,477,055
Health Care Providers & Services7,425,400 Indigo Merger Sub, Inc., 2.7500%, due
3/7/28 0.09 7,437,2441,850,043 Indigo Merger Sub, Inc., 2.7500%, due
3/7/28 0.02 1,852,9940.11 9,290,238
Machinery8,998,396 Madison IAQ LLC, 3.7500%, due
21/6/28 0.11 9,002,130
Pharmaceuticals9,368,392 Elanco Animal Health, Inc., 1.8493%,
due 1/8/27 0.11 9,259,343
Semiconductors & Semiconductor Equipment5,866,000 MKS Instruments, Inc., due 20/10/28 0.07 5,860,867
Total Tranche Loans 0.93 77,547,396
Total Investments (Cost: USD 6,745,027,292) 102.60 8,587,612,597
Forward Currency Contracts (2020: 0.59% USD 32,654,256)Open as at 31 December 2021.
Current Market
Percentage of Net Unrealised
Currency Currency Value Settle Assets GainPurchased Sold (USD) Date (%) (USD)
.J.P. Morgan AUD◊ 44,096,176 USD 31,712,105 32,084,973 31-Jan-22 0.00 372,868
CAD◊ 66,630,171 USD 52,573,188 52,672,679 31-Jan-22 0.00 99,491
CNH◊ 519,143 USD 80,855 81,523 28-Jan-22 0.00 668
EUR◊ 1,651,479,995 USD 1,854,289,753 1,881,258,664 31-Jan-22 0.32 26,968,911
GBP◊ 2,896,248 USD 3,863,644 3,919,960 31-Jan-22 0.00 56,316
SGD◊ 4,317,076 USD 3,158,124 3,202,951 31-Jan-22 0.00 44,827
USD◊ 654,570 CAD 827,701 654,317 31-Jan-22 0.00 253
Total 0.32 27,543,334
.
Total Financial Assets at fair value through profit or loss 102.92 8,615,155,931
Financial Liabilities at fair value through profit or loss.Forward Currency Contracts (2020: 0.00% USD (189,672))Open as at 31 December 2021
Current Market
Percentage of Net Unrealised
Currency Currency Value Settle Assets LossPurchased Sold (USD) Date (%) (USD)
J.P. Morgan CAD◊ 1,009,716 USD 798,555 798,205 31-Jan-22 0.00 (350)
USD◊ 2,532,404 AUD 3,550,492 2,583,384 31-Jan-22 0.00 (50,980)
USD◊ 2,770,989 CAD 3,548,812 2,805,417 31-Jan-22 0.00 (34,428)
USD◊ 2,182 CNH 13,986 2,197 28-Jan-22 0.00 (15)
USD◊ 58,018,416 EUR 51,438,597 58,595,504 31-Jan-22 0.00 (577,088)
USD◊ 88,485 GBP 66,667 90,231 31-Jan-22 0.00 (1,746)
USD◊ 163,746 SGD 224,237 166,366 31-Jan-22 0.00 (2,620)
Total 0.00 (667,227).
Total Financial Liabilities at fair value through profit or loss 0.00 (667,227)
Portfolio Analysis (Unaudited)
Analysis of Total Assets:% of Total
AssetsTransferable securities admitted to official stock exchange listing 77.69Transferable securities dealt in on another regulated market 18.78OTC financial derivative instruments 0.31Other Assets 3.22Total Assets 100.00
◊ These forward currency contracts are used for share class hedging.
DocuSign Envelope ID: 521655BF-9BE3-47DC-A9A3-494932954338

31Janus Henderson Capital Funds plc / 31 December 2021
The accompanying notes are an integral part of the financial statements.
Janus Henderson Balanced Fund (continued)
Fair Value Hierarchy
The tables below provide the fair value hierarchy summary of the Fund’s financial assets and liabilities measured at fair value at 31 December 2021 and 31 December 2020.
31 December 2021
Level 1 - Quoted Prices
(USD)
Level 2 - Other Significant
Observable Inputs (USD)
Level 3 - Significant
Unobservable Inputs (USD)
Total (USD)
Asset-Backed/Commercial Mortgage-Backed Securities – 215,977,613 – 215,977,613Common Stock 5,398,139,549 – – 5,398,139,549Corporate Bonds – 849,478,958 – 849,478,958Forward Currency Contracts – 26,876,107 – 26,876,107Government Obligations – 1,589,598,637 – 1,589,598,637Mortgage-Backed Securities – 456,870,444 – 456,870,444Tranche Loans – 77,547,396 – 77,547,396Total Investments in Securities 5,398,139,549 3,216,349,155 – 8,614,488,704
31 December 2020
Level 1 - Quoted Prices
(USD)
Level 2 - Other Significant
Observable Inputs (USD)
Level 3 - Significant
Unobservable Inputs (USD)
Total (USD)
Asset-Backed/Commercial Mortgage-Backed Securities – 176,838,670 – 176,838,670Common Stock 3,446,498,055 – – 3,446,498,055Corporate Bonds – 1,079,916,734 – 1,079,916,734Forward Currency Contracts – 32,464,584 – 32,464,584Government Obligations – 409,545,676 – 409,545,676Mortgage-Backed Securities – 323,269,119 – 323,269,119Preferred Stock 12,926,083 – – 12,926,083Tranche Loans – 6,636,604 – 6,636,604Total Investments in Securities 3,459,424,138 2,028,671,387 – 5,488,095,525
There were transfers on Government Obligations from level 1 to level 2 during the financial year ended 31 December 2021 and 31 December 2020.
There were no investments held by the Fund at 31 December 2021 and 31 December 2020 that were fair valued at level 3 by the Janus Henderson Global Pricing Committee (“GPC”).
Valuation policy of private placements is referenced in note 2 of the financial statements.
DocuSign Envelope ID: 521655BF-9BE3-47DC-A9A3-494932954338

Janus Henderson Capital Funds plc / 31 December 202132
Janus Henderson Balanced Fund (continued)
The accompanying notes are an integral part of the financial statements.
Capital Share Transactions
For the financial year ended 31 December 2021
A2 EUR A2 HAUD A2 HEUR A2 HKD A2 HSGD A2 SGD A2 USD A3m USDShares Shares Shares Shares Shares Shares Shares Shares
At beginning of the year . . . . . . . 4,993 37,022 11,775,058 2,017,953 19,741 13,630 67,253,587 301Shares issued 71,369 153,977 7,307,554 5,256,146 14,590 114,863 34,367,770 31,549Shares redeemed. . . . . . . . . . . (7,155) (137,708) (2,391,414) (3,332,778) (7,411) (10,276) (13,544,194) –At end of year . . . . . . . . . . . . . 69,207 53,291 16,691,198 3,941,321 26,920 118,217 88,077,163 31,850
A5m HAUD A5m HCAD A5m HCNH A5m HEUR A5m HKD A5m HSGD A5m SGD A5m USDShares Shares Shares Shares Shares Shares Shares Shares
At beginning of the year . . . . . . . 3,273,234 1,400,517 29,735 9,805,446 51,151,010 9,638 7,636 32,919,268Shares issued 1,895,747 1,588,914 101 8,849,372 47,448,259 287,911 122,028 38,186,708Shares redeemed. . . . . . . . . . . (2,758,718) (1,769,432) – (2,867,957) (48,701,226) (8,902) (2,451) (24,900,410)At end of year . . . . . . . . . . . . . 2,410,263 1,219,999 29,836 15,786,861 49,898,043 288,647 127,213 46,205,566
B2 USD E2 HEUR E2 USD E3m USD E5m HEUR E5m USD H1m HEUR H1m USDShares Shares Shares Shares Shares Shares Shares Shares
At beginning of the year . . . . . . . 299,890 4,468,323 22,096,752 301 4,729,927 1,279,037 138,334 1,097,608Shares issued 32,782 3,217,742 12,716,817 16,771 3,097,527 1,198,843 235 439,812Shares redeemed. . . . . . . . . . . (45,815) (822,771) (5,510,648) – (838,437) (222,906) (58,868) (193,422)At end of year . . . . . . . . . . . . . 286,857 6,863,294 29,302,921 17,072 6,989,017 2,254,974 79,701 1,343,998
H2 HEUR H2 USD H3m USD I1m HEUR I1m HGBP I2 HCAD I2 HEUR I2 USDShares Shares Shares Shares Shares Shares Shares Shares
At beginning of the year . . . . . . . 270,672 939,787 301 23,349 201,121 2,368,456 12,638,130 19,675,198Shares issued 222,295 1,947,831 4 96,290 11,693 – 9,717,227 8,425,818Shares redeemed. . . . . . . . . . . (127,687) (282,332) – – – – (3,529,610) (3,323,992)At end of year . . . . . . . . . . . . . 365,280 2,605,286 305 119,639 212,814 2,368,456 18,825,747 24,777,024
I3m USD V5m HAUD V5m USDShares Shares Shares
At beginning of the year . . . . . . . 301 396,031 2,050,685Shares issued 23,394 373,589 1,891,437Shares redeemed. . . . . . . . . . . – (270,719) (1,219,128)At end of year . . . . . . . . . . . . . 23,695 498,901 2,722,994
For the financial year ended 31 December 2020
A2 EUR A2 HAUD A2 HEUR A2 HKD A2 HSGD A2 SGD A2 USD A3m USDShares Shares Shares Shares Shares Shares Shares Shares
At beginning of the year . . . . . . . 268 139,075 9,260,325 1,411,434 6,586 11,699 51,216,632 –Shares issued 4,725 62,529 5,665,021 3,104,756 28,298 27,142 33,736,904 301Shares redeemed. . . . . . . . . . . – (164,582) (3,150,288) (2,498,237) (15,143) (25,211) (17,699,949) –At end of year . . . . . . . . . . . . . 4,993 37,022 11,775,058 2,017,953 19,741 13,630 67,253,587 301
A5m HAUD A5m HCAD A5m HCNH A5m HEUR A5m HKD A5m HSGD A5m SGD A5m USDShares Shares Shares Shares Shares Shares Shares Shares
At beginning of the year . . . . . . . 2,497,156 1,058,349 29,638 7,026,940 51,897,951 11,766 5,186 19,414,696Shares issued 8,277,141 2,401,147 97 4,649,772 82,201,219 5,956 8,707 35,403,814Shares redeemed. . . . . . . . . . . (7,501,063) (2,058,979) – (1,871,266) (82,948,160) (8,084) (6,257) (21,899,242)At end of year . . . . . . . . . . . . . 3,273,234 1,400,517 29,735 9,805,446 51,151,010 9,638 7,636 32,919,268
B2 USD E2 HEUR E2 USD E3m USD E5m HEUR E5m USD H1m HEUR H1m USDShares Shares Shares Shares Shares Shares Shares Shares
At beginning of the year . . . . . . . 353,699 3,267,517 15,149,033 – 3,588,421 511,965 151,281 1,237,838Shares issued 25,218 2,168,783 12,089,370 301 1,862,818 981,204 140,718 155,218Shares redeemed. . . . . . . . . . . (79,027) (967,977) (5,141,651) – (721,312) (214,132) (153,665) (295,448)At end of year . . . . . . . . . . . . . 299,890 4,468,323 22,096,752 301 4,729,927 1,279,037 138,334 1,097,608
DocuSign Envelope ID: 521655BF-9BE3-47DC-A9A3-494932954338

33Janus Henderson Capital Funds plc / 31 December 2021
Janus Henderson Balanced Fund (continued)
The accompanying notes are an integral part of the financial statements.
H2 HEUR H2 USD H3m USD I1m HEUR I1m HGBP I2 HCAD I2 HEUR I2 USDShares Shares Shares Shares Shares Shares Shares Shares
At beginning of the year . . . . . . . 169,983 168,783 – 250 199,238 2,368,456 9,973,750 13,693,165Shares issued 182,995 882,852 301 23,099 1,883 – 5,910,454 9,768,012Shares redeemed. . . . . . . . . . . (82,306) (111,848) – – – – (3,246,074) (3,785,979)At end of year . . . . . . . . . . . . . 270,672 939,787 301 23,349 201,121 2,368,456 12,638,130 19,675,198
I3m USD V5m HAUD V5m USDShares Shares Shares
At beginning of the year . . . . . . . – 320,489 1,383,988Shares issued 301 355,112 1,812,968Shares redeemed. . . . . . . . . . . – (279,570) (1,146,271)At end of year . . . . . . . . . . . . . 301 396,031 2,050,685
Net Asset Comparison
31 December 2021 31 December 2020 31 December 2019
Net Assets (USD)
NAV Per Share
(Local Currency)Net Assets
(USD)
NAV Per Share
(Local Currency)Net Assets
(USD)
NAV Per Share
(Local Currency)
A2 EUR 1,002,298 12.72 62,633 10.27 2,982 9.93A2 HAUD 787,226 20.30 505,536 17.71 1,565,227 16.04A2 HEUR 755,313,775 39.75 500,047,550 34.76 326,466,987 31.43A2 HKD 12,805,326 25.33 5,678,326 21.81 3,526,209 19.47A2 HSGD 283,794 14.21 183,917 12.31 53,999 11.02A2 SGD 1,246,279 14.21 124,466 12.07 94,892 10.91A2 USD 3,745,849,899 42.53 2,477,475,632 36.84 1,675,185,103 32.71A3m USD 385,862 12.11 3,197 10.63 – –A5m HAUD 23,761,100 13.55 31,138,283 12.34 20,434,913 11.66A5m HCAD 13,190,445 13.68 13,636,207 12.39 9,446,987 11.59A5m HCNH 79,222 16.88 67,875 14.84 57,788 13.57A5m HEUR 223,919,510 12.46 135,848,872 11.34 84,105,104 10.67A5m HKD 92,159,018 14.40 85,175,065 12.91 79,873,549 11.99A5m HSGD 2,743,908 12.81 84,249 11.55 94,316 10.78A5m SGD 1,210,785 12.83 65,506 11.34 41,116 10.66A5m USD 662,924,532 14.35 425,786,181 12.93 232,043,471 11.95B2 USD 9,714,642 33.87 8,885,662 29.63 9,399,473 26.57E2 HEUR 161,156,573 20.62 98,953,393 18.13 60,365,812 16.47E2 USD 521,197,280 17.79 342,132,296 15.48 209,308,025 13.82E3m USD 205,638 12.05 3,194 10.62 – –E5m HEUR 96,003,918 12.07 63,784,153 11.04 42,004,363 10.44E5m USD 32,209,543 14.28 16,550,829 12.94 6,152,417 12.02H1m HEUR 1,276,448 14.07 2,068,796 12.24 1,878,002 11.07H1m USD 20,739,119 15.43 14,585,952 13.29 14,608,274 11.80H2 HEUR 6,090,013 14.64 4,192,422 12.68 2,162,705 11.34H2 USD 41,811,643 16.05 12,932,808 13.76 2,041,934 12.10H3m USD 3,737 12.26 3,202 10.65 – –I1m HEUR 2,121,604 15.58 386,316 13.54 3,429 12.24I1m HGBP 3,817,242 13.25 3,152,142 11.46 2,729,966 10.35I2 HCAD 36,653,648 19.58 31,347,035 16.85 27,330,542 14.98I2 HEUR 572,569,883 26.71 357,246,936 23.14 231,726,083 20.71I2 USD 1,281,639,137 51.72 872,643,759 44.35 533,957,666 38.99I3m USD 290,490 12.26 3,202 10.65 – –V5m HAUD 4,982,797 13.73 3,813,380 12.49 2,654,822 11.81V5m USD 39,659,460 14.56 26,928,286 13.13 16,794,556 12.13
. . .
DocuSign Envelope ID: 521655BF-9BE3-47DC-A9A3-494932954338

Janus Henderson Capital Funds plc / 31 December 202134
Janus Henderson Balanced Fund (continued)
The accompanying notes are an integral part of the financial statements.
Total Expense Ratio (unaudited)
The Average Total Expense Ratio table shows the actual expenses, excluding transactions costs and trade commissions, incurred by each Class for the Fund during the reporting financial year expressed as a percentage of the average net assets for the corresponding year, on an annualised basis.
31 December 2021 31 December 2020 31 December 2019A2 EUR 1.86% 2.17% 1.86%A2 HAUD 1.87% 1.88% 1.91%A2 HEUR 1.87% 1.90% 1.91%A2 HKD 1.86% 1.90% 1.90%A2 HSGD 1.87% 1.87% 1.88%A2 SGD 1.86% 1.91% 1.89%A2 USD 1.87% 1.89% 1.90%A3m USD 1.85% 1.76% –A5m HAUD 1.87% 1.89% 1.91%A5m HCAD 1.87% 1.90% 1.91%A5m HCNH 1.88% 1.94% 1.91%A5m HEUR 1.87% 1.90% 1.91%A5m HKD 1.88% 1.89% 1.91%A5m HSGD 1.85% 1.93% 1.87%A5m SGD 1.85% 1.88% 1.87%A5m USD 1.87% 1.89% 1.90%B2 USD 2.87% 2.89% 2.91%E2 HEUR 2.37% 2.39% 2.40%E2 USD 2.37% 2.40% 2.40%E3m USD 2.33% 2.26% –E5m HEUR 2.37% 2.39% 2.41%E5m USD 2.37% 2.39% 2.40%H1m HEUR 0.85% 0.87% 0.96%H1m USD 0.85% 0.91% 0.93%H2 HEUR 0.85% 0.90% 0.95%H2 USD 0.85% 0.90% 0.95%H3m USD 0.81% 0.81% –I1m HEUR 0.84% 0.91% 0.96%I1m HGBP 0.85% 0.90% 0.90%I2 HCAD 0.85% 0.90% 0.96%I2 HEUR 0.85% 0.90% 0.96%I2 USD 0.85% 0.90% 0.96%I3m USD 0.85% 0.81% –V5m HAUD 1.85% 1.89% 1.91%V5m USD 1.87% 1.90% 1.90%
DocuSign Envelope ID: 521655BF-9BE3-47DC-A9A3-494932954338

35Janus Henderson Capital Funds plc / 31 December 2021
Janus Henderson Balanced Fund (continued)
The accompanying notes are an integral part of the financial statements.
Distributions per share (unaudited)
The following table shows the distribution rate per share at Ex-date for each distributing share class :
Share Class (Local Currency) 15/01/2021 12/02/2021 15/03/2021 15/04/2021 14/05/2021 15/06/2021 15/07/2021 13/08/2021 15/09/2021 15/10/2021 15/11/2021 15/12/2021A3m USD 0.01863 0.01073 0.01529 0.01272 0.01099 0.01279 0.01129 0.01079 0.01283 0.01006 0.00980 0.01230A5m HAUD 0.04474 0.04149 0.04208 0.04971 0.04285 0.04851 0.04647 0.04547 0.05133 0.04614 0.04626 0.05027A5m HCAD 0.04147 0.03851 0.03919 0.04629 0.04502 0.04542 0.04477 0.04192 0.05503 0.04327 0.04198 0.04745A5m HCNH 0.05022 0.04627 0.04740 0.05585 0.04869 0.05510 0.05309 0.05172 0.05879 0.05305 0.05333 0.05830A5m HEUR 0.03821 0.03516 0.03594 0.04227 0.03670 0.04140 0.04061 0.03864 0.04377 0.03935 0.03949 0.04295A5m HKD 0.04369 0.04011 0.04110 0.04782 0.04222 0.04747 0.04588 0.04465 0.05048 0.04540 0.04572 0.05056A5m HSGD 0.03904 0.03592 0.03673 0.04317 0.03756 0.04242 0.04082 0.03967 0.04499 0.04048 0.04061 0.04430A5m SGD 0.03839 0.03534 0.03666 0.04283 0.03719 0.04181 0.04102 0.04001 0.04492 0.04056 0.04078 0.04509A5m USD 0.04370 0.03993 0.04107 0.04833 0.04200 0.04747 0.04556 0.04430 0.04995 0.04531 0.04525 0.04950E3m USD 0.01863 0.01073 0.01526 0.01269 0.01098 0.01282 0.01122 0.01085 0.01285 0.01000 0.00975 0.01224E5m HEUR 0.03726 0.03424 0.03499 0.04112 0.03587 0.04022 0.03867 0.03755 0.04246 0.03821 0.03826 0.04184E5m USD 0.04362 0.04012 0.04108 0.04837 0.04195 0.04740 0.04553 0.04425 0.05007 0.04516 0.04521 0.04948H1m HEUR 0.01112 0.00351 0.00865 0.00465 0.00211 0.00569 0.00421 0.00349 0.00454 0.00201 0.00185 0.00426H1m USD 0.01153 0.00384 0.00935 0.00511 0.00286 0.00613 0.00456 0.00379 0.00490 0.00221 0.00198 0.00439H3m USD 0.01869 0.01076 0.01536 0.01272 0.01105 0.01289 0.01132 0.01095 0.01302 0.01014 0.00980 0.01235I1m HEUR 0.01218 0.00388 0.00957 0.00515 0.00437 0.00576 0.00459 0.00386 0.00493 0.00223 0.00203 0.00436I1m HGBP 0.00997 0.00327 0.00807 0.00440 0.00268 0.00520 0.00392 0.00324 0.00423 0.00189 0.00174 0.00386I3m USD 0.01869 0.01076 0.01536 0.01272 0.01105 0.01289 0.01132 0.01090 0.01294 0.01016 0.00990 0.01244V5m HAUD 0.04536 0.04170 0.04206 0.05026 0.04351 0.04912 0.04697 0.04558 0.05126 0.04639 0.04688 0.05083V5m USD 0.04447 0.04083 0.04287 0.04973 0.04251 0.04823 0.04637 0.04518 0.05096 0.04603 0.04610 0.05027
– – – – – – – – – – – –
DocuSign Envelope ID: 521655BF-9BE3-47DC-A9A3-494932954338

Janus Henderson Capital Funds plc / 31 December 202136
Janus Henderson Balanced Fund (continued)
The accompanying notes are an integral part of the financial statements.
Fund Performance (unaudited)
As at 31 December 2021
One year Three years Five yearsSince
inception
Performance (Annualised) 31/12/2020 31/12/2021
%
31/12/2017 31/12/2021
%
31/12/2015 31/12/2021
%
to 31/12/2021
%
H2 USD (Net)* 16.64 16.00** 12.48** 6.49**Balanced Index (55%S&P500/45% BBUSAgg) 14.32 16.47 11.87 6.84
Five years 31/12/2015 31/12/2021
%H2 USD (Gross)* 14.65Balanced Index (55%S&P500/45% BBUSAgg) + 1.50% 13.55
.
Discrete performance
31/12/2020 31/12/2021
%
31/12/2019 31/12/2020
%
31/12/2018 31/12/2019
%
31/12/2017 31/12/2018
%
31/12/2016 31/12/2017
%
H2 USD (Net)* 16.64 12.60** 20.08** (0.95)** 16.43**Balanced Index (55%S&P500/45% BBUSAgg) 14.32 14.20 21.03 (2.12) 13.29
H2 USD (Gross)* 17.66 14.74** 22.36** 0.96** 18.73**Balanced Index (55%S&P500/45% BBUSAgg) + 1.50% 16.04 15.92 22.85 (0.64) 14.98
. . . . .
Class H2 USD is disclosed as it is the representative share class.
* The representative share class has changed from the A2 USD to the H2 USD share class with effect from August 2021.
** Historical figures are based on the A2 USD share class.
Performance target: To outperform the ‘Balanced’ Index (55% S&P 500 + 45% Bloomberg Barclays US Aggregate Bond) by 1.5% per annum, before the deduction of charges, over any 5 year period.
The Total Expense Ratio includes fees payable to Distributors. Where the Total Expense Ratio exceeds the target outperformance relative to the benchmark the return is likely to be below the benchmark return, even when the Fund’s outperformance target (before the deduction of charges) has been achieved.
Please note the Gross Returns 5 year annualised table is only applicable for share classes which have been active for 5 or more years and the performance target is to be achieved over a specific annualised time period. Performance target and index shown in USD.
Past performance does not guarantee future returns. The rates of return will vary and the principal value of an investment will fluctuate. Shares, if redeemed, may be worth more or less than their original cost. The performance data does not take account of the commissions and costs incurred on the issue and redemption of Shares. All returns are calculated in the base currency of the representative Share Class.
There is no guarantee that the Fund’s performance will match or exceed the benchmark.
DocuSign Envelope ID: 521655BF-9BE3-47DC-A9A3-494932954338

37Janus Henderson Capital Funds plc / 31 December 2021
Janus Henderson Balanced Fund (continued)
Statements of Changes in Composition of Portfolio (unaudited)The tables below show a breakdown of material purchases and sales of the Investment Portfolio in accordance with Central Bank UCITS Regulations 79(2) requirements. All purchases and sales of investments exceeding 1% of the total value of each transaction respectively, are disclosed, with a minimum number of 20 of each such transaction. A full analysis of the movement on the Investment Portfolio is available upon request from the registered office.
Major Purchases for the year ended 31 December 2021
Shares or Principal Amount
Cost (USD)
Credit Agricole Corporate And Investment Bank, 0.0000%, due 24/11/21 428,300,000 428,299,405Credit Agricole Corporate And Investment Bank, 0.0000%, due 23/11/21 423,400,000 423,399,412Credit Agricole Corporate And Investment Bank, 0.0000%, due 22/11/21 416,300,000 416,298,265Credit Agricole Corporate And Investment Bank, 0.0000%, due 8/12/21 415,800,000 415,799,422Credit Agricole Corporate And Investment Bank, 0.0000%, due 16/12/21 415,600,000 415,599,423Credit Agricole Corporate And Investment Bank, 0.0000%, due 7/12/21 415,200,000 415,199,423Credit Agricole Corporate And Investment Bank, 0.0000%, due 19/11/21 413,400,000 413,399,426Credit Agricole Corporate And Investment Bank, 0.0000%, due 9/12/21 407,200,000 407,199,434Credit Agricole Corporate And Investment Bank, 0.0000%, due 13/12/21 405,700,000 405,698,310Credit Agricole Corporate And Investment Bank, 0.0000%, due 12/11/21 405,500,000 405,498,874Credit Agricole Corporate And Investment Bank, 0.0000%, due 20/12/21 405,000,000 404,998,312Credit Agricole Corporate And Investment Bank, 0.0000%, due 15/12/21 402,400,000 402,399,441Credit Agricole Corporate And Investment Bank, 0.0000%, due 17/11/21 400,100,000 400,099,444Credit Agricole Corporate And Investment Bank, 0.0000%, due 15/11/21 400,100,000 400,098,333Credit Agricole Corporate And Investment Bank, 0.0000%, due 17/12/21 398,400,000 398,399,447Credit Agricole Corporate And Investment Bank, 0.0000%, due 18/11/21 397,500,000 397,499,448Credit Agricole Corporate And Investment Bank, 0.0000%, due 10/12/21 396,900,000 396,899,449Credit Agricole Corporate And Investment Bank, 0.0000%, due 9/11/21 396,700,000 396,699,449Credit Agricole Corporate And Investment Bank, 0.0000%, due 16/11/21 394,800,000 394,799,452Credit Agricole Corporate And Investment Bank, 0.0000%, due 10/11/21 394,400,000 394,399,452
Major Sales for the year ended 31 December 2021
Shares or Principal Amount
Proceeds (USD)
UMBS, 2.5000%, due 15/12/51 191,618,443 196,088,730US Treasury, 1.2500%, due 15/8/31 179,874,000 174,562,773US Treasury, 1.1250%, due 28/2/22 156,169,000 157,649,103UMBS, 2.5000%, due 25/1/52 153,081,546 157,530,246UMBS, 2.0000%, due 25/3/52 142,642,510 143,502,428US Treasury, 0.8750%, due 15/11/30 140,813,500 134,097,744UMBS, 2.5000%, due 25/11/51 126,273,580 129,684,528US Treasury, 1.1250%, due 15/2/31 125,697,200 120,331,073UMBS, 2.5000%, due 25/10/51 111,269,462 114,494,538US Treasury, 0.6250%, due 15/4/23 97,095,000 111,243,096US Treasury, 1.6250%, due 15/5/31 102,657,000 105,095,049UMBS, 2.5000%, due 25/9/51 91,659,718 95,118,771US Treasury, 1.3800%, due 15/11/31 90,715,400 89,746,579US Treasury, 0.3750%, due 30/11/25 88,668,000 88,323,405UMBS, 2.5000%, due 25/7/51 83,361,573 86,428,685GNMA II, 2.0000%, due 15/9/51 75,545,660 77,294,129US Treasury, 0.1300%, due 28/2/23 74,622,000 74,528,611UMBS, 2.0000%, due 25/5/52 70,117,776 70,617,207UMBS, 2.5000%, due 25/8/51 66,886,068 69,555,452UMBS, 2.0000%, due 25/2/52 64,998,760 66,887,780UMBS, 2.5000%, due 25/6/52 64,265,712 66,484,887US Treasury, 0.5000%, due 28/2/26 65,923,000 65,205,257
DocuSign Envelope ID: 521655BF-9BE3-47DC-A9A3-494932954338

Janus Henderson Global Adaptive Capital Appreciation Fund
Janus Henderson Capital Funds plc / 31 December 202138
The Fund ceased investment activities on 27 May 2021.
Please refer to the fund performance (unaudited) note for details on the Funds performance during the year.
DocuSign Envelope ID: 521655BF-9BE3-47DC-A9A3-494932954338

39Janus Henderson Capital Funds plc / 31 December 2021
The accompanying notes are an integral part of the financial statements.
Janus Henderson Global Adaptive Capital Appreciation Fund (continued)
Statement of Financial PositionAs of
31 December 2021
(USD)*
As of 31 December
2020 (USD)
Assets:Financial assets at fair value through profit or loss . . . . . . . . . . . . . . . . . . . . . . . . . . . . . . . . . . . . . . . . . . . . . . . . . . . . . . . – 36,466,846Cash and foreign currency . . . . . . . . . . . . . . . . . . . . . . . . . . . . . . . . . . . . . . . . . . . . . . . . . . . . . . . . . . . . . . . . . . . . . . . 51,945 717,952Margin cash . . . . . . . . . . . . . . . . . . . . . . . . . . . . . . . . . . . . . . . . . . . . . . . . . . . . . . . . . . . . . . . . . . . . . . . . . . . . . . . . . – 15,495Collateral cash . . . . . . . . . . . . . . . . . . . . . . . . . . . . . . . . . . . . . . . . . . . . . . . . . . . . . . . . . . . . . . . . . . . . . . . . . . . . . . . – 1,810,000Receivables:
Dividends . . . . . . . . . . . . . . . . . . . . . . . . . . . . . . . . . . . . . . . . . . . . . . . . . . . . . . . . . . . . . . . . . . . . . . . . . . . . . . . . . – 7,321Interest . . . . . . . . . . . . . . . . . . . . . . . . . . . . . . . . . . . . . . . . . . . . . . . . . . . . . . . . . . . . . . . . . . . . . . . . . . . . . . . . . . . – 541
Receivable from Investment Manager . . . . . . . . . . . . . . . . . . . . . . . . . . . . . . . . . . . . . . . . . . . . . . . . . . . . . . . . . . . . . . . . 23 26,222
Total Assets . . . . . . . . . . . . . . . . . . . . . . . . . . . . . . . . . . . . . . . . . . . . . . . . . . . . . . . . . . . . . . . . . . . . . . . . . 51,968 39,044,377 Liabilities (amounts falling due within one year)Payables:
Financial liabilities at fair value through profit or loss . . . . . . . . . . . . . . . . . . . . . . . . . . . . . . . . . . . . . . . . . . . . . . . . . . . . – 378,737Bank overdraft and foreign currency . . . . . . . . . . . . . . . . . . . . . . . . . . . . . . . . . . . . . . . . . . . . . . . . . . . . . . . . . . . . . . . 840 3,911Margin cash . . . . . . . . . . . . . . . . . . . . . . . . . . . . . . . . . . . . . . . . . . . . . . . . . . . . . . . . . . . . . . . . . . . . . . . . . . . . . . . – 247,946Collateral cash . . . . . . . . . . . . . . . . . . . . . . . . . . . . . . . . . . . . . . . . . . . . . . . . . . . . . . . . . . . . . . . . . . . . . . . . . . . . . . – 340,000Investments purchased . . . . . . . . . . . . . . . . . . . . . . . . . . . . . . . . . . . . . . . . . . . . . . . . . . . . . . . . . . . . . . . . . . . . . . . . – 1,684,937Investment Management fees . . . . . . . . . . . . . . . . . . . . . . . . . . . . . . . . . . . . . . . . . . . . . . . . . . . . . . . . . . . . . . . . . . . 77 1,382Shareholder Service fees . . . . . . . . . . . . . . . . . . . . . . . . . . . . . . . . . . . . . . . . . . . . . . . . . . . . . . . . . . . . . . . . . . . . . . – 1Accounting, Administration and Transfer Agent fees . . . . . . . . . . . . . . . . . . . . . . . . . . . . . . . . . . . . . . . . . . . . . . . . . . . . 9,202 –Management fees . . . . . . . . . . . . . . . . . . . . . . . . . . . . . . . . . . . . . . . . . . . . . . . . . . . . . . . . . . . . . . . . . . . . . . . . . . . (44) 685Accrued expenses . . . . . . . . . . . . . . . . . . . . . . . . . . . . . . . . . . . . . . . . . . . . . . . . . . . . . . . . . . . . . . . . . . . . . . . . . . . 41,893 40,066
Total Liabilities (excluding Net Assets attributable to holders of redeemable ordinary shares) . . . . . . . . . . . . 51,968 2,697,665 Net Assets attributable to holders of redeemable ordinary participating shares . . . . . . . . . . . . . . . . . . . . . . – 36,346,712
* The Fund ceased investment activities on 27 May 2021.
DocuSign Envelope ID: 521655BF-9BE3-47DC-A9A3-494932954338

Janus Henderson Capital Funds plc / 31 December 202140
Janus Henderson Global Adaptive Capital Appreciation Fund (continued)
The accompanying notes are an integral part of the financial statements.
Statement of Comprehensive IncomeYear ended
31 December 2021
(USD)*
Year ended 31 December
2020 (USD)
Year ended Year endedRevenue:Interest income . . . . . . . . . . . . . . . . . . . . . . . . . . . . . . . . . . . . . . . . . . . . . . . . . . . . . . . . . . . . . . . . . . . . . . . . . . . . . . . 21,464 37,170Dividend income . . . . . . . . . . . . . . . . . . . . . . . . . . . . . . . . . . . . . . . . . . . . . . . . . . . . . . . . . . . . . . . . . . . . . . . . . . . . . . 64,860 103,216Other income . . . . . . . . . . . . . . . . . . . . . . . . . . . . . . . . . . . . . . . . . . . . . . . . . . . . . . . . . . . . . . . . . . . . . . . . . . . . . . . . 4,881 15,608
Net gain on financial assets and liabilities at fair value through profit or loss . . . . . . . . . . . . . . . . . . . . . . . . . . . . . . . . . . . . . . 2,313,279 2,492,365 Total Investments Income . . . . . . . . . . . . . . . . . . . . . . . . . . . . . . . . . . . . . . . . . . . . . . . . . . . . . . . . . . . . . . . 2,404,484 2,648,359
Expenses:Investment Management fees . . . . . . . . . . . . . . . . . . . . . . . . . . . . . . . . . . . . . . . . . . . . . . . . . . . . . . . . . . . . . . . . . . . . . 6,933 19,645Shareholder Service fees . . . . . . . . . . . . . . . . . . . . . . . . . . . . . . . . . . . . . . . . . . . . . . . . . . . . . . . . . . . . . . . . . . . . . . . . 6 56Management fees . . . . . . . . . . . . . . . . . . . . . . . . . . . . . . . . . . . . . . . . . . . . . . . . . . . . . . . . . . . . . . . . . . . . . . . . . . . . . 2,664 4,044Accounting, Administration and Transfer Agent fees . . . . . . . . . . . . . . . . . . . . . . . . . . . . . . . . . . . . . . . . . . . . . . . . . . . . . . 51,292 15,118Custodian fees . . . . . . . . . . . . . . . . . . . . . . . . . . . . . . . . . . . . . . . . . . . . . . . . . . . . . . . . . . . . . . . . . . . . . . . . . . . . . . . 14,807 19,377Audit fees . . . . . . . . . . . . . . . . . . . . . . . . . . . . . . . . . . . . . . . . . . . . . . . . . . . . . . . . . . . . . . . . . . . . . . . . . . . . . . . . . . 17,316 26,927Printing expenses . . . . . . . . . . . . . . . . . . . . . . . . . . . . . . . . . . . . . . . . . . . . . . . . . . . . . . . . . . . . . . . . . . . . . . . . . . . . . 1,141 235Legal and other professional fees . . . . . . . . . . . . . . . . . . . . . . . . . . . . . . . . . . . . . . . . . . . . . . . . . . . . . . . . . . . . . . . . . . 2,901 17,624Other fees . . . . . . . . . . . . . . . . . . . . . . . . . . . . . . . . . . . . . . . . . . . . . . . . . . . . . . . . . . . . . . . . . . . . . . . . . . . . . . . . . . 17,114 17,199
Total Expenses . . . . . . . . . . . . . . . . . . . . . . . . . . . . . . . . . . . . . . . . . . . . . . . . . . . . . . . . . . . . . . . . . . . . . . . 114,174 120,225Less Expense Reimbursement . . . . . . . . . . . . . . . . . . . . . . . . . . . . . . . . . . . . . . . . . . . . . . . . . . . . . . . . . . . (104,218) (96,835)Net Expenses after Expense Reimbursement . . . . . . . . . . . . . . . . . . . . . . . . . . . . . . . . . . . . . . . . . . . . . . . . 9,956 23,390Net Operating Profit . . . . . . . . . . . . . . . . . . . . . . . . . . . . . . . . . . . . . . . . . . . . . . . . . . . . . . . . . . . . . . . . . . . 2,394,528 2,624,969
Finance Costs: – 1,000
Total distributions to holders of redeemable ordinary shares. . . . . . . . . . . . . . . . . . . . . . . . . . . . . . . . . . . . . . . . . . . . . . . . . – (393,959)Swap interest expense . . . . . . . . . . . . . . . . . . . . . . . . . . . . . . . . . . . . . . . . . . . . . . . . . . . . . . . . . . . . . . . . . . . . . . . . . . – (131)
Withholding tax on dividends and other investment income . . . . . . . . . . . . . . . . . . . . . . . . . . . . . . . . . . . . . (17,987) (28,417)
Net Increase in Net Assets attributable to holders of redeemable ordinary shares resulting from operations . 2,376,541 2,202,462
. .
. .. . .
Statement of Changes in Net Assets Attributable to Redeemable Ordinary ShareholdersYear ended
31 December 2021
(USD)*
Year ended 31 December
2020 (USD)
Increase in Net Assets attributable to holders of redeemable ordinary shares resulting from operations . . . . . . . . . . . . . . . . . . . . 2,376,541 2,202,462
Capital Share Transactions of redeemable ordinary shares:Proceeds from redeemable ordinary shares sold . . . . . . . . . . . . . . . . . . . . . . . . . . . . . . . . . . . . . . . . . . . . . . . . . . . . . . . – 41Redemption of redeemable ordinary shares . . . . . . . . . . . . . . . . . . . . . . . . . . . . . . . . . . . . . . . . . . . . . . . . . . . . . . . . . . (38,735,236) (10,450)Dilution Adjustment. . . . . . . . . . . . . . . . . . . . . . . . . . . . . . . . . . . . . . . . . . . . . . . . . . . . . . . . . . . . . . . . . . . . . . . . . . . 11,983 –
Net (Decrease) from Capital Share Transactions of redeemable ordinary shares . . . . . . . . . . . . . . . . . . . . . . (38,723,253) (10,409)
Net (Decrease)/Increase in Net Assets attributable to holders of redeemable ordinary shares . . . . . . . . . . . . . . . . . . . . . . . . . . . (36,346,712) 2,192,053Net Assets attributable to holders of redeemable ordinary shares at the beginning of the financial year . . . . . . . . . . . . . . . . . . . . 36,346,712 34,154,659
Net Assets attributable to holders of redeemable ordinary shares at the end of the financial year . . . . . . . . . – 36,346,712
* The Fund ceased investment activities on 27 May 2021.
Gains and losses are solely from continuing operations except for the Funds which ceased operations during the financial year ended 31 December 2021 or 31 December 2020. There were no gains and losses other than those dealt with in the Statement of Comprehensive Income. Please refer to note 1 which details the Fund closures during the year.
DocuSign Envelope ID: 521655BF-9BE3-47DC-A9A3-494932954338

41Janus Henderson Capital Funds plc / 31 December 2021
The accompanying notes are an integral part of the financial statements.
Janus Henderson Global Adaptive Capital Appreciation Fund (continued)
Fair Value Hierarchy
The Fund ceased operations on 27 May 2021. There were no investments held by the Fund at 31 December 2021. The table below provides the fair value hierarchy summary of the Fund’s financial assets and liabilities measured at fair value at 31 December 2020.
31 December 2020
Level 1 - Quoted Prices
(USD)
Level 2 - Other Significant
Observable Inputs (USD)
Level 3 - Significant
Unobservable Inputs (USD)
Total (USD)
Commercial Papers – 2,098,964 – 2,098,964Common Stock 13,885,017 – – 13,885,017Credit Default Swaps – 29,434 – 29,434Exchange Traded Fund – 2,886,3391 – 2,886,339Forward Currency Contracts – (78,962) – (78,962)Futures 232,218 – – 232,218Government Obligations – 15,118,911 – 15,118,911Mortgage-Backed Securities – 1,686,669 – 1,686,669Options Purchased – 385,959 – 385,959Options Written – (156,440) – (156,440)Total Investments in Securities 14,117,235 21,970,874 – 36,088,109
1At 31 December 2020 the administrator used a systematic fair valuation model provided by an independent third party to value listed securities in order to adjust for stale pricing between the close of foreign exchanges and the valuation point. This resulted in a decrease of USD 440 to exchange traded funds with a fair value of USD 2,886,339.
There were transfers on Government Obligations from level 1 to level 2 during the financial year ended 31 December 2020.
There were no investments held by the Fund at 31 December 2020 that were fair valued at level 3 by the Janus Henderson Global Pricing Committee.
Valuation policy of private placements is referenced in note 2 of the financial statements.
Capital Share Transactions
For the financial year ended 31 December 2021
A2 USD I2 USD Z1 USDShares Shares Shares
At beginning of the year . . . . . . . 300 199,700 299,612Shares issued – – –Shares redeemed. . . . . . . . . . . (300) (199,700) (299,612)At end of year . . . . . . . . . . . . . – – –
For the financial year ended 31 December 2020
A2 USD I2 USD Z1 USDShares Shares Shares
At beginning of the year . . . . . . . 1,300 199,700 299,612Shares issued – – –Shares redeemed. . . . . . . . . . . (1,000) – –At end of year . . . . . . . . . . . . . 300 199,700 299,612
DocuSign Envelope ID: 521655BF-9BE3-47DC-A9A3-494932954338

Janus Henderson Capital Funds plc / 31 December 202142
Janus Henderson Global Adaptive Capital Appreciation Fund (continued)
The accompanying notes are an integral part of the financial statements.
Net Asset Comparison
31 December 2021 31 December 2020 31 December 2019
Net Assets (USD)
NAV Per Share
(Local Currency)Net Assets
(USD)
NAV Per Share
(Local Currency)Net Assets
(USD)
NAV Per Share
(Local Currency)
A2 USD – – 3,422 11 .41 13,998 10 .77
I2 USD – – 2,758,973 13 .82 2,586,509 12 .95
Z1 USD – – 33,584,317 112 .09 31,554,152 105 .32. . .
Fund Performance (unaudited)
As at 31 December 2021
Discrete performance
31/12/2020 27/05/2021
%
31/12/2019 31/12/2020
%
31/12/2018 31/12/2019
%
03/04/2018 31/12/2018
%
A2 USD (Net) 7.63 5.85 14.57 –*60% MSCI ACWI NR / 40% Bloomberg Barclays Global Agg 5.15 14.05 18.55 –*
A2 USD (Gross) 8.21 7.59 16.45 –*60% MSCI ACWI NR / 40% Bloomberg Barclays Global Agg + 1.00% 5.66 15.19 19.74 –*
. . . .
*The Fund had launched on 3 April 2018, hence no performance numbers disclosed.
Class A2 USD is disclosed as it is the representative share class.
Performance target: To outperform the composite benchmark comprising 60% MSCI All Country World Index (ACWI) + 40% Bloomberg Barclays BB Global Aggregate Bond Index by 1% per annum, before the deduction of charges, over any 5 year period.
Past performance does not guarantee future returns. The rates of return will vary and the principal value of an investment will fluctuate. Shares, if redeemed, may be worth more or less than their original cost. The performance data does not take account of the commissions and costs incurred on the issue and redemption of Shares. All returns are calculated in the base currency of the representative Share Class.
There is no guarantee that the Fund’s performance will match or exceed the benchmark.
DocuSign Envelope ID: 521655BF-9BE3-47DC-A9A3-494932954338

43Janus Henderson Capital Funds plc / 31 December 2021
Janus Henderson Global Adaptive Capital Appreciation Fund (continued)
Statements of Changes in Composition of Portfolio (unaudited)The tables below show a breakdown of material purchases and sales of the Investment Portfolio in accordance with Central Bank UCITS Regulations 79(2) requirements. All purchases and sales of investments exceeding 1% of the total value of each transaction respectively, are disclosed, with a minimum number of 20 of each such transaction. A full analysis of the movement on the Investment Portfolio is available upon request from the registered office.
Major Purchases for the year ended 31 December 2021
Shares or Principal Amount
Cost (USD)
Credit Agricole Corporate And Investment Bank, 0.0000%, due 16/3/21 3,600,000 3,599,994Credit Agricole Corporate And Investment Bank, 0.0000%, due 30/3/21 3,500,000 3,499,995Credit Agricole Corporate And Investment Bank, 0.0000%, due 5/4/21 3,500,000 3,499,981Credit Agricole Corporate And Investment Bank, 0.0000%, due 11/2/21 2,400,000 2,399,996Credit Agricole Corporate And Investment Bank, 0.0000%, due 23/2/21 2,400,000 2,399,996Credit Agricole Corporate And Investment Bank, 0.0000%, due 22/1/21 2,000,000 1,999,996Credit Agricole Corporate And Investment Bank, 0.0000%, due 10/3/21 1,900,000 1,899,997Credit Agricole Corporate And Investment Bank, 0.0000%, due 11/3/21 1,900,000 1,899,997Credit Agricole Corporate And Investment Bank, 0.0000%, due 13/4/21 1,900,000 1,899,997Credit Agricole Corporate And Investment Bank, 0.0000%, due 17/3/21 1,900,000 1,899,997Credit Agricole Corporate And Investment Bank, 0.0000%, due 18/3/21 1,900,000 1,899,997Credit Agricole Corporate And Investment Bank, 0.0000%, due 19/3/21 1,900,000 1,899,997Credit Agricole Corporate And Investment Bank, 0.0000%, due 23/3/21 1,900,000 1,899,997Credit Agricole Corporate And Investment Bank, 0.0000%, due 3/3/21 1,900,000 1,899,997Credit Agricole Corporate And Investment Bank, 0.0000%, due 8/4/21 1,900,000 1,899,997Credit Agricole Corporate And Investment Bank, 0.0000%, due 9/4/21 1,900,000 1,899,997Credit Agricole Corporate And Investment Bank, 0.0000%, due 12/4/21 1,900,000 1,899,992Credit Agricole Corporate And Investment Bank, 0.0000%, due 22/3/21 1,900,000 1,899,992Credit Agricole Corporate And Investment Bank, 0.0000%, due 8/2/21 1,900,000 1,899,990Energy Transfer LP, 0.0000%, due 7/4/21 1,900,000 1,899,979
Major Sales for the year ended 31 December 2021
Shares or Principal Amount
Proceeds (USD)
Mexico Cetes, 0.0000%, due 28/1/21 74,683,500 3,745,932Italy Buoni Ordinari del Tesoro BOT, 0.0000%, due 29/1/21 2,476,000 3,012,714iShares USD Corp. Bond ETF 'A' 410,430 2,582,332Romulus Funding Corp., 0.0000%, due 19/4/21 1,900,000 1,899,842Crown Castle International Corp., 0.0000%, due 21/4/21 1,900,000 1,899,791Canadian Natural Resources Ltd., 0.0000%, due 26/4/21 1,900,000 1,899,686Centennial Energy Holdings, Inc., 0.0000%, due 20/5/21 1,900,000 1,899,416General Motors Financial Co., Inc., 0.0000%, due 12/5/21 1,900,000 1,899,388Cabot Corp., 0.0000%, due 29/4/21 1,850,000 1,849,723Walgreens Boots Alliance, Inc., 0.0000%, due 18/5/21 1,850,000 1,849,519Exelon Generation Co. LLC, 0.0000%, due 10/5/21 1,850,000 1,849,203Las Vegas Sands Corp. 29,994 1,722,322UMBS, 5.0000%, due 25/5/52 1,348,000 1,494,200UMBS, 5.0000%, due 25/2/52 1,348,000 1,492,462UMBS, 3.5000%, due 25/2/52 1,200,000 1,278,375UMBS, 3.5000%, due 25/3/52 1,200,000 1,273,359UMBS, 3.5000%, due 25/5/52 1,200,000 1,271,203UMBS, 3.5000%, due 25/1/52 1,200,000 1,268,086JPMorgan Chase & Co. 6,876 1,037,391Morgan Stanley 9,517 766,318
DocuSign Envelope ID: 521655BF-9BE3-47DC-A9A3-494932954338

Janus Henderson Global Adaptive Capital Preservation Fund
Janus Henderson Capital Funds plc / 31 December 202144
Fund Overview (unaudited)Investment Objective and Policy
The Fund aims to provide positive, consistent returns (although not guaranteed) above those that would be earned on cash deposits investments. The Fund seeks to provide long-term positive returns through various market environments.
Performance target: To outperform the Bloomberg Barclays 1 month US Treasury Bill Index by 1% per annum, before the deduction of charges, over any 5 year period.
The Fund invests in a globally diverse portfolio of company shares (also known as equities) and equity-related investments, bonds of any type, cash and money market instruments. The Fund may gain its exposure to these assets either directly, via other funds (collective investment schemes, including exchange traded funds), and investment trusts/companies, or by using derivatives (complex financial instruments). The investment manager has flexibility to shift allocations between different asset classes and may invest up to 100% of its assets in any of these classes, depending on prevailing market conditions. The Fund has no specific geographical or industrial focus and may invest in developing countries.
The investment manager may use derivatives (complex financial instruments), including total return swaps, with the aim of making investment gains in line with the Fund’s objective, to reduce risk or to manage the Fund more efficiently.
The Fund is actively managed with reference to the Bloomberg Barclays 1 month US Treasury Bill Index, as this forms the basis of the Fund’s performance target. The investment manager has a high degree of freedom to choose individual investments for the Fund.
How Sustainability Risks are part of the investment processThe investments underlying this financial product (referred to as the Fund) do not take into account the EU criteria for environmentally sustainable economic activities, although the Manager and the Investment Manager have agreed a decision making process that will apply to investment decisions relating to the Fund as further detailed in the Prospectus.
The likely impacts of sustainability risks on the returns of the FundWhile the analysis of (Environmental, Social and Governance) ESG factors is an integral component across the Investment Manager’s investment capabilities and one of a number of inputs to the selection of investments and portfolio construction, the investment process of the Investment Manager is primarily designed to maximise long-term risk-adjusted returns for investors. Therefore, in managing the Fund, the Investment Manager does not maximise portfolio alignment with sustainability risks as a
separate goal in its own right nor does it precisely attribute the impact of ESG factors on returns for the Fund.
Fund Overview
Ashwin Alankar, portfolio manager
For the year ended 31 December 2021, the Janus Henderson Global Adaptive Capital Preservation Fund Class I2 US dollar terms returned 1.98% (net) and 2.74% (gross) compared with 0.04% and 1.04% Target (Gross) for its benchmark, the Bloomberg 1 Month US Treasury Bill Index.
Riskier assets rallied in 2021 while global treasuries lost ground. Early in the year, the market positioned itself for economic reopening as large-scale vaccination efforts against COVID-19 were deployed. This led to a sell-off in mid-dated government bonds in countries such as Australia and New Zealand, where investors deduced that the plan to stick with highly accommodative policy was not suited for improving economic conditions. Later in the year, government bonds slipped again as inflationary pressure built up across a host of countries, including the US. Meanwhile, equities rallied, led by US and growth stocks. Other developed markets finished in positive territory, but that was not the case for emerging markets. With their sensitivity to interest rates, investment-grade corporate credits lost ground while high-yield issuers generated positive returns.
Consistent with the views based upon options-market signals, the theme that we expect to continue to unfold in the medium term is a shift to tighter monetary policy. Our view is inflation is not only here but here to stay. And without increasing the cost of capital, inflation can heat up very quickly. Hence, we believe the US Federal Reserve (Fed) and other central banks need to respond proactively to prevent prices from rising too fast and eroding purchasing power. The eurodollar and Fed futures markets both anticipate at least three rate hikes in the US in 2022.
We believe that this regime shift will not only directly pose challenges to the performance of fixed income markets but also to equities. This is the case because equity benchmarks have near-record exposure to growth names, especially the so-called FANG (Meta, formerly Facebook; Amazon; Netflix; and Alphabet) stocks. Accordingly, equity ‘duration’ is near record levels as growth stocks, in theory, are longer duration assets than value stocks and, thus, support higher earnings multiples.
We believe investors should be wary of holding longer-duration assets (both in fixed income and with growth stocks). At the same time, we realize that ‘good’ inflation, driven by increased demand, can benefit equities as wage increases allow companies to pass higher costs along and maintain sufficient margins. This type of inflation is unlikely to lead to a sharp slowdown in economic activity or a sell-off
DocuSign Envelope ID: 521655BF-9BE3-47DC-A9A3-494932954338

45Janus Henderson Capital Funds plc / 31 December 2021
Janus Henderson Global Adaptive Capital Preservation Fund (continued)
Fund Overview (unaudited) (continued)
in equities. We must recognize, however, that the economy and equities will be pressured as the cost of capital increases due to monetary tightening.
Thank you for investing in Janus Henderson Global Adaptive Capital Preservation Fund.
January 2022
DocuSign Envelope ID: 521655BF-9BE3-47DC-A9A3-494932954338

Janus Henderson Capital Funds plc / 31 December 202146
The accompanying notes are an integral part of the financial statements.
Janus Henderson Global Adaptive Capital Preservation Fund (continued)s
Statement of Financial PositionAs of
31 December 2021
(USD)
As of 31 December
2020 (USD)
Assets:Financial assets at fair value through profit or loss . . . . . . . . . . . . . . . . . . . . . . . . . . . . . . . . . . . . . . . . . . . . . . . . . . . . . . . 2,911,217 575,366Cash and foreign currency . . . . . . . . . . . . . . . . . . . . . . . . . . . . . . . . . . . . . . . . . . . . . . . . . . . . . . . . . . . . . . . . . . . . . . . 194,309 64,448Margin cash . . . . . . . . . . . . . . . . . . . . . . . . . . . . . . . . . . . . . . . . . . . . . . . . . . . . . . . . . . . . . . . . . . . . . . . . . . . . . . . . . 5,952 1,453Collateral cash . . . . . . . . . . . . . . . . . . . . . . . . . . . . . . . . . . . . . . . . . . . . . . . . . . . . . . . . . . . . . . . . . . . . . . . . . . . . . . . 20,000 20,000Receivables:
Dividends . . . . . . . . . . . . . . . . . . . . . . . . . . . . . . . . . . . . . . . . . . . . . . . . . . . . . . . . . . . . . . . . . . . . . . . . . . . . . . . . . 57 4Interest . . . . . . . . . . . . . . . . . . . . . . . . . . . . . . . . . . . . . . . . . . . . . . . . . . . . . . . . . . . . . . . . . . . . . . . . . . . . . . . . . . . 503 –
Receivable from Investment Manager . . . . . . . . . . . . . . . . . . . . . . . . . . . . . . . . . . . . . . . . . . . . . . . . . . . . . . . . . . . . . . . . 3,808 11,824Other debtors . . . . . . . . . . . . . . . . . . . . . . . . . . . . . . . . . . . . . . . . . . . . . . . . . . . . . . . . . . . . . . . . . . . . . . . . . . . . . . . . 86 89
Total Assets . . . . . . . . . . . . . . . . . . . . . . . . . . . . . . . . . . . . . . . . . . . . . . . . . . . . . . . . . . . . . . . . . . . . . . . . . 3,135,932 673,184 Liabilities (amounts falling due within one year)Payables:
Financial liabilities at fair value through profit or loss . . . . . . . . . . . . . . . . . . . . . . . . . . . . . . . . . . . . . . . . . . . . . . . . . . . . 7,830 3,004Margin cash . . . . . . . . . . . . . . . . . . . . . . . . . . . . . . . . . . . . . . . . . . . . . . . . . . . . . . . . . . . . . . . . . . . . . . . . . . . . . . . – 53Investment Management fees . . . . . . . . . . . . . . . . . . . . . . . . . . . . . . . . . . . . . . . . . . . . . . . . . . . . . . . . . . . . . . . . . . . 3,362 3,384Accounting, Administration and Transfer Agent fees . . . . . . . . . . . . . . . . . . . . . . . . . . . . . . . . . . . . . . . . . . . . . . . . . . . . 8,479 847Management fees . . . . . . . . . . . . . . . . . . . . . . . . . . . . . . . . . . . . . . . . . . . . . . . . . . . . . . . . . . . . . . . . . . . . . . . . . . . 61 12Accrued expenses . . . . . . . . . . . . . . . . . . . . . . . . . . . . . . . . . . . . . . . . . . . . . . . . . . . . . . . . . . . . . . . . . . . . . . . . . . . 47,265 39,265
Total Liabilities (excluding Net Assets attributable to holders of redeemable ordinary shares) . . . . . . . . . . . . 66,997 46,565 Net Assets attributable to holders of redeemable ordinary participating shares . . . . . . . . . . . . . . . . . . . . . . 3,068,935 626,619
DocuSign Envelope ID: 521655BF-9BE3-47DC-A9A3-494932954338

47Janus Henderson Capital Funds plc / 31 December 2021
Janus Henderson Global Adaptive Capital Preservation Fund (continued)
The accompanying notes are an integral part of the financial statements.
Statement of Comprehensive IncomeYear ended
31 December 2021
(USD)
Year ended 31 December
2020 (USD)
Year ended Year endedRevenue:Interest income . . . . . . . . . . . . . . . . . . . . . . . . . . . . . . . . . . . . . . . . . . . . . . . . . . . . . . . . . . . . . . . . . . . . . . . . . . . . . . . 2,092 1,083Dividend income . . . . . . . . . . . . . . . . . . . . . . . . . . . . . . . . . . . . . . . . . . . . . . . . . . . . . . . . . . . . . . . . . . . . . . . . . . . . . . 7,991 139Other income . . . . . . . . . . . . . . . . . . . . . . . . . . . . . . . . . . . . . . . . . . . . . . . . . . . . . . . . . . . . . . . . . . . . . . . . . . . . . . . . 1,541 2,238
Net gain/(loss) on financial assets and liabilities at fair value through profit or loss . . . . . . . . . . . . . . . . . . . . . . . . . . . . . . . . . . 31,099 (671,336) Total Investments Income/(Loss) . . . . . . . . . . . . . . . . . . . . . . . . . . . . . . . . . . . . . . . . . . . . . . . . . . . . . . . . . . 42,723 (667,876)
Expenses:Investment Management fees . . . . . . . . . . . . . . . . . . . . . . . . . . . . . . . . . . . . . . . . . . . . . . . . . . . . . . . . . . . . . . . . . . . . . 15 3,375Management fees . . . . . . . . . . . . . . . . . . . . . . . . . . . . . . . . . . . . . . . . . . . . . . . . . . . . . . . . . . . . . . . . . . . . . . . . . . . . . 554 73Accounting, Administration and Transfer Agent fees . . . . . . . . . . . . . . . . . . . . . . . . . . . . . . . . . . . . . . . . . . . . . . . . . . . . . . 44,317 9,750Custodian fees . . . . . . . . . . . . . . . . . . . . . . . . . . . . . . . . . . . . . . . . . . . . . . . . . . . . . . . . . . . . . . . . . . . . . . . . . . . . . . . 13,615 17,737Audit fees . . . . . . . . . . . . . . . . . . . . . . . . . . . . . . . . . . . . . . . . . . . . . . . . . . . . . . . . . . . . . . . . . . . . . . . . . . . . . . . . . . 19,370 33,028Printing expenses . . . . . . . . . . . . . . . . . . . . . . . . . . . . . . . . . . . . . . . . . . . . . . . . . . . . . . . . . . . . . . . . . . . . . . . . . . . . . 1,208 1,113Legal and other professional fees . . . . . . . . . . . . . . . . . . . . . . . . . . . . . . . . . . . . . . . . . . . . . . . . . . . . . . . . . . . . . . . . . . (2,110) 8,930Other fees . . . . . . . . . . . . . . . . . . . . . . . . . . . . . . . . . . . . . . . . . . . . . . . . . . . . . . . . . . . . . . . . . . . . . . . . . . . . . . . . . . 24,112 13,928
Total Expenses . . . . . . . . . . . . . . . . . . . . . . . . . . . . . . . . . . . . . . . . . . . . . . . . . . . . . . . . . . . . . . . . . . . . . . . 101,081 87,934Less Expense Reimbursement . . . . . . . . . . . . . . . . . . . . . . . . . . . . . . . . . . . . . . . . . . . . . . . . . . . . . . . . . . . (101,074) (88,484)Net Expenses after Expense Reimbursement . . . . . . . . . . . . . . . . . . . . . . . . . . . . . . . . . . . . . . . . . . . . . . . . 7 (550)Net Operating Profit/(Loss) . . . . . . . . . . . . . . . . . . . . . . . . . . . . . . . . . . . . . . . . . . . . . . . . . . . . . . . . . . . . . . 42,716 (667,326)
Withholding tax on dividends and other investment income . . . . . . . . . . . . . . . . . . . . . . . . . . . . . . . . . . . . . (400) (42)
Net Increase/(Decrease) in Net Assets attributable to holders of redeemable ordinary shares resulting from operations . . . . . . . . . . . . . . . . . . . . . . . . . . . . . . . . . . . . . . . . . . . . . . . . . . . . . . . . . . . . . . . . . . . . . . . . . . . 42,316 (667,368)
. .
. .. . .
Statement of Changes in Net Assets Attributable to Redeemable Ordinary ShareholdersYear ended
31 December 2021
(USD)
Year ended 31 December
2020 (USD)
Increase/(Decrease) in Net Assets attributable to holders of redeemable ordinary shares resulting from operations . . . . . . . . . . . . 42,316 (667,368)
Capital Share Transactions of redeemable ordinary shares:Proceeds from redeemable ordinary shares sold . . . . . . . . . . . . . . . . . . . . . . . . . . . . . . . . . . . . . . . . . . . . . . . . . . . . . . . 2,400,000 –Redemption of redeemable ordinary shares . . . . . . . . . . . . . . . . . . . . . . . . . . . . . . . . . . . . . . . . . . . . . . . . . . . . . . . . . . – (26,522,998)
Net Increase/(Decrease) from Capital Share Transactions of redeemable ordinary shares . . . . . . . . . . . . . . 2,400,000 (26,522,998)
Net Increase/(Decrease) in Net Assets attributable to holders of redeemable ordinary shares . . . . . . . . . . . . . . . . . . . . . . . . . . . 2,442,316 (27,190,366)Net Assets attributable to holders of redeemable ordinary shares at the beginning of the financial year . . . . . . . . . . . . . . . . . . . . 626,619 27,816,985
Net Assets attributable to holders of redeemable ordinary shares at the end of the financial year . . . . . . . . . 3,068,935 626,619
Gains and losses are solely from continuing operations except for the Funds which ceased operations during the financial year ended 31 December 2021 or 31 December 2020. There were no gains and losses other than those dealt with in the Statement of Comprehensive Income. Please refer to note 1 which details the Fund closures during the year.
DocuSign Envelope ID: 521655BF-9BE3-47DC-A9A3-494932954338

Janus Henderson Capital Funds plc / 31 December 202148
Janus Henderson Global Adaptive Capital Preservation Fund (continued)
Portfolio Investments
The accompanying notes are an integral part of the financial statements.
Shares or Principal Amount
Percentage of Net Assets
(%)Fair Value
(USD)
Financial Assets at fair value through profit or lossCommercial Papers (2020: 0.00% USD –)CanadaWireless Telecommunication Services
250,000 Rogers Communications, Inc., due 7/1/22 8.15 249,992
Total Commercial Papers 8.15 249,992
Common Stock (2020: 6.15% USD 38,520)BermudaHotels, Restaurants & Leisure
173 Norwegian Cruise Line Holdings Ltd. 0.12 3,588
CanadaBanks
12 Bank of Montreal 0.04 1,29310 Bank of Nova Scotia (The) 0.02 7176 Canadian Imperial Bank of Commerce 0.02 699
0.08 2,709
Chemicals19 Nutrien Ltd. 0.05 1,429
Metals & Mining71 Barrick Gold Corp. 0.05 1,349
222 Kinross Gold Corp. 0.04 1,2900.09 2,639
Cayman IslandsEntertainment
322 Sea Ltd. 2.35 72,035
Internet & Direct Marketing Retail710 Alibaba Group Holding Ltd. 2.75 84,341
IndiaBanks
35 ICICI Bank Ltd. 0.02 693
IrelandBiotechnology
13 Horizon Therapeutics plc 0.05 1,401
Health Care Equipment & Supplies6 Medtronic plc 0.02 621
Insurance2 Aon plc, A 0.02 601
PanamaHotels, Restaurants & Leisure
106 Carnival Corp. 0.07 2,133
SwitzerlandCapital Markets
133 Credit Suisse Group AG 0.04 1,28236 UBS Group AG 0.02 643
0.06 1,925
TaiwanSemiconductors & Semiconductor Equipment
5 Taiwan Semiconductor Manufacturing Co. Ltd. 0.02 602
53 United Microelectronics Corp. 0.02 6200.04 1,222
United KingdomBanks
45 HSBC Holdings plc 0.05 1,357
Shares or Principal Amount
Percentage of Net Assets
(%)Fair Value
(USD)
Multi-Utilities
19 National Grid plc 0.05 1,374
Personal Products12 Unilever plc 0.02 645
Pharmaceuticals12 AstraZeneca plc 0.02 69916 Royalty Pharma plc, A 0.02 638
0.04 1,337
United StatesAerospace & Defense
4 Huntington Ingalls Industries, Inc. 0.03 7472 Lockheed Martin Corp. 0.02 7112 Northrop Grumman Corp. 0.03 7748 Raytheon Technologies Corp. 0.02 688
0.10 2,920
Airlines53 Delta Air Lines, Inc. 0.07 2,071
Automobiles71 General Motors Co. 0.14 4,163
Banks4 JPMorgan Chase & Co. 0.02 633
28 KeyCorp 0.02 64811 US Bancorp 0.02 618
114 Wells Fargo & Co. 0.18 5,4700.24 7,369
Beverages12 Coca-Cola Co. (The) 0.02 7114 PepsiCo, Inc. 0.02 695
0.04 1,406
Biotechnology6 Amgen, Inc. 0.05 1,3503 United Therapeutics Corp. 0.02 6483 Vertex Pharmaceuticals, Inc. 0.02 659
0.09 2,657
Capital Markets4 Goldman Sachs Group, Inc. (The) 0.05 1,5305 Northern Trust Corp. 0.02 5981 S&P Global, Inc. 0.02 472
0.09 2,600
Construction Materials3 Martin Marietta Materials, Inc. 0.04 1,322
Consumer Finance5 American Express Co. 0.03 818
Distributors5 Genuine Parts Co. 0.02 701
Diversified Consumer Services19 Service Corp. International 0.05 1,349
Diversified Financial Services2 Berkshire Hathaway, Inc., B 0.02 598
Diversified Telecommunication Services13 Verizon Communications, Inc. 0.02 675
Electric Utilities10 Edison International 0.02 68210 Pinnacle West Capital Corp. 0.02 70620 Xcel Energy, Inc. 0.05 1,354
0.09 2,742
DocuSign Envelope ID: 521655BF-9BE3-47DC-A9A3-494932954338

49Janus Henderson Capital Funds plc / 31 December 2021
The accompanying notes are an integral part of the financial statements.
Janus Henderson Global Adaptive Capital Preservation Fund (continued)
Portfolio Investments
Shares or Principal Amount
Percentage of Net Assets
(%)Fair Value
(USD)
Electronic Equipment, Instruments & Components
2 Zebra Technologies Corp., A 0.04 1,190
Entertainment3 Netflix, Inc. 0.06 1,8079 Walt Disney Co. (The) 0.05 1,394
76 World Wrestling Entertainment, Inc., A 0.12 3,7500.23 6,951
Equity Real Estate Investment Trusts (REITs)30 STAG Industrial, Inc. 0.05 1,439
Food & Staples Retailing5 Walmart, Inc. 0.02 723
Food Products5 J M Smucker Co. (The) 0.02 679
20 Kellogg Co. 0.04 1,28811 Mondelez International, Inc., A 0.02 729
0.08 2,696
Hotels, Restaurants & Leisure9 Caesars Entertainment, Inc. 0.03 842
13 MGM Resorts International 0.02 5830.05 1,425
Household Durables32 Hovnanian Enterprises, Inc., A 0.13 4,07311 Lennar Corp., A 0.04 1,278
0.17 5,351
Insurance12 American International Group, Inc. 0.02 6828 Arthur J Gallagher & Co. 0.05 1,357
13 Fidelity National Financial, Inc. 0.02 6780.09 2,717
Interactive Media & Services39 Alphabet, Inc., A 3.68 112,985
1 Alphabet, Inc., C 0.10 2,894386 Meta Platforms, Inc., A 4.23 129,831
2,272 Snap, Inc., A 3.48 106,85211.49 352,562
Internet & Direct Marketing Retail34 Amazon.com, Inc. 3.70 113,368
179 Wayfair, Inc., A 1.11 34,0054.81 147,373
IT Services168 Akamai Technologies, Inc. 0.64 19,663
6 Fidelity National Information Services, Inc. 0.02 655
5 International Business Machines Corp. 0.02 6683 Visa, Inc., A 0.02 650
0.70 21,636
Machinery6 Oshkosh Corp. 0.02 676
Media18 Fox Corp., A 0.02 66418 Interpublic Group of Cos., Inc. (The) 0.02 674
0.04 1,338
Metals & Mining24 Newmont Corp. 0.05 1,488
Mortgage Real Estate Investment Trusts (REITs)42 AGNC Investment Corp. 0.02 632
Shares or Principal Amount
Percentage of Net Assets
(%)Fair Value
(USD)
Multi-Utilities
7 WEC Energy Group, Inc. 0.02 679
Oil, Gas & Consumable Fuels47 Williams Cos., Inc. (The) 0.04 1,224
Pharmaceuticals11 Bristol-Myers Squibb Co. 0.02 6869 Merck & Co., Inc. 0.02 690
12 Pfizer, Inc. 0.02 7090.06 2,085
Real Estate Management & Development6 CBRE Group, Inc., A 0.02 651
Road & Rail2 Old Dominion Freight Line, Inc. 0.02 717
Semiconductors & Semiconductor Equipment13 Intel Corp. 0.02 66916 NVIDIA Corp. 0.15 4,706
0.17 5,375
Software53 Dropbox, Inc., A 0.04 1,30111 Microsoft Corp. 0.12 3,700
0.16 5,001
Technology Hardware, Storage & Peripherals94 Apple, Inc. 0.55 16,69242 Hewlett Packard Enterprise Co. 0.02 662
0.57 17,354
Water Utilities8 American Water Works Co., Inc. 0.05 1,511
Total Common Stock 25.89 794,235
Exchange Traded Funds (2020: 26.86% USD 168,334)148 Invesco EQQQ Nasdaq-100 Fund 1.94 59,637
4 Invesco EQQQ Nasdaq-100 Fund 0.05 1,60516,271 iShares Core Global Aggregate Bond
Fund 3.01 92,43623,009 iShares USD Short Duration Corp.
Bond Fund 4.21 129,25366,285 iShares USD Short Duration High Yield
Corp. Bond Fund 12.63 387,6352,922 iShares USD Treasury Bond 0-1yr Fund 9.72 298,2781,610 SPDR Russell 2000 U.S. Small Cap
Fund 3.29 100,8582,455 Vanguard FTSE All-World Fund 9.91 304,125
347 Vanguard S&P 500 Fund 1.02 31,4047,174 Vanguard USD Corporate 1-3 Year
Bond Fund 12.02 368,815Total Exchange Traded Funds 57.80 1,774,046
Government Obligations (2020: 58.79% USD 368,403)
Total Investments (Cost: USD 2,856,021) 91.84 2,818,273
Forward Currency Contracts (2020: 0.02% USD 109).Futures° (2020: 0.00% USD –)
.
Counterparty No of Contracts
Percentage of Net
Assets (%)
UnrealisedGain (USD)
Goldman Sachs (1) US 2 Year Note 0.00 77Total 0.00 77
.
DocuSign Envelope ID: 521655BF-9BE3-47DC-A9A3-494932954338

Janus Henderson Capital Funds plc / 31 December 202150
The accompanying notes are an integral part of the financial statements.
Janus Henderson Global Adaptive Capital Preservation Fund (continued)
Portfolio Investments
Total Return Swap (2020: 0.00% USD –).
Return Paid
Return Received
Percentage of Net Unrealized
by the by the Notional Maturity Assets GainCounterparty Fund Fund Amount Date (%) (USD)
Bank of America Amazon.com,
Inc.
1 month USD LIBOR plus 60
basis points 115,056 05-Jan-22 0.05 1,688
Bank of America
Alphabet, Inc.
1 month USD LIBOR plus 60
basis points 114,346 05-Jan-22 0.04 1,362
J.P. Morgan Alibaba Group Holding Ltd. 80 basis points 114,722 18-Jan-22 0.99 30,381
J.P. Morgan Sea Ltd. 80 basis points 101,240 18-Jan-22 0.95 29,205
J.P. Morgan Snap, Inc. 80 basis points 123,960 18-Jan-22 0.56 17,108
J.P. Morgan Wayfair, Inc. 80 basis points 47,127 18-Jan-22 0.43 13,123
Total 3.02 92,867
Total Financial Assets at fair value through profit or loss 94.86 2,911,217
Financial Liabilities at fair value through profit or loss.Forward Currency Contracts (2020: (0.23)% USD (1,402))
Futures° (2020: (0.25)% USD (1,602))
Counterparty No of Contracts
Percentage of Net
Assets (%)
Unrealised Loss
(USD)
Goldman Sachs (9) Micro E-mini S&P 500 Index (0.14) (4,481)Goldman Sachs (1) US 5 Year Note (0.02) (509)Total (0.16) (4,990)
.
Total Return Swap (2020: 0.00% USD–)
Return Paid
Return Received
Percentage of Net Unrealized
by the by the Notional Maturity Assets LossCounterparty Fund Fund Amount Date (%) (USD)
Bank of America Meta
Platforms, Inc.
1 month USD LIBOR plus
60 basis points 114,077 05-Jan-22 (0.05) (1,627)
J.P. Morgan Akamai Technologies,
Inc.80 basis
points 18,450 18-Jan-22 (0.04) (1,213)Total (0.09) (2,840)
Total Financial Liabilities at fair value through profit or loss (0.25) (7,830)
Portfolio Analysis (Unaudited)
Analysis of Total Assets:% of Total
AssetsTransferable securities admitted to official stock exchange listing 81.90Financial derivative instruments dealt in on a regulated market 0.00Other transferable securities of the type referred to in Regulation 68 (1) (a), (b) and (c) 7.97OTC financial derivative instruments 2.96Other Assets 7.17Total Assets 100.00
° Refer to Note 5 for details of collateral held.
DocuSign Envelope ID: 521655BF-9BE3-47DC-A9A3-494932954338

51Janus Henderson Capital Funds plc / 31 December 2021
The accompanying notes are an integral part of the financial statements.
Janus Henderson Global Adaptive Capital Preservation Fund (continued)
Fair Value Hierarchy
The tables below provide the fair value hierarchy summary of the Fund’s financial assets and liabilities measured at fair value at 31 December 2021 and 31 December 2020.
31 December 2021
Level 1 - Quoted Prices
(USD)
Level 2 - Other Significant
Observable Inputs (USD)
Level 3 - Significant
Unobservable Inputs (USD)
Total (USD)
Commercial Papers – 249,992 – 249,992Common Stock 794,235 – – 794,235Exchange Traded Funds 1,774,046 – – 1,774,046Futures (4,913) – – (4,913)Total Return Swaps – 90,027 – 90,027Total Investments in Securities 2,563,368 340,019 – 2,903,387
31 December 2020
Level 1 - Quoted Prices
(USD)
Level 2 - Other Significant
Observable Inputs (USD)
Level 3 - Significant
Unobservable Inputs (USD)
Total (USD)
Common Stock 38,520 – – 38,520Exchange Traded Funds – 168,3341 – 168,334Forward Currency Contracts – (1,293) – (1,293)Futures (1,602) – – (1,602)Government Obligations – 368,403 – 368,403Total Investments in Securities 36,918 535,444 – 572,362
1At 31 December 2020 the administrator used a systematic fair valuation model provided by an independent third party to value listed securities in order to adjust for stale pricing between the close of foreign exchanges and the valuation point. This resulted in an increase of USD 457 to exchange traded funds with a fair value of USD 168,334.
There were transfers on Exchange Traded Funds from level 2 to level 1 during the financial year ended 31 December 2021 and on Government Obligations from level 1 to level 2 during the financial year ended 31 December 2020.
There were no investments held by the Fund at 31 December 2021 and 31 December 2020 that were fair valued at level 3 by the Janus Henderson Global Pricing Committee.
Valuation policy of private placements is referenced in note 2 of the financial statements.
DocuSign Envelope ID: 521655BF-9BE3-47DC-A9A3-494932954338

Janus Henderson Capital Funds plc / 31 December 202152
Janus Henderson Global Adaptive Capital Preservation Fund (continued)
The accompanying notes are an integral part of the financial statements.
Capital Share Transactions
For the financial year ended 31 December 2021
. .I2 USD Z2 USDShares Shares
At beginning of the year . . . 300 5,724Shares issued – 21,661Shares redeemed . . . . . . . . – –At end of year . . . . . . . . . . 300 27,385
For the financial year ended 31 December 2020
I2 USD Z2 USDShares Shares
At beginning of the year . . . 300 255,195Shares issued – –Shares redeemed . . . . . . . . – (249,471)At end of year . . . . . . . . . . 300 5,724
Net Asset Comparison
31 December 2021 31 December 2020 31 December 2019
Net Assets (USD)
NAV Per Share
(Local Currency)Net Assets
(USD)
NAV Per Share
(Local Currency)Net Assets
(USD)
NAV Per Share
(Local Currency)
I2 USD 3,253 10.84 3,189 10.63 3,217 10.72Z2 USD 3,065,682 111.95 623,430 108.91 27,813,768 108.99
. . .
DocuSign Envelope ID: 521655BF-9BE3-47DC-A9A3-494932954338

53Janus Henderson Capital Funds plc / 31 December 2021
Janus Henderson Global Adaptive Capital Preservation Fund (continued)
The accompanying notes are an integral part of the financial statements.
Total Expense Ratio (unaudited)
The Average Total Expense Ratio table shows the actual expenses, excluding transactions costs and trade commissions, incurred by each Class for the Fund during the reporting financial year expressed as a percentage of the average net assets for the corresponding year, on an annualised basis.
31 December 2021 31 December 2020 31 December 2019I2 USD 0.75% 0.75% 0.73%
Fund Performance (unaudited)
As at 31 December 2021
One year Three years Five yearsSince
inception
Performance (Annualised) 31/12/2020 31/12/2021
%
31/12/2017 31/12/2021
%
31/12/2015 31/12/2021
%
to 31/12/2021
%
I2 USD (Net) 1.98 1.88 –* 1.77BB US Treasury Bellwethers: 1 Month (USD) 0.04 0.84 –* 1.04
.
Discrete performance
31/12/2020 31/12/2021
%
31/12/2019 31/12/2020
%
31/12/2018 31/12/2019
%
31/12/2017 31/12/2018
%
23/05/2017 31/12/2017
%
I2 USD (Net) 1.98 (0.84) 4.59 (0.10) –*BB US Treasury Bellwethers: 1 Month (USD) 0.04 0.42 2.07 1.71 –*
I2 USD (Gross) 2.74 (0.11) 5.35 0.64 –*BB US Treasury Bellwethers: 1 Month (USD) + 1.00% 1.04 1.42 3.09 2.74 –*
. . . . .*The fund had launched on 23 May 2017, hence no performance numbers are disclosed.
Class I2 USD is disclosed as it is the representative share class.
Performance target: To outperform the Bloomberg Barclays 1 month US Treasury bill Index by 1% per annum, before the deduction of charges, over any 5 year period.
Please note the Gross Returns 5 year annualised table is only applicable for share classes which have been active for 5 or more years and the performance target is to be achieved over a specific annualised time period. Performance target and index shown in USD.
Past performance does not guarantee future returns. The rates of return will vary and the principal value of an investment will fluctuate. Shares, if redeemed, may be worth more or less than their original cost. The performance data does not take account of the commissions and costs incurred on the issue and redemption of Shares. All returns are calculated in the base currency of the representative Share Class.
There is no guarantee that the Fund’s performance will match or exceed the benchmark.
DocuSign Envelope ID: 521655BF-9BE3-47DC-A9A3-494932954338

Janus Henderson Capital Funds plc / 31 December 202154
Janus Henderson Global Adaptive Capital Preservation Fund (continued)
Statements of Changes in Composition of Portfolio (unaudited)The tables below show a breakdown of material purchases and sales of the Investment Portfolio in accordance with Central Bank UCITS Regulations 79(2) requirements. All purchases and sales of investments exceeding 1% of the total value of each transaction respectively, are disclosed, with a minimum number of 20 of each such transaction. A full analysis of the movement on the Investment Portfolio is available upon request from the registered office.
Major Purchases for the year ended 31 December 2021
Shares or Principal Amount
Cost (USD)
Vanguard FTSE All-World Fund 3,769 443,607iShares USD Treasury Bond 0-1yr Fund 82,175 423,415iShares USD Short Duration High Yield Corp. Bond Fund 61,500 353,520Vanguard USD Corporate 1-3 Year Bond Fund 6,674 346,425Credit Agricole Corporate And Investment Bank, 0.0000%, due 23/7/21 300,000 300,000Credit Agricole Corporate And Investment Bank, 0.0000%, due 26/7/21 300,000 299,999Credit Agricole Corporate And Investment Bank, 0.0000%, due 30/6/21 300,000 299,999Credit Industriel et Commercial, 0.0000%, due 2/7/21 300,000 299,999Credit Industriel et Commercial, 0.0000%, due 20/7/21 300,000 299,999Credit Industriel et Commercial, 0.0000%, due 7/7/21 300,000 299,999Credit Agricole Corporate And Investment Bank, 0.0000%, due 19/7/21 300,000 299,998Credit Agricole Corporate And Investment Bank, 0.0000%, due 4/10/21 300,000 299,998Credit Industriel et Commercial, 0.0000%, due 6/7/21 300,000 299,997Bat International Finance plc, 0.0000%, due 25/5/21 300,000 299,928Romulus Funding Corp., 0.0000%, due 21/5/21 300,000 299,925Eni Finance USA, Inc., 0.0000%, due 9/7/21 300,000 299,840US Treasury Bill, 0.0000%, due 17/6/21 250,000 249,999Jabil, Inc., 0.0000%, due 19/11/21 250,000 249,998US Treasury Bill, 0.0000%, due 22/6/21 250,000 249,996US Treasury Bill, 0.0000%, due 10/8/21 250,000 249,992
Major Sales for the year ended 31 December 2021
Shares or Principal Amount
Proceeds (USD)
US Treasury Bill, 0.0000%, due 17/6/21 250,000 249,999US Treasury Bill, 0.0000%, due 22/6/21 250,000 249,997Vanguard FTSE All-World Fund 1,785 212,258Mexico Cetes, 0.0000%, due 28/1/21 2,975,000 149,218iShares USD Treasury Bond 0-1yr Fund 24,225 124,820iShares Core Global Aggregate Bond Fund 9,431 53,442SPDR Russell 2000 U.S. Small Cap Fund 669 40,520JPMorgan Chase & Co. 107 16,039Citigroup, Inc. 200 14,022Morgan Stanley 159 13,457World Wrestling Entertainment, Inc. 'A' 212 11,354Visa, Inc. 'A' 45 10,263Alphabet, Inc. 'C' 4 9,293Invesco EQQQ Nasdaq-100 Fund 24 8,322AMC Entertainment Holdings, Inc. 346 8,107Las Vegas Sands Corp. 150 7,279AutoZone, Inc. 5 7,152Ford Motor Co. 560 6,657Royal Caribbean Cruises Ltd. 68 5,768Toll Brothers, Inc. 95 5,655
DocuSign Envelope ID: 521655BF-9BE3-47DC-A9A3-494932954338

Janus Henderson Global Adaptive Multi-Asset Fund
55Janus Henderson Capital Funds plc / 31 December 2021
Fund Overview (unaudited)Investment Objective and Policy
The Fund aims to provide a total return, from a combination of capital growth and income over the long term.
Performance target: To outperform the composite benchmark comprising 60% MSCI All Country World Index NR + 40% Bloomberg Barclays (BB) Global Aggregate Bond Index by 1% per annum, before the deduction of charges, over any 5 year period.
The Fund invests in a globally diverse portfolio of company shares (also known as equities) and equity-related investments, bonds of any type, commodities (such as gold, oil and agricultural produce), cash and money market instruments. The Fund may gain its exposure to these assets either directly, via other funds (collective investment schemes, including exchange traded funds) and investment trusts/companies, or by using derivatives (complex financial instruments). The investment manager has flexibility to shift allocations between different asset classes and may invest up to 100% of its assets in any of these classes, depending on prevailing market conditions. The Fund has no specific geographical or industrial focus and may invest in developing countries.
The investment manager may use derivatives (complex financial instruments), including total return swaps, with the aim of making investment gains in line with the Fund's objective, to reduce risk or to manage the Fund more efficiently.
The Fund is actively managed with reference to the 60% MSCI All Country World Index NR + 40% BB Global Aggregate Bond Index, which is broadly representative of the assets in which it may invest, as this forms the basis of the Fund's performance target. The investment manager has a high degree of freedom to choose individual investments for the Fund
How Sustainability Risks are part of the investment processThe investments underlying this financial product (referred to as the Fund) do not take into account the EU criteria for environmentally sustainable economic activities, although the Manager and the Investment Manager have agreed a decision making process that will apply to investment decisions relating to the Fund as further detailed in the Prospectus.
The likely impacts of sustainability risks on the returns of the FundWhile the analysis of (Environmental, Social and Governance) ESG factors is an integral component across the Investment Manager’s investment capabilities and one of a number of inputs to the selection of investments and portfolio construction, the investment process of the Investment Manager is primarily designed to maximise long-term risk-adjusted returns for investors. Therefore,
in managing the Fund, the Investment Manager does not maximise portfolio alignment with sustainability risks as a separate goal in its own right nor does it precisely attribute the impact of ESG factors on returns for the Fund.
Fund Overview
Ashwin Alankar, portfolio manager
For the year ended 31 December 2021, the Janus Henderson Global Adaptive Multi-Asset Fund’s Class H2 US dollar terms returned 10.75% (Net) and 11.80% (Gross), compared with 8.78% and 9.86% Target (Gross) for its benchmark, an internally calculated index comprised of 60% MSCI All Country World Index and 40% Bloomberg Global Aggregate Bond Index.
Riskier assets rallied in 2021 while global treasuries lost ground. Early in the year, the market positioned itself for economic reopening as large-scale vaccination efforts against COVID-19 were deployed. This led to a sell-off in mid-dated government bonds in countries such as Australia and New Zealand, where investors deduced that the plan to stick with highly accommodative policy was not suited for improving economic conditions. Later in the year, government bonds slipped again as inflationary pressure built up across a host of countries, including the US. Meanwhile, equities rallied, led by US growth stocks. Other developed markets finished in positive territory, but that was not the case for emerging markets. With their sensitivity to interest rates, investment-grade corporate credits lost ground while high-yield issuers generated positive returns.
Consistent with the views based upon options-market signals, the theme that we expect to continue to unfold in the medium term is a shift to tighter monetary policy. Our view is inflation is not only here but here to stay. And without increasing the cost of capital, inflation can heat up very quickly. Hence, we believe the US Federal Reserve (Fed) and other central banks need to respond proactively to prevent prices from rising too fast and eroding purchasing power. The eurodollar and Fed futures markets both anticipate at least three rate hikes in the US in 2022.
We believe that this regime shift will not only directly pose challenges to the performance of fixed income markets but also to equities. This is the case because equity benchmarks have near-record exposure to growth names, especially the so-called FANG (Meta, formerly Facebook; Amazon; Netflix; and Alphabet) stocks. Accordingly, equity ‘duration’ is near record levels as growth stocks, in theory, are longer duration assets than value stocks and, thus, support higher earnings multiples.
We believe investors should be wary of holding longer-duration assets (both in fixed income and with growth stocks). At the same time, we realize that ‘good’ inflation, driven by increased demand, can benefit equities as wage increases allow companies to pass higher costs along and
DocuSign Envelope ID: 521655BF-9BE3-47DC-A9A3-494932954338

Janus Henderson Capital Funds plc / 31 December 202156
Janus Henderson Global Adaptive Multi-Asset Fund (continued)
Fund Overview (unaudited) (continued)
maintain sufficient margins. This type of inflation is unlikely to lead to a sharp slowdown in economic activity or a sell-off in equities. We must recognize, however, that the economy and equities will be pressured as the cost of capital increases due to monetary tightening.
Thank you for investing in Janus Henderson Global Adaptive Multi-Asset Fund.
January 2022
DocuSign Envelope ID: 521655BF-9BE3-47DC-A9A3-494932954338

57Janus Henderson Capital Funds plc / 31 December 2021
The accompanying notes are an integral part of the financial statements.
Janus Henderson Global Adaptive Multi-Asset Fund (continued)
s
Statement of Financial PositionAs of
31 December 2021
(USD)
As of 31 December
2020 (USD)
Assets:Financial assets at fair value through profit or loss . . . . . . . . . . . . . . . . . . . . . . . . . . . . . . . . . . . . . . . . . . . . . . . . . . . . . . . 16,470,512 13,316,954Cash and foreign currency . . . . . . . . . . . . . . . . . . . . . . . . . . . . . . . . . . . . . . . . . . . . . . . . . . . . . . . . . . . . . . . . . . . . . . . 901,573 598,719Margin cash . . . . . . . . . . . . . . . . . . . . . . . . . . . . . . . . . . . . . . . . . . . . . . . . . . . . . . . . . . . . . . . . . . . . . . . . . . . . . . . . . 24,251 33,798Collateral cash . . . . . . . . . . . . . . . . . . . . . . . . . . . . . . . . . . . . . . . . . . . . . . . . . . . . . . . . . . . . . . . . . . . . . . . . . . . . . . . 365,000 563,000Receivables:
Spot foreign exchange contracts awaiting settlement . . . . . . . . . . . . . . . . . . . . . . . . . . . . . . . . . . . . . . . . . . . . . . . . . . . . – 34Funds shares sold . . . . . . . . . . . . . . . . . . . . . . . . . . . . . . . . . . . . . . . . . . . . . . . . . . . . . . . . . . . . . . . . . . . . . . . . . . . 4,540 14,026Dividends . . . . . . . . . . . . . . . . . . . . . . . . . . . . . . . . . . . . . . . . . . . . . . . . . . . . . . . . . . . . . . . . . . . . . . . . . . . . . . . . . 3,186 3,232Interest . . . . . . . . . . . . . . . . . . . . . . . . . . . . . . . . . . . . . . . . . . . . . . . . . . . . . . . . . . . . . . . . . . . . . . . . . . . . . . . . . . . 6,549 4,884
Receivable from Investment Manager . . . . . . . . . . . . . . . . . . . . . . . . . . . . . . . . . . . . . . . . . . . . . . . . . . . . . . . . . . . . . . . . 5,024 28,630Other debtors . . . . . . . . . . . . . . . . . . . . . . . . . . . . . . . . . . . . . . . . . . . . . . . . . . . . . . . . . . . . . . . . . . . . . . . . . . . . . . . . – 190
Total Assets . . . . . . . . . . . . . . . . . . . . . . . . . . . . . . . . . . . . . . . . . . . . . . . . . . . . . . . . . . . . . . . . . . . . . . . . . 17,780,635 14,563,467 Liabilities (amounts falling due within one year)Payables:
Financial liabilities at fair value through profit or loss . . . . . . . . . . . . . . . . . . . . . . . . . . . . . . . . . . . . . . . . . . . . . . . . . . . . 47,556 118,444Bank overdraft and foreign currency . . . . . . . . . . . . . . . . . . . . . . . . . . . . . . . . . . . . . . . . . . . . . . . . . . . . . . . . . . . . . . . – 857Margin cash . . . . . . . . . . . . . . . . . . . . . . . . . . . . . . . . . . . . . . . . . . . . . . . . . . . . . . . . . . . . . . . . . . . . . . . . . . . . . . . 120,077 82,111Collateral cash . . . . . . . . . . . . . . . . . . . . . . . . . . . . . . . . . . . . . . . . . . . . . . . . . . . . . . . . . . . . . . . . . . . . . . . . . . . . . . 290,000 –Spot foreign exchange contracts awaiting payment . . . . . . . . . . . . . . . . . . . . . . . . . . . . . . . . . . . . . . . . . . . . . . . . . . . . . 14 –Investment Management fees . . . . . . . . . . . . . . . . . . . . . . . . . . . . . . . . . . . . . . . . . . . . . . . . . . . . . . . . . . . . . . . . . . . 10,039 8,313Shareholder Service fees . . . . . . . . . . . . . . . . . . . . . . . . . . . . . . . . . . . . . . . . . . . . . . . . . . . . . . . . . . . . . . . . . . . . . . 832 214Accounting, Administration and Transfer Agent fees . . . . . . . . . . . . . . . . . . . . . . . . . . . . . . . . . . . . . . . . . . . . . . . . . . . . 11,482 –Management fees . . . . . . . . . . . . . . . . . . . . . . . . . . . . . . . . . . . . . . . . . . . . . . . . . . . . . . . . . . . . . . . . . . . . . . . . . . . 329 270Accrued expenses . . . . . . . . . . . . . . . . . . . . . . . . . . . . . . . . . . . . . . . . . . . . . . . . . . . . . . . . . . . . . . . . . . . . . . . . . . . 73,381 54,213
Total Liabilities (excluding Net Assets attributable to holders of redeemable ordinary shares) . . . . . . . . . . . . 553,710 264,422 Net Assets attributable to holders of redeemable ordinary participating shares . . . . . . . . . . . . . . . . . . . . . . 17,226,925 14,299,045
DocuSign Envelope ID: 521655BF-9BE3-47DC-A9A3-494932954338

Janus Henderson Capital Funds plc / 31 December 202158
Janus Henderson Global Adaptive Multi-Asset Fund (continued)
The accompanying notes are an integral part of the financial statements.
Statement of Comprehensive IncomeYear ended
31 December 2021
(USD)
Year ended 31 December
2020 (USD)
Year ended Year endedRevenue:Interest income . . . . . . . . . . . . . . . . . . . . . . . . . . . . . . . . . . . . . . . . . . . . . . . . . . . . . . . . . . . . . . . . . . . . . . . . . . . . . . . 155,595 42,700Dividend income . . . . . . . . . . . . . . . . . . . . . . . . . . . . . . . . . . . . . . . . . . . . . . . . . . . . . . . . . . . . . . . . . . . . . . . . . . . . . . 98,510 88,857Other income . . . . . . . . . . . . . . . . . . . . . . . . . . . . . . . . . . . . . . . . . . . . . . . . . . . . . . . . . . . . . . . . . . . . . . . . . . . . . . . . 8,804 1,709
Net gain on financial assets and liabilities at fair value through profit or loss . . . . . . . . . . . . . . . . . . . . . . . . . . . . . . . . . . . . . . 1,422,095 2,099,346 Total Investments Income . . . . . . . . . . . . . . . . . . . . . . . . . . . . . . . . . . . . . . . . . . . . . . . . . . . . . . . . . . . . . . . 1,685,004 2,232,612
Expenses:Investment Management fees . . . . . . . . . . . . . . . . . . . . . . . . . . . . . . . . . . . . . . . . . . . . . . . . . . . . . . . . . . . . . . . . . . . . . 111,105 96,187Shareholder Service fees . . . . . . . . . . . . . . . . . . . . . . . . . . . . . . . . . . . . . . . . . . . . . . . . . . . . . . . . . . . . . . . . . . . . . . . . 5,919 1,911Management fees . . . . . . . . . . . . . . . . . . . . . . . . . . . . . . . . . . . . . . . . . . . . . . . . . . . . . . . . . . . . . . . . . . . . . . . . . . . . . 3,808 1,554Accounting, Administration and Transfer Agent fees . . . . . . . . . . . . . . . . . . . . . . . . . . . . . . . . . . . . . . . . . . . . . . . . . . . . . . 79,203 5,947Custodian fees . . . . . . . . . . . . . . . . . . . . . . . . . . . . . . . . . . . . . . . . . . . . . . . . . . . . . . . . . . . . . . . . . . . . . . . . . . . . . . . 15,135 45,554Audit fees . . . . . . . . . . . . . . . . . . . . . . . . . . . . . . . . . . . . . . . . . . . . . . . . . . . . . . . . . . . . . . . . . . . . . . . . . . . . . . . . . . 19,370 26,800Printing expenses . . . . . . . . . . . . . . . . . . . . . . . . . . . . . . . . . . . . . . . . . . . . . . . . . . . . . . . . . . . . . . . . . . . . . . . . . . . . . 1,257 507Legal and other professional fees . . . . . . . . . . . . . . . . . . . . . . . . . . . . . . . . . . . . . . . . . . . . . . . . . . . . . . . . . . . . . . . . . . 3,661 21,318Other fees . . . . . . . . . . . . . . . . . . . . . . . . . . . . . . . . . . . . . . . . . . . . . . . . . . . . . . . . . . . . . . . . . . . . . . . . . . . . . . . . . . 38,201 23,470
Total Expenses . . . . . . . . . . . . . . . . . . . . . . . . . . . . . . . . . . . . . . . . . . . . . . . . . . . . . . . . . . . . . . . . . . . . . . . 277,659 223,248Less Expense Reimbursement . . . . . . . . . . . . . . . . . . . . . . . . . . . . . . . . . . . . . . . . . . . . . . . . . . . . . . . . . . . (121,134) (94,247)Net Expenses after Expense Reimbursement . . . . . . . . . . . . . . . . . . . . . . . . . . . . . . . . . . . . . . . . . . . . . . . . 156,525 129,001Net Operating Profit . . . . . . . . . . . . . . . . . . . . . . . . . . . . . . . . . . . . . . . . . . . . . . . . . . . . . . . . . . . . . . . . . . . 1,528,479 2,103,611
Finance Costs: 220 –
Swap interest expense . . . . . . . . . . . . . . . . . . . . . . . . . . . . . . . . . . . . . . . . . . . . . . . . . . . . . . . . . . . . . . . . . . . . . . . . . . (220) (61) Withholding tax on dividends and other investment income . . . . . . . . . . . . . . . . . . . . . . . . . . . . . . . . . . . . . (26,077) (23,615)
Net Increase in Net Assets attributable to holders of redeemable ordinary shares resulting from operations . 1,502,182 2,079,935
. .
. .. . .
Statement of Changes in Net Assets Attributable to Redeemable Ordinary ShareholdersYear ended
31 December 2021
(USD)
Year ended 31 December
2020 (USD)
Increase in Net Assets attributable to holders of redeemable ordinary shares resulting from operations . . . . . . . . . . . . . . . . . . . . 1,502,182 2,079,935
Capital Share Transactions of redeemable ordinary shares:Proceeds from redeemable ordinary shares sold . . . . . . . . . . . . . . . . . . . . . . . . . . . . . . . . . . . . . . . . . . . . . . . . . . . . . . . 1,892,298 292,100Redemption of redeemable ordinary shares . . . . . . . . . . . . . . . . . . . . . . . . . . . . . . . . . . . . . . . . . . . . . . . . . . . . . . . . . . (466,781) (57,770)Dilution Adjustment. . . . . . . . . . . . . . . . . . . . . . . . . . . . . . . . . . . . . . . . . . . . . . . . . . . . . . . . . . . . . . . . . . . . . . . . . . . 181 205
Net Increase from Capital Share Transactions of redeemable ordinary shares . . . . . . . . . . . . . . . . . . . . . . . . 1,425,698 234,535
Net Increase in Net Assets attributable to holders of redeemable ordinary shares . . . . . . . . . . . . . . . . . . . . . . . . . . . . . . . . . . . 2,927,880 2,314,470Net Assets attributable to holders of redeemable ordinary shares at the beginning of the financial year . . . . . . . . . . . . . . . . . . . . 14,299,045 11,984,575
Net Assets attributable to holders of redeemable ordinary shares at the end of the financial year . . . . . . . . . 17,226,925 14,299,045
Gains and losses are solely from continuing operations except for the Funds which ceased operations during the financial year ended 31 December 2021 or 31 December 2020. There were no gains and losses other than those dealt with in the Statement of Comprehensive Income. Please refer to note 1 which details the Fund closures during the year.
DocuSign Envelope ID: 521655BF-9BE3-47DC-A9A3-494932954338

59Janus Henderson Capital Funds plc / 31 December 2021
Janus Henderson Global Adaptive Multi-Asset Fund (continued)
Portfolio Investments
The accompanying notes are an integral part of the financial statements.
Shares or Principal Amount
Percentage of Net Assets
(%)Fair Value
(USD)
Financial Assets at fair value through profit or lossCollective Investment Schemes (2020: 0.24% USD 35,279)United StatesCapital Markets
2,241 BlackRock Ltd. Duration Income Trust 0.22 37,761
Total Collective Investment Schemes 0.22 37,761
Commercial Papers (2020: 2.45% USD 349,989)CanadaWireless Telecommunication Services
650,000 Rogers Communications, Inc., due 7/1/22 3.77 649,980
United StatesCapital Markets
400,000 White Plains Capital Co. LLC, due 25/1/22 2.32 399,896
Consumer Finance800,000 General Motors Financial Co., Inc., due
5/1/22 4.64 799,970
Machinery800,000 Parker-Hannifin Corp., due 4/1/22 4.65 799,981
Pharmaceuticals750,000 Viatris, Inc., due 19/1/22 4.35 749,836
Total Commercial Papers 19.73 3,399,663
Common Stock (2020: 44.02% USD 6,294,112)BermudaHotels, Restaurants & Leisure
3,634 Norwegian Cruise Line Holdings Ltd. 0.44 75,369
CanadaBanks
601 Bank of Montreal 0.38 64,740493 Bank of Nova Scotia (The) 0.21 35,343300 Canadian Imperial Bank of Commerce 0.20 34,968
0.79 135,051
Chemicals951 Nutrien Ltd. 0.42 71,515
Metals & Mining3,633 Barrick Gold Corp. 0.40 69,02711,301 Kinross Gold Corp. 0.38 65,659
0.78 134,686
Cayman IslandsEntertainment
887 Sea Ltd. 1.15 198,431
Internet & Direct Marketing Retail1,954 Alibaba Group Holding Ltd. 1.35 232,116
FinlandMachinery
1 Metso Outotec OYJ 0.00 5
GermanyBiotechnology
123 BioNTech SE 0.18 31,709
IndiaBanks
1,759 ICICI Bank Ltd. 0.20 34,811
Shares or Principal Amount
Percentage of Net Assets
(%)Fair Value
(USD)
IrelandBiotechnology
639 Horizon Therapeutics plc 0.40 68,859
Health Care Equipment & Supplies305 Medtronic plc 0.18 31,552
Insurance110 Aon plc, A 0.19 33,062
NetherlandsHealth Care Equipment & Supplies
0 Koninklijke Philips NV 0.00 17
PanamaHotels, Restaurants & Leisure
2,073 Carnival Corp. 0.24 41,709
SwitzerlandCapital Markets
6,792 Credit Suisse Group AG 0.38 65,4751,851 UBS Group AG 0.19 33,077
0.57 98,552
TaiwanSemiconductors & Semiconductor Equipment
273 Taiwan Semiconductor Manufacturing Co. Ltd. 0.19 32,845
2,679 United Microelectronics Corp. 0.18 31,3440.37 64,189
United KingdomBanks
2,281 HSBC Holdings plc 0.40 68,772
Multi-Utilities986 National Grid plc 0.41 71,307
Personal Products634 Unilever plc 0.20 34,103
Pharmaceuticals606 AstraZeneca plc 0.21 35,299837 Royalty Pharma plc, A 0.19 33,354
0.40 68,653
United StatesAerospace & Defense
182 Huntington Ingalls Industries, Inc. 0.20 33,98798 Lockheed Martin Corp. 0.20 34,83092 Northrop Grumman Corp. 0.21 35,610
399 Raytheon Technologies Corp. 0.20 34,3380.81 138,765
Airlines1,131 Delta Air Lines, Inc. 0.26 44,199283 Southwest Airlines Co. 0.07 12,124
0.33 56,323
Automobiles1,138 General Motors Co. 0.39 66,721
Banks203 JPMorgan Chase & Co. 0.19 32,145
1,427 KeyCorp 0.19 33,006579 US Bancorp 0.19 32,522
2,755 Wells Fargo & Co. 0.77 132,1851.34 229,858
Beverages612 Coca-Cola Co. (The) 0.21 36,236
DocuSign Envelope ID: 521655BF-9BE3-47DC-A9A3-494932954338

Janus Henderson Capital Funds plc / 31 December 202160
The accompanying notes are an integral part of the financial statements.
Janus Henderson Global Adaptive Multi-Asset Fund (continued)
Portfolio Investments
Shares or Principal Amount
Percentage of Net Assets
(%)Fair Value
(USD)
202 PepsiCo, Inc. 0.20 35,089
0.41 71,325
Biotechnology324 Amgen, Inc. 0.42 72,89056 Gilead Sciences, Inc. 0.02 4,066
173 United Therapeutics Corp. 0.22 37,382160 Vertex Pharmaceuticals, Inc. 0.20 35,136
0.86 149,474
Capital Markets194 Goldman Sachs Group, Inc. (The) 0.43 74,215275 Northern Trust Corp. 0.19 32,893
71 S&P Global, Inc. 0.19 33,5070.81 140,615
Construction Materials157 Martin Marietta Materials, Inc. 0.40 69,162
Consumer Finance138 American Express Co. 0.13 22,577
Distributors251 Genuine Parts Co. 0.20 35,190
Diversified Consumer Services969 Service Corp. International 0.40 68,789
Diversified Financial Services117 Berkshire Hathaway, Inc., B 0.20 34,983
Diversified Telecommunication Services641 Verizon Communications, Inc. 0.19 33,306
Electric Utilities495 Edison International 0.20 33,784499 Pinnacle West Capital Corp. 0.20 35,224
1,013 Xcel Energy, Inc. 0.40 68,5800.80 137,588
Electronic Equipment, Instruments & Components110 Zebra Technologies Corp., A 0.38 65,472
Entertainment33 Netflix, Inc. 0.12 19,88189 Roku, Inc. 0.12 20,310
1,406 Walt Disney Co. (The) 1.26 217,7751,544 World Wrestling Entertainment, Inc., A 0.44 76,181
1.94 334,147
Equity Real Estate Investment Trusts (REITs)1,506 STAG Industrial, Inc. 0.42 72,228
Food & Staples Retailing639 Walmart, Inc. 0.54 92,457
Food Products252 J M Smucker Co. (The) 0.20 34,227
1,041 Kellogg Co. 0.39 67,061545 Mondelez International, Inc., A 0.21 36,139
0.80 137,427
Hotels, Restaurants & Leisure328 Caesars Entertainment, Inc. 0.18 30,678
2,164 MGM Resorts International 0.56 97,1200.74 127,798
Household Durables3 Lennar Corp., A 0.00 348
Insurance603 American International Group, Inc. 0.20 34,287394 Arthur J Gallagher & Co. 0.39 66,850
Shares or Principal Amount
Percentage of Net Assets
(%)Fair Value
(USD)
648 Fidelity National Financial, Inc. 0.20 33,813
0.79 134,950
Interactive Media & Services336 Alphabet, Inc., A 5.65 973,405
7 Alphabet, Inc., C 0.12 20,2553,176 Meta Platforms, Inc., A 6.20 1,068,2486,255 Snap, Inc., A 1.71 294,173
13.68 2,356,081
Internet & Direct Marketing Retail293 Amazon.com, Inc. 5.67 976,962492 Wayfair, Inc., A 0.54 93,465
6.21 1,070,427
IT Services462 Akamai Technologies, Inc. 0.31 54,072316 Fidelity National Information Services,
Inc. 0.20 34,491275 International Business Machines Corp. 0.21 36,756166 Visa, Inc., A 0.21 35,974
0.93 161,293
Machinery299 Oshkosh Corp. 0.20 33,700
Media911 Fox Corp., A 0.20 33,616937 Interpublic Group of Cos., Inc. (The) 0.20 35,091
0.40 68,707
Metals & Mining1,228 Newmont Corp. 0.44 76,161
Mortgage Real Estate Investment Trusts (REITs)2,119 AGNC Investment Corp. 0.19 31,870
Multi-Utilities366 WEC Energy Group, Inc. 0.21 35,528
Oil, Gas & Consumable Fuels2,399 Williams Cos., Inc. (The) 0.36 62,470
Pharmaceuticals580 Bristol-Myers Squibb Co. 0.21 36,163446 Merck & Co., Inc. 0.20 34,181612 Pfizer, Inc. 0.21 36,139
0 Viatris, Inc. 0.00 30.62 106,486
Real Estate Management & Development326 CBRE Group, Inc., A 0.21 35,374
Road & Rail92 Old Dominion Freight Line, Inc. 0.19 32,971
Semiconductors & Semiconductor Equipment660 Intel Corp. 0.20 33,990172 NVIDIA Corp. 0.29 50,587
0.49 84,577
Software2,700 Dropbox, Inc., A 0.39 66,258
75 Microsoft Corp. 0.15 25,2240.54 91,482
Specialty Retail5 Home Depot, Inc. (The) 0.01 2,075
Technology Hardware, Storage & Peripherals1,139 Apple, Inc. 1.17 202,252
DocuSign Envelope ID: 521655BF-9BE3-47DC-A9A3-494932954338

61Janus Henderson Capital Funds plc / 31 December 2021
The accompanying notes are an integral part of the financial statements.
Janus Henderson Global Adaptive Multi-Asset Fund (continued)
Portfolio Investments
Shares or Principal Amount
Percentage of Net Assets
(%)Fair Value
(USD)
2,118 Hewlett Packard Enterprise Co. 0.19 33,401
1.36 235,653
Textiles, Apparel & Luxury Goods1,998 NIKE, Inc., B 1.93 333,007
Water Utilities387 American Water Works Co., Inc. 0.42 73,089
Total Common Stock 49.94 8,604,922
Exchange Traded Funds (2020: 7.53% USD 1,077,448)1,111 iShares Core EUR Corp. Bond Fund 0.98 169,404420 iShares J.P. Morgan USD EM Bond Fund 0.27 45,683
5,748 iShares Physical Gold ETC 1.18 203,925346 iShares USD Corp. Bond Fund 0.25 43,764
1,100 iShares USD High Yield Corp. Bond Fund 0.66 112,81618,466 iShares USD Short Duration High Yield
Corp. Bond Fund 0.63 107,98951,490 Lyxor Commodities Thomson Reuters 6.61 1,137,8412,000 Vanguard USD Corporate 1-3 Year Bond
Fund 0.63 108,0302,233 WisdomTree WTI Crude Oil 0.09 16,011
Total Exchange Traded Funds 11.30 1,945,463
Government Obligations (2020: 37.12% USD 5,307,992)US Treasury Notes/Bonds
9,669,207 4.5000%, due 4/12/25 2.96 509,4371,250,000 0.5000%, due 15/1/28 9.11 1,568,745
Total Government Obligations 12.07 2,078,182
.Total Investments (Cost: USD 15,370,019) 93.26 16,065,991
Credit Default Swaps (2020: 0.03% USD 4,388).Forward Currency Contracts (2020: 0.02% USD 2,168)Open as at 31 December 2021.
Current Market
Percentage of Net Unrealised
Currency Currency Value Settle Assets GainPurchased Sold (USD) Date (%) (USD)
.Barclays USD 8,901 CAD 11,000 8,696 20-Jan-22 0.00 205
Citibank USD 8,894 CAD 11,000 8,696 20-Jan-22 0.00 198
USD 23,452 GBP 17,000 23,009 20-Jan-22 0.00 443
Credit SuisseUSD 35,841 AUD 48,000 34,924 20-Jan-22 0.01 917
USD 96,710 EUR 83,000 94,526 20-Jan-22 0.01 2,184
USD 20,894 JPY 2,377,000 20,667 20-Jan-22 0.00 227
HSBC USD 7,274 CAD 9,000 7,114 20-Jan-22 0.00 160
USD 196 KRW 231,000 194 20-Jan-22 0.00 2
J.P. Morgan EUR◊ 1,028,196 USD 1,163,420 1,172,734 31-Mar-22 0.05 9,314
Total 0.07 13,650
.
Futures° (2020: 0.67% USD 95,925).
Counterparty No of Contracts
Percentage of Net
Assets (%)
UnrealisedGain (USD)
Goldman Sachs 1 Amsterdam Index 0.03 4,994Goldman Sachs 3 CAC 40 Index 0.05 8,775Goldman Sachs 1 DAX Index 0.06 11,255
Goldman Sachs 19Micro E-mini Nasdaq-100 Index 0.06 9,252
Goldman Sachs 75Micro E-mini Russell 2000 Index 0.14 24,701
Goldman Sachs 14MSCI Emerging Markets Index 0.06 10,400
Goldman Sachs 2 Nikkei 225 Index 0.00 690Goldman Sachs 9 OMXS30 Index 0.08 13,236Goldman Sachs 5 S&P/TSX 60 Index 0.14 24,807Goldman Sachs 4 SPI 200 Index 0.04 6,323Goldman Sachs 1 US Long Bond 0.01 1,679Goldman Sachs 1 US Ultra Bond 0.02 3,139Total 0.69 119,251
.
Total Return Swap° (2020: 0.00% USD –).
Return Paid
Return Received
Percentage of Net Unrealized
by the by the Notional Maturity Assets GainCounterparty Fund Fund Amount Date (%) (USD)
Bank of America Amazon.com,
Inc.
1 month USD LIBOR plus 60
basis points 917,064 05-Jan-22 0.08 13,458
Bank of America
Alphabet, Inc.
1 month USD LIBOR plus 60
basis points 917,703 05-Jan-22 0.06 10,930
J.P. Morgan Alibaba Group Holding Ltd. 80 basis points 315,727 18-Jan-22 0.49 83,612
J.P. Morgan Sea Ltd. 80 basis points 278,882 18-Jan-22 0.47 80,451
J.P. Morgan Snap, Inc. 80 basis points 341,273 18-Jan-22 0.27 47,100
J.P. Morgan Wayfair, Inc. 80 basis points 129,534 18-Jan-22 0.21 36,069
Total 1.58 271,620
Options (2020: 1.04% USD 149,653)
Total Financial Assets at fair value through profit or loss 95.60 16,470,512
Financial Liabilities at fair value through profit or loss.Forward Currency Contracts (2020: (0.20)% USD (28,057))Open as at 31 December 2021
Current Market
Percentage of Net Unrealised
Currency Currency Value Settle Assets LossPurchased Sold (USD) Date (%) (USD)
Citibank HKD 268,000 USD 34,476 34,371 20-Jan-22 0.00 (105)
USD 157,066 MXN 3,235,836 157,605 20-Jan-22 0.00 (539)
Credit SuisseUSD 19,648 CHF 18,000 19,763 20-Jan-22 0.00 (115)
J.P. Morgan USD◊ 16,796 EUR 14,860 16,948 31-Mar-22 0.00 (152)
USD 20,769 SGD 28,000 20,776 20-Jan-22 0.00 (7)
Total 0.00 (918).
Futures° (2020: (0.20)% USD (29,058))
Counterparty No of Contracts
Percentage of Net
Assets (%)
Unrealised Loss
(USD)
Goldman Sachs 1 Australia 10 Year Bond 0.00 (620)Goldman Sachs (2) E-mini S&P 500 Index (0.06) (9,938)Goldman Sachs (3) Micro E-mini S&P 500 Index (0.01) (1,494)Goldman Sachs (11) US 10 Year Note (0.08) (14,106)
DocuSign Envelope ID: 521655BF-9BE3-47DC-A9A3-494932954338

Janus Henderson Capital Funds plc / 31 December 202162
The accompanying notes are an integral part of the financial statements.
Janus Henderson Global Adaptive Multi-Asset Fund (continued)
Portfolio Investments
Futures° (2020: (0.20)% USD (29,058))
Counterparty No of Contracts
Percentage of Net
Assets (%)
Unrealised Loss
(USD)
Goldman Sachs (8) US 5 Year Note (0.02) (4,070)Total (0.17) (30,228)
.
Total Return Swap° (2020: 0.00% USD–)
Return Paid
Return Received
Percentage of Net Unrealized
by the by the Notional Maturity Assets LossCounterparty Fund Fund Amount Date (%) (USD)
Bank of America Meta
Platforms, Inc.
1 month USD LIBOR plus
60 basis points 916,598 05-Jan-22 (0.08) (13,074)
J.P. Morgan Akamai Technologies,
Inc.80 basis
points 50,737 18-Jan-22 (0.02) (3,336)Total (0.10) (16,410)
Options (2020: (0.42)% USD (61,329))
Total Financial Liabilities at fair value through profit or loss (0.27) (47,556)
Portfolio Analysis (Unaudited)
Analysis of Total Assets:% of Total
AssetsTransferable securities admitted to official stock exchange listing 71.02Collective investment schemes 0.21Financial derivative instruments dealt in on a regulated market 0.67Other transferable securities of the type referred to in Regulation 68 (1) (a), (b) and (c) 19.12OTC financial derivative instruments 1.60Other Assets 7.38Total Assets 100.00
◊ These forward currency contracts are used for share class hedging.° Refer to Note 5 for details of collateral held.
DocuSign Envelope ID: 521655BF-9BE3-47DC-A9A3-494932954338

63Janus Henderson Capital Funds plc / 31 December 2021
The accompanying notes are an integral part of the financial statements.
Janus Henderson Global Adaptive Multi-Asset Fund (continued)
Fair Value Hierarchy
The tables below provide the fair value hierarchy summary of the Fund’s financial assets and liabilities measured at fair value at 31 December 2021 and 31 December 2020.
31 December 2021
Level 1 - Quoted Prices
(USD)
Level 2 - Other Significant
Observable Inputs (USD)
Level 3 - Significant
Unobservable Inputs (USD)
Total (USD)
Collective Investment Schemes 37,761 – – 37,761Commercial Papers – 3,399,663 – 3,399,663Common Stock 8,604,922 – – 8,604,922Exchange Traded Funds 1,945,463 – – 1,945,463Forward Currency Contracts – 12,732 – 12,732Futures 89,023 – – 89,023Government Obligations – 2,078,182 – 2,078,182Total Return Swaps – 255,210 – 255,210Total Investments in Securities 10,677,169 5,745,787 – 16,422,956
31 December 2020
Level 1 - Quoted Prices
(USD)
Level 2 - Other Significant
Observable Inputs (USD)
Level 3 - Significant
Unobservable Inputs (USD)
Total (USD)
Collective Investment Schemes 35,279 – – 35,279Commercial Papers – 349,989 – 349,989Common Stock 6,294,082 301 – 6,294,112Credit Default Swaps – 4,388 – 4,388Exchange Traded Funds – 1,077,4482 – 1,077,448Forward Currency Contracts – (25,889) – (25,889)Futures 66,867 – – 66,867Government Obligations – 5,307,992 – 5,307,992Options Purchased – 149,653 – 149,653Options Written – (61,329) – (61,329)Total Investments in Securities 6,396,228 6,802,282 – 13,198,510
1At 31 December 2020 the administrator used a systematic fair valuation model provided by an independent third party to value listed securities in order to adjust for stale pricing between the close of foreign exchanges and the valuation point. This resulted in a change to common stocks with a fair value of USD 30.
2At 31 December 2020 the administrator used a systematic fair valuation model provided by an independent third party to value listed securities in order to adjust for stale pricing between the close of foreign exchanges and the valuation point. This resulted in a decrease of USD 9 to exchange traded funds with a fair value of USD 1,077,448.
There were transfers on Common Stocks and Exchange Traded Funds from level 2 to level 1 during the financial year ended 31 December 2021 and on Government Obligations from level 1 to level 2 during the financial year ended 31 December 2020.
There were no investments held by the Fund at 31 December 2021 and 31 December 2020 that were fair valued at level 3 by the Janus Henderson Global Pricing Committee.
Valuation policy of private placements is referenced in note 2 of the financial statements.
DocuSign Envelope ID: 521655BF-9BE3-47DC-A9A3-494932954338

Janus Henderson Capital Funds plc / 31 December 202164
Janus Henderson Global Adaptive Multi-Asset Fund (continued)
The accompanying notes are an integral part of the financial statements.
Capital Share Transactions
For the financial year ended 31 December 2021
A2 HEUR A2 USD E2 HEUR H2 USD I2 USDShares Shares Shares Shares Shares
At beginning of the year . . . . . . . 15,985 21,762 1,262 985,320 300Shares issued 61,184 59,076 7,163 – –Shares redeemed. . . . . . . . . . . (5,820) (24,052) (2,321) – –At end of year . . . . . . . . . . . . . 71,349 56,786 6,104 985,320 300
For the financial year ended 31 December 2020
A2 HEUR A2 USD E2 HEUR H2 USD I2 USDShares Shares Shares Shares Shares
At beginning of the year . . . . . . . 18,066 303 2,197 985,320 300Shares issued 2,131 21,459 – – –Shares redeemed. . . . . . . . . . . (4,212) – (935) – –At end of year . . . . . . . . . . . . . 15,985 21,762 1,262 985,320 300
Net Asset Comparison
31 December 2021 31 December 2020 31 December 2019
Net Assets (USD)
NAV Per Share
(Local Currency)Net Assets
(USD)
NAV Per Share
(Local Currency)Net Assets
(USD)
NAV Per Share
(Local Currency)
A2 HEUR 1,065,500 13 .12 234,586 12 .01 213,053 10 .51
A2 USD 845,288 14 .89 294,000 13 .51 3,525 11 .62
E2 HEUR 86,430 12 .44 17,608 11 .42 24,898 10 .11
H2 USD 15,225,069 15 .45 13,748,663 13 .95 11,739,522 11 .91
I2 USD 4,638 15 .46 4,188 13 .96 3,577 11 .92. . .
Total Expense Ratio (unaudited)
The Average Total Expense Ratio table shows the actual expenses, excluding transactions costs and trade commissions, incurred by each Class for the Fund during the reporting financial year expressed as a percentage of the average net assets for the corresponding year, on an annualised basis.
31 December 2021 31 December 2020 31 December 2019A2 HEUR 1.44% 1.74% 1.75%A2 USD 1.45% 1.69% 1.75%E2 HEUR 1.70% 2.75% 2.86%H2 USD 0.95% 1.03% 1.05%I2 USD 0.95% 0.87% 1.04%
DocuSign Envelope ID: 521655BF-9BE3-47DC-A9A3-494932954338

65Janus Henderson Capital Funds plc / 31 December 2021
Janus Henderson Global Adaptive Multi-Asset Fund (continued)
The accompanying notes are an integral part of the financial statements.
Fund Performance (unaudited)
As at 31 December 2021
One year Three years Five yearsSince
inception
Performance (Annualised) 31/12/2020 31/12/2021
%
31/12/2017 31/12/2021
%
31/12/2015 31/12/2021
%
to 31/12/2021
%
H2 USD (Net)* 10.75 14.24** 7.57** 7.17**60% MSCI All Country World Index NR / 40% Bloomberg Barclays Global +1.00% 8.78 13.72 10.11 9.52
Five years 31/12/2015 31/12/2021
%H2 USD (Gross)* 9.4160% MSCI All Country World Index NR / 40% Bloomberg Barclays Global +1.00% 11.22
.
Discrete performance
31/12/2020 31/12/2021
%
31/12/2019 31/12/2020
%
31/12/2018 31/12/2019
%
31/12/2017 31/12/2018
%
31/12/2016 31/12/2017
%
H2 USD (Net)* 10.75 16.27** 16.43** (7.08)** 3.97**60% MSCI ACWI NR / 40% Bloomberg Barclays Global Agg 8.78 14.05 18.55 (6.00) 17.09
H2 USD (Gross)* 11.80 18.30** 18.47** (5.45)** 5.79**60% MSCI All Country World Index NR / 40% Bloomberg Barclays Global +1.00% 9.86 15.19 19.74 (5.05) 18.26
Class H2 USD is disclosed as it is the representative share class.
* The representative share class has changed from the A2 USD to the H2 USD share class with effect from August 2021.
** Historical figures are based on the A2 USD share class.
Performance target: To outperform the 60% MSCI All Country World Index NR + 40% Bloomberg Barclays Global Aggregate Bond Index by 1% per annum, before the deduction of charges, over any 5 year period.
The Total Expense Ratio includes fees payable to Distributors. Where the Total Expense Ratio exceeds the target outperformance relative to the benchmark the return is likely to be below the benchmark return, even when the Fund’s outperformance target (before the deduction of charges) has been achieved.
Please note the Gross Returns 5 year annualised table is only applicable for share classes which have been active for 5 or more years and the performance target is to be achieved over a specific annualised time period. Performance target and index shown in USD.
Past performance does not guarantee future returns. The rates of return will vary and the principal value of an investment will fluctuate. Shares, if redeemed, may be worth more or less than their original cost. The performance data does not take account of the commissions and costs incurred on the issue and redemption of Shares. All returns are calculated in the base currency of the representative Share Class.
There is no guarantee that the Fund’s performance will match or exceed the benchmark.
DocuSign Envelope ID: 521655BF-9BE3-47DC-A9A3-494932954338

Janus Henderson Capital Funds plc / 31 December 202166
Janus Henderson Global Adaptive Multi-Asset Fund (continued)
Statements of Changes in Composition of Portfolio (unaudited)The tables below show a breakdown of material purchases and sales of the Investment Portfolio in accordance with Central Bank UCITS Regulations 79(2) requirements. All purchases and sales of investments exceeding 1% of the total value of each transaction respectively, are disclosed, with a minimum number of 20 of each such transaction. A full analysis of the movement on the Investment Portfolio is available upon request from the registered office.
Major Purchases for the year ended 31 December 2021
Shares or Principal Amount
Cost (USD)
Cnpc Finance HK Ltd., 0.0000%, due 7/7/21 1,550,000 1,549,896Credit Agricole Corporate And Investment Bank, 0.0000%, due 5/11/21 1,500,000 1,499,998Credit Agricole Corporate And Investment Bank, 0.0000%, due 16/3/21 1,300,000 1,299,998Credit Agricole Corporate And Investment Bank, 0.0000%, due 5/4/21 1,300,000 1,299,993Credit Agricole Corporate And Investment Bank, 0.0000%, due 26/5/21 1,200,000 1,199,999Credit Agricole Corporate And Investment Bank, 0.0000%, due 28/5/21 1,200,000 1,199,999Meta Platforms, Inc. 'A' 3,357 1,106,703Amazon.com, Inc. 325 1,101,629Credit Agricole Corporate And Investment Bank, 0.0000%, due 15/10/21 1,100,000 1,099,998Credit Agricole Corporate And Investment Bank, 0.0000%, due 5/10/21 1,100,000 1,099,998Alphabet, Inc. 'A' 364 1,047,010Credit Agricole Corporate And Investment Bank, 0.0000%, due 17/11/21 1,000,000 999,999Credit Agricole Corporate And Investment Bank, 0.0000%, due 29/9/21 1,000,000 999,999Credit Industriel et Commercial, 0.0000%, due 30/9/21 1,000,000 999,998US Treasury Bill, 0.0000%, due 5/10/21 900,000 900,000Credit Agricole Corporate And Investment Bank, 0.0000%, due 10/12/21 900,000 899,999Credit Agricole Corporate And Investment Bank, 0.0000%, due 16/11/21 900,000 899,999Credit Agricole Corporate And Investment Bank, 0.0000%, due 25/8/21 900,000 899,999Credit Agricole Corporate And Investment Bank, 0.0000%, due 30/12/21 900,000 899,999Credit Agricole Corporate And Investment Bank, 0.0000%, due 9/12/21 900,000 899,999
Major Sales for the year ended 31 December 2021
Shares or Principal Amount
Proceeds (USD)
Mexico Cetes, 0.0000%, due 28/1/21 15,982,600 801,646Las Vegas Sands Corp. 11,778 606,262Italy Buoni Ordinari del Tesoro BOT, 0.0000%, due 29/1/21 414,000 503,741JPMorgan Chase & Co. 3,120 467,599Citigroup, Inc. 4,621 318,890Morgan Stanley 3,766 310,980Microsoft Corp. 1,155 279,276AMC Entertainment Holdings, Inc. 19,346 277,217Walt Disney Co. (The) 1,563 267,986AutoZone, Inc. 178 248,233Visa, Inc. 'A' 1,106 241,894Pfizer, Inc. 5,888 234,211World Wrestling Entertainment, Inc. 'A' 4,306 230,577Duke Energy Corp. 2,258 220,910US Bancorp 3,915 219,149US Treasury Inflation Indexed, 0.5000%, due 15/1/28 182,000 216,754Archer-Daniels-Midland Co. 3,123 184,278Caterpillar, Inc. 818 178,638MSCI, Inc. 347 175,063Lyxor Commodities Thomson Reuters 8,665 172,929
DocuSign Envelope ID: 521655BF-9BE3-47DC-A9A3-494932954338

Janus Henderson Global Life Sciences Fund
67Janus Henderson Capital Funds plc / 31 December 2021
Fund Overview (unaudited)Investment Objective and Policy
The Fund aims to provide capital growth over the long term.
Performance target: To outperform the MSCI World Health Care NR Index by at least 2% per annum, before the deduction of charges, over any 5 year period.
The Fund invests in shares (also known as equities) of companies, of any size, with a life sciences orientation, in any country.
The Fund is actively managed with reference to the MSCI World Health Care NR Index, which is broadly representative of the companies in which it may invest, as this forms the basis of the Fund’s performance target. The investment manager has discretion to choose individual investments for the Fund with weightings different to the index or not in the index, but at times the Fund may hold investments similar to the index.
How Sustainability Risks are part of the investment processThe investments underlying this financial product (referred to as the Fund) do not take into account the EU criteria for environmentally sustainable economic activities, although the Manager and the Investment Manager have agreed a decision making process that will apply to investment decisions relating to the Fund as further detailed in the Prospectus.
The likely impacts of sustainability risks on the returns of the FundWhile the analysis of (Environmental, Social and Governance) ESG factors is an integral component across the Investment Manager’s investment capabilities and one of a number of inputs to the selection of investments and portfolio construction, the investment process of the Investment Manager is primarily designed to maximise long-term risk-adjusted returns for investors. Therefore, in managing the Fund, the Investment Manager does not maximise portfolio alignment with sustainability risks as a separate goal in its own right nor does it precisely attribute the impact of ESG factors on returns for the Fund.
Fund Overview
Andy Acker, portfolio manager
For the 12-months ended 31 December 2021, the Janus Henderson Global Life Sciences Fund H2 US dollar terms returned 6.35% (Net) and 7.27% (Gross), underperforming its primary benchmark, the MSCI World Health Care NR Index, which gained 19.80% (Gross) and 22.20% (Target). The Fund also underperformed its secondary benchmark, the S&P 500® Index, which delivered 28.71% (Gross).
The Fund’s positioning in biotechnology weighed most on performance. Conversely, stock selection in health care equipment aided returns.
Looking at individual holdings, Acadia Pharmaceuticals was the largest detractor. Early in the year, the company was developing lead drug Nuplazid as a treatment for hallucinations and delusions associated with dementia-related psychosis. However, in April, the Food and Drug Administration (FDA) denied approval due to a lack of statistical significance for some patient subgroups. The decision came as a surprise since the issues flagged were not part of agreed-upon criteria for approval, causing the stock to sell off. But after meeting with the FDA, the company announced it would resubmit its application in early 2022, narrowing the proposed indication to Alzheimer’s disease psychosis and using new analyses of existing clinical data. Further, Acadia announced positive clinical data for another pipeline program, this time for Rett syndrome, a rare, genetic neurological disorder.
Allakos was another significant detractor. Allakos is developing lead drug lirentelimab to treat disorders caused by the proliferation of eosinophils (specialized immune cells). But in December, the company reported the drug failed to improve symptoms for patients in two late-stage trials – despite significantly reducing eosinophil counts. Although Allakos will continue to develop lirentelimab, the company could not explain the disconnect in trial outcomes. The Fund exited the position.
Conversely, some holdings benefited from mergers and acquisitions, including GW Pharmaceuticals, the Fund’s top contributor. The stock rose after Jazz Pharmaceuticals announced it would buy GW for US $7.2 billion, roughly 50% more than market value. The offer reflects GW’s strong growth potential, as lead drug Epidiolex, a cannabinoid for patients with severe childhood-onset epilepsy, saw sales increase more than 70% in 2020. GW also recently launched Epidiolex for a new indication called tuberous sclerosis complex, a genetic condition that affects 30,000 patients.
Arena Pharmaceuticals was another top contributor. The stock climbed after Pfizer announced it would acquire the biotech for US $6.7 billion, a 100% premium. Arena is focused on developing treatments for immuno-inflammatory ailments in gastroenterology, dermatology and cardiology. It was interesting that the company was acquired prior to the announcement of phase 3 trial data, which suggests deal activity could become more aggressive in 2022, given big pharma’s strong balance sheets and biotech’s combination of high innovation/low valuations.
Thank you for investing in Janus Henderson Global Life Sciences Fund.
January 2022
DocuSign Envelope ID: 521655BF-9BE3-47DC-A9A3-494932954338

Janus Henderson Capital Funds plc / 31 December 202168
The accompanying notes are an integral part of the financial statements.
Janus Henderson Global Life Sciences Fund (continued)
Statement of Financial PositionAs of
31 December 2021
(USD)
As of 31 December
2020 (USD)
Assets:Financial assets at fair value through profit or loss . . . . . . . . . . . . . . . . . . . . . . . . . . . . . . . . . . . . . . . . . . . . . . . . . . . . . . . 4,652,239,666 3,876,475,738Cash and foreign currency . . . . . . . . . . . . . . . . . . . . . . . . . . . . . . . . . . . . . . . . . . . . . . . . . . . . . . . . . . . . . . . . . . . . . . . 9,483,669 21,584,859Receivables:
Investments sold . . . . . . . . . . . . . . . . . . . . . . . . . . . . . . . . . . . . . . . . . . . . . . . . . . . . . . . . . . . . . . . . . . . . . . . . . . . . 14,859,032 6,248,839Spot foreign exchange contracts awaiting settlement . . . . . . . . . . . . . . . . . . . . . . . . . . . . . . . . . . . . . . . . . . . . . . . . . . . . 1,548 10,810Funds shares sold . . . . . . . . . . . . . . . . . . . . . . . . . . . . . . . . . . . . . . . . . . . . . . . . . . . . . . . . . . . . . . . . . . . . . . . . . . . 12,134,128 25,711,650Dividends . . . . . . . . . . . . . . . . . . . . . . . . . . . . . . . . . . . . . . . . . . . . . . . . . . . . . . . . . . . . . . . . . . . . . . . . . . . . . . . . . 1,330,864 1,780,362
Receivable from Investment Manager . . . . . . . . . . . . . . . . . . . . . . . . . . . . . . . . . . . . . . . . . . . . . . . . . . . . . . . . . . . . . . . . 16,172 43,550Other debtors . . . . . . . . . . . . . . . . . . . . . . . . . . . . . . . . . . . . . . . . . . . . . . . . . . . . . . . . . . . . . . . . . . . . . . . . . . . . . . . . 650,575 638,675
Total Assets . . . . . . . . . . . . . . . . . . . . . . . . . . . . . . . . . . . . . . . . . . . . . . . . . . . . . . . . . . . . . . . . . . . . . . . . . 4,690,715,654 3,932,494,483 Liabilities (amounts falling due within one year)Payables:
Financial liabilities at fair value through profit or loss . . . . . . . . . . . . . . . . . . . . . . . . . . . . . . . . . . . . . . . . . . . . . . . . . . . . 358,951 98,475Bank overdraft and foreign currency . . . . . . . . . . . . . . . . . . . . . . . . . . . . . . . . . . . . . . . . . . . . . . . . . . . . . . . . . . . . . . . 126 1Investments purchased . . . . . . . . . . . . . . . . . . . . . . . . . . . . . . . . . . . . . . . . . . . . . . . . . . . . . . . . . . . . . . . . . . . . . . . . 289,977 17,326,259Fund shares repurchased . . . . . . . . . . . . . . . . . . . . . . . . . . . . . . . . . . . . . . . . . . . . . . . . . . . . . . . . . . . . . . . . . . . . . . 15,198,233 3,234,033Investment Management fees . . . . . . . . . . . . . . . . . . . . . . . . . . . . . . . . . . . . . . . . . . . . . . . . . . . . . . . . . . . . . . . . . . . 4,622,743 3,714,759Shareholder Service fees . . . . . . . . . . . . . . . . . . . . . . . . . . . . . . . . . . . . . . . . . . . . . . . . . . . . . . . . . . . . . . . . . . . . . . 702,423 617,550Distribution fees . . . . . . . . . . . . . . . . . . . . . . . . . . . . . . . . . . . . . . . . . . . . . . . . . . . . . . . . . . . . . . . . . . . . . . . . . . . . . 7,471 8,953Accounting, Administration and Transfer Agent fees . . . . . . . . . . . . . . . . . . . . . . . . . . . . . . . . . . . . . . . . . . . . . . . . . . . . 439,690 395,469Management fees . . . . . . . . . . . . . . . . . . . . . . . . . . . . . . . . . . . . . . . . . . . . . . . . . . . . . . . . . . . . . . . . . . . . . . . . . . . 88,116 73,138Accrued expenses . . . . . . . . . . . . . . . . . . . . . . . . . . . . . . . . . . . . . . . . . . . . . . . . . . . . . . . . . . . . . . . . . . . . . . . . . . . 680,059 487,270
Total Liabilities (excluding Net Assets attributable to holders of redeemable ordinary shares) . . . . . . . . . . . . 22,387,789 25,955,907 Net Assets attributable to holders of redeemable ordinary participating shares . . . . . . . . . . . . . . . . . . . . . . 4,668,327,865 3,906,538,576
DocuSign Envelope ID: 521655BF-9BE3-47DC-A9A3-494932954338

69Janus Henderson Capital Funds plc / 31 December 2021
Janus Henderson Global Life Sciences Fund (continued)
The accompanying notes are an integral part of the financial statements.
Statement of Comprehensive IncomeYear ended
31 December 2021
(USD)
Year ended 31 December
2020 (USD)
Year ended Year endedRevenue:Interest income . . . . . . . . . . . . . . . . . . . . . . . . . . . . . . . . . . . . . . . . . . . . . . . . . . . . . . . . . . . . . . . . . . . . . . . . . . . . . . . (6,176) 24,835Dividend income . . . . . . . . . . . . . . . . . . . . . . . . . . . . . . . . . . . . . . . . . . . . . . . . . . . . . . . . . . . . . . . . . . . . . . . . . . . . . . 44,761,301 33,476,871Other income . . . . . . . . . . . . . . . . . . . . . . . . . . . . . . . . . . . . . . . . . . . . . . . . . . . . . . . . . . . . . . . . . . . . . . . . . . . . . . . . 3,368,256 60,102
Net gain on financial assets and liabilities at fair value through profit or loss . . . . . . . . . . . . . . . . . . . . . . . . . . . . . . . . . . . . . . 214,754,129 757,431,774 Total Investments Income . . . . . . . . . . . . . . . . . . . . . . . . . . . . . . . . . . . . . . . . . . . . . . . . . . . . . . . . . . . . . . . 262,877,510 790,993,582
Expenses:Investment Management fees . . . . . . . . . . . . . . . . . . . . . . . . . . . . . . . . . . . . . . . . . . . . . . . . . . . . . . . . . . . . . . . . . . . . . 51,988,771 33,301,283Shareholder Service fees . . . . . . . . . . . . . . . . . . . . . . . . . . . . . . . . . . . . . . . . . . . . . . . . . . . . . . . . . . . . . . . . . . . . . . . . 8,388,384 5,789,817Distribution fees . . . . . . . . . . . . . . . . . . . . . . . . . . . . . . . . . . . . . . . . . . . . . . . . . . . . . . . . . . . . . . . . . . . . . . . . . . . . . . 98,840 45,826Management fees . . . . . . . . . . . . . . . . . . . . . . . . . . . . . . . . . . . . . . . . . . . . . . . . . . . . . . . . . . . . . . . . . . . . . . . . . . . . . 1,051,925 390,396Accounting, Administration and Transfer Agent fees . . . . . . . . . . . . . . . . . . . . . . . . . . . . . . . . . . . . . . . . . . . . . . . . . . . . . . 1,358,633 1,627,899Custodian fees . . . . . . . . . . . . . . . . . . . . . . . . . . . . . . . . . . . . . . . . . . . . . . . . . . . . . . . . . . . . . . . . . . . . . . . . . . . . . . . 456,843 340,756Audit fees . . . . . . . . . . . . . . . . . . . . . . . . . . . . . . . . . . . . . . . . . . . . . . . . . . . . . . . . . . . . . . . . . . . . . . . . . . . . . . . . . . 20,228 26,295Printing expenses . . . . . . . . . . . . . . . . . . . . . . . . . . . . . . . . . . . . . . . . . . . . . . . . . . . . . . . . . . . . . . . . . . . . . . . . . . . . . 108,265 (56,614)Legal and other professional fees . . . . . . . . . . . . . . . . . . . . . . . . . . . . . . . . . . . . . . . . . . . . . . . . . . . . . . . . . . . . . . . . . . 755,541 589,921Other fees . . . . . . . . . . . . . . . . . . . . . . . . . . . . . . . . . . . . . . . . . . . . . . . . . . . . . . . . . . . . . . . . . . . . . . . . . . . . . . . . . . 261,652 321,961
Total Expenses . . . . . . . . . . . . . . . . . . . . . . . . . . . . . . . . . . . . . . . . . . . . . . . . . . . . . . . . . . . . . . . . . . . . . . . 64,489,082 42,377,540Less Expense Reimbursement . . . . . . . . . . . . . . . . . . . . . . . . . . . . . . . . . . . . . . . . . . . . . . . . . . . . . . . . . . . (264,026) (274,011)Net Expenses after Expense Reimbursement . . . . . . . . . . . . . . . . . . . . . . . . . . . . . . . . . . . . . . . . . . . . . . . . 64,225,056 42,103,529Net Operating Profit . . . . . . . . . . . . . . . . . . . . . . . . . . . . . . . . . . . . . . . . . . . . . . . . . . . . . . . . . . . . . . . . . . . 198,652,454 748,890,053
Total distributions to holders of redeemable ordinary shares. . . . . . . . . . . . . . . . . . . . . . . . . . . . . . . . . . . . . . . . . . . . . . . . . – (43,978)
Withholding tax on dividends and other investment income . . . . . . . . . . . . . . . . . . . . . . . . . . . . . . . . . . . . . (10,283,345) (11,862,896)
Net Increase in Net Assets attributable to holders of redeemable ordinary shares resulting from operations . 188,369,109 736,983,179
. .
. .. . .
Statement of Changes in Net Assets Attributable to Redeemable Ordinary ShareholdersYear ended
31 December 2021
(USD)
Year ended 31 December
2020 (USD)
Increase in Net Assets attributable to holders of redeemable ordinary shares resulting from operations . . . . . . . . . . . . . . . . . . . . 188,369,109 736,983,179
Capital Share Transactions of redeemable ordinary shares:Proceeds from redeemable ordinary shares sold . . . . . . . . . . . . . . . . . . . . . . . . . . . . . . . . . . . . . . . . . . . . . . . . . . . . . . . 1,633,168,356 1,457,727,740Redemption of redeemable ordinary shares . . . . . . . . . . . . . . . . . . . . . . . . . . . . . . . . . . . . . . . . . . . . . . . . . . . . . . . . . . (1,059,748,176) (876,357,956)
Net Increase from Capital Share Transactions of redeemable ordinary shares . . . . . . . . . . . . . . . . . . . . . . . . 573,420,180 581,369,784
Net Increase in Net Assets attributable to holders of redeemable ordinary shares . . . . . . . . . . . . . . . . . . . . . . . . . . . . . . . . . . . 761,789,289 1,318,352,963Net Assets attributable to holders of redeemable ordinary shares at the beginning of the financial year . . . . . . . . . . . . . . . . . . . . 3,906,538,576 2,588,185,613
Net Assets attributable to holders of redeemable ordinary shares at the end of the financial year . . . . . . . . . 4,668,327,865 3,906,538,576
Gains and losses are solely from continuing operations except for the Funds which ceased operations during the financial year ended 31 December 2021 or 31 December 2020. There were no gains and losses other than those dealt with in the Statement of Comprehensive Income. Please refer to note 1 which details the Fund closures during the year.
DocuSign Envelope ID: 521655BF-9BE3-47DC-A9A3-494932954338

Janus Henderson Capital Funds plc / 31 December 202170
Janus Henderson Global Life Sciences Fund (Continued)
Portfolio Investments
The accompanying notes are an integral part of the financial statements.
Shares or Principal Amount
Percentage of Net Assets
(%)Fair Value
(USD)
Financial Assets at fair value through profit or lossCommon Stock (2020: 96.12% USD 3,754,598,233)BermudaBiotechnology
1,306,982 Myovant Sciences Ltd. 0.43 20,349,709
CanadaBiotechnology
502,243 Clementia Pharmaceuticals, Inc., Private Placement* – –
400,764 Essa Pharma, Inc. 0.12 5,690,8480.12 5,690,848
Cayman IslandsBiotechnology
2,531,300 Canbridge Pharmaceuticals, Inc., Private Placement 0.06 2,594,424
1,233,886 Canbridge Pharmaceuticals, Inc., Private Placement 0.03 1,405,173
1,213,647 Everest Medicines Ltd. 0.12 5,416,4340.21 9,416,031
DenmarkBiotechnology
438,033 Ascendis Pharma A/S 1.26 58,928,580
Pharmaceuticals625,109 Novo Nordisk A/S, B 1.51 70,338,579
FrancePharmaceuticals
837,130 Sanofi 1.81 84,423,163
IrelandBiotechnology
623,779 Horizon Therapeutics plc 1.44 67,218,425
Health Care Equipment & Supplies577,080 Medtronic plc 1.28 59,698,926169,607 STERIS plc 0.89 41,284,040
2.17 100,982,966
Life Sciences Tools & Services91,964 ICON plc 0.61 28,481,251
Pharmaceuticals288,649 Jazz Pharmaceuticals plc 0.79 36,773,883
JapanPharmaceuticals
2,855,800 Astellas Pharma, Inc. 1.00 46,438,094631,915 Takeda Pharmaceutical Co. Ltd. 0.37 17,233,047
1.37 63,671,141
NetherlandsBiotechnology
172,424 Argenx SE 1.29 60,381,161
SwitzerlandLife Sciences Tools & Services
21,059 Lonza Group AG 0.38 17,601,552
Pharmaceuticals1,101,438 Novartis AG 2.06 96,342,782326,693 Roche Holding AG 2.91 135,918,916
4.97 232,261,698
United KingdomBiotechnology
429,753 Bicycle Therapeutics plc 0.56 26,159,065130,459 Centessa Pharmaceuticals plc 0.03 1,468,968
Shares or Principal Amount
Percentage of Net Assets
(%)Fair Value
(USD)
625,149 Centessa Pharmaceuticals plc, Private
Placement 0.14 6,687,2190.73 34,315,252
Commercial Services & Supplies204,906 Verve Furnitures Ltd., Private
Placement 0.15 7,177,140
Diversified Financial Services259,529 Graphite Capital Partners IX LP, Private
Placement 0.07 3,064,648
Pharmaceuticals1,556,429 AstraZeneca plc 3.92 182,819,814
737,630 Royalty Pharma plc, A 0.63 29,394,5554.55 212,214,369
United StatesBiotechnology
346,919 4D Molecular Therapeutics, Inc. 0.16 7,611,4031,041,586 AbbVie, Inc. 3.02 141,030,744605,248 ACADIA Pharmaceuticals, Inc. 0.30 14,126,488905,604 Akero Therapeutics, Inc. 0.41 19,153,519642,534 Aligos Therapeutics, Inc. 0.16 7,626,879139,538 Alnylam Pharmaceuticals, Inc. 0.51 23,662,854291,204 ALX Oncology Holdings, Inc. 0.13 6,257,974
2,665,185 Amicus Therapeutics, Inc. 0.66 30,782,887145,324 Arbor Biotechnologies, Inc., Private
Placement* 0.05 2,408,019502,580 Arena Pharmaceuticals, Inc. 1.00 46,709,7851,125,753 Asher Biotherapeutics, Inc., Private
Placement* 0.05 2,261,075618,724 Attralus, Inc., Private Placement* 0.10 4,801,298482,151 BioAtla, Inc. 0.20 9,464,624
519,566 BioMarin Pharmaceutical, Inc. 0.98 45,903,656329,417 Biomea Fusion, Inc. 0.05 2,454,157
0 Black Diamond Therapeutics, Inc. 0.00 3317,801 C4 Therapeutics, Inc. 0.22 10,233,192
682,456 Cardiff Oncology, Inc. 0.09 4,101,561229,672 Caribou Biosciences, Inc. 0.07 3,465,750210,695 Caribou Biosciences, Inc., Private
Placement 0.06 3,020,418131,327 Cyteir Therapeutics, Inc. 0.03 1,493,188
446,220 Cyteir Therapeutics, Inc., Private Placement 0.10 4,819,845
998,749 Disc Medicine, Inc., Private Placement* 0.05 2,396,9981,692,219 DTX Pharma, Inc., Private Placement* 0.05 2,500,000
377,635 Element Biosciences, Inc., Private Placement* 0.17 7,762,929
208,580 Fate Therapeutics, Inc. 0.26 12,204,016658,320 Flame Biosciences, Inc., Private
Placement* 0.05 2,161,923302,982 Galecto, Inc., Private Placement 0.02 918,034569,524 Gilead Sciences, Inc. 0.89 41,353,138887,328 Global Blood Therapeutics, Inc. 0.56 25,972,091238,136 Hemoshear Therapeutics LLC, Private
Placement* 0.07 3,160,601178,710 Icosavax, Inc. 0.09 4,088,885284,818 Icosavax, Inc., Private Placement 0.13 6,190,804
1,683,857 Insmed, Inc. 0.98 45,868,26573,241 Intellia Therapeutics, Inc. 0.19 8,660,016
412,321 Janux Therapeutics, Inc. 0.17 8,135,093207,582 Janux Therapeutics, Inc., Private
Placement 0.08 3,890,81394,020 Kodiak Sciences, Inc. 0.17 7,971,01697,432 Mirati Therapeutics, Inc. 0.31 14,292,30068,808 Moderna, Inc. 0.37 17,475,856
DocuSign Envelope ID: 521655BF-9BE3-47DC-A9A3-494932954338

71Janus Henderson Capital Funds plc / 31 December 2021
The accompanying notes are an integral part of the financial statements.
Janus Henderson Global Life Sciences Fund (Continued)
Portfolio Investments
Shares or Principal Amount
Percentage of Net Assets
(%)Fair Value
(USD)
164,725 Natera, Inc. 0.33 15,383,668789,559 Neurocrine Biosciences, Inc. 1.44 67,246,740
1,025,013 Neurogene, Inc., Private Placement* 0.05 2,501,032246,281 Nuvalent, Inc., A 0.10 4,689,190268,634 Nuvalent, Inc., Private Placement 0.10 4,859,052718,064 Olema Pharmaceuticals, Inc., Private
Placement 0.14 6,721,079706,560 Praxis Precision Medicines, Inc. 0.30 13,919,232657,658 PTC Therapeutics, Inc. 0.56 26,194,518185,928 Pyxis Oncology, Inc. 0.04 2,039,630239,442 Pyxis Oncology, Inc., Private Placement 0.05 2,364,011
46,821 Regeneron Pharmaceuticals, Inc. 0.63 29,568,398941,834 Rhythm Pharmaceuticals, Inc. 0.20 9,399,503269,163 Sage Therapeutics, Inc. 0.25 11,450,194977,641 Sarepta Therapeutics, Inc. 1.89 88,036,572
1,393,935 Seres Therapeutics, Inc. 0.25 11,611,479693,106 Shoreline Biosciences, Inc., Private
Placement* 0.15 6,977,7751,134,227 Sonoma Biotherapeutics, Inc., Private
Placement* 0.05 2,241,5731,903,567 Synthekine, Inc., Private Placement* 0.12 5,460,001
912,268 Travere Therapeutics, Inc. 0.61 28,316,799492,331 Tyra Biosciences, Inc., Private
Placement 0.14 6,580,742591,513 ValenzaBio, Inc., Private Placement* 0.11 5,264,720
438,473 Vaxcyte, Inc., Private Placement 0.22 10,431,283421,915 Vertex Pharmaceuticals, Inc. 1.99 92,652,53478,223 Verve Therapeutics, Inc. 0.06 2,884,082
22.74 1,063,185,904
Building Products414,451 Designers Tops, Inc., Private Placement 0.18 8,429,726
Chemicals292,542 Biomass North America Licensing, Inc.,
Private Placement 0.04 2,070,466
Commercial Services & Supplies2,573,920 Amunix Operating, Inc., Private
Placement* 0.30 14,068,275
Health Care Equipment & Supplies968,640 Abbott Laboratories 2.92 136,326,394149,914 Align Technology, Inc. 2.11 98,520,483216,099 Bigfoot Biomedical, Inc., Private
Placement* 0.04 2,046,2952,490,939 Boston Scientific Corp. 2.27 105,815,089
111,261 Cooper Cos., Inc. (The) 1.00 46,611,683751,978 DENTSPLY SIRONA, Inc. 0.90 41,952,853110,722 Dexcom, Inc. 1.27 59,452,178
640,093 Edwards Lifesciences Corp. 1.78 82,924,048470,427 Globus Medical, Inc., A 0.73 33,964,82990,752 ICU Medical, Inc. 0.46 21,539,080
135,693 Insulet Corp. 0.77 36,103,837138,281 Intuitive Surgical, Inc. 1.06 49,684,363
1,441,449 Lexeo Therapeutics, Inc., Private Placement* 0.05 2,479,999
273,889 Silk Road Medical, Inc. 0.25 11,670,410174,521 Stryker Corp. 1.00 46,670,406
196,545 Tandem Diabetes Care, Inc. 0.63 29,583,953144,502 Teleflex, Inc. 1.02 47,466,017
18.26 852,811,917
Health Care Providers & Services515,883 Accolade, Inc. 0.29 13,598,676364,260 agilon health, Inc. 0.21 9,835,020180,834 Anthem, Inc. 1.80 83,823,792
Shares or Principal Amount
Percentage of Net Assets
(%)Fair Value
(USD)
922,635 Centene Corp. 1.63 76,025,124334,507 Day One New York, Inc., Private
Placement 0.12 5,354,621320,124 Freenome Holdings, Inc., Private
Placement* 0.08 3,735,847268,147 Humana, Inc. 2.67 124,382,667
1,126,505 LifeStance Health Group, Inc. 0.23 10,724,328408,447 Privia Health Group, Inc. 0.23 10,566,524163,962 Quest Diagnostics, Inc. 0.61 28,367,066488,653 UnitedHealth Group, Inc. 5.26 245,372,217
13.13 611,785,882
Health Care Technology411,352 Health Catalyst, Inc. 0.35 16,297,766
Life Sciences Tools & Services365,094 Danaher Corp. 2.57 120,119,577119,983 Illumina, Inc. 0.98 45,646,333227,500 IQVIA Holdings, Inc. 1.38 64,186,850464,059 NeoGenomics, Inc. 0.34 15,833,693991,615 SomaLogic, Inc. 0.25 11,542,399
554,342 SomaLogic, Inc., Private Placement 0.00 38,804481,570 Sotera Health Co. 0.24 11,340,974205,485 Thermo Fisher Scientific, Inc. 2.94 137,107,811
8.70 405,816,441
Pharmaceuticals205,690 Artiva Biotherapeutics, Inc., Private
Placement* 0.05 2,262,5901,377,818 Bristol-Myers Squibb Co. 1.84 85,906,952279,930 Catalent, Inc. 0.77 35,839,438726,999 Collegium Pharmaceutical, Inc. 0.29 13,580,341351,864 DICE Therapeutics, Inc. 0.19 8,905,678495,749 Edgewise Therapeutics, Inc., Private
Placement 0.16 7,575,0451,134,247 Elanco Animal Health, Inc. 0.69 32,189,930416,878 Eli Lilly & Co. 2.47 115,150,041437,703 Harmony Biosciences Holdings, Inc. 0.40 18,663,656243,117 Johnson & Johnson 0.89 41,590,025
1,199,370 Merck & Co., Inc. 1.97 91,919,717406,203 Phathom Pharmaceuticals, Inc. 0.17 7,990,013506,522 Rain Therapeutics, Inc., Private
Placement 0.14 6,524,003270,396 Ventyx Biosciences, Inc. 0.12 5,370,065620,765 Zogenix, Inc. 0.22 10,087,431
10.37 483,554,925
Professional Services178,241 Dice, Inc., Private Placement 0.09 4,285,716
Software258,756 Ventyx Energy LLC, Private Placement 0.10 4,625,005
Virgin Islands, BritishBiotechnology
264,957 Biohaven Pharmaceutical Holding Co. Ltd. 0.78 36,513,724
Total Common Stock 98.90 4,616,736,143
Government Obligations (2020: 0.00% USD –)US Treasury Notes/Bonds
12,200,000 0.0000%, due 4/1/22 0.26 12,200,012
Total Government Obligations 0.26 12,200,012
Preferred Stock (2020: 2.69% USD 105,405,606)
DocuSign Envelope ID: 521655BF-9BE3-47DC-A9A3-494932954338

Janus Henderson Capital Funds plc / 31 December 202172
The accompanying notes are an integral part of the financial statements.
Janus Henderson Global Life Sciences Fund (Continued)
Portfolio Investments
Shares or Principal Amount
Percentage of Net Assets
(%)Fair Value
(USD)
United KingdomRoad & Rail
548,201 Bigfoot Ltd., Private Placement* 0.11 5,191,053
United StatesHealth Care Equipment & Supplies
2,660,459 Lexeo Therapeutics, Inc., Private Placement* 0.10 4,577,293
Professional Services239,046 Freenome Holdings, Inc., Private
Placement* 0.06 2,789,667
Total Preferred Stock 0.27 12,558,013
Total Investments (Cost: USD 3,598,912,284) 99.43 4,641,494,168
Forward Currency Contracts (2020: 0.42% USD 16,471,899)Open as at 31 December 2021.
Current Market
Percentage of Net Unrealised
Currency Currency Value Settle Assets GainPurchased Sold (USD) Date (%) (USD)
.J.P. Morgan AUD◊ 11,706,270 USD 8,418,554 8,517,640 31-Jan-22 0.00 99,086
CNH◊ 4,761,729 USD 741,730 747,761 28-Jan-22 0.00 6,031
EUR◊ 625,434,126 USD 702,234,901 712,453,898 31-Jan-22 0.22 10,218,997
SGD◊ 37,836,632 USD 27,650,629 28,072,013 31-Jan-22 0.01 421,384
Total 0.23 10,745,498
.
Total Financial Assets at fair value through profit or loss 99.66 4,652,239,666
Financial Liabilities at fair value through profit or loss.Forward Currency Contracts (2020: 0.00% USD (98,475))Open as at 31 December 2021
Current Market
Percentage of Net Unrealised
Currency Currency Value Settle Assets LossPurchased Sold (USD) Date (%) (USD)
J.P. Morgan CNH◊ 47,675 USD 7,495 7,486 28-Jan-22 0.00 (9)
USD◊ 841,382 AUD 1,173,089 853,555 31-Jan-22 0.00 (12,173)
USD◊ 53,777 CNH 344,088 54,035 28-Jan-22 0.00 (258)
USD◊ 49,955,982 EUR 44,140,368 50,281,837 31-Jan-22 0.00 (325,855)
USD◊ 1,441,410 SGD 1,970,636 1,462,066 31-Jan-22 0.00 (20,656)
Total 0.00 (358,951).
Total Financial Liabilities at fair value through profit or loss 0.00 (358,951)
Portfolio Analysis (Unaudited)
Analysis of Total Assets:% of Total
AssetsTransferable securities admitted to official stock exchange listing 94.50Transferable securities dealt in on another regulated market 0.26OTC financial derivative instruments 0.23Other Assets 5.01Total Assets 100.00
* Fair valued by Janus Henderson Global Pricing Committee at 31 December 2021.◊ These forward currency contracts are used for share class hedging.
DocuSign Envelope ID: 521655BF-9BE3-47DC-A9A3-494932954338

73Janus Henderson Capital Funds plc / 31 December 2021
The accompanying notes form an integral part of the financial statements.
Janus Henderson Global Life Sciences Fund (continued)
Fair Value Hierarchy
The tables below provide the fair value hierarchy summary of the Fund’s financial assets and liabilities measured at fair value at 31 December 2021 and 31 December 2020.
31 December 2021
Level 1 - Quoted Prices
(USD)
Level 2 - Other Significant
Observable Inputs (USD)
Level 3 - Significant
Unobservable Inputs (USD)
Total (USD)
Common Stock 4,466,191,739 76,053,4541 74,490,950 4,616,736,143Forward Currency Contracts – 10,386,547 – 10,386,547Government Obligations – 12,200,012 – 12,200,012Preferred Stock – – 12,558,013 12,558,013Total Investments in Securities 4,466,191,739 98,640,013 87,048,963 4,651,880,715
1At 31 December 2021, Investments with a fair value of USD 76,014,650 had a liquidity discount applied in line with GPC pricing policies.
31 December 2020
Level 1 - Quoted Prices
(USD)
Level 2 - Other Significant
Observable Inputs (USD)
Level 3 - Significant
Unobservable Inputs (USD)
Total (USD)
Common Stock 3,171,323,857 555,610,0371,2 27,664,339 3,754,598,233Forward Currency Contracts – 16,373,424 – 16,373,424Preferred Stock – 91,648,3173 13,757,289 105,405,606Total Investments in Securities 3,171,323,857 663,631,778 41,421,628 3,876,377,263
1At 31 December 2020, the administrator used a systematic fair valuation model provided by an independent third party to value listed securities in order to adjust for stale pricing between the close of foreign exchanges and the valuation point. This resulted in a decrease of USD 100,231 to common stocks with a fair value of USD 438,521,061.
2At 31 December 2020, Investments with a fair value of USD 117,088,976 had a liquidity discount applied in line with GPC pricing policies.
3At 31 December 2020, Investments with a fair value of USD 91,648,317 had a liquidity discount applied in line with GPC pricing policies.
There were transfers on Common Stock from level 3 to level 2 and level 2 to level 1 during the financial year ended 31 December 2021.
Valuation policy of private placements is referenced in note 2 of the financial statements.
The following tables present level 3 positions that were fair valued by the Janus Henderson Global Pricing Committee at 31 December 2021 and 31 December 2020.
Security Name
Fair Value at 31 December 2021
(USD)Fair Value as a %
of Net Assets Valuation MethodAmunix Operating, Inc., Private Placement
14,068,275 0.30%Discounted Cash Flow
("DCF") ModelArbor Biotechnologies, Inc., Private Placement 2,408,019 0.05% Valued at costArtiva Biotherapeutics, Inc., Private Placement 2,262,590 0.05% Valued at costAsher Biotherapeutics, Inc., Private Placement 2,261,075 0.05% Valued at costAttralus, Inc., Private Placement 4,801,298 0.10% Valued at costBigfoot Biomedical, Inc., Private Placement 2,046,295 0.04% Valued at costBigfoot Ltd., Private Placement 5,191,053 0.11% Valued at costClementia Pharmaceuticals, Inc., Private Placement – – Valued at zeroDisc Medicine, Inc., Private Placement 2,396,998 0.05% Valued at costDTX Pharma, Inc., Private Placement 2,500,000 0.05% Valued at costElement Biosciences, Inc., Private Placement 7,762,929 0.17% Valued at costFlame Biosciences, Inc., Private Placement 2,161,923 0.05% Liquidation value
DocuSign Envelope ID: 521655BF-9BE3-47DC-A9A3-494932954338

Janus Henderson Capital Funds plc / 31 December 202174
Janus Henderson Global Life Sciences Fund (continued)
The accompanying notes form an integral part of the financial statements.
Freenome Holdings, Inc., Private Placement3,735,847 0.08%
Valued at cost of most recent funding
Freenome Holdings, Inc., Private Placement2,789,667 0.06%
Valued at cost of most recent funding
Hemoshear Therapeutics LLC, Private Placement 3,160,601 0.07% Valued at costLexeo Therapeutics, Inc., Private Placement 2,479,999 0.05% Valued at costLexeo Therapeutics, Inc., Private Placement
4,577,293 0.10%Valued at cost of most
recent fundingNeurogene, Inc., Private Placement 2,501,032 0.05% Valued at costShoreline Biosciences, Inc., Private Placement 6,977,775 0.15% Valued at costSonoma Biotherapeutics, Inc., Private Placement 2,241,573 0.05% Valued at costSynthekine, Inc., Private Placement 5,460,001 0.12% Valued at costValenzaBio, Inc., Private Placement 5,264,720 0.11% Valued at cost
Total 87,048,963
Security Name
Fair Value at 31 December 2020
(USD)Fair Value as a %
of Net Assets Valuation MethodAcerta Pharma LLC
6,511,316 0.17%Discounted Cash Flow
("DCF") Model Bigfoot Biomedical, Inc. 2,046,295 0.05% Valued at cost Bigfoot Ltd. 5,191,052 0.13% Valued at cost Biomass North America Licensing, Inc. 2,318,827 0.06% Valued at cost Clementia Pharmaceuticals, Inc., CVR 0 0.00% Valued at zeroEdgewise Technologies LLC 2,975,464 0.08% Valued at cost Flame Biosciences, Inc. 4,311,996 0.11% Valued at cost Freemont Holdings, Inc. Series C 1,580,883 0.04% Valued at cost Inivata Ltd. 2,228,340 0.06% Valued at cost Lexel Corp. 985,355 0.02% Valued at cost Neurogene, Inc. 1,500,620 0.04% Valued at cost Rain Therapeutics, Inc.Series E 2,013,042 0.05% Valued at cost Sojourner Center 5,999,999 0.15% Valued at cost SomaLogic, Inc. 3,758,439 0.10% Valued at cost
Total 41,421,628
DocuSign Envelope ID: 521655BF-9BE3-47DC-A9A3-494932954338

75Janus Henderson Capital Funds plc / 31 December 2021
Janus Henderson Global Life Sciences Fund (continued)
The accompanying notes form an integral part of the financial statements.
Capital Share Transactions
For the financial year ended 31 December 2021
A2 HAUD A2 HCNH A2 HEUR A2 HKD A2 HSGD A2 SGD A2 USD A2 EURShares Shares Shares Shares Shares Shares Shares Shares
At beginning of the year . . . . . . . 425,853 110,548 4,302,751 2,364,855 580,574 471,781 14,086,544 –Shares issued 361,711 237,261 1,975,438 2,930,805 432,326 341,396 6,029,811 187,561Shares redeemed. . . . . . . . . . . (384,472) (159,685) (1,476,957) (1,583,752) (85,117) (206,479) (4,575,887) (8,796)At end of year . . . . . . . . . . . . . 403,092 188,124 4,801,232 3,711,908 927,783 606,698 15,540,468 178,765
B2 USD E2 HEUR E2 USD H1 GBP H1 USD H2 EUR H2 GBP H2 HEURShares Shares Shares Shares Shares Shares Shares Shares
At beginning of the year . . . . . . . 278,284 640,210 1,190,631 1,278,232 2,768,568 2,507,447 226,883 6,832,514Shares issued 1,077 183,948 483,326 268,137 614,348 1,952,838 57,187 3,410,435Shares redeemed. . . . . . . . . . . (61,594) (181,082) (285,434) (209,397) (409,602) (691,119) (55,550) (2,833,482)At end of year . . . . . . . . . . . . . 217,767 643,076 1,388,523 1,336,972 2,973,314 3,769,166 228,520 7,409,467
H2 USD I1 USD I2 EUR I2 HEUR I2 HSGD I2 USD I2 HAUD I2 HKDShares Shares Shares Shares Shares Shares Shares Shares
At beginning of the year . . . . . . . 22,044,134 5,269 187,013 3,548,806 546,345 22,833,665 – –Shares issued 6,299,770 – 189,425 671,887 1,135,266 13,237,842 388 2,329Shares redeemed. . . . . . . . . . . (9,919,982) (1,529) (93,583) (662,791) (209,161) (4,733,867) – –At end of year . . . . . . . . . . . . . 18,423,922 3,740 282,855 3,557,902 1,472,450 31,337,640 388 2,329
V2 HEUR V2 USD Z2 USDShares Shares Shares
At beginning of the year . . . . . . . 6,467 52,529 1,931,673Shares issued 18,186 141,496 –Shares redeemed. . . . . . . . . . . (13,576) (100,120) –At end of year . . . . . . . . . . . . . 11,077 93,905 1,931,673
For the financial year ended 31 December 2020
A2 HAUD A2 HCNH A2 HEUR A2 HKD A2 HSGD A2 SGD A2 USD B2 USDShares Shares Shares Shares Shares Shares Shares Shares
At beginning of the year . . . . . . . 383,969 96,779 3,441,584 2,412,730 211,700 130,218 12,153,215 315,977Shares issued 881,708 113,983 1,911,125 2,908,763 538,783 548,528 8,622,114 –Shares redeemed. . . . . . . . . . . (839,824) (100,214) (1,049,958) (2,956,638) (169,909) (206,965) (6,688,785) (37,693)At end of year . . . . . . . . . . . . . 425,853 110,548 4,302,751 2,364,855 580,574 471,781 14,086,544 278,284
E2 HEUR E2 USD H1 GBP H1 USD H2 EUR H2 GBP H2 HEUR H2 USDShares Shares Shares Shares Shares Shares Shares Shares
At beginning of the year . . . . . . . 499,689 810,002 1,132,799 2,840,083 579,125 234,644 5,008,383 18,531,123Shares issued 302,466 811,436 460,296 891,355 2,434,815 75,480 3,924,316 8,749,647Shares redeemed. . . . . . . . . . . (161,945) (430,807) (314,863) (962,870) (506,493) (83,241) (2,100,185) (5,236,636)At end of year . . . . . . . . . . . . . 640,210 1,190,631 1,278,232 2,768,568 2,507,447 226,883 6,832,514 22,044,134
I1 USD I2 EUR I2 HEUR I2 HSGD I2 USD V2 HEUR V2 USD Z2 USDShares Shares Shares Shares Shares Shares Shares Shares
At beginning of the year . . . . . . . 3,740 199,718 2,989,043 5,160 18,537,968 16,982 39,032 1,931,673Shares issued 1,529 341,146 1,265,207 560,105 10,626,381 9,167 166,657 –Shares redeemed. . . . . . . . . . . – (353,851) (705,444) (18,920) (6,330,684) (19,682) (153,160) –At end of year . . . . . . . . . . . . . 5,269 187,013 3,548,806 546,345 22,833,665 6,467 52,529 1,931,673
DocuSign Envelope ID: 521655BF-9BE3-47DC-A9A3-494932954338

Janus Henderson Capital Funds plc / 31 December 202176
Janus Henderson Global Life Sciences Fund (continued)
The accompanying notes form an integral part of the financial statements.
Net Asset Comparison
31 December 2021 31 December 2020 31 December 2019
Net Assets (USD)
NAV Per Share
(Local Currency)Net Assets
(USD)
NAV Per Share
(Local Currency)Net Assets
(USD)
NAV Per Share
(Local Currency)
A2 HAUD 7,629,450 26 .02 8,220,900 25 .04 5,598,700 20 .78
A2 HCNH 700,231 23 .66 374,512 22 .03 245,784 17 .68
A2 HEUR 241,620,510 44 .20 224,184,518 42 .65 135,832,681 35 .19
A2 HKD 8,003,305 16 .81 4,867,490 15 .96 4,023,799 12 .99
A2 HSGD 9,944,716 14 .44 6,065,454 13 .81 1,780,855 11 .31
A2 SGD 6,583,768 14 .62 4,887,145 13 .69 1,092,873 11 .28
A2 USD 779,178,531 50 .14 674,290,968 47 .87 471,346,610 38 .78
A2 EUR 2,316,414 11 .38 – – – – B2 USD 8,742,105 40 .14 10,775,546 38 .72 10,012,469 31 .69
E2 HEUR 16,058,261 21 .93 16,633,666 21 .27 9,879,586 17 .63
E2 USD 35,218,022 25 .36 28,975,215 24 .34 16,052,529 19 .82
H1 GBP 50,089,948 27 .68 45,030,356 25 .76 31,881,057 21 .25
H1 USD 68,859,881 23 .16 60,288,891 21 .78 49,403,719 17 .40
H2 EUR 111,845,006 26 .06 69,964,097 22 .84 12,900,116 19 .86
H2 GBP 15,472,648 50 .02 14,444,746 46 .56 11,925,997 38 .38
H2 HEUR 222,905,412 26 .42 209,640,704 25 .12 114,685,439 20 .42
H2 USD 555,425,396 30 .15 624,886,451 28 .35 419,359,961 22 .63
I1 USD 77,845 20 .81 103,850 19 .71 59,263 15 .85
I2 EUR 7,991,279 24 .82 5,003,414 21 .90 4,295,044 19 .17
I2 HEUR 177,462,214 43 .81 181,799,491 41 .93 115,084,703 34 .33
I2 HSGD 16,566,870 15 .16 5,944,126 14 .38 44,846 11 .69
I2 USD 1,886,882,930 60 .21 1,301,913,258 57 .02 849,734,794 45 .84
I2 HAUD 3,055 10 .82 – – – – I2 HKD 3,261 10 .92 – – – – V2 HEUR 194,859 15 .45 117,597 14 .88 233,990 12 .28
V2 USD 1,656,293 17 .64 884,703 16 .84 532,668 13 .65
Z2 USD 436,895,655 226 .17 407,241,478 210 .82 322,178,130 166 .79. . .
DocuSign Envelope ID: 521655BF-9BE3-47DC-A9A3-494932954338

77Janus Henderson Capital Funds plc / 31 December 2021
Janus Henderson Global Life Sciences Fund (continued)
The accompanying notes form an integral part of the financial statements.
Total Expense Ratio (unaudited)
The Average Total Expense Ratio table shows the actual expenses, excluding transactions costs and trade commissions, incurred by each Class for the Fund during the reporting financial year expressed as a percentage of the average net assets for the corresponding year, on an annualised basis.
31 December 2021 31 December 2020 31 December 2019A2 HAUD 2.38% 2.35% 2.40%A2 HCNH 2.38% 2.37% 2.39%A2 HEUR 2.38% 2.38% 2.40%A2 HKD 2.37% 2.37% 2.40%A2 HSGD 2.37% 2.37% 2.39%A2 SGD 2.37% 2.38% 2.38%A2 USD 2.38% 2.37% 2.40%A2 EUR* 2.34% – –B2 USD 3.39% 3.37% 3.40%E2 HEUR 2.87% 2.88% 2.90%E2 USD 2.88% 2.88% 2.90%H1 GBP 0.85% 0.88% 0.95%H1 USD 0.85% 0.89% 0.95%H2 EUR 0.85% 0.87% 0.94%H2 GBP 0.86% 0.89% 0.95%H2 HEUR 0.85% 0.87% 0.95%H2 USD 0.85% 0.88% 0.95%I1 USD 1.57% 1.59% 1.64%I2 EUR 1.56% 1.59% 1.65%I2 HEUR 1.56% 1.58% 1.65%I2 HSGD 1.56% 1.58% 1.64%I2 USD 1.56% 1.58% 1.65%I2 HAUD* 1.50% – –I2 HKD* 1.49% – –V2 HEUR 2.37% 2.40% 2.40%V2 USD 2.39% 2.39% 2.41%
*As the share class launched during the year, an estimated Total Expense Ratio is disclosed for the year end.
DocuSign Envelope ID: 521655BF-9BE3-47DC-A9A3-494932954338

Janus Henderson Capital Funds plc / 31 December 202178
Janus Henderson Global Life Sciences Fund (continued)
The accompanying notes form an integral part of the financial statements.
Distribution per share
This fund distributes annually and the fund had a nil distribution as at Ex-date 15 April 2021.
Fund Performance (unaudited)
As at 31 December 2021
One year Three years Five yearsSince
inception
Performance (Annualised) 31/12/2020 31/12/2021
%
31/12/2017 31/12/2021
%
31/12/2015 31/12/2021
%
to 31/12/2021
%
H2 USD (Net)* 6.35 17.98** 15.09** 7.69**MSCI World Health Care NR 19.80 18.78 15.54 8.36
Five years 31/12/2015 31/12/2021
%H2 USD (Gross)* 17.88MSCI World Health Care NR + 2.00% 17.85
.
Discrete performance
31/12/2020 31/12/2021
%
31/12/2019 31/12/2020
%
31/12/2018 31/12/2019
%
31/12/2017 31/12/2018
%
31/12/2016 31/12/2017
%
H2 USD (Net)* 6.35 23.41** 27.06** 2.01** 20.55**MSCI World Health Care NR 19.80 13.52 23.24 2.51 19.80
H2 USD (Gross)* 7.27 26.38** 30.11** 4.47** 23.50**MSCI World Health Care NR + 2.00% 22.20 15.79 25.71 4.57 22.19
. . . . .
Class H2 USD is disclosed as it is the representative share class.
* The representative share class has changed from the A2 USD to the H2 USD share class with effect from August 2021.
** Historical figures are based on the A2 USD share class.
Performance target: To outperform the MSCI World Health Care NR Index by at least 2% per annum, before the deduction of charges, over any 5 year period.
The Total Expense Ratio includes fees payable to Distributors. Where the Total Expense Ratio exceeds the target outperformance relative to the benchmark the return is likely to be below the benchmark return, even when the Fund’s outperformance target (before the deduction of charges) has been achieved.
Please note the Gross Returns 5 year annualised table is only applicable for share classes which have been active for 5 or more years and the performance target is to be achieved over a specific annualised time period. Performance target and index shown in USD.
Past performance does not guarantee future returns. The rates of return will vary and the principal value of an investment will fluctuate. Shares, if redeemed, may be worth more or less than their original cost. The performance data does not take account of the commissions and costs incurred on the issue and redemption of Shares. All returns are calculated in the base currency of the representative Share Class.
There is no guarantee that the Fund’s performance will match or exceed the benchmark.
DocuSign Envelope ID: 521655BF-9BE3-47DC-A9A3-494932954338

79Janus Henderson Capital Funds plc / 31 December 2021
Janus Henderson Global Life Sciences Fund (continued)
Statements of Changes in Composition of Portfolio (unaudited)The tables below show a breakdown of material purchases and sales of the Investment Portfolio in accordance with Central Bank UCITS Regulations 79(2) requirements. All purchases and sales of investments exceeding 1% of the total value of each transaction respectively, are disclosed, with a minimum number of 20 of each such transaction. A full analysis of the movement on the Investment Portfolio is available upon request from the registered office.
Major Purchases for the year ended 31 December 2021
Shares or Principal Amount
Cost (USD)
Credit Agricole Corporate And Investment Bank, 0.0000%, due 27/8/21 76,700,000 76,699,915Credit Agricole Corporate And Investment Bank, 0.0000%, due 16/2/21 63,400,000 63,399,577Credit Industriel et Commercial, 0.0000%, due 24/5/21 63,300,000 63,299,789Credit Agricole Corporate And Investment Bank, 0.0000%, due 12/2/21 59,600,000 59,599,901AstraZeneca plc 547,221 59,131,162Credit Agricole Corporate And Investment Bank, 0.0000%, due 20/1/21 58,400,000 58,399,886Credit Agricole Corporate And Investment Bank, 0.0000%, due 17/2/21 58,200,000 58,199,903Sarepta Therapeutics, Inc. 696,482 56,995,799Credit Agricole Corporate And Investment Bank, 0.0000%, due 22/1/21 55,300,000 55,299,892Credit Industriel et Commercial, 0.0000%, due 2/7/21 54,200,000 54,199,880Align Technology, Inc. 84,238 53,141,223UnitedHealth Group, Inc. 136,236 52,819,509Credit Agricole Corporate And Investment Bank, 0.0000%, due 27/1/21 52,400,000 52,399,898Credit Industriel et Commercial, 0.0000%, due 12/7/21 50,800,000 50,799,661Credit Agricole Corporate And Investment Bank, 0.0000%, due 19/1/21 49,500,000 49,499,615Credit Agricole Corporate And Investment Bank, 0.0000%, due 1/2/21 48,500,000 48,499,757Vertex Pharmaceuticals, Inc. 229,268 48,311,903Credit Agricole Corporate And Investment Bank, 0.0000%, due 25/1/21 47,700,000 47,699,722Credit Agricole Corporate And Investment Bank, 0.0000%, due 26/1/21 47,600,000 47,599,907Credit Agricole Corporate And Investment Bank, 0.0000%, due 21/1/21 46,800,000 46,799,909
Major Sales for the year ended 31 December 2021
Shares or Principal Amount
Proceeds (USD)
GW Pharmaceuticals Ltd. 299,668 61,914,333Alexion Pharmaceuticals, Inc. 380,552 59,745,603Merck & Co., Inc. 598,254 47,309,859Eli Lilly & Co. 206,840 41,440,290Acceleron Pharma, Inc. 238,729 38,861,297AbbVie, Inc. 330,642 37,408,916Moderna, Inc. 132,895 35,735,366AstraZeneca plc 296,323 33,793,902Novartis AG 358,084 31,296,820Baxter International, Inc. 381,209 29,911,576Roche Holding AG 67,339 25,519,168Medtronic plc 214,088 24,241,428Johnson & Johnson 133,409 22,171,798Horizon Therapeutics plc 241,069 21,975,446Vertex Pharmaceuticals, Inc. 108,952 21,833,245IQVIA Holdings, Inc. 88,984 21,432,621Elanco Animal Health, Inc. 672,085 20,862,383iTeos Therapeutics, Inc. 658,729 19,779,038Forma Therapeutics Holdings, Inc. 632,455 18,823,586Boston Scientific Corp. 430,549 18,030,503Neurocrine Biosciences, Inc. 167,200 17,379,879Novavax, Inc. 92,557 17,116,157UnitedHealth Group, Inc. 40,608 16,802,900Shattuck Labs, Inc. 543,466 15,515,650Illumina, Inc. 31,180 14,397,757BioMarin Pharmaceutical, Inc. 169,707 13,705,273Catalent, Inc. 117,490 13,585,036agilon health, Inc. 365,139 12,563,553ALX Oncology Holdings, Inc. 185,698 12,472,579Dexcom, Inc. 21,524 12,453,858
DocuSign Envelope ID: 521655BF-9BE3-47DC-A9A3-494932954338

Janus Henderson Global Research Fund
Janus Henderson Capital Funds plc / 31 December 202180
Fund Overview (unaudited)Investment Objective and Policy
The Fund aims to provide capital growth over the long term.
Performance target: To outperform the MSCI World Index NR by at least 2% per annum, before the deduction of charges, over any 5 year period.
The Fund invests at least 80% of its assets in shares (also known as equities) of mainly larger companies, in any industry, in any country.
The Fund is actively managed with reference to the MSCI World Index NR, which is broadly representative of the companies in which it may invest, as this forms the basis of the Fund’s performance target. The investment manager has discretion to choose individual investments for the Fund with weightings different to the index or not in the index, but at times the Fund may hold investments similar to the index. The investment manager will seek to maintain the portfolio with sector weightings close to those of the index.
How Sustainability Risks are part of the investment processThe investments underlying this financial product (referred to as the Fund) do not take into account the EU criteria for environmentally sustainable economic activities, although the Manager and the Investment Manager have agreed a decision making process that will apply to investment decisions relating to the Fund as further detailed in the Prospectus.
The likely impacts of sustainability risks on the returns of the FundWhile the analysis of (Environmental, Social and Governance) ESG factors is an integral component across the Investment Manager’s investment capabilities and one of a number of inputs to the selection of investments and portfolio construction, the investment process of the Investment Manager is primarily designed to maximise long-term risk-adjusted returns for investors. Therefore, in managing the Fund, the Investment Manager does not maximise portfolio alignment with sustainability risks as a separate goal in its own right nor does it precisely attribute the impact of ESG factors on returns for the Fund.
Fund Overview
Janus Henderson Central Research Team, portfolio managers
For the year ended 31 December 2021, the Janus Global Research Fund Class H2 US dollar terms returned 17.72% (Net) and 18.96% (Gross), compared with 21.82% and 24.25% Target (Gross) for its benchmark, the MSCI World Index NR.
On an individual stock basis, the top detractors included Sands China, a resort developer and operator in Macau.
The Chinese government’s announcement that it will increase regulatory oversight in several industries triggered a downturn in China-based stocks, including Sands China. Adding to share weakness were tighter travel restrictions into Macau amid new COVID-19 outbreaks. We maintained our confidence in Sands China.
Another notable detractor was Latin America-based e-commerce retailer MercadoLibre, which struggled amid global logistics headwinds. Further pressuring the stock was the company’s decision to sell a million shares at a discount of approximately 5% to its closing price, thereby diluting the value of the stock for existing shareholders. Nonetheless, we remained impressed with the growth trends in MercadoLibre’s e-commerce marketplace and payments network. We took the view that the company was well positioned in Latin America, where e-commerce and digital banking penetration is still low.
Fidelity National Information Services (FIS), a provider of software solutions for the financial services industry, also weighed on relative results. The shares declined on worries that FIS’ solutions are becoming ‘legacy’ technology and concerns about new financial technology competitors. We were encouraged by the growth metrics of FIS’ merchant and banking segments, and maintained our position in the stock.
Despite the disappointing short-term performance of these stocks, a number of holdings contributed to the Fund’s results. Semiconductor capital equipment manufacturer ASML was among the top contributors. As long-term secular demand continued to increase in the semiconductor market, ASML benefited from expanding capital investment plans across the industry, with sizable investments by Samsung Electronics and Taiwan Semiconductor Manufacturing Company, in particular. Broadening adoption of extreme ultraviolet (EUV) lithography across device types along with accelerated investment in upgrading leading-edge semiconductor manufacturing continued to support our view of ASML.
Investment firm Blackstone also delivered strong results. Performance in the company’s portfolios has been generally strong as a result of the economic reopening. Notable increases in fee-related earnings and solid fundraising also helped the company log strong financial results.
Another key contributor was Ferguson, a leading global distributor of plumbing and heating supplies. Although Ferguson is a UK-listed stock, 95% of its revenue is generated in the U.S. This motivated the company to register for a secondary listing on the New York Stock Exchange (NYSE), which was completed in March 2021, and, more recently, to propose moving its primary listing from the U.K. to the U.S. Shareholders are expected to vote on the proposal in early 2022. Since trading on the NYSE, U.S. investors have bid the stock higher, bringing it more in-line with the higher valuations of Ferguson’s U.S. peers.
DocuSign Envelope ID: 521655BF-9BE3-47DC-A9A3-494932954338

81Janus Henderson Capital Funds plc / 31 December 2021
Janus Henderson Global Research Fund (continued)
Fund Overview (unaudited) (continued)
Further boosting the stock were strong quarterly earnings driven by market share gains and substantial sales growth. We welcomed Ferguson’s continued focus on its U.S. business, which has a history of gaining market share and improving margins.
Thank you for investing in the Janus Henderson Global Research Fund.
January 2022
DocuSign Envelope ID: 521655BF-9BE3-47DC-A9A3-494932954338
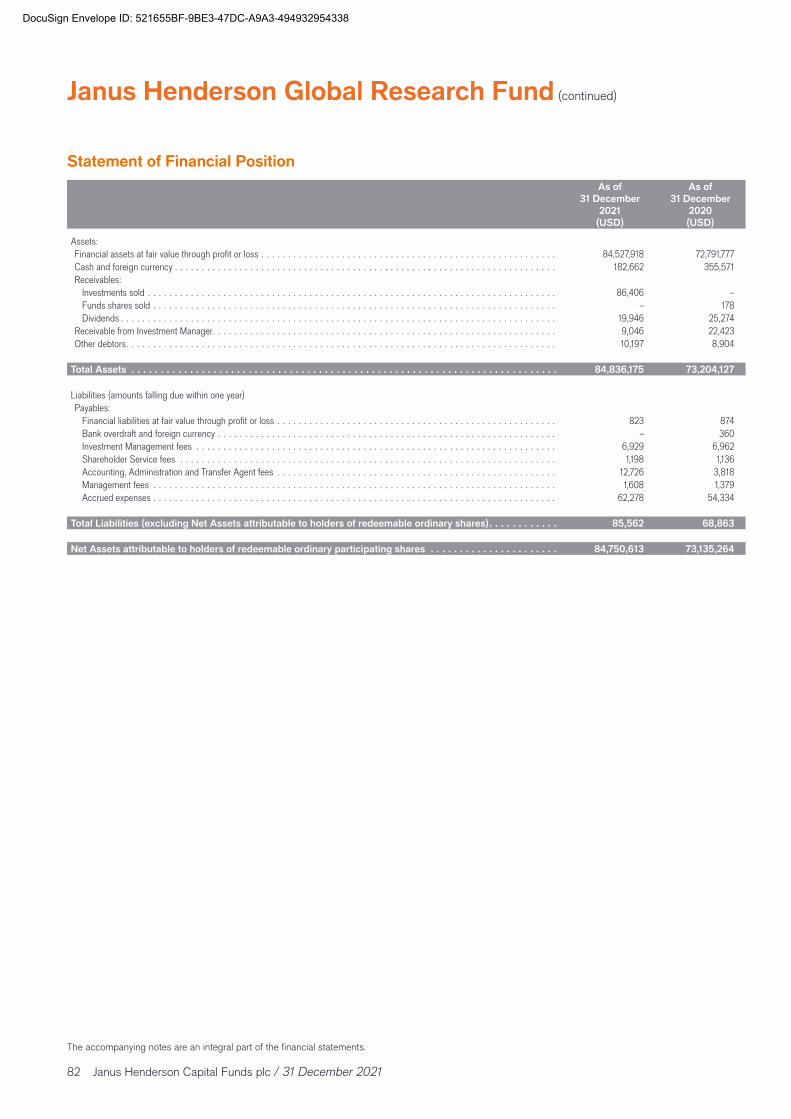
Janus Henderson Capital Funds plc / 31 December 202182
The accompanying notes are an integral part of the financial statements.
Janus Henderson Global Research Fund (continued)
s
Statement of Financial PositionAs of
31 December 2021
(USD)
As of 31 December
2020 (USD)
Assets:Financial assets at fair value through profit or loss . . . . . . . . . . . . . . . . . . . . . . . . . . . . . . . . . . . . . . . . . . . . . . . . . . . . . . . 84,527,918 72,791,777Cash and foreign currency . . . . . . . . . . . . . . . . . . . . . . . . . . . . . . . . . . . . . . . . . . . . . . . . . . . . . . . . . . . . . . . . . . . . . . . 182,662 355,571Receivables:
Investments sold . . . . . . . . . . . . . . . . . . . . . . . . . . . . . . . . . . . . . . . . . . . . . . . . . . . . . . . . . . . . . . . . . . . . . . . . . . . . 86,406 –Funds shares sold . . . . . . . . . . . . . . . . . . . . . . . . . . . . . . . . . . . . . . . . . . . . . . . . . . . . . . . . . . . . . . . . . . . . . . . . . . . – 178Dividends . . . . . . . . . . . . . . . . . . . . . . . . . . . . . . . . . . . . . . . . . . . . . . . . . . . . . . . . . . . . . . . . . . . . . . . . . . . . . . . . . 19,946 25,274
Receivable from Investment Manager . . . . . . . . . . . . . . . . . . . . . . . . . . . . . . . . . . . . . . . . . . . . . . . . . . . . . . . . . . . . . . . . 9,046 22,423Other debtors . . . . . . . . . . . . . . . . . . . . . . . . . . . . . . . . . . . . . . . . . . . . . . . . . . . . . . . . . . . . . . . . . . . . . . . . . . . . . . . . 10,197 8,904
Total Assets . . . . . . . . . . . . . . . . . . . . . . . . . . . . . . . . . . . . . . . . . . . . . . . . . . . . . . . . . . . . . . . . . . . . . . . . . 84,836,175 73,204,127 Liabilities (amounts falling due within one year)Payables:
Financial liabilities at fair value through profit or loss . . . . . . . . . . . . . . . . . . . . . . . . . . . . . . . . . . . . . . . . . . . . . . . . . . . . 823 874Bank overdraft and foreign currency . . . . . . . . . . . . . . . . . . . . . . . . . . . . . . . . . . . . . . . . . . . . . . . . . . . . . . . . . . . . . . . – 360Investment Management fees . . . . . . . . . . . . . . . . . . . . . . . . . . . . . . . . . . . . . . . . . . . . . . . . . . . . . . . . . . . . . . . . . . . 6,929 6,962Shareholder Service fees . . . . . . . . . . . . . . . . . . . . . . . . . . . . . . . . . . . . . . . . . . . . . . . . . . . . . . . . . . . . . . . . . . . . . . 1,198 1,136Accounting, Administration and Transfer Agent fees . . . . . . . . . . . . . . . . . . . . . . . . . . . . . . . . . . . . . . . . . . . . . . . . . . . . 12,726 3,818Management fees . . . . . . . . . . . . . . . . . . . . . . . . . . . . . . . . . . . . . . . . . . . . . . . . . . . . . . . . . . . . . . . . . . . . . . . . . . . 1,608 1,379Accrued expenses . . . . . . . . . . . . . . . . . . . . . . . . . . . . . . . . . . . . . . . . . . . . . . . . . . . . . . . . . . . . . . . . . . . . . . . . . . . 62,278 54,334
Total Liabilities (excluding Net Assets attributable to holders of redeemable ordinary shares) . . . . . . . . . . . . 85,562 68,863 Net Assets attributable to holders of redeemable ordinary participating shares . . . . . . . . . . . . . . . . . . . . . . 84,750,613 73,135,264
.
DocuSign Envelope ID: 521655BF-9BE3-47DC-A9A3-494932954338

83Janus Henderson Capital Funds plc / 31 December 2021
Janus Henderson Global Research Fund (continued)
The accompanying notes are an integral part of the financial statements.
Statement of Comprehensive IncomeYear ended
31 December 2021
(USD)
Year ended 31 December
2020 (USD)
Year ended Year endedRevenue:Interest income . . . . . . . . . . . . . . . . . . . . . . . . . . . . . . . . . . . . . . . . . . . . . . . . . . . . . . . . . . . . . . . . . . . . . . . . . . . . . . . 578 506Dividend income . . . . . . . . . . . . . . . . . . . . . . . . . . . . . . . . . . . . . . . . . . . . . . . . . . . . . . . . . . . . . . . . . . . . . . . . . . . . . . 1,122,764 868,719Other income . . . . . . . . . . . . . . . . . . . . . . . . . . . . . . . . . . . . . . . . . . . . . . . . . . . . . . . . . . . . . . . . . . . . . . . . . . . . . . . . 5,672 37
Net gain on financial assets and liabilities at fair value through profit or loss . . . . . . . . . . . . . . . . . . . . . . . . . . . . . . . . . . . . . . 13,292,328 11,542,420 Total Investments Income . . . . . . . . . . . . . . . . . . . . . . . . . . . . . . . . . . . . . . . . . . . . . . . . . . . . . . . . . . . . . . . 14,421,342 12,411,682
Expenses:Investment Management fees . . . . . . . . . . . . . . . . . . . . . . . . . . . . . . . . . . . . . . . . . . . . . . . . . . . . . . . . . . . . . . . . . . . . . 110,355 28,351Shareholder Service fees . . . . . . . . . . . . . . . . . . . . . . . . . . . . . . . . . . . . . . . . . . . . . . . . . . . . . . . . . . . . . . . . . . . . . . . . 14,955 11,489Management fees . . . . . . . . . . . . . . . . . . . . . . . . . . . . . . . . . . . . . . . . . . . . . . . . . . . . . . . . . . . . . . . . . . . . . . . . . . . . . 19,862 7,434Accounting, Administration and Transfer Agent fees . . . . . . . . . . . . . . . . . . . . . . . . . . . . . . . . . . . . . . . . . . . . . . . . . . . . . . 55,307 23,998Custodian fees . . . . . . . . . . . . . . . . . . . . . . . . . . . . . . . . . . . . . . . . . . . . . . . . . . . . . . . . . . . . . . . . . . . . . . . . . . . . . . . 32,252 24,898Audit fees . . . . . . . . . . . . . . . . . . . . . . . . . . . . . . . . . . . . . . . . . . . . . . . . . . . . . . . . . . . . . . . . . . . . . . . . . . . . . . . . . . 22,498 29,433Printing expenses . . . . . . . . . . . . . . . . . . . . . . . . . . . . . . . . . . . . . . . . . . . . . . . . . . . . . . . . . . . . . . . . . . . . . . . . . . . . . 2,467 3,148Legal and other professional fees . . . . . . . . . . . . . . . . . . . . . . . . . . . . . . . . . . . . . . . . . . . . . . . . . . . . . . . . . . . . . . . . . . 11,792 24,441Other fees . . . . . . . . . . . . . . . . . . . . . . . . . . . . . . . . . . . . . . . . . . . . . . . . . . . . . . . . . . . . . . . . . . . . . . . . . . . . . . . . . . 27,822 18,360
Total Expenses . . . . . . . . . . . . . . . . . . . . . . . . . . . . . . . . . . . . . . . . . . . . . . . . . . . . . . . . . . . . . . . . . . . . . . . 297,310 171,552Less Expense Reimbursement . . . . . . . . . . . . . . . . . . . . . . . . . . . . . . . . . . . . . . . . . . . . . . . . . . . . . . . . . . . (147,454) (128,401)Net Expenses after Expense Reimbursement . . . . . . . . . . . . . . . . . . . . . . . . . . . . . . . . . . . . . . . . . . . . . . . . 149,856 43,151Net Operating Profit . . . . . . . . . . . . . . . . . . . . . . . . . . . . . . . . . . . . . . . . . . . . . . . . . . . . . . . . . . . . . . . . . . . 14,271,486 12,368,531
Finance Costs: 738,979 660,908
Total distributions to holders of redeemable ordinary shares. . . . . . . . . . . . . . . . . . . . . . . . . . . . . . . . . . . . . . . . . . . . . . . . . (738,979) (660,908) Withholding tax on dividends and other investment income . . . . . . . . . . . . . . . . . . . . . . . . . . . . . . . . . . . . . (236,024) (180,206)
Net Increase in Net Assets attributable to holders of redeemable ordinary shares resulting from operations . 13,296,483 11,527,417
. .
. .. . .
Statement of Changes in Net Assets Attributable to Redeemable Ordinary ShareholdersYear ended
31 December 2021
(USD)
Year ended 31 December
2020 (USD)
Increase in Net Assets attributable to holders of redeemable ordinary shares resulting from operations . . . . . . . . . . . . . . . . . . . . 13,296,483 11,527,417
Capital Share Transactions of redeemable ordinary shares:Proceeds from redeemable ordinary shares sold . . . . . . . . . . . . . . . . . . . . . . . . . . . . . . . . . . . . . . . . . . . . . . . . . . . . . . . 5,146,682 5,880,244Redemption of redeemable ordinary shares . . . . . . . . . . . . . . . . . . . . . . . . . . . . . . . . . . . . . . . . . . . . . . . . . . . . . . . . . . (6,831,513) (401,223)Dilution Adjustment. . . . . . . . . . . . . . . . . . . . . . . . . . . . . . . . . . . . . . . . . . . . . . . . . . . . . . . . . . . . . . . . . . . . . . . . . . . 3,697 4,047
Net (Decrease)/Increase from Capital Share Transactions of redeemable ordinary shares . . . . . . . . . . . . . . (1,681,134) 5,483,068
Net Increase in Net Assets attributable to holders of redeemable ordinary shares . . . . . . . . . . . . . . . . . . . . . . . . . . . . . . . . . . . 11,615,349 17,010,485Net Assets attributable to holders of redeemable ordinary shares at the beginning of the financial year . . . . . . . . . . . . . . . . . . . . 73,135,264 56,124,779
Net Assets attributable to holders of redeemable ordinary shares at the end of the financial year . . . . . . . . . 84,750,613 73,135,264
Gains and losses are solely from continuing operations except for the Funds which ceased operations during the financial year ended 31 December 2021 or 31 December 2020. There were no gains and losses other than those dealt with in the Statement of Comprehensive Income. Please refer to note 1 which details the Fund closures during the year.
DocuSign Envelope ID: 521655BF-9BE3-47DC-A9A3-494932954338

Janus Henderson Capital Funds plc / 31 December 202184
Janus Henderson Global Research Fund (continued)
Portfolio Investments
The accompanying notes are an integral part of the financial statements.
Shares or Principal Amount
Percentage of Net Assets
(%)Fair Value
(USD)
Financial Assets at fair value through profit or lossCommon Stock (2020: 99.49% USD 72,762,611)CanadaInsurance
2,791 Intact Financial Corp. 0.43 362,778
Metals & Mining25,852 Teck Resources Ltd., B 0.88 744,526
Oil, Gas & Consumable Fuels21,011 Canadian Natural Resources Ltd. 1.05 887,81223,123 Suncor Energy, Inc. 0.68 578,555
1.73 1,466,367
Cayman IslandsEntertainment
1,527 Sea Ltd. 0.40 341,605
Hotels, Restaurants & Leisure162,000 Sands China Ltd. 0.45 377,288
Interactive Media & Services6,500 Tencent Holdings Ltd. 0.45 380,786
Internet & Direct Marketing Retail8,400 Meituan 0.29 242,815
Road & Rail27,577 Full Truck Alliance Co. Ltd. 0.27 230,819
DenmarkBiotechnology
1,460 Ascendis Pharma A/S 0.23 196,414
FranceBanks
10,864 BNP Paribas SA 0.89 751,644
Beverages5,516 Pernod Ricard SA 1.57 1,328,213
Machinery25,196 Alstom SA 1.06 895,566
Oil, Gas & Consumable Fuels2,710 TotalEnergies SE 0.16 137,698
Pharmaceuticals3,903 Sanofi 0.46 393,611
GermanyMulti-Utilities
4,830 RWE AG 0.23 196,423
Textiles, Apparel & Luxury Goods2,099 adidas AG 0.71 605,075
Hong KongInsurance
69,600 AIA Group Ltd. 0.83 701,574
IndiaBanks
19,714 HDFC Bank Ltd. 0.46 392,341
IrelandAirlines
4,824 Ryanair Holdings plc 0.58 493,640
Biotechnology3,594 Horizon Therapeutics plc 0.46 387,289
Insurance2,200 Aon plc, A 0.78 661,232
Shares or Principal Amount
Percentage of Net Assets
(%)Fair Value
(USD)
Isle of ManHotels, Restaurants & Leisure
37,884 Entain plc 1.02 863,007
ItalyIT Services
32,261 Nexi SpA 0.61 513,841
JapanBuilding Products
3,700 Daikin Industries Ltd. 0.99 839,198
JerseyAuto Components
5,022 Aptiv plc 0.98 828,379
Trading Companies & Distributors9,670 Ferguson plc 2.02 1,715,291
NetherlandsAerospace & Defense
6,834 Airbus SE 1.03 874,218
Semiconductors & Semiconductor Equipment2,992 ASML Holding NV 2.84 2,407,297
SwedenBuilding Products
26,319 Assa Abloy AB, B 0.95 804,465
Electronic Equipment, Instruments & Components89,368 Hexagon AB, B 1.68 1,420,698
SwitzerlandPharmaceuticals
8,011 Novartis AG 0.83 705,7981,899 Roche Holding AG 0.93 790,069
1.76 1,495,867
TaiwanSemiconductors & Semiconductor Equipment
60,000 Taiwan Semiconductor Manufacturing Co. Ltd. 1.57 1,333,719
United KingdomCapital Markets
4,133 London Stock Exchange Group plc 0.46 387,680
Insurance62,531 Beazley plc 0.47 394,67120,818 Prudential plc 0.42 359,131
0.89 753,802
Metals & Mining7,192 Rio Tinto plc 0.56 476,223
Personal Products19,530 Unilever plc 1.23 1,046,263
Pharmaceuticals8,758 AstraZeneca plc 1.21 1,028,724
United StatesAerospace & Defense
959 L3Harris Technologies, Inc. 0.24 204,497
Air Freight & Logistics5,238 United Parcel Service, Inc., B 1.32 1,122,713
Banks13,185 Citigroup, Inc. 0.94 796,24210,585 JPMorgan Chase & Co. 1.98 1,676,135
2.92 2,472,377
DocuSign Envelope ID: 521655BF-9BE3-47DC-A9A3-494932954338

85Janus Henderson Capital Funds plc / 31 December 2021
The accompanying notes are an integral part of the financial statements.
Janus Henderson Global Research Fund (continued)
Portfolio Investments
Shares or Principal Amount
Percentage of Net Assets
(%)Fair Value
(USD)
Beverages
7,009 Constellation Brands, Inc., A 2.08 1,759,049
Biotechnology6,801 AbbVie, Inc. 1.09 920,8552,343 Sarepta Therapeutics, Inc. 0.25 210,9872,123 Vertex Pharmaceuticals, Inc. 0.55 466,211
1.89 1,598,053
Capital Markets10,844 Apollo Asset Management, Inc. 0.93 785,431
7,065 Blackstone, Inc., A 1.08 914,1408,868 Morgan Stanley 1.03 870,483
3.04 2,570,054
Chemicals2,450 Air Products and Chemicals, Inc. 0.88 745,4372,891 Sherwin-Williams Co. (The) 1.20 1,018,095
2.08 1,763,532
Consumer Finance7,369 OneMain Holdings, Inc. 0.43 368,745
11,688 Synchrony Financial 0.64 542,2061.07 910,951
Diversified Financial Services0 Jackson Financial, Inc., A 0.00 13
Electric Utilities2,496 NextEra Energy, Inc. 0.27 233,027
18,837 NRG Energy, Inc. 0.96 811,4981.23 1,044,525
Entertainment16,380 Liberty Media Corp.-Liberty Formula
One, C 1.22 1,035,8712,064 Netflix, Inc. 1.47 1,243,4361,608 Roku, Inc. 0.43 366,946
3.12 2,646,253
Health Care Equipment & Supplies5,312 Abbott Laboratories 0.88 747,611
16,386 Boston Scientific Corp. 0.82 696,0775,402 DENTSPLY SIRONA, Inc. 0.36 301,378
584 Dexcom, Inc. 0.37 313,5793,836 Edwards Lifesciences Corp. 0.59 496,954
3.02 2,555,599
Health Care Providers & Services5,842 Centene Corp. 0.57 481,3811,294 Humana, Inc. 0.71 600,235
512 UnitedHealth Group, Inc. 0.30 257,0961.58 1,338,712
Hotels, Restaurants & Leisure319 Booking Holdings, Inc. 0.90 765,354
3,147 McDonald's Corp. 1.00 843,6161.90 1,608,970
Independent Power and Renewable Electricity Producers24,801 Vistra Corp. 0.67 564,719
Industrial Conglomerates2,499 Honeywell International, Inc. 0.61 521,066
Insurance5,451 Progressive Corp. (The) 0.66 559,545
Interactive Media & Services977 Alphabet, Inc., C 3.34 2,827,037
2,398 Match Group, Inc. 0.37 317,135
Shares or Principal Amount
Percentage of Net Assets
(%)Fair Value
(USD)
2,631 Meta Platforms, Inc., A 1.04 884,9379,119 Snap, Inc., A 0.51 428,867
5.26 4,457,976
Internet & Direct Marketing Retail813 Amazon.com, Inc. 3.20 2,710,818
2,011 DoorDash, Inc., A 0.35 299,438531 MercadoLibre, Inc. 0.84 716,000
4.39 3,726,256
IT Services5,541 Fidelity National Information Services,
Inc. 0.71 604,8004,125 Mastercard, Inc., A 1.75 1,482,195
6,093 Visa, Inc., A 1.56 1,320,4144.02 3,407,409
Life Sciences Tools & Services793 Danaher Corp. 0.31 260,905
1,219 Thermo Fisher Scientific, Inc. 0.96 813,3661.27 1,074,271
Machinery2,630 Parker-Hannifin Corp. 0.99 836,656
Metals & Mining11,710 Freeport-McMoRan, Inc. 0.58 488,658
Oil, Gas & Consumable Fuels2,339 Cheniere Energy, Inc. 0.28 237,2219,837 ConocoPhillips 0.84 710,0355,202 EOG Resources, Inc. 0.55 462,094
10,978 Marathon Petroleum Corp. 0.83 702,4822.50 2,111,832
Pharmaceuticals4,695 Catalent, Inc. 0.71 601,101
942 Eli Lilly & Co. 0.31 260,1991.02 861,300
Road & Rail21,034 Uber Technologies, Inc. 1.04 881,956
Semiconductors & Semiconductor Equipment5,432 Advanced Micro Devices, Inc. 0.92 781,6658,147 Marvell Technology, Inc. 0.84 712,781
5,495 NVIDIA Corp. 1.91 1,616,1343,727 Texas Instruments, Inc. 0.83 702,428
4.50 3,813,008
Software2,558 Adobe, Inc. 1.71 1,450,5392,603 Autodesk, Inc. 0.86 731,93812,821 Microsoft Corp. 5.09 4,311,9594,465 SS&C Technologies Holdings, Inc. 0.43 366,0412,861 Workday, Inc., A 0.92 781,568
9.01 7,642,045
Technology Hardware, Storage & Peripherals13,890 Apple, Inc. 2.91 2,466,447
Textiles, Apparel & Luxury Goods5,203 NIKE, Inc., B 1.02 867,184
Wireless Telecommunication Services3,100 T-Mobile US, Inc. 0.42 359,538
Total Common Stock 99.48 84,311,540
Government Obligations (2020: 0.00% USD –)US Treasury Notes/Bonds
200,000 0.0000%, due 4/1/22 0.24 200,000
DocuSign Envelope ID: 521655BF-9BE3-47DC-A9A3-494932954338

Janus Henderson Capital Funds plc / 31 December 202186
The accompanying notes are an integral part of the financial statements.
Janus Henderson Global Research Fund (continued)
Portfolio Investments
Shares or Principal Amount
Percentage of Net Assets
(%)Fair Value
(USD)
Total Government Obligations 0.24 200,000
Total Investments (Cost: USD 55,456,274) 99.72 84,511,540
Forward Currency Contracts (2020: 0.04% USD 29,166)Open as at 31 December 2021.
Current Market
Percentage of Net Unrealised
Currency Currency Value Settle Assets GainPurchased Sold (USD) Date (%) (USD)
.J.P. Morgan EUR◊ 999,649 USD 1,122,358 1,138,736 31-Jan-22 0.02 16,378
Total 0.02 16,378
.
Total Financial Assets at fair value through profit or loss 99.74 84,527,918
Financial Liabilities at fair value through profit or loss.Forward Currency Contracts (2020: 0.00% USD (874))Open as at 31 December 2021
Current Market
Percentage of Net Unrealised
Currency Currency Value Settle Assets LossPurchased Sold (USD) Date (%) (USD)
J.P. Morgan USD◊ 102,782 EUR 90,950 103,605 31-Jan-22 0.00 (823)
Total 0.00 (823).
Total Financial Liabilities at fair value through profit or loss 0.00 (823)
Portfolio Analysis (Unaudited)
Analysis of Total Assets:% of Total
AssetsTransferable securities admitted to official stock exchange listing 99.38Transferable securities dealt in on another regulated market 0.24OTC financial derivative instruments 0.02Other Assets 0.36Total Assets 100.00
◊ These forward currency contracts are used for share class hedging.
DocuSign Envelope ID: 521655BF-9BE3-47DC-A9A3-494932954338

87Janus Henderson Capital Funds plc / 31 December 2021
The accompanying notes are an integral part of the financial statements.
Janus Henderson Global Research Fund (continued)
Fair Value Hierarchy
The tables below provide the fair value hierarchy summary of the Fund’s financial assets and liabilities measured at fair value at 31 December 2021 and 31 December 2020.
31 December 2021
Level 1 - Quoted Prices
(USD)
Level 2 - Other Significant
Observable Inputs (USD)
Level 3 - Significant
Unobservable Inputs (USD)
Total (USD)
Common Stock 84,311,540 – – 84,311,540Forward Currency Contracts – 15,555 – 15,555Government Obligations – 200,000 – 200,000Total Investments in Securities 84,311,540 215,555 – 84,527,095
31 December 2020
Level 1 - Quoted Prices
(USD)
Level 2 - Other Significant
Observable Inputs (USD)
Level 3 - Significant
Unobservable Inputs (USD)
Total (USD)
Common Stock 51,390,951 21,371,6601 – 72,762,611Forward Currency Contracts – 28,292 – 28,292Total Investments in Securities 51,390,951 21,399,952 – 72,790,903
1At 31 December 2020, the administrator used a systematic fair valuation model provided by an independent third party to value listed securities in order to adjust for stale pricing between the close of foreign exchanges and the valuation point. This resulted in a decrease of USD 150 to common stocks with a fair value of USD 21,371,660.
There were transfers on Common Stock from level 2 to level 1 during the financial year ended 31 December 2021 and on Common Stock from level 1 to level 2 during the financial year ended 31 December 2020.
There were no investments held by the Fund at 31 December 2021 and 31 December 2020 that were fair valued at level 3 by the Janus Henderson Global Pricing Committee.
Valuation policy of private placements is referenced in note 2 of the financial statements.
Capital Share Transactions
For the financial year ended 31 December 2021
A2 HEUR A2 USD E2 HEUR H2 USD I2 USD Z1 USDShares Shares Shares Shares Shares Shares
At beginning of the year . . . . . . . 43,368 32,839 1,726 300 208,847 300,033Shares issued 5,510 5,247 – 8,926 151,198 –Shares redeemed. . . . . . . . . . . (9,402) (5,249) – (624) (189,265) –At end of year . . . . . . . . . . . . . 39,476 32,837 1,726 8,602 170,780 300,033
For the financial year ended 31 December 2020
. .A2 HEUR A2 USD E2 HEUR H2 USD I2 USD Z1 USD
Shares Shares Shares Shares Shares SharesAt beginning of the year . . . . . . . 38,379 28,356 5,537 300 2,624 300,033Shares issued 16,985 8,955 – – 206,223 –Shares redeemed. . . . . . . . . . . (11,996) (4,472) (3,811) – – –At end of year . . . . . . . . . . . . . 43,368 32,839 1,726 300 208,847 300,033
DocuSign Envelope ID: 521655BF-9BE3-47DC-A9A3-494932954338

Janus Henderson Capital Funds plc / 31 December 202188
Janus Henderson Global Research Fund (continued)
The accompanying notes are an integral part of the financial statements.
Net Asset Comparison
31 December 2021 31 December 2020 31 December 2019
Net Assets (USD)
NAV Per Share
(Local Currency)Net Assets
(USD)
NAV Per Share
(Local Currency)Net Assets
(USD)
NAV Per Share
(Local Currency)
A2 HEUR 990,886 22.05 1,015,626 19.17 715,083 16.61A2 USD 935,751 28.50 804,956 24.51 590,112 20.81E2 HEUR 40,520 20.62 37,986 18.02 97,480 15.70H2 USD 144,009 16.74 4,265 14.22 3,571 11.90I2 USD 5,845,215 34.23 6,082,740 29.13 64,172 24.45Z1 USD 76,794,232 255.95 65,189,691 217.28 54,654,361 182.16
. . .
DocuSign Envelope ID: 521655BF-9BE3-47DC-A9A3-494932954338

89Janus Henderson Capital Funds plc / 31 December 2021
Janus Henderson Global Research Fund (continued)
The accompanying notes are an integral part of the financial statements.
Total Expense Ratio (unaudited)
The Average Total Expense Ratio table shows the actual expenses, excluding transactions costs and trade commissions, incurred by each Class for the Fund during the reporting financial year expressed as a percentage of the average net assets for the corresponding year, on an annualised basis.
31 December 2021 31 December 2020 31 December 2019A2 HEUR 2.26% 2.33% 2.50%A2 USD 2.27% 2.33% 2.50%E2 HEUR 2.75% 2.89% 3.00%H2 USD 1.01% 0.92% 1.05%I2 USD 1.21% 1.25% 1.25%
Distributions per share (unaudited)
The following table shows the distribution rate per share at Ex-date for each distributing share class :
Share Class (Local Currency) 15/01/2021 12/02/2021 15/03/2021 15/04/2021 14/05/2021 15/06/2021 15/07/2021 13/08/2021 15/09/2021 15/10/2021 15/11/2021 15/12/2021Z1 USD – – – – – – – – – 2.46300 – –
– – – – – – – – – – – –
This fund distributes annually.
DocuSign Envelope ID: 521655BF-9BE3-47DC-A9A3-494932954338
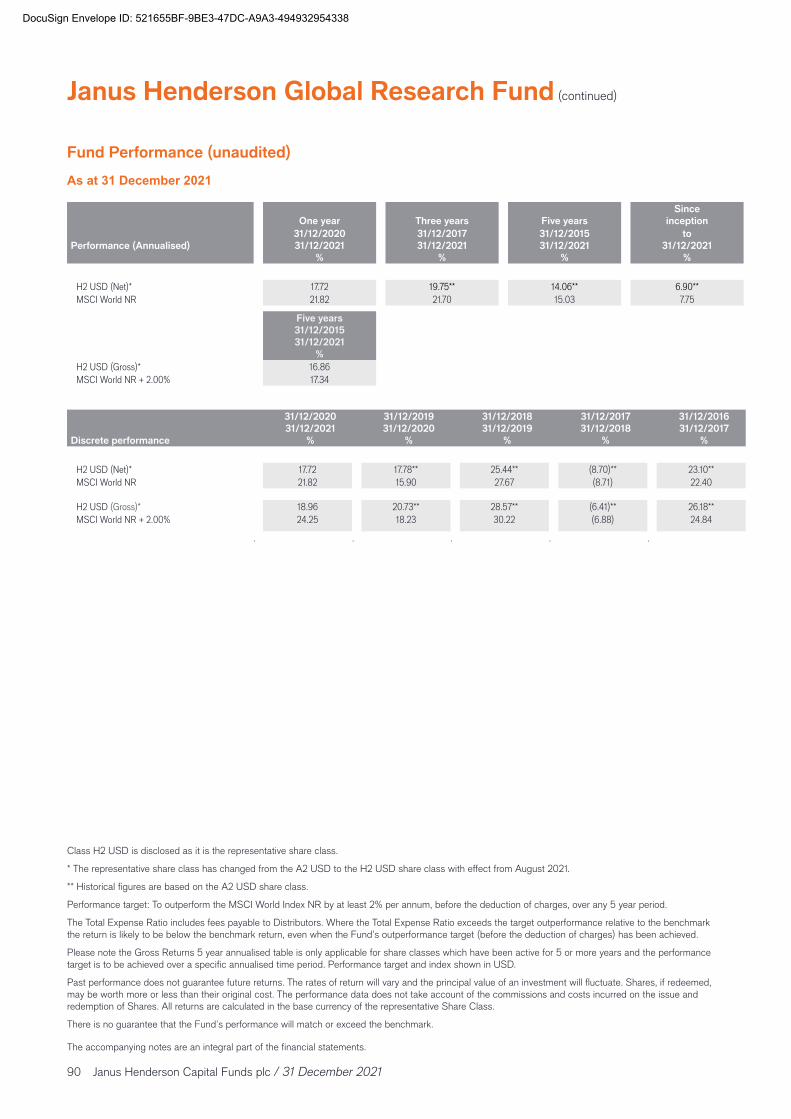
Janus Henderson Capital Funds plc / 31 December 202190
Janus Henderson Global Research Fund (continued)
The accompanying notes are an integral part of the financial statements.
Fund Performance (unaudited)
As at 31 December 2021
One year Three years Five yearsSince
inception
Performance (Annualised) 31/12/2020 31/12/2021
%
31/12/2017 31/12/2021
%
31/12/2015 31/12/2021
%
to 31/12/2021
%
H2 USD (Net)* 17.72 19.75** 14.06** 6.90**MSCI World NR 21.82 21.70 15.03 7.75
Five years 31/12/2015 31/12/2021
%H2 USD (Gross)* 16.86MSCI World NR + 2.00% 17.34
.
Discrete performance
31/12/2020 31/12/2021
%
31/12/2019 31/12/2020
%
31/12/2018 31/12/2019
%
31/12/2017 31/12/2018
%
31/12/2016 31/12/2017
%
H2 USD (Net)* 17.72 17.78** 25.44** (8.70)** 23.10**MSCI World NR 21.82 15.90 27.67 (8.71) 22.40
H2 USD (Gross)* 18.96 20.73** 28.57** (6.41)** 26.18**MSCI World NR + 2.00% 24.25 18.23 30.22 (6.88) 24.84
. . . . .
Class H2 USD is disclosed as it is the representative share class.
* The representative share class has changed from the A2 USD to the H2 USD share class with effect from August 2021.
** Historical figures are based on the A2 USD share class.
Performance target: To outperform the MSCI World Index NR by at least 2% per annum, before the deduction of charges, over any 5 year period.
The Total Expense Ratio includes fees payable to Distributors. Where the Total Expense Ratio exceeds the target outperformance relative to the benchmark the return is likely to be below the benchmark return, even when the Fund’s outperformance target (before the deduction of charges) has been achieved.
Please note the Gross Returns 5 year annualised table is only applicable for share classes which have been active for 5 or more years and the performance target is to be achieved over a specific annualised time period. Performance target and index shown in USD.
Past performance does not guarantee future returns. The rates of return will vary and the principal value of an investment will fluctuate. Shares, if redeemed, may be worth more or less than their original cost. The performance data does not take account of the commissions and costs incurred on the issue and redemption of Shares. All returns are calculated in the base currency of the representative Share Class.
There is no guarantee that the Fund’s performance will match or exceed the benchmark.
DocuSign Envelope ID: 521655BF-9BE3-47DC-A9A3-494932954338

91Janus Henderson Capital Funds plc / 31 December 2021
Janus Henderson Global Research Fund (continued)
Statements of Changes in Composition of Portfolio (unaudited)The tables below show a breakdown of material purchases and sales of the Investment Portfolio in accordance with Central Bank UCITS Regulations 79(2) requirements. All purchases and sales of investments exceeding 1% of the total value of each transaction respectively, are disclosed, with a minimum number of 20 of each such transaction. A full analysis of the movement on the Investment Portfolio is available upon request from the registered office.
Major Purchases for the year ended 31 December 2021
Shares or Principal Amount
Cost (USD)
Credit Agricole Corporate And Investment Bank, 0.0000%, due 7/9/21 1,600,000 1,599,993Credit Agricole Corporate And Investment Bank, 0.0000%, due 10/2/21 1,300,000 1,299,998Credit Agricole Corporate And Investment Bank, 0.0000%, due 11/2/21 1,300,000 1,299,998Credit Agricole Corporate And Investment Bank, 0.0000%, due 24/2/21 1,300,000 1,299,998Credit Agricole Corporate And Investment Bank, 0.0000%, due 25/2/21 1,300,000 1,299,998Credit Agricole Corporate And Investment Bank, 0.0000%, due 9/2/21 1,300,000 1,299,998Credit Agricole Corporate And Investment Bank, 0.0000%, due 12/2/21 1,200,000 1,199,998Credit Agricole Corporate And Investment Bank, 0.0000%, due 17/2/21 1,200,000 1,199,998Credit Agricole Corporate And Investment Bank, 0.0000%, due 18/2/21 1,200,000 1,199,998Credit Agricole Corporate And Investment Bank, 0.0000%, due 19/2/21 1,200,000 1,199,998Credit Agricole Corporate And Investment Bank, 0.0000%, due 5/2/21 1,200,000 1,199,998Credit Agricole Corporate And Investment Bank, 0.0000%, due 22/2/21 1,200,000 1,199,994Credit Agricole Corporate And Investment Bank, 0.0000%, due 8/2/21 1,200,000 1,199,994Credit Agricole Corporate And Investment Bank, 0.0000%, due 16/2/21 1,200,000 1,199,992Credit Agricole Corporate And Investment Bank, 0.0000%, due 30/4/21 1,100,000 1,099,999Credit Industriel et Commercial, 0.0000%, due 11/5/21 1,100,000 1,099,998Credit Industriel et Commercial, 0.0000%, due 29/4/21 1,100,000 1,099,998Credit Industriel et Commercial, 0.0000%, due 4/5/21 1,100,000 1,099,998Credit Industriel et Commercial, 0.0000%, due 5/5/21 1,100,000 1,099,998Credit Industriel et Commercial, 0.0000%, due 6/5/21 1,100,000 1,099,998
Major Sales for the year ended 31 December 2021
Shares or Principal Amount
Proceeds (USD)
Meta Platforms, Inc. 'A' 3,010 986,315Safran SA 6,778 959,173Merck & Co., Inc. 11,298 861,911L3Harris Technologies, Inc. 3,592 795,076Microchip Technology, Inc. 5,299 783,224Keyence Corp. 1,400 754,003Alphabet, Inc. 'C' 297 752,197CAE, Inc. 23,699 727,023Apple, Inc. 4,711 626,276RWE AG 14,727 560,516Texas Instruments, Inc. 2,992 556,336Microsoft Corp. 1,355 444,369Entain plc 19,748 442,729Bristol-Myers Squibb Co. 7,188 425,422Adobe, Inc. 664 408,836Blackstone, Inc. 3,948 407,285ASML Holding NV 555 406,813Elanco Animal Health, Inc. 12,462 371,832Roku, Inc. 887 353,034TotalEnergies SE 7,542 339,047Honeywell International, Inc. 1,401 309,933Prudential plc 14,846 298,456ConocoPhillips 4,147 297,724Wix.com Ltd. 1,960 293,610Uber Technologies, Inc. 5,320 278,966Neurocrine Biosciences, Inc. 3,255 278,354SS&C Technologies Holdings, Inc. 3,676 266,462Alexion Pharmaceuticals, Inc. 1,664 261,496Crown Castle International Corp. 1,750 260,968Aon plc 'A' 976 249,572Taiwan Semiconductor Manufacturing Co. Ltd. 12,000 241,725American Tower Corp. 1,167 234,268Parker-Hannifin Corp. 781 229,646Equinix, Inc. 379 228,460
DocuSign Envelope ID: 521655BF-9BE3-47DC-A9A3-494932954338

Janus Henderson Global Technology and Innovation Fund
Janus Henderson Capital Funds plc / 31 December 202192
Fund Overview (unaudited)Investment Objective and Policy
The Fund aims to provide capital growth over the long term.
Performance target: To outperform the MSCI All Country World Index Technology Index NR by at least 2% per annum, before the deduction of charges, over any 5 year period.
The Fund invests at least 80% of its assets in a concentrated portfolio of shares (also known as equities) of companies, of any size, which are technology-related or derive profits from technology, in any country.
The Fund is actively managed with reference to the MSCI All Country World Index Technology Index NR, which is broadly representative of the companies in which it may invest, as this forms the basis of the Fund’s performance target. The investment manager has discretion to choose individual investments for the Fund with weightings different to the index or not in the index, but at times the Fund may hold investments similar to the index
How Sustainability Risks are part of the investment processThe investments underlying this financial product (referred to as the Fund) do not take into account the EU criteria for environmentally sustainable economic activities, although the Manager and the Investment Manager have agreed a decision making process that will apply to investment decisions relating to the Fund as further detailed in the Prospectus.
The likely impacts of sustainability risks on the returns of the FundWhile the analysis of (Environmental, Social and Governance) ESG factors is an integral component across the Investment Manager’s investment capabilities and one of a number of inputs to the selection of investments and portfolio construction, the investment process of the Investment Manager is primarily designed to maximise long-term risk-adjusted returns for investors. Therefore, in managing the Fund, the Investment Manager does not maximise portfolio alignment with sustainability risks as a separate goal in its own right nor does it precisely attribute the impact of ESG factors on returns for the Fund.
Fund Overview
Denny Fish and Jonathan Cofsky, portfolio managers
For the year ended 31 December 2021, the Janus Henderson Global Technology and Innovation Fund Class H2 US dollar terms returned 17.39 % (Net) and 18.46% (Gross), compared with 27.36% and 29.91% Target (Gross) for its benchmark, the MSCI ACWI Technology Index.
Global technology stocks rallied during the year, outpacing broader equities. The market attempted more than once to rotate to value-oriented names in anticipation of greater reopening. However, continued concerns about COVID-19 variants weighing on economic growth sent investors back toward stocks aligned with long-duration growth themes and those with robust balance sheets and cash-flow generation. With many leading mega-cap technology names fitting that description, these stocks continued to be a driving force behind equity gains. Within the sector, the semiconductor complex proved especially strong as there was a considerable supply/demand mismatch in the wake of persistent supply-chain disruptions.
Late in the year, the trajectory of the sector was driven by a series of forces that proved difficult for our strategy to navigate. While we believe some of these drivers are unsustainable, as they are not grounded in corporate fundamentals, we are nonetheless disappointed in the Fund’s performance. The expectation that more central banks would soon raise interest rates created headwinds for the growth stocks we typically prefer. Also, a rush toward cash-rich companies favored a select few mega-cap stocks with substantial cash. Among these were some of the year’s largest detractors: Apple and Microsoft. While we like these companies, from a risk-budgeting perspective, we carry underweight positions in them, which can negatively impact performance in periods when these stocks rally.
Another source of underperformance was the Fund’s out-of-benchmark allocation to internet stocks, among them Amazon. As testament to what we considered the market’s indiscriminate prioritization of ‘rotation’ over ‘fundamentals,’ we believed our internet holdings were among the most secularly advantaged stocks in the broader technology universe.
We believe 2022 is shaping up to be a year of normalization for the technology sector. In the past 20 months, technology has experienced an acceleration of the digitization of the global economy, historic supply-chain disruptions and a backdrop of highly accommodative monetary policy.
DocuSign Envelope ID: 521655BF-9BE3-47DC-A9A3-494932954338

93Janus Henderson Capital Funds plc / 31 December 2021
Janus Henderson Global Technology and Innovation Fund (continued)
Fund Overview (unaudited) (continued)
The likelihood of rising interest rates introduces the risk of policy error. Should central banks move too quickly, they could squelch economic expansion. This would be most harmful to cyclical growth stocks.
It may seem like technology commands a disproportionate share of corporate headlines. This is no accident. Given the potential for delivering increased efficiencies across the economy, it is our view that technology companies will command an ever-greater share of aggregate corporate earnings and, thus, equity returns as the digitization of the global economy continues. With this in mind, we maintain our core ethos of identifying the companies we believe will most likely dominate their markets over the next 3-5 years.
Thank you for investing in Janus Henderson Global Technology and Innovation Fund.
January 2022
DocuSign Envelope ID: 521655BF-9BE3-47DC-A9A3-494932954338

Janus Henderson Capital Funds plc / 31 December 202194
The accompanying notes are an integral part of the financial statements.
Janus Henderson Global Technology and Innovation Fund (continued)s
Statement of Financial PositionAs of
31 December 2021
(USD)
As of 31 December
2020 (USD)
Assets:Financial assets at fair value through profit or loss . . . . . . . . . . . . . . . . . . . . . . . . . . . . . . . . . . . . . . . . . . . . . . . . . . . . . . . 529,387,670 443,342,615Cash and foreign currency . . . . . . . . . . . . . . . . . . . . . . . . . . . . . . . . . . . . . . . . . . . . . . . . . . . . . . . . . . . . . . . . . . . . . . . 5,704,512 13,103,781Receivables:
Spot foreign exchange contracts awaiting settlement . . . . . . . . . . . . . . . . . . . . . . . . . . . . . . . . . . . . . . . . . . . . . . . . . . . . – 2,087Funds shares sold . . . . . . . . . . . . . . . . . . . . . . . . . . . . . . . . . . . . . . . . . . . . . . . . . . . . . . . . . . . . . . . . . . . . . . . . . . . 3,730,181 2,428,143Dividends . . . . . . . . . . . . . . . . . . . . . . . . . . . . . . . . . . . . . . . . . . . . . . . . . . . . . . . . . . . . . . . . . . . . . . . . . . . . . . . . . 117,374 124,793
Total Assets . . . . . . . . . . . . . . . . . . . . . . . . . . . . . . . . . . . . . . . . . . . . . . . . . . . . . . . . . . . . . . . . . . . . . . . . . 538,939,737 459,001,419
Liabilities (amounts falling due within one year)Payables:
Financial liabilities at fair value through profit or loss . . . . . . . . . . . . . . . . . . . . . . . . . . . . . . . . . . . . . . . . . . . . . . . . . . . . 185,185 108,136Investments purchased . . . . . . . . . . . . . . . . . . . . . . . . . . . . . . . . . . . . . . . . . . . . . . . . . . . . . . . . . . . . . . . . . . . . . . . . 614,385 –Spot foreign exchange contracts awaiting payment . . . . . . . . . . . . . . . . . . . . . . . . . . . . . . . . . . . . . . . . . . . . . . . . . . . . . 6,555 –Fund shares repurchased . . . . . . . . . . . . . . . . . . . . . . . . . . . . . . . . . . . . . . . . . . . . . . . . . . . . . . . . . . . . . . . . . . . . . . 1,247,872 1,491,434Investment Management fees . . . . . . . . . . . . . . . . . . . . . . . . . . . . . . . . . . . . . . . . . . . . . . . . . . . . . . . . . . . . . . . . . . . 619,828 538,807Shareholder Service fees . . . . . . . . . . . . . . . . . . . . . . . . . . . . . . . . . . . . . . . . . . . . . . . . . . . . . . . . . . . . . . . . . . . . . . 229,557 200,168Distribution fees . . . . . . . . . . . . . . . . . . . . . . . . . . . . . . . . . . . . . . . . . . . . . . . . . . . . . . . . . . . . . . . . . . . . . . . . . . . . . 5,013 5,606Accounting, Administration and Transfer Agent fees . . . . . . . . . . . . . . . . . . . . . . . . . . . . . . . . . . . . . . . . . . . . . . . . . . . . 80,105 34,589Management fees . . . . . . . . . . . . . . . . . . . . . . . . . . . . . . . . . . . . . . . . . . . . . . . . . . . . . . . . . . . . . . . . . . . . . . . . . . . 10,158 8,661Accrued expenses . . . . . . . . . . . . . . . . . . . . . . . . . . . . . . . . . . . . . . . . . . . . . . . . . . . . . . . . . . . . . . . . . . . . . . . . . . . 154,734 123,770
Total Liabilities (excluding Net Assets attributable to holders of redeemable ordinary shares) . . . . . . . . . . . . 3,153,392 2,511,171 Net Assets attributable to holders of redeemable ordinary participating shares . . . . . . . . . . . . . . . . . . . . . . 535,786,345 456,490,248
DocuSign Envelope ID: 521655BF-9BE3-47DC-A9A3-494932954338

95Janus Henderson Capital Funds plc / 31 December 2021
Janus Henderson Global Technology and Innovation Fund (continued)
The accompanying notes are an integral part of the financial statements.
Statement of Comprehensive IncomeYear ended
31 December 2021
(USD)
Year ended 31 December
2020 (USD)
Year ended Year endedRevenue:Interest income . . . . . . . . . . . . . . . . . . . . . . . . . . . . . . . . . . . . . . . . . . . . . . . . . . . . . . . . . . . . . . . . . . . . . . . . . . . . . . . 24,112 6,611Dividend income . . . . . . . . . . . . . . . . . . . . . . . . . . . . . . . . . . . . . . . . . . . . . . . . . . . . . . . . . . . . . . . . . . . . . . . . . . . . . . 2,206,602 2,070,816Other income . . . . . . . . . . . . . . . . . . . . . . . . . . . . . . . . . . . . . . . . . . . . . . . . . . . . . . . . . . . . . . . . . . . . . . . . . . . . . . . . 71,768 840
Net gain on financial assets and liabilities at fair value through profit or loss . . . . . . . . . . . . . . . . . . . . . . . . . . . . . . . . . . . . . . 70,354,442 155,680,625 Total Investments Income . . . . . . . . . . . . . . . . . . . . . . . . . . . . . . . . . . . . . . . . . . . . . . . . . . . . . . . . . . . . . . . 72,656,924 157,758,892
Expenses:Investment Management fees . . . . . . . . . . . . . . . . . . . . . . . . . . . . . . . . . . . . . . . . . . . . . . . . . . . . . . . . . . . . . . . . . . . . . 7,084,027 4,654,027Shareholder Service fees . . . . . . . . . . . . . . . . . . . . . . . . . . . . . . . . . . . . . . . . . . . . . . . . . . . . . . . . . . . . . . . . . . . . . . . . 2,673,693 1,719,600Distribution fees . . . . . . . . . . . . . . . . . . . . . . . . . . . . . . . . . . . . . . . . . . . . . . . . . . . . . . . . . . . . . . . . . . . . . . . . . . . . . . 64,439 26,148Management fees . . . . . . . . . . . . . . . . . . . . . . . . . . . . . . . . . . . . . . . . . . . . . . . . . . . . . . . . . . . . . . . . . . . . . . . . . . . . . 120,917 48,009Accounting, Administration and Transfer Agent fees . . . . . . . . . . . . . . . . . . . . . . . . . . . . . . . . . . . . . . . . . . . . . . . . . . . . . . 338,561 230,044Custodian fees . . . . . . . . . . . . . . . . . . . . . . . . . . . . . . . . . . . . . . . . . . . . . . . . . . . . . . . . . . . . . . . . . . . . . . . . . . . . . . . 88,083 70,951Audit fees . . . . . . . . . . . . . . . . . . . . . . . . . . . . . . . . . . . . . . . . . . . . . . . . . . . . . . . . . . . . . . . . . . . . . . . . . . . . . . . . . . 20,986 26,939Printing expenses . . . . . . . . . . . . . . . . . . . . . . . . . . . . . . . . . . . . . . . . . . . . . . . . . . . . . . . . . . . . . . . . . . . . . . . . . . . . . 9,471 984Legal and other professional fees . . . . . . . . . . . . . . . . . . . . . . . . . . . . . . . . . . . . . . . . . . . . . . . . . . . . . . . . . . . . . . . . . . 164,767 109,461Other fees . . . . . . . . . . . . . . . . . . . . . . . . . . . . . . . . . . . . . . . . . . . . . . . . . . . . . . . . . . . . . . . . . . . . . . . . . . . . . . . . . . 59,271 80,220
Total Expenses . . . . . . . . . . . . . . . . . . . . . . . . . . . . . . . . . . . . . . . . . . . . . . . . . . . . . . . . . . . . . . . . . . . . . . . 10,624,215 6,966,383Less Expense Reimbursement . . . . . . . . . . . . . . . . . . . . . . . . . . . . . . . . . . . . . . . . . . . . . . . . . . . . . . . . . . . – –Net Expenses after Expense Reimbursement . . . . . . . . . . . . . . . . . . . . . . . . . . . . . . . . . . . . . . . . . . . . . . . . 10,624,215 6,966,383Net Operating Profit . . . . . . . . . . . . . . . . . . . . . . . . . . . . . . . . . . . . . . . . . . . . . . . . . . . . . . . . . . . . . . . . . . . 62,032,709 150,792,509
Finance Costs: 56 28
Total distributions to holders of redeemable ordinary shares. . . . . . . . . . . . . . . . . . . . . . . . . . . . . . . . . . . . . . . . . . . . . . . . . (56) (28) Withholding tax on dividends and other investment income . . . . . . . . . . . . . . . . . . . . . . . . . . . . . . . . . . . . . (580,577) (654,474)
Net Increase in Net Assets attributable to holders of redeemable ordinary shares resulting from operations . 61,452,076 150,138,007
. .
. .. . .
Statement of Changes in Net Assets Attributable to Redeemable Ordinary ShareholdersYear ended
31 December 2021
(USD)
Year ended 31 December
2020 (USD)
Increase in Net Assets attributable to holders of redeemable ordinary shares resulting from operations . . . . . . . . . . . . . . . . . . . . 61,452,076 150,138,007
Capital Share Transactions of redeemable ordinary shares:Proceeds from redeemable ordinary shares sold . . . . . . . . . . . . . . . . . . . . . . . . . . . . . . . . . . . . . . . . . . . . . . . . . . . . . . . 234,033,058 332,318,077Redemption of redeemable ordinary shares . . . . . . . . . . . . . . . . . . . . . . . . . . . . . . . . . . . . . . . . . . . . . . . . . . . . . . . . . . (216,189,037) (225,063,448)
Net Increase from Capital Share Transactions of redeemable ordinary shares . . . . . . . . . . . . . . . . . . . . . . . . 17,844,021 107,254,629
Net Increase in Net Assets attributable to holders of redeemable ordinary shares . . . . . . . . . . . . . . . . . . . . . . . . . . . . . . . . . . . 79,296,097 257,392,636Net Assets attributable to holders of redeemable ordinary shares at the beginning of the financial year . . . . . . . . . . . . . . . . . . . . 456,490,248 199,097,612
Net Assets attributable to holders of redeemable ordinary shares at the end of the financial year . . . . . . . . . 535,786,345 456,490,248
Gains and losses are solely from continuing operations except for the Funds which ceased operations during the financial year ended 31 December 2021 and 31 December 2020. There were no gains and losses other than those dealt with in the Statement of Comprehensive Income. Please refer to note 1 which details the Fund closures during the year.
DocuSign Envelope ID: 521655BF-9BE3-47DC-A9A3-494932954338

Janus Henderson Capital Funds plc / 31 December 202196
Janus Henderson Global Technology and Innovation Fund (continued)
Portfolio Investments
The accompanying notes are an integral part of the financial statements.
Shares or Principal Amount
Percentage of Net Assets
(%)Fair Value
(USD)
Financial Assets at fair value through profit or lossCommon Stock (2020: 96.37% USD 439,920,272)CanadaIT Services
4,468 Shopify, Inc., A 1.15 6,154,178
Software1 Topicus.com, Inc. 0.00 59
Cayman IslandsEntertainment
32,429 Sea Ltd. 1.35 7,254,692
Internet & Direct Marketing Retail85,965 Farfetch Ltd., A 0.54 2,873,81025,507 Grab Holdings Ltd., Warrant, due
1/12/26 0.01 53,820394,494 Grab Holdings Ltd., A 0.53 2,812,742243,320 Grab Holdings Ltd., Private Placement,
A 0.32 1,734,8721.40 7,475,244
IndiaIT Services
30,660 One 97 Communications Ltd., Private Placement 0.10 550,440
IsraelInternet & Direct Marketing Retail
84,224 Global-e Online Ltd. 1.00 5,338,959
Software11,310 Nice Ltd. 0.64 3,433,716
NetherlandsIT Services
954 Adyen NV 0.47 2,510,587
Semiconductors & Semiconductor Equipment38,736 ASML Holding NV 5.82 31,166,13124,300 NXP Semiconductors NV 1.03 5,535,054
6.85 36,701,185
TaiwanSemiconductors & Semiconductor Equipment
1,066,000 Taiwan Semiconductor Manufacturing Co. Ltd. 4.42 23,695,739
United KingdomSoftware
16,446 Atlassian Corp. plc, A 1.17 6,270,695
United StatesAerospace & Defense
7,924 Axon Enterprise, Inc. 0.23 1,244,068
Diversified Consumer Services53,369 Coursera, Inc. 0.24 1,304,338
Entertainment5,474 Netflix, Inc. 0.62 3,297,757
19,028 Roku, Inc. 0.81 4,342,1901.43 7,639,947
Equity Real Estate Investment Trusts (REITs)8,283 Equinix, Inc. 1.31 7,006,093
Interactive Media & Services9,154 Alphabet, Inc., C 4.94 26,487,923
47,608 Match Group, Inc. 1.18 6,296,158101,721 Snap, Inc., A 0.89 4,783,939
Shares or Principal Amount
Percentage of Net Assets
(%)Fair Value
(USD)
39,646 Twitter, Inc. 0.32 1,713,500
7.33 39,281,520
Internet & Direct Marketing Retail7,443 Amazon.com, Inc. 4.63 24,817,493
65,691 Coupang, Inc. 0.36 1,930,00210,234 DoorDash, Inc., A 0.28 1,523,8435,809 MercadoLibre, Inc. 1.46 7,832,856
6.73 36,104,194
IT Services9,940 Block, Inc., A 0.30 1,605,409
80,320 Marqeta, Inc., A 0.26 1,379,09456,981 Mastercard, Inc., A 3.82 20,474,41320,744 Okta, Inc. 0.87 4,650,18217,362 Snowflake, Inc., A 1.10 5,881,37752,061 Toast, Inc., A 0.34 1,807,03732,565 Twilio, Inc., A 1.60 8,575,66733,926 Visa, Inc., A 1.37 7,352,103
9.66 51,725,282
Leisure Products22,871 Peloton Interactive, Inc., A 0.15 817,867
Professional Services108,895 CoStar Group, Inc. 1.61 8,605,972
Real Estate Management & Development128,411 Doma Holdings, Inc. 0.12 652,32832,246 Redfin Corp. 0.23 1,237,924
0.35 1,890,252
Road & Rail139,678 Uber Technologies, Inc. 1.09 5,856,698
Semiconductors & Semiconductor Equipment33,757 Advanced Micro Devices, Inc. 0.91 4,857,63236,762 Analog Devices, Inc. 1.21 6,461,65713,752 Applied Materials, Inc. 0.40 2,164,01525,147 KLA Corp. 2.02 10,815,97621,000 Lam Research Corp. 2.82 15,102,15053,081 Marvell Technology, Inc. 0.87 4,644,05756,680 NVIDIA Corp. 3.11 16,670,15572,244 Texas Instruments, Inc. 2.54 13,615,82711,465 Xilinx, Inc. 0.45 2,430,924
14.33 76,762,393
Software36,317 Adobe, Inc. 3.84 20,593,91824,925 Autodesk, Inc. 1.31 7,008,66139,635 Avalara, Inc. 0.96 5,117,27555,134 Cadence Design Systems, Inc. 1.92 10,274,221
335,144 CCC Intelligent Solutions Holdings, Inc. 0.71 3,817,29066,936 CCC Intelligent Solutions Holdings,
Inc., Warrant, due 14/8/25 0.00 6,69448,797 Ceridian HCM Holding, Inc. 0.95 5,097,33590,231 Dynatrace, Inc. 1.02 5,445,4419,892 Gitlab, Inc., A 0.16 860,604
153,220 Microsoft Corp. 9.62 51,530,95034,310 Olo, Inc., A 0.13 713,9912,654 Paylocity Holding Corp. 0.12 626,7695,049 Synopsys, Inc. 0.35 1,860,5566,090 Tyler Technologies, Inc. 0.61 3,276,115
27,934 Unity Software, Inc. 0.75 3,994,28341,148 Via Transportation, Inc., Private
Placement* 0.35 1,872,55114,212 Via Transportation, Inc., Private
Placement* 0.11 614,385
DocuSign Envelope ID: 521655BF-9BE3-47DC-A9A3-494932954338

97Janus Henderson Capital Funds plc / 31 December 2021
The accompanying notes are an integral part of the financial statements.
Janus Henderson Global Technology and Innovation Fund (continued)
Portfolio Investments
Shares or Principal Amount
Percentage of Net Assets
(%)Fair Value
(USD)
53,377 Workday, Inc., A 2.72 14,581,529
25.63 137,292,568
Technology Hardware, Storage & Peripherals246,940 Apple, Inc. 8.18 43,849,136
Total Common Stock 96.82 518,765,822
Government Obligations (2020: 0.00% USD –)US Treasury Notes/Bonds
8,100,000 0.0000%, due 4/1/22 1.51 8,100,008
Total Government Obligations 1.51 8,100,008
Total Investments (Cost: USD 345,559,678) 98.33 526,865,830
Forward Currency Contracts (2020: 0.75% USD 3,422,343)Open as at 31 December 2021.
Current Market
Percentage of Net Unrealised
Currency Currency Value Settle Assets GainPurchased Sold (USD) Date (%) (USD)
.J.P. Morgan AUD◊ 8,221,859 USD 5,910,299 5,982,336 31-Jan-22 0.01 72,037
EUR◊ 155,428,563 USD 174,604,310 177,054,113 31-Jan-22 0.43 2,449,803
Total 0.44 2,521,840
.
Total Financial Assets at fair value through profit or loss 98.77 529,387,670
Financial Liabilities at fair value through profit or loss.Forward Currency Contracts (2020: (0.02)% USD (108,136))Open as at 31 December 2021
Current Market
Percentage of Net Unrealised
Currency Currency Value Settle Assets LossPurchased Sold (USD) Date (%) (USD)
J.P. Morgan USD◊ 800,557 AUD 1,123,944 817,798 31-Jan-22 0.00 (17,241)
USD◊ 24,049,229 EUR 21,259,267 24,217,173 31-Jan-22 0.00 (167,944)
Total 0.00 (185,185).
Total Financial Liabilities at fair value through profit or loss 0.00 (185,185)
Portfolio Analysis (Unaudited)
Analysis of Total Assets:% of Total
AssetsTransferable securities admitted to official stock exchange listing 95.37Transferable securities dealt in on another regulated market 1.50OTC financial derivative instruments 0.47Other Assets 2.66Total Assets 100.00
* Fair valued by Janus Henderson Global Pricing Committee at 31 December 2021.◊ These forward currency contracts are used for share class hedging.
DocuSign Envelope ID: 521655BF-9BE3-47DC-A9A3-494932954338

Janus Henderson Capital Funds plc / 31 December 202198
The accompanying notes are an integral part of the financial statements.
Janus Henderson Global Technology and Innovation Fund (continued)
Fair Value Hierarchy
The tables below provide the fair value hierarchy summary of the Fund’s financial assets and liabilities measured at fair value at 31 December 2021 and 31 December 2020.
31 December 2021
Level 1 - Quoted Prices
(USD)
Level 2 - Other Significant
Observable Inputs (USD)
Level 3 - Significant
Unobservable Inputs (USD)
Total (USD)
Common Stock 514,537,320 1,741,5661 2,486,936 518,765,822Forward Currency Contracts – 2,336,655 – 2,336,655Government Obligations – 8,100,008 – 8,100,008Total Investments in Securities 514,537,320 12,178,229 2,486,936 529,202,485
1At 31 December 2021, Investments with a fair value of USD 6,694 had a liquidity discount applied in line with GPC pricing policies.
31 December 2020
Level 1 - Quoted Prices
(USD)
Level 2 - Other Significant
Observable Inputs (USD)
Level 3 - Significant
Unobservable Inputs (USD)
Total (USD)
Common Stock 394,724,132 45,196,1401 – 439,920,272Forward Currency Contracts – 3,314,207 – 3,314,207Total Investments in Securities 394,724,132 48,510,347 – 443,234,479
1At 31 December 2020, the administrator used a systematic fair valuation model provided by an independent third party to value listed securities in order to adjust for stale pricing between the close of foreign exchanges and the valuation point. This resulted in a decrease of USD 144,102 to common stocks with a fair value of USD 45,196,140.
There were transfers on Common Stock from level 2 to level 1 and level 3 to level 1 during the financial year ended 31 December 2021 from level 1 to level 2 during the financial year ended 31 December 2020.
Valuation policy of private placements is referenced in note 2 of the financial statements.
The following tables present level 3 positions that were fair valued by the Janus Henderson Global Pricing Committee at 31 December 2021 and 31 December 2020.
Security Name
Fair Value at 31 December 2021
(USD)Fair Value as a %
of Net Assets Valuation MethodVia Transportation, Inc., Private Placement 1,872,551 0.35% Valued at costVia Transportation, Inc., Private Placement 614,385 0.11% Valued at cost
Total 2,486,936
Security Name
Fair Value at 31 December 2020
(USD)Fair Value as a %
of Net Assets Valuation MethodTopicus.com, Inc. – 0.00% Valued at zero
Total –
DocuSign Envelope ID: 521655BF-9BE3-47DC-A9A3-494932954338

99Janus Henderson Capital Funds plc / 31 December 2021
Janus Henderson Global Technology and Innovation Fund (continued)
The accompanying notes are an integral part of the financial statements.
Capital Share Transactions
For the financial year ended 31 December 2021
.A2 EUR A2 HAUD A2 HEUR A2 HKD A2 USD B2 USD E2 USD H2 EURShares Shares Shares Shares Shares Shares Shares Shares
At beginning of the year . . . . . . . – 175,908 3,531,990 1,531,338 9,327,173 354,357 – –Shares issued 251 109,897 2,236,106 2,318,772 3,411,793 – 300 251Shares redeemed. . . . . . . . . . . – (112,032) (1,623,059) (2,154,436) (3,798,104) (78,104) – –At end of year . . . . . . . . . . . . . 251 173,773 4,145,037 1,695,674 8,940,862 276,253 300 251
H2 HEUR H2 USD I2 HEUR I2 USD V2 HEUR V2 USDShares Shares Shares Shares Shares Shares
At beginning of the year . . . . . . . 166,123 1,059,117 357,792 1,870,597 15,792 29,086Shares issued 122,962 638,233 160,458 682,280 2,784 99,947Shares redeemed. . . . . . . . . . . (88,552) (389,541) (101,439) (898,146) (11,148) (66,746)At end of year . . . . . . . . . . . . . 200,533 1,307,809 416,811 1,654,731 7,428 62,287
For the financial year ended 31 December 2020
A2 HAUD A2 HEUR A2 HKD A2 USD B2 USD H2 HEUR H2 USD I2 HEURShares Shares Shares Shares Shares Shares Shares Shares
At beginning of the year . . . . . . . 125,585 2,216,800 1,278,171 6,718,766 384,220 196,487 89,937 177,262Shares issued 415,500 3,391,130 4,279,924 8,102,105 22,278 189,608 1,348,625 346,883Shares redeemed. . . . . . . . . . . (365,177) (2,075,940) (4,026,757) (5,493,698) (52,141) (219,972) (379,445) (166,353)At end of year . . . . . . . . . . . . . 175,908 3,531,990 1,531,338 9,327,173 354,357 166,123 1,059,117 357,792
I2 USD V2 HEUR V2 USDShares Shares Shares
At beginning of the year . . . . . . . 1,700,632 12,439 25,382Shares issued 1,579,840 18,651 79,606Shares redeemed. . . . . . . . . . . (1,409,875) (15,298) (75,902)At end of year . . . . . . . . . . . . . 1,870,597 15,792 29,086
Net Asset Comparison
31 December 2021 31 December 2020 31 December 2019
Net Assets (USD)
NAV Per Share
(Local Currency)Net Assets
(USD)
NAV Per Share
(Local Currency)Net Assets
(USD)
NAV Per Share
(Local Currency)
A2 EUR 3,232 11.33 – – – –A2 HAUD 5,146,285 40.71 4,822,166 35.56 2,166,740 24.59A2 HEUR 112,498,909 23.84 89,958,844 20.85 35,519,863 14.29A2 HKD 9,162,161 42.13 7,158,400 36.24 4,016,672 24.49A2 USD 240,349,365 26.88 216,841,818 23.25 105,002,232 15.63B2 USD 5,980,851 21.65 6,703,065 18.92 4,934,728 12.84E2 USD 3,071 10.24 – – – –H2 EUR 3,267 11.45 – – – –H2 HEUR 8,192,607 35.88 6,274,221 30.92 4,600,838 20.88H2 USD 66,295,214 50.69 45,732,853 43.18 2,572,029 28.60I2 HEUR 31,724,349 66.85 25,351,940 58.00 7,837,323 39.42I2 USD 53,734,488 32.47 52,105,609 27.86 31,594,901 18.58V2 HEUR 285,212 33.73 569,218 29.50 282,001 20.21V2 USD 2,407,334 38.65 972,114 33.42 570,285 22.47
. . .
DocuSign Envelope ID: 521655BF-9BE3-47DC-A9A3-494932954338

Janus Henderson Capital Funds plc / 31 December 2021100
Janus Henderson Global Technology and Innovation Fund (continued)
The accompanying notes are an integral part of the financial statements.
Total Expense Ratio (unaudited)
The Average Total Expense Ratio table shows the actual expenses, excluding transactions costs and trade commissions, incurred by each Class for the Fund during the reporting financial year expressed as a percentage of the average net assets for the corresponding year, on an annualised basis.
31 December 2021 31 December 2020 31 December 2019A2 EUR 2.30% – –A2 HAUD 2.40% 2.40% 2.46%A2 HEUR 2.41% 2.41% 2.45%A2 HKD 2.40% 2.40% 2.45%A2 USD 2.41% 2.40% 2.45%B2 USD 3.42% 3.41% 3.45%E2 USD* 2.74% – –H2 EUR* 0.80% – –H2 HEUR 0.89% 0.93% 1.04%H2 USD 0.89% 0.92% 1.01%I2 HEUR 1.59% 1.62% 1.74%I2 USD 1.60% 1.62% 1.74%V2 HEUR 2.39% 2.43% 2.45%V2 USD 2.41% 2.42% 2.46%
*As the share class launched during the year, an estimated Total Expense Ratio is disclosed for the year end.
DocuSign Envelope ID: 521655BF-9BE3-47DC-A9A3-494932954338

101Janus Henderson Capital Funds plc / 31 December 2021
Janus Henderson Global Technology and Innovation Fund (continued)
The accompanying notes are an integral part of the financial statements.
Fund Performance (unaudited)
As at 31 December 2021
One year Three years Five yearsSince
inception
Performance (Annualised) 31/12/2020 31/12/2021
%
31/12/2017 31/12/2021
%
31/12/2015 31/12/2021
%
to 31/12/2021
%
H2 USD (Net)* 17.39 34.85** 27.88** 4.65**MSCI All Country World Index/Information Technology NR 27.36 39.65 29.47 –
Five years 31/12/2015 31/12/2021
%H2 USD (Gross)* 31.09MSCI ACWI/Information Technology NR + 2.00% 32.06
.
Discrete performance
31/12/2020 31/12/2021
%
31/12/2019 31/12/2020
%
31/12/2018 31/12/2019
%
31/12/2017 31/12/2018
%
31/12/2016 31/12/2017
%
H2 USD (Net)* 17.39 48.69** 42.61** (1.17)** 41.09**MSCI ACWI/Information Technology NR 27.36 45.61 46.89 (5.81) 41.77
H2 USD (Gross)* 18.46 52.34** 46.10** 1.36** 44.70**MSCI ACWI/Information Technology NR + 2.00% 29.91 48.53 49.82 (3.92) 44.60
. . . . .
Class H2 USD is disclosed as it is the representative share class.
* The representative share class has changed from the A2 USD to the H2 USD share class with effect from August 2021.
** Historical figures are based on the A2 USD share class.
Performance Target: To outperform the MSCI All Country World Index Technology Index NR by at least 2% per annum, before the deduction of charges, over any 5 year period.
The Total Expense Ratio include fees payable to Distributors. Where the Total Expense Ratio exceeds the target outperformance relative to the benchmark the return is likely to be below the benchmark return, even when the Fund’s outperformance target (before the deduction of charges) has been achieved.
Please note the Gross Returns 5 year annualised table is only applicable for share classes which have been active for 5 or more years and the performance target is to be achieved over a specific annualised time period. Performance target and index shown in USD.
Past performance does not guarantee future returns. The rates of return will vary and the principal value of an investment will fluctuate. Shares, if redeemed, may be worth more or less than their original cost. The performance data does not take account of the commissions and costs incurred on the issue and redemption of Shares. All returns are calculated in the base currency of the representative Share Class.
There is no guarantee that the Fund’s performance will match or exceed the benchmark.
DocuSign Envelope ID: 521655BF-9BE3-47DC-A9A3-494932954338

Janus Henderson Capital Funds plc / 31 December 2021102
Janus Henderson Global Technology and Innovation Fund (continued)
Statements of Changes in Composition of Portfolio (unaudited)The tables below show a breakdown of material purchases and sales of the Investment Portfolio in accordance with Central Bank UCITS Regulations 79(2) requirements. All purchases and sales of investments exceeding 1% of the total value of each transaction respectively, are disclosed, with a minimum number of 20 of each such transaction. A full analysis of the movement on the Investment Portfolio is available upon request from the registered office.
Major Purchases for the year ended 31 December 2021
Shares or Principal Amount
Cost (USD)
Credit Agricole Corporate And Investment Bank, 0.0000%, due 28/7/21 20,100,000 20,099,972Credit Agricole Corporate And Investment Bank, 0.0000%, due 30/7/21 19,900,000 19,899,972Credit Agricole Corporate And Investment Bank, 0.0000%, due 28/10/21 19,600,000 19,599,973Credit Industriel et Commercial, 0.0000%, due 29/7/21 19,600,000 19,599,962Apple, Inc. 128,043 19,343,049Credit Agricole Corporate And Investment Bank, 0.0000%, due 16/8/21 19,200,000 19,199,920Credit Agricole Corporate And Investment Bank, 0.0000%, due 12/8/21 19,100,000 19,099,973Credit Agricole Corporate And Investment Bank, 0.0000%, due 13/8/21 19,000,000 18,999,974Credit Agricole Corporate And Investment Bank, 0.0000%, due 10/8/21 18,900,000 18,899,974Credit Agricole Corporate And Investment Bank, 0.0000%, due 11/8/21 18,900,000 18,899,974Credit Industriel et Commercial, 0.0000%, due 5/8/21 18,800,000 18,799,963Credit Agricole Corporate And Investment Bank, 0.0000%, due 9/8/21 18,800,000 18,799,922Credit Industriel et Commercial, 0.0000%, due 4/8/21 18,500,000 18,499,964Credit Industriel et Commercial, 0.0000%, due 6/8/21 18,400,000 18,399,964Credit Agricole Corporate And Investment Bank, 0.0000%, due 17/8/21 18,200,000 18,199,975Credit Agricole Corporate And Investment Bank, 0.0000%, due 15/7/21 18,100,000 18,099,970Credit Industriel et Commercial, 0.0000%, due 16/7/21 18,100,000 18,099,960Credit Agricole Corporate And Investment Bank, 0.0000%, due 15/11/21 18,100,000 18,099,925Credit Agricole Corporate And Investment Bank, 0.0000%, due 3/8/21 17,900,000 17,899,975Credit Agricole Corporate And Investment Bank, 0.0000%, due 1/2/21 17,900,000 17,899,910
Major Sales for the year ended 31 December 2021
Shares or Principal Amount
Proceeds (USD)
Meta Platforms, Inc. 'A' 91,106 30,304,177Apple, Inc. 166,501 21,108,472NVIDIA Corp. 50,699 16,167,784Microsoft Corp. 48,367 13,389,253salesforce.com, Inc. 52,549 11,940,053Visa, Inc. 'A' 51,803 10,862,988Tencent Holdings Ltd. 109,400 7,081,545Amazon.com, Inc. 1,980 6,701,491Zendesk, Inc. 66,768 6,681,273Wix.com Ltd. 35,295 5,694,805Meituan 168,300 5,547,280Fidelity National Information Services, Inc. 40,196 5,506,733Crown Castle International Corp. 31,380 5,128,953Lam Research Corp. 8,609 5,123,163Microchip Technology, Inc. 33,357 4,922,658American Tower Corp. 20,674 4,680,810T-Mobile US, Inc. 34,117 4,208,789Cadence Design Systems, Inc. 22,317 3,778,708Texas Instruments, Inc. 18,507 3,514,710Booking Holdings, Inc. 1,426 3,287,034PayPal Holdings, Inc. 9,837 2,699,063ContextLogic, Inc. 98,926 2,664,087Cognex Corp. 28,911 2,602,557Atlassian Corp. plc 'A' 6,593 2,562,796RingCentral, Inc. 10,259 2,525,800Full Truck Alliance Co. Ltd. 188,317 2,518,281
DocuSign Envelope ID: 521655BF-9BE3-47DC-A9A3-494932954338

Janus Henderson US Contrarian Fund (formerly Opportunistic Alpha Fund)
103Janus Henderson Capital Funds plc / 31 December 2021
Fund Overview (unaudited)Investment Objective and Policy
The Fund aims to provide capital growth over the long term.
Performance target: To outperform the S&P 500 Index by at least 2% per annum, before the deduction of charges, over any 5 year period.
The Fund invests at least 80% of its assets in a concentrated portfolio of shares (also known as equities) of companies, of any size, in any industry, in the United States.
The Fund is actively managed with reference to the S&P 500 Index, which is broadly representative of the companies in which it may invest, as this forms the basis of the Fund’s performance target. The investment manager has a high degree of freedom to exercise conviction, which may result in a high degree of bias within the portfolio. The Fund may hold companies which are not within the index.
The Fund’s name changed from Janus Henderson Opportunistic Alpha Fund to Janus Henderson US Contrarian Fund on 30 September 2021.
How Sustainability Risks are part of the investment processThe investments underlying this financial product (referred to as the Fund) do not take into account the EU criteria for environmentally sustainable economic activities, although the Manager and the Investment Manager have agreed a decision making process that will apply to investment decisions relating to the Fund as further detailed in the Prospectus.
The likely impacts of sustainability risks on the returns of the FundWhile the analysis of (Environmental, Social and Governance) ESG factors is an integral component across the Investment Manager’s investment capabilities and one of a number of inputs to the selection of investments and portfolio construction, the investment process of the Investment Manager is primarily designed to maximise long-term risk-adjusted returns for investors. Therefore, in managing the Fund, the Investment Manager does not maximise portfolio alignment with sustainability risks as a separate goal in its own right nor does it precisely attribute the impact of ESG factors on returns for the Fund.
Fund Overview
Nick Schommer, portfolio manager
For the year ended 31 December 2021, the Janus Henderson US Contrarian Fund Class H2 US dollar terms returned 20.37% (Net) and 21.63% (Gross), compared with 28.71% and 31.28% Target (Gross) for its benchmark, the S&P 500® Index. As the Fund is a concentrated portfolio, stock selection was the primary driver of relative underperformance.
Crown Holdings, which is the largest position in the Fund, was among the top detractors for the year. Following a strong performance in 2020, the aluminum can manufacturer had muted performance in 2021. It faced some headwinds from inflationary and supply chain pressures and COVID-19-related lockdowns in Vietnam, where it has significant production capacity. We expected Crown to continue to benefit from strong demand for sustainable packaging.
Wireless company T-Mobile US was also among the top relative detractors. While the company continued to gain market share, there have been concerns that the wireless market is becoming increasingly competitive, and that T-Mobile’s share gains could slow, leading to some underperformance. We took the view that the company was well placed in terms of 5G network capabilities, given its strong spectrum position.
Social media operator Snap was also among the top detractors during the year. The company has faced short-term difficulty in measuring advertisers’ conversion rates due to Apple’s iOS privacy changes. However, Snap has expanded into areas such as augmented reality advertising and e-commerce and enhanced its app with features such as Spotlight and Maps. We believe that the company is still early in its development and that as it matures, its business model has the potential to help it evolve into a core digital advertising platform.
Semiconductor company Marvell Technology was among the top contributors during the year. The company’s stock gained on strong financial results and significantly increased revenue growth guidance for the next two years. The company has undergone a significant business model transition over the past several years, including several strategic acquisitions. We believe Marvell is well positioned as the leading provider of baseband processors, which are instrumental in the build-out of 5G networks, and in data center applications - both areas where we expect significant capital investment in coming years.
Copper miner Freeport McMoRan was also among the top contributors. Freeport’s stock benefited as it reported robust financial results and demand for copper, particularly in China, continued to be resilient. Long term, we believe that Freeport is well positioned as a supplier of copper - a key input in the transformation of energy consumption away from fossil fuels and toward electric power generation.
Horizon Therapeutics was also among the top contributors. Previously, Horizon was negatively impacted as the government utilized some of the company’s production capacity to make COVID-19 vaccines. During the year, the company reported results that showed demand continued to be strong for its drug Tepezza, used to treat thyroid eye disease. This reinforced the belief that the supply disruptions were the primary cause of lower results in previous quarters,
DocuSign Envelope ID: 521655BF-9BE3-47DC-A9A3-494932954338

Janus Henderson Capital Funds plc / 31 December 2021104
Janus Henderson US Contrarian Fund (formerly Opportunistic Alpha Fund) (continued)
Fund Overview (unaudited) (continued)
and that the company could continue to meet growing demand as it resumed full production capacity.
Thank you for investing in the Janus Henderson US Contrarian Fund.
January 2022
DocuSign Envelope ID: 521655BF-9BE3-47DC-A9A3-494932954338

105Janus Henderson Capital Funds plc / 31 December 2021
The accompanying notes are an integral part of the financial statements.
Janus Henderson US Contrarian Fund (continued)
s
Statement of Financial PositionAs of
31 December 2021
(USD)
As of 31 December
2020 (USD)
Assets:Financial assets at fair value through profit or loss . . . . . . . . . . . . . . . . . . . . . . . . . . . . . . . . . . . . . . . . . . . . . . . . . . . . . . . 33,972,049 23,113,091Cash and foreign currency . . . . . . . . . . . . . . . . . . . . . . . . . . . . . . . . . . . . . . . . . . . . . . . . . . . . . . . . . . . . . . . . . . . . . . . 64,044 398,574Receivables:
Investments sold . . . . . . . . . . . . . . . . . . . . . . . . . . . . . . . . . . . . . . . . . . . . . . . . . . . . . . . . . . . . . . . . . . . . . . . . . . . . – 80,868Spot foreign exchange contracts awaiting settlement . . . . . . . . . . . . . . . . . . . . . . . . . . . . . . . . . . . . . . . . . . . . . . . . . . . . 9 10Funds shares sold . . . . . . . . . . . . . . . . . . . . . . . . . . . . . . . . . . . . . . . . . . . . . . . . . . . . . . . . . . . . . . . . . . . . . . . . . . . 48,989 16,371Dividends . . . . . . . . . . . . . . . . . . . . . . . . . . . . . . . . . . . . . . . . . . . . . . . . . . . . . . . . . . . . . . . . . . . . . . . . . . . . . . . . . 17,982 15,262
Receivable from Investment Manager . . . . . . . . . . . . . . . . . . . . . . . . . . . . . . . . . . . . . . . . . . . . . . . . . . . . . . . . . . . . . . . . 496 3,723
Total Assets . . . . . . . . . . . . . . . . . . . . . . . . . . . . . . . . . . . . . . . . . . . . . . . . . . . . . . . . . . . . . . . . . . . . . . . . . 34,103,569 23,627,899 Liabilities (amounts falling due within one year)Payables:
Financial liabilities at fair value through profit or loss . . . . . . . . . . . . . . . . . . . . . . . . . . . . . . . . . . . . . . . . . . . . . . . . . . . . 8,836 665Fund shares repurchased . . . . . . . . . . . . . . . . . . . . . . . . . . . . . . . . . . . . . . . . . . . . . . . . . . . . . . . . . . . . . . . . . . . . . . 74,300 66,976Investment Management fees . . . . . . . . . . . . . . . . . . . . . . . . . . . . . . . . . . . . . . . . . . . . . . . . . . . . . . . . . . . . . . . . . . . 33,587 24,194Shareholder Service fees . . . . . . . . . . . . . . . . . . . . . . . . . . . . . . . . . . . . . . . . . . . . . . . . . . . . . . . . . . . . . . . . . . . . . . 18,218 14,060Distribution fees . . . . . . . . . . . . . . . . . . . . . . . . . . . . . . . . . . . . . . . . . . . . . . . . . . . . . . . . . . . . . . . . . . . . . . . . . . . . . 1,568 1,659Accounting, Administration and Transfer Agent fees . . . . . . . . . . . . . . . . . . . . . . . . . . . . . . . . . . . . . . . . . . . . . . . . . . . . 11,982 24Management fees . . . . . . . . . . . . . . . . . . . . . . . . . . . . . . . . . . . . . . . . . . . . . . . . . . . . . . . . . . . . . . . . . . . . . . . . . . . 667 441Accrued expenses . . . . . . . . . . . . . . . . . . . . . . . . . . . . . . . . . . . . . . . . . . . . . . . . . . . . . . . . . . . . . . . . . . . . . . . . . . . 39,871 47,196
Total Liabilities (excluding Net Assets attributable to holders of redeemable ordinary shares) . . . . . . . . . . . . 189,029 155,215 Net Assets attributable to holders of redeemable ordinary participating shares . . . . . . . . . . . . . . . . . . . . . . 33,914,540 23,472,684
DocuSign Envelope ID: 521655BF-9BE3-47DC-A9A3-494932954338

Janus Henderson Capital Funds plc / 31 December 2021106
Janus Henderson US Contrarian Fund (continued)
The accompanying notes are an integral part of the financial statements.
Statement of Comprehensive IncomeYear ended
31 December 2021
(USD)
Year ended 31 December
2020 (USD)
Year ended Year endedRevenue:Interest income . . . . . . . . . . . . . . . . . . . . . . . . . . . . . . . . . . . . . . . . . . . . . . . . . . . . . . . . . . . . . . . . . . . . . . . . . . . . . . . (829) 7,226Dividend income . . . . . . . . . . . . . . . . . . . . . . . . . . . . . . . . . . . . . . . . . . . . . . . . . . . . . . . . . . . . . . . . . . . . . . . . . . . . . . 452,581 231,478Other income . . . . . . . . . . . . . . . . . . . . . . . . . . . . . . . . . . . . . . . . . . . . . . . . . . . . . . . . . . . . . . . . . . . . . . . . . . . . . . . . 51,360 292
Net gain on financial assets and liabilities at fair value through profit or loss . . . . . . . . . . . . . . . . . . . . . . . . . . . . . . . . . . . . . . 4,751,496 5,134,616 Total Investments Income . . . . . . . . . . . . . . . . . . . . . . . . . . . . . . . . . . . . . . . . . . . . . . . . . . . . . . . . . . . . . . . 5,254,608 5,373,612
Expenses:Investment Management fees . . . . . . . . . . . . . . . . . . . . . . . . . . . . . . . . . . . . . . . . . . . . . . . . . . . . . . . . . . . . . . . . . . . . . 411,830 246,347Shareholder Service fees . . . . . . . . . . . . . . . . . . . . . . . . . . . . . . . . . . . . . . . . . . . . . . . . . . . . . . . . . . . . . . . . . . . . . . . . 230,337 145,846Distribution fees . . . . . . . . . . . . . . . . . . . . . . . . . . . . . . . . . . . . . . . . . . . . . . . . . . . . . . . . . . . . . . . . . . . . . . . . . . . . . . 20,375 16,359Management fees . . . . . . . . . . . . . . . . . . . . . . . . . . . . . . . . . . . . . . . . . . . . . . . . . . . . . . . . . . . . . . . . . . . . . . . . . . . . . 8,088 2,438Accounting, Administration and Transfer Agent fees . . . . . . . . . . . . . . . . . . . . . . . . . . . . . . . . . . . . . . . . . . . . . . . . . . . . . . 62,248 20,950Custodian fees . . . . . . . . . . . . . . . . . . . . . . . . . . . . . . . . . . . . . . . . . . . . . . . . . . . . . . . . . . . . . . . . . . . . . . . . . . . . . . . 20,366 18,826Audit fees . . . . . . . . . . . . . . . . . . . . . . . . . . . . . . . . . . . . . . . . . . . . . . . . . . . . . . . . . . . . . . . . . . . . . . . . . . . . . . . . . . 18,883 23,424Printing expenses . . . . . . . . . . . . . . . . . . . . . . . . . . . . . . . . . . . . . . . . . . . . . . . . . . . . . . . . . . . . . . . . . . . . . . . . . . . . . 692 2,665Legal and other professional fees . . . . . . . . . . . . . . . . . . . . . . . . . . . . . . . . . . . . . . . . . . . . . . . . . . . . . . . . . . . . . . . . . . 12,378 26,948Other fees . . . . . . . . . . . . . . . . . . . . . . . . . . . . . . . . . . . . . . . . . . . . . . . . . . . . . . . . . . . . . . . . . . . . . . . . . . . . . . . . . . 13,465 8,125
Total Expenses . . . . . . . . . . . . . . . . . . . . . . . . . . . . . . . . . . . . . . . . . . . . . . . . . . . . . . . . . . . . . . . . . . . . . . . 798,662 511,928Less Expense Reimbursement . . . . . . . . . . . . . . . . . . . . . . . . . . . . . . . . . . . . . . . . . . . . . . . . . . . . . . . . . . . (2,907) (22,155)Net Expenses after Expense Reimbursement . . . . . . . . . . . . . . . . . . . . . . . . . . . . . . . . . . . . . . . . . . . . . . . . 795,755 489,773Net Operating Profit . . . . . . . . . . . . . . . . . . . . . . . . . . . . . . . . . . . . . . . . . . . . . . . . . . . . . . . . . . . . . . . . . . . 4,458,853 4,883,839
Withholding tax on dividends and other investment income . . . . . . . . . . . . . . . . . . . . . . . . . . . . . . . . . . . . . (129,904) (70,340)
Net Increase in Net Assets attributable to holders of redeemable ordinary shares resulting from operations . 4,328,949 4,813,499
. .
. .. . .
Statement of Changes in Net Assets Attributable to Redeemable Ordinary ShareholdersYear ended
31 December 2021
(USD)
Year ended 31 December
2020 (USD)
Increase in Net Assets attributable to holders of redeemable ordinary shares resulting from operations . . . . . . . . . . . . . . . . . . . . 4,328,949 4,813,499
Capital Share Transactions of redeemable ordinary shares:Proceeds from redeemable ordinary shares sold . . . . . . . . . . . . . . . . . . . . . . . . . . . . . . . . . . . . . . . . . . . . . . . . . . . . . . . 19,040,868 4,093,256Redemption of redeemable ordinary shares . . . . . . . . . . . . . . . . . . . . . . . . . . . . . . . . . . . . . . . . . . . . . . . . . . . . . . . . . . (12,936,239) (8,812,260)Dilution Adjustment. . . . . . . . . . . . . . . . . . . . . . . . . . . . . . . . . . . . . . . . . . . . . . . . . . . . . . . . . . . . . . . . . . . . . . . . . . . 8,278 396
Net Increase/(Decrease) from Capital Share Transactions of redeemable ordinary shares . . . . . . . . . . . . . . 6,112,907 (4,718,608)
Net Increase in Net Assets attributable to holders of redeemable ordinary shares . . . . . . . . . . . . . . . . . . . . . . . . . . . . . . . . . . . 10,441,856 94,891Net Assets attributable to holders of redeemable ordinary shares at the beginning of the financial year . . . . . . . . . . . . . . . . . . . . 23,472,684 23,377,793
Net Assets attributable to holders of redeemable ordinary shares at the end of the financial year . . . . . . . . . 33,914,540 23,472,684
Gains and losses are solely from continuing operations except for the Funds which ceased operations during the financial year ended 31 December 2021 and 31 December 2020. There were no gains and losses other than those dealt with in the Statement of Comprehensive Income. Please refer to note 1 which details the Fund closures during the year.
DocuSign Envelope ID: 521655BF-9BE3-47DC-A9A3-494932954338

107Janus Henderson Capital Funds plc / 31 December 2021
Janus Henderson US Contrarian Fund (continued)
Portfolio Investments
The accompanying notes are an integral part of the financial statements.
Shares or Principal Amount
Percentage of Net Assets
(%)Fair Value
(USD)
Financial Assets at fair value through profit or lossCommon Stock (2020: 97.77% USD 22,949,203)Cayman IslandsCapital Markets
10,654 Patria Investments Ltd., A 0.51 172,595
FranceMetals & Mining
51,474 Constellium SE 2.72 921,899
IrelandBiotechnology
19,082 Horizon Therapeutics plc 6.06 2,056,276
JerseyTrading Companies & Distributors
4,293 Ferguson plc 2.25 761,504
SwitzerlandHotels, Restaurants & Leisure
19,386 Sportradar Holding AG, A 1.00 340,612
United StatesAerospace & Defense
30,641 Howmet Aerospace, Inc. 2.88 975,303
Biotechnology4,336 AbbVie, Inc. 1.73 587,0947,408 Insmed, Inc. 0.60 201,7943,986 Neurocrine Biosciences, Inc. 1.00 339,488
3.33 1,128,376
Capital Markets10,237 Apollo Asset Management, Inc. 2.19 741,46610,205 Morgan Stanley 2.95 1,001,723
5.14 1,743,189
Consumer Finance6,112 Capital One Financial Corp. 2.61 886,790
18,323 OneMain Holdings, Inc. 2.70 916,8835.31 1,803,673
Containers & Packaging22,739 Crown Holdings, Inc. 7.42 2,515,388
Electric Utilities10,822 American Electric Power Co., Inc. 2.84 962,833
Entertainment11,042 Liberty Media Corp.-Liberty Formula
One, C 2.06 698,296
Equity Real Estate Investment Trusts (REITs)52,349 VICI Properties, Inc. 4.65 1,576,228
Health Care Equipment & Supplies23,299 Boston Scientific Corp. 2.92 989,742
7,858 Globus Medical, Inc., A 1.67 567,3484.59 1,557,090
Hotels, Restaurants & Leisure18,861 Caesars Entertainment, Inc. 5.20 1,764,0694,012 Monarch Casino & Resort, Inc. 0.88 296,687
26,489 Rush Street Interactive, Inc. 1.29 437,0697.37 2,497,825
Interactive Media & Services16,944 Snap, Inc., A 2.35 796,876
Internet & Direct Marketing Retail464 Amazon.com, Inc. 4.56 1,547,134
Shares or Principal Amount
Percentage of Net Assets
(%)Fair Value
(USD)
Leisure Products
6,532 Hasbro, Inc. 1.96 664,827
Metals & Mining37,819 Freeport-McMoRan, Inc. 4.65 1,578,187
Multi-Utilities4,275 Sempra Energy 1.67 565,497
Oil, Gas & Consumable Fuels17,578 Occidental Petroleum Corp. 1.50 509,586
Personal Products15,987 Beauty Health Co. (The) 1.14 386,246
Pharmaceuticals33,799 Organon & Co. 3.03 1,029,180
Semiconductors & Semiconductor Equipment5,488 Analog Devices, Inc. 2.84 964,6261,310 Lam Research Corp. 2.78 942,0878,218 Marvell Technology, Inc. 2.12 718,9934,913 Teradyne, Inc. 2.37 803,423
10.11 3,429,129
Software3,132 Ceridian HCM Holding, Inc. 0.96 327,1696,892 Zendesk, Inc. 2.12 718,767
3.08 1,045,936
Textiles, Apparel & Luxury Goods1,827 Deckers Outdoor Corp. 1.97 669,248
37,864 Under Armour, Inc., C 2.01 683,0673.98 1,352,315
Trading Companies & Distributors17,801 Core & Main, Inc., A 1.59 540,082
Wireless Telecommunication Services2,862 T-Mobile US, Inc. 0.98 331,935
Virgin Islands, BritishBiotechnology
1,481 Biohaven Pharmaceutical Holding Co. Ltd. 0.60 204,097
Total Common Stock 99.33 33,692,114
Government Obligations (2020: 0.00% USD –)US Treasury Notes/Bonds
100,000 0.0000%, due 4/1/22 0.30 100,000
Total Government Obligations 0.30 100,000
Total Investments (Cost: USD 26,090,440) 99.63 33,792,114
Forward Currency Contracts (2020: 0.70% USD 163,888)Open as at 31 December 2021.
Current Market
Percentage of Net Unrealised
Currency Currency Value Settle Assets GainPurchased Sold (USD) Date (%) (USD)
.J.P. Morgan CHF◊ 220,108 USD 235,899 241,727 31-Jan-22 0.02 5,828
EUR◊ 10,616,677 USD 11,919,721 12,093,828 31-Jan-22 0.51 174,107
Total 0.53 179,935
.
Total Financial Assets at fair value through profit or loss 100.16 33,972,049
DocuSign Envelope ID: 521655BF-9BE3-47DC-A9A3-494932954338

Janus Henderson Capital Funds plc / 31 December 2021108
The accompanying notes are an integral part of the financial statements.
Janus Henderson US Contrarian Fund (continued)
Portfolio Investments
Financial Liabilities at fair value through profit or loss.Forward Currency Contracts (2020: 0.00% USD (665))Open as at 31 December 2021
Current Market
Percentage of Net Unrealised
Currency Currency Value Settle Assets LossPurchased Sold (USD) Date (%) (USD)
J.P. Morgan USD◊ 22,915 CHF 21,113 23,184 31-Jan-22 0.00 (269)
USD◊ 1,214,414 EUR 1,073,604 1,222,981 31-Jan-22 (0.02) (8,567)
Total (0.02) (8,836).
Total Financial Liabilities at fair value through profit or loss (0.02) (8,836)
Portfolio Analysis (Unaudited)
Analysis of Total Assets:% of Total
AssetsTransferable securities admitted to official stock exchange listing 98.79Transferable securities dealt in on another regulated market 0.29OTC financial derivative instruments 0.53Other Assets 0.39Total Assets 100.00
◊ These forward currency contracts are used for share class hedging.
DocuSign Envelope ID: 521655BF-9BE3-47DC-A9A3-494932954338

109Janus Henderson Capital Funds plc / 31 December 2021
The accompanying notes are an integral part of the financial statements.
Janus Henderson US Contrarian Fund (continued)
Fair Value Hierarchy
The tables below provide the fair value hierarchy summary of the Fund’s financial assets and liabilities measured at fair value at 31 December 2021 and 31 December 2020.
31 December 2021
Level 1 - Quoted Prices
(USD)
Level 2 - Other Significant
Observable Inputs (USD)
Level 3 - Significant
Unobservable Inputs (USD)
Total (USD)
Common Stock 33,692,114 – – 33,692,114Forward Currency Contracts – 171,099 – 171,099Government Obligations – 100,000 – 100,000Total Investments in Securities 33,692,114 271,099 – 33,963,213
31 December 2020
Level 1 - Quoted Prices
(USD)
Level 2 - Other Significant
Observable Inputs (USD)
Level 3 - Significant
Unobservable Inputs (USD)
Total (USD)
Common Stock 22,481,609 467,5941 – 22,949,203Forward Currency Contracts – 163,223 – 163,223Total Investments in Securities 22,481,609 630,817 – 23,112,426
1At 31 December 2020, the administrator used a systematic fair valuation model provided by an independent third party to value listed securities in order to adjust for stale pricing between the close of foreign exchanges and the valuation point. This resulted in an increase of USD 470 to common stocks with a fair value of USD 467,594.
There were transfers on Common Stock from level 2 to level 1 during the year ended 31 December 2021 and on Common Stock from level 1 to level 2 during the year ended 31 December 2020.
There were no investments held by the Fund at 31 December 2021 and 31 December 2020 that were fair valued at level 3 by the Janus Henderson Global Pricing Committee.
Valuation policy of private placements is referenced in note 2 of the financial statements.
DocuSign Envelope ID: 521655BF-9BE3-47DC-A9A3-494932954338

Janus Henderson Capital Funds plc / 31 December 2021110
Janus Henderson US Contrarian Fund (continued)
The accompanying notes are an integral part of the financial statements.
Capital Share Transactions
For the financial year ended 31 December 2021
A1 USD A2 HCHF A2 HEUR A2 USD B2 USD E2 HEUR H2 HCHF H2 USDShares Shares Shares Shares Shares Shares Shares Shares
At beginning of the year . . . . . . . 1,881 – 169,264 463,790 77,216 209 – 6,399Shares issued 386 19,175 143,449 249,208 2 6,049 275 6,704Shares redeemed. . . . . . . . . . . (192) – (44,827) (275,511) (14,274) (1,070) – (6,064)At end of year . . . . . . . . . . . . . 2,075 19,175 267,886 437,487 62,944 5,188 275 7,039
I2 HCHF I2 HEUR I2 USDShares Shares Shares
At beginning of the year . . . . . . . – 10,982 559Shares issued 275 8,428 79,682Shares redeemed. . . . . . . . . . . – (4,398) (391)At end of year . . . . . . . . . . . . . 275 15,012 79,850
For the financial year ended 31 December 2020
A1 USD A2 HEUR A2 USD B2 USD E2 HEUR H2 USD I2 HEUR I2 USDShares Shares Shares Shares Shares Shares Shares Shares
At beginning of the year . . . . . . . 1,881 174,404 639,648 82,077 2,014 3,038 5,755 20,337Shares issued – 33,900 111,094 – 249 3,648 14,696 164Shares redeemed. . . . . . . . . . . – (39,040) (286,952) (4,861) (2,054) (287) (9,469) (19,942)At end of year . . . . . . . . . . . . . 1,881 169,264 463,790 77,216 209 6,399 10,982 559
DocuSign Envelope ID: 521655BF-9BE3-47DC-A9A3-494932954338

111Janus Henderson Capital Funds plc / 31 December 2021
Janus Henderson US Contrarian Fund (continued)
The accompanying notes are an integral part of the financial statements.
Net Asset Comparison
31 December 2021 31 December 2020 31 December 2019
Net Assets (USD)
NAV Per Share
(Local Currency)Net Assets
(USD)
NAV Per Share
(Local Currency)Net Assets
(USD)
NAV Per Share
(Local Currency)
A1 USD 61,277 29.53 46,766 24.86 36,889 19.61A2 HCHF 213,734 10.16 – – – –A2 HEUR 10,327,693 33.86 5,964,009 28.84 4,544,175 23.23A2 USD 16,768,196 38.33 14,966,870 32.27 16,262,060 25.42B2 USD 1,917,651 30.47 2,000,624 25.91 1,694,262 20.64E2 HEUR 135,145 22.88 4,991 19.58 35,780 15.84H2 HCHF 3,088 10.23 – – – –H2 USD 200,918 28.54 151,700 23.71 56,000 18.43I2 HCHF 3,086 10.22 – – – –I2 HEUR 477,604 27.94 315,558 23.52 120,718 18.70I2 USD 3,806,148 47.67 22,166 39.65 627,909 30.87
. . .
Total Expense Ratio (unaudited)
The Average Total Expense Ratio table shows the actual expenses, excluding transactions costs and trade commissions, incurred by each Class for the Fund during the reporting financial year expressed as a percentage of the average net assets for the corresponding year, on an annualised basis.
31 December 2021 31 December 2020 31 December 2019A1 USD 2.38% 2.50% 2.50%A2 HCHF* 2.36% – –A2 HEUR 2.40% 2.50% 2.50%A2 USD 2.39% 2.34% 2.50%B2 USD 3.39% 3.50% 3.50%E2 HEUR 2.85% 3.00% 3.00%H2 HCHF* 1.05% – –H2 USD 1.03% 1.05% 1.05%I2 HCHF* 1.20% – –I2 HEUR 1.17% 1.20% 1.20%I2 USD 1.17% 1.20% 1.20%
*As the share class launched during the year, an estimated Total Expense Ratio is disclosed for the year end.
DocuSign Envelope ID: 521655BF-9BE3-47DC-A9A3-494932954338

Janus Henderson Capital Funds plc / 31 December 2021112
Janus Henderson US Contrarian Fund (continued)
The accompanying notes are an integral part of the financial statements.
Fund Performance (unaudited)
As at 31 December 2021
One year Three years Five yearsSince
inception
Performance (Annualised) 31/12/2020 31/12/2021
%
31/12/2017 31/12/2021
%
31/12/2015 31/12/2021
%
to 31/12/2021
%
H2 USD (Net)* 20.37 28.54** 15.44** 6.01**S&P 500 TR 28.71 26.06 18.48 8.09
Five years 31/12/2015 31/12/2021
%H2 USD (Gross)* 18.30S&P 500 TR + 2.00% 20.85
.
Discrete performance
31/12/2020 31/12/2021
%
31/12/2019 31/12/2020
%
31/12/2018 31/12/2019
%
31/12/2017 31/12/2018
%
31/12/2016 31/12/2017
%
H2 USD (Net)* 20.37 26.95** 40.91** (6.43)** 3.16**S&P 500 TR 28.71 18.40 31.49 (4.38) 21.83
H2 USD (Gross)* 21.63 30.15** 44.46** (4.07)** 5.62**S&P 500 TR + 2.00% 31.28 20.77 34.11 (2.46) 24.26
. . . . .
Class H2 USD is disclosed as it is the representative share class.
* The representative share class has changed from the A2 USD to the H2 USD share class with effect from August 2021.
** Historical figures are based on the A2 USD share class.
Performance target: To outperform the S&P 500 Index by at least 2% per annum, before the deduction of charges, over any 5 year period.
The Total Expense Ratio includes fees payable to Distributors. Where the Total Expense Ratio exceeds the target outperformance relative to the benchmark the return is likely to be below the benchmark return, even when the Fund’s outperformance target (before the deduction of charges) has been achieved.
Please note the Gross Returns 5 year annualised table is only applicable for share classes which have been active for 5 or more years and the performance target is to be achieved over a specific annualised time period. Performance target and index shown in USD.
Past performance does not guarantee future returns. The rates of return will vary and the principal value of an investment will fluctuate. Shares, if redeemed, may be worth more or less than their original cost. The performance data does not take account of the commissions and costs incurred on the issue and redemption of Shares. All returns are calculated in the base currency of the representative Share Class.
There is no guarantee that the Fund’s performance will match or exceed the benchmark.
DocuSign Envelope ID: 521655BF-9BE3-47DC-A9A3-494932954338

113Janus Henderson Capital Funds plc / 31 December 2021
Janus Henderson US Contrarian Fund (continued)
Statements of Changes in Composition of Portfolio (unaudited)The tables below show a breakdown of material purchases and sales of the Investment Portfolio in accordance with Central Bank UCITS Regulations 79(2) requirements. All purchases and sales of investments exceeding 1% of the total value of each transaction respectively, are disclosed, with a minimum number of 20 of each such transaction. A full analysis of the movement on the Investment Portfolio is available upon request from the registered office.
Major Purchases for the year ended 31 December 2021
Shares or Principal Amount
Cost (USD)
Credit Agricole Corporate And Investment Bank, 0.0000%, due 21/7/21 1,900,000 1,899,997Credit Agricole Corporate And Investment Bank, 0.0000%, due 27/7/21 1,900,000 1,899,997Credit Agricole Corporate And Investment Bank, 0.0000%, due 15/7/21 1,800,000 1,799,997Credit Agricole Corporate And Investment Bank, 0.0000%, due 22/7/21 1,800,000 1,799,997Credit Agricole Corporate And Investment Bank, 0.0000%, due 23/7/21 1,800,000 1,799,997Credit Industriel et Commercial, 0.0000%, due 16/7/21 1,800,000 1,799,996Credit Agricole Corporate And Investment Bank, 0.0000%, due 19/7/21 1,800,000 1,799,991Credit Industriel et Commercial, 0.0000%, due 20/7/21 1,700,000 1,699,996Credit Agricole Corporate And Investment Bank, 0.0000%, due 13/7/21 1,600,000 1,599,997Credit Agricole Corporate And Investment Bank, 0.0000%, due 14/7/21 1,600,000 1,599,997Credit Agricole Corporate And Investment Bank, 0.0000%, due 26/7/21 1,600,000 1,599,993Credit Industriel et Commercial, 0.0000%, due 17/5/21 1,500,000 1,499,994Credit Agricole Corporate And Investment Bank, 0.0000%, due 28/7/21 1,400,000 1,399,998Credit Industriel et Commercial, 0.0000%, due 4/5/21 1,400,000 1,399,998Credit Industriel et Commercial, 0.0000%, due 29/6/21 1,400,000 1,399,997Credit Industriel et Commercial, 0.0000%, due 29/7/21 1,400,000 1,399,997Credit Industriel et Commercial, 0.0000%, due 7/7/21 1,400,000 1,399,997Credit Industriel et Commercial, 0.0000%, due 12/7/21 1,400,000 1,399,991Amazon.com, Inc. 380 1,306,370Credit Industriel et Commercial, 0.0000%, due 7/5/21 1,300,000 1,299,998
Major Sales for the year ended 31 December 2021
Shares or Principal Amount
Proceeds (USD)
Marvell Technology, Inc. 27,452 1,725,118Morgan Stanley 11,854 1,169,309Citigroup, Inc. 15,278 1,044,180L3Harris Technologies, Inc. 4,050 924,878Boston Scientific Corp. 18,077 779,409Elanco Animal Health, Inc. 17,464 617,584Terminix Global Holdings, Inc. 14,973 615,014T-Mobile US, Inc. 4,864 602,934Freeport-McMoRan, Inc. 15,987 599,885Crown Holdings, Inc. 5,323 582,270Atotech Ltd. 22,860 553,966Summit Materials, Inc. 14,334 525,420Warner Music Group Corp. 13,325 498,915Amazon.com, Inc. 130 433,168AbbVie, Inc. 3,602 407,813Apollo Asset Management, Inc. 6,420 395,696Microchip Technology, Inc. 2,644 393,993Analog Devices, Inc. 1,941 362,322Collegium Pharmaceutical, Inc. 16,430 357,475VICI Properties, Inc. 11,832 344,167QUALCOMM, Inc. 2,195 334,735Horizon Therapeutics plc 2,768 299,016Under Armour, Inc. 'C' 14,891 296,386Hasbro, Inc. 2,969 293,498American Electric Power Co., Inc. 3,434 290,872Liberty Media Corp.-Liberty Formula One 'C' 4,812 272,094Constellium SE 13,117 245,358Neurocrine Biosciences, Inc. 2,760 233,339Caesars Entertainment, Inc. 2,397 232,239Howmet Aerospace, Inc. 7,410 222,185ICU Medical, Inc. 934 204,355Capital One Financial Corp. 1,202 190,025
DocuSign Envelope ID: 521655BF-9BE3-47DC-A9A3-494932954338

Janus Henderson US Balanced 2026 Fund
Janus Henderson Capital Funds plc / 31 December 2021114
Fund Overview (unaudited)Investment Objective and Policy
The Fund aims to provide a total return (income and capital growth), over the 7 year term. Neither the income nor capital value at maturity is guaranteed.
Performance Target: To deliver 2.5% per annum income (based upon the initial subscription value) and capital growth, before the deduction of fees and expenses, to 18 November 2026 (“Maturity”).
The Fund invests between 25% and 45% of its assets in shares (equities) of US companies and between 55% and 75% of its assets in bonds issued by US companies. The investment manager actively adjusts the allocation between equities and bonds over time based on a view of overall market risk and the valuations of bond and equity markets. At least 75% of the Fund is invested in US assets.
The Fund is actively managed without reference to a benchmark. The investment manager has a high degree of freedom to choose individual investments for the Fund.
How Sustainability Risks are part of the investment processThe investments underlying this financial product (referred to as the Fund) do not take into account the EU criteria for environmentally sustainable economic activities, although the Manager and the Investment Manager have agreed a decision making process that will apply to investment decisions relating to the Fund as further detailed in the Prospectus.
The likely impacts of sustainability risks on the returns of the FundWhile the analysis of (Environmental, Social and Governance) ESG factors is an integral component across the Investment Manager’s investment capabilities and one of a number of inputs to the selection of investments and portfolio construction, the investment process of the Investment Manager is primarily designed to maximise long-term risk-adjusted returns for investors. Therefore, in managing the Fund, the Investment Manager does not maximise portfolio alignment with sustainability risks as a separate goal in its own right nor does it precisely attribute the impact of ESG factors on returns for the Fund.
Fund Overview
Jeremiah Buckley, Greg Wilensky, Michael Keough and David Chung, portfolio managers
For the year ended 31 December 2021, the Janus Henderson US Balanced 2026 Fund Y2 HEUR returned 9.01% (Net) and 10.96% (Gross) in euro terms compared with 18.15% for its benchmark, the Balanced Index, an internally calculated benchmark that combines the total returns from the S&P 500® Index (40%) and the Bloomberg US Aggregate Bond Index (60%).
On average, the Fund was positioned at its maximum 45% limit in stocks throughout the year (based on month-end data). The equity allocation may vary based on market conditions, and the Fund’s overweight to equities relative to the Balanced Index reflected our belief that equities offered greater risk-adjusted opportunities versus fixed income.
The equity portion outperformed the S&P 500 Index, driven by strong stock selection, particularly in the technology, health care and consumer staples sectors. Nvidia was the largest individual equity contributor to relative results. As large technology platform companies continued to increase capital spending on network data centers and infrastructure during the year, Nvidia – a leading producer of graphics processing units – benefited. Semiconductor company Lam Research was another relative contributor. Demand forecasts for wafer fabrication equipment increased during the year, and the company benefited near year-end from the stabilization of memory prices.
Detractors included a lack of exposure to energy – the best-performing benchmark sector during the year – and an underweight to the strong-performing real estate sector. Credit card service provider Mastercard led individual equity detractors. The Delta and Omicron variants of COVID-19 dashed investor optimism that cross-border travel spending would see a sizable recovery during the year. Comcast was another detractor given concerns around slower subscriber growth for high-speed cable internet in 2021 versus the prior year.
The fixed income portion outperformed the Bloomberg US Aggregate Bond Index. Although we consistently trimmed the fixed income portion’s allocation to corporate bonds during the year, our overall favorable view on the US economy led us to maintain its overweight exposure to corporate bonds (including high yield) and securitized credit such as asset-backed securities (ABS) and commercial mortgage-backed securities (CMBS). We maintained underweight exposures to US Treasuries and mortgage-backed securities (MBS).
Our decision to reduce corporate credit exposure was primarily due to credit spreads narrowing as the year progressed. Corporate bond sales were focused on the investment-grade market given our view that the relatively tight level of spreads diminished their attractiveness on a risk-adjusted basis compared to high yield. Within high yield, we adjusted positions, emphasizing names believed to have the potential to be ‘rising stars’ – securities that could see sufficient rating improvement to push them into the investment-grade market. We added floating rate products such as bank loans. We were also active within our ABS and CMBS allocations, focusing on relative-value opportunities identified through individual security analysis. Within Treasury Inflation-Protected Securities (TIPS), we actively adjusted the allocation as inflation expectations changed throughout the year.
DocuSign Envelope ID: 521655BF-9BE3-47DC-A9A3-494932954338

115Janus Henderson Capital Funds plc / 31 December 2021
Janus Henderson US Balanced 2026 Fund (continued)
Fund Overview (unaudited) (continued)
Our asset allocation decisions drove relative outperformance versus the Bloomberg US Aggregate Bond Index. The Fund’s out-of-index allocation to high-yield corporate bonds performed well as the economic outlook continued to improve and investors’ demand for yield remained intact. Out-of-index exposure to TIPS was also a strong contributor. An underweight to MBS and strong security selection further benefited relative performance. The Fund’s positioning relative to the US Treasury yield curve and a lack of exposure to government-related securities detracted.
As always, we will continue to dynamically adjust each sleeve of the Fund, as well as overall asset allocation, based on market conditions and the investment opportunities our equity and fixed income teams identify through their bottom-up, fundamental research.
Thank you for investing in Janus Henderson Balanced 2026 Fund.
January 2022
DocuSign Envelope ID: 521655BF-9BE3-47DC-A9A3-494932954338

Janus Henderson Capital Funds plc / 31 December 2021116
The accompanying notes are an integral part of the financial statements.
Janus Henderson US Balanced 2026 Fund (continued)
Statement of Financial PositionAs of
31 December 2021
(USD)
As of 31 December
2020 (USD)
Assets:Financial assets at fair value through profit or loss . . . . . . . . . . . . . . . . . . . . . . . . . . . . . . . . . . . . . . . . . . . . . . . . . . . . . . . 71,496,321 72,846,096Cash and foreign currency . . . . . . . . . . . . . . . . . . . . . . . . . . . . . . . . . . . . . . . . . . . . . . . . . . . . . . . . . . . . . . . . . . . . . . . 925,694 1,555,488Receivables:
Investments sold . . . . . . . . . . . . . . . . . . . . . . . . . . . . . . . . . . . . . . . . . . . . . . . . . . . . . . . . . . . . . . . . . . . . . . . . . . . . 1,604,499 –Spot foreign exchange contracts awaiting settlement . . . . . . . . . . . . . . . . . . . . . . . . . . . . . . . . . . . . . . . . . . . . . . . . . . . . 89 –Dividends . . . . . . . . . . . . . . . . . . . . . . . . . . . . . . . . . . . . . . . . . . . . . . . . . . . . . . . . . . . . . . . . . . . . . . . . . . . . . . . . . 10,054 14,650Interest . . . . . . . . . . . . . . . . . . . . . . . . . . . . . . . . . . . . . . . . . . . . . . . . . . . . . . . . . . . . . . . . . . . . . . . . . . . . . . . . . . . 159,993 215,494
Other debtors . . . . . . . . . . . . . . . . . . . . . . . . . . . . . . . . . . . . . . . . . . . . . . . . . . . . . . . . . . . . . . . . . . . . . . . . . . . . . . . . – 15,346
Total Assets . . . . . . . . . . . . . . . . . . . . . . . . . . . . . . . . . . . . . . . . . . . . . . . . . . . . . . . . . . . . . . . . . . . . . . . . . 74,196,650 74,647,074 Liabilities (amounts falling due within one year)Payables:
Financial liabilities at fair value through profit or loss . . . . . . . . . . . . . . . . . . . . . . . . . . . . . . . . . . . . . . . . . . . . . . . . . . . . 17,006 489Bank overdraft and foreign currency . . . . . . . . . . . . . . . . . . . . . . . . . . . . . . . . . . . . . . . . . . . . . . . . . . . . . . . . . . . . . . . 8,019 –Investments purchased . . . . . . . . . . . . . . . . . . . . . . . . . . . . . . . . . . . . . . . . . . . . . . . . . . . . . . . . . . . . . . . . . . . . . . . . 5,221,075 1,932,614Spot foreign exchange contracts awaiting payment . . . . . . . . . . . . . . . . . . . . . . . . . . . . . . . . . . . . . . . . . . . . . . . . . . . . . – 10Fund shares repurchased . . . . . . . . . . . . . . . . . . . . . . . . . . . . . . . . . . . . . . . . . . . . . . . . . . . . . . . . . . . . . . . . . . . . . . 29,459 29,300Investment Management fees . . . . . . . . . . . . . . . . . . . . . . . . . . . . . . . . . . . . . . . . . . . . . . . . . . . . . . . . . . . . . . . . . . . 46,503 49,353Shareholder Service fees . . . . . . . . . . . . . . . . . . . . . . . . . . . . . . . . . . . . . . . . . . . . . . . . . . . . . . . . . . . . . . . . . . . . . . 21,751 23,128Accounting, Administration and Transfer Agent fees . . . . . . . . . . . . . . . . . . . . . . . . . . . . . . . . . . . . . . . . . . . . . . . . . . . . 10,634 –Management fees . . . . . . . . . . . . . . . . . . . . . . . . . . . . . . . . . . . . . . . . . . . . . . . . . . . . . . . . . . . . . . . . . . . . . . . . . . . 1,311 1,394Accrued expenses . . . . . . . . . . . . . . . . . . . . . . . . . . . . . . . . . . . . . . . . . . . . . . . . . . . . . . . . . . . . . . . . . . . . . . . . . . . 56,427 10,045
Total Liabilities (excluding Net Assets attributable to holders of redeemable ordinary shares) . . . . . . . . . . . . 5,412,185 2,046,333 Net Assets attributable to holders of redeemable ordinary participating shares . . . . . . . . . . . . . . . . . . . . . . 68,784,465 72,600,741
.
+
DocuSign Envelope ID: 521655BF-9BE3-47DC-A9A3-494932954338

117Janus Henderson Capital Funds plc / 31 December 2021
Janus Henderson US Balanced 2026 Fund (continued)
The accompanying notes are an integral part of the financial statements.
Statement of Comprehensive IncomeYear ended
31 December 2021
(USD)
Year ended 31 December
2020 (USD)
Year ended Year endedRevenue:Interest income . . . . . . . . . . . . . . . . . . . . . . . . . . . . . . . . . . . . . . . . . . . . . . . . . . . . . . . . . . . . . . . . . . . . . . . . . . . . . . . 929,123 1,072,205Dividend income . . . . . . . . . . . . . . . . . . . . . . . . . . . . . . . . . . . . . . . . . . . . . . . . . . . . . . . . . . . . . . . . . . . . . . . . . . . . . . 394,790 454,523Other income . . . . . . . . . . . . . . . . . . . . . . . . . . . . . . . . . . . . . . . . . . . . . . . . . . . . . . . . . . . . . . . . . . . . . . . . . . . . . . . . 86,990 1,290
Net gain on financial assets and liabilities at fair value through profit or loss . . . . . . . . . . . . . . . . . . . . . . . . . . . . . . . . . . . . . . 1,153,060 13,048,723 Total Investments Income . . . . . . . . . . . . . . . . . . . . . . . . . . . . . . . . . . . . . . . . . . . . . . . . . . . . . . . . . . . . . . . 2,563,963 14,576,741
Expenses:Investment Management fees . . . . . . . . . . . . . . . . . . . . . . . . . . . . . . . . . . . . . . . . . . . . . . . . . . . . . . . . . . . . . . . . . . . . . 576,196 524,478Shareholder Service fees . . . . . . . . . . . . . . . . . . . . . . . . . . . . . . . . . . . . . . . . . . . . . . . . . . . . . . . . . . . . . . . . . . . . . . . . 288,098 262,239Management fees . . . . . . . . . . . . . . . . . . . . . . . . . . . . . . . . . . . . . . . . . . . . . . . . . . . . . . . . . . . . . . . . . . . . . . . . . . . . . 17,286 8,341Accounting, Administration and Transfer Agent fees . . . . . . . . . . . . . . . . . . . . . . . . . . . . . . . . . . . . . . . . . . . . . . . . . . . . . . 69,030 6,590Custodian fees . . . . . . . . . . . . . . . . . . . . . . . . . . . . . . . . . . . . . . . . . . . . . . . . . . . . . . . . . . . . . . . . . . . . . . . . . . . . . . . 69,649 3,721Audit fees . . . . . . . . . . . . . . . . . . . . . . . . . . . . . . . . . . . . . . . . . . . . . . . . . . . . . . . . . . . . . . . . . . . . . . . . . . . . . . . . . . 18,091 20,851Printing expenses . . . . . . . . . . . . . . . . . . . . . . . . . . . . . . . . . . . . . . . . . . . . . . . . . . . . . . . . . . . . . . . . . . . . . . . . . . . . . 2,515 1,219Legal and other professional fees . . . . . . . . . . . . . . . . . . . . . . . . . . . . . . . . . . . . . . . . . . . . . . . . . . . . . . . . . . . . . . . . . . 8,042 6,727Other fees . . . . . . . . . . . . . . . . . . . . . . . . . . . . . . . . . . . . . . . . . . . . . . . . . . . . . . . . . . . . . . . . . . . . . . . . . . . . . . . . . . 25,126 (21,557)
Total Expenses . . . . . . . . . . . . . . . . . . . . . . . . . . . . . . . . . . . . . . . . . . . . . . . . . . . . . . . . . . . . . . . . . . . . . . . 1,074,033 812,609Less Expense Reimbursement . . . . . . . . . . . . . . . . . . . . . . . . . . . . . . . . . . . . . . . . . . . . . . . . . . . . . . . . . . . – –Net Expenses after Expense Reimbursement . . . . . . . . . . . . . . . . . . . . . . . . . . . . . . . . . . . . . . . . . . . . . . . . 1,074,033 812,609Net Operating Profit . . . . . . . . . . . . . . . . . . . . . . . . . . . . . . . . . . . . . . . . . . . . . . . . . . . . . . . . . . . . . . . . . . . 1,489,930 13,764,132
Finance Costs: 1,281,170 1,251,441
Total distributions to holders of redeemable ordinary shares. . . . . . . . . . . . . . . . . . . . . . . . . . . . . . . . . . . . . . . . . . . . . . . . . (1,281,170) (1,251,441) Withholding tax on dividends and other investment income . . . . . . . . . . . . . . . . . . . . . . . . . . . . . . . . . . . . . (130,455) (140,807)
Net Increase in Net Assets attributable to holders of redeemable ordinary shares resulting from operations . 78,305 12,371,884
. .
. .. . .
Statement of Changes in Net Assets Attributable to Redeemable Ordinary ShareholdersYear ended
31 December 2021
(USD)
Year ended 31 December
2020 (USD)
Increase in Net Assets attributable to holders of redeemable ordinary shares resulting from operations . . . . . . . . . . . . . . . . . . . . 78,305 12,371,884
Capital Share Transactions of redeemable ordinary shares:Proceeds from redeemable ordinary shares sold . . . . . . . . . . . . . . . . . . . . . . . . . . . . . . . . . . . . . . . . . . . . . . . . . . . . . . . – 2,723Redemption of redeemable ordinary shares . . . . . . . . . . . . . . . . . . . . . . . . . . . . . . . . . . . . . . . . . . . . . . . . . . . . . . . . . . (3,894,581) (2,306,287)
Net (Decrease) from Capital Share Transactions of redeemable ordinary shares . . . . . . . . . . . . . . . . . . . . . . (3,894,581) (2,303,564)
Net (Decrease)/Increase in Net Assets attributable to holders of redeemable ordinary shares . . . . . . . . . . . . . . . . . . . . . . . . . . . (3,816,276) 10,068,320Net Assets attributable to holders of redeemable ordinary shares at the beginning of the financial year . . . . . . . . . . . . . . . . . . . . 72,600,741 62,532,421
Net Assets attributable to holders of redeemable ordinary shares at the end of the financial year . . . . . . . . . 68,784,465 72,600,741
Gains and losses are solely from continuing operations except for the Funds which ceased operations during the financial year ended 31 December 2021 or 31 December 2020. There were no gains and losses other than those dealt with in the Statement of Comprehensive Income. Please refer to note 1 which details the Fund closures during the year.
DocuSign Envelope ID: 521655BF-9BE3-47DC-A9A3-494932954338

Janus Henderson Capital Funds plc / 31 December 2021118
Janus Henderson US Balanced 2026 Fund (continued)
Portfolio Investments
The accompanying notes are an integral part of the financial statements.
Shares or Principal Amount
Percentage of Net Assets
(%)Fair Value
(USD)
Financial Assets at fair value through profit or lossAsset-Backed/Commercial Mortgage-Backed Securities (2020: 3.73% USD 2,706,859)
200,000 280 Park Avenue Mortgage Trust, 0.9898%, due 15/9/34 0.29 199,961
216,181 BANK, 4.2550%, due 15/5/61 0.36 244,26851,000 BANK, 4.2170%, due 15/8/61 0.08 57,59078,000 BBCMS Mortgage Trust, 4.3140%, due
15/12/51 0.13 88,698242,000 BBCMS Trust, 4.1970%, due 10/8/35 0.39 267,74846,000 BXP Trust, 3.3790%, due 13/6/39 0.07 49,073112,000 COMM Mortgage Trust, 4.2280%, due
10/5/51 0.18 125,93214,523 Connecticut Avenue Securities Trust,
2.5019%, due 25/4/31 0.02 14,5776,384 Connecticut Avenue Securities Trust,
2.4028%, due 25/8/31 0.01 6,40819,767 Connecticut Avenue Securities Trust,
2.2528%, due 25/9/31 0.03 19,8328,572 Connecticut Avenue Securities Trust,
2.1027%, due 25/7/39 0.01 8,5725,932 Connecticut Avenue Securities Trust,
2.2028%, due 25/10/39 0.01 5,94478,000 Connecticut Avenue Securities Trust,
1.5997%, due 25/10/41 0.11 78,12046,000 Connecticut Avenue Securities Trust,
1.7000%, due 25/12/41 0.07 46,1053,423 Connecticut Avenue Securities Trust,
2.2019%, due 25/6/39 0.01 3,42340,558 Connecticut Avenue Securities Trust,
2.1027%, due 25/1/40 0.06 40,641137,550 Domino's Pizza Master Issuer LLC,
3.6680%, due 25/10/49 0.21 144,976165,870 Domino's Pizza Master Issuer LLC,
4.3280%, due 25/7/48 0.25 174,301381 Drive Auto Receivables Trust, 3.5300%,
due 15/12/23 0.00 381142,161 GS Mortgage Securities Corp. II,
4.1550%, due 10/7/51 0.23 159,892133,241 GS Mortgage Securities Trust, 3.9920%,
due 10/3/51 0.21 147,68666,498 Jack in the Box Funding LLC, 4.4760%,
due 25/8/49 0.10 68,859150,000 Morgan Stanley Capital I Trust, 3.8090%,
due 15/12/48 0.23 160,941150,000 Morgan Stanley Capital I Trust, 2.7820%,
due 15/8/49 0.23 155,47840,000 Morgan Stanley Capital I Trust, 4.4070%,
due 15/10/51 0.07 45,525138,000 Morgan Stanley Capital I Trust, 4.3100%,
due 15/12/51 0.23 156,761138,000 Morgan Stanley Capital I Trust, 4.1770%,
due 15/7/51 0.23 155,08766,952 Morgan Stanley Capital I Trust, 6.0143%,
due 11/6/42 0.10 66,95288,840 NRZ Excess Spread-Collateralized
Notes, 3.1040%, due 25/7/26 0.13 88,67298,111 Oak Street Investment Grade Net Lease
Fund, 1.8500%, due 20/11/50 0.14 97,12348,375 Planet Fitness Master Issuer LLC,
4.2620%, due 5/9/48 0.07 48,37526,678 Sequoia Mortgage Trust, 2.5000%, due
25/5/43 0.04 27,04784,995 Taco Bell Funding LLC, 4.9700%, due
25/5/46 0.13 88,708
Shares or Principal Amount
Percentage of Net Assets
(%)Fair Value
(USD)
58,000 Taco Bell Funding LLC, 1.9460%, due
25/8/51 0.08 56,32071,000 Taco Bell Funding LLC, 2.2940%, due
25/8/51 0.10 69,35592,000 Wendy's Funding LLC, 3.7830%, due
15/6/49 0.14 95,16549,750 Wendy's Funding LLC, 2.3700%, due
15/6/51 0.07 48,91649,750 Wendy's Funding LLC, 2.7750%, due
15/6/51 0.07 49,689111,440 Wingstop Funding LLC, 2.8410%, due
5/12/50 0.16 112,89448,878 Zaxby's Funding LLC, 3.2380%, due
30/7/51 0.07 49,421Total Asset-Backed/Commercial Mortgage-Backed Securities 5.12 3,525,416
Common Stock (2020: 42.89% USD 31,131,239)IrelandBuilding Products
581 Trane Technologies plc 0.17 117,379
Health Care Equipment & Supplies1,643 Medtronic plc 0.25 169,968
IT Services946 Accenture plc, A 0.57 392,164
JerseyAuto Components
1,090 Aptiv plc 0.26 179,796
United KingdomPharmaceuticals
1,778 AstraZeneca plc 0.15 103,569
United StatesAerospace & Defense
1,503 General Dynamics Corp. 0.46 313,330862 L3Harris Technologies, Inc. 0.27 183,813
0.73 497,143
Air Freight & Logistics2,664 United Parcel Service, Inc., B 0.83 571,002
Airlines2,836 Southwest Airlines Co. 0.18 121,494
Banks15,112 Bank of America Corp. 0.98 672,333
Beverages530 Constellation Brands, Inc., A 0.19 133,014
4,293 Monster Beverage Corp. 0.60 412,3000.79 545,314
Biotechnology2,841 AbbVie, Inc. 0.56 384,671
Capital Markets1,994 Charles Schwab Corp. (The) 0.24 167,6951,771 CME Group, Inc. 0.59 404,603
6,700 Morgan Stanley 0.96 657,672224 S&P Global, Inc. 0.15 105,712
1.94 1,335,682
Chemicals613 Sherwin-Williams Co. (The) 0.31 215,874
Communications Equipment714 Motorola Solutions, Inc. 0.28 193,994
DocuSign Envelope ID: 521655BF-9BE3-47DC-A9A3-494932954338

119Janus Henderson Capital Funds plc / 31 December 2021
The accompanying notes are an integral part of the financial statements.
Janus Henderson US Balanced 2026 Fund (continued)
Portfolio Investments
Shares or Principal Amount
Percentage of Net Assets
(%)Fair Value
(USD)
Consumer Finance
2,743 American Express Co. 0.65 448,755
Electrical Equipment562 Rockwell Automation, Inc. 0.29 196,054
Electronic Equipment, Instruments & Components4,099 Corning, Inc. 0.22 152,606
Entertainment2,287 Activision Blizzard, Inc. 0.22 152,154
212 Netflix, Inc. 0.19 127,7172,563 Walt Disney Co. (The) 0.58 396,983
0.99 676,854
Food & Staples Retailing1,289 Costco Wholesale Corp. 1.06 731,7651,615 Sysco Corp. 0.18 126,858
1.24 858,623
Food Products1,132 Hershey Co. (The) 0.32 219,008
Health Care Equipment & Supplies3,576 Abbott Laboratories 0.73 503,286
190 Align Technology, Inc. 0.18 124,8641,916 Edwards Lifesciences Corp. 0.36 248,218373 Intuitive Surgical, Inc. 0.20 134,019651 Stryker Corp. 0.25 174,090
1.72 1,184,477
Health Care Providers & Services2,172 UnitedHealth Group, Inc. 1.59 1,090,648
Hotels, Restaurants & Leisure88 Booking Holdings, Inc. 0.31 211,132
2,020 Hilton Worldwide Holdings, Inc. 0.46 315,1002,381 McDonald's Corp. 0.93 638,2752,880 Starbucks Corp. 0.49 336,874
2.19 1,501,381
Household Products2,801 Procter & Gamble Co. (The) 0.67 458,188
Industrial Conglomerates2,044 Honeywell International, Inc. 0.62 426,194
Insurance4,807 Progressive Corp. (The) 0.72 493,439
Interactive Media & Services610 Alphabet, Inc., C 2.57 1,765,090
Internet & Direct Marketing Retail391 Amazon.com, Inc. 1.90 1,303,727
IT Services1,359 Fidelity National Information Services,
Inc. 0.22 148,3352,846 Mastercard, Inc., A 1.49 1,022,625
1.71 1,170,960
Leisure Products2,057 Hasbro, Inc. 0.30 209,361
Life Sciences Tools & Services284 Illumina, Inc. 0.16 108,045690 Thermo Fisher Scientific, Inc. 0.67 460,396
0.83 568,441
Machinery1,291 Deere & Co. 0.64 442,671
Shares or Principal Amount
Percentage of Net Assets
(%)Fair Value
(USD)
411 Parker-Hannifin Corp. 0.19 130,747
0.83 573,418
Media10,868 Comcast Corp., A 0.80 546,986
Multiline Retail2,034 Dollar General Corp. 0.70 479,678
Personal Products366 Estee Lauder Cos., Inc. (The), A 0.20 135,493
Pharmaceuticals2,477 Eli Lilly & Co. 0.99 684,1974,099 Merck & Co., Inc. 0.46 314,147
255 Zoetis, Inc. 0.09 62,2281.54 1,060,572
Real Estate Management & Development1,634 CBRE Group, Inc., A 0.26 177,305
Semiconductors & Semiconductor Equipment1,899 Advanced Micro Devices, Inc. 0.40 273,2661,080 Lam Research Corp. 1.13 776,6821,292 Marvell Technology, Inc. 0.16 113,0373,173 NVIDIA Corp. 1.36 933,2111,978 Texas Instruments, Inc. 0.54 372,794
3.59 2,468,990
Software1,366 Adobe, Inc. 1.13 774,6041,306 Cadence Design Systems, Inc. 0.35 243,3738,224 Microsoft Corp. 4.02 2,765,8961,218 salesforce.com, Inc. 0.45 309,530
5.95 4,093,403
Specialty Retail1,618 Home Depot, Inc. (The) 0.98 671,486
Technology Hardware, Storage & Peripherals10,527 Apple, Inc. 2.72 1,869,279
Textiles, Apparel & Luxury Goods2,575 NIKE, Inc., B 0.62 429,175
Total Common Stock 44.72 30,729,974
Corporate Bonds (2020: 31.86% USD 23,128,027)AustraliaBanks
250,000 National Australia Bank Ltd., 2.9900%, due 21/5/31 0.37 250,989
72,000 Westpac Banking Corp., 2.6680%, due 15/11/35 0.10 70,222
0.47 321,211
BermudaProfessional Services
32,000 IHS Markit Ltd., 4.7500%, due 15/2/25 0.05 34,924
CanadaHotels, Restaurants & Leisure
169,000 1011778 BC ULC, 4.0000%, due 15/10/30 0.24 166,394
Cayman IslandsTechnology Hardware, Storage & Peripherals
3,000 Seagate HDD Cayman, 4.8750%, due 1/6/27 0.00 3,273
35,000 Seagate HDD Cayman, 4.0910%, due 1/6/29 0.05 36,289
DocuSign Envelope ID: 521655BF-9BE3-47DC-A9A3-494932954338

Janus Henderson Capital Funds plc / 31 December 2021120
The accompanying notes are an integral part of the financial statements.
Janus Henderson US Balanced 2026 Fund (continued)
Portfolio Investments
Shares or Principal Amount
Percentage of Net Assets
(%)Fair Value
(USD)
15,000 Seagate HDD Cayman, 3.1250%, due
15/7/29 0.02 14,68856,000 Seagate HDD Cayman, 4.1250%, due
15/1/31 0.09 58,3430.16 112,593
FranceBanks
200,000 BNP Paribas SA, 2.5880%, due 12/8/35 0.28 191,827
IrelandConsumer Finance
150,000 AerCap Ireland Capital DAC, 4.6250%, due 15/10/27 0.24 166,058
150,000 AerCap Ireland Capital DAC, 3.0000%, due 29/10/28 0.22 152,238
150,000 AerCap Ireland Capital DAC, 3.3000%, due 30/1/32 0.22 152,942
0.68 471,238
JapanPharmaceuticals
21,000 Takeda Pharmaceutical Co. Ltd., 3.0250%, due 9/7/40 0.03 21,415
21,000 Takeda Pharmaceutical Co. Ltd., 3.3750%, due 9/7/60 0.03 21,816
0.06 43,231
NetherlandsPharmaceuticals
200,000 Teva Pharmaceutical Finance Netherlands III BV, 4.7500%, due 9/5/27 0.29 198,424
South KoreaSemiconductors & Semiconductor Equipment
200,000 SK Hynix, Inc., 1.5000%, due 19/1/26 0.28 195,849200,000 SK Hynix, Inc., 2.3750%, due 19/1/31 0.28 192,716
0.56 388,565
SupranationalFood Products
44,000 JBS USA LUX SA, 6.7500%, due 15/2/28 0.07 47,539
113,000 JBS USA LUX SA, 6.5000%, due 15/4/29 0.18 124,491
91,000 JBS USA LUX SA, 5.5000%, due 15/1/30 0.14 99,115
54,000 JBS USA LUX SA, 3.7500%, due 1/12/31 0.08 54,888
0.47 326,033
United KingdomBeverages
200,000 Diageo Capital plc, 2.0000%, due 29/4/30 0.29 198,109
Pharmaceuticals46,000 Royalty Pharma plc, 2.1500%, due
2/9/31 0.06 43,50346,000 Royalty Pharma plc, 3.5500%, due
2/9/50 0.07 45,71633,000 Royalty Pharma plc, 3.3500%, due
2/9/51 0.05 31,6430.18 120,862
United StatesAerospace & Defense
32,000 Boeing Co. (The), 4.8750%, due 1/5/25 0.05 35,037
Shares or Principal Amount
Percentage of Net Assets
(%)Fair Value
(USD)
35,000 Boeing Co. (The), 2.1960%, due 4/2/26 0.05 35,02037,000 Boeing Co. (The), 3.2500%, due 1/2/28 0.06 38,58536,000 Boeing Co. (The), 3.6250%, due 1/2/31 0.06 38,43445,000 Boeing Co. (The), 3.9500%, due 1/8/59 0.07 46,88633,000 General Dynamics Corp., 3.5000%,
due 1/4/27 0.05 35,95052,000 TransDigm, Inc., 4.6250%, due 15/1/29 0.08 51,921
0.42 281,833
Air Freight & Logistics65,000 GXO Logistics, Inc., 1.6500%, due
15/7/26 0.09 63,49243,000 GXO Logistics, Inc., 2.6500%, due
15/7/31 0.06 42,5310.15 106,023
Automobiles102,000 Ford Motor Co., 3.2500%, due 12/2/32 0.15 104,652
Banks33,000 Bank of America Corp., 5.2000%, due
1/6/23 0.05 34,09383,000 Bank of America Corp., 6.2500%, due
5/9/24 0.13 89,38148,000 Bank of America Corp., 3.7050%, due
24/4/28 0.08 52,12946,000 Bank of America Corp., 3.9700%, due
5/3/29 0.07 50,374111,000 Bank of America Corp., 2.0870%, due
14/6/29 0.16 110,304195,000 Bank of America Corp., 2.5920%, due
29/4/31 0.29 197,19544,000 Citigroup, Inc., 5.9500%, due 30/1/23 0.07 45,43042,000 Citigroup, Inc., 5.3500%, due 15/5/23 0.06 42,8939,000 Citigroup, Inc., 6.3000%, due 15/5/24 0.01 9,456
42,000 Citigroup, Inc., 5.9500%, due 15/5/25 0.07 45,045124,000 Citigroup, Inc., 3.8870%, due 10/1/28 0.20 134,50992,000 Citigroup, Inc., 4.4120%, due 31/3/31 0.15 105,17515,000 JPMorgan Chase & Co., 5.0000%, due
1/8/24 0.02 15,42236,000 JPMorgan Chase & Co., 4.6000%, due
1/2/25 0.05 36,99042,000 JPMorgan Chase & Co., 2.0830%, due
22/4/26 0.06 42,66191,000 JPMorgan Chase & Co., 3.9600%, due
29/1/27 0.14 98,37693,000 JPMorgan Chase & Co., 2.9560%, due
13/5/31 0.14 96,392160,000 SVB Financial Group, 4.2500%, due
15/11/26 0.24 162,54085,000 SVB Financial Group, 4.1000%, due
15/2/31 0.12 84,490107,000 US Bancorp, 2.4910%, due 3/11/36 0.16 106,706
2.27 1,559,561
Beverages65,000 Anheuser-Busch Cos. LLC, 4.9000%,
due 1/2/46 0.12 82,345
Building Products21,000 Standard Industries, Inc., 4.3750%, due
15/7/30 0.03 21,468
Capital Markets119,000 Bank of New York Mellon Corp. (The),
4.7000%, due 20/9/25 0.19 127,241204,000 Charles Schwab Corp. (The), 5.3750%,
due 1/6/25 0.32 222,870
DocuSign Envelope ID: 521655BF-9BE3-47DC-A9A3-494932954338

121Janus Henderson Capital Funds plc / 31 December 2021
The accompanying notes are an integral part of the financial statements.
Janus Henderson US Balanced 2026 Fund (continued)
Portfolio Investments
Shares or Principal Amount
Percentage of Net Assets
(%)Fair Value
(USD)
55,000 Charles Schwab Corp. (The), 4.0000%,
due 1/12/30 0.08 55,61928,000 Goldman Sachs Group, Inc. (The),
4.9500%, due 10/2/25 0.04 29,120134,000 Goldman Sachs Group, Inc. (The),
3.5000%, due 1/4/25 0.21 141,79689,000 Morgan Stanley, 2.1880%, due 28/4/26 0.13 90,81465,000 Morgan Stanley, 4.3500%, due 8/9/26 0.10 71,92989,000 Morgan Stanley, 3.9500%, due 23/4/27 0.14 98,05449,000 Morgan Stanley, 1.5930%, due 4/5/27 0.07 48,54372,000 Morgan Stanley, 1.7940%, due 13/2/32 0.10 68,233
133,000 Morgan Stanley, 2.2390%, due 21/7/32 0.19 130,226152,000 Morgan Stanley, 2.4840%, due 16/9/36 0.21 146,529
7,000 MSCI, Inc., 4.0000%, due 15/11/29 0.01 7,327103,000 MSCI, Inc., 3.6250%, due 1/9/30 0.15 105,47668,000 MSCI, Inc., 3.8750%, due 15/2/31 0.10 70,910
2.04 1,414,687
Chemicals201,000 Axalta Coating Systems LLC, 3.3750%,
due 15/2/29 0.28 194,7645,000 CF Industries, Inc., 5.1500%, due
15/3/34 0.01 6,05651,000 CF Industries, Inc., 4.9500%, due
1/6/43 0.09 61,63712,000 CF Industries, Inc., 5.3750%, due
15/3/44 0.02 15,15081,000 Element Solutions, Inc., 3.8750%, due
1/9/28 0.12 81,5210.52 359,128
Commercial Services & Supplies96,000 Aramark Services, Inc., 6.3750%, due
1/5/25 0.15 100,442
Diversified Telecommunication Services50,000 AT&T, Inc., 3.8000%, due 1/12/57 0.08 52,172
8,000 AT&T, Inc., 3.6500%, due 15/9/59 0.01 8,095105,000 CCO Holdings LLC, 4.2500%, due
1/2/31 0.15 106,137125,000 CCO Holdings LLC, 4.5000%, due
1/5/32 0.19 128,8021,000 Level 3 Financing, Inc., 3.4000%, due
1/3/27 0.00 1,03410,000 Lumen Technologies, Inc., 5.8000%,
due 15/3/22 0.01 10,0880.44 306,328
Electric Utilities73,000 Duquesne Light Holdings, Inc.,
2.7750%, due 7/1/32 0.11 72,24097,000 NextEra Energy Capital Holdings, Inc.,
1.8750%, due 15/1/27 0.14 97,63429,000 NextEra Energy Capital Holdings, Inc.,
2.4400%, due 15/1/32 0.04 29,09026,000 NRG Energy, Inc., 6.6250%, due
15/1/27 0.04 27,06176,000 NRG Energy, Inc., 3.3750%, due
15/2/29 0.11 74,58186,000 NRG Energy, Inc., 3.6250%, due
15/2/31 0.12 83,9970.56 384,603
Electronic Equipment, Instruments & Components63,000 Trimble, Inc., 4.7500%, due 1/12/24 0.10 68,34451,000 Trimble, Inc., 4.9000%, due 15/6/28 0.08 58,052
0.18 126,396
Shares or Principal Amount
Percentage of Net Assets
(%)Fair Value
(USD)
Equity Real Estate Investment Trusts (REITs)
50,000 Agree LP, 2.0000%, due 15/6/28 0.07 49,02115,000 Agree LP, 2.9000%, due 1/10/30 0.02 15,26337,000 Agree LP, 2.6000%, due 15/6/33 0.05 36,37840,000 Equinix, Inc., 2.1500%, due 15/7/30 0.06 38,93026,000 GLP Capital LP, 5.2500%, due 1/6/25 0.04 28,50814,000 GLP Capital LP, 5.3750%, due 15/4/26 0.02 15,6086,000 GLP Capital LP, 5.3000%, due 15/1/29 0.01 6,820
70,000 GLP Capital LP, 3.2500%, due 15/1/32 0.10 70,49179,000 Invitation Homes Operating Partnership
LP, 2.0000%, due 15/8/31 0.11 74,479124,000 Iron Mountain Information Management
Services, Inc., 5.0000%, due 15/7/32 0.19 127,15475,000 MPT Operating Partnership LP,
3.5000%, due 15/3/31 0.11 75,95996,000 Rexford Industrial Realty LP, 2.1500%,
due 1/9/31 0.13 90,74774,000 Sun Communities Operating LP,
2.7000%, due 15/7/31 0.11 73,4791.02 702,837
Food & Staples Retailing111,000 Performance Food Group, Inc.,
4.2500%, due 1/8/29 0.16 110,298
Food Products72,000 Kraft Heinz Foods Co., 3.8750%, due
15/5/27 0.11 77,85532,000 Kraft Heinz Foods Co., 5.0000%, due
4/6/42 0.06 39,89314,000 Kraft Heinz Foods Co., 4.3750%, due
1/6/46 0.02 16,43032,000 Kraft Heinz Foods Co., 4.8750%, due
1/10/49 0.06 40,27510,000 Mondelez International, Inc., 2.7500%,
due 13/4/30 0.02 10,31687,000 Pilgrim's Pride Corp., 3.5000%, due
1/3/32 0.13 88,0140.40 272,783
Health Care Providers & Services59,000 Centene Corp., 4.2500%, due 15/12/27 0.09 61,61072,000 Centene Corp., 2.4500%, due 15/7/28 0.10 71,03176,000 Centene Corp., 3.0000%, due 15/10/30 0.11 77,38626,000 Centene Corp., 2.5000%, due 1/3/31 0.04 25,35531,000 Centene Corp., 2.6250%, due 1/8/31 0.04 30,43230,000 CVS Health Corp., 5.0500%, due
25/3/48 0.06 39,29263,000 DaVita, Inc., 4.6250%, due 1/6/30 0.09 64,61097,000 DaVita, Inc., 3.7500%, due 15/2/31 0.14 94,68677,000 HCA, Inc., 4.7500%, due 1/5/23 0.12 80,67538,000 HCA, Inc., 5.3750%, due 1/2/25 0.06 41,81120,000 HCA, Inc., 5.8750%, due 15/2/26 0.03 22,58315,000 HCA, Inc., 5.3750%, due 1/9/26 0.02 16,87621,000 HCA, Inc., 5.6250%, due 1/9/28 0.04 24,57431,000 HCA, Inc., 5.8750%, due 1/2/29 0.05 36,988
127,000 HCA, Inc., 3.5000%, due 1/9/30 0.20 134,47717,000 HCA, Inc., 5.5000%, due 15/6/47 0.03 22,299
26,000 HCA, Inc., 5.2500%, due 15/6/49 0.05 33,45580,000 HCA, Inc., 3.5000%, due 15/7/51 0.12 81,749
193,000 Molina Healthcare, Inc., 4.3750%, due 15/6/28 0.29 199,119
1.68 1,159,008
Industrial Conglomerates71,000 General Electric Co., 3.5327%, due
15/3/22 0.10 70,645
DocuSign Envelope ID: 521655BF-9BE3-47DC-A9A3-494932954338

Janus Henderson Capital Funds plc / 31 December 2021122
The accompanying notes are an integral part of the financial statements.
Janus Henderson US Balanced 2026 Fund (continued)
Portfolio Investments
Shares or Principal Amount
Percentage of Net Assets
(%)Fair Value
(USD)
Insurance
135,000 Athene Global Funding, 1.7300%, due 2/10/26 0.19 132,580
127,000 Athene Global Funding, 2.6460%, due 4/10/31 0.18 125,589
112,000 Prudential Financial, Inc., 3.7000%, due 1/10/50 0.17 113,427
0.54 371,596
IT Services79,000 Broadridge Financial Solutions, Inc.,
2.6000%, due 1/5/31 0.12 79,38044,000 Global Payments, Inc., 4.8000%, due
1/4/26 0.07 48,89543,000 Global Payments, Inc., 2.1500%, due
15/1/27 0.06 43,19664,000 Global Payments, Inc., 2.9000%, due
15/11/31 0.09 64,98531,000 PayPal Holdings, Inc., 1.6500%, due
1/6/25 0.05 31,4030.39 267,859
Leisure Products87,000 Hasbro, Inc., 3.9000%, due 19/11/29 0.14 96,02031,000 Hasbro, Inc., 6.3500%, due 15/3/40 0.06 42,92713,000 Hasbro, Inc., 5.1000%, due 15/5/44 0.02 16,218
0.22 155,165
Machinery49,000 Westinghouse Air Brake Technologies
Corp., 4.9500%, due 15/9/28 0.08 55,747
Media66,000 Charter Communications Operating
LLC, 2.8000%, due 1/4/31 0.10 65,38819,000 Charter Communications Operating
LLC, 6.4840%, due 23/10/45 0.04 26,00341,000 Charter Communications Operating
LLC, 4.8000%, due 1/3/50 0.07 46,01822,000 Comcast Corp., 3.7500%, due 1/4/40 0.04 24,67683,000 CSC Holdings LLC, 4.1250%, due
1/12/30 0.12 81,16349,000 Fox Corp., 4.0300%, due 25/1/24 0.08 51,773
125,000 GCI LLC, 4.7500%, due 15/10/28 0.19 128,4620.64 423,483
Metals & Mining25,000 Reliance Steel & Aluminum Co.,
4.5000%, due 15/4/23 0.04 25,885
Multiline Retail44,000 Dollar General Corp., 4.1250%, due
3/4/50 0.07 50,924
Multi-Utilities47,000 Dominion Energy, Inc., 4.3500%, due
15/1/27 0.07 48,645
Oil, Gas & Consumable Fuels59,000 Cheniere Energy Partners LP, 4.0000%,
due 1/3/31 0.09 61,97365,000 Cheniere Energy Partners LP, 3.2500%,
due 31/1/32 0.10 65,78071,000 Continental Resources, Inc., 5.7500%,
due 15/1/31 0.12 83,7304,000 Energy Transfer LP, 4.9500%, due
15/6/28 0.01 4,50386,000 Hess Midstream Operations LP,
5.1250%, due 15/6/28 0.13 89,673
Shares or Principal Amount
Percentage of Net Assets
(%)Fair Value
(USD)
24,000 Hess Midstream Operations LP,
4.2500%, due 15/2/30 0.03 23,86155,000 Southwestern Energy Co., 4.7500%,
due 1/2/32 0.08 58,0270.56 387,547
Pharmaceuticals94,000 Elanco Animal Health, Inc., 5.2720%,
due 28/8/23 0.15 100,115
Semiconductors & Semiconductor Equipment38,000 Analog Devices, Inc., 2.9500%, due
1/4/25 0.06 39,93355,000 Broadcom, Inc., 4.3000%, due 15/11/32 0.09 61,88962,000 Broadcom, Inc., 3.4190%, due 15/4/33 0.09 65,064
125,000 Broadcom, Inc., 3.4690%, due 15/4/34 0.19 130,99957,000 Marvell Technology, Inc., 1.6500%, due
15/4/26 0.08 56,40351,000 Marvell Technology, Inc., 4.8750%, due
22/6/28 0.09 58,478111,000 Microchip Technology, Inc., 2.6700%,
due 1/9/23 0.17 113,40663,000 Micron Technology, Inc., 2.7030%, due
15/4/32 0.09 63,1800.86 589,352
Specialty Retail137,000 Lithia Motors, Inc., 3.8750%, due
1/6/29 0.20 140,086
Thrifts & Mortgage Finance76,000 Rocket Mortgage LLC, 2.8750%, due
15/10/26 0.11 75,53276,000 Rocket Mortgage LLC, 3.6250%, due
1/3/29 0.11 76,39471,000 Rocket Mortgage LLC, 3.8750%, due
1/3/31 0.11 72,17478,000 Rocket Mortgage LLC, 4.0000%, due
15/10/33 0.12 79,1220.45 303,222
Trading Companies & Distributors57,000 Air Lease Corp., 1.8750%, due 15/8/26 0.08 56,11538,000 Air Lease Corp., 3.0000%, due 1/2/30 0.06 37,970
0.14 94,085
Wireless Telecommunication Services54,000 T-Mobile USA, Inc., 3.5000%, due
15/4/25 0.08 57,25162,000 T-Mobile USA, Inc., 3.7500%, due
15/4/27 0.10 67,1710.18 124,422
Total Corporate Bonds 18.71 12,874,581
Government Obligations (2020: 9.65% USD 7,008,798)US Treasury Notes/Bonds
369,000 0.1250%, due 28/2/23 0.53 367,544700,000 0.1250%, due 31/3/23 1.01 696,855991,000 0.1250%, due 30/4/23 1.43 985,813
1,103,000 0.1250%, due 30/6/23 1.59 1,095,632340,000 0.1250%, due 31/8/23 0.49 337,038216,100 0.3750%, due 31/10/23 0.31 214,859175,000 0.2500%, due 15/5/24 0.25 172,635337,000 0.3750%, due 15/9/24 0.48 332,274595,200 0.3750%, due 31/1/26 0.84 575,972
1,094,000 0.5000%, due 28/2/26 1.55 1,063,103760,000 0.7500%, due 30/4/26 1.08 745,008487,000 0.8750%, due 30/6/26 0.70 479,334
DocuSign Envelope ID: 521655BF-9BE3-47DC-A9A3-494932954338

123Janus Henderson Capital Funds plc / 31 December 2021
The accompanying notes are an integral part of the financial statements.
Janus Henderson US Balanced 2026 Fund (continued)
Portfolio Investments
Shares or Principal Amount
Percentage of Net Assets
(%)Fair Value
(USD)
247,000 0.6250%, due 31/7/26 0.35 240,198197,400 0.7500%, due 31/8/26 0.28 192,997125,500 0.8750%, due 30/9/26 0.18 123,304522,000 1.2500%, due 30/11/26 0.76 521,75556,600 1.1250%, due 29/2/28 0.08 55,79141,200 1.2500%, due 30/4/28 0.06 40,83575,000 1.2500%, due 30/6/28 0.11 74,250
1,355,200 1.3750%, due 15/11/31 1.95 1,338,472101,000 1.3750%, due 15/11/40 0.13 92,076
1,148,000 1.7500%, due 15/8/41 1.62 1,113,38122,000 2.0000%, due 15/11/41 0.03 22,258
502,600 2.7500%, due 15/8/42 0.83 572,846756,100 1.3750%, due 15/8/50 0.96 662,621750,200 1.6250%, due 15/11/50 1.02 699,181397,500 1.8750%, due 15/2/51 0.57 393,43223,000 2.3750%, due 15/5/51 0.04 25,41114,000 2.0000%, due 15/8/51 0.02 14,276
2,500,000 0.0000%, due 4/1/22 3.63 2,500,002166,000 0.1250%, due 15/7/31 0.28 192,676
Total Government Obligations 23.16 15,941,829
Mortgage-Backed Securities (2020: 9.05% USD 6,571,697)Fannie Mae
551 3.0000%, due 1/10/34 0.00 579118,506 2.5000%, due 1/11/34 0.18 123,444
8,785 6.0000%, due 1/2/37 0.01 10,14817,557 4.5000%, due 1/11/42 0.03 19,3502,548 3.0000%, due 1/1/43 0.00 2,6852,819 3.0000%, due 1/2/43 0.00 2,980
48,091 5.0000%, due 1/7/44 0.08 53,70341,085 4.5000%, due 1/10/44 0.07 45,82760,315 4.5000%, due 1/3/45 0.10 67,27732,684 4.5000%, due 1/6/45 0.05 36,15410,373 3.5000%, due 1/12/45 0.02 11,08260,894 4.5000%, due 1/2/46 0.10 67,11169,460 3.5000%, due 1/7/46 0.11 74,977
8,856 3.5000%, due 1/3/47 0.01 9,4607,683 3.5000%, due 1/7/47 0.01 8,207
19,209 3.5000%, due 1/8/47 0.03 20,3624,025 3.0000%, due 1/2/48 0.01 4,261
206,495 3.5000%, due 1/7/48 0.32 220,14717,256 3.0000%, due 1/8/49 0.03 18,2275,351 3.0000%, due 1/8/49 0.01 5,652
611 3.0000%, due 1/9/49 0.00 64017,977 2.5000%, due 1/10/50 0.03 18,36081,283 2.5000%, due 1/1/51 0.12 83,0153,496 2.5000%, due 1/8/51 0.01 3,574
201,088 3.5000%, due 1/8/56 0.32 218,647109,925 3.0000%, due 1/2/57 0.17 116,65768,877 4.1028%, due 25/5/25 0.10 70,08818,627 5.1028%, due 25/7/25 0.03 19,08619,656 5.8028%, due 25/4/28 0.03 20,70333,508 3.6528%, due 25/7/29 0.05 34,269
108,000 2.0500%, due 25/11/41 0.16 108,189132,627 3.0000%, due 25/5/48 0.20 138,117
2.39 1,632,978
Freddie Mac6,103 3.5000%, due 1/1/47 0.01 6,583
34,000 2.2997%, due 25/8/33 0.05 34,2301,695 2.0527%, due 25/10/49 0.00 1,7008,565 3.2528%, due 25/9/50 0.01 8,584
51,000 2.0497%, due 25/12/50 0.07 51,33930,000 2.3497%, due 25/8/33 0.04 30,495
Shares or Principal Amount
Percentage of Net Assets
(%)Fair Value
(USD)
85,310 2.6497%, due 25/11/50 0.13 86,145
0.31 219,076
Freddie Mac Pool165,446 3.0000%, due 1/5/31 0.25 173,750
410 3.0000%, due 1/9/32 0.00 431433 3.0000%, due 1/10/32 0.00 454474 3.0000%, due 1/1/33 0.00 499
83,292 2.5000%, due 1/12/33 0.13 86,378643 3.0000%, due 1/10/34 0.00 677
108,234 2.5000%, due 1/11/34 0.16 112,74814,323 6.0000%, due 1/4/40 0.02 16,62528,607 3.5000%, due 1/2/43 0.05 30,876
7,724 3.0000%, due 1/3/43 0.01 8,13788 3.0000%, due 1/6/43 0.00 92
42,433 3.5000%, due 1/2/44 0.07 45,79829,564 4.5000%, due 1/5/44 0.05 32,705
400 3.5000%, due 1/12/44 0.00 4291,154 3.0000%, due 1/1/46 0.00 1,228
34,571 4.0000%, due 1/2/46 0.06 38,144120,155 3.0000%, due 1/10/46 0.18 126,188
420 3.5000%, due 1/4/47 0.00 45417,841 3.0000%, due 1/4/47 0.03 18,686
119,190 3.5000%, due 1/12/47 0.19 128,45423,217 4.5000%, due 1/7/48 0.04 24,871
1,622 5.0000%, due 1/9/48 0.00 1,77214,616 3.0000%, due 1/8/49 0.02 15,2965,736 3.0000%, due 1/8/49 0.01 6,0607,482 3.0000%, due 1/10/49 0.01 7,7605,539 3.0000%, due 1/10/49 0.01 5,7453,127 3.0000%, due 1/11/49 0.00 3,243503 3.0000%, due 1/11/49 0.00 521
1,231 3.0000%, due 1/12/49 0.00 1,2772,656 3.0000%, due 1/12/49 0.00 2,755
738 2.5000%, due 1/1/50 0.00 757437 3.0000%, due 1/3/50 0.00 452
32,485 2.5000%, due 1/8/51 0.05 33,1901.34 926,452
Ginnie Mae53,012 4.0000%, due 15/7/47 0.08 56,994
7,404 4.0000%, due 15/8/47 0.01 7,9601,838 4.0000%, due 20/8/47 0.00 1,972
4,060 4.0000%, due 20/8/47 0.01 4,3368,436 4.0000%, due 15/11/47 0.01 9,070
15,492 4.0000%, due 15/12/47 0.02 16,65622,058 4.5000%, due 20/2/48 0.03 23,710
7,027 4.5000%, due 20/5/48 0.01 7,507106,238 4.0000%, due 20/6/48 0.16 112,47733,834 2.0000%, due 15/1/52 0.05 34,148
270,865 2.5000%, due 15/1/52 0.40 277,6350.78 552,465
UMBS41,133 1.5000%, due 25/1/37 0.06 41,276
175,273 2.0000%, due 25/1/37 0.26 179,588780,511 2.0000%, due 25/1/52 1.13 778,365810,839 2.5000%, due 25/1/52 1.20 827,895
1,200,320 3.0000%, due 25/1/52 1.81 1,243,809105,000 3.5000%, due 25/2/52 0.16 110,455
4.62 3,181,388
Total Mortgage-Backed Securities 9.44 6,512,359
Preferred Stock (2020: 0.45% USD 333,713)
DocuSign Envelope ID: 521655BF-9BE3-47DC-A9A3-494932954338

Janus Henderson Capital Funds plc / 31 December 2021124
The accompanying notes are an integral part of the financial statements.
Janus Henderson US Balanced 2026 Fund (continued)
Portfolio Investments
Shares or Principal Amount
Percentage of Net Assets
(%)Fair Value
(USD)
Tranche Loans (2020: 0.00% USD –)NetherlandsChemicals
73,630 Alpha 3 BV, 3.0000%, due 18/3/28 0.11 73,581112,000 Diamond (BC) BV, 3.5000%, due
29/9/28 0.16 111,7980.27 185,379
United StatesBuilding Products
52,472 Standard Industries, Inc., 3.0000%, due 22/9/28 0.08 52,581
Diversified Financial Services122,000 Trans Union LLC, 2.7500%, due
1/12/28 0.18 121,848
Health Care Equipment & Supplies84,394 Mozart Borrower LP, 3.7500%, due
23/10/28 0.12 84,471
Health Care Providers & Services130,069 Indigo Merger Sub, Inc., 2.7500%, due
3/7/28 0.19 130,27632,407 Indigo Merger Sub, Inc., 2.7500%, due
3/7/28 0.05 32,4580.24 162,734
Machinery157,325 Madison IAQ LLC, 3.7500%, due
21/6/28 0.23 157,390
Semiconductors & Semiconductor Equipment88,000 MKS Instruments, Inc., due 20/10/28 0.13 87,923
Total Tranche Loans 1.25 852,326
Total Investments (Cost: USD 59,373,430) 102.40 70,436,485
Forward Currency Contracts (2020: 2.71% USD 1,965,763)Open as at 31 December 2021.
Current Market
Percentage of Net Unrealised
Currency Currency Value Settle Assets GainPurchased Sold (USD) Date (%) (USD)
.J.P. Morgan EUR◊ 62,656,194 USD 70,314,027 71,373,863 31-Jan-22 1.54 1,059,836
Total 1.54 1,059,836
.
Total Financial Assets at fair value through profit or loss 103.94 71,496,321
Financial Liabilities at fair value through profit or loss.Forward Currency Contracts (2020: 0.00% USD (489))Open as at 31 December 2021
Current Market
Percentage of Net Unrealised
Currency Currency Value Settle Assets LossPurchased Sold (USD) Date (%) (USD)
J.P. Morgan USD◊ 2,118,049 EUR 1,874,277 2,135,055 31-Jan-22 (0.02) (17,006)
Total (0.02) (17,006).
Total Financial Liabilities at fair value through profit or loss (0.02) (17,006)
Portfolio Analysis (Unaudited)
Analysis of Total Assets:% of Total
AssetsTransferable securities admitted to official stock exchange listing 65.01Transferable securities dealt in on another regulated market 29.93OTC financial derivative instruments 1.43Other Assets 3.63Total Assets 100.00
◊ These forward currency contracts are used for share class hedging.
DocuSign Envelope ID: 521655BF-9BE3-47DC-A9A3-494932954338

125Janus Henderson Capital Funds plc / 31 December 2021
The accompanying notes are an integral part of the financial statements.
Janus Henderson US Balanced 2026 Fund (continued)
Fair Value Hierarchy
The tables below provide the fair value hierarchy summary of the Fund’s financial assets and liabilities measured at fair value at 31 December 2021 and 31 December 2020.
31 December 2021
Level 1 - Quoted Prices
(USD)
Level 2 - Other Significant
Observable Inputs (USD)
Level 3 - Significant
Unobservable Inputs (USD)
Total (USD)
Asset-Backed/Commercial Mortgage-Backed Securities – 3,525,416 – 3,525,416Common Stock 30,729,974 – – 30,729,974Corporate Bonds – 12,874,581 – 12,874,581Forward Currency Contracts – 1,042,830 – 1,042,830Government Obligations – 15,941,829 – 15,941,829Mortgage-Backed Securities – 6,512,359 – 6,512,359Tranche Loans – 852,326 – 852,326Total Investments in Securities 30,729,974 40,749,341 – 71,479,315
31 December 2020
Level 1 - Quoted Prices
(USD)
Level 2 - Other Significant
Observable Inputs (USD)
Level 3 - Significant
Unobservable Inputs (USD)
Total (USD)
Asset-Backed/Commercial Mortgage-Backed Securities – 2,706,859 – 2,706,859Common Stock 31,131,239 – – 31,131,239Corporate Bonds – 23,128,027 – 23,128,027Forward Currency Contracts – 1,965,274 – 1,965,274Government Obligations – 7,008,798 – 7,008,798Mortgage-Backed Securities – 6,571,697 – 6,571,697Preferred Stock 333,713 – – 333,713Total Investments in Securities 31,464,952 41,380,655 – 72,845,607
There were transfers on Government Obligations from level 1 to level 2 during the financial year ended 31 December 2020.
There were no investments held by the Fund at 31 December 2021 and 31 December 2020 that were fair valued at level 3 by the Janus Henderson Global Pricing Committee.
Valuation policy of private placements is referenced in note 2 of the financial statements.
DocuSign Envelope ID: 521655BF-9BE3-47DC-A9A3-494932954338

Janus Henderson Capital Funds plc / 31 December 2021126
Janus Henderson US Balanced 2026 Fund (continued)
The accompanying notes are an integral part of the financial statements.
Capital Share Transactions
For the financial year ended 31 December 2021
Y2 HEUR Y4 HEURShares Shares
At beginning of the year . . . . . . . 1,544,741 3,872,666Shares issued – –Shares redeemed. . . . . . . . . . . (118,187) (165,766)At end of year . . . . . . . . . . . . . 1,426,554 3,706,900
For the financial year ended 31 December 2020
Y2 HEUR Y4 HEURShares Shares
At beginning of the year . . . . . . . 1,601,311 4,018,843Shares issued – –Shares redeemed. . . . . . . . . . . (56,570) (146,177)At end of year . . . . . . . . . . . . . 1,544,741 3,872,666
Net Asset Comparison
31 December 2021 31 December 2020 31 December 2019
Net Assets (USD)
NAV Per Share
(Local Currency)Net Assets
(USD)
NAV Per Share
(Local Currency)Net Assets
(USD)
NAV Per Share
(Local Currency)
Y2 HEUR 19,817,595 11 .71 21,070,582 11 .17 18,165,954 10 .11
Y4 HEUR 48,966,870 11 .14 51,530,159 10 .89 45,591,586 10 .11. . .
The following table details the difference between the published NAV and the NAV which has been disclosed in the financial statements as at 31 December 2021 and 31 December 2020:J
Year ended 31 December
2021
Year ended 31 December
2020
(USD) (USD)
Published NAV 69,544,545 73,618,026Placement fee (760,080) (1,017,285)Closing NAV 68,784,465 72,600,741
. .For the purposes of calculating the Janus Henderson US Balanced 2026 published NAV, in accordance with its prospectus and leading industry practice, the placement fee with respect to Y shares has been capitalised and is amortised through the Statement of Comprehensive Income over a 7 year period from the date of commencement of the Fund’s operations. However, as the financial statements are prepared under Irish GAAP and FRS102, the placement fee has been expensed in the Statement of Comprehensive Income for the period 18 November 2019 to 31 December 2019.
Class Y shares are also subject to a redemption fee (exit fee) if an Investor redeems shares during the term of the Janus Henderson US Balanced 2026 fund, on a sliding scale depending on the date of redemption.
The difference between the published NAV per share and that shown in the financial statements is wholly attributable to the differences arising from expensing the placement fee. This has no impact on the published NAV per share, its related redemption pricing or the calculation of fees due to the Janus Henderson US Balanced 2026 Fund.
DocuSign Envelope ID: 521655BF-9BE3-47DC-A9A3-494932954338

127Janus Henderson Capital Funds plc / 31 December 2021
Janus Henderson US Balanced 2026 Fund (continued)
The accompanying notes are an integral part of the financial statements.
Total Expense Ratio (unaudited)
The Average Total Expense Ratio table shows the actual expenses, excluding transactions costs and trade commissions, incurred by each Class for the Fund during the reporting financial year expressed as a percentage of the average net assets for the corresponding year, on an annualised basis.
31 December 2021 31 December 2020 31 December 2019Y2 HEUR 1.73% 1.53% 1.80%Y4 HEUR 1.73% 1.53% 1.80%
Distributions per share (unaudited)
The following table shows the distribution rate per share at Ex-date for each distributing share class :
Share Class (Local Currency) 15/01/2021 15/02/2021 15/03/2021 15/04/2021 15/05/2021 15/06/2021 15/07/2021 15/08/2021 15/09/2021 15/10/2021 18/11/2021 15/12/2021Y4 HEUR – – – – – – – – – – 0.30311 –
– – – – – – – – – – – –
DocuSign Envelope ID: 521655BF-9BE3-47DC-A9A3-494932954338

Janus Henderson Capital Funds plc / 31 December 2021128
Janus Henderson US Balanced 2026 Fund (continued)
The accompanying notes are an integral part of the financial statements.
Fund Performance (unaudited)
As at 31 December 2021
One year Three years Five yearsSince
inception
Performance (Annualised) 31/12/2020 31/12/2021
%
31/12/2017 31/12/2021
%
31/12/2015 31/12/2021
%
to 31/12/2021
%
Y2 HEUR (Net) 9.01 –* –* 10.43
Discrete performance
31/12/2020 31/12/2021
%
31/12/2019 31/12/2020
%
18/09/2019 31/12/2019
%
Y2 HEUR (Net) 9.01 11.97 1.10Euro Main Refinancing Rate – 12.53 1.64
Y2 HEUR (Gross) 10.96 13.99 1.31. . .
* The Fund had launched on 19 November 2019, hence no performance numbers disclosed.
Class Y2 HEUR is disclosed as it is the representative share class.
Only share class returns are displayed as we do not currently subscribe to this index.
Please note the performance target is to be achieved over a specific annualised time period. Performance target and index shown in USD.
Past performance does not guarantee future returns. The rates of return will vary and the principal value of an investment will fluctuate. Shares, if redeemed, may be worth more or less than their original cost. The performance data does not take account of the commissions and costs incurred on the issue and redemption of Shares. All returns are calculated in the base currency of the representative Share Class.
There is no guarantee that the Fund’s performance will match or exceed the benchmark.
DocuSign Envelope ID: 521655BF-9BE3-47DC-A9A3-494932954338

129Janus Henderson Capital Funds plc / 31 December 2021
Janus Henderson US Balanced 2026 Fund (continued)
Statements of Changes in Composition of Portfolio (unaudited)The tables below show a breakdown of material purchases and sales of the Investment Portfolio in accordance with Central Bank UCITS Regulations 79(2) requirements. All purchases and sales of investments exceeding 1% of the total value of each transaction respectively, are disclosed, with a minimum number of 20 of each such transaction. A full analysis of the movement on the Investment Portfolio is available upon request from the registered office.
Major Purchases for the year ended 31 December 2021
Shares or Principal Amount
Cost (USD)
Credit Agricole Corporate And Investment Bank, 0.0000%, due 30/6/21 5,000,000 4,999,989Credit Industriel et Commercial, 0.0000%, due 28/6/21 4,300,000 4,299,971Credit Industriel et Commercial, 0.0000%, due 29/6/21 4,100,000 4,099,991Credit Industriel et Commercial, 0.0000%, due 22/6/21 4,000,000 3,999,991Credit Industriel et Commercial, 0.0000%, due 24/6/21 4,000,000 3,999,991Credit Industriel et Commercial, 0.0000%, due 25/6/21 4,000,000 3,999,991Credit Agricole Corporate And Investment Bank, 0.0000%, due 21/6/21 4,000,000 3,999,980Credit Industriel et Commercial, 0.0000%, due 23/6/21 3,900,000 3,899,991Credit Agricole Corporate And Investment Bank, 0.0000%, due 29/10/21 3,800,000 3,799,995Credit Agricole Corporate And Investment Bank, 0.0000%, due 3/5/21 3,800,000 3,799,994Credit Agricole Corporate And Investment Bank, 0.0000%, due 2/6/21 3,700,000 3,699,998Credit Agricole Corporate And Investment Bank, 0.0000%, due 27/10/21 3,700,000 3,699,995Credit Agricole Corporate And Investment Bank, 0.0000%, due 28/10/21 3,600,000 3,599,995Credit Agricole Corporate And Investment Bank, 0.0000%, due 15/7/21 3,600,000 3,599,994Credit Industriel et Commercial, 0.0000%, due 29/7/21 3,600,000 3,599,993Credit Industriel et Commercial, 0.0000%, due 20/7/21 3,600,000 3,599,992Credit Industriel et Commercial, 0.0000%, due 11/6/21 3,500,000 3,499,996Credit Agricole Corporate And Investment Bank, 0.0000%, due 21/7/21 3,500,000 3,499,995Credit Agricole Corporate And Investment Bank, 0.0000%, due 26/10/21 3,500,000 3,499,995Credit Agricole Corporate And Investment Bank, 0.0000%, due 30/7/21 3,500,000 3,499,995
Major Sales for the year ended 31 December 2021
Shares or Principal Amount
Proceeds (USD)
UMBS, 2.0000%, due 25/3/52 2,763,427 2,780,227UMBS, 2.5000%, due 15/12/51 2,640,811 2,702,307US Treasury, 1.1250%, due 15/2/31 2,746,100 2,630,377US Treasury, 1.1250%, due 28/2/22 2,424,500 2,445,197US Treasury, 1.2500%, due 15/8/31 2,422,000 2,350,267UMBS, 2.5000%, due 25/1/52 2,217,135 2,286,379US Treasury, 1.6250%, due 15/5/31 2,185,000 2,230,083UMBS, 2.5000%, due 25/7/51 2,062,832 2,138,730UMBS, 2.5000%, due 25/9/51 2,048,368 2,125,706US Treasury, 0.6250%, due 15/4/23 1,812,000 2,072,938US Treasury, 0.8750%, due 15/11/30 2,136,300 2,046,082UMBS, 2.0000%, due 25/5/52 1,986,553 2,000,342US Treasury, 0.1300%, due 28/2/23 1,892,000 1,891,312UMBS, 2.5000%, due 25/11/51 1,747,950 1,795,166UMBS, 2.5000%, due 25/8/51 1,655,135 1,721,190UMBS, 2.5000%, due 25/6/52 1,644,886 1,701,686UMBS, 2.5000%, due 25/10/51 1,540,234 1,584,877US Treasury, 0.1250%, due 15/10/25 1,183,000 1,302,846US Treasury, 1.2500%, due 15/5/50 1,480,700 1,283,995US Treasury, 0.5000%, due 28/2/26 1,265,000 1,251,098UMBS, 2.5000%, due 25/5/52 1,178,691 1,219,061UMBS, 2.0000%, due 25/2/52 1,177,212 1,211,165UMBS, 2.5000%, due 25/2/52 1,149,030 1,206,992US Treasury, 1.3800%, due 15/11/31 1,157,000 1,145,239US Treasury, 0.3800%, due 31/1/26 1,137,500 1,120,571US Treasury, 0.3750%, due 30/11/25 1,115,000 1,110,505
DocuSign Envelope ID: 521655BF-9BE3-47DC-A9A3-494932954338

Janus Henderson US Forty Fund
Janus Henderson Capital Funds plc / 31 December 2021130
Fund Overview (unaudited)Investment Objective and Policy
The Fund aims to provide capital growth over the long term.
Performance target: To outperform the Russell 1000 Growth Index by at least 2.5% per annum, before the deduction of charges, over any 5 year period.
The Fund invests at least 80% of its assets in a concentrated portfolio of shares (also known as equities) of companies, in any industry, in the United States. The Fund is focused towards larger US companies.
The Fund is actively managed with reference to the Russell 1000 Growth Index, which is broadly representative of the companies in which it may invest, as this forms the basis of the Fund’s performance target. The investment manager has a high degree of freedom to exercise conviction, which may result in a high degree of bias within the portfolio. The Fund may hold companies which are not within the index.
How Sustainability Risks are part of the investment processThe investments underlying this financial product (referred to as the Fund) do not take into account the EU criteria for environmentally sustainable economic activities, although the Manager and the Investment Manager have agreed a decision making process that will apply to investment decisions relating to the Fund as further detailed in the Prospectus.
The likely impacts of sustainability risks on the returns of the FundWhile the analysis of (Environmental, Social and Governance) ESG factors is an integral component across the Investment Manager’s investment capabilities and one of a number of inputs to the selection of investments and portfolio construction, the investment process of the Investment Manager is primarily designed to maximise long-term risk-adjusted returns for investors. Therefore, in managing the Fund, the Investment Manager does not maximise portfolio alignment with sustainability risks as a separate goal in its own right nor does it precisely attribute the impact of ESG factors on returns for the Fund.
Fund Overview
Doug Rao and Nick Schommer, portfolio managers
For the year ended 31 December 2021, the Janus Henderson US Forty Fund Class H2 US dollar terms returned 22.98% (Net) and 23.89% (Gross), compared with 27.60% and 30.78% Target (Gross) for its benchmark, the Russell 1000® Growth Index. Stock selection in the communication services and industrials sectors detracted from benchmark-relative performance, while stock selection in the financials and health care sectors contributed to performance.
Cloud-based customer engagement platform Twilio was among the top relative detractors. Last year, the company saw demand for its core products grow swiftly as digital transformation efforts accelerated with the COVID-19 pandemic. However, more recently, the stock has suffered from difficult year-over-year comparisons and lower growth expectations. We expected the company to benefit from the continued to development of its end-to-end customer-centric ecosystem.
Disney was also among the top detractors. The company’s stock suffered during the year as it reported lower-than-expected growth in new subscribers to its Disney+ online streaming service. The surge in COVID-19 cases, as a result of the Delta and Omicron variants, also hurt Disney’s parks business. We liked the potential for park visits and travel to rebound strongly once the health risks of COVID-19 subside and expected the company to benefit from significant new content releases in 2022 and 2023.
Private equity firm The Blackstone Group was among the top relative contributors. During the year, management raised its full-year guidance due to strong performance for its private equity strategies as well as continued inflows into its products. The company remained favorably positioned to capture capital migrating to private equities - a long-term secular trend.
Nvidia, a leading producer of graphics processing units (GPUs), was also among the top contributors, as the stock outperformed following strong results. As large cloud platform providers have expanded investment in computing-intensive applications such as artificial intelligence and machine learning, demand for Nvidia’s GPUs has continued to grow.
Thank you for investing in the Janus Henderson US Forty Fund.
January 2022
DocuSign Envelope ID: 521655BF-9BE3-47DC-A9A3-494932954338

131Janus Henderson Capital Funds plc / 31 December 2021
The accompanying notes are an integral part of the financial statements.
Janus Henderson US Forty Fund (continued)
s
Statement of Financial PositionAs of
31 December 2021
(USD)
As of 31 December
2020 (USD)
Assets:Financial assets at fair value through profit or loss . . . . . . . . . . . . . . . . . . . . . . . . . . . . . . . . . . . . . . . . . . . . . . . . . . . . . . . 1,198,129,468 718,757,926Cash and foreign currency . . . . . . . . . . . . . . . . . . . . . . . . . . . . . . . . . . . . . . . . . . . . . . . . . . . . . . . . . . . . . . . . . . . . . . . 9,449,159 25,095,261Receivables:
Investments sold . . . . . . . . . . . . . . . . . . . . . . . . . . . . . . . . . . . . . . . . . . . . . . . . . . . . . . . . . . . . . . . . . . . . . . . . . . . . – 5,082,063Funds shares sold . . . . . . . . . . . . . . . . . . . . . . . . . . . . . . . . . . . . . . . . . . . . . . . . . . . . . . . . . . . . . . . . . . . . . . . . . . . 2,754,244 7,603,787Dividends . . . . . . . . . . . . . . . . . . . . . . . . . . . . . . . . . . . . . . . . . . . . . . . . . . . . . . . . . . . . . . . . . . . . . . . . . . . . . . . . . 250,557 108,980
Total Assets . . . . . . . . . . . . . . . . . . . . . . . . . . . . . . . . . . . . . . . . . . . . . . . . . . . . . . . . . . . . . . . . . . . . . . . . . 1,210,583,428 756,648,017
Liabilities (amounts falling due within one year)Payables:
Financial liabilities at fair value through profit or loss . . . . . . . . . . . . . . . . . . . . . . . . . . . . . . . . . . . . . . . . . . . . . . . . . . . . 82,099 14,689Bank overdraft and foreign currency . . . . . . . . . . . . . . . . . . . . . . . . . . . . . . . . . . . . . . . . . . . . . . . . . . . . . . . . . . . . . . . – 22Investments purchased . . . . . . . . . . . . . . . . . . . . . . . . . . . . . . . . . . . . . . . . . . . . . . . . . . . . . . . . . . . . . . . . . . . . . . . . – 15,250,602Spot foreign exchange contracts awaiting payment . . . . . . . . . . . . . . . . . . . . . . . . . . . . . . . . . . . . . . . . . . . . . . . . . . . . . 147 131Fund shares repurchased . . . . . . . . . . . . . . . . . . . . . . . . . . . . . . . . . . . . . . . . . . . . . . . . . . . . . . . . . . . . . . . . . . . . . . 1,680,334 552,029Investment Management fees . . . . . . . . . . . . . . . . . . . . . . . . . . . . . . . . . . . . . . . . . . . . . . . . . . . . . . . . . . . . . . . . . . . 1,004,227 613,386Shareholder Service fees . . . . . . . . . . . . . . . . . . . . . . . . . . . . . . . . . . . . . . . . . . . . . . . . . . . . . . . . . . . . . . . . . . . . . . 170,648 133,473Distribution fees . . . . . . . . . . . . . . . . . . . . . . . . . . . . . . . . . . . . . . . . . . . . . . . . . . . . . . . . . . . . . . . . . . . . . . . . . . . . . 8,555 7,541Accounting, Administration and Transfer Agent fees . . . . . . . . . . . . . . . . . . . . . . . . . . . . . . . . . . . . . . . . . . . . . . . . . . . . 135,136 58,497Management fees . . . . . . . . . . . . . . . . . . . . . . . . . . . . . . . . . . . . . . . . . . . . . . . . . . . . . . . . . . . . . . . . . . . . . . . . . . . 23,260 13,756Accrued expenses . . . . . . . . . . . . . . . . . . . . . . . . . . . . . . . . . . . . . . . . . . . . . . . . . . . . . . . . . . . . . . . . . . . . . . . . . . . 160,172 128,448
Total Liabilities (excluding Net Assets attributable to holders of redeemable ordinary shares) . . . . . . . . . . . . 3,264,578 16,772,574 Net Assets attributable to holders of redeemable ordinary participating shares . . . . . . . . . . . . . . . . . . . . . . 1,207,318,850 739,875,443
.
DocuSign Envelope ID: 521655BF-9BE3-47DC-A9A3-494932954338

Janus Henderson Capital Funds plc / 31 December 2021132
Janus Henderson US Forty Fund (continued)
The accompanying notes are an integral part of the financial statements.
Statement of Comprehensive IncomeYear ended
31 December 2021
(USD)
Year ended 31 December
2020 (USD)
Year ended Year endedRevenue:Interest income . . . . . . . . . . . . . . . . . . . . . . . . . . . . . . . . . . . . . . . . . . . . . . . . . . . . . . . . . . . . . . . . . . . . . . . . . . . . . . . 39,501 7,162Dividend income . . . . . . . . . . . . . . . . . . . . . . . . . . . . . . . . . . . . . . . . . . . . . . . . . . . . . . . . . . . . . . . . . . . . . . . . . . . . . . 5,109,291 3,522,452Other income . . . . . . . . . . . . . . . . . . . . . . . . . . . . . . . . . . . . . . . . . . . . . . . . . . . . . . . . . . . . . . . . . . . . . . . . . . . . . . . . 273,476 58,862
Net gain on financial assets and liabilities at fair value through profit or loss . . . . . . . . . . . . . . . . . . . . . . . . . . . . . . . . . . . . . . 186,394,042 194,974,180 Total Investments Income . . . . . . . . . . . . . . . . . . . . . . . . . . . . . . . . . . . . . . . . . . . . . . . . . . . . . . . . . . . . . . . 191,816,310 198,562,656
Expenses:Investment Management fees . . . . . . . . . . . . . . . . . . . . . . . . . . . . . . . . . . . . . . . . . . . . . . . . . . . . . . . . . . . . . . . . . . . . . 9,727,335 5,344,024Shareholder Service fees . . . . . . . . . . . . . . . . . . . . . . . . . . . . . . . . . . . . . . . . . . . . . . . . . . . . . . . . . . . . . . . . . . . . . . . . 1,815,834 1,387,988Distribution fees . . . . . . . . . . . . . . . . . . . . . . . . . . . . . . . . . . . . . . . . . . . . . . . . . . . . . . . . . . . . . . . . . . . . . . . . . . . . . . 98,835 34,760Management fees . . . . . . . . . . . . . . . . . . . . . . . . . . . . . . . . . . . . . . . . . . . . . . . . . . . . . . . . . . . . . . . . . . . . . . . . . . . . . 230,741 72,297Accounting, Administration and Transfer Agent fees . . . . . . . . . . . . . . . . . . . . . . . . . . . . . . . . . . . . . . . . . . . . . . . . . . . . . . 416,211 313,175Custodian fees . . . . . . . . . . . . . . . . . . . . . . . . . . . . . . . . . . . . . . . . . . . . . . . . . . . . . . . . . . . . . . . . . . . . . . . . . . . . . . . 112,561 76,322Audit fees . . . . . . . . . . . . . . . . . . . . . . . . . . . . . . . . . . . . . . . . . . . . . . . . . . . . . . . . . . . . . . . . . . . . . . . . . . . . . . . . . . 18,765 24,198Printing expenses . . . . . . . . . . . . . . . . . . . . . . . . . . . . . . . . . . . . . . . . . . . . . . . . . . . . . . . . . . . . . . . . . . . . . . . . . . . . . 15,895 (2,221)Legal and other professional fees . . . . . . . . . . . . . . . . . . . . . . . . . . . . . . . . . . . . . . . . . . . . . . . . . . . . . . . . . . . . . . . . . . 165,080 123,702Other fees . . . . . . . . . . . . . . . . . . . . . . . . . . . . . . . . . . . . . . . . . . . . . . . . . . . . . . . . . . . . . . . . . . . . . . . . . . . . . . . . . . 59,219 84,893
Total Expenses . . . . . . . . . . . . . . . . . . . . . . . . . . . . . . . . . . . . . . . . . . . . . . . . . . . . . . . . . . . . . . . . . . . . . . . 12,660,476 7,459,138Less Expense Reimbursement . . . . . . . . . . . . . . . . . . . . . . . . . . . . . . . . . . . . . . . . . . . . . . . . . . . . . . . . . . . – –Net Expenses after Expense Reimbursement . . . . . . . . . . . . . . . . . . . . . . . . . . . . . . . . . . . . . . . . . . . . . . . . 12,660,476 7,459,138Net Operating Profit . . . . . . . . . . . . . . . . . . . . . . . . . . . . . . . . . . . . . . . . . . . . . . . . . . . . . . . . . . . . . . . . . . . 179,155,834 191,103,518
Finance Costs: 5 1
Total distributions to holders of redeemable ordinary shares. . . . . . . . . . . . . . . . . . . . . . . . . . . . . . . . . . . . . . . . . . . . . . . . . – (1) Withholding tax on dividends and other investment income . . . . . . . . . . . . . . . . . . . . . . . . . . . . . . . . . . . . . (1,279,382) (945,707)
Net Increase in Net Assets attributable to holders of redeemable ordinary shares resulting from operations . 177,876,452 190,157,810
. .
. .. . .
Statement of Changes in Net Assets Attributable to Redeemable Ordinary ShareholdersYear ended
31 December 2021
(USD)
Year ended 31 December
2020 (USD)
Increase in Net Assets attributable to holders of redeemable ordinary shares resulting from operations . . . . . . . . . . . . . . . . . . . . 177,876,452 190,157,810
Capital Share Transactions of redeemable ordinary shares:Proceeds from redeemable ordinary shares sold . . . . . . . . . . . . . . . . . . . . . . . . . . . . . . . . . . . . . . . . . . . . . . . . . . . . . . . 438,521,709 332,215,921Redemption of redeemable ordinary shares . . . . . . . . . . . . . . . . . . . . . . . . . . . . . . . . . . . . . . . . . . . . . . . . . . . . . . . . . . (148,959,398) (162,710,467)Dilution Adjustment. . . . . . . . . . . . . . . . . . . . . . . . . . . . . . . . . . . . . . . . . . . . . . . . . . . . . . . . . . . . . . . . . . . . . . . . . . . 4,644 –
Net Increase from Capital Share Transactions of redeemable ordinary shares . . . . . . . . . . . . . . . . . . . . . . . . 289,566,955 169,505,454
Net Increase in Net Assets attributable to holders of redeemable ordinary shares . . . . . . . . . . . . . . . . . . . . . . . . . . . . . . . . . . . 467,443,407 359,663,264Net Assets attributable to holders of redeemable ordinary shares at the beginning of the financial year . . . . . . . . . . . . . . . . . . . . 739,875,443 380,212,179
Net Assets attributable to holders of redeemable ordinary shares at the end of the financial year . . . . . . . . . 1,207,318,850 739,875,443
Gains and losses are solely from continuing operations except for the Funds which ceased operations during the financial year ended 31 December 2021 or 31 December 2020. There were no gains and losses other than those dealt with in the Statement of Comprehensive Income. Please refer to note 1 which details the Fund closures during the year.
DocuSign Envelope ID: 521655BF-9BE3-47DC-A9A3-494932954338

133Janus Henderson Capital Funds plc / 31 December 2021
Janus Henderson US Forty Fund (continued)
Portfolio Investments
The accompanying notes are an integral part of the financial statements.
Shares or Principal Amount
Percentage of Net Assets
(%)Fair Value
(USD)
Financial Assets at fair value through profit or lossCommon Stock (2020: 96.94% USD 717,222,448)CanadaIT Services
6,864 Shopify, Inc., A 0.78 9,454,405
Cayman IslandsInternet & Direct Marketing Retail
220,834 Farfetch Ltd., A 0.61 7,382,48134,124 Grab Holdings Ltd., Warrant, due
1/12/26 0.01 72,002373,853 Grab Holdings Ltd., A 0.22 2,665,572421,249 Grab Holdings Ltd., Private Placement,
A 0.25 3,003,5051.09 13,123,560
FranceTextiles, Apparel & Luxury Goods
24,026 LVMH Moet Hennessy Louis Vuitton SE 1.65 19,886,068
NetherlandsSemiconductors & Semiconductor Equipment
43,476 ASML Holding NV 2.87 34,612,983
TaiwanSemiconductors & Semiconductor Equipment
127,980 Taiwan Semiconductor Manufacturing Co. Ltd. 1.27 15,397,274
United StatesAutomobiles
127,246 Rivian Automotive, Inc., A 1.09 13,194,138
Capital Markets323,253 Blackstone, Inc., A 3.46 41,825,706
Chemicals86,798 Sherwin-Williams Co. (The) 2.53 30,566,784
Entertainment46,111 Netflix, Inc. 2.30 27,779,111
168,625 Walt Disney Co. (The) 2.16 26,118,3264.46 53,897,437
Equity Real Estate Investment Trusts (REITs)108,683 American Tower Corp. 2.63 31,789,777
Health Care Equipment & Supplies56,542 Align Technology, Inc. 3.08 37,158,272
471,959 Boston Scientific Corp. 1.66 20,048,81822,604 Cooper Cos., Inc. (The) 0.78 9,469,72043,895 Dexcom, Inc. 1.95 23,569,420
119,898 Edwards Lifesciences Corp. 1.29 15,532,7868.76 105,779,016
Health Care Providers & Services37,831 UnitedHealth Group, Inc. 1.57 18,996,458
Hotels, Restaurants & Leisure8,251 Booking Holdings, Inc. 1.64 19,796,047
144,944 Caesars Entertainment, Inc. 1.12 13,556,6122.76 33,352,659
Household Products147,292 Procter & Gamble Co. (The) 2.00 24,094,025
Interactive Media & Services16,277 Alphabet, Inc., C 3.90 47,098,964
131,055 Match Group, Inc. 1.44 17,332,024107,667 Meta Platforms, Inc., A 3.00 36,213,795
Shares or Principal Amount
Percentage of Net Assets
(%)Fair Value
(USD)
673,891 Snap, Inc., A 2.62 31,693,094
10.96 132,337,877
Internet & Direct Marketing Retail27,235 Amazon.com, Inc. 7.52 90,810,750
IT Services133,920 Mastercard, Inc., A 3.99 48,120,13489,783 Twilio, Inc., A 1.96 23,643,455
5.95 71,763,589
Life Sciences Tools & Services132,980 Danaher Corp. 3.62 43,751,750
Machinery84,060 Deere & Co. 2.39 28,823,333
Metals & Mining288,370 Freeport-McMoRan, Inc. 1.00 12,033,680
Professional Services215,230 CoStar Group, Inc. 1.41 17,009,627
Semiconductors & Semiconductor Equipment101,025 NVIDIA Corp. 2.46 29,712,463108,517 Texas Instruments, Inc. 1.69 20,452,199
4.15 50,164,662
Software57,314 Adobe, Inc. 2.69 32,500,477
316,304 Microsoft Corp. 8.81 106,379,36163,944 Unity Software, Inc. 0.76 9,143,35385,216 Workday, Inc., A 1.93 23,279,307
14.19 171,302,498
Specialty Retail237,846 TJX Cos., Inc. (The) 1.50 18,057,268
Technology Hardware, Storage & Peripherals440,497 Apple, Inc. 6.48 78,219,052
Textiles, Apparel & Luxury Goods106,348 NIKE, Inc., B 1.47 17,725,021
Total Common Stock 97.56 1,177,969,397
Government Obligations (2020: 0.00% USD –)US Treasury Notes/Bonds
18,900,000 0.0000%, due 4/1/22 1.57 18,900,018
Total Government Obligations 1.57 18,900,018
Total Investments (Cost: USD 808,363,533) 99.13 1,196,869,415
Forward Currency Contracts (2020: 0.20% USD 1,535,478)Open as at 31 December 2021.
Current Market
Percentage of Net Unrealised
Currency Currency Value Settle Assets GainPurchased Sold (USD) Date (%) (USD)
.J.P. Morgan AUD◊ 709,859 USD 510,360 516,503 31-Jan-22 0.00 6,143
EUR◊ 77,834,162 USD 87,409,711 88,663,621 31-Jan-22 0.10 1,253,910
Total 0.10 1,260,053
.
Total Financial Assets at fair value through profit or loss 99.23 1,198,129,468
DocuSign Envelope ID: 521655BF-9BE3-47DC-A9A3-494932954338

Janus Henderson Capital Funds plc / 31 December 2021134
The accompanying notes are an integral part of the financial statements.
Janus Henderson US Forty Fund (continued)
Portfolio Investments
Financial Liabilities at fair value through profit or loss.Forward Currency Contracts (2020: 0.00% USD (14,689))Open as at 31 December 2021
Current Market
Percentage of Net Unrealised
Currency Currency Value Settle Assets LossPurchased Sold (USD) Date (%) (USD)
J.P. Morgan USD◊ 62,294 AUD 87,501 63,667 31-Jan-22 0.00 (1,373)
USD◊ 11,506,937 EUR 10,172,333 11,587,663 31-Jan-22 0.00 (80,726)
Total 0.00 (82,099).
Total Financial Liabilities at fair value through profit or loss 0.00 (82,099)
Portfolio Analysis (Unaudited)
Analysis of Total Assets:% of Total
AssetsTransferable securities admitted to official stock exchange listing 97.06Transferable securities dealt in on another regulated market 1.56OTC financial derivative instruments 0.10Other Assets 1.28Total Assets 100.00
◊ These forward currency contracts are used for share class hedging.
DocuSign Envelope ID: 521655BF-9BE3-47DC-A9A3-494932954338

135Janus Henderson Capital Funds plc / 31 December 2021
The accompanying notes are an integral part of the financial statements.
Janus Henderson US Forty Fund (continued)
Fair Value Hierarchy
The tables below provide the fair value hierarchy summary of the Fund’s financial assets and liabilities measured at fair value at 31 December 2021 and 31 December 2020.
31 December 2021
Level 1 - Quoted Prices
(USD)
Level 2 - Other Significant
Observable Inputs (USD)
Level 3 - Significant
Unobservable Inputs (USD)
Total (USD)
Common Stock 1,174,965,892 3,003,505 – 1,177,969,397Forward Currency Contracts – 1,177,954 – 1,177,954Government Obligations – 18,900,018 – 18,900,018Total Investments in Securities 1,174,965,892 23,081,477 – 1,198,047,369
31 December 2020
Level 1 - Quoted Prices
(USD)
Level 2 - Other Significant
Observable Inputs (USD)
Level 3 - Significant
Unobservable Inputs (USD)
Total (USD)
Common Stock 699,933,384 17,289,0641 – 717,222,448Forward Currency Contracts – 1,520,789 – 1,520,789Total Investments in Securities 699,933,384 18,809,853 – 718,743,237
1At 31 December 2020, the administrator used a systematic fair valuation model provided by an independent third party to value listed securities in order to adjust for stale pricing between the close of foreign exchanges and the valuation point. This resulted in an increase of USD 19,083 to common stocks with a fair value of USD 17,289,064.
There were transfers on Common Stock from level 2 to level 1 during the financial year ended 31 December 2021 and on Common Stock from level 1 to level 2 during the financial year ended 31 December 2020.
There were no investments held by the Fund at 31 December 2021 and 31 December 2020 that were fair valued at level 3 by the Janus Henderson Global Pricing Committee.
Valuation policy of private placements is referenced in note 2 of the financial statements.
Capital Share Transactions
For the financial year ended 31 December 2021
A2 HAUD A2 HEUR A2 USD B2 USD E2 HEUR E2 USD H2 GBP H2 HEURShares Shares Shares Shares Shares Shares Shares Shares
At beginning of the year . . . . . . . 10,428 893,140 2,903,451 216,424 25,477 38,908 1,891 150,434Shares issued 27,298 217,910 1,120,517 222 3,388 98,155 1,479 33,699Shares redeemed. . . . . . . . . . . (19,608) (166,614) (971,064) (13,477) (4,965) (7,021) (294) (121,255)At end of year . . . . . . . . . . . . . 18,118 944,436 3,052,904 203,169 23,900 130,042 3,076 62,878
H2 USD I1 USD I2 HEUR I2 USD V2 HEUR V2 USDShares Shares Shares Shares Shares Shares
At beginning of the year . . . . . . . 1,268,985 1,445 613 7,641,583 383 59,383Shares issued 222,246 966 176,297 4,629,164 2,967 121,361Shares redeemed. . . . . . . . . . . (414,432) – (22,986) (839,295) (390) (95,857)At end of year . . . . . . . . . . . . . 1,076,799 2,411 153,924 11,431,452 2,960 84,887
DocuSign Envelope ID: 521655BF-9BE3-47DC-A9A3-494932954338

Janus Henderson Capital Funds plc / 31 December 2021136
Janus Henderson US Forty Fund (continued)
The accompanying notes are an integral part of the financial statements.
For the financial year ended 31 December 2020
. .A2 HAUD A2 HEUR A2 USD B2 USD E2 HEUR E2 USD H2 GBP H2 HEUR
Shares Shares Shares Shares Shares Shares Shares SharesAt beginning of the year . . . . . . . 1,939 949,899 3,255,105 227,588 23,030 7,776 385 221Shares issued 12,694 237,633 1,276,505 – 9,911 38,824 1,506 166,513Shares redeemed. . . . . . . . . . . (4,205) (294,392) (1,628,159) (11,164) (7,464) (7,692) – (16,300)At end of year . . . . . . . . . . . . . 10,428 893,140 2,903,451 216,424 25,477 38,908 1,891 150,434
H2 USD I1 USD I2 HEUR I2 USD V2 HEUR V2 USDShares Shares Shares Shares Shares Shares
At beginning of the year . . . . . . . 1,102,538 1,750 63,081 4,049,040 4,190 10,781Shares issued 792,559 – – 4,718,842 3,029 129,108Shares redeemed. . . . . . . . . . . (626,112) (305) (62,468) (1,126,299) (6,836) (80,506)At end of year . . . . . . . . . . . . . 1,268,985 1,445 613 7,641,583 383 59,383
Net Asset Comparison
31 December 2021 31 December 2020 31 December 2019
Net Assets (USD)
NAV Per Share
(Local Currency)Net Assets
(USD)
NAV Per Share
(Local Currency)Net Assets
(USD)
NAV Per Share
(Local Currency)
A2 HAUD 454,622 34.49 230,632 28.69 29,251 21.50A2 HEUR 60,928,590 56.67 51,534,707 47.23 37,354,753 35.06A2 USD 193,813,344 63.48 152,017,256 52.36 124,125,507 38.13B2 USD 10,249,930 50.45 9,096,751 42.03 7,036,800 30.92E2 HEUR 1,140,932 41.93 1,093,389 35.13 676,904 26.21E2 USD 3,646,745 28.04 904,354 23.24 132,287 17.01H2 GBP 238,539 57.28 119,231 46.10 17,454 34.20H2 HEUR 2,406,948 33.62 5,080,496 27.64 5,014 20.23H2 USD 41,321,492 38.37 39,597,333 31.20 24,710,897 22.41I1 USD 120,449 49.95 58,880 40.74 51,383 29.35I2 HEUR 12,552,193 71.63 44,217 59.03 3,067,381 43.35I2 USD 877,988,109 76.81 478,717,895 62.64 182,752,309 45.13V2 HEUR 81,987 24.33 9,482 20.27 70,993 15.11V2 USD 2,374,970 27.98 1,370,820 23.08 181,246 16.81
. . .
Total Expense Ratio (unaudited)
The Average Total Expense Ratio table shows the actual expenses, excluding transactions costs and trade commissions, incurred by each Class for the Fund during the reporting financial year expressed as a percentage of the average net assets for the corresponding year, on an annualised basis.
31 December 2021 31 December 2020 31 December 2019A2 HAUD 2.13% 2.15% 2.15%A2 HEUR 2.14% 2.15% 2.16%A2 USD 2.14% 2.14% 2.15%B2 USD 3.14% 3.14% 3.16%E2 HEUR 2.62% 2.64% 2.66%E2 USD 2.64% 2.65% 2.65%H2 GBP 0.71% 0.75% 0.80%H2 HEUR 0.73% 0.74% 0.79%H2 USD 0.73% 0.75% 0.80%I1 USD 1.02% 1.06% 1.16%I2 HEUR 1.02% 1.11% 1.10%I2 USD 1.02% 1.04% 1.11%V2 HEUR 2.13% 2.26% 2.16%V2 USD 2.13% 2.14% 2.16%
DocuSign Envelope ID: 521655BF-9BE3-47DC-A9A3-494932954338

137Janus Henderson Capital Funds plc / 31 December 2021
Janus Henderson US Forty Fund (continued)
The accompanying notes are an integral part of the financial statements.
Fund Performance (unaudited)
As at 31 December 2021
One year Three years Five yearsSince
inception
Performance (Annualised) 31/12/2020 31/12/2021
%
31/12/2017 31/12/2021
%
31/12/2015 31/12/2021
%
to 31/12/2021
%
H2 USD (Net)* 22.98 30.80** 23.36** 8.36**Russell 1000 Growth TR 27.60 34.07 25.32 8.50
Five years 31/12/2015 31/12/2021
%H2 USD (Gross)* 26.08Russell 1000 Growth TR + 2.50% 28.46
.
Discrete performance
31/12/2020 31/12/2021
%
31/12/2019 31/12/2020
%
31/12/2018 31/12/2019
%
31/12/2017 31/12/2018
%
31/12/2016 31/12/2017
%
H2 USD (Net)* 22.98 37.27** 34.45** (0.32)** 28.04**Russell 1000 Growth TR 27.60 38.49 36.39 (1.51) 30.21
H2 USD (Gross)* 23.89 40.22** 37.34** 1.88** 30.89**Russell 1000 Growth TR + 2.50% 30.78 41.96 39.80 0.96 33.46
. . . . .
Class H2 USD is disclosed as it is the representative share class.
* The representative share class has changed from the A2 USD to the H2 USD share class with effect from August 2021.
** Historical figures are based on the A2 USD share class.
Performance target: To outperform the Russell 1000 Growth Index by at least 2.5% per annum, before the deduction of charges, over any 5 year period.
Please note the Gross Returns 5 year annualised table is only applicable for share classes which have been active for 5 or more years and the performance target is to be achieved over a specific annualised time period. Performance target and index shown in USD.
Past performance does not guarantee future returns. The rates of return will vary and the principal value of an investment will fluctuate. Shares, if redeemed, may be worth more or less than their original cost. The performance data does not take account of the commissions and costs incurred on the issue and redemption of Shares. All returns are calculated in the base currency of the representative Share Class.
There is no guarantee that the Fund’s performance will match or exceed the benchmark.
DocuSign Envelope ID: 521655BF-9BE3-47DC-A9A3-494932954338

Janus Henderson Capital Funds plc / 31 December 2021138
Janus Henderson US Forty Fund (continued)
Statements of Changes in Composition of Portfolio (unaudited)The tables below show a breakdown of material purchases and sales of the Investment Portfolio in accordance with Central Bank UCITS Regulations 79(2) requirements. All purchases and sales of investments exceeding 1% of the total value of each transaction respectively, are disclosed, with a minimum number of 20 of each such transaction. A full analysis of the movement on the Investment Portfolio is available upon request from the registered office.
Major Purchases for the year ended 31 December 2021
Shares or Principal Amount
Cost (USD)
Credit Industriel et Commercial, 0.0000%, due 16/7/21 56,300,000 56,299,875Credit Agricole Corporate And Investment Bank, 0.0000%, due 15/7/21 54,700,000 54,699,909Credit Agricole Corporate And Investment Bank, 0.0000%, due 19/10/21 53,500,000 53,499,911Credit Agricole Corporate And Investment Bank, 0.0000%, due 18/10/21 53,400,000 53,399,733Credit Agricole Corporate And Investment Bank, 0.0000%, due 6/10/21 53,000,000 52,999,912Credit Agricole Corporate And Investment Bank, 0.0000%, due 13/7/21 51,500,000 51,499,914Credit Agricole Corporate And Investment Bank, 0.0000%, due 14/7/21 51,500,000 51,499,914Credit Agricole Corporate And Investment Bank, 0.0000%, due 20/12/21 50,600,000 50,599,789Credit Agricole Corporate And Investment Bank, 0.0000%, due 17/12/21 50,100,000 50,099,930Credit Agricole Corporate And Investment Bank, 0.0000%, due 15/10/21 49,500,000 49,499,917Credit Agricole Corporate And Investment Bank, 0.0000%, due 16/12/21 48,700,000 48,699,932Credit Agricole Corporate And Investment Bank, 0.0000%, due 14/10/21 48,300,000 48,299,919Credit Agricole Corporate And Investment Bank, 0.0000%, due 1/11/21 48,100,000 48,099,800Amazon.com, Inc. 14,123 47,050,734Credit Agricole Corporate And Investment Bank, 0.0000%, due 15/12/21 46,300,000 46,299,936Credit Agricole Corporate And Investment Bank, 0.0000%, due 29/10/21 46,100,000 46,099,936Credit Industriel et Commercial, 0.0000%, due 12/7/21 44,800,000 44,799,701Credit Agricole Corporate And Investment Bank, 0.0000%, due 14/12/21 44,300,000 44,299,938Credit Industriel et Commercial, 0.0000%, due 9/7/21 42,400,000 42,399,906Credit Agricole Corporate And Investment Bank, 0.0000%, due 15/11/21 42,400,000 42,399,823
Major Sales for the year ended 31 December 2021
Shares or Principal Amount
Proceeds (USD)
Meta Platforms, Inc. 'A' 72,578 25,365,052L3Harris Technologies, Inc. 111,403 23,106,816salesforce.com, Inc. 99,582 21,479,617US Treasury Bill, 0.0000%, due 4/1/22 20,000,000 19,999,792T-Mobile US, Inc. 140,845 16,723,865Amazon.com, Inc. 4,726 16,543,349PayPal Holdings, Inc. 63,461 16,180,284NVIDIA Corp. 49,449 15,750,104Mastercard, Inc. 'A' 43,571 15,087,360Boston Scientific Corp. 341,770 14,259,872Illumina, Inc. 35,645 14,198,430Uber Technologies, Inc. 287,535 13,631,569Elanco Animal Health, Inc. 391,068 12,012,787Texas Instruments, Inc. 57,179 11,400,192Vertex Pharmaceuticals, Inc. 47,791 9,280,746Booking Holdings, Inc. 3,949 8,562,370Dexcom, Inc. 10,089 5,399,485Avalara, Inc. 21,174 3,366,328NIKE, Inc. 'B' 23,584 3,084,103LVMH Moet Hennessy Louis Vuitton SE 4,335 2,849,457
DocuSign Envelope ID: 521655BF-9BE3-47DC-A9A3-494932954338

Janus Henderson US Research Fund
139Janus Henderson Capital Funds plc / 31 December 2021
Fund Overview (unaudited)Investment Objective and Policy
The Fund aims to provide capital growth over the long term.
Performance target: To outperform the Russell 1000 Index by at least 2% per annum, before the deduction of charges, over any 5 year period.
The Fund invests at least 80% of its assets in shares (also known as equities) of mainly larger companies, in any industry, in the United States.
The Fund is actively managed with reference to the Russell 1000 Index, which is broadly representative of the companies in which it may invest, as this forms the basis of the Fund’s performance target. The investment manager has discretion to choose individual investments for the Fund with weightings different to the index or not in the index, but at times the Fund may hold investments similar to the index. The investment manager will seek to maintain the portfolio with sector weightings close to those of the index.
How Sustainability Risks are part of the investment processThe investments underlying this financial product (referred to as the Fund) do not take into account the EU criteria for environmentally sustainable economic activities, although the Manager and the Investment Manager have agreed a decision making process that will apply to investment decisions relating to the Fund as further detailed in the Prospectus.
The likely impacts of sustainability risks on the returns of the FundWhile the analysis of (Environmental, Social and Governance) ESG factors is an integral component across the Investment Manager’s investment capabilities and one of a number of inputs to the selection of investments and portfolio construction, the investment process of the Investment Manager is primarily designed to maximise long-term risk-adjusted returns for investors. Therefore, in managing the Fund, the Investment Manager does not maximise portfolio alignment with sustainability risks as a separate goal in its own right nor does it precisely attribute the impact of ESG factors on returns for the Fund.
Fund Overview
Janus Henderson Central Research Team, portfolio managers
For the year ended 31 December 2021, the Janus Henderson US Research Fund Class H2 US dollar terms returned 23.44 % (Net) and 24.74% (Gross), compared with 26.45% and 28.98% Target (Gross) for its benchmark, the Russell 1000® Index.
On an individual stock basis, relative detractors included Uber Technologies. The ride-share company faced several
headwinds during the year, including driver supply issues resulting from a national labor shortage in the U.S., concerns that the Department of Labor could reclassify drivers as employees rather than contractors, and higher gas prices. We expected Uber to overcome these challenges and maintained our position in the stock.
Fidelity National Information Services (FIS), a provider of software solutions for the financial services industry, also weighed on relative results. The shares declined on some investors’ perception that FIS’ solutions are becoming ‘legacy’ technology and concerns about new financial technology competitors. We were encouraged by the growth metrics of FIS’ merchant and banking segments, and maintained our position in the stock.
Notable detractors included Roku. Although the streaming television platform operator continued to exceed analysts’ estimates for quarterly growth, the shares slid on concerns about a decline in engagement amid relaxed COVID-19 restrictions and consumers’ subsequent shift to out-of-home entertainment. These concerns caused several analysts to reduce their price targets for the stock. The company was well positioned to benefit from opportunities in international markets, among others, and we maintained our position.
Despite the disappointing short-term performance of these stocks, a number of holdings contributed to the Fund’s results, including Blackstone. Performance in the investment firm’s portfolios has been generally strong as a result of the economic reopening. Notable increases in fee-related earnings and solid fundraising also helped the company log strong financial results.
Top contributors included technology holdings Microsoft and Marvell Technology. Microsoft’s quarterly financial results continued to surpass analysts’ consensus estimates. Notably, the software company reported double-digit year-over-year revenue growth, driven by its intelligent cloud segment and productivity and business process unit. Shares of semiconductor manufacturer Marvell advanced following management’s strong growth projections for fiscal year 2023, which triggered a flurry of price target increases among analysts. Through its diverse product portfolio and design wins, Marvell has been benefiting from several secular growth opportunities, including bandwidth upgrade in data centers, 5G infrastructure expansion, and automotive electrification.
Thank you for investing in the Janus Henderson US Research Fund.
January 2022
DocuSign Envelope ID: 521655BF-9BE3-47DC-A9A3-494932954338

Janus Henderson Capital Funds plc / 31 December 2021140
The accompanying notes are an integral part of the financial statements.
Janus Henderson US Research Fund (continued)
s
Statement of Financial PositionAs of
31 December 2021
(USD)
As of 31 December
2020 (USD)
Assets:Financial assets at fair value through profit or loss . . . . . . . . . . . . . . . . . . . . . . . . . . . . . . . . . . . . . . . . . . . . . . . . . . . . . . . 10,471,561 8,942,948Cash and foreign currency . . . . . . . . . . . . . . . . . . . . . . . . . . . . . . . . . . . . . . . . . . . . . . . . . . . . . . . . . . . . . . . . . . . . . . . 24,383 75,675Receivables:
Investments sold . . . . . . . . . . . . . . . . . . . . . . . . . . . . . . . . . . . . . . . . . . . . . . . . . . . . . . . . . . . . . . . . . . . . . . . . . . . . 10,653 –Funds shares sold . . . . . . . . . . . . . . . . . . . . . . . . . . . . . . . . . . . . . . . . . . . . . . . . . . . . . . . . . . . . . . . . . . . . . . . . . . . 50,208 19,090Dividends . . . . . . . . . . . . . . . . . . . . . . . . . . . . . . . . . . . . . . . . . . . . . . . . . . . . . . . . . . . . . . . . . . . . . . . . . . . . . . . . . 1,512 3,383
Receivable from Investment Manager . . . . . . . . . . . . . . . . . . . . . . . . . . . . . . . . . . . . . . . . . . . . . . . . . . . . . . . . . . . . . . . . 6,770 3,614
Total Assets . . . . . . . . . . . . . . . . . . . . . . . . . . . . . . . . . . . . . . . . . . . . . . . . . . . . . . . . . . . . . . . . . . . . . . . . . 10,565,087 9,044,710 Liabilities (amounts falling due within one year)Payables:
Financial liabilities at fair value through profit or loss . . . . . . . . . . . . . . . . . . . . . . . . . . . . . . . . . . . . . . . . . . . . . . . . . . . . 757 211Spot foreign exchange contracts awaiting payment . . . . . . . . . . . . . . . . . . . . . . . . . . . . . . . . . . . . . . . . . . . . . . . . . . . . . – 324Fund shares repurchased . . . . . . . . . . . . . . . . . . . . . . . . . . . . . . . . . . . . . . . . . . . . . . . . . . . . . . . . . . . . . . . . . . . . . . – 61,183Investment Management fees . . . . . . . . . . . . . . . . . . . . . . . . . . . . . . . . . . . . . . . . . . . . . . . . . . . . . . . . . . . . . . . . . . . 8,452 13,540Shareholder Service fees . . . . . . . . . . . . . . . . . . . . . . . . . . . . . . . . . . . . . . . . . . . . . . . . . . . . . . . . . . . . . . . . . . . . . . 4,843 4,366Distribution fees . . . . . . . . . . . . . . . . . . . . . . . . . . . . . . . . . . . . . . . . . . . . . . . . . . . . . . . . . . . . . . . . . . . . . . . . . . . . . 98 82Accounting, Administration and Transfer Agent fees . . . . . . . . . . . . . . . . . . . . . . . . . . . . . . . . . . . . . . . . . . . . . . . . . . . . 9,672 –Management fees . . . . . . . . . . . . . . . . . . . . . . . . . . . . . . . . . . . . . . . . . . . . . . . . . . . . . . . . . . . . . . . . . . . . . . . . . . . 197 168Accrued expenses . . . . . . . . . . . . . . . . . . . . . . . . . . . . . . . . . . . . . . . . . . . . . . . . . . . . . . . . . . . . . . . . . . . . . . . . . . . 44,238 27,705
Total Liabilities (excluding Net Assets attributable to holders of redeemable ordinary shares) . . . . . . . . . . . . 68,257 107,579 Net Assets attributable to holders of redeemable ordinary participating shares . . . . . . . . . . . . . . . . . . . . . . 10,496,830 8,937,131
..
.
.
.
.
.
.
DocuSign Envelope ID: 521655BF-9BE3-47DC-A9A3-494932954338

141Janus Henderson Capital Funds plc / 31 December 2021
Janus Henderson US Research Fund (continued)
The accompanying notes are an integral part of the financial statements.
Statement of Comprehensive IncomeYear ended
31 December 2021
(USD)
Year ended 31 December
2020 (USD)
Year ended Year endedRevenue:Interest income . . . . . . . . . . . . . . . . . . . . . . . . . . . . . . . . . . . . . . . . . . . . . . . . . . . . . . . . . . . . . . . . . . . . . . . . . . . . . . . 22,664 942Dividend income . . . . . . . . . . . . . . . . . . . . . . . . . . . . . . . . . . . . . . . . . . . . . . . . . . . . . . . . . . . . . . . . . . . . . . . . . . . . . . 122,901 2,055,603Other income . . . . . . . . . . . . . . . . . . . . . . . . . . . . . . . . . . . . . . . . . . . . . . . . . . . . . . . . . . . . . . . . . . . . . . . . . . . . . . . . 32,302 2,865
Net gain/(loss) on financial assets and liabilities at fair value through profit or loss . . . . . . . . . . . . . . . . . . . . . . . . . . . . . . . . . . 2,163,409 (7,231,567) Total Investments Income/(Loss) . . . . . . . . . . . . . . . . . . . . . . . . . . . . . . . . . . . . . . . . . . . . . . . . . . . . . . . . . . 2,341,276 (5,172,157)
Expenses:Investment Management fees . . . . . . . . . . . . . . . . . . . . . . . . . . . . . . . . . . . . . . . . . . . . . . . . . . . . . . . . . . . . . . . . . . . . . 104,281 146,397Shareholder Service fees . . . . . . . . . . . . . . . . . . . . . . . . . . . . . . . . . . . . . . . . . . . . . . . . . . . . . . . . . . . . . . . . . . . . . . . . 56,708 50,187Distribution fees . . . . . . . . . . . . . . . . . . . . . . . . . . . . . . . . . . . . . . . . . . . . . . . . . . . . . . . . . . . . . . . . . . . . . . . . . . . . . . 1,090 509Management fees . . . . . . . . . . . . . . . . . . . . . . . . . . . . . . . . . . . . . . . . . . . . . . . . . . . . . . . . . . . . . . . . . . . . . . . . . . . . . 2,532 1,088Accounting, Administration and Transfer Agent fees . . . . . . . . . . . . . . . . . . . . . . . . . . . . . . . . . . . . . . . . . . . . . . . . . . . . . . 51,773 75,495Custodian fees . . . . . . . . . . . . . . . . . . . . . . . . . . . . . . . . . . . . . . . . . . . . . . . . . . . . . . . . . . . . . . . . . . . . . . . . . . . . . . . 35,164 31,090Audit fees . . . . . . . . . . . . . . . . . . . . . . . . . . . . . . . . . . . . . . . . . . . . . . . . . . . . . . . . . . . . . . . . . . . . . . . . . . . . . . . . . . 21,332 26,967Printing expenses . . . . . . . . . . . . . . . . . . . . . . . . . . . . . . . . . . . . . . . . . . . . . . . . . . . . . . . . . . . . . . . . . . . . . . . . . . . . . 5,127 5,451Legal and other professional fees . . . . . . . . . . . . . . . . . . . . . . . . . . . . . . . . . . . . . . . . . . . . . . . . . . . . . . . . . . . . . . . . . . 12,843 28,105Other fees . . . . . . . . . . . . . . . . . . . . . . . . . . . . . . . . . . . . . . . . . . . . . . . . . . . . . . . . . . . . . . . . . . . . . . . . . . . . . . . . . . 20,185 2,881
Total Expenses . . . . . . . . . . . . . . . . . . . . . . . . . . . . . . . . . . . . . . . . . . . . . . . . . . . . . . . . . . . . . . . . . . . . . . . 311,035 368,170Less Expense Reimbursement . . . . . . . . . . . . . . . . . . . . . . . . . . . . . . . . . . . . . . . . . . . . . . . . . . . . . . . . . . . (103,290) (119,716)Net Expenses after Expense Reimbursement . . . . . . . . . . . . . . . . . . . . . . . . . . . . . . . . . . . . . . . . . . . . . . . . 207,745 248,454Net Operating Profit/(Loss) . . . . . . . . . . . . . . . . . . . . . . . . . . . . . . . . . . . . . . . . . . . . . . . . . . . . . . . . . . . . . . 2,133,531 (5,420,611)
Finance Costs: 97 68
Total distributions to holders of redeemable ordinary shares. . . . . . . . . . . . . . . . . . . . . . . . . . . . . . . . . . . . . . . . . . . . . . . . . (97) (68) Withholding tax on dividends and other investment income . . . . . . . . . . . . . . . . . . . . . . . . . . . . . . . . . . . . . (34,914) (671,842)
Net Increase/(Decrease) in Net Assets attributable to holders of redeemable ordinary shares resulting from operations . . . . . . . . . . . . . . . . . . . . . . . . . . . . . . . . . . . . . . . . . . . . . . . . . . . . . . . . . . . . . . . . . . . . . . . . . . . 2,098,520 (6,092,521)
. .
. .. . .
Statement of Changes in Net Assets Attributable to Redeemable Ordinary ShareholdersYear ended
31 December 2021
(USD)
Year ended 31 December
2020 (USD)
Increase/(Decrease) in Net Assets attributable to holders of redeemable ordinary shares resulting from operations . . . . . . . . . . . . 2,098,520 (6,092,521)
Capital Share Transactions of redeemable ordinary shares:Proceeds from redeemable ordinary shares sold . . . . . . . . . . . . . . . . . . . . . . . . . . . . . . . . . . . . . . . . . . . . . . . . . . . . . . . 5,044,854 10,497,485Redemption of redeemable ordinary shares . . . . . . . . . . . . . . . . . . . . . . . . . . . . . . . . . . . . . . . . . . . . . . . . . . . . . . . . . . (5,586,021) (300,101,500)Dilution Adjustment. . . . . . . . . . . . . . . . . . . . . . . . . . . . . . . . . . . . . . . . . . . . . . . . . . . . . . . . . . . . . . . . . . . . . . . . . . . 2,345 2,969
Net (Decrease) from Capital Share Transactions of redeemable ordinary shares . . . . . . . . . . . . . . . . . . . . . . (538,822) (289,601,046)
Net Increase/(Decrease) in Net Assets attributable to holders of redeemable ordinary shares . . . . . . . . . . . . . . . . . . . . . . . . . . . 1,559,699 (295,693,567)Net Assets attributable to holders of redeemable ordinary shares at the beginning of the financial year . . . . . . . . . . . . . . . . . . . . 8,937,131 304,630,698
Net Assets attributable to holders of redeemable ordinary shares at the end of the financial year . . . . . . . . . 10,496,830 8,937,131
Gains and losses are solely from continuing operations except for the Funds which ceased operations during the financial year ended 31 December 2021 or 31 December 2020. There were no gains and losses other than those dealt with in the Statement of Comprehensive Income. Please refer to note 1 which details the Fund closures during the year.
DocuSign Envelope ID: 521655BF-9BE3-47DC-A9A3-494932954338

Janus Henderson Capital Funds plc / 31 December 2021142
Janus Henderson US Research Fund (continued)
Portfolio Investments
The accompanying notes are an integral part of the financial statements.
Shares or Principal Amount
Percentage of Net Assets
(%)Fair Value
(USD)
Financial Assets at fair value through profit or lossCommon Stock (2020: 99.80% USD 8,919,440)IrelandBiotechnology
337 Horizon Therapeutics plc 0.35 36,315
Building Products566 Trane Technologies plc 1.09 114,349
Insurance312 Aon plc, A 0.89 93,775
JerseyAuto Components
636 Aptiv plc 1.00 104,908
Trading Companies & Distributors510 Ferguson plc 0.86 90,465
United KingdomPharmaceuticals
1,585 AstraZeneca plc 0.88 92,326
United StatesAerospace & Defense
2,592 Howmet Aerospace, Inc. 0.79 82,503351 L3Harris Technologies, Inc. 0.71 74,847
1.50 157,350
Air Freight & Logistics615 United Parcel Service, Inc., B 1.26 131,819
Banks1,912 Citigroup, Inc. 1.10 115,4661,500 JPMorgan Chase & Co. 2.26 237,525
104 SVB Financial Group 0.67 70,5374.03 423,528
Beverages683 Constellation Brands, Inc., A 1.63 171,413
Biotechnology757 AbbVie, Inc. 0.98 102,498566 Sarepta Therapeutics, Inc. 0.49 50,968327 Vertex Pharmaceuticals, Inc. 0.68 71,809
2.15 225,275
Capital Markets1,497 Apollo Asset Management, Inc. 1.03 108,428885 Blackstone, Inc., A 1.09 114,510
1,384 Morgan Stanley 1.29 135,8533.41 358,791
Chemicals356 Sherwin-Williams Co. (The) 1.19 125,369
Consumer Finance1,292 OneMain Holdings, Inc. 0.62 64,6521,860 Synchrony Financial 0.82 86,285
1.44 150,937
Containers & Packaging743 Ball Corp. 0.68 71,529
Diversified Consumer Services856 Terminix Global Holdings, Inc. 0.37 38,717
Electric Utilities301 NextEra Energy, Inc. 0.27 28,101
2,122 NRG Energy, Inc. 0.87 91,4161.14 119,517
Shares or Principal Amount
Percentage of Net Assets
(%)Fair Value
(USD)
Electronic Equipment, Instruments & Components
191 Teledyne Technologies, Inc. 0.80 83,446
Entertainment2,070 Liberty Media Corp.-Liberty Formula
One, C 1.25 130,907247 Netflix, Inc. 1.42 148,803206 Roku, Inc. 0.45 47,009
3.12 326,719
Equity Real Estate Investment Trusts (REITs)221 American Tower Corp. 0.62 64,643269 Crown Castle International Corp. 0.54 56,15158 Equinix, Inc. 0.47 49,059
1.63 169,853
Health Care Equipment & Supplies620 Abbott Laboratories 0.83 87,25980 Align Technology, Inc. 0.50 52,574
1,315 Boston Scientific Corp. 0.53 55,861817 DENTSPLY SIRONA, Inc. 0.43 45,58081 Dexcom, Inc. 0.41 43,493
495 Edwards Lifesciences Corp. 0.61 64,1273.31 348,894
Health Care Providers & Services824 Centene Corp. 0.65 67,898154 Humana, Inc. 0.68 71,434222 UnitedHealth Group, Inc. 1.06 111,475
2.39 250,807
Hotels, Restaurants & Leisure1,612 Aramark 0.57 59,402
40 Booking Holdings, Inc. 0.91 95,9691,051 Caesars Entertainment, Inc. 0.94 98,300
377 McDonald's Corp. 0.96 101,0623.38 354,733
Household Products1,376 Procter & Gamble Co. (The) 2.14 225,086
Independent Power and Renewable Electricity Producers2,540 Vistra Corp. 0.55 57,836
Industrial Conglomerates441 Honeywell International, Inc. 0.88 91,953
Insurance904 Progressive Corp. (The) 0.88 92,796414 Travelers Cos., Inc. (The) 0.62 64,762
1.50 157,558
Interactive Media & Services159 Alphabet, Inc., C 4.38 460,081270 Match Group, Inc. 0.34 35,708494 Meta Platforms, Inc., A 1.58 166,157934 Snap, Inc., A 0.42 43,926
6.72 705,872
Internet & Direct Marketing Retail123 Amazon.com, Inc. 3.91 410,124272 DoorDash, Inc., A 0.39 40,501210 Wayfair, Inc., A 0.38 39,894
4.68 490,519
IT Services812 Fidelity National Information Services,
Inc. 0.84 88,630576 Mastercard, Inc., A 1.97 206,968
DocuSign Envelope ID: 521655BF-9BE3-47DC-A9A3-494932954338

143Janus Henderson Capital Funds plc / 31 December 2021
The accompanying notes are an integral part of the financial statements.
Janus Henderson US Research Fund (continued)
Portfolio Investments
Shares or Principal Amount
Percentage of Net Assets
(%)Fair Value
(USD)
871 Visa, Inc., A 1.80 188,754
4.61 484,352
Life Sciences Tools & Services215 Danaher Corp. 0.67 70,737180 IQVIA Holdings, Inc. 0.48 50,785183 Thermo Fisher Scientific, Inc. 1.16 122,105
2.31 243,627
Machinery249 Deere & Co. 0.81 85,380
1,810 Ingersoll Rand, Inc. 1.07 111,985191 Parker-Hannifin Corp. 0.58 60,761671 Westinghouse Air Brake Technologies
Corp. 0.59 61,8063.05 319,932
Multi-Utilities138 Sempra Energy 0.17 18,255
Oil, Gas & Consumable Fuels126 Cheniere Energy, Inc. 0.12 12,779443 Chevron Corp. 0.50 51,986
1,168 ConocoPhillips 0.80 84,306522 EOG Resources, Inc. 0.44 46,369
1,291 Marathon Petroleum Corp. 0.79 82,611425 Pioneer Natural Resources Co. 0.74 77,299
3.39 355,350
Pharmaceuticals604 Catalent, Inc. 0.74 77,330255 Eli Lilly & Co. 0.67 70,436774 Merck & Co., Inc. 0.57 59,319
1.98 207,085
Professional Services1,253 CoStar Group, Inc. 0.94 99,025
Road & Rail1,638 CSX Corp. 0.59 61,5892,633 Uber Technologies, Inc. 1.05 110,402
1.64 171,991
Semiconductors & Semiconductor Equipment857 Advanced Micro Devices, Inc. 1.17 123,32288 Lam Research Corp. 0.60 63,285
1,229 Marvell Technology, Inc. 1.02 107,525655 NVIDIA Corp. 1.84 192,642836 Texas Instruments, Inc. 1.50 157,561
6.13 644,335
Software369 Adobe, Inc. 1.99 209,245
2,363 Microsoft Corp. 7.57 794,724547 SS&C Technologies Holdings, Inc. 0.43 44,843161 Tyler Technologies, Inc. 0.83 86,610
308 Workday, Inc., A 0.80 84,13911.62 1,219,561
Specialty Retail284 Burlington Stores, Inc. 0.79 82,789
Technology Hardware, Storage & Peripherals3,793 Apple, Inc. 6.42 673,523
Textiles, Apparel & Luxury Goods640 NIKE, Inc., B 1.02 106,669
Wireless Telecommunication Services527 T-Mobile US, Inc. 0.58 61,121
Shares or Principal Amount
Percentage of Net Assets
(%)Fair Value
(USD)
Total Common Stock 99.62 10,457,274
Total Investments (Cost: USD 7,722,687) 99.62 10,457,274
Forward Currency Contracts (2020: 0.26% USD 23,508)Open as at 31 December 2021.
Current Market
Percentage of Net Unrealised
Currency Currency Value Settle Assets GainPurchased Sold (USD) Date (%) (USD)
.J.P. Morgan EUR◊ 902,949 USD 1,014,295 1,028,582 31-Jan-22 0.13 14,287
Total 0.13 14,287
.
Total Financial Assets at fair value through profit or loss 99.75 10,471,561
Financial Liabilities at fair value through profit or loss.Forward Currency Contracts (2020: 0.00% USD (211))Open as at 31 December 2021
Current Market
Percentage of Net Unrealised
Currency Currency Value Settle Assets LossPurchased Sold (USD) Date (%) (USD)
J.P. Morgan USD◊ 105,850 EUR 93,586 106,607 31-Jan-22 0.00 (757)
Total 0.00 (757).
Total Financial Liabilities at fair value through profit or loss 0.00 (757)
Portfolio Analysis (Unaudited)
Analysis of Total Assets:% of Total
AssetsTransferable securities admitted to official stock exchange listing 98.98OTC financial derivative instruments 0.14Other Assets 0.88Total Assets 100.00
◊ These forward currency contracts are used for share class hedging.
DocuSign Envelope ID: 521655BF-9BE3-47DC-A9A3-494932954338

Janus Henderson Capital Funds plc / 31 December 2021144
The accompanying notes are an integral part of the financial statements.
Janus Henderson US Research Fund (continued)
Fair Value Hierarchy
The tables below provide the fair value hierarchy summary of the Fund’s financial assets and liabilities measured at fair value at 31 December 2021 and 31 December 2020.
31 December 2021
Level 1 - Quoted Prices
(USD)
Level 2 - Other Significant
Observable Inputs (USD)
Level 3 - Significant
Unobservable Inputs (USD)
Total (USD)
Common Stock 10,457,274 – – 10,457,274Forward Currency Contracts – 13,530 – 13,530Total Investments in Securities 10,457,274 13,530 – 10,470,804
31 December 2020
Level 1 - Quoted Prices
(USD)
Level 2 - Other Significant
Observable Inputs (USD)
Level 3 - Significant
Unobservable Inputs (USD)
Total (USD)
Common Stock 8,919,440 – – 8,919,440Forward Currency Contracts – 23,297 – 23,297Total Investments in Securities 8,919,440 23,297 – 8,942,737
There were no investments held by the Fund at 31 December 2021 and 31 December 2020 that were fair valued at level 3 by the Janus Henderson Global Pricing Committee.
Valuation policy of private placements is referenced in note 2 of the financial statements.
Capital Share Transactions
For the financial year ended 31 December 2021
A2 HEUR A2 USD B2 USD H2 USD I2 USD Z1 USDShares Shares Shares Shares Shares Shares
At beginning of the year . . . . . . . 21,483 155,072 3,096 8,546 36,246 32Shares issued 2,904 8,585 – – 83,426 0Shares redeemed. . . . . . . . . . . (2,811) (21,139) – (7,834) (76,718) –At end of year . . . . . . . . . . . . . 21,576 142,518 3,096 712 42,954 32
For the financial year ended 31 December 2020
. .A2 HEUR A2 USD B2 USD H2 USD I2 USD Z1 USD
Shares Shares Shares Shares Shares SharesAt beginning of the year . . . . . . . 34,588 174,686 4,070 1,143,942 119,953 1,300,031Shares issued 1,550 177,007 – 96,165 79,384 2Shares redeemed. . . . . . . . . . . (14,655) (196,621) (974) (1,231,561) (163,091) (1,300,001)At end of year . . . . . . . . . . . . . 21,483 155,072 3,096 8,546 36,246 32
DocuSign Envelope ID: 521655BF-9BE3-47DC-A9A3-494932954338

145Janus Henderson Capital Funds plc / 31 December 2021
Janus Henderson US Research Fund (continued)
The accompanying notes are an integral part of the financial statements.
Net Asset Comparison
31 December 2021 31 December 2020 31 December 2019
Net Assets (USD)
NAV Per Share
(Local Currency)Net Assets
(USD)
NAV Per Share
(Local Currency)Net Assets
(USD)
NAV Per Share
(Local Currency)
A2 HEUR 924,490 37.64 818,430 31.18 1,010,073 26.04A2 USD 6,850,105 48.06 6,113,937 39.43 5,650,622 32.35B2 USD 118,368 38.23 98,575 31.84 107,681 26.45H2 USD 13,426 18.85 130,547 15.28 14,145,706 12.37I2 USD 2,579,902 60.06 1,767,186 48.76 4,744,019 39.55Z1 USD 10,539 327.70 8,456 265.45 278,972,597 214.59
. . .
Total Expense Ratio (unaudited)
The Average Total Expense Ratio table shows the actual expenses, excluding transactions costs and trade commissions, incurred by each Class for the Fund during the reporting financial year expressed as a percentage of the average net assets for the corresponding year, on an annualised basis.
31 December 2021 31 December 2020 31 December 2019A2 HEUR 2.24% 2.03% 1.96%A2 USD 2.25% 2.25% 1.96%B2 USD 3.75% 3.51% 3.46%H2 USD 1.05% 1.02% 0.98%I2 USD 1.18% 1.11% 1.18%
Distributions per share (unaudited)
The following table shows the distribution rate per share at Ex-date for each distributing share class:
Share Class (Local Currency) 15/01/2021 12/02/2021 15/03/2021 15/04/2021 14/05/2021 15/06/2021 15/07/2021 13/08/2021 15/09/2021 15/10/2021 15/11/2021 15/12/2021Z1 USD – – – – – – – – – 3.04418 – –
– – – – – – – – – – – –
DocuSign Envelope ID: 521655BF-9BE3-47DC-A9A3-494932954338

Janus Henderson Capital Funds plc / 31 December 2021146
Janus Henderson US Research Fund (continued)
The accompanying notes are an integral part of the financial statements.
Fund Performance (unaudited)
As at 31 December 2021
One year Three years Five yearsSince
inception
Performance (Annualised) 31/12/2020 31/12/2021
%
31/12/2017 31/12/2021
%
31/12/2015 31/12/2021
%
to 31/12/2021
%
H2 USD (Net)* 23.44 23.73** 16.80** 8.18**Russell 1000 TR 26.45 26.20 18.43 9.76
Five years 31/12/2015 31/12/2021
%H2 USD (Gross)* 19.36Russell 1000 TR + 2.00% 20.80
.
Discrete performance
31/12/2020 31/12/2021
%
31/12/2019 31/12/2020
%
31/12/2018 31/12/2019
%
31/12/2017 31/12/2018
%
31/12/2016 31/12/2017
%
H2 USD (Net)* 23.44 21.85** 27.51** (4.91)** 20.67**Russell 1000 TR 26.45 20.96 31.43 (4.78) 21.69
H2 USD (Gross)* 24.74 24.25** 30.01** (2.89)** 23.31**Russell 1000 TR + 2.00% 28.98 23.39 34.05 (2.87) 24.11
. . . . .
Class H2 USD is disclosed as it is the representative share class.
* The representative share class has changed from the A2 USD to the H2 USD share class with effect from August 2021.
** Historical figures are based on the A2 USD share class.
Performance target: To outperform the Russell 1000 Index by at least 2% per annum, before the deduction of charges, over any 5 year period.
The Total Expense Ratio includes fees payable to Distributors. Where the Total Expense Ratio exceeds the target outperformance relative to the benchmark the return is likely to be below the benchmark return, even when the Fund’s outperformance target (before the deduction of charges) has been achieved.
Please note the Gross Returns 5 year annualised table is only applicable for share classes which have been active for 5 or more years and the performance target is to be achieved over a specific annualised time period. Performance target and index shown in USD.
Past performance does not guarantee future returns. The rates of return will vary and the principal value of an investment will fluctuate. Shares, if redeemed, may be worth more or less than their original cost. The performance data does not take account of the commissions and costs incurred on the issue and redemption of Shares. All returns are calculated in the base currency of the representative Share Class.
There is no guarantee that the Fund’s performance will match or exceed the benchmark.
DocuSign Envelope ID: 521655BF-9BE3-47DC-A9A3-494932954338

147Janus Henderson Capital Funds plc / 31 December 2021
Janus Henderson US Research Fund (continued)
Statements of Changes in Composition of Portfolio (unaudited)The tables below show a breakdown of material purchases and sales of the Investment Portfolio in accordance with Central Bank UCITS Regulations 79(2) requirements. All purchases and sales of investments exceeding 1% of the total value of each transaction respectively, are disclosed, with a minimum number of 20 of each such transaction. A full analysis of the movement on the Investment Portfolio is available upon request from the registered office.
Major Purchases for the year ended 31 December 2021
Shares or Principal Amount
Cost (USD)
Microsoft Corp. 1,373 347,175Credit Agricole Corporate And Investment Bank, 0.0000%, due 10/8/21 300,000 300,000Credit Agricole Corporate And Investment Bank, 0.0000%, due 22/7/21 300,000 300,000Amazon.com, Inc. 76 256,160Apple, Inc. 1,770 236,477Alphabet, Inc. 'C' 83 206,453NVIDIA Corp. 259 146,427Apollo Asset Management, Inc. 2,343 145,293Procter & Gamble Co. (The) 1,021 138,274Mastercard, Inc. 'A' 369 135,333AstraZeneca plc 2,391 129,202Advanced Micro Devices, Inc. 1,168 128,416UnitedHealth Group, Inc. 337 127,241Howmet Aerospace, Inc. 3,855 125,804Visa, Inc. 'A' 541 123,262Teledyne Technologies, Inc. 288 116,019Meta Platforms, Inc. 'A' 343 111,745JPMorgan Chase & Co. 707 111,342Constellation Brands, Inc. 'A' 477 109,213OneMain Holdings, Inc. 1,850 108,908Adobe, Inc. 198 107,570Ferguson plc 761 107,321Marvell Technology, Inc. 1,779 102,768Credit Agricole Corporate And Investment Bank, 0.0000%, due 21/9/21 100,000 100,000Credit Agricole Corporate And Investment Bank, 0.0000%, due 22/9/21 100,000 100,000Credit Agricole Corporate And Investment Bank, 0.0000%, due 30/11/21 100,000 100,000Credit Agricole Corporate And Investment Bank, 0.0000%, due 30/6/21 100,000 100,000Credit Agricole Corporate And Investment Bank, 0.0000%, due 9/2/21 100,000 100,000Credit Industriel et Commercial, 0.0000%, due 2/7/21 100,000 100,000Credit Industriel et Commercial, 0.0000%, due 4/8/21 100,000 100,000Credit Industriel et Commercial, 0.0000%, due 8/7/21 100,000 100,000Credit Industriel et Commercial, 0.0000%, due 6/7/21 100,000 99,999Texas Instruments, Inc. 460 86,273
Major Sales for the year ended 31 December 2021
Shares or Principal Amount
Proceeds (USD)
Apple, Inc. 2,766 393,553Microsoft Corp. 1,228 362,866Alphabet, Inc. 'C' 123 332,802Amazon.com, Inc. 78 267,121Meta Platforms, Inc. 'A' 608 213,102Adobe, Inc. 276 174,566Microchip Technology, Inc. 1,091 162,086Texas Instruments, Inc. 755 142,723Merck & Co., Inc. 1,665 127,272JPMorgan Chase & Co. 801 126,181Blackstone, Inc. 1,153 124,820Procter & Gamble Co. (The) 873 122,079Air Products and Chemicals, Inc. 412 111,927Mastercard, Inc. 'A' 305 106,921Visa, Inc. 'A' 456 104,243VICI Properties, Inc. 3,619 103,465Constellation Brands, Inc. 'A' 438 95,630Deere & Co. 265 94,771L3Harris Technologies, Inc. 415 92,974Catalent, Inc. 710 90,398Abbott Laboratories 692 86,967Boston Scientific Corp. 1,900 83,458Bristol-Myers Squibb Co. 1,342 81,806Aon plc 'A' 300 78,789Booking Holdings, Inc. 34 77,699Morgan Stanley 763 76,691Netflix, Inc. 135 76,642Citigroup, Inc. 1,073 75,140
DocuSign Envelope ID: 521655BF-9BE3-47DC-A9A3-494932954338

Janus Henderson US Small-Mid Cap Value Fund (formerly US Strategic Value Fund)
Janus Henderson Capital Funds plc / 31 December 2021148
Fund Overview (unaudited)Investment Objective and Policy
The Fund aims to provide capital growth over the long term.
Performance target: To outperform the Russell 2500 Value Index* by 2.5% per annum, before the deduction of charges, over any 5 year period.
The Fund invests at least 80% of its assets in a concentrated portfolio of shares (also known as equities) of small and medium sized companies in any industry, in the United States. Companies will be incorporated, headquartered, listed on an exchange in, or deriving significant revenue from, the United States. The investment manager may use derivatives (complex financial instruments) to reduce risk, to manage the Fund more efficiently, or to generate additional capital or income for the Fund.
The Fund is actively managed with reference to the Russell 2500 Value Index, which is broadly representative of the companies in which it may invest, as this forms the basis of the Fund’s performance target. The investment manager has discretion to choose individual investments for the Fund with weightings different to the index or not in the index, but at times the Fund may hold investments similar to the index.
The Funds investment objective and policy, benchmark and name changed from Janus Henderson US Strategic Value Fund to Janus Henderson US Small-Mid Cap Fund on 30 September 2021.
How Sustainability Risks are part of the investment processThe investments underlying this financial product (referred to as the Fund) do not take into account the EU criteria for environmentally sustainable economic activities, although the Manager and the Investment Manager have agreed a decision making process that will apply to investment decisions relating to the Fund as further detailed in the Prospectus.
The likely impacts of sustainability risks on the returns of the FundWhile the analysis of (Environmental, Social and Governance) ESG factors is an integral component across the Investment Manager’s investment capabilities and one of a number of inputs to the selection of investments and portfolio construction, the investment process of the Investment Manager is primarily designed to maximise long-term risk-adjusted returns for investors. Therefore, in managing the Fund, the Investment Manager does not maximise portfolio alignment with sustainability risks as a separate goal in its own right nor does it precisely attribute the impact of ESG factors on returns for the Fund.
Fund Overview
Ted Thorne, portfolio manager
For the 12-months ended 31 December 2021, the Janus Henderson US Small-Mid Cap Value Fund Class H2 US dollar terms returned 21.1% (Net) and 22.21 % (Gross), compared with 23.99% and 27.09% Target (Gross) for its benchmark, the Russell 2500® Value Index. As of 30 September 2021, the US Strategic Value Portfolio strategy changed to US Small-Mid Cap Value, with a corresponding benchmark change to the Russell 2500® Value Index from the Russell 3000® Value Index.
The Fund underperformed the benchmark over the year, driven by negative stock selection in consumer staples, financials and industrials. Cash positioning and an underweight in energy also detracted. Positive stock selection in communication services, information technology and health care aided relative performance, along with an underweight in communication services and an overweight in materials.
At the individual stock level, BWX Technologies, a supplier of nuclear components and fuel for the defense industry, was among the top detractors from relative performance. Over the year it faced continued uncertainty regarding the outlook for government defense spending, and the stock declined as the company reported disappointing revenue and profits growth. Security software provider Check Point also weighed on relative returns after its shares dropped in May.
LabCorp, the leading global life sciences company, was among the largest individual contributors on a relative basis. The company outperformed due to continued strength in COVID-19 testing, non-COVID-19 laboratory work – particularly its expanded testing, treatment and clinical trial access for people with cancer – and activist involvement in the stock. Relative performance also benefited from our new position in Teradyne, a provider of testing equipment used in semiconductor and electronics manufacturing. The company’s stock rose after it reported third-quarter earnings and revenues that were better than expected.
As value investors looking for high-quality companies on sale, over the year we continued to take advantage of dislocations in the market and started new positions in several sectors including consumer discretionary, real estate, consumer staples, health care, industrials and energy. We also added to select existing positions within materials, financials, industrials, real estate, consumer staples and technology as the risks and rewards became relatively more favorable. Conversely, we trimmed back a real estate holding where the valuation expanded and the risk/reward profile became less attractive, and exited positions in health care, technology and consumer staples.
*The benchmark changed to Russell 2500 Value Index from Russell 3000 Value index on 30 September 2021.
DocuSign Envelope ID: 521655BF-9BE3-47DC-A9A3-494932954338

149Janus Henderson Capital Funds plc / 31 December 2021
Janus Henderson US Small-Mid Cap Value Fund (formerly US Strategic Value Fund) (continued)
Fund Overview (unaudited) (continued)
Over the year, absolute sector weights in the Fund increased in consumer discretionary, industrials, real estate, energy and materials, and decreased in consumer staples, financials, utilities, health care, technology and communication services.
Thank you for investing in Janus Henderson US Small-Mid Cap Value Fund.
January 2022
DocuSign Envelope ID: 521655BF-9BE3-47DC-A9A3-494932954338

Janus Henderson Capital Funds plc / 31 December 2021150
The accompanying notes are an integral part of the financial statements.
Janus Henderson US Small-Mid Cap Value Fund (continued)
s
Statement of Financial PositionAs of
31 December 2021
(USD)
As of 31 December
2020 (USD)
Assets:Financial assets at fair value through profit or loss . . . . . . . . . . . . . . . . . . . . . . . . . . . . . . . . . . . . . . . . . . . . . . . . . . . . . . . 212,549,484 125,821,794Cash and foreign currency . . . . . . . . . . . . . . . . . . . . . . . . . . . . . . . . . . . . . . . . . . . . . . . . . . . . . . . . . . . . . . . . . . . . . . . 953,122 5,962,074Receivables:
Spot foreign exchange contracts awaiting settlement . . . . . . . . . . . . . . . . . . . . . . . . . . . . . . . . . . . . . . . . . . . . . . . . . . . . 199 –Funds shares sold . . . . . . . . . . . . . . . . . . . . . . . . . . . . . . . . . . . . . . . . . . . . . . . . . . . . . . . . . . . . . . . . . . . . . . . . . . . 118,836 1,777,091Dividends . . . . . . . . . . . . . . . . . . . . . . . . . . . . . . . . . . . . . . . . . . . . . . . . . . . . . . . . . . . . . . . . . . . . . . . . . . . . . . . . . 175,825 119,672
Receivable from Investment Manager . . . . . . . . . . . . . . . . . . . . . . . . . . . . . . . . . . . . . . . . . . . . . . . . . . . . . . . . . . . . . . . . 28 47
Total Assets . . . . . . . . . . . . . . . . . . . . . . . . . . . . . . . . . . . . . . . . . . . . . . . . . . . . . . . . . . . . . . . . . . . . . . . . . 213,797,494 133,680,678 Liabilities (amounts falling due within one year)Payables:
Financial liabilities at fair value through profit or loss . . . . . . . . . . . . . . . . . . . . . . . . . . . . . . . . . . . . . . . . . . . . . . . . . . . . 12,086 5,748Investments purchased . . . . . . . . . . . . . . . . . . . . . . . . . . . . . . . . . . . . . . . . . . . . . . . . . . . . . . . . . . . . . . . . . . . . . . . . – 1,142,660Spot foreign exchange contracts awaiting payment . . . . . . . . . . . . . . . . . . . . . . . . . . . . . . . . . . . . . . . . . . . . . . . . . . . . . – 17Fund shares repurchased . . . . . . . . . . . . . . . . . . . . . . . . . . . . . . . . . . . . . . . . . . . . . . . . . . . . . . . . . . . . . . . . . . . . . . 320,992 194,784Investment Management fees . . . . . . . . . . . . . . . . . . . . . . . . . . . . . . . . . . . . . . . . . . . . . . . . . . . . . . . . . . . . . . . . . . . 174,259 104,474Shareholder Service fees . . . . . . . . . . . . . . . . . . . . . . . . . . . . . . . . . . . . . . . . . . . . . . . . . . . . . . . . . . . . . . . . . . . . . . 39,374 29,212Distribution fees . . . . . . . . . . . . . . . . . . . . . . . . . . . . . . . . . . . . . . . . . . . . . . . . . . . . . . . . . . . . . . . . . . . . . . . . . . . . . 982 937Accounting, Administration and Transfer Agent fees . . . . . . . . . . . . . . . . . . . . . . . . . . . . . . . . . . . . . . . . . . . . . . . . . . . . 36,564 16,797Management fees . . . . . . . . . . . . . . . . . . . . . . . . . . . . . . . . . . . . . . . . . . . . . . . . . . . . . . . . . . . . . . . . . . . . . . . . . . . 4,158 2,428Accrued expenses . . . . . . . . . . . . . . . . . . . . . . . . . . . . . . . . . . . . . . . . . . . . . . . . . . . . . . . . . . . . . . . . . . . . . . . . . . . 61,436 61,641
Total Liabilities (excluding Net Assets attributable to holders of redeemable ordinary shares) . . . . . . . . . . . . 649,851 1,558,698 Net Assets attributable to holders of redeemable ordinary participating shares . . . . . . . . . . . . . . . . . . . . . . 213,147,643 132,121,980
DocuSign Envelope ID: 521655BF-9BE3-47DC-A9A3-494932954338

151Janus Henderson Capital Funds plc / 31 December 2021
Janus Henderson US Small-Mid Cap Value Fund (continued)
The accompanying notes are an integral part of the financial statements.
Statement of Comprehensive IncomeYear ended
31 December 2021
(USD)
Year ended 31 December
2020 (USD)
Year ended Year endedRevenue:Interest income . . . . . . . . . . . . . . . . . . . . . . . . . . . . . . . . . . . . . . . . . . . . . . . . . . . . . . . . . . . . . . . . . . . . . . . . . . . . . . . 19,090 3,005Dividend income . . . . . . . . . . . . . . . . . . . . . . . . . . . . . . . . . . . . . . . . . . . . . . . . . . . . . . . . . . . . . . . . . . . . . . . . . . . . . . 3,860,890 2,505,186Other income . . . . . . . . . . . . . . . . . . . . . . . . . . . . . . . . . . . . . . . . . . . . . . . . . . . . . . . . . . . . . . . . . . . . . . . . . . . . . . . . 14,246 63,406
Net gain on financial assets and liabilities at fair value through profit or loss . . . . . . . . . . . . . . . . . . . . . . . . . . . . . . . . . . . . . . 31,518,069 4,567,721 Total Investments Income . . . . . . . . . . . . . . . . . . . . . . . . . . . . . . . . . . . . . . . . . . . . . . . . . . . . . . . . . . . . . . . 35,412,295 7,139,318
Expenses:Investment Management fees . . . . . . . . . . . . . . . . . . . . . . . . . . . . . . . . . . . . . . . . . . . . . . . . . . . . . . . . . . . . . . . . . . . . . 1,930,583 1,065,764Shareholder Service fees . . . . . . . . . . . . . . . . . . . . . . . . . . . . . . . . . . . . . . . . . . . . . . . . . . . . . . . . . . . . . . . . . . . . . . . . 496,800 312,805Distribution fees . . . . . . . . . . . . . . . . . . . . . . . . . . . . . . . . . . . . . . . . . . . . . . . . . . . . . . . . . . . . . . . . . . . . . . . . . . . . . . 12,314 10,625Management fees . . . . . . . . . . . . . . . . . . . . . . . . . . . . . . . . . . . . . . . . . . . . . . . . . . . . . . . . . . . . . . . . . . . . . . . . . . . . . 47,501 13,262Accounting, Administration and Transfer Agent fees . . . . . . . . . . . . . . . . . . . . . . . . . . . . . . . . . . . . . . . . . . . . . . . . . . . . . . 126,351 78,701Custodian fees . . . . . . . . . . . . . . . . . . . . . . . . . . . . . . . . . . . . . . . . . . . . . . . . . . . . . . . . . . . . . . . . . . . . . . . . . . . . . . . 29,700 27,360Audit fees . . . . . . . . . . . . . . . . . . . . . . . . . . . . . . . . . . . . . . . . . . . . . . . . . . . . . . . . . . . . . . . . . . . . . . . . . . . . . . . . . . 22,773 29,696Printing expenses . . . . . . . . . . . . . . . . . . . . . . . . . . . . . . . . . . . . . . . . . . . . . . . . . . . . . . . . . . . . . . . . . . . . . . . . . . . . . 2,564 705Legal and other professional fees . . . . . . . . . . . . . . . . . . . . . . . . . . . . . . . . . . . . . . . . . . . . . . . . . . . . . . . . . . . . . . . . . . 37,305 47,164Other fees . . . . . . . . . . . . . . . . . . . . . . . . . . . . . . . . . . . . . . . . . . . . . . . . . . . . . . . . . . . . . . . . . . . . . . . . . . . . . . . . . . 32,779 8,140
Total Expenses . . . . . . . . . . . . . . . . . . . . . . . . . . . . . . . . . . . . . . . . . . . . . . . . . . . . . . . . . . . . . . . . . . . . . . . 2,738,670 1,594,222Less Expense Reimbursement . . . . . . . . . . . . . . . . . . . . . . . . . . . . . . . . . . . . . . . . . . . . . . . . . . . . . . . . . . . – (48)Net Expenses after Expense Reimbursement . . . . . . . . . . . . . . . . . . . . . . . . . . . . . . . . . . . . . . . . . . . . . . . . 2,738,670 1,594,174Net Operating Profit . . . . . . . . . . . . . . . . . . . . . . . . . . . . . . . . . . . . . . . . . . . . . . . . . . . . . . . . . . . . . . . . . . . 32,673,625 5,545,144
Finance Costs: – 1,267
Total distributions to holders of redeemable ordinary shares. . . . . . . . . . . . . . . . . . . . . . . . . . . . . . . . . . . . . . . . . . . . . . . . . – (1,267) Withholding tax on dividends and other investment income . . . . . . . . . . . . . . . . . . . . . . . . . . . . . . . . . . . . . (1,114,763) (706,029)
Net Increase in Net Assets attributable to holders of redeemable ordinary shares resulting from operations . 31,558,862 4,837,848
. .
. .. . .
Statement of Changes in Net Assets Attributable to Redeemable Ordinary ShareholdersYear ended
31 December 2021
(USD)
Year ended 31 December
2020 (USD)
Increase in Net Assets attributable to holders of redeemable ordinary shares resulting from operations . . . . . . . . . . . . . . . . . . . . 31,558,862 4,837,848
Capital Share Transactions of redeemable ordinary shares:Proceeds from redeemable ordinary shares sold . . . . . . . . . . . . . . . . . . . . . . . . . . . . . . . . . . . . . . . . . . . . . . . . . . . . . . . 108,770,715 32,014,677Redemption of redeemable ordinary shares . . . . . . . . . . . . . . . . . . . . . . . . . . . . . . . . . . . . . . . . . . . . . . . . . . . . . . . . . . (59,315,888) (25,615,286)Dilution Adjustment. . . . . . . . . . . . . . . . . . . . . . . . . . . . . . . . . . . . . . . . . . . . . . . . . . . . . . . . . . . . . . . . . . . . . . . . . . . 11,974 2,319
Net Increase from Capital Share Transactions of redeemable ordinary shares . . . . . . . . . . . . . . . . . . . . . . . . 49,466,801 6,401,710
Net Increase in Net Assets attributable to holders of redeemable ordinary shares . . . . . . . . . . . . . . . . . . . . . . . . . . . . . . . . . . . 81,025,663 11,239,558Net Assets attributable to holders of redeemable ordinary shares at the beginning of the financial year . . . . . . . . . . . . . . . . . . . . 132,121,980 120,882,422
Net Assets attributable to holders of redeemable ordinary shares at the end of the financial year . . . . . . . . . 213,147,643 132,121,980
Gains and losses are solely from continuing operations except for the Funds which ceased operations during the financial year ended 31 December 2021 and 31 December 2020. There were no gains and losses other than those dealt with in the Statement of Comprehensive Income. Please refer to note 1 which details the Fund closures during the year.
DocuSign Envelope ID: 521655BF-9BE3-47DC-A9A3-494932954338

Janus Henderson Capital Funds plc / 31 December 2021152
Janus Henderson US Small-Mid Cap Value Fund (continued)
Portfolio Investments
The accompanying notes are an integral part of the financial statements.
Shares or Principal Amount
Percentage of Net Assets
(%)Fair Value
(USD)
Financial Assets at fair value through profit or lossCommon Stock (2020: 95.01% USD 125,520,653)CanadaBuilding Products
27,638 Masonite International Corp. 1.53 3,259,902
United StatesAerospace & Defense
77,783 BWX Technologies, Inc. 1.75 3,724,250
Auto Components31,373 Autoliv, Inc. 1.52 3,244,282
24,096 Lear Corp. 2.07 4,408,3633.59 7,652,645
Banks117,995 Ameris Bancorp 2.75 5,861,992187,098 Associated Banc-Corp. 1.98 4,226,544354,725 First Horizon Corp. 2.72 5,792,659200,090 Great Western Bancorp, Inc. 3.19 6,795,056
10.64 22,676,251
Biotechnology264,599 Exelixis, Inc. 2.27 4,836,870
Building Products17,071 Carlisle Cos., Inc. 1.99 4,235,656
Chemicals50,881 FMC Corp. 2.62 5,591,31349,842 Innospec, Inc. 2.11 4,502,726
4.73 10,094,039
Commercial Services & Supplies107,306 IAA, Inc. 2.55 5,431,830
Communications Equipment19,751 F5, Inc. 2.27 4,833,267
Construction & Engineering23,854 EMCOR Group, Inc. 1.43 3,038,761
Construction Materials31,780 Eagle Materials, Inc. 2.48 5,290,099
Containers & Packaging223,734 Graphic Packaging Holding Co. 2.05 4,362,813
Electrical Equipment242,995 GrafTech International Ltd. 1.35 2,874,631180,946 Thermon Group Holdings, Inc. 1.44 3,063,416
2.79 5,938,047
Electronic Equipment, Instruments & Components28,230 Insight Enterprises, Inc. 1.41 3,009,318121,889 Vontier Corp. 1.76 3,745,649
3.17 6,754,967
Equity Real Estate Investment Trusts (REITs)126,206 Americold Realty Trust 1.94 4,138,295285,536 Apple Hospitality REIT, Inc. 2.16 4,611,406
61,466 Equity LifeStyle Properties, Inc. 2.53 5,388,11025,780 Lamar Advertising Co., A 1.47 3,127,11498,071 PotlatchDeltic Corp. 2.77 5,905,836
10.87 23,170,761
Food & Staples Retailing28,131 Casey's General Stores, Inc. 2.60 5,551,653
Health Care Equipment & Supplies117,954 Envista Holdings Corp. 2.49 5,315,007
Shares or Principal Amount
Percentage of Net Assets
(%)Fair Value
(USD)
62,008 Globus Medical, Inc., A 2.10 4,476,978
4.59 9,791,985
Health Care Providers & Services74,942 Cardinal Health, Inc. 1.81 3,858,76452,209 Henry Schein, Inc. 1.90 4,047,764
3.71 7,906,528
Insurance71,121 Hartford Financial Services Group,
Inc. (The) 2.30 4,910,194
Internet & Direct Marketing Retail447,227 Qurate Retail, Inc. 1.59 3,398,925
Machinery19,913 Lincoln Electric Holdings, Inc. 1.30 2,777,26637,253 Oshkosh Corp. 1.97 4,198,786
3.27 6,976,052
Metals & Mining155,664 Commercial Metals Co. 2.65 5,649,047
Oil, Gas & Consumable Fuels28,851 Denbury, Inc. 1.04 2,209,698231,017 Magnolia Oil & Gas Corp., A 2.05 4,359,291
3.09 6,568,989
Pharmaceuticals0 Viatris, Inc. 0.00 4
Semiconductors & Semiconductor Equipment32,755 MKS Instruments, Inc. 2.68 5,704,93831,388 Teradyne, Inc. 2.41 5,132,880
5.09 10,837,818
Software56,450 Black Knight, Inc. 2.20 4,679,140
Specialty Retail134,122 Torrid Holdings, Inc. 0.62 1,325,125
Textiles, Apparel & Luxury Goods272,455 Hanesbrands, Inc. 2.14 4,555,448
Thrifts & Mortgage Finance87,269 WSFS Financial Corp. 2.05 4,373,922
Trading Companies & Distributors119,493 H&E Equipment Services, Inc. 2.48 5,289,95535,024 MSC Industrial Direct Co., Inc., A 1.38 2,944,117
3.86 8,234,072
Virgin Islands, BritishFood Products
299,574 Nomad Foods Ltd. 3.57 7,606,184
Total Common Stock 97.44 207,665,244
Government Obligations (2020: 0.00% USD –)US Treasury Notes/Bonds
4,700,000 0.0000%, due 4/1/22 2.20 4,700,005
Total Government Obligations 2.20 4,700,005
Total Investments (Cost: USD 198,739,106) 99.64 212,365,249
DocuSign Envelope ID: 521655BF-9BE3-47DC-A9A3-494932954338

153Janus Henderson Capital Funds plc / 31 December 2021
The accompanying notes are an integral part of the financial statements.
Janus Henderson US Small-Mid Cap Value Fund (continued)
Portfolio Investments
Shares or Principal Amount
Percentage of Net Assets
(%)Fair Value
(USD)
Forward Currency Contracts (2020: 0.23% USD 301,141)Open as at 31 December 2021.
Current Market
Percentage of Net Unrealised
Currency Currency Value Settle Assets GainPurchased Sold (USD) Date (%) (USD)
.J.P. Morgan EUR◊ 11,460,083 USD 12,870,346 13,054,581 31-Jan-22 0.07 184,235
Total 0.07 184,235
.
Total Financial Assets at fair value through profit or loss 99.71 212,549,484
Financial Liabilities at fair value through profit or loss.Forward Currency Contracts (2020: (0.01)% USD (5,748))Open as at 31 December 2021
Current Market
Percentage of Net Unrealised
Currency Currency Value Settle Assets LossPurchased Sold (USD) Date (%) (USD)
J.P. Morgan USD◊ 1,577,910 EUR 1,395,791 1,589,996 31-Jan-22 0.00 (12,086)
Total 0.00 (12,086).
Total Financial Liabilities at fair value through profit or loss 0.00 (12,086)
Portfolio Analysis (Unaudited)
Analysis of Total Assets:% of Total
AssetsTransferable securities admitted to official stock exchange listing 97.13Transferable securities dealt in on another regulated market 2.20OTC financial derivative instruments 0.09Other Assets 0.58Total Assets 100.00
◊ These forward currency contracts are used for share class hedging.
DocuSign Envelope ID: 521655BF-9BE3-47DC-A9A3-494932954338

Janus Henderson Capital Funds plc / 31 December 2021154
The accompanying notes are an integral part of the financial statements.
Janus Henderson US Small-Mid Cap Value Fund (continued)
Fair Value Hierarchy
The tables below provide the fair value hierarchy summary of the Fund’s financial assets and liabilities measured at fair value at 31 December 2021 and 31 December 2020.
31 December 2021
Level 1 - Quoted Prices
(USD)
Level 2 - Other Significant
Observable Inputs (USD)
Level 3 - Significant
Unobservable Inputs (USD)
Total (USD)
Common Stock 207,665,244 – – 207,665,244Forward Currency Contracts – 172,149 – 172,149Government Obligations – 4,700,005 – 4,700,005Total Investments in Securities 207,665,244 4,872,154 – 212,537,398
31 December 2020
Level 1 - Quoted Prices
(USD)
Level 2 - Other Significant
Observable Inputs (USD)
Level 3 - Significant
Unobservable Inputs (USD)
Total (USD)
Common Stock 125,520,653 – – 125,520,653Forward Currency Contracts – 295,393 – 295,393Total Investments in Securities 125,520,653 295,393 – 125,816,046
There were no investments held by the Fund at 31 December 2021 and 31 December 2020 that were fair valued at level 3 by the Janus Henderson Global Pricing Committee.
Valuation policy of private placements is referenced in note 2 of the financial statements.
Capital Share Transactions
For the financial year ended 31 December 2021
A1 USD A2 HEUR A2 USD B2 USD E2 HEUR E2 USD H2 HEUR H2 USDShares Shares Shares Shares Shares Shares Shares Shares
At beginning of the year . . . . . . . 45,781 351,370 1,096,164 46,550 20,904 63,484 309 300Shares issued 90,695 56,861 699,534 – 7,178 115,070 – –Shares redeemed. . . . . . . . . . . (16,033) (83,666) (685,391) (4,305) (12,855) (23,546) – –At end of year . . . . . . . . . . . . . 120,443 324,565 1,110,307 42,245 15,227 155,008 309 300
I1 USD I2 HEUR I2 USDShares Shares Shares
At beginning of the year . . . . . . . 3,000 23,609 2,374,097Shares issued – 8,042 1,978,655Shares redeemed. . . . . . . . . . . (3,000) (6,674) (767,803)At end of year . . . . . . . . . . . . . – 24,977 3,584,949
DocuSign Envelope ID: 521655BF-9BE3-47DC-A9A3-494932954338

155Janus Henderson Capital Funds plc / 31 December 2021
Janus Henderson US Small-Mid Cap Value Fund (continued)
The accompanying notes are an integral part of the financial statements.
For the financial year ended 31 December 2020
. .A1 USD A2 HEUR A2 USD B2 USD Class I$dis E2 HEUR E2 USD H2 HEURShares Shares Shares Shares Shares Shares Shares Shares
At beginning of the year . . . . . . . 53,054 447,302 1,114,695 49,357 2,408 14,046 300 3,270Shares issued 17,058 30,281 306,886 835 –- 6,858 65,420 –Shares redeemed. . . . . . . . . . . (24,331) (126,213) (325,417) (3,642) (2,408) – (2,236) (2,961)At end of year . . . . . . . . . . . . . 45,781 351,370 1,096,164 46,550 – 20,904 63,484 309
H2 USD I1 USD I2 HEUR I2 USDShares Shares Shares Shares
At beginning of the year . . . . . . . 4,032 – 41,369 2,108,187Shares issued – 3,000 1,593 684,288Shares redeemed. . . . . . . . . . . (3,732) – (19,353) (418,378)At end of year . . . . . . . . . . . . . 300 3,000 23,609 2,374,097
Net Asset Comparison
31 December 2021 31 December 2020 31 December 2019
Net Assets (USD)
NAV Per Share
(Local Currency)Net Assets
(USD)
NAV Per Share
(Local Currency)Net Assets
(USD)
NAV Per Share
(Local Currency)
A1 USD 3,013,814 25.02 955,615 20.87 1,078,962 20.34A2 HEUR 10,387,934 28.11 10,176,005 23.71 11,807,206 23.53A2 USD 40,454,282 36.44 33,316,793 30.39 32,962,423 29.57B2 USD 1,204,498 28.51 1,123,934 24.14 1,177,088 23.85Class I$dis – – 38,094 12.70 53,276 22.12E2 HEUR 343,353 19.81 430,718 16.87 266,418 16.91E2 USD 2,482,082 16.01 856,860 13.50 3,979 13.26H2 HEUR 6,471 18.39 5,795 15.35 55,342 15.09H2 USD 6,354 21.18 5,247 17.49 67,933 16.85I1 USD – – 38,094 12.70 – –I2 HEUR 654,108 23.00 554,597 19.23 878,381 18.93I2 USD 154,594,747 43.12 84,658,322 35.66 72,531,414 34.40
. . .
Total Expense Ratio (unaudited)
The Average Total Expense Ratio table shows the actual expenses, excluding transactions costs and trade commissions, incurred by each Class for the Fund during the reporting financial year expressed as a percentage of the average net assets for the corresponding year, on an annualised basis.
31 December 2021 31 December 2020 31 December 2019A1 USD 1.90% 1.93% 1.92%A2 HEUR 1.92% 1.93% 1.92%A2 USD 1.92% 1.94% 1.92%B2 USD 3.42% 3.43% 3.42%E2 HEUR 2.90% 2.98% 2.92%E2 USD 2.90% 2.96% 2.93%H2 HEUR 0.88% 0.96% 0.99%H2 USD 0.90% 0.95% 1.00%I1 USD 1.04% 1.04% 1.19%I2 HEUR 1.05% 1.11% 1.17%I2 USD 1.05% 1.12% 1.12%
DocuSign Envelope ID: 521655BF-9BE3-47DC-A9A3-494932954338

Janus Henderson Capital Funds plc / 31 December 2021156
Janus Henderson US Small-Mid Cap Value Fund (continued)
The accompanying notes are an integral part of the financial statements.
Fund Performance (unaudited)
As at 31 December 2021
One year Three years Five yearsSince
inception
Performance (Annualised) 31/12/2020 31/12/2021
%
31/12/2017 31/12/2021
%
31/12/2015 31/12/2021
%
to 31/12/2021
%
H2 USD (Net)* 21.1 15.80** 9.62** 6.32**Russell 2500 Value TR 23.99 17.21 10.76 7.93
Five years 31/12/2015 31/12/2021
%H2 USD (Gross)* 11.78Russell 2500 Value TR + 2.50% 13.53
.
Discrete performance
31/12/2020 31/12/2021
%
31/12/2019 31/12/2020
%
31/12/2018 31/12/2019
%
31/12/2017 31/12/2018
%
31/12/2016 31/12/2017
%
H2 USD (Net)* 21.1 2.77** 26.04** (9.25)** 12.29**Russell 2500 Value TR 23.99 2.87 26.26 (8.58) 13.19
H2 USD (Gross)* 22.21 4.75** 28.46** (7.45)** 14.54**Russell 2500 Value TR + 2.50% 27.09 5.45 29.41 (6.28) 16.01
. . . . .
Class H2 USD is disclosed as it is the representative share class.
* The representative share class has changed from the A2 USD to the H2 USD share class with effect from August 2021.
** Historical figures are based on the A2 USD share class.
Performance target: To outperform the Russell 2500 Value Index by 2.5% per annum, before the deduction of charges, over any 5 year period.
Please note the Gross Returns 5 year annualised table is only applicable for share classes which have been active for 5 or more years and the performance target is to be achieved over a specific annualised time period. Performance target and index shown in USD.
Past performance does not guarantee future returns. The rates of return will vary and the principal value of an investment will fluctuate. Shares, if redeemed, may be worth more or less than their original cost. The performance data does not take account of the commissions and costs incurred on the issue and redemption of Shares. All returns are calculated in the base currency of the representative Share Class.
There is no guarantee that the Fund’s performance will match or exceed the benchmark.
DocuSign Envelope ID: 521655BF-9BE3-47DC-A9A3-494932954338

157Janus Henderson Capital Funds plc / 31 December 2021
Janus Henderson US Small-Mid Cap Value Fund (continued)
Statements of Changes in Composition of Portfolio (unaudited)The tables below show a breakdown of material purchases and sales of the Investment Portfolio in accordance with Central Bank UCITS Regulations 79(2) requirements. All purchases and sales of investments exceeding 1% of the total value of each transaction respectively, are disclosed, with a minimum number of 20 of each such transaction. A full analysis of the movement on the Investment Portfolio is available upon request from the registered office.
Major Purchases for the year ended 31 December 2021
Shares or Principal Amount
Cost (USD)
Credit Agricole Corporate And Investment Bank, 0.0000%, due 24/2/21 8,600,000 8,599,986Credit Agricole Corporate And Investment Bank, 0.0000%, due 6/10/21 8,300,000 8,299,986Nomad Foods Ltd. 299,574 8,266,808Credit Agricole Corporate And Investment Bank, 0.0000%, due 5/10/21 8,200,000 8,199,986Credit Agricole Corporate And Investment Bank, 0.0000%, due 7/10/21 8,000,000 7,999,987Credit Agricole Corporate And Investment Bank, 0.0000%, due 24/11/21 7,400,000 7,399,990Credit Agricole Corporate And Investment Bank, 0.0000%, due 8/10/21 7,400,000 7,399,988Credit Agricole Corporate And Investment Bank, 0.0000%, due 20/12/21 7,400,000 7,399,969Credit Agricole Corporate And Investment Bank, 0.0000%, due 16/12/21 7,300,000 7,299,990Credit Agricole Corporate And Investment Bank, 0.0000%, due 12/10/21 7,300,000 7,299,951Credit Agricole Corporate And Investment Bank, 0.0000%, due 23/11/21 7,200,000 7,199,990IAA, Inc. 129,300 7,116,578Credit Agricole Corporate And Investment Bank, 0.0000%, due 26/11/21 6,900,000 6,899,981Credit Agricole Corporate And Investment Bank, 0.0000%, due 25/3/21 6,800,000 6,799,991Credit Agricole Corporate And Investment Bank, 0.0000%, due 17/12/21 6,700,000 6,699,991Ameris Bancorp 126,371 6,646,994Credit Agricole Corporate And Investment Bank, 0.0000%, due 26/4/21 6,600,000 6,599,978Great Western Bancorp, Inc. 200,090 6,548,633Credit Agricole Corporate And Investment Bank, 0.0000%, due 14/4/21 6,500,000 6,499,991Credit Agricole Corporate And Investment Bank, 0.0000%, due 29/11/21 6,500,000 6,499,973
Major Sales for the year ended 31 December 2021
Shares or Principal Amount
Proceeds (USD)
Laboratory Corp of America Holdings 31,457 8,999,528Berkshire Hathaway, Inc. 'B' 24,694 6,840,506Alphabet, Inc. 'A' 2,414 6,549,646CMC Materials, Inc. 37,019 6,460,474Oracle Corp. 64,582 5,780,273Citigroup, Inc. 80,804 5,771,622Marathon Petroleum Corp. 86,416 5,572,560Regions Financial Corp. 254,110 5,487,336Mercury Systems, Inc. 100,150 5,183,053Analog Devices, Inc. 29,023 4,981,659UniFirst Corp. 21,988 4,822,051Atlantic Union Bankshares Corp. 131,246 4,784,497Check Point Software Technologies Ltd. 41,233 4,752,995Colgate-Palmolive Co. 58,840 4,478,794Citizens Financial Group, Inc. 92,715 4,388,885Electronic Arts, Inc. 31,962 4,351,916American Woodmark Corp. 62,320 4,248,083Emergent BioSolutions, Inc. 100,831 4,198,519Brigham Minerals, Inc. 207,011 4,054,611Comcast Corp. 'A' 71,542 3,990,434Cerner Corp. 54,823 3,909,178Johnson & Johnson 23,992 3,908,518Discover Financial Services 29,922 3,820,922Charles Schwab Corp. (The) 50,495 3,812,782Equity Commonwealth 143,402 3,733,144Chubb Ltd. 20,768 3,648,326CDK Global, Inc. 88,605 3,597,456PepsiCo, Inc. 22,788 3,476,300WNS Holdings Ltd. 39,748 3,364,484W R Grace & Co. 48,351 3,353,567Quidel Corp. 25,571 3,148,720Cracker Barrel Old Country Store, Inc. 22,749 3,057,726Donaldson Co., Inc. 51,541 3,051,041Alliant Energy Corp. 53,993 3,050,373Cisco Systems, Inc. 53,980 3,020,028Diodes, Inc. 30,976 2,978,526Lamb Weston Holdings, Inc. 46,158 2,852,038Vulcan Materials Co. 15,896 2,773,671Evergy, Inc. 46,116 2,701,110Sunstone Hotel Investors, Inc. 216,835 2,641,955Columbia Sportswear Co. 25,424 2,605,444Enterprise Financial Services Corp. 55,680 2,546,443
DocuSign Envelope ID: 521655BF-9BE3-47DC-A9A3-494932954338

Janus Henderson US Venture Fund
Janus Henderson Capital Funds plc / 31 December 2021158
Fund Overview (unaudited)Investment Objective and Policy
The Fund aims to provide capital growth over the long term.
Performance target: To outperform the Russell 2000 Growth Index by 2% per annum, before the deduction of charges, over any 5 year period.
The Fund invests at least 80% of its assets in a concentrated portfolio of shares (also known as equities) of companies, in any industry, in the United States. Companies will be incorporated, headquartered, listed on an exchange in, or deriving significant revenue from, the United States. The Fund will invest at least 50% in smaller US companies.
The Fund is actively managed with reference to the Russell 2000 Growth Index, which is broadly representative of the companies in which it may invest, as this forms the basis of the Fund’s performance target. The investment manager has discretion to choose individual investments for the Fund with weightings different to the index or not in the index, but at times the Fund may hold investments similar to the index.
How Sustainability Risks are part of the investment processThe investments underlying this financial product (referred to as the Fund) do not take into account the EU criteria for environmentally sustainable economic activities, although the Manager and the Investment Manager have agreed a decision making process that will apply to investment decisions relating to the Fund as further detailed in the Prospectus.
The likely impacts of sustainability risks on the returns of the FundWhile the analysis of (Environmental, Social and Governance) ESG factors is an integral component across the Investment Manager’s investment capabilities and one of a number of inputs to the selection of investments and portfolio construction, the investment process of the Investment Manager is primarily designed to maximise long-term risk-adjusted returns for investors. Therefore, in managing the Fund, the Investment Manager does not maximise portfolio alignment with sustainability risks as a separate goal in its own right nor does it precisely attribute the impact of ESG factors on returns for the Fund.
Fund Overview
Jonathan Coleman and Scott Stutzman, portfolio managers
For the 12-months ended 31 December 2021, the Janus Henderson US Venture Fund Class H2 US dollar terms returned 5.78% (Net) and 6.79% (Gross), compared with 2.83% and 4.89% Target (Gross) for its benchmark, the Russell 2000® Growth Index. Stock selection in health care and materials contributed to relative performance. Stock
selection in the consumer discretionary and consumer staples sectors detracted.
We were encouraged to see a number of our moderate-growth companies rewarded during the year. These included ON Semiconductor, a leading global supplier of advanced semiconductors. The company has benefited from strong demand and pricing trends supporting high-growth areas such as electric vehicles and automation. It also streamlined its cost structure under the guidance of a disciplined new management team.
Valvoline was another standout contributor. In addition to selling automotive oil products, the company also owns a customer service-driven quick oil change business. While this segment of the business has delivered several years of double-digit sales growth, it has remained underpenetrated in much of the US. Valvoline has announced plans to expand its network of oil change locations.
QuantumScape was a notable detractor. It is developing a next-generation, solid-state battery that could potentially allow electric vehicles to charge faster and travel farther. We invested in the company in 2020, and the stock initially rose on investor excitement over this potential game-changing technology. Following this run-up, we significantly reduced our position in light of the high stock valuation and the long time frame to commercialization. Unfortunately, our small position was affected by a pullback in the stock price, as excitement over this large potential opportunity was tempered by the reality of the manufacturing hurdles the company will need to overcome.
LivePerson, another detractor, provides a software as a service platform that helps retailers and brands interact in real time with customers. It has continued to gain market share, as its artificial intelligence-supported online chat function has demonstrated effectiveness is driving sales and customer satisfaction. Despite strong revenue growth, the company reported third-quarter earnings growth that was slightly below expectations. The market had little patience for even modest earnings shortfalls, and the stock declined in the fourth quarter.
Thank you for investing in Janus Henderson US Venture Fund.
January 2022
DocuSign Envelope ID: 521655BF-9BE3-47DC-A9A3-494932954338

159Janus Henderson Capital Funds plc / 31 December 2021
The accompanying notes are an integral part of the financial statements.
Janus Henderson US Venture Fund (continued)
s
Statement of Financial PositionAs of
31 December 2021
(USD)
As of 31 December
2020 (USD)
Assets:Financial assets at fair value through profit or loss . . . . . . . . . . . . . . . . . . . . . . . . . . . . . . . . . . . . . . . . . . . . . . . . . . . . . . . 258,782,571 250,598,705Cash and foreign currency . . . . . . . . . . . . . . . . . . . . . . . . . . . . . . . . . . . . . . . . . . . . . . . . . . . . . . . . . . . . . . . . . . . . . . . 3,417,661 17,345,595Receivables:
Investments sold . . . . . . . . . . . . . . . . . . . . . . . . . . . . . . . . . . . . . . . . . . . . . . . . . . . . . . . . . . . . . . . . . . . . . . . . . . . . – 18,916Spot foreign exchange contracts awaiting settlement . . . . . . . . . . . . . . . . . . . . . . . . . . . . . . . . . . . . . . . . . . . . . . . . . . . . 449 291Funds shares sold . . . . . . . . . . . . . . . . . . . . . . . . . . . . . . . . . . . . . . . . . . . . . . . . . . . . . . . . . . . . . . . . . . . . . . . . . . . 95,913 2,779,453Dividends . . . . . . . . . . . . . . . . . . . . . . . . . . . . . . . . . . . . . . . . . . . . . . . . . . . . . . . . . . . . . . . . . . . . . . . . . . . . . . . . . 31,066 21,524
Other debtors . . . . . . . . . . . . . . . . . . . . . . . . . . . . . . . . . . . . . . . . . . . . . . . . . . . . . . . . . . . . . . . . . . . . . . . . . . . . . . . . 10,600 18,977
Total Assets . . . . . . . . . . . . . . . . . . . . . . . . . . . . . . . . . . . . . . . . . . . . . . . . . . . . . . . . . . . . . . . . . . . . . . . . . 262,338,260 270,783,461 Liabilities (amounts falling due within one year)Payables:
Financial liabilities at fair value through profit or loss . . . . . . . . . . . . . . . . . . . . . . . . . . . . . . . . . . . . . . . . . . . . . . . . . . . . 92,425 84,938Bank overdraft and foreign currency . . . . . . . . . . . . . . . . . . . . . . . . . . . . . . . . . . . . . . . . . . . . . . . . . . . . . . . . . . . . . . . 1 1Investments purchased . . . . . . . . . . . . . . . . . . . . . . . . . . . . . . . . . . . . . . . . . . . . . . . . . . . . . . . . . . . . . . . . . . . . . . . . 1,709,913 –Fund shares repurchased . . . . . . . . . . . . . . . . . . . . . . . . . . . . . . . . . . . . . . . . . . . . . . . . . . . . . . . . . . . . . . . . . . . . . . 2,147,899 3,852,404Investment Management fees . . . . . . . . . . . . . . . . . . . . . . . . . . . . . . . . . . . . . . . . . . . . . . . . . . . . . . . . . . . . . . . . . . . 269,220 277,298Shareholder Service fees . . . . . . . . . . . . . . . . . . . . . . . . . . . . . . . . . . . . . . . . . . . . . . . . . . . . . . . . . . . . . . . . . . . . . . 57,281 54,792Distribution fees . . . . . . . . . . . . . . . . . . . . . . . . . . . . . . . . . . . . . . . . . . . . . . . . . . . . . . . . . . . . . . . . . . . . . . . . . . . . . 1,508 1,571Accounting, Administration and Transfer Agent fees . . . . . . . . . . . . . . . . . . . . . . . . . . . . . . . . . . . . . . . . . . . . . . . . . . . . 46,598 25,772Management fees . . . . . . . . . . . . . . . . . . . . . . . . . . . . . . . . . . . . . . . . . . . . . . . . . . . . . . . . . . . . . . . . . . . . . . . . . . . 5,325 5,013Accrued expenses . . . . . . . . . . . . . . . . . . . . . . . . . . . . . . . . . . . . . . . . . . . . . . . . . . . . . . . . . . . . . . . . . . . . . . . . . . . 84,776 70,464
Total Liabilities (excluding Net Assets attributable to holders of redeemable ordinary shares) . . . . . . . . . . . . 4,414,946 4,372,253 Net Assets attributable to holders of redeemable ordinary participating shares . . . . . . . . . . . . . . . . . . . . . . 257,923,314 266,411,208
.
DocuSign Envelope ID: 521655BF-9BE3-47DC-A9A3-494932954338

Janus Henderson Capital Funds plc / 31 December 2021160
Janus Henderson US Venture Fund (continued)
The accompanying notes are an integral part of the financial statements.
Statement of Comprehensive IncomeYear ended
31 December 2021
(USD)
Year ended 31 December
2020 (USD)
Year ended Year endedRevenue:Interest income . . . . . . . . . . . . . . . . . . . . . . . . . . . . . . . . . . . . . . . . . . . . . . . . . . . . . . . . . . . . . . . . . . . . . . . . . . . . . . . 22,276 6,960Dividend income . . . . . . . . . . . . . . . . . . . . . . . . . . . . . . . . . . . . . . . . . . . . . . . . . . . . . . . . . . . . . . . . . . . . . . . . . . . . . . 821,371 697,113Other income . . . . . . . . . . . . . . . . . . . . . . . . . . . . . . . . . . . . . . . . . . . . . . . . . . . . . . . . . . . . . . . . . . . . . . . . . . . . . . . . 74,817 –
Net gain on financial assets and liabilities at fair value through profit or loss . . . . . . . . . . . . . . . . . . . . . . . . . . . . . . . . . . . . . . 12,931,008 64,973,875 Total Investments Income . . . . . . . . . . . . . . . . . . . . . . . . . . . . . . . . . . . . . . . . . . . . . . . . . . . . . . . . . . . . . . . 13,849,472 65,677,948
Expenses:Investment Management fees . . . . . . . . . . . . . . . . . . . . . . . . . . . . . . . . . . . . . . . . . . . . . . . . . . . . . . . . . . . . . . . . . . . . . 3,549,617 2,314,911Shareholder Service fees . . . . . . . . . . . . . . . . . . . . . . . . . . . . . . . . . . . . . . . . . . . . . . . . . . . . . . . . . . . . . . . . . . . . . . . . 756,918 456,680Distribution fees . . . . . . . . . . . . . . . . . . . . . . . . . . . . . . . . . . . . . . . . . . . . . . . . . . . . . . . . . . . . . . . . . . . . . . . . . . . . . . 18,593 15,268Management fees . . . . . . . . . . . . . . . . . . . . . . . . . . . . . . . . . . . . . . . . . . . . . . . . . . . . . . . . . . . . . . . . . . . . . . . . . . . . . 66,964 24,814Accounting, Administration and Transfer Agent fees . . . . . . . . . . . . . . . . . . . . . . . . . . . . . . . . . . . . . . . . . . . . . . . . . . . . . . 170,679 125,869Custodian fees . . . . . . . . . . . . . . . . . . . . . . . . . . . . . . . . . . . . . . . . . . . . . . . . . . . . . . . . . . . . . . . . . . . . . . . . . . . . . . . 63,580 46,710Audit fees . . . . . . . . . . . . . . . . . . . . . . . . . . . . . . . . . . . . . . . . . . . . . . . . . . . . . . . . . . . . . . . . . . . . . . . . . . . . . . . . . . 18,765 24,180Printing expenses . . . . . . . . . . . . . . . . . . . . . . . . . . . . . . . . . . . . . . . . . . . . . . . . . . . . . . . . . . . . . . . . . . . . . . . . . . . . . 4,188 (1,144)Legal and other professional fees . . . . . . . . . . . . . . . . . . . . . . . . . . . . . . . . . . . . . . . . . . . . . . . . . . . . . . . . . . . . . . . . . . 61,211 53,763Other fees . . . . . . . . . . . . . . . . . . . . . . . . . . . . . . . . . . . . . . . . . . . . . . . . . . . . . . . . . . . . . . . . . . . . . . . . . . . . . . . . . . 39,301 8,546
Total Expenses . . . . . . . . . . . . . . . . . . . . . . . . . . . . . . . . . . . . . . . . . . . . . . . . . . . . . . . . . . . . . . . . . . . . . . . 4,749,816 3,069,597Less Expense Reimbursement . . . . . . . . . . . . . . . . . . . . . . . . . . . . . . . . . . . . . . . . . . . . . . . . . . . . . . . . . . . – –Net Expenses after Expense Reimbursement . . . . . . . . . . . . . . . . . . . . . . . . . . . . . . . . . . . . . . . . . . . . . . . . 4,749,816 3,069,597Net Operating Profit . . . . . . . . . . . . . . . . . . . . . . . . . . . . . . . . . . . . . . . . . . . . . . . . . . . . . . . . . . . . . . . . . . . 9,099,656 62,608,351
Withholding tax on dividends and other investment income . . . . . . . . . . . . . . . . . . . . . . . . . . . . . . . . . . . . . (239,404) (192,485)
Net Increase in Net Assets attributable to holders of redeemable ordinary shares resulting from operations . 8,860,252 62,415,866
. .
. .. . .
Statement of Changes in Net Assets Attributable to Redeemable Ordinary ShareholdersYear ended
31 December 2021
(USD)
Year ended 31 December
2020 (USD)
Increase in Net Assets attributable to holders of redeemable ordinary shares resulting from operations . . . . . . . . . . . . . . . . . . . . 8,860,252 62,415,866
Capital Share Transactions of redeemable ordinary shares:Proceeds from redeemable ordinary shares sold . . . . . . . . . . . . . . . . . . . . . . . . . . . . . . . . . . . . . . . . . . . . . . . . . . . . . . . 75,791,662 86,920,052Redemption of redeemable ordinary shares . . . . . . . . . . . . . . . . . . . . . . . . . . . . . . . . . . . . . . . . . . . . . . . . . . . . . . . . . . (93,158,166) (69,460,992)Dilution Adjustment. . . . . . . . . . . . . . . . . . . . . . . . . . . . . . . . . . . . . . . . . . . . . . . . . . . . . . . . . . . . . . . . . . . . . . . . . . . 18,358 8,815
Net (Decrease)/Increase from Capital Share Transactions of redeemable ordinary shares . . . . . . . . . . . . . . (17,348,146) 17,467,875
Net (Decrease)/Increase in Net Assets attributable to holders of redeemable ordinary shares . . . . . . . . . . . . . . . . . . . . . . . . . . . (8,487,894) 79,883,741Net Assets attributable to holders of redeemable ordinary shares at the beginning of the financial year . . . . . . . . . . . . . . . . . . . . 266,411,208 186,527,467
Net Assets attributable to holders of redeemable ordinary shares at the end of the financial year . . . . . . . . . 257,923,314 266,411,208
Gains and losses are solely from continuing operations except for the Funds which ceased operations during the financial year ended 31 December 2021 and 31 December 2020. There were no gains and losses other than those dealt with in the Statement of Comprehensive Income. Please refer to note 1 which details the Fund closures during the year.
DocuSign Envelope ID: 521655BF-9BE3-47DC-A9A3-494932954338

161Janus Henderson Capital Funds plc / 31 December 2021
Janus Henderson US Venture Fund (continued)
Portfolio Investments
The accompanying notes are an integral part of the financial statements.
Shares or Principal Amount
Percentage of Net Assets
(%)Fair Value
(USD)
Financial Assets at fair value through profit or lossCommon Stock (2020: 93.47% USD 249,028,376)BermudaBiotechnology
58,702 Myovant Sciences Ltd. 0.35 913,990
CanadaBiotechnology
47,080 Essa Pharma, Inc. 0.26 668,536
Electronic Equipment, Instruments & Components11,023 Novanta, Inc. 0.75 1,943,686
IT Services152,674 Payfare, Inc. 0.39 1,010,223
Machinery64,944 ATS Automation Tooling Systems, Inc. 1.00 2,579,380
Real Estate Management & Development9,418 FirstService Corp. 0.72 1,850,354
Software50,770 Descartes Systems Group, Inc. (The) 1.63 4,199,026
Cayman IslandsEntertainment
61,885 Manchester United plc, A 0.34 881,242
DenmarkBiotechnology
7,356 Ascendis Pharma A/S 0.38 989,603
FranceMetals & Mining
114,535 Constellium SE 0.80 2,051,322
IrelandHealth Care Equipment & Supplies
9,380 STERIS plc 0.89 2,283,186
Life Sciences Tools & Services9,022 ICON plc 1.08 2,794,113
IsraelInternet & Direct Marketing Retail
17,861 Global-e Online Ltd. 0.44 1,132,209
Machinery13,205 Kornit Digital Ltd. 0.78 2,010,461
Software23,757 Nice Ltd. 2.80 7,212,625
JerseyIT Services
42,364 WNS Holdings Ltd. 1.45 3,737,352
Professional Services133,169 Clarivate plc 1.21 3,132,135
LuxembourgChemicals
68,151 Perimeter Solutions SA 0.37 946,617
United KingdomBiotechnology
7,165 Bicycle Therapeutics plc 0.17 436,13439,997 Centessa Pharmaceuticals plc 0.17 450,366
0.34 886,500
Machinery83,419 Gates Industrial Corp. plc 0.51 1,327,196
Shares or Principal Amount
Percentage of Net Assets
(%)Fair Value
(USD)
United StatesAuto Components
29,038 QuantumScape Corp. 0.25 644,35314,776 Visteon Corp. 0.64 1,642,205
0.89 2,286,558
Automobiles16,327 Thor Industries, Inc. 0.66 1,694,253
Banks59,536 Bancorp, Inc. (The) 0.58 1,506,856
Biotechnology20,091 Eagle Pharmaceuticals, Inc. 0.40 1,023,03429,690 Global Blood Therapeutics, Inc. 0.34 869,02638,678 Halozyme Therapeutics, Inc. 0.60 1,555,24235,505 Icosavax, Inc. 0.32 812,35440,930 Insmed, Inc. 0.43 1,114,93317,062 Ligand Pharmaceuticals, Inc. 1.02 2,635,3978,382 Mirati Therapeutics, Inc. 0.48 1,229,55617,821 Neurocrine Biosciences, Inc. 0.59 1,517,815
29,348 Praxis Precision Medicines, Inc. 0.22 578,15626,418 PTC Therapeutics, Inc. 0.41 1,052,22935,964 Travere Therapeutics, Inc. 0.43 1,116,32344,215 Vaxcyte, Inc., Private Placement 0.41 1,051,872
5.65 14,555,937
Building Products19,100 CSW Industrials, Inc. 0.90 2,308,426
157,452 Janus International Group, Inc. 0.76 1,971,29957,408 Zurn Water Solutions Corp. 0.81 2,089,651
2.47 6,369,376
Capital Markets55,870 AssetMark Financial Holdings, Inc. 0.57 1,464,35335,647 Focus Financial Partners, Inc., A 0.83 2,128,83932,599 LPL Financial Holdings, Inc. 2.02 5,218,774
170,967 Thayer Ventures, Private Placement 0.67 1,726,7674.09 10,538,733
Chemicals47,977 Sensient Technologies Corp. 1.86 4,800,579
125,984 Valvoline, Inc. 1.82 4,697,9433.68 9,498,522
Commercial Services & Supplies56,728 Brady Corp., A 1.19 3,057,63914,649 Montrose Environmental Group, Inc. 0.40 1,032,901
1.59 4,090,540
Consumer Finance5,423 LendingTree, Inc. 0.26 664,860
62,739 Sandbridge Consumer Fund II LP 0.07 167,5130.33 832,373
Containers & Packaging45,561 Sealed Air Corp. 1.19 3,074,001
Diversified Consumer Services40,945 Frontdoor, Inc. 0.58 1,500,63475,305 Stride, Inc. 0.97 2,509,91658,686 Terminix Global Holdings, Inc. 1.03 2,654,368
2.58 6,664,918
Electrical Equipment27,867 EnerSys 0.85 2,203,16511,848 Regal Rexnord Corp. 0.78 2,016,293
1.63 4,219,458
DocuSign Envelope ID: 521655BF-9BE3-47DC-A9A3-494932954338

Janus Henderson Capital Funds plc / 31 December 2021162
The accompanying notes are an integral part of the financial statements.
Janus Henderson US Venture Fund (continued)
Portfolio Investments
Shares or Principal Amount
Percentage of Net Assets
(%)Fair Value
(USD)
Electronic Equipment, Instruments & Components
51,674 908 Devices, Inc. 0.52 1,336,80643,291 Napco Security Technologies, Inc. 0.84 2,163,68429,774 National Instruments Corp. 0.50 1,300,23126,311 OSI Systems, Inc. 0.95 2,452,1854,264 Rogers Corp. 0.45 1,164,072
3.26 8,416,978
Equity Real Estate Investment Trusts (REITs)87,985 Easterly Government Properties, Inc. 0.78 2,016,616
Food & Staples Retailing6,777 Casey's General Stores, Inc. 0.52 1,337,441
Food Products80,973 AppHarvest, Inc. 0.12 314,98544,979 Hain Celestial Group, Inc. (The) 0.74 1,916,55552,103 Laird Superfood, Inc. 0.26 679,423
1.12 2,910,963
Health Care Equipment & Supplies110,303 Alphatec Holdings, Inc. 0.49 1,260,76384,519 Axogen, Inc. 0.31 791,94334,669 CryoPort, Inc. 0.80 2,051,36519,302 Glaukos Corp. 0.33 857,78129,632 Globus Medical, Inc., A 0.83 2,139,430
5,827 Heska Corp. 0.41 1,063,36910,811 ICU Medical, Inc. 1.00 2,565,8837,039 Insulet Corp. 0.73 1,872,867
46,136 Integra LifeSciences Holdings Corp. 1.20 3,090,65142,683 Paragon 28, Inc. 0.29 755,06229,899 Sight Sciences, Inc. 0.20 525,32515,450 Surmodics, Inc. 0.29 743,91738,807 Treace Medical Concepts, Inc. 0.28 723,362
7.16 18,441,718
Health Care Providers & Services18,233 HealthEquity, Inc. 0.31 806,62821,616 ModivCare, Inc. 1.24 3,205,437
1.55 4,012,065
Health Care Technology23,330 Phreesia, Inc. 0.38 971,928
Hotels, Restaurants & Leisure36,228 Dutch Bros, Inc., A 0.72 1,844,36726,395 Monarch Casino & Resort, Inc. 0.76 1,951,910
1.48 3,796,277
Household Durables36,501 Lovesac Co. (The) 0.94 2,418,556
Insurance19,187 RLI Corp. 0.83 2,150,863
119,729 Trean Insurance Group, Inc. 0.41 1,066,7851.24 3,217,648
Interactive Media & Services36,390 Ziff Davis, Inc. 1.56 4,034,195
Internet & Direct Marketing Retail98,203 CarParts.com, Inc. 0.43 1,099,87428,720 Xometry, Inc., A 0.57 1,471,900
1.00 2,571,774
IT Services17,576 Broadridge Financial Solutions, Inc. 1.25 3,213,244
23,838 Euronet Worldwide, Inc. 1.10 2,840,77457,148 Repay Holdings Corp. 0.41 1,044,09415,915 Shift4 Payments, Inc., A 0.36 921,956
Shares or Principal Amount
Percentage of Net Assets
(%)Fair Value
(USD)
11,788 WEX, Inc. 0.64 1,654,917
3.76 9,674,985
Life Sciences Tools & Services4,490 Bio-Techne Corp. 0.90 2,322,857
49,038 Codexis, Inc. 0.59 1,533,41840,590 Inotiv, Inc. 0.66 1,707,62160,737 NeoGenomics, Inc. 0.80 2,072,346
2.95 7,636,242
Machinery9,821 Alamo Group, Inc. 0.56 1,445,455
28,576 Hydrofarm Holdings Group, Inc. 0.31 808,41523,297 ITT, Inc. 0.92 2,380,720
8,981 Nordson Corp. 0.89 2,292,58043,062 SPX Corp. 1.00 2,569,940
3.68 9,497,110
Media113,763 Advantage Solutions, Inc. 0.35 912,37920,206 John Wiley & Sons, Inc., A 0.45 1,157,198
0.80 2,069,577
Personal Products47,002 BellRing Brands, Inc., A 0.52 1,340,967
Pharmaceuticals54,669 Catalent, Inc. 2.71 6,999,27242,234 EyePoint Pharmaceuticals, Inc. 0.20 516,94421,024 Phathom Pharmaceuticals, Inc. 0.16 413,54243,393 Zogenix, Inc. 0.27 705,136
3.34 8,634,894
Real Estate Management & Development75,194 Project Boundary, Private Placement 0.41 1,044,44547,318 Redfin Corp. 0.70 1,816,538
1.11 2,860,983
Road & Rail2,842 AMERCO 0.80 2,063,946
Semiconductors & Semiconductor Equipment87,600 ON Semiconductor Corp. 2.31 5,949,792
Software25,053 Altair Engineering, Inc., A 0.75 1,937,09838,943 AvidXchange Holdings, Inc. 0.23 586,48240,061 Blackbaud, Inc. 1.23 3,164,018
110,293 ChannelAdvisor Corp. 1.06 2,722,03135,159 Clear Secure, Inc., A 0.43 1,102,93815,208 Consensus Cloud Solutions, Inc. 0.34 880,08637,931 CoreCard Corp. 0.57 1,471,72334,175 Enfusion, Inc., A 0.28 715,624
30,533 EngageSmart, Inc. 0.29 736,45627,510 Envestnet, Inc. 0.85 2,182,64340,723 Expensify, Inc., A 0.69 1,791,81214,564 ForgeRock, Inc., A 0.15 388,71347,935 LivePerson, Inc. 0.66 1,712,23816,150 Paylocity Holding Corp. 1.48 3,813,984
59,339 Sailpoint Technologies Holdings, Inc. 1.11 2,868,44752,560 SS&C Technologies Holdings, Inc. 1.67 4,308,869
9,079 Trade Desk, Inc. (The), A 0.32 832,0004,602 Tyler Technologies, Inc. 0.96 2,475,646
112,718 Vonage Holdings Corp. 0.91 2,343,40770,603 Yext, Inc. 0.27 700,382
14.25 36,734,597
Specialty Retail9,733 Williams-Sonoma, Inc. 0.64 1,646,142
DocuSign Envelope ID: 521655BF-9BE3-47DC-A9A3-494932954338

163Janus Henderson Capital Funds plc / 31 December 2021
The accompanying notes are an integral part of the financial statements.
Janus Henderson US Venture Fund (continued)
Portfolio Investments
Shares or Principal Amount
Percentage of Net Assets
(%)Fair Value
(USD)
Trading Companies & Distributors
106,816 Core & Main, Inc., A 1.26 3,240,797
Virgin Islands, BritishCapital Markets
73,057 Everarc Holdings Ltd., Warrant, due 10/11/22 0.06 146,370
Total Common Stock 98.30 253,523,842
Government Obligations (2020: 0.00% USD –)US Treasury Notes/Bonds
3,200,000 0.0000%, due 4/1/22 1.24 3,200,003
Total Government Obligations 1.24 3,200,003
Preferred Stock (2020: 0.16% USD 418,437)United StatesHealth Care Equipment & Supplies
38,252 Sight Sciences, Inc., Private Placement 0.25 638,483
Real Estate Management & Development143,541 Apartment List, Inc., Private Placement* 0.20 524,355
Total Preferred Stock 0.45 1,162,838
Total Investments (Cost: USD 171,970,570) 99.99 257,886,683
Forward Currency Contracts (2020: 0.43% USD 1,151,892)Open as at 31 December 2021.
Current Market
Percentage of Net Unrealised
Currency Currency Value Settle Assets GainPurchased Sold (USD) Date (%) (USD)
.Barclays USD 2,253,528 CAD 2,785,000 2,201,636 20-Jan-22 0.02 51,892
USD 350,298 GBP 253,800 343,518 20-Jan-22 0.00 6,780
Citibank USD 2,553,231 CAD 3,157,900 2,496,425 20-Jan-22 0.02 56,806
USD 242,526 GBP 175,800 237,945 20-Jan-22 0.00 4,581
Credit SuisseCAD 648,000 USD 505,861 512,266 20-Jan-22 0.00 6,405
HSBC GBP 74,000 USD 98,318 100,159 20-Jan-22 0.00 1,841
USD 2,552,265 CAD 3,157,700 2,496,268 20-Jan-22 0.02 55,997
J.P. Morgan EUR◊ 43,151,264 USD 48,459,050 49,155,116 31-Jan-22 0.25 696,066
GBP 31,000 USD 41,542 41,959 20-Jan-22 0.00 417
USD 620,427 CAD 781,000 617,407 20-Jan-22 0.00 3,020
USD 629,491 GBP 456,600 618,008 20-Jan-22 0.00 11,483
State StreetGBP 29,000 USD 38,651 39,251 20-Jan-22 0.00 600
Total 0.31 895,888
.
Total Financial Assets at fair value through profit or loss 100.30 258,782,571
Financial Liabilities at fair value through profit or loss.Forward Currency Contracts (2020: (0.03)% USD (84,938))Open as at 31 December 2021
Current Market
Percentage of Net Unrealised
Currency Currency Value Settle Assets LossPurchased Sold (USD) Date (%) (USD)
Barclays GBP 21,000 USD 28,946 28,424 20-Jan-22 0.00 (522)
HSBC GBP 22,000 USD 30,348 29,777 20-Jan-22 0.00 (571)
USD 25,570 GBP 19,000 25,716 20-Jan-22 0.00 (146)
J.P. Morgan CAD 319,000 USD 258,248 252,180 20-Jan-22 0.00 (6,068)
USD◊ 10,353,636 EUR 9,160,303 10,434,819 31-Jan-22 0.00 (81,183)
USD 211,267 GBP 158,000 213,853 20-Jan-22 0.00 (2,586)
State StreetUSD 60,912 GBP 46,000 62,261 20-Jan-22 0.00 (1,349)
Total 0.00 (92,425).
Total Financial Liabilities at fair value through profit or loss 0.00 (92,425)
Portfolio Analysis (Unaudited)
Analysis of Total Assets:% of Total
AssetsTransferable securities admitted to official stock exchange listing 95.06Transferable securities dealt in on another regulated market 1.28OTC financial derivative instruments 0.34Other Assets 3.32Total Assets 100.00
* Fair valued by Janus Henderson Global Pricing Committee at 31 December 2021.◊ These forward currency contracts are used for share class hedging.
DocuSign Envelope ID: 521655BF-9BE3-47DC-A9A3-494932954338

Janus Henderson Capital Funds plc / 31 December 2021164
The accompanying notes are an integral part of the financial statements.
Janus Henderson US Venture Fund (continued)
Fair Value Hierarchy
The tables below provide the fair value hierarchy summary of the Fund’s financial assets and liabilities measured at fair value at 31 December 2021 and 31 December 2020.
31 December 2021
Level 1 - Quoted Prices
(USD)
Level 2 - Other Significant
Observable Inputs (USD)
Level 3 - Significant
Unobservable Inputs (USD)
Total (USD)
Common Stock 250,438,747 3,085,095 – 253,523,842Forward Currency Contracts – 803,463 – 803,463Government Obligations – 3,200,003 – 3,200,003Preferred Stock – 638,483 524,355 1,162,838Total Investments in Securities 250,438,747 7,727,044 524,355 258,690,146
There were transfers on Preferred Stock from level 3 to level 2 during the financial year ended 31 December 2021.
31 December 2020
Level 1 - Quoted Prices
(USD)
Level 2 - Other Significant
Observable Inputs (USD)
Level 3 - Significant
Unobservable Inputs (USD)
Total (USD)
Common Stock 236,384,152 12,119,8691,2 524,355 249,028,376Forward Currency Contracts – 1,066,954 – 1,066,954Preferred Stock – – 418,437 418,437Total Investments in Securities 236,384,152 13,186,823 942,792 250,513,767
1At 31 December 2020, the administrator used a systematic fair valuation model provided by an independent third party to value listed securities in order to adjust for stale pricing between the close of foreign exchanges and the valuation point. This resulted in an increase of USD 527 to common stocks with a fair value of USD 1,529,039.
2At 31 December 2020, Investments with a fair value of USD 10,590,830 had a liquidity discount applied in line with GPC pricing policies.
Valuation policy of private placements is referenced in note 2 of the financial statements.
The following tables present level 3 positions that were fair valued by the Janus Henderson Global Pricing Committee at 31 December 2021 and 31 December 2020.
Security Name
Fair Value at 31 December 2021
(USD)Fair Value as a %
of Net Assets Valuation MethodApartment List, Inc., Private Placement 524,355 0.20% Valued at cost
Total 524,355
Security Name
Fair Value at 31 December 2020
(USD)Fair Value as a %
of Net Assets Valuation MethodApartment List, Inc. 524,355 0.20% Valued at costSight Sciences, Inc. 418,437 0.16% Valued at cost
Total 942,792
DocuSign Envelope ID: 521655BF-9BE3-47DC-A9A3-494932954338

165Janus Henderson Capital Funds plc / 31 December 2021
Janus Henderson US Venture Fund (continued)
The accompanying notes are an integral part of the financial statements.
Capital Share Transactions
For the financial year ended 31 December 2021
A1 USD A2 HEUR A2 USD B2 USD E2 USD H2 GBP H2 HEUR H2 USDShares Shares Shares Shares Shares Shares Shares Shares
At beginning of the year . . . . . . . 25,918 339,261 1,759,087 56,968 27,546 254,504 9,929 2,857,141Shares issued 38,881 98,967 770,403 – 87,125 56,475 36,595 143,028Shares redeemed. . . . . . . . . . . (7,445) (118,995) (832,574) (3,030) (25,726) (47,765) (5,075) (150,489)At end of year . . . . . . . . . . . . . 57,354 319,233 1,696,916 53,938 88,945 263,214 41,449 2,849,680
I2 HEUR I2 USD V2 HEUR V2 USDShares Shares Shares Shares
At beginning of the year . . . . . . . 747,492 1,287,948 – –Shares issued 140,857 441,467 251 300Shares redeemed. . . . . . . . . . . (256,673) (707,472) – –At end of year . . . . . . . . . . . . . 631,676 1,021,943 251 300
For the financial year ended 31 December 2020
. .A1 USD A2 HEUR A2 USD B2 USD E2 USD H2 GBP H2 HEUR H2 USDShares Shares Shares Shares Shares Shares Shares Shares
At beginning of the year . . . . . . . 12,458 462,131 1,389,215 64,097 1,056 128,489 28,090 3,419,074Shares issued 15,078 52,907 1,431,915 – 27,246 149,067 – 142,899Shares redeemed. . . . . . . . . . . (1,618) (175,777) (1,062,043) (7,129) (756) (23,052) (18,161) (704,832)At end of year . . . . . . . . . . . . . 25,918 339,261 1,759,087 56,968 27,546 254,504 9,929 2,857,141
I2 HEUR I2 USDShares Shares
At beginning of the year . . . . . . . 764,862 962,594Shares issued 226,451 623,826Shares redeemed. . . . . . . . . . . (243,821) (298,472)At end of year . . . . . . . . . . . . . 747,492 1,287,948
Net Asset Comparison
31 December 2021 31 December 2020 31 December 2019
Net Assets (USD)
NAV Per Share
(Local Currency)Net Assets
(USD)
NAV Per Share
(Local Currency)Net Assets
(USD)
NAV Per Share
(Local Currency)
A1 USD 2,146,491 37.43 930,468 35.90 341,696 27.43A2 HEUR 14,159,661 38.96 15,689,797 37.86 15,287,355 29.49A2 USD 71,365,147 42.06 71,001,225 40.36 42,841,881 30.84B2 USD 1,823,715 33.81 1,867,687 32.78 1,621,739 25.30E2 USD 1,722,084 19.36 514,413 18.67 15,146 14.34H2 GBP 14,841,025 41.66 13,568,653 38.99 5,156,486 30.30H2 HEUR 776,721 16.46 181,095 14.93 361,221 11.47H2 USD 76,118,781 26.71 72,155,413 25.25 64,997,715 19.01I2 HEUR 23,695,097 32.95 28,994,593 31.75 21,056,921 24.55I2 USD 51,268,694 50.17 61,507,864 47.76 34,847,307 36.20V2 HEUR 2,863 10.04 – – – –V2 USD 3,035 10.12 – – – –
. . .
DocuSign Envelope ID: 521655BF-9BE3-47DC-A9A3-494932954338

Janus Henderson Capital Funds plc / 31 December 2021166
Janus Henderson US Venture Fund (continued)
The accompanying notes are an integral part of the financial statements.
Total Expense Ratio (unaudited)
The Average Total Expense Ratio table shows the actual expenses, excluding transactions costs and trade commissions, incurred by each Class for the Fund during the reporting financial year expressed as a percentage of the average net assets for the corresponding year, on an annualised basis.
31 December 2021 31 December 2020 31 December 2019A1 USD 2.41% 2.42% 2.43%A2 HEUR 2.42% 2.44% 2.43%A2 USD 2.42% 2.42% 2.43%B2 USD 3.41% 3.44% 3.43%E2 USD 2.89% 2.92% 2.92%H2 GBP 0.90% 0.93% 0.99%H2 HEUR 0.90% 0.93% 0.99%H2 USD 0.90% 0.94% 0.98%I2 HEUR 1.60% 1.63% 1.68%I2 USD 1.60% 1.63% 1.71%V2 HEUR* 2.28% – –V2 USD* 2.29% – –
*As the share class launched during the year, an estimated Total Expense Ratio is disclosed for the year end.
DocuSign Envelope ID: 521655BF-9BE3-47DC-A9A3-494932954338

167Janus Henderson Capital Funds plc / 31 December 2021
Janus Henderson US Venture Fund (continued)
The accompanying notes are an integral part of the financial statements.
Fund Performance (unaudited)
As at 31 December 2021
One year Three years Five yearsSince
inception
Performance (Annualised) 31/12/2020 31/12/2021
%
31/12/2017 31/12/2021
%
31/12/2015 31/12/2021
%
to 31/12/2021
%
H2 USD (Net)* 5.78 20.32** 14.55** 6.75**Russell 2000 Growth TR 2.83 21.16 14.54 6.62
Five years 31/12/2015 31/12/2021
%H2 USD (Gross)* 17.39Russell 2000 Growth TR + 2.00% 16.83
.
Discrete performance
31/12/2020 31/12/2021
%
31/12/2019 31/12/2020
%
31/12/2018 31/12/2019
%
31/12/2017 31/12/2018
%
31/12/2016 31/12/2017
%
H2 USD (Net)* 5.78 30.84** 27.75** (7.08)** 21.86**Russell 2000 Growth TR 2.83 34.63 28.48 (9.31) 22.17
H2 USD (Gross)* 6.79 34.02** 30.86** (4.79)** 24.90**Russell 2000 Growth TR + 2.00% 4.89 37.33 31.05 (7.49) 24.60
. . . . .
Class H2 USD is disclosed as it is the representative share class.
* The representative share class has changed from the A2 USD to the H2 USD share class with effect from August 2021.
** Historical figures are based on the A2 USD share class.
Performance target: To outperform the Russell 2000 Growth Index by 2% per annum, before the deduction of charges, over any 5 year period.
The Total Expense Ratio includes fees payable to Distributors. Where the Total Expense Ratio exceeds the target outperformance relative to the benchmark the return is likely to be below the benchmark return, even when the Fund’s outperformance target (before the deduction of charges) has been achieved.
Please note the Gross Returns 5 year annualised table is only applicable for share classes which have been active for 5 or more years and the performance target is to be achieved over a specific annualised time period. Performance target and index shown in USD.
Past performance does not guarantee future returns. The rates of return will vary and the principal value of an investment will fluctuate. Shares, if redeemed, may be worth more or less than their original cost. The performance data does not take account of the commissions and costs incurred on the issue and redemption of Shares. All returns are calculated in the base currency of the representative Share Class.
There is no guarantee that the Fund’s performance will match or exceed the benchmark.
DocuSign Envelope ID: 521655BF-9BE3-47DC-A9A3-494932954338

Janus Henderson Capital Funds plc / 31 December 2021168
Janus Henderson US Venture Fund (continued)
Statements of Changes in Composition of Portfolio (unaudited)The tables below show a breakdown of material purchases and sales of the Investment Portfolio in accordance with Central Bank UCITS Regulations 79(2) requirements. All purchases and sales of investments exceeding 1% of the total value of each transaction respectively, are disclosed, with a minimum number of 20 of each such transaction. A full analysis of the movement on the Investment Portfolio is available upon request from the registered office.
Major Purchases for the year ended 31 December 2021
Shares or Principal Amount
Cost (USD)
Credit Agricole Corporate And Investment Bank, 0.0000%, due 13/1/21 21,800,000 21,799,958Credit Agricole Corporate And Investment Bank, 0.0000%, due 25/1/21 20,200,000 20,199,882Credit Agricole Corporate And Investment Bank, 0.0000%, due 12/1/21 19,300,000 19,299,962Credit Agricole Corporate And Investment Bank, 0.0000%, due 5/1/21 19,200,000 19,199,963Credit Agricole Corporate And Investment Bank, 0.0000%, due 22/1/21 18,900,000 18,899,963Credit Industriel et Commercial, 0.0000%, due 13/5/21 18,000,000 17,999,975Credit Industriel et Commercial, 0.0000%, due 14/5/21 18,000,000 17,999,975Credit Agricole Corporate And Investment Bank, 0.0000%, due 20/1/21 17,800,000 17,799,965Credit Agricole Corporate And Investment Bank, 0.0000%, due 21/1/21 17,800,000 17,799,965Credit Industriel et Commercial, 0.0000%, due 12/5/21 17,600,000 17,599,976Credit Industriel et Commercial, 0.0000%, due 17/5/21 17,500,000 17,499,927Credit Agricole Corporate And Investment Bank, 0.0000%, due 11/1/21 17,500,000 17,499,898Credit Agricole Corporate And Investment Bank, 0.0000%, due 10/2/21 17,300,000 17,299,971Credit Agricole Corporate And Investment Bank, 0.0000%, due 12/2/21 17,200,000 17,199,971Credit Agricole Corporate And Investment Bank, 0.0000%, due 8/1/21 17,200,000 17,199,967Credit Agricole Corporate And Investment Bank, 0.0000%, due 11/2/21 17,100,000 17,099,971Credit Agricole Corporate And Investment Bank, 0.0000%, due 9/2/21 17,100,000 17,099,971Credit Agricole Corporate And Investment Bank, 0.0000%, due 8/2/21 17,100,000 17,099,914Credit Agricole Corporate And Investment Bank, 0.0000%, due 16/2/21 17,100,000 17,099,886Credit Industriel et Commercial, 0.0000%, due 18/5/21 16,900,000 16,899,977
Major Sales for the year ended 31 December 2021
Shares or Principal Amount
Proceeds (USD)
QuantumScape Corp. 85,266 5,110,548Trade Desk, Inc. (The) 'A' 28,750 3,511,825Heska Corp. 12,852 2,711,199Catalent, Inc. 21,691 2,667,866RealPage, Inc. 26,982 2,343,799Kornit Digital Ltd. 20,192 2,198,925Rogers Corp. 8,105 2,137,387Construction Partners, Inc. 62,161 2,054,303Medallia, Inc. 59,142 1,994,007Bio-Techne Corp. 3,679 1,745,191Standex International Corp. 19,236 1,719,422Insulet Corp. 5,923 1,613,083Guidewire Software, Inc. 12,604 1,495,021Prestige Consumer Healthcare, Inc. 33,921 1,450,045Broadridge Financial Solutions, Inc. 8,003 1,387,528Ligand Pharmaceuticals, Inc. 8,659 1,346,284CryoPort, Inc. 17,487 1,329,226HB Fuller Co. 21,945 1,273,021Montrose Environmental Group, Inc. 25,833 1,255,158Vonage Holdings Corp. 63,642 1,249,604STERIS plc 5,832 1,246,220ITT, Inc. 13,178 1,223,183Lovesac Co. (The) 17,740 1,164,104Nice Ltd. 4,286 1,147,295Redfin Corp. 16,128 1,141,075Carter's, Inc. 11,011 1,115,906Descartes Systems Group, Inc. (The) 14,887 1,111,275Hyster-Yale Materials Handling, Inc. 18,955 1,106,249Paylocity Holding Corp. 5,022 1,074,322Pulmonx Corp. 20,755 1,071,865Globus Medical, Inc. 'A' 13,020 1,015,071FibroGen, Inc. 37,084 961,890Napco Security Technologies, Inc. 26,026 961,382Everbridge, Inc. 12,640 946,882
DocuSign Envelope ID: 521655BF-9BE3-47DC-A9A3-494932954338

Janus Henderson Intech All-World Minimum Variance Core Fund
169Janus Henderson Capital Funds plc / 31 December 2021
The Fund ceased investment activities on 09 July 2021.
Please refer to the fund performance (unaudited) note for details on the Funds performance during the year.
DocuSign Envelope ID: 521655BF-9BE3-47DC-A9A3-494932954338

Janus Henderson Capital Funds plc / 31 December 2021170
The accompanying notes are an integral part of the financial statements.
Janus Henderson Intech All-World Minimum Variance Core Fund (continued)s
Statement of Financial PositionAs of
31 December 2021
(USD)*
As of 31 December
2020 (USD)
Assets:Financial assets at fair value through profit or loss . . . . . . . . . . . . . . . . . . . . . . . . . . . . . . . . . . . . . . . . . . . . . . . . . . . . . . . – 1,062,918,412Cash and foreign currency . . . . . . . . . . . . . . . . . . . . . . . . . . . . . . . . . . . . . . . . . . . . . . . . . . . . . . . . . . . . . . . . . . . . . . . 282,087 10,883,798Collateral cash . . . . . . . . . . . . . . . . . . . . . . . . . . . . . . . . . . . . . . . . . . . . . . . . . . . . . . . . . . . . . . . . . . . . . . . . . . . . . . . – 2,180,000Receivables:
Investments sold . . . . . . . . . . . . . . . . . . . . . . . . . . . . . . . . . . . . . . . . . . . . . . . . . . . . . . . . . . . . . . . . . . . . . . . . . . . . – 20,300Dividends . . . . . . . . . . . . . . . . . . . . . . . . . . . . . . . . . . . . . . . . . . . . . . . . . . . . . . . . . . . . . . . . . . . . . . . . . . . . . . . . . 17,659 806,069
Other debtors . . . . . . . . . . . . . . . . . . . . . . . . . . . . . . . . . . . . . . . . . . . . . . . . . . . . . . . . . . . . . . . . . . . . . . . . . . . . . . . . 222,762 351,138
Total Assets . . . . . . . . . . . . . . . . . . . . . . . . . . . . . . . . . . . . . . . . . . . . . . . . . . . . . . . . . . . . . . . . . . . . . . . . . 522,508 1,077,159,717 Liabilities (amounts falling due within one year)Payables:
Financial liabilities at fair value through profit or loss . . . . . . . . . . . . . . . . . . . . . . . . . . . . . . . . . . . . . . . . . . . . . . . . . . . . – 328,594Bank overdraft and foreign currency . . . . . . . . . . . . . . . . . . . . . . . . . . . . . . . . . . . . . . . . . . . . . . . . . . . . . . . . . . . . . . . – 1Fund shares repurchased . . . . . . . . . . . . . . . . . . . . . . . . . . . . . . . . . . . . . . . . . . . . . . . . . . . . . . . . . . . . . . . . . . . . . . 411,246 –Investment Management fees . . . . . . . . . . . . . . . . . . . . . . . . . . . . . . . . . . . . . . . . . . . . . . . . . . . . . . . . . . . . . . . . . . . 5,770 71,720Accounting, Administration and Transfer Agent fees . . . . . . . . . . . . . . . . . . . . . . . . . . . . . . . . . . . . . . . . . . . . . . . . . . . . 13,840 114,556Management fees . . . . . . . . . . . . . . . . . . . . . . . . . . . . . . . . . . . . . . . . . . . . . . . . . . . . . . . . . . . . . . . . . . . . . . . . . . . (4,589) 16,705Accrued expenses . . . . . . . . . . . . . . . . . . . . . . . . . . . . . . . . . . . . . . . . . . . . . . . . . . . . . . . . . . . . . . . . . . . . . . . . . . . 96,241 185,531
Total Liabilities (excluding Net Assets attributable to holders of redeemable ordinary shares) . . . . . . . . . . . . 522,508 717,107 Net Assets attributable to holders of redeemable ordinary participating shares . . . . . . . . . . . . . . . . . . . . . . – 1,076,442,610
* The Fund ceased investment activities on 09 July 2021.
DocuSign Envelope ID: 521655BF-9BE3-47DC-A9A3-494932954338

171Janus Henderson Capital Funds plc / 31 December 2021
Janus Henderson Intech All-World Minimum Variance Core Fund (continued)
The accompanying notes are an integral part of the financial statements.
Statement of Comprehensive IncomeYear ended
31 December 2021
(USD)*
Year ended 31 December
2020 (USD)
Year ended Year endedRevenue:Interest income . . . . . . . . . . . . . . . . . . . . . . . . . . . . . . . . . . . . . . . . . . . . . . . . . . . . . . . . . . . . . . . . . . . . . . . . . . . . . . . 159,905 138,582Dividend income . . . . . . . . . . . . . . . . . . . . . . . . . . . . . . . . . . . . . . . . . . . . . . . . . . . . . . . . . . . . . . . . . . . . . . . . . . . . . . 9,949,160 18,194,162Other income . . . . . . . . . . . . . . . . . . . . . . . . . . . . . . . . . . . . . . . . . . . . . . . . . . . . . . . . . . . . . . . . . . . . . . . . . . . . . . . . – 13,191
Net gain on financial assets and liabilities at fair value through profit or loss . . . . . . . . . . . . . . . . . . . . . . . . . . . . . . . . . . . . . . 116,257,767 143,617,545 Total Investments Income . . . . . . . . . . . . . . . . . . . . . . . . . . . . . . . . . . . . . . . . . . . . . . . . . . . . . . . . . . . . . . . 126,366,832 161,963,480
Expenses:Management fees . . . . . . . . . . . . . . . . . . . . . . . . . . . . . . . . . . . . . . . . . . . . . . . . . . . . . . . . . . . . . . . . . . . . . . . . . . . . . 122,669 110,216Accounting, Administration and Transfer Agent fees . . . . . . . . . . . . . . . . . . . . . . . . . . . . . . . . . . . . . . . . . . . . . . . . . . . . . . 72,466 350,876Custodian fees . . . . . . . . . . . . . . . . . . . . . . . . . . . . . . . . . . . . . . . . . . . . . . . . . . . . . . . . . . . . . . . . . . . . . . . . . . . . . . . 193,644 307,649Audit fees . . . . . . . . . . . . . . . . . . . . . . . . . . . . . . . . . . . . . . . . . . . . . . . . . . . . . . . . . . . . . . . . . . . . . . . . . . . . . . . . . . 17,428 26,499Printing expenses . . . . . . . . . . . . . . . . . . . . . . . . . . . . . . . . . . . . . . . . . . . . . . . . . . . . . . . . . . . . . . . . . . . . . . . . . . . . . 20,111 8,049Legal and other professional fees . . . . . . . . . . . . . . . . . . . . . . . . . . . . . . . . . . . . . . . . . . . . . . . . . . . . . . . . . . . . . . . . . . 59,192 121,100Other fees . . . . . . . . . . . . . . . . . . . . . . . . . . . . . . . . . . . . . . . . . . . . . . . . . . . . . . . . . . . . . . . . . . . . . . . . . . . . . . . . . . 50,887 113,036
Total Expenses . . . . . . . . . . . . . . . . . . . . . . . . . . . . . . . . . . . . . . . . . . . . . . . . . . . . . . . . . . . . . . . . . . . . . . . 536,397 1,037,425Less Expense Reimbursement . . . . . . . . . . . . . . . . . . . . . . . . . . . . . . . . . . . . . . . . . . . . . . . . . . . . . . . . . . . (532,626) (1,090,718)Net Expenses after Expense Reimbursement . . . . . . . . . . . . . . . . . . . . . . . . . . . . . . . . . . . . . . . . . . . . . . . . 3,771 (53,293)Net Operating Profit . . . . . . . . . . . . . . . . . . . . . . . . . . . . . . . . . . . . . . . . . . . . . . . . . . . . . . . . . . . . . . . . . . . 126,363,061 162,016,773
Withholding tax on dividends and other investment income . . . . . . . . . . . . . . . . . . . . . . . . . . . . . . . . . . . . . (1,813,426) (3,860,464)
Net Increase in Net Assets attributable to holders of redeemable ordinary shares resulting from operations . 124,549,635 158,156,309
. .
. .. . .
Statement of Changes in Net Assets Attributable to Redeemable Ordinary ShareholdersYear ended
31 December 2021
(USD)*
Year ended 31 December
2020 (USD)
Increase in Net Assets attributable to holders of redeemable ordinary shares resulting from operations . . . . . . . . . . . . . . . . . . . . 124,549,635 158,156,309
Capital Share Transactions of redeemable ordinary shares:Proceeds from redeemable ordinary shares sold . . . . . . . . . . . . . . . . . . . . . . . . . . . . . . . . . . . . . . . . . . . . . . . . . . . . . . . – 174,477,600Redemption of redeemable ordinary shares . . . . . . . . . . . . . . . . . . . . . . . . . . . . . . . . . . . . . . . . . . . . . . . . . . . . . . . . . . (1,200,992,245) –
Net (Decrease)/Increase from Capital Share Transactions of redeemable ordinary shares . . . . . . . . . . . . . . (1,200,992,245) 174,477,600
Net (Decrease)/Increase in Net Assets attributable to holders of redeemable ordinary shares . . . . . . . . . . . . . . . . . . . . . . . . . . . (1,076,442,610) 332,633,909Net Assets attributable to holders of redeemable ordinary shares at the beginning of the financial year . . . . . . . . . . . . . . . . . . . . 1,076,442,610 743,808,701
Net Assets attributable to holders of redeemable ordinary shares at the end of the financial year . . . . . . . . . – 1,076,442,610
* The Fund ceased investment activities on 09 July 2021.
Gains and losses are solely from continuing operations except for the Funds which ceased operations during the financial year ended 31 December 2021 or 31 December 2020. There were no gains and losses other than those dealt with in the Statement of Comprehensive Income. Please refer to note 1 which details the Fund closures during the year.
DocuSign Envelope ID: 521655BF-9BE3-47DC-A9A3-494932954338

Janus Henderson Capital Funds plc / 31 December 2021172
The accompanying notes are an integral part of the financial statements.
Janus Henderson Intech All-World Minimum Variance Core Fund (continued)
Fair Value Hierarchy
The Fund ceased operations on 09 July 2021. There were no investments held by the Fund at 31 December 2021. The tables below provide the fair value hierarchy summary of the Fund’s financial assets and liabilities measured at fair value at 31 December 2020.
31 December 2020
Level 1 - Quoted Prices
(USD)
Level 2 - Other Significant
Observable Inputs (USD)
Level 3 - Significant
Unobservable Inputs (USD)
Total (USD)
Common Stock 644,416,289 404,611,6111 181,635 1,049,209,535Forward Currency Contracts – 13,380,283 – 13,380,283Total Investments in Securities 644,416,289 417,991,894 181,635 1,062,589,818
1At 31 December 2020, the administrator used a systematic fair valuation model provided by an independent third party to value listed securities in order to adjust for stale pricing between the close of foreign exchanges and the valuation point. This resulted in an increase of USD 80,506 to common stocks with a fair value of USD 404,611,611.
Valuation policy of private placements is referenced in note 2 of the financial statements.
The following tables present level 3 positions that were fair valued by the Janus Henderson Global Pricing Committee at 31 December 2020.
Security Name
Fair Value at 31 December 2020
(USD)Fair Value as a %
of Net Assets Valuation MethodHanergy Thin Film Power Group Ltd.
181,635 0.02%
Enterprise Value/ Last Twelve Month (“EV/LTM”)
Revenue
Total 181,635
DocuSign Envelope ID: 521655BF-9BE3-47DC-A9A3-494932954338

173Janus Henderson Capital Funds plc / 31 December 2021
Janus Henderson Intech All-World Minimum Variance Core Fund (continued)
The accompanying notes are an integral part of the financial statements.
Capital Share Transactions
For the financial year ended 31 December 2021
. .Z2 GBPShares
At beginning of the year . . . . . . . 5,314,218Shares issued –Shares redeemed. . . . . . . . . . . (5,314,218)At end of year . . . . . . . . . . . . . –
For the financial year ended 31 December 2020
Z2 GBPShares
At beginning of the year . . . . . . . 4,173,988Shares issued 1,140,230Shares redeemed. . . . . . . . . . . –At end of year . . . . . . . . . . . . . 5,314,218
Net Asset Comparison
31 December 2021 31 December 2020 31 December 2019
Net Assets (USD)
NAV Per Share
(Local Currency)Net Assets
(USD)
NAV Per Share
(Local Currency)Net Assets
(USD)
NAV Per Share
(Local Currency)
Z2 GBP – – 1,076,442,610 148.12 743,808,701 134.55. . .
Fund Performance (unaudited)
As at 31 December 2021
Discrete performance
31/12/2020 09/07/2021
%
31/12/2019 31/12/2020
%
31/12/2018 31/12/2019
%
31/12/2017 31/12/2018
%
31/12/2016 31/12/2017
%
Z2 GBP (Net) 10.07 10.09 18.23 (7.60) 20.82FTSE All World Minimum Variance Index + 1.75% 13.82 5.84 17.12 (7.65) 18.45
. . . . .
Class Z2 GBP is disclosed as it is the representative share class.
Performance target: To outperform the FTSE All World Minimum Variance Core Index Net Total Return (Hedged to GBP) by at least 1.75% per annum, before the deduction of charges, over any 5 year period.
Please note the Gross Returns 5 year annualised table is only applicable for share classes which have been active for 5 or more years.
Please note the performance target is to be achieved over a specific annualised time period. Performance target and index shown in USD.
Please note the Z class does not incur fees therefore the Net and Gross performances are the same.
Past performance does not guarantee future returns. The rates of return will vary and the principal value of an investment will fluctuate. Shares, if redeemed, may be worth more or less than their original cost. The performance data does not take account of the commissions and costs incurred on the issue and redemption of Shares. All returns are calculated in the base currency of the representative Share Class.
DocuSign Envelope ID: 521655BF-9BE3-47DC-A9A3-494932954338

Janus Henderson Capital Funds plc / 31 December 2021174
Janus Henderson Intech All-World Minimum Variance Core Fund (continued)
Statements of Changes in Composition of Portfolio (unaudited)The tables below show a breakdown of material purchases and sales of the Investment Portfolio in accordance with Central Bank UCITS Regulations 79(2) requirements. All purchases and sales of investments exceeding 1% of the total value of each transaction respectively, are disclosed, with a minimum number of 20 of each such transaction. A full analysis of the movement on the Investment Portfolio is available upon request from the registered office.
Major Purchases for the year ended 31 December 2021
Shares or Principal Amount
Cost (USD)
Credit Industriel et Commercial, 0.0000%, due 7/7/21 55,100,000 55,099,878iShares MSCI Taiwan ETF 620,000 52,290,058Credit Agricole Corporate And Investment Bank, 0.0000%, due 28/5/21 50,000,000 49,999,972Credit Industriel et Commercial, 0.0000%, due 2/7/21 45,000,000 44,999,900Credit Industriel et Commercial, 0.0000%, due 6/7/21 44,400,000 44,399,605Credit Industriel et Commercial, 0.0000%, due 8/7/21 40,100,000 40,099,911Credit Agricole Corporate And Investment Bank, 0.0000%, due 8/1/21 15,700,000 15,699,969Credit Agricole Corporate And Investment Bank, 0.0000%, due 11/1/21 15,700,000 15,699,908iShares MSCI Korea ETF 61,500 14,607,400Credit Agricole Corporate And Investment Bank, 0.0000%, due 12/1/21 14,000,000 13,999,973Credit Agricole Corporate And Investment Bank, 0.0000%, due 29/1/21 12,600,000 12,599,979Credit Agricole Corporate And Investment Bank, 0.0000%, due 22/1/21 12,400,000 12,399,976Credit Agricole Corporate And Investment Bank, 0.0000%, due 28/1/21 12,000,000 11,999,980Credit Agricole Corporate And Investment Bank, 0.0000%, due 27/1/21 12,000,000 11,999,977Credit Agricole Corporate And Investment Bank, 0.0000%, due 26/1/21 11,400,000 11,399,978Credit Agricole Corporate And Investment Bank, 0.0000%, due 25/1/21 11,400,000 11,399,933Credit Agricole Corporate And Investment Bank, 0.0000%, due 20/1/21 11,200,000 11,199,978Credit Industriel et Commercial, 0.0000%, due 14/5/21 11,100,000 11,099,985Credit Industriel et Commercial, 0.0000%, due 13/5/21 11,000,000 10,999,985Credit Industriel et Commercial, 0.0000%, due 11/5/21 10,900,000 10,899,985
Major Sales for the year ended 31 December 2021
Shares or Principal Amount
Proceeds (USD)
iShares MSCI Taiwan ETF 620,000 51,886,068iShares MSCI Korea ETF 61,500 14,151,853AES Corp. (The) 230,730 6,053,618Prologis, Inc. 50,671 5,871,067Coca-Cola Europacific Partners plc 100,044 5,788,846CME Group, Inc. 27,405 5,664,365Marsh & McLennan Cos, Inc. 41,981 5,630,310American Tower Corp. 22,345 5,596,256Target Corp. 22,959 5,520,419Costco Wholesale Corp. 13,602 5,368,398Starbucks Corp. 47,578 5,343,117American Water Works Co., Inc. 33,530 5,341,351Waste Management, Inc. 38,199 5,299,390Chipotle Mexican Grill, Inc. 3,510 5,298,681Cooper Cos., Inc. (The) 13,099 5,287,835Sherwin-Williams Co. (The) 16,820 5,260,017Discovery, Inc. 138,379 5,244,932Walt Disney Co. (The) 29,038 5,212,855Dollar General Corp. 24,335 5,163,148O'Reilly Automotive, Inc. 9,440 5,120,766
DocuSign Envelope ID: 521655BF-9BE3-47DC-A9A3-494932954338

Janus Henderson Intech European Core Fund
175Janus Henderson Capital Funds plc / 31 December 2021
Fund Overview (unaudited)Investment Objective and Policy
The Fund aims to provide capital growth over the long term.
Performance target: To outperform the MSCI Europe NR Index by at least 2.75% per annum, before the deduction of charges, over any 5 year period.
The Fund invests at least 80% of its assets in shares (equities) and equity-related securities of companies, which at the time of purchase are at least equal in size to a company included in the MSCI Europe NR Index, in any industry, in Europe (including UK).
The Fund is actively managed with reference to the MSCI Europe NR Index, which is broadly representative of the companies in which it may invest, as this forms the basis of the Fund’s performance target. The investment manager has a mathematical approach to investing which controls the extent to which the portfolio may differ from the index.
How Sustainability Risks are part of the investment processThe investments underlying this financial product (referred to as the Fund) do not take into account the EU criteria for environmentally sustainable economic activities, although the Manager and the Investment Manager have agreed a decision making process that will apply to investment decisions relating to the Fund as further detailed in the Prospectus.
The likely impacts of sustainability risks on the returns of the FundWhile the analysis of (Environmental, Social and Governance) ESG factors is an integral component across the Investment Manager’s investment capabilities and one of a number of inputs to the selection of investments and portfolio construction, the investment process of the Investment Manager is primarily designed to maximise long-term risk-adjusted returns for investors. Therefore, in managing the Fund, the Investment Manager does not maximise portfolio alignment with sustainability risks as a separate goal in its own right nor does it precisely attribute the impact of ESG factors on returns for the Fund.
Fund Overview
Adrian Banner, Joseph Runnels and Vassilios Papathanakos, portfolio managers
For the 12-months ended 31 December 2021, the Janus Henderson Intech European Core Fund Class G2 EUR shares returned 23.74 % (Net) and 24.25 % (Gross), compared with 25.13% and 28.57% Target (Gross) for its benchmark, the MSCI Europe Index.
The Fund was negatively impacted by its smaller size positioning as capital concentration in European equity
markets increased during the year, reflecting the relative outperformance of the larger-capitalization stocks over the smaller-capitalization stocks within the MSCI Europe Index on average.
From a sector perspective, the Fund was negatively impacted by an average overweight to utilities, which was among the weakest-performing sectors during the year, as well as an average overweight to materials. While the Fund benefited from favorable selection effects within the consumer discretionary sector during the year, this was offset by adverse selection effects within the energy and information technology sectors.
Intech builds portfolios in a disciplined and systematic manner, with risk management remaining the hallmark of our investment process. As Intech’s ongoing research efforts yield modest improvements, we will continue implementing changes that we believe are likely to improve the long-term results for our clients.
Thank you for investing in Janus Henderson Intech European Core Fund.
January 2022
DocuSign Envelope ID: 521655BF-9BE3-47DC-A9A3-494932954338

Janus Henderson Capital Funds plc / 31 December 2021176
The accompanying notes are an integral part of the financial statements.
Janus Henderson Intech European Core Fund (continued)
s
Statement of Financial PositionAs of
31 December 2021
(EUR)
As of 31 December
2020 (EUR)
Assets:Financial assets at fair value through profit or loss . . . . . . . . . . . . . . . . . . . . . . . . . . . . . . . . . . . . . . . . . . . . . . . . . . . . . . . 140,482,501 115,544,362Cash and foreign currency . . . . . . . . . . . . . . . . . . . . . . . . . . . . . . . . . . . . . . . . . . . . . . . . . . . . . . . . . . . . . . . . . . . . . . . 671,182 631,059Receivables:
Dividends . . . . . . . . . . . . . . . . . . . . . . . . . . . . . . . . . . . . . . . . . . . . . . . . . . . . . . . . . . . . . . . . . . . . . . . . . . . . . . . . . 50,840 35,271Receivable from Investment Manager . . . . . . . . . . . . . . . . . . . . . . . . . . . . . . . . . . . . . . . . . . . . . . . . . . . . . . . . . . . . . . . . 40,112 37,586Other debtors . . . . . . . . . . . . . . . . . . . . . . . . . . . . . . . . . . . . . . . . . . . . . . . . . . . . . . . . . . . . . . . . . . . . . . . . . . . . . . . . 432,575 329,449
Total Assets . . . . . . . . . . . . . . . . . . . . . . . . . . . . . . . . . . . . . . . . . . . . . . . . . . . . . . . . . . . . . . . . . . . . . . . . . 141,677,210 116,577,727 Liabilities (amounts falling due within one year)Payables:
Financial liabilities at fair value through profit or loss . . . . . . . . . . . . . . . . . . . . . . . . . . . . . . . . . . . . . . . . . . . . . . . . . . . . 161 216Bank overdraft and foreign currency . . . . . . . . . . . . . . . . . . . . . . . . . . . . . . . . . . . . . . . . . . . . . . . . . . . . . . . . . . . . . . . 1 –Investment Management fees . . . . . . . . . . . . . . . . . . . . . . . . . . . . . . . . . . . . . . . . . . . . . . . . . . . . . . . . . . . . . . . . . . . 1,564 803Shareholder Service fees . . . . . . . . . . . . . . . . . . . . . . . . . . . . . . . . . . . . . . . . . . . . . . . . . . . . . . . . . . . . . . . . . . . . . . 393 256Accounting, Administration and Transfer Agent fees . . . . . . . . . . . . . . . . . . . . . . . . . . . . . . . . . . . . . . . . . . . . . . . . . . . . 14,713 15,368Management fees . . . . . . . . . . . . . . . . . . . . . . . . . . . . . . . . . . . . . . . . . . . . . . . . . . . . . . . . . . . . . . . . . . . . . . . . . . . 4,228 4,343Accrued expenses . . . . . . . . . . . . . . . . . . . . . . . . . . . . . . . . . . . . . . . . . . . . . . . . . . . . . . . . . . . . . . . . . . . . . . . . . . . 40,262 37,442
Total Liabilities (excluding Net Assets attributable to holders of redeemable ordinary shares) . . . . . . . . . . . . 61,322 58,428 Net Assets attributable to holders of redeemable ordinary participating shares . . . . . . . . . . . . . . . . . . . . . . 141,615,888 116,519,299
.
DocuSign Envelope ID: 521655BF-9BE3-47DC-A9A3-494932954338

177Janus Henderson Capital Funds plc / 31 December 2021
Janus Henderson Intech European Core Fund (continued)
The accompanying notes are an integral part of the financial statements.
Statement of Comprehensive IncomeYear ended
31 December 2021
(EUR)
Year ended 31 December
2020 (EUR)
Year ended Year endedRevenue:Dividend income . . . . . . . . . . . . . . . . . . . . . . . . . . . . . . . . . . . . . . . . . . . . . . . . . . . . . . . . . . . . . . . . . . . . . . . . . . . . . . 3,769,592 2,789,887Other income . . . . . . . . . . . . . . . . . . . . . . . . . . . . . . . . . . . . . . . . . . . . . . . . . . . . . . . . . . . . . . . . . . . . . . . . . . . . . . . . 2,536 –
Net gain on financial assets and liabilities at fair value through profit or loss . . . . . . . . . . . . . . . . . . . . . . . . . . . . . . . . . . . . . . 24,938,967 1,647,121 Total Investments Income . . . . . . . . . . . . . . . . . . . . . . . . . . . . . . . . . . . . . . . . . . . . . . . . . . . . . . . . . . . . . . . 28,711,095 4,437,008
Expenses:Investment Management fees . . . . . . . . . . . . . . . . . . . . . . . . . . . . . . . . . . . . . . . . . . . . . . . . . . . . . . . . . . . . . . . . . . . . . 6,267 3,774Shareholder Service fees . . . . . . . . . . . . . . . . . . . . . . . . . . . . . . . . . . . . . . . . . . . . . . . . . . . . . . . . . . . . . . . . . . . . . . . . 3,534 2,331Management fees . . . . . . . . . . . . . . . . . . . . . . . . . . . . . . . . . . . . . . . . . . . . . . . . . . . . . . . . . . . . . . . . . . . . . . . . . . . . . 32,091 12,978Accounting, Administration and Transfer Agent fees . . . . . . . . . . . . . . . . . . . . . . . . . . . . . . . . . . . . . . . . . . . . . . . . . . . . . . 56,199 52,683Custodian fees . . . . . . . . . . . . . . . . . . . . . . . . . . . . . . . . . . . . . . . . . . . . . . . . . . . . . . . . . . . . . . . . . . . . . . . . . . . . . . . 33,994 24,227Audit fees . . . . . . . . . . . . . . . . . . . . . . . . . . . . . . . . . . . . . . . . . . . . . . . . . . . . . . . . . . . . . . . . . . . . . . . . . . . . . . . . . . 17,828 22,142Printing expenses . . . . . . . . . . . . . . . . . . . . . . . . . . . . . . . . . . . . . . . . . . . . . . . . . . . . . . . . . . . . . . . . . . . . . . . . . . . . . 4,161 5,155Legal and other professional fees . . . . . . . . . . . . . . . . . . . . . . . . . . . . . . . . . . . . . . . . . . . . . . . . . . . . . . . . . . . . . . . . . . 12,157 26,768Other fees . . . . . . . . . . . . . . . . . . . . . . . . . . . . . . . . . . . . . . . . . . . . . . . . . . . . . . . . . . . . . . . . . . . . . . . . . . . . . . . . . . 9,872 25,019
Total Expenses . . . . . . . . . . . . . . . . . . . . . . . . . . . . . . . . . . . . . . . . . . . . . . . . . . . . . . . . . . . . . . . . . . . . . . . 176,103 175,077Less Expense Reimbursement . . . . . . . . . . . . . . . . . . . . . . . . . . . . . . . . . . . . . . . . . . . . . . . . . . . . . . . . . . . (165,645) (162,760)Net Expenses after Expense Reimbursement . . . . . . . . . . . . . . . . . . . . . . . . . . . . . . . . . . . . . . . . . . . . . . . . 10,458 12,317Net Operating Profit . . . . . . . . . . . . . . . . . . . . . . . . . . . . . . . . . . . . . . . . . . . . . . . . . . . . . . . . . . . . . . . . . . . 28,700,637 4,424,691
Finance Costs: 3,462,818 2,244,339
Total distributions to holders of redeemable ordinary shares. . . . . . . . . . . . . . . . . . . . . . . . . . . . . . . . . . . . . . . . . . . . . . . . . (3,462,818) (2,244,339) Withholding tax on dividends and other investment income . . . . . . . . . . . . . . . . . . . . . . . . . . . . . . . . . . . . . (371,369) (268,475)
Net Increase in Net Assets attributable to holders of redeemable ordinary shares resulting from operations . 24,866,450 1,911,877
. .
. .. . .
Statement of Changes in Net Assets Attributable to Redeemable Ordinary ShareholdersYear ended
31 December 2021
(EUR)
Year ended 31 December
2020 (EUR)
Increase in Net Assets attributable to holders of redeemable ordinary shares resulting from operations . . . . . . . . . . . . . . . . . . . . 24,866,450 1,911,877
Capital Share Transactions of redeemable ordinary shares:Proceeds from redeemable ordinary shares sold . . . . . . . . . . . . . . . . . . . . . . . . . . . . . . . . . . . . . . . . . . . . . . . . . . . . . . . 566,149 309,119Redemption of redeemable ordinary shares . . . . . . . . . . . . . . . . . . . . . . . . . . . . . . . . . . . . . . . . . . . . . . . . . . . . . . . . . . (336,010) (263,596)
Net Increase from Capital Share Transactions of redeemable ordinary shares . . . . . . . . . . . . . . . . . . . . . . . . 230,139 45,523
Net Increase in Net Assets attributable to holders of redeemable ordinary shares . . . . . . . . . . . . . . . . . . . . . . . . . . . . . . . . . . . 25,096,589 1,957,400Net Assets attributable to holders of redeemable ordinary shares at the beginning of the financial year . . . . . . . . . . . . . . . . . . . . 116,519,299 114,561,899
Net Assets attributable to holders of redeemable ordinary shares at the end of the financial year . . . . . . . . . 141,615,888 116,519,299
Gains and losses are solely from continuing operations except for the Funds which ceased operations during the financial year ended 31 December 2021 and 31 December 2020. There were no gains and losses other than those dealt with in the Statement of Comprehensive Income. Please refer to note 1 which details the Fund closures during the year.
DocuSign Envelope ID: 521655BF-9BE3-47DC-A9A3-494932954338

Janus Henderson Capital Funds plc / 31 December 2021178
Janus Henderson Intech European Core Fund (continued)
Portfolio Investments
The accompanying notes are an integral part of the financial statements.
Shares or Principal Amount
Percentage of Net Assets
(%)Fair Value
(EUR)
Financial Assets at fair value through profit or lossCommon Stock (2020: 97.07% EUR 113,111,838)DenmarkBeverages
5,626 Carlsberg A/S, B 0.60 854,483
Health Care Equipment & Supplies9,494 Coloplast A/S, B 1.04 1,469,407
Marine142 AP Moller - Maersk A/S, A 0.29 415,876
Pharmaceuticals58,805 Novo Nordisk A/S, B 4.10 5,811,912
Textiles, Apparel & Luxury Goods12,456 Pandora A/S 0.96 1,365,736
FinlandCommunications Equipment
239,017 Nokia OYJ 0.94 1,332,281
Food & Staples Retailing10,634 Kesko OYJ, B 0.22 312,002
Oil, Gas & Consumable Fuels70,118 Neste OYJ 2.15 3,040,317
Pharmaceuticals52,420 Orion OYJ, B 1.35 1,914,378
FranceAuto Components
15,055 Cie Generale des Etablissements Michelin SCA 1.53 2,170,178
1 Faurecia SE 0.00 2116,927 Valeo 0.32 449,920
1.85 2,620,119
Automobiles36,867 Renault SA 0.79 1,126,103
Banks63,564 Credit Agricole SA 0.56 797,728
Beverages3,180 Pernod Ricard SA 0.47 672,570
Capital Markets13,778 Amundi SA 0.71 999,594
Chemicals4,081 Arkema SA 0.36 505,432
Construction & Engineering40,829 Bouygues SA 0.91 1,285,70511,740 Vinci SA 0.77 1,090,763
1.68 2,376,468
Diversified Financial Services8,308 Wendel SE 0.62 875,663
Electric Utilities28,319 Electricite de France SA 0.21 292,535
Entertainment303,765 Bollore SA 1.06 1,494,524
Equity Real Estate Investment Trusts (REITs)3,114 Gecina SA 0.27 382,711
Food & Staples Retailing91,581 Carrefour SA 1.04 1,474,912
Shares or Principal Amount
Percentage of Net Assets
(%)Fair Value
(EUR)
Food Products
29,812 Danone SA 1.15 1,627,437
Hotels, Restaurants & Leisure20,314 Accor SA 0.41 577,933
IT Services47,002 Edenred 1.35 1,906,871
Life Sciences Tools & Services914 Sartorius Stedim Biotech 0.31 440,914
Media29,367 Publicis Groupe SA 1.23 1,738,526
Multi-Utilities30,624 Suez SA 0.43 606,66122,589 Veolia Environnement SA 0.51 728,721
0.94 1,335,382
Textiles, Apparel & Luxury Goods732 Kering SA 0.37 517,451
GermanyAutomobiles
1,985 Volkswagen AG 0.36 512,924
Chemicals7,004 LANXESS AG 0.27 381,718
Diversified Telecommunication Services49,117 Deutsche Telekom AG 0.57 800,607
Insurance18,419 Allianz SE 2.70 3,824,7053,095 Hannover Rueck SE 0.37 517,329
3.07 4,342,034
Machinery24,204 GEA Group AG 0.82 1,163,970
Multi-Utilities80,162 E.ON SE 0.69 977,335
Trading Companies & Distributors4,343 Brenntag SE 0.24 345,616
IrelandConstruction Materials
19,647 CRH plc 0.65 913,978
Isle of ManHotels, Restaurants & Leisure
21,731 Entain plc 0.31 434,816
ItalyBanks
167,374 Intesa Sanpaolo SpA 0.27 380,609
Insurance143,276 Assicurazioni Generali SpA 1.88 2,669,232
NetherlandsChemicals
19,809 Akzo Nobel NV 1.35 1,911,5691,627 Koninklijke DSM NV 0.23 322,146
1.58 2,233,715
Insurance27,921 NN Group NV 0.94 1,329,319
Professional Services26,104 Wolters Kluwer NV 1.91 2,704,374
DocuSign Envelope ID: 521655BF-9BE3-47DC-A9A3-494932954338

179Janus Henderson Capital Funds plc / 31 December 2021
The accompanying notes are an integral part of the financial statements.
Janus Henderson Intech European Core Fund (continued)
Portfolio Investments
Shares or Principal Amount
Percentage of Net Assets
(%)Fair Value
(EUR)
Semiconductors & Semiconductor Equipment
2,167 ASM International NV 0.59 842,3132,156 ASML Holding NV 1.08 1,523,645
33,325 STMicroelectronics NV 1.02 1,445,3052.69 3,811,263
NorwayMetals & Mining
683,432 Norsk Hydro ASA 3.35 4,738,777
Oil, Gas & Consumable Fuels15,667 Equinor ASA 0.26 368,617
PortugalElectric Utilities
180,563 EDP - Energias de Portugal SA 0.62 872,480
Food & Staples Retailing32,745 Jeronimo Martins SGPS SA 0.46 658,175
Oil, Gas & Consumable Fuels192,559 Galp Energia SGPS SA 1.16 1,640,603
SpainBanks
94,175 Banco Bilbao Vizcaya Argentaria SA 0.35 494,419
Diversified Telecommunication Services109,875 Telefonica SA 0.30 423,239
Gas Utilities49,365 Naturgy Energy Group SA 1.00 1,413,320
SwedenCommunications Equipment
47,249 Telefonaktiebolaget LM Ericsson, B 0.32 458,312
Construction & Engineering18,835 Skanska AB, B 0.30 428,779
Hotels, Restaurants & Leisure17,708 Evolution AB 1.56 2,213,906
Household Products54,309 Essity AB, B 1.10 1,559,421
Machinery18,156 Epiroc AB, B 0.24 338,317
110,640 Volvo AB, B 1.59 2,254,6971.83 2,593,014
Software39,945 Sinch AB 0.32 446,909
Specialty Retail39,942 H & M Hennes & Mauritz AB, B 0.49 691,395
Tobacco500,770 Swedish Match AB 2.47 3,505,682
Wireless Telecommunication Services211,561 Tele2 AB, B 1.87 2,654,868
SwitzerlandBeverages
35,769 Coca-Cola HBC AG 0.77 1,086,523
Building Products5,849 Geberit AG 2.97 4,201,532
Capital Markets3,947 Partners Group Holding AG 4.06 5,754,608
Electrical Equipment50,267 ABB Ltd. 1.19 1,691,070
Shares or Principal Amount
Percentage of Net Assets
(%)Fair Value
(EUR)
Food Products
5,956 Nestle SA 0.52 731,667
Health Care Equipment & Supplies245 Straumann Holding AG 0.32 457,456
Insurance4,537 Zurich Insurance Group AG 1.24 1,751,121
Life Sciences Tools & Services5,299 Lonza Group AG 2.75 3,890,220
Marine3,611 Kuehne + Nagel International AG 0.72 1,024,751
Pharmaceuticals38,352 Novartis AG 2.10 2,967,896
2,557 Roche Holding AG 0.71 1,007,6166,022 Vifor Pharma AG 0.66 941,843
3.47 4,917,355
Real Estate Management & Development4,029 Swiss Prime Site AG 0.25 348,178
Technology Hardware, Storage & Peripherals11,359 Logitech International SA 0.59 841,796
Textiles, Apparel & Luxury Goods2,182 Swatch Group AG (The) 0.41 586,830
United KingdomAerospace & Defense
267,677 Rolls-Royce Holdings plc 0.28 391,051
Banks1,517,575 Lloyds Banking Group plc 0.61 862,421
Capital Markets129,542 St James's Place plc 1.83 2,592,776
Chemicals17,402 Croda International plc 1.48 2,093,731
29,203 Johnson Matthey plc 0.50 710,3531.98 2,804,084
Equity Real Estate Investment Trusts (REITs)39,293 Land Securities Group plc 0.26 362,695
Food & Staples Retailing300,918 J Sainsbury plc 0.70 986,697
Insurance45,611 Admiral Group plc 1.21 1,711,928
65,898 Prudential plc 0.70 998,5121.91 2,710,440
Machinery11,088 Spirax-Sarco Engineering plc 1.49 2,115,775
Metals & Mining245,924 Evraz plc 1.24 1,758,936
Multiline Retail44,368 Next plc 3.04 4,299,013
Personal Products9,689 Unilever plc 0.32 454,488
Pharmaceuticals25,004 AstraZeneca plc 1.82 2,579,707
Software122,463 Sage Group plc (The) 0.88 1,241,342
DocuSign Envelope ID: 521655BF-9BE3-47DC-A9A3-494932954338

Janus Henderson Capital Funds plc / 31 December 2021180
The accompanying notes are an integral part of the financial statements.
Janus Henderson Intech European Core Fund (continued)
Portfolio Investments
Shares or Principal Amount
Percentage of Net Assets
(%)Fair Value
(EUR)
United StatesDiversified Financial Services
0 Jackson Financial, Inc., A 0.00 10
Total Common Stock 96.66 136,885,233
Preferred Stock (2020: 2.09% EUR 2,432,523)GermanyAutomobiles
43,112 Porsche Automobil Holding SE 2.54 3,597,265
Total Preferred Stock 2.54 3,597,265
Total Investments (Cost: EUR 119,428,032) 99.20 140,482,498
Forward Currency Contracts (2020: 0.00% EUR 1)Open as at 31 December 2021.
Current Market
Percentage of Net Unrealised
Currency Currency Value Settle Assets GainPurchased Sold (EUR) Date (%) (EUR)
.J.P. Morgan EUR◊ 627 USD 706 624 31-Jan-22 0.00 3
Total 0.00 3
.
Total Financial Assets at fair value through profit or loss 99.20 140,482,501
Financial Liabilities at fair value through profit or loss.Forward Currency Contracts (2020: 0.00% EUR (216))Open as at 31 December 2021
Current Market
Percentage of Net Unrealised
Currency Currency Value Settle Assets LossPurchased Sold (EUR) Date (%) (EUR)
J.P. Morgan USD◊ 12,684 EUR 11,299 11,138 31-Jan-22 0.00 (161)
Total 0.00 (161).
Total Financial Liabilities at fair value through profit or loss 0.00 (161)
Portfolio Analysis (Unaudited)
Analysis of Total Assets:% of Total
AssetsTransferable securities admitted to official stock exchange listing 99.16OTC financial derivative instruments 0.00Other Assets 0.84Total Assets 100.00
◊ These forward currency contracts are used for share class hedging.
DocuSign Envelope ID: 521655BF-9BE3-47DC-A9A3-494932954338

181Janus Henderson Capital Funds plc / 31 December 2021
The accompanying notes are an integral part of the financial statements.
Janus Henderson Intech European Core Fund (continued)
Fair Value Hierarchy
The tables below provide the fair value hierarchy summary of the Fund’s financial assets and liabilities measured at fair value at 31 December 2021 and 31 December 2020.
31 December 2021
Level 1 - Quoted Prices
(USD)
Level 2 - Other Significant
Observable Inputs (USD)
Level 3 - Significant
Unobservable Inputs (USD)
Total (USD)
Common Stock 136,885,233 – – 136,885,233Forward Currency Contracts – (158) – (158)Preferred Stock 3,597,265 – – 3,597,265Total Investments in Securities 140,482,498 (158) – 140,482,340
31 December 2020
Level 1 - Quoted Prices
(EUR)
Level 2 - Other Significant
Observable Inputs (EUR)
Level 3 - Significant
Unobservable Inputs (EUR)
Total (EUR)
Common Stock 2,769,539 110,342,2991 – 113,111,838Forward Currency Contracts – (215) – (215)Preferred Stock – 2,432,5232 – 2,432,523Total Investments in Securities 2,769,539 112,774,607 – 115,544,146
1At 31 December 2020, the administrator used a systematic fair valuation model provided by an independent third party to value listed securities in order to adjust for stale pricing between the close of foreign exchanges and the valuation point. This resulted in an increase of EUR 2,865 to common stocks with a fair value of EUR 110,342,299.
2At 31 December 2020, the administrator used a systematic fair valuation model provided by an independent third party to value listed securities in order to adjust for stale pricing between the close of foreign exchanges and the valuation point. This resulted in an increase of EUR 1,007 to preferred stocks with a fair value of EUR 2,432,523.
There were transfers on Common Stock and Preferred Stock from level 2 to level 1 during the financial year ended 31 December 2021 and on Common Stock from level 1 to level 2 during the financial year ended 31 December 2020.
There were no investments held by the Fund at 31 December 2021 and 31 December 2020 that were fair valued at level 3 by the Janus Henderson Global Pricing Committee.
Valuation policy of private placements is referenced in note 2 of the financial statements.
DocuSign Envelope ID: 521655BF-9BE3-47DC-A9A3-494932954338

Janus Henderson Capital Funds plc / 31 December 2021182
Janus Henderson Intech European Core Fund (continued)
The accompanying notes are an integral part of the financial statements.
Capital Share Transactions
For the financial year ended 31 December 2021
A2 EUR A2 HUSD E2 EUR E2 HUSD G2 EUR I2 EUR I2 HUSD Z1 EURShares Shares Shares Shares Shares Shares Shares Shares
At beginning of the year . . . . . . . 23,208 300 4,985 300 261 263 300 815,026Shares issued 25,978 – 2,153 – – 6,953 – 1Shares redeemed. . . . . . . . . . . (10,454) – (3,061) – – (6,953) – (1)At end of year . . . . . . . . . . . . . 38,732 300 4,077 300 261 263 300 815,026
For the financial year ended 31 December 2020
A2 EUR A2 HUSD E2 EUR E2 HUSD G2 EUR I2 EUR I2 HUSD Z1 EURShares Shares Shares Shares Shares Shares Shares Shares
At beginning of the year . . . . . . . 19,766 300 6,382 300 261 263 300 815,025Shares issued 14,659 – 2,789 – – 5,802 – 1Shares redeemed. . . . . . . . . . . (11,217) – (4,186) – – (5,802) – –At end of year . . . . . . . . . . . . . 23,208 300 4,985 300 261 263 300 815,026
DocuSign Envelope ID: 521655BF-9BE3-47DC-A9A3-494932954338

183Janus Henderson Capital Funds plc / 31 December 2021
Janus Henderson Intech European Core Fund (continued)
The accompanying notes are an integral part of the financial statements.
Net Asset Comparison
31 December 2021 31 December 2020 31 December 2019
Net Assets (EUR)
NAV Per Share
(Local Currency)Net Assets
(EUR)
NAV Per Share
(Local Currency)Net Assets
(EUR)
NAV Per Share
(Local Currency)
A2 EUR 679,782 17.55 333,197 14.36 278,097 14.07A2 HUSD 3,516 13.34 2,658 10.82 2,791 10.43E2 EUR 65,574 16.08 66,101 13.26 83,632 13.10E2 HUSD 3,449 13.09 2,631 10.71 2,787 10.42G2 EUR 3,916 15.01 3,165 12.13 3,064 11.75I2 EUR 4,638 17.61 3,770 14.32 3,673 13.95I2 HUSD 3,558 13.50 2,673 10.89 2,793 10.44Z1 EUR 140,851,455 172.82 116,105,104 142.46 114,185,062 140.10
. . .
Total Expense Ratio (unaudited)
The Average Total Expense Ratio table shows the actual expenses, excluding transactions costs and trade commissions, incurred by each Class for the Fund during the reporting financial year expressed as a percentage of the average net assets for the corresponding year, on an annualised basis.
31 December 2021 31 December 2020 31 December 2019A2 EUR 1.71% 1.75% 1.75%A2 HUSD 1.75% 1.69% 1.75%E2 EUR 2.50% 2.57% 2.75%E2 HUSD 2.75% 2.56% 2.62%G2 EUR 0.41% 0.53% –I2 EUR 1.11% 1.21% 1.24%I2 HUSD 1.03% 1.20% 1.24%
Distribution per share (unaudited)
The following table shows the distribution rate per share at Ex-date for each distributing share class :
Share Class (Local Currency) 15/01/2021 12/02/2021 15/03/2021 15/04/2021 14/05/2021 15/06/2021 15/07/2021 13/08/2021 15/09/2021 15/10/2021 15/11/2021 15/12/2021Z1 EUR – – – – – – – – – 4.24872 – –
– – – – – – – – – – – –
DocuSign Envelope ID: 521655BF-9BE3-47DC-A9A3-494932954338

Janus Henderson Capital Funds plc / 31 December 2021184
Janus Henderson Intech European Core Fund (continued)
The accompanying notes are an integral part of the financial statements.
Fund Performance (unaudited)
As at 31 December 2021
One year Three years Five yearsSince
inception
Performance (Annualised) 31/12/2020 31/12/2021
%
31/12/2017 31/12/2021
%
31/12/2015 31/12/2021
%
to 31/12/2021
%
G2 EUR (Net)* 23.74 16.01** 9.90** 7.44**MSCI Europe NR 25.13 15.10 8.50 7.26
Five years 31/12/2015 31/12/2021
%G2 EUR (Gross)* 11.81MSCI Europe NR + 2.75% 11.48
.
Discrete performance
31/12/2020 31/12/2021
%
31/12/2019 31/12/2020
%
31/12/2018 31/12/2019
%
31/12/2017 31/12/2018
%
31/12/2016 31/12/2017
%
G2 EUR (Net)* 23.74 2.06** 25.18** (8.47)** 12.15**MSCI Europe NR 25.13 (3.32) 26.05 (10.57) 10.24
G2 EUR (Gross)* 24.25 3.84** 27.35** (6.87)** 14.07**MSCI Europe NR + 2.75% 28.57 (0.66) 29.51 (8.10) 13.26
. . . . .
Class G2 EUR is disclosed as it is the representative share class.
* The representative share class has changed from the H2 USD to the G2 USD share class with effect from August 2021.
** Historical figures are based on the A2 USD share class.
Performance Target: To outperform the MSCI Europe NR Index by at least 2.75% per annum, before the deduction of charges, over any 5 year period.
Please note the Gross Returns 5 year annualised table is only applicable for share classes which have been active for 5 or more years and the performance target is to be achieved over a specific annualised time period. Performance target and index shown in USD.
Past performance does not guarantee future returns. The rates of return will vary and the principal value of an investment will fluctuate. Shares, if redeemed, may be worth more or less than their original cost. The performance data does not take account of the commissions and costs incurred on the issue and redemption of Shares. All returns are calculated in the base currency of the representative Share Class.
There is no guarantee that the Fund’s performance will match or exceed the benchmark.
DocuSign Envelope ID: 521655BF-9BE3-47DC-A9A3-494932954338

185Janus Henderson Capital Funds plc / 31 December 2021
Janus Henderson Intech European Core Fund (continued)
Statements of Changes in Composition of Portfolio (unaudited)The tables below show a breakdown of material purchases and sales of the Investment Portfolio in accordance with Central Bank UCITS Regulations 79(2) requirements. All purchases and sales of investments exceeding 1% of the total value of each transaction respectively, are disclosed, with a minimum number of 20 of each such transaction. A full analysis of the movement on the Investment Portfolio is available upon request from the registered office.
Major Purchases for the year ended 31 December 2021
Shares or Principal Amount
Cost (EUR)
Norsk Hydro ASA 683,432 3,909,902Lonza Group AG 5,299 3,699,085Allianz SE 18,419 3,693,977Swedish Match AB 444,350 3,262,701Tele2 AB 'B' 211,561 2,623,894Hannover Rueck SE 16,492 2,573,398Geberit AG 4,145 2,561,991St James's Place plc 129,542 2,363,316Wolters Kluwer NV 26,104 2,348,219Bayerische Motoren Werke AG 26,320 2,299,383Evraz plc 312,446 2,249,148Vifor Pharma AG 17,511 2,022,260Croda International plc 17,402 1,928,054Galp Energia SGPS SA 192,559 1,885,143SAP SE 15,046 1,793,390Bouygues SA 50,696 1,755,946Tenaris SA 193,547 1,743,194Zurich Insurance Group AG 4,537 1,688,571Publicis Groupe SA 29,367 1,660,917Prudential plc 94,135 1,624,740Land Securities Group plc 188,822 1,546,476ASML Holding NV 2,156 1,533,464Bayerische Motoren Werke AG, Preference 21,695 1,525,034Pandora A/S 12,456 1,475,506Akzo Nobel NV 13,942 1,470,323Essity AB 'B' 54,309 1,433,810Eurazeo SE 16,782 1,410,040Deutsche Telekom AG 88,814 1,409,858Coloplast A/S 'B' 9,494 1,391,997Symrise AG 10,887 1,352,530Bollore SA 310,795 1,337,679STMicroelectronics NV 33,325 1,328,965Admiral Group plc 37,482 1,322,059Danone SA 22,076 1,270,640
Major Sales for the year ended 31 December 2021
Shares or Principal Amount
Proceeds (EUR)
Entain plc 235,916 4,146,057Bayerische Motoren Werke AG 41,700 3,625,510Groupe Bruxelles Lambert SA 32,775 3,304,200Tele2 AB 'B' 269,069 3,198,752Hannover Rueck SE 19,271 3,015,091Coca-Cola Europacific Partners plc 67,899 3,009,514J Sainsbury plc 878,512 2,906,868Nokia OYJ 560,811 2,841,446Johnson Matthey plc 86,074 2,663,426Alfa Laval AB 87,192 2,642,117Symrise AG 21,514 2,593,624Stellantis NV 171,826 2,557,236Pandora A/S 21,164 2,417,745Worldline SA 31,713 2,357,925RWE AG 70,224 2,282,454Intertek Group plc 37,863 2,238,850Danone SA 34,959 2,021,881Vifor Pharma AG 17,245 1,978,492Tenaris SA 193,547 1,872,281SAP SE 15,046 1,835,058Coca-Cola HBC AG 58,753 1,721,098Spirax-Sarco Engineering plc 9,429 1,707,073Land Securities Group plc 207,833 1,696,391STMicroelectronics NV 46,465 1,669,458Croda International plc 20,296 1,598,242EDP - Energias de Portugal SA 346,978 1,567,833Bollore SA 300,728 1,557,947Bayerische Motoren Werke AG, Preference 21,695 1,544,520Admiral Group plc 43,320 1,542,010Ferguson plc 11,641 1,535,863Naturgy Energy Group SA 69,780 1,514,368ABB Ltd. 50,698 1,492,920Terna - Rete Elettrica Nazionale 227,323 1,455,683EXOR NV 18,346 1,419,806ICA Gruppen AB 31,618 1,413,061Eurazeo SE 16,782 1,321,163Lundin Energy AB 34,656 1,206,066
DocuSign Envelope ID: 521655BF-9BE3-47DC-A9A3-494932954338

Janus Henderson Intech Global Absolute Return Fund
Janus Henderson Capital Funds plc / 31 December 2021186
The Fund ceased investment activities on 03 March 2021.
Please refer to the fund performance (unaudited) note for details on the Funds performance during the year.
DocuSign Envelope ID: 521655BF-9BE3-47DC-A9A3-494932954338

187Janus Henderson Capital Funds plc / 31 December 2021
The accompanying notes are an integral part of the financial statements.
Janus Henderson Intech Global Absolute Return Fund (continued)
s
Statement of Financial PositionAs of
31 December 2021
(USD)*
As of 31 December
2020 (USD)
Assets:Financial assets at fair value through profit or loss . . . . . . . . . . . . . . . . . . . . . . . . . . . . . . . . . . . . . . . . . . . . . . . . . . . . . . . – 4,880,546Cash and foreign currency . . . . . . . . . . . . . . . . . . . . . . . . . . . . . . . . . . . . . . . . . . . . . . . . . . . . . . . . . . . . . . . . . . . . . . . 27,471 52,203Margin cash . . . . . . . . . . . . . . . . . . . . . . . . . . . . . . . . . . . . . . . . . . . . . . . . . . . . . . . . . . . . . . . . . . . . . . . . . . . . . . . . . – 125,546Receivables:
Investments sold . . . . . . . . . . . . . . . . . . . . . . . . . . . . . . . . . . . . . . . . . . . . . . . . . . . . . . . . . . . . . . . . . . . . . . . . . . . . – 72Dividends . . . . . . . . . . . . . . . . . . . . . . . . . . . . . . . . . . . . . . . . . . . . . . . . . . . . . . . . . . . . . . . . . . . . . . . . . . . . . . . . . – 2,679
Receivable from Investment Manager . . . . . . . . . . . . . . . . . . . . . . . . . . . . . . . . . . . . . . . . . . . . . . . . . . . . . . . . . . . . . . . . 284 14,777Other debtors . . . . . . . . . . . . . . . . . . . . . . . . . . . . . . . . . . . . . . . . . . . . . . . . . . . . . . . . . . . . . . . . . . . . . . . . . . . . . . . . 169 9,939
Total Assets . . . . . . . . . . . . . . . . . . . . . . . . . . . . . . . . . . . . . . . . . . . . . . . . . . . . . . . . . . . . . . . . . . . . . . . . . 27,924 5,085,762 Liabilities (amounts falling due within one year)Payables:
Financial liabilities at fair value through profit or loss . . . . . . . . . . . . . . . . . . . . . . . . . . . . . . . . . . . . . . . . . . . . . . . . . . . . – 39,777Bank overdraft and foreign currency . . . . . . . . . . . . . . . . . . . . . . . . . . . . . . . . . . . . . . . . . . . . . . . . . . . . . . . . . . . . . . . – 15Fund shares repurchased . . . . . . . . . . . . . . . . . . . . . . . . . . . . . . . . . . . . . . . . . . . . . . . . . . . . . . . . . . . . . . . . . . . . . . 1,501 –Investment Management fees . . . . . . . . . . . . . . . . . . . . . . . . . . . . . . . . . . . . . . . . . . . . . . . . . . . . . . . . . . . . . . . . . . . (3) 2,745Shareholder Service fees . . . . . . . . . . . . . . . . . . . . . . . . . . . . . . . . . . . . . . . . . . . . . . . . . . . . . . . . . . . . . . . . . . . . . . – 1Accounting, Administration and Transfer Agent fees . . . . . . . . . . . . . . . . . . . . . . . . . . . . . . . . . . . . . . . . . . . . . . . . . . . . (1,013) –Management fees . . . . . . . . . . . . . . . . . . . . . . . . . . . . . . . . . . . . . . . . . . . . . . . . . . . . . . . . . . . . . . . . . . . . . . . . . . . (6) 95Accrued expenses . . . . . . . . . . . . . . . . . . . . . . . . . . . . . . . . . . . . . . . . . . . . . . . . . . . . . . . . . . . . . . . . . . . . . . . . . . . 27,445 45,133
Total Liabilities (excluding Net Assets attributable to holders of redeemable ordinary shares) . . . . . . . . . . . . 27,924 87,766 Net Assets attributable to holders of redeemable ordinary participating shares . . . . . . . . . . . . . . . . . . . . . . – 4,997,996
* The Fund ceased investment activities on 03 March 2021.
DocuSign Envelope ID: 521655BF-9BE3-47DC-A9A3-494932954338

Janus Henderson Capital Funds plc / 31 December 2021188
Janus Henderson Intech Global Absolute Return Fund (continued)
The accompanying notes are an integral part of the financial statements.
Statement of Comprehensive IncomeYear ended
31 December 2021
(USD)*
Year ended 31 December
2020 (USD)
Year ended Year endedRevenue:Interest income . . . . . . . . . . . . . . . . . . . . . . . . . . . . . . . . . . . . . . . . . . . . . . . . . . . . . . . . . . . . . . . . . . . . . . . . . . . . . . . 1,468 844Dividend income . . . . . . . . . . . . . . . . . . . . . . . . . . . . . . . . . . . . . . . . . . . . . . . . . . . . . . . . . . . . . . . . . . . . . . . . . . . . . . 13,629 73,163Other income . . . . . . . . . . . . . . . . . . . . . . . . . . . . . . . . . . . . . . . . . . . . . . . . . . . . . . . . . . . . . . . . . . . . . . . . . . . . . . . . – 128
Net (loss) on financial assets and liabilities at fair value through profit or loss . . . . . . . . . . . . . . . . . . . . . . . . . . . . . . . . . . . . . . (165,594) (11,644) Total Investments (Loss)/Income . . . . . . . . . . . . . . . . . . . . . . . . . . . . . . . . . . . . . . . . . . . . . . . . . . . . . . . . . . (150,497) 62,491
Expenses:Investment Management fees . . . . . . . . . . . . . . . . . . . . . . . . . . . . . . . . . . . . . . . . . . . . . . . . . . . . . . . . . . . . . . . . . . . . . 5,554 31,707Shareholder Service fees . . . . . . . . . . . . . . . . . . . . . . . . . . . . . . . . . . . . . . . . . . . . . . . . . . . . . . . . . . . . . . . . . . . . . . . . 2 7Management fees . . . . . . . . . . . . . . . . . . . . . . . . . . . . . . . . . . . . . . . . . . . . . . . . . . . . . . . . . . . . . . . . . . . . . . . . . . . . . 205 585Accounting, Administration and Transfer Agent fees . . . . . . . . . . . . . . . . . . . . . . . . . . . . . . . . . . . . . . . . . . . . . . . . . . . . . . 19,672 3,794Custodian fees . . . . . . . . . . . . . . . . . . . . . . . . . . . . . . . . . . . . . . . . . . . . . . . . . . . . . . . . . . . . . . . . . . . . . . . . . . . . . . . 5,614 42,976Audit fees . . . . . . . . . . . . . . . . . . . . . . . . . . . . . . . . . . . . . . . . . . . . . . . . . . . . . . . . . . . . . . . . . . . . . . . . . . . . . . . . . . 18,374 23,374Printing expenses . . . . . . . . . . . . . . . . . . . . . . . . . . . . . . . . . . . . . . . . . . . . . . . . . . . . . . . . . . . . . . . . . . . . . . . . . . . . . (113) 956Legal and other professional fees . . . . . . . . . . . . . . . . . . . . . . . . . . . . . . . . . . . . . . . . . . . . . . . . . . . . . . . . . . . . . . . . . . 1,595 20,355Other fees . . . . . . . . . . . . . . . . . . . . . . . . . . . . . . . . . . . . . . . . . . . . . . . . . . . . . . . . . . . . . . . . . . . . . . . . . . . . . . . . . . 181 17,492
Total Expenses . . . . . . . . . . . . . . . . . . . . . . . . . . . . . . . . . . . . . . . . . . . . . . . . . . . . . . . . . . . . . . . . . . . . . . . 51,084 141,246Less Expense Reimbursement . . . . . . . . . . . . . . . . . . . . . . . . . . . . . . . . . . . . . . . . . . . . . . . . . . . . . . . . . . . (43,294) (96,803)Net Expenses after Expense Reimbursement . . . . . . . . . . . . . . . . . . . . . . . . . . . . . . . . . . . . . . . . . . . . . . . . 7,790 44,443Net Operating (Loss)/Profit . . . . . . . . . . . . . . . . . . . . . . . . . . . . . . . . . . . . . . . . . . . . . . . . . . . . . . . . . . . . . . (158,287) 18,048
Withholding tax on dividends and other investment income . . . . . . . . . . . . . . . . . . . . . . . . . . . . . . . . . . . . . (1,806) (17,450)
Net (Decrease)/Increase in Net Assets attributable to holders of redeemable ordinary shares resulting from operations . . . . . . . . . . . . . . . . . . . . . . . . . . . . . . . . . . . . . . . . . . . . . . . . . . . . . . . . . . . . . . . . . . . . . . . . . . . (160,093) 598
. .
. .. . .
Statement of Changes in Net Assets Attributable to Redeemable Ordinary ShareholdersYear ended
31 December 2021
(USD)*
Year ended 31 December
2020 (USD)
(Decrease)/Increase in Net Assets attributable to holders of redeemable ordinary shares resulting from operations . . . . . . . . . . . . (160,093) 598
Capital Share Transactions of redeemable ordinary shares:Redemption of redeemable ordinary shares . . . . . . . . . . . . . . . . . . . . . . . . . . . . . . . . . . . . . . . . . . . . . . . . . . . . . . . . . . (4,837,903) –
Net (Decrease) from Capital Share Transactions of redeemable ordinary shares . . . . . . . . . . . . . . . . . . . . . . (4,837,903) –
Net (Decrease)/Increase in Net Assets attributable to holders of redeemable ordinary shares . . . . . . . . . . . . . . . . . . . . . . . . . . . (4,997,996) 598Net Assets attributable to holders of redeemable ordinary shares at the beginning of the financial year . . . . . . . . . . . . . . . . . . . . 4,997,996 4,997,398
Net Assets attributable to holders of redeemable ordinary shares at the end of the financial year . . . . . . . . . – 4,997,996
* The Fund ceased investment activities on 03 March 2021.
Gains and losses are solely from continuing operations except for the Funds which ceased operations during the financial year ended 31 December 2021 or 31 December 2020. There were no gains and losses other than those dealt with in the Statement of Comprehensive Income. Please refer to note 1 which details the Fund closures during the year.
DocuSign Envelope ID: 521655BF-9BE3-47DC-A9A3-494932954338

189Janus Henderson Capital Funds plc / 31 December 2021
The accompanying notes are an integral part of the financial statements.
Janus Henderson Intech Global Absolute Return Fund (continued)
Fair Value Hierarchy
The Fund ceased operations on 03 March 2021. There were no investments held by the Fund at 31 December 2021. The table below provides the fair value hierarchy summary of the Fund’s financial assets and liabilities measured at fair value at 31 December 2020.
31 December 2020
Level 1 - Quoted Prices
(USD)
Level 2 - Other Significant
Observable Inputs (USD)
Level 3 - Significant
Unobservable Inputs (USD)
Total (USD)
Common Stock 2,976,333 1,393,2481 – 4,369,581Futures (39,777) – – (39,777)Government Obligations – 510,965 – 510,965Total Investments in Securities 2,936,556 1,904,213 – 4,840,769
1At 31 December 2020, the administrator used a systematic fair valuation model provided by an independent third party to value listed securities in order to adjust for stale pricing between the close of foreign exchanges and the valuation point. This resulted in an increase of USD 1,460 to common stocks with a fair value of USD 1,393,248.
There were transfers on Government Obligations from level 1 to level 2 during the financial year ended 31 December 2020.
There were no investments held by the Fund at 31 December 2020 that were fair valued at level 3 by the Janus Henderson Global Pricing Committee.
Valuation policy of private placements is referenced in note 2 of the financial statements.
Capital Share Transactions
For the financial year ended 31 December 2021
. .A2 USD H2 USD I2 USDShares Shares Shares
At beginning of the year . . . . . . . 300 499,400 300Shares issued – – –Shares redeemed. . . . . . . . . . . (300) (499,400) (300)At end of year . . . . . . . . . . . . . – – –
For the financial year ended 31 December 2020
A2 USD H2 USD I2 USDShares Shares Shares
At beginning of the year . . . . . . . 300 499,400 300Shares issued – – –Shares redeemed. . . . . . . . . . . – – –At end of year . . . . . . . . . . . . . 300 499,400 300
Net Asset Comparison
31 December 2021 31 December 2020 31 December 2019
Net Assets (USD)
NAV Per Share
(Local Currency)Net Assets
(USD)
NAV Per Share
(Local Currency)Net Assets
(USD)
NAV Per Share
(Local Currency)
A2 USD – – 2,950 9.83 2,977 9.92H2 USD – – 4,992,067 10.00 4,991,431 9.99I2 USD – – 2,979 9.93 2,990 9.97
. . .
DocuSign Envelope ID: 521655BF-9BE3-47DC-A9A3-494932954338

Janus Henderson Capital Funds plc / 31 December 2021190
Janus Henderson Intech Global Absolute Return Fund (continued)
The accompanying notes are an integral part of the financial statements.
Fund Performance (unaudited)
As at 31 December 2021
Discrete performance
31/12/2020 03/03/2021
%
31/12/2019 31/12/2020
%
7/02/2019 31/12/2019
%
A2 USD (Net) (3.26) (0.91) (0.80)FTSE Treasury Bill 3 month 0.01 0.58 2.05
A2 USD (Gross) (2.97) – –. . .
Class A2 USD is disclosed as it is the representative share class.
Performance target: To provide a positive return, over any 3 year period.
Past performance does not guarantee future returns. The rates of return will vary and the principal value of an investment will fluctuate. Shares, if redeemed, may be worth more or less than their original cost. The performance data does not take account of the commissions and costs incurred on the issue and redemption of Shares. All returns are calculated in the base currency of the representative Share Class.
There is no guarantee that the Fund’s performance will match or exceed the benchmark.
DocuSign Envelope ID: 521655BF-9BE3-47DC-A9A3-494932954338

191Janus Henderson Capital Funds plc / 31 December 2021
Janus Henderson Intech Global Absolute Return Fund (continued)
Statements of Changes in Composition of Portfolio (unaudited)The tables below show a breakdown of material purchases and sales of the Investment Portfolio in accordance with Central Bank UCITS Regulations 79(2) requirements. All purchases and sales of investments exceeding 1% of the total value of each transaction respectively, are disclosed, with a minimum number of 20 of each such transaction. A full analysis of the movement on the Investment Portfolio is available upon request from the registered office.
Major Purchases for the year ended 31 December 2021
Shares or Principal Amount
Cost (USD)
Credit Agricole Corporate And Investment Bank, 0.0000%, due 25/2/21 200,000 200,000Credit Agricole Corporate And Investment Bank, 0.0000%, due 13/1/21 100,000 100,000Credit Agricole Corporate And Investment Bank, 0.0000%, due 16/2/21 100,000 99,999Cloudflare, Inc. 777 64,054Jardine Matheson Holdings Ltd. 1,000 49,565Novocure Ltd. 267 48,596Keysight Technologies, Inc. 301 42,769SVB Financial Group 78 40,655Discovery, Inc. 899 37,954Waters Corp. 110 30,976Chewy, Inc. 272 29,450Walmart, Inc. 208 28,526Xinyi Glass Holdings Ltd. 10,000 28,522Oji Holdings Corp. 4,200 28,240Nidec Corp. 200 27,878Keio Corp. 300 24,283Aeon Co. Ltd. 700 23,867Invesco Ltd. 954 21,758Kroger Co. (The) 600 20,137Micron Technology, Inc. 210 18,231Toyota Industries Corp. 200 17,891Peloton Interactive, Inc. 'A' 133 17,313Kurita Water Industries Ltd. 400 16,787Zendesk, Inc. 99 15,200Progressive Corp. (The) 169 14,691Zoom Video Communications, Inc. 37 14,522
Major Sales for the year ended 31 December 2021
Shares or Principal Amount
Proceeds (USD)
Zoom Video Communications, Inc. 288 110,955Fortescue Metals Group Ltd. 6,189 104,670Peloton Interactive, Inc. 'A' 840 104,226M3, Inc. 1,300 103,531Regeneron Pharmaceuticals, Inc. 214 97,337Take-Two Interactive Software, Inc. 444 83,543Kroger Co. (The) 2,429 79,064Sysmex Corp. 700 74,502Moderna, Inc. 489 71,785Jardine Matheson Holdings Ltd. 1,300 69,631Apple, Inc. 548 68,560Activision Blizzard, Inc. 703 68,008Teladoc Health, Inc. 277 60,361Cloudflare, Inc. 777 58,655Crowdstrike Holdings, Inc. 261 58,360Ocado Group plc 1,909 58,182Tesla, Inc. 70 57,715Digital Realty Trust, Inc. 418 54,804Nippon Paint Holdings Co. Ltd. 700 53,820Eurofins Scientific SE 587 53,281SVB Financial Group 102 53,166
DocuSign Envelope ID: 521655BF-9BE3-47DC-A9A3-494932954338

Janus Henderson Intech Global All Country Low Volatility Fund
Janus Henderson Capital Funds plc / 31 December 2021192
The Fund ceased investment activities on 18 May 2021.
Please refer to the fund performance (unaudited) note for details on the Funds performance during the year.
DocuSign Envelope ID: 521655BF-9BE3-47DC-A9A3-494932954338

193Janus Henderson Capital Funds plc / 31 December 2021
The accompanying notes are an integral part of the financial statements.
Janus Henderson Intech Global All Country Low Volatility Fund (continued)s
Statement of Financial PositionAs of
31 December 2021
(USD)*
As of 31 December
2020 (USD)
Assets:Financial assets at fair value through profit or loss . . . . . . . . . . . . . . . . . . . . . . . . . . . . . . . . . . . . . . . . . . . . . . . . . . . . . . . – 194,375,952Cash and foreign currency . . . . . . . . . . . . . . . . . . . . . . . . . . . . . . . . . . . . . . . . . . . . . . . . . . . . . . . . . . . . . . . . . . . . . . . 34,613 2,079,792Receivables:
Investments sold . . . . . . . . . . . . . . . . . . . . . . . . . . . . . . . . . . . . . . . . . . . . . . . . . . . . . . . . . . . . . . . . . . . . . . . . . . . . – 462,599Spot foreign exchange contracts awaiting settlement . . . . . . . . . . . . . . . . . . . . . . . . . . . . . . . . . . . . . . . . . . . . . . . . . . . . – 1,068Dividends . . . . . . . . . . . . . . . . . . . . . . . . . . . . . . . . . . . . . . . . . . . . . . . . . . . . . . . . . . . . . . . . . . . . . . . . . . . . . . . . . 4,938 246,180
Receivable from Investment Manager . . . . . . . . . . . . . . . . . . . . . . . . . . . . . . . . . . . . . . . . . . . . . . . . . . . . . . . . . . . . . . . . 292 46,046Other debtors . . . . . . . . . . . . . . . . . . . . . . . . . . . . . . . . . . . . . . . . . . . . . . . . . . . . . . . . . . . . . . . . . . . . . . . . . . . . . . . . 121,469 153,993
Total Assets . . . . . . . . . . . . . . . . . . . . . . . . . . . . . . . . . . . . . . . . . . . . . . . . . . . . . . . . . . . . . . . . . . . . . . . . . 161,312 197,365,630 Liabilities (amounts falling due within one year)Payables:
Investments purchased . . . . . . . . . . . . . . . . . . . . . . . . . . . . . . . . . . . . . . . . . . . . . . . . . . . . . . . . . . . . . . . . . . . . . . . . – 917,086Fund shares repurchased . . . . . . . . . . . . . . . . . . . . . . . . . . . . . . . . . . . . . . . . . . . . . . . . . . . . . . . . . . . . . . . . . . . . . . 141,645 –Accounting, Administration and Transfer Agent fees . . . . . . . . . . . . . . . . . . . . . . . . . . . . . . . . . . . . . . . . . . . . . . . . . . . . 2,037 22,622Management fees . . . . . . . . . . . . . . . . . . . . . . . . . . . . . . . . . . . . . . . . . . . . . . . . . . . . . . . . . . . . . . . . . . . . . . . . . . . (248) 3,684Accrued expenses . . . . . . . . . . . . . . . . . . . . . . . . . . . . . . . . . . . . . . . . . . . . . . . . . . . . . . . . . . . . . . . . . . . . . . . . . . . 17,878 62,514
Total Liabilities (excluding Net Assets attributable to holders of redeemable ordinary shares) . . . . . . . . . . . . 161,312 1,005,906 Net Assets attributable to holders of redeemable ordinary participating shares . . . . . . . . . . . . . . . . . . . . . . – 196,359,724
* The Fund ceased investment activities on 18 May 2021.
.
DocuSign Envelope ID: 521655BF-9BE3-47DC-A9A3-494932954338

Janus Henderson Capital Funds plc / 31 December 2021194
Janus Henderson Intech Global All Country Low Volatility Fund (continued)
The accompanying notes are an integral part of the financial statements.
Statement of Comprehensive IncomeYear ended
31 December 2021
(USD)*
Year ended 31 December
2020 (USD)
Year ended Year endedRevenue:Interest income . . . . . . . . . . . . . . . . . . . . . . . . . . . . . . . . . . . . . . . . . . . . . . . . . . . . . . . . . . . . . . . . . . . . . . . . . . . . . . . 64,510 1,443Dividend income . . . . . . . . . . . . . . . . . . . . . . . . . . . . . . . . . . . . . . . . . . . . . . . . . . . . . . . . . . . . . . . . . . . . . . . . . . . . . . 1,720,415 4,448,654Other income . . . . . . . . . . . . . . . . . . . . . . . . . . . . . . . . . . . . . . . . . . . . . . . . . . . . . . . . . . . . . . . . . . . . . . . . . . . . . . . . – 205
Net gain/(loss) on financial assets and liabilities at fair value through profit or loss . . . . . . . . . . . . . . . . . . . . . . . . . . . . . . . . . . 5,822,562 (4,686,126) Total Investments Income/(Loss) . . . . . . . . . . . . . . . . . . . . . . . . . . . . . . . . . . . . . . . . . . . . . . . . . . . . . . . . . . 7,607,487 (235,824)
Expenses:Management fees . . . . . . . . . . . . . . . . . . . . . . . . . . . . . . . . . . . . . . . . . . . . . . . . . . . . . . . . . . . . . . . . . . . . . . . . . . . . . 16,564 22,233Accounting, Administration and Transfer Agent fees . . . . . . . . . . . . . . . . . . . . . . . . . . . . . . . . . . . . . . . . . . . . . . . . . . . . . . 27,944 81,689Custodian fees . . . . . . . . . . . . . . . . . . . . . . . . . . . . . . . . . . . . . . . . . . . . . . . . . . . . . . . . . . . . . . . . . . . . . . . . . . . . . . . 43,106 78,718Audit fees . . . . . . . . . . . . . . . . . . . . . . . . . . . . . . . . . . . . . . . . . . . . . . . . . . . . . . . . . . . . . . . . . . . . . . . . . . . . . . . . . . 23,109 28,288Printing expenses . . . . . . . . . . . . . . . . . . . . . . . . . . . . . . . . . . . . . . . . . . . . . . . . . . . . . . . . . . . . . . . . . . . . . . . . . . . . . 1,998 2,408Legal and other professional fees . . . . . . . . . . . . . . . . . . . . . . . . . . . . . . . . . . . . . . . . . . . . . . . . . . . . . . . . . . . . . . . . . . 7,572 28,613Other fees . . . . . . . . . . . . . . . . . . . . . . . . . . . . . . . . . . . . . . . . . . . . . . . . . . . . . . . . . . . . . . . . . . . . . . . . . . . . . . . . . . 7,933 38,415
Total Expenses . . . . . . . . . . . . . . . . . . . . . . . . . . . . . . . . . . . . . . . . . . . . . . . . . . . . . . . . . . . . . . . . . . . . . . . 128,226 280,364Less Expense Reimbursement . . . . . . . . . . . . . . . . . . . . . . . . . . . . . . . . . . . . . . . . . . . . . . . . . . . . . . . . . . . (128,046) (271,421)Net Expenses after Expense Reimbursement . . . . . . . . . . . . . . . . . . . . . . . . . . . . . . . . . . . . . . . . . . . . . . . . 180 8,943Net Operating Profit/(Loss) . . . . . . . . . . . . . . . . . . . . . . . . . . . . . . . . . . . . . . . . . . . . . . . . . . . . . . . . . . . . . . 7,607,307 (244,767)
Withholding tax on dividends and other investment income . . . . . . . . . . . . . . . . . . . . . . . . . . . . . . . . . . . . . (316,707) (1,079,264)
Net Increase/(Decrease) in Net Assets attributable to holders of redeemable ordinary shares resulting from operations . . . . . . . . . . . . . . . . . . . . . . . . . . . . . . . . . . . . . . . . . . . . . . . . . . . . . . . . . . . . . . . . . . . . . . . . . . . 7,290,600 (1,324,031)
. .
. .. . .
Statement of Changes in Net Assets Attributable to Redeemable Ordinary ShareholdersYear ended
31 December 2021
(USD)*
Year ended 31 December
2020 (USD)
Increase/(Decrease) in Net Assets attributable to holders of redeemable ordinary shares resulting from operations . . . . . . . . . . . . 7,290,600 (1,324,031)
Capital Share Transactions of redeemable ordinary shares:Proceeds from redeemable ordinary shares sold . . . . . . . . . . . . . . . . . . . . . . . . . . . . . . . . . . . . . . . . . . . . . . . . . . . . . . . – –Redemption of redeemable ordinary shares . . . . . . . . . . . . . . . . . . . . . . . . . . . . . . . . . . . . . . . . . . . . . . . . . . . . . . . . . . (203,650,324) –
Net (Decrease) from Capital Share Transactions of redeemable ordinary shares . . . . . . . . . . . . . . . . . . . . . . (203,650,324) –
Net (Decrease) in Net Assets attributable to holders of redeemable ordinary shares . . . . . . . . . . . . . . . . . . . . . . . . . . . . . . . . . (196,359,724) (1,324,031)Net Assets attributable to holders of redeemable ordinary shares at the beginning of the financial year . . . . . . . . . . . . . . . . . . . . 196,359,724 197,683,755
Net Assets attributable to holders of redeemable ordinary shares at the end of the financial year . . . . . . . . . – 196,359,724
* The Fund ceased investment activities on 18 May 2021.
Gains and losses are solely from continuing operations except for the Funds which ceased operations during the financial year ended 31 December 2021 or 31 December 2020. There were no gains and losses other than those dealt with in the Statement of Comprehensive Income. Please refer to note 1 which details the Fund closures during the year.
DocuSign Envelope ID: 521655BF-9BE3-47DC-A9A3-494932954338

195Janus Henderson Capital Funds plc / 31 December 2021
The accompanying notes are an integral part of the financial statements.
Janus Henderson Intech Global All Country Low Volatility Fund (continued)
Fair Value Hierarchy
The Fund ceased operations on 18 May 2021. There were no investments held by the Fund at 31 December 2021. The table below provide the fair value hierarchy summary of the Fund’s financial assets and liabilities measured at fair value at 31 December 2020.
31 December 2020
Level 1 - Quoted Prices
(USD)
Level 2 - Other Significant
Observable Inputs (USD)
Level 3 - Significant
Unobservable Inputs (USD)
Total (USD)
Common Stock 112,304,912 81,833,2671 120,803 194,258,982Preferred Stock – 116,9702 – 116,970Total Investments in Securities 112,304,912 81,950,237 120,803 194,375,952
1At 31 December 2020, the administrator used a systematic fair valuation model provided by an independent third party to value listed securities in order to adjust for stale pricing between the close of foreign exchanges and the valuation point. This resulted in an increase of USD 100,806 to common stocks with a fair value of USD 81,833,267.
2At 31 December 2020, the administrator used a systematic fair valuation model provided by an independent third party to value listed securities in order to adjust for stale pricing between the close of foreign exchanges and the valuation point. This resulted in a decrease of USD 1,187 to preferred stocks with a fair value of USD 116,970.
There were transfers on Common Stock from level 1 to level 2 during the financial year ended 31 December 2020.
Valuation policy of private placements is referenced in note 2 of the financial statements.
The following tables present level 3 positions that were fair valued by the Janus Henderson Global Pricing Committee at 31 December 2020.
Security Name
Fair Value at 31 December 2020
(USD)Fair Value as a %
of Net Assets Valuation MethodHanergy Thin Film Power Group Ltd. 120,803 0.06% EV/ LTM Revenue
Total 120,803
Capital Share Transactions
For the financial year ended 31 December 2021
. .Z2 GBPShares
At beginning of the year . . . . . . . 861,228Shares issued –Shares redeemed. . . . . . . . . . . (861,228)At end of year . . . . . . . . . . . . . –
For the financial year ended 31 December 2020
Z2 GBPShares
At beginning of the year . . . . . . . 861,228Shares issued –Shares redeemed. . . . . . . . . . . –At end of year . . . . . . . . . . . . . 861,228
DocuSign Envelope ID: 521655BF-9BE3-47DC-A9A3-494932954338

Janus Henderson Capital Funds plc / 31 December 2021196
Janus Henderson Intech Global All Country Low Volatility Fund (continued)
The accompanying notes are an integral part of the financial statements.
Net Asset Comparison
31 December 2021 31 December 2020 31 December 2019
Net Assets (USD)
NAV Per Share
(Local Currency)Net Assets
(USD)
NAV Per Share
(Local Currency)Net Assets
(USD)
NAV Per Share
(Local Currency)
Z2 GBP – – 196,359,724 166.73 197,683,755 173.31. . .
Fund Performance (unaudited)
As at 31 December 2021
Discrete performance
31/12/2020 18/05/2021
%
31/12/2019 31/12/2020
%
31/12/2018 31/12/2019
%
31/12/2017 31/12/2018
%
31/12/2016 31/12/2017
%
Z2 GBP (Net) 0.06 (3.80) 15.69 (2.75) 8.43MSCI AC World NR 5.27 12.67 21.71 (3.78) 13.24
Class Z2 GBP is disclosed as it is the representative share class.
Performance target: To outperform the MSCI All Country World Index NR, before the deduction of charges, over any 5 year period.
Please note the Z class does not incur fees therefore the Net and Gross performances are the same.
Past performance does not guarantee future returns. The rates of return will vary and the principal value of an investment will fluctuate. Shares, if redeemed, may be worth more or less than their original cost. The performance data does not take account of the commissions and costs incurred on the issue and redemption of Shares. All returns are calculated in the base currency of the representative Share Class.
There is no guarantee that the Fund’s performance will match or exceed the benchmark.
DocuSign Envelope ID: 521655BF-9BE3-47DC-A9A3-494932954338

197Janus Henderson Capital Funds plc / 31 December 2021
Janus Henderson Intech Global All Country Low Volatility Fund (continued)
Statements of Changes in Composition of Portfolio (unaudited)The tables below show a breakdown of material purchases and sales of the Investment Portfolio in accordance with Central Bank UCITS Regulations 79(2) requirements. All purchases and sales of investments exceeding 1% of the total value of each transaction respectively, are disclosed, with a minimum number of 20 of each such transaction. A full analysis of the movement on the Investment Portfolio is available upon request from the registered office.
Major Purchases for the year ended 31 December 2021
Shares or Principal Amount
Cost (USD)
Credit Industriel et Commercial, 0.0000%, due 29/4/21 13,200,000 13,199,982Credit Industriel et Commercial, 0.0000%, due 20/5/21 7,500,000 7,499,992Credit Agricole Corporate And Investment Bank, 0.0000%, due 7/4/21 6,500,000 6,499,991Credit Agricole Corporate And Investment Bank, 0.0000%, due 28/4/21 4,400,000 4,399,996Credit Agricole Corporate And Investment Bank, 0.0000%, due 23/4/21 4,400,000 4,399,995Credit Agricole Corporate And Investment Bank, 0.0000%, due 27/4/21 4,400,000 4,399,995Credit Agricole Corporate And Investment Bank, 0.0000%, due 13/4/21 4,400,000 4,399,994Credit Agricole Corporate And Investment Bank, 0.0000%, due 21/4/21 4,400,000 4,399,994Credit Agricole Corporate And Investment Bank, 0.0000%, due 22/4/21 4,400,000 4,399,994Credit Agricole Corporate And Investment Bank, 0.0000%, due 26/4/21 4,400,000 4,399,985London Stock Exchange Group plc 37,679 4,389,068Credit Agricole Corporate And Investment Bank, 0.0000%, due 20/4/21 4,300,000 4,299,994Credit Agricole Corporate And Investment Bank, 0.0000%, due 19/4/21 4,300,000 4,299,982Credit Agricole Corporate And Investment Bank, 0.0000%, due 16/4/21 4,200,000 4,199,994Credit Agricole Corporate And Investment Bank, 0.0000%, due 12/4/21 4,100,000 4,099,983Credit Agricole Corporate And Investment Bank, 0.0000%, due 14/4/21 4,000,000 3,999,994Credit Agricole Corporate And Investment Bank, 0.0000%, due 9/4/21 4,000,000 3,999,994Credit Agricole Corporate And Investment Bank, 0.0000%, due 12/1/21 3,900,000 3,899,992Credit Agricole Corporate And Investment Bank, 0.0000%, due 11/1/21 3,900,000 3,899,977Credit Agricole Corporate And Investment Bank, 0.0000%, due 15/4/21 3,700,000 3,699,995Credit Agricole Corporate And Investment Bank, 0.0000%, due 13/1/21 3,400,000 3,399,993
Major Sales for the year ended 31 December 2021
Shares or Principal Amount
Proceeds (USD)
Apple, Inc. 40,292 5,240,362London Stock Exchange Group plc 38,383 3,968,139Microsoft Corp. 14,418 3,657,043Charter Communications, Inc. 'A' 5,035 3,367,511Verizon Communications, Inc. 57,004 3,217,227Kroger Co. (The) 89,426 3,142,118Take-Two Interactive Software, Inc. 17,051 2,932,388Walmart, Inc. 20,667 2,874,344Public Storage 11,078 2,785,498Motorola Solutions, Inc. 14,003 2,705,281Regeneron Pharmaceuticals, Inc. 5,502 2,651,902Digital Realty Trust, Inc. 18,900 2,640,636NetEase, Inc. 22,750 2,628,990Amazon.com, Inc. 754 2,518,204Chunghwa Telecom Co. Ltd. 587,000 2,369,124ZTO Express Cayman, Inc. 66,946 2,239,512Activision Blizzard, Inc. 23,790 2,164,240Sysmex Corp. 20,100 2,124,615Segro plc 148,509 2,080,334ITOCHU Corp. 66,000 2,056,337
DocuSign Envelope ID: 521655BF-9BE3-47DC-A9A3-494932954338

Janus Henderson Intech US Core Fund
Janus Henderson Capital Funds plc / 31 December 2021198
Fund Overview (unaudited)Investment Objective and Policy
The Fund aims to provide capital growth over the long term.
Performance target: To outperform the S&P 500 Index by at least 3% per annum, before the deduction of charges, over any 5 year period.
The Fund invests at least 80% of its assets in shares (equities) and equity-related securities of companies, which at the time of purchase are at least equal in size to a company included in the S&P 500 Index, in any industry, in the US.
The Fund is actively managed with reference to the S&P 500 Index, which is broadly representative of the companies in which it may invest, as this forms the basis of the Fund’s performance target. The investment manager has a mathematical approach to investing which controls the extent to which the portfolio may differ from the index.
How Sustainability Risks are part of the investment processThe investments underlying this financial product (referred to as the Fund) do not take into account the EU criteria for environmentally sustainable economic activities, although the Manager and the Investment Manager have agreed a decision making process that will apply to investment decisions relating to the Fund as further detailed in the Prospectus.
The likely impacts of sustainability risks on the returns of the FundWhile the analysis of (Environmental, Social and Governance) ESG factors is an integral component across the Investment Manager’s investment capabilities and one of a number of inputs to the selection of investments and portfolio construction, the investment process of the Investment Manager is primarily designed to maximise long-term risk-adjusted returns for investors. Therefore, in managing the Fund, the Investment Manager does not maximise portfolio alignment with sustainability risks as a separate goal in its own right nor does it precisely attribute the impact of ESG factors on returns for the Fund.
Fund Overview
Adrian Banner, Joseph Runnels and Vassilios Papathanakos, portfolio managers
For the 12-months ended 31 December 2021, the Janus Henderson Intech US Core Fund Class G2 US dollar terms returned 21.46% (Net) and 22.13% (Gross), compared with 28.71% and 32.56% Target (Gross) for its benchmark, the S&P 500 Index.
The Fund was negatively impacted by its smaller size positioning as capital concentration in US equity markets continued to increase during the year, reflecting the relative
outperformance of the larger-capitalization stocks over the smaller-capitalization stocks within the S&P 500 Index on average. Specifically, an average underweight to some strongly performing mega-capitalization technology-oriented stocks was among the biggest detractors during the year.
The Fund’s overall active sector positioning also detracted from relative performance during the year. An average overweight to consumer staples, which was the one of the weakest-performing sectors in the S&P 500 Index, as well as average underweights to real estate and energy, were headwinds to relative performance during the year. An overall negative stock selection effect also detracted during the year, especially within the communication services and information technology sectors.
Intech builds portfolios in a disciplined and systematic manner, with risk management remaining the hallmark of our investment process. As Intech’s ongoing research efforts yield modest improvements, we will continue implementing changes that we believe are likely to improve the long-term results for our clients.
Thank you for investing in Janus Henderson Intech US Core Fund.
January 2022
DocuSign Envelope ID: 521655BF-9BE3-47DC-A9A3-494932954338

199Janus Henderson Capital Funds plc / 31 December 2021
The accompanying notes are an integral part of the financial statements.
Janus Henderson Intech US Core Fund (continued)
s
Statement of Financial PositionAs of
31 December 2021
(USD)
As of 31 December
2020 (USD)
Assets:Financial assets at fair value through profit or loss . . . . . . . . . . . . . . . . . . . . . . . . . . . . . . . . . . . . . . . . . . . . . . . . . . . . . . . 19,670,554 28,501,614Cash and foreign currency . . . . . . . . . . . . . . . . . . . . . . . . . . . . . . . . . . . . . . . . . . . . . . . . . . . . . . . . . . . . . . . . . . . . . . . 99,159 139,081Receivables:
Investments sold . . . . . . . . . . . . . . . . . . . . . . . . . . . . . . . . . . . . . . . . . . . . . . . . . . . . . . . . . . . . . . . . . . . . . . . . . . . . – 9,420Funds shares sold . . . . . . . . . . . . . . . . . . . . . . . . . . . . . . . . . . . . . . . . . . . . . . . . . . . . . . . . . . . . . . . . . . . . . . . . . . . 53,287 9,768Dividends . . . . . . . . . . . . . . . . . . . . . . . . . . . . . . . . . . . . . . . . . . . . . . . . . . . . . . . . . . . . . . . . . . . . . . . . . . . . . . . . . 13,158 16,736
Receivable from Investment Manager . . . . . . . . . . . . . . . . . . . . . . . . . . . . . . . . . . . . . . . . . . . . . . . . . . . . . . . . . . . . . . . . 7,825 14,076
Total Assets . . . . . . . . . . . . . . . . . . . . . . . . . . . . . . . . . . . . . . . . . . . . . . . . . . . . . . . . . . . . . . . . . . . . . . . . . 19,843,983 28,690,695 Liabilities (amounts falling due within one year)Payables:
Financial liabilities at fair value through profit or loss . . . . . . . . . . . . . . . . . . . . . . . . . . . . . . . . . . . . . . . . . . . . . . . . . . . . 4,659 8,055Investments purchased . . . . . . . . . . . . . . . . . . . . . . . . . . . . . . . . . . . . . . . . . . . . . . . . . . . . . . . . . . . . . . . . . . . . . . . . – 44,860Spot foreign exchange contracts awaiting payment . . . . . . . . . . . . . . . . . . . . . . . . . . . . . . . . . . . . . . . . . . . . . . . . . . . . . 69 48Fund shares repurchased . . . . . . . . . . . . . . . . . . . . . . . . . . . . . . . . . . . . . . . . . . . . . . . . . . . . . . . . . . . . . . . . . . . . . . 30,347 20,562Investment Management fees . . . . . . . . . . . . . . . . . . . . . . . . . . . . . . . . . . . . . . . . . . . . . . . . . . . . . . . . . . . . . . . . . . . 16,124 23,183Shareholder Service fees . . . . . . . . . . . . . . . . . . . . . . . . . . . . . . . . . . . . . . . . . . . . . . . . . . . . . . . . . . . . . . . . . . . . . . 7,141 6,780Distribution fees . . . . . . . . . . . . . . . . . . . . . . . . . . . . . . . . . . . . . . . . . . . . . . . . . . . . . . . . . . . . . . . . . . . . . . . . . . . . . 170 143Accounting, Administration and Transfer Agent fees . . . . . . . . . . . . . . . . . . . . . . . . . . . . . . . . . . . . . . . . . . . . . . . . . . . . 10,538 37Management fees . . . . . . . . . . . . . . . . . . . . . . . . . . . . . . . . . . . . . . . . . . . . . . . . . . . . . . . . . . . . . . . . . . . . . . . . . . . 354 533Accrued expenses . . . . . . . . . . . . . . . . . . . . . . . . . . . . . . . . . . . . . . . . . . . . . . . . . . . . . . . . . . . . . . . . . . . . . . . . . . . 39,467 53,843
Total Liabilities (excluding Net Assets attributable to holders of redeemable ordinary shares) . . . . . . . . . . . . 108,869 158,044 Net Assets attributable to holders of redeemable ordinary participating shares . . . . . . . . . . . . . . . . . . . . . . 19,735,114 28,532,651
.
DocuSign Envelope ID: 521655BF-9BE3-47DC-A9A3-494932954338

Janus Henderson Capital Funds plc / 31 December 2021200
Janus Henderson Intech US Core Fund (continued)
The accompanying notes are an integral part of the financial statements.
Statement of Comprehensive IncomeYear ended
31 December 2021
(USD)
Year ended 31 December
2020 (USD)
Year ended Year endedRevenue:Interest income . . . . . . . . . . . . . . . . . . . . . . . . . . . . . . . . . . . . . . . . . . . . . . . . . . . . . . . . . . . . . . . . . . . . . . . . . . . . . . . 20,744 218Dividend income . . . . . . . . . . . . . . . . . . . . . . . . . . . . . . . . . . . . . . . . . . . . . . . . . . . . . . . . . . . . . . . . . . . . . . . . . . . . . . 443,349 568,766Other income . . . . . . . . . . . . . . . . . . . . . . . . . . . . . . . . . . . . . . . . . . . . . . . . . . . . . . . . . . . . . . . . . . . . . . . . . . . . . . . . 12,360 55,622
Net gain on financial assets and liabilities at fair value through profit or loss . . . . . . . . . . . . . . . . . . . . . . . . . . . . . . . . . . . . . . 3,268,729 3,858,655 Total Investments Income . . . . . . . . . . . . . . . . . . . . . . . . . . . . . . . . . . . . . . . . . . . . . . . . . . . . . . . . . . . . . . . 3,745,182 4,483,261
Expenses:Investment Management fees . . . . . . . . . . . . . . . . . . . . . . . . . . . . . . . . . . . . . . . . . . . . . . . . . . . . . . . . . . . . . . . . . . . . . 209,162 277,761Shareholder Service fees . . . . . . . . . . . . . . . . . . . . . . . . . . . . . . . . . . . . . . . . . . . . . . . . . . . . . . . . . . . . . . . . . . . . . . . . 85,276 81,433Distribution fees . . . . . . . . . . . . . . . . . . . . . . . . . . . . . . . . . . . . . . . . . . . . . . . . . . . . . . . . . . . . . . . . . . . . . . . . . . . . . . 1,909 788Management fees . . . . . . . . . . . . . . . . . . . . . . . . . . . . . . . . . . . . . . . . . . . . . . . . . . . . . . . . . . . . . . . . . . . . . . . . . . . . . 5,068 3,301Accounting, Administration and Transfer Agent fees . . . . . . . . . . . . . . . . . . . . . . . . . . . . . . . . . . . . . . . . . . . . . . . . . . . . . . 55,224 23,014Custodian fees . . . . . . . . . . . . . . . . . . . . . . . . . . . . . . . . . . . . . . . . . . . . . . . . . . . . . . . . . . . . . . . . . . . . . . . . . . . . . . . 11,898 32,656Audit fees . . . . . . . . . . . . . . . . . . . . . . . . . . . . . . . . . . . . . . . . . . . . . . . . . . . . . . . . . . . . . . . . . . . . . . . . . . . . . . . . . . 21,262 26,937Printing expenses . . . . . . . . . . . . . . . . . . . . . . . . . . . . . . . . . . . . . . . . . . . . . . . . . . . . . . . . . . . . . . . . . . . . . . . . . . . . . 574 1,254Legal and other professional fees . . . . . . . . . . . . . . . . . . . . . . . . . . . . . . . . . . . . . . . . . . . . . . . . . . . . . . . . . . . . . . . . . . 8,737 26,680Other fees . . . . . . . . . . . . . . . . . . . . . . . . . . . . . . . . . . . . . . . . . . . . . . . . . . . . . . . . . . . . . . . . . . . . . . . . . . . . . . . . . . 15,315 (659)
Total Expenses . . . . . . . . . . . . . . . . . . . . . . . . . . . . . . . . . . . . . . . . . . . . . . . . . . . . . . . . . . . . . . . . . . . . . . . 414,425 473,165Less Expense Reimbursement . . . . . . . . . . . . . . . . . . . . . . . . . . . . . . . . . . . . . . . . . . . . . . . . . . . . . . . . . . . (65,539) (41,481)Net Expenses after Expense Reimbursement . . . . . . . . . . . . . . . . . . . . . . . . . . . . . . . . . . . . . . . . . . . . . . . . 348,886 431,684Net Operating Profit . . . . . . . . . . . . . . . . . . . . . . . . . . . . . . . . . . . . . . . . . . . . . . . . . . . . . . . . . . . . . . . . . . . 3,396,296 4,051,577
Withholding tax on dividends and other investment income . . . . . . . . . . . . . . . . . . . . . . . . . . . . . . . . . . . . . (134,911) (241,360)
Net Increase in Net Assets attributable to holders of redeemable ordinary shares resulting from operations . 3,261,385 3,810,217
. .
. .. . .
Statement of Changes in Net Assets Attributable to Redeemable Ordinary ShareholdersYear ended
31 December 2021
(USD)
Year ended 31 December
2020 (USD)
Increase in Net Assets attributable to holders of redeemable ordinary shares resulting from operations . . . . . . . . . . . . . . . . . . . . 3,261,385 3,810,217
Capital Share Transactions of redeemable ordinary shares:Proceeds from redeemable ordinary shares sold . . . . . . . . . . . . . . . . . . . . . . . . . . . . . . . . . . . . . . . . . . . . . . . . . . . . . . . 1,236,533 2,388,306Redemption of redeemable ordinary shares . . . . . . . . . . . . . . . . . . . . . . . . . . . . . . . . . . . . . . . . . . . . . . . . . . . . . . . . . . (13,303,459) (13,607,720)Dilution Adjustment. . . . . . . . . . . . . . . . . . . . . . . . . . . . . . . . . . . . . . . . . . . . . . . . . . . . . . . . . . . . . . . . . . . . . . . . . . . 8,004 390
Net (Decrease) from Capital Share Transactions of redeemable ordinary shares . . . . . . . . . . . . . . . . . . . . . . (12,058,922) (11,219,024)
Net (Decrease) in Net Assets attributable to holders of redeemable ordinary shares . . . . . . . . . . . . . . . . . . . . . . . . . . . . . . . . . (8,797,537) (7,408,807)Net Assets attributable to holders of redeemable ordinary shares at the beginning of the financial year . . . . . . . . . . . . . . . . . . . . 28,532,651 35,941,458
Net Assets attributable to holders of redeemable ordinary shares at the end of the financial year . . . . . . . . . 19,735,114 28,532,651
Gains and losses are solely from continuing operations except for the Funds which ceased operations during the financial year ended 31 December 2021 and 31 December 2020. There were no gains and losses other than those dealt with in the Statement of Comprehensive Income. Please refer to note 1 which details the Fund closures during the year.
DocuSign Envelope ID: 521655BF-9BE3-47DC-A9A3-494932954338

201Janus Henderson Capital Funds plc / 31 December 2021
Janus Henderson Intech US Core Fund (continued)
Portfolio Investments
The accompanying notes are an integral part of the financial statements.
Shares or Principal Amount
Percentage of Net Assets
(%)Fair Value
(USD)
Financial Assets at fair value through profit or lossCommon Stock (2020: 98.44% USD 28,088,614)BermudaInsurance
990 Everest Re Group Ltd. 1.37 271,181
IrelandBuilding Products
1,046 Trane Technologies plc 1.07 211,323
Chemicals1,334 Linde plc 2.34 462,138
Health Care Equipment & Supplies1,196 STERIS plc 1.48 291,118
IT Services683 Accenture plc, A 1.44 283,138
Technology Hardware, Storage & Peripherals3,232 Seagate Technology Holdings plc 1.85 365,151
United KingdomProfessional Services
2,841 Nielsen Holdings plc 0.30 58,269
United StatesAir Freight & Logistics
1,815 United Parcel Service, Inc., B 1.97 389,027
Automobiles4,301 General Motors Co. 1.28 252,168
391 Tesla, Inc. 2.09 413,2013.37 665,369
Banks1,101 JPMorgan Chase & Co. 0.88 174,343
Biotechnology332 AbbVie, Inc. 0.23 44,953
1,202 Amgen, Inc. 1.37 270,4141.60 315,367
Capital Markets927 Ameriprise Financial, Inc. 1.42 279,639769 Goldman Sachs Group, Inc. (The) 1.49 294,181
3,191 Morgan Stanley 1.59 313,229141 Nasdaq, Inc. 0.15 29,611
2,420 T Rowe Price Group, Inc. 2.41 475,8697.06 1,392,529
Chemicals447 Air Products and Chemicals, Inc. 0.69 136,004
Commercial Services & Supplies82 Cintas Corp. 0.18 36,340
Construction Materials179 Martin Marietta Materials, Inc. 0.40 78,853
Consumer Finance1,278 Discover Financial Services 0.75 147,686
Containers & Packaging813 Avery Dennison Corp. 0.89 176,071
Diversified Telecommunication Services9,781 Lumen Technologies, Inc. 0.62 122,752
Electric Utilities4,146 FirstEnergy Corp. 0.87 172,4323,131 NRG Energy, Inc. 0.68 134,883
1.55 307,315
Shares or Principal Amount
Percentage of Net Assets
(%)Fair Value
(USD)
Electrical Equipment
92 Generac Holdings, Inc. 0.16 32,377
Entertainment550 Netflix, Inc. 1.68 331,342
1,139 Walt Disney Co. (The) 0.89 176,4202.57 507,762
Equity Real Estate Investment Trusts (REITs)1,054 Healthpeak Properties, Inc. 0.19 38,0393,661 Iron Mountain, Inc. 0.97 191,580
1.16 229,619
Food & Staples Retailing2,440 Walmart, Inc. 1.79 353,044
Food Products6,913 Archer-Daniels-Midland Co. 2.37 467,2505,940 Conagra Brands, Inc. 1.03 202,851
3.40 670,101
Health Care Equipment & Supplies589 Cooper Cos., Inc. (The) 1.25 246,756298 Intuitive Surgical, Inc. 0.54 107,071
1.79 353,827
Health Care Providers & Services932 Cardinal Health, Inc. 0.24 47,989
5,881 CVS Health Corp. 3.07 606,684406 HCA Healthcare, Inc. 0.53 104,309
1,638 UnitedHealth Group, Inc. 4.17 822,505546 Universal Health Services, Inc., B 0.36 70,794
8.37 1,652,281
Health Care Technology2,203 Cerner Corp. 1.04 204,593
Household Durables2,952 Newell Brands, Inc. 0.33 64,472
Insurance740 Arthur J Gallagher & Co. 0.64 125,556
2,032 Cincinnati Financial Corp. 1.17 231,5063,634 Hartford Financial Services Group,
Inc. (The) 1.27 250,8913.08 607,953
Interactive Media & Services64 Alphabet, Inc., A 0.94 185,41164 Alphabet, Inc., C 0.94 185,190
1.88 370,601
Internet & Direct Marketing Retail104 Amazon.com, Inc. 1.76 346,771
Life Sciences Tools & Services1,138 Danaher Corp. 1.90 374,413631 West Pharmaceutical Services, Inc. 1.50 295,945
3.40 670,358
Machinery1,431 Dover Corp. 1.32 259,870
2,598 Otis Worldwide Corp. 1.15 226,2081,004 PACCAR, Inc. 0.45 88,613
2.92 574,691
Media485 Charter Communications, Inc., A 1.60 316,205
4,635 Interpublic Group of Cos., Inc. (The) 0.88 173,5813,124 News Corp., A 0.35 69,696
DocuSign Envelope ID: 521655BF-9BE3-47DC-A9A3-494932954338

Janus Henderson Capital Funds plc / 31 December 2021202
The accompanying notes are an integral part of the financial statements.
Janus Henderson Intech US Core Fund (continued)
Portfolio Investments
Shares or Principal Amount
Percentage of Net Assets
(%)Fair Value
(USD)
5,488 ViacomCBS, Inc. 0.84 165,628
3.67 725,110
Oil, Gas & Consumable Fuels4,534 APA Corp. 0.62 121,91917,513 Kinder Morgan, Inc. 1.41 277,756
2.03 399,675
Pharmaceuticals316 Eli Lilly & Co. 0.44 87,285
Professional Services446 Robert Half International, Inc. 0.25 49,738
Semiconductors & Semiconductor Equipment1,362 Applied Materials, Inc. 1.09 214,3241,686 Enphase Energy, Inc. 1.56 308,4376,840 Intel Corp. 1.79 352,260
780 Microchip Technology, Inc. 0.34 67,9072,768 QUALCOMM, Inc. 2.57 506,1841,311 Skyworks Solutions, Inc. 1.03 203,389
8.38 1,652,501
Software602 Adobe, Inc. 1.73 341,370
2,158 Microsoft Corp. 3.68 725,7792,363 NortonLifeLock, Inc. 0.31 61,3913,215 Oracle Corp. 1.42 280,380
7.14 1,408,920
Specialty Retail3,923 Bath & Body Works, Inc. 1.39 273,7862,839 Best Buy Co., Inc. 1.46 288,4423,498 Gap, Inc. (The) 0.31 61,740
3.16 623,968
Technology Hardware, Storage & Peripherals6,237 Apple, Inc. 5.61 1,107,504
10,029 HP, Inc. 1.91 377,7922,262 Western Digital Corp. 0.75 147,505
8.27 1,632,801
Textiles, Apparel & Luxury Goods1,684 NIKE, Inc., B 1.42 280,672
Trading Companies & Distributors2,093 Fastenal Co. 0.68 134,078
Wireless Telecommunication Services623 T-Mobile US, Inc. 0.37 72,256
Total Common Stock 99.27 19,589,428
Total Investments (Cost: USD 16,576,625) 99.27 19,589,428
Forward Currency Contracts (2020: 1.45% USD 413,000)Open as at 31 December 2021.
Current Market
Percentage of Net Unrealised
Currency Currency Value Settle Assets GainPurchased Sold (USD) Date (%) (USD)
.J.P. Morgan EUR◊ 5,022,194 USD 5,639,830 5,720,956 31-Jan-22 0.39 81,126
Total 0.39 81,126
.
Total Financial Assets at fair value through profit or loss 99.66 19,670,554
Financial Liabilities at fair value through profit or loss.Forward Currency Contracts (2020: (0.03)% USD (8,055))Open as at 31 December 2021
Current Market
Percentage of Net Unrealised
Currency Currency Value Settle Assets LossPurchased Sold (USD) Date (%) (USD)
J.P. Morgan USD◊ 643,875 EUR 569,321 648,534 31-Jan-22 (0.01) (4,659)
Total (0.01) (4,659).
Total Financial Liabilities at fair value through profit or loss (0.01) (4,659)
Portfolio Analysis (Unaudited)
Analysis of Total Assets:% of Total
AssetsTransferable securities admitted to official stock exchange listing 98.72OTC financial derivative instruments 0.41Other Assets 0.87Total Assets 100.00
◊ These forward currency contracts are used for share class hedging.
DocuSign Envelope ID: 521655BF-9BE3-47DC-A9A3-494932954338

203Janus Henderson Capital Funds plc / 31 December 2021
The accompanying notes are an integral part of the financial statements.
Janus Henderson Intech US Core Fund (continued)
Fair Value Hierarchy
The tables below provide the fair value hierarchy summary of the Fund’s financial assets and liabilities measured at fair value at 31 December 2021 and 31 December 2020.
31 December 2021
Level 1 - Quoted Prices
(USD)
Level 2 - Other Significant
Observable Inputs (USD)
Level 3 - Significant
Unobservable Inputs (USD)
Total (USD)
Common Stock 19,589,428 – – 19,589,428Forward Currency Contracts – 76,467 – 76,467Total Investments in Securities 19,589,428 76,467 – 19,665,895
31 December 2020
Level 1 - Quoted Prices
(USD)
Level 2 - Other Significant
Observable Inputs (USD)
Level 3 - Significant
Unobservable Inputs (USD)
Total (USD)
Common Stock 28,088,614 – – 28,088,614Forward Currency Contracts – 404,945 – 404,945Total Investments in Securities 28,088,614 404,945 – 28,493,559
There were no investments held by the Fund at 31 December 2021 and 31 December 2020 that were fair valued at level 3 by the Janus Henderson Global Pricing Committee.
Valuation policy of private placements is referenced in note 2 of the financial statements.
Capital Share Transactions
For the financial year ended 31 December 2021
.A2 HEUR A2 USD B2 USD G2 HEUR G2 USD I2 HEUR I2 USD
Shares Shares Shares Shares Shares Shares SharesAt beginning of the year . . . . . . . 127,165 224,493 4,379 221 300 313,710 49,875Shares issued 5,456 15,860 – – – 3,935 624Shares redeemed. . . . . . . . . . . (33,543) (21,214) – – – (317,071) (17,057)At end of year . . . . . . . . . . . . . 99,078 219,139 4,379 221 300 574 33,442
For the financial year ended 31 December 2020
A2 HEUR A2 USD B2 USD G2 HEUR G2 USD I2 HEUR I2 USDShares Shares Shares Shares Shares Shares Shares
At beginning of the year . . . . . . . 149,801 354,151 5,365 221 300 437,504 104,058Shares issued 7,197 10,246 – – – 76,927 2,253Shares redeemed. . . . . . . . . . . (29,833) (139,904) (986) – – (200,721) (56,436)At end of year . . . . . . . . . . . . . 127,165 224,493 4,379 221 300 313,710 49,875
DocuSign Envelope ID: 521655BF-9BE3-47DC-A9A3-494932954338

Janus Henderson Capital Funds plc / 31 December 2021204
Janus Henderson Intech US Core Fund (continued)
The accompanying notes are an integral part of the financial statements.
Net Asset Comparison
31 December 2021 31 December 2020 31 December 2019
Net Assets (USD)
NAV Per Share
(Local Currency)Net Assets
(USD)
NAV Per Share
(Local Currency)Net Assets
(USD)
NAV Per Share
(Local Currency)
A2 HEUR 5,014,504 44.45 5,811,266 37.41 5,641,183 33.58A2 USD 12,393,665 56.56 10,574,159 47.10 14,670,603 41.42B2 USD 205,686 46.97 173,058 39.52 188,344 35.10G2 HEUR 5,759 22.89 5,138 19.03 4,185 16.88G2 USD 7,828 26.09 6,444 21.48 5,602 18.67I2 HEUR 19,046 29.16 9,382,466 24.48 10,723,347 21.85I2 USD 2,088,626 62.46 2,580,120 51.73 4,708,194 45.25
. . .
Total Expense Ratio (unaudited)
The Average Total Expense Ratio table shows the actual expenses, excluding transactions costs and trade commissions, incurred by each Class for the Fund during the reporting financial year expressed as a percentage of the average net assets for the corresponding year, on an annualised basis.
31 December 2021 31 December 2020 31 December 2019A2 HEUR 1.72% 1.75% 1.62%A2 USD 1.75% 1.75% 1.62%B2 USD 2.75% 2.75% 2.62%G2 HEUR 0.55% 0.55% 0.52%G2 USD 0.55% 0.55% 0.55%I2 HEUR 1.17% 1.20% 1.07%I2 USD 1.18% 1.20% 1.16%
DocuSign Envelope ID: 521655BF-9BE3-47DC-A9A3-494932954338

205Janus Henderson Capital Funds plc / 31 December 2021
Janus Henderson Intech US Core Fund (continued)
The accompanying notes are an integral part of the financial statements.
Fund Performance (unaudited)
As at 31 December 2021
One year Three years Five yearsSince
inception
Performance (Annualised) 31/12/2020 31/12/2021
%
31/12/2017 31/12/2021
%
31/12/2015 31/12/2021
%
to 31/12/2021
%
G2 USD (Net)* 21.46 20.20** 13.59** 9.72***S&P 500 TR 28.71 26.06 18.48 11.55
Five years 31/12/2015 31/12/2021
%G2 USD (Gross)* 15.53S&P 500 TR + 3.00% 22.03
.6
Discrete performance
31/12/2020 31/12/2021
%
31/12/2019 31/12/2020
%
31/12/2018 31/12/2019
%
31/12/2017 31/12/2018
%
31/12/2016 31/12/2017
%
G2 USD (Net)* 21.46 13.71** 27.21** (9.58)** 20.39**S&P 500 TR 28.71 18.40 31.48 (4.39) 21.83
G2 USD (Gross)* 22.13 15.56** 29.27** (8.00)** 22.49**S&P 500 TR + 3.00% 32.56 21.96 35.42 (1.50) 25.48
. . . . .
Class G2 USD is disclosed as it is the representative share class.
* The representative share class has changed from the A2 USD to the G2 USD share class with effect from August 2021.
** Historical figures are based on the A2 USD share class.
Performance target: To outperform the S&P 500 Index by at least 3% per annum, before the deduction of charges, over any 5 year period.
Please note the Gross Returns 5 year annualised table is only applicable for share classes which have been active for 5 or more years and the performance target is to be achieved over a specific annualised time period. Performance target and index shown in USD.
Past performance does not guarantee future returns. The rates of return will vary and the principal value of an investment will fluctuate. Shares, if redeemed, may be worth more or less than their original cost. The performance data does not take account of the commissions and costs incurred on the issue and redemption of Shares. All returns are calculated in the base currency of the representative Share Class.
There is no guarantee that the Fund’s performance will match or exceed the benchmark.
DocuSign Envelope ID: 521655BF-9BE3-47DC-A9A3-494932954338

Janus Henderson Capital Funds plc / 31 December 2021206
Janus Henderson Intech US Core Fund (continued)
Statements of Changes in Composition of Portfolio (unaudited)The tables below show a breakdown of material purchases and sales of the Investment Portfolio in accordance with Central Bank UCITS Regulations 79(2) requirements. All purchases and sales of investments exceeding 1% of the total value of each transaction respectively, are disclosed, with a minimum number of 20 of each such transaction. A full analysis of the movement on the Investment Portfolio is available upon request from the registered office.
Major Purchases for the year ended 31 December 2021
Shares or Principal Amount
Cost (USD)
UnitedHealth Group, Inc. 1,638 735,989Credit Agricole Corporate And Investment Bank, 0.0000%, due 9/4/21 600,000 599,999Credit Agricole Corporate And Investment Bank, 0.0000%, due 15/11/21 600,000 599,997Walt Disney Co. (The) 3,071 520,106Credit Agricole Corporate And Investment Bank, 0.0000%, due 6/4/21 500,000 499,999Credit Agricole Corporate And Investment Bank, 0.0000%, due 7/4/21 500,000 499,999Credit Agricole Corporate And Investment Bank, 0.0000%, due 8/4/21 500,000 499,999Enphase Energy, Inc. 2,128 496,565Dover Corp. 2,912 439,434Tesla, Inc. 391 426,200Morgan Stanley 4,356 398,375Philip Morris International, Inc. 3,969 386,124Kinder Morgan, Inc. 23,517 385,097Netflix, Inc. 550 373,459Adobe, Inc. 602 371,139United Parcel Service, Inc. 'B' 1,994 347,941Chevron Corp. 3,407 338,968Hartford Financial Services Group, Inc. (The) 5,461 319,143Walmart, Inc. 2,106 313,716Linde plc 1,119 313,108
Major Sales for the year ended 31 December 2021
Shares or Principal Amount
Proceeds (USD)
AbbVie, Inc. 7,642 854,098Progressive Corp. (The) 7,587 711,649TransDigm Group, Inc. 1,096 672,064Intuit, Inc. 1,683 663,332General Motors Co. 11,375 648,112Target Corp. 3,202 638,666International Business Machines Corp. 4,919 609,751Costco Wholesale Corp. 1,611 597,203Cisco Systems, Inc. 11,452 582,335Air Products and Chemicals, Inc. 1,971 577,270Raytheon Technologies Corp. 6,347 510,968Gilead Sciences, Inc. 7,477 494,810Microsoft Corp. 2,105 492,082Netflix, Inc. 912 491,588NVIDIA Corp. 1,769 486,752Willis Towers Watson plc 2,079 476,071Twitter, Inc. 7,092 459,505Danaher Corp. 1,726 447,566Apple, Inc. 3,605 443,623Advanced Micro Devices, Inc. 2,998 429,782Dover Corp. 2,854 426,951Edison International 6,515 413,011Lockheed Martin Corp. 1,115 399,529JPMorgan Chase & Co. 2,316 390,893Eaton Corp plc 2,290 388,835Chevron Corp. 3,407 386,546Philip Morris International, Inc. 3,969 383,982Corning, Inc. 9,668 360,632ResMed, Inc. 1,679 354,092
DocuSign Envelope ID: 521655BF-9BE3-47DC-A9A3-494932954338

Janus Henderson Global Real Estate Equity Income Fund
207Janus Henderson Capital Funds plc / 31 December 2021
Fund Overview (unaudited)Investment Objective and Policy
The Fund aims to provide a positive level of income with the potential for capital growth over the long term (five years or more).
Performance target: To achieve a dividend yield exceeding that of the FTSE EPRA Nareit Global REIT Index, before the deduction of charges, on an annual basis.
The Fund invests at least 80% of its assets in shares (also known as equities) and equity-related securities of real estate investment trusts (REITs) and companies, which invest in property, in any country. Companies will derive the main part of their revenue from owning, developing and managing real estate.
The Fund is actively managed with reference to the FTSE EPRA Nareit Global REIT Index, which is broadly representative of the companies in which it may invest, as this forms the basis of the Fund's performance target. The investment manager has discretion to choose investments for the Fund with weightings different to the index or not in the index, but at times the Fund may hold investments similar to the index.
The Fund’s name changed from Janus Henderson Global Real Estate Fund to the Janus Henderson Global Real Estate Equity Income Fund on 30 June 2021.
How Sustainability Risks are part of the investment processThe investments underlying this financial product (referred to as the Fund) do not take into account the EU criteria for environmentally sustainable economic activities, although the Manager and the Investment Manager have agreed a decision making process that will apply to investment decisions relating to the Fund as further detailed in the Prospectus.
The likely impacts of sustainability risks on the returns of the FundWhile the analysis of (Environmental, Social and Governance) ESG factors is an integral component across the Investment Manager’s investment capabilities and one of a number of inputs to the selection of investments and portfolio construction, the investment process of the Investment Manager is primarily designed to maximise long-term risk-adjusted returns for investors. Therefore, in managing the Fund, the Investment Manager does not maximise portfolio alignment with sustainability risks as a separate goal in its own right nor does it precisely attribute the impact of ESG factors on returns for the Fund.
Fund Overview
Guy Barnard, Tim Gibson and Greg Kuhl, portfolio managers
For the year ended 31 December 2021, the Class H2 USD shares returned 22.43% (Net) and 23.55% (Gross) compared with 27.87% and 29.14% Target (Gross) for its benchmark, FTSE EPRA Nareit Global Index.
Effective 30th June the Fund’s objective and benchmark were amended, following an investor vote, to reflect a new income focus. The Fund’s name was updated to the Janus Henderson Global Real Estate Equity Income Fund. With the investment objective to provide a positive level of income and to seek to achieve long-term (5 years or more) growth of capital. The performance target is to achieve a dividend yield exceeding that of the FTSE EPRA Nareit Global REIT Index, before the deduction of charges, on an annual basis.
Over the year global equities delivered positive returns as economic data improved across the developed world following vaccination campaigns, despite volatility caused by the emergence of the Omicron variant of COVID-19. Property equities also rose in the year, outperforming the wider market and marking the strongest ever year for US REITs. In Europe, stocks in Sweden and the UK performed well, while those in Germany declined. In Asia, Hong Kong and Chinese property companies fell following escalating concerns around the liquidity of Chinese developers sparked by Evergrande. At a sector level, US malls and shopping centres rebounded from pandemic lows and global logistics landlords, US rental residential owners and storage landlords all outperformed given superior operating fundamentals. Other sectors where sentiment was hit harder by the spread of the Omicron variant lagged, particularly office, hotel and health care property stocks.
The Fund was positioned to achieve its income mandate, although on a total return basis it underperformed its index over the year. Key detractors included exposure to China, where data centre landlord GDS and residential developer Shimao suffered from the deteriorating backdrop. An underweight in US storage and malls also detracted, as did exposure to cold storage operator Americold. Toward the end of the year exposure to higher yielding areas of the market, such as health care, also effected capital growth in the period. Contributors over the year included logistics landlords Duke, VGP and Granite, and US apartment landlords UDR and Essex, as fundamentals strengthened in their respective sectors. The German residential space also added value as the Fund benefited from an underweight to Vonovia, which acquired core holding and peer Deutsche Wohnen.
*Benchmark Index has changed from FTSE EPRA Nareit Global Index to FTSE EPRA Nareit Global REITs TR effective 30 June 2021.
DocuSign Envelope ID: 521655BF-9BE3-47DC-A9A3-494932954338

Janus Henderson Capital Funds plc / 31 December 2021208
Janus Henderson Global Real Estate Equity Income Fund (continued)
Fund Overview (unaudited) (continued)
Following the change in Fund mandate we repositioned the Fund toward the new income-focused objective. This saw the regional weighting to North America increase, in-line with the new benchmark, with European and Asia Pacific weightings decreasing. In Asia, exposure to developers was decreased given the greater focus on REITs. Likewise, in Europe, exposure to non-REIT areas such as German residential and Sweden was reduced. In North America, Cubesmart, Physicians Realty Trust, American Campus Communities and SL Green were added in the US, as well as Granite and Dream Industrial in Canada. We believed these names offered a combination of income and capital growth potential. We subsequently positioned the Fund to take advantage of further opportunities in the storage, apartments and single-family home sectors given stronger fundamentals, including Life Storage, Essex Property, UDR and Tricon Residential. We also sought opportunities in diversified names with recovery potential in Europe and Asia, including Land Securities, Activia Properties and Capital and Integrated Commercial Trust. We took profit in various logistics names as funding trades given strong outperformance.
Looking ahead, despite concerns around tightening monetary policy from central banks, we continue to believe that investors’ desire for income and real assets to help protect from the threat of sustained inflation will remain supportive for physical real estate. Within the sector, real estate fundamentals are likely to reflect ongoing divergence across different property types in the years ahead, driven by the themes of changing demographics, digitization, sustainability and the convenience lifestyle. It therefore remains important, in our view, to remain selective.
Listed real estate offers lower correlations to many other asset classes and provides investors the benefits of portfolio enhancement by increasing risk adjusted returns within a balanced portfolio. In addition, the real estate market continues to provide an attractive, reliable and growing income stream for investors, something we expect to be rewarded over time.
Thank you for investing in Janus Henderson Global Real Estate Equity Income Fund.
January 2022
DocuSign Envelope ID: 521655BF-9BE3-47DC-A9A3-494932954338

209Janus Henderson Capital Funds plc / 31 December 2021
The accompanying notes are an integral part of the financial statements.
Janus Henderson Global Real Estate Equity Income Fund (continued)s
Statement of Financial PositionAs of
31 December 2021
(USD)
As of 31 December
2020 (USD)
Assets:Financial assets at fair value through profit or loss . . . . . . . . . . . . . . . . . . . . . . . . . . . . . . . . . . . . . . . . . . . . . . . . . . . . . . . 313,815,988 183,105,322Cash and foreign currency . . . . . . . . . . . . . . . . . . . . . . . . . . . . . . . . . . . . . . . . . . . . . . . . . . . . . . . . . . . . . . . . . . . . . . . 6,036,090 5,692,651Receivables:
Investments sold . . . . . . . . . . . . . . . . . . . . . . . . . . . . . . . . . . . . . . . . . . . . . . . . . . . . . . . . . . . . . . . . . . . . . . . . . . . . 4,146 80,606Spot foreign exchange contracts awaiting settlement . . . . . . . . . . . . . . . . . . . . . . . . . . . . . . . . . . . . . . . . . . . . . . . . . . . . – 225Funds shares sold . . . . . . . . . . . . . . . . . . . . . . . . . . . . . . . . . . . . . . . . . . . . . . . . . . . . . . . . . . . . . . . . . . . . . . . . . . . 591,915 599,897Dividends . . . . . . . . . . . . . . . . . . . . . . . . . . . . . . . . . . . . . . . . . . . . . . . . . . . . . . . . . . . . . . . . . . . . . . . . . . . . . . . . . 1,080,807 483,603
Receivable from Investment Manager . . . . . . . . . . . . . . . . . . . . . . . . . . . . . . . . . . . . . . . . . . . . . . . . . . . . . . . . . . . . . . . . – 66Other debtors . . . . . . . . . . . . . . . . . . . . . . . . . . . . . . . . . . . . . . . . . . . . . . . . . . . . . . . . . . . . . . . . . . . . . . . . . . . . . . . . 44,112 47,397
Total Assets . . . . . . . . . . . . . . . . . . . . . . . . . . . . . . . . . . . . . . . . . . . . . . . . . . . . . . . . . . . . . . . . . . . . . . . . . 321,573,058 190,009,767 Liabilities (amounts falling due within one year)Payables:
Financial liabilities at fair value through profit or loss . . . . . . . . . . . . . . . . . . . . . . . . . . . . . . . . . . . . . . . . . . . . . . . . . . . . 10,566 14,752Bank overdraft and foreign currency . . . . . . . . . . . . . . . . . . . . . . . . . . . . . . . . . . . . . . . . . . . . . . . . . . . . . . . . . . . . . . . 17,551 34,450Investments purchased . . . . . . . . . . . . . . . . . . . . . . . . . . . . . . . . . . . . . . . . . . . . . . . . . . . . . . . . . . . . . . . . . . . . . . . . – 182,817Spot foreign exchange contracts awaiting payment . . . . . . . . . . . . . . . . . . . . . . . . . . . . . . . . . . . . . . . . . . . . . . . . . . . . . 320 –Fund shares repurchased . . . . . . . . . . . . . . . . . . . . . . . . . . . . . . . . . . . . . . . . . . . . . . . . . . . . . . . . . . . . . . . . . . . . . . 966,201 440,233Investment Management fees . . . . . . . . . . . . . . . . . . . . . . . . . . . . . . . . . . . . . . . . . . . . . . . . . . . . . . . . . . . . . . . . . . . 265,562 165,779Shareholder Service fees . . . . . . . . . . . . . . . . . . . . . . . . . . . . . . . . . . . . . . . . . . . . . . . . . . . . . . . . . . . . . . . . . . . . . . 52,223 30,978Distribution fees . . . . . . . . . . . . . . . . . . . . . . . . . . . . . . . . . . . . . . . . . . . . . . . . . . . . . . . . . . . . . . . . . . . . . . . . . . . . . 102 87Accounting, Administration and Transfer Agent fees . . . . . . . . . . . . . . . . . . . . . . . . . . . . . . . . . . . . . . . . . . . . . . . . . . . . 44,927 17,790Management fees . . . . . . . . . . . . . . . . . . . . . . . . . . . . . . . . . . . . . . . . . . . . . . . . . . . . . . . . . . . . . . . . . . . . . . . . . . . 6,018 3,537Accrued expenses . . . . . . . . . . . . . . . . . . . . . . . . . . . . . . . . . . . . . . . . . . . . . . . . . . . . . . . . . . . . . . . . . . . . . . . . . . . 84,171 116,171
Total Liabilities (excluding Net Assets attributable to holders of redeemable ordinary shares) . . . . . . . . . . . . 1,447,641 1,006,594 Net Assets attributable to holders of redeemable ordinary participating shares . . . . . . . . . . . . . . . . . . . . . . 320,125,417 189,003,173
.
DocuSign Envelope ID: 521655BF-9BE3-47DC-A9A3-494932954338

Janus Henderson Capital Funds plc / 31 December 2021210
Janus Henderson Global Real Estate Equity Income Fund (continued)
The accompanying notes are an integral part of the financial statements.
Statement of Comprehensive IncomeYear ended
31 December 2021
(USD)
Year ended 31 December
2020 (USD)
Year ended Year endedRevenue:Interest income . . . . . . . . . . . . . . . . . . . . . . . . . . . . . . . . . . . . . . . . . . . . . . . . . . . . . . . . . . . . . . . . . . . . . . . . . . . . . . . 142,190 –Dividend income . . . . . . . . . . . . . . . . . . . . . . . . . . . . . . . . . . . . . . . . . . . . . . . . . . . . . . . . . . . . . . . . . . . . . . . . . . . . . . 8,910,895 5,094,808Other income . . . . . . . . . . . . . . . . . . . . . . . . . . . . . . . . . . . . . . . . . . . . . . . . . . . . . . . . . . . . . . . . . . . . . . . . . . . . . . . . 5,000 –
Net gain on financial assets and liabilities at fair value through profit or loss . . . . . . . . . . . . . . . . . . . . . . . . . . . . . . . . . . . . . . 48,417,026 1,721,976 Total Investments Income . . . . . . . . . . . . . . . . . . . . . . . . . . . . . . . . . . . . . . . . . . . . . . . . . . . . . . . . . . . . . . . 57,475,111 6,816,784
Expenses:Investment Management fees . . . . . . . . . . . . . . . . . . . . . . . . . . . . . . . . . . . . . . . . . . . . . . . . . . . . . . . . . . . . . . . . . . . . . 2,806,401 1,797,681Shareholder Service fees . . . . . . . . . . . . . . . . . . . . . . . . . . . . . . . . . . . . . . . . . . . . . . . . . . . . . . . . . . . . . . . . . . . . . . . . 522,878 362,318Distribution fees . . . . . . . . . . . . . . . . . . . . . . . . . . . . . . . . . . . . . . . . . . . . . . . . . . . . . . . . . . . . . . . . . . . . . . . . . . . . . . 1,153 850Management fees . . . . . . . . . . . . . . . . . . . . . . . . . . . . . . . . . . . . . . . . . . . . . . . . . . . . . . . . . . . . . . . . . . . . . . . . . . . . . 65,617 22,122Accounting, Administration and Transfer Agent fees . . . . . . . . . . . . . . . . . . . . . . . . . . . . . . . . . . . . . . . . . . . . . . . . . . . . . . 156,703 112,134Custodian fees . . . . . . . . . . . . . . . . . . . . . . . . . . . . . . . . . . . . . . . . . . . . . . . . . . . . . . . . . . . . . . . . . . . . . . . . . . . . . . . 60,030 63,906Audit fees . . . . . . . . . . . . . . . . . . . . . . . . . . . . . . . . . . . . . . . . . . . . . . . . . . . . . . . . . . . . . . . . . . . . . . . . . . . . . . . . . . 22,791 29,734Printing expenses . . . . . . . . . . . . . . . . . . . . . . . . . . . . . . . . . . . . . . . . . . . . . . . . . . . . . . . . . . . . . . . . . . . . . . . . . . . . . 3,745 3,514Legal and other professional fees . . . . . . . . . . . . . . . . . . . . . . . . . . . . . . . . . . . . . . . . . . . . . . . . . . . . . . . . . . . . . . . . . . 45,852 56,195Other fees . . . . . . . . . . . . . . . . . . . . . . . . . . . . . . . . . . . . . . . . . . . . . . . . . . . . . . . . . . . . . . . . . . . . . . . . . . . . . . . . . . 37,241 54,964
Total Expenses . . . . . . . . . . . . . . . . . . . . . . . . . . . . . . . . . . . . . . . . . . . . . . . . . . . . . . . . . . . . . . . . . . . . . . . 3,722,411 2,503,418Less Expense Reimbursement . . . . . . . . . . . . . . . . . . . . . . . . . . . . . . . . . . . . . . . . . . . . . . . . . . . . . . . . . . . – (66)Net Expenses after Expense Reimbursement . . . . . . . . . . . . . . . . . . . . . . . . . . . . . . . . . . . . . . . . . . . . . . . . 3,722,411 2,503,352Net Operating Profit . . . . . . . . . . . . . . . . . . . . . . . . . . . . . . . . . . . . . . . . . . . . . . . . . . . . . . . . . . . . . . . . . . . 53,752,700 4,313,432
Finance Costs: 2,560,322 2,045,338
Total distributions to holders of redeemable ordinary shares. . . . . . . . . . . . . . . . . . . . . . . . . . . . . . . . . . . . . . . . . . . . . . . . . (2,560,322) (2,045,338) Withholding tax on dividends and other investment income . . . . . . . . . . . . . . . . . . . . . . . . . . . . . . . . . . . . . (1,984,385) (1,055,443)
Net Increase in Net Assets attributable to holders of redeemable ordinary shares resulting from operations . 49,207,993 1,212,651
. .
. .. . .
Statement of Changes in Net Assets Attributable to Redeemable Ordinary ShareholdersYear ended
31 December 2021
(USD)
Year ended 31 December
2020 (USD)
Increase in Net Assets attributable to holders of redeemable ordinary shares resulting from operations . . . . . . . . . . . . . . . . . . . . 49,207,993 1,212,651
Capital Share Transactions of redeemable ordinary shares:Proceeds from redeemable ordinary shares sold . . . . . . . . . . . . . . . . . . . . . . . . . . . . . . . . . . . . . . . . . . . . . . . . . . . . . . . 173,270,431 100,021,532Redemption of redeemable ordinary shares . . . . . . . . . . . . . . . . . . . . . . . . . . . . . . . . . . . . . . . . . . . . . . . . . . . . . . . . . . (91,440,265) (71,618,751)Dilution Adjustment. . . . . . . . . . . . . . . . . . . . . . . . . . . . . . . . . . . . . . . . . . . . . . . . . . . . . . . . . . . . . . . . . . . . . . . . . . . 84,085 48,281
Net Increase from Capital Share Transactions of redeemable ordinary shares . . . . . . . . . . . . . . . . . . . . . . . . 81,914,251 28,451,062
Net Increase in Net Assets attributable to holders of redeemable ordinary shares . . . . . . . . . . . . . . . . . . . . . . . . . . . . . . . . . . . 131,122,244 29,663,713Net Assets attributable to holders of redeemable ordinary shares at the beginning of the financial year . . . . . . . . . . . . . . . . . . . . 189,003,173 159,339,460
Net Assets attributable to holders of redeemable ordinary shares at the end of the financial year . . . . . . . . . 320,125,417 189,003,173
Gains and losses are solely from continuing operations except for the Funds which ceased operations during the financial year ended 31 December 2021 or 31 December 2020. There were no gains and losses other than those dealt with in the Statement of Comprehensive Income. Please refer to note 1 which details the Fund closures during the year.
DocuSign Envelope ID: 521655BF-9BE3-47DC-A9A3-494932954338

211Janus Henderson Capital Funds plc / 31 December 2021
Janus Henderson Global Real Estate Equity Income Fund (continued)
Portfolio Investments
The accompanying notes are an integral part of the financial statements.
Shares or Principal Amount
Percentage of Net Assets
(%)Fair Value
(USD)
Financial Assets at fair value through profit or lossCommon Stock (2020: 96.70% USD 182,773,395)AustraliaEquity Real Estate Investment Trusts (REITs)
302,616 Goodman Group 1.82 5,834,4592,478,920 HealthCo REIT 1.26 4,039,9261,929,377 Vicinity Centres 0.74 2,372,284
3.82 12,246,669
BelgiumReal Estate Management & Development
8,000 VGP NV 0.73 2,331,648
BermudaReal Estate Management & Development
728,000 Kerry Properties Ltd. 0.59 1,895,262
CanadaEquity Real Estate Investment Trusts (REITs)
435,965 Dream Industrial Real Estate Investment Trust 1.85 5,934,873
132,108 Granite Real Estate Investment Trust 3.44 11,007,6955.29 16,942,568
Cayman IslandsIT Services
331,640 GDS Holdings Ltd., A 0.60 1,926,668
FranceEquity Real Estate Investment Trusts (REITs)
17,700 Gecina SA 0.77 2,476,61319,000 ICADE 0.43 1,364,948
1.20 3,841,561
GermanyReal Estate Management & Development
78,000 Instone Real Estate Group SE 0.46 1,477,68226,841 LEG Immobilien SE 1.17 3,749,525
1.63 5,227,207
Hong KongReal Estate Management & Development
687,000 New World Development Co. Ltd. 0.85 2,718,027
IndiaEquity Real Estate Investment Trusts (REITs)
480,600 Embassy Office Parks REIT 0.69 2,195,799
JapanEquity Real Estate Investment Trusts (REITs)
571 Activia Properties, Inc. 0.65 2,064,9921,411 CRE Logistics REIT, Inc. 0.87 2,774,652
1,078 Hulic Reit, Inc. 0.51 1,622,2011,131 Industrial & Infrastructure Fund
Investment Corp. 0.68 2,183,7364,733 Japan Hotel REIT Investment Corp. 0.72 2,312,3933,501 Japan Metropolitan Fund Invest 0.94 3,016,1621,252 LaSalle Logiport REIT 0.69 2,205,1222,307 Nomura Real Estate Master Fund, Inc. 1.01 3,245,002
6.07 19,424,260
NetherlandsReal Estate Management & Development
98,888 CTP NV 0.66 2,105,321
SingaporeEquity Real Estate Investment Trusts (REITs)
3,105,700 CapitaLand Integrated Commercial Trust 1.47 4,701,416
Shares or Principal Amount
Percentage of Net Assets
(%)Fair Value
(USD)
1,150,760 Mapletree Industrial Trust 0.72 2,314,158
2.19 7,015,574
SpainDiversified Telecommunication Services
22,500 Cellnex Telecom SA 0.41 1,311,040
Equity Real Estate Investment Trusts (REITs)220,000 Merlin Properties Socimi SA 0.75 2,396,998
United KingdomEquity Real Estate Investment Trusts (REITs)
182,696 Land Securities Group plc 0.60 1,919,945130,000 Safestore Holdings plc 0.78 2,479,298230,000 Segro plc 1.40 4,472,061
1,035,000 Target Healthcare REIT plc 0.52 1,653,091142,000 UNITE Group plc (The) 0.67 2,134,426
1,050,000 Urban Logistics REIT plc 0.83 2,657,6954.80 15,316,516
Real Estate Management & Development315,000 Helical plc 0.61 1,935,712
United StatesEquity Real Estate Investment Trusts (REITs)
42,103 Alexandria Real Estate Equities, Inc. 2.93 9,387,285164,363 American Campus Communities, Inc. 2.94 9,416,35620,066 American Tower Corp. 1.83 5,869,305188,185 CubeSmart 3.35 10,709,608176,946 Douglas Emmett, Inc. 1.85 5,927,691141,282 Duke Realty Corp. 2.90 9,273,75070,797 Equity LifeStyle Properties, Inc. 1.94 6,206,06527,462 Essex Property Trust, Inc. 3.02 9,672,940
266,962 Invitation Homes, Inc. 3.78 12,104,05792,106 Life Storage, Inc. 4.41 14,108,797
299,643 MGM Growth Properties LLC, A 3.82 12,240,417253,689 National Retail Properties, Inc. 3.81 12,194,830479,630 Physicians Realty Trust 2.82 9,031,433
74,925 Prologis, Inc. 3.94 12,614,37368,913 SL Green Realty Corp. 1.54 4,941,062
288,387 Spirit Realty Capital, Inc. 4.34 13,897,37050,747 Sun Communities, Inc. 3.33 10,655,348
211,446 UDR, Inc. 3.96 12,684,646219,323 Ventas, Inc. 3.50 11,211,792463,539 VICI Properties, Inc. 4.36 13,957,159
64.37 206,104,284
Hotels, Restaurants & Leisure54,783 Hilton Worldwide Holdings, Inc. 2.67 8,545,600
Total Common Stock 97.93 313,480,714
Total Investments (Cost: USD 262,921,053) 97.93 313,480,714
DocuSign Envelope ID: 521655BF-9BE3-47DC-A9A3-494932954338

Janus Henderson Capital Funds plc / 31 December 2021212
The accompanying notes are an integral part of the financial statements.
Janus Henderson Global Real Estate Equity Income Fund (continued)
Portfolio Investments
Shares or Principal Amount
Percentage of Net Assets
(%)Fair Value
(USD)
Forward Currency Contracts (2020: 0.18% USD 331,927)Open as at 31 December 2021.
Current Market
Percentage of Net Unrealised
Currency Currency Value Settle Assets GainPurchased Sold (USD) Date (%) (USD)
.J.P. Morgan AUD◊ 351,817 USD 252,939 255,987 31-Jan-22 0.00 3,048
EUR◊ 19,698,202 USD 22,118,254 22,438,909 31-Jan-22 0.10 320,655
GBP◊ 596,654 USD 795,977 807,548 31-Jan-22 0.00 11,571
Total 0.10 335,274
.
Total Financial Assets at fair value through profit or loss 98.03 313,815,988
Financial Liabilities at fair value through profit or loss.Forward Currency Contracts (2020: (0.01)% USD (14,752))Open as at 31 December 2021
Current Market
Percentage of Net Unrealised
Currency Currency Value Settle Assets LossPurchased Sold (USD) Date (%) (USD)
J.P. Morgan USD◊ 13,972 AUD 19,578 14,244 31-Jan-22 0.00 (272)
USD◊ 1,371,739 EUR 1,212,045 1,380,685 31-Jan-22 0.00 (8,946)
USD◊ 79,671 GBP 59,862 81,019 31-Jan-22 0.00 (1,348)
Total 0.00 (10,566).
Total Financial Liabilities at fair value through profit or loss 0.00 (10,566)
Portfolio Analysis (Unaudited)
Analysis of Total Assets:% of Total
AssetsTransferable securities admitted to official stock exchange listing 97.48OTC financial derivative instruments 0.10Other Assets 2.42Total Assets 100.00
◊ These forward currency contracts are used for share class hedging.
DocuSign Envelope ID: 521655BF-9BE3-47DC-A9A3-494932954338

213Janus Henderson Capital Funds plc / 31 December 2021
The accompanying notes are an integral part of the financial statements.
Janus Henderson Global Real Estate Equity Income Fund (continued)
Fair Value Hierarchy
The tables below provide the fair value hierarchy summary of the Fund’s financial assets and liabilities measured at fair value at 31 December 2021 and 31 December 2020.
31 December 2021
Level 1 - Quoted Prices
(USD)
Level 2 - Other Significant
Observable Inputs (USD)
Level 3 - Significant
Unobservable Inputs (USD)
Total (USD)
Common Stock 313,480,714 – – 313,480,714Forward Currency Contracts – 324,708 – 324,708Total Investments in Securities 313,480,714 324,708 – 313,805,422
31 December 2020
Level 1 - Quoted Prices
(USD)
Level 2 - Other Significant
Observable Inputs (USD)
Level 3 - Significant
Unobservable Inputs (USD)
Total (USD)
Common Stock 97,462,325 85,311,0701 – 182,773,395Forward Currency Contracts – 317,175 – 317,175Total Investments in Securities 97,462,325 85,628,245 – 183,090,570
1At 31 December 2020, the administrator used a systematic fair valuation model provided by an independent third party to value listed securities in order to adjust for stale pricing between the close of foreign exchanges and the valuation point. This resulted in an increase of USD 142,311 to common stocks with a fair value of USD 85,311,070.
There were transfers on Common Stock from level 2 to level 1 during the financial year ended 31 December 2021 and on Common Stock from level 1 to level 2 during the financial year ended 31 December 2020.
There were no investments held by the Fund at 31 December 2021 and 31 December 2020 that were fair valued at level 3 by the Janus Henderson Global Pricing Committee.
Valuation policy of private placements is referenced in note 2 of the financial statements.
DocuSign Envelope ID: 521655BF-9BE3-47DC-A9A3-494932954338

Janus Henderson Capital Funds plc / 31 December 2021214
Janus Henderson Global Real Estate Equity Income Fund (continued)
The accompanying notes are an integral part of the financial statements.
Capital Share Transactions
For the financial year ended 31 December 2021
A2 HEUR A2 USD A3 q HAUD A3 q USD A5m USD B1 q USD B2 USD E2 HEURShares Shares Shares Shares Shares Shares Shares Shares
At beginning of the year . . . . . . . 291,171 1,472,109 7,556 291,726 – 1,404 4,068 89,435Shares issued 172,256 1,453,039 15,289 629,941 304 – – 104,758Shares redeemed. . . . . . . . . . . (82,545) (837,374) – (248,735) – – – (44,015)At end of year . . . . . . . . . . . . . 380,882 2,087,774 22,845 672,932 304 1,404 4,068 150,178
E3 q HEUR H1 q GBP H1 q HGBP H1 q USD H2 USD I1 q USD I2 HEUR I2 USDShares Shares Shares Shares Shares Shares Shares Shares
At beginning of the year . . . . . . . 103,990 35,371 51,798 34,319 131,707 6,839,667 194,016 552,960Shares issued 21,041 2,245,969 5,124 12,129 602,473 2,095,425 165,199 762,207Shares redeemed. . . . . . . . . . . (54,779) (205,368) (19,193) (26,800) (28,512) (2,511,494) (37,823) (286,201)At end of year . . . . . . . . . . . . . 70,252 2,075,972 37,729 19,648 705,668 6,423,598 321,392 1,028,966
I3m USD V2 USD V5m USDShares Shares Shares
At beginning of the year . . . . . . . – – –Shares issued 301 300 304Shares redeemed. . . . . . . . . . . – – –At end of year . . . . . . . . . . . . . 301 300 304
For the financial year ended 31 December 2020
A2 HEUR A2 USD A3 q HAUD A3 q USD B1 q USD B2 USD E2 HEUR E3 q HEURShares Shares Shares Shares Shares Shares Shares Shares
At beginning of the year . . . . . . . 290,485 1,857,540 20,574 243,623 1,404 4,068 53,504 34,725Shares issued 89,194 928,116 37,155 236,802 – – 44,716 78,270Shares redeemed. . . . . . . . . . . (88,508) (1,313,547) (50,173) (188,699) – – (8,785) (9,005)At end of year . . . . . . . . . . . . . 291,171 1,472,109 7,556 291,726 1,404 4,068 89,435 103,990
H1 q GBP H1 q HGBP H1 q USD H2 USD I1 q USD I2 HEUR I2 USDShares Shares Shares Shares Shares Shares Shares
At beginning of the year . . . . . . . 52,166 49,210 27,513 207,484 5,172,125 39,090 334,493Shares issued 6,133 16,013 6,806 38,733 3,766,399 198,511 218,467Shares redeemed. . . . . . . . . . . (22,928) (13,425) – (114,510) (2,098,857) (43,585) –At end of year . . . . . . . . . . . . . 35,371 51,798 34,319 131,707 6,839,667 194,016 552,960
DocuSign Envelope ID: 521655BF-9BE3-47DC-A9A3-494932954338

215Janus Henderson Capital Funds plc / 31 December 2021
Janus Henderson Global Real Estate Equity Income Fund (continued)
The accompanying notes are an integral part of the financial statements.
Net Asset Comparison
31 December 2021 31 December 2020 31 December 2019
Net Assets (USD)
NAV Per Share
(Local Currency)Net Assets
(USD)
NAV Per Share
(Local Currency)Net Assets
(USD)
NAV Per Share
(Local Currency)
A2 HEUR 9,047,638 20.86 6,208,179 17.45 5,794,603 17.79A2 USD 58,509,610 28.02 34,131,878 23.19 42,843,428 23.06A3 q HAUD 243,493 14.65 72,962 12.52 190,200 13.18A3 q USD 12,487,645 18.56 4,583,813 15.71 3,918,118 16.08A5m USD 3,263 10.72 – – – –B1 q USD 29,940 21.32 25,026 17.82 25,168 17.93B2 USD 95,043 23.36 79,427 19.52 79,835 19.63E2 HEUR 2,658,849 15.55 1,428,128 13.07 803,595 13.39E3 q HEUR 974,936 12.19 1,332,615 10.49 430,488 11.05H1 q GBP 57,005,359 20.29 804,301 16.63 1,187,455 17.19H1 q HGBP 731,880 14.33 845,268 11.93 801,414 12.30H1 q USD 288,935 14.71 417,949 12.18 335,416 12.19H2 USD 11,172,503 15.83 1,703,360 12.93 2,637,229 12.71I1 q USD 142,896,355 22.25 126,006,703 18.42 95,391,481 18.44I2 HEUR 8,515,284 23.27 4,564,879 19.26 852,200 19.44I2 USD 15,455,071 15.02 6,798,685 12.30 4,048,830 12.10I3m USD 3,093 10.29 – – – –V2 USD 3,257 10.86 – – – –V5m USD 3,263 10.72 – – – –
. . .
DocuSign Envelope ID: 521655BF-9BE3-47DC-A9A3-494932954338

Janus Henderson Capital Funds plc / 31 December 2021216
Janus Henderson Global Real Estate Equity Income Fund (continued)
The accompanying notes are an integral part of the financial statements.
Total Expense Ratio (unaudited)
The Average Total Expense Ratio table shows the actual expenses, excluding transactions costs and trade commissions, incurred by each Class for the Fund during the reporting financial year expressed as a percentage of the average net assets for the corresponding year, on an annualised basis.
31 December 2021 31 December 2020 31 December 2019A2 HEUR 2.17% 2.21% 2.21%A2 USD 2.18% 2.18% 2.21%A3 q HAUD 2.17% 2.19% 2.17%A3 q USD 2.17% 2.20% 2.21%A5m USD* 1.97% – –B1 q USD 3.19% 3.19% 3.22%B2 USD 3.19% 3.23% 3.22%E2 HEUR 2.67% 2.70% 2.72%E3 q HEUR 2.69% 2.70% 2.71%H1 q GBP 0.92% 0.97% 1.02%H1 q HGBP 0.91% 0.98% 1.02%H1 q USD 0.91% 0.97% 1.03%H2 USD 0.91% 0.98% 1.03%I1 q USD 1.11% 1.15% 1.22%I2 HEUR 1.11% 1.14% 1.22%I2 USD 1.11% 1.16% 1.22%I3m USD* 0.96% – –V2 USD* 1.97% – –V5m USD* 1.97% – –
*As the share class launched during the year, an estimated Total Expense Ratio is disclosed for the year end.
DocuSign Envelope ID: 521655BF-9BE3-47DC-A9A3-494932954338

217Janus Henderson Capital Funds plc / 31 December 2021
Janus Henderson Global Real Estate Equity Income Fund (continued)
The accompanying notes are an integral part of the financial statements.
Distributions per share (unaudited)
The following table shows the distribution rate per share at Ex-date for each distributing share class :
Share Class (Local Currency) 15/01/2021 12/02/2021 15/03/2021 15/04/2021 14/05/2021 15/06/2021 15/07/2021 13/08/2021 15/09/2021 15/10/2021 15/11/2021 15/12/2021A3 q HAUD – 0.05444 – – 0.08014 – – 0.10466 – – 0.10368 –A3 q USD – 0.06052 – – 0.09565 – – 0.12172 – – 0.12502 –A5m USD – – – – – – – – – 0.05127 0.04982 0.05407E3 q HEUR – 0.04050 – – 0.06278 – – 0.08226 – – 0.08428 –H1 q GBP – 0.02148 – – 0.06103 – – 0.07833 – – 0.09529 –H1 q HGBP – 0.01615 – – 0.04378 – – 0.05751 – – 0.06787 –H1 q USD – 0.01685 – – 0.04538 – – 0.05782 – – 0.06838 –I1 q USD – 0.01666 – – 0.05822 – – 0.07681 – – 0.09226 –I3m USD – – – – – – – – – – 0.00283 0.01953V5m USD – – – – – – – – – 0.05127 0.04982 0.05407
– – – – – – – – – – – –All share classes distribute quarterly except for class I3m USD and V5m USD which launched on 28 September 2021 and 8 November 2021 respectively and distribute monthly.
Fund Performance (unaudited)
As at 31 December 2021
One year Three years Five yearsSince
inception
Performance (Annualised) 31/12/2020 31/12/2021
%
31/12/2017 31/12/2021
%
31/12/2015 31/12/2021
%
to 31/12/2021
%
H2 USD (Net)** 22.43 16.24*** 11.54*** 5.81***FTSE EPRA Nareit Global* 27.87 12.80 9.29 –
Five years 31/12/2015 31/12/2021
%H2 USD (Gross)* 14.08FTSE EPRA Nareit Global* 11.26
.
Discrete performance
31/12/2020 31/12/2021
%
31/12/2019 31/12/2020
%
31/12/2018 31/12/2019
%
31/12/2017 31/12/2018
%
31/12/2016 31/12/2017
%
H2 USD (Net)** 22.43 0.52*** 29.26*** (4.95)*** 15.65***FTSE EPRA Nareit Global* 27.87 (9.16) 23.58 (5.55) 15.01
H2 USD (Gross)* 22.43 2.75*** 32.11*** (2.73)*** 18.33***FTSE EPRA Nareit Global* 29.14 (7.34) 26.05 (3.65) 17.31
. . . . .*Benchmark Index has changed from FTSE EPRA Nareit Global Index to FTSE EPRA Nareit Global REITs effective 30 June 2021.
Class H2 USD is disclosed as it is the representative share class.
** The representative share class has changed from the A2 USD to the H2 USD share class with effect from August 2021.
*** Historical figures are based on the A2 USD share class.
Performance target: To achieve a dividend yield exceeding that of the FTSE EPRA Nareit Global REIT Index, before the deduction of charges, on an annual basis.
Please note the Gross Returns 5 year annualised table is only applicable for share classes which have been active for 5 or more years and the performance target is to be achieved over a specific annualised time period. Performance target and index shown in USD.
Past performance does not guarantee future returns. The rates of return will vary and the principal value of an investment will fluctuate. Shares, if redeemed, may be worth more or less than their original cost. The performance data does not take account of the commissions and costs incurred on the issue and redemption of Shares. All returns are calculated in the base currency of the representative Share Class.
There is no guarantee that the Fund’s performance will match or exceed the benchmark.
DocuSign Envelope ID: 521655BF-9BE3-47DC-A9A3-494932954338

Janus Henderson Capital Funds plc / 31 December 2021218
Janus Henderson Global Real Estate Equity Income Fund (continued)
Statements of Changes in Composition of Portfolio (unaudited)The tables below show a breakdown of material purchases and sales of the Investment Portfolio in accordance with Central Bank UCITS Regulations 79(2) requirements. All purchases and sales of investments exceeding 1% of the total value of each transaction respectively, are disclosed, with a minimum number of 20 of each such transaction. A full analysis of the movement on the Investment Portfolio is available upon request from the registered office.
Major Purchases for the year ended 31 December 2021
Shares or Principal Amount
Cost (USD)
Ventas, Inc. 222,339 12,601,731National Retail Properties, Inc. 257,236 12,175,114National Health Investors, Inc. 162,558 11,221,290Life Storage, Inc. 92,106 10,867,995Spirit Realty Capital, Inc. 221,135 10,342,320VICI Properties, Inc. 334,774 10,083,570Granite Real Estate Investment Trust 147,683 9,897,228CubeSmart 202,700 9,421,972Physicians Realty Trust 486,337 9,007,146MGM Growth Properties LLC 'A' 228,259 8,162,180American Campus Communities, Inc. 166,140 8,142,399Sabra Health Care REIT, Inc. 432,247 7,809,898Hilton Worldwide Holdings, Inc. 55,549 7,091,406UDR, Inc. 147,483 6,889,086Invitation Homes, Inc. 160,068 6,189,512Prologis, Inc. 54,547 5,932,475SL Green Realty Corp. 69,876 5,690,645American Tower Corp. 22,385 5,652,310HealthCo REIT 3,824,801 5,630,107Alexandria Real Estate Equities, Inc. 32,240 5,531,417Dream Industrial Real Estate Investment Trust 435,965 5,416,141Americold Realty Trust 129,084 4,887,546CapitaLand Integrated Commercial Trust 3,105,700 4,821,257Vonovia SE 78,000 4,764,999Essex Property Trust, Inc. 16,423 4,583,508China Vanke Co. Ltd. 1,211,200 4,505,498Vicinity Centres 3,825,530 4,478,165Sun Communities, Inc. 26,412 3,997,796Equinix, Inc. 6,155 3,971,950Douglas Emmett, Inc. 116,383 3,911,236Urban Logistics REIT plc 1,619,628 3,553,214New World Development Co. Ltd. 687,000 3,512,755Swire Properties Ltd. 1,114,000 3,495,192Duke Realty Corp. 80,776 3,472,574Mapletree Industrial Trust 1,687,160 3,414,262CRE Logistics REIT, Inc. 1,774 3,406,939VEREIT, Inc. 87,205 3,285,430Goodman Group 222,660 3,191,885
Major Sales for the year ended 31 December 2021
Shares or Principal Amount
Proceeds (USD)
Prologis, Inc. 87,743 10,585,366Mitsui Fudosan Co. Ltd. 413,100 9,604,615Sabra Health Care REIT, Inc. 635,038 9,400,487Deutsche Wohnen SE 148,000 9,290,614National Health Investors, Inc. 162,558 9,275,861VEREIT, Inc. 185,860 8,633,215Rexford Industrial Realty, Inc. 130,864 7,344,977Sun Hung Kai Properties Ltd. 465,333 6,956,618Americold Realty Trust 227,234 6,680,776Welltower, Inc. 90,668 6,336,259SBA Communications Corp. 18,998 6,090,952China Resources Land Ltd. 1,346,000 5,790,100Wharf Real Estate Investment Co. Ltd. 931,000 5,373,573Vonovia SE 78,000 5,038,150Equinix, Inc. 6,155 4,993,061Fastighets AB Balder 78,000 4,891,368American Tower Corp. 15,536 4,254,313Washington Real Estate Investment Trust 182,653 4,186,211Alexandria Real Estate Equities, Inc. 21,991 4,033,420China Vanke Co. Ltd. 1,211,200 3,838,776China Resources Mixc Lifestyle Services Ltd. 545,132 3,654,593Pebblebrook Hotel Trust 147,454 3,376,947NEXTDC Ltd. 385,118 3,372,612Swire Properties Ltd. 1,114,000 3,312,478Duke Realty Corp. 60,674 3,246,899Aroundtown SA 393,997 3,072,977Stockland 848,760 2,842,288GLP J-Reit 1,596 2,809,075Mapletree Industrial Trust 1,343,700 2,786,208VGP NV 13,464 2,744,065Sun Communities, Inc. 15,090 2,715,723Mapletree Logistics Trust 1,773,100 2,685,032Goodman Group 170,727 2,656,427Equity LifeStyle Properties, Inc. 34,855 2,627,618VICI Properties, Inc. 92,234 2,601,013Capitaland Group Pte. Ltd. 941,400 2,587,513UDR, Inc. 55,629 2,545,321NVR, Inc. 561 2,411,828
DocuSign Envelope ID: 521655BF-9BE3-47DC-A9A3-494932954338

Janus Henderson Absolute Return Income Fund
219Janus Henderson Capital Funds plc / 31 December 2021
Fund Overview (unaudited)Investment Objective and Policy
The Fund aims to provide positive, consistent returns (although not guaranteed) above those that would be earned on cash deposits over time.
Performance target: To outperform the FTSE 3-Month US Treasury Bill Index by at least 2% per annum, before the deduction of charges, over any 5 year period.
The Fund invests at least 80% of its assets in a global portfolio of bonds of any quality, including high yield (non-investment grade) bonds and asset-backed and mortgage-backed securities, issued by governments or companies. The Fund may invest directly or via derivatives (complex financial instruments).
In certain market conditions, the Fund may invest more than 35% of its assets in government bonds issued by any one body. The Fund will not invest more than 15% of its assets in high yield (non-investment grade) bonds and will never invest in bonds rated lower than B- or B3 (credit agency ratings), or if unrated deemed to be of a comparable quality by the investment manager.
The investment manager may use derivatives (complex financial instruments), including total return swaps, with the aim of making investment gains in line with the Fund's objective, to reduce risk or to manage the Fund more efficiently.
The Fund is actively managed with reference to the FTSE 3-Month US Treasury Bill Index as this forms the basis of the Fund's performance target. The investment manager has a high degree of freedom to choose individual investments for the Fund.
How Sustainability Risks are part of the investment processThe investments underlying this financial product (referred to as the Fund) do not take into account the EU criteria for environmentally sustainable economic activities, although the Manager and the Investment Manager have agreed a decision making process that will apply to investment decisions relating to the Fund as further detailed in the Prospectus.
The likely impacts of sustainability risks on the returns of the FundWhile the analysis of (Environmental, Social and Governance) ESG factors is an integral component across the Investment Manager’s investment capabilities and one of a number of inputs to the selection of investments and portfolio construction, the investment process of the Investment Manager is primarily designed to maximise long-term risk-adjusted returns for investors. Therefore, in managing the Fund, the Investment Manager does not maximise portfolio alignment with sustainability risks as a
separate goal in its own right nor does it precisely attribute the impact of ESG factors on returns for the Fund.
Fund Overview
Jason England and Daniel Siluk, portfolio managers
For the year ended 31 December 2021, the Janus Henderson Absolute Return Income Fund Class G2 US dollar terms returned -0.36% (Net) and 0.09% (Gross), compared with 0.05% and 2.05% Target (Gross) for its benchmark, the FTSE 3-month US Treasury Bill Index.
Underpinning our strategy is our strong belief that, over the long term, a globally diversified allocation to shorter-duration bonds offers considerable benefits to broader fixed income portfolios. For every asset class, however, there is a unique set of market conditions that provide investors few places to hide. For shorter-dated bonds, perhaps the most challenging environment is one in which interest rates are primed to rise across many of the world’s most investable regions.
The speed in which short-to-mid-dated yields rose early in the year caught the market off-guard, as COVID-19 vaccination efforts were still in their earliest days and were not without a series of fits and starts. In keeping with our tactic of maintaining a globally diversified portfolio, we had duration exposure to countries where the sell-off was especially pronounced. The force of the move ran counter to our view that with the pandemic still raging, it was too soon to price in a wholesale global economic recovery.
As the year progressed and economic activity resumed at a methodical pace, we lowered overall portfolio duration to account for gradually rising yields. This tactic generated positive performance for much of the year. Late in the year, volatility weighed on performance as global central banks belatedly recognized the strength and durability of inflation and, thus, pushed forward their policy normalization plans. Anticipating this eventuality, we had lowered portfolio duration considerably, especially by deploying interest rate hedges on the core of the portfolio. While these efforts buffered some of the losses, the widespread sell-off across short-to-mid-dated bonds meant completely avoiding these headwinds proved impossible for any portfolio with exposure to interest rates.
The upcoming year is shaping up to be one where relative value trades are likely to be attractive sources of excess returns. By relative value, we mean geographically, along the yield curve and among credit profiles. The disparate nature of the economic recovery and divergent policy responses mean that, at any given time, countries are likely to be in different places on the policy spectrum.
DocuSign Envelope ID: 521655BF-9BE3-47DC-A9A3-494932954338

Janus Henderson Capital Funds plc / 31 December 2021220
Janus Henderson Absolute Return Income Fund (continued)
Fund Overview (unaudited) (continued)
With respect to corporate issuers, an uneven global reopening would probably lead to variances in the economic cycle, resulting in relative value opportunities among issuers of different ratings in a particular country or those of similar ratings across jurisdictions.
Thank you for investing in the Janus Henderson Absolute Return Income Fund.
January 2022
DocuSign Envelope ID: 521655BF-9BE3-47DC-A9A3-494932954338

221Janus Henderson Capital Funds plc / 31 December 2021
The accompanying notes are an integral part of the financial statements.
Janus Henderson Absolute Return Income Fund (continued)
s
Statement of Financial PositionAs of
31 December 2021
(USD)
As of 31 December
2020 (USD)
Assets:Financial assets at fair value through profit or loss . . . . . . . . . . . . . . . . . . . . . . . . . . . . . . . . . . . . . . . . . . . . . . . . . . . . . . . 169,569,831 244,762,327Cash and foreign currency . . . . . . . . . . . . . . . . . . . . . . . . . . . . . . . . . . . . . . . . . . . . . . . . . . . . . . . . . . . . . . . . . . . . . . . 731,185 1,902,943Margin cash . . . . . . . . . . . . . . . . . . . . . . . . . . . . . . . . . . . . . . . . . . . . . . . . . . . . . . . . . . . . . . . . . . . . . . . . . . . . . . . . . 119,315 368,099Collateral cash . . . . . . . . . . . . . . . . . . . . . . . . . . . . . . . . . . . . . . . . . . . . . . . . . . . . . . . . . . . . . . . . . . . . . . . . . . . . . . . 680,000 1,370,000Receivables:
Funds shares sold . . . . . . . . . . . . . . . . . . . . . . . . . . . . . . . . . . . . . . . . . . . . . . . . . . . . . . . . . . . . . . . . . . . . . . . . . . . 23,182 47,616Interest . . . . . . . . . . . . . . . . . . . . . . . . . . . . . . . . . . . . . . . . . . . . . . . . . . . . . . . . . . . . . . . . . . . . . . . . . . . . . . . . . . . 620,077 890,575
Receivable from Investment Manager . . . . . . . . . . . . . . . . . . . . . . . . . . . . . . . . . . . . . . . . . . . . . . . . . . . . . . . . . . . . . . . . 14,953 50,628
Total Assets . . . . . . . . . . . . . . . . . . . . . . . . . . . . . . . . . . . . . . . . . . . . . . . . . . . . . . . . . . . . . . . . . . . . . . . . . 171,758,543 249,392,188 Liabilities (amounts falling due within one year)Payables:
Financial liabilities at fair value through profit or loss . . . . . . . . . . . . . . . . . . . . . . . . . . . . . . . . . . . . . . . . . . . . . . . . . . . . 251,145 5,457,289Margin cash . . . . . . . . . . . . . . . . . . . . . . . . . . . . . . . . . . . . . . . . . . . . . . . . . . . . . . . . . . . . . . . . . . . . . . . . . . . . . . . 1 12,988Spot foreign exchange contracts awaiting payment . . . . . . . . . . . . . . . . . . . . . . . . . . . . . . . . . . . . . . . . . . . . . . . . . . . . . 85 –Fund shares repurchased . . . . . . . . . . . . . . . . . . . . . . . . . . . . . . . . . . . . . . . . . . . . . . . . . . . . . . . . . . . . . . . . . . . . . . – 54,537Investment Management fees . . . . . . . . . . . . . . . . . . . . . . . . . . . . . . . . . . . . . . . . . . . . . . . . . . . . . . . . . . . . . . . . . . . 64,679 97,537Shareholder Service fees . . . . . . . . . . . . . . . . . . . . . . . . . . . . . . . . . . . . . . . . . . . . . . . . . . . . . . . . . . . . . . . . . . . . . . 456 580Accounting, Administration and Transfer Agent fees . . . . . . . . . . . . . . . . . . . . . . . . . . . . . . . . . . . . . . . . . . . . . . . . . . . . 26,445 25,683Management fees . . . . . . . . . . . . . . . . . . . . . . . . . . . . . . . . . . . . . . . . . . . . . . . . . . . . . . . . . . . . . . . . . . . . . . . . . . . 3,200 4,646Accrued expenses . . . . . . . . . . . . . . . . . . . . . . . . . . . . . . . . . . . . . . . . . . . . . . . . . . . . . . . . . . . . . . . . . . . . . . . . . . . 84,182 94,617
Total Liabilities (excluding Net Assets attributable to holders of redeemable ordinary shares) . . . . . . . . . . . . 430,193 5,747,877 Net Assets attributable to holders of redeemable ordinary participating shares . . . . . . . . . . . . . . . . . . . . . . 171,328,350 243,644,311
.
DocuSign Envelope ID: 521655BF-9BE3-47DC-A9A3-494932954338

Janus Henderson Capital Funds plc / 31 December 2021222
Janus Henderson Absolute Return Income Fund (continued)
The accompanying notes are an integral part of the financial statements.
Statement of Comprehensive IncomeYear ended
31 December 2021
(USD)
Year ended 31 December
2020 (USD)
Year ended Year endedRevenue:Interest income . . . . . . . . . . . . . . . . . . . . . . . . . . . . . . . . . . . . . . . . . . . . . . . . . . . . . . . . . . . . . . . . . . . . . . . . . . . . . . . 3,265,385 4,504,151Other income . . . . . . . . . . . . . . . . . . . . . . . . . . . . . . . . . . . . . . . . . . . . . . . . . . . . . . . . . . . . . . . . . . . . . . . . . . . . . . . . 17,657 574
Net (loss)/gain on financial assets and liabilities at fair value through profit or loss . . . . . . . . . . . . . . . . . . . . . . . . . . . . . . . . . . (5,548,714) 5,331,430 Total Investments (Loss)/Income . . . . . . . . . . . . . . . . . . . . . . . . . . . . . . . . . . . . . . . . . . . . . . . . . . . . . . . . . . (2,265,672) 9,836,155
Expenses:Investment Management fees . . . . . . . . . . . . . . . . . . . . . . . . . . . . . . . . . . . . . . . . . . . . . . . . . . . . . . . . . . . . . . . . . . . . . 932,992 1,060,912Shareholder Service fees . . . . . . . . . . . . . . . . . . . . . . . . . . . . . . . . . . . . . . . . . . . . . . . . . . . . . . . . . . . . . . . . . . . . . . . . 6,450 6,706Management fees . . . . . . . . . . . . . . . . . . . . . . . . . . . . . . . . . . . . . . . . . . . . . . . . . . . . . . . . . . . . . . . . . . . . . . . . . . . . . 48,385 27,867Accounting, Administration and Transfer Agent fees . . . . . . . . . . . . . . . . . . . . . . . . . . . . . . . . . . . . . . . . . . . . . . . . . . . . . . 99,781 130,524Custodian fees . . . . . . . . . . . . . . . . . . . . . . . . . . . . . . . . . . . . . . . . . . . . . . . . . . . . . . . . . . . . . . . . . . . . . . . . . . . . . . . 41,875 49,257Audit fees . . . . . . . . . . . . . . . . . . . . . . . . . . . . . . . . . . . . . . . . . . . . . . . . . . . . . . . . . . . . . . . . . . . . . . . . . . . . . . . . . . 22,791 30,019Printing expenses . . . . . . . . . . . . . . . . . . . . . . . . . . . . . . . . . . . . . . . . . . . . . . . . . . . . . . . . . . . . . . . . . . . . . . . . . . . . . 3,908 1,882Legal and other professional fees . . . . . . . . . . . . . . . . . . . . . . . . . . . . . . . . . . . . . . . . . . . . . . . . . . . . . . . . . . . . . . . . . . 5,041 45,380Other fees . . . . . . . . . . . . . . . . . . . . . . . . . . . . . . . . . . . . . . . . . . . . . . . . . . . . . . . . . . . . . . . . . . . . . . . . . . . . . . . . . . 30,438 37,422
Total Expenses . . . . . . . . . . . . . . . . . . . . . . . . . . . . . . . . . . . . . . . . . . . . . . . . . . . . . . . . . . . . . . . . . . . . . . . 1,191,661 1,389,969Less Expense Reimbursement . . . . . . . . . . . . . . . . . . . . . . . . . . . . . . . . . . . . . . . . . . . . . . . . . . . . . . . . . . . (226,799) (286,332)Net Expenses after Expense Reimbursement . . . . . . . . . . . . . . . . . . . . . . . . . . . . . . . . . . . . . . . . . . . . . . . . 964,862 1,103,637Net Operating (Loss)/Profit . . . . . . . . . . . . . . . . . . . . . . . . . . . . . . . . . . . . . . . . . . . . . . . . . . . . . . . . . . . . . . (3,230,534) 8,732,518
Finance Costs: 157,089 237,552
Swap interest expense . . . . . . . . . . . . . . . . . . . . . . . . . . . . . . . . . . . . . . . . . . . . . . . . . . . . . . . . . . . . . . . . . . . . . . . . . . (157,088) (237,552) Withholding tax on dividends and other investment income . . . . . . . . . . . . . . . . . . . . . . . . . . . . . . . . . . . . . (230) (1,825)
Net (Decrease)/Increase in Net Assets attributable to holders of redeemable ordinary shares resulting from operations . . . . . . . . . . . . . . . . . . . . . . . . . . . . . . . . . . . . . . . . . . . . . . . . . . . . . . . . . . . . . . . . . . . . . . . . . . . (3,387,852) 8,493,141
. .
. .. . .
Statement of Changes in Net Assets Attributable to Redeemable Ordinary ShareholdersYear ended
31 December 2021
(USD)
Year ended 31 December
2020 (USD)
(Decrease)/Increase in Net Assets attributable to holders of redeemable ordinary shares resulting from operations . . . . . . . . . . . . (3,387,852) 8,493,141
Capital Share Transactions of redeemable ordinary shares:Proceeds from redeemable ordinary shares sold . . . . . . . . . . . . . . . . . . . . . . . . . . . . . . . . . . . . . . . . . . . . . . . . . . . . . . . 29,605,721 67,192,996Redemption of redeemable ordinary shares . . . . . . . . . . . . . . . . . . . . . . . . . . . . . . . . . . . . . . . . . . . . . . . . . . . . . . . . . . (98,615,862) (61,056,768)Dilution Adjustment. . . . . . . . . . . . . . . . . . . . . . . . . . . . . . . . . . . . . . . . . . . . . . . . . . . . . . . . . . . . . . . . . . . . . . . . . . . 82,032 64,255
Net (Decrease)/Increase from Capital Share Transactions of redeemable ordinary shares . . . . . . . . . . . . . . (68,928,109) 6,200,483
Net (Decrease)/Increase in Net Assets attributable to holders of redeemable ordinary shares . . . . . . . . . . . . . . . . . . . . . . . . . . . (72,315,961) 14,693,624Net Assets attributable to holders of redeemable ordinary shares at the beginning of the financial year . . . . . . . . . . . . . . . . . . . . 243,644,311 228,950,687
Net Assets attributable to holders of redeemable ordinary shares at the end of the financial year . . . . . . . . . 171,328,350 243,644,311
Gains and losses are solely from continuing operations except for the Funds which ceased operations during the financial year ended 31 December 2021 or 31 December 2020. There were no gains and losses other than those dealt with in the Statement of Comprehensive Income. Please refer to note 1 which details the Fund closures during the year.
DocuSign Envelope ID: 521655BF-9BE3-47DC-A9A3-494932954338

223Janus Henderson Capital Funds plc / 31 December 2021
Janus Henderson Absolute Return Income Fund (continued)
Portfolio Investments
The accompanying notes are an integral part of the financial statements.
Shares or Principal Amount
Percentage of Net Assets
(%)Fair Value
(USD)
Financial Assets at fair value through profit or lossAsset-Backed/Commercial Mortgage-Backed Securities (2020: 4.03% USD 9,803,299)
1,483,760 La Trobe Financial Capital Markets Trust, 1.3650%, due 11/2/51 0.64 1,088,978
191,280 La Trobe Financial Capital Markets Trust, 1.6650%, due 11/2/51 0.08 139,634
554,637 Latitude Australia Personal Loans Trust, 1.0650%, due 17/6/28 0.24 404,911
196,437 Liberty, 1.3950%, due 10/6/51 0.08 144,220375,479 Liberty, 1.9150%, due 10/6/51 0.16 276,835375,479 Liberty, 2.1150%, due 10/6/51 0.16 277,182641,879 Liberty, 1.6650%, due 10/10/49 0.27 468,669327,485 Pepper Residential Securities Trust No.
18, 1.4150%, due 12/8/58 0.14 238,958110,387 Pepper Residential Securities Trust No.
22, 1.1039%, due 20/6/60 0.07 110,84688,300 Pepper Residential Securities Trust No.
24, 1.0039%, due 18/11/60 0.05 88,622543,291 Pepper SPARKZ Trust No. 2, 1.0683%,
due 16/10/27 0.23 396,468Total Asset-Backed/Commercial Mortgage-Backed Securities 2.12 3,635,323
Certificates of Deposit (2020: 0.92% USD 2,232,913)
Commercial Papers (2020: 4.31% USD 10,499,451)United StatesOil, Gas & Consumable Fuels
800,000 Energy Transfer LP, due 3/1/22 0.47 799,979
Total Commercial Papers 0.47 799,979
Corporate Bonds (2020: 90.85% USD 221,357,044)AustraliaAutomobiles
920,000 Mercedes-Benz Australia, 0.7500%, due 22/1/24 0.39 660,155
1,380,000 Volkswagen Financial Services Australia Pty. Ltd., 3.1000%, due 17/4/23 0.60 1,029,080
1,000,000 Volkswagen Financial Services Australia Pty. Ltd., 1.4000%, due 25/8/25 0.41 710,336
1.40 2,399,571
Banks2,350,000 Australia & New Zealand Banking
Group Ltd., 1.0850%, due 6/12/23 1.01 1,734,1761,410,000 Australia & New Zealand Banking
Group Ltd., 2.0400%, due 26/7/29 0.61 1,052,275600,000 Australia & New Zealand Banking
Group Ltd., 1.8991%, due 26/2/31 0.26 445,815900,000 Australian Central Credit Union Ltd.,
2.4650%, due 16/9/31 0.38 655,9161,320,000 Bank of Queensland Ltd., 1.1702%, due
30/10/24 0.57 974,8951,000,000 Bank of Queensland Ltd., 1.7972%, due
19/5/32 0.42 727,5331,400,000 Bendigo & Adelaide Bank Ltd.,
2.4976%, due 30/11/28 0.61 1,047,656500,000 Bendigo & Adelaide Bank Ltd.,
1.5070%, due 14/10/31 0.21 360,284700,000 Commonwealth Bank of Australia,
1.1550%, due 11/1/24 0.30 517,883120,000 Commonwealth Bank of Australia,
3.3500%, due 4/6/24 0.07 126,496850,000 Commonwealth Bank of Australia,
1.1250%, due 15/6/26 0.49 834,704
Shares or Principal Amount
Percentage of Net Assets
(%)Fair Value
(USD)
1,900,000 Commonwealth Bank of Australia,
1.3672%, due 20/8/31 0.81 1,383,679680,000 National Australia Bank Ltd., 2.1949%,
due 17/5/29 0.30 508,5071,410,000 National Australia Bank Ltd., 2.0600%,
due 18/11/31 0.62 1,057,6321,500,000 Westpac Banking Corp., 0.9949%, due
16/11/23 0.65 1,105,1081,450,000 Westpac Banking Corp., 4.3340%, due
16/8/29 0.65 1,115,040800,000 Westpac Banking Corp., 2.3500%, due
19/2/25 0.48 826,583600,000 Westpac Banking Corp., 2.0250%, due
27/8/29 0.26 447,9588.70 14,922,140
Capital Markets2,160,000 Macquarie Bank Ltd., 2.3000%, due
22/1/25 1.29 2,214,444600,000 Macquarie Bank Ltd., 2.9450%, due
28/5/30 0.27 456,2691,100,000 Macquarie Bank Ltd., 1.6204%, due
17/6/31 0.47 799,5722.03 3,470,285
Diversified Financial Services1,920,000 Liberty Financial Pty. Ltd., 2.5204%,
due 17/3/25 0.82 1,406,899630,000 Liberty Financial Pty. Ltd., 2.5950%,
due 25/5/26 0.27 462,426540,000 New Terminal Financing Co. Pty. Ltd.,
1.4750%, due 12/7/24 0.23 392,8771.32 2,262,202
Diversified Telecommunication Services600,000 Optus Finance Pty. Ltd., 1.6000%, due
1/7/25 0.25 431,859
Electric Utilities1,330,000 Ausgrid Finance Pty. Ltd., 1.1488%,
due 5/2/24 0.57 974,4392,500,000 Ausgrid Finance Pty. Ltd., 1.2902%, due
30/10/24 1.07 1,838,642200,000 AusNet Services Holdings Pty. Ltd.,
5.3750%, due 2/7/24 0.09 158,2681,750,000 ElectraNet Pty. Ltd., 2.4737%, due
15/12/28 0.72 1,234,196470,000 ETSA Utilities Finance Pty. Ltd.,
1.1015%, due 13/12/23 0.20 345,3471,020,000 Network Finance Co. Pty. Ltd.,
3.5000%, due 6/12/24 0.45 774,9271,100,000 Network Finance Co. Pty. Ltd.,
2.2500%, due 11/11/26 0.46 791,556840,000 United Energy Distribution Pty. Ltd.,
3.8500%, due 23/10/24 0.38 649,048500,000 Victoria Power Networks Finance Pty.
Ltd., 0.8404%, due 21/4/26 0.21 364,792700,000 Victoria Power Networks Finance Pty.
Ltd., 4.0000%, due 18/8/27 0.32 550,1584.47 7,681,373
Equity Real Estate Investment Trusts (REITs)1,710,000 Charter Hall LWR Pty. Ltd., 2.0860%,
due 3/3/28 0.69 1,188,273230,000 Dexus Wholesale Property Fund,
4.7500%, due 16/6/25 0.11 181,4651,000,000 GAIF Bond Issuer Pty. Ltd., 2.5840%,
due 18/11/27 0.43 734,089
DocuSign Envelope ID: 521655BF-9BE3-47DC-A9A3-494932954338

Janus Henderson Capital Funds plc / 31 December 2021224
The accompanying notes are an integral part of the financial statements.
Janus Henderson Absolute Return Income Fund (continued)
Portfolio Investments
Shares or Principal Amount
Percentage of Net Assets
(%)Fair Value
(USD)
660,000 GPT Wholesale Shopping Centre Fund
No. 1, 3.9930%, due 11/9/24 0.29 500,5011,170,000 GTA Finance Co. Pty. Ltd., 2.2000%,
due 26/8/27 0.48 824,9251,500,000 VER Finco Pty. Ltd., 2.4000%, due
21/9/28 0.61 1,047,333590,000 Vicinity Centres Trust, 1.4818%, due
27/6/25 0.26 436,2762.87 4,912,862
Gas Utilities1,000,000 Australian Gas Networks Ltd., 0.4877%,
due 1/7/26 0.42 711,186980,000 SGSP Australia Assets Pty. Ltd.,
3.3000%, due 9/4/23 0.59 1,007,6481.01 1,718,834
Insurance1,380,000 Insurance Australia Group Ltd.,
2.5121%, due 15/12/36 0.61 1,039,527200,000 Insurance Australia Group Ltd.,
2.1621%, due 15/6/44 0.09 147,4141,560,000 Suncorp Group Ltd., 2.2050%, due
5/12/28 0.68 1,161,813230,000 Suncorp-Metway Ltd., 3.3000%, due
15/4/24 0.14 240,7641.52 2,589,518
Machinery1,100,000 CNH Industrial Capital Australia Pty.
Ltd., 1.7500%, due 8/7/24 0.46 794,902
Real Estate Management & Development310,000 QIC Finance Shopping Center Fund
Pty. Ltd., 3.7500%, due 6/12/23 0.14 235,014470,000 QIC Finance Shopping Center Fund
Pty. Ltd., 1.3163%, due 15/8/25 0.20 345,4390.34 580,453
Transportation Infrastructure1,050,000 ConnectEast Finance Pty. Ltd.,
3.4000%, due 25/3/26 0.46 795,2372,190,000 Lonsdale Finance Pty. Ltd., 2.4500%,
due 20/11/26 0.93 1,590,1501,450,000 Lonsdale Finance Pty. Ltd., 2.1000%,
due 15/10/27 0.60 1,022,566390,000 WSO Finance Pty. Ltd., 4.5000%, due
31/3/27 0.18 312,5422.17 3,720,495
CanadaBanks
550,000 Bank of Montreal, 2.5000%, due 28/6/24 0.33 567,508
1,270,000 Bank of Montreal, 1.0341%, due 17/7/24 0.55 937,971350,000 Bank of Montreal, 0.6250%, due 9/7/24 0.20 345,422230,000 Bank of Nova Scotia (The), 2.3750%,
due 18/1/23 0.14 234,004860,000 Bank of Nova Scotia (The), 0.7000%,
due 15/4/24 0.50 852,836700,000 Bank of Nova Scotia (The), 1.0500%,
due 2/3/26 0.40 682,894780,000 Royal Bank of Canada, 1.1500%, due
10/6/25 0.45 773,870510,000 Royal Bank of Canada, 2.5500%, due
16/7/24 0.31 527,214470,000 Royal Bank of Canada, 1.2000%, due
27/4/26 0.27 462,085
Shares or Principal Amount
Percentage of Net Assets
(%)Fair Value
(USD)
570,000 Toronto-Dominion Bank (The),
0.5500%, due 4/3/24 0.33 564,079110,000 Toronto-Dominion Bank (The),
2.8500%, due 8/3/24 0.05 89,3841,200,000 Toronto-Dominion Bank (The),
0.7000%, due 10/9/24 0.69 1,185,1014.22 7,222,368
Oil, Gas & Consumable Fuels350,000 Harvest Operations Corp., 4.2000%,
due 1/6/23 0.21 364,203500,000 Harvest Operations Corp., 1.0000%,
due 26/4/24 0.29 496,8030.50 861,006
Road & Rail625,000 Canadian Pacific Railway Co., 1.3500%,
due 2/12/24 0.37 625,879
Cayman IslandsDiversified Financial Services
780,000 CK Hutchison International 17 Ltd., 2.8750%, due 5/4/22 0.46 784,009
Food & Staples Retailing820,000 CK Hutchison International 21 Ltd.,
1.5000%, due 15/4/26 0.47 809,625
Oil, Gas & Consumable Fuels400,000 SA Global Sukuk Ltd., 0.9460%, due
17/6/24 0.23 394,410
ChinaBanks
645,000 Agricultural Bank of China Ltd., 0.8500%, due 19/1/24 0.37 640,443
300,000 Bank of China Ltd., 5.0000%, due 13/11/24 0.19 327,457
0.56 967,900
FinlandBanks
600,000 Nordea Bank Abp, 1.0000%, due 9/6/23 0.35 602,056
Hong KongConsumer Finance
295,000 ICBCIL Finance Co. Ltd., 3.6500%, due 5/3/22 0.17 296,151
IrelandConsumer Finance
900,000 AerCap Ireland Capital DAC, 1.6500%, due 29/10/24 0.52 898,829
1,025,000 AerCap Ireland Capital DAC, 1.7500%, due 29/10/24 0.60 1,023,170
550,000 AerCap Ireland Capital DAC, 1.7500%, due 30/1/26 0.32 539,990
200,000 AerCap Ireland Capital DAC, 3.6500%, due 21/7/27 0.12 210,927
1.56 2,672,916
JapanBanks
500,000 Mitsubishi UFJ Financial Group, Inc., 0.8480%, due 15/9/24 0.29 497,730
1,850,000 Mizuho Financial Group, Inc., 1.5540%, due 9/7/27 1.06 1,821,039
1,525,000 Sumitomo Mitsui Financial Group, Inc., 1.4020%, due 17/9/26 0.87 1,490,087
2.22 3,808,856
DocuSign Envelope ID: 521655BF-9BE3-47DC-A9A3-494932954338

225Janus Henderson Capital Funds plc / 31 December 2021
The accompanying notes are an integral part of the financial statements.
Janus Henderson Absolute Return Income Fund (continued)
Portfolio Investments
Shares or Principal Amount
Percentage of Net Assets
(%)Fair Value
(USD)
NetherlandsBanks
500,000 Cooperatieve Rabobank UA, 2.6250%, due 22/7/24 0.30 516,509
500,000 Cooperatieve Rabobank UA, 1.3390%, due 24/6/26 0.29 493,215
400,000 Cooperatieve Rabobank UA, 0.3750%, due 12/1/24 0.23 394,935
0.82 1,404,659
Food Products600,000 Mondelez International Holdings
Netherlands BV, 0.7500%, due 24/9/24 0.34 590,298
New ZealandBanks
1,020,000 Kiwibank Ltd., 0.7622%, due 23/9/25 0.44 748,516
Diversified Telecommunication Services950,000 Spark Finance Ltd., 2.6000%, due
18/3/30 0.40 679,875
SingaporeBanks
300,000 DBS Group Holdings Ltd., 1.1690%, due 22/11/24 0.17 299,140
520,000 DBS Group Holdings Ltd., 1.6450%, due 16/3/28 0.22 382,216
980,000 DBS Group Holdings Ltd., 4.5200%, due 11/12/28 0.61 1,036,079
1,170,000 United Overseas Bank Ltd., 3.7500%, due 15/4/29 0.72 1,225,718
1.72 2,943,153
South KoreaElectric Utilities
2,110,000 Korea Southern Power Co. Ltd., 1.0402%, due 30/10/24 0.91 1,554,015
Oil, Gas & Consumable Fuels450,000 GS Caltex Corp., 1.6250%, due 27/7/25 0.26 448,824
SpainBanks
400,000 Banco Santander SA, 1.7220%, due 14/9/27 0.23 392,947
SwitzerlandCapital Markets
550,000 UBS AG, 0.3750%, due 1/6/23 0.32 545,864300,000 UBS AG, 0.7000%, due 9/8/24 0.17 296,676850,000 UBS Group AG, 1.4940%, due 10/8/27 0.48 829,630
0.97 1,672,170
United KingdomBanks
465,000 HSBC Holdings plc, 0.7320%, due 17/8/24 0.27 461,020
565,000 HSBC Holdings plc, 0.9760%, due 24/5/25 0.33 558,465
1,120,000 Lloyds Banking Group plc, 1.3650%, due 20/3/23 0.48 823,413
700,000 Lloyds Banking Group plc, 3.9000%, due 23/11/23 0.31 534,067
1.39 2,376,965
United StatesAerospace & Defense
825,000 Boeing Co. (The), 1.4330%, due 4/2/24 0.48 824,123
Shares or Principal Amount
Percentage of Net Assets
(%)Fair Value
(USD)
900,000 Boeing Co. (The), 2.1960%, due 4/2/26 0.53 900,518
1.01 1,724,641
Automobiles325,000 BMW US Capital LLC, 0.7500%, due
12/8/24 0.19 321,579450,000 BMW US Capital LLC, 1.2500%, due
12/8/26 0.26 443,271940,000 Daimler Finance North America LLC,
0.7500%, due 1/3/24 0.54 931,6861,900,000 Hyundai Capital America, 1.0000%,
due 17/9/24 1.09 1,868,2881,175,000 Stellantis Finance US, Inc., 1.7110%,
due 29/1/27 0.67 1,155,6012.75 4,720,425
Banks470,000 Bank of America Corp., 0.9810%, due
25/9/25 0.27 464,586230,000 Bank of America Corp., 1.6580%, due
11/3/27 0.13 228,4633,000,000 Bank of America Corp., 1.7340%, due
22/7/27 1.74 2,979,804945,000 Citigroup, Inc., 0.9810%, due 1/5/25 0.55 938,033750,000 Citigroup, Inc., 1.2810%, due 3/11/25 0.44 748,452
1,250,000 Citigroup, Inc., 1.1220%, due 28/1/27 0.71 1,218,096550,000 Citigroup, Inc., 1.4620%, due 9/6/27 0.32 540,849
1,410,000 JPMorgan Chase & Co., 2.3010%, due 15/10/25 0.84 1,442,935
630,000 JPMorgan Chase & Co., 1.0450%, due 19/11/26 0.36 614,072
1,400,000 JPMorgan Chase & Co., 0.9690%, due 23/6/25 0.81 1,387,133
780,000 SVB Financial Group, 2.1000%, due 15/5/28 0.46 780,880
1,720,000 Wells Fargo & Co., 1.6540%, due 2/6/24 1.01 1,735,123
310,000 Wells Fargo & Co., 0.8050%, due 19/5/25 0.18 306,635
1,410,000 Wells Fargo & Co., 2.1640%, due 11/2/26 0.84 1,431,861
8.66 14,816,922
Capital Markets1,800,000 Charles Schwab Corp. (The), 1.1500%,
due 13/5/26 1.04 1,777,4451,800,000 Goldman Sachs Group, Inc. (The),
0.6570%, due 10/9/24 1.04 1,785,5671,800,000 Goldman Sachs Group, Inc. (The),
1.5420%, due 10/9/27 1.03 1,764,5431,000,000 Morgan Stanley, 1.1640%, due 21/10/25 0.58 992,715
860,000 Morgan Stanley, 1.5930%, due 4/5/27 0.50 851,9761,835,000 Morgan Stanley, 1.5120%, due 20/7/27 1.05 1,806,777
5.24 8,979,023
Chemicals425,000 Ecolab, Inc., 0.9000%, due 15/12/23 0.25 425,670450,000 Ecolab, Inc., 1.6500%, due 1/2/27 0.26 452,294
0.51 877,964
Construction Materials425,000 Martin Marietta Materials, Inc.,
0.6500%, due 15/7/23 0.25 423,616
Consumer Finance310,000 American Honda Finance Corp.,
0.8750%, due 7/7/23 0.18 310,214310,000 American Honda Finance Corp.,
0.5500%, due 12/7/24 0.18 306,119
DocuSign Envelope ID: 521655BF-9BE3-47DC-A9A3-494932954338

Janus Henderson Capital Funds plc / 31 December 2021226
The accompanying notes are an integral part of the financial statements.
Janus Henderson Absolute Return Income Fund (continued)
Portfolio Investments
Shares or Principal Amount
Percentage of Net Assets
(%)Fair Value
(USD)
1,530,000 Caterpillar Financial Services Corp.,
0.4500%, due 17/5/24 0.88 1,511,855310,000 Caterpillar Financial Services Corp.,
0.8000%, due 13/11/25 0.18 304,3001,350,000 General Motors Financial Co., Inc.,
1.2000%, due 15/10/24 0.78 1,340,9021,150,000 John Deere Capital Corp., 0.4500%,
due 7/6/24 0.66 1,136,291450,000 John Deere Capital Corp., 0.6250%,
due 10/9/24 0.26 445,212270,000 John Deere Capital Corp., 0.7000%,
due 15/1/26 0.15 262,0381,800,000 Toyota Motor Credit Corp., 1.8000%,
due 13/2/25 1.07 1,828,2414.34 7,445,172
Containers & Packaging450,000 Avery Dennison Corp., 0.8500%, due
15/8/24 0.26 443,736
Diversified Financial Services1,000,000 Computershare US, Inc., 3.1470%, due
30/11/27 0.43 738,446
Diversified Telecommunication Services1,770,000 AT&T, Inc., 0.9000%, due 25/3/24 1.03 1,762,8831,490,000 Verizon Communications, Inc., 1.2649%,
due 17/2/23 0.64 1,092,875780,000 Verizon Communications, Inc.,
0.8500%, due 20/11/25 0.44 761,5882.11 3,617,346
Entertainment390,000 Walt Disney Co. (The), 1.7500%, due
30/8/24 0.23 396,404
Equity Real Estate Investment Trusts (REITs)590,000 American Tower Corp., 1.6000%, due
15/4/26 0.34 584,547125,000 American Tower Corp., 1.4500%, due
15/9/26 0.07 122,4421,000,000 Equinix, Inc., 1.4500%, due 15/5/26 0.57 981,153
0.98 1,688,142
Food & Staples Retailing200,000 7-Eleven, Inc., 0.6250%, due 10/2/23 0.12 199,292900,000 Walmart, Inc., 1.0500%, due 17/9/26 0.52 890,812
0.64 1,090,104
Food Products300,000 Conagra Brands, Inc., 0.5000%, due
11/8/23 0.17 297,534700,000 Hershey Co. (The), 2.3000%, due
15/8/26 0.42 726,005581,000 Mars, Inc., 2.7000%, due 1/4/25 0.35 604,598980,000 Nestle Holdings, Inc., 0.3750%, due
15/1/24 0.57 968,589425,000 Unilever Capital Corp., 0.6260%, due
12/8/24 0.25 422,5961.76 3,019,322
Health Care Equipment & Supplies275,000 Boston Scientific Corp., 3.7500%, due
1/3/26 0.17 295,705
Health Care Providers & Services1,000,000 Cardinal Health, Inc., 3.0790%, due
15/6/24 0.61 1,037,591875,000 Centene Corp., 4.2500%, due 15/12/27 0.53 913,701
Shares or Principal Amount
Percentage of Net Assets
(%)Fair Value
(USD)
680,000 CVS Health Corp., 2.6250%, due
15/8/24 0.41 704,507650,000 Humana, Inc., 0.6500%, due 3/8/23 0.38 646,854300,000 Humana, Inc., 1.3500%, due 3/2/27 0.17 291,858
2.10 3,594,511
Hotels, Restaurants & Leisure1,410,000 McDonald's Corp., 1.1850%, due
8/3/24 0.61 1,037,069550,000 McDonald's Corp., 3.0000%, due
8/3/24 0.24 412,8450.85 1,449,914
Insurance950,000 Athene Global Funding, 0.9140%, due
19/8/24 0.55 936,231940,000 Athene Global Funding, 1.6080%, due
29/6/26 0.54 923,6351.09 1,859,866
Interactive Media & Services1,130,000 Alphabet, Inc., 0.4500%, due 15/8/25 0.65 1,104,963
Internet & Direct Marketing Retail950,000 Amazon.com, Inc., 0.4500%, due
12/5/24 0.55 941,092700,000 Amazon.com, Inc., 0.8000%, due
3/6/25 0.40 692,545530,000 eBay, Inc., 1.4000%, due 10/5/26 0.31 522,381
1.26 2,156,018
IT Services1,430,000 Fiserv, Inc., 3.8000%, due 1/10/23 0.87 1,495,394
Life Sciences Tools & Services300,000 PerkinElmer, Inc., 0.5500%, due
15/9/23 0.17 297,580300,000 PerkinElmer, Inc., 0.8500%, due
15/9/24 0.17 295,911925,000 Thermo Fisher Scientific, Inc., 0.7970%,
due 18/10/23 0.54 922,138925,000 Thermo Fisher Scientific, Inc., 1.2150%,
due 18/10/24 0.54 924,4761.42 2,440,105
Paper & Forest Products1,880,000 Georgia-Pacific LLC, 0.6250%, due
15/5/24 1.08 1,856,405
Pharmaceuticals1,410,000 Johnson & Johnson, 0.5500%, due
1/9/25 0.81 1,381,429
Road & Rail220,000 DAE Funding LLC, 1.5500%, due
1/8/24 0.13 218,617
Semiconductors & Semiconductor Equipment1,840,000 Broadcom, Inc., 1.9500%, due 15/2/28 1.06 1,820,7301,050,000 NVIDIA Corp., 0.5840%, due 14/6/24 0.61 1,040,7611,050,000 TSMC Arizona Corp., 1.7500%, due
25/10/26 0.61 1,051,0322.28 3,912,523
Software890,000 Intuit, Inc., 0.6500%, due 15/7/23 0.52 887,607
1,250,000 Oracle Corp., 1.6500%, due 25/3/26 0.72 1,241,393425,000 VMware, Inc., 1.0000%, due 15/8/24 0.25 421,143425,000 VMware, Inc., 1.4000%, due 15/8/26 0.24 418,125
1.73 2,968,268
DocuSign Envelope ID: 521655BF-9BE3-47DC-A9A3-494932954338

227Janus Henderson Capital Funds plc / 31 December 2021
The accompanying notes are an integral part of the financial statements.
Janus Henderson Absolute Return Income Fund (continued)
Portfolio Investments
Shares or Principal Amount
Percentage of Net Assets
(%)Fair Value
(USD)
Specialty Retail
720,000 Home Depot, Inc. (The), 0.9000%, due 15/3/28 0.40 687,757
250,000 Home Depot, Inc. (The), 1.5000%, due 15/9/28 0.14 246,903
0.54 934,660
Technology Hardware, Storage & Peripherals1,070,000 Apple, Inc., 1.8000%, due 11/9/24 0.64 1,094,063
160,000 Apple, Inc., 0.5500%, due 20/8/25 0.09 155,768510,000 Apple, Inc., 0.7000%, due 8/2/26 0.29 499,951915,000 Hewlett Packard Enterprise Co.,
1.4500%, due 1/4/24 0.54 921,3401.56 2,671,122
Trading Companies & Distributors1,100,000 Air Lease Corp., 0.8000%, due 18/8/24 0.63 1,078,152375,000 Air Lease Corp., 1.8750%, due 15/8/26 0.22 369,178780,000 Aviation Capital Group LLC, 1.9500%,
due 30/1/26 0.44 761,5671,100,000 Aviation Capital Group LLC, 1.9500%,
due 20/9/26 0.62 1,069,5531.91 3,278,450
Virgin Islands, BritishOil, Gas & Consumable Fuels
940,000 Sinopec Capital 2013 Ltd., 3.1250%, due 24/4/23 0.56 962,665
500,000 Sinopec Group Overseas Development 2018 Ltd., 2.5000%, due 12/11/24 0.30 515,695
0.86 1,478,360
Total Corporate Bonds 93.61 160,418,665
Government Obligations (2020: 0.00% USD –)US Treasury Notes/Bonds
4,115,000 0.5000%, due 15/5/24 1.59 2,724,72210,000 0.0000%, due 6/1/22 0.01 10,00010,000 0.0000%, due 3/2/22 0.01 10,000
Total Government Obligations 1.61 2,744,722
Total Investments (Cost: USD 166,423,117) 97.81 167,598,689
Forward Currency Contracts (2020: 0.32% USD 778,533)Open as at 31 December 2021.
Current Market
Percentage of Net Unrealised
Currency Currency Value Settle Assets GainPurchased Sold (USD) Date (%) (USD)
.Citibank USD 54,750,330 AUD 73,700,000 53,626,167 10-Feb-22 0.66 1,124,163
J.P. Morgan CHF◊ 8,630 USD 9,395 9,492 31-Mar-22 0.00 97
EUR◊ 17,414,643 USD 19,703,470 19,862,723 31-Mar-22 0.09 159,253
GBP◊ 5,289,810 USD 6,992,074 7,157,237 31-Mar-22 0.10 165,163
SGD◊ 36,965,019 USD 27,027,150 27,419,108 31-Mar-22 0.23 391,958
USD 91,993 CAD 114,500 90,514 10-Feb-22 0.00 1,479
USD 552,597 NZD 794,000 543,531 10-Feb-22 0.01 9,066
Morgan Stanley AUD 600,000 USD 429,330 436,577 10-Feb-22 0.00 7,247
USD 731,417 AUD 1,000,000 727,627 10-Feb-22 0.00 3,790
USD 1,110,386 NZD 1,589,000 1,087,747 10-Feb-22 0.02 22,639
Total 1.11 1,884,855
.
Futures° (2020: 0.01% USD 25,952).
Counterparty No of Contracts
Percentage of Net
Assets (%)
UnrealisedGain (USD)
Credit Suisse (65) Australia 10 Year Bond 0.03 56,001Credit Suisse (244) US 2 Year Note 0.02 30,286Total 0.05 86,287
Interest Rate Swaps (2020: 0.03% USD 65,135)
Total Financial Assets at fair value through profit or loss 98.97 169,569,831
Financial Liabilities at fair value through profit or loss
Credit Default Swaps (2020: (0.11)% USD (254,450))
Forward Currency Contracts (2020: (2.06)% USD (5,011,970))Open as at 31 December 2021
Current Market
Percentage of Net Unrealised
Currency Currency Value Settle Assets LossPurchased Sold (USD) Date (%) (USD)
Citibank USD 723,187 AUD 1,000,000 727,628 10-Feb-22 0.00 (4,441)
USD 533,793 NZD 791,000 541,478 10-Feb-22 0.00 (7,685)
J.P. Morgan USD◊ 26,266 GBP 19,663 26,604 31-Mar-22 0.00 (338)
USD 536,766 NZD 790,000 540,794 10-Feb-22 0.00 (4,028)
Morgan Stanley AUD 2,000,000 USD 1,467,299 1,455,256 10-Feb-22 (0.01) (12,043)
Total (0.01) (28,535).
Futures° (2020: (0.01)% USD (23,278))
Counterparty No of Contracts
Percentage of Net
Assets (%)
Unrealised Loss
(USD)
Credit Suisse (29) US 10 Year Note (0.02) (37,203)Credit Suisse (364) US 5 Year Note (0.11) (185,407)Total (0.13) (222,610)
Interest Rate Swaps (2020: (0.07)% USD (167,591))
Total Financial Liabilities at fair value through profit or loss (0.14) (251,145)
Portfolio Analysis (Unaudited)
Analysis of Total Assets:% of Total
AssetsTransferable securities admitted to official stock exchange listing 43.21Transferable securities dealt in on another regulated market 53.90Financial derivative instruments dealt in on a regulated market 0.05Other transferable securities of the type referred to in Regulation 68 (1) (a), (b) and (c) 0.47OTC financial derivative instruments 1.10Other Assets 1.27Total Assets 100.00
◊ These forward currency contracts are used for share class hedging.° Refer to Note 5 for details of collateral held.
DocuSign Envelope ID: 521655BF-9BE3-47DC-A9A3-494932954338

Janus Henderson Capital Funds plc / 31 December 2021228
The accompanying notes are an integral part of the financial statements.
Janus Henderson Absolute Return Income Fund (continued)
Fair Value Hierarchy
The tables below provide the fair value hierarchy summary of the Fund’s financial assets and liabilities measured at fair value at 31 December 2021 and 31 December 2020.
31 December 2021
Level 1 - Quoted Prices
(USD)
Level 2 - Other Significant
Observable Inputs (USD)
Level 3 - Significant
Unobservable Inputs (USD)
Total (USD)
Asset-Backed/Commercial Mortgage-Backed Securities – 3,635,323 – 3,635,323Commercial Papers – 799,979 – 799,979Corporate Bonds – 160,418,665 – 160,418,665Forward Currency Contracts – 1,856,320 – 1,856,320Futures (136,323) – – (136,323)Government Obligations – 2,744,722 – 2,744,722Total Investments in Securities (136,323) 169,455,009 – 169,318,686
31 December 2020
Level 1 - Quoted Prices
(USD)
Level 2 - Other Significant
Observable Inputs (USD)
Level 3 - Significant
Unobservable Inputs (USD)
Total (USD)
Asset-Backed/Commercial Mortgage-Backed Securities – 9,803,299 – 9,803,299Certificates of Deposit – 2,232,913 – 2,232,913Commercial Papers – 10,499,451 – 10,499,451Corporate Bonds – 221,357,044 – 221,357,044Credit Default Swaps – (254,450) – (254,450)Forward Currency Contracts – (4,233,437) – (4,233,437)Futures 2,674 – – 2,674Interest Rate Swaps – (102,456) – (102,456)Total Investments in Securities 2,674 239,302,364 – 239,305,038
There were no investments held by the Fund at 31 December 2021 and 31 December 2020 that were fair valued at level 3 by the Janus Henderson Global Pricing Committee.
Valuation policy of private placements is referenced in note 2 of the financial statements.
DocuSign Envelope ID: 521655BF-9BE3-47DC-A9A3-494932954338

229Janus Henderson Capital Funds plc / 31 December 2021
Janus Henderson Absolute Return Income Fund (continued)
The accompanying notes are an integral part of the financial statements.
Capital Share Transactions
For the financial year ended 31 December 2021
A2 HCHF A2 HEUR A2 USD E2 HEUR E2 USD G2 HCHF G2 HEUR G2 HGBPShares Shares Shares Shares Shares Shares Shares Shares
At beginning of the year . . . . . . . 291 17,130 105,663 6,422 63,054 291 261 3,677Shares issued – 2,101 5,554 – 5,262 – 7,545 571,077Shares redeemed. . . . . . . . . . . – (6,196) (61,569) – (15,577) – (7,545) (67,014)At end of year . . . . . . . . . . . . . 291 13,035 49,648 6,422 52,739 291 261 507,740
G2 USD I2 HCHF I2 HEUR I2 HSGD I2 USD S2 HEUR S2 USDShares Shares Shares Shares Shares Shares Shares
At beginning of the year . . . . . . . 681,155 291 1,733,844 10,086,203 1,807,083 268 10,204,677Shares issued 62,350 2,379 15,270 10,241 209,776 – 1,597,901Shares redeemed. . . . . . . . . . . (459,443) (2,379) – (6,495,845) (1,557,289) – (2,132,581)At end of year . . . . . . . . . . . . . 284,062 291 1,749,114 3,600,599 459,570 268 9,669,997
For the financial year ended 31 December 2020
A2 HCHF A2 HEUR A2 USD E2 HEUR E2 USD G2 HCHF G2 HEUR G2 HGBPShares Shares Shares Shares Shares Shares Shares Shares
At beginning of the year . . . . . . . 291 18,000 128,005 10,440 57,276 291 261 5,677Shares issued – 7,621 22,444 – 23,061 – – –Shares redeemed. . . . . . . . . . . – (8,491) (44,786) (4,018) (17,283) – – (2,000)At end of year . . . . . . . . . . . . . 291 17,130 105,663 6,422 63,054 291 261 3,677
G2 USD I2 HCHF I2 HEUR I2 HSGD I2 USD S2 HEUR S2 USDShares Shares Shares Shares Shares Shares Shares
At beginning of the year . . . . . . . 1,074,008 291 1,579,380 6,481,691 2,005,374 268 11,654,419Shares issued 309,983 – 231,925 3,604,512 504,894 – 2,559,020Shares redeemed. . . . . . . . . . . (702,836) – (77,461) – (703,185) – (4,008,762)At end of year . . . . . . . . . . . . . 681,155 291 1,733,844 10,086,203 1,807,083 268 10,204,677
DocuSign Envelope ID: 521655BF-9BE3-47DC-A9A3-494932954338

Janus Henderson Capital Funds plc / 31 December 2021230
Janus Henderson Absolute Return Income Fund (continued)
The accompanying notes are an integral part of the financial statements.
Net Asset Comparison
31 December 2021 31 December 2020 31 December 2019
Net Assets (USD)
NAV Per Share
(Local Currency)Net Assets
(USD)
NAV Per Share
(Local Currency)Net Assets
(USD)
NAV Per Share
(Local Currency)
A2 HCHF 3,133 9.83 3,286 10.01 3,004 10.00A2 HEUR 142,348 9.59 204,125 9.75 196,088 9.71A2 USD 535,553 10.79 1,149,560 10.88 1,365,341 10.67E2 HEUR 68,176 9.32 74,684 9.52 111,469 9.52E2 USD 551,574 10.46 667,400 10.58 596,372 10.41G2 HCHF 3,161 9.91 3,300 10.05 3,004 10.00G2 HEUR 2,917 9.82 3,168 9.94 2,884 9.86G2 HGBP 7,124,959 10.37 52,389 10.42 76,992 10.24G2 USD 3,142,857 11.06 7,562,363 11.10 11,635,729 10.83I2 HCHF 3,150 9.88 3,295 10.04 3,004 10.00I2 HEUR 19,563,677 9.82 21,094,016 9.96 17,483,096 9.87I2 HSGD 27,490,760 10.29 78,895,221 10.34 48,907,593 10.15I2 USD 5,074,749 11.04 20,050,233 11.10 21,745,103 10.84S2 HEUR 3,043 9.98 3,302 10.09 3,003 10.00S2 USD 107,618,293 11.13 113,877,969 11.16 126,818,005 10.88
. . .
Total Expense Ratio (unaudited)
The Average Total Expense Ratio table shows the actual expenses, excluding transactions costs and trade commissions, incurred by each Class for the Fund during the reporting financial year expressed as a percentage of the average net assets for the corresponding year, on an annualised basis.
31 December 2021 31 December 2020 31 December 2019A2 HCHF 0.95% 0.87% 0.97%A2 HEUR 0.93% 0.93% 1.06%A2 USD 0.94% 0.87% 1.10%E2 HEUR 1.29% 1.30% 1.50%E2 USD 1.27% 1.23% 1.62%G2 HCHF 0.45% 0.45% 0.37%G2 HEUR 0.44% 0.45% 0.52%G2 HGBP 0.44% 0.45% 0.52%G2 USD 0.43% 0.45% 0.52%I2 HCHF 0.56% 0.60% 0.61%I2 HEUR 0.57% 0.60% 0.67%I2 HSGD 0.59% 0.60% 0.66%I2 USD 0.58% 0.60% 0.66%S2 HEUR 0.38% 0.38% 0.40%S2 USD 0.36% 0.38% 0.39%
DocuSign Envelope ID: 521655BF-9BE3-47DC-A9A3-494932954338
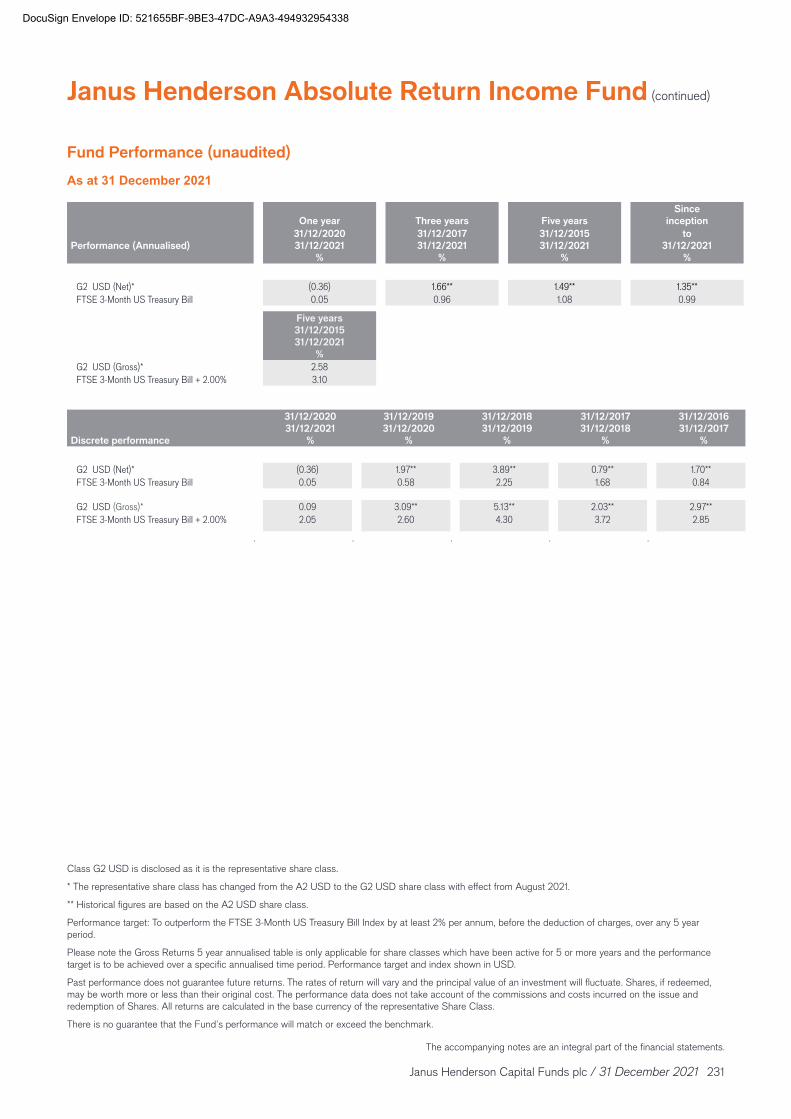
231Janus Henderson Capital Funds plc / 31 December 2021
Janus Henderson Absolute Return Income Fund (continued)
The accompanying notes are an integral part of the financial statements.
Fund Performance (unaudited)
As at 31 December 2021
One year Three years Five yearsSince
inception
Performance (Annualised) 31/12/2020 31/12/2021
%
31/12/2017 31/12/2021
%
31/12/2015 31/12/2021
%
to 31/12/2021
%
G2 USD (Net)* (0.36) 1.66** 1.49** 1.35**FTSE 3-Month US Treasury Bill 0.05 0.96 1.08 0.99
Five years 31/12/2015 31/12/2021
%G2 USD (Gross)* 2.58FTSE 3-Month US Treasury Bill + 2.00% 3.10
.
Discrete performance
31/12/2020 31/12/2021
%
31/12/2019 31/12/2020
%
31/12/2018 31/12/2019
%
31/12/2017 31/12/2018
%
31/12/2016 31/12/2017
%
G2 USD (Net)* (0.36) 1.97** 3.89** 0.79** 1.70**FTSE 3-Month US Treasury Bill 0.05 0.58 2.25 1.68 0.84
G2 USD (Gross)* 0.09 3.09** 5.13** 2.03** 2.97**FTSE 3-Month US Treasury Bill + 2.00% 2.05 2.60 4.30 3.72 2.85
. . . . .
Class G2 USD is disclosed as it is the representative share class.
* The representative share class has changed from the A2 USD to the G2 USD share class with effect from August 2021.
** Historical figures are based on the A2 USD share class.
Performance target: To outperform the FTSE 3-Month US Treasury Bill Index by at least 2% per annum, before the deduction of charges, over any 5 year period.
Please note the Gross Returns 5 year annualised table is only applicable for share classes which have been active for 5 or more years and the performance target is to be achieved over a specific annualised time period. Performance target and index shown in USD.
Past performance does not guarantee future returns. The rates of return will vary and the principal value of an investment will fluctuate. Shares, if redeemed, may be worth more or less than their original cost. The performance data does not take account of the commissions and costs incurred on the issue and redemption of Shares. All returns are calculated in the base currency of the representative Share Class.
There is no guarantee that the Fund’s performance will match or exceed the benchmark.
DocuSign Envelope ID: 521655BF-9BE3-47DC-A9A3-494932954338

Janus Henderson Capital Funds plc / 31 December 2021232
Janus Henderson Absolute Return Income Fund (continued)
Statements of Changes in Composition of Portfolio (unaudited)The tables below show a breakdown of material purchases and sales of the Investment Portfolio in accordance with Central Bank UCITS Regulations 79(2) requirements. All purchases and sales of investments exceeding 1% of the total value of each transaction respectively, are disclosed, with a minimum number of 20 of each such transaction. A full analysis of the movement on the Investment Portfolio is available upon request from the registered office.
Major Purchases for the year ended 31 December 2021
Shares or Principal Amount
Cost (USD)
Jabil, Inc., 0.0000%, due 23/7/21 6,250,000 6,249,925Aviation Capital Group LLC, 0.0000%, due 14/9/21 5,750,000 5,749,968Jabil, Inc., 0.0000%, due 14/9/21 5,500,000 5,499,947Jabil, Inc., 0.0000%, due 18/8/21 5,500,000 5,499,934Nissan Motor Acceptance Co. LLC, 0.0000%, due 16/9/21 5,500,000 5,499,932Conagra Brands, Inc., 0.0000%, due 7/9/21 5,500,000 5,499,896Jabil, Inc., 0.0000%, due 21/6/21 5,500,000 5,499,794Conagra Brands, Inc., 0.0000%, due 15/10/21 5,000,000 4,999,975Flex Ltd., 0.0000%, due 26/8/21 5,000,000 4,999,969Jabil, Inc., 0.0000%, due 6/10/21 5,000,000 4,999,947Plains All American Corp., 0.0000%, due 2/3/21 4,900,000 4,899,932Conagra Brands, Inc., 0.0000%, due 28/7/21 4,750,000 4,749,976Conagra Brands, Inc., 0.0000%, due 30/7/21 4,750,000 4,749,976FMC Corp., 0.0000%, due 29/9/21 4,750,000 4,749,974Smithfield Foods, Inc., 0.0000%, due 10/6/21 4,750,000 4,749,974Energy Transfer LP, 0.0000%, due 3/9/21 4,750,000 4,749,954Jabil, Inc., 0.0000%, due 4/8/21 4,750,000 4,749,943Conagra Brands, Inc., 0.0000%, due 29/4/21 4,600,000 4,599,968Jabil, Inc., 0.0000%, due 17/6/21 4,500,000 4,499,946Conagra Brands, Inc., 0.0000%, due 4/10/21 4,500,000 4,499,932
Major Sales for the year ended 31 December 2021
Shares or Principal Amount
Proceeds (USD)
Bank of America Corp., 1.0839%, due 23/7/24 3,700,000 3,752,622Athene Global Funding, 0.0000%, due 24/5/24 2,900,000 2,913,927Sydney Airport Finance Co. Pty. Ltd., 3.6250%, due 28/4/26 2,500,000 2,708,611Sumitomo Mitsui Financial Group, Inc., 1.3150%, due 16/10/24 3,500,000 2,663,366CNOOC Finance 2015 USA LLC, 3.7500%, due 2/5/23 2,400,000 2,519,760Energy Transfer LP, 0.0000%, due 20/9/21 2,500,000 2,499,923Toronto-Dominion Bank (The), 0.5033%, due 27/1/23 2,400,000 2,412,864PayPal Holdings, Inc., 1.3500%, due 1/6/23 2,310,000 2,341,228Mizuho Financial Group, Inc., 1.0573%, due 11/9/22 2,300,000 2,320,790Barclays plc, 1.5859%, due 15/2/23 2,285,000 2,294,171Mondelez International, Inc., 0.6250%, due 1/7/22 2,234,000 2,241,614Agricultural Bank of China Ltd., 0.9318%, due 26/9/22 2,880,000 2,179,954Morgan Stanley, 0.7800%, due 3/2/23 2,700,000 2,155,207Goldman Sachs Group, Inc. (The), 0.6300%, due 17/11/23 2,100,000 2,102,868Caterpillar Financial Services Corp., 0.7701%, due 6/6/22 2,000,000 2,012,826Credit Union Australia Ltd., 1.2850%, due 4/3/22 2,500,000 1,943,214ICBCIL Finance Co. Ltd., 3.6500%, due 5/3/22 1,905,000 1,925,806Bendigo & Adelaide Bank Ltd., 1.0452%, due 19/1/22 2,200,000 1,666,835International Business Machines Corp., 2.8500%, due 13/5/22 1,600,000 1,645,092Toronto-Dominion Bank (The), 0.5500%, due 4/3/24 1,630,000 1,630,352Oracle Corp., 2.5000%, due 15/5/22 1,546,000 1,574,642
DocuSign Envelope ID: 521655BF-9BE3-47DC-A9A3-494932954338

Janus Henderson Absolute Return Income Fund (EUR)
233Janus Henderson Capital Funds plc / 31 December 2021
The Fund ceased investment activities on 10 November 2021.
Please refer to the fund performance (unaudited) note for details on the Funds performance during the year.
DocuSign Envelope ID: 521655BF-9BE3-47DC-A9A3-494932954338

Janus Henderson Capital Funds plc / 31 December 2021234
The accompanying notes are an integral part of the financial statements.
Janus Henderson Absolute Return Income Fund (EUR) (continued)s
Statement of Financial PositionAs of
31 December 2021
(EUR)*
As of 31 December
2020 (EUR)
Assets:Financial assets at fair value through profit or loss . . . . . . . . . . . . . . . . . . . . . . . . . . . . . . . . . . . . . . . . . . . . . . . . . . . . . . . – 17,777,834Cash and foreign currency . . . . . . . . . . . . . . . . . . . . . . . . . . . . . . . . . . . . . . . . . . . . . . . . . . . . . . . . . . . . . . . . . . . . . . . 36,878 186,523Margin cash . . . . . . . . . . . . . . . . . . . . . . . . . . . . . . . . . . . . . . . . . . . . . . . . . . . . . . . . . . . . . . . . . . . . . . . . . . . . . . . . . 124,694 35,740Collateral cash . . . . . . . . . . . . . . . . . . . . . . . . . . . . . . . . . . . . . . . . . . . . . . . . . . . . . . . . . . . . . . . . . . . . . . . . . . . . . . . – 130,000Receivables:
Interest . . . . . . . . . . . . . . . . . . . . . . . . . . . . . . . . . . . . . . . . . . . . . . . . . . . . . . . . . . . . . . . . . . . . . . . . . . . . . . . . . . . – 79,169Receivable from Investment Manager . . . . . . . . . . . . . . . . . . . . . . . . . . . . . . . . . . . . . . . . . . . . . . . . . . . . . . . . . . . . . . . . 10,412 14,771
Total Assets . . . . . . . . . . . . . . . . . . . . . . . . . . . . . . . . . . . . . . . . . . . . . . . . . . . . . . . . . . . . . . . . . . . . . . . . . 171,984 18,224,037 Liabilities (amounts falling due within one year)Payables:
Financial liabilities at fair value through profit or loss . . . . . . . . . . . . . . . . . . . . . . . . . . . . . . . . . . . . . . . . . . . . . . . . . . . . – 217,763Bank overdraft and foreign currency . . . . . . . . . . . . . . . . . . . . . . . . . . . . . . . . . . . . . . . . . . . . . . . . . . . . . . . . . . . . . . . 308 –Margin cash . . . . . . . . . . . . . . . . . . . . . . . . . . . . . . . . . . . . . . . . . . . . . . . . . . . . . . . . . . . . . . . . . . . . . . . . . . . . . . . 124,694 1,465Investment Management fees . . . . . . . . . . . . . . . . . . . . . . . . . . . . . . . . . . . . . . . . . . . . . . . . . . . . . . . . . . . . . . . . . . . 1,644 9,527Shareholder Service fees . . . . . . . . . . . . . . . . . . . . . . . . . . . . . . . . . . . . . . . . . . . . . . . . . . . . . . . . . . . . . . . . . . . . . . 314 1,953Accounting, Administration and Transfer Agent fees . . . . . . . . . . . . . . . . . . . . . . . . . . . . . . . . . . . . . . . . . . . . . . . . . . . . 4,724 –Management fees . . . . . . . . . . . . . . . . . . . . . . . . . . . . . . . . . . . . . . . . . . . . . . . . . . . . . . . . . . . . . . . . . . . . . . . . . . . 367 735Accrued expenses . . . . . . . . . . . . . . . . . . . . . . . . . . . . . . . . . . . . . . . . . . . . . . . . . . . . . . . . . . . . . . . . . . . . . . . . . . . 39,933 44,233
Total Liabilities (excluding Net Assets attributable to holders of redeemable ordinary shares) . . . . . . . . . . . . 171,984 275,676 Net Assets attributable to holders of redeemable ordinary participating shares . . . . . . . . . . . . . . . . . . . . . . – 17,948,361
* The Fund ceased investment activities on 10 November 2021.
DocuSign Envelope ID: 521655BF-9BE3-47DC-A9A3-494932954338

235Janus Henderson Capital Funds plc / 31 December 2021
Janus Henderson Absolute Return Income Fund (EUR) (continued)
The accompanying notes are an integral part of the financial statements.
Statement of Comprehensive IncomeYear ended
31 December 2021
(EUR)*
Year ended 31 December
2020 (EUR)
Year ended Year endedRevenue:Interest income . . . . . . . . . . . . . . . . . . . . . . . . . . . . . . . . . . . . . . . . . . . . . . . . . . . . . . . . . . . . . . . . . . . . . . . . . . . . . . . 199,835 321,579Other income . . . . . . . . . . . . . . . . . . . . . . . . . . . . . . . . . . . . . . . . . . . . . . . . . . . . . . . . . . . . . . . . . . . . . . . . . . . . . . . . 1,007 14,982
Net (loss) on financial assets and liabilities at fair value through profit or loss . . . . . . . . . . . . . . . . . . . . . . . . . . . . . . . . . . . . . . (317,999) (77,724) Total Investments (Loss)/Income . . . . . . . . . . . . . . . . . . . . . . . . . . . . . . . . . . . . . . . . . . . . . . . . . . . . . . . . . . (117,157) 258,837
Expenses:Investment Management fees . . . . . . . . . . . . . . . . . . . . . . . . . . . . . . . . . . . . . . . . . . . . . . . . . . . . . . . . . . . . . . . . . . . . . 52,635 85,712Shareholder Service fees . . . . . . . . . . . . . . . . . . . . . . . . . . . . . . . . . . . . . . . . . . . . . . . . . . . . . . . . . . . . . . . . . . . . . . . . 8,027 19,011Management fees . . . . . . . . . . . . . . . . . . . . . . . . . . . . . . . . . . . . . . . . . . . . . . . . . . . . . . . . . . . . . . . . . . . . . . . . . . . . . 2,863 2,401Accounting, Administration and Transfer Agent fees . . . . . . . . . . . . . . . . . . . . . . . . . . . . . . . . . . . . . . . . . . . . . . . . . . . . . . 44,547 13,542Custodian fees . . . . . . . . . . . . . . . . . . . . . . . . . . . . . . . . . . . . . . . . . . . . . . . . . . . . . . . . . . . . . . . . . . . . . . . . . . . . . . . 12,786 21,883Audit fees . . . . . . . . . . . . . . . . . . . . . . . . . . . . . . . . . . . . . . . . . . . . . . . . . . . . . . . . . . . . . . . . . . . . . . . . . . . . . . . . . . 15,357 19,026Printing expenses . . . . . . . . . . . . . . . . . . . . . . . . . . . . . . . . . . . . . . . . . . . . . . . . . . . . . . . . . . . . . . . . . . . . . . . . . . . . . 647 2,486Legal and other professional fees . . . . . . . . . . . . . . . . . . . . . . . . . . . . . . . . . . . . . . . . . . . . . . . . . . . . . . . . . . . . . . . . . . 3,372 21,244Other fees . . . . . . . . . . . . . . . . . . . . . . . . . . . . . . . . . . . . . . . . . . . . . . . . . . . . . . . . . . . . . . . . . . . . . . . . . . . . . . . . . . 14,345 19,116
Total Expenses . . . . . . . . . . . . . . . . . . . . . . . . . . . . . . . . . . . . . . . . . . . . . . . . . . . . . . . . . . . . . . . . . . . . . . . 154,579 204,421Less Expense Reimbursement . . . . . . . . . . . . . . . . . . . . . . . . . . . . . . . . . . . . . . . . . . . . . . . . . . . . . . . . . . . (87,122) (80,583)Net Expenses after Expense Reimbursement . . . . . . . . . . . . . . . . . . . . . . . . . . . . . . . . . . . . . . . . . . . . . . . . 67,457 123,838Net Operating (Loss)/Profit . . . . . . . . . . . . . . . . . . . . . . . . . . . . . . . . . . . . . . . . . . . . . . . . . . . . . . . . . . . . . . (184,614) 134,999
Finance Costs: 11,960 17,473
Swap interest expense . . . . . . . . . . . . . . . . . . . . . . . . . . . . . . . . . . . . . . . . . . . . . . . . . . . . . . . . . . . . . . . . . . . . . . . . . . (11,960) (17,473) Withholding tax on dividends and other investment income . . . . . . . . . . . . . . . . . . . . . . . . . . . . . . . . . . . . . (164) (209)
Net (Decrease)/Increase in Net Assets attributable to holders of redeemable ordinary shares resulting from operations . . . . . . . . . . . . . . . . . . . . . . . . . . . . . . . . . . . . . . . . . . . . . . . . . . . . . . . . . . . . . . . . . . . . . . . . . . . (196,738) 117,317
. .
. .. . .
Statement of Changes in Net Assets Attributable to Redeemable Ordinary ShareholdersYear ended
31 December 2021
(EUR)*
Year ended 31 December
2020 (EUR)
(Decrease)/Increase in Net Assets attributable to holders of redeemable ordinary shares resulting from operations . . . . . . . . . . . . (196,738) 117,317
Capital Share Transactions of redeemable ordinary shares:Proceeds from redeemable ordinary shares sold . . . . . . . . . . . . . . . . . . . . . . . . . . . . . . . . . . . . . . . . . . . . . . . . . . . . . . . 664,908 8,768,610Redemption of redeemable ordinary shares . . . . . . . . . . . . . . . . . . . . . . . . . . . . . . . . . . . . . . . . . . . . . . . . . . . . . . . . . . (18,422,812) (7,097,056)Dilution Adjustment. . . . . . . . . . . . . . . . . . . . . . . . . . . . . . . . . . . . . . . . . . . . . . . . . . . . . . . . . . . . . . . . . . . . . . . . . . . 6,281 7,161
Net (Decrease)/Increase from Capital Share Transactions of redeemable ordinary shares . . . . . . . . . . . . . . (17,751,623) 1,678,715
Net (Decrease)/Increase in Net Assets attributable to holders of redeemable ordinary shares . . . . . . . . . . . . . . . . . . . . . . . . . . . (17,948,361) 1,796,032Net Assets attributable to holders of redeemable ordinary shares at the beginning of the financial year . . . . . . . . . . . . . . . . . . . . 17,948,361 16,152,329
Net Assets attributable to holders of redeemable ordinary shares at the end of the financial year . . . . . . . . . – 17,948,361
* The Fund ceased investment activities on 10 November 2021.
Gains and losses are solely from continuing operations except for the Funds which ceased operations during the financial year ended 31 December 2021 or 31 December 2020. There were no gains and losses other than those dealt with in the Statement of Comprehensive Income. Please refer to note 1 which details the Fund closures during the year.
DocuSign Envelope ID: 521655BF-9BE3-47DC-A9A3-494932954338

Janus Henderson Capital Funds plc / 31 December 2021236
The accompanying notes are an integral part of the financial statements.
Janus Henderson Absolute Return Income Fund (EUR) (continued)
Fair Value Hierarchy
The Fund ceased operations on 10 November 2021. There were no investments held by the Fund at 31 December 2021. The tables below provide the fair value hierarchy summary of the Fund’s financial assets and liabilities measured at fair value at 31 December 2020.
31 December 2020
Level 1 - Quoted Prices
(EUR)
Level 2 - Other Significant
Observable Inputs (EUR)
Level 3 - Significant
Unobservable Inputs (EUR)
Total (EUR)
Asset-Backed/Commercial Mortgage-Backed Securities – 779,601 – 779,601Certificates of Deposit – 158,662 – 158,662Corporate Bonds – 16,455,835 – 16,455,835Credit Default Swaps – (18,477) – (18,477)Forward Currency Contracts – 198,687 – 198,687Futures (3,969) – – (3,969)Interest Rate Swaps – (10,268) – (10,268)Total Investments in Securities (3,969) 17,564,040 – 17,560,071
There were no investments held by the Fund at 31 December 2021 and 31 December 2020 that were fair valued at level 3 by the Janus Henderson Global Pricing Committee.
Valuation policy of private placements is referenced in note 2 of the financial statements.
Capital Share Transactions
For the financial year ended 31 December 2021
A2 EUR G2 EUR G2 HCHF I2 EUR S2 EURShares Shares Shares Shares Shares
At beginning of the year . . . . . . . 750,536 1,005,985 291 15,093 272Shares issued 65,458 779 – – –Shares redeemed. . . . . . . . . . . (815,994) (1,006,764) (291) (15,093) (272)At end of year . . . . . . . . . . . . . – – – – –
For the financial year ended 31 December 2020
A2 EUR G2 EUR G2 HCHF I2 EUR S2 EURShares Shares Shares Shares Shares
At beginning of the year . . . . . . . 558,509 1,030,741 291 15,093 272Shares issued 713,858 157,977 – – –Shares redeemed. . . . . . . . . . . (521,831) (182,733) – – –At end of year . . . . . . . . . . . . . 750,536 1,005,985 291 15,093 272
DocuSign Envelope ID: 521655BF-9BE3-47DC-A9A3-494932954338

237Janus Henderson Capital Funds plc / 31 December 2021
Janus Henderson Absolute Return Income Fund (EUR) (continued)
The accompanying notes are an integral part of the financial statements.
Net Asset Comparison
31 December 2021 31 December 2020 31 December 2019
Net Assets (EUR)
NAV Per Share
(Local Currency)Net Assets
(EUR)
NAV Per Share
(Local Currency)Net Assets
(EUR)
NAV Per Share
(Local Currency)
A2 EUR – – 7,555,467 10.07 5,600,833 10.03G2 EUR – – 10,234,337 10.17 10,394,100 10.08G2 HCHF – – 2,698 10.04 2,676 10.00I2 EUR – – 153,110 10.14 151,996 10.07S2 EUR – – 2,749 10.09 2,724 10.00
. . .
Fund Performance (unaudited)
As at 31 December 2021
Discrete performance
31/12/2020 10/11/2021
%
31/12/2019 31/12/2020
%
27/02/2019 31/12/2019
%
A2 EUR (Net) (1.72) 0.40 –*BB Barclays Euro Treasury Bill 0-3 Mths - 840 (0.46) (0.43) –*
A2 EUR (Gross) (0.89) 1.39 –*BB Barclays Euro Treasury Bill 0-3 Mths - 840 + 2.00% 1.24 1.57 –*
. . .*The Fund had launched on 27 February 2019, hence no performance numbers disclosed.
Class A2 EUR is disclosed as it is the representative share class.
Performance target: To outperform the Bloomberg Barclays Euro Treasury Bills 0-3 months Index by at least 2% per annum, before the deduction of charges, over any 5 year period.
Please note the Gross Returns 5 year annualised table is only applicable for share classes which have been active for 5 or more years and the performance target is to be achieved over a specific annualised time period. Performance target and index shown in USD.
Past performance does not guarantee future returns. The rates of return will vary and the principal value of an investment will fluctuate. Shares, if redeemed, may be worth more or less than their original cost. The performance data does not take account of the commissions and costs incurred on the issue and redemption of Shares. All returns are calculated in the base currency of the representative Share Class.
There is no guarantee that the Fund’s performance will match or exceed the benchmark.
DocuSign Envelope ID: 521655BF-9BE3-47DC-A9A3-494932954338

Janus Henderson Capital Funds plc / 31 December 2021238
Janus Henderson Absolute Return Income Fund (EUR) (continued)
Statements of Changes in Composition of Portfolio (unaudited)The tables below show a breakdown of material purchases and sales of the Investment Portfolio in accordance with Central Bank UCITS Regulations 79(2) requirements. All purchases and sales of investments exceeding 1% of the total value of each transaction respectively, are disclosed, with a minimum number of 20 of each such transaction. A full analysis of the movement on the Investment Portfolio is available upon request from the registered office.
Major Purchases for the year ended 31 December 2021
Shares or Principal Amount
Cost (EUR)
Jabil, Inc., 0.0000%, due 12/10/21 500,000 432,715Energy Transfer LP, 0.0000%, due 8/11/21 500,000 432,233Energy Transfer LP, 0.0000%, due 4/11/21 500,000 430,715CNPC Finance HK Ltd., 0.0000%, due 29/10/21 500,000 428,061Energy Transfer LP, 0.0000%, due 5/11/21 400,000 346,092General Motors Financial Co., Inc., 0.0000%, due 5/11/21 300,000 259,570Jabil, Inc., 0.0000%, due 5/11/21 300,000 259,569Energy Transfer LP, 0.0000%, due 13/10/21 250,000 216,777Jabil, Inc., 0.0000%, due 13/10/21 250,000 216,777Energy Transfer LP, 0.0000%, due 8/10/21 250,000 216,364General Motors Financial Co., Inc., 0.0000%, due 8/10/21 250,000 216,364Energy Transfer LP, 0.0000%, due 7/10/21 250,000 216,280Jabil, Inc., 0.0000%, due 7/10/21 250,000 216,279Conagra Brands, Inc., 0.0000%, due 1/11/21 250,000 216,260Sinopec Century Bright Capital Investment America, 0.0000%, due 1/11/21 250,000 216,259Energy Transfer LP, 0.0000%, due 1/11/21 250,000 216,257General Motors Financial Co., Inc., 0.0000%, due 8/11/21 250,000 216,118Energy Transfer LP, 0.0000%, due 12/10/21 250,000 216,040Centennial Energy Holdings, Inc., 0.0000%, due 3/11/21 250,000 215,869Jabil, Inc., 0.0000%, due 3/11/21 250,000 215,869
Major Sales for the year ended 31 December 2021
Shares or Principal Amount
Proceeds (EUR)
La Trobe Financial Capital Markets Trust, 1.8600%, due 11/2/51 500,000 323,644Sumitomo Mitsui Financial Group, Inc., 1.3150%, due 16/10/24 500,000 319,797Westpac Banking Corp., 2.3500%, due 19/2/25 250,000 224,017Pepper SPARKZ Trust No. 2 'B', 1.5700%, due 16/10/27 333,739 213,874Verizon Communications, Inc., 0.8500%, due 20/11/25 250,000 211,765Georgia-Pacific LLC, 0.6300%, due 15/5/24 240,000 205,779Equinix, Inc., 1.2500%, due 15/7/25 240,000 205,510American Tower Corp., 3.3750%, due 15/5/24 220,000 200,552Lonsdale Finance Pty. Ltd., 2.4500%, due 20/11/26 300,000 192,059Aviation Capital Group LLC, 1.9500%, due 30/1/26 220,000 188,308SGSP Australia Assets Pty. Ltd., 3.2500%, due 29/7/26 200,000 184,288Utah Acquisition Sub, Inc., 3.1500%, due 15/6/21 220,000 182,858Korea East-West Power Co. Ltd., 3.8750%, due 19/7/23 200,000 181,561Harvest Operations Corp., 4.2000%, due 1/6/23 200,000 181,112Sinopec Group Overseas Development 2018 Ltd., 2.5000%, due 8/8/24 200,000 178,593Crown Castle International Corp., 3.1500%, due 15/7/23 200,000 178,436Ausgrid Finance Pty. Ltd., 3.8500%, due 1/5/23 200,000 178,317CNOOC Finance 2015 USA LLC, 3.7500%, due 2/5/23 200,000 176,580CNOOC Finance 2013 Ltd., 3.0000%, due 9/5/23 200,000 175,167Hewlett Packard Enterprise Co., 1.4500%, due 1/4/24 200,000 174,744
DocuSign Envelope ID: 521655BF-9BE3-47DC-A9A3-494932954338

Janus Henderson Absolute Return Income Opportunities Fund
239Janus Henderson Capital Funds plc / 31 December 2021
Fund Overview (unaudited)Investment Objective and Policy
The Fund aims to provide a return, from a combination of income and capital growth, while seeking to limit losses to capital (although not guaranteed).
Performance target: To outperform the FTSE 3-Month US Treasury Bill Index by at least 3% per annum, before the deduction of charges, over any 5 year period.
The Fund invests at least 80% of its assets in a global portfolio of bonds of any quality, including high yield/non-investment grade bonds, issued by companies or governments, asset-backed and mortgage backed securities.
In certain market conditions, the Fund may invest more than 35% of its assets in government bonds issued by any one body. The investment manager makes extensive use of derivatives (complex financial instruments), including total return swaps, with the aim of making investment gains in line with the Fund's objective, to reduce risk or to manage the Fund more efficiently.
The Fund is actively managed with reference to the FTSE 3-Month US Treasury Bill Index as this forms the basis of the Fund's performance target. The investment manager has a high degree of freedom to choose individual investments for the Fund.
How Sustainability Risks are part of the investment processThe investments underlying this financial product (referred to as the Fund) do not take into account the EU criteria for environmentally sustainable economic activities, although the Manager and the Investment Manager have agreed a decision making process that will apply to investment decisions relating to the Fund as further detailed in the Prospectus.
The likely impacts of sustainability risks on the returns of the FundWhile the analysis of (Environmental, Social and Governance) ESG factors is an integral component across the Investment Manager’s investment capabilities and one of a number of inputs to the selection of investments and portfolio construction, the investment process of the Investment Manager is primarily designed to maximise long-term risk-adjusted returns for investors. Therefore, in managing the Fund, the Investment Manager does not maximise portfolio alignment with sustainability risks as a separate goal in its own right nor does it precisely attribute the impact of ESG factors on returns for the Fund.
Fund Overview
Jason England, Daniel Siluk and Dylan Bourke*, portfolio managers
For the year ended 31 December 2021, the Janus Henderson Absolute Return Income Opportunities Fund Class G1m US dollar terms returned -0.1% (Net) and 0.45% (Gross), compared with 0.05% and 3.05% Target (Gross) for its benchmark, the FTSE 3-month US Treasury Bill Index.
Underpinning our strategy is our strong belief that, over the long term, a globally diversified allocation to shorter-duration bonds offers considerable benefits to broader fixed income portfolios. For every asset class, however, there is a unique set of market conditions that provide investors few places to hide. For shorter-dated bonds, perhaps the most challenging environment is one in which interest rates are primed to rise across many of the world’s most investable regions.
The speed in which short-to-mid-dated yields rose early in the year caught the market off-guard, as COVID-19 vaccination efforts were still in their earliest days and were not without a series of fits and starts. In keeping with our tactic of maintaining a globally diversified portfolio, we had duration exposure to countries where the sell-off was especially pronounced. The force of the move ran counter to our view that with the pandemic still raging, it was too soon to price in a wholesale global economic recovery.
As the year progressed and economic activity resumed at a methodical pace, we lowered overall portfolio duration to account for gradually rising yields. This tactic generated positive performance for much of the year. Late in the year, volatility weighed on performance as global central banks belatedly recognized the strength and durability of inflation and, thus, pushed forward their policy normalization plans. Anticipating this eventuality, we had lowered portfolio duration considerably, especially by deploying interest rate hedges on the core of the portfolio. While these efforts buffered some of the losses, the widespread sell-off across short-to-mid-dated bonds meant completely avoiding these headwinds proved impossible for any portfolio with exposure to interest rates.
Contributing to performance was the ‘carry’ generated by the Fund’s core of short-dated corporate and securitized credit. Over the course of the year we took steps to optimize the yield generation within our corporate credit sleeve. Furthermore, our securitized sleeve benefited from rising rates given the floating-rate nature of many of these securities.
*Effective 15 June 2021 Dylan Bourke also manages this Fund.
DocuSign Envelope ID: 521655BF-9BE3-47DC-A9A3-494932954338

Janus Henderson Capital Funds plc / 31 December 2021240
Janus Henderson Absolute Return Income Opportunities Fund (continued)
Fund Overview (unaudited) (continued)
The upcoming year is shaping up to be one where relative value trades are likely to be attractive sources of excess returns. By relative value, we mean geographically, along the yield curve and among credit profiles. The disparate nature of the economic recovery and divergent policy responses mean that, at any given time, countries are likely to be in different places on the policy spectrum. With respect to corporate issuers, an uneven global reopening would probably lead to variances in the economic cycle, resulting in relative value opportunities among issuers of different ratings in a particular country or those of similar ratings across jurisdictions.
Thank you for investing in the Janus Henderson Absolute Return Income Opportunities Fund.
January 2022
DocuSign Envelope ID: 521655BF-9BE3-47DC-A9A3-494932954338

241Janus Henderson Capital Funds plc / 31 December 2021
The accompanying notes are an integral part of the financial statements.
Janus Henderson Absolute Return Income Opportunities Fund (continued)s
Statement of Financial PositionAs of
31 December 2021
(USD)
As of 31 December
2020 (USD)
Assets:Financial assets at fair value through profit or loss . . . . . . . . . . . . . . . . . . . . . . . . . . . . . . . . . . . . . . . . . . . . . . . . . . . . . . . 34,332,114 38,605,590Cash and foreign currency . . . . . . . . . . . . . . . . . . . . . . . . . . . . . . . . . . . . . . . . . . . . . . . . . . . . . . . . . . . . . . . . . . . . . . . 525,673 3,760,412Margin cash . . . . . . . . . . . . . . . . . . . . . . . . . . . . . . . . . . . . . . . . . . . . . . . . . . . . . . . . . . . . . . . . . . . . . . . . . . . . . . . . . 12,698 68,455Collateral cash . . . . . . . . . . . . . . . . . . . . . . . . . . . . . . . . . . . . . . . . . . . . . . . . . . . . . . . . . . . . . . . . . . . . . . . . . . . . . . . 120,000 260,000Receivables:
Investments sold . . . . . . . . . . . . . . . . . . . . . . . . . . . . . . . . . . . . . . . . . . . . . . . . . . . . . . . . . . . . . . . . . . . . . . . . . . . . – 66,523Funds shares sold . . . . . . . . . . . . . . . . . . . . . . . . . . . . . . . . . . . . . . . . . . . . . . . . . . . . . . . . . . . . . . . . . . . . . . . . . . . 188,204 51,176Interest . . . . . . . . . . . . . . . . . . . . . . . . . . . . . . . . . . . . . . . . . . . . . . . . . . . . . . . . . . . . . . . . . . . . . . . . . . . . . . . . . . . 141,908 185,865
Receivable from Investment Manager . . . . . . . . . . . . . . . . . . . . . . . . . . . . . . . . . . . . . . . . . . . . . . . . . . . . . . . . . . . . . . . . 10,256 29,862
Total Assets . . . . . . . . . . . . . . . . . . . . . . . . . . . . . . . . . . . . . . . . . . . . . . . . . . . . . . . . . . . . . . . . . . . . . . . . . 35,330,853 43,027,883 Liabilities (amounts falling due within one year)Payables:
Financial liabilities at fair value through profit or loss . . . . . . . . . . . . . . . . . . . . . . . . . . . . . . . . . . . . . . . . . . . . . . . . . . . . 40,319 1,570,671Margin cash . . . . . . . . . . . . . . . . . . . . . . . . . . . . . . . . . . . . . . . . . . . . . . . . . . . . . . . . . . . . . . . . . . . . . . . . . . . . . . . – 12,888Collateral cash . . . . . . . . . . . . . . . . . . . . . . . . . . . . . . . . . . . . . . . . . . . . . . . . . . . . . . . . . . . . . . . . . . . . . . . . . . . . . . 10,000 –Spot foreign exchange contracts awaiting payment . . . . . . . . . . . . . . . . . . . . . . . . . . . . . . . . . . . . . . . . . . . . . . . . . . . . . 76 25Fund shares repurchased . . . . . . . . . . . . . . . . . . . . . . . . . . . . . . . . . . . . . . . . . . . . . . . . . . . . . . . . . . . . . . . . . . . . . . 1,053 15,000Investment Management fees . . . . . . . . . . . . . . . . . . . . . . . . . . . . . . . . . . . . . . . . . . . . . . . . . . . . . . . . . . . . . . . . . . . 16,201 19,460Shareholder Service fees . . . . . . . . . . . . . . . . . . . . . . . . . . . . . . . . . . . . . . . . . . . . . . . . . . . . . . . . . . . . . . . . . . . . . . 1,884 2,932Accounting, Administration and Transfer Agent fees . . . . . . . . . . . . . . . . . . . . . . . . . . . . . . . . . . . . . . . . . . . . . . . . . . . . 11,925 2,059Management fees . . . . . . . . . . . . . . . . . . . . . . . . . . . . . . . . . . . . . . . . . . . . . . . . . . . . . . . . . . . . . . . . . . . . . . . . . . . 656 785Accrued expenses . . . . . . . . . . . . . . . . . . . . . . . . . . . . . . . . . . . . . . . . . . . . . . . . . . . . . . . . . . . . . . . . . . . . . . . . . . . 65,016 75,435
Total Liabilities (excluding Net Assets attributable to holders of redeemable ordinary shares) . . . . . . . . . . . . 147,130 1,699,255 Net Assets attributable to holders of redeemable ordinary participating shares . . . . . . . . . . . . . . . . . . . . . . 35,183,723 41,328,628
.
DocuSign Envelope ID: 521655BF-9BE3-47DC-A9A3-494932954338

Janus Henderson Capital Funds plc / 31 December 2021242
Janus Henderson Absolute Return Income Opportunities Fund (continued)
The accompanying notes are an integral part of the financial statements.
Statement of Comprehensive IncomeYear ended
31 December 2021
(USD)
Year ended 31 December
2020 (USD)
Year ended Year endedRevenue:Interest income . . . . . . . . . . . . . . . . . . . . . . . . . . . . . . . . . . . . . . . . . . . . . . . . . . . . . . . . . . . . . . . . . . . . . . . . . . . . . . . 790,773 1,115,594Other income . . . . . . . . . . . . . . . . . . . . . . . . . . . . . . . . . . . . . . . . . . . . . . . . . . . . . . . . . . . . . . . . . . . . . . . . . . . . . . . . 2,265 5,193
Net (loss)/gain on financial assets and liabilities at fair value through profit or loss . . . . . . . . . . . . . . . . . . . . . . . . . . . . . . . . . . (891,560) 953,427 Total Investments (Loss)/Income . . . . . . . . . . . . . . . . . . . . . . . . . . . . . . . . . . . . . . . . . . . . . . . . . . . . . . . . . . (98,522) 2,074,214
Expenses:Investment Management fees . . . . . . . . . . . . . . . . . . . . . . . . . . . . . . . . . . . . . . . . . . . . . . . . . . . . . . . . . . . . . . . . . . . . . 204,038 245,695Shareholder Service fees . . . . . . . . . . . . . . . . . . . . . . . . . . . . . . . . . . . . . . . . . . . . . . . . . . . . . . . . . . . . . . . . . . . . . . . . 28,576 39,204Management fees . . . . . . . . . . . . . . . . . . . . . . . . . . . . . . . . . . . . . . . . . . . . . . . . . . . . . . . . . . . . . . . . . . . . . . . . . . . . . 8,927 5,037Accounting, Administration and Transfer Agent fees . . . . . . . . . . . . . . . . . . . . . . . . . . . . . . . . . . . . . . . . . . . . . . . . . . . . . . 64,442 35,842Custodian fees . . . . . . . . . . . . . . . . . . . . . . . . . . . . . . . . . . . . . . . . . . . . . . . . . . . . . . . . . . . . . . . . . . . . . . . . . . . . . . . 17,760 30,814Audit fees . . . . . . . . . . . . . . . . . . . . . . . . . . . . . . . . . . . . . . . . . . . . . . . . . . . . . . . . . . . . . . . . . . . . . . . . . . . . . . . . . . 22,033 29,799Printing expenses . . . . . . . . . . . . . . . . . . . . . . . . . . . . . . . . . . . . . . . . . . . . . . . . . . . . . . . . . . . . . . . . . . . . . . . . . . . . . (1,144) 7,925Legal and other professional fees . . . . . . . . . . . . . . . . . . . . . . . . . . . . . . . . . . . . . . . . . . . . . . . . . . . . . . . . . . . . . . . . . . 4,274 32,746Other fees . . . . . . . . . . . . . . . . . . . . . . . . . . . . . . . . . . . . . . . . . . . . . . . . . . . . . . . . . . . . . . . . . . . . . . . . . . . . . . . . . . 28,654 13,184
Total Expenses . . . . . . . . . . . . . . . . . . . . . . . . . . . . . . . . . . . . . . . . . . . . . . . . . . . . . . . . . . . . . . . . . . . . . . . 377,560 440,246Less Expense Reimbursement . . . . . . . . . . . . . . . . . . . . . . . . . . . . . . . . . . . . . . . . . . . . . . . . . . . . . . . . . . . (114,330) (116,637)Net Expenses after Expense Reimbursement . . . . . . . . . . . . . . . . . . . . . . . . . . . . . . . . . . . . . . . . . . . . . . . . 263,230 323,609Net Operating (Loss)/Profit . . . . . . . . . . . . . . . . . . . . . . . . . . . . . . . . . . . . . . . . . . . . . . . . . . . . . . . . . . . . . . (361,752) 1,750,605
Finance Costs: 106,341 144,211
Total distributions to holders of redeemable ordinary shares. . . . . . . . . . . . . . . . . . . . . . . . . . . . . . . . . . . . . . . . . . . . . . . . . (75,839) (107,014)Swap interest expense . . . . . . . . . . . . . . . . . . . . . . . . . . . . . . . . . . . . . . . . . . . . . . . . . . . . . . . . . . . . . . . . . . . . . . . . . . (30,502) (37,197)
Withholding tax on dividends and other investment income . . . . . . . . . . . . . . . . . . . . . . . . . . . . . . . . . . . . . (2,793) 2,831
Net (Decrease)/Increase in Net Assets attributable to holders of redeemable ordinary shares resulting from operations . . . . . . . . . . . . . . . . . . . . . . . . . . . . . . . . . . . . . . . . . . . . . . . . . . . . . . . . . . . . . . . . . . . . . . . . . . . (470,886) 1,609,225
. .
. .. . .
Statement of Changes in Net Assets Attributable to Redeemable Ordinary ShareholdersYear ended
31 December 2021
(USD)
Year ended 31 December
2020 (USD)
(Decrease)/Increase in Net Assets attributable to holders of redeemable ordinary shares resulting from operations . . . . . . . . . . . . (470,886) 1,609,225
Capital Share Transactions of redeemable ordinary shares:Proceeds from redeemable ordinary shares sold . . . . . . . . . . . . . . . . . . . . . . . . . . . . . . . . . . . . . . . . . . . . . . . . . . . . . . . 2,052,871 5,367,042Redemption of redeemable ordinary shares . . . . . . . . . . . . . . . . . . . . . . . . . . . . . . . . . . . . . . . . . . . . . . . . . . . . . . . . . . (7,734,485) (15,680,271)Dilution Adjustment. . . . . . . . . . . . . . . . . . . . . . . . . . . . . . . . . . . . . . . . . . . . . . . . . . . . . . . . . . . . . . . . . . . . . . . . . . . 7,595 1,964
Net (Decrease) from Capital Share Transactions of redeemable ordinary shares . . . . . . . . . . . . . . . . . . . . . . (5,674,019) (10,311,265)
Net (Decrease) in Net Assets attributable to holders of redeemable ordinary shares . . . . . . . . . . . . . . . . . . . . . . . . . . . . . . . . . (6,144,905) (8,702,040)Net Assets attributable to holders of redeemable ordinary shares at the beginning of the financial year . . . . . . . . . . . . . . . . . . . . 41,328,628 50,030,668
Net Assets attributable to holders of redeemable ordinary shares at the end of the financial year . . . . . . . . . 35,183,723 41,328,628
Gains and losses are solely from continuing operations except for the Funds which ceased operations during the financial year ended 31 December 2021 or 31 December 2020. There were no gains and losses other than those dealt with in the Statement of Comprehensive Income. Please refer to note 1 which details the Fund closures during the year.
DocuSign Envelope ID: 521655BF-9BE3-47DC-A9A3-494932954338

243Janus Henderson Capital Funds plc / 31 December 2021
Janus Henderson Absolute Return Income Opportunities Fund (continued)
Portfolio Investments
The accompanying notes are an integral part of the financial statements.
Shares or Principal Amount
Percentage of Net Assets
(%)Fair Value
(USD)
Financial Assets at fair value through profit or lossAsset-Backed/Commercial Mortgage-Backed Securities (2020: 16.95% USD 7,005,282)
1,300,000 Firstmac Mortgage Funding Trust No. 4, 1.3150%, due 8/3/49 2.71 953,713
1,182,772 La Trobe Financial Capital Markets Trust, 2.0150%, due 12/3/50 2.47 868,636
1,357,821 Liberty, 1.6650%, due 10/10/49 2.82 991,4151,157,779 Pepper Residential Securities Trust No.
23, 2.2650%, due 18/8/60 2.44 859,615280,921 Pepper SPARKZ Trust No. 2, 1.5683%,
due 16/10/27 0.58 205,3111,100,368 RedZed Trust, 2.4150%, due 9/3/50 2.30 809,578
Total Asset-Backed/Commercial Mortgage-Backed Securities 13.32 4,688,268
Commercial Papers (2020: 9.48% USD 3,919,753)United StatesOil, Gas & Consumable Fuels
700,000 Energy Transfer LP, due 3/1/22 1.99 699,982
Total Commercial Papers 1.99 699,982
Corporate Bonds (2020: 66.15% USD 27,339,834)AustraliaAutomobiles
1,050,000 Volkswagen Financial Services Australia Pty. Ltd., 2.4000%, due 28/8/24 2.21 776,072
Banks800,000 Australia & New Zealand Banking
Group Ltd., 2.0400%, due 26/7/29 1.70 597,0351,250,000 Australia & New Zealand Banking
Group Ltd., 1.8991%, due 26/2/31 2.64 928,781300,000 Australian Central Credit Union Ltd.,
2.4650%, due 16/9/31 0.62 218,639500,000 Bendigo & Adelaide Bank Ltd.,
2.4976%, due 30/11/28 1.06 374,163700,000 Bendigo & Adelaide Bank Ltd.,
1.5070%, due 14/10/31 1.43 504,397800,000 Commonwealth Bank of Australia,
1.3672%, due 20/8/31 1.66 582,6021,100,000 National Australia Bank Ltd., 2.0600%,
due 18/11/31 2.34 825,103640,000 Westpac Banking Corp., 4.8000%, due
14/6/28 1.38 485,853200,000 Westpac Banking Corp., 2.0250%, due
27/8/29 0.42 149,3191,500,000 Westpac Banking Corp., 1.6202%, due
29/1/31 3.13 1,100,82816.38 5,766,720
Capital Markets1,320,000 Macquarie Bank Ltd., 1.6204%, due
17/6/31 2.73 959,486
Construction & Engineering500,000 Downer Group Finance Pty. Ltd.,
3.7000%, due 29/4/26 1.08 380,929
Diversified Financial Services150,000 Liberty Financial Pty. Ltd., 2.6550%,
due 6/3/23 0.31 109,944810,000 Liberty Financial Pty. Ltd., 2.5204%,
due 17/3/25 1.69 593,5362.00 703,480
Shares or Principal Amount
Percentage of Net Assets
(%)Fair Value
(USD)
Electric Utilities
350,000 ElectraNet Pty. Ltd., 2.4737%, due 15/12/28 0.70 246,839
Equity Real Estate Investment Trusts (REITs)200,000 GTA Finance Co. Pty. Ltd., 2.2000%,
due 26/8/27 0.40 141,013900,000 Vicinity Centres Trust, 4.0000%, due
26/4/27 1.99 700,5462.39 841,559
Gas Utilities200,000 SGSP Australia Assets Pty. Ltd.,
3.3000%, due 9/4/23 0.58 205,642
Insurance350,000 Insurance Australia Group Ltd.,
2.5121%, due 15/12/36 0.75 263,648
Machinery450,000 CNH Industrial Capital Australia Pty.
Ltd., 2.1000%, due 12/12/22 0.94 331,276
Real Estate Management & Development400,000 QIC Finance Shopping Center Fund
Pty. Ltd., 1.3163%, due 15/8/25 0.83 293,990
ChinaBanks
650,000 Bank of China Ltd., 5.0000%, due 13/11/24 2.02 709,491
Hong KongConsumer Finance
700,000 ICBCIL Finance Co. Ltd., 3.6500%, due 5/3/22 2.00 702,730
IrelandConsumer Finance
175,000 AerCap Ireland Capital DAC, 1.6500%, due 29/10/24 0.50 174,772
150,000 AerCap Ireland Capital DAC, 1.7500%, due 29/10/24 0.42 149,732
150,000 AerCap Ireland Capital DAC, 1.7500%, due 30/1/26 0.42 147,270
200,000 AerCap Ireland Capital DAC, 2.4500%, due 29/10/26 0.57 201,755
1.91 673,529
New ZealandDiversified Telecommunication Services
270,000 Spark Finance Ltd., 2.6000%, due 18/3/30 0.55 193,228
SingaporeBanks
550,000 DBS Group Holdings Ltd., 4.5200%, due 11/12/28 1.65 581,473
891,000 Oversea-Chinese Banking Corp. Ltd., 4.2500%, due 19/6/24 2.70 948,431
4.35 1,529,904
South KoreaOil, Gas & Consumable Fuels
200,000 GS Caltex Corp., 1.6250%, due 27/7/25 0.57 199,477
Semiconductors & Semiconductor Equipment380,000 SK Hynix, Inc., 1.0000%, due 19/1/24 1.07 375,905
DocuSign Envelope ID: 521655BF-9BE3-47DC-A9A3-494932954338

Janus Henderson Capital Funds plc / 31 December 2021244
The accompanying notes are an integral part of the financial statements.
Janus Henderson Absolute Return Income Opportunities Fund (continued)
Portfolio Investments
Shares or Principal Amount
Percentage of Net Assets
(%)Fair Value
(USD)
United KingdomBanks
250,000 Standard Chartered plc, 1.9118%, due 28/6/25 0.53 186,950
250,000 Standard Chartered plc, 1.8220%, due 23/11/25 0.71 249,858
1.24 436,808
United StatesAerospace & Defense
725,000 Boeing Co. (The), 2.1960%, due 4/2/26 2.06 725,418
Automobiles720,000 Hyundai Capital America, 0.8750%,
due 14/6/24 2.01 706,427400,000 Stellantis Finance US, Inc., 1.7110%,
due 29/1/27 1.12 393,3963.13 1,099,823
Capital Markets650,000 Charles Schwab Corp. (The), 5.3750%,
due 1/6/25 2.02 710,125
Chemicals175,000 Ecolab, Inc., 1.6500%, due 1/2/27 0.50 175,892
Consumer Finance325,000 Ally Financial, Inc., 5.7500%, due
20/11/25 1.04 366,878375,000 General Motors Financial Co., Inc.,
1.0500%, due 8/3/24 1.06 373,202380,000 General Motors Financial Co., Inc.,
1.5000%, due 10/6/26 1.06 374,266350,000 OneMain Finance Corp., 8.8750%,
due 1/6/25 1.07 374,9154.23 1,489,261
Containers & Packaging400,000 Ball Corp., 4.0000%, due 15/11/23 1.19 418,000
Entertainment350,000 Netflix, Inc., 3.6250%, due 15/6/25 1.05 369,199
Equity Real Estate Investment Trusts (REITs)470,000 American Tower Corp., 1.4500%, due
15/9/26 1.31 460,381400,000 Crown Castle International Corp.,
1.0500%, due 15/7/26 1.10 386,692440,000 Equinix, Inc., 1.2500%, due 15/7/25 1.23 432,529
3.64 1,279,602
Health Care Providers & Services350,000 Centene Corp., 4.2500%, due 15/12/27 1.04 365,481165,000 HCA, Inc., 5.3750%, due 1/2/25 0.52 181,550375,000 Universal Health Services, Inc.,
1.6500%, due 1/9/26 1.05 368,4642.61 915,495
Insurance375,000 Athene Global Funding, 1.6080%, due
29/6/26 1.05 368,472
Internet & Direct Marketing Retail300,000 eBay, Inc., 1.9000%, due 11/3/25 0.86 303,595
Oil, Gas & Consumable Fuels304,000 DCP Midstream Operating LP,
4.9500%, due 1/4/22 0.86 304,000
Road & Rail375,000 Ashtead Capital, Inc., 1.5000%, due
12/8/26 1.05 368,513
Shares or Principal Amount
Percentage of Net Assets
(%)Fair Value
(USD)
210,000 DAE Funding LLC, 1.5500%, due
1/8/24 0.59 208,6801.64 577,193
Semiconductors & Semiconductor Equipment630,000 Broadcom, Inc., 1.9500%, due 15/2/28 1.77 623,402175,000 Microchip Technology, Inc., 4.2500%,
due 1/9/25 0.52 181,779350,000 Qorvo, Inc., 1.7500%, due 15/12/24 1.00 350,594
3.29 1,155,775
Technology Hardware, Storage & Peripherals225,000 Hewlett Packard Enterprise Co.,
1.4500%, due 1/4/24 0.64 226,559
Thrifts & Mortgage Finance350,000 Rocket Mortgage LLC, 2.8750%, due
15/10/26 0.99 347,844
Trading Companies & Distributors200,000 Air Lease Corp., 1.8750%, due 15/8/26 0.56 196,895375,000 Air Lease Corp., 2.1000%, due 1/9/28 1.03 361,977400,000 Aviation Capital Group LLC, 1.9500%,
due 30/1/26 1.11 390,547150,000 Aviation Capital Group LLC, 1.9500%,
due 20/9/26 0.41 145,8483.11 1,095,267
Virgin Islands, BritishOil, Gas & Consumable Fuels
1,380,000 Sinopec Capital 2013 Ltd., 3.1250%, due 24/4/23 4.02 1,413,275
Total Corporate Bonds 81.19 28,565,508
Total Investments (Cost: USD 33,466,612) 96.50 33,953,758
Forward Currency Contracts (2020: 0.75% USD 307,467)Open as at 31 December 2021.
Current Market
Percentage of Net Unrealised
Currency Currency Value Settle Assets GainPurchased Sold (USD) Date (%) (USD)
.Citibank USD 16,491,958 AUD 22,200,000 16,153,336 10-Feb-22 0.96 338,622
J.P. Morgan CHF◊ 22,411 USD 24,399 24,652 31-Mar-22 0.00 253
EUR◊ 2,648,749 USD 2,996,911 3,021,099 31-Mar-22 0.07 24,188
GBP◊ 5,456 USD 7,211 7,382 31-Mar-22 0.00 171
SGD◊ 13,122 USD 9,594 9,733 31-Mar-22 0.00 139
Morgan Stanley AUD 200,000 USD 142,751 145,526 10-Feb-22 0.01 2,775
Total 1.04 366,148
.
Futures° (2020: 0.03% USD 14,788).
Counterparty No of Contracts
Percentage of Net
Assets (%)
Unrealised Gain
(USD)
Credit Suisse (11) Australia 10 Year Bond 0.02 9,477Credit Suisse (22) US 2 Year Note 0.01 2,731Total 0.03 12,208
Interest Rate Swaps (2020: 0.05% USD 18,466)
Total Financial Assets at fair value through profit or loss 97.57 34,332,114
DocuSign Envelope ID: 521655BF-9BE3-47DC-A9A3-494932954338

245Janus Henderson Capital Funds plc / 31 December 2021
The accompanying notes are an integral part of the financial statements.
Janus Henderson Absolute Return Income Opportunities Fund (continued)
Portfolio Investments
Financial Liabilities at fair value through profit or loss
Credit Default Swaps (2020: (0.12)% USD (51,711))
Forward Currency Contracts (2020: (3.60)% USD (1,486,902))Open as at 31 December 2021
Current Market
Percentage of Net Unrealised
Currency Currency Value Settle Assets LossPurchased Sold (USD) Date (%) (USD)
J.P. Morgan USD◊ 2,432 EUR 2,142 2,444 31-Mar-22 0.00 (12)
Total 0.00 (12).
Futures° (2020: 0.00% USD (738))
Counterparty No of Contracts
Percentage of Net
Assets (%)
Unrealised Loss
(USD)
Credit Suisse 33 Australia 3 Year Bond (0.01) (3,500)Credit Suisse (14) US 10 Year Note (0.05) (17,960)Credit Suisse (37) US 5 Year Note (0.05) (18,847)Total (0.11) (40,307)
Interest Rate Swaps (2020: (0.08)% USD (31,320))
Total Financial Liabilities at fair value through profit or loss (0.11) (40,319)
Portfolio Analysis (Unaudited)
Analysis of Total Assets:% of Total
AssetsTransferable securities admitted to official stock exchange listing 45.78Transferable securities dealt in on another regulated market 48.35Financial derivative instruments dealt in on a regulated market 0.03Other transferable securities of the type referred to in Regulation 68 (1) (a), (b) and (c) 1.98OTC financial derivative instruments 1.04Other Assets 2.82Total Assets 100.00
◊ These forward currency contracts are used for share class hedging.° Refer to Note 5 for details of collateral held.
DocuSign Envelope ID: 521655BF-9BE3-47DC-A9A3-494932954338

Janus Henderson Capital Funds plc / 31 December 2021246
The accompanying notes are an integral part of the financial statements.
Janus Henderson Absolute Return Income Opportunities Fund (continued)
Fair Value Hierarchy
The tables below provide the fair value hierarchy summary of the Fund’s financial assets and liabilities measured at fair value at 31 December 2021 and 31 December 2020.
31 December 2021
Level 1 - Quoted Prices
(USD)
Level 2 - Other Significant
Observable Inputs (USD)
Level 3 - Significant
Unobservable Inputs (USD)
Total (USD)
Asset-Backed/Commercial Mortgage-Backed Securities – 4,688,268 – 4,688,268Commercial Papers – 699,982 – 699,982Corporate Bonds – 28,565,508 – 28,565,508Forward Currency Contracts – 366,136 – 366,136Futures (28,099) – – (28,099)Total Investments in Securities (28,099) 34,319,894 – 34,291,795
31 December 2020
Level 1 - Quoted Prices
(USD)
Level 2 - Other Significant
Observable Inputs (USD)
Level 3 - Significant
Unobservable Inputs (USD)
Total (USD)
Asset-Backed/Commercial Mortgage-Backed Securities – 7,005,282 – 7,005,282Commercial Papers – 3,919,753 – 3,919,753Corporate Bonds – 27,339,834 – 27,339,834Credit Default Swaps – (51,711) – (51,711)Forward Currency Contracts – (1,179,435) – (1,179,435)Futures 14,050 – – 14,050Interest Rate Swaps – (12,854) – (12,854)Total Investments in Securities 14,050 37,020,869 – 37,034,919
There were no investments held by the Fund at 31 December 2021 and 31 December 2020 that were fair valued at level 3 by the Janus Henderson Global Pricing Committee.
Valuation policy of private placements is referenced in note 2 of the financial statements.
DocuSign Envelope ID: 521655BF-9BE3-47DC-A9A3-494932954338

247Janus Henderson Capital Funds plc / 31 December 2021
Janus Henderson Absolute Return Income Opportunities Fund (continued)
The accompanying notes are an integral part of the financial statements.
Capital Share Transactions
For the financial year ended 31 December 2021
A2 HCHF A2 HEUR A2 USD A4m HEUR A4m HSGD A4m SGD A4m USD E2 HEURShares Shares Shares Shares Shares Shares Shares Shares
At beginning of the year . . . . . . . 2,500 116,639 455,769 43,850 1,518 422 238,338 77,433Shares issued – 11,357 53,840 0 46 13 4,256 21,341Shares redeemed. . . . . . . . . . . – (46,290) (157,176) (1,145) – – (70,008) (55,119)At end of year . . . . . . . . . . . . . 2,500 81,706 352,433 42,705 1,564 435 172,586 43,655
E2 USD E4m HEUR E4m USD G1m USD G2 HGBP G2 USD I2 HEUR I2 USDShares Shares Shares Shares Shares Shares Shares Shares
At beginning of the year . . . . . . . 13,712 47,765 3,374 10,057 1,000 217,061 184,988 224,529Shares issued 337 506 10 – – 764 119 7,063Shares redeemed. . . . . . . . . . . (779) (17,829) (1,651) – (480) (217,825) (86,218) (11,406)At end of year . . . . . . . . . . . . . 13,270 30,442 1,733 10,057 520 – 98,889 220,186
S2 USDShares
At beginning of the year . . . . . . . 2,194,498Shares issued 90,999Shares redeemed. . . . . . . . . . . (54,623)At end of year . . . . . . . . . . . . . 2,230,874
For the financial year ended 31 December 2020
A2 HCHF A2 HEUR A2 USD A4m HEUR A4m HSGD A4m SGD A4m USD E2 HEURShares Shares Shares Shares Shares Shares Shares Shares
At beginning of the year . . . . . . . 2,500 194,248 687,280 62,202 1,472 409 350,898 83,440Shares issued – 50,380 31,284 4,421 46 13 92,029 25,928Shares redeemed. . . . . . . . . . . – (127,989) (262,795) (22,773) – – (204,589) (31,935)At end of year . . . . . . . . . . . . . 2,500 116,639 455,769 43,850 1,518 422 238,338 77,433
E2 USD E4m HEUR E4m USD G1m USD G2 HGBP G2 USD I2 HEUR I2 USDShares Shares Shares Shares Shares Shares Shares Shares
At beginning of the year . . . . . . . 12,933 92,416 3,363 10,057 1,000 289,394 470,435 368,729Shares issued 3,198 8,233 11 – – 21,947 269,615 11,310Shares redeemed. . . . . . . . . . . (2,419) (52,884) – – – (94,280) (555,062) (155,510)At end of year . . . . . . . . . . . . . 13,712 47,765 3,374 10,057 1,000 217,061 184,988 224,529
S2 USDShares
At beginning of the year . . . . . . . 2,194,498Shares issued –Shares redeemed. . . . . . . . . . . –At end of year . . . . . . . . . . . . . 2,194,498
DocuSign Envelope ID: 521655BF-9BE3-47DC-A9A3-494932954338

Janus Henderson Capital Funds plc / 31 December 2021248
Janus Henderson Absolute Return Income Opportunities Fund (continued)
The accompanying notes are an integral part of the financial statements.
Net Asset Comparison
31 December 2021 31 December 2020 31 December 2019
Net Assets (USD)
NAV Per Share
(Local Currency)Net Assets
(USD)
NAV Per Share
(Local Currency)Net Assets
(USD)
NAV Per Share
(Local Currency)
A2 HCHF 24,449 8.91 25,584 9.06 23,229 8.99A2 HEUR 851,430 9.15 1,323,622 9.29 2,001,857 9.19A2 USD 3,679,751 10.44 4,785,335 10.50 7,028,652 10.23A4m HEUR 362,508 7.46 417,782 7.80 554,770 7.95A4m HSGD 9,743 8.40 9,990 8.70 9,602 8.77A4m SGD 3,076 9.54 3,094 9.69 3,012 9.89A4m USD 1,453,253 8.42 2,085,292 8.75 3,082,597 8.78E2 HEUR 444,827 8.95 872,787 9.23 859,481 9.18E2 USD 135,334 10.20 141,560 10.32 130,905 10.12E4m HEUR 252,090 7.27 447,061 7.66 814,652 7.86E4m USD 15,023 8.67 30,503 9.04 30,718 9.13G1m USD 93,384 9.29 95,064 9.45 94,390 9.39G2 HGBP 7,360 10.46 14,336 10.48 13,552 10.23G2 USD – – 2,426,925 11.18 3,136,042 10.84I2 HEUR 1,092,020 9.70 2,217,345 9.81 5,103,931 9.67I2 USD 2,437,366 11.07 2,490,867 11.09 3,970,171 10.77S2 USD 24,322,109 10.90 23,941,481 10.91 23,202,821 10.57
. . .
Total Expense Ratio (unaudited)
The Average Total Expense Ratio table shows the actual expenses, excluding transactions costs and trade commissions, incurred by each Class for the Fund during the reporting financial year expressed as a percentage of the average net assets for the corresponding year, on an annualised basis.
31 December 2021 31 December 2020 31 December 2019A2 HCHF 1.05% 1.05% 1.54%A2 HEUR 1.05% 1.05% 1.61%A2 USD 1.05% 1.05% 1.72%A4m HEUR 1.04% 1.05% 1.60%A4m HSGD 1.05% 1.05% 1.54%A4m SGD 1.05% 1.04% 0.97%A4m USD 1.05% 1.05% 1.62%E2 HEUR 1.69% 1.70% 1.98%E2 USD 1.69% 1.70% 1.93%E4m HEUR 1.68% 1.70% 1.93%E4m USD 1.69% 1.70% 1.91%G1m USD 0.54% 0.55% 0.70%G2 HGBP 0.55% 0.55% 0.64%G2 USD 0.55% 0.55% 0.60%I2 HEUR 0.70% 0.70% 0.81%I2 USD 0.70% 0.70% 0.89%S2 USD 0.54% 0.55% 0.59%
DocuSign Envelope ID: 521655BF-9BE3-47DC-A9A3-494932954338

249Janus Henderson Capital Funds plc / 31 December 2021
Janus Henderson Absolute Return Income Opportunities Fund (continued)
The accompanying notes are an integral part of the financial statements.
Distributions per share (unaudited)
The following table shows the distribution rate per share at Ex-date for each distributing share class :
Share Class (Local Currency) 15/01/2021 12/02/2021 15/03/2021 15/04/2021 14/05/2021 15/06/2021 15/07/2021 13/08/2021 15/09/2021 15/10/2021 15/11/2021 15/12/2021A4m HEUR 0.01985 0.01791 0.01840 0.02091 0.01832 0.02021 0.01885 0.01816 0.02062 0.01864 0.01790 0.01965A4m HSGD 0.02215 0.02000 0.02055 0.02339 0.02050 0.02263 0.02113 0.02037 0.02315 0.02094 0.02012 0.02211A4m SGD 0.02472 0.02233 0.02329 0.02633 0.02304 0.02530 0.02409 0.02331 0.02621 0.02379 0.02291 0.02552A4m USD 0.02228 0.02011 0.02067 0.02352 0.02062 0.02275 0.02124 0.02048 0.02327 0.02104 0.02022 0.02222E4m HEUR 0.01950 0.01758 0.01805 0.02050 0.01795 0.01979 0.01845 0.01777 0.02016 0.01821 0.01748 0.01918E4m USD 0.02302 0.02077 0.02134 0.02426 0.02126 0.02345 0.02187 0.02108 0.02394 0.02164 0.02078 0.02282G1m USD 0.01217 0.01088 0.01276 0.01440 0.01322 0.01459 0.01278 0.01404 0.01388 0.01394 0.01374 0.01444
– – – – – – – – – – – –
Fund Performance (unaudited)
As at 31 December 2021
One year Three years Five yearsSince
inception
Performance (Annualised) 31/12/2020 31/12/2021
%
31/12/2017 31/12/2021
%
31/12/2015 31/12/2021
%
to 31/12/2021
%
G1m USD (Net)* (0.10) 1.65** 0.62** 0.60**FTSE 3-Month US Treasury Bill 0.05 0.96 1.11 0.81
Five years 31/12/2015 31/12/2021
%G1m USD (Gross)* 2.19FTSE 3-Month US Treasury Bill + 3.00% 4.15
.
Discrete performance
31/12/2020 31/12/2021
%
31/12/2019 31/12/2020
%
31/12/2018 31/12/2019
%
31/12/2017 31/12/2018
%
31/12/2016 31/12/2017
%
G1m USD (Net)* (0.10) 2.64** 2.92** (3.68)** 1.98**FTSE 3-Month US Treasury Bill 0.05 0.58 2.25 1.86 0.84
G1m USD (Gross)* 0.45 4.41** 4.69** (1.70)** 3.97**FTSE 3-Month US Treasury Bill + 3.00% 3.05 3.60 5.32 4.93 3.86
. . . . .
Class G1m USD is disclosed as it is the representative share class.
* The representative share class has changed from the A2 USD to the G1m USD share class with effect from August 2021.
** Historical figures are based on the A2 USD share class
Performance target: To outperform the FTSE 3-Month US Treasury Bill Index by at least 3% per annum, before the deduction of charges, over any 5 year period.
Please note the Gross Returns 5 year annualised table is only applicable for share classes which have been active for 5 or more years and the performance target is to be achieved over a specific annualised time period. Performance target and index shown in USD.
Past performance does not guarantee future returns. The rates of return will vary and the principal value of an investment will fluctuate. Shares, if redeemed, may be worth more or less than their original cost. The performance data does not take account of the commissions and costs incurred on the issue and redemption of Shares. All returns are calculated in the base currency of the representative Share Class.
There is no guarantee that the Fund’s performance will match or exceed the benchmark.
DocuSign Envelope ID: 521655BF-9BE3-47DC-A9A3-494932954338

Janus Henderson Capital Funds plc / 31 December 2021250
Janus Henderson Absolute Return Income Opportunities Fund (continued)
Statements of Changes in Composition of Portfolio (unaudited)The tables below show a breakdown of material purchases and sales of the Investment Portfolio in accordance with Central Bank UCITS Regulations 79(2) requirements. All purchases and sales of investments exceeding 1% of the total value of each transaction respectively, are disclosed, with a minimum number of 20 of each such transaction. A full analysis of the movement on the Investment Portfolio is available upon request from the registered office.
Major Purchases for the year ended 31 December 2021
Shares or Principal Amount
Cost (USD)
Jabil, Inc., 0.0000%, due 18/8/21 1,500,000 1,499,982Conagra Brands, Inc., 0.0000%, due 7/9/21 1,500,000 1,499,972Energy Transfer LP, 0.0000%, due 27/4/21 1,400,000 1,399,984Plains Midstream Canada ULC, 0.0000%, due 11/2/21 1,400,000 1,399,981Energy Transfer LP, 0.0000%, due 14/12/21 1,250,000 1,249,988Energy Transfer LP, 0.0000%, due 23/11/21 1,250,000 1,249,988Aviation Capital Group LLC, 0.0000%, due 13/9/21 1,250,000 1,249,979Enable Midstream Corp., 0.0000%, due 19/2/21 1,200,000 1,199,985Energy Transfer LP, 0.0000%, due 17/2/21 1,200,000 1,199,983Energy Transfer LP, 0.0000%, due 18/2/21 1,200,000 1,199,983Energy Transfer LP, 0.0000%, due 26/2/21 1,200,000 1,199,983Plains All American Corp., 0.0000%, due 2/3/21 1,200,000 1,199,983Plains All American Corp., 0.0000%, due 23/2/21 1,200,000 1,199,983Plains All American Corp., 0.0000%, due 25/2/21 1,200,000 1,199,983Plains Midstream Corp., 0.0000%, due 26/2/21 1,200,000 1,199,983Plains All American Corp., 0.0000%, due 24/2/21 1,200,000 1,199,982Jabil, Inc., 0.0000%, due 4/3/21 1,200,000 1,199,981Jabil, Inc., 0.0000%, due 26/1/21 1,200,000 1,199,980Jabil, Inc., 0.0000%, due 27/1/21 1,200,000 1,199,980Jabil, Inc., 0.0000%, due 28/1/21 1,200,000 1,199,980
Major Sales for the year ended 31 December 2021
Shares or Principal Amount
Proceeds (USD)
Westpac Banking Corp., 4.5000%, due 11/3/27 1,648,000 1,323,487Lloyds Banking Group plc, 3.9000%, due 23/11/23 1,550,000 1,240,511CNOOC Curtis Funding No. 1 Pty. Ltd., 4.5000%, due 3/10/23 1,100,000 1,180,685Hyundai Capital America, 1.1374%, due 8/7/21 1,055,000 1,055,485Macquarie Group Ltd., 3.1890%, due 28/11/23 800,000 826,504Liberty Financial Pty. Ltd., 3.2888%, due 7/3/22 1,000,000 782,634Volkswagen Financial Services Australia Pty. Ltd., 3.1000%, due 17/4/23 970,000 734,158ICBCIL Finance Co. Ltd., 3.6500%, due 5/3/22 700,000 713,468Commonwealth Bank of Australia, 3.3750%, due 20/10/26 700,000 703,178Country Garden Holdings Co. Ltd., 8.0000%, due 27/1/24 700,000 681,500Volkswagen Financial Services Australia Pty. Ltd., 3.3000%, due 28/2/22 800,000 618,168Sydney Airport Finance Co. Pty. Ltd., 3.6250%, due 28/4/26 500,000 540,518National Australia Bank Ltd., 2.1900%, due 17/5/29 580,000 440,847Boeing Co. (The), 1.4300%, due 4/2/24 425,000 425,866American Tower Corp., 3.3750%, due 15/5/24 400,000 425,802Crown Castle International Corp., 3.1500%, due 15/7/23 400,000 419,056Amazon.com, Inc., 0.8000%, due 3/6/25 400,000 400,424Bendigo & Adelaide Bank Ltd., 2.5000%, due 30/11/28 500,000 375,365ETSA Utilities Finance Pty. Ltd., 1.0650%, due 29/8/22 500,000 372,881Bank of China Ltd., 0.8809%, due 20/11/21 350,000 350,347Novelis Corp., 3.2500%, due 15/11/26 305,000 307,669HSBC Holdings plc, 2.2060%, due 17/8/29 300,000 299,943Standard Chartered plc, 0.9910%, due 12/1/25 250,000 247,248Bank of Queensland Ltd., 1.8690%, due 1/5/28 300,000 231,413Florida Power & Light Co., 0.5640%, due 28/7/23 205,000 205,051Hewlett Packard Enterprise Co., 1.4500%, due 1/4/24 175,000 175,599
DocuSign Envelope ID: 521655BF-9BE3-47DC-A9A3-494932954338

Janus Henderson Flexible Income Fund
251Janus Henderson Capital Funds plc / 31 December 2021
Fund Overview (unaudited)Investment Objective and Policy
The Fund aims to provide a return, from a combination of income and capital growth, while seeking to limit losses to capital (although not guaranteed) over the long term.
Performance target: To outperform the Bloomberg Barclays US Aggregate Bond Index by 1.25% per annum, before the deduction of charges, over any 5 year period.
The Fund invests at least 67% (but typically more than 80%) of its assets in US bonds of any quality, including high yield (non-investment grade) bonds and asset-backed and mortgage-backed securities, issued by governments, companies or any other type of issuer.
The Fund is actively managed with reference to the Bloomberg Barclays US Aggregate Bond Index, which is broadly representative of the bonds in which it may invest, as this forms the basis of the Fund’s performance target. The investment manager has discretion to choose investments for the Fund with weightings different to the index or not in the index, but at times the Fund may hold investments similar to the index.
How Sustainability Risks are part of the investment processThe investments underlying this financial product (referred to as the Fund) do not take into account the EU criteria for environmentally sustainable economic activities, although the Manager and the Investment Manager have agreed a decision making process that will apply to investment decisions relating to the Fund as further detailed in the Prospectus.
The likely impacts of sustainability risks on the returns of the FundWhile the analysis of (Environmental, Social and Governance) ESG factors is an integral component across the Investment Manager’s investment capabilities and one of a number of inputs to the selection of investments and portfolio construction, the investment process of the Investment Manager is primarily designed to maximise long-term risk-adjusted returns for investors. Therefore, in managing the Fund, the Investment Manager does not maximise portfolio alignment with sustainability risks as a separate goal in its own right nor does it precisely attribute the impact of ESG factors on returns for the Fund.
Fund Overview
Greg Wilensky and Michael Keough, portfolio managers
For the year ended 31 December 2021, the Janus Henderson Flexible Income Fund H1m US dollar terms returned -1.19% (Net) and -0.55% (Gross) compared with -1.54% and -0.31% Target (Gross) for the Bloomberg US Aggregate Bond Index.
Although we consistently trimmed the Fund’s allocation to corporate bonds during the year, our overall favorable view on the US economy led us to maintain the overweight exposure to corporate bonds (including high yield) and securitized credit such as asset-backed securities (ABS) and commercial mortgage-backed securities (CMBS). We maintained underweight exposures to US Treasuries and mortgage-backed securities (MBS).
Our decision to reduce corporate credit exposure was primarily due to credit spreads narrowing as the year progressed. Corporate bond sales were focused on the investment-grade market given our view that the relatively tight level of spreads diminished their attractiveness on a risk-adjusted basis compared to high yield. Within high yield, we adjusted positions, emphasizing names believed to have the potential to be ‘rising stars’ – securities that could see sufficient rating improvement to push them into the investment-grade market. We added floating rate products such as bank loans. We also added ABS and CMBS exposure, focusing on relative-value opportunities identified through individual security analysis. Lastly, we were active in the Treasury Inflation-Protected Securities (TIPS) market, adding early on the expectation that inflation expectations would increase and adjusting the allocation throughout the year as expectations shifted.
Our asset allocation decisions benefited relative performance versus the Bloomberg US Aggregate Bond Index. The Fund’s out-of-index allocation to high-yield corporate bonds performed well as the economic outlook continued to improve and investors’ demand for yield remained intact. Out-of-index exposure to TIPS was also a strong contributor as we adjusted positioning with the ebb and flow of inflation expectations. An underweight exposure to MBS and strong security selection further benefited relative performance. The Fund’s positioning relative to the US Treasury yield curve and a lack of exposure to government-related securities detracted.
While navigating central bank tightening is never straightforward, we think bonds will continue to offer opportunities to add value in the coming quarters while maintaining their traditional role as a diversifier in volatile times. In fact, 2022 may play to the active manager’s strengths. In our opinion, opportunities to add incremental returns are likely to come from relative-value opportunities, nuanced sector allocation, shorter-term dislocations and individual security selection.
Thank you for investing in Janus Henderson Flexible Income Fund.
January 2022
DocuSign Envelope ID: 521655BF-9BE3-47DC-A9A3-494932954338

Janus Henderson Capital Funds plc / 31 December 2021252
The accompanying notes are an integral part of the financial statements.
Janus Henderson Flexible Income Fund (continued)
s
Statement of Financial PositionAs of
31 December 2021
(USD)
As of 31 December
2020 (USD)
Assets:Financial assets at fair value through profit or loss . . . . . . . . . . . . . . . . . . . . . . . . . . . . . . . . . . . . . . . . . . . . . . . . . . . . . . . 811,837,268 949,318,721Cash and foreign currency . . . . . . . . . . . . . . . . . . . . . . . . . . . . . . . . . . . . . . . . . . . . . . . . . . . . . . . . . . . . . . . . . . . . . . . 49,052,699 54,507,881Margin cash . . . . . . . . . . . . . . . . . . . . . . . . . . . . . . . . . . . . . . . . . . . . . . . . . . . . . . . . . . . . . . . . . . . . . . . . . . . . . . . . . – 51,017Collateral cash . . . . . . . . . . . . . . . . . . . . . . . . . . . . . . . . . . . . . . . . . . . . . . . . . . . . . . . . . . . . . . . . . . . . . . . . . . . . . . . 20,000 72,757Receivables:
Investments sold . . . . . . . . . . . . . . . . . . . . . . . . . . . . . . . . . . . . . . . . . . . . . . . . . . . . . . . . . . . . . . . . . . . . . . . . . . . . 35,866,865 –Spot foreign exchange contracts awaiting settlement . . . . . . . . . . . . . . . . . . . . . . . . . . . . . . . . . . . . . . . . . . . . . . . . . . . . 426 1,752Funds shares sold . . . . . . . . . . . . . . . . . . . . . . . . . . . . . . . . . . . . . . . . . . . . . . . . . . . . . . . . . . . . . . . . . . . . . . . . . . . 262,612 11,365,007Interest . . . . . . . . . . . . . . . . . . . . . . . . . . . . . . . . . . . . . . . . . . . . . . . . . . . . . . . . . . . . . . . . . . . . . . . . . . . . . . . . . . . 2,979,662 4,898,488
Receivable from Investment Manager . . . . . . . . . . . . . . . . . . . . . . . . . . . . . . . . . . . . . . . . . . . . . . . . . . . . . . . . . . . . . . . . 4,073 9,884
Total Assets . . . . . . . . . . . . . . . . . . . . . . . . . . . . . . . . . . . . . . . . . . . . . . . . . . . . . . . . . . . . . . . . . . . . . . . . . 900,023,605 1,020,225,507 Liabilities (amounts falling due within one year)Payables:
Financial liabilities at fair value through profit or loss . . . . . . . . . . . . . . . . . . . . . . . . . . . . . . . . . . . . . . . . . . . . . . . . . . . . 15,127 94,746Bank overdraft and foreign currency . . . . . . . . . . . . . . . . . . . . . . . . . . . . . . . . . . . . . . . . . . . . . . . . . . . . . . . . . . . . . . . 153,708 –Margin cash . . . . . . . . . . . . . . . . . . . . . . . . . . . . . . . . . . . . . . . . . . . . . . . . . . . . . . . . . . . . . . . . . . . . . . . . . . . . . . . 6,395 573Investments purchased . . . . . . . . . . . . . . . . . . . . . . . . . . . . . . . . . . . . . . . . . . . . . . . . . . . . . . . . . . . . . . . . . . . . . . . . 137,637,954 55,106,114Fund shares repurchased . . . . . . . . . . . . . . . . . . . . . . . . . . . . . . . . . . . . . . . . . . . . . . . . . . . . . . . . . . . . . . . . . . . . . . 3,857,960 1,079,238Investment Management fees . . . . . . . . . . . . . . . . . . . . . . . . . . . . . . . . . . . . . . . . . . . . . . . . . . . . . . . . . . . . . . . . . . . 378,835 501,434Shareholder Service fees . . . . . . . . . . . . . . . . . . . . . . . . . . . . . . . . . . . . . . . . . . . . . . . . . . . . . . . . . . . . . . . . . . . . . . 82,208 157,728Distribution fees . . . . . . . . . . . . . . . . . . . . . . . . . . . . . . . . . . . . . . . . . . . . . . . . . . . . . . . . . . . . . . . . . . . . . . . . . . . . . 1,054 1,127Accounting, Administration and Transfer Agent fees . . . . . . . . . . . . . . . . . . . . . . . . . . . . . . . . . . . . . . . . . . . . . . . . . . . . 114,887 109,555Management fees . . . . . . . . . . . . . . . . . . . . . . . . . . . . . . . . . . . . . . . . . . . . . . . . . . . . . . . . . . . . . . . . . . . . . . . . . . . 14,656 17,970Accrued expenses . . . . . . . . . . . . . . . . . . . . . . . . . . . . . . . . . . . . . . . . . . . . . . . . . . . . . . . . . . . . . . . . . . . . . . . . . . . 207,468 199,825
Total Liabilities (excluding Net Assets attributable to holders of redeemable ordinary shares) . . . . . . . . . . . . 142,470,252 57,268,310 Net Assets attributable to holders of redeemable ordinary participating shares . . . . . . . . . . . . . . . . . . . . . . 757,553,353 962,957,197
. 1/12/2020
DocuSign Envelope ID: 521655BF-9BE3-47DC-A9A3-494932954338

253Janus Henderson Capital Funds plc / 31 December 2021
Janus Henderson Flexible Income Fund (continued)
The accompanying notes are an integral part of the financial statements.
Statement of Comprehensive IncomeYear ended
31 December 2021
(USD)
Year ended 31 December
2020 (USD)
Year ended Year endedRevenue:Interest income . . . . . . . . . . . . . . . . . . . . . . . . . . . . . . . . . . . . . . . . . . . . . . . . . . . . . . . . . . . . . . . . . . . . . . . . . . . . . . . 20,763,582 21,893,949Dividend income . . . . . . . . . . . . . . . . . . . . . . . . . . . . . . . . . . . . . . . . . . . . . . . . . . . . . . . . . . . . . . . . . . . . . . . . . . . . . . 180,179 93,619Other income . . . . . . . . . . . . . . . . . . . . . . . . . . . . . . . . . . . . . . . . . . . . . . . . . . . . . . . . . . . . . . . . . . . . . . . . . . . . . . . . 10,213 20,278
Net (loss)/gain on financial assets and liabilities at fair value through profit or loss . . . . . . . . . . . . . . . . . . . . . . . . . . . . . . . . . . (29,758,401) 58,277,141 Total Investments (Loss)/Income . . . . . . . . . . . . . . . . . . . . . . . . . . . . . . . . . . . . . . . . . . . . . . . . . . . . . . . . . . (8,804,427) 80,284,987
Expenses:Investment Management fees . . . . . . . . . . . . . . . . . . . . . . . . . . . . . . . . . . . . . . . . . . . . . . . . . . . . . . . . . . . . . . . . . . . . . 5,207,039 4,464,370Shareholder Service fees . . . . . . . . . . . . . . . . . . . . . . . . . . . . . . . . . . . . . . . . . . . . . . . . . . . . . . . . . . . . . . . . . . . . . . . . 1,340,009 1,207,218Distribution fees . . . . . . . . . . . . . . . . . . . . . . . . . . . . . . . . . . . . . . . . . . . . . . . . . . . . . . . . . . . . . . . . . . . . . . . . . . . . . . 12,840 8,375Management fees . . . . . . . . . . . . . . . . . . . . . . . . . . . . . . . . . . . . . . . . . . . . . . . . . . . . . . . . . . . . . . . . . . . . . . . . . . . . . 207,325 104,312Accounting, Administration and Transfer Agent fees . . . . . . . . . . . . . . . . . . . . . . . . . . . . . . . . . . . . . . . . . . . . . . . . . . . . . . 354,039 460,365Custodian fees . . . . . . . . . . . . . . . . . . . . . . . . . . . . . . . . . . . . . . . . . . . . . . . . . . . . . . . . . . . . . . . . . . . . . . . . . . . . . . . 122,784 128,705Audit fees . . . . . . . . . . . . . . . . . . . . . . . . . . . . . . . . . . . . . . . . . . . . . . . . . . . . . . . . . . . . . . . . . . . . . . . . . . . . . . . . . . 22,769 29,857Printing expenses . . . . . . . . . . . . . . . . . . . . . . . . . . . . . . . . . . . . . . . . . . . . . . . . . . . . . . . . . . . . . . . . . . . . . . . . . . . . . 20,153 (3,356)Legal and other professional fees . . . . . . . . . . . . . . . . . . . . . . . . . . . . . . . . . . . . . . . . . . . . . . . . . . . . . . . . . . . . . . . . . . 159,388 163,583Other fees . . . . . . . . . . . . . . . . . . . . . . . . . . . . . . . . . . . . . . . . . . . . . . . . . . . . . . . . . . . . . . . . . . . . . . . . . . . . . . . . . . 73,776 85,156
Total Expenses . . . . . . . . . . . . . . . . . . . . . . . . . . . . . . . . . . . . . . . . . . . . . . . . . . . . . . . . . . . . . . . . . . . . . . . 7,520,122 6,648,585Less Expense Reimbursement . . . . . . . . . . . . . . . . . . . . . . . . . . . . . . . . . . . . . . . . . . . . . . . . . . . . . . . . . . . (49,060) (95,957)Net Expenses after Expense Reimbursement . . . . . . . . . . . . . . . . . . . . . . . . . . . . . . . . . . . . . . . . . . . . . . . . 7,471,062 6,552,628Net Operating (Loss)/Profit . . . . . . . . . . . . . . . . . . . . . . . . . . . . . . . . . . . . . . . . . . . . . . . . . . . . . . . . . . . . . . (16,275,489) 73,732,359
Finance Costs: 11,654,265 12,693,985
Total distributions to holders of redeemable ordinary shares. . . . . . . . . . . . . . . . . . . . . . . . . . . . . . . . . . . . . . . . . . . . . . . . . (11,629,670) (12,665,265)Swap interest expense . . . . . . . . . . . . . . . . . . . . . . . . . . . . . . . . . . . . . . . . . . . . . . . . . . . . . . . . . . . . . . . . . . . . . . . . . . (24,596) (26,229)
Withholding tax on dividends and other investment income . . . . . . . . . . . . . . . . . . . . . . . . . . . . . . . . . . . . . (423,904) (250,994)
Net (Decrease)/Increase in Net Assets attributable to holders of redeemable ordinary shares resulting from operations . . . . . . . . . . . . . . . . . . . . . . . . . . . . . . . . . . . . . . . . . . . . . . . . . . . . . . . . . . . . . . . . . . . . . . . . . . . (28,353,659) 60,789,871
. .
. .. . .
Statement of Changes in Net Assets Attributable to Redeemable Ordinary ShareholdersYear ended
31 December 2021
(USD)
Year ended 31 December
2020 (USD)
(Decrease)/Increase in Net Assets attributable to holders of redeemable ordinary shares resulting from operations . . . . . . . . . . . . (28,353,659) 60,789,871
Capital Share Transactions of redeemable ordinary shares:Proceeds from redeemable ordinary shares sold . . . . . . . . . . . . . . . . . . . . . . . . . . . . . . . . . . . . . . . . . . . . . . . . . . . . . . . 114,683,078 474,208,579Redemption of redeemable ordinary shares . . . . . . . . . . . . . . . . . . . . . . . . . . . . . . . . . . . . . . . . . . . . . . . . . . . . . . . . . . (291,733,263) (235,689,323)Dilution Adjustment. . . . . . . . . . . . . . . . . . . . . . . . . . . . . . . . . . . . . . . . . . . . . . . . . . . . . . . . . . . . . . . . . . . . . . . . . . . – 102,100
Net (Decrease)/Increase from Capital Share Transactions of redeemable ordinary shares . . . . . . . . . . . . . . (177,050,185) 238,621,356
Net (Decrease)/Increase in Net Assets attributable to holders of redeemable ordinary shares . . . . . . . . . . . . . . . . . . . . . . . . . . . (205,403,844) 299,411,227Net Assets attributable to holders of redeemable ordinary shares at the beginning of the financial year . . . . . . . . . . . . . . . . . . . . 962,957,197 663,545,970
Net Assets attributable to holders of redeemable ordinary shares at the end of the financial year . . . . . . . . . 757,553,353 962,957,197
Gains and losses are solely from continuing operations except for the Funds which ceased operations during the financial year ended 31 December 2021 or 31 December 2020. There were no gains and losses other than those dealt with in the Statement of Comprehensive Income. Please refer to note 1 which details the Fund closures during the year.
DocuSign Envelope ID: 521655BF-9BE3-47DC-A9A3-494932954338

Janus Henderson Capital Funds plc / 31 December 2021254
Janus Henderson Flexible Income Fund (continued)
Portfolio Investments
The accompanying notes are an integral part of the financial statements.
Shares or Principal Amount
Percentage of Net Assets
(%)Fair Value
(USD)
Financial Assets at fair value through profit or lossAsset-Backed/Commercial Mortgage-Backed Securities (2020: 7.61% USD 73,260,164)
2,068,116 280 Park Avenue Mortgage Trust, 0.9898%, due 15/9/34 0.27 2,067,715
634,000 BAMLL Commercial Mortgage Securities Trust, 0.9600%, due 15/9/34 0.08 633,490
2,830,170 BANK, 4.2550%, due 15/5/61 0.42 3,197,8801,090,000 BANK, 4.2170%, due 15/8/61 0.16 1,230,839
548,000 BBCMS Mortgage Trust, 0.9597%, due 15/8/36 0.07 548,204
2,020,000 BBCMS Mortgage Trust, 4.3140%, due 15/12/51 0.30 2,297,043
1,712,000 BBCMS Trust, 4.1970%, due 10/8/35 0.25 1,894,1511,115,983 BX Commercial Mortgage Trust,
1.2310%, due 15/3/37 0.15 1,113,2811,820,000 BXP Trust, 3.3790%, due 13/6/39 0.26 1,941,5933,863,247 CHT Mortgage Trust, 1.0397%, due
15/11/36 0.51 3,864,4302,383,000 COMM Mortgage Trust, 4.2280%, due
10/5/51 0.35 2,679,436143,099 Connecticut Avenue Securities Trust,
2.5019%, due 25/4/31 0.02 143,631183,787 Connecticut Avenue Securities Trust,
2.4028%, due 25/8/31 0.02 184,490324,652 Connecticut Avenue Securities Trust,
2.2528%, due 25/9/31 0.04 325,711147,765 Connecticut Avenue Securities Trust,
2.1027%, due 25/7/39 0.02 147,77097,020 Connecticut Avenue Securities Trust,
2.2028%, due 25/10/39 0.01 97,2141,330,000 Connecticut Avenue Securities Trust,
1.5997%, due 25/10/41 0.18 1,332,043794,000 Connecticut Avenue Securities Trust,
1.7000%, due 25/12/41 0.11 795,807122,948 Connecticut Avenue Securities Trust,
2.2019%, due 25/6/39 0.02 122,951793,093 Connecticut Avenue Securities Trust,
2.1027%, due 25/1/40 0.11 794,699423,258 DB Master Finance LLC, 4.3520%, due
20/5/49 0.06 449,421298,138 DB Master Finance LLC, 4.0210%, due
20/5/49 0.04 308,6633,274,673 Domino's Pizza Master Issuer LLC,
3.6680%, due 25/10/49 0.46 3,451,459438,900 Domino's Pizza Master Issuer LLC,
4.1180%, due 25/7/47 0.06 460,1991,437,540 Domino's Pizza Master Issuer LLC,
4.1160%, due 25/7/48 0.19 1,469,345685,790 Domino's Pizza Master Issuer LLC,
4.3280%, due 25/7/48 0.10 720,6477,301 Drive Auto Receivables Trust, 3.5300%,
due 15/12/23 0.00 7,3072,849,799 GS Mortgage Securities Corp. II,
4.1550%, due 10/7/51 0.42 3,205,2382,842,876 GS Mortgage Securities Trust, 3.9920%,
due 10/3/51 0.42 3,151,0721,229,708 Jack in the Box Funding LLC, 4.9700%,
due 25/8/49 0.17 1,313,7381,224,745 Jack in the Box Funding LLC, 3.9820%,
due 25/8/49 0.16 1,229,4561,627,700 Jack in the Box Funding LLC, 4.4760%,
due 25/8/49 0.22 1,685,4983,775,000 Morgan Stanley Capital I Trust, 3.8090%,
due 15/12/48 0.53 4,050,352
Shares or Principal Amount
Percentage of Net Assets
(%)Fair Value
(USD)
3,041,000 Morgan Stanley Capital I Trust, 2.7820%,
due 15/8/49 0.42 3,152,057825,000 Morgan Stanley Capital I Trust, 4.4070%,
due 15/10/51 0.12 938,9632,784,627 Morgan Stanley Capital I Trust, 4.3100%,
due 15/12/51 0.42 3,163,1942,813,605 Morgan Stanley Capital I Trust, 4.1770%,
due 15/7/51 0.42 3,161,9731,776,679 Morgan Stanley Capital I Trust, 6.0143%,
due 11/6/42 0.23 1,776,679524,726 New Residential Mortgage Loan Trust,
4.5000%, due 25/2/58 0.07 560,4261,036,000 Newday Funding Master Issuer plc,
1.1495%, due 15/3/29 0.14 1,043,8381,123,828 NRZ Excess Spread-Collateralized
Notes, 3.1040%, due 25/7/26 0.15 1,121,6951,088,048 Oak Street Investment Grade Net Lease
Fund, 1.8500%, due 20/11/50 0.14 1,077,093414,000 OneMain Direct Auto Receivables Trust,
3.8500%, due 14/10/25 0.05 414,382446,000 OneMain Direct Auto Receivables Trust,
4.4000%, due 14/1/28 0.06 446,4701,143,660 Planet Fitness Master Issuer LLC,
3.8580%, due 5/12/49 0.15 1,172,879752,715 Planet Fitness Master Issuer LLC,
4.2620%, due 5/9/48 0.10 752,715182,537 Sequoia Mortgage Trust, 2.5000%, due
25/5/43 0.02 185,0621,814,500 Taco Bell Funding LLC, 4.9700%, due
25/5/46 0.25 1,893,7741,138,000 Taco Bell Funding LLC, 1.9460%, due
25/8/51 0.15 1,105,031675,120 Taco Bell Funding LLC, 4.9400%, due
25/11/48 0.10 735,7101,383,000 Taco Bell Funding LLC, 2.2940%, due
25/8/51 0.18 1,350,965640,320 Wendy's Funding LLC, 3.7830%, due
15/6/49 0.09 662,347681,575 Wendy's Funding LLC, 2.3700%, due
15/6/51 0.09 670,144653,760 Wendy's Funding LLC, 3.8840%, due
15/3/48 0.09 677,615792,020 Wendy's Funding LLC, 2.7750%, due
15/6/51 0.10 791,0491,252,000 WFRBS Commercial Mortgage Trust,
3.6310%, due 15/11/47 0.17 1,319,7571,254,695 Wingstop Funding LLC, 2.8410%, due
5/12/50 0.17 1,271,069959,595 Zaxby's Funding LLC, 3.2380%, due
30/7/51 0.13 970,272Total Asset-Backed/Commercial Mortgage-Backed Securities 10.19 77,329,932
Corporate Bonds (2020: 51.59% USD 496,839,241)AustraliaBanks
2,018,000 Westpac Banking Corp., 2.6680%, due 15/11/35 0.26 1,968,171
BermudaProfessional Services
2,567,000 IHS Markit Ltd., 4.7500%, due 15/2/25 0.37 2,801,547
CanadaHotels, Restaurants & Leisure
3,941,000 1011778 BC ULC, 4.0000%, due 15/10/30 0.51 3,880,230
DocuSign Envelope ID: 521655BF-9BE3-47DC-A9A3-494932954338

255Janus Henderson Capital Funds plc / 31 December 2021
The accompanying notes are an integral part of the financial statements.
Janus Henderson Flexible Income Fund (continued)
Portfolio Investments
Shares or Principal Amount
Percentage of Net Assets
(%)Fair Value
(USD)
Cayman IslandsTechnology Hardware, Storage & Peripherals
1,649,000 Seagate HDD Cayman, 4.1250%, due 15/1/31 0.23 1,717,986
FranceBanks
2,741,000 BNP Paribas SA, 2.5880%, due 12/8/35 0.35 2,628,993
922,000 Credit Agricole SA, 4.3750%, due 17/3/25 0.13 991,597
0.48 3,620,590
GuernseyDiversified Financial Services
2,100,000 Pershing Square Holdings Ltd., 3.2500%, due 1/10/31 0.28 2,106,376
IrelandConsumer Finance
1,875,000 AerCap Ireland Capital DAC, 4.6250%, due 15/10/27 0.27 2,075,723
1,042,000 AerCap Ireland Capital DAC, 3.0000%, due 29/10/28 0.14 1,057,545
1,068,000 AerCap Ireland Capital DAC, 3.3000%, due 30/1/32 0.14 1,088,944
783,000 AerCap Ireland Capital DAC, 3.4000%, due 29/10/33 0.11 798,160
595,000 AerCap Ireland Capital DAC, 3.8500%, due 29/10/41 0.08 620,866
0.74 5,641,238
LuxembourgFood Products
1,239,000 JBS Finance Luxembourg SARL, 3.6250%, due 15/1/32 0.16 1,245,802
NetherlandsPharmaceuticals
558,000 Teva Pharmaceutical Finance Netherlands III BV, 4.7500%, due 9/5/27 0.07 553,603
713,000 Teva Pharmaceutical Finance Netherlands III BV, 5.1250%, due 9/5/29 0.09 700,202
0.16 1,253,805
South KoreaSemiconductors & Semiconductor Equipment
1,733,000 SK Hynix, Inc., 1.5000%, due 19/1/26 0.22 1,697,0311,127,000 SK Hynix, Inc., 2.3750%, due 19/1/31 0.14 1,085,952
0.36 2,782,983
SpainBiotechnology
3,008,000 Grifols Escrow Issuer SA, 4.7500%, due 15/10/28 0.41 3,073,785
SupranationalFood Products
962,000 JBS USA LUX SA, 6.7500%, due 15/2/28 0.14 1,039,383
2,450,000 JBS USA LUX SA, 6.5000%, due 15/4/29 0.36 2,699,140
2,013,000 JBS USA LUX SA, 5.5000%, due 15/1/30 0.29 2,192,519
1,172,000 JBS USA LUX SA, 3.7500%, due 1/12/31 0.16 1,191,262
0.95 7,122,304
Shares or Principal Amount
Percentage of Net Assets
(%)Fair Value
(USD)
United KingdomPharmaceuticals
1,438,000 Royalty Pharma plc, 2.1500%, due 2/9/31 0.18 1,359,937
1,447,000 Royalty Pharma plc, 3.5500%, due 2/9/50 0.19 1,438,053
715,000 Royalty Pharma plc, 3.3500%, due 2/9/51 0.09 685,596
0.46 3,483,586
United StatesAerospace & Defense
1,487,000 Boeing Co. (The), 4.8750%, due 1/5/25 0.22 1,628,147730,000 Boeing Co. (The), 2.1960%, due 4/2/26 0.10 730,420811,000 Boeing Co. (The), 3.6250%, due 1/2/31 0.11 865,837
1,022,000 Boeing Co. (The), 3.9500%, due 1/8/59 0.14 1,064,8440.57 4,289,248
Air Freight & Logistics1,389,000 GXO Logistics, Inc., 1.6500%, due
15/7/26 0.18 1,356,768
Automobiles2,098,000 Ford Motor Co., 3.2500%, due 12/2/32 0.28 2,152,548
Banks736,000 Bank of America Corp., 5.2000%, due
1/6/23 0.10 760,3801,903,000 Bank of America Corp., 6.2500%, due
5/9/24 0.27 2,049,2931,591,000 Bank of America Corp., 3.5590%, due
23/4/27 0.22 1,702,2891,571,000 Bank of America Corp., 3.7050%, due
24/4/28 0.23 1,706,1421,515,000 Citigroup, Inc., 5.9500%, due 30/1/23 0.21 1,564,237
897,000 Citigroup, Inc., 5.3500%, due 15/5/23 0.12 916,061204,000 Citigroup, Inc., 6.3000%, due 15/5/24 0.03 214,328916,000 Citigroup, Inc., 5.9500%, due 15/5/25 0.13 982,410736,000 JPMorgan Chase & Co., 5.0000%, due
1/8/24 0.10 756,700777,000 JPMorgan Chase & Co., 4.6000%, due
1/2/25 0.11 798,367846,000 JPMorgan Chase & Co., 2.0830%, due
22/4/26 0.11 859,3072,342,000 JPMorgan Chase & Co., 3.9600%, due
29/1/27 0.33 2,531,8322,036,000 JPMorgan Chase & Co., 2.9560%, due
13/5/31 0.28 2,110,2513,301,000 SVB Financial Group, 4.2500%, due
15/11/26 0.44 3,353,4032,352,000 SVB Financial Group, 4.1000%, due
15/2/31 0.31 2,337,8882,070,000 US Bancorp, 2.4910%, due 3/11/36 0.27 2,064,311
3.26 24,707,199
Beverages1,983,000 Anheuser-Busch Cos. LLC, 4.9000%,
due 1/2/46 0.33 2,512,156
Building Products436,000 Standard Industries, Inc., 4.3750%, due
15/7/30 0.06 445,714
Capital Markets1,480,000 Ares Capital Corp., 3.2000%, due
15/11/31 0.19 1,456,7273,817,000 Charles Schwab Corp. (The), 5.3750%,
due 1/6/25 0.55 4,170,072
DocuSign Envelope ID: 521655BF-9BE3-47DC-A9A3-494932954338

Janus Henderson Capital Funds plc / 31 December 2021256
The accompanying notes are an integral part of the financial statements.
Janus Henderson Flexible Income Fund (continued)
Portfolio Investments
Shares or Principal Amount
Percentage of Net Assets
(%)Fair Value
(USD)
613,000 Goldman Sachs Group, Inc. (The),
4.9500%, due 10/2/25 0.08 637,5202,490,000 Morgan Stanley, 2.1880%, due 28/4/26 0.34 2,540,7612,116,000 Morgan Stanley, 3.9500%, due 23/4/27 0.31 2,331,2591,083,000 Morgan Stanley, 1.5930%, due 4/5/27 0.14 1,072,8953,271,000 Morgan Stanley, 2.4840%, due 16/9/36 0.42 3,153,263
2.03 15,362,497
Chemicals115,000 CF Industries, Inc., 5.1500%, due
15/3/34 0.02 139,2771,143,000 CF Industries, Inc., 4.9500%, due
1/6/43 0.18 1,381,392829,000 CF Industries, Inc., 5.3750%, due
15/3/44 0.14 1,046,6210.34 2,567,290
Commercial Services & Supplies1,980,000 Aramark Services, Inc., 6.3750%, due
1/5/25 0.27 2,071,624
Diversified Telecommunication Services2,417,000 CCO Holdings LLC, 4.2500%, due
1/2/31 0.32 2,443,164790,000 Lumen Technologies, Inc., 5.8000%,
due 15/3/22 0.11 796,9240.43 3,240,088
Electric Utilities1,572,000 Duquesne Light Holdings, Inc.,
2.7750%, due 7/1/32 0.21 1,555,6351,951,000 IPALCO Enterprises, Inc., 4.2500%,
due 1/5/30 0.28 2,145,8032,055,000 NextEra Energy Capital Holdings, Inc.,
1.8750%, due 15/1/27 0.27 2,068,442611,000 NextEra Energy Capital Holdings, Inc.,
2.4400%, due 15/1/32 0.08 612,895366,000 NRG Energy, Inc., 6.6250%, due
15/1/27 0.05 380,9330.89 6,763,708
Electronic Equipment, Instruments & Components2,283,000 Trimble, Inc., 4.7500%, due 1/12/24 0.33 2,476,6461,125,000 Trimble, Inc., 4.9000%, due 15/6/28 0.17 1,280,566
0.50 3,757,212
Entertainment4,210,000 Netflix, Inc., 3.6250%, due 15/6/25 0.59 4,440,940
Equity Real Estate Investment Trusts (REITs)1,628,000 Agree LP, 2.9000%, due 1/10/30 0.22 1,656,511
832,000 American Homes 4 Rent LP, 2.3750%, due 15/7/31 0.11 816,861
1,625,000 Broadstone Net Lease LLC, 2.6000%, due 15/9/31 0.21 1,579,125
1,292,000 CTR Partnership LP, 3.8750%, due 30/6/28 0.17 1,319,694
664,000 GLP Capital LP, 5.2500%, due 1/6/25 0.10 728,0611,249,000 GLP Capital LP, 5.3750%, due 15/4/26 0.18 1,392,473
135,000 GLP Capital LP, 5.3000%, due 15/1/29 0.02 153,4421,485,000 GLP Capital LP, 3.2500%, due 15/1/32 0.20 1,495,4171,716,000 Invitation Homes Operating Partnership
LP, 2.0000%, due 15/8/31 0.21 1,617,8002,595,000 Iron Mountain Information Management
Services, Inc., 5.0000%, due 15/7/32 0.35 2,661,0042,003,000 MPT Operating Partnership LP,
3.5000%, due 15/3/31 0.27 2,028,6181,973,000 Rexford Industrial Realty LP, 2.1250%,
due 1/12/30 0.25 1,876,460
Shares or Principal Amount
Percentage of Net Assets
(%)Fair Value
(USD)
2,014,000 Sun Communities Operating LP,
2.7000%, due 15/7/31 0.26 1,999,8212.55 19,325,287
Food Products1,553,000 Kraft Heinz Foods Co., 3.8750%, due
15/5/27 0.22 1,679,2971,070,000 Kraft Heinz Foods Co., 5.0000%, due
4/6/42 0.18 1,333,931308,000 Kraft Heinz Foods Co., 4.3750%, due
1/6/46 0.05 361,453720,000 Kraft Heinz Foods Co., 4.8750%, due
1/10/49 0.12 906,1871,787,000 Pilgrim's Pride Corp., 3.5000%, due
1/3/32 0.24 1,807,8360.81 6,088,704
Health Care Providers & Services2,186,000 Centene Corp., 4.2500%, due 15/12/27 0.30 2,282,6871,559,000 Centene Corp., 2.4500%, due 15/7/28 0.20 1,538,0164,099,000 Centene Corp., 3.0000%, due 15/10/30 0.55 4,173,766
551,000 Centene Corp., 2.5000%, due 1/3/31 0.07 537,324481,000 Centene Corp., 2.6250%, due 1/8/31 0.06 472,181
1,573,000 DaVita, Inc., 4.6250%, due 1/6/30 0.21 1,613,206861,000 HCA, Inc., 5.3750%, due 1/2/25 0.13 947,358
1,248,000 HCA, Inc., 3.5000%, due 1/9/30 0.17 1,321,476568,000 HCA, Inc., 5.2500%, due 15/6/49 0.10 730,869
1,732,000 HCA, Inc., 3.5000%, due 15/7/51 0.23 1,769,8742.02 15,386,757
Hotels, Restaurants & Leisure291,000 MGM Resorts International, 7.7500%,
due 15/3/22 0.04 295,006
Industrial Conglomerates2,598,000 General Electric Co., 3.5327%, due
15/3/22 0.34 2,585,010
Insurance2,879,000 Athene Global Funding, 1.7300%, due
2/10/26 0.37 2,827,3922,714,000 Athene Global Funding, 2.6460%, due
4/10/31 0.35 2,683,8540.72 5,511,246
IT Services1,725,000 Broadridge Financial Solutions, Inc.,
2.6000%, due 1/5/31 0.23 1,733,2973,448,000 Global Payments, Inc., 4.8000%, due
1/4/26 0.51 3,831,6010.74 5,564,898
Leisure Products2,303,000 Hasbro, Inc., 3.9000%, due 19/11/29 0.34 2,541,782
303,000 Hasbro, Inc., 6.3500%, due 15/3/40 0.06 419,576244,000 Hasbro, Inc., 5.1000%, due 15/5/44 0.04 304,395
0.44 3,265,753
Machinery1,102,000 Westinghouse Air Brake Technologies
Corp., 4.9500%, due 15/9/28 0.17 1,253,730
Media834,000 Charter Communications Operating
LLC, 4.8000%, due 1/3/50 0.12 936,0651,921,000 CSC Holdings LLC, 4.1250%, due
1/12/30 0.25 1,878,488414,000 CSC Holdings LLC, 4.6250%, due
1/12/30 0.05 392,447
DocuSign Envelope ID: 521655BF-9BE3-47DC-A9A3-494932954338

257Janus Henderson Capital Funds plc / 31 December 2021
The accompanying notes are an integral part of the financial statements.
Janus Henderson Flexible Income Fund (continued)
Portfolio Investments
Shares or Principal Amount
Percentage of Net Assets
(%)Fair Value
(USD)
1,562,000 CSC Holdings LLC, 3.3750%, due
15/2/31 0.19 1,464,953928,000 CSC Holdings LLC, 5.0000%, due
15/11/31 0.12 895,7063,616,000 GCI LLC, 4.7500%, due 15/10/28 0.49 3,716,145
1.22 9,283,804
Multi-Utilities1,812,000 CMS Energy Corp., 4.7500%, due
1/6/50 0.26 1,975,080956,000 Dominion Energy, Inc., 4.3500%, due
15/1/27 0.13 989,4600.39 2,964,540
Oil, Gas & Consumable Fuels1,303,000 Cheniere Energy Partners LP, 4.0000%,
due 1/3/31 0.18 1,368,6521,406,000 Cheniere Energy Partners LP, 3.2500%,
due 31/1/32 0.19 1,422,8721,981,000 Continental Resources, Inc., 5.7500%,
due 15/1/31 0.31 2,336,193150,000 Energy Transfer LP, 4.9500%, due
15/6/28 0.02 168,8803,009,000 EQT Corp., 3.1250%, due 15/5/26 0.41 3,092,5452,958,000 Hess Midstream Operations LP,
5.1250%, due 15/6/28 0.41 3,084,336263,000 Hess Midstream Operations LP,
4.2500%, due 15/2/30 0.03 261,4761,160,000 Southwestern Energy Co., 4.7500%,
due 1/2/32 0.16 1,223,8461.71 12,958,800
Pharmaceuticals1,709,000 Elanco Animal Health, Inc., 5.2720%,
due 28/8/23 0.24 1,820,170
Semiconductors & Semiconductor Equipment1,418,000 Broadcom, Inc., 4.3000%, due 15/11/32 0.21 1,595,6221,708,000 Broadcom, Inc., 3.4190%, due 15/4/33 0.24 1,792,4202,567,000 Broadcom, Inc., 3.4690%, due 15/4/34 0.36 2,690,2031,283,000 Marvell Technology, Inc., 1.6500%, due
15/4/26 0.17 1,269,5661,499,000 Marvell Technology, Inc., 4.8750%, due
22/6/28 0.23 1,718,7812,127,000 Microchip Technology, Inc., 2.6700%,
due 1/9/23 0.29 2,173,0961,227,000 Micron Technology, Inc., 2.7030%, due
15/4/32 0.16 1,230,5091.66 12,470,197
Software4,036,000 Cadence Design Systems, Inc.,
4.3750%, due 15/10/24 0.57 4,341,481
Specialty Retail2,889,000 Lithia Motors, Inc., 3.8750%, due
1/6/29 0.39 2,954,075
Thrifts & Mortgage Finance1,253,000 Rocket Mortgage LLC, 2.8750%, due
15/10/26 0.16 1,245,2821,637,000 Rocket Mortgage LLC, 3.6250%, due
1/3/29 0.22 1,645,4882,465,000 Rocket Mortgage LLC, 3.8750%, due
1/3/31 0.33 2,505,7711,249,000 Rocket Mortgage LLC, 4.0000%, due
15/10/33 0.17 1,266,9730.88 6,663,514
Shares or Principal Amount
Percentage of Net Assets
(%)Fair Value
(USD)
Trading Companies & Distributors
1,671,000 Air Lease Corp., 1.8750%, due 15/8/26 0.22 1,645,059826,000 Air Lease Corp., 3.0000%, due 1/2/30 0.11 825,352
0.33 2,470,411
Total Corporate Bonds 30.32 229,568,778
Government Obligations (2020: 22.78% USD 219,329,737)US Treasury Notes/Bonds
15,465,000 0.1250%, due 28/2/23 2.03 15,403,9865,191,000 0.1250%, due 31/8/23 0.68 5,145,781
4,593,300 0.3750%, due 31/10/23 0.60 4,566,9243,759,000 0.2500%, due 15/5/24 0.49 3,708,1954,382,000 0.3750%, due 15/9/24 0.57 4,320,5494,930,900 0.3750%, due 31/1/26 0.63 4,771,609
23,832,000 0.5000%, due 28/2/26 3.06 23,158,93216,505,000 0.7500%, due 30/4/26 2.14 16,179,41322,601,000 0.8750%, due 30/6/26 2.94 22,245,2119,463,000 0.6250%, due 31/7/26 1.21 9,202,3987,856,700 0.7500%, due 31/8/26 1.01 7,681,4591,487,600 0.8750%, due 30/9/26 0.19 1,461,567
75,000 1.1250%, due 31/10/26 0.01 74,52010,859,000 1.2500%, due 30/11/26 1.43 10,853,910
1,243,500 1.1250%, due 29/2/28 0.16 1,225,7221,106,300 1.2500%, due 30/4/28 0.14 1,096,4901,845,000 1.2500%, due 30/6/28 0.24 1,826,5505,135,400 1.1250%, due 31/8/28 0.67 5,037,1052,305,000 1.3750%, due 31/10/28 0.30 2,296,356
39,687,800 1.3750%, due 15/11/31 5.17 39,197,9043,883,000 1.3750%, due 15/11/40 0.47 3,539,901
20,152,000 1.7500%, due 15/8/41 2.58 19,544,2911,821,000 2.0000%, due 15/11/41 0.24 1,842,340
10,068,500 2.7500%, due 15/8/42 1.51 11,475,73016,634,000 1.3750%, due 15/8/50 1.92 14,577,49216,394,400 1.6250%, due 15/11/50 2.02 15,279,453
2,716,500 1.8750%, due 15/2/51 0.36 2,688,6983,593,000 2.3750%, due 15/5/51 0.52 3,969,704
1,011,000 2.0000%, due 15/8/51 0.14 1,030,90457,700,000 0.0000%, due 4/1/22 7.62 57,700,0563,363,000 0.1250%, due 15/7/31 0.52 3,903,422
Total Government Obligations 41.57 315,006,572
Mortgage-Backed Securities (2020: 15.42% USD 148,511,956)Fannie Mae
215,371 3.0000%, due 1/10/34 0.03 226,49155,661 2.5000%, due 1/11/34 0.01 57,98030,222 3.0000%, due 1/11/34 0.00 31,93434,680 3.0000%, due 1/12/34 0.00 36,60371,826 6.0000%, due 1/2/37 0.01 82,969
141,090 4.5000%, due 1/11/42 0.02 155,49527,366 3.0000%, due 1/1/43 0.00 28,84421,914 3.0000%, due 1/2/43 0.00 23,163
180,104 3.0000%, due 1/5/43 0.03 190,493387,306 5.0000%, due 1/7/44 0.06 432,500330,865 4.5000%, due 1/10/44 0.05 369,055492,051 4.5000%, due 1/3/45 0.07 548,846263,693 4.5000%, due 1/6/45 0.04 291,688244,656 3.5000%, due 1/12/45 0.03 261,360490,203 4.5000%, due 1/2/46 0.07 540,253563,563 3.5000%, due 1/7/46 0.08 608,330465,880 3.0000%, due 1/9/46 0.06 490,715
6,451,098 3.0000%, due 1/2/47 0.90 6,794,982208,682 3.5000%, due 1/3/47 0.03 222,930183,532 3.5000%, due 1/7/47 0.03 196,062155,983 3.5000%, due 1/8/47 0.02 165,347
DocuSign Envelope ID: 521655BF-9BE3-47DC-A9A3-494932954338

Janus Henderson Capital Funds plc / 31 December 2021258
The accompanying notes are an integral part of the financial statements.
Janus Henderson Flexible Income Fund (continued)
Portfolio Investments
Shares or Principal Amount
Percentage of Net Assets
(%)Fair Value
(USD)
171,926 3.5000%, due 1/1/48 0.02 184,621
1,239,341 4.0000%, due 1/1/48 0.18 1,349,581481,858 3.0000%, due 1/2/48 0.07 510,162
1,193,804 3.5000%, due 1/3/48 0.17 1,279,886429,175 4.0000%, due 1/3/48 0.06 466,75468,832 5.0000%, due 1/5/48 0.01 74,913
4,877,620 3.5000%, due 1/7/48 0.69 5,200,098281,113 4.0000%, due 1/2/49 0.04 301,576
301,539 3.0000%, due 1/8/49 0.04 318,50966,617 3.0000%, due 1/9/49 0.01 69,742
189,409 2.5000%, due 1/1/50 0.03 194,247486,125 2.5000%, due 1/10/50 0.07 496,4811,011,125 2.5000%, due 1/1/51 0.14 1,032,663
65,013 2.5000%, due 1/8/51 0.01 66,4731,642,220 3.5000%, due 1/8/56 0.24 1,785,6141,154,584 3.0000%, due 1/2/57 0.16 1,225,293
7,686 3.0000%, due 1/6/57 0.00 8,1561,114,052 5.0028%, due 25/11/24 0.15 1,156,1021,528,518 4.1028%, due 25/5/25 0.21 1,555,385
671,650 5.1028%, due 25/7/25 0.09 688,209366,987 5.8028%, due 25/4/28 0.05 386,546503,800 4.3527%, due 25/4/29 0.07 519,580726,449 3.6528%, due 25/7/29 0.10 742,953
1,279,569 2.3028%, due 25/1/30 0.17 1,302,2601,253,745 2.5019%, due 25/5/30 0.17 1,272,1751,233,068 2.2528%, due 25/10/30 0.16 1,246,9372,205,000 2.0500%, due 25/11/41 0.29 2,208,862
1,118,216 3.0000%, due 25/5/48 0.15 1,164,5051,435,059 3.0000%, due 25/11/49 0.20 1,493,545
5.29 40,057,868
Freddie Mac142,404 3.5000%, due 1/1/47 0.02 153,596
2,021,000 3.0528%, due 25/11/49 0.27 2,021,464723,000 2.2997%, due 25/8/33 0.10 727,89596,539 2.0527%, due 25/10/49 0.01 96,809
233,488 3.2528%, due 25/9/50 0.03 233,9971,313,000 2.0497%, due 25/12/50 0.17 1,321,737663,000 2.3497%, due 25/8/33 0.09 673,938
1,940,354 2.6497%, due 25/11/50 0.26 1,959,352382,765 5.6527%, due 25/7/28 0.05 397,028
1.00 7,585,816
Freddie Mac Pool1,155,775 3.0000%, due 1/5/31 0.16 1,213,789
312,123 3.0000%, due 1/9/32 0.04 328,05664,029 3.0000%, due 1/10/32 0.01 67,158
193,594 3.0000%, due 1/1/33 0.03 203,4761,447,529 2.5000%, due 1/12/33 0.20 1,501,165
451,536 3.0000%, due 1/10/34 0.06 475,550183,392 3.0000%, due 1/10/34 0.03 192,869
50,761 2.5000%, due 1/11/34 0.01 52,87889,789 2.5000%, due 1/11/34 0.01 93,533112,431 6.0000%, due 1/4/40 0.02 130,50111,059 3.5000%, due 1/7/42 0.00 11,92612,584 3.5000%, due 1/8/42 0.00 13,57013,993 3.5000%, due 1/8/42 0.00 15,090
229,921 3.5000%, due 1/2/43 0.03 248,155988,992 3.0000%, due 1/3/43 0.14 1,041,896
12,307 3.0000%, due 1/6/43 0.00 12,808344,902 3.5000%, due 1/2/44 0.05 372,255242,849 4.5000%, due 1/5/44 0.04 268,645395,684 3.0000%, due 1/1/45 0.06 416,027285,088 4.0000%, due 1/2/46 0.04 314,559282,146 3.5000%, due 1/7/46 0.04 303,543
Shares or Principal Amount
Percentage of Net Assets
(%)Fair Value
(USD)
10,367 3.0000%, due 1/8/46 0.00 10,85856,793 4.0000%, due 1/3/47 0.01 61,454417,551 3.0000%, due 1/4/47 0.06 437,339
1,425,966 3.5000%, due 1/4/47 0.20 1,539,874128,125 3.5000%, due 1/2/48 0.02 137,091
326,677 4.0000%, due 1/4/48 0.05 354,172338,277 4.0000%, due 1/4/48 0.05 360,169559,173 4.0000%, due 1/5/48 0.08 596,145178,639 4.5000%, due 1/7/48 0.03 191,366
17,925 5.0000%, due 1/9/48 0.00 19,587915,094 3.5000%, due 1/8/49 0.13 963,446
101,114 3.0000%, due 1/8/49 0.01 106,810138,694 3.0000%, due 1/12/49 0.02 143,858114,697 3.0000%, due 1/12/49 0.02 118,96877,496 2.5000%, due 1/1/50 0.01 79,48071,174 3.0000%, due 1/3/50 0.01 73,7372,895 3.5000%, due 1/3/50 0.00 3,054
604,206 2.5000%, due 1/8/51 0.08 617,3321.75 13,092,189
Ginnie Mae1,441,092 4.0000%, due 15/1/45 0.21 1,574,6841,695,441 4.5000%, due 15/8/46 0.25 1,919,541
61,556 4.0000%, due 15/8/47 0.01 66,18015,331 4.0000%, due 20/8/47 0.00 16,457
163,328 4.0000%, due 20/8/47 0.02 174,45033,640 4.0000%, due 20/8/47 0.00 35,93170,001 4.0000%, due 15/11/47 0.01 75,259128,112 4.0000%, due 15/12/47 0.02 137,736
206,963 4.5000%, due 20/2/48 0.03 222,46955,653 4.5000%, due 20/5/48 0.01 59,457
350,894 4.5000%, due 20/5/48 0.05 374,879395,607 4.0000%, due 20/6/48 0.06 418,838505,446 5.0000%, due 20/8/48 0.07 539,039
5,436,032 2.0000%, due 15/1/52 0.72 5,486,4416,626,103 2.5000%, due 15/1/52 0.90 6,791,708
2.36 17,893,069
UMBS4,060,584 2.0000%, due 25/1/37 0.55 4,160,5583,994,700 2.5000%, due 25/1/37 0.55 4,133,356
27,766,072 2.0000%, due 25/1/52 3.66 27,689,71225,217,448 2.5000%, due 25/1/52 3.40 25,747,89717,756,935 3.0000%, due 25/1/52 2.43 18,400,2924,905,900 3.5000%, due 25/2/52 0.68 5,160,778
11.27 85,292,593
Total Mortgage-Backed Securities 21.67 163,921,535
Preferred Stock (2020: 0.68% USD 6,522,533).
Tranche Loans (2020: 0.35% USD 3,327,553)NetherlandsChemicals
1,742,245 Alpha 3 BV, 3.0000%, due 18/3/28 0.23 1,741,0952,368,000 Diamond (BC) BV, 3.5000%, due
29/9/28 0.31 2,363,7380.54 4,104,833
United StatesBuilding Products
1,141,717 Standard Industries, Inc., 3.0000%, due 22/9/28 0.15 1,144,098
Diversified Financial Services4,177,000 Trans Union LLC, 2.7500%, due
1/12/28 0.55 4,171,779
DocuSign Envelope ID: 521655BF-9BE3-47DC-A9A3-494932954338

259Janus Henderson Capital Funds plc / 31 December 2021
The accompanying notes are an integral part of the financial statements.
Janus Henderson Flexible Income Fund (continued)
Portfolio Investments
Shares or Principal Amount
Percentage of Net Assets
(%)Fair Value
(USD)
Health Care Equipment & Supplies
4,191,785 Mozart Borrower LP, 3.7500%, due 23/10/28 0.55 4,195,578
Health Care Providers & Services2,804,035 Indigo Merger Sub, Inc., 2.7500%, due
3/7/28 0.37 2,808,508698,627 Indigo Merger Sub, Inc., 2.7500%, due
3/7/28 0.09 699,7420.46 3,508,250
Machinery3,397,650 Madison IAQ LLC, 3.7500%, due
21/6/28 0.45 3,399,060
Pharmaceuticals3,315,489 Elanco Animal Health, Inc., 1.8493%,
due 1/8/27 0.43 3,276,896
Semiconductors & Semiconductor Equipment1,728,000 MKS Instruments, Inc., due 20/10/28 0.23 1,726,488
Total Tranche Loans 3.36 25,526,982
Total Investments (Cost: USD 808,028,535) 107.11 811,353,799
Credit Default Swaps (2020: 0.00% USD 18,452).
Forward Currency Contracts (2020: 0.15% USD 1,506,282)Open as at 31 December 2021.
Current Market
Percentage of Net Unrealised
Currency Currency Value Settle Assets GainPurchased Sold (USD) Date (%) (USD)
.J.P. Morgan AUD◊ 3,239,199 USD 2,330,447 2,356,885 31-Jan-22 0.00 26,438
EUR◊ 26,261,525 USD 29,467,403 29,915,424 31-Jan-22 0.05 448,021
Total 0.05 474,459
.
Futures° (2020: 0.00% USD 2,803).
Counterparty No of Contracts
Percentage of Net
Assets (%)
UnrealisedGain (USD)
Goldman Sachs 2 US 10 Year Ultra Bond 0.00 4,201Goldman Sachs (2) US 2 Year Note 0.00 248Goldman Sachs 9 US 5 Year Note 0.00 4,561Total 0.00 9,010
.
Total Financial Assets at fair value through profit or loss 107.16 811,837,268
Financial Liabilities at fair value through profit or loss.Credit Default Swaps (2020: (0.01)% USD (70,232))
.
Forward Currency Contracts (2020: 0.00% USD (23,744))Open as at 31 December 2021
Current Market
Percentage of Net Unrealised
Currency Currency Value Settle Assets LossPurchased Sold (USD) Date (%) (USD)
J.P. Morgan USD◊ 51,535 AUD 71,420 51,966 31-Jan-22 0.00 (431)
USD◊ 2,500,767 EUR 2,208,221 2,515,463 31-Jan-22 0.00 (14,696)
Total 0.00 (15,127).
Futures° (2020: 0.00% USD (770))
.
Total Financial Liabilities at fair value through profit or loss 0.00 (15,127)
Portfolio Analysis (Unaudited)
Analysis of Total Assets:% of Total
AssetsTransferable securities admitted to official stock exchange listing 35.85Transferable securities dealt in on another regulated market 54.30Financial derivative instruments dealt in on a regulated market 0.00OTC financial derivative instruments 0.05Other Assets 9.80Total Assets 100.00
◊ These forward currency contracts are used for share class hedging.° Refer to Note 5 for details of collateral held.
DocuSign Envelope ID: 521655BF-9BE3-47DC-A9A3-494932954338

Janus Henderson Capital Funds plc / 31 December 2021260
The accompanying notes are an integral part of the financial statements.
Janus Henderson Flexible Income Fund (continued)
Fair Value Hierarchy
The tables below provide the fair value hierarchy summary of the Fund’s financial assets and liabilities measured at fair value at 31 December 2021 and 31 December 2020.
31 December 2021
Level 1 - Quoted Prices
(USD)
Level 2 - Other Significant
Observable Inputs (USD)
Level 3 - Significant
Unobservable Inputs (USD)
Total (USD)
Asset-Backed/Commercial Mortgage-Backed Securities – 77,329,932 – 77,329,932Corporate Bonds – 229,568,778 – 229,568,778Forward Currency Contracts – 459,332 – 459,332Futures 9,010 – – 9,010Government Obligations – 315,006,572 – 315,006,572Mortgage-Backed Securities – 163,921,535 – 163,921,535Tranche Loans – 25,526,982 – 25,526,982Total Investments in Securities 9,010 811,813,131 – 811,822,141
31 December 2020
Level 1 - Quoted Prices
(USD)
Level 2 - Other Significant
Observable Inputs (USD)
Level 3 - Significant
Unobservable Inputs (USD)
Total (USD)
Asset-Backed/Commercial Mortgage-Backed Securities – 73,260,164 – 73,260,164Corporate Bonds – 496,839,241 – 496,839,241Credit Default Swaps – (51,780) – (51,780)Forward Currency Contracts – 1,482,538 – 1,482,538Futures 2,033 – – 2,033Government Obligations – 219,329,737 – 219,329,737Mortgage-Backed Securities – 148,511,956 – 148,511,956Preferred Stock 6,522,533 – – 6,522,533Tranche Loans – 3,327,553 – 3,327,553Total Investments in Securities 6,524,566 942,699,409 – 949,223,975
There were transfers on Government Obligations from level 1 to level 2 during the financial year ended 31 December 2020.
There were no investments held by the Fund at 31 December 2021 and 31 December 2020 that were fair valued at level 3 by the Janus Henderson Global Pricing Committee.
Valuation policy of private placements is referenced in note 2 of the financial statements.
DocuSign Envelope ID: 521655BF-9BE3-47DC-A9A3-494932954338

261Janus Henderson Capital Funds plc / 31 December 2021
Janus Henderson Flexible Income Fund (continued)
The accompanying notes are an integral part of the financial statements.
Capital Share Transactions
For the financial year ended 31 December 2021
A2 HEUR A2 USD A3 m HAUD A3 m HKD A3 m USD B1 m HEUR B1 m USD B2 USDShares Shares Shares Shares Shares Shares Shares Shares
At beginning of the year . . . . . . . 947,945 3,538,816 749,442 10,353,016 9,782,133 4,636 85,106 7,239Shares issued 84,050 525,422 15,668 43,433 546,632 – – –Shares redeemed. . . . . . . . . . . (437,763) (1,250,137) (601,340) (8,662,660) (6,866,982) (309) (4,432) –At end of year . . . . . . . . . . . . . 594,232 2,814,101 163,770 1,733,789 3,461,783 4,327 80,674 7,239
E2 HEUR E2 USD E3 m HEUR E3 m USD H1 m USD H2 HEUR H2 USD I1 m USDShares Shares Shares Shares Shares Shares Shares Shares
At beginning of the year . . . . . . . 79,378 37,188 161,270 11,752 324 902 300 43,745,171Shares issued 81,281 14,050 14,565 1,798 5 72 – 4,988,897Shares redeemed. . . . . . . . . . . (73,274) (18,918) (34,773) (4,482) – (598) – (10,232,887)At end of year . . . . . . . . . . . . . 87,385 32,320 141,062 9,068 329 376 300 38,501,181
I2 HEUR I2 USD I3m USD V3 m HAUD V3 m USD Z2 USDShares Shares Shares Shares Shares Shares
At beginning of the year . . . . . . . 499,740 3,526,467 301 240,275 609,275 447,872Shares issued 212,691 1,240,513 7 6,040 82,631 20,686Shares redeemed. . . . . . . . . . . (381,833) (819,784) – (45,869) (338,997) –At end of year . . . . . . . . . . . . . 330,598 3,947,196 308 200,446 352,909 468,558
For the financial year ended 31 December 2020
A2 HEUR A2 USD A3 m HAUD A3 m HKD A3 m USD B1 m HEUR B1 m USD B2 USDShares Shares Shares Shares Shares Shares Shares Shares
At beginning of the year . . . . . . . 771,069 1,912,309 106,452 105,752 1,487,971 5,732 88,571 21,751Shares issued 870,132 3,065,145 848,203 11,554,159 11,350,771 – 33 –Shares redeemed. . . . . . . . . . . (693,256) (1,438,638) (205,213) (1,306,895) (3,056,609) (1,096) (3,498) (14,512)At end of year . . . . . . . . . . . . . 947,945 3,538,816 749,442 10,353,016 9,782,133 4,636 85,106 7,239
E2 HEUR E2 USD E3 m HEUR E3 m USD H1 m USD H2 HEUR H2 USD I1 m USDShares Shares Shares Shares Shares Shares Shares Shares
At beginning of the year . . . . . . . 71,776 847 156,960 339 317 299 300 35,053,629Shares issued 44,153 44,217 41,964 15,947 7 608 – 13,313,216Shares redeemed. . . . . . . . . . . (36,551) (7,876) (37,654) (4,534) – (5) – (4,621,674)At end of year . . . . . . . . . . . . . 79,378 37,188 161,270 11,752 324 902 300 43,745,171
I2 HEUR I2 USD I3m USD V3 m HAUD V3 m USD Z2 USDShares Shares Shares Shares Shares Shares
At beginning of the year . . . . . . . 253,148 2,178,325 – 166,929 373,457 882,926Shares issued 546,706 2,517,724 301 122,197 832,413 –Shares redeemed. . . . . . . . . . . (300,114) (1,169,582) – (48,851) (596,595) (435,054)At end of year . . . . . . . . . . . . . 499,740 3,526,467 301 240,275 609,275 447,872
DocuSign Envelope ID: 521655BF-9BE3-47DC-A9A3-494932954338

Janus Henderson Capital Funds plc / 31 December 2021262
Janus Henderson Flexible Income Fund (continued)
The accompanying notes are an integral part of the financial statements.
Net Asset Comparison
31 December 2021 31 December 2020 31 December 2019
Net Assets (USD)
NAV Per Share
(Local Currency)Net Assets
(USD)
NAV Per Share
(Local Currency)Net Assets
(USD)
NAV Per Share
(Local Currency)
A2 HEUR 15,334,151 22 .67 27,144,096 23 .44 18,915,140 21 .87
A2 USD 64,995,240 23 .10 83,691,260 23 .65 41,534,432 21 .72
A3 m HAUD 1,012,881 8 .50 5,188,183 8 .98 639,995 8 .57
A3 m HKD 1,930,773 8 .68 12,102,889 9 .06 117,081 8 .63
A3 m USD 37,579,470 10 .86 111,461,825 11 .39 16,054,899 10 .79
B1 m HEUR 51,202 10 .39 61,465 10 .85 65,895 10 .25
B1 m USD 1,039,642 12 .89 1,134,253 13 .33 1,096,852 12 .38
B2 USD 134,115 18 .53 138,695 19 .16 386,827 17 .78
E2 HEUR 1,055,053 10 .60 1,065,503 10 .99 827,613 10 .28
E2 USD 354,667 10 .97 418,877 11 .26 8,780 10 .37
E3 m HEUR 1,249,733 7 .78 1,628,590 8 .27 1,404,207 7 .98
E3 m USD 80,786 8 .91 113,546 9 .66 3,114 9 .18
H1 m USD 3,519 10 .68 3,560 10 .99 3,231 10 .19
H2 HEUR 4,889 11 .43 12,872 11 .68 3,612 10 .77
H2 USD 3,894 12 .98 3,938 13 .13 3,573 11 .91
I1 m USD 501,764,447 13 .03 586,356,642 13 .40 435,884,558 12 .43
I2 HEUR 9,606,146 25 .52 15,920,660 26 .08 6,824,335 24 .04
I2 USD 53,426,893 13 .54 48,250,286 13 .68 27,036,253 12 .41
I3m USD 3,018 9 .78 3,049 10 .13 – – V3 m HAUD 1,277,320 8 .76 1,710,357 9 .23 1,028,005 8 .78
V3 m USD 3,008,158 8 .52 5,441,788 8 .93 3,158,901 8 .46
Z2 USD 63,637,356 135 .82 61,104,863 136 .43 108,548,667 122 .94. . .
DocuSign Envelope ID: 521655BF-9BE3-47DC-A9A3-494932954338

263Janus Henderson Capital Funds plc / 31 December 2021
Janus Henderson Flexible Income Fund (continued)
The accompanying notes are an integral part of the financial statements.
Total Expense Ratio (unaudited)
The Average Total Expense Ratio table shows the actual expenses, excluding transactions costs and trade commissions, incurred by each Class for the Fund during the reporting financial year expressed as a percentage of the average net assets for the corresponding year, on an annualised basis.
31 December 2021 31 December 2020 31 December 2019A2 HEUR 1.90% 1.89% 1.89%A2 USD 1.89% 1.88% 1.89%A3 m HAUD 1.91% 1.88% 1.89%A3 m HKD 1.91% 1.91% 1.89%A3 m USD 1.92% 1.88% 1.89%B1 m HEUR 2.92% 2.88% 2.88%B1 m USD 2.90% 2.88% 2.89%B2 USD 2.89% 2.91% 2.89%E2 HEUR 2.12% 2.14% 2.14%E2 USD 2.14% 2.15% 2.13%E3 m HEUR 2.14% 2.14% 2.14%E3 m USD 2.16% 2.17% 2.16%H1 m USD 0.64% 0.65% 0.75%H2 HEUR 0.66% 0.68% 0.76%H2 USD 0.58% 0.64% 0.77%I1 m USD 0.64% 0.64% 0.69%I2 HEUR 0.63% 0.64% 0.69%I2 USD 0.63% 0.64% 0.67%I3m USD 0.58% 0.55% –V3 m HAUD 1.88% 1.89% 1.89%V3 m USD 1.92% 1.89% 1.88%
Distributions per share (unaudited)
The following table shows the distribution rate per share at Ex-date for each distributing share class :
Share Class (Local Currency) 15/01/2021 12/02/2021 15/03/2021 15/04/2021 14/05/2021 15/06/2021 15/07/2021 13/08/2021 15/09/2021 15/10/2021 15/11/2021 15/12/2021A3 m HAUD 0.02246 0.01994 0.02100 0.01981 0.01917 0.01978 0.01785 0.01710 0.01946 0.01633 0.01532 0.01761A3 m HKD 0.02032 0.01798 0.02040 0.01928 0.01829 0.01890 0.01684 0.01631 0.01861 0.01585 0.01434 0.01607A3 m USD 0.02555 0.02261 0.02562 0.02420 0.02295 0.02373 0.02113 0.02042 0.02331 0.01986 0.01794 0.02007E3 m HEUR 0.01862 0.01634 0.01869 0.01734 0.01657 0.01722 0.01533 0.01481 0.01677 0.01437 0.01306 0.01449E3 m USD 0.02166 0.01917 0.02171 0.02051 0.01944 0.02011 0.01790 0.01730 0.01974 0.01681 0.01518 0.01698H1 m USD 0.01550 0.01449 0.01810 0.01611 0.01531 0.01621 0.01539 0.01442 0.01663 0.01258 0.01077 0.01298I1 m USD 0.01870 0.01730 0.02146 0.02065 0.02021 0.02150 0.01964 0.01833 0.02080 0.01638 0.01422 0.01710I3m USD 0.02277 0.02010 0.02284 0.02143 0.02046 0.02111 0.01912 0.01840 0.02059 0.01774 0.01605 0.01804V3 m HAUD 0.02233 0.01990 0.02159 0.02039 0.01970 0.02032 0.01835 0.01758 0.02001 0.01680 0.01575 0.01812V3 m USD 0.02002 0.01772 0.02008 0.01897 0.01799 0.01861 0.01657 0.01601 0.01827 0.01557 0.01406 0.01573
– – – – – – – – – – – –
DocuSign Envelope ID: 521655BF-9BE3-47DC-A9A3-494932954338

Janus Henderson Capital Funds plc / 31 December 2021264
Janus Henderson Flexible Income Fund (continued)
The accompanying notes are an integral part of the financial statements.
Fund Performance (unaudited)
As at 31 December 2021
One year Three years Five yearsSince
inception
Performance (Annualised) 31/12/2020 31/12/2021
%
31/12/2017 31/12/2021
%
31/12/2015 31/12/2021
%
to 31/12/2021
%
H1m USD (Net)* (1.19) 4.69** 2.77** 3.70**Bloomberg Barclays US Aggregate Bond TR (1.54) 4.79 3.57 4.62
Five years 31/12/2015 31/12/2021
%H1m USD (Gross)* 4.72Bloomberg Barclays U.S. Aggregate Bond TR + 1.25% 4.86
.
Discrete performance
31/12/2020 31/12/2021
%
31/12/2019 31/12/2020
%
31/12/2018 31/12/2019
%
31/12/2017 31/12/2018
%
31/12/2016 31/12/2017
%
H1m USD (Net)* (1.19) 8.89** 7.90** (2.23)** 2.18**Bloomberg Barclays U.S. Aggregate Bond TR (1.54) 7.51 8.72 0.01 3.54
H1m USD (Gross)* (0.55) 10.95** 9.94** (0.33)** 4.19**Bloomberg Barclays U.S. Aggregate Bond TR + 1.25% (0.31) 8.85 10.07 1.27 4.83
. . . . .
Class H1m USD is disclosed as it is the representative share class.
* The representative share class has changed from the A2 USD to the H1m USD share class with effect from August 2021.
** Historical figures are based on the A2 USD share class.
Performance target: To outperform the Bloomberg Barclays US Aggregate Bond Index by 1.25% per annum, before the deduction of charges, over any 5 year period.
The Total Expense Ratio includes fees payable to Distributors. Where the Total Expense Ratio exceeds the target outperformance relative to the benchmark the return is likely to be below the benchmark return, even when the Fund’s outperformance target (before the deduction of charges) has been achieved.
Please note the Gross Returns 5 year annualised table is only applicable for share classes which have been active for 5 or more years and the performance target is to be achieved over a specific annualised time period. Performance target and index shown in USD.
Past performance does not guarantee future returns. The rates of return will vary and the principal value of an investment will fluctuate. Shares, if redeemed, may be worth more or less than their original cost. The performance data does not take account of the commissions and costs incurred on the issue and redemption of Shares. All returns are calculated in the base currency of the representative Share Class.
There is no guarantee that the Fund’s performance will match or exceed the benchmark.
DocuSign Envelope ID: 521655BF-9BE3-47DC-A9A3-494932954338

265Janus Henderson Capital Funds plc / 31 December 2021
Janus Henderson Flexible Income Fund (continued)
Statements of Changes in Composition of Portfolio (unaudited)The tables below show a breakdown of material purchases and sales of the Investment Portfolio in accordance with Central Bank UCITS Regulations 79(2) requirements. All purchases and sales of investments exceeding 1% of the total value of each transaction respectively, are disclosed, with a minimum number of 20 of each such transaction. A full analysis of the movement on the Investment Portfolio is available upon request from the registered office.
Major Purchases for the year ended 31 December 2021
Shares or Principal Amount
Cost (USD)
Credit Agricole Corporate And Investment Bank, 0.0000%, due 17/3/21 88,300,000 88,299,853US Treasury Bill, 0.0000%, due 1/7/21 87,000,000 86,999,988Credit Agricole Corporate And Investment Bank, 0.0000%, due 19/3/21 86,700,000 86,699,880Credit Agricole Corporate And Investment Bank, 0.0000%, due 7/4/21 86,700,000 86,699,880Credit Agricole Corporate And Investment Bank, 0.0000%, due 8/4/21 86,200,000 86,199,880Credit Agricole Corporate And Investment Bank, 0.0000%, due 27/4/21 85,800,000 85,799,905Credit Industriel et Commercial, 0.0000%, due 24/5/21 85,800,000 85,799,714Credit Industriel et Commercial, 0.0000%, due 14/5/21 85,500,000 85,499,881Credit Agricole Corporate And Investment Bank, 0.0000%, due 19/5/21 85,000,000 84,999,929Credit Agricole Corporate And Investment Bank, 0.0000%, due 23/3/21 85,000,000 84,999,882Credit Agricole Corporate And Investment Bank, 0.0000%, due 24/3/21 85,000,000 84,999,882Credit Agricole Corporate And Investment Bank, 0.0000%, due 26/3/21 85,000,000 84,999,882Credit Agricole Corporate And Investment Bank, 0.0000%, due 30/3/21 85,000,000 84,999,882Credit Agricole Corporate And Investment Bank, 0.0000%, due 29/3/21 85,000,000 84,999,646Credit Agricole Corporate And Investment Bank, 0.0000%, due 5/4/21 85,000,000 84,999,528Credit Industriel et Commercial, 0.0000%, due 4/6/21 84,700,000 84,699,906Credit Agricole Corporate And Investment Bank, 0.0000%, due 3/6/21 84,500,000 84,499,953Credit Agricole Corporate And Investment Bank, 0.0000%, due 22/4/21 84,500,000 84,499,883Credit Agricole Corporate And Investment Bank, 0.0000%, due 7/6/21 84,500,000 84,499,859Credit Industriel et Commercial, 0.0000%, due 2/7/21 84,500,000 84,499,812
Major Sales for the year ended 31 December 2021
Shares or Principal Amount
Proceeds (USD)
UMBS, 2.5000%, due 15/12/51 72,613,191 74,284,596UMBS, 2.0000%, due 25/3/52 69,691,099 70,105,143US Treasury, 1.1250%, due 15/2/31 67,613,100 64,694,992US Treasury, 1.2500%, due 15/8/31 63,829,300 62,002,536UMBS, 2.5000%, due 25/11/51 53,186,120 54,622,803US Treasury, 0.8750%, due 15/11/30 57,099,800 54,472,362UMBS, 2.5000%, due 25/10/51 51,213,810 52,698,210US Treasury, 1.6250%, due 15/5/31 45,733,000 46,802,086US Treasury, 1.1250%, due 28/2/22 46,082,000 46,492,365UMBS, 2.5000%, due 25/1/52 43,601,444 44,919,398US Treasury, 0.3750%, due 30/11/25 44,384,000 44,211,922US Treasury, 0.6250%, due 15/4/23 38,329,000 43,847,820UMBS, 2.5000%, due 25/9/51 42,188,067 43,780,160UMBS, 2.5000%, due 25/7/51 39,017,022 40,452,877GNMA II, 2.0000%, due 15/9/51 38,688,686 39,584,117UMBS, 2.0000%, due 25/5/52 35,230,815 35,480,514UMBS, 2.0000%, due 25/2/52 32,368,752 33,322,534UMBS, 2.5000%, due 25/8/51 30,785,539 32,014,172US Treasury, 0.5000%, due 28/2/26 32,005,000 31,658,680GNMA II, 2.0000%, due 15/6/52 30,028,069 30,634,311US Treasury, 0.3800%, due 31/1/26 30,735,500 30,281,266US Treasury, 0.1250%, due 15/10/25 25,178,000 27,728,699UMBS, 2.5000%, due 25/6/52 26,299,044 27,207,183US Treasury, 1.3800%, due 15/11/31 26,556,300 26,303,111US Treasury, 1.2500%, due 15/5/50 30,232,300 26,222,785UMBS, 0.0200%, due 25/1/52 24,122,019 24,989,029US Treasury, 2.1250%, due 31/5/21 24,496,000 24,666,806US Treasury, 0.1300%, due 31/8/23 24,537,000 24,391,158
DocuSign Envelope ID: 521655BF-9BE3-47DC-A9A3-494932954338

Janus Henderson Global High Yield Fund
Janus Henderson Capital Funds plc / 31 December 2021266
The Fund ceased investment activities and merged into the Janus Henderson High Yield Fund on 08 October 2021.
Please refer to the fund performance (unaudited) note for details on the Funds performance during the year.
DocuSign Envelope ID: 521655BF-9BE3-47DC-A9A3-494932954338

267Janus Henderson Capital Funds plc / 31 December 2021
The accompanying notes are an integral part of the financial statements.
Janus Henderson Global High Yield Fund (continued)
s
Statement of Financial PositionAs of
31 December 2021
(USD)*
As of 31 December
2020 (USD)
Assets:Financial assets at fair value through profit or loss . . . . . . . . . . . . . . . . . . . . . . . . . . . . . . . . . . . . . . . . . . . . . . . . . . . . . . . – 22,897,938Cash and foreign currency . . . . . . . . . . . . . . . . . . . . . . . . . . . . . . . . . . . . . . . . . . . . . . . . . . . . . . . . . . . . . . . . . . . . . . . – 902,007Margin cash . . . . . . . . . . . . . . . . . . . . . . . . . . . . . . . . . . . . . . . . . . . . . . . . . . . . . . . . . . . . . . . . . . . . . . . . . . . . . . . . . – 11,052Collateral cash . . . . . . . . . . . . . . . . . . . . . . . . . . . . . . . . . . . . . . . . . . . . . . . . . . . . . . . . . . . . . . . . . . . . . . . . . . . . . . . – 90,000Receivables:
Investments sold . . . . . . . . . . . . . . . . . . . . . . . . . . . . . . . . . . . . . . . . . . . . . . . . . . . . . . . . . . . . . . . . . . . . . . . . . . . . – 43,277Spot foreign exchange contracts awaiting settlement . . . . . . . . . . . . . . . . . . . . . . . . . . . . . . . . . . . . . . . . . . . . . . . . . . . . – 135Funds shares sold . . . . . . . . . . . . . . . . . . . . . . . . . . . . . . . . . . . . . . . . . . . . . . . . . . . . . . . . . . . . . . . . . . . . . . . . . . . – 167,326Interest . . . . . . . . . . . . . . . . . . . . . . . . . . . . . . . . . . . . . . . . . . . . . . . . . . . . . . . . . . . . . . . . . . . . . . . . . . . . . . . . . . . – 355,275
Receivable from Investment Manager . . . . . . . . . . . . . . . . . . . . . . . . . . . . . . . . . . . . . . . . . . . . . . . . . . . . . . . . . . . . . . . . – 23,213
Total Assets . . . . . . . . . . . . . . . . . . . . . . . . . . . . . . . . . . . . . . . . . . . . . . . . . . . . . . . . . . . . . . . . . . . . . . . . . – 24,490,223 Liabilities (amounts falling due within one year)Payables:
Financial liabilities at fair value through profit or loss . . . . . . . . . . . . . . . . . . . . . . . . . . . . . . . . . . . . . . . . . . . . . . . . . . . . – 93,755Bank overdraft and foreign currency . . . . . . . . . . . . . . . . . . . . . . . . . . . . . . . . . . . . . . . . . . . . . . . . . . . . . . . . . . . . . . . – 1,445Investments purchased . . . . . . . . . . . . . . . . . . . . . . . . . . . . . . . . . . . . . . . . . . . . . . . . . . . . . . . . . . . . . . . . . . . . . . . . – 134,183Investment Management fees . . . . . . . . . . . . . . . . . . . . . . . . . . . . . . . . . . . . . . . . . . . . . . . . . . . . . . . . . . . . . . . . . . . – 19,830Shareholder Service fees . . . . . . . . . . . . . . . . . . . . . . . . . . . . . . . . . . . . . . . . . . . . . . . . . . . . . . . . . . . . . . . . . . . . . . – 14,787Accounting, Administration and Transfer Agent fees . . . . . . . . . . . . . . . . . . . . . . . . . . . . . . . . . . . . . . . . . . . . . . . . . . . . – 4,567Management fees . . . . . . . . . . . . . . . . . . . . . . . . . . . . . . . . . . . . . . . . . . . . . . . . . . . . . . . . . . . . . . . . . . . . . . . . . . . – 451Accrued expenses . . . . . . . . . . . . . . . . . . . . . . . . . . . . . . . . . . . . . . . . . . . . . . . . . . . . . . . . . . . . . . . . . . . . . . . . . . . – 64,190
Total Liabilities (excluding Net Assets attributable to holders of redeemable ordinary shares) . . . . . . . . . . . . – 333,208 Net Assets attributable to holders of redeemable ordinary participating shares . . . . . . . . . . . . . . . . . . . . . . – 24,157,015
* The Fund ceased investment activities on 08 October 2021.
DocuSign Envelope ID: 521655BF-9BE3-47DC-A9A3-494932954338

Janus Henderson Capital Funds plc / 31 December 2021268
Janus Henderson Global High Yield Fund (continued)
The accompanying notes are an integral part of the financial statements.
Statement of Comprehensive IncomeYear ended
31 December 2021
(USD)*
Year ended 31 December
2020 (USD)
Year ended Year endedRevenue:Interest income . . . . . . . . . . . . . . . . . . . . . . . . . . . . . . . . . . . . . . . . . . . . . . . . . . . . . . . . . . . . . . . . . . . . . . . . . . . . . . . 1,018,953 1,270,416Dividend income . . . . . . . . . . . . . . . . . . . . . . . . . . . . . . . . . . . . . . . . . . . . . . . . . . . . . . . . . . . . . . . . . . . . . . . . . . . . . . 2,015 4,457Other income . . . . . . . . . . . . . . . . . . . . . . . . . . . . . . . . . . . . . . . . . . . . . . . . . . . . . . . . . . . . . . . . . . . . . . . . . . . . . . . . – 5,375
Net (loss)/gain on financial assets and liabilities at fair value through profit or loss . . . . . . . . . . . . . . . . . . . . . . . . . . . . . . . . . . (968,605) 1,114,063 Total Investments Income . . . . . . . . . . . . . . . . . . . . . . . . . . . . . . . . . . . . . . . . . . . . . . . . . . . . . . . . . . . . . . . 52,363 2,394,311
Expenses:Investment Management fees . . . . . . . . . . . . . . . . . . . . . . . . . . . . . . . . . . . . . . . . . . . . . . . . . . . . . . . . . . . . . . . . . . . . . 204,309 201,265Shareholder Service fees . . . . . . . . . . . . . . . . . . . . . . . . . . . . . . . . . . . . . . . . . . . . . . . . . . . . . . . . . . . . . . . . . . . . . . . . 156,287 153,573Management fees . . . . . . . . . . . . . . . . . . . . . . . . . . . . . . . . . . . . . . . . . . . . . . . . . . . . . . . . . . . . . . . . . . . . . . . . . . . . . 4,909 2,614Accounting, Administration and Transfer Agent fees . . . . . . . . . . . . . . . . . . . . . . . . . . . . . . . . . . . . . . . . . . . . . . . . . . . . . . 44,317 22,326Custodian fees . . . . . . . . . . . . . . . . . . . . . . . . . . . . . . . . . . . . . . . . . . . . . . . . . . . . . . . . . . . . . . . . . . . . . . . . . . . . . . . 21,928 38,844Audit fees . . . . . . . . . . . . . . . . . . . . . . . . . . . . . . . . . . . . . . . . . . . . . . . . . . . . . . . . . . . . . . . . . . . . . . . . . . . . . . . . . . 18,186 30,051Printing expenses . . . . . . . . . . . . . . . . . . . . . . . . . . . . . . . . . . . . . . . . . . . . . . . . . . . . . . . . . . . . . . . . . . . . . . . . . . . . . (690) 3,548Legal and other professional fees . . . . . . . . . . . . . . . . . . . . . . . . . . . . . . . . . . . . . . . . . . . . . . . . . . . . . . . . . . . . . . . . . . 10,815 65,433Other fees . . . . . . . . . . . . . . . . . . . . . . . . . . . . . . . . . . . . . . . . . . . . . . . . . . . . . . . . . . . . . . . . . . . . . . . . . . . . . . . . . . 22,939 4,976
Total Expenses . . . . . . . . . . . . . . . . . . . . . . . . . . . . . . . . . . . . . . . . . . . . . . . . . . . . . . . . . . . . . . . . . . . . . . . 483,000 522,630Less Expense Reimbursement . . . . . . . . . . . . . . . . . . . . . . . . . . . . . . . . . . . . . . . . . . . . . . . . . . . . . . . . . . . (67,387) (112,555)Net Expenses after Expense Reimbursement . . . . . . . . . . . . . . . . . . . . . . . . . . . . . . . . . . . . . . . . . . . . . . . . 415,613 410,075Net Operating (Loss)/Profit . . . . . . . . . . . . . . . . . . . . . . . . . . . . . . . . . . . . . . . . . . . . . . . . . . . . . . . . . . . . . . (363,250) 1,984,236
Finance Costs: 642,163 804,956
Total distributions to holders of redeemable ordinary shares. . . . . . . . . . . . . . . . . . . . . . . . . . . . . . . . . . . . . . . . . . . . . . . . . (642,163) (804,956) Withholding tax on dividends and other investment income . . . . . . . . . . . . . . . . . . . . . . . . . . . . . . . . . . . . . (2,840) (10,032)
Net (Decrease)/Increase in Net Assets attributable to holders of redeemable ordinary shares resulting from operations . . . . . . . . . . . . . . . . . . . . . . . . . . . . . . . . . . . . . . . . . . . . . . . . . . . . . . . . . . . . . . . . . . . . . . . . . . . (1,008,253) 1,169,248
. .
. .. . .
Statement of Changes in Net Assets Attributable to Redeemable Ordinary ShareholdersYear ended
31 December 2021
(USD)*
Year ended 31 December
2020 (USD)
(Decrease)/Increase in Net Assets attributable to holders of redeemable ordinary shares resulting from operations . . . . . . . . . . . . (1,008,253) 1,169,248
Capital Share Transactions of redeemable ordinary shares:Proceeds from redeemable ordinary shares sold . . . . . . . . . . . . . . . . . . . . . . . . . . . . . . . . . . . . . . . . . . . . . . . . . . . . . . . 10,761,088 9,302,072Redemption of redeemable ordinary shares . . . . . . . . . . . . . . . . . . . . . . . . . . . . . . . . . . . . . . . . . . . . . . . . . . . . . . . . . . (33,925,468) (35,596,328)Dilution Adjustment. . . . . . . . . . . . . . . . . . . . . . . . . . . . . . . . . . . . . . . . . . . . . . . . . . . . . . . . . . . . . . . . . . . . . . . . . . . 15,618 4,841
Net (Decrease) from Capital Share Transactions of redeemable ordinary shares . . . . . . . . . . . . . . . . . . . . . . (23,148,762) (26,289,415)
Net (Decrease) in Net Assets attributable to holders of redeemable ordinary shares . . . . . . . . . . . . . . . . . . . . . . . . . . . . . . . . . (24,157,015) (25,120,167)Net Assets attributable to holders of redeemable ordinary shares at the beginning of the financial year . . . . . . . . . . . . . . . . . . . . 24,157,015 49,277,182
Net Assets attributable to holders of redeemable ordinary shares at the end of the financial year . . . . . . . . . – 24,157,015
* The Fund ceased investment activities on 08 October 2021.
Gains and losses are solely from continuing operations except for the Funds which ceased operations during the financial year ended 31 December 2021 and 31 December 2020. There were no gains and losses other than those dealt with in the Statement of Comprehensive Income. Please refer to note 1 which details the Fund closures during the year.
DocuSign Envelope ID: 521655BF-9BE3-47DC-A9A3-494932954338

269Janus Henderson Capital Funds plc / 31 December 2021
The accompanying notes are an integral part of the financial statements.
Janus Henderson Global High Yield Fund (continued)
Fair Value Hierarchy
The Fund ceased operations on 08 October 2021. There were no investments held by the Fund at 31 December 2021. The tables below provide the fair value hierarchy summary of the Fund’s financial assets and liabilities measured at fair value at 31 December 2020.
31 December 2020
Level 1 - Quoted Prices
(USD)
Level 2 - Other Significant
Observable Inputs (USD)
Level 3 - Significant
Unobservable Inputs (USD)
Total (USD)
Common Stock – – 25,132 25,132Corporate Bonds – 21,345,222 – 21,345,222Forward Currency Contracts – 173,334 – 173,334Futures (7,428) – – (7,428)Government Obligations – 1,113,311 – 1,113,311Tranche Loans – 151,632 2,980 154,612Total Investments in Securities (7,428) 22,783,499 28,112 22,804,183
There were transfers on Government Obligations from level 1 to level 2 during the financial year ended 31 December 2020.
Valuation policy of private placements is referenced in note 2 of the financial statements.
The following tables present level 3 positions that were fair valued by the Janus Henderson Global Pricing Committee at 31 December 2020.
Security Name
Fair Value at 31 December 2020
(USD)Fair Value as a %
of Net Assets Valuation MethodBoardriders, Inc. 2,980 0.01% DCF ModelBoardriders, Inc. – 0.00% Valued at zeroQuiksilver Americas, Inc. 25,132 0.10% Liquidation value
Total 28,112
DocuSign Envelope ID: 521655BF-9BE3-47DC-A9A3-494932954338

Janus Henderson Capital Funds plc / 31 December 2021270
Janus Henderson Global High Yield Fund (continued)
The accompanying notes are an integral part of the financial statements.
Capital Share Transactions
For the financial year ended 31 December 2021
A2 HEUR A2 USD A3 m HEUR A3 m USD E2 HEUR E3 m HEUR H1 m HEUR H1 m USDShares Shares Shares Shares Shares Shares Shares Shares
At beginning of the year . . . . . . . 173,603 305,799 401,404 1,167,763 24,442 144,165 7,740 344Shares issued 142,909 257,085 46,553 314,676 44,966 13,576 10 11Shares redeemed. . . . . . . . . . . (316,512) (562,884) (447,957) (1,482,439) (69,408) (157,741) (7,750) (355)At end of year . . . . . . . . . . . . . – – – – – – – –
I1 m HEUR I1 m USD Z1 s USDShares Shares Shares
At beginning of the year . . . . . . . 1,926 544 52Shares issued 17 16 3Shares redeemed. . . . . . . . . . . (1,943) (560) (55)At end of year . . . . . . . . . . . . . – – –
For the financial year ended 31 December 2020
A2 HEUR A2 USD A3 m HEUR A3 m USD E2 HEUR E3 m HEUR H1 m HEUR H1 m USDShares Shares Shares Shares Shares Shares Shares Shares
At beginning of the year . . . . . . . 104,401 211,457 458,346 886,980 20,912 187,397 48,554 328Shares issued 89,069 188,675 123,303 437,845 10,337 16,255 14 16Shares redeemed. . . . . . . . . . . (19,867) (94,333) (180,245) (157,062) (6,807) (59,487) (40,828) –At end of year . . . . . . . . . . . . . 173,603 305,799 401,404 1,167,763 24,442 144,165 7,740 344
I1 m HEUR I1 m USD Z1 s USDShares Shares Shares
At beginning of the year . . . . . . . 1,902 520 300,049Shares issued 24 24 4Shares redeemed. . . . . . . . . . . – – (300,001)At end of year . . . . . . . . . . . . . 1,926 544 52
Net Asset Comparison
31 December 2021 31 December 2020 31 December 2019
Net Assets (USD)
NAV Per Share
(Local Currency)Net Assets
(USD)
NAV Per Share
(Local Currency)Net Assets
(USD)
NAV Per Share
(Local Currency)
A2 HEUR – – 2,968,756 14.00 1,568,968 13.40A2 USD – – 4,952,992 16.20 3,219,619 15.23A3 m HEUR – – 3,811,328 7.77 4,040,430 7.86A3 m USD – – 10,502,484 8.99 7,921,482 8.93E2 HEUR – – 403,536 13.51 304,908 13.00E3 m HEUR – – 1,389,867 7.89 1,686,057 8.02H1 m HEUR – – 90,940 9.62 520,186 9.55H1 m USD – – 3,597 10.45 3,345 10.19I1 m HEUR – – 22,498 9.56 20,244 9.49I1 m USD – – 5,721 10.52 5,329 10.26Z1 s USD – – 5,296 102.77 29,986,614 99.94
. . .
DocuSign Envelope ID: 521655BF-9BE3-47DC-A9A3-494932954338

271Janus Henderson Capital Funds plc / 31 December 2021
Janus Henderson Global High Yield Fund (continued)
The accompanying notes are an integral part of the financial statements.
Distributions per share (unaudited)
The following table shows the distribution rate per share at Ex-date for each distributing share class :
Share Class (Local Currency) 15/01/2021 12/02/2021 15/03/2021 15/04/2021 14/05/2021 15/06/2021 15/07/2021 13/08/2021 15/09/2021 15/10/2021 15/11/2021 15/12/2021A3 m HEUR 0.03375 0.02868 0.03412 0.03556 0.03288 0.03297 0.02974 0.02729 0.03086 – – –A3 m USD 0.03886 0.03560 0.03922 0.04163 0.03823 0.03812 0.03436 0.03206 0.03595 – – –E3 m HEUR 0.03427 0.03091 0.03461 0.03606 0.03333 0.03340 0.03011 0.02719 0.03122 – – –H1 m HEUR 0.03530 0.03281 0.03682 0.03798 0.03499 0.03458 0.03091 0.02800 0.03176 – – –H1 m USD 0.03875 0.03625 0.03990 0.04193 0.03874 0.03744 0.03263 0.02981 0.03340 – – –I1 m HEUR 0.03269 0.03113 0.03502 0.03600 0.03328 0.03270 0.02919 0.02633 0.02988 – – –I1 m USD 0.03440 0.03454 0.03818 0.04030 0.03658 0.03579 0.03193 0.02888 0.03318 – – –Z1 s USD – 2.75545 – – – – – 2.58872 – – – –
– – – – – – – – – – – –
The Z1s USD class distributes semi-annually.
Fund Performance (unaudited)
As at 31 December 2021
Discrete performance
31/12/2020 08/10/2021
%
31/12/2019 31/12/2020
%
31/12/2018 31/12/2019
%
31/12/2017 31/12/2018
%
31/12/2016 31/12/2017
%
A2 USD (Net) 1.05 6.37 14.08 (5.05) 7.99Bloomberg Barclays Global High Yield TR 1.19 7.03 12.56 (4.06) 10.43
A2 USD (Gross) 2.66 8.50 16.36 (3.15) 10.15Bloomberg Barclays Global High Yield TR + 1.25% 1.30 8.37 13.97 (2.85) 11.81
. . . . .
Class A2 USD is disclosed as it is the representative share class.
Performance target: To outperform the Bloomberg Barclays Global High Yield Index by 1.25% per annum, before the deduction of charges, over any 5 year period.
The Total Expense Ratio includes fees payable to Distributors. Where the Total Expense Ratio exceeds the target outperformance relative to the benchmark the return is likely to be below the benchmark return, even when the Fund’s outperformance target (before the deduction of charges) has been achieved.
Please note the Gross Returns 5 year annualised table is only applicable for share classes which have been active for 5 or more years and the performance target is to be achieved over a specific annualised time period. Performance target and index shown in USD.
Past performance does not guarantee future returns. The rates of return will vary and the principal value of an investment will fluctuate. Shares, if redeemed, may be worth more or less than their original cost. The performance data does not take account of the commissions and costs incurred on the issue and redemption of Shares. All returns are calculated in the base currency of the representative Share Class.
There is no guarantee that the Fund’s performance will match or exceed the benchmark.
DocuSign Envelope ID: 521655BF-9BE3-47DC-A9A3-494932954338

Janus Henderson Capital Funds plc / 31 December 2021272
Janus Henderson Global High Yield Fund (continued)
Statements of Changes in Composition of Portfolio (unaudited)The tables below show a breakdown of material purchases and sales of the Investment Portfolio in accordance with Central Bank UCITS Regulations 79(2) requirements. All purchases and sales of investments exceeding 1% of the total value of each transaction respectively, are disclosed, with a minimum number of 20 of each such transaction. A full analysis of the movement on the Investment Portfolio is available upon request from the registered office.
Major Purchases for the year ended 31 December 2021
Shares or Principal Amount
Cost (USD)
US Treasury Bill, 0.0000%, due 14/10/21 8,422,000 8,421,917Credit Agricole Corporate And Investment Bank, 0.0000%, due 20/8/21 2,900,000 2,899,996Credit Agricole Corporate And Investment Bank, 0.0000%, due 11/8/21 2,800,000 2,799,996Credit Agricole Corporate And Investment Bank, 0.0000%, due 12/8/21 2,800,000 2,799,996Credit Agricole Corporate And Investment Bank, 0.0000%, due 13/8/21 2,800,000 2,799,996Credit Agricole Corporate And Investment Bank, 0.0000%, due 18/8/21 2,800,000 2,799,996Credit Agricole Corporate And Investment Bank, 0.0000%, due 21/7/21 2,800,000 2,799,996Credit Agricole Corporate And Investment Bank, 0.0000%, due 22/7/21 2,800,000 2,799,996Credit Agricole Corporate And Investment Bank, 0.0000%, due 23/7/21 2,800,000 2,799,996Credit Industriel et Commercial, 0.0000%, due 16/7/21 2,800,000 2,799,994Credit Industriel et Commercial, 0.0000%, due 20/7/21 2,800,000 2,799,994Credit Agricole Corporate And Investment Bank, 0.0000%, due 19/7/21 2,800,000 2,799,986Credit Agricole Corporate And Investment Bank, 0.0000%, due 10/8/21 2,700,000 2,699,996Credit Agricole Corporate And Investment Bank, 0.0000%, due 17/8/21 2,700,000 2,699,996Credit Agricole Corporate And Investment Bank, 0.0000%, due 19/8/21 2,700,000 2,699,996Credit Agricole Corporate And Investment Bank, 0.0000%, due 16/8/21 2,700,000 2,699,989Credit Agricole Corporate And Investment Bank, 0.0000%, due 26/7/21 2,700,000 2,699,989Credit Agricole Corporate And Investment Bank, 0.0000%, due 9/8/21 2,700,000 2,699,989Credit Industriel et Commercial, 0.0000%, due 4/8/21 2,600,000 2,599,995Credit Industriel et Commercial, 0.0000%, due 5/8/21 2,600,000 2,599,995
Major Sales for the year ended 31 December 2021
Shares or Principal Amount
Proceeds (USD)
Bank of Ireland Group plc, 7.5000%, due 19/5/25 200,000 280,809First Quantum Minerals Ltd., 7.2500%, due 1/4/23 248,000 252,650Banco BPM SpA, 6.5000%, due 19/1/26 200,000 250,571Allegheny Technologies, Inc., 7.8750%, due 15/8/23 227,000 249,910Banca Monte dei Paschi di Siena SpA, 1.8750%, due 9/1/26 200,000 240,701Electricite de France SA, 2.6250%, due 1/12/27 200,000 233,977Heimstaden AB, 4.3750%, due 6/3/27 200,000 232,242Heimstaden Bostad AB, 2.6250%, due 1/2/27 200,000 230,000DIC Asset AG, 2.2500%, due 22/9/26 200,000 227,752MEDNAX, Inc., 6.2500%, due 15/1/27 211,000 224,792CPI Property Group SA, 3.7500%, due 28/4/28 200,000 224,597Cablevision Lightpath LLC, 5.6300%, due 15/9/28 220,000 222,750Turkiye Sise ve Cam Fabrikalari AS, 6.9500%, due 14/3/26 200,000 220,600Vedanta Resources Finance II plc, 13.8750%, due 21/1/24 200,000 218,000Saipem Finance International BV, 3.1250%, due 31/3/28 180,000 215,471General Electric Co., 3.5300%, due 15/3/22 223,000 212,200Herens Midco SARL, 5.2500%, due 15/5/29 190,000 210,988HTA Group Ltd., 7.0000%, due 18/12/25 200,000 210,250Turkiye Vakiflar Bankasi TAO, 6.5000%, due 8/1/26 200,000 209,790Ford Motor Credit Co. LLC, 3.2500%, due 15/9/25 170,000 209,249
DocuSign Envelope ID: 521655BF-9BE3-47DC-A9A3-494932954338

Janus Henderson Global Investment Grade Bond Fund
273Janus Henderson Capital Funds plc / 31 December 2021
Fund Overview (unaudited)Investment Objective and Policy
The Fund aims to provide a return, from a combination of income and capital growth over the long term.
Performance target: To outperform the Bloomberg Barclays Global Aggregate Corporate Bond Hedged USD Index by 1.25% per annum, before the deduction of charges, over any 5 year period.
The Fund invests at least 80% of its assets in a global portfolio of investment grade (equivalent to BBB rated or higher) corporate bonds, issued by companies and issuers.
The investment manager may use derivatives (complex financial instruments), including total return swaps, with the aim of making investment gains in line with the Fund’s objective, to reduce risk or to manage the Fund more efficiently.
The Fund is actively managed with reference to the Bloomberg Barclays Global Aggregate Corporate Bond Hedged USD Index, which is broadly representative of the bonds in which it may invest, as this forms the basis of the Fund’s performance target. The investment manager has discretion to choose investments for the Fund with weightings different to the index or not in the index, but at times the Fund may hold investments similar to the index.
How Sustainability Risks are part of the investment processThe investments underlying this financial product (referred to as the Fund) do not take into account the EU criteria for environmentally sustainable economic activities, although the Manager and the Investment Manager have agreed a decision making process that will apply to investment decisions relating to the Fund as further detailed in the Prospectus.
The likely impacts of sustainability risks on the returns of the FundWhile the analysis of (Environmental, Social and Governance) ESG factors is an integral component across the Investment Manager’s investment capabilities and one of a number of inputs to the selection of investments and portfolio construction, the investment process of the Investment Manager is primarily designed to maximise long-term risk-adjusted returns for investors. Therefore, in managing the Fund, the Investment Manager does not maximise portfolio alignment with sustainability risks as a separate goal in its own right nor does it precisely attribute the impact of ESG factors on returns for the Fund.
Fund Overview
Michael Keough, James Briggs, Brad Smith and Tim Winstone*, portfolio managers
For the year ended 31 December 2021, the Janus Henderson Global Investment Grade Bond Fund H2 US dollar terms returned -1.39% (Net) and -0.73% (Gross), compared with -0.79% and 0.45% Target (Gross) for the Bloomberg Global Aggregate Corporate Bond Index hedged USD.
Asset allocation was positive through the Fund’s off-benchmark positioning in high-yield names, given the outperformance of high yield relative to investment-grade credit over the year. Our high-yield exposure was expressed predominantly through ‘rising star’ opportunities (high-yield issuers expected to be upgraded to investment grade) in the BB rated space, which we expected to benefit from a growth rebound and looked attractive from a valuation standpoint relative to investment-grade credit.
At the sector level, the overweight to technology was supportive for performance, with Broadcom a prominent contributor. In January, Broadcom came to market with a multi-tranche US dollar deal, where we bought the 20-year and 30-year bonds. The name also benefited from strong earnings and a focus on deleveraging and the diversification of revenue channels, buoyed by technological innovation and the 5G rollout. On the negative side, an underweight to the wirelines sector – one of our largest sector underweights, given regulatory headwinds and price competition – hurt performance, with AT&T exposure a particular drag.
Security selection was positive overall, with an overweight to games manufacturer Hasbro the standout performer. Despite a ratings downgrade (from investment grade to high yield), the company showed continued earnings momentum through the year and progress on deleveraging. Exposure to Medical Properties Trust (MPT), a US hospital real estate investment trust and rising star candidate, helped returns over the year. MPT acquired a portfolio of behavioral health facilities in the UK at the start of the year, and the diversification this provides in tenants and properties generated favorable momentum in the company’s credit ratings.
The largest single-name detractor was an off-benchmark exposure to German property name Adler Real Estate. Exposure to the name weighed on results following news in September related to a parliamentary inquiry from German political party Die Linke and allegations in a short-seller report, which triggered a stop-loss meeting that saw us reduce the overweight.
*As of 1 September 2021 Tim Winstone also managed the Fund.
DocuSign Envelope ID: 521655BF-9BE3-47DC-A9A3-494932954338

Janus Henderson Capital Funds plc / 31 December 2021274
Janus Henderson Global Investment Grade Bond Fund (continued)
Fund Overview (unaudited) (continued)
Duration and curve positioning also detracted. Entering 2021, we anticipated rates would move up as economic growth increased, but we did not expect the large move early in the year before inflation accelerated. As a result, our duration positioning was too long early in the year. As the year progressed, we shortened our duration exposure while rates rallied.
In terms of activity, we reduced our overweight to credit beta through the year, selling down some of our European investment-grade corporate bond exposure and rotating out of bonds where valuations did not compensate for beta or cyclicality risk. Mid-year, we began to increase exposure to banks and reduced exposure to cyclical sectors, particularly at the long end, which were trading flat to historical averages. We maintained exposure to BB rated names that we had identified as rising star candidates, in anticipation of a strong ratings upgrade cycle over the next 18 months.
Our Fund retains a moderate overweight to credit beta, largely expressed through exposure to high yield, where we expect stronger excess returns relative to investment-grade credit in the near term. High-yield defaults expectations for 2022 are historically low. Within high yield, our positioning is largely focused on companies we have identified as rising star candidates, specifically BB rated names with the potential for upgrades to investment-grade status.
The Fund’s credit beta overweight is in acknowledgement of the strong fundamental backdrop, with low default rates, positive upgrade/downgrade ratios and positive company profit margins all supportive for credit markets. Market technicals, however, have weakened due to less accommodative policy from some central banks, with valuations for investment-grade corporates continuing to look tight relative to historical levels. This increases the likelihood of bouts of downside volatility through 2022, which leads us to be cautious. Hence, we have reduced the size of our credit beta overweight. We expect central banks to begin normalizing policy rates in 2022, led by the US Federal Reserve, in an effort to quell inflation that has proved to be higher and more persistent than previously expected.
Looking forward, the main risks to our outlook are inflation remaining persistent over 2022, an uptick in rates volatility, central bank policy error as they look to catch up with the inflation curve, and liquidity withdrawal in the market as some central banks begin to taper. Another risk is a further slowdown in China’s growth and the potential impact on the broader global economy. As we navigate these uncertainties, we will continue to adhere to our research-driven investment process with a focus on taking the right amount of risk throughout the cycle.
Thank you for investing in Janus Henderson Global Investment Grade Bond Fund.
January 2022
DocuSign Envelope ID: 521655BF-9BE3-47DC-A9A3-494932954338

275Janus Henderson Capital Funds plc / 31 December 2021
The accompanying notes are an integral part of the financial statements.
Janus Henderson Global Investment Grade Bond Fund (continued)s
Statement of Financial PositionAs of
31 December 2021
(USD)
As of 31 December
2020 (USD)
Assets:Financial assets at fair value through profit or loss . . . . . . . . . . . . . . . . . . . . . . . . . . . . . . . . . . . . . . . . . . . . . . . . . . . . . . . 333,671,986 365,354,909Cash and foreign currency . . . . . . . . . . . . . . . . . . . . . . . . . . . . . . . . . . . . . . . . . . . . . . . . . . . . . . . . . . . . . . . . . . . . . . . 9,453,825 9,548,283Receivables:
Investments sold . . . . . . . . . . . . . . . . . . . . . . . . . . . . . . . . . . . . . . . . . . . . . . . . . . . . . . . . . . . . . . . . . . . . . . . . . . . . 1,421,855 3,487,743Spot foreign exchange contracts awaiting settlement . . . . . . . . . . . . . . . . . . . . . . . . . . . . . . . . . . . . . . . . . . . . . . . . . . . . 43 4,178Funds shares sold . . . . . . . . . . . . . . . . . . . . . . . . . . . . . . . . . . . . . . . . . . . . . . . . . . . . . . . . . . . . . . . . . . . . . . . . . . . 228 179,924Interest . . . . . . . . . . . . . . . . . . . . . . . . . . . . . . . . . . . . . . . . . . . . . . . . . . . . . . . . . . . . . . . . . . . . . . . . . . . . . . . . . . . 2,106,914 2,633,484
Receivable from Investment Manager . . . . . . . . . . . . . . . . . . . . . . . . . . . . . . . . . . . . . . . . . . . . . . . . . . . . . . . . . . . . . . . . 19,493 37,920Other debtors . . . . . . . . . . . . . . . . . . . . . . . . . . . . . . . . . . . . . . . . . . . . . . . . . . . . . . . . . . . . . . . . . . . . . . . . . . . . . . . . 1,650 1,650
Total Assets . . . . . . . . . . . . . . . . . . . . . . . . . . . . . . . . . . . . . . . . . . . . . . . . . . . . . . . . . . . . . . . . . . . . . . . . . 346,675,994 381,248,091 Liabilities (amounts falling due within one year)Payables:
Financial liabilities at fair value through profit or loss . . . . . . . . . . . . . . . . . . . . . . . . . . . . . . . . . . . . . . . . . . . . . . . . . . . . 474,741 1,784,334Bank overdraft and foreign currency . . . . . . . . . . . . . . . . . . . . . . . . . . . . . . . . . . . . . . . . . . . . . . . . . . . . . . . . . . . . . . . – 94Investments purchased . . . . . . . . . . . . . . . . . . . . . . . . . . . . . . . . . . . . . . . . . . . . . . . . . . . . . . . . . . . . . . . . . . . . . . . . 9,821,527 10,957,652Fund shares repurchased . . . . . . . . . . . . . . . . . . . . . . . . . . . . . . . . . . . . . . . . . . . . . . . . . . . . . . . . . . . . . . . . . . . . . . 715,093 18,815Investment Management fees . . . . . . . . . . . . . . . . . . . . . . . . . . . . . . . . . . . . . . . . . . . . . . . . . . . . . . . . . . . . . . . . . . . 11,629 8,883Shareholder Service fees . . . . . . . . . . . . . . . . . . . . . . . . . . . . . . . . . . . . . . . . . . . . . . . . . . . . . . . . . . . . . . . . . . . . . . 2,505 3,769Accounting, Administration and Transfer Agent fees . . . . . . . . . . . . . . . . . . . . . . . . . . . . . . . . . . . . . . . . . . . . . . . . . . . . 30,895 –Management fees . . . . . . . . . . . . . . . . . . . . . . . . . . . . . . . . . . . . . . . . . . . . . . . . . . . . . . . . . . . . . . . . . . . . . . . . . . . 2,057 2,004Accrued expenses . . . . . . . . . . . . . . . . . . . . . . . . . . . . . . . . . . . . . . . . . . . . . . . . . . . . . . . . . . . . . . . . . . . . . . . . . . . 86,052 62,003
Total Liabilities (excluding Net Assets attributable to holders of redeemable ordinary shares) . . . . . . . . . . . . 11,144,499 12,837,554 Net Assets attributable to holders of redeemable ordinary participating shares . . . . . . . . . . . . . . . . . . . . . . 335,531,495 368,410,537
.
DocuSign Envelope ID: 521655BF-9BE3-47DC-A9A3-494932954338

Janus Henderson Capital Funds plc / 31 December 2021276
Janus Henderson Global Investment Grade Bond Fund (continued)
The accompanying notes are an integral part of the financial statements.
Statement of Comprehensive IncomeYear ended
31 December 2021
(USD)
Year ended 31 December
2020 (USD)
Year ended Year endedRevenue:Interest income . . . . . . . . . . . . . . . . . . . . . . . . . . . . . . . . . . . . . . . . . . . . . . . . . . . . . . . . . . . . . . . . . . . . . . . . . . . . . . . 7,679,842 4,523,435Other income . . . . . . . . . . . . . . . . . . . . . . . . . . . . . . . . . . . . . . . . . . . . . . . . . . . . . . . . . . . . . . . . . . . . . . . . . . . . . . . . 142 1,650
Net (loss)/gain on financial assets and liabilities at fair value through profit or loss . . . . . . . . . . . . . . . . . . . . . . . . . . . . . . . . . . (38,338,153) 23,421,189 Total Investments (Loss)/Income . . . . . . . . . . . . . . . . . . . . . . . . . . . . . . . . . . . . . . . . . . . . . . . . . . . . . . . . . . (30,658,169) 27,946,274
Expenses:Investment Management fees . . . . . . . . . . . . . . . . . . . . . . . . . . . . . . . . . . . . . . . . . . . . . . . . . . . . . . . . . . . . . . . . . . . . . 123,935 103,444Shareholder Service fees . . . . . . . . . . . . . . . . . . . . . . . . . . . . . . . . . . . . . . . . . . . . . . . . . . . . . . . . . . . . . . . . . . . . . . . . 39,684 42,756Management fees . . . . . . . . . . . . . . . . . . . . . . . . . . . . . . . . . . . . . . . . . . . . . . . . . . . . . . . . . . . . . . . . . . . . . . . . . . . . . 25,530 12,484Accounting, Administration and Transfer Agent fees . . . . . . . . . . . . . . . . . . . . . . . . . . . . . . . . . . . . . . . . . . . . . . . . . . . . . . 165,765 29,217Custodian fees . . . . . . . . . . . . . . . . . . . . . . . . . . . . . . . . . . . . . . . . . . . . . . . . . . . . . . . . . . . . . . . . . . . . . . . . . . . . . . . 60,582 57,900Audit fees . . . . . . . . . . . . . . . . . . . . . . . . . . . . . . . . . . . . . . . . . . . . . . . . . . . . . . . . . . . . . . . . . . . . . . . . . . . . . . . . . . 23,431 29,699Printing expenses . . . . . . . . . . . . . . . . . . . . . . . . . . . . . . . . . . . . . . . . . . . . . . . . . . . . . . . . . . . . . . . . . . . . . . . . . . . . . 6,085 7,639Legal and other professional fees . . . . . . . . . . . . . . . . . . . . . . . . . . . . . . . . . . . . . . . . . . . . . . . . . . . . . . . . . . . . . . . . . . 49,304 40,511Other fees . . . . . . . . . . . . . . . . . . . . . . . . . . . . . . . . . . . . . . . . . . . . . . . . . . . . . . . . . . . . . . . . . . . . . . . . . . . . . . . . . . 32,699 19,570
Total Expenses . . . . . . . . . . . . . . . . . . . . . . . . . . . . . . . . . . . . . . . . . . . . . . . . . . . . . . . . . . . . . . . . . . . . . . . 527,015 343,220Less Expense Reimbursement . . . . . . . . . . . . . . . . . . . . . . . . . . . . . . . . . . . . . . . . . . . . . . . . . . . . . . . . . . . (334,105) (174,798)Net Expenses after Expense Reimbursement . . . . . . . . . . . . . . . . . . . . . . . . . . . . . . . . . . . . . . . . . . . . . . . . 192,910 168,422Net Operating (Loss)/Profit . . . . . . . . . . . . . . . . . . . . . . . . . . . . . . . . . . . . . . . . . . . . . . . . . . . . . . . . . . . . . . (30,851,079) 27,777,852
Finance Costs: 7,307,774 5,218,110
Total distributions to holders of redeemable ordinary shares. . . . . . . . . . . . . . . . . . . . . . . . . . . . . . . . . . . . . . . . . . . . . . . . . (7,307,774) (5,218,110) Withholding tax on dividends and other investment income . . . . . . . . . . . . . . . . . . . . . . . . . . . . . . . . . . . . . (119,953) (53,122)
Net (Decrease)/Increase in Net Assets attributable to holders of redeemable ordinary shares resulting from operations . . . . . . . . . . . . . . . . . . . . . . . . . . . . . . . . . . . . . . . . . . . . . . . . . . . . . . . . . . . . . . . . . . . . . . . . . . . (38,278,806) 22,506,620
. .
. .. . .
Statement of Changes in Net Assets Attributable to Redeemable Ordinary ShareholdersYear ended
31 December 2021
(USD)
Year ended 31 December
2020 (USD)
(Decrease)/Increase in Net Assets attributable to holders of redeemable ordinary shares resulting from operations . . . . . . . . . . . . (38,278,806) 22,506,620
Capital Share Transactions of redeemable ordinary shares:Proceeds from redeemable ordinary shares sold . . . . . . . . . . . . . . . . . . . . . . . . . . . . . . . . . . . . . . . . . . . . . . . . . . . . . . . 26,789,061 317,449,720Redemption of redeemable ordinary shares . . . . . . . . . . . . . . . . . . . . . . . . . . . . . . . . . . . . . . . . . . . . . . . . . . . . . . . . . . (21,403,370) (14,895,778)Dilution Adjustment. . . . . . . . . . . . . . . . . . . . . . . . . . . . . . . . . . . . . . . . . . . . . . . . . . . . . . . . . . . . . . . . . . . . . . . . . . . 14,073 280,870
Net Increase from Capital Share Transactions of redeemable ordinary shares . . . . . . . . . . . . . . . . . . . . . . . . 5,399,764 302,834,812
Net (Decrease)/Increase in Net Assets attributable to holders of redeemable ordinary shares . . . . . . . . . . . . . . . . . . . . . . . . . . . (32,879,042) 325,341,432Net Assets attributable to holders of redeemable ordinary shares at the beginning of the financial year . . . . . . . . . . . . . . . . . . . . 368,410,537 43,069,105
Net Assets attributable to holders of redeemable ordinary shares at the end of the financial year . . . . . . . . . 335,531,495 368,410,537
Gains and losses are solely from continuing operations except for the Funds which ceased operations during the financial year ended 31 December 2021 or 31 December 2020. There were no gains and losses other than those dealt with in the Statement of Comprehensive Income. Please refer to note 1 which details the Fund closures during the year.
DocuSign Envelope ID: 521655BF-9BE3-47DC-A9A3-494932954338

277Janus Henderson Capital Funds plc / 31 December 2021
Janus Henderson Global Investment Grade Bond Fund (continued)
Portfolio Investments
The accompanying notes are an integral part of the financial statements.
Shares or Principal Amount
Percentage of Net Assets
(%)Fair Value
(USD)
Financial Assets at fair value through profit or lossAsset-Backed/Commercial Mortgage-Backed Securities (2020: 0.94% USD 3,454,317)
1,534,675 DB Master Finance LLC, 4.3520%, due 20/5/49 0.49 1,629,542
307,523 Domino's Pizza Master Issuer LLC, 3.6680%, due 25/10/49 0.10 324,124
48,125 Domino's Pizza Master Issuer LLC, 4.1180%, due 25/7/47 0.01 50,460
99,910 Domino's Pizza Master Issuer LLC, 4.3280%, due 25/7/48 0.03 104,988
72,520 Planet Fitness Master Issuer LLC, 3.8580%, due 5/12/49 0.02 74,373
1,384,000 Taco Bell Funding LLC, 1.9460%, due 25/8/51 0.40 1,343,904
98,440 Wendy's Funding LLC, 3.7830%, due 15/6/49 0.03 101,826
1,064,650 Wingstop Funding LLC, 2.8410%, due 5/12/50 0.32 1,078,544
Total Asset-Backed/Commercial Mortgage-Backed Securities 1.40 4,707,761
Corporate Bonds (2020: 95.07% USD 350,241,315)AustraliaBanks
1,080,000 National Australia Bank Ltd., 2.9900%, due 21/5/31 0.32 1,084,273
BelgiumBanks
1,500,000 Argenta Spaarbank NV, 1.0000%, due 13/10/26 0.52 1,742,190
Health Care Providers & Services800,000 Lonza Finance International NV,
1.6250%, due 21/4/27 0.29 971,209
CanadaOil, Gas & Consumable Fuels
937,000 TransCanada PipeLines Ltd., 4.1000%, due 15/4/30 0.31 1,046,312
646,000 TransCanada PipeLines Ltd., 5.1000%, due 15/3/49 0.25 853,492
0.56 1,899,804
FranceBanks
1,965,000 BNP Paribas SA, 2.8190%, due 19/11/25 0.60 2,023,394
2,200,000 BNP Paribas SA, 0.2500%, due 13/4/27 0.74 2,477,922
330,000 BNP Paribas SA, 3.0520%, due 13/1/31 0.10 339,816
1,813,000 BNP Paribas SA, 2.5880%, due 12/8/35 0.52 1,738,914
331,000 Credit Agricole SA, 4.3750%, due 17/3/25 0.11 355,985
412,000 Credit Agricole SA, 3.2500%, due 14/1/30 0.13 427,073
1,365,000 Societe Generale SA, 2.6250%, due 22/1/25 0.42 1,400,448
1,500,000 Societe Generale SA, 0.1250%, due 24/2/26 0.51 1,701,723
3.13 10,465,275
Electric Utilities1,300,000 Electricite de France SA, 1.0000%, due
29/11/33 0.44 1,469,638
Shares or Principal Amount
Percentage of Net Assets
(%)Fair Value
(USD)
1,300,000 RTE Reseau de Transport d'Electricite
SADIR, 0.6250%, due 8/7/32 0.44 1,463,2940.88 2,932,932
Thrifts & Mortgage Finance1,200,000 BPCE SA, 1.5000%, due 13/1/42 0.40 1,357,454
Water Utilities1,530,000 Holding d'Infrastructures des Metiers
de l'Environnement, 0.6250%, due 16/9/28 0.51 1,706,769
GermanyAuto Components
100,000 Schaeffler AG, 2.8750%, due 26/3/27 0.04 123,6411,200,000 Schaeffler AG, 3.3750%, due 12/10/28 0.45 1,524,713
0.49 1,648,354
Consumer Finance580,000 Volkswagen Financial Services AG,
3.3750%, due 6/4/28 0.23 768,1981,180,000 Volkswagen Leasing GmbH, 0.3750%,
due 20/7/26 0.40 1,341,4970.63 2,109,695
Real Estate Management & Development1,000,000 HOWOGE Wohnungs-baugesellschaft
mbH, 1.1250%, due 1/11/33 0.34 1,153,609
Textiles, Apparel & Luxury Goods800,000 adidas AG, 0.6250%, due 10/9/35 0.27 895,816
GuernseyDiversified Financial Services
1,000,000 Pershing Square Holdings Ltd., 1.3750%, due 1/10/27 0.33 1,121,426
1,800,000 Pershing Square Holdings Ltd., 3.2500%, due 1/10/31 0.54 1,805,465
0.87 2,926,891
Real Estate Management & Development1,100,000 Sirius Real Estate Ltd., 1.7500%, due
24/11/28 0.37 1,243,219
IrelandConsumer Finance
1,113,000 AerCap Ireland Capital DAC, 4.6250%, due 15/10/27 0.37 1,232,149
443,000 AerCap Ireland Capital DAC, 3.0000%, due 29/10/28 0.13 449,609
454,000 AerCap Ireland Capital DAC, 3.3000%, due 30/1/32 0.14 462,903
333,000 AerCap Ireland Capital DAC, 3.4000%, due 29/10/33 0.10 339,447
253,000 AerCap Ireland Capital DAC, 3.8500%, due 29/10/41 0.08 263,998
0.82 2,748,106
Industrial Conglomerates689,000 GE Capital International Funding Co.
Unlimited Co., 4.4180%, due 15/11/35 0.25 823,356
ItalyTransportation Infrastructure
880,000 ASTM SpA, 1.0000%, due 25/11/26 0.30 1,005,6052,000,000 Autostrade per l'Italia SpA, 2.0000%,
due 4/12/28 0.70 2,362,6271.00 3,368,232
DocuSign Envelope ID: 521655BF-9BE3-47DC-A9A3-494932954338

Janus Henderson Capital Funds plc / 31 December 2021278
The accompanying notes are an integral part of the financial statements.
Janus Henderson Global Investment Grade Bond Fund (continued)
Portfolio Investments
Shares or Principal Amount
Percentage of Net Assets
(%)Fair Value
(USD)
JapanPharmaceuticals
1,780,000 Takeda Pharmaceutical Co. Ltd., 1.3750%, due 9/7/32 0.63 2,106,657
508,000 Takeda Pharmaceutical Co. Ltd., 3.0250%, due 9/7/40 0.15 518,032
0.78 2,624,689
LuxembourgDiversified Financial Services
1,230,000 Bevco Lux SARL, 1.0000%, due 16/1/30 0.41 1,374,773
Real Estate Management & Development1,100,000 Aroundtown SA, 0.3750%, due 15/4/27 0.36 1,223,319810,000 CPI Property Group SA, 1.5000%, due
27/1/31 0.26 886,1410.62 2,109,460
NetherlandsAutomobiles
1,660,000 Stellantis NV, 0.7500%, due 18/1/29 0.56 1,867,639
Building Products910,000 Danfoss Finance I BV, 0.3750%, due
28/10/28 0.30 1,020,277
Commercial Services & Supplies1,500,000 SGS Nederland Holding BV, 0.1250%,
due 21/4/27 0.51 1,695,656
Construction & Engineering1,200,000 ABB Finance BV, due 19/1/30 0.39 1,314,958
Diversified Financial Services480,000 Lseg Netherlands BV, 0.2500%, due
6/4/28 0.16 542,007
Electric Utilities1,430,000 Enel Finance International NV,
0.8750%, due 28/9/34 0.48 1,597,452
Food Products1,976,000 Mondelez International Holdings
Netherlands BV, 2.2500%, due 19/9/24 0.60 2,021,4101,070,000 Viterra Finance BV, 1.0000%, due
24/9/28 0.36 1,199,5620.96 3,220,972
Health Care Equipment & Supplies1,610,000 Thermo Fisher Scientific Finance I BV,
0.8000%, due 18/10/30 0.55 1,846,817
Pharmaceuticals401,000 Teva Pharmaceutical Finance
Netherlands III BV, 4.7500%, due 9/5/27 0.12 397,840
512,000 Teva Pharmaceutical Finance Netherlands III BV, 5.1250%, due 9/5/29 0.15 502,810
0.27 900,650
Real Estate Management & Development1,180,000 VIA Outlets BV, 1.7500%, due 15/11/28 0.40 1,342,719
South KoreaSemiconductors & Semiconductor Equipment
1,267,000 SK Hynix, Inc., 1.5000%, due 19/1/26 0.37 1,240,703880,000 SK Hynix, Inc., 2.3750%, due 19/1/31 0.25 847,948
0.62 2,088,651
Shares or Principal Amount
Percentage of Net Assets
(%)Fair Value
(USD)
SpainBanks
1,800,000 Banco Santander SA, 2.7490%, due 3/12/30 0.53 1,763,525
Construction & Engineering1,100,000 Cellnex Finance Co. SA, 1.2500%, due
15/1/29 0.36 1,196,177
SupranationalFood Products
2,160,000 JBS USA LUX SA, 6.7500%, due 15/2/28 0.70 2,333,750
1,261,000 JBS USA LUX SA, 6.5000%, due 15/4/29 0.41 1,389,231
1.11 3,722,981
Semiconductors & Semiconductor Equipment950,000 NXP BV, 2.5000%, due 11/5/31 0.28 953,344
SwedenBanks
1,246,000 Svenska Handelsbanken AB, 0.5500%, due 11/6/24 0.37 1,229,283
2,330,000 Svenska Handelsbanken AB, 0.0500%, due 6/9/28 0.77 2,591,083
1.14 3,820,366
Machinery620,000 Sandvik AB, 0.3750%, due 25/11/28 0.21 699,279
Real Estate Management & Development1,480,000 Heimstaden Bostad AB, 3.6250%, due
13/10/26 0.50 1,677,000670,000 Heimstaden Bostad AB, 3.0000%, due
29/10/27 0.22 729,7430.72 2,406,743
SwitzerlandCapital Markets
1,470,000 Credit Suisse Group AG, 0.6250%, due 18/1/33 0.47 1,562,624
2,809,000 UBS Group AG, 1.0080%, due 30/7/24 0.83 2,801,0591,426,000 UBS Group AG, 1.3640%, due 30/1/27 0.42 1,394,470
1.72 5,758,153
United KingdomBanks
1,205,000 HSBC Holdings plc, 1.6450%, due 18/4/26 0.36 1,195,952
2,677,000 HSBC Holdings plc, 1.5890%, due 24/5/27 0.78 2,619,506
508,000 HSBC Holdings plc, 4.9500%, due 31/3/30 0.18 596,678
659,000 HSBC Holdings plc, 2.3570%, due 18/8/31 0.19 644,555
710,000 Lloyds Banking Group plc, 1.9850%, due 15/12/31 0.28 946,240
1,010,000 NatWest Group plc, 2.1050%, due 28/11/31 0.40 1,345,498
770,000 NatWest Group plc, 1.0430%, due 14/9/32 0.26 864,948
775,000 NatWest Group plc, 3.0320%, due 28/11/35 0.23 765,610
2.68 8,978,987
Diversified Consumer Services1,600,000 RAC Bond Co. plc, 4.8700%, due
6/5/46 0.70 2,349,461
DocuSign Envelope ID: 521655BF-9BE3-47DC-A9A3-494932954338

279Janus Henderson Capital Funds plc / 31 December 2021
The accompanying notes are an integral part of the financial statements.
Janus Henderson Global Investment Grade Bond Fund (continued)
Portfolio Investments
Shares or Principal Amount
Percentage of Net Assets
(%)Fair Value
(USD)
Equity Real Estate Investment Trusts (REITs)
1,570,000 Workspace Group plc, 2.2500%, due 11/3/28 0.63 2,102,197
Hotels, Restaurants & Leisure590,000 InterContinental Hotels Group plc,
3.3750%, due 8/10/28 0.25 838,543
Pharmaceuticals474,000 Royalty Pharma plc, 2.1500%, due
2/9/31 0.13 448,2681,793,000 Royalty Pharma plc, 3.5500%, due
2/9/50 0.53 1,781,9140.66 2,230,182
Real Estate Management & Development1,510,000 Annington Funding plc, 2.3080%, due
6/10/32 0.60 2,015,2122,190,000 Canary Wharf Group Investment
Holdings plc, 3.3750%, due 23/4/28 0.89 3,000,8831.49 5,016,095
Road & Rail540,000 Motability Operations Group plc,
0.1250%, due 20/7/28 0.18 602,738
Thrifts & Mortgage Finance1,020,000 Yorkshire Building Society, 1.5000%,
due 15/9/29 0.40 1,339,446
United StatesAerospace & Defense
2,515,000 Boeing Co. (The), 4.5080%, due 1/5/23 0.78 2,627,5781,018,000 Boeing Co. (The), 4.8750%, due 1/5/25 0.33 1,114,629839,000 Boeing Co. (The), 3.6250%, due 1/2/31 0.27 895,731722,000 Boeing Co. (The), 5.7050%, due 1/5/40 0.28 928,681831,000 Boeing Co. (The), 3.5000%, due 1/3/45 0.24 809,459
1,377,000 Leidos, Inc., 4.3750%, due 15/5/30 0.46 1,536,1192.36 7,912,197
Air Freight & Logistics1,148,000 GXO Logistics, Inc., 1.6500%, due
15/7/26 0.33 1,121,3611,637,000 United Parcel Service, Inc., 2.5000%,
due 1/4/23 0.50 1,669,9970.83 2,791,358
Banks1,652,000 Bank of America Corp., 6.1000%, due
17/3/25 0.53 1,791,5033,423,000 Bank of America Corp., 4.4500%, due
3/3/26 1.12 3,772,237703,000 Bank of America Corp., 3.5590%, due
23/4/27 0.22 752,174752,000 Bank of America Corp., 4.1830%, due
25/11/27 0.25 823,347605,000 Bank of America Corp., 3.4190%, due
20/12/28 0.19 646,3491,213,000 Bank of America Corp., 2.5720%, due
20/10/32 0.36 1,219,7102,633,000 Citigroup, Inc., 2.8760%, due 24/7/23 0.79 2,664,9861,978,000 Citigroup, Inc., 1.6009%, due 1/9/23 0.59 1,993,0091,260,000 Citigroup, Inc., 3.8870%, due 10/1/28 0.41 1,366,785
778,000 Citizens Financial Group, Inc., 2.6380%, due 30/9/32 0.23 769,770
2,246,000 JPMorgan Chase & Co., 3.8750%, due 10/9/24 0.71 2,383,718
3,726,000 JPMorgan Chase & Co., 2.0830%, due 22/4/26 1.13 3,784,609
Shares or Principal Amount
Percentage of Net Assets
(%)Fair Value
(USD)
471,000 JPMorgan Chase & Co., 2.7390%, due
15/10/30 0.14 484,4321,556,000 SVB Financial Group, 3.1250%, due
5/6/30 0.49 1,634,8541,722,000 SVB Financial Group, 4.1000%, due
15/2/31 0.51 1,711,6682,497,000 US Bancorp, 1.4500%, due 12/5/25 0.75 2,509,1761,007,000 US Bancorp, 2.4910%, due 3/11/36 0.30 1,004,232
8.72 29,312,559
Beverages387,000 Anheuser-Busch InBev Worldwide, Inc.,
3.5000%, due 1/6/30 0.13 424,6361,145,000 Anheuser-Busch InBev Worldwide, Inc.,
5.5500%, due 23/1/49 0.47 1,587,882243,000 Keurig Dr Pepper, Inc., 3.8000%, due
1/5/50 0.08 269,8160.68 2,282,334
Biotechnology2,442,000 AbbVie, Inc., 2.6000%, due 21/11/24 0.76 2,535,385
519,000 AbbVie, Inc., 4.0500%, due 21/11/39 0.18 596,6330.94 3,132,018
Capital Markets836,000 Ares Capital Corp., 3.2000%, due
15/11/31 0.25 822,8541,670,000 Bank of New York Mellon Corp. (The),
4.7000%, due 20/9/25 0.53 1,785,6481,965,000 Charles Schwab Corp. (The), 5.3750%,
due 1/6/25 0.64 2,146,7631,789,000 Charles Schwab Corp. (The), 4.0000%,
due 1/12/30 0.54 1,809,126882,000 Goldman Sachs Group, Inc. (The),
3.7500%, due 25/2/26 0.28 950,7152,123,000 Goldman Sachs Group, Inc. (The),
3.5000%, due 16/11/26 0.67 2,263,6653,285,000 Morgan Stanley, 3.9500%, due 23/4/27 1.08 3,619,1812,656,000 Morgan Stanley, 2.4840%, due 16/9/36 0.76 2,560,400
892,000 Nasdaq, Inc., 3.2500%, due 28/4/50 0.27 909,5461,401,000 Owl Rock Capital Corp. III, 3.1250%,
due 13/4/27 0.41 1,370,7511,849,000 State Street Corp., 3.0310%, due
1/11/34 0.57 1,927,7966.00 20,166,445
Chemicals2,073,000 CF Industries, Inc., 4.9500%, due
1/6/43 0.75 2,505,359728,000 Sherwin-Williams Co. (The), 3.4500%,
due 1/6/27 0.23 788,2030.98 3,293,562
Construction & Engineering2,640,000 Worley US Finance Sub Ltd., 0.8750%,
due 9/6/26 0.90 3,017,212
Diversified Financial Services1,870,000 Blackstone Private Credit Fund,
1.7500%, due 30/11/26 0.63 2,111,1301,530,000 Computershare US, Inc., 1.1250%, due
7/10/31 0.50 1,689,8151.13 3,800,945
Diversified Telecommunication Services538,000 Verizon Communications, Inc.,
4.0160%, due 3/12/29 0.18 603,766908,000 Verizon Communications, Inc.,
4.2720%, due 15/1/36 0.32 1,066,914
DocuSign Envelope ID: 521655BF-9BE3-47DC-A9A3-494932954338

Janus Henderson Capital Funds plc / 31 December 2021280
The accompanying notes are an integral part of the financial statements.
Janus Henderson Global Investment Grade Bond Fund (continued)
Portfolio Investments
Shares or Principal Amount
Percentage of Net Assets
(%)Fair Value
(USD)
930,000 Verizon Communications, Inc.,
2.8500%, due 3/9/41 0.27 919,291561,000 Verizon Communications, Inc.,
4.0000%, due 22/3/50 0.19 645,8850.96 3,235,856
Electric Utilities1,029,000 Duquesne Light Holdings, Inc.,
2.7750%, due 7/1/32 0.30 1,018,288679,000 IPALCO Enterprises, Inc., 4.2500%,
due 1/5/30 0.22 746,7971,272,000 NextEra Energy Capital Holdings, Inc.,
1.8750%, due 15/1/27 0.38 1,280,320784,000 PPL Capital Funding, Inc., 3.1000%,
due 15/5/26 0.24 822,4651.14 3,867,870
Electronic Equipment, Instruments & Components346,000 Allegion US Holding Co., Inc.,
3.2000%, due 1/10/24 0.11 360,0531,569,000 Trimble, Inc., 4.1500%, due 15/6/23 0.49 1,632,344
0.60 1,992,397
Entertainment701,000 Activision Blizzard, Inc., 4.5000%, due
15/6/47 0.25 842,921
Equity Real Estate Investment Trusts (REITs)543,000 Alexandria Real Estate Equities, Inc.,
2.7500%, due 15/12/29 0.17 560,641417,000 American Homes 4 Rent LP, 2.3750%,
due 15/7/31 0.12 409,412751,000 American Homes 4 Rent LP, 3.3750%,
due 15/7/51 0.23 756,419684,000 Broadstone Net Lease LLC, 2.6000%,
due 15/9/31 0.20 664,690214,000 Equinix, Inc., 2.6250%, due 18/11/24 0.07 220,645239,000 Equinix, Inc., 2.9000%, due 18/11/26 0.07 247,762
42,000 GLP Capital LP, 5.3750%, due 15/4/26 0.01 46,8257,000 GLP Capital LP, 5.3000%, due 15/1/29 0.00 7,956
1,396,000 GLP Capital LP, 4.0000%, due 15/1/31 0.44 1,491,521427,000 GLP Capital LP, 3.2500%, due 15/1/32 0.13 429,995698,000 Invitation Homes Operating Partnership
LP, 2.0000%, due 15/8/31 0.20 658,0561,649,000 Iron Mountain Information Management
Services, Inc., 5.0000%, due 15/7/32 0.50 1,690,9421,170,000 Mid-America Apartments LP, 2.8750%,
due 15/9/51 0.34 1,155,9161,000,000 MPT Operating Partnership LP,
3.3750%, due 24/4/30 0.41 1,384,4942,319,000 Omega Healthcare Investors, Inc.,
3.2500%, due 15/4/33 0.67 2,263,080812,000 Rexford Industrial Realty LP, 2.1250%,
due 1/12/30 0.23 772,268832,000 Sun Communities Operating LP,
2.7000%, due 15/7/31 0.25 826,1431,741,000 WP Carey, Inc., 2.4500%, due 1/2/32 0.51 1,700,391
4.55 15,287,156
Food & Staples Retailing780,000 Sysco Corp., 4.5000%, due 1/4/46 0.27 910,313840,000 Sysco Corp., 3.3000%, due 15/2/50 0.25 853,035429,000 Sysco Corp., 6.6000%, due 1/4/50 0.20 668,033
0.72 2,431,381
Food Products1,754,000 General Mills, Inc., 2.2500%, due
14/10/31 0.52 1,735,089
Shares or Principal Amount
Percentage of Net Assets
(%)Fair Value
(USD)
510,000 Kraft Heinz Foods Co., 4.8750%, due
1/10/49 0.19 641,8820.71 2,376,971
Health Care Equipment & Supplies318,000 Boston Scientific Corp., 3.7500%, due
1/3/26 0.10 341,942561,000 Boston Scientific Corp., 4.5500%, due
1/3/39 0.20 672,326679,000 Boston Scientific Corp., 4.7000%, due
1/3/49 0.26 862,2290.56 1,876,497
Health Care Providers & Services845,000 Centene Corp., 2.4500%, due 15/7/28 0.25 833,626
2,104,000 Centene Corp., 3.0000%, due 15/10/30 0.64 2,142,377296,000 Cigna Corp., 3.2000%, due 15/3/40 0.09 307,287526,000 Cigna Corp., 3.4000%, due 15/3/50 0.16 547,471595,000 CVS Health Corp., 3.2500%, due
15/8/29 0.19 635,023848,000 CVS Health Corp., 4.7800%, due
25/3/38 0.31 1,034,051473,000 CVS Health Corp., 2.7000%, due
21/8/40 0.14 456,5882,161,000 HCA, Inc., 5.3750%, due 1/2/25 0.71 2,377,748508,000 HCA, Inc., 3.5000%, due 1/9/30 0.16 537,909154,000 HCA, Inc., 5.5000%, due 15/6/47 0.06 201,999231,000 HCA, Inc., 5.2500%, due 15/6/49 0.09 297,237
1,303,000 HCA, Inc., 3.5000%, due 15/7/51 0.40 1,331,4931,219,000 Universal Health Services, Inc.,
1.6500%, due 1/9/26 0.36 1,197,754598,000 Universal Health Services, Inc.,
2.6500%, due 15/1/32 0.18 588,3063.74 12,488,869
Household Durables1,019,000 NVR, Inc., 3.0000%, due 15/5/30 0.32 1,059,986
Industrial Conglomerates130,000 General Electric Co., 3.5327%, due
15/3/22 0.04 129,350
Insurance872,000 Athene Global Funding, 1.7300%, due
2/10/26 0.26 856,3691,390,000 Athene Global Funding, 1.7500%, due
24/11/27 0.55 1,857,2161,745,000 Athene Global Funding, 2.6460%, due
4/10/31 0.51 1,725,617497,000 Brown & Brown, Inc., 4.5000%, due
15/3/29 0.17 560,0881,195,000 Prudential Financial, Inc., 3.7000%,
due 1/10/50 0.36 1,210,2231.85 6,209,513
IT Services1,349,000 Broadridge Financial Solutions, Inc.,
2.6000%, due 1/5/31 0.40 1,355,488653,000 Fidelity National Information Services,
Inc., 1.6500%, due 1/3/28 0.19 632,712363,000 Fiserv, Inc., 3.2000%, due 1/7/26 0.11 384,215450,000 Fiserv, Inc., 3.5000%, due 1/7/29 0.14 484,423815,000 Fiserv, Inc., 4.4000%, due 1/7/49 0.29 973,448
2,092,000 Global Payments, Inc., 1.2000%, due 1/3/26 0.61 2,032,576
892,000 PayPal Holdings, Inc., 1.3500%, due 1/6/23 0.27 899,539
2.01 6,762,401
DocuSign Envelope ID: 521655BF-9BE3-47DC-A9A3-494932954338

281Janus Henderson Capital Funds plc / 31 December 2021
The accompanying notes are an integral part of the financial statements.
Janus Henderson Global Investment Grade Bond Fund (continued)
Portfolio Investments
Shares or Principal Amount
Percentage of Net Assets
(%)Fair Value
(USD)
Leisure Products
878,000 Brunswick Corp., 0.8500%, due 18/8/24 0.26 865,969
923,000 Hasbro, Inc., 3.9000%, due 19/11/29 0.30 1,018,699566,000 Hasbro, Inc., 6.3500%, due 15/3/40 0.23 783,762267,000 Hasbro, Inc., 5.1000%, due 15/5/44 0.10 333,088
0.89 3,001,518
Life Sciences Tools & Services941,000 Agilent Technologies, Inc., 2.7500%,
due 15/9/29 0.29 972,444
Machinery1,670,000 Daimler Trucks Finance North America
LLC, 2.3750%, due 14/12/28 0.50 1,678,967460,000 Westinghouse Air Brake Technologies
Corp., 4.3750%, due 15/8/23 0.14 478,394599,000 Westinghouse Air Brake Technologies
Corp., 4.9500%, due 15/9/28 0.20 681,4740.84 2,838,835
Media303,000 Charter Communications Operating
LLC, 5.3750%, due 1/5/47 0.11 362,4761,137,000 Charter Communications Operating
LLC, 4.8000%, due 1/3/50 0.38 1,276,146699,000 Interpublic Group of Cos., Inc. (The),
4.6500%, due 1/10/28 0.24 802,2400.73 2,440,862
Metals & Mining335,000 Reliance Steel & Aluminum Co.,
4.5000%, due 15/4/23 0.10 346,853
Multi-Utilities1,144,000 CMS Energy Corp., 4.7500%, due
1/6/50 0.37 1,246,960764,000 Dominion Energy, Inc., 4.3500%, due
15/1/27 0.24 790,740747,000 Dominion Energy, Inc., 4.7000%, due
1/12/44 0.28 924,9630.89 2,962,663
Oil, Gas & Consumable Fuels899,000 Cheniere Energy Partners LP, 4.0000%,
due 1/3/31 0.28 944,296846,000 Cheniere Energy Partners LP, 3.2500%,
due 31/1/32 0.25 856,152891,000 Energy Transfer LP, 3.7500%, due
15/5/30 0.28 945,166535,000 Energy Transfer LP, 5.0000%, due
15/5/50 0.18 617,120623,000 Enterprise Products Operating LLC,
3.1250%, due 31/7/29 0.20 662,2311,372,000 Enterprise Products Operating LLC,
4.2000%, due 31/1/50 0.46 1,542,0071,243,000 EQT Corp., 3.1250%, due 15/5/26 0.38 1,277,512
572,000 NGPL PipeCo LLC, 7.7680%, due 15/12/37 0.24 803,471
644,000 ONEOK, Inc., 6.3500%, due 15/1/31 0.24 809,459942,000 Southwestern Energy Co., 4.7500%,
due 1/2/32 0.30 993,8481,137,000 Transcontinental Gas Pipe Line Co.
LLC, 3.2500%, due 15/5/30 0.36 1,199,7521,321,000 Transcontinental Gas Pipe Line Co.
LLC, 3.9500%, due 15/5/50 0.44 1,483,8253.61 12,134,839
Shares or Principal Amount
Percentage of Net Assets
(%)Fair Value
(USD)
Pharmaceuticals
889,000 Johnson & Johnson, 2.1000%, due 1/9/40 0.25 843,096
1,057,000 Mylan, Inc., 4.5500%, due 15/4/28 0.35 1,184,115575,000 Mylan, Inc., 5.2000%, due 15/4/48 0.21 713,53482,000 Viatris, Inc., 1.6500%, due 22/6/25 0.02 81,755
0.83 2,822,500
Professional Services668,000 Equifax, Inc., 2.6000%, due 1/12/24 0.21 690,980418,000 Equifax, Inc., 7.0000%, due 1/7/37 0.18 595,696860,000 Verisk Analytics, Inc., 4.0000%, due
15/6/25 0.28 924,745400,000 Verisk Analytics, Inc., 5.5000%, due
15/6/45 0.16 539,9390.83 2,751,360
Road & Rail882,000 Norfolk Southern Corp., 2.3000%, due
15/5/31 0.26 887,359
Semiconductors & Semiconductor Equipment614,000 Broadcom, Inc., 4.3000%, due 15/11/32 0.21 690,911
1,460,000 Broadcom, Inc., 3.4690%, due 15/4/34 0.46 1,530,073517,000 Marvell Technology, Inc., 1.6500%, due
15/4/26 0.15 511,587677,000 Marvell Technology, Inc., 2.4500%, due
15/4/28 0.20 687,1421,862,000 Microchip Technology, Inc., 2.6700%,
due 1/9/23 0.57 1,902,3531,225,000 Micron Technology, Inc., 2.7030%, due
15/4/32 0.37 1,228,504542,000 Qorvo, Inc., 1.7500%, due 15/12/24 0.16 542,920484,000 Skyworks Solutions, Inc., 1.8000%,
due 1/6/26 0.14 479,596310,000 Skyworks Solutions, Inc., 3.0000%,
due 1/6/31 0.09 312,7922.35 7,885,878
Software1,741,000 Autodesk, Inc., 2.4000%, due 15/12/31 0.52 1,737,9001,141,000 Cadence Design Systems, Inc.,
4.3750%, due 15/10/24 0.37 1,227,361752,000 Fortinet, Inc., 1.0000%, due 15/3/26 0.22 729,135477,000 Fortinet, Inc., 2.2000%, due 15/3/31 0.14 467,330333,000 Intuit, Inc., 0.9500%, due 15/7/25 0.10 328,483260,000 Intuit, Inc., 1.3500%, due 15/7/27 0.08 254,456624,000 ServiceNow, Inc., 1.4000%, due 1/9/30 0.17 581,540867,000 VMware, Inc., 0.6000%, due 15/8/23 0.26 861,233867,000 VMware, Inc., 1.0000%, due 15/8/24 0.26 859,131
1,783,000 VMware, Inc., 4.7000%, due 15/5/30 0.62 2,077,3902.74 9,123,959
Specialty Retail927,000 AutoZone, Inc., 4.0000%, due 15/4/30 0.31 1,038,298805,000 AutoZone, Inc., 1.6500%, due 15/1/31 0.23 758,546
1,586,000 Home Depot, Inc. (The), 3.7500%, due 15/2/24 0.50 1,672,483
2,630,000 Lithia Motors, Inc., 3.8750%, due 1/6/29 0.80 2,689,241
394,000 Lowe's Cos., Inc., 4.5500%, due 5/4/49 0.15 495,867712,000 O'Reilly Automotive, Inc., 3.6000%,
due 1/9/27 0.23 770,14116,000 O'Reilly Automotive, Inc., 4.3500%,
due 1/6/28 0.01 18,063659,000 O'Reilly Automotive, Inc., 3.9000%,
due 1/6/29 0.22 728,263
DocuSign Envelope ID: 521655BF-9BE3-47DC-A9A3-494932954338

Janus Henderson Capital Funds plc / 31 December 2021282
The accompanying notes are an integral part of the financial statements.
Janus Henderson Global Investment Grade Bond Fund (continued)
Portfolio Investments
Shares or Principal Amount
Percentage of Net Assets
(%)Fair Value
(USD)
663,000 Ross Stores, Inc., 0.8750%, due
15/4/26 0.19 643,268742,000 Ross Stores, Inc., 1.8750%, due 15/4/31 0.21 712,310
2.85 9,526,480
Thrifts & Mortgage Finance1,333,000 Rocket Mortgage LLC, 2.8750%, due
15/10/26 0.39 1,324,7891,773,000 Rocket Mortgage LLC, 4.0000%, due
15/10/33 0.54 1,798,5130.93 3,123,302
Trading Companies & Distributors677,000 Air Lease Corp., 1.8750%, due 15/8/26 0.20 666,490335,000 Air Lease Corp., 3.0000%, due 1/2/30 0.10 334,737
0.30 1,001,227
Wireless Telecommunication Services2,191,000 T-Mobile USA, Inc., 3.5000%, due
15/4/25 0.69 2,322,9061,843,000 T-Mobile USA, Inc., 3.7500%, due
15/4/27 0.59 1,996,708519,000 T-Mobile USA, Inc., 4.3750%, due
15/4/40 0.18 594,279364,000 T-Mobile USA, Inc., 4.5000%, due
15/4/50 0.13 426,6411.59 5,340,534
Virgin Islands, BritishSemiconductors & Semiconductor Equipment
879,000 TSMC Global Ltd., 1.2500%, due 23/4/26 0.26 861,855
Total Corporate Bonds 92.00 308,694,387
Government Obligations (2020: 2.19% USD 8,080,624)US Treasury Notes/Bonds
2,100,000 0.0000%, due 15/8/31 0.73 2,434,1434,000,000 0.2500%, due 31/7/31 1.51 5,059,6671,367,000 1.7500%, due 15/8/41 0.39 1,325,7761,462,000 2.0000%, due 15/11/41 0.44 1,479,1334,570,000 2.0000%, due 15/8/51 1.39 4,659,9721,000,000 0.0000%, due 4/1/22 0.30 1,000,001
Total Government Obligations 4.76 15,958,692
Tranche Loans (2020: 0.00% USD –)United StatesHealth Care Equipment & Supplies
2,372,264 Mozart Borrower LP, 3.7500%, due 23/10/28 0.71 2,374,410
Software1,166,078 Realpage, Inc., 3.7500%, due 24/4/28 0.35 1,164,078
Total Tranche Loans 1.06 3,538,488
Total Investments (Cost: USD 334,714,444) 99.22 332,899,328
Shares or Principal Amount
Percentage of Net Assets
(%)Fair Value
(USD)
Forward Currency Contracts (2020: 0.97% USD 3,578,653)Open as at 31 December 2021.
Current Market
Percentage of Net Unrealised
Currency Currency Value Settle Assets GainPurchased Sold (USD) Date (%) (USD)
.Bank of America EUR 2,229,304 USD 2,505,622 2,540,542 22-Feb-22 0.01 34,920
GBP 759,269 USD 1,023,905 1,027,515 22-Feb-22 0.00 3,610
Citibank EUR 449,000 USD 508,902 511,686 22-Feb-22 0.00 2,784
HSBC EUR 1,573,811 USD 1,775,736 1,793,535 22-Feb-22 0.01 17,799
GBP 2,626,439 USD 3,547,492 3,554,344 22-Feb-22 0.00 6,852
USD 702,129 EUR 616,082 702,094 22-Feb-22 0.00 35
J.P. Morgan EUR◊ 4,288,634 USD 4,821,119 4,885,334 31-Jan-22 0.01 64,215
EUR 1,494,963 USD 1,685,951 1,703,678 22-Feb-22 0.01 17,727
JPY◊ 26,302,994,758 USD 228,087,135 228,711,851 31-Jan-22 0.19 624,716
Total 0.23 772,658
.
Total Financial Assets at fair value through profit or loss 99.45 333,671,986
Financial Liabilities at fair value through profit or loss.Forward Currency Contracts (2020: (0.48)% USD (1,784,334))Open as at 31 December 2021
Current Market
Percentage of Net Unrealised
Currency Currency Value Settle Assets LossPurchased Sold (USD) Date (%) (USD)
Bank of America USD 584,855 GBP 439,022 594,127 22-Feb-22 0.00 (9,272)
Citibank USD 59,035,412 EUR 52,027,285 59,290,935 22-Feb-22 (0.08) (255,523)
HSBC USD 5,584,173 EUR 4,949,899 5,640,967 22-Feb-22 (0.02) (56,794)
USD 5,043,304 GBP 3,783,616 5,120,345 22-Feb-22 (0.03) (77,041)
J.P. Morgan USD◊ 224,874 EUR 198,879 226,550 31-Jan-22 0.00 (1,676)
USD 1,236,319 EUR 1,090,133 1,242,329 22-Feb-22 0.00 (6,010)
USD 21,356,381 GBP 15,822,402 21,412,360 22-Feb-22 (0.02) (55,979)
Morgan Stanley USD 1,557,500 EUR 1,377,615 1,569,946 22-Feb-22 0.00 (12,446)
Total (0.15) (474,741).
Total Financial Liabilities at fair value through profit or loss (0.15) (474,741)
Portfolio Analysis (Unaudited)
Analysis of Total Assets:% of Total
AssetsTransferable securities admitted to official stock exchange listing 57.61Transferable securities dealt in on another regulated market 38.42OTC financial derivative instruments 0.22Other Assets 3.75Total Assets 100.00
◊ These forward currency contracts are used for share class hedging.
DocuSign Envelope ID: 521655BF-9BE3-47DC-A9A3-494932954338

283Janus Henderson Capital Funds plc / 31 December 2021
The accompanying notes are an integral part of the financial statements.
Janus Henderson Global Investment Grade Bond Fund (continued)
Fair Value Hierarchy
The tables below provide the fair value hierarchy summary of the Fund’s financial assets and liabilities measured at fair value at 31 December 2021 and 31 December 2020.
31 December 2021
Level 1 - Quoted Prices
(USD)
Level 2 - Other Significant
Observable Inputs (USD)
Level 3 - Significant
Unobservable Inputs (USD)
Total (USD)
Asset-Backed/Commercial Mortgage-Backed Securities – 4,707,761 – 4,707,761Corporate Bonds – 308,694,387 – 308,694,387Forward Currency Contracts – 297,917 – 297,917Government Obligations – 15,958,692 – 15,958,692Tranche Loans – 3,538,488 – 3,538,488Total Investments in Securities – 333,197,245 – 333,197,245
31 December 2020
Level 1 - Quoted Prices
(USD)
Level 2 - Other Significant
Observable Inputs (USD)
Level 3 - Significant
Unobservable Inputs (USD)
Total (USD)
Asset-Backed/Commercial Mortgage-Backed Securities – 3,454,317 – 3,454,317Corporate Bonds – 350,241,315 – 350,241,315Forward Currency Contracts – 1,794,319 – 1,794,319Government Obligations – 8,080,624 – 8,080,624Total Investments in Securities – 363,570,575 – 363,570,575
There were transfers on Government Obligations from level 1 to level 2 during the financial year ended 31 December 2020.
There were no investments held by the Fund at 31 December 2021 and 31 December 2020 that were fair valued at level 3 by the Janus Henderson Global Pricing Committee.
Valuation policy of private placements is referenced in note 2 of the financial statements.
Capital Share Transactions
For the financial year ended 31 December 2021
A2 HEUR A2 USD A3m HEUR A3m USD E2 HEUR E3m HEUR H1m USD H2 USDShares Shares Shares Shares Shares Shares Shares Shares
At beginning of the year . . . . . . . 237,431 202,771 163,441 203,379 34,343 64,569 320 300Shares issued 108,818 60,581 5,549 16,758 4,238 10,428 5 –Shares redeemed. . . . . . . . . . . (187,093) (110,580) (84,573) (57,849) (30,332) (11,311) – –At end of year . . . . . . . . . . . . . 159,156 152,772 84,417 162,288 8,249 63,686 325 300
I1m HEUR I1m USD I2 HEUR I2 USD I3m USD Z1 HJPY Z1 USDShares Shares Shares Shares Shares Shares Shares
At beginning of the year . . . . . . . 413 53,116 1,146 527,136 301 2,509,852 709,000Shares issued 7 82,247 68,619 1,441,324 8 1 1Shares redeemed. . . . . . . . . . . – (60,630) (492) (872,145) – (1) (10,289)At end of year . . . . . . . . . . . . . 420 74,733 69,273 1,096,315 309 2,509,852 698,712
DocuSign Envelope ID: 521655BF-9BE3-47DC-A9A3-494932954338

Janus Henderson Capital Funds plc / 31 December 2021284
Janus Henderson Global Investment Grade Bond Fund (continued)
The accompanying notes are an integral part of the financial statements.
For the financial year ended 31 December 2020
A2 HEUR A2 USD A3m HEUR A3m USD E2 HEUR E3m HEUR H1m USD H2 USDShares Shares Shares Shares Shares Shares Shares Shares
At beginning of the year . . . . . . . 25,493 84,129 77,098 219,736 7,516 27,699 314 300Shares issued 271,385 349,890 115,081 42,661 30,120 43,636 6 –Shares redeemed. . . . . . . . . . . (59,447) (231,248) (28,738) (59,018) (3,293) (6,766) – –At end of year . . . . . . . . . . . . . 237,431 202,771 163,441 203,379 34,343 64,569 320 300
I1m HEUR I1m USD I2 HEUR I2 USD I3m USD Z1 HJPY Z1 USDShares Shares Shares Shares Shares Shares Shares
At beginning of the year . . . . . . . 405 2,364 1,168 434,305 – – 300,041Shares issued 8 53,728 7,573 580,771 301 2,509,852 428,377Shares redeemed. . . . . . . . . . . – (2,976) (7,595) (487,940) – – (19,418)At end of year . . . . . . . . . . . . . 413 53,116 1,146 527,136 301 2,509,852 709,000
Net Asset Comparison
31 December 2021 31 December 2020 31 December 2019
Net Assets (USD)
NAV Per Share
(Local Currency)Net Assets
(USD)
NAV Per Share
(Local Currency)Net Assets
(USD)
NAV Per Share
(Local Currency)
A2 HEUR 2,158,633 11.91 3,528,759 12.17 317,992 11.12A2 USD 2,095,587 13.72 2,837,946 14.00 1,058,889 12.59A3m HEUR 816,923 8.50 1,789,643 8.96 729,631 8.44A3m USD 1,601,409 9.87 2,098,603 10.32 2,099,146 9.55E2 HEUR 102,976 10.96 474,219 11.30 87,423 10.37E3m HEUR 587,751 8.11 676,123 8.57 251,423 8.09H1m USD 3,622 11.14 3,672 11.46 3,277 10.42H2 USD 3,622 12.07 3,672 12.24 3,277 10.92I1m HEUR 4,826 10.09 5,295 10.49 4,409 9.70I1m USD 878,575 11.76 642,680 12.10 26,000 11.00I2 HEUR 984,271 12.48 17,860 12.76 15,153 11.57I2 USD 16,980,892 15.49 8,272,590 15.69 6,076,848 13.99I3m USD 3,027 9.80 3,067 10.19 – –Z1 HJPY 228,754,526 10,484.14 263,920,976 10,858.00 – –Z1 USD 80,554,855 115.29 84,135,432 118.67 32,395,637 107.97
. . .
Total Expense Ratio (unaudited)
The Average Total Expense Ratio table shows the actual expenses, excluding transactions costs and trade commissions, incurred by each Class for the Fund during the reporting financial year expressed as a percentage of the average net assets for the corresponding year, on an annualised basis.
31 December 2021 31 December 2020 31 December 2019A2 HEUR 1.17% 1.20% 2.00%A2 USD 1.16% 1.43% 2.00%A3m HEUR 1.16% 1.36% 2.00%A3m USD 1.15% 1.45% 2.00%E2 HEUR 1.33% 1.56% 2.34%E3m HEUR 1.36% 1.62% 2.34%H1m USD 0.57% 0.69% 0.85%H2 USD 0.57% 0.69% 0.85%I1m HEUR 0.60% 0.60% 0.85%I1m USD 0.59% 0.60% 0.85%I2 HEUR 0.60% 0.57% 0.85%I2 USD 0.60% 0.59% 0.85%I3m USD 0.60% 0.49% –
DocuSign Envelope ID: 521655BF-9BE3-47DC-A9A3-494932954338

285Janus Henderson Capital Funds plc / 31 December 2021
Janus Henderson Global Investment Grade Bond Fund (continued)
The accompanying notes are an integral part of the financial statements.
Distributions per share (unaudited)
The following table shows the distribution rate per share at Ex-date for each distributing share class :
Share Class (Local Currency) 15/01/2021 12/02/2021 15/03/2021 15/04/2021 14/05/2021 15/06/2021 15/07/2021 13/08/2021 15/09/2021 15/10/2021 15/11/2021 15/12/2021A3m HEUR 0.02096 0.01866 0.02180 0.01941 0.01760 0.01891 0.01784 0.01664 0.01895 0.01519 0.01767 0.01921A3m USD 0.02401 0.02155 0.02493 0.02261 0.02036 0.02174 0.02051 0.01913 0.02196 0.01988 0.02021 0.02216E3m HEUR 0.02004 0.01784 0.02084 0.01856 0.01682 0.01806 0.01704 0.01589 0.01810 0.01643 0.01686 0.01833H1m USD 0.01356 0.01510 0.01872 0.01505 0.00929 0.01340 0.01330 0.01148 0.01336 0.01264 0.01404 0.01655I1m HEUR 0.02056 0.01361 0.01683 0.01342 0.01051 0.01362 0.01318 0.01193 0.01335 0.01229 0.01331 0.01458I1m USD 0.01739 0.01522 0.01882 0.01524 0.01327 0.01546 0.01483 0.01357 0.01544 0.01403 0.01511 0.01686I3m USD 0.02357 0.02126 0.02442 0.02212 0.02009 0.02149 0.02017 0.01911 0.02182 0.01960 0.02004 0.02204Z1 HJPY – – – – – – – – – 244.62968 – –Z1 USD – – – – – – – – – 2.53081 – –
– – – – – – – – – – – –
The Z1 HJPY and Z1 USD share class distributes annually.
Fund Performance (unaudited)
As at 31 December 2021
One year Three years Five yearsSince
inception
Performance (Annualised) 31/12/2020 31/12/2021
%
31/12/2017 31/12/2021
%
31/12/2015 31/12/2021
%
to 31/12/2021
%
H2 USD (Net)* (1.39) 6.70 4.59 2.88Bloomberg Barclays Global Agg Corp Bond Hgd USD (0.79) 6.35 4.82 3.61
Five years 31/12/2015 31/12/2021
%H2 USD (Gross)* 6.38Bloomberg Barclays Global Agg Corp Bond Hgd USD + 1.25% 6.13
.
Discrete performance
31/12/2020 31/12/2021
%
31/12/2019 31/12/2020
%
31/12/2018 31/12/2019
%
31/12/2017 31/12/2018
%
31/12/2016 31/12/2017
%
H2 USD (Net)* (1.39) 11.20** 11.32** (4.48)** 7.83**Bloomberg Barclays Global Agg Corp Bond Hgd USD (0.79) 8.26 11.99 (3.57) 9.09
H2 USD (Gross)* (0.73) 13.43** 13.54** (2.57)** 9.98**Bloomberg Barclays Global Agg Corp Bond Hgd USD + 1.25% 0.45 9.62 13.39 (2.36) 10.45
. . . . .
Class H2 USD is disclosed as it is the representative share class.
* The representative share class has changed from the A2 USD to the H2 USD share class with effect from August 2021.
** Historical figures are based on the A2 USD share class.
Performance target: To outperform the Bloomberg Barclays Global Aggregate Corporate Bond Hedged USD Index by 1.25% per annum, before the deduction of charges, over any 5 year period.
Please note the Gross Returns 5 year annualised table is only applicable for share classes which have been active for 5 or more years and the performance target is to be achieved over a specific annualised time period. Performance target and index shown in USD.
Past performance does not guarantee future returns. The rates of return will vary and the principal value of an investment will fluctuate. Shares, if redeemed, may be worth more or less than their original cost. The performance data does not take account of the commissions and costs incurred on the issue and redemption of Shares. All returns are calculated in the base currency of the representative Share Class.
There is no guarantee that the Fund’s performance will match or exceed the benchmark.
DocuSign Envelope ID: 521655BF-9BE3-47DC-A9A3-494932954338

Janus Henderson Capital Funds plc / 31 December 2021286
Janus Henderson Global Investment Grade Bond Fund (continued)
Statements of Changes in Composition of Portfolio (unaudited)The tables below show a breakdown of material purchases and sales of the Investment Portfolio in accordance with Central Bank UCITS Regulations 79(2) requirements. All purchases and sales of investments exceeding 1% of the total value of each transaction respectively, are disclosed, with a minimum number of 20 of each such transaction. A full analysis of the movement on the Investment Portfolio is available upon request from the registered office.
Major Purchases for the year ended 31 December 2021
Shares or Principal Amount
Cost (USD)
Credit Agricole Corporate And Investment Bank, 0.0000%, due 30/3/21 34,000,000 33,999,953Credit Agricole Corporate And Investment Bank, 0.0000%, due 19/3/21 33,300,000 33,299,954Credit Agricole Corporate And Investment Bank, 0.0000%, due 18/3/21 32,100,000 32,099,955Credit Agricole Corporate And Investment Bank, 0.0000%, due 7/4/21 32,000,000 31,999,956Credit Agricole Corporate And Investment Bank, 0.0000%, due 6/4/21 30,900,000 30,899,957Credit Agricole Corporate And Investment Bank, 0.0000%, due 5/4/21 30,700,000 30,699,829Credit Agricole Corporate And Investment Bank, 0.0000%, due 8/4/21 29,200,000 29,199,959Credit Agricole Corporate And Investment Bank, 0.0000%, due 22/3/21 29,100,000 29,099,879Credit Agricole Corporate And Investment Bank, 0.0000%, due 23/3/21 28,300,000 28,299,961Credit Agricole Corporate And Investment Bank, 0.0000%, due 29/3/21 27,700,000 27,699,885Credit Agricole Corporate And Investment Bank, 0.0000%, due 26/3/21 26,800,000 26,799,963Credit Agricole Corporate And Investment Bank, 0.0000%, due 24/3/21 26,700,000 26,699,963Credit Industriel et Commercial, 0.0000%, due 8/6/21 26,000,000 25,999,971Credit Industriel et Commercial, 0.0000%, due 9/6/21 25,700,000 25,699,971Credit Agricole Corporate And Investment Bank, 0.0000%, due 25/3/21 25,300,000 25,299,965Credit Agricole Corporate And Investment Bank, 0.0000%, due 29/11/21 24,400,000 24,399,898Credit Agricole Corporate And Investment Bank, 0.0000%, due 9/4/21 24,200,000 24,199,966Credit Agricole Corporate And Investment Bank, 0.0000%, due 12/4/21 24,000,000 23,999,900Credit Agricole Corporate And Investment Bank, 0.0000%, due 30/11/21 23,100,000 23,099,968Credit Industriel et Commercial, 0.0000%, due 10/6/21 22,500,000 22,499,975
Major Sales for the year ended 31 December 2021
Shares or Principal Amount
Proceeds (USD)
US Treasury, 1.3800%, due 15/11/31 14,092,900 13,969,332US Treasury, 0.1300%, due 30/4/23 11,451,000 11,433,665US Treasury, 0.3800%, due 31/10/23 10,533,000 10,478,685US Treasury, 1.6250%, due 15/5/31 9,060,000 9,251,032US Treasury, 1.2500%, due 30/11/26 7,146,000 7,151,898Bundesschatzanweisungen, 0.0000%, due 10/3/23 5,300,000 6,531,448US Treasury Bill, 0.0000%, due 4/1/22 6,500,000 6,499,958US Treasury, 0.1300%, due 30/6/23 5,200,000 5,185,817UK Treasury, 4.7500%, due 7/12/30 2,100,000 4,010,320MPT Operating Partnership LP, 3.5000%, due 15/3/31 3,875,000 3,933,636US Treasury, 0.7500%, due 30/4/26 3,659,000 3,613,927JPMorgan Chase & Co., 2.9600%, due 13/5/31 3,513,000 3,582,593UK Treasury, 0.2500%, due 31/7/31 2,800,000 3,542,580JPMorgan Chase & Co., 0.9910%, due 28/4/26 2,640,000 3,529,267US Treasury, 0.1300%, due 31/8/23 3,527,000 3,506,906Avantor Funding, Inc., 3.8750%, due 1/11/29 3,461,000 3,465,087Heimstaden Bostad AB, 2.6250%, due 1/2/27 2,820,000 3,296,194Goldman Sachs Group, Inc. (The), 1.0000%, due 18/3/33 2,600,000 3,116,874Banque Federative du Credit Mutuel SA, 0.0100%, due 11/5/26 2,600,000 3,005,463Nationwide Building Society, 0.2500%, due 22/7/25 2,420,000 2,912,970
DocuSign Envelope ID: 521655BF-9BE3-47DC-A9A3-494932954338

Janus Henderson High Yield Fund*
287Janus Henderson Capital Funds plc / 31 December 2021
Fund Overview (unaudited)Investment Objective and Policy
The Fund aims to provide a high income with the potential for some capital growth over the long term.
Performance target: To outperform the Bloomberg Barclays US Corporate High Yield Bond Index by 1.25% per annum, before the deduction of charges, over any 5 year period.
The Fund invests at least 80% of its assets in US high yield (non-investment grade, equivalent to BB+ rated or lower) corporate bonds, issued by companies or any other type of issuer.
The Fund is actively managed with reference to the Bloomberg Barclays US Corporate High Yield Bond Index, which is broadly representative of the bonds in which it may invest, as this forms the basis of the Fund’s performance target. The investment manager has discretion to choose investments for the Fund with weightings different to the index or not in the index, but at times the Fund may hold investments similar to the index.
How Sustainability Risks are part of the investment processThe investments underlying this financial product (referred to as the Fund) do not take into account the EU criteria for environmentally sustainable economic activities, although the Manager and the Investment Manager have agreed a decision making process that will apply to investment decisions relating to the Fund as further detailed in the Prospectus.
The likely impacts of sustainability risks on the returns of the FundWhile the analysis of (Environmental, Social and Governance) ESG factors is an integral component across the Investment Manager’s investment capabilities and one of a number of inputs to the selection of investments and portfolio construction, the investment process of the Investment Manager is primarily designed to maximise long-term risk-adjusted returns for investors. Therefore, in managing the Fund, the Investment Manager does not maximise portfolio alignment with sustainability risks as a separate goal in its own right nor does it precisely attribute the impact of ESG factors on returns for the Fund.
Fund Overview
Seth Meyer and Brent Olson, portfolio managers
For the year ended 31 December 2021, the Janus Henderson High Yield Fund H2 US dollar terms returned 5.61 % (Net) and 6.28% (Gross), compared with 5.28% and 6.59% Target (Gross) for the Bloomberg US Corporate High-Yield Bond Index.
At the start of the year, we had a favorable view on the US economy and believed the US Federal Reserve (Fed) was likely to remain accommodative, which would benefit high-yield bonds. We added significant exposure to the BB rated segment of the market, seeking to identify individual names that we thought had the potential to be ‘rising stars’ – securities that, in our view, could see sufficient rating improvement to push them into the investment-grade market in the years ahead. We also took profits and trimmed our overweights in CCC and CC rated segment after strong performance early in the year.
Later in the year, we trimmed our exposure – in aggregate – to BB rated bonds as tighter spreads provided less of an income cushion in the event US Treasury yields rose significantly. We increased our allocations to the lower-rated single B rated segment of the market on the expectation these securities had greater potential for capital appreciation while likely to exhibit less sensitivity to rising interest rates.
While the Fund’s relative performance was aided by strong security selection overall, particularly in the BB rated segment of the market, security selection within the food and beverage and metals and mining sectors ultimately detracted. Our underweight to the typically lower-quality issuers in the oil field services sector also weighed on results – we prefer to leverage our equity and equity-like exposure to match the index’s level of risk in this area.
On a single-name basis, our position in Bally’s was a noteworthy detractor as the gaming sector struggled at times, driven lower by uncertainties about the COVID-19 Delta and Omicron variants. The company’s strategic investment in online gaming in the US also raised investor concerns. A convertible position in analytics services company Clarivate was another notable detractor. Market sentiment around Clarivate wavered when the US Federal Trade Commission requested additional information pertaining to the company’s intended acquisition of ProQuest. Our modest cash position also detracted; cash is not used as a strategy within the Fund but is a residual of our investment process.
Positioning in independent energy, health care and automotive issues aided results. Within independent energy, bonds of Great Western Petroleum were additive to incremental returns. We had expected the company to refinance bonds maturing in 2021, which it did, and our position was tendered at par. A position in medical device manufacturer Boston Scientific also performed well as operating rooms reopened during the year, enabling previously postponed surgeries to take place. Our asset allocation decisions, including the Fund’s exposure to equity and equity-like securities as well as bank loans, also proved beneficial.
*The Global High Yield Fund merged into the High Yield Fund on 08 October 2021.
DocuSign Envelope ID: 521655BF-9BE3-47DC-A9A3-494932954338

Janus Henderson Capital Funds plc / 31 December 2021288
Janus Henderson High Yield Fund* (continued)
Fund Overview (unaudited) (continued)
Although periods of volatility should be expected given the uncertainties around the outlook for inflation, the path of interest rate hikes and the impact of COVID-19 variants, we expect high-yield bonds to continue to offer compelling risk-adjusted returns in a low-yield, rising-rate environment. Sustained, even if moderate, economic growth combined with a still-accommodative Fed and relatively few near-term maturities should provide support to the asset class in the quarters ahead. Additionally, as absolute yield levels remain high relative to government and other investment-grade markets, high-yield bonds may provide an attractive income cushion to help absorb any volatility in US Treasuries.
Thank you for investing in Janus Henderson High Yield Fund.
January 2022
DocuSign Envelope ID: 521655BF-9BE3-47DC-A9A3-494932954338

289Janus Henderson Capital Funds plc / 31 December 2021
The accompanying notes are an integral part of the financial statements.
Janus Henderson High Yield Fund (continued)
s
Statement of Financial PositionAs of
31 December 2021
(USD)
As of 31 December
2020 (USD)
Assets:Financial assets at fair value through profit or loss . . . . . . . . . . . . . . . . . . . . . . . . . . . . . . . . . . . . . . . . . . . . . . . . . . . . . . . 547,916,555 464,568,214Cash and foreign currency . . . . . . . . . . . . . . . . . . . . . . . . . . . . . . . . . . . . . . . . . . . . . . . . . . . . . . . . . . . . . . . . . . . . . . . 14,842,502 22,371,882Collateral cash . . . . . . . . . . . . . . . . . . . . . . . . . . . . . . . . . . . . . . . . . . . . . . . . . . . . . . . . . . . . . . . . . . . . . . . . . . . . . . . 99,979 711,000Receivables:
Investments sold . . . . . . . . . . . . . . . . . . . . . . . . . . . . . . . . . . . . . . . . . . . . . . . . . . . . . . . . . . . . . . . . . . . . . . . . . . . . 2,264,061 2,780,701Spot foreign exchange contracts awaiting settlement . . . . . . . . . . . . . . . . . . . . . . . . . . . . . . . . . . . . . . . . . . . . . . . . . . . . 335 –Funds shares sold . . . . . . . . . . . . . . . . . . . . . . . . . . . . . . . . . . . . . . . . . . . . . . . . . . . . . . . . . . . . . . . . . . . . . . . . . . . 220,089 2,617,592Interest . . . . . . . . . . . . . . . . . . . . . . . . . . . . . . . . . . . . . . . . . . . . . . . . . . . . . . . . . . . . . . . . . . . . . . . . . . . . . . . . . . . 7,524,465 7,367,955
Receivable from Investment Manager . . . . . . . . . . . . . . . . . . . . . . . . . . . . . . . . . . . . . . . . . . . . . . . . . . . . . . . . . . . . . . . . 13,922 9,571
Total Assets . . . . . . . . . . . . . . . . . . . . . . . . . . . . . . . . . . . . . . . . . . . . . . . . . . . . . . . . . . . . . . . . . . . . . . . . . 572,881,908 500,426,915 Liabilities (amounts falling due within one year)Payables:
Financial liabilities at fair value through profit or loss . . . . . . . . . . . . . . . . . . . . . . . . . . . . . . . . . . . . . . . . . . . . . . . . . . . . 7,902 15,887Bank overdraft and foreign currency . . . . . . . . . . . . . . . . . . . . . . . . . . . . . . . . . . . . . . . . . . . . . . . . . . . . . . . . . . . . . . . 4 –Margin cash . . . . . . . . . . . . . . . . . . . . . . . . . . . . . . . . . . . . . . . . . . . . . . . . . . . . . . . . . . . . . . . . . . . . . . . . . . . . . . . 78,343 504,476Investments purchased . . . . . . . . . . . . . . . . . . . . . . . . . . . . . . . . . . . . . . . . . . . . . . . . . . . . . . . . . . . . . . . . . . . . . . . . 6,696,040 6,190,672Spot foreign exchange contracts awaiting payment . . . . . . . . . . . . . . . . . . . . . . . . . . . . . . . . . . . . . . . . . . . . . . . . . . . . . – 19Fund shares repurchased . . . . . . . . . . . . . . . . . . . . . . . . . . . . . . . . . . . . . . . . . . . . . . . . . . . . . . . . . . . . . . . . . . . . . . 751,700 268,716Investment Management fees . . . . . . . . . . . . . . . . . . . . . . . . . . . . . . . . . . . . . . . . . . . . . . . . . . . . . . . . . . . . . . . . . . . 323,887 271,777Shareholder Service fees . . . . . . . . . . . . . . . . . . . . . . . . . . . . . . . . . . . . . . . . . . . . . . . . . . . . . . . . . . . . . . . . . . . . . . 96,051 81,220Distribution fees . . . . . . . . . . . . . . . . . . . . . . . . . . . . . . . . . . . . . . . . . . . . . . . . . . . . . . . . . . . . . . . . . . . . . . . . . . . . . 18,929 22,647Accounting, Administration and Transfer Agent fees . . . . . . . . . . . . . . . . . . . . . . . . . . . . . . . . . . . . . . . . . . . . . . . . . . . . 84,253 82,955Management fees . . . . . . . . . . . . . . . . . . . . . . . . . . . . . . . . . . . . . . . . . . . . . . . . . . . . . . . . . . . . . . . . . . . . . . . . . . . 10,938 9,217Accrued expenses . . . . . . . . . . . . . . . . . . . . . . . . . . . . . . . . . . . . . . . . . . . . . . . . . . . . . . . . . . . . . . . . . . . . . . . . . . . 188,567 144,272
Total Liabilities (excluding Net Assets attributable to holders of redeemable ordinary shares) . . . . . . . . . . . . 8,256,614 7,591,858 Net Assets attributable to holders of redeemable ordinary participating shares . . . . . . . . . . . . . . . . . . . . . . 564,625,294 492,835,057
.
DocuSign Envelope ID: 521655BF-9BE3-47DC-A9A3-494932954338
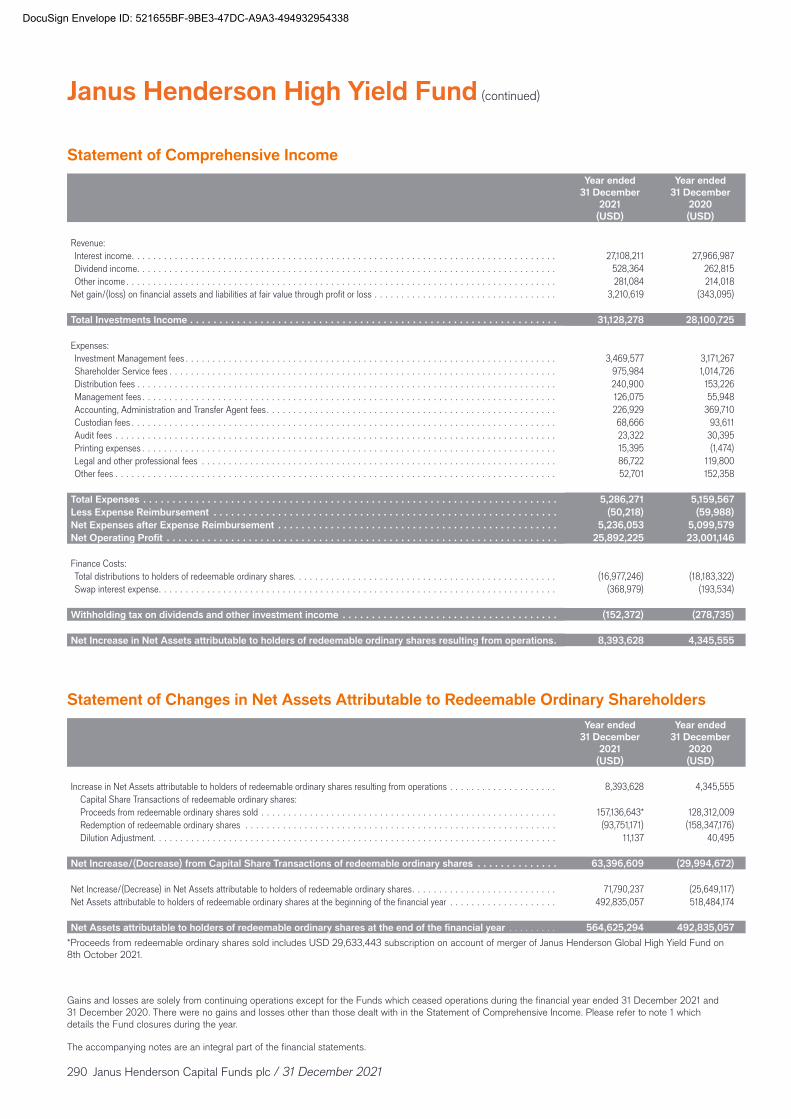
Janus Henderson Capital Funds plc / 31 December 2021290
Janus Henderson High Yield Fund (continued)
The accompanying notes are an integral part of the financial statements.
Statement of Comprehensive IncomeYear ended
31 December 2021
(USD)
Year ended 31 December
2020 (USD)
Year ended Year endedRevenue:Interest income . . . . . . . . . . . . . . . . . . . . . . . . . . . . . . . . . . . . . . . . . . . . . . . . . . . . . . . . . . . . . . . . . . . . . . . . . . . . . . . 27,108,211 27,966,987Dividend income . . . . . . . . . . . . . . . . . . . . . . . . . . . . . . . . . . . . . . . . . . . . . . . . . . . . . . . . . . . . . . . . . . . . . . . . . . . . . . 528,364 262,815Other income . . . . . . . . . . . . . . . . . . . . . . . . . . . . . . . . . . . . . . . . . . . . . . . . . . . . . . . . . . . . . . . . . . . . . . . . . . . . . . . . 281,084 214,018
Net gain/(loss) on financial assets and liabilities at fair value through profit or loss . . . . . . . . . . . . . . . . . . . . . . . . . . . . . . . . . . 3,210,619 (343,095) Total Investments Income . . . . . . . . . . . . . . . . . . . . . . . . . . . . . . . . . . . . . . . . . . . . . . . . . . . . . . . . . . . . . . . 31,128,278 28,100,725
Expenses:Investment Management fees . . . . . . . . . . . . . . . . . . . . . . . . . . . . . . . . . . . . . . . . . . . . . . . . . . . . . . . . . . . . . . . . . . . . . 3,469,577 3,171,267Shareholder Service fees . . . . . . . . . . . . . . . . . . . . . . . . . . . . . . . . . . . . . . . . . . . . . . . . . . . . . . . . . . . . . . . . . . . . . . . . 975,984 1,014,726Distribution fees . . . . . . . . . . . . . . . . . . . . . . . . . . . . . . . . . . . . . . . . . . . . . . . . . . . . . . . . . . . . . . . . . . . . . . . . . . . . . . 240,900 153,226Management fees . . . . . . . . . . . . . . . . . . . . . . . . . . . . . . . . . . . . . . . . . . . . . . . . . . . . . . . . . . . . . . . . . . . . . . . . . . . . . 126,075 55,948Accounting, Administration and Transfer Agent fees . . . . . . . . . . . . . . . . . . . . . . . . . . . . . . . . . . . . . . . . . . . . . . . . . . . . . . 226,929 369,710Custodian fees . . . . . . . . . . . . . . . . . . . . . . . . . . . . . . . . . . . . . . . . . . . . . . . . . . . . . . . . . . . . . . . . . . . . . . . . . . . . . . . 68,666 93,611Audit fees . . . . . . . . . . . . . . . . . . . . . . . . . . . . . . . . . . . . . . . . . . . . . . . . . . . . . . . . . . . . . . . . . . . . . . . . . . . . . . . . . . 23,322 30,395Printing expenses . . . . . . . . . . . . . . . . . . . . . . . . . . . . . . . . . . . . . . . . . . . . . . . . . . . . . . . . . . . . . . . . . . . . . . . . . . . . . 15,395 (1,474)Legal and other professional fees . . . . . . . . . . . . . . . . . . . . . . . . . . . . . . . . . . . . . . . . . . . . . . . . . . . . . . . . . . . . . . . . . . 86,722 119,800Other fees . . . . . . . . . . . . . . . . . . . . . . . . . . . . . . . . . . . . . . . . . . . . . . . . . . . . . . . . . . . . . . . . . . . . . . . . . . . . . . . . . . 52,701 152,358
Total Expenses . . . . . . . . . . . . . . . . . . . . . . . . . . . . . . . . . . . . . . . . . . . . . . . . . . . . . . . . . . . . . . . . . . . . . . . 5,286,271 5,159,567Less Expense Reimbursement . . . . . . . . . . . . . . . . . . . . . . . . . . . . . . . . . . . . . . . . . . . . . . . . . . . . . . . . . . . (50,218) (59,988)Net Expenses after Expense Reimbursement . . . . . . . . . . . . . . . . . . . . . . . . . . . . . . . . . . . . . . . . . . . . . . . . 5,236,053 5,099,579Net Operating Profit . . . . . . . . . . . . . . . . . . . . . . . . . . . . . . . . . . . . . . . . . . . . . . . . . . . . . . . . . . . . . . . . . . . 25,892,225 23,001,146
Finance Costs: 17,346,225 18,376,856
Total distributions to holders of redeemable ordinary shares. . . . . . . . . . . . . . . . . . . . . . . . . . . . . . . . . . . . . . . . . . . . . . . . . (16,977,246) (18,183,322)Swap interest expense . . . . . . . . . . . . . . . . . . . . . . . . . . . . . . . . . . . . . . . . . . . . . . . . . . . . . . . . . . . . . . . . . . . . . . . . . . (368,979) (193,534)
Withholding tax on dividends and other investment income . . . . . . . . . . . . . . . . . . . . . . . . . . . . . . . . . . . . . (152,372) (278,735)
Net Increase in Net Assets attributable to holders of redeemable ordinary shares resulting from operations . 8,393,628 4,345,555
. .
. .. . .
Statement of Changes in Net Assets Attributable to Redeemable Ordinary ShareholdersYear ended
31 December 2021
(USD)
Year ended 31 December
2020 (USD)
Increase in Net Assets attributable to holders of redeemable ordinary shares resulting from operations . . . . . . . . . . . . . . . . . . . . 8,393,628 4,345,555
Capital Share Transactions of redeemable ordinary shares:Proceeds from redeemable ordinary shares sold . . . . . . . . . . . . . . . . . . . . . . . . . . . . . . . . . . . . . . . . . . . . . . . . . . . . . . . 157,136,643* 128,312,009Redemption of redeemable ordinary shares . . . . . . . . . . . . . . . . . . . . . . . . . . . . . . . . . . . . . . . . . . . . . . . . . . . . . . . . . . (93,751,171) (158,347,176)Dilution Adjustment. . . . . . . . . . . . . . . . . . . . . . . . . . . . . . . . . . . . . . . . . . . . . . . . . . . . . . . . . . . . . . . . . . . . . . . . . . . 11,137 40,495
Net Increase/(Decrease) from Capital Share Transactions of redeemable ordinary shares . . . . . . . . . . . . . . 63,396,609 (29,994,672)
Net Increase/(Decrease) in Net Assets attributable to holders of redeemable ordinary shares . . . . . . . . . . . . . . . . . . . . . . . . . . . 71,790,237 (25,649,117)Net Assets attributable to holders of redeemable ordinary shares at the beginning of the financial year . . . . . . . . . . . . . . . . . . . . 492,835,057 518,484,174
Net Assets attributable to holders of redeemable ordinary shares at the end of the financial year . . . . . . . . . 564,625,294 492,835,057
*Proceeds from redeemable ordinary shares sold includes USD 29,633,443 subscription on account of merger of Janus Henderson Global High Yield Fund on 8th October 2021.
Gains and losses are solely from continuing operations except for the Funds which ceased operations during the financial year ended 31 December 2021 and 31 December 2020. There were no gains and losses other than those dealt with in the Statement of Comprehensive Income. Please refer to note 1 which details the Fund closures during the year.
DocuSign Envelope ID: 521655BF-9BE3-47DC-A9A3-494932954338

291Janus Henderson Capital Funds plc / 31 December 2021
Janus Henderson High Yield Fund (continued)
Portfolio Investments
The accompanying notes are an integral part of the financial statements.
Shares or Principal Amount
Percentage of Net Assets
(%)Fair Value
(USD)
Financial Assets at fair value through profit or lossCommon Stock (2020: 1.15% USD 5,656,972)JerseyProfessional Services
1,794 Clarivate plc 0.01 42,195
United KingdomChemicals
71,719 Tronox Holdings plc, A 0.31 1,723,408
United StatesChemicals
58,238 Element Solutions, Inc. 0.25 1,414,019
Electronic Equipment, Instruments & Components28,575 II-VI, Inc. 0.35 1,952,530
Hotels, Restaurants & Leisure56,646 Bally's Corp. 0.38 2,155,94721,377 Caesars Entertainment, Inc. 0.35 1,999,391
0.73 4,155,338
Media61,772 Altice USA, Inc., A 0.18 999,471
Oil, Gas & Consumable Fuels55,753 EQT Corp. 0.22 1,215,973
Textiles, Apparel & Luxury Goods1,105,543 Quiksilver Americas, Inc., Private
Placement* 0.17 939,712
Total Common Stock 2.22 12,442,646
Corporate Bonds (2020: 87.77% USD 432,568,606)AustraliaMetals & Mining
1,067,000 FMG Resources August 2006 Pty. Ltd., 4.3750%, due 1/4/31 0.20 1,122,196
CanadaCommercial Services & Supplies
1,403,000 Garda World Security Corp., 4.6250%, due 15/2/27 0.25 1,397,584
1,402,000 Garda World Security Corp., 6.0000%, due 1/6/29 0.24 1,340,880
0.49 2,738,464
Hotels, Restaurants & Leisure1,400,000 1011778 BC ULC, 4.0000%, due
15/10/30 0.24 1,378,412
Metals & Mining2,675,000 First Quantum Minerals Ltd., 7.5000%,
due 1/4/25 0.49 2,755,1832,157,000 Hudbay Minerals, Inc., 4.5000%, due
1/4/26 0.38 2,159,4812,479,000 Hudbay Minerals, Inc., 6.1250%, due
1/4/29 0.47 2,632,3511.34 7,547,015
Pharmaceuticals2,270,000 Bausch Health Cos., Inc., 9.0000%,
due 15/12/25 0.42 2,393,6705,947,000 Bausch Health Cos., Inc., 5.0000%,
due 30/1/28 0.97 5,480,607908,000 Bausch Health Cos., Inc., 4.8750%,
due 1/6/28 0.16 927,803801,000 Bausch Health Cos., Inc., 5.0000%,
due 15/2/29 0.13 708,1361.68 9,510,216
Shares or Principal Amount
Percentage of Net Assets
(%)Fair Value
(USD)
Cayman IslandsHotels, Restaurants & Leisure
994,000 Wynn Macau Ltd., 5.6250%, due 26/8/28 0.16 921,935
Personal Products1,032,000 Herbalife Nutrition Ltd., 2.6250%, due
15/3/24 0.18 1,036,541
Technology Hardware, Storage & Peripherals1,228,000 Seagate HDD Cayman, 4.1250%, due
15/1/31 0.23 1,279,3731,421,000 Seagate HDD Cayman, 3.3750%, due
15/7/31 0.25 1,388,7860.48 2,668,159
FranceDiversified Telecommunication Services
4,114,000 Altice France SA, 5.1250%, due 15/7/29 0.71 4,020,160
2,343,000 Altice France SA, 5.5000%, due 15/10/29 0.41 2,311,850
1.12 6,332,010
GermanyMachinery
1,425,000 TK Elevator Holdco GmbH, 7.6250%, due 15/7/28 0.27 1,528,548
IrelandMedia
1,446,000 LCPR Senior Secured Financing DAC, 6.7500%, due 15/10/27 0.27 1,519,746
1,513,000 LCPR Senior Secured Financing DAC, 5.1250%, due 15/7/29 0.27 1,522,834
0.54 3,042,580
LuxembourgChemicals
490,000 Herens Holdco SARL, 4.7500%, due 15/5/28 0.08 480,977
1,279,000 Trinseo Materials Operating SCA, 5.1250%, due 1/4/29 0.23 1,306,511
0.31 1,787,488
Containers & Packaging6,376,000 ARD Finance SA, 6.5000%, due
30/6/27 1.16 6,573,911
Diversified Telecommunication Services2,014,000 Altice France Holding SA, 10.5000%,
due 15/5/27 0.38 2,167,890
Food Products908,000 FAGE International SA, 5.6250%, due
15/8/26 0.16 931,622
IT Services2,588,000 ION Trading Technologies SARL,
5.7500%, due 15/5/28 0.47 2,669,457
Media2,790,000 Altice Financing SA, 5.0000%, due
15/1/28 0.48 2,727,085
Road & Rail1,722,000 Albion Financing 2 SARL, 8.7500%,
due 15/4/27 0.31 1,752,135
DocuSign Envelope ID: 521655BF-9BE3-47DC-A9A3-494932954338

Janus Henderson Capital Funds plc / 31 December 2021292
The accompanying notes are an integral part of the financial statements.
Janus Henderson High Yield Fund (continued)
Portfolio Investments
Shares or Principal Amount
Percentage of Net Assets
(%)Fair Value
(USD)
NetherlandsChemicals
866,000 Diamond (BC) BV, 4.6250%, due 1/10/29 0.15 860,358
Media2,768,000 Ziggo Bond Co. BV, 5.1250%, due
28/2/30 0.49 2,785,978
Pharmaceuticals3,449,000 Teva Pharmaceutical Finance
Netherlands III BV, 3.1500%, due 1/10/26 0.57 3,247,475
1,453,000 Teva Pharmaceutical Finance Netherlands III BV, 4.7500%, due 9/5/27 0.26 1,441,550
1,131,000 Teva Pharmaceutical Finance Netherlands III BV, 5.1250%, due 9/5/29 0.20 1,110,699
1.03 5,799,724
Real Estate Management & Development1,750,000 AT Securities BV, 5.2500%, due
21/7/23 0.32 1,813,674
PanamaHotels, Restaurants & Leisure
1,452,000 Carnival Corp., 7.6250%, due 1/3/26 0.27 1,523,954
SupranationalAirlines
1,882,000 American Airlines, Inc., 5.5000%, due 20/4/26 0.35 1,959,971
1,397,000 American Airlines, Inc., 5.7500%, due 20/4/29 0.26 1,495,845
0.61 3,455,816
Commercial Services & Supplies1,534,000 Allied Universal Holdco LLC, 4.6250%,
due 1/6/28 0.27 1,535,726
Containers & Packaging3,607,000 Ardagh Packaging Finance plc,
5.2500%, due 15/8/27 0.64 3,633,602
Food Products2,482,000 JBS USA LUX SA, 6.7500%, due
15/2/28 0.47 2,681,6522,653,000 JBS USA LUX SA, 6.5000%, due
15/4/29 0.52 2,922,7842,291,000 JBS USA LUX SA, 5.5000%, due
15/1/30 0.44 2,495,3111,051,000 JBS USA LUX SA, 3.7500%, due
1/12/31 0.19 1,068,2731.62 9,168,020
Wireless Telecommunication Services3,274,000 Connect Finco SARL, 6.7500%, due
1/10/26 0.61 3,446,212
SwitzerlandCapital Markets
1,991,000 Credit Suisse Group AG, 4.5000%, due 3/9/30 0.34 1,943,714
United KingdomAutomobiles
1,189,000 Jaguar Land Rover Automotive plc, 7.7500%, due 15/10/25 0.23 1,287,093
Shares or Principal Amount
Percentage of Net Assets
(%)Fair Value
(USD)
1,573,000 Jaguar Land Rover Automotive plc,
5.8750%, due 15/1/28 0.28 1,602,7610.51 2,889,854
Chemicals1,261,000 INEOS Quattro Finance 2 plc, 3.3750%,
due 15/1/26 0.22 1,267,084
Diversified Telecommunication Services1,218,000 Virgin Media Finance plc, 5.0000%,
due 15/7/30 0.21 1,213,810
United StatesAerospace & Defense
3,623,000 TransDigm, Inc., 4.8750%, due 1/5/29 0.65 3,644,032
Air Freight & Logistics4,665,000 Cargo Aircraft Management, Inc.,
4.7500%, due 1/2/28 0.84 4,755,454
Airlines1,141,000 Delta Air Lines, Inc., 7.3750%, due
15/1/26 0.24 1,344,504446,000 Delta Air Lines, Inc., 3.7500%, due
28/10/29 0.08 457,5503,488,000 United Airlines Holdings, Inc., 4.8750%,
due 15/1/25 0.64 3,591,9420.96 5,393,996
Auto Components1,477,000 American Axle & Manufacturing, Inc.,
6.8750%, due 1/7/28 0.28 1,594,8872,680,000 Dornoch Debt Merger Sub, Inc.,
6.6250%, due 15/10/29 0.47 2,649,8502,286,000 Goodyear Tire & Rubber Co. (The),
5.2500%, due 30/4/31 0.44 2,488,32272,000 Goodyear Tire & Rubber Co. (The),
5.2500%, due 15/7/31 0.01 78,2781,305,000 JB Poindexter & Co., Inc., 7.1250%, due
15/4/26 0.24 1,367,3721.44 8,178,709
Automobiles2,304,000 Ford Motor Co., 4.7500%, due 15/1/43 0.45 2,547,130
Banks1,847,000 SVB Financial Group, 4.2500%, due
15/11/26 0.33 1,876,321
Building Products1,687,000 CP Atlas Buyer, Inc., 7.0000%, due
1/12/28 0.30 1,680,9352,928,000 New Enterprise Stone & Lime Co., Inc.,
5.2500%, due 15/7/28 0.53 2,973,3995,616,000 Standard Industries, Inc., 3.3750%,
due 15/1/31 0.96 5,419,4401,321,000 Summit Materials LLC, 5.2500%, due
15/1/29 0.25 1,385,5442.04 11,459,318
Capital Markets1,383,000 Charles Schwab Corp. (The), 4.0000%,
due 1/6/26 0.25 1,412,3892,024,000 Coinbase Global, Inc., 3.3750%, due
1/10/28 0.34 1,894,1201,771,000 Coinbase Global, Inc., 3.6250%, due
1/10/31 0.29 1,632,5251,218,000 Compass Group Diversified Holdings
LLC, 5.2500%, due 15/4/29 0.23 1,278,060698,000 Jane Street Group, 4.5000%, due
15/11/29 0.12 706,125
DocuSign Envelope ID: 521655BF-9BE3-47DC-A9A3-494932954338

293Janus Henderson Capital Funds plc / 31 December 2021
The accompanying notes are an integral part of the financial statements.
Janus Henderson High Yield Fund (continued)
Portfolio Investments
Shares or Principal Amount
Percentage of Net Assets
(%)Fair Value
(USD)
1,869,000 LPL Holdings, Inc., 4.3750%, due
15/5/31 0.34 1,914,5292,011,000 MSCI, Inc., 3.6250%, due 1/11/31 0.37 2,089,298
1.94 10,927,046
Chemicals1,104,000 Axalta Coating Systems LLC, 3.3750%,
due 15/2/29 0.19 1,069,748611,000 Iris Holdings, Inc., 8.7500%, due
15/2/26 0.11 618,6221,117,000 Kobe US Midco 2, Inc., 9.2500%, due
1/11/26 0.20 1,142,1322,357,000 Olympus Water US Holding Corp.,
6.2500%, due 1/10/29 0.41 2,301,3872,891,000 Polar US Borrower LLC, 6.7500%, due
15/5/26 0.50 2,843,414636,000 SCIL IV LLC, 5.3750%, due 1/11/26 0.12 653,490
1.53 8,628,793
Commercial Services & Supplies1,315,000 Allied Universal Holdco LLC, 6.0000%,
due 1/6/29 0.23 1,280,8301,779,000 APi Group DE, Inc., 4.1250%, due
15/7/29 0.32 1,790,5192,016,000 Covanta Holding Corp., 4.8750%, due
1/12/29 0.36 2,049,304929,000 Prime Security Services Borrower LLC,
3.3750%, due 31/8/27 0.16 898,0411.07 6,018,694
Construction & Engineering452,000 Arcosa, Inc., 4.3750%, due 15/4/29 0.08 458,884
2,653,000 Tutor Perini Corp., 6.8750%, due 1/5/25 0.47 2,676,399
822,000 Weekley Homes LLC, 4.8750%, due 15/9/28 0.15 847,901
0.70 3,983,184
Consumer Finance3,285,000 Ford Motor Credit Co. LLC, 3.6250%,
due 17/6/31 0.61 3,463,5402,208,000 General Motors Financial Co., Inc.,
5.7500%, due 30/9/27 0.42 2,368,0801,775,000 OneMain Finance Corp., 8.8750%,
due 1/6/25 0.34 1,901,353446,000 OneMain Finance Corp., 6.6250%, due
15/1/28 0.09 500,1563,889,000 OneMain Finance Corp., 5.3750%, due
15/11/29 0.75 4,234,1492.21 12,467,278
Containers & Packaging1,180,000 LABL, Inc., 6.7500%, due 15/7/26 0.22 1,217,3351,897,000 LABL, Inc., 10.5000%, due 15/7/27 0.35 1,991,3762,611,000 LABL, Inc., 8.2500%, due 1/11/29 0.47 2,630,387
1.04 5,839,098
Diversified Consumer Services1,403,000 WW International, Inc., 4.5000%, due
15/4/29 0.24 1,345,070
Diversified Telecommunication Services2,257,000 CCO Holdings LLC, 5.1250%, due
1/5/27 0.41 2,327,4751,645,000 CCO Holdings LLC, 5.0000%, due
1/2/28 0.30 1,714,0901,917,000 CCO Holdings LLC, 4.5000%, due
15/8/30 0.35 1,965,375
Shares or Principal Amount
Percentage of Net Assets
(%)Fair Value
(USD)
2,713,000 CCO Holdings LLC, 4.5000%, due
1/6/33 0.49 2,772,1842,129,000 Consolidated Communications, Inc.,
5.0000%, due 1/10/28 0.38 2,153,5262,010,000 Level 3 Financing, Inc., 3.6250%, due
15/1/29 0.34 1,912,6152,108,000 Windstream Escrow LLC, 7.7500%,
due 15/8/28 0.40 2,238,6542,232,000 Zayo Group Holdings, Inc., 4.0000%,
due 1/3/27 0.39 2,202,7943,063,000 Zayo Group Holdings, Inc., 6.1250%,
due 1/3/28 0.53 3,021,7413.59 20,308,454
Electrical Equipment531,000 Atkore, Inc., 4.2500%, due 1/6/31 0.10 545,037
1,793,000 Vertiv Group Corp., 4.1250%, due 15/11/28 0.32 1,814,005
0.42 2,359,042
Electronic Equipment, Instruments & Components1,421,000 II-VI, Inc., 5.0000%, due 15/12/29 0.26 1,454,109
Energy Equipment & Services1,074,000 Archrock Partners LP, 6.8750%, due
1/4/27 0.20 1,128,774
Equity Real Estate Investment Trusts (REITs)1,196,000 CTR Partnership LP, 3.8750%, due
30/6/28 0.22 1,221,6361,740,000 Global Net Lease, Inc., 3.7500%, due
15/12/27 0.30 1,700,7212,163,000 Iron Mountain, Inc., 5.2500%, due
15/7/30 0.40 2,283,2981,803,000 Uniti Group LP, 6.5000%, due 15/2/29 0.32 1,799,5382,954,000 VICI Properties LP, 4.1250%, due
15/8/30 0.55 3,128,9651.79 10,134,158
Food & Staples Retailing1,997,000 Albertsons Cos., Inc., 4.6250%, due
15/1/27 0.37 2,097,9882,071,000 Albertsons Cos., Inc., 4.8750%, due
15/2/30 0.40 2,239,289295,000 Performance Food Group, Inc.,
4.2500%, due 1/8/29 0.05 293,1360.82 4,630,413
Food Products649,000 Kraft Heinz Foods Co., 4.3750%, due
1/6/46 0.13 761,634535,000 Kraft Heinz Foods Co., 4.8750%, due
1/10/49 0.12 673,3471,788,000 Pilgrim's Pride Corp., 3.5000%, due
1/3/32 0.32 1,808,8481,308,000 Post Holdings, Inc., 4.5000%, due
15/9/31 0.23 1,300,3090.80 4,544,138
Health Care Equipment & Supplies4,753,000 Mozart Debt Merger Sub, Inc.,
5.2500%, due 1/10/29 0.85 4,827,717
Health Care Providers & Services1,381,000 Centene Corp., 2.6250%, due 1/8/31 0.24 1,355,679
4,078,000 Community Health Systems, Inc., 6.8750%, due 15/4/29 0.74 4,160,702
4,031,000 DaVita, Inc., 3.7500%, due 15/2/31 0.70 3,934,8202,435,000 Hadrian Merger Sub, Inc., 8.5000%,
due 1/5/26 0.45 2,516,512
DocuSign Envelope ID: 521655BF-9BE3-47DC-A9A3-494932954338

Janus Henderson Capital Funds plc / 31 December 2021294
The accompanying notes are an integral part of the financial statements.
Janus Henderson High Yield Fund (continued)
Portfolio Investments
Shares or Principal Amount
Percentage of Net Assets
(%)Fair Value
(USD)
2,512,000 ModivCare Escrow Issuer, Inc.,
5.0000%, due 1/10/29 0.45 2,569,2231,487,000 ModivCare, Inc., 5.8750%, due
15/11/25 0.28 1,563,134765,000 Prime Healthcare Services, Inc.,
7.2500%, due 1/11/25 0.14 811,7991,074,000 Surgery Center Holdings, Inc.,
6.7500%, due 1/7/25 0.19 1,083,1722,177,000 Tenet Healthcare Corp., 4.8750%, due
1/1/26 0.40 2,239,4041,791,000 Tenet Healthcare Corp., 6.1250%, due
1/10/28 0.34 1,895,3352,239,000 Tenet Healthcare Corp., 4.2500%, due
1/6/29 0.40 2,277,6684.33 24,407,448
Hotels, Restaurants & Leisure1,808,000 Bloomin' Brands, Inc., 5.1250%, due
15/4/29 0.33 1,838,8631,997,000 Carrols Restaurant Group, Inc.,
5.8750%, due 1/7/29 0.32 1,800,1062,351,000 Full House Resorts, Inc., 8.2500%, due
15/2/28 0.44 2,471,8882,113,000 Life Time, Inc., 5.7500%, due 15/1/26 0.39 2,189,438
2,374,000 Life Time, Inc., 8.0000%, due 15/4/26 0.44 2,490,2311,307,000 Papa John's International, Inc.,
3.8750%, due 15/9/29 0.23 1,302,3934,353,000 Premier Entertainment Sub LLC,
5.6250%, due 1/9/29 0.77 4,325,1194,351,000 Premier Entertainment Sub LLC,
5.8750%, due 1/9/31 0.77 4,372,7551,377,000 Sugarhouse HSP Gaming Prop Mezz
LP, 5.8750%, due 15/5/25 0.24 1,371,5471,973,000 Travel + Leisure Co., 6.6000%, due
1/10/25 0.39 2,196,9351,693,000 Travel + Leisure Co., 6.6250%, due
31/7/26 0.33 1,879,2981,067,000 Vail Resorts, Inc., 6.2500%, due
15/5/25 0.20 1,110,747941,000 Wendy's International LLC, 7.0000%,
due 15/12/25 0.19 1,065,1701,351,000 Yum! Brands, Inc., 3.6250%, due
15/3/31 0.24 1,348,0145.28 29,762,504
Household Durables1,734,000 Century Communities, Inc., 3.8750%,
due 15/8/29 0.31 1,749,4932,875,000 Shea Homes LP, 4.7500%, due 1/4/29 0.52 2,934,0241,226,000 Taylor Morrison Communities, Inc.,
5.1250%, due 1/8/30 0.24 1,350,3353,499,000 TopBuild Corp., 4.1250%, due 15/2/32 0.64 3,595,870
1.71 9,629,722
Insurance1,308,000 HUB International Ltd., 5.6250%, due
1/12/29 0.24 1,349,529
Interactive Media & Services908,000 Rackspace Technology Global, Inc.,
3.5000%, due 15/2/28 0.15 865,764
Internet & Direct Marketing Retail1,692,000 Go Daddy Operating Co. LLC,
3.5000%, due 1/3/29 0.30 1,681,476
IT Services1,368,000 Austin BidCo, Inc., 7.1250%, due
15/12/28 0.25 1,414,403
Shares or Principal Amount
Percentage of Net Assets
(%)Fair Value
(USD)
1,361,000 Block, Inc., 3.5000%, due 1/6/31 0.25 1,397,380
3,016,000 Endure Digital, Inc., 6.0000%, due 15/2/29 0.50 2,809,117
1,306,000 Northwest Fiber LLC, 6.0000%, due 15/2/28 0.23 1,281,970
1.23 6,902,870
Life Sciences Tools & Services1,960,000 Syneos Health, Inc., 3.6250%, due
15/1/29 0.34 1,938,313
Machinery3,104,000 Madison IAQ LLC, 5.8750%, due
30/6/29 0.55 3,108,7481,373,000 Titan International, Inc., 7.0000%, due
30/4/28 0.26 1,464,1951,625,000 TK Elevator US Newco, Inc., 5.2500%,
due 15/7/27 0.30 1,710,3611.11 6,283,304
Media3,154,000 Block Communications, Inc., 4.8750%,
due 1/3/28 0.56 3,158,7472,870,000 CSC Holdings LLC, 5.3750%, due
1/2/28 0.53 2,976,1182,426,000 CSC Holdings LLC, 7.5000%, due
1/4/28 0.46 2,605,7304,992,000 CSC Holdings LLC, 4.6250%, due
1/12/30 0.84 4,732,1161,604,000 Directv Financing LLC, 5.8750%, due
15/8/27 0.29 1,644,4211,498,000 DISH DBS Corp., 5.1250%, due 1/6/29 0.24 1,365,6072,929,000 GCI LLC, 4.7500%, due 15/10/28 0.53 3,010,1191,136,000 Gray Escrow II, Inc., 5.3750%, due
15/11/31 0.21 1,170,6994,123,000 Gray Television, Inc., 4.7500%, due
15/10/30 0.73 4,104,2614,313,000 Liberty Interactive LLC, 8.2500%, due
1/2/30 0.84 4,728,795926,000 Nexstar Media, Inc., 4.7500%, due
1/11/28 0.17 945,0523,027,000 Scripps Escrow II, Inc., 5.3750%, due
15/1/31 0.55 3,080,7141,186,000 Scripps Escrow, Inc., 5.8750%, due
15/7/27 0.22 1,247,1531,992,000 Sirius XM Radio, Inc., 4.0000%, due
15/7/28 0.36 2,006,581600,000 Summer BC Bidco B LLC, 5.5000%,
due 31/10/26 0.11 615,0006.64 37,391,113
Metals & Mining3,102,000 Allegheny Technologies, Inc., 5.1250%,
due 1/10/31 0.55 3,129,7322,598,000 Arconic Corp., 6.1250%, due 15/2/28 0.49 2,769,1561,048,000 Compass Minerals International, Inc.,
6.7500%, due 1/12/27 0.20 1,111,137973,000 Freeport-McMoRan, Inc., 5.2500%,
due 1/9/29 0.19 1,067,0752,442,000 Freeport-McMoRan, Inc., 4.6250%,
due 1/8/30 0.46 2,623,0991,610,000 Kaiser Aluminum Corp., 4.5000%, due
1/6/31 0.28 1,586,2771,075,000 Novelis Corp., 3.8750%, due 15/8/31 0.19 1,069,953
2.36 13,356,429
Multiline Retail1,805,000 Nordstrom, Inc., 5.0000%, due 15/1/44 0.30 1,685,978
DocuSign Envelope ID: 521655BF-9BE3-47DC-A9A3-494932954338

295Janus Henderson Capital Funds plc / 31 December 2021
The accompanying notes are an integral part of the financial statements.
Janus Henderson High Yield Fund (continued)
Portfolio Investments
Shares or Principal Amount
Percentage of Net Assets
(%)Fair Value
(USD)
Oil, Gas & Consumable Fuels
1,050,000 Antero Resources Corp., 7.6250%, due 1/2/29 0.21 1,167,164
961,000 Antero Resources Corp., 5.3750%, due 1/3/30 0.18 1,028,928
2,634,000 Apache Corp., 4.2500%, due 15/1/30 0.51 2,862,1972,689,000 DT Midstream, Inc., 4.1250%, due
15/6/29 0.49 2,757,3411,900,000 DT Midstream, Inc., 4.3750%, due
15/6/31 0.35 1,978,9261,509,000 Endeavor Energy Resources LP,
6.6250%, due 15/7/25 0.28 1,598,3551,383,000 EnLink Midstream LLC, 5.6250%, due
15/1/28 0.25 1,440,3391,611,000 EnLink Midstream LLC, 5.3750%, due
1/6/29 0.29 1,649,9543,298,000 EnLink Midstream Partners LP,
4.1500%, due 1/6/25 0.61 3,421,6911,364,000 EQM Midstream Partners LP, 4.7500%,
due 15/1/31 0.26 1,444,5922,184,000 Great Western Petroleum LLC,
12.0000%, due 1/9/25 0.41 2,304,1202,321,000 Hess Midstream Operations LP,
5.6250%, due 15/2/26 0.42 2,393,2411,807,000 Hess Midstream Operations LP,
5.1250%, due 15/6/28 0.33 1,884,177963,000 Hess Midstream Operations LP,
4.2500%, due 15/2/30 0.17 957,4191,678,000 Howard Midstream Energy Partners
LLC, 6.7500%, due 15/1/27 0.30 1,721,5112,551,000 Magnolia Oil & Gas Operating LLC,
6.0000%, due 1/8/26 0.46 2,618,0403,548,000 NGL Energy Operating LLC, 7.5000%,
due 1/2/26 0.65 3,663,6831,426,000 Occidental Petroleum Corp., 6.3750%,
due 1/9/28 0.30 1,695,1152,364,000 Occidental Petroleum Corp., 3.5000%,
due 15/8/29 0.43 2,432,6273,046,000 Occidental Petroleum Corp., 6.6250%,
due 1/9/30 0.67 3,774,542823,000 Occidental Petroleum Corp., 6.1250%,
due 1/1/31 0.18 1,001,328560,000 Range Resources Corp., 4.8750%, due
15/5/25 0.10 578,9222,659,000 Renewable Energy Group, Inc.,
5.8750%, due 1/6/28 0.48 2,735,858515,000 Rockies Express Pipeline LLC,
4.9500%, due 15/7/29 0.10 549,1191,374,000 Southwestern Energy Co., 5.3750%,
due 15/3/30 0.26 1,474,6321,394,000 Southwestern Energy Co., 4.7500%,
due 1/2/32 0.26 1,470,7261,216,000 Sunoco LP, 4.5000%, due 15/5/29 0.22 1,236,940
2,284,000 Sunoco LP, 4.5000%, due 30/4/30 0.42 2,344,3662,979,000 Tallgrass Energy Partners LP, 5.5000%,
due 15/1/28 0.52 2,957,1492,988,000 Tallgrass Energy Partners LP, 6.0000%,
due 1/9/31 0.52 2,961,0182,636,000 TerraForm Power Operating LLC,
4.7500%, due 15/1/30 0.49 2,767,4842,321,000 Viper Energy Partners LP, 5.3750%,
due 1/11/27 0.42 2,400,1933,434,000 Western Midstream Operating LP,
5.3000%, due 1/2/30 0.67 3,780,920
Shares or Principal Amount
Percentage of Net Assets
(%)Fair Value
(USD)
607,000 Western Midstream Operating LP,
5.4500%, due 1/4/44 0.13 726,22712.34 69,778,844
Pharmaceuticals1,706,000 Bausch Health Americas, Inc.,
8.5000%, due 31/1/27 0.32 1,793,7653,451,000 HLF Financing SARL LLC, 4.8750%,
due 1/6/29 0.60 3,391,1252,572,000 Organon & Co., 4.1250%, due 30/4/28 0.46 2,618,2454,159,000 Organon & Co., 5.1250%, due 30/4/31 0.77 4,352,2901,488,000 Teva Pharmaceutical Finance Co. LLC,
6.1500%, due 1/2/36 0.28 1,561,9682.43 13,717,393
Professional Services4,758,000 CoreLogic, Inc., 4.5000%, due 1/5/28 0.84 4,747,1281,598,000 KBR, Inc., 4.7500%, due 30/9/28 0.29 1,632,325
1.13 6,379,453
Real Estate Management & Development1,257,000 Realogy Group LLC, 5.7500%, due
15/1/29 0.23 1,290,342
Road & Rail1,145,000 First Student Bidco, Inc., 4.0000%,
due 31/7/29 0.20 1,114,6752,240,000 PECF USS Intermediate Holding III
Corp., 8.0000%, due 15/11/29 0.41 2,322,9701,538,000 Uber Technologies, Inc., 4.5000%, due
15/8/29 0.28 1,569,0912,470,000 Watco Cos. LLC, 6.5000%, due
15/6/27 0.46 2,571,2701.35 7,578,006
Software1,573,000 NCR Corp., 5.1250%, due 15/4/29 0.29 1,631,2172,225,000 Rocket Software, Inc., 6.5000%, due
15/2/29 0.38 2,173,8360.67 3,805,053
Specialty Retail2,062,000 Arko Corp., 5.1250%, due 15/11/29 0.35 1,995,3772,116,000 Carvana Co., 5.5000%, due 15/4/27 0.37 2,097,0622,746,000 Carvana Co., 4.8750%, due 1/9/29 0.46 2,619,5472,037,000 Lithia Motors, Inc., 4.3750%, due
15/1/31 0.39 2,177,4212,762,000 LSF9 Atlantis Holdings LLC, 7.7500%,
due 15/2/26 0.50 2,796,0691,801,000 Rent-A-Center, Inc., 6.3750%, due
15/2/29 0.33 1,880,100645,000 SRS Distribution, Inc., 6.1250%, due
1/7/29 0.12 658,248884,000 SRS Distribution, Inc., 6.0000%, due
1/12/29 0.16 889,803783,000 White Cap Parent LLC, 8.2500%, due
15/3/26 0.14 804,4972.82 15,918,124
Thrifts & Mortgage Finance2,045,000 MGIC Investment Corp., 5.2500%, due
15/8/28 0.38 2,150,1442,515,000 Rocket Mortgage LLC, 3.8750%, due
1/3/31 0.45 2,556,5980.83 4,706,742
Trading Companies & Distributors1,648,000 Beacon Roofing Supply, Inc., 4.1250%,
due 15/5/29 0.29 1,649,623
DocuSign Envelope ID: 521655BF-9BE3-47DC-A9A3-494932954338

Janus Henderson Capital Funds plc / 31 December 2021296
The accompanying notes are an integral part of the financial statements.
Janus Henderson High Yield Fund (continued)
Portfolio Investments
Shares or Principal Amount
Percentage of Net Assets
(%)Fair Value
(USD)
1,390,000 Fortress Transportation and
Infrastructure Investors LLC, 9.7500%, due 1/8/27 0.28 1,558,190
0.57 3,207,813
Total Corporate Bonds 87.79 495,860,338
Government Obligations (2020: 0.00% USD –)US Treasury Notes/Bonds
3,700,000 0.0000%, due 4/1/22 0.66 3,700,004
Total Government Obligations 0.66 3,700,004
Preferred Stock (2020: 1.75% USD 8,657,263)JerseyProfessional Services
55,500 Clarivate plc, 5.2500%, due 1/6/24 0.89 5,042,730
United StatesHealth Care Equipment & Supplies
54,250 Becton Dickinson and Co., 6.0000%, due 1/6/23 0.51 2,861,687
22,473 Boston Scientific Corp., 5.5000%, due 1/6/23 0.46 2,576,754
0.97 5,438,441
Total Preferred Stock 1.86 10,481,171
Tranche Loans (2020: 3.28% USD 16,150,169)Cayman IslandsAirlines
892,000 AAdvantage Loyalty IP Ltd., 5.5000%, due 20/4/28 0.16 925,847
LuxembourgProfessional Services
2,241,000 Luxembourg Investment Co. 428 SARL, due 20/10/28 0.40 2,235,397
United KingdomEntertainment
1,068,190 Formula One Management Ltd., 3.5000%, due 1/2/24 0.19 1,068,633
United StatesChemicals
1,048,000 Aruba Investments Holdings LLC, 8.5000%, due 24/11/28 0.19 1,058,480
Diversified Financial Services2,801,535 Tacala Investment Corp., 8.2500%,
due 4/2/28 0.50 2,800,961
Health Care Providers & Services325,153 National Mentor Holdings, Inc.,
8.0000%, due 2/3/29 0.06 324,747
Hotels, Restaurants & Leisure1,363,266 MIC Glen LLC, 7.2500%, due 20/7/29 0.24 1,368,944
Insurance2,314,000 Asurion LLC, 5.3543%, due 20/1/29 0.41 2,307,498
Machinery1,280,523 Fairbanks Morse Defense LLC,
5.5000%, due 23/6/28 0.23 1,281,3231,156,000 Fairbanks Morse Defense LLC,
9.0000%, due 15/6/29 0.21 1,158,8900.44 2,440,213
Road & Rail1,190,013 PECF USS Intermediate Holding III
Corp., 4.7500%, due 15/12/28 0.21 1,192,779
Shares or Principal Amount
Percentage of Net Assets
(%)Fair Value
(USD)
Semiconductors & Semiconductor Equipment
1,280,931 Altar Bidco, Inc., due 17/11/28 0.23 1,278,529436,019 Altar Bidco, Inc., due 16/11/29 0.08 438,472
0.31 1,717,001
Software1,043,000 Mitchell International, Inc., 4.2500%,
due 15/10/28 0.18 1,038,4371,319,000 Proofpoint, Inc., 3.7500%, due 31/8/28 0.23 1,315,6041,722,380 UKG, Inc., 3.7500%, due 4/5/26 0.30 1,716,274
521,293 UKG, Inc., 5.7500%, due 3/5/27 0.09 524,4440.80 4,594,759
Technology Hardware, Storage & Peripherals2,060,000 Magenta Buyer LLC, 9.0000%, due
27/7/29 0.36 2,051,636
Textiles, Apparel & Luxury Goods121,319 Boardriders, Inc., 9.0000%, due
23/4/24* 0.02 121,319
Total Tranche Loans 4.29 24,208,214
Total Investments (Cost: USD 535,707,314) 96.82 546,692,373
DocuSign Envelope ID: 521655BF-9BE3-47DC-A9A3-494932954338

297Janus Henderson Capital Funds plc / 31 December 2021
The accompanying notes are an integral part of the financial statements.
Janus Henderson High Yield Fund (continued)
Portfolio Investments
Credit Default Swaps°† (2020: 0.11% USD 515,036).
Percentage of Net Unrealized
Reference Notional Maturity Assets GainCounterparty Asset Amount Date (%) (USD)
Citigroup
Sell protection on CDX.NA.HY.37-V1 Receive USD fixed 5.00% 1,800,000 20-Dec-26 0.03 165,537
Citigroup
Sell protection on CDX.NA.HY.37-V1 Receive USD fixed 5.00% 1,800,000 20-Dec-26 0.03 165,538
Citigroup
Sell protection on CDX.NA.HY.37-V1 Receive USD fixed 5.00% 1,800,000 20-Dec-26 0.03 165,538
Citigroup
Sell protection on CDX.NA.HY.37-V1 Receive USD fixed 5.00% 1,300,000 20-Dec-26 0.02 119,555
Citigroup
Sell protection on CDX.NA.HY.37-V1 Receive USD fixed 5.00% 1,300,000 20-Dec-26 0.02 119,555
Total 0.13 735,723
Forward Currency Contracts (2020: 0.21% USD 1,020,168)Open as at 31 December 2021.
Current Market
Percentage of Net Unrealised
Currency Currency Value Settle Assets GainPurchased Sold (USD) Date (%) (USD)
.J.P. Morgan AUD◊ 8,445,552 USD 6,077,167 6,145,099 31-Jan-22 0.01 67,932
CNH◊ 311,101 USD 48,445 48,853 28-Jan-22 0.00 408
EUR◊ 24,714,160 USD 27,732,930 28,152,764 31-Jan-22 0.08 419,834
GBP◊ 14,670 USD 19,568 19,853 31-Jan-22 0.00 285
Total 0.09 488,459
.
Total Financial Assets at fair value through profit or loss 97.04 547,916,555
Financial Liabilities at fair value through profit or loss.Forward Currency Contracts (2020: (0.01)% USD (15,887))Open as at 31 December 2021
Current Market
Percentage of Net Unrealised
Currency Currency Value Settle Assets LossPurchased Sold (USD) Date (%) (USD)
J.P. Morgan USD◊ 83,708 AUD 116,178 84,533 31-Jan-22 0.00 (825)
USD◊ 870,017 EUR 769,966 877,094 31-Jan-22 0.00 (7,077)
Total 0.00 (7,902).
Total Financial Liabilities at fair value through profit or loss 0.00 (7,902)
Portfolio Analysis (Unaudited)
Analysis of Total Assets:% of Total
AssetsTransferable securities admitted to official stock exchange listing 19.42Transferable securities dealt in on another regulated market 75.85Financial derivative instruments dealt in on a regulated market 0.13OTC financial derivative instruments 0.09Other Assets 4.51Total Assets 100.00
* Fair valued by Janus Henderson Global Pricing Committee at 31 December 2021.° Refer to Note 5 for details of collateral held.† Cleared through ICE (Central Counterparty Clearing House “CCP”).◊ These forward currency contracts are used for share class hedging.
DocuSign Envelope ID: 521655BF-9BE3-47DC-A9A3-494932954338

Janus Henderson Capital Funds plc / 31 December 2021298
The accompanying notes are an integral part of the financial statements.
Janus Henderson High Yield Fund (continued)
Fair Value Hierarchy
The tables below provide the fair value hierarchy summary of the Fund’s financial assets and liabilities measured at fair value at 31 December 2021 and 31 December 2020.
31 December 2021
Level 1 - Quoted Prices
(USD)
Level 2 - Other Significant
Observable Inputs (USD)
Level 3 - Significant
Unobservable Inputs (USD)
Total (USD)
Common Stock 11,502,934 – 939,712 12,442,646Corporate Bonds – 495,860,338 – 495,860,338Credit Default Swaps – 735,723 – 735,723Forward Currency Contracts – 480,557 – 480,557Government Obligations – 3,700,004 – 3,700,004Preferred Stock 10,481,171 – – 10,481,171Tranche Loans – 24,086,895 121,319 24,208,214Total Investments in Securities 21,984,105 524,863,517 1,061,031 547,908,653
31 December 2020
Level 1 - Quoted Prices
(USD)
Level 2 - Other Significant
Observable Inputs (USD)
Level 3 - Significant
Unobservable Inputs (USD)
Total (USD)
Common Stock 4,742,392 – 914,580 5,656,972Corporate Bonds – 432,568,606 – 432,568,606Credit Default Swaps – 515,036 – 515,036Forward Currency Contracts – 1,004,281 – 1,004,281Preferred Stock 6,322,189 2,335,0741 – 8,657,263Tranche Loans – 16,041,728 108,441 16,150,169Total Investments in Securities 11,064,581 452,464,725 1,023,021 464,552,327
1At 31 December 2020, the administrator used a systematic fair valuation model provided by an independent third party to value listed securities in order to adjust for stale pricing between the close of foreign exchanges and the valuation point. This resulted in a change to Preferred stocks with a fair value of USD 2,335,074.
Valuation policy of private placements is referenced in note 2 of the financial statements.
The following tables present level 3 positions that were fair valued by the Janus Henderson Global Pricing Committee at 31 December 2021 and 31 December 2020.
Security Name
Fair Value at 31 December 2021
(USD)Fair Value as a %
of Net Assets Valuation MethodBoardriders, Inc. 121,319 0.02% Valued at costQuiksilver Americas, Inc., Private Placement 939,712 0.17% Valued at cost
Total 1,061,031
Security Name
Fair Value at 31 December 2020
(USD)Fair Value as a %
of Net Assets Valuation MethodBoardriders, Inc. – –% Valued at costBoardriders, Inc. 108,441 0.02% DCF ModelQuiksilver Americas, Inc. 914,580 0.19% Valued at cost
Total 1,023,021
DocuSign Envelope ID: 521655BF-9BE3-47DC-A9A3-494932954338

299Janus Henderson Capital Funds plc / 31 December 2021
Janus Henderson High Yield Fund (continued)
The accompanying notes are an integral part of the financial statements.
Capital Share Transactions
For the financial year ended 31 December 2021
A2 HEUR A2 HKD A2 USD A3m HAUD A3m HCNH A3m HEUR A3m HKD A3m USDShares Shares Shares Shares Shares Shares Shares Shares
At beginning of the year . . . . . . . 360,460 115,572 653,621 183,045 29,780 – 35,223 5,068,201Shares issued 164,119 – 343,660 4,511 175 360,013 13,685 2,016,053Shares redeemed. . . . . . . . . . . (56,479) (5,180) (190,248) (26,999) – (23,296) (1,691) (774,437)At end of year . . . . . . . . . . . . . 468,100 110,392 807,033 160,557 29,955 336,717 47,217 6,309,817
B1m HEUR B1m USD B2 USD E2 HEUR E2 USD E3m HEUR H1m HEUR H1m USDShares Shares Shares Shares Shares Shares Shares Shares
At beginning of the year . . . . . . . 360,948 2,430,167 30,205 25,740 55,590 193,100 – 371Shares issued – 512 – 34,794 34,867 172,205 7,753 372Shares redeemed. . . . . . . . . . . (49,662) (437,082) (2,168) (12,641) (20,016) (59,819) – –At end of year . . . . . . . . . . . . . 311,286 1,993,597 28,037 47,893 70,441 305,486 7,753 743
H2 HEUR H2 HGBP H2 USD I1m HEUR I1m USD I2 HEUR I2 USD I3m USDShares Shares Shares Shares Shares Shares Shares Shares
At beginning of the year . . . . . . . 283 1,163 300 – 30,228,849 39,371 1,137,677 302Shares issued – – – 1,949 6,652,976 3,049 2,577,912 16Shares redeemed. . . . . . . . . . . – (169) – – (5,264,983) (7,091) (883,446) –At end of year . . . . . . . . . . . . . 283 994 300 1,949 31,616,842 35,329 2,832,143 318
V3m HAUD V3m USD Z2 USDShares Shares Shares
At beginning of the year . . . . . . . 1,005,706 2,186,621 356,311Shares issued 14,280 255,683 –Shares redeemed. . . . . . . . . . . (196,807) (626,095) –At end of year . . . . . . . . . . . . . 823,179 1,816,209 356,311
For the financial year ended 31 December 2020
A2 HEUR A2 HKD A2 USD A3m HAUD A3m HCNH A3m HKD A3m USD B1m HEURShares Shares Shares Shares Shares Shares Shares Shares
At beginning of the year . . . . . . . 420,460 132,183 1,137,348 216,102 29,591 61,633 5,554,608 415,868Shares issued 25,959 19,698 658,458 6,862 189 247 558,328 –Shares redeemed. . . . . . . . . . . 85,959 36,309 1,142,185 39,919 – 26,657 1,044,735 54,920At end of year . . . . . . . . . . . . . 360,460 115,572 653,621 183,045 29,780 35,223 5,068,201 360,948
B1m USD B2 USD E2 HEUR E2 USD E3m HEUR H1m USD H2 HEUR H2 HGBPShares Shares Shares Shares Shares Shares Shares Shares
At beginning of the year . . . . . . . 2,653,519 51,304 23,475 14,365 200,065 352 283 1,276Shares issued 366 – 6,168 51,018 52,488 19 – 57Shares redeemed. . . . . . . . . . . 223,718 21,099 3,903 9,793 59,453 – – 170At end of year . . . . . . . . . . . . . 2,430,167 30,205 25,740 55,590 193,100 371 283 1,163
H2 USD I1m USD I2 HEUR I2 USD I3m USD V3m HAUD V3m USD Z2 USDShares Shares Shares Shares Shares Shares Shares Shares
At beginning of the year . . . . . . . 300 30,036,446 294,612 1,103,668 – 1,378,579 2,909,694 356,311Shares issued – 7,722,527 33,197 1,698,424 302 23,504 236,019 –Shares redeemed. . . . . . . . . . . – 7,530,124 288,438 1,664,415 – 396,377 959,092 –At end of year . . . . . . . . . . . . . 300 30,228,849 39,371 1,137,677 302 1,005,706 2,186,621 356,311
DocuSign Envelope ID: 521655BF-9BE3-47DC-A9A3-494932954338

Janus Henderson Capital Funds plc / 31 December 2021300
Janus Henderson High Yield Fund (continued)
The accompanying notes are an integral part of the financial statements.
Net Asset Comparison
31 December 2021 31 December 2020 31 December 2019
Net Assets (USD)
NAV Per Share
(Local Currency)Net Assets
(USD)
NAV Per Share
(Local Currency)Net Assets
(USD)
NAV Per Share
(Local Currency)
A2 HEUR 16,942,084 31.79 13,526,674 30.72 14,037,278 29.77A2 HKD 234,777 16.58 235,276 15.78 256,127 15.10A2 USD 26,367,870 32.67 20,449,310 31.29 33,861,089 29.77A3m HAUD 1,043,174 8.93 1,278,556 9.06 1,406,275 9.28A3m HCNH 49,062 10.41 46,866 10.23 43,369 10.20A3m HEUR 2,863,061 7.47 – – – –A3m HKD 53,452 8.83 40,221 8.85 71,095 8.99A3m USD 49,249,330 7.81 39,930,211 7.88 44,194,547 7.96B1m HEUR 2,955,674 8.34 3,673,476 8.33 3,921,717 8.41B1m USD 18,549,631 9.30 22,378,137 9.21 24,223,427 9.13B2 USD 736,222 26.26 767,165 25.40 1,252,766 24.42E2 HEUR 754,117 13.83 421,154 13.39 342,589 13.01E2 USD 901,252 12.79 682,808 12.28 168,327 11.72E3m HEUR 2,601,100 7.48 1,800,937 7.63 1,765,373 7.87H1m HEUR 83,140 9.42 – – – –H1m USD 7,776 10.47 3,849 10.37 3,620 10.27H2 HEUR 3,902 12.12 3,998 11.57 3,515 11.08H2 HGBP 19,951 14.83 22,378 14.07 22,679 13.41H2 USD 4,068 13.56 3,850 12.83 3,620 12.07I1m HEUR 20,779 9.36 – – – –I1m USD 294,274,680 9.31 278,570,727 9.22 274,380,345 9.13I2 HEUR 1,174,869 29.21 1,342,377 27.91 8,838,838 26.75I2 USD 63,018,877 22.25 23,963,129 21.06 21,873,827 19.82I3m USD 3,349 10.52 3,170 10.49 – –V3m HAUD 5,016,770 8.38 6,589,856 8.50 8,389,496 8.67V3m USD 14,950,771 8.23 18,155,315 8.30 24,400,171 8.39Z2 USD 62,745,556 176.10 58,945,617 165.43 55,024,084 154.43
. . .
DocuSign Envelope ID: 521655BF-9BE3-47DC-A9A3-494932954338

301Janus Henderson Capital Funds plc / 31 December 2021
Janus Henderson High Yield Fund (continued)
The accompanying notes are an integral part of the financial statements.
Total Expense Ratio (unaudited)
The Average Total Expense Ratio table shows the actual expenses, excluding transactions costs and trade commissions, incurred by each Class for the Fund during the reporting financial year expressed as a percentage of the average net assets for the corresponding year, on an annualised basis.
31 December 2021 31 December 2020 31 December 2019A2 HEUR 1.87% 1.92% 1.91%A2 HKD 1.84% 1.90% 1.91%A2 USD 1.88% 1.88% 1.91%A3m HAUD 1.88% 1.91% 1.91%A3m HCNH 1.93% 1.90% 1.91%A3m HEUR* 1.86% – –A3m HKD 1.93% 1.90% 1.92%A3m USD 1.88% 1.88% 1.91%B1m HEUR 2.88% 2.91% 2.91%B1m USD 2.89% 2.89% 2.91%B2 USD 2.89% 2.90% 2.91%E2 HEUR 2.09% 2.18% 2.16%E2 USD 2.13% 2.18% 2.16%E3m HEUR 2.11% 2.16% 2.16%H1m HEUR* 0.66% – –H1m USD 0.64% 0.68% 0.78%H2 HEUR 0.64% 0.67% 0.77%H2 HGBP 0.66% 0.75% 0.77%H2 USD 0.63% 0.68% 0.78%I1m HEUR* 0.70% – –I1m USD 0.71% 0.76% 0.81%I2 HEUR 0.72% 0.77% 0.81%I2 USD 0.71% 0.76% 0.80%I3m USD 0.68% 0.67% –V3m HAUD 1.88% 1.89% 1.91%V3m USD 1.89% 1.89% 1.91%
*As the share class launched during the year, an estimated Total Expense Ratio is disclosed for the year end.
Distributions per share (unaudited)
The following table shows the distribution rate per share at Ex-date for each distributing share class:
Share Class (Local Currency) 15/01/2021 12/02/2021 15/03/2021 15/04/2021 14/05/2021 15/06/2021 15/07/2021 13/08/2021 15/09/2021 15/10/2021 15/11/2021 15/12/2021A3m HAUD 0.04228 0.03934 0.04307 0.04438 0.03852 0.03765 0.03865 0.03710 0.04157 0.04063 0.03832 0.04256A3m HCNH 0.04613 0.04264 0.04807 0.04970 0.04238 0.04170 0.04260 0.04130 0.04631 0.04610 0.04243 0.04685A3m HEUR – – – – – – – – – 0.00405 0.03111 0.03396A3m HKD 0.04011 0.03709 0.04133 0.04287 0.03661 0.03573 0.03651 0.03534 0.03972 0.03939 0.03620 0.03989A3m USD 0.03570 0.03300 0.03673 0.03809 0.03252 0.03176 0.03243 0.03133 0.03522 0.03927 0.03204 0.03525B1m HEUR 0.01657 0.01655 0.01992 0.01843 0.01593 0.01231 0.01483 0.01406 0.01551 0.01753 0.01519 0.01619B1m USD 0.01830 0.01836 0.02189 0.02060 0.01766 0.01351 0.01606 0.01555 0.01725 0.01937 0.01674 0.01797E3m HEUR 0.03476 0.03187 0.03581 0.03645 0.03134 0.03077 0.03144 0.03034 0.03385 0.03492 0.03117 0.03401H1m HEUR* – – – – – – – – – 0.00440 0.03392 0.03699H1m USD 0.04197 0.03900 0.04323 0.04428 0.03695 0.03552 0.03661 0.03538 0.04000 0.04104 0.03697 0.04073I1m HEUR* – – – – – – – – – 0.00434 0.03329 0.03631I1m USD 0.03554 0.03378 0.03791 0.03871 0.03292 0.03168 0.03264 0.03147 0.03561 0.03587 0.03267 0.03622I3m USD 0.04751 0.04409 0.04895 0.05084 0.04337 0.04248 0.04330 0.04197 0.04721 0.04679 0.04307 0.04759V3m HAUD 0.03968 0.03691 0.04041 0.04163 0.03614 0.03532 0.03626 0.03480 0.03899 0.03805 0.03595 0.03992V3m USD 0.03762 0.03478 0.03871 0.04014 0.03427 0.03348 0.03418 0.03302 0.03712 0.03680 0.03379 0.03717
– – – – – – – – – – – –*The share class launched on 10 August 2021.
DocuSign Envelope ID: 521655BF-9BE3-47DC-A9A3-494932954338

Janus Henderson Capital Funds plc / 31 December 2021302
Janus Henderson High Yield Fund (continued)
The accompanying notes are an integral part of the financial statements.
Fund Performance (unaudited)
As at 31 December 2021
One year Three years Five yearsSince
inception
Performance (Annualised) 31/12/2020 31/12/2021
%
31/12/2017 31/12/2021
%
31/12/2015 31/12/2021
%
to 31/12/2021
%
H2 USD (Net)* 5.61 7.62** 4.63** 5.28**Bloomberg Barclays US Corporate High Yield Bond TR 5.28 8.83 6.30 6.87
Five years 31/12/2015 31/12/2021
%H2 USD (Gross)* 6.63Bloomberg Barclays U.S. Corporate High Yield Bond TR + 1.25% 7.63
.
Discrete performance
31/12/2020 31/12/2021
%
31/12/2019 31/12/2020
%
31/12/2018 31/12/2019
%
31/12/2017 31/12/2018
%
31/12/2016 31/12/2017
%
H2 USD (Net)* 5.61 5.11** 13.58** (4.10)** 4.87**Bloomberg Barclays U.S. Corporate High Yield Bond TR 5.28 7.11 14.32 (2.08) 7.50
H2 USD (Gross)* 6.28 7.12** 15.75** (2.22)** 6.95**Bloomberg Barclays U.S. Corporate High Yield Bond TR + 1.25% 6.59 8.46 15.75 (0.85) 8.84
. . . . .
Class H2 USD is disclosed as it is the representative share class.
* The representative share class has changed from the A2 USD to the H2 USD share class with effect from August 2021.
** Historical figures are based on the A2 USD share class.
Performance target: To outperform the Bloomberg Barclays US Corporate High Yield Bond Index by 1.25% per annum, before the deduction of charges, over any 5 year period.
The Total Expense Ratio includes fees payable to Distributors. Where the Total Expense Ratio exceeds the target outperformance relative to the benchmark the return is likely to be below the benchmark return, even when the Fund’s outperformance target (before the deduction of charges) has been achieved.
Please note the Gross Returns 5 year annualised table is only applicable for share classes which have been active for 5 or more years and the performance target is to be achieved over a specific annualised time period. Performance target and index shown in USD.
Past performance does not guarantee future returns. The rates of return will vary and the principal value of an investment will fluctuate. Shares, if redeemed, may be worth more or less than their original cost. The performance data does not take account of the commissions and costs incurred on the issue and redemption of Shares. All returns are calculated in the base currency of the representative Share Class.
There is no guarantee that the Fund’s performance will match or exceed the benchmark.
DocuSign Envelope ID: 521655BF-9BE3-47DC-A9A3-494932954338

303Janus Henderson Capital Funds plc / 31 December 2021
Janus Henderson High Yield Fund (continued)
Statements of Changes in Composition of Portfolio (unaudited)The tables below show a breakdown of material purchases and sales of the Investment Portfolio in accordance with Central Bank UCITS Regulations 79(2) requirements. All purchases and sales of investments exceeding 1% of the total value of each transaction respectively, are disclosed, with a minimum number of 20 of each such transaction. A full analysis of the movement on the Investment Portfolio is available upon request from the registered office.
Major Purchases for the year ended 31 December 2021
Shares or Principal Amount
Cost (USD)
Credit Industriel et Commercial, 0.0000%, due 27/5/21 41,300,000 41,299,954Credit Agricole Corporate And Investment Bank, 0.0000%, due 28/5/21 37,500,000 37,499,979Credit Agricole Corporate And Investment Bank, 0.0000%, due 26/5/21 36,600,000 36,599,980Credit Agricole Corporate And Investment Bank, 0.0000%, due 2/6/21 35,800,000 35,799,980Credit Agricole Corporate And Investment Bank, 0.0000%, due 1/6/21 35,200,000 35,199,961Credit Industriel et Commercial, 0.0000%, due 20/5/21 32,500,000 32,499,964Credit Agricole Corporate And Investment Bank, 0.0000%, due 7/6/21 32,000,000 31,999,947Credit Industriel et Commercial, 0.0000%, due 14/5/21 31,700,000 31,699,956Credit Agricole Corporate And Investment Bank, 0.0000%, due 16/2/21 31,500,000 31,499,790Credit Agricole Corporate And Investment Bank, 0.0000%, due 3/6/21 31,400,000 31,399,983Credit Industriel et Commercial, 0.0000%, due 21/5/21 31,400,000 31,399,965Credit Industriel et Commercial, 0.0000%, due 25/5/21 31,200,000 31,199,965Credit Industriel et Commercial, 0.0000%, due 4/6/21 30,900,000 30,899,966Credit Industriel et Commercial, 0.0000%, due 18/5/21 30,800,000 30,799,957Credit Industriel et Commercial, 0.0000%, due 17/5/21 30,800,000 30,799,872Credit Agricole Corporate And Investment Bank, 0.0000%, due 9/11/21 30,500,000 30,499,958Credit Agricole Corporate And Investment Bank, 0.0000%, due 24/11/21 30,400,000 30,399,958Credit Industriel et Commercial, 0.0000%, due 24/5/21 29,900,000 29,899,900Credit Agricole Corporate And Investment Bank, 0.0000%, due 17/2/21 29,500,000 29,499,951Credit Agricole Corporate And Investment Bank, 0.0000%, due 15/10/21 29,200,000 29,199,951
Major Sales for the year ended 31 December 2021
Shares or Principal Amount
Proceeds (USD)
Allegheny Technologies, Inc., 7.8750%, due 15/8/23 7,112,000 7,821,346First Quantum Minerals Ltd., 7.2500%, due 1/4/23 6,888,000 7,017,344US Treasury Bill, 0.0000%, due 4/1/22 6,000,000 5,999,935Great Western Petroleum LLC, 9.0000%, due 30/9/21 5,641,000 5,652,282LABL, Inc., 10.5000%, due 15/7/27 4,957,000 5,464,306Boston Scientific Corp. 43,927 5,221,910MEDNAX, Inc., 6.2500%, due 15/1/27 4,678,000 4,984,412Ortho Clinical Diagnostics Holdings plc 265,411 4,959,884NRG Energy, Inc., 3.6300%, due 15/2/31 4,937,000 4,902,154AMN Healthcare, Inc., 4.6250%, due 1/10/27 4,458,000 4,600,159General Electric Co., 3.5300%, due 15/3/22 4,824,000 4,590,231Golden Entertainment, Inc., 7.6250%, due 15/4/26 4,288,000 4,553,951Molina Healthcare, Inc., 4.3800%, due 15/6/28 4,353,000 4,543,000LGI Homes, Inc., 6.8750%, due 15/7/26 4,241,000 4,416,058SCIH Salt Holdings, Inc., 4.8800%, due 1/5/28 4,371,000 4,385,698TransDigm, Inc., 7.5000%, due 15/3/27 4,068,000 4,340,376Downstream Development Authority of the Quapaw Tribe of Oklahoma, 10.5000%, due 15/2/23 3,510,000 3,678,235Avolon Holdings Funding Ltd., 2.7500%, due 21/2/28 3,442,000 3,382,694IRB Holding Corp., 6.7500%, due 15/2/26 3,141,000 3,252,778Novelis Corp., 5.8750%, due 30/9/26 3,083,000 3,206,320
DocuSign Envelope ID: 521655BF-9BE3-47DC-A9A3-494932954338

Janus Henderson Multi-Sector Income Fund
Janus Henderson Capital Funds plc / 31 December 2021304
Fund Overview (unaudited)Investment Objective and Policy
The Fund aims to provide a high income with the potential for some capital growth over the long term.
Performance target: To outperform the Bloomberg Barclays US Aggregate Bond Index by 1.25% per annum, before the deduction of charges, over any 5 year period.
The Fund invests at least 80% of its assets in a global portfolio of bonds of any quality, including high yield (non-investment grade) bonds and asset-backed and mortgage-backed securities, issued by governments, companies or any other type of issuer.
The Fund is actively managed with reference to the Bloomberg Barclays US Aggregate Bond Index, which is broadly representative of the bonds in which it may invest, as this forms the basis of the Fund’s performance target. The investment manager has discretion to choose investments for the Fund with weightings different to the index or not in the index, but at times the Fund may hold investments similar to the index.
How Sustainability Risks are part of the investment processThe investments underlying this financial product (referred to as the Fund) do not take into account the EU criteria for environmentally sustainable economic activities, although the Manager and the Investment Manager have agreed a decision making process that will apply to investment decisions relating to the Fund as further detailed in the Prospectus.
The likely impacts of sustainability risks on the returns of the FundWhile the analysis of (Environmental, Social and Governance) ESG factors is an integral component across the Investment Manager’s investment capabilities and one of a number of inputs to the selection of investments and portfolio construction, the investment process of the Investment Manager is primarily designed to maximise long-term risk-adjusted returns for investors. Therefore, in managing the Fund, the Investment Manager does not maximise portfolio alignment with sustainability risks as a separate goal in its own right nor does it precisely attribute the impact of ESG factors on returns for the Fund.
Fund Overview
Seth Meyer, John Lloyd and John Kerschner, portfolio managers
For the year ended 31 December 2021, the Janus Henderson Multi-Sector Income Fund H2 US dollar terms returned 2.46% (Net) and 3.23% (Gross), compared with -1.54% and -0.31% Target (Gross) for the Bloomberg US Aggregate Bond Index.
At the start of the year, we had a favorable view on the US economy and believed the US Federal Reserve (Fed) was likely to remain accommodative, leading us to maintain our overweight exposure to credit markets broadly, including a material out-of-index position in high yield. We maintained our focus on individual names that we believed had the potential to be ‘rising stars’ – securities that, in our view, could see sufficient rating improvement to push them into the investment-grade market in the year ahead.
As the year progressed and credit spreads narrowed, we reduced our exposure to investment-grade corporate bonds to a historic low for the Fund. This was done given our view that the relatively tight level of spreads diminished their attractiveness on a risk-adjusted basis compared to high yield, particularly with rates set to rise. In our efforts to diversify sources of income and risk, we also favored the securitized markets. We actively sought opportunities in commercial mortgage-backed securities (CMBS), believing the asset class would continue to provide diversification as well as attractive individual opportunities in specialized sectors set to benefit in a post-pandemic economy. We added floating rate products such as bank loans and collateralized loan obligations (CLO) and also increased our allocation to mortgage-backed securities (MBS).
Both our asset allocation and security selection decisions proved to be positive contributors. The Fund’s out-of-index allocation to high-yield corporate bonds performed strongly as the economic outlook continued to improve and investors’ demand for yield remained intact. Our CLO allocation was another meaningful contributor to relative performance. Security selection within securitized markets such as asset-backed securities (ABS), MBS and CMBS further aided returns. The Fund’s material underweight in investment-grade corporate credit detracted, although this was largely offset by strong security selection within the asset class. A lack of exposure to government-related securities proved to be another modest headwind.
DocuSign Envelope ID: 521655BF-9BE3-47DC-A9A3-494932954338

305Janus Henderson Capital Funds plc / 31 December 2021
Janus Henderson Multi-Sector Income Fund (continued)
Fund Overview (unaudited) (continued)
Favoring investments that offer the prospect of lower returns, but less chance of generating negative returns, may (thanks to the power of compounding returns) prove to be prescient in 2022. Put more concretely, we think that continuing to rotate exposure from corporate bonds to securitized products may prove prudent over the course of the year, particularly given the underlying fundamentals of many securitized sectors remain positive. Within corporate credit, we are less optimistic about the likelihood of investment-grade corporate bonds seeing significant tightening in 2022, but we anticipate continued strength in high yield. We think the high-yield asset class’ risk/reward profile remains a bright spot in an otherwise low-yielding/tight-spread world for government and corporate bonds.
Thank you for investing in Janus Henderson Multi-Sector Income Fund.
January 2022
DocuSign Envelope ID: 521655BF-9BE3-47DC-A9A3-494932954338

Janus Henderson Capital Funds plc / 31 December 2021306
The accompanying notes are an integral part of the financial statements.
Janus Henderson Multi-Sector Income Fund (continued)
s
Statement of Financial PositionAs of
31 December 2021
(USD)
As of 31 December
2020 (USD)
Assets:Financial assets at fair value through profit or loss . . . . . . . . . . . . . . . . . . . . . . . . . . . . . . . . . . . . . . . . . . . . . . . . . . . . . . . 333,183,305 279,477,379Cash and foreign currency . . . . . . . . . . . . . . . . . . . . . . . . . . . . . . . . . . . . . . . . . . . . . . . . . . . . . . . . . . . . . . . . . . . . . . . 20,258,688 26,599,118Margin cash . . . . . . . . . . . . . . . . . . . . . . . . . . . . . . . . . . . . . . . . . . . . . . . . . . . . . . . . . . . . . . . . . . . . . . . . . . . . . . . . . 212,012 –Collateral cash . . . . . . . . . . . . . . . . . . . . . . . . . . . . . . . . . . . . . . . . . . . . . . . . . . . . . . . . . . . . . . . . . . . . . . . . . . . . . . . 539,000 480,000Receivables:
Investments sold . . . . . . . . . . . . . . . . . . . . . . . . . . . . . . . . . . . . . . . . . . . . . . . . . . . . . . . . . . . . . . . . . . . . . . . . . . . . 9,255,583 1,001,464Funds shares sold . . . . . . . . . . . . . . . . . . . . . . . . . . . . . . . . . . . . . . . . . . . . . . . . . . . . . . . . . . . . . . . . . . . . . . . . . . . 129,800 3,013,469Interest . . . . . . . . . . . . . . . . . . . . . . . . . . . . . . . . . . . . . . . . . . . . . . . . . . . . . . . . . . . . . . . . . . . . . . . . . . . . . . . . . . . 1,920,869 2,010,097
Receivable from Investment Manager . . . . . . . . . . . . . . . . . . . . . . . . . . . . . . . . . . . . . . . . . . . . . . . . . . . . . . . . . . . . . . . . 8,079 5,847
Total Assets . . . . . . . . . . . . . . . . . . . . . . . . . . . . . . . . . . . . . . . . . . . . . . . . . . . . . . . . . . . . . . . . . . . . . . . . . 365,507,336 312,587,374 Liabilities (amounts falling due within one year)Payables:
Financial liabilities at fair value through profit or loss . . . . . . . . . . . . . . . . . . . . . . . . . . . . . . . . . . . . . . . . . . . . . . . . . . . . 452,521 159,089Bank overdraft and foreign currency . . . . . . . . . . . . . . . . . . . . . . . . . . . . . . . . . . . . . . . . . . . . . . . . . . . . . . . . . . . . . . . 415,394 –Margin cash . . . . . . . . . . . . . . . . . . . . . . . . . . . . . . . . . . . . . . . . . . . . . . . . . . . . . . . . . . . . . . . . . . . . . . . . . . . . . . . 99,677 59,935Investments purchased . . . . . . . . . . . . . . . . . . . . . . . . . . . . . . . . . . . . . . . . . . . . . . . . . . . . . . . . . . . . . . . . . . . . . . . . 81,285,946 54,309,831Fund shares repurchased . . . . . . . . . . . . . . . . . . . . . . . . . . . . . . . . . . . . . . . . . . . . . . . . . . . . . . . . . . . . . . . . . . . . . . 1,307,045 837,344Investment Management fees . . . . . . . . . . . . . . . . . . . . . . . . . . . . . . . . . . . . . . . . . . . . . . . . . . . . . . . . . . . . . . . . . . . 151,708 141,134Shareholder Service fees . . . . . . . . . . . . . . . . . . . . . . . . . . . . . . . . . . . . . . . . . . . . . . . . . . . . . . . . . . . . . . . . . . . . . . 46,121 50,693Accounting, Administration and Transfer Agent fees . . . . . . . . . . . . . . . . . . . . . . . . . . . . . . . . . . . . . . . . . . . . . . . . . . . . 45,138 38,400Management fees . . . . . . . . . . . . . . . . . . . . . . . . . . . . . . . . . . . . . . . . . . . . . . . . . . . . . . . . . . . . . . . . . . . . . . . . . . . 5,556 4,819Accrued expenses . . . . . . . . . . . . . . . . . . . . . . . . . . . . . . . . . . . . . . . . . . . . . . . . . . . . . . . . . . . . . . . . . . . . . . . . . . . 104,949 77,508
Total Liabilities (excluding Net Assets attributable to holders of redeemable ordinary shares) . . . . . . . . . . . . 83,914,055 55,678,753 Net Assets attributable to holders of redeemable ordinary participating shares . . . . . . . . . . . . . . . . . . . . . . 281,593,281 256,908,621
.
DocuSign Envelope ID: 521655BF-9BE3-47DC-A9A3-494932954338

307Janus Henderson Capital Funds plc / 31 December 2021
Janus Henderson Multi-Sector Income Fund (continued)
The accompanying notes are an integral part of the financial statements.
Statement of Comprehensive IncomeYear ended
31 December 2021
(USD)
Year ended 31 December
2020 (USD)
Year ended Year endedRevenue:Interest income . . . . . . . . . . . . . . . . . . . . . . . . . . . . . . . . . . . . . . . . . . . . . . . . . . . . . . . . . . . . . . . . . . . . . . . . . . . . . . . 10,725,950 7,483,567Dividend income . . . . . . . . . . . . . . . . . . . . . . . . . . . . . . . . . . . . . . . . . . . . . . . . . . . . . . . . . . . . . . . . . . . . . . . . . . . . . . 75,112 59,374Other income . . . . . . . . . . . . . . . . . . . . . . . . . . . . . . . . . . . . . . . . . . . . . . . . . . . . . . . . . . . . . . . . . . . . . . . . . . . . . . . . 41,708 16,151
Net (loss)/gain on financial assets and liabilities at fair value through profit or loss . . . . . . . . . . . . . . . . . . . . . . . . . . . . . . . . . . (5,365,169) 4,884,306 Total Investments Income . . . . . . . . . . . . . . . . . . . . . . . . . . . . . . . . . . . . . . . . . . . . . . . . . . . . . . . . . . . . . . . 5,477,601 12,443,398
Expenses:Investment Management fees . . . . . . . . . . . . . . . . . . . . . . . . . . . . . . . . . . . . . . . . . . . . . . . . . . . . . . . . . . . . . . . . . . . . . 1,735,171 1,036,034Shareholder Service fees . . . . . . . . . . . . . . . . . . . . . . . . . . . . . . . . . . . . . . . . . . . . . . . . . . . . . . . . . . . . . . . . . . . . . . . . 559,640 679,642Management fees . . . . . . . . . . . . . . . . . . . . . . . . . . . . . . . . . . . . . . . . . . . . . . . . . . . . . . . . . . . . . . . . . . . . . . . . . . . . . 66,630 23,399Accounting, Administration and Transfer Agent fees . . . . . . . . . . . . . . . . . . . . . . . . . . . . . . . . . . . . . . . . . . . . . . . . . . . . . . 152,434 127,832Custodian fees . . . . . . . . . . . . . . . . . . . . . . . . . . . . . . . . . . . . . . . . . . . . . . . . . . . . . . . . . . . . . . . . . . . . . . . . . . . . . . . 64,679 34,878Audit fees . . . . . . . . . . . . . . . . . . . . . . . . . . . . . . . . . . . . . . . . . . . . . . . . . . . . . . . . . . . . . . . . . . . . . . . . . . . . . . . . . . 21,595 (7,732)Printing expenses . . . . . . . . . . . . . . . . . . . . . . . . . . . . . . . . . . . . . . . . . . . . . . . . . . . . . . . . . . . . . . . . . . . . . . . . . . . . . 10,518 6,465Legal and other professional fees . . . . . . . . . . . . . . . . . . . . . . . . . . . . . . . . . . . . . . . . . . . . . . . . . . . . . . . . . . . . . . . . . . 54,159 56,231Other fees . . . . . . . . . . . . . . . . . . . . . . . . . . . . . . . . . . . . . . . . . . . . . . . . . . . . . . . . . . . . . . . . . . . . . . . . . . . . . . . . . . 45,257 8,744
Total Expenses . . . . . . . . . . . . . . . . . . . . . . . . . . . . . . . . . . . . . . . . . . . . . . . . . . . . . . . . . . . . . . . . . . . . . . . 2,710,083 1,965,493Less Expense Reimbursement . . . . . . . . . . . . . . . . . . . . . . . . . . . . . . . . . . . . . . . . . . . . . . . . . . . . . . . . . . . (77,718) (36,122)Net Expenses after Expense Reimbursement . . . . . . . . . . . . . . . . . . . . . . . . . . . . . . . . . . . . . . . . . . . . . . . . 2,632,365 1,929,371Net Operating Profit . . . . . . . . . . . . . . . . . . . . . . . . . . . . . . . . . . . . . . . . . . . . . . . . . . . . . . . . . . . . . . . . . . . 2,845,236 10,514,027
Finance Costs: 1,485,436 1,258,318
Total distributions to holders of redeemable ordinary shares. . . . . . . . . . . . . . . . . . . . . . . . . . . . . . . . . . . . . . . . . . . . . . . . . (1,386,943) (1,191,882)Swap interest expense . . . . . . . . . . . . . . . . . . . . . . . . . . . . . . . . . . . . . . . . . . . . . . . . . . . . . . . . . . . . . . . . . . . . . . . . . . (98,493) (66,436)
Withholding tax on dividends and other investment income . . . . . . . . . . . . . . . . . . . . . . . . . . . . . . . . . . . . . (84,829) (104,691)
Net Increase in Net Assets attributable to holders of redeemable ordinary shares resulting from operations . 1,274,971 9,151,018
. .
. .. . .
Statement of Changes in Net Assets Attributable to Redeemable Ordinary ShareholdersYear ended
31 December 2021
(USD)
Year ended 31 December
2020 (USD)
Increase in Net Assets attributable to holders of redeemable ordinary shares resulting from operations . . . . . . . . . . . . . . . . . . . . 1,274,971 9,151,018
Capital Share Transactions of redeemable ordinary shares:Proceeds from redeemable ordinary shares sold . . . . . . . . . . . . . . . . . . . . . . . . . . . . . . . . . . . . . . . . . . . . . . . . . . . . . . . 81,079,079 151,528,758Redemption of redeemable ordinary shares . . . . . . . . . . . . . . . . . . . . . . . . . . . . . . . . . . . . . . . . . . . . . . . . . . . . . . . . . . (57,680,719) (63,618,344)Dilution Adjustment. . . . . . . . . . . . . . . . . . . . . . . . . . . . . . . . . . . . . . . . . . . . . . . . . . . . . . . . . . . . . . . . . . . . . . . . . . . 11,329 368,426
Net Increase from Capital Share Transactions of redeemable ordinary shares . . . . . . . . . . . . . . . . . . . . . . . . 23,409,689 88,278,840
Net Increase in Net Assets attributable to holders of redeemable ordinary shares . . . . . . . . . . . . . . . . . . . . . . . . . . . . . . . . . . . 24,684,660 97,429,858Net Assets attributable to holders of redeemable ordinary shares at the beginning of the financial year . . . . . . . . . . . . . . . . . . . . 256,908,621 159,478,763
Net Assets attributable to holders of redeemable ordinary shares at the end of the financial year . . . . . . . . . 281,593,281 256,908,621
Gains and losses are solely from continuing operations except for the Funds which ceased operations during the financial year ended 31 December 2021 or 31 December 2020. There were no gains and losses other than those dealt with in the Statement of Comprehensive Income. Please refer to note 1 which details the Fund closures during the year.
DocuSign Envelope ID: 521655BF-9BE3-47DC-A9A3-494932954338

Janus Henderson Capital Funds plc / 31 December 2021308
Janus Henderson Multi-Sector Income Fund (continued)
Portfolio Investments
The accompanying notes are an integral part of the financial statements.
Shares or Principal Amount
Percentage of Net Assets
(%)Fair Value
(USD)
Financial Assets at fair value through profit or lossAsset-Backed/Commercial Mortgage-Backed Securities (2020: 27.73% USD 71,231,365)
999,644 Agora Securities UK DAC, 1.9738%, due 17/8/31 0.48 1,343,575
447,903 Alaska Airlines Pass-Through Trust, 4.8000%, due 15/2/29 0.17 490,438
1,500,000 American Credit Acceptance Receivables Trust, 5.1700%, due 15/10/24 0.54 1,526,113
1,000,000 Apidos CLO XII, 5.5238%, due 15/4/31 0.32 913,3112,041,000 Apidos CLO XV, 1.1415%, due 20/4/31 0.72 2,039,300
2,000,000 Apidos CLO XXI, 2.5723%, due 18/7/27 0.71 2,000,0141,851,657 Atrium XII, 0.9583%, due 22/4/27 0.66 1,854,257
1,330,000 BAMLL Re-REMIC Trust, due 27/5/23 0.43 1,216,7801,451,843 BX Commercial Mortgage Trust, 1.4311%,
due 15/3/37 0.51 1,446,28496,790 BX Commercial Mortgage Trust,
2.5810%, due 15/3/37 0.03 95,988861,000 Carlyle Global Market Strategies CLO
Ltd., 3.6268%, due 14/1/32 0.29 829,6911,500,000 Carlyle Global Market Strategies CLO
Ltd., 3.2738%, due 15/7/31 0.51 1,445,5733,008,000 CHT Mortgage Trust, 3.1097%, due
15/11/36 1.07 3,010,9071,500,000 CIFC Funding Ltd., 2.6236%, due
19/4/29 0.53 1,479,8051,750,000 CIFC Funding Ltd., 3.5223%, due
17/10/31 0.62 1,750,2751,446,825 Coinstar Funding LLC, 5.2160%, due
25/4/47 0.51 1,447,2453,500,000 Connecticut Avenue Securities Trust,
4.4519%, due 25/4/31 1.28 3,607,4163,151,000 Connecticut Avenue Securities Trust,
4.2527%, due 25/8/31 1.14 3,208,800881,331 Connecticut Avenue Securities Trust,
4.2028%, due 25/9/31 0.32 899,90329,269 Connecticut Avenue Securities Trust,
2.5019%, due 25/4/31 0.01 29,37841,312 Connecticut Avenue Securities Trust,
2.4028%, due 25/8/31 0.01 41,470179,441 Connecticut Avenue Securities Trust,
2.2528%, due 25/9/31 0.06 180,0271,522,748 Connecticut Avenue Securities Trust,
2.1027%, due 25/1/40 0.54 1,525,8321,300,000 DBCCRE Mortgage Trust, 4.9345%, due
10/1/34 0.47 1,326,2661,588,000 DBCCRE Mortgage Trust, 4.9345%, due
10/1/34 0.56 1,569,0651,392,208 DBGS Mortgage Trust, 1.8020%, due
15/5/35 0.49 1,390,3261,945,000 Driven Brands Funding LLC, 4.6410%,
due 20/4/49 0.72 2,039,1871,000,000 Dryden 50 Senior Loan Fund, 6.3838%,
due 15/7/30 0.35 985,4621,000,000 Dryden 53 CLO Ltd., 1.2438%, due
15/1/31 0.36 1,000,3844,000,000 Dryden 57 CLO Ltd., 1.1660%, due
15/5/31 1.42 4,001,0401,750,000 Exeter Automobile Receivables Trust,
6.5500%, due 25/8/25 0.67 1,876,2932,503,000 First Investors Auto Owner Trust,
7.1600%, due 15/8/25 0.90 2,548,077505,446 FREMF Mortgage Trust, 2.0440%, due
25/3/25 0.18 506,287
Shares or Principal Amount
Percentage of Net Assets
(%)Fair Value
(USD)
1,700,000 FREMF Mortgage Trust, 2.5440%, due
25/10/28 0.60 1,703,4811,356,703 FREMF Mortgage Trust, 2.5940%, due
25/1/28 0.48 1,357,007975,000 FREMF Mortgage Trust, 5.0940%, due
25/10/28 0.34 962,0131,250,000 GoldenTree Loan Opportunities IX Ltd.,
3.1286%, due 29/10/29 0.44 1,241,4341,500,000 GS Mortgage Securities Corp. Trust,
4.5913%, due 10/10/32 0.52 1,469,189169,000 GS Mortgage Securities Corp. Trust,
4.5913%, due 10/10/32 0.06 162,541900,000 Highbridge Loan Management, 3.7222%,
due 18/7/29 0.32 894,0041,360,000 LCM XIV LP, 1.1715%, due 20/7/31 0.48 1,360,269
975,000 LCM XIV LP, 5.6315%, due 20/7/31 0.31 878,2563,000,000 LCM XXI LP, 2.9315%, due 20/4/28 1.06 2,982,9752,000,000 Madison Park Funding XXX Ltd.,
2.6237%, due 15/4/29 0.70 1,975,8021,570,379 Morgan Stanley Capital I Trust, 6.0143%,
due 11/6/42 0.56 1,570,3791,288,525 Neighborly Issuer LLC, 3.5840%, due
30/4/51 0.46 1,294,8381,000,000 Newday Funding Master Issuer plc,
2.3380%, due 15/7/29 0.48 1,363,747501,000 Oak Street Investment Grade Net Lease
Fund, 5.1100%, due 20/11/50 0.19 525,9152,688,000 Palmer Square CLO Ltd., 1.2223%, due
16/7/31 0.95 2,689,247171,500 Planet Fitness Master Issuer LLC,
3.8580%, due 5/12/49 0.06 175,882680,000 Regatta XV Funding Ltd., 6.6239%, due
25/10/31 0.24 663,4602,945,000 RR 4 Ltd., 3.0737%, due 15/4/30 1.04 2,928,826
370,882 Santander Prime Auto Issuance Notes Trust, 6.8000%, due 15/9/25 0.13 374,642
573,281 SC Germany SA Compartment Consumer, 3.3240%, due 14/11/34 0.23 661,475
1,150,243 Sequoia Mortgage Trust, 0.2604%, due 25/11/48 0.00 70
10,000 Sofi Professional Loan Program Trust, due 25/2/48 0.05 136,842
500,000 Symphony CLO XV Ltd., 4.1222%, due 17/1/32 0.18 500,152
867,136 Thunderbolt Aircraft Lease Ltd., 5.7500%, due 17/5/32 0.28 790,652
250,000 VB-S1 Issuer LLC, 3.4130%, due 15/2/48 0.09 251,563
750,000 VB-S1 Issuer LLC, 5.2500%, due 15/2/48 0.27 756,576
1,460,000 Voya CLO Ltd., 3.4768%, due 14/7/31 0.50 1,396,8241,500,000 Voya CLO Ltd., 5.3737%, due 15/7/31 0.48 1,350,664
157,295 Vx Cargo Trust, 5.4380%, due 15/12/33 0.06 158,1401,000,000 Westlake Automobile Receivables Trust,
6.0400%, due 15/1/25 0.36 1,009,8401,451,069 Willis Engine Structured Trust III,
6.3600%, due 15/8/42 0.46 1,295,7021,492,500 Wingstop Funding LLC, 2.8410%, due
5/12/50 0.54 1,511,9771,910,000 Z Capital Credit Partners CLO Ltd.,
1.6823%, due 16/1/31 0.68 1,910,4812,500,000 Z Capital Credit Partners CLO Ltd.,
2.5723%, due 16/1/31 0.89 2,500,445
DocuSign Envelope ID: 521655BF-9BE3-47DC-A9A3-494932954338

309Janus Henderson Capital Funds plc / 31 December 2021
The accompanying notes are an integral part of the financial statements.
Janus Henderson Multi-Sector Income Fund (continued)
Portfolio Investments
Shares or Principal Amount
Percentage of Net Assets
(%)Fair Value
(USD)
296,258 Zaxby's Funding LLC, 3.2380%, due
30/7/51 0.11 299,554Total Asset-Backed/Commercial Mortgage-Backed Securities 32.18 90,729,633
Common Stock (2020: 0.00% USD –)JerseyProfessional Services
356 Clarivate plc 0.00 8,373
United StatesAirlines
10,708 Southwest Airlines Co. 0.16 458,731
Total Common Stock 0.16 467,104
Corporate Bonds (2020: 52.16% USD 133,998,452)BermudaInsurance
658,000 Athene Holding Ltd., 3.5000%, due 15/1/31 0.25 696,597
BrazilEntertainment
375,000 Globo Comunicacao e Participacoes SA, 4.8750%, due 22/1/30 0.13 364,766
CanadaCommercial Services & Supplies
716,000 Garda World Security Corp., 4.6250%, due 15/2/27 0.25 713,236
Metals & Mining724,000 First Quantum Minerals Ltd., 7.5000%,
due 1/4/25 0.26 745,702695,000 Hudbay Minerals, Inc., 4.5000%, due
1/4/26 0.25 695,799681,000 Hudbay Minerals, Inc., 6.1250%, due
1/4/29 0.26 723,127842,000 IAMGOLD Corp., 5.7500%, due
15/10/28 0.29 828,5531.06 2,993,181
Pharmaceuticals1,371,000 Bausch Health Cos., Inc., 5.0000%,
due 30/1/28 0.45 1,263,479475,000 Bausch Health Cos., Inc., 4.8750%,
due 1/6/28 0.17 485,3600.62 1,748,839
Cayman IslandsConsumer Finance
9,664 Global Aircraft Leasing Co. Ltd., 6.5000%, due 15/9/24 0.00 9,337
Diversified Telecommunication Services321,000 Sable International Finance Ltd.,
5.7500%, due 7/9/27 0.12 328,945
Hotels, Restaurants & Leisure215,000 Sands China Ltd., 4.3750%, due
18/6/30 0.08 219,690
Metals & Mining425,000 CSN Inova Ventures, 6.7500%, due
28/1/28 0.16 448,037
FranceDiversified Telecommunication Services
397,000 Altice France SA, 5.5000%, due 15/10/29 0.14 391,722
Shares or Principal Amount
Percentage of Net Assets
(%)Fair Value
(USD)
GermanyAuto Components
819,000 IHO Verwaltungs GmbH, 3.8750%, due 15/5/27 0.34 952,828
Building Products100,000 HT Troplast GmbH, 9.2500%, due
15/7/25 0.04 122,970180,000 HT Troplast GmbH, 9.2500%, due
15/7/25 0.08 221,3460.12 344,316
IrelandBanks
766,000 Permanent TSB Group Holdings plc, 2.1250%, due 26/9/24 0.31 886,080
Media788,000 LCPR Senior Secured Financing DAC,
5.1250%, due 15/7/29 0.28 793,122
ItalyHotels, Restaurants & Leisure
750,123 ASR Media and Sponsorship SpA, 5.1250%, due 1/8/24 0.29 827,607
Machinery100,000 IMA Industria Macchine Automatiche
SpA, 3.7500%, due 15/1/28 0.04 113,360340,000 IMA Industria Macchine Automatiche
SpA, 3.7500%, due 15/1/28 0.14 385,4240.18 498,784
JerseyAuto Components
1,000,000 Aptiv plc, 3.1000%, due 1/12/51 0.34 954,327
LuxembourgContainers & Packaging
234,978 ARD Finance SA, 6.5000%, due 30/6/27 0.09 242,272
1,281,000 ARD Finance SA, 5.0000%, due 30/6/27 0.53 1,500,901
0.62 1,743,173
Media317,000 Altice Financing SA, 5.0000%, due
15/1/28 0.11 309,852
Real Estate Management & Development360,000 CPI Property Group SA, 4.8750%, due
16/7/25 0.15 423,717
Road & Rail1,016,000 Albion Financing 2 SARL, 8.7500%,
due 15/4/27 0.37 1,033,780
NetherlandsBanks
804,675 Stichting AK Rabobank Certificaten, 6.5000%, due 29/3/70 0.45 1,264,249
Containers & Packaging374,000 Trivium Packaging Finance BV,
5.5000%, due 15/8/26 0.14 389,368
Pharmaceuticals530,000 Teva Pharmaceutical Finance
Netherlands III BV, 3.1500%, due 1/10/26 0.18 499,032
DocuSign Envelope ID: 521655BF-9BE3-47DC-A9A3-494932954338

Janus Henderson Capital Funds plc / 31 December 2021310
The accompanying notes are an integral part of the financial statements.
Janus Henderson Multi-Sector Income Fund (continued)
Portfolio Investments
Shares or Principal Amount
Percentage of Net Assets
(%)Fair Value
(USD)
748,000 Teva Pharmaceutical Finance
Netherlands III BV, 4.7500%, due 9/5/27 0.26 742,106
0.44 1,241,138
Real Estate Management & Development500,000 AT Securities BV, 5.2500%, due
21/7/23 0.18 518,192
PanamaBanks
300,000 Banco La Hipotecaria SA, 5.5000%, due 15/9/23 0.11 310,944
1,000,000 Banco La Hipotecaria SA, 4.1250%, due 15/12/24 0.37 1,048,128
0.48 1,359,072
Hotels, Restaurants & Leisure325,000 Carnival Corp., 7.6250%, due 1/3/26 0.12 341,105
SupranationalAirlines
574,000 American Airlines, Inc., 5.5000%, due 20/4/26 0.21 597,781
Containers & Packaging520,000 Ardagh Packaging Finance plc,
4.1250%, due 15/8/26 0.19 532,350650,000 Ardagh Packaging Finance plc,
5.2500%, due 15/8/27 0.23 654,7940.42 1,187,144
Food Products969,000 JBS USA LUX SA, 6.5000%, due
15/4/29 0.38 1,067,538
SwitzerlandCapital Markets
560,000 Credit Suisse Group AG, 7.5000%, due 11/12/23 0.22 606,333
577,000 UBS Group AG, 7.0000%, due 31/1/24 0.22 622,5510.44 1,228,884
United KingdomBanks
341,000 HSBC Holdings plc, 2.3570%, due 18/8/31 0.12 333,525
Household Durables630,000 Victoria plc, 3.7500%, due 15/3/28 0.26 729,592
United StatesAir Freight & Logistics
1,523,000 Cargo Aircraft Management, Inc., 4.7500%, due 1/2/28 0.55 1,552,531
Auto Components1,377,000 Dornoch Debt Merger Sub, Inc.,
6.6250%, due 15/10/29 0.48 1,361,509
Banks884,000 Citigroup, Inc., 5.9500%, due 15/5/25 0.34 948,090601,000 JPMorgan Chase & Co., 5.0000%, due
1/8/24 0.22 617,903241,000 JPMorgan Chase & Co., 4.6000%, due
1/2/25 0.09 247,627803,000 JPMorgan Chase & Co., 2.9560%, due
13/5/31 0.30 832,2851,653,000 SVB Financial Group, 4.2500%, due
15/11/26 0.60 1,679,241
Shares or Principal Amount
Percentage of Net Assets
(%)Fair Value
(USD)
895,000 SVB Financial Group, 4.1000%, due
15/2/31 0.32 889,6301.87 5,214,776
Building Products609,000 CP Atlas Buyer, Inc., 7.0000%, due
1/12/28 0.22 606,8111,000,000 New Enterprise Stone & Lime Co., Inc.,
5.2500%, due 15/7/28 0.36 1,015,505323,000 Standard Industries, Inc., 4.3750%, due
15/7/30 0.12 330,1960.70 1,952,512
Capital Markets291,000 Bank of New York Mellon Corp. (The),
4.7000%, due 20/9/25 0.11 311,152530,000 Charles Schwab Corp. (The), 5.3750%,
due 1/6/25 0.21 579,025709,000 Charles Schwab Corp. (The), 4.0000%,
due 1/6/26 0.26 724,066563,000 Coinbase Global, Inc., 3.3750%, due
1/10/28 0.19 526,872901,000 Coinbase Global, Inc., 3.6250%, due
1/10/31 0.29 830,551431,000 Intercontinental Exchange, Inc.,
1.8500%, due 15/9/32 0.15 414,527854,000 Jane Street Group, 4.5000%, due
15/11/29 0.31 863,941382,000 Morgan Stanley, 3.2170%, due 22/4/42 0.14 400,943167,000 MSCI, Inc., 3.8750%, due 15/2/31 0.06 174,147
855,000 MSCI, Inc., 3.6250%, due 1/11/31 0.32 888,289245,000 MSCI, Inc., 3.2500%, due 15/8/33 0.09 248,137
2.13 5,961,650
Chemicals759,000 Axalta Coating Systems LLC, 3.3750%,
due 15/2/29 0.26 735,452634,000 GPD Cos., Inc., 10.1250%, due 1/4/26 0.24 676,101797,000 Iris Holdings, Inc., 8.7500%, due
15/2/26 0.29 806,9431,013,000 Olympus Water US Holding Corp.,
6.2500%, due 1/10/29 0.35 989,0981.14 3,207,594
Commercial Services & Supplies424,000 Allied Universal Holdco LLC, 6.0000%,
due 1/6/29 0.15 412,982
Construction & Engineering251,000 Arcosa, Inc., 4.3750%, due 15/4/29 0.09 254,823326,000 Weekley Homes LLC, 4.8750%, due
15/9/28 0.12 336,2720.21 591,095
Consumer Finance453,000 FirstCash, Inc., 4.6250%, due 1/9/28 0.16 453,417460,000 FirstCash, Inc., 5.6250%, due 1/1/30 0.17 469,563
0.33 922,980
Containers & Packaging550,000 LABL, Inc., 10.5000%, due 15/7/27 0.20 577,362
1,075,000 LABL, Inc., 8.2500%, due 1/11/29 0.38 1,082,9820.58 1,660,344
Diversified Telecommunication Services976,000 CCO Holdings LLC, 4.5000%, due
15/8/30 0.36 1,000,629593,000 Lumen Technologies, Inc., 7.5000%,
due 1/4/24 0.23 650,047
DocuSign Envelope ID: 521655BF-9BE3-47DC-A9A3-494932954338

311Janus Henderson Capital Funds plc / 31 December 2021
The accompanying notes are an integral part of the financial statements.
Janus Henderson Multi-Sector Income Fund (continued)
Portfolio Investments
Shares or Principal Amount
Percentage of Net Assets
(%)Fair Value
(USD)
402,000 Verizon Communications, Inc.,
2.5500%, due 21/3/31 0.14 405,999389,000 Windstream Escrow LLC, 7.7500%,
due 15/8/28 0.15 413,110666,000 Zayo Group Holdings, Inc., 4.0000%,
due 1/3/27 0.23 657,285497,000 Zayo Group Holdings, Inc., 6.1250%,
due 1/3/28 0.17 490,3051.28 3,617,375
Electric Utilities1,581,000 American Electric Power Co., Inc.,
3.8750%, due 15/2/62 0.57 1,605,942430,000 Duquesne Light Holdings, Inc.,
2.5320%, due 1/10/30 0.15 421,318624,000 IPALCO Enterprises, Inc., 4.2500%,
due 1/5/30 0.24 686,305866,000 NRG Energy, Inc., 3.3750%, due
15/2/29 0.30 849,836350,000 Toledo Edison Co. (The), 2.6500%,
due 1/5/28 0.13 355,5741.39 3,918,975
Electronic Equipment, Instruments & Components729,000 II-VI, Inc., 5.0000%, due 15/12/29 0.26 745,986810,000 Vontier Corp., 2.9500%, due 1/4/31 0.29 803,508
0.55 1,549,494
Entertainment395,000 Netflix, Inc., 3.6250%, due 15/6/30 0.19 536,853472,000 WMG Acquisition Corp., 3.0000%, due
15/2/31 0.16 452,6170.35 989,470
Equity Real Estate Investment Trusts (REITs)879,000 Broadstone Net Lease LLC, 2.6000%,
due 15/9/31 0.30 854,185592,000 CTR Partnership LP, 3.8750%, due
30/6/28 0.21 604,690799,000 Global Net Lease, Inc., 3.7500%, due
15/12/27 0.28 780,963528,000 GLP Capital LP, 4.0000%, due 15/1/31 0.20 564,128700,000 LXP Industrial Trust, 2.7000%, due
15/9/30 0.25 694,4701,312,000 Safehold Operating Partnership LP,
2.8000%, due 15/6/31 0.46 1,295,8331.70 4,794,269
Food & Staples Retailing734,000 Performance Food Group, Inc.,
4.2500%, due 1/8/29 0.26 729,361
Food Products248,000 Smithfield Foods, Inc., 3.0000%, due
15/10/30 0.09 247,281
Health Care Equipment & Supplies1,434,000 Mozart Debt Merger Sub, Inc.,
5.2500%, due 1/10/29 0.52 1,456,542300,000 Ortho-Clinical Diagnostics, Inc.,
7.3750%, due 1/6/25 0.11 316,805237,000 Ortho-Clinical Diagnostics, Inc.,
7.2500%, due 1/2/28 0.09 255,1230.72 2,028,470
Health Care Providers & Services113,000 AHP Health Partners, Inc., 5.7500%,
due 15/7/29 0.04 112,175969,000 Centene Corp., 3.0000%, due 15/10/30 0.35 986,675
Shares or Principal Amount
Percentage of Net Assets
(%)Fair Value
(USD)
545,000 Community Health Systems, Inc.,
6.8750%, due 15/4/29 0.20 556,0531,332,000 Hadrian Merger Sub, Inc., 8.5000%,
due 1/5/26 0.49 1,376,589932,000 HCA, Inc., 3.5000%, due 1/9/30 0.35 986,871552,000 ModivCare Escrow Issuer, Inc.,
5.0000%, due 1/10/29 0.20 564,575863,000 Universal Health Services, Inc.,
2.6500%, due 15/1/32 0.30 849,0111.93 5,431,949
Hotels, Restaurants & Leisure516,000 Bloomin' Brands, Inc., 5.1250%, due
15/4/29 0.19 524,808555,000 Caesars Resort Collection LLC,
5.7500%, due 1/7/25 0.21 580,3021,062,000 Full House Resorts, Inc., 8.2500%, due
15/2/28 0.40 1,116,6081,086,000 IRB Holding Corp., 7.0000%, due
15/6/25 0.41 1,150,058647,000 Life Time, Inc., 5.7500%, due 15/1/26 0.24 670,405262,000 Life Time, Inc., 8.0000%, due 15/4/26 0.10 274,828842,000 Premier Entertainment Sub LLC,
5.6250%, due 1/9/29 0.30 836,607844,000 Premier Entertainment Sub LLC,
5.8750%, due 1/9/31 0.30 848,220428,000 Sugarhouse HSP Gaming Prop Mezz
LP, 5.8750%, due 15/5/25 0.15 426,305856,000 Travel + Leisure Co., 6.6250%, due
31/7/26 0.34 950,1941,159,000 Wendy's International LLC, 7.0000%,
due 15/12/25 0.47 1,311,9363.11 8,690,271
Household Durables400,000 LGI Homes, Inc., 4.0000%, due
15/7/29 0.14 399,090231,000 Newell Brands, Inc., 4.8750%, due
1/6/25 0.09 252,075153,000 PulteGroup, Inc., 7.8750%, due 15/6/32 0.08 217,619
0.31 868,784
Industrial Conglomerates1,098,000 General Electric Co., 3.5327%, due
15/3/22 0.39 1,092,510
Insurance269,000 AssuredPartners, Inc., 5.6250%, due
15/1/29 0.09 262,053301,000 Prudential Financial, Inc., 3.7000%,
due 1/10/50 0.11 304,8340.20 566,887
Interactive Media & Services128,000 Snap, Inc., 0.7500%, due 1/8/26 0.10 277,574
IT Services811,000 Austin BidCo, Inc., 7.1250%, due
15/12/28 0.30 838,5091,935,000 Cablevision Lightpath LLC, 5.6250%,
due 15/9/28 0.68 1,910,2611,078,000 Endure Digital, Inc., 6.0000%, due
15/2/29 0.36 1,004,0551.34 3,752,825
Machinery624,000 Madison IAQ LLC, 5.8750%, due
30/6/29 0.22 624,955
DocuSign Envelope ID: 521655BF-9BE3-47DC-A9A3-494932954338

Janus Henderson Capital Funds plc / 31 December 2021312
The accompanying notes are an integral part of the financial statements.
Janus Henderson Multi-Sector Income Fund (continued)
Portfolio Investments
Shares or Principal Amount
Percentage of Net Assets
(%)Fair Value
(USD)
594,000 Mueller Water Products, Inc., 4.0000%,
due 15/6/29 0.21 600,7920.43 1,225,747
Media493,000 Block Communications, Inc., 4.8750%,
due 1/3/28 0.18 493,742496,000 CSC Holdings LLC, 7.5000%, due
1/4/28 0.19 532,7461,298,000 CSC Holdings LLC, 4.6250%, due
1/12/30 0.44 1,230,426661,000 GCI LLC, 4.7500%, due 15/10/28 0.24 679,306511,000 Gray Escrow II, Inc., 5.3750%, due
15/11/31 0.19 526,608859,000 Liberty Interactive LLC, 8.5000%, due
15/7/29 0.33 937,5171.57 4,400,345
Metals & Mining787,000 Allegheny Technologies, Inc., 5.1250%,
due 1/10/31 0.28 794,036635,000 Arconic Corp., 6.1250%, due 15/2/28 0.24 676,834534,000 Freeport-McMoRan, Inc., 5.2500%,
due 1/9/29 0.21 585,6300.73 2,056,500
Multi-Utilities576,000 CMS Energy Corp., 4.7500%, due
1/6/50 0.22 627,840
Oil, Gas & Consumable Fuels319,000 Antero Resources Corp., 7.6250%, due
1/2/29 0.13 354,596482,000 Antero Resources Corp., 5.3750%,
due 1/3/30 0.18 516,070381,000 CNX Resources Corp., 6.0000%, due
15/1/29 0.14 396,775196,000 DCP Midstream Operating LP,
5.6000%, due 1/4/44 0.09 244,102671,000 DT Midstream, Inc., 4.1250%, due
15/6/29 0.24 688,053651,000 EnLink Midstream LLC, 5.6250%, due
15/1/28 0.24 677,990396,000 Great Western Petroleum LLC,
12.0000%, due 1/9/25 0.15 417,780484,000 Hess Midstream Operations LP,
4.2500%, due 15/2/30 0.17 481,195848,000 Howard Midstream Energy Partners
LLC, 6.7500%, due 15/1/27 0.31 869,989647,000 NGL Energy Operating LLC, 7.5000%,
due 1/2/26 0.24 668,095268,000 Rockies Express Pipeline LLC,
4.9500%, due 15/7/29 0.10 285,755516,000 Southwestern Energy Co., 5.3750%,
due 15/3/30 0.20 553,7922.19 6,154,192
Pharmaceuticals827,000 HLF Financing SARL LLC, 4.8750%,
due 1/6/29 0.29 812,652
Professional Services673,000 AMN Healthcare, Inc., 4.0000%, due
15/4/29 0.24 683,220330,000 KBR, Inc., 4.7500%, due 30/9/28 0.12 337,088
0.36 1,020,308
Real Estate Management & Development1,077,000 Realogy Group LLC, 9.3750%, due
1/4/27 0.41 1,164,350
Shares or Principal Amount
Percentage of Net Assets
(%)Fair Value
(USD)
654,000 Realogy Group LLC, 5.7500%, due
15/1/29 0.24 671,3470.65 1,835,697
Road & Rail351,000 PECF USS Intermediate Holding III
Corp., 8.0000%, due 15/11/29 0.13 364,0011,459,000 Watco Cos. LLC, 6.5000%, due
15/6/27 0.54 1,518,8190.67 1,882,820
Software1,053,000 Fair Isaac Corp., 4.0000%, due
15/6/28 0.38 1,084,232889,000 Rocket Software, Inc., 6.5000%, due
15/2/29 0.31 868,5570.69 1,952,789
Specialty Retail192,000 Carvana Co., 5.5000%, due 15/4/27 0.07 190,282846,000 Carvana Co., 4.8750%, due 1/9/29 0.29 807,042
1,023,000 Lithia Motors, Inc., 4.3750%, due 15/1/31 0.39 1,093,521
663,000 LSF9 Atlantis Holdings LLC, 7.7500%, due 15/2/26 0.24 671,178
593,000 Rent-A-Center, Inc., 6.3750%, due 15/2/29 0.22 619,045
355,000 SRS Distribution, Inc., 6.1250%, due 1/7/29 0.13 362,292
450,000 SRS Distribution, Inc., 6.0000%, due 1/12/29 0.16 452,954
409,000 White Cap Parent LLC, 8.2500%, due 15/3/26 0.15 420,229
1.65 4,616,543
Thrifts & Mortgage Finance953,000 MGIC Investment Corp., 5.2500%, due
15/8/28 0.36 1,001,998986,000 Rocket Mortgage LLC, 3.8750%, due
1/3/31 0.36 1,002,3080.72 2,004,306
Total Corporate Bonds 41.59 116,922,731
Government Obligations (2020: 0.36% USD 935,307)US Treasury Notes/Bonds
21,200,000 0.0000%, due 4/1/22 7.53 21,200,021
Total Government Obligations 7.53 21,200,021
Mortgage-Backed Securities (2020: 21.93% USD 56,357,011)Fannie Mae
842 6.0000%, due 1/2/37 0.00 9731,124,748 3.0000%, due 1/2/43 0.42 1,185,488
942 3.0000%, due 1/2/43 0.00 9962,262 3.0000%, due 1/5/43 0.00 2,3937,622 5.0000%, due 1/7/44 0.00 8,5114,684 4.5000%, due 1/10/44 0.00 5,2256,967 4.5000%, due 1/3/45 0.00 7,77110,116 4.5000%, due 1/2/46 0.00 11,149
15,666 3.5000%, due 1/7/46 0.01 16,91143,189 4.0000%, due 1/5/47 0.02 47,4033,027 3.5000%, due 1/8/47 0.00 3,2094,245 3.5000%, due 1/1/48 0.00 4,55915,154 4.0000%, due 1/1/48 0.01 16,50216,770 3.0000%, due 1/2/48 0.01 17,7555,295 4.0000%, due 1/3/48 0.00 5,758
81,930 3.5000%, due 1/7/48 0.03 87,34758,672 3.0000%, due 1/9/49 0.02 61,424
DocuSign Envelope ID: 521655BF-9BE3-47DC-A9A3-494932954338

313Janus Henderson Capital Funds plc / 31 December 2021
The accompanying notes are an integral part of the financial statements.
Janus Henderson Multi-Sector Income Fund (continued)
Portfolio Investments
Shares or Principal Amount
Percentage of Net Assets
(%)Fair Value
(USD)
167,793 2.5000%, due 1/1/50 0.06 172,08024,642 2.5000%, due 1/8/51 0.01 25,195
367,003 2.0000%, due 1/9/51 0.13 366,241868 3.0000%, due 1/6/57 0.00 921
200,318 5.1028%, due 25/7/25 0.07 205,257321,438 5.8028%, due 25/4/28 0.12 338,569
2,716,000 2.3028%, due 25/1/30 0.98 2,770,19123,689 53.9083%, due 25/10/40 0.03 86,79519,489 3.0000%, due 25/5/48 0.01 20,296
1.93 5,468,919
Freddie Mac2,373 3.5000%, due 1/1/47 0.00 2,560
496,000 3.8027%, due 25/12/30 0.18 511,776526,000 3.0997%, due 25/1/34 0.19 527,921669,000 5.3528%, due 25/9/50 0.25 695,927558,570 4.0497%, due 25/11/50 0.21 582,488579,000 2.3497%, due 25/8/33 0.21 588,552
1.04 2,909,224
Freddie Mac Pool3,622 3.0000%, due 1/1/33 0.00 3,80717,728 6.0000%, due 1/4/40 0.01 20,5774,863 3.5000%, due 1/2/43 0.00 5,24917,311 3.0000%, due 1/3/43 0.01 18,238
19,320 3.0000%, due 1/6/43 0.01 20,1076,058 3.5000%, due 1/2/44 0.00 6,5393,707 4.5000%, due 1/5/44 0.00 4,101
15,001 3.5000%, due 1/12/44 0.01 16,1043,024 3.0000%, due 1/1/45 0.00 3,1803,515 3.5000%, due 1/7/46 0.00 3,782
19,124 3.0000%, due 1/10/46 0.01 20,0851,611 4.0000%, due 1/3/47 0.00 1,743
5,248 3.5000%, due 1/9/47 0.00 5,56417,329 3.5000%, due 1/12/47 0.01 18,676
3,117 3.5000%, due 1/2/48 0.00 3,3351,761 4.0000%, due 1/4/48 0.00 1,910
47,836 4.5000%, due 1/4/49 0.02 51,2329,773 3.0000%, due 1/10/49 0.00 10,137
27,750 3.0000%, due 1/10/49 0.01 28,78418,576 3.0000%, due 1/11/49 0.01 19,26784,191 3.0000%, due 1/11/49 0.03 87,326
266,695 3.0000%, due 1/12/49 0.10 276,625122,691 3.0000%, due 1/12/49 0.05 127,25940,484 3.0000%, due 1/12/49 0.01 41,99168,653 2.5000%, due 1/1/50 0.02 70,41020,522 3.0000%, due 1/3/50 0.01 21,261
229,006 2.5000%, due 1/8/51 0.08 233,981394,842 2.0000%, due 1/9/51 0.14 394,105
0.54 1,515,375
Ginnie Mae13,749 4.5000%, due 15/8/46 0.01 15,5664,819 4.0000%, due 15/7/47 0.00 5,181
635 4.0000%, due 15/8/47 0.00 6821,377 4.0000%, due 15/11/47 0.00 1,4802,518 4.0000%, due 15/12/47 0.00 2,707
34,637 4.5000%, due 20/2/48 0.01 37,2331,200 4.5000%, due 20/5/48 0.00 1,2824,521 4.5000%, due 20/5/48 0.00 4,830
3,251,492 2.0000%, due 15/1/52 1.17 3,281,6443,620,633 2.5000%, due 15/1/52 1.32 3,711,1234,200,193 3.0000%, due 15/1/52 1.54 4,348,3333,185,641 3.5000%, due 15/1/52 1.18 3,318,414
Shares or Principal Amount
Percentage of Net Assets
(%)Fair Value
(USD)
1,592,197 4.0000%, due 15/1/52 0.60 1,676,623
5.83 16,405,098
UMBS895,027 1.5000%, due 25/1/37 0.32 898,1321,367,164 2.0000%, due 25/1/37 0.50 1,400,824821,750 2.5000%, due 25/1/37 0.30 850,273
1,182,100 3.0000%, due 25/1/37 0.44 1,236,268452,900 3.5000%, due 25/1/37 0.17 477,044
67,000 4.0000%, due 25/1/37 0.02 70,55714,172,119 2.0000%, due 25/1/52 5.02 14,133,1442,524,932 2.5000%, due 25/1/52 0.92 2,578,04424,113,024 3.0000%, due 25/1/52 8.87 24,986,671
665,000 4.5000%, due 25/1/52 0.25 712,9057,956,868 3.5000%, due 25/2/52 2.97 8,370,254
19.78 55,714,116
Total Mortgage-Backed Securities 29.12 82,012,732
Preferred Stock (2020: 1.10% USD 2,834,676)JerseyProfessional Services
7,700 Clarivate plc, 5.2500%, due 1/6/24 0.25 699,622
United StatesElectric Utilities
2,417 American Electric Power Co., Inc., 6.1250%, due 15/8/23 0.05 127,134
Health Care Equipment & Supplies6,050 Becton Dickinson and Co., 6.0000%,
due 1/6/23 0.11 319,137
Total Preferred Stock 0.41 1,145,893
Tranche Loans (2020: 5.32% USD 13,663,306)FinlandCapital Markets
489,312 Spa Holdings 3 Oy, 4.7500%, due 4/2/28 0.17 490,535
GermanyChemicals
361,185 INEOS Styrolution Group Gmbh, 3.2500%, due 29/1/26 0.13 360,584
LuxembourgProfessional Services
987,562 Loire UK Midco 3 Ltd., 3.3404%, due 21/4/27 0.35 977,687
United KingdomEntertainment
1,096,125 Formula One Management Ltd., 3.5000%, due 1/2/24 0.39 1,096,580
United StatesBuilding Products
512,480 Cornerstone Building Brands, Inc., 3.7500%, due 12/4/28 0.18 512,322
205,255 CP Atlas Buyer, Inc., 4.2500%, due 23/11/27 0.07 204,639
278,893 Watlow Electric Manufacturing Co., 4.2500%, due 2/3/28 0.10 278,980
0.35 995,941
Chemicals515,000 Aruba Investments Holdings LLC,
8.5000%, due 24/11/28 0.18 520,150
DocuSign Envelope ID: 521655BF-9BE3-47DC-A9A3-494932954338

Janus Henderson Capital Funds plc / 31 December 2021314
The accompanying notes are an integral part of the financial statements.
Janus Henderson Multi-Sector Income Fund (continued)
Portfolio Investments
Shares or Principal Amount
Percentage of Net Assets
(%)Fair Value
(USD)
421,372 Geon Performance Solutions LLC,
5.5000%, due 18/8/28 0.15 425,5860.33 945,736
Diversified Financial Services607,774 Tacala Investment Corp., 4.2500%,
due 5/2/27 0.22 607,461392,800 Trans Union LLC, 3.7500%, due
12/11/27 0.14 392,9650.36 1,000,426
Diversified Telecommunication Services257,292 Acuris Finance US, Inc., 4.5000%, due
16/2/28 0.09 258,532100,675 Consolidated Communications, Inc.,
4.2500%, due 2/10/27 0.04 100,6590.13 359,191
Entertainment403,391 Lions Gate Capital Holdings LLC,
1.8543%, due 22/3/23 0.14 401,374882,333 Playtika Holding Corp., 2.8543%, due
13/3/28 0.31 879,9410.45 1,281,315
Food Products319,206 Sovos Brands Intermediate, Inc.,
4.5000%, due 8/6/28 0.11 319,572
Health Care Providers & Services173,258 National Mentor Holdings, Inc.,
8.0000%, due 2/3/29 0.06 173,041771,098 Surgery Center Holdings, Inc.,
4.5000%, due 31/8/26 0.27 771,8230.33 944,864
Hotels, Restaurants & Leisure546,782 Enterprise Development Authority,
5.0000%, due 28/2/28 0.19 547,012897,539 Golden Entertainment, Inc., 3.7500%,
due 21/10/24 0.32 897,355707,594 MIC Glen LLC, 7.2500%, due 20/7/29 0.25 710,541
0.76 2,154,908
Machinery1,052,990 Fairbanks Morse Defense LLC,
9.0000%, due 15/6/29 0.37 1,055,622
Multiline Retail374,307 Driven Holdings LLC, 3.5169%, due
17/11/28 0.13 374,775
Personal Products466,766 Journey Personal Care Corp., 5.0000%,
due 1/3/28 0.17 467,156
Pharmaceuticals394,737 Sharp Midco LLC, due 14/12/28 0.14 395,230
Road & Rail917,829 PECF USS Intermediate Holding III
Corp., 4.7500%, due 15/12/28 0.33 919,962
Software295,000 Cloudera, Inc., 6.5000%, due 8/10/29 0.10 295,737428,000 Cornerstone OnDemand, Inc.,
4.2500%, due 16/10/28 0.15 427,311494,738 Epicor Software Corp., 4.0000%, due
30/7/27 0.18 494,992678,000 Mitchell International, Inc., 4.2500%,
due 15/10/28 0.24 675,034683,000 Proofpoint, Inc., 3.7500%, due 31/8/28 0.24 681,241
Shares or Principal Amount
Percentage of Net Assets
(%)Fair Value
(USD)
660,833 Realpage, Inc., 3.7500%, due 24/4/28 0.23 659,700222,513 UKG, Inc., 3.7500%, due 4/5/26 0.08 221,724316,950 UKG, Inc., 5.7500%, due 3/5/27 0.11 318,866
1.33 3,774,605
Specialty Retail196,716 84 Lumber Co., 3.7500%, due 13/11/26 0.07 197,188257,316 Kodiak BP LLC, 4.0000%, due 12/3/28 0.09 255,868518,156 White Cap Buyer LLC, 4.5000%, due
19/10/27 0.18 519,273163,629 Woof Holdings, Inc., 8.0000%, due
21/12/28 0.06 165,3680.40 1,137,697
Technology Hardware, Storage & Peripherals733,000 Magenta Buyer LLC, 9.0000%, due
27/7/29 0.26 730,024
Textiles, Apparel & Luxury Goods480,244 Boardriders, Inc., 7.5000%, due
23/4/24 0.10 276,140
Total Tranche Loans 7.09 20,058,550
Total Investments (Cost: USD 331,012,491) 118.08 332,536,664
Credit Default Swaps† (2020: 0.00% USD –).
Percentage of Net Unrealized
Reference Notional Maturity Assets GainCounterparty Asset Amount Date (%) (USD)
Citigroup
Sell protection on CDX.NA.HY.37-V1 Receive USD fixed 5.00% 2,600,000 20-Dec-26 0.09 239,110
Citigroup
Sell protection on CDX.NA.HY.37-V1 Receive USD fixed 5.00% 700,000 20-Dec-26 0.02 64,376
Total 0.11 303,486
Forward Currency Contracts (2020: 0.15% USD 392,305)Open as at 31 December 2021.
Current Market
Percentage of Net Unrealised
Currency Currency Value Settle Assets GainPurchased Sold (USD) Date (%) (USD)
.J.P. Morgan EUR◊ 3,278 USD 3,678 3,734 31-Jan-22 0.00 56
JPY◊ 3,182,835,789 USD 27,600,047 27,675,642 31-Jan-22 0.03 75,595
SGD◊ 8,626 USD 6,302 6,400 31-Jan-22 0.00 98
Total 0.03 75,749
.
DocuSign Envelope ID: 521655BF-9BE3-47DC-A9A3-494932954338

315Janus Henderson Capital Funds plc / 31 December 2021
The accompanying notes are an integral part of the financial statements.
Janus Henderson Multi-Sector Income Fund (continued)
Portfolio Investments
Futures° (2020: 0.03% USD 64,957).
Counterparty No of Contracts
Percentage of Net
Assets (%)
Unrealised Gain
(USD)
Goldman Sachs 223 US 10 Year Note 0.02 72,508Goldman Sachs 341 US 5 Year Note 0.06 172,823Goldman Sachs 13 US Long Bond 0.01 22,075Total 0.09 267,406
.
Total Financial Assets at fair value through profit or loss 118.31 333,183,305
Financial Liabilities at fair value through profit or loss.Forward Currency Contracts (2020: (0.05)% USD (144,724))Open as at 31 December 2021
Current Market
Percentage of Net Unrealised
Currency Currency Value Settle Assets LossPurchased Sold (USD) Date (%) (USD)
Citibank USD 8,781,106 EUR 7,738,696 8,819,113 22-Feb-22 (0.01) (38,007)
J.P. Morgan USD 2,699,512 GBP 2,000,000 2,706,588 22-Feb-22 0.00 (7,076)
Total (0.01) (45,083).
Futures° (2020: (0.01)% USD (14,365))
Counterparty No of Contracts
Percentage of Net
Assets (%)
Unrealised Loss
(USD)
Goldman Sachs (164) US 10 Year Ultra Bond (0.12) (346,134)Goldman Sachs 60 US 2 Year Note 0.00 (8,026)Goldman Sachs (17) US Ultra Bond (0.02) (53,278)Total (0.14) (407,438)
.
Total Financial Liabilities at fair value through profit or loss (0.15) (452,521)
Portfolio Analysis (Unaudited)
Analysis of Total Assets:% of Total
AssetsTransferable securities admitted to official stock exchange listing 6.84Transferable securities dealt in on another regulated market 84.14Financial derivative instruments dealt in on a regulated market 0.16OTC financial derivative instruments 0.02Other Assets 8.84Total Assets 100.00
† Cleared through ICE (Central Counterparty Clearing House “CCP”).◊ These forward currency contracts are used for share class hedging.° Refer to Note 5 for details of collateral held.
DocuSign Envelope ID: 521655BF-9BE3-47DC-A9A3-494932954338

Janus Henderson Capital Funds plc / 31 December 2021316
The accompanying notes are an integral part of the financial statements.
Janus Henderson Multi-Sector Income Fund (continued)
Fair Value Hierarchy
The tables below provide the fair value hierarchy summary of the Fund’s financial assets and liabilities measured at fair value at 31 December 2021 and 31 December 2020.
31 December 2021
Level 1 - Quoted Prices
(USD)
Level 2 - Other Significant
Observable Inputs (USD)
Level 3 - Significant
Unobservable Inputs (USD)
Total (USD)
Asset-Backed/Commercial Mortgage-Backed Securities – 90,729,633 – 90,729,633Common Stock 467,104 – – 467,104Corporate Bonds – 116,922,731 – 116,922,731Credit Default Swaps – 303,486 – 303,486Forward Currency Contracts – 30,666 – 30,666Futures (140,032) – – (140,032)Government Obligations – 21,200,021 – 21,200,021Mortgage-Backed Securities – 82,012,732 – 82,012,732Preferred Stock 1,145,893 – – 1,145,893Tranche Loans – 20,058,550 – 20,058,550Total Investments in Securities 1,472,965 331,257,819 – 332,730,784
31 December 2020
Level 1 - Quoted Prices
(USD)
Level 2 - Other Significant
Observable Inputs (USD)
Level 3 - Significant
Unobservable Inputs (USD)
Total (USD)
Asset-Backed/Commercial Mortgage-Backed Securities – 71,231,365 – 71,231,365Corporate Bonds – 133,998,452 – 133,998,452Forward Currency Contracts – 247,581 – 247,581Futures 50,592 – – 50,592Government Obligations – 935,307 – 935,307Mortgage-Backed Securities – 56,357,011 – 56,357,011Preferred Stock 1,643,115 1,191,5611 – 2,834,676Tranche Loans – 13,663,306 – 13,663,306Total Investments in Securities 1,693,707 277,624,583 – 279,318,290
1At 31 December 2020, the administrator used a systematic fair valuation model provided by an independent third party to value listed securities in order to adjust for stale pricing between the close of foreign exchanges and the valuation point. This resulted in a change to preferred stocks with a fair value of USD 1,191,561.
There were transfers on Government Obligations from level 1 to level 2 during the financial year ended 31 December 2020.
There were no investments held by the Fund at 31 December 2021 and 31 December 2020 that were fair valued at level 3 by the Janus Henderson Global Pricing Committee.
Valuation policy of private placements is referenced in note 2 of the financial statements.
DocuSign Envelope ID: 521655BF-9BE3-47DC-A9A3-494932954338

317Janus Henderson Capital Funds plc / 31 December 2021
Janus Henderson Multi-Sector Income Fund (continued)
The accompanying notes are an integral part of the financial statements.
Capital Share Transactions
For the financial year ended 31 December 2021
A2 HEUR A2 HSGD A2 SGD A2 USD A3m USD A4m HSGD A4m SGD A4m USDShares Shares Shares Shares Shares Shares Shares Shares
At beginning of the year . . . . . . . 276 408 408 4,559,660 302 430 430 216,627Shares issued – – – 722,558 12 23 23 90,135Shares redeemed. . . . . . . . . . . – – – (864,319) – – – (57,478)At end of year . . . . . . . . . . . . . 276 408 408 4,417,899 314 453 453 249,284
E2 USD E3m USD E4m USD H2 USD H3m USD I2 USD I3m USD I4m USDShares Shares Shares Shares Shares Shares Shares Shares
At beginning of the year . . . . . . . 3,136,416 302 110,275 13,286 313 13,411,121 302 34,970Shares issued 224,673 12 903 – 13 6,551,093 12 16Shares redeemed. . . . . . . . . . . (649,703) – (39,147) (7,940) – (3,790,187) – –At end of year . . . . . . . . . . . . . 2,711,386 314 72,031 5,346 326 16,172,027 314 34,986
Z3 HJPYShares
At beginning of the year . . . . . . . 320,000Shares issued –Shares redeemed. . . . . . . . . . . –At end of year . . . . . . . . . . . . . 320,000
For the financial year ended 31 December 2020
A2 HEUR A2 HSGD A2 SGD A2 USD A3m USD A4m HSGD A4m SGD A4m USDShares Shares Shares Shares Shares Shares Shares Shares
At beginning of the year . . . . . . . – 408 408 5,659,229 – 408 408 87,013Shares issued 276 – – 2,022,771 302 22 22 136,607Shares redeemed. . . . . . . . . . . – – – (3,122,340) – – – (6,993)At end of year . . . . . . . . . . . . . 276 408 408 4,559,660 302 430 430 216,627
E2 USD E3m USD E4m USD H2 USD H3m USD I2 USD I3m USD I4m USDShares Shares Shares Shares Shares Shares Shares Shares
At beginning of the year . . . . . . . 4,238,501 – 59,392 999,100 300 1,851,842 – 38,608Shares issued 729,791 302 118,572 14,975 13 11,940,861 302 48,904Shares redeemed. . . . . . . . . . . (1,831,876) – (67,689) (1,000,789) – (381,582) – (52,542)At end of year . . . . . . . . . . . . . 3,136,416 302 110,275 13,286 313 13,411,121 302 34,970
Z3 HJPYShares
At beginning of the year . . . . . . . 320,000Shares issued –Shares redeemed. . . . . . . . . . . –At end of year . . . . . . . . . . . . . 320,000
DocuSign Envelope ID: 521655BF-9BE3-47DC-A9A3-494932954338

Janus Henderson Capital Funds plc / 31 December 2021318
Janus Henderson Multi-Sector Income Fund (continued)
The accompanying notes are an integral part of the financial statements.
Net Asset Comparison
31 December 2021 31 December 2020 31 December 2019
Net Assets (USD)
NAV Per Share
(Local Currency)Net Assets
(USD)
NAV Per Share
(Local Currency)Net Assets
(USD)
NAV Per Share
(Local Currency)
A2 HEUR 3,751 11.92 3,985 11.80 – –A2 HSGD 3,217 10.62 3,219 10.42 3,049 10.04A2 SGD 3,201 10.56 3,142 10.17 3,009 9.91A2 USD 47,163,398 10.68 47,787,747 10.48 56,838,757 10.04A3m USD 3,156 10.06 3,098 10.27 – –A4m HSGD 3,215 9.57 3,219 9.88 3,049 10.04A4m SGD 3,200 9.53 3,142 9.65 3,009 9.91A4m USD 2,401,620 9.63 2,154,332 9.94 874,240 10.05E2 USD 28,655,749 10.57 32,703,129 10.43 42,563,455 10.04E3m USD 3,137 10.00 3,095 10.26 – –E4m USD 687,357 9.54 1,091,589 9.90 596,554 10.04H2 USD 57,806 10.81 140,219 10.55 10,039,666 10.05H3m USD 3,247 9.97 3,167 10.11 3,015 10.05I2 USD 174,579,665 10.79 141,348,284 10.54 18,605,265 10.05I3m USD 3,176 10.12 3,101 10.28 – –I4m USD 341,185 9.75 350,151 10.01 387,866 10.05Z3 HJPY 27,677,201 9,949.09 31,304,003 10,101.00 29,557,829 10,035.00
. . .
Total Expense Ratio (unaudited)
The Average Total Expense Ratio table shows the actual expenses, excluding transactions costs and trade commissions, incurred by each Class for the Fund during the reporting financial year expressed as a percentage of the average net assets for the corresponding year, on an annualised basis.
31 December 2021 31 December 2020 31 December 2019A2 HEUR 1.35% 1.35% –A2 HSGD 1.35% 1.25% 1.32%A2 SGD 1.35% 1.26% 1.33%A2 USD 1.34% 1.32% 1.35%A3m USD 1.28% 1.23% –A4m HSGD 1.35% 1.25% 1.32%A4m SGD 1.35% 1.25% 1.33%A4m USD 1.33% 1.35% 1.35%E2 USD 1.84% 1.85% 1.85%E3m USD 1.85% 1.73% –E4m USD 1.83% 1.80% 1.85%H2 USD 0.75% 0.69% 0.75%H3m USD 0.61% 0.64% 0.75%I2 USD 0.81% 0.82% 0.95%I3m USD 0.73% 0.73% –I4m USD 0.81% 0.72% 0.95%
Distributions per share (unaudited)
The following table shows the distribution rate per share at Ex-date for each distributing share class:
Share Class (Local Currency) 15/01/2021 12/02/2021 15/03/2021 15/04/2021 14/05/2021 15/06/2021 15/07/2021 13/08/2021 15/09/2021 15/10/2021 15/11/2021 15/12/2021A3m USD 0.03368 0.03133 0.03532 0.03651 0.03333 0.03652 0.03561 0.02943 0.03386 0.03156 0.02913 0.03444A4m HSGD 0.04200 0.03812 0.03892 0.04445 0.03901 0.04320 0.04047 0.03893 0.04447 0.03993 0.03829 0.04201A4m SGD 0.04107 0.03730 0.03864 0.04384 0.03839 0.04231 0.04042 0.03904 0.04413 0.03977 0.03822 0.04250A4m USD 0.04227 0.03836 0.03916 0.04470 0.03925 0.04346 0.04071 0.03917 0.04475 0.04018 0.03852 0.04225E3m USD 0.03368 0.03123 0.03525 0.03635 0.03330 0.03639 0.03554 0.02933 0.03370 0.03143 0.02903 0.03432E4m USD 0.04206 0.03816 0.03894 0.04443 0.03900 0.04317 0.04042 0.03888 0.04439 0.03984 0.03818 0.04186H3m USD 0.03326 0.03087 0.03474 0.03582 0.03295 0.03598 0.03516 0.02908 0.03344 0.03122 0.02885 0.03412I3m USD 0.03375 0.03137 0.03535 0.03654 0.03346 0.03659 0.03561 0.02969 0.03402 0.03165 0.02929 0.03467I4m USD 0.04257 0.03865 0.03947 0.04508 0.03959 0.04386 0.04111 0.03957 0.04522 0.04062 0.03896 0.04276Z3 HJPY – – – – – – – – – 429.62000 – –
– – – – – – – – – – – –
DocuSign Envelope ID: 521655BF-9BE3-47DC-A9A3-494932954338

319Janus Henderson Capital Funds plc / 31 December 2021
Janus Henderson Multi-Sector Income Fund (continued)
The accompanying notes are an integral part of the financial statements.
Fund Performance (unaudited)
As at 31 December 2021
One year Three years Five yearsSince
inception
Performance (Annualised) 31/12/2020 31/12/2021
%
31/12/2017 31/12/2021
%
31/12/2015 31/12/2021
%
to 31/12/2021
%
H2 USD (Net)** 2.46 –* –* 3.22***Bloomberg Barclays US Aggregate Bond TR (1.54) –* –* 2.75
.
Discrete performance
31/12/2020 31/12/2021
%
31/12/2019 31/12/2020
%
31/12/2018 31/12/2019
%
31/12/2017 31/12/2018
%
31/12/2016 31/12/2017
%
H2 USD (Net)** 2.46 4.38*** –* –* –*Bloomberg Barclays U.S. Aggregate Bond TR (1.54) 7.51 –* –* –*
H2 USD (Gross)** 3.23 5.79*** –* –* –*Bloomberg Barclays U.S. Aggregate Bond TR + 1.25% (0.31) 8.85 –* –* –*
. . . . .*The Fund had launched on 4 December 2019, hence no performance numbers disclosed.
Class H2 USD is disclosed as it is the representative share class.
** The representative share class has changed from the A2 USD to the H2 USD share class with effect from August 2021.
*** Historical figures are based on the A2 USD share class.
Performance target: To outperform the Bloomberg Barclays US Aggregate Bond Index by 1.25% per annum, before the deduction of charges, over any 5 year period.
The Total Expense Ratio includes fees payable to Distributors. Where the Total Expense Ratio exceeds the target outperformance relative to the benchmark the return is likely to be below the benchmark return, even when the Fund’s outperformance target (before the deduction of charges) has been achieved.
Please note the Gross Returns 5 year annualised table is only applicable for share classes which have been active for 5 or more years and the performance target is to be achieved over a specific annualised time period. Performance target and index shown in USD.
Past performance does not guarantee future returns. The rates of return will vary and the principal value of an investment will fluctuate. Shares, if redeemed, may be worth more or less than their original cost. The performance data does not take account of the commissions and costs incurred on the issue and redemption of Shares. All returns are calculated in the base currency of the representative Share Class.
There is no guarantee that the Fund’s performance will match or exceed the benchmark.
DocuSign Envelope ID: 521655BF-9BE3-47DC-A9A3-494932954338

Janus Henderson Capital Funds plc / 31 December 2021320
Janus Henderson Multi-Sector Income Fund (continued)
Statements of Changes in Composition of Portfolio (unaudited)The tables below show a breakdown of material purchases and sales of the Investment Portfolio in accordance with Central Bank UCITS Regulations 79(2) requirements. All purchases and sales of investments exceeding 1% of the total value of each transaction respectively, are disclosed, with a minimum number of 20 of each such transaction. A full analysis of the movement on the Investment Portfolio is available upon request from the registered office.
Major Purchases for the year ended 31 December 2021
Shares or Principal Amount
Cost (USD)
Credit Agricole Corporate And Investment Bank, 0.0000%, due 7/10/21 28,700,000 28,699,952Credit Agricole Corporate And Investment Bank, 0.0000%, due 22/9/21 28,400,000 28,399,968Credit Agricole Corporate And Investment Bank, 0.0000%, due 16/9/21 28,300,000 28,299,969Credit Agricole Corporate And Investment Bank, 0.0000%, due 16/11/21 28,200,000 28,199,961Credit Agricole Corporate And Investment Bank, 0.0000%, due 17/11/21 28,200,000 28,199,961Credit Agricole Corporate And Investment Bank, 0.0000%, due 18/11/21 28,200,000 28,199,961GNMA II, 2.0000%, due 15/2/52 27,075,268 28,135,011Credit Agricole Corporate And Investment Bank, 0.0000%, due 10/8/21 28,100,000 28,099,961Credit Agricole Corporate And Investment Bank, 0.0000%, due 30/8/21 28,000,000 27,999,883UMBS, 2.0000%, due 25/10/51 27,593,892 27,777,110Credit Agricole Corporate And Investment Bank, 0.0000%, due 27/8/21 27,700,000 27,699,969Credit Agricole Corporate And Investment Bank, 0.0000%, due 20/12/21 27,600,000 27,599,885Credit Industriel et Commercial, 0.0000%, due 6/8/21 27,200,000 27,199,947Credit Agricole Corporate And Investment Bank, 0.0000%, due 26/8/21 27,100,000 27,099,962UMBS, 3.5000%, due 25/2/52 25,522,868 27,036,393Credit Agricole Corporate And Investment Bank, 0.0000%, due 1/9/21 27,000,000 26,999,977Credit Agricole Corporate And Investment Bank, 0.0000%, due 10/9/21 27,000,000 26,999,970Credit Agricole Corporate And Investment Bank, 0.0000%, due 14/9/21 27,000,000 26,999,970Credit Agricole Corporate And Investment Bank, 0.0000%, due 21/9/21 27,000,000 26,999,970Credit Agricole Corporate And Investment Bank, 0.0000%, due 3/9/21 27,000,000 26,999,970
Major Sales for the year ended 31 December 2021
Shares or Principal Amount
Proceeds (USD)
GNMA II, 2.0000%, due 15/2/52 27,075,268 28,050,930UMBS, 2.0000%, due 25/10/51 27,593,892 27,618,070UMBS, 2.5000%, due 25/2/37 23,972,000 25,100,341UMBS, 3.0000%, due 15/12/51 24,113,024 25,010,198UMBS, 2.0000%, due 25/12/51 21,779,161 21,803,518UMBS, 3.0000%, due 25/11/51 20,854,510 21,788,129UMBS, 3.5000%, due 25/2/52 17,566,000 18,713,279UMBS, 3.5000%, due 25/3/52 17,566,000 18,639,859UMBS, 2.5000%, due 25/7/51 17,047,801 17,676,223UMBS, 2.5000%, due 25/9/51 15,313,345 15,878,790UMBS, 2.5000%, due 25/11/51 14,965,542 15,369,797UMBS, 2.5000%, due 25/1/52 13,832,164 14,564,758UMBS, 2.0000%, due 25/11/51 14,172,119 14,212,049GNMA II, 2.0000%, due 15/1/52 13,537,634 14,128,848UMBS, 2.5000%, due 25/10/51 13,444,526 13,834,207UMBS, 3.0000%, due 25/9/51 12,113,885 12,678,141UMBS, 2.5000%, due 25/1/37 11,986,000 12,532,589UMBS, 4.0000%, due 25/2/52 11,658,000 12,516,867UMBS, 4.0000%, due 25/3/52 11,658,000 12,516,639UMBS, 3.0000%, due 25/8/51 11,674,890 12,233,552UMBS, 2.5000%, due 25/8/51 11,668,286 12,133,961
DocuSign Envelope ID: 521655BF-9BE3-47DC-A9A3-494932954338

Janus Henderson US Short-Term Bond Fund
321Janus Henderson Capital Funds plc / 31 December 2021
Fund Overview (unaudited)Investment Objective and Policy
The Fund aims to provide as high a level of income as is consistent with the aim of limiting losses to capital over the long term.
Performance target: To outperform the Bloomberg Barclays 1-3 Year US Government/Credit Index by 0.75% per annum, before the deduction of charges, over any 5 year period.
The Fund invests at least 80% of its assets in US short-term and intermediate-term bonds, issued by governments or companies.
The Fund is actively managed with reference to the Bloomberg Barclays 1-3 Year US Government/Credit Index, which is broadly representative of the bonds in which it may invest, as this forms the basis of the Fund’s performance target. The investment manager has discretion to choose investments for the Fund with weightings different to the index or not in the index, but at times the Fund may hold investments similar to the index.
How Sustainability Risks are part of the investment processThe investments underlying this financial product (referred to as the Fund) do not take into account the EU criteria for environmentally sustainable economic activities, although the Manager and the Investment Manager have agreed a decision making process that will apply to investment decisions relating to the Fund as further detailed in the Prospectus.
The likely impacts of sustainability risks on the returns of the FundWhile the analysis of (Environmental, Social and Governance) ESG factors is an integral component across the Investment Manager’s investment capabilities and one of a number of inputs to the selection of investments and portfolio construction, the investment process of the Investment Manager is primarily designed to maximise long-term risk-adjusted returns for investors. Therefore, in managing the Fund, the Investment Manager does not maximise portfolio alignment with sustainability risks as a separate goal in its own right nor does it precisely attribute the impact of ESG factors on returns for the Fund.
Fund Overview
Greg Wilensky, Michael Keough and Seth Meyer, portfolio managers
For the year ended 31 December 2021, the Janus Henderson US Short-Term Bond Fund H2 US dollar terms returned -0.09% (Net) and 0.45% (Gross), compared with -0.47% and 0.27% Target (Gross) for the Bloomberg 1-3 Year US Government/Credit Index.
Our overall favorable view on the US economy led us to maintain the Fund’s overweight exposure to corporate bonds (including high yield) throughout the year. Though as spreads narrowed, we did reduce exposure while actively seeking opportunities in securitized credit. Corporate bond sales were focused on the investment-grade market given our view that the relatively tight level of spreads diminished their attractiveness on a risk-adjusted basis compared to high yield, particularly with rates set to rise. Within high yield, we adjusted positions, emphasizing names believed to have the potential to be ‘rising stars’ – securities that could see sufficient rating improvement to push them into the investment-grade market. In our efforts to diversify the Fund’s sources of yield and risk, we increased our allocations to mortgage-backed securities and collateralized mortgage obligations and were active in the commercial mortgage-backed and asset-backed securities markets. We added floating rate exposure via securities such as bank loans as well as highly rated (AAA/AA) collateralized loan obligations (CLOs), as we believed the underlying bank loans not only offered attractive valuations but their securitization into CLOs added additional value. We were also active in the Treasury Inflation-Protected Securities (TIPS) market, adding early on the expectation that inflation would increase and adjusting the allocation throughout the year as expectations shifted.
Our asset allocation decisions proved to be positive contributors. The Fund’s out-of-index allocation to high-yield corporate bonds performed well as the economic outlook continued to improve and investors’ demand for yield remained intact. Security selection within investment-grade corporate credit further benefited relative returns. The ability to adjust our exposure to TIPS with the ebb and flow of inflation expectations also aided results. The Fund’s yield curve positioning detracted over the year. While our overall duration (a measure of sensitivity to interest rate changes) exposure remained long relative to the index, this was intended to help offset our overweight position in spread product generally.
Through most parts of the economic cycle, we expect to maintain a structural overweight allocation to short-duration credit as it offers attractive risk-adjusted spread compensation over the credit risk embedded in the securities. We believe our security selection will minimize default risk, aiding us through periods of interest rate or spread volatility. As we enter 2022, we expect to maintain our out-of-index exposure to high-yield corporate bonds and securitized assets as corporate fundamentals are still improving, credit ratings are being upgraded, access to credit remains plentiful and defaults are expected to remain scarce. Additionally, allocations to both high-yield and securitized assets can provide attractive spread ‘carry’ over the benchmark’s allocation to investment-grade corporate bonds, which we believe have priced in the strong fundamental outlook. Navigating a central bank tightening cycle is never straightforward. Despite our expectation
DocuSign Envelope ID: 521655BF-9BE3-47DC-A9A3-494932954338

Janus Henderson Capital Funds plc / 31 December 2021322
Janus Henderson US Short-Term Bond Fund (continued)
Fund Overview (unaudited) (continued)
that short-term US Treasury rates will increase more than is currently priced into the forward curves, as part of our portfolio construction strategy we expect to maintain duration alongside the credit allocation to help mitigate downside risk during market drawdowns.
Thank you for investing in Janus Henderson US Short-Term Bond Fund.
January 2022
DocuSign Envelope ID: 521655BF-9BE3-47DC-A9A3-494932954338

323Janus Henderson Capital Funds plc / 31 December 2021
The accompanying notes are an integral part of the financial statements.
Janus Henderson US Short-Term Bond Fund (continued)
s
Statement of Financial PositionAs of
31 December 2021
(USD)
As of 31 December
2020 (USD)
Assets:Financial assets at fair value through profit or loss . . . . . . . . . . . . . . . . . . . . . . . . . . . . . . . . . . . . . . . . . . . . . . . . . . . . . . . 305,293,397 285,771,873Cash and foreign currency . . . . . . . . . . . . . . . . . . . . . . . . . . . . . . . . . . . . . . . . . . . . . . . . . . . . . . . . . . . . . . . . . . . . . . . 12,697,775 11,869,523Margin cash . . . . . . . . . . . . . . . . . . . . . . . . . . . . . . . . . . . . . . . . . . . . . . . . . . . . . . . . . . . . . . . . . . . . . . . . . . . . . . . . . 55,124 –Collateral cash . . . . . . . . . . . . . . . . . . . . . . . . . . . . . . . . . . . . . . . . . . . . . . . . . . . . . . . . . . . . . . . . . . . . . . . . . . . . . . . 250,000 60,000Receivables:
Investments sold . . . . . . . . . . . . . . . . . . . . . . . . . . . . . . . . . . . . . . . . . . . . . . . . . . . . . . . . . . . . . . . . . . . . . . . . . . . . 11,660,018 –Spot foreign exchange contracts awaiting settlement . . . . . . . . . . . . . . . . . . . . . . . . . . . . . . . . . . . . . . . . . . . . . . . . . . . . 184 4Funds shares sold . . . . . . . . . . . . . . . . . . . . . . . . . . . . . . . . . . . . . . . . . . . . . . . . . . . . . . . . . . . . . . . . . . . . . . . . . . . 195,220 1,427,456Interest . . . . . . . . . . . . . . . . . . . . . . . . . . . . . . . . . . . . . . . . . . . . . . . . . . . . . . . . . . . . . . . . . . . . . . . . . . . . . . . . . . . 942,960 1,709,740
Receivable from Investment Manager . . . . . . . . . . . . . . . . . . . . . . . . . . . . . . . . . . . . . . . . . . . . . . . . . . . . . . . . . . . . . . . . 27 205
Total Assets . . . . . . . . . . . . . . . . . . . . . . . . . . . . . . . . . . . . . . . . . . . . . . . . . . . . . . . . . . . . . . . . . . . . . . . . . 331,094,705 300,838,801 Liabilities (amounts falling due within one year)Payables:
Financial liabilities at fair value through profit or loss . . . . . . . . . . . . . . . . . . . . . . . . . . . . . . . . . . . . . . . . . . . . . . . . . . . . 87,608 9,918Bank overdraft and foreign currency . . . . . . . . . . . . . . . . . . . . . . . . . . . . . . . . . . . . . . . . . . . . . . . . . . . . . . . . . . . . . . . 68,654 –Margin cash . . . . . . . . . . . . . . . . . . . . . . . . . . . . . . . . . . . . . . . . . . . . . . . . . . . . . . . . . . . . . . . . . . . . . . . . . . . . . . . – 9,582Investments purchased . . . . . . . . . . . . . . . . . . . . . . . . . . . . . . . . . . . . . . . . . . . . . . . . . . . . . . . . . . . . . . . . . . . . . . . . 42,499,414 9,940,051Fund shares repurchased . . . . . . . . . . . . . . . . . . . . . . . . . . . . . . . . . . . . . . . . . . . . . . . . . . . . . . . . . . . . . . . . . . . . . . 2,227,021 913,247Investment Management fees . . . . . . . . . . . . . . . . . . . . . . . . . . . . . . . . . . . . . . . . . . . . . . . . . . . . . . . . . . . . . . . . . . . 111,470 110,299Shareholder Service fees . . . . . . . . . . . . . . . . . . . . . . . . . . . . . . . . . . . . . . . . . . . . . . . . . . . . . . . . . . . . . . . . . . . . . . 36,262 34,914Distribution fees . . . . . . . . . . . . . . . . . . . . . . . . . . . . . . . . . . . . . . . . . . . . . . . . . . . . . . . . . . . . . . . . . . . . . . . . . . . . . 174 325Accounting, Administration and Transfer Agent fees . . . . . . . . . . . . . . . . . . . . . . . . . . . . . . . . . . . . . . . . . . . . . . . . . . . . 52,342 32,355Management fees . . . . . . . . . . . . . . . . . . . . . . . . . . . . . . . . . . . . . . . . . . . . . . . . . . . . . . . . . . . . . . . . . . . . . . . . . . . 5,887 5,583Accrued expenses . . . . . . . . . . . . . . . . . . . . . . . . . . . . . . . . . . . . . . . . . . . . . . . . . . . . . . . . . . . . . . . . . . . . . . . . . . . 109,412 100,711
Total Liabilities (excluding Net Assets attributable to holders of redeemable ordinary shares) . . . . . . . . . . . . 45,198,244 11,156,985 Net Assets attributable to holders of redeemable ordinary participating shares . . . . . . . . . . . . . . . . . . . . . . 285,896,461 289,681,816
.
DocuSign Envelope ID: 521655BF-9BE3-47DC-A9A3-494932954338

Janus Henderson Capital Funds plc / 31 December 2021324
Janus Henderson US Short-Term Bond Fund (continued)
The accompanying notes are an integral part of the financial statements.
Statement of Comprehensive IncomeYear ended
31 December 2021
(USD)
Year ended 31 December
2020 (USD)
Year ended Year endedRevenue:Interest income . . . . . . . . . . . . . . . . . . . . . . . . . . . . . . . . . . . . . . . . . . . . . . . . . . . . . . . . . . . . . . . . . . . . . . . . . . . . . . . 5,082,411 4,829,145Other income . . . . . . . . . . . . . . . . . . . . . . . . . . . . . . . . . . . . . . . . . . . . . . . . . . . . . . . . . . . . . . . . . . . . . . . . . . . . . . . . 733 7,427
Net (loss)/gain on financial assets and liabilities at fair value through profit or loss . . . . . . . . . . . . . . . . . . . . . . . . . . . . . . . . . . (5,245,180) 6,538,175 Total Investments (Loss)/Income . . . . . . . . . . . . . . . . . . . . . . . . . . . . . . . . . . . . . . . . . . . . . . . . . . . . . . . . . . (162,036) 11,374,747
Expenses:Investment Management fees . . . . . . . . . . . . . . . . . . . . . . . . . . . . . . . . . . . . . . . . . . . . . . . . . . . . . . . . . . . . . . . . . . . . . 1,389,975 1,098,195Shareholder Service fees . . . . . . . . . . . . . . . . . . . . . . . . . . . . . . . . . . . . . . . . . . . . . . . . . . . . . . . . . . . . . . . . . . . . . . . . 453,996 350,947Distribution fees . . . . . . . . . . . . . . . . . . . . . . . . . . . . . . . . . . . . . . . . . . . . . . . . . . . . . . . . . . . . . . . . . . . . . . . . . . . . . . 2,455 3,001Management fees . . . . . . . . . . . . . . . . . . . . . . . . . . . . . . . . . . . . . . . . . . . . . . . . . . . . . . . . . . . . . . . . . . . . . . . . . . . . . 73,474 30,595Accounting, Administration and Transfer Agent fees . . . . . . . . . . . . . . . . . . . . . . . . . . . . . . . . . . . . . . . . . . . . . . . . . . . . . . 221,016 159,871Custodian fees . . . . . . . . . . . . . . . . . . . . . . . . . . . . . . . . . . . . . . . . . . . . . . . . . . . . . . . . . . . . . . . . . . . . . . . . . . . . . . . 39,945 49,908Audit fees . . . . . . . . . . . . . . . . . . . . . . . . . . . . . . . . . . . . . . . . . . . . . . . . . . . . . . . . . . . . . . . . . . . . . . . . . . . . . . . . . . 19,231 24,421Printing expenses . . . . . . . . . . . . . . . . . . . . . . . . . . . . . . . . . . . . . . . . . . . . . . . . . . . . . . . . . . . . . . . . . . . . . . . . . . . . . 4,540 2,387Legal and other professional fees . . . . . . . . . . . . . . . . . . . . . . . . . . . . . . . . . . . . . . . . . . . . . . . . . . . . . . . . . . . . . . . . . . 97,478 73,347Other fees . . . . . . . . . . . . . . . . . . . . . . . . . . . . . . . . . . . . . . . . . . . . . . . . . . . . . . . . . . . . . . . . . . . . . . . . . . . . . . . . . . 51,087 29,371
Total Expenses . . . . . . . . . . . . . . . . . . . . . . . . . . . . . . . . . . . . . . . . . . . . . . . . . . . . . . . . . . . . . . . . . . . . . . . 2,353,197 1,822,043Less Expense Reimbursement . . . . . . . . . . . . . . . . . . . . . . . . . . . . . . . . . . . . . . . . . . . . . . . . . . . . . . . . . . . (158) (305)Net Expenses after Expense Reimbursement . . . . . . . . . . . . . . . . . . . . . . . . . . . . . . . . . . . . . . . . . . . . . . . . 2,353,039 1,821,738Net Operating (Loss)/Profit . . . . . . . . . . . . . . . . . . . . . . . . . . . . . . . . . . . . . . . . . . . . . . . . . . . . . . . . . . . . . . (2,515,075) 9,553,009
Finance Costs: 370,210 510,492
Total distributions to holders of redeemable ordinary shares. . . . . . . . . . . . . . . . . . . . . . . . . . . . . . . . . . . . . . . . . . . . . . . . . (370,210) (510,492) Withholding tax on dividends and other investment income . . . . . . . . . . . . . . . . . . . . . . . . . . . . . . . . . . . . . (90,846) –
Net (Decrease)/Increase in Net Assets attributable to holders of redeemable ordinary shares resulting from operations . . . . . . . . . . . . . . . . . . . . . . . . . . . . . . . . . . . . . . . . . . . . . . . . . . . . . . . . . . . . . . . . . . . . . . . . . . . (2,976,131) 9,042,517
. .
. .. . .
Statement of Changes in Net Assets Attributable to Redeemable Ordinary ShareholdersYear ended
31 December 2021
(USD)
Year ended 31 December
2020 (USD)
(Decrease)/Increase in Net Assets attributable to holders of redeemable ordinary shares resulting from operations . . . . . . . . . . . . (2,976,131) 9,042,517
Capital Share Transactions of redeemable ordinary shares:Proceeds from redeemable ordinary shares sold . . . . . . . . . . . . . . . . . . . . . . . . . . . . . . . . . . . . . . . . . . . . . . . . . . . . . . . 162,354,587 219,378,705Redemption of redeemable ordinary shares . . . . . . . . . . . . . . . . . . . . . . . . . . . . . . . . . . . . . . . . . . . . . . . . . . . . . . . . . . (163,192,582) (133,767,975)Dilution Adjustment. . . . . . . . . . . . . . . . . . . . . . . . . . . . . . . . . . . . . . . . . . . . . . . . . . . . . . . . . . . . . . . . . . . . . . . . . . . 28,771 51,017
Net (Decrease)/Increase from Capital Share Transactions of redeemable ordinary shares . . . . . . . . . . . . . . (809,224) 85,661,747
Net (Decrease)/Increase in Net Assets attributable to holders of redeemable ordinary shares . . . . . . . . . . . . . . . . . . . . . . . . . . . (3,785,355) 94,704,264Net Assets attributable to holders of redeemable ordinary shares at the beginning of the financial year . . . . . . . . . . . . . . . . . . . . 289,681,816 194,977,552
Net Assets attributable to holders of redeemable ordinary shares at the end of the financial year . . . . . . . . . 285,896,461 289,681,816
Gains and losses are solely from continuing operations except for the Funds which ceased operations during the financial year ended 31 December 2021 or 31 December 2020. There were no gains and losses other than those dealt with in the Statement of Comprehensive Income. Please refer to note 1 which details the Fund closures during the year.
DocuSign Envelope ID: 521655BF-9BE3-47DC-A9A3-494932954338

325Janus Henderson Capital Funds plc / 31 December 2021
Janus Henderson US Short-Term Bond Fund (continued)
Portfolio Investments
The accompanying notes are an integral part of the financial statements.
Shares or Principal Amount
Percentage of Net Assets
(%)Fair Value
(USD)
Financial Assets at fair value through profit or lossAsset-Backed/Commercial Mortgage-Backed Securities (2020: 9.68% USD 28,037,140)
1,130,000 280 Park Avenue Mortgage Trust, 0.9898%, due 15/9/34 0.40 1,129,781
134,000 BBCMS Mortgage Trust, 0.9597%, due 15/8/36 0.05 134,050
725,921 BX Commercial Mortgage Trust, 1.2310%, due 15/3/37 0.25 724,164
100,664 CHT Mortgage Trust, 1.0397%, due 15/11/36 0.04 100,695
1,225,000 CHT Mortgage Trust, 3.1097%, due 15/11/36 0.43 1,226,184
38,863 Connecticut Avenue Securities Trust, 2.5019%, due 25/4/31 0.01 39,007
38,030 Connecticut Avenue Securities Trust, 2.4028%, due 25/8/31 0.01 38,176
482,794 Connecticut Avenue Securities Trust, 2.2528%, due 25/9/31 0.17 484,370
4,430 Connecticut Avenue Securities Trust, 2.1027%, due 25/7/39 0.00 4,431
503,000 Connecticut Avenue Securities Trust, 1.5997%, due 25/10/41 0.18 503,773
301,000 Connecticut Avenue Securities Trust, 1.7000%, due 25/12/41 0.11 301,685
56,327 Connecticut Avenue Securities Trust, 2.2019%, due 25/6/39 0.02 56,328
546,067 Connecticut Avenue Securities Trust, 2.2019%, due 25/9/39 0.19 546,762
221,594 Connecticut Avenue Securities Trust, 2.1027%, due 25/1/40 0.08 222,043
1,173,288 DB Master Finance LLC, 4.0300%, due 20/11/47 0.43 1,225,258
1,099,980 Domino's Pizza Master Issuer LLC, 4.1160%, due 25/7/48 0.39 1,124,317
1,847 Drive Auto Receivables Trust, 3.5300%, due 15/12/23 0.00 1,849
1,200,000 Dryden 53 CLO Ltd., 1.2438%, due 15/1/31 0.42 1,200,461
888,288 Jack in the Box Funding LLC, 3.9820%, due 25/8/49 0.31 891,704
663,000 Lanark Master Issuer plc, 2.2770%, due 22/12/69 0.23 668,811
287,000 Morgan Stanley Capital I Trust, 4.4070%, due 15/10/51 0.11 326,645
659,178 Morgan Stanley Capital I Trust, 6.0143%, due 11/6/42 0.23 659,178
324,000 Newday Funding Master Issuer plc, 1.1495%, due 15/3/29 0.11 326,451
496,000 Newday Funding Master Issuer plc, 0.9996%, due 15/7/29 0.17 496,182
410,442 NRZ Excess Spread-Collateralized Notes, 3.1040%, due 25/7/26 0.14 409,662
330,633 Oak Street Investment Grade Net Lease Fund, 1.8500%, due 20/11/50 0.11 327,304
266,008 OSCAR US Funding Trust VII LLC, 2.7600%, due 10/12/24 0.09 266,108
482,783 Planet Fitness Master Issuer LLC, 4.2620%, due 5/9/48 0.17 482,783
114,769 Prestige Auto Receivables Trust, 3.7500%, due 15/10/24 0.04 115,303
201,972 Santander Prime Auto Issuance Notes Trust, 5.0400%, due 15/9/25 0.07 205,800
294,560 Silverstone Master Issuer plc, 0.5195%, due 21/1/70 0.10 294,682
1,272,000 Taco Bell Funding LLC, 1.9460%, due 25/8/51 0.43 1,235,149
Shares or Principal Amount
Percentage of Net Assets
(%)Fair Value
(USD)
887,114 Verus Securitization Trust, 2.6420%, due
25/1/60 0.31 890,908158,000 WFRBS Commercial Mortgage Trust,
3.6310%, due 15/11/47 0.06 166,551Total Asset-Backed/Commercial Mortgage-Backed Securities 5.86 16,826,555
Corporate Bonds (2020: 52.35% USD 151,644,028)CanadaChemicals
418,000 NOVA Chemicals Corp., 4.8750%, due 1/6/24 0.15 432,055
Commercial Services & Supplies1,064,000 GFL Environmental, Inc., 3.7500%,
due 1/8/25 0.38 1,075,959
Cayman IslandsConsumer Finance
843,000 Avolon Holdings Funding Ltd., 2.1250%, due 21/2/26 0.29 828,171
561,000 Avolon Holdings Funding Ltd., 4.2500%, due 15/4/26 0.21 595,078
0.50 1,423,249
FranceBanks
781,000 BNP Paribas SA, 4.7050%, due 10/1/25 0.29 831,842
1,232,000 BNP Paribas SA, 7.3750%, due 19/8/25 0.49 1,400,716
544,000 BNP Paribas SA, 2.8190%, due 19/11/25 0.20 560,166
1,141,000 Societe Generale SA, 2.6250%, due 22/1/25 0.41 1,170,631
1.39 3,963,355
GermanyCapital Markets
745,000 Deutsche Bank AG, 0.9620%, due 8/11/23 0.26 743,980
IrelandConsumer Finance
1,687,000 AerCap Ireland Capital DAC, 1.6500%, due 29/10/24 0.59 1,684,804
3,306,000 AerCap Ireland Capital DAC, 2.4500%, due 29/10/26 1.17 3,335,016
762,000 Castlelake Aviation Finance DAC, 5.0000%, due 15/4/27 0.26 757,047
2.02 5,776,867
LuxembourgFood Products
1,510,000 JBS Finance Luxembourg SARL, 2.5000%, due 15/1/27 0.52 1,494,915
NetherlandsPharmaceuticals
200,000 Teva Pharmaceutical Finance Netherlands III BV, 4.7500%, due 9/5/27 0.07 198,424
South KoreaSemiconductors & Semiconductor Equipment
1,653,000 SK Hynix, Inc., 1.0000%, due 19/1/24 0.57 1,635,186
SupranationalContainers & Packaging
2,188,000 Ardagh Packaging Finance plc, 4.1250%, due 15/8/26 0.78 2,239,965
DocuSign Envelope ID: 521655BF-9BE3-47DC-A9A3-494932954338

Janus Henderson Capital Funds plc / 31 December 2021326
The accompanying notes are an integral part of the financial statements.
Janus Henderson US Short-Term Bond Fund (continued)
Portfolio Investments
Shares or Principal Amount
Percentage of Net Assets
(%)Fair Value
(USD)
SwitzerlandCapital Markets
1,303,000 UBS Group AG, 7.0000%, due 31/1/24 0.49 1,405,865
United KingdomHotels, Restaurants & Leisure
536,000 International Game Technology plc, 6.5000%, due 15/2/25 0.20 582,233
472,000 International Game Technology plc, 4.1250%, due 15/4/26 0.17 486,778
0.37 1,069,011
United StatesAerospace & Defense
2,230,000 Boeing Co. (The), 2.1960%, due 4/2/26 0.78 2,231,284654,000 TransDigm, Inc., 8.0000%, due
15/12/25 0.24 690,7781.02 2,922,062
Banks2,280,000 Bank of America Corp., 4.0000%, due
22/1/25 0.85 2,436,7931,371,000 Citigroup, Inc., 4.4000%, due 10/6/25 0.52 1,494,3171,354,000 JPMorgan Chase & Co., 6.7500%, due
1/2/24 0.51 1,468,4131,896,000 SVB Financial Group, 4.2500%, due
15/11/26 0.67 1,926,0992.55 7,325,622
Biotechnology576,000 Horizon Therapeutics USA, Inc.,
5.5000%, due 1/8/27 0.21 605,808
Capital Markets1,378,000 Bank of New York Mellon Corp. (The),
4.7000%, due 20/9/25 0.52 1,473,4262,565,000 Charles Schwab Corp. (The), 5.3750%,
due 1/6/25 0.98 2,802,2621,405,000 Goldman Sachs Group, Inc. (The),
0.6270%, due 17/11/23 0.49 1,401,6442,131,000 Morgan Stanley, 4.1000%, due 22/5/23 0.78 2,220,2901,233,000 Morgan Stanley, 3.7370%, due 24/4/24 0.45 1,275,9751,218,000 Owl Rock Capital Corp. III, 3.1250%,
due 13/4/27 0.42 1,191,7023.64 10,365,299
Chemicals514,000 Tronox, Inc., 6.5000%, due 1/5/25 0.19 543,761956,000 WR Grace Holdings LLC, 5.6250%,
due 1/10/24 0.35 1,007,4520.54 1,551,213
Consumer Finance498,000 OneMain Finance Corp., 6.8750%, due
15/3/25 0.19 554,655653,000 OneMain Finance Corp., 8.8750%,
due 1/6/25 0.24 699,484757,000 OneMain Finance Corp., 3.5000%, due
15/1/27 0.26 749,4191,359,000 SLM Corp., 3.1250%, due 2/11/26 0.47 1,347,381
1.16 3,350,939
Distributors414,000 Univar Solutions USA, Inc., 5.1250%,
due 1/12/27 0.15 432,582
Diversified Telecommunication Services348,000 Lumen Technologies, Inc., 7.5000%,
due 1/4/24 0.13 381,478
Shares or Principal Amount
Percentage of Net Assets
(%)Fair Value
(USD)
280,000 Lumen Technologies, Inc., 5.6250%,
due 1/4/25 0.10 296,493413,000 Switch Ltd., 3.7500%, due 15/9/28 0.15 416,690
0.38 1,094,661
Electric Utilities300,000 NextEra Energy Operating Partners LP,
4.2500%, due 15/7/24 0.11 311,995
Entertainment2,473,000 Netflix, Inc., 3.6250%, due 15/6/25 0.91 2,608,656
Equity Real Estate Investment Trusts (REITs)1,424,000 GLP Capital LP, 3.3500%, due 1/9/24 0.52 1,476,0141,202,000 HAT Holdings I LLC, 3.3750%, due
15/6/26 0.43 1,215,6312,171,000 VICI Properties LP, 3.5000%, due
15/2/25 0.77 2,205,8551.72 4,897,500
Food & Staples Retailing1,233,000 Albertsons Cos., Inc., 3.5000%, due
15/2/23 0.44 1,255,878
Health Care Providers & Services1,771,000 HCA, Inc., 5.8750%, due 1/5/23 0.66 1,877,287327,000 HCA, Inc., 5.3750%, due 1/2/25 0.13 359,798171,000 HCA, Inc., 5.8750%, due 15/2/26 0.07 193,084
418,000 MEDNAX, Inc., 6.2500%, due 15/1/27 0.15 437,838424,000 ModivCare, Inc., 5.8750%, due
15/11/25 0.16 445,709169,000 Tenet Healthcare Corp., 4.6250%, due
15/7/24 0.06 171,3251.23 3,485,041
Hotels, Restaurants & Leisure647,000 Caesars Resort Collection LLC,
5.7500%, due 1/7/25 0.24 676,497381,000 IRB Holding Corp., 7.0000%, due
15/6/25 0.14 403,473424,000 Travel + Leisure Co., 5.6500%, due
1/4/24 0.16 450,924754,000 Vail Resorts, Inc., 6.2500%, due
15/5/25 0.27 784,9140.81 2,315,808
Leisure Products1,589,000 Brunswick Corp., 0.8500%, due
18/8/24 0.55 1,567,227
Life Sciences Tools & Services1,832,000 PRA Health Sciences, Inc., 2.8750%,
due 15/7/26 0.64 1,836,223
Media631,000 CSC Holdings LLC, 5.2500%, due
1/6/24 0.23 657,016
Metals & Mining473,000 Novelis Corp., 3.2500%, due 15/11/26 0.17 477,695
Mortgage Real Estate Investment Trusts (REITs)719,000 Starwood Property Trust, Inc., 3.7500%,
due 31/12/24 0.25 727,628
Oil, Gas & Consumable Fuels613,000 DCP Midstream Operating LP,
4.9500%, due 1/4/22 0.21 613,0002,385,000 EQT Corp., 3.1250%, due 15/5/26 0.86 2,451,220
DocuSign Envelope ID: 521655BF-9BE3-47DC-A9A3-494932954338

327Janus Henderson Capital Funds plc / 31 December 2021
The accompanying notes are an integral part of the financial statements.
Janus Henderson US Short-Term Bond Fund (continued)
Portfolio Investments
Shares or Principal Amount
Percentage of Net Assets
(%)Fair Value
(USD)
398,000 Targa Resources Partners LP, 6.5000%,
due 15/7/27 0.15 427,0861.22 3,491,306
Pharmaceuticals1,399,000 Elanco Animal Health, Inc., 5.2720%,
due 28/8/23 0.52 1,490,005
Road & Rail458,000 DAE Funding LLC, 1.5500%, due
1/8/24 0.16 455,121
Semiconductors & Semiconductor Equipment3,051,000 Broadcom, Inc., 3.4590%, due 15/9/26 1.14 3,251,6621,358,000 Microchip Technology, Inc., 2.6700%,
due 1/9/23 0.49 1,387,431573,000 Microchip Technology, Inc., 4.2500%,
due 1/9/25 0.21 595,195946,000 Qorvo, Inc., 1.7500%, due 15/12/24 0.33 947,606
2.17 6,181,894
Thrifts & Mortgage Finance1,987,000 Rocket Mortgage LLC, 2.8750%, due
15/10/26 0.69 1,974,760
Trading Companies & Distributors790,000 Air Lease Corp., 0.8000%, due 18/8/24 0.27 774,309869,000 Air Lease Corp., 1.8750%, due 15/8/26 0.30 855,509
0.57 1,629,818
Wireless Telecommunication Services917,000 Sprint Communications, Inc., 6.0000%,
due 15/11/22 0.33 955,606542,000 Sprint Corp., 7.8750%, due 15/9/23 0.21 597,677
0.54 1,553,283
Total Corporate Bonds 30.08 86,023,871
Government Obligations (2020: 30.28% USD 87,718,950)US Treasury Notes/Bonds
7,734,000 0.1250%, due 31/12/22 2.70 7,710,5132,098,000 0.1250%, due 31/1/23 0.73 2,091,0755,324,000 0.1250%, due 28/2/23 1.86 5,302,9958,443,000 0.1250%, due 31/3/23 2.94 8,405,0722,164,000 0.2500%, due 15/4/23 0.75 2,156,9847,096,000 0.1250%, due 30/4/23 2.47 7,058,8576,285,000 0.1250%, due 31/5/23 2.19 6,246,94617,867,000 0.1250%, due 30/6/23 6.21 17,747,6549,562,000 0.1250%, due 31/7/23 3.32 9,488,0441,600,000 0.1250%, due 31/8/23 0.55 1,586,062
51,051,400 0.3750%, due 31/10/23 17.75 50,758,2533,019,000 1.7500%, due 30/6/24 1.08 3,085,159
685,600 1.7500%, due 31/7/24 0.25 701,0263,529,000 0.7500%, due 15/11/24 1.23 3,509,701
817,300 0.8750%, due 30/9/26 0.28 802,9973,439,000 1.1250%, due 31/10/26 1.20 3,416,969
21,900,000 0.0000%, due 4/1/22 7.66 21,900,0211,332,000 0.1250%, due 15/10/26 0.51 1,466,418
Total Government Obligations 53.68 153,434,746
Mortgage-Backed Securities (2020: 3.36% USD 9,732,258)Fannie Mae
222,200 4.4028%, due 25/2/25 0.08 226,163491,699 4.1028%, due 25/5/25 0.18 500,34143,962 5.1028%, due 25/7/25 0.02 45,04593,316 5.8028%, due 25/4/28 0.03 98,290
203,057 3.6528%, due 25/7/29 0.07 207,670365,447 2.3028%, due 25/1/30 0.13 371,927
1,096,259 2.5019%, due 25/5/30 0.39 1,112,374
Shares or Principal Amount
Percentage of Net Assets
(%)Fair Value
(USD)
410,589 2.3528%, due 25/7/30 0.15 415,510845,000 2.0500%, due 25/11/41 0.30 846,480
1.35 3,823,800
Freddie Mac761,000 3.0528%, due 25/11/49 0.27 761,17584,798 0.9497%, due 25/12/50 0.03 84,787
230,000 2.2997%, due 25/8/33 0.08 231,557870,000 2.0997%, due 25/12/33 0.31 871,511222,754 2.0527%, due 25/10/49 0.08 223,377
408,000 2.0497%, due 25/12/50 0.14 410,715215,000 2.3497%, due 25/8/33 0.08 218,547600,802 2.6497%, due 25/11/50 0.21 606,684135,051 5.6527%, due 25/7/28 0.05 140,084
1.25 3,548,437
UMBS12,457,743 2.5000%, due 25/1/52 4.45 12,719,791
10,928,825 3.0000%, due 25/1/52 3.96 11,324,7918.41 24,044,582
Total Mortgage-Backed Securities 11.01 31,416,819
Tranche Loans (2020: 2.81% USD 8,125,535)NetherlandsChemicals
813,910 Alpha 3 BV, 3.0000%, due 18/3/28 0.28 813,3731,531,694 Diamond (BC) BV, 3.5000%, due
29/9/28 0.53 1,528,9370.81 2,342,310
United StatesBuilding Products
1,449,993 Standard Industries, Inc., 3.0000%, due 22/9/28 0.51 1,453,016
Capital Markets1,064,312 Jane Street Group LLC, 2.8543%, due
26/1/28 0.37 1,057,549
Diversified Financial Services1,617,000 Trans Union LLC, 2.7500%, due
1/12/28 0.57 1,614,979
Food Products304,643 Froneri US, Inc., 2.3543%, due 29/1/27 0.11 301,251
Health Care Equipment & Supplies2,144,820 Mozart Borrower LP, 3.7500%, due
23/10/28 0.75 2,146,761
Household Products507,682 Reynolds Consumer Products LLC,
1.8543%, due 4/2/27 0.18 505,642
Industrial Conglomerates831,538 Zurn Industries LLC, 2.7500%, due
4/10/28 0.29 833,097
Machinery1,986,456 Madison IAQ LLC, 3.7500%, due
21/6/28 0.70 1,987,281
Media2,423,088 Charter Communications Operating
LLC, 1.8600%, due 30/4/25 0.85 2,420,520
Pharmaceuticals636,691 Elanco Animal Health, Inc., 1.8493%,
due 1/8/27 0.22 629,280
DocuSign Envelope ID: 521655BF-9BE3-47DC-A9A3-494932954338

Janus Henderson Capital Funds plc / 31 December 2021328
The accompanying notes are an integral part of the financial statements.
Janus Henderson US Short-Term Bond Fund (continued)
Portfolio Investments
Shares or Principal Amount
Percentage of Net Assets
(%)Fair Value
(USD)
Road & Rail
322,963 PECF USS Intermediate Holding III Corp., 4.7500%, due 15/12/28 0.11 323,714
Semiconductors & Semiconductor Equipment659,000 MKS Instruments, Inc., due 20/10/28 0.23 658,423
Software1,013,460 Realpage, Inc., 3.7500%, due 24/4/28 0.35 1,011,722
Total Tranche Loans 6.05 17,285,545
Total Investments (Cost: USD 305,031,128) 106.68 304,987,536
Forward Currency Contracts (2020: 0.17% USD 504,285)Open as at 31 December 2021.
Current Market
Percentage of Net Unrealised
Currency Currency Value Settle Assets GainPurchased Sold (USD) Date (%) (USD)
.J.P. Morgan CHF◊ 19,711 USD 21,100 21,648 31-Jan-22 0.00 548
EUR◊ 16,973,681 USD 19,047,762 19,335,315 31-Jan-22 0.09 287,553
GBP◊ 1,111 USD 1,482 1,504 31-Jan-22 0.00 22
Total 0.09 288,123
.
Futures° (2020: 0.00% USD 9,677).
Counterparty No of Contracts
Percentage of Net
Assets (%)
Unrealised Gain
(USD)
Goldman Sachs 35 US 5 Year Note 0.01 17,738Total 0.01 17,738
.
Total Financial Assets at fair value through profit or loss 106.78 305,293,397
Financial Liabilities at fair value through profit or loss.Forward Currency Contracts (2020: 0.00% USD (7,091))Open as at 31 December 2021
Current Market
Percentage of Net Unrealised
Currency Currency Value Settle Assets LossPurchased Sold (USD) Date (%) (USD)
J.P. Morgan USD◊ 789,252 EUR 698,593 795,793 31-Jan-22 0.00 (6,541)
Total 0.00 (6,541).
Futures° (2020: 0.00% USD (2,827))
Counterparty No of Contracts
Percentage of Net
Assets (%)
Unrealised Loss
(USD)
Goldman Sachs (29) US 10 Year Note (0.02) (37,188)Goldman Sachs 8 US 10 Year Ultra Bond 0.00 (4,134)Goldman Sachs 270 US 2 Year Note (0.01) (36,116)Goldman Sachs (31) US Long Bond 0.00 (3,629)Total (0.03) (81,067)
.
Total Financial Liabilities at fair value through profit or loss (0.03) (87,608)
Portfolio Analysis (Unaudited)
Analysis of Total Assets:% of Total
AssetsTransferable securities admitted to official stock exchange listing 47.71Transferable securities dealt in on another regulated market 44.41Financial derivative instruments dealt in on a regulated market 0.01OTC financial derivative instruments 0.09Other Assets 7.78Total Assets 100.00
◊ These forward currency contracts are used for share class hedging.° Refer to Note 5 for details of collateral held.
DocuSign Envelope ID: 521655BF-9BE3-47DC-A9A3-494932954338

329Janus Henderson Capital Funds plc / 31 December 2021
The accompanying notes are an integral part of the financial statements.
Janus Henderson US Short-Term Bond Fund (continued)
Fair Value Hierarchy
The tables below provide the fair value hierarchy summary of the Fund’s financial assets and liabilities measured at fair value at 31 December 2021 and 31 December 2020.
31 December 2021
Level 1 - Quoted Prices
(USD)
Level 2 - Other Significant
Observable Inputs (USD)
Level 3 - Significant
Unobservable Inputs (USD)
Total (USD)
Asset-Backed/Commercial Mortgage-Backed Securities – 16,826,555 – 16,826,555Corporate Bonds – 86,023,871 – 86,023,871Forward Currency Contracts – 281,582 – 281,582Futures (63,329) – – (63,329)Government Obligations – 153,434,746 – 153,434,746Mortgage-Backed Securities – 31,416,819 – 31,416,819Tranche Loans – 17,285,545 – 17,285,545Total Investments in Securities (63,329) 305,269,118 – 305,205,789
31 December 2020
Level 1 - Quoted Prices
(USD)
Level 2 - Other Significant
Observable Inputs (USD)
Level 3 - Significant
Unobservable Inputs (USD)
Total (USD)
Asset-Backed/Commercial Mortgage-Backed Securities – 28,037,140 – 28,037,140Corporate Bonds – 151,644,028 – 151,644,028Forward Currency Contracts – 497,194 – 497,194Futures 6,850 – – 6,850Government Obligations – 87,718,950 – 87,718,950Mortgage-Backed Securities – 9,732,258 – 9,732,258Tranche Loans – 8,125,535 – 8,125,535Total Investments in Securities 6,850 285,755,105 – 285,761,955
There were transfers on Government Obligations from level 1 to level 2 during the financial year ended 31 December 2020.
There were no investments held by the Fund at 31 December 2021 and 31 December 2020 that were fair valued at level 3 by the Janus Henderson Global Pricing Committee.
Valuation policy of private placements is referenced in note 2 of the financial statements.
DocuSign Envelope ID: 521655BF-9BE3-47DC-A9A3-494932954338

Janus Henderson Capital Funds plc / 31 December 2021330
Janus Henderson US Short-Term Bond Fund (continued)
The accompanying notes are an integral part of the financial statements.
Capital Share Transactions
For the financial year ended 31 December 2021
A1m HCHF A1m USD A2 HEUR A2 USD A3m USD B1m USD B2 USD E2 HEURShares Shares Shares Shares Shares Shares Shares Shares
At beginning of the year . . . . . . . 2,317 1,707,818 351,113 8,655,375 – 23,729 12,955 57,696Shares issued 2 782,076 141,777 3,272,107 304 5 – 26,194Shares redeemed. . . . . . . . . . . – (414,815) (196,412) (3,685,559) – (13,462) (3,502) (52,726)At end of year . . . . . . . . . . . . . 2,319 2,075,079 296,478 8,241,923 304 10,272 9,453 31,164
E2 USD E3m HEUR H1m USD H2 HEUR H2 USD I1m HGBP I1m USD I2 HEURShares Shares Shares Shares Shares Shares Shares Shares
At beginning of the year . . . . . . . 835,913 18,973 4,549 255 11,527 211 1,871,537 614,733Shares issued 1,059,183 3,127 3,984 131,060 158,639 3 1,096,238 250,963Shares redeemed. . . . . . . . . . . (507,867) (13,484) – (119,972) (98,514) – (1,498,130) (23,091)At end of year . . . . . . . . . . . . . 1,387,229 8,616 8,533 11,343 71,652 214 1,469,645 842,605
I2 USD I3m USDShares Shares
At beginning of the year . . . . . . . 5,382,507 –Shares issued 5,085,210 304Shares redeemed. . . . . . . . . . . (5,201,132) –At end of year . . . . . . . . . . . . . 5,266,585 304
For the financial year ended 31 December 2020
A1m HCHF A1m USD A2 HEUR A2 USD B1m USD B2 USD E2 HEUR E2 USDShares Shares Shares Shares Shares Shares Shares Shares
At beginning of the year . . . . . . . 5,363 1,431,117 299,244 6,604,869 35,561 12,955 41,705 795,726Shares issued 4 951,967 406,034 5,668,480 44 – 107,176 599,105Shares redeemed. . . . . . . . . . . (3,050) (675,266) (354,165) (3,617,974) (11,876) – (91,185) (558,918)At end of year . . . . . . . . . . . . . 2,317 1,707,818 351,113 8,655,375 23,729 12,955 57,696 835,913
E3m HEUR H1m USD H2 HEUR H2 USD I1m HGBP I1m USD I2 HEUR I2 USDShares Shares Shares Shares Shares Shares Shares Shares
At beginning of the year . . . . . . . 2,800 4,308 255 55,899 207 585,365 571,387 2,986,498Shares issued 18,167 241 – 2,760 4 3,034,847 63,480 4,825,620Shares redeemed. . . . . . . . . . . (1,994) – – (47,132) – (1,748,675) (20,134) (2,429,611)At end of year . . . . . . . . . . . . . 18,973 4,549 255 11,527 211 1,871,537 614,733 5,382,507
DocuSign Envelope ID: 521655BF-9BE3-47DC-A9A3-494932954338

331Janus Henderson Capital Funds plc / 31 December 2021
Janus Henderson US Short-Term Bond Fund (continued)
The accompanying notes are an integral part of the financial statements.
Net Asset Comparison
31 December 2021 31 December 2020 31 December 2019
Net Assets (USD)
NAV Per Share
(Local Currency)Net Assets
(USD)
NAV Per Share
(Local Currency)Net Assets
(USD)
NAV Per Share
(Local Currency)
A1m HCHF 21,517 8.45 22,649 8.65 47,468 8.56A1m USD 23,525,420 11.34 19,605,871 11.48 15,951,396 11.15A2 HEUR 6,042,063 17.90 7,788,896 18.16 5,923,673 17.65A2 USD 150,236,211 18.23 158,564,998 18.32 115,830,403 17.54A3m USD 2,988 9.84 – – – –B1m USD 114,882 11.18 270,086 11.38 393,243 11.06B2 USD 141,161 14.93 196,808 15.19 190,716 14.72E2 HEUR 333,453 9.40 673,642 9.56 436,746 9.34E2 USD 14,755,728 10.64 8,950,684 10.71 8,201,886 10.31E3m HEUR 72,185 7.36 177,174 7.64 24,120 7.68H1m USD 85,961 10.07 46,391 10.20 42,658 9.90H2 HEUR 129,929 10.06 3,165 10.16 2,816 9.84H2 USD 812,132 11.33 130,766 11.34 605,852 10.84I1m HGBP 1,498 5.18 1,516 5.26 1,413 5.14I1m USD 16,546,614 11.26 21,533,054 11.51 6,538,269 11.17I2 HEUR 11,858,923 12.36 9,373,021 12.48 7,755,208 12.10I2 USD 61,212,800 11.62 62,343,095 11.58 33,031,685 11.06I3m USD 2,996 9.87 – – – –
. . .
Total Expense Ratio (unaudited)
The Average Total Expense Ratio table shows the actual expenses, excluding transactions costs and trade commissions, incurred by each Class for the Fund during the reporting financial year expressed as a percentage of the average net assets for the corresponding year, on an annualised basis.
31 December 2021 31 December 2020 31 December 2019A1m HCHF 0.87% 0.87% 0.93%A1m USD 0.88% 0.87% 0.92%A2 HEUR 0.88% 0.85% 0.93%A2 USD 0.88% 0.87% 0.90%A3m USD* 0.78% – –B1m USD 2.10% 2.10% 2.10%B2 USD 2.10% 2.10% 2.10%E2 HEUR 1.07% 1.39% 1.56%E2 USD 1.08% 1.39% 1.41%E3m HEUR 1.06% 1.37% 1.57%H1m USD 0.51% 0.62% 0.73%H2 HEUR 0.50% 0.56% 0.70%H2 USD 0.51% 0.65% 0.68%I1m HGBP 0.30% 0.60% 0.76%I1m USD 0.47% 0.61% 0.73%I2 HEUR 0.46% 0.62% 0.70%I2 USD 0.46% 0.60% 0.70%I3m USD* 0.50% – –
*As the share class launched during the year, an estimated Total Expense Ratio is disclosed for the year end.
DocuSign Envelope ID: 521655BF-9BE3-47DC-A9A3-494932954338

Janus Henderson Capital Funds plc / 31 December 2021332
Janus Henderson US Short-Term Bond Fund (continued)
The accompanying notes are an integral part of the financial statements.
Distributions per share (unaudited)
The following table shows the distribution rate per share at Ex-date for each distributing share class :
Share Class (Local Currency) 15/01/2021 12/02/2021 15/03/2021 15/04/2021 14/05/2021 15/06/2021 15/07/2021 13/08/2021 15/09/2021 15/10/2021 15/11/2021 15/12/2021A1m HCHF 0.00778 0.00567 0.00890 0.00675 0.00286 0.00561 0.00685 0.00466 0.00492 0.00679 0.00244 0.00295A1m USD 0.01020 0.00752 0.01159 0.00921 0.00716 0.00705 0.00824 0.00625 0.00651 0.00460 0.00459 0.00552A3m USD – – – – 0.01690 0.01738 0.01532 0.01361 0.01528 0.01383 0.01391 0.01435B1m USD – – 0.00035 – – – – – – – – –E3m HEUR 0.01733 0.01410 0.01712 0.01568 0.01278 0.01316 0.01168 0.01022 0.01142 0.01048 0.01061 0.01095H1m USD 0.01002 0.00961 0.01334 0.01161 0.00813 0.01087 0.00996 0.00831 0.00912 0.00689 0.00697 0.00836I1m HGBP 0.00745 0.00566 0.00802 0.00689 0.00473 0.00505 0.00622 0.00562 0.00596 0.00446 0.00447 0.00528I1m USD 0.01341 0.01126 0.01545 0.01358 0.00951 0.01182 0.01192 0.00972 0.01079 0.00826 0.00830 0.01013I3m USD – – – – 0.01690 0.01738 0.01532 0.01361 0.01531 0.01383 0.01398 0.01435
– – – – – – – – – – – –
Fund Performance (unaudited)
As at 31 December 2021
One year Three years Five yearsSince
inception
Performance (Annualised) 31/12/2020 31/12/2021
%
31/12/2017 31/12/2021
%
31/12/2015 31/12/2021
%
to 31/12/2021
%
H2 USD (Net)* (0.09) 2.56** 1.84** 2.65**Bloomberg Barclays 1-3 Year US Govt/Credit TR (0.47) 2.28 1.85 3.05
Five years 31/12/2015 31/12/2021
%H2 USD (Gross)* 2.79Bloomberg Barclays 1-3 Year US Govt/Credit TR + 0.75% 2.62
.
Discrete performance
31/12/2020 31/12/2021
%
31/12/2019 31/12/2020
%
31/12/2018 31/12/2019
%
31/12/2017 31/12/2018
%
31/12/2016 31/12/2017
%
H2 USD (Net)* (0.09) 4.45** 3.73** 0.71** 0.84**Bloomberg Barclays 1-3 Year US Govt/Credit TR (0.47) 3.33 4.03 1.60 0.84
H2 USD (Gross)* 0.45 5.39** 4.66** 1.67** 1.79**Bloomberg Barclays 1-3 Year US Govt/Credit TR + 0.75% 0.27 4.11 4.81 2.36 1.60
. . . . .
Class H2 USD is disclosed as it is the representative share class.
* The representative share class has changed from the A2 USD to the H2 USD share class with effect from August 2021.
** Historical figures are based on the A2 USD share class.
Performance target: To outperform the Bloomberg Barclays 1-3 Year US Government/Credit Index by 0.75% per annum, before the deduction of charges, over any 5 year period.
The Total Expense Ratio includes fees payable to Distributors. Where the Total Expense Ratio exceeds the target outperformance relative to the benchmark the return is likely to be below the benchmark return, even when the Fund’s outperformance target (before the deduction of charges) has been achieved.
Please note the Gross Returns 5 year annualised table is only applicable for share classes which have been active for 5 or more years and the performance target is to be achieved over a specific annualised time period. Performance target and index shown in USD.
Past performance does not guarantee future returns. The rates of return will vary and the principal value of an investment will fluctuate. Shares, if redeemed, may be worth more or less than their original cost. The performance data does not take account of the commissions and costs incurred on the issue and redemption of Shares. All returns are calculated in the base currency of the representative Share Class.
There is no guarantee that the Fund’s performance will match or exceed the benchmark.
DocuSign Envelope ID: 521655BF-9BE3-47DC-A9A3-494932954338

333Janus Henderson Capital Funds plc / 31 December 2021
Janus Henderson US Short-Term Bond Fund (continued)
Statements of Changes in Composition of Portfolio (unaudited)The tables below show a breakdown of material purchases and sales of the Investment Portfolio in accordance with Central Bank UCITS Regulations 79(2) requirements. All purchases and sales of investments exceeding 1% of the total value of each transaction respectively, are disclosed, with a minimum number of 20 of each such transaction. A full analysis of the movement on the Investment Portfolio is available upon request from the registered office.
Major Purchases for the year ended 31 December 2021
Shares or Principal Amount
Cost (USD)
US Treasury, 0.3800%, due 31/10/23 51,051,400 50,886,652Credit Agricole Corporate And Investment Bank, 0.0000%, due 23/4/21 30,000,000 29,999,967Credit Agricole Corporate And Investment Bank, 0.0000%, due 27/4/21 30,000,000 29,999,967Credit Agricole Corporate And Investment Bank, 0.0000%, due 20/4/21 30,000,000 29,999,958Credit Agricole Corporate And Investment Bank, 0.0000%, due 26/4/21 30,000,000 29,999,900Credit Agricole Corporate And Investment Bank, 0.0000%, due 16/11/21 29,600,000 29,599,959Credit Agricole Corporate And Investment Bank, 0.0000%, due 28/4/21 29,400,000 29,399,975Credit Agricole Corporate And Investment Bank, 0.0000%, due 12/11/21 29,200,000 29,199,919UMBS, 2.5000%, due 15/12/51 28,438,478 29,142,658Credit Agricole Corporate And Investment Bank, 0.0000%, due 10/11/21 28,800,000 28,799,960Credit Agricole Corporate And Investment Bank, 0.0000%, due 17/11/21 28,500,000 28,499,960Credit Agricole Corporate And Investment Bank, 0.0000%, due 20/12/21 28,500,000 28,499,881Credit Agricole Corporate And Investment Bank, 0.0000%, due 27/1/21 28,200,000 28,199,945Credit Agricole Corporate And Investment Bank, 0.0000%, due 26/1/21 28,100,000 28,099,945Credit Agricole Corporate And Investment Bank, 0.0000%, due 29/10/21 28,000,000 27,999,961Credit Agricole Corporate And Investment Bank, 0.0000%, due 25/1/21 28,000,000 27,999,837Credit Agricole Corporate And Investment Bank, 0.0000%, due 18/11/21 27,900,000 27,899,961Credit Agricole Corporate And Investment Bank, 0.0000%, due 28/10/21 27,400,000 27,399,962Credit Agricole Corporate And Investment Bank, 0.0000%, due 22/4/21 27,300,000 27,299,962Credit Agricole Corporate And Investment Bank, 0.0000%, due 24/8/21 27,300,000 27,299,962
Major Sales for the year ended 31 December 2021
Shares or Principal Amount
Proceeds (USD)
UMBS, 2.5000%, due 15/12/51 28,438,478 29,114,545UMBS, 2.5000%, due 25/6/52 25,440,708 26,319,207UMBS, 2.5000%, due 25/11/51 24,880,214 25,552,287US Treasury, 0.6250%, due 15/4/23 22,080,000 25,372,434US Treasury, 1.7500%, due 15/7/22 23,946,900 24,201,864UMBS, 2.5000%, due 25/10/51 21,923,614 22,559,056UMBS, 2.0000%, due 25/2/37 19,843,752 20,758,813UMBS, 2.0000%, due 25/3/37 19,843,752 20,540,609UMBS, 2.0000%, due 25/3/52 19,843,752 19,969,025UMBS, 2.0000%, due 25/4/52 19,843,752 19,939,035US Treasury, 0.2500%, due 15/4/23 19,735,000 19,712,100UMBS, 2.5000%, due 25/9/51 17,979,800 18,659,245US Treasury, 1.7500%, due 15/6/22 17,890,000 18,114,543UMBS, 2.5000%, due 25/7/51 16,057,609 16,648,415US Treasury, 0.1300%, due 31/1/23 14,096,000 14,076,854US Treasury, 1.1300%, due 31/10/26 14,042,000 14,015,996UMBS, 2.5000%, due 25/8/51 12,883,998 13,398,191UMBS, 2.5000%, due 25/5/52 12,720,354 13,156,622UMBS, 2.5000%, due 25/1/52 11,430,296 11,660,018UMBS, 2.0000%, due 25/2/52 11,045,898 11,352,249UMBS, 3.0000%, due 25/11/51 10,590,080 11,064,152UMBS, 2.0000%, due 25/5/52 9,921,876 9,986,601US Treasury, 0.1300%, due 31/12/22 9,982,000 9,982,320US Treasury, 2.2500%, due 31/3/21 9,939,000 9,948,506US Treasury, 2.6250%, due 15/12/21 9,170,000 9,226,954US Treasury, 1.7500%, due 30/11/21 8,688,000 8,742,891US Treasury, 0.1300%, due 28/2/23 8,689,000 8,683,494US Treasury, 0.1300%, due 31/3/23 6,970,000 6,955,006
DocuSign Envelope ID: 521655BF-9BE3-47DC-A9A3-494932954338

Notes to the Financial Statements
Janus Henderson Capital Funds plc / 31 December 2021334
1. Accounting Policies
The significant accounting policies and estimation techniques adopted by the Company are as follows:
Statement of ComplianceThe financial statements for the year ended 31 December 2021 are prepared in accordance with FRS 102 Financial Reporting Standard applicable in the UK and Republic of Ireland issued by the Financial Reporting Council (FRC) and the UCITS Regulations 2011 as amended and the Central Bank (Supervision and Enforcement) Act 2013 (Section 48(1)) (Undertakings for Collective Investment in Transferable Securities) Regulations 2019 (the “Central Bank UCITS Regulations”).
The Company has applied the same accounting policies and methods of computation in this annual report and financial statements as in its annual financial statements for the financial year ended 31 December 2020 unless otherwise stated.
The format and certain wordings of the financial statements have been adapted from those contained in the FRS 102 and the Companies Act 2014 so that, in the opinion of the Directors, they more appropriately reflect the nature of the Company’s business as an investment fund.
Fair Value MeasurementUnder FRS 102, in accounting for its financial instruments a reporting entity is required to apply either:
a) the full requirements of FRS 102 relating to Basic Financial Instruments and Other Financial Instruments,
b) the recognition and measurement provisions of IAS 39 Financial Instruments: Recognition and only the disclosure requirements of FRS 102 relating to Basic Financial Instruments and Other Financial Instruments, or
c) the recognition and measurement provisions of IFRS 9 Financial Instruments and only the disclosure requirements of FRS 102 relating to Basic Financial Instruments and Other Financial Instruments. The Company has chosen to apply the recognition and measurement provisions of IAS 39 Financial Instruments: Recognition and only the disclosure requirements of FRS 102 relating to Basic Financial Instruments and Other Financial Instruments.
Use of EstimatesManagement makes estimates and assumptions concerning the future. The resulting accounting estimates will, by definition, seldom equal the related actual results. The estimates and assumptions that have a significant risk of causing a material adjustment to the carrying amounts of assets and liabilities within the next financial year are outlined below in note 1 of the financial statements.
Basis of MeasurementThe financial statements are prepared under the historical cost convention as modified to include financial assets held at fair value through profit or loss.
The financial statements are prepared on a going concern basis except for Janus Henderson Global Adaptive Capital Appreciation Fund, Janus Henderson Global Adaptive Capital Preservation Fund, Janus Henderson Intech All-World Minimum Variance Core Fund, Janus Henderson Intech Global Absolute Return Fund, Janus Henderson Intech Global All Country Low Volatility Fund, Janus Henderson Intech US Core Fund, Janus Henderson Absolute Return Income Fund (EUR) and Janus Henderson Global High Yield Fund.
The financial statements for the Funds listed below have been prepared on a basis other than going concern as the Funds have either ceased investment activity on the dates provided below or are about to. There has been no impact on the financial statements or disclosure notes to adjust assets or liabilities to realisable value. No adjustments were necessary to provide for the costs of terminating the Funds as the Manager will bear any related costs for the Funds.
Fund Name Closure DateJanus Henderson Global Adaptive Capital Appreciation Fund 27 May 2021Janus Henderson Intech All World Minimum Variance Core Fund 09 July 2021Janus Henderson Intech Global Absolute Return Fund 03 March 2021Janus Henderson Intech Global All Country Low Volatility Fund 18 May 2021Janus Henderson Intech US Core Fund
Q2/3 2022 subject to regulatory approval
Janus Henderson Absolute Return Income Fund (EUR) 10 November 2021Janus Henderson Global High Yield Fund 08 October 2021Janus Henderson Global Adaptive Capital Preservation Fund 25 March 2022
Cash Flow StatementThe Funds are not required to produce a cash flow statement as they meet the exemption criteria set out in Section 7 of FRS 102 as the Funds’ investments are highly liquid, are carried at market value and a Statement of change in net assets attributable to redeemable ordinary shareholders is provided for each Fund.
ValuationThe financial statements have been prepared using a valuation date of 31 December 2021 and 31 December 2020.
Investment ValuationThe Company values both financial assets and financial liabilities at fair value in the Statement of Financial Position and Statement of Comprehensive Income. Gains and losses arising from changes in their fair value are included in the Statement of Comprehensive Income in the financial year in which they arise.
All the Company’s assets and liabilities are held for the purpose of being traded.
DocuSign Envelope ID: 521655BF-9BE3-47DC-A9A3-494932954338

Notes to the Financial Statements (continued)
335Janus Henderson Capital Funds plc / 31 December 2021
The Manager has assigned the responsibility to review and approve level 3 fair value pricing decisions on a regular basis to the Janus Henderson Global Pricing Committee.
The tables presenting the positions that were fair valued at level 3 by Janus Henderson Global Pricing Committee at 31 December 2021 and 31 December 2020 are disclosed in the individual fund sections. These estimated fair values may not reflect amounts that could be realised upon immediate sale or amounts that ultimately may be realised.
Listed SecuritiesSecurities listed on a recognised exchange or traded on any other organised market are valued at the latest available market price on that regulated market, as at the close of the regular trading session of the New York Stock Exchange (“NYSE”) on the relevant Business Day (normally 4:00 p.m., New York time, Monday through Friday) or, if unavailable or, in the opinion of the Administrator unrepresentative of fair value, the last available market price on the principal exchange. If for specific assets the latest available prices do not, in the opinion of the Administrator, reflect their fair value or if prices are unavailable, the value shall be calculated by the Administrator in consultation with the Investment Adviser or the relevant Sub-Investment Adviser on the basis of the probable realisation value for such assets as at the close of the regular trading session of the NYSE on the relevant Business Day. The Administrator may use a systematic fair valuation model provided by an independent third party to value equity securities in order to adjust for stale pricing which may occur between the close of foreign exchanges and the relevant Valuation Point.
Debt SecuritiesThe fair value of debt securities (including corporate and government bonds) are based on closing mid prices at the Statement of Financial Position date. The market prices are obtained from reputable pricing sources. The Fund would exercise judgement on the quantity and quality of pricing sources used. Where no market price is available the Investment Manager/Investment Adviser will determine the fair value using valuation techniques. These valuation techniques include the use of comparable recent arm's length transactions, reference to other instruments that are substantially the same, discounted cash flow analysis and other valuation techniques used by market participants.
Investment FundsUnits or shares in investment funds are valued at the latest available unaudited net asset value estimated by the underlying administrator or, if listed or traded on a Regulated Market, at the latest quoted trade price or a mid-quotation (or, if unavailable, a bid quotation) or, if unavailable or unrepresentative, the latest available unaudited net asset value estimated by the underlying administrator as deemed relevant to the investment fund.
Short-Term InvestmentsAmortised cost calculated using the effective yield method, which approximates fair value, is used to value discounted
debt obligations with 60 days or less remaining to maturity, unless a competent person appointed by the Directors or its duly appointed delegate determine that this does not represent fair value. All other short-term investments, including time deposits, are valued at cost, which approximates their fair value. When calculating the effective interest rate, the Company estimates cash flows considering all contractual terms of the financial instrument but does not consider future credit losses.
Exchange Traded Derivative InstrumentsExchange traded derivative instruments are valued at the close of the regular trading session of the NYSE on the relevant Business Day at the settlement price for such instruments on such market. If the settlement price of an exchange traded derivative instrument is not available, the value of such instrument shall be the probable realisation value estimated with care and in good faith by the Administrator or other competent person approved for the purpose by the Depositary.
Over-the-Counter (“OTC”) Derivative InstrumentsOTC financial derivative instruments are valued daily using either the counterparty valuation or an alternative valuation, such as a valuation calculated by the Company or by an independent pricing vendor appointed by the Company provided that the Company or other party has adequate human and technical means to perform the valuation and is approved for that purpose by the Depositary. The counterparty to derivative instruments not traded on an exchange must be prepared to value the contract and to close out the transaction at the request of the Company at fair value. Where the counterparty valuation is used, the valuation must be approved or verified at least weekly by an independent party who is approved for the purpose by the Depositary and who is independent of the counterparty. The independent verification shall be carried out at least monthly. Where an alternative valuation is used, the Company shall follow international best practice and shall adhere to the principles on the valuation of OTC instruments established by bodies such as International Organisation of Securities Commissions (“IOSCO”) and Alternative Investment Management Association (“AIMA”) such valuation shall be reconciled on a monthly basis to the valuation provided by the counterparty to such instrument. Where significant differences arise these will be promptly investigated and explained.
Futures ContractsFutures are contracts for delayed delivery of securities in which the seller agrees to make delivery at a specified future date of an instrument, at a specified price or yield. Initial margin deposits are made upon entering into future contracts and are generally made in cash or cash equivalents. Futures contracts are fair valued based upon their daily quoted settlement price. For open futures contracts, changes in the fair value of the contract are recognised as unrealised gains or losses by “marking-to-market” the value of the contract at the Statement of Financial Position date. When the contract is closed, the
DocuSign Envelope ID: 521655BF-9BE3-47DC-A9A3-494932954338

Notes to the Financial Statements (continued)
Janus Henderson Capital Funds plc / 31 December 2021336
difference between the proceeds from (or cost of) the closing transactions and the original transaction is recorded as a realised gain or loss. Futures contracts are held at fair value through profit or loss. The variation margin receivable or payable at the financial year end date is reported as an asset or liability, as applicable, in the Statement of Financial Position, gains and losses arising from changes in the fair value of the futures contracts are included in the Statement of Comprehensive Income in the financial year which they arise.
OptionsOptions are rights to buy or sell an underlying asset or instrument for a specified price (the exercise price) during, or at the end of, a specified contractual period. The seller (or writer) of the option receives a payment, or premium, from the buyer, which the writer keeps regardless of whether the buyer uses (or exercises) the option. The premium on purchased put options exercised is subtracted from the proceeds of the sale of the underlying security or foreign currency in determining the realised gain or loss. The premium on purchased call options exercised is added to the cost of the securities or foreign currencies purchased. Premiums paid from the purchase of options, which expire unexercised are treated as realised losses. The premium on written call options exercised is added to the proceeds from the sale of the underlying security or foreign currency in determining the realised gain or loss. The premium on written put options exercised is subtracted from the cost of the securities or foreign currencies purchased. Premiums received from written options, which expire unexercised are treated as realised gains. A call option gives the holder (buyer) the right to buy the underlying asset from the seller (writer) of the option. A put option gives the holder the right to sell the underlying asset to the writer of the option. Options can trade on exchanges or in the OTC market and may be bought or sold on a wide variety of underlying assets or instruments, including financial indices, individual securities, and other derivative instruments, such as futures contracts, foreign currencies, forward currency contracts, structured investments (derivative securities which are specifically designed to combine the characteristics of one or more underlying securities in a single note) and yield curve options. Options that are written on futures contracts are subject to margin requirements similar to those applied to futures contracts.
Options, held at fair value though profit or loss, are fair valued daily based upon the quotation provided by counterparty on the principal exchange on which the option is traded. Realised and unrealised gains and losses arising from option contracts are included in the Statement of Comprehensive Income in the financial year in which they arise.
SwapsA swap is an agreement that obligates two parties to exchange a series of cash flows at specified intervals based upon or calculated by reference to changes in specified prices or rates for a specified amount of an underlying asset.
The Company may utilise swap agreements as a means to gain exposure to certain common stocks and/or to “hedge” or protect their portfolios from adverse movements in securities prices or interest rates. Swap contracts of the Company are reported as an asset or liability on the Statement of Financial Position. Realised gains and losses of the swaps are reported in “Net gain/(loss) on financial assets and liabilities at fair value through profit or loss” on the Statement of Comprehensive Income.
Total return swaps involve an exchange by two parties in which one party makes payments based on a set rate, either fixed or variable, while the other party makes payments based on the return of an underlying asset, which includes both the income it generates and any capital gains over the payment financial period. The Company’s maximum risk of loss for total return swaps from counterparty risk or credit risk is the discounted value of the payments to be received from/paid to the counterparty over the contract’s remaining life, to the extent that the amount is positive. The risk is mitigated by having a netting arrangement between the Company and the counterparty and by the posting of collateral to the Company to cover the Company’s exposure to the counterparty. Total return swaps are valued daily by independent pricing vendor Markit.
Equity swaps involve an exchange of cash flows between two parties that allows each party to diversify its income, while still holding its original assets. The two sets of nominally equal cash flows are exchanged as per the terms of the swap, which may involve an equity-based cash flow (such as from a stock asset) that is traded for a fixed-income cash flow (such as a benchmark rate). Equity swaps are valued daily by independent pricing vendor Markit.
An interest rate swap is an agreement between two parties in which one stream of future interest payments is exchanged for another based on a specified principal amount. Interest rate swaps usually involve the exchange of a fixed interest rate for a floating rate, or vice versa, to reduce or increase exposure to fluctuations in interest rates or to obtain a marginally lower interest rate than would have been possible without the swap. Interest rate swaps are valued daily by independent pricing vendor Markit.
Credit default swap agreements (“CDS”) enable the Company to buy or sell credit protection on an individual issuer or basket of issuers. The Company may enter into CDS to gain long or short exposure to sovereign bond markets. Long CDS positions are utilised to gain exposure to a sovereign bond market (similar to buying a bond) and are akin to selling insurance on the bond. Short CDS positions are utilised to short exposure to a sovereign bond market (similar to shorting a bond) and are akin to buying insurance on the bond. CDS are valued daily by independent pricing vendor Markit. All credit default swap positions held are centrally cleared.
Some derivatives may be centrally cleared through a Central Counterparty Clearing House ("CCP"). A CCP is a financial
DocuSign Envelope ID: 521655BF-9BE3-47DC-A9A3-494932954338

Notes to the Financial Statements (continued)
337Janus Henderson Capital Funds plc / 31 December 2021
institution that takes on counterparty credit risk between parties to a transaction and provides clearing and settlement services for trades in foreign exchange, securities, options, and derivative contracts. For centrally cleared trades the CCP marks contracts to market, and requires the posting of variation margin in response to changes in market values. Details of individual Funds exposure to the CCP is detailed in the relevant portfolio investments.
Forward Currency ContractsThe Company may, without limitation, enter into three types of forward currency contracts: non-base currency Share Class level hedging, foreign security hedging and security transaction level hedging. The unrealised appreciation or depreciation on open forward currency contracts is calculated by reference to the difference between the contracted rate and the rate to close out the contract. Realised gains or losses include net gains/losses on contracts, which have been settled or offset by other contracts.
For foreign security and security transaction level hedging, realised and unrealised gains and losses are allocated at Fund level. For non-base currency Share Class level hedging the realised and unrealised gains and losses are allocated solely to the relevant Share Class.
Tranche LoansThe Company invests in direct debt instruments which are interests in amounts owed to lenders or lending syndicates by corporate, governmental, or other borrowers. A Fund’s investment in loans may be in the form of participations in loans or assignments of all or a portion of loans from third parties. When investing in a tranche loan, a Fund has the right to receive payments of principal, interest and any fees to which it is entitled only from the lender selling the loan agreement and only upon receipt of payments by the lender from the borrower. Tranche loans are fair valued based on valuations provided by the independent pricing vendor Markit. Fees earned or paid and the receipt of payments of principal are recorded as a component of net gain/(loss) on financial assets and liabilities at fair value through profit or loss in the Statement of Comprehensive Income.
Private Placement InvestmentsA private placement is a private alternative to issuing a publicly offered security as a means for raising capital. In a private placement the sale of securities is made directly by the issuer to a select number of investors without public offering through an investment bank. Typically, when the Fund invests through a private placement, the Fund makes a commitment to invest a specified amount of capital in the investee private company in a series of tranches. The capital commitment for the initial and any future closings are triggered following the completion of defined conditions or events.
The Fund recognises investment purchases in the financial statements for tranches that completed or became binding transactions prior to the end of the financial reporting
period. These are then included in the year end investment portfolio as an investment holding. Private placements are fair valued using valuation techniques approved by the Janus Henderson Global Pricing Committee in line with the valuation policy. Future tranches that have not completed before the year end and are dependent on future events are unfunded commitments and not recognised in the financial statements. These future commitments are disclosed in the Unfunded commitments and contingent liabilities note.
Receivables and PayablesReceivables and payables are recognised initially at fair value and subsequently measured at amortised cost using the effective interest method.
Allocations between ClassesA Fund's income, expenses provisions, accruals and changes in values are allocated between classes using an allocation ratio representing the proportion of the Fund nominally owned by each class. In addition class specific movements, such as class fees and charges are applied to just the appropriate class. Subscriptions, redemptions and gains or losses on share class hedges are applied as class specific items.
Cash, Bank Overdraft and Other Liquid AssetsCash, bank overdraft and other liquid assets are valued at their fair value with the relevant interest accrued, where applicable, and charged to the Statement of Comprehensive Income when incurred.
Investment Transactions and Investment IncomeInvestment transactions are accounted for as of the date purchased or sold. Gains and losses arising from changes in the fair value of the financial assets at fair value through profit or loss are included in the Statement of Comprehensive Income in the financial period in which they arise. The weighted average cost basis is used to calculate realised gains and losses on the sale of investments. The Fund derecognises an investment as a financial asset when the contractual rights to the cash flows from the financial asset expire or a financial asset is transferred and the transfer qualifies for derecognition with FRS 102. The Fund derecognises an investment as a financial liability when the obligation specified in the contract is discharged, cancelled or expired.
Dividends are included in the Statement of Comprehensive Income on the dates on which the relevant securities are listed as “ex-dividend”. Interest income is accrued daily on an effective yield basis. Income is shown gross of non-recoverable withholding tax. Withholding tax is shown net of any reclaim receivable.
ExpensesExpenses are accounted for on an accruals basis and are charged to the Statement of Comprehensive Income when incurred.
DocuSign Envelope ID: 521655BF-9BE3-47DC-A9A3-494932954338

Notes to the Financial Statements (continued)
Janus Henderson Capital Funds plc / 31 December 2021338
Transaction CostsTransaction costs include fees and commissions paid to agents (including employees acting as selling agents), advisers, brokers and dealers, levies by regulatory agencies and securities exchanges, and transfer taxes and duties. Transaction costs do not include debt premiums or discounts, financing costs or internal administrative costs. Transaction costs on financial assets and liabilities at fair value through profit or loss are expensed as incurred. Transaction costs per Fund are presented in Note 12.
Distributions Payable to Holders of Redeemable Ordinary SharesDistributions to holders of redeemable ordinary shares are recognised in the Statement of Comprehensive Income when they are appropriately authorised and no longer at the discretion of the Company. Distributions paid to holders of redeemable ordinary Shares are classified as finance costs in the Statement of Comprehensive Income. Please refer to the Prospectus for details on distribution policies applicable to each Class of Shares.
Income EqualisationAll Funds operating a distributing share class intend to operate income equalisation. Income equalisation prevents the dilution of current shareholders’ earnings by applying a portion of the proceeds from Shares issued or redeemed to undistributed income. When Shares are purchased or redeemed the price may include an element of income. Equalisation is this element of income paid out to shareholders who have purchased or redeemed during this financial year and it is accounted for in the Statement of Changes in Net Assets Attributable to Redeemable Ordinary Shareholders in the Proceeds from/Redemption of redeemable ordinary shares.
Dilution AdjustmentA Fund may suffer dilution which is a reduction in the value of the assets as a result of the costs incurred in dealing in its underlying investments and of any spread between the buying and the selling prices of such investments which is not reflected in the issue or redemption price paid by or to shareholders. With a view to countering this (which, if it is significant, disadvantages existing or continuing shareholders), the Directors may make an adjustment to the share price on a dealing day. The dilution adjustment may apply to redemptions or to subscriptions and if charged, the value of the dilution adjustment will be paid into the Fund and will become part of the net asset attributed to the relevant Fund. Any dilution adjustments are disclosed in Statement of Changes in the Net Assets Attributable to Redeemable Ordinary Shareholders.
Where a dilution adjustment is applied, it will increase the Net Asset Value per Share of a Fund when there are net inflows and decrease the Net Asset Value per Share of a Fund when there are net outflows. The Net Asset Value per Share, as adjusted by any dilution adjustment, will be applicable to all transactions in Shares or the relevant Fund on the relevant dealing day. Therefore, for an investor who
subscribes to a Fund on a dealing day when the dilution adjustment increases the Net Asset Value per Share, the cost per Share to the investor will be greater than it would have been absent the dilution adjustment. For an investor who redeems a certain number of Shares from a Fund on a dealing day when the dilution adjustment decreases the Net Asset Value per Share, the amount received by the investor in redemption proceeds for the Shares redeemed will be less than it would have been absent the dilution adjustment.
Foreign Exchange TranslationFunctional and Presentation Currency
Items included in the Company’s financial statements are measured using the currency of the primary economic environment in which the Company operates (the “functional currency”), which is the US Dollar (USD). All amounts disclosed in the financial statements are in USD (the “presentation currency”), with the exception of the Janus Henderson Intech European Core Fund and Janus Henderson Absolute Return Income Fund (EUR) for which the functional currency is the Euro (EUR).
The Statement of Financial Position is translated using exchange rates listed in Note 11 at the financial year end and the Statement of Comprehensive Income and Statement of Changes in Net Assets Attributable to Redeemable Ordinary Shareholders are translated at an average rate over the financial year for inclusion in the combined financial statements of the Company. The resulting notional currency gain/(loss) on retranslation of opening net assets is included in the Combined Company Statement of Changes in Net Assets Attributable to Redeemable Ordinary Shareholders.
The method of translation has no effect on the value of net assets allocated to the individual Funds.
Transactions and Balances
Assets and liabilities denominated in currencies other than the functional currency are translated into the functional currency at the exchange rates ruling at the Statement of Financial Position date. Transactions in foreign currencies are translated into the functional currency at the exchange rates ruling at the dates of the transactions. Gains and losses on foreign exchange transactions are recognised in the Statement of Comprehensive Income in determining the result for the financial year.
Offsetting financial instrumentsFinancial assets and liabilities are offset and the net amount reported in the Statement of Financial Position where the Company has a legally enforceable right to set-off the recognised amounts and there is an intention to settle on a net basis or realise the asset and settle the liability simultaneously.
DocuSign Envelope ID: 521655BF-9BE3-47DC-A9A3-494932954338

Notes to the Financial Statements (continued)
339Janus Henderson Capital Funds plc / 31 December 2021
2. Share Capital
AuthorisedThe paid up share capital of the Company shall at all times equal the combined net asset value of the Funds. The Directors are authorised to issue up to 500 billion Shares of no par value each. For financial statements purposes, these are deemed to be either subscriber shares or redeemable ordinary Shares (“Ordinary Shares”).
Subscriber SharesThere are currently 30,000 subscriber shares in issue of no par value, held by two subscriber shareholders. The subscriber shares do not form part of the net asset value of the Company and are thus not disclosed in the financial statements except by way of this note only. The subscriber shares entitle the shareholders holding them to attend and vote at all meetings of the Company, but do not entitle the holders to participate in the dividends or net asset value of any Fund or of the Company.
Redeemable Ordinary SharesThe Company issues redeemable ordinary shares, which are redeemable at the holder’s option and are classified as financial liabilities. Redeemable ordinary shares can be put back to the Company at any time for cash equal to a proportionate share of the net asset value of the relevant Fund. The redeemable ordinary share is carried at the redemption amount that is payable at the Statement of Financial Position date if the holder exercises the right to put the share back to the Company at that date. Holders of redeemable ordinary shares are entitled to attend and vote at meetings of the Company and of the Fund represented by those Shares.
The net asset value for each Class of Shares of each Fund is calculated by determining the value of the assets of the relevant Fund applicable to that Class, including accrued income, and deducting all liabilities (including all fees and charges) of that Class, and dividing the resultant sum by the total number of Shares of that Class in the relevant Fund in issue or allotted at that time, to give the net asset value per Share per Class of the Fund. As the Share Classes of each Fund will have different amounts of liabilities, the net asset value per Share attributable to each of them, even within the same Fund, will be different.
Hedged Share ClassesIn order to limit the currency exposure between the share classes denominated in a currency other than the relevant Fund’s base currency and that include “H” in their names, the relevant currency of the share class may be hedged provided that (1) it is generally in the best interests of the Shareholders of the relevant class and (2) the overhedged position will not exceed 105% of the net asset value of the share class.
Alternatively a hedged currency share class (the “Portfolio Hedged Share Class”) that include the prefix “PH” in their name may be created with the aim of hedging any currency exposure between the currency of the share class and
the currency of any underlying investment of a Fund to the extent a Fund has not hedged the currency exposure between the Base Currency of that Fund and the currencies of the underlying investments of that Fund.
3. Related Party Transactions
Henderson Management S.A. ("HMSA") was appointed as manager of the Company with effect from 00.01 am (Irish time) on 6 July 2020. HMSA is responsible for the general management of the Company’s affairs and is the distributor of the Funds. HMSA has appointed JHIIL as the Company’s investment adviser. JHIIL acts as Investment Adviser and Distributor to the Company. JHIIL is a company incorporated under the laws of England and Wales, which is authorised and regulated by the Financial Conduct Authority (“FCA”) in the UK. JHIIL holds 29,997 Subscriber Shares of the Company as of 31 December 2021 (31 December 2020: 29,997).
JHIIL has delegated to JHISL responsibility for providing discretionary investment management and advisory services the whole or part of the assets of the Janus Henderson Global Real Estate Equity Income Fund, pursuant to an Investment Management Delegation Agreement dated 15 December 2017. JHISL is a limited liability company incorporated in Singapore and is regulated by the Monetary Authority of Singapore.
JHIIL has delegated to JHIUKL responsibility for providing discretionary investment management and advisory services the whole or part of the assets of the Janus Henderson Global Real Estate Equity Income Fund, Janus Henderson Absolute Return Income Fund, Janus Henderson Absolute Return Income Fund (EUR), Janus Henderson Absolute Return Income Opportunities Fund, Janus Henderson Fixed Maturity Bond Fund I (This fund was authorised during the year 2020, the fund is yet to launch), Janus Henderson Global High Yield Fund, Janus Henderson Multi-Sector Income Fund and Janus Henderson Global Investment Grade Bond Fund pursuant to an Investment Management Delegation Agreement dated 15 December 2017. JHIUKL is a limited liability company incorporated under the laws of England and Wales. JHIUKL is authorised and regulated by the FCA.
JHIIL has delegated to JHIUS responsibility for providing discretionary investment management and advisory services to the whole or part of the assets of the Equity & Allocation Funds (except for the Janus Henderson US Small-Mid Cap Value Fund), the Alternative Investment Funds and the Fixed Income Funds pursuant to an Investment Management Delegation Agreement dated 17 August 1999, as amended. JHIUS is registered as an investment adviser with the US Securities and Exchange Commission. JHIUS which indirectly owns JHIIL is owned by Janus Henderson Group plc. JHIUS did not hold any Subscriber Shares of the Company as of 31 December 2021 (31 December 2020: Nil).
DocuSign Envelope ID: 521655BF-9BE3-47DC-A9A3-494932954338

Notes to the Financial Statements (continued)
Janus Henderson Capital Funds plc / 31 December 2021340
JHIIL has delegated to Intech responsibility for providing discretionary investment management and advisory services to the Intech Sub-Advised Funds pursuant to an Investment Management Delegation Agreement dated 6 January 2003, as amended. Intech has been in the investment advisory business since 1987 and serves as investment adviser or sub-adviser to a number of mutual funds, institutional investors and separately managed accounts. As of 31 December 2021, approximately 97.11% (31 December 2020: 97.11%) of the outstanding voting shares of Intech was ultimately owned by Janus Henderson Group plc. There were no transactions between the funds and Intech Investment Management LLC during the year.
JHIIL has delegated to Perkins Investment Management LLC (“Perkins”) responsibility for providing discretionary investment management and advisory services to Janus Henderson US Small-Mid Cap Value Fund pursuant to an Investment Management Delegation Agreement dated 11 July 2003, as amended. Perkins serves as investment adviser or sub-adviser to a number of US domiciled mutual funds, institutional investors and individually managed accounts. As of 29 September 2021, JHIUS owned 100% (31 December 2020: 100%) of Perkins. Perkins is ultimately owned by Janus Henderson Group plc. There were no transactions between the funds and Perkins Investment Management LLC during the year. The relationship with Perkins was terminated with effect from 30 September 2021.
Kapstream Capital PTY Limited was appointed as Sub- Investment Adviser to the Janus Henderson Absolute Return Income Fund, Janus Henderson Absolute Return Income
Fund (EUR) and Janus Henderson Absolute Return Income Opportunities Fund pursuant to an Investment Management Delegation Agreement dated 5 November 2019.
Janus Henderson Investors UK Limited ("JHIUKL") was appointed as Sub-Investment Adviser to the Janus Henderson Absolute Return Income Fund, Janus Henderson Absolute Return Income Fund (EUR), Janus Henderson Absolute Return Income Opportunities Fund, Janus Henderson Fixed Maturity Bond Fund I (This fund was authorised during the year 2020, the fund is yet to launch) and Janus Henderson Multi-Sector Income Fund during the year. HMSA has also appointed JHIUKL as the distributor of the Funds.
Ian Dyble, Matteo Candolfini and Jane Challice are officers of Janus Henderson Group plc and have waived their right to a director’s fee during the financial years ended 31 December 2021 and 31 December 2020. Carl O’Sullivan and Peter Sandys are the Independent Directors and receive a fixed fee from the Company in their roles as directors. All transactions with related parties, Directors or any party in which they have a material interest are entered into in the ordinary course of business and on normal commercial terms.
None of the Directors have entered into an employment or service contract with the Company. Directors’ remuneration is detailed in Note 15 to the financial statements.
Janus Selection Funds invest substantially all of their assets into the corresponding funds of Janus Henderson Capital Funds plc which are managed by the Investment Adviser and are part of Janus Henderson Group plc.
In accordance with the requirements of the UCITS Regulations FRS 102 section 33 the following table details the total value of transactions between JHIIL and related parties for the financial year 31 December 2021. The total number of transactions between the related parties were 1,524 purchases and 1,537 sales of corporate bonds.
Related Party Purchases SalesJanus Henderson Flexible Bond Fund 6,937,472.80 10,018,643.92 Janus Henderson Balanced fund 322,489.58 67,063,728.24 Janus Henderson Small Cap Value Fund 270,347.20 6,754,441.27 Janus Henderson Mid Cap Value Portfolio – 7,257.60 Janus Henderson Triton Fund – 54,507.13 Janus Henderson Value Plus Income Fund – 9,331,599.25 Janus Henderson Absolute Return Income Opportunities 1,180,239.49 197,269.93 Janus Henderson High-Yield Fund 1,333,621.63 17,171,050.54 Janus Henderson Global Research Portfolio 329,482.40 –
Janus Henderson Balanced Portfolio – 8,273,363.78 Janus Henderson Flexible Bond Portfolio 6,897,472.03 1,075,246.16 Janus Henderson Overseas Portfolio – 46,409.27 Janus Henderson Global Life Sciences Fund 656,024.40 3,208,093.70 Janus Henderson Contrarian Fund 919,602.60 1,876,300.16 Janus US Opportunistic Alpha Fund 75,103.08 –
Janus Henderson US Contrarian fund 54,507.13 23,860.96 Janus Global High Yield Fund 20,596.05 3,178.87 Janus Global Investment Grade Bond Fund – 1,412,300.80 Janus Balanced Fund 76,988,418.38 322,489.58 Janus Henderson Absolute Return Income Opportunities Fund 197,269.93 7,471,671.49 Janus Absolute Return Income Fund 166,773.65 93,010,516.35 Janus Global Adaptive Capital Appreciation fund – 129,705.25
DocuSign Envelope ID: 521655BF-9BE3-47DC-A9A3-494932954338

Notes to the Financial Statements (continued)
341Janus Henderson Capital Funds plc / 31 December 2021
Related Party Purchases SalesJanus Global Adaptive Capital Preservation Fund 129,707.25 –
Janus Flexible Income Fund 11,093,890.08 13,834,944.83 Janus High Yield Fund 17,585,913.90 1,571,345.12 Janus Henderson Absolute Return Income Fund (EUR) – 15,196,124.65 Janus Henderson US Balanced 2026 fund 666,482.86 –
Janus Henderson Multi-Sector Income Fund 8,004,354.63 –
Janus Henderson Global Technology and Innovation Fund – 445,525.60 Janus Global Life Sciences Fund 3,208,093.70 656,024.40 Janus Henderson US Small-Mid Cap Value Fund 1,023,510.75 –
Janus Global Research Fund 116,043.20 –
Janus Henderson Short Duration Income ETF 116,816,598.31 –
Grand Total 254,994,015.03 259,155,598.85
DocuSign Envelope ID: 521655BF-9BE3-47DC-A9A3-494932954338

Notes to the Financial Statements (continued)
Janus Henderson Capital Funds plc / 31 December 2021342
Investment Management Fees The Investment Management fees are payable to the Manager for onward transmission to the Investment Adviser (JHIIL) who is entitled to receive an investment management fee in respect of launched Class A, B, E, G, H, I, S, T, V and Y Shares for each launched Fund calculated daily and paid monthly in arrears, as set out in the table below, which sets out the maximum fees of the Funds that are/were launched and active during the year.
Investment Management Fees Funds
Maximum Annual Percentage (of a
Fund's Net Asset Value for
Class A Shares)*
Maximum Annual Percentage (of a
Fund's Net Asset Value for
Class B, E** ,T**** and V Shares)*
Maximum Annual Percentage (of a
Fund's Net Asset Value for
Class G and Y Shares)*
Maximum Annual Percentage (of a
Fund's Net Asset Value for Class H Shares)*
Maximum Annual Percentage (of a
Fund's Net Asset Value for
Class I and S*** Shares)*
Janus Henderson Balanced Fund . . . . . . . 1.00% 1.00% 0.80% 0.80% 0.80%Janus Henderson Global Adaptive Capital Appreciation Fund . . . . . . . . . . . . . . . . . 0.90% 0.90% 0.80% 0.80% 0.80%Janus Henderson Global Adaptive Capital Preservation Fund . . . . . . . . . . . . . . . . . 0.50% 0.65% 0.50% 0.50% 0.50%Janus Henderson Global Adaptive Multi-Asset Fund . . . . . . . . . . . . . . . . . . . . . . . . . . 0.90% 0.90% 0.80% 0.80% 0.80%Janus Henderson Global Life Sciences Fund 1.50% 1.50% 0.80% 0.80% 1.50%Janus Henderson Global Research Fund . . 1.25% 1.25% 0.80% 0.80% 1.00%Janus Henderson Global Technology and Innovation Fund . . . . . . . . . . . . . . . . . . 1.50% 1.50% 0.80% 0.80% 1.50%Janus Henderson US Contrarian Fund . . . 1.25% 1.25% 0.80% 0.80% 0.95%Janus Henderson US Balanced 2026 Fund n/a n/a 0.80% n/a n/aJanus Henderson US Forty Fund . . . . . . . 1.25% 1.25% 0.80% 0.80% 0.95%Janus Henderson US Research Fund . . . . 1.00% 1.50%/1.00%**** 0.80% 0.80% 0.95%Janus Henderson US Small-Mid Cap Value Fund . . . . . . . . . . . . . . . . . . . . . . . . . . 1.00% 1.50%/1.00%**** 0.80% 0.80% 0.95%Janus Henderson US Venture Fund . . . . . 1.50% 1.50% 0.80% 0.80% 1.50%Janus Henderson Intech All-World Minimum Variance Core Fund . . . . . . . . . . . . . . . . 0.85% 0.85% 0.75% 0.75% 0.80%Janus Henderson Intech European Core Fund . . . . . . . . . . . . . . . . . . . . . . . . . . 1.00% 1.00% 0.75% 0.75% 1.00%Janus Henderson Intech Global Absolute Return Fund . . . . . . . . . . . . . . . . . . . . . 1.00% 1.00% 0.65% 0.65% 1.00%Janus Henderson Intech Global All Country Low Volatility Fund . . . . . . . . . . . . . . . . . 0.75% 0.75% 0.65% 0.65% 0.70%Janus Henderson Intech US Core Fund . . . 1.00% 1.00% 0.75% 0.75% 0.95%Janus Henderson Global Diversified Alternatives Fund . . . . . . . . . . . . . . . . . 1.25% 1.25% 0.90% 0.90% 1.10%Janus Henderson Global Real Estate Equity Income Fund . . . . . . . . . . . . . . . . . . . . 1.25% 1.25% 0.80% 0.80% 1.00%Janus Henderson Absolute Return Income Fund . . . . . . . . . . . . . . . . . . . . . . . . . . 0.65% 0.65% 0.60% 0.60% 0.55%Janus Henderson Absolute Return Income Fund (EUR) . . . . . . . . . . . . . . . . . . . . . 0.65% 0.65% 0.60% 0.60% 0.55%Janus Henderson Absolute Return Income Opportunities Fund . . . . . . . . . . . . . . . . 1.00% 1.00% 0.60% 0.60% 0.75%Janus Henderson Flexible Income Fund . . 1.00% 1.00% 0.60% 0.60% 0.55%Janus Henderson Global High Yield Fund . 1.00% 1.00% 0.60% 0.60% 0.80%Janus Henderson Global Investment Grade Bond Fund . . . . . . . . . . . . . . . . . . . . . . 0.55% 0.55/1.00%** 0.60% 0.55% 0.50/0.60%***Janus Henderson High Yield Fund . . . . . . 1.00% 1.00% 0.60% 0.60% 0.65%Janus Henderson Multi-Sector Income Fund 1.00% 1.00% 0.60% 0.60% 0.70%Janus Henderson US Short-Term Bond Fund 0.50% 0.65% 0.50% 0.50% 0.50%
In respect of the Class Z Shares, the Investment Adviser is entitled to an investment management fee which is payable under a separate agreement with the Investment Adviser into which each investor will enter (and maintain) prior to their initial subscription for Class Z Shares in the Fund.
*Calculated as a percentage of the Fund's average daily net asset value attributed to the relevant class.**Class B is 1.00% However Class E is 0.55% as per the latest Prospectus***Class I is 0.50% However Class S is 0.60% as per the latest Prospectus****For Janus Henderson US Research Fund and Janus Henderson US Small-Mid Cap Value Fund Class T is 1.00% as per the latest Prospectus
DocuSign Envelope ID: 521655BF-9BE3-47DC-A9A3-494932954338

Notes to the Financial Statements (continued)
343Janus Henderson Capital Funds plc / 31 December 2021
Shareholder Service FeesA shareholder service fee with respect to Class A Shares is payable out of the assets of each Fund at the rate of up to 0.75% per annum (up to 0.60% for the Global Adaptive Capital Appreciation Fund and the Global Adaptive Multi-Asset Fund, up to 0.50% for the Intech Sub-Advised Funds and Multi-Sector Income Fund, up to 0.40% for the Global Investment Grade Bond Fund, up to 0.25% for the Absolute Return Income Fund, Absolute Return Income Opportunities Fund and the Absolute Return Income Fund (EUR) and up to 0.20% for the Global Adaptive Capital Preservation Fund and the US Short-Term Bond Fund) of the Fund’s average daily net asset value attributable to Class A Shares.
A shareholder service fee with respect to Class B Shares is payable out of the assets of each Fund attributable to the Class B Shares at the rate of up to 0.75% per annum (up to 0.50% for the Intech Sub-Advised Funds and the Janus Henderson US Short-Term Bond Fund) of the Fund’s average daily net asset value attributable to Class B Shares.
A shareholder service fee with respect to Class E Shares is payable out of the assets of each Fund attributable to the Class E Shares at the rate of up to 1.25% for each of the Equity & Allocation Funds, Intech Sub-Advised Funds and Alternative Investment Funds, up to 1.00% for each of the Fixed Income Funds per annum of the relevant Fund’s average daily net asset value attributable to Class E Shares.
A shareholder service fee with respect to Class V Shares is payable out of the assets of each Fund attributable to the Class V Shares at the rate of up to 0.75% per annum (up to 0.50% for Intech Sub-Advised Funds and the Janus Henderson US Short-Term Bond Fund) of the Fund’s average daily net asset value attributable to Class V Shares.
A shareholder service fee with respect to Class Y Shares is payable out of the assets of each Fund at the rate of up to 0.40 % per annum of the Fund’s average daily net asset value attributable to Class Y Shares.
There are no shareholder service fees with respect to Class I, Class S, Class U, Class G, Class H and Class Z Shares.
Distribution FeesA distribution fee with respect to Class B and T is payable out of the assets of each Fund at the rate of up to 1.00% per annum of the Fund’s average daily net asset value attributable to each such Class.
Fees charged in relation to Investment Management, Shareholder Service and Distribution Fees are shown as separate line items in the Statement of Comprehensive Income.
Fund Expense LimitsThe Investment Adviser has agreed to waive all or a portion of its investment management fee to the extent necessary to ensure that the total fees (including all fees
of the Administrator, the Depositary and any Company representatives in any jurisdiction) and out-of-pocket expenses allocated to a Fund in any fiscal year do not exceed the percentage of average daily net assets attributable to each Class of Shares of such Fund which are set out in the “Fees and Expenses” section of the Prospectus.
Management fees The Manager shall be entitled to receive a fee out of the assets of the Company. Such fee shall accrue daily and shall be payable monthly in arrears. The fee payable to the Manager in relation to the provision of management services shall not exceed 0.025% of NAV of the Company per annum plus the amount of the maximum investment management fee per Share Class payable to the Investment Adviser. The Manager shall also be entitled to be reimbursed by the Company for all reasonable disbursements and out-of-pocket expenses incurred by it and the Investment Adviser, if any.
4. Taxation
The Directors have been advised that under current Irish law and practice the Company qualifies as an investment undertaking as defined in Section 739B of the Taxes Consolidation Act, 1997 (of Ireland) (as amended). On that basis it is not generally chargeable to Irish tax on its income and gains.
Tax may however arise on the happening of a chargeable event in the Company. A chargeable event includes any payments of distributions to Shareholders, any encashment, repurchase, redemption, cancellation or transfer of Shares and any deemed disposal of Shares as described in the Company’s Prospectus.
No Irish tax will arise on the Company in respect of chargeable events in respect of:
(a) a Shareholder who is neither resident nor ordinarily resident in Ireland at the time of the chargeable event and has made the necessary signed statutory declarations to that effect which are held by the Company or the Company has been authorised by the Irish Revenue to make gross payments in the absence of appropriate declarations; and
(b) certain exempted Irish resident investors as defined in the Prospectus and who have provided the Company with the necessary signed statutory declarations.
If the Company becomes liable to account for tax on a chargeable event, the Company shall be entitled to deduct from the payment arising on that chargeable event an amount equal to the appropriate tax and/or, where applicable, to repurchase and cancel such number of Shares held by the Shareholder as is required to meet the amount of tax. The relevant Shareholder shall indemnify and keep the Company indemnified against loss arising to the
DocuSign Envelope ID: 521655BF-9BE3-47DC-A9A3-494932954338

Notes to the Financial Statements (continued)
Janus Henderson Capital Funds plc / 31 December 2021344
Company by reason of the Company becoming liable to account for tax on the happening of a chargeable event.
Dividends, interest and capital gains (if any) received on investments made by the Company may be subject to withholding taxes imposed by the country from which the investment income/ gains are received and such taxes may not be recoverable by the Company or its shareholders.
On 1 April 2018, India introduced a taxation regime for long term capital gains. As a result, the Janus Henderson Global Research Fund and Janus Henderson Global Real Estate Equity Income Fund had included a provision of USD 11,965 (2020: USD 13,663) and NIL (2020: USD 31,004) respectively, for incremental Indian long term and short term capital gains earned as at 31 December 2021 on Indian securities. Other overseas capital gains tax is recognised when paid and no provision has been made for this.
5. Margin Cash and Collateral
All cash balances and bank overdrafts, for the financial year ended 31 December 2021 and 31 December 2020, were held by the Depositary, with the exception of margin cash and cash held as collateral. The below tables show the margin cash, cash collateral and non-cash collateral held for financial derivatives such as futures, options and swaps and the associated counterparties at the financial years ended 31 December 2021 and 31 December 2020.
As at 31 December 2021
Funds Counterparty
Margin Cash USD
Collateral Cash USD
Non- Cash
Collateral USD
Collateralised Position
Janus Henderson Global Adaptive Capital Preservation Fund Goldman Sachs 5,952 20,000 – FuturesJanus Henderson Global Adaptive Multi-Asset Fund CitiBank 6,514 – – OTC TRSJanus Henderson Global Adaptive Multi-Asset Fund J.P. Morgan – (290,000) – OTC TRSJanus Henderson Global Adaptive Multi-Asset Fund Goldman Sachs (102,340) 365,000 – FuturesJanus Henderson Absolute Return Income Fund Credit Suisse 119,314 680,000 – FuturesJanus Henderson Absolute Return Income Opportunities Fund Goldman Sachs 1,315 – – FuturesJanus Henderson Absolute Return Income Opportunities Fund Credit Suisse 11,383 110,000 – FuturesJanus Henderson Flexible Income Fund Goldman Sachs (6,395) 20,000 – FuturesJanus Henderson High Yield Fund Goldman Sachs – 99,979- – FuturesJanus Henderson High Yield Fund CitiBank (78,343) – – CCP CDSJanus Henderson Multi-Sector Income Fund CitiBank (17,632) – – CCP CDSJanus Henderson Multi-Sector Income Fund Goldman Sachs 129,967 539,000 – FuturesJanus Henderson US Short-Term Bond Fund Goldman Sachs 55,124 250,000 – Futures
As at 31 December 2020
Funds Counterparty
Margin Cash USD
Collateral Cash USD
Non- Cash
Collateral USD
Collateralised Position
Janus Henderson Global Adaptive Capital Appreciation Fund Goldman Sachs (27,935) 150,000 – CCP CDSJanus Henderson Global Adaptive Capital Appreciation Fund Goldman Sachs (204,516) 1,660,000 – FuturesJanus Henderson Global Adaptive Capital Appreciation Fund Goldman Sachs – (340,000) – OTC forwardsJanus Henderson Global Adaptive Capital Preservation Fund Goldman Sachs 1,400 20,000 – FuturesJanus Henderson Global Adaptive Multi-Asset Fund Goldman Sachs (44,188) 530,000 – FuturesJanus Henderson Global Adaptive Multi-Asset Fund Goldman Sachs (4,125) 33,000 – CCP CDSJanus Henderson Intech All-World Minimum Variance Core Fund HSBC – 2,180,000 – OTC forwardsJanus Henderson Intech Global Absolute Return Fund Morgan Stanley 125,546 – 510,965* FuturesJanus Henderson Absolute Return Income Fund Credit Suisse (12,182) 480,000 – FuturesJanus Henderson Absolute Return Income Fund Goldman Sachs 367,293 890,000 – CCP CDSJanus Henderson Absolute Return Income Fund (EUR) Credit Suisse (1,719) 61,083 – FuturesJanus Henderson Absolute Return Income Fund (EUR) Goldman Sachs 43,592 97,732 – CCP CDSJanus Henderson Absolute Return Income Opportunities Fund Credit Suisse (12,813) 70,000 – FuturesJanus Henderson Absolute Return Income Opportunities Fund Goldman Sachs 68,380 190,000 – CCP CDSJanus Henderson Flexible Income Fund Goldman Sachs 51,017 52,757 – CCP CDSJanus Henderson Flexible Income Fund Goldman Sachs (573) 20,000 – FuturesJanus Henderson Global High Yield Fund Goldman Sachs 11,052 90,000 – FuturesJanus Henderson High Yield Fund Goldman Sachs (504,476) 711,000 – CCP CDSJanus Henderson Multi-Sector Income Fund Goldman Sachs (59,935) 480,000 – FuturesJanus Henderson US Short-Term Bond Fund Goldman Sachs (9,582) 60,000 – Futures
*US Treasury Note 0.0000% with a maturity date of 18 February 2021 and par amount of 511,000 was pledged as collateral at 31 December 2020.
Cash collateral provided by the Fund is identified in the Statement of Financial Position as collateral cash and is not included as a component of cash and foreign currency. Cash collateral payable to the broker is identified in the Statement of Financial position as Collateral cash payable to broker. For collateral other than cash, if the party to whom the collateral is provided has the right by contract or custom to sell or re-pledge the collateral, the Fund classifies that asset in its Statement of Financial Position separately from other assets and identifies the asset as pledged collateral. Where the party to whom the collateral is provided does not have the right to sell or re-pledge, a disclosure of the collateral provided is made in the notes to the financial statements.
DocuSign Envelope ID: 521655BF-9BE3-47DC-A9A3-494932954338

Notes to the Financial Statements (continued)
345Janus Henderson Capital Funds plc / 31 December 2021
6. Commitments and Contingent Liabilities
For Credit Default Swaps in which the Company is selling protection the notional amount of the Credit Default Swap contract on which protection has been sold represents the maximum payout. As at 31 December 2021 and 31 December 2020 there is no credit risk exposure.
7. Securities Lending
During the year, the Company has entered into a securities lending programme with J.P. Morgan Chase Bank, National Association (London Branch) acting as the Securities Lending Agent for the purposes of efficient portfolio management and in order to generate additional revenue. The Securities Lending Agent shall ensure that
sufficient value and quality of collateral is received before or simultaneously with the movement of loaned collateral. This will then be held throughout the duration of the loan transaction and only returned once the lent asset has been received or returned back to the relevant fund. The Securities Lending Agent will also monitor and maintain all operational aspects of the assets while they are on loan. Securities lending revenue is accounted for in the Statement of Operations within ‘Other income’. As remuneration for this agency role, J.P. Morgan Chase Bank, National Association (London Branch) receives a maximum of 8% of the variable fees from the associated program.
All securities are fully collateralised.
As at 31 December 2021, the market value of the securities lent is as follows:
Fund Counterparty Currency Total market value of securities on loan
Amount of collateral received
Type of collateral
Janus Henderson Balanced Fund Citigroup Global Markets Ltd. USD 78,764,954 82,588,311 Government Bond78,764,954 82,588,311
Janus Henderson Global Life Sciences Fund Credit Suisse AG USD 12,234,355 12,914,441 Government BondJanus Henderson Global Life Sciences Fund UBS AG USD 17,518,021 18,683,251 Government Bond
29,752,376 31,597,692
Janus Henderson Global Research Fund Citigroup Global Markets Ltd. USD 231,998 245,514 Government BondJanus Henderson Global Research Fund UBS AG USD 783,500 897,175 Government Bond
1,015,498 1,142,689
Janus Henderson Global Technology and Innovation Fund Credit Suisse AG USD 1,411,352 1,486,017 Government BondJanus Henderson Global Technology and Innovation Fund UBS AG USD 675,377 760,684 Government Bond
2,086,729 2,246,701
Janus Henderson US Contrarian Fund UBS AG USD 500,433 562,450 Government Bond500,433 562,450
Janus Henderson US Balanced 2026 Fund Citigroup Global Markets Ltd. USD 697,646 731,511 Government Bond697,646 731,511
Janus Henderson US Forty Fund UBS AG USD 121,519 128,597 Government Bond121,519 128,597
Janus Henderson US Research Fund UBS AG USD 102,948 109,522 Government Bond102,948 109,522
Janus Henderson US Small-Mid Cap Value Fund UBS AG USD 340,560 360,398 Government Bond340,560 360,398
Janus Henderson US Venture Fund UBS AG USD 6,295,468 6,990,097 Government Bond6,295,468 6,990,097
Janus Henderson Intech European Core Fund Citigroup Global Markets Ltd. EUR 1,807,295 1,905,153 Government BondJanus Henderson Intech European Core Fund UBS AG EUR 551,070 583,172 Government Bond
2,358,365 2,488,325
Janus Henderson Global Real Estate Equity Income Fund Citigroup Global Markets Ltd. USD 80,517 85,208 Government BondJanus Henderson Global Real Estate Equity Income Fund Credit Suisse AG USD 280,896 296,592 Government BondJanus Henderson Global Real Estate Equity Income Fund UBS AG USD 2,823,152 2,987,607 Government Bond
3,184,565 3,369,407
Janus Henderson Flexible Income Fund Citigroup Global Markets Ltd. USD 9,115,910 9,558,409 Government Bond9,115,910 9,558,409
Janus Henderson High Yield Fund UBS AG USD 874,995 925,965 Government Bond874,995 925,965
DocuSign Envelope ID: 521655BF-9BE3-47DC-A9A3-494932954338

Notes to the Financial Statements (continued)
Janus Henderson Capital Funds plc / 31 December 2021346
For the year ending 31 December 2021 the total net income arising from the securities lending is as follows:
Currency Total gross amount of
stock lending revenue
Direct and indirect costs and fees
deducted by securities
lending agent
Net stock lending revenue
retained by the fund
Janus Henderson Balanced Fund USD 1,327 152 1,175Janus Henderson Global Life Sciences Fund USD 63,340 6,887 56,453Janus Henderson Global Research Fund USD 1,420 129 1,291Janus Henderson Global Technology and Innovation Fund USD 67,516 7,717 59,799Janus Henderson US Contrarian Fund USD 506 58 448Janus Henderson US Balanced 2026 Fund USD 111 12 99Janus Henderson US Forty Fund USD 71 8 63Janus Henderson US Research Fund USD 62 6 56Janus Henderson US Small-Mid Cap Value Fund USD 169 19 150Janus Henderson US Venture Fund USD 8,033 920 7,113Janus Henderson Intech European Core Fund EUR 2,756 220 2,536Janus Henderson Global Real Estate Equity Income Fund USD 5,435 435 5,000Janus Henderson Flexible Income Fund USD 2,225 254 1,971Janus Henderson High Yield Fund USD 355 40 315
8. Soft Commissions Arrangements
The Investment Manager and where relevant, sub-investment managers, use investment research, both internally generated and externally sourced, to inform their decision making.
The Investment Manager, and where relevant sub-investment managers, pay for investment research from their own resources.
For the year ending 31 December 2021 and 31 December 2020 there were no soft commission arrangements.
9. Cross Liability
The Company has segregated liability between Funds. This ensures that the liabilities incurred on behalf of a Fund will generally be discharged solely out of the assets of that Fund and there generally can be no recourse to the other Funds to satisfy those liabilities. Notwithstanding the foregoing, there can be no assurance that, should an action be brought against the Company in the courts of another jurisdiction, the segregated nature of the Funds would necessarily be upheld. In addition, whether or not there is a cross-liability between Funds, proceedings involving an individual Fund could involve the Company as a whole which could potentially affect the operation of all Funds.
10. Efficient Portfolio Management
The Company may enter into derivative contracts and Securities Financing Transactions (a repurchase transaction, securities or commodities lending and securities or commodities borrowing, a buy-sell back transaction or sell-buy back transaction and a margin lending transaction) for the purposes of efficient portfolio management. Efficient portfolio management means investment decisions involving transactions that are entered into for one or more of the following specific aims: the reduction of risk; the reduction of cost; or the generation of additional capital or income for the Funds with an appropriate level of risk, taking into account
the risk profile of the Funds. Permitted efficient portfolio management transactions are transactions in derivative contracts dealt in or traded on regulated markets operating regularly or over-the-counter arrangements with highly rated financial institutions specialising in this type of transactions.
During the financial year, forward currency contracts, futures, options, swaps transactions and stock lending arrangements were entered into for the purpose of efficient portfolio management in order to hedge currency and market exposure and/or for investment purposes. Details of all open transactions at the financial year end are disclosed in the Portfolio Investments.
The Funds did not engage in any efficient portfolio management techniques using repurchase and reverse repurchase agreements during the years ended 31 December 2021 and 31 December 2020.
DocuSign Envelope ID: 521655BF-9BE3-47DC-A9A3-494932954338

Notes to the Financial Statements (continued)
347Janus Henderson Capital Funds plc / 31 December 2021
11. Exchange Rates
The following exchange rates were used to translate assets and liabilities in currencies other than USD at 31 December 2021 and 31 December 2020:
As at 31 December
2021
As at 31 December
2020AED 3.6731 3.6732AUD 1.3745 1.2971BRL 5.5700 5.1942CAD 1.2650 1.2729CHF 0.9112 0.8853CLP 852.0000 710.5000CNH 6.3575 6.5029CNY 6.3734 6.5398COP 4,070.0000 3,415.5000DKK 6.5321 6.0924EUR 0.8783 0.8186GBP 0.7388 0.7313HKD 7.7976 7.7525HUF 324.0987 296.8486IDR 14,252.5000 14,050.0000ILS 3.1124 3.2100INR 74.3357 73.0675JPY 115.0300 103.2550KRW 1,188.7500 1,086.3000MXN 20.4755 19.9000MYR 4.1660 4.0225NOK 8.8066 8.5742NZD 1.4601 1.3899PHP 50.9925 48.0235PLN 4.0304 3.7357QAR 3.6410 3.6410SAR 3.7544 3.7516SEK 9.0362 8.2276SGD 1.3476 1.3216THB 33.4050 29.9600TRY 13.2290 7.4330TWD 27.6670 28.0980ZAR 15.9350 14.6950
The following exchange rates have been used to translate assets and liabilities in the Janus Henderson Intech European Core Fund and Janus Henderson Absolute Return Income Fund (EUR), in currencies other than EUR at 31 December 2021 and 31 December 2020:
As at 31 December
2021
As at 31 December
2020AUD 1.5648 1.5846CAD 1.4401 1.5550CHF 1.0374 1.0815DKK 7.4367 7.4428GBP 0.8411 0.8933INR 84.5345 89.2629NOK 10.0263 10.4747NZD 1.6610 1.6979SEK 10.2877 10.0512USD 1.1385 1.2217
The average foreign exchange rates being used to translate income and expenses in currencies other than US Dollars are :
As at 31 December
2021
As at 31 December
2020EUR 0.8454 0.8758
DocuSign Envelope ID: 521655BF-9BE3-47DC-A9A3-494932954338

Notes to the Financial Statements (continued)
Janus Henderson Capital Funds plc / 31 December 2021348
12. Transaction Costs
The following table details the transaction costs for the financial years ended 31 December 2021 and 31 December 2020.
Fund NameYear ended
31 December 2021Year ended
31 December 2020Janus Henderson Balanced Fund USD 155,058 USD 249,060 Janus Henderson Global Adaptive Capital Appreciation Fund USD 8,083 USD 15,741 Janus Henderson Global Adaptive Capital Preservation Fund USD 782 USD 691 Janus Henderson Global Adaptive Multi-Asset Fund USD 7,241 USD 5,430 Janus Henderson Global Life Sciences Fund USD 447,296 USD 653,989 Janus Henderson Global Research Fund USD 6,924 USD 13,697 Janus Henderson Global Technology and Innovation Fund USD 65,918 USD 58,296 Janus Henderson US Contrarian Fund USD 6,564 USD 7,384 Janus Henderson US Balanced 2026 Fund USD 1,288 USD 1,481 Janus Henderson US Forty Fund USD 52,015 USD 86,091 Janus Henderson US Research Fund USD 996 USD 40,836 Janus Henderson US Small-Mid Cap Value Fund USD 102,115 USD 15,301 Janus Henderson US Venture Fund USD 34,459 USD 32,182 Janus Henderson Intech All-World Minimum Variance Core Fund USD 481,476 USD 600,122 Janus Henderson Intech European Core Fund EUR 118,886 EUR 254,172 Janus Henderson Intech Global Absolute Return Fund USD 1,442 USD 3,935 Janus Henderson Intech Global All Country Low Volatility Fund USD 129,780 USD 332,133 Janus Henderson Intech US Core Fund USD 12,588 USD 26,746 Janus Henderson Global Real Estate Equity Income Fund USD 216,334 USD 168,621 Janus Henderson Absolute Return Income Fund USD 11,826 USD 2,754 Janus Henderson Absolute Return Income Fund (EUR) EUR 832 EUR 244 Janus Henderson Absolute Return Income Opportunities Fund USD 1,921 USD 477 Janus Henderson Flexible Income Fund USD 113 USD 64 Janus Henderson Global High Yield Fund USD 190 USD 156 Janus Henderson High Yield Fund USD 18,040 USD 50,534 Janus Henderson Multi-Sector Income Fund USD 11,132 USD 2,455 Janus Henderson US Short-Term Bond Fund USD 4,472 USD 211
There were no transaction costs for Janus Henderson Global Investment Grade Bond Fund for the financial year ended 31 December 2021 and financial year ended 31 December 2020.
Direct transaction costs related to bonds are not separately identifiable as with other financial instruments as the costs form part of the dealing spread and therefore are inherent within the purchase and sale prices of the trade.
13. Distribution Policy
The Company will declare or make dividend payments as per the distribution policy of each share class.
Where the above Classes of Shares operate equalisation, distributions made by such Classes of Shares will include an amount of income equalisation. This amount corresponds to the equalisation income included in the net asset value per Share of such Classes.
Please refer to pages 393 to 395 (which are unaudited) for details on distribution policies applicable to each Class of Share.
14. Financial Instruments and Financial Derivative Instruments
As an investment company, in pursuing their investment objectives set out in the Prospectus, the Funds hold a number of financial instruments, and derivatives for efficient portfolio management, which means that the assessment and monitoring of these risks attached to these instruments is fundamental to the financial position and results of the Company. These comprise of:
• Equity and non-equity shares, fixed income securities, floating rate securities, tranche loans and derivatives. These are held in accordance with each Fund's investment objectives and policies;
• Cash, liquid resources and short-term debtors and creditors that arise directly from operations; and
• Redeemable ordinary shares which represent investors’ monies which are invested on their behalf.
Risk can be separated into the following components: Market Risk, Credit Risk and Liquidity Risk. The main risks arising from the Company’s financial instruments are market price, foreign currency, interest rate, liquidity, credit, counterparty risk, increased margin calls and unlimited risk of loss. Further details of these and other risks are set out in the Prospectus under the heading “Risk Factors and Special Considerations”.
Assessment and Monitoring of RiskDay-to-day risk management of the Company is undertaken by the Investment Adviser. The Investment Adviser together with the Sub-Investment Advisers identify, monitor and manage all applicable risks pertaining to the Company to the extent required under the UCITS Regulations.
DocuSign Envelope ID: 521655BF-9BE3-47DC-A9A3-494932954338

Notes to the Financial Statements (continued)
349Janus Henderson Capital Funds plc / 31 December 2021
The Investment Adviser has undertaken to report to the Manager on a monthly basis matters arising in relation to the monitoring of certain material risks arising from a Fund’s investments in financial instruments. In addition to the Investment Adviser undertaking a daily review of a Fund’s investments in financial instruments, other risk management issues are also reported on a quarterly basis to the Manager by the individual or individuals within the relevant service providers responsible for monitoring risk including certain operational risks relating to the Company’s key service providers.
The risk management process is well integrated with the Investment Adviser’s investment process. The Investment Adviser has a dedicated Risk Management Group that ensures that risk is continuously monitored versus the benchmarks. The Risk Management Group meets periodically with the portfolio managers to highlight the risk and positioning of the portfolios.
Securities Lending ArrangementsA Fund may seek to earn additional income through lending its securities to certain qualified broker-dealers and institutions. There is the risk that when portfolio securities are lent, the securities may not be returned on a timely basis, and a Fund may experience delays and costs in recovering the security or gaining access to the collateral provided to a Fund to collateralise the loan. If a Fund is unable to recover a security on loan, the Fund may use the collateral to purchase replacement securities in the market. There is a risk that the value of the collateral could decrease below the value of the replacement security, resulting in a loss to the Fund. In participating in any securities lending programme, assets of the Company may be transferred to certain borrowers. Notwithstanding the requirement to receive collateral from any borrower, there are certain risks inherent in the lending of securities such as the default or failure of a borrower or securities lending agent. In addition, there are certain market risks associated with the investment of any collateral received from a borrower which could result in a decline in the value of the invested collateral, resulting in a loss to the Company.
The Investment Adviser has appointed the following Sub-Investment Advisers with responsibility for investing and managing the assets of the Funds and for assisting in identifying, monitoring and managing the relevant risks.
1. Janus Henderson Investors US LLC ("JHIUS"), Janus Henderson Investors (Singapore) Limited (“JHISL”) and Janus Henderson Investors UK Limited ("JHIUKL")
JHIUS and JHISL generally take a “bottom-up” approach to building portfolios. In other words, they seek to identify individual companies with earnings growth potential that may not be recognised by the market at large. Those Funds in the Equity and Allocation Funds and Alternative Fixed Income Investment Funds categories with the exception of the Janus Henderson US Small-Mid Cap Value Fund
follow an investment strategy in which companies are considered principally on their own fundamental qualitative and quantitative characteristics. Commonly referred to as stock picking or bottom up investing, portfolios of fundamental based investment funds are built one security at a time following intensive in house research into each company. Areas of research focus can include the company’s management, financials, competitive strengths and weaknesses, earnings growth prospects and numerous other metrics. This approach rests on a belief that some companies have inherent strengths for creating shareholder value over time, have superior prospects to their peer groups and should therefore outperform even in challenging industry and economic circumstances. The purpose of a fundamental investment approach is to identify and invest in such companies.
JHIUKL is the Sub-Investment Adviser for the Janus Henderson Absolute Return Income Fund, Janus Henderson Absolute Return Income Fund (EUR), Janus Henderson Absolute Return Income Opportunities Fund, Janus Henderson Multi-Sector Income Fund and Janus Henderson Fixed Maturity Bond Fund I (This fund was authorised during the year 2020, the fund is yet to launch). There is no overarching house style used by JHIUKL team. Each team is responsible for their investment process, stock selection, and portfolio construction. Research analysts are embedded within teams as required, depending on the requirements of the individual investment processes
2. Intech Investment Management LLC (“Intech”)
Intech the Sub-Investment Adviser for the Risk Managed Equity Funds, applies a mathematical approach to building portfolios. Intech developed the formulas underlying this mathematical process. The process is designed to take advantage of market volatility (variation in stock prices), rather than using research or market/economic trends to predict the future stocks. The process seeks to generate a return in excess of the relevant Risk Managed Equity Fund’s benchmark over the long term, while controlling the risk relative to the benchmark.
Intech’s investment and risk process is unique in that it is based on a rigorous mathematical theory – its risk process employs a proprietary optimisation process to identify the target security weights in the portfolio. Using a precise mathematical formula and applying that within specific risk constraints, the process attempts to identify a portfolio that is more efficient than the benchmark index.
3. Perkins Investment Management LLC (“Perkins”)
Perkins, the Sub-Investment Adviser for the Janus Henderson US Small-Mid Cap Value Fund, generally takes a “value” approach to building portfolios. The “value” approach emphasises investments in companies that Perkins believes are undervalued relative to their intrinsic worth.
Perkins seeks investment in companies with solid balance sheets and strong cash flows, which are trading at low
DocuSign Envelope ID: 521655BF-9BE3-47DC-A9A3-494932954338

Notes to the Financial Statements (continued)
Janus Henderson Capital Funds plc / 31 December 2021350
prices relative to their competitors or which are trading at low price/earnings, or price/book ratios, or low price/cash flow.
Within Perkins’s investment process, there are several factors which Perkins uses to manage risk. In addition to those referred to above, Perkins aims to calculate and carefully monitor the risk/reward ratio for each security in the portfolio, seeking a minimum of a 1.5:1 reward to risk ratio, but ideally aiming for a ratio of 2:1, Perkins monitors position sizes carefully and is price sensitive. Perkins may also consult with JHIUS’s Risk Committee regarding the Funds’ exposures and risk levels.
JHIIL has delegated to Perkins Investment Management LLC (“Perkins”) responsibility for providing discretionary investment management and advisory services to the Janus Henderson US Small-Mid Cap Value Fund pursuant to an Investment Management Delegation Agreement dated 11 July 2003, as amended. Perkins serves as investment adviser or sub-adviser to a number of US domiciled mutual funds, institutional investors and individually managed accounts.
The relationship with Perkins was terminated with effect from 30 September 2021.
4. Kapstream Capital PTY Limited (“Kapstream”)
Kapstream, is the Sub-Investment Adviser for the Janus Henderson Absolute Return Income Fund, Janus Henderson Absolute Return Income Fund (EUR) and Janus Henderson Absolute Return Income Opportunities Fund during the year. Kapstream portfolios are managed on a largely unconstrained basis, with risk constraints limited mostly to headline exposures. Risk is specifically managed and monitored through a combination of proprietary in-house and external quantitative risk systems (Kapstream Analytics Portal, SimCorp Dimension, Bloomberg, FINCAD) and the judgment of the portfolio managers.
Market Risk This risk comprises of three types of risk, Market Price Risk, Foreign Currency Risk and Interest Rate Risk.
Market Price RiskMarket price risk arises mainly from uncertainty about future prices of financial instruments held, which are classified as financial assets at fair value through profit or loss. It represents the potential loss the Company might suffer through holding market positions in the face of price movements. The value of Shares of a Fund and the related income may rise or fall, as the fair value price of the securities in which the Fund invests may fluctuate. Each Fund seeks to maintain a diversified portfolio but certain Funds may be less diversified leading to an increased concentration of investments which will increase the risk of that Fund suffering proportionately higher loss should a particular investment decline in value. Investment concentrations within the portfolio for each Fund are disclosed in the Portfolio Investments. There can be no
assurance that the Funds will achieve their investment objectives. Certain Sub-Investment Advisers may take a “bottom up” approach to building portfolios. In other words, they seek to identify individual companies with earnings growth potential that may not be recognised by the market at large.
DocuSign Envelope ID: 521655BF-9BE3-47DC-A9A3-494932954338

Notes to the Financial Statements (continued)
351Janus Henderson Capital Funds plc / 31 December 2021
As at 31 December 2021 and 31 December 2020, for the Funds listed in the following table, should the market value have increased or decreased by 5% with all other variables remaining constant, the increase or decrease in net assets attributable to holders of redeemable ordinary shares at the year end is shown in the following table:
Market Price Risk - 31 December 2021 and 31 December 2020
Increase or decrease of financial assets or liabilities at fair value through Volatility profit or lossFund Currency 2021 2020 2021 2020Janus Henderson Balanced Fund USD 5.00% 5.00% 429,380,630 272,781,547Janus Henderson Global Adaptive Capital Appreciation Fund USD 5.00% 5.00% – 1,808,354Janus Henderson Global Adaptive Capital Preservation Fund USD 5.00% 5.00% 145,169 28,683Janus Henderson Global Adaptive Multi-Asset Fund USD 5.00% 5.00% 820,511 661,220Janus Henderson Global Life Sciences Fund USD 5.00% 5.00% 232,074,708 193,000,192Janus Henderson Global Research Fund USD 5.00% 5.00% 4,225,577 3,638,131Janus Henderson Global Technology and Innovation Fund USD 5.00% 5.00% 26,343,291 21,996,014Janus Henderson US Contrarian Fund USD 5.00% 5.00% 1,689,606 1,147,460Janus Henderson US Balanced 2026 Fund USD 5.00% 5.00% 3,521,824 3,544,017Janus Henderson US Forty Fund USD 5.00% 5.00% 59,843,471 35,861,122Janus Henderson US Research Fund USD 5.00% 5.00% 522,864 445,972Janus Henderson US Small-Mid Cap Value Fund USD 5.00% 5.00% 10,618,262 6,276,033Janus Henderson US Venture Fund USD 5.00% 5.00% 12,894,334 12,472,341Janus Henderson Intech All World Minimum Variance Core Fund USD 5.00% 5.00% – 52,460,477Janus Henderson Intech European Core Fund EUR 5.00% 5.00% 7,024,125 5,777,218Janus Henderson Intech Global Absolute Return Fund USD 5.00% 5.00% – 242,038Janus Henderson Intech Global All Country Low Volatility Fund USD 5.00% 5.00% – 9,718,798Janus Henderson Intech US Core Fund USD 5.00% 5.00% 979,471 1,404,431Janus Henderson Global Real Estate Equity Income Fund USD 5.00% 5.00% 15,674,036 9,138,670Janus Henderson Absolute Return Income Fund USD 5.00% 5.00% 8,373,118 12,176,924Janus Henderson Absolute Return Income Fund (EUR) EUR 5.00% 5.00% – 868,069Janus Henderson Absolute Return Income Opportunities Fund USD 5.00% 5.00% 1,696,283 1,910,718Janus Henderson Flexible Income Fund USD 5.00% 5.00% 40,568,141 47,387,072Janus Henderson Global High Yield Fund USD 5.00% 5.00% – 1,131,542Janus Henderson Global Investment Grade Bond Fund USD 5.00% 5.00% 16,644,966 18,088,813Janus Henderson High Yield Fund USD 5.00% 5.00% 27,371,405 23,177,402Janus Henderson Multi-Sector Income Fund USD 5.00% 5.00% 16,635,006 13,953,535Janus Henderson US Short-Term Bond Fund USD 5.00% 5.00% 15,246,210 14,263,238
The analysis is based on the investment valued as incorporated in the financial year end Dealing Net Asset Value.
Please refer to note 1 of the financial statements for details of Fund closures during the year.
Global Derivative ExposureFor all Funds other than the Janus Henderson Global Diversified Alternatives Fund, Janus Henderson Absolute Return Income Opportunities Fund, Janus Henderson Global Adaptive Capital Appreciation Fund, Janus Henderson Global Adaptive Capital Preservation Fund, Janus Henderson Absolute Return Income Fund (EUR), Janus Henderson Global Adaptive Multi-Asset Fund and Janus Henderson Absolute Return Income Fund, the Investment Adviser uses the “commitment approach” to quantitatively measure the Fund’s global exposure when using financial derivative instruments (“FDI”). In the case of the Janus Henderson Global Adaptive Capital Appreciation Fund, Janus Henderson Global Adaptive Capital Preservation Fund, Janus Henderson Global Adaptive Multi-Asset Fund, Janus Henderson Global Diversified Alternatives Fund, Janus Henderson Absolute Return Income Fund, Janus Henderson Absolute Return Income Fund (EUR) and Janus Henderson Absolute Return Income Opportunities Fund the Investment Adviser uses the Value at Risk (“VaR”) method.
The VaR of the relevant Funds, are set to a time horizon of 20 days and a one-tailed confidence level of 99% such that the resulting VaR number represents the level of loss that should occur in only one out of one hundred periods. The models and methods are continuously backtested in each Fund’s specific environment to ensure they are capturing the extreme risks of a Fund to within an accepted tolerance level. The Funds are stress tested continuously, with a review of these tests being carried out quarterly. Further to the above, the calculation of VaR will be carried out in accordance with the following parameters:
(a) one-tailed confidence interval of 99%;
(b) holding period of 20 days;
(c) effective observation period (history) of risk factors of at least one (1) year (250 business days) unless a shorter observation period is justified by a significant increase in price volatility (for instance in extreme market conditions);
(d) quarterly data set updates, or more frequent when market prices are subject to material changes; and
DocuSign Envelope ID: 521655BF-9BE3-47DC-A9A3-494932954338

Notes to the Financial Statements (continued)
Janus Henderson Capital Funds plc / 31 December 2021352
(e) at least daily calculation.
The following table details the Absolute VaR during the financial years 2021 and 2020:
31 December 2021
Lowest VaR (%)
Highest VaR (%)
Average VaR (%)
Janus Henderson Global Adaptive Capital Appreciation Fund* 7.10 15.80 10.30Janus Henderson Global Adaptive Capital Preservation Fund 1.40 6.40 2.50Janus Henderson Global Adaptive Multi-Asset Fund 7.40 12.70 9.40Janus Henderson Absolute Return Income Fund 1.10 2.10 1.50Janus Henderson Absolute Return Income Fund (EUR)** 1.10 1.80 1.40Janus Henderson Absolute Return Income Opportunities Fund 0.80 1.90 1.20
31 December 2020
Lowest VaR (%)
Highest VaR (%)
Average VaR (%)
Janus Henderson Global Adaptive Capital Appreciation Fund 1.65 11.68 7.40Janus Henderson Global Adaptive Capital Preservation Fund 0.10 5.33 1.75Janus Henderson Global Adaptive Multi-Asset Fund 4.76 15.50 9.46Janus Henderson Global Diversified Alternatives Fund*** 0.01 3.32 0.97Janus Henderson Absolute Return Income Fund 0.38 2.01 1.23Janus Henderson Absolute Return Income Fund (EUR) 0.25 1.93 1.28Janus Henderson Absolute Return Income Opportunities Fund 0.56 3.97 1.49
Limitations of VaRWhilst VaR is a good general risk measure, it does have certain limitations, including:
• The measure is a point-in-time calculation, reflecting positions as recorded at that date, which do not necessarily reflect the risk positions held at any other time.
• VaR is a statistical estimation and therefore it is possible that there could be, in any period, a greater number of days in which losses could exceed the calculated VaR than implied by the confidence level.
* The fund closed on 27 May 2021.** The fund closed on 10 November 2021.*** The fund closed on 16 April 2020.
• Although losses are not expected to exceed the calculated VaR on 99% of occasions, on the other 1% of occasions losses will be greater and might be substantially greater than the calculated VaR.
• The period over which positions are expected to be held may differ and so will the modelled losses incurred.
• A look back period of 2 year means that any return that has not been evidenced in this time period will not be present in the distribution.
The following table details the VaR limit during the financial years 2021 and 2020:
31 December 2021
Lowest Utilisation (%)
Highest Utilisation (%)
Average Utilisation (%)
Janus Henderson Global Adaptive Capital Appreciation Fund* 35.60 79.10 51.70Janus Henderson Global Adaptive Capital Preservation Fund 6.90 31.80 12.50Janus Henderson Global Adaptive Multi-Asset Fund 36.90 63.30 47.00Janus Henderson Absolute Return Income Fund 5.30 10.30 7.50Janus Henderson Absolute Return Income Fund (EUR)** 5.40 8.80 7.10Janus Henderson Absolute Return Income Opportunities Fund 4.00 9.50 6.10
31 December 2020
Lowest Utilisation (%)
Highest Utilisation (%)
Average Utilisation (%)
Janus Henderson Global Adaptive Capital Appreciation Fund 8.24 58.42 37.01Janus Henderson Global Adaptive Capital Preservation Fund 0.52 26.64 8.74Janus Henderson Global Adaptive Multi-Asset Fund 23.79 77.49 47.28Janus Henderson Global Diversified Alternatives Fund*** 0.05 16.60 4.85Janus Henderson Absolute Return Income Fund 1.88 10.07 6.16Janus Henderson Absolute Return Income Fund (EUR) 1.23 9.64 6.42Janus Henderson Absolute Return Income Opportunities Fund 2.81 19.85 7.43
In the case of the above Funds leverage is calculated as the sum of the notionals of the derivatives used.
DocuSign Envelope ID: 521655BF-9BE3-47DC-A9A3-494932954338

Notes to the Financial Statements (continued)
353Janus Henderson Capital Funds plc / 31 December 2021
The average level of leverage employed by the Janus Henderson Global Adaptive Capital Appreciation Fund, Janus Henderson Global Adaptive Capital Preservation Fund, Janus Henderson Global Adaptive Multi-Asset Fund, Janus Henderson Global Diversified Alternatives Fund, Janus Henderson Absolute Return Income Fund, Janus Henderson Absolute Return Income Fund (EUR) and Janus Henderson Absolute Return Income Opportunities Fund during the financial years 2021 and 2020 was as follows:
31 December 2021
Average Level of Leverage
(%)Janus Henderson Global Adaptive Capital Appreciation Fund* 89.00Janus Henderson Global Adaptive Capital Preservation Fund 18.70Janus Henderson Global Adaptive Multi-Asset Fund 78.80Janus Henderson Absolute Return Income Fund 118.30Janus Henderson Absolute Return Income Fund (EUR)** 214.50Janus Henderson Absolute Return Income Opportunities Fund 154.50
31 December 2020
Average Level of Leverage
(%)Janus Henderson Global Adaptive Capital Appreciation Fund 67.20Janus Henderson Global Adaptive Capital Preservation Fund 26.25Janus Henderson Global Adaptive Multi-Asset Fund 72.99Janus Henderson Global Diversified Alternatives Fund* 391.00Janus Henderson Absolute Return Income Fund 73.39Janus Henderson Absolute Return Income Fund (EUR) 111.42Janus Henderson Absolute Return Income Opportunities Fund 118.39
Foreign Currency RiskEach of the Funds has the flexibility to invest a portion of its net assets in non-base currency securities. As long as a Fund holds a foreign currency asset or liability, its value will be affected by the value of the local currency relative to the base currency of the Fund. While the Company will attempt to hedge against currency exposure in the non-base currency Share Classes, there can be no guarantee that the value of these Classes will not be affected by the value of these currencies relative to the base currency of the Funds as applicable.
The Investment Adviser has identified three principal areas where foreign currency risk could impact the Company:
• Movements in rates affect the fair value of investments;
• Movements in rates affect short-term timing differences; and
• Movements in rates affect the income received.
The Company can hedge the initial investment and subsequent gains of the value of investments that are priced in other currencies. The hedging is done by entering into forward currency contracts to minimise the amount of foreign currency risk. For more information on open forward currency contracts please refer to the section “Forward Currency Contracts” in the Portfolio Investments of the Financial Statements. The Investment Adviser also employs forward currency contracts to hedge the currency exposure of the Classes and the base currency of the Funds, as applicable, provided that the conditions set out in the Prospectus are met (“Class Level Hedging”).
The Company may be subject to short-term exposure to exchange rate movements, for instance, where there is an exchange difference between the date an investment purchase or sale is entered into and the date when settlement of the proceeds occurs. When the Company enters into such a transaction which will involve the buying and selling of foreign currency in order to complete it, a forward currency contract can be entered into at the same time as the initial transaction in order to minimise foreign currency risk.
The Company receives income in currencies other than the non-base currency of the Funds and the value of this income can be affected by movements in exchange rates. The Company converts all receipts of income into the base currency as appropriate on or near the date of receipt. However it does not hedge or otherwise seek to avoid movement risk on income accrued but not received.
Janus Henderson US Research Fund, Janus Henderson US Small-Mid Cap Value Fund, Janus Henderson Intech US Core Fund, Janus Flexible Income Fund and Janus US Short-Term Bond Fund had partial but insignificant exposure to foreign currencies other than their functional currency as at 31 December 2021 and 31 December 2020.
* The fund closed on 27 May 2021.** The fund closed on 10 November 2021.*** The fund closed on 16 April 2020.
DocuSign Envelope ID: 521655BF-9BE3-47DC-A9A3-494932954338

Notes to the Financial Statements (continued)
Janus Henderson Capital Funds plc / 31 December 2021354
The following sets out the total exposure to foreign currency risk including short-term assets and liabilities excluding relevant class level hedging as at 31 December 2021 and 31 December 2020 as applicable:
Janus Henderson Balanced Fund Currency
Monetary Assets in USD
Monetary Liabilities
in USD
Non- Monetary
Assets in USD
Non- Monetary Liabilities
in USD
Impact of forward
currency contracts
in USD
Net Exposures
in USD
As at 31 December 2021AUD 92,730 (150,080) – – – (57,350)CAD 100,734 (9,223) – – – 91,511EUR 10,585,449 (1,615,040) – – – 8,970,409HKD 798,770 (921,157) – – – (122,387)SGD 153,302 (7,544) – – – 145,758
11,730,985 (2,703,044) – – – 9,027,941
Janus Henderson Global Adaptive Capital Preservation Fund Currency
Monetary Assets in USD
Monetary Liabilities
in USD
Non- Monetary
Assets in USD
Non- Monetary Liabilities
in USD
Impact of forward
currency contracts
in USD
Net Exposures
in USD
As at 31 December 2021CAD 6 – – – – 6EUR 43 (3) – – – 40GBP 1 – 59,637 – – 59,638MXN 830 – – – – 830NOK 86 – – – – 86
966 (3) 59,637 – – 60,600
Janus Henderson Global Adaptive Multi-Asset Fund Currency
Monetary Assets in USD
Monetary Liabilities
in USD
Non- Monetary
Assets in USD
Non- Monetary Liabilities
in USD
Impact of forward
currency contracts
in USD
Net Exposures
in USD
As at 31 December 2021AUD 9 – 5,703 – (34,924) (29,212)CAD 497 – 24,807 – (24,506) 798CHF – – – – (19,763) (19,763)EUR 5,086 – 1,332,292 – (94,526) 1,242,852GBP – – – – (23,009) (23,009)HKD – – – – 34,371 34,371JPY 5 – 690 – (20,667) (19,972)
KRW 16,824 – – – (194) 16,630MXN 11,976 – 509,437 – (157,605) 363,808SEK 10 – 13,236 – – 13,246SGD – – – – (20,776) (20,776)
34,407 – 1,886,165 – (361,599) 1,558,973
DocuSign Envelope ID: 521655BF-9BE3-47DC-A9A3-494932954338

Notes to the Financial Statements (continued)
355Janus Henderson Capital Funds plc / 31 December 2021
Janus Henderson Global Life Sciences Fund Currency
Monetary Assets in USD
Monetary Liabilities
in USD
Non- Monetary
Assets in USD
Non- Monetary Liabilities
in USD
Impact of forward
currency contracts
in USD
Net Exposures
in USD
As at 31 December 2021AUD 1,059 – – – – 1,059CHF – – 153,520,468 – – 153,520,468CNH – (123) – – – (123)CNY 123 – – – – 123DKK 421,497 – 70,338,579 – – 70,760,076EUR 1,563,155 (4,904,594) 84,423,163 – – 81,081,724GBP 2,440,258 (16,209) 182,819,814 – – 185,243,863HKD 19,157 (36,028) 9,416,031 – – 9,399,160JPY – (1) 63,671,140 – – 63,671,139
SGD 33,319 (23,398) – – – 9,921
4,478,568 (4,980,353) 564,189,195 – – 563,687,410
Janus Henderson Global Research Fund Currency
Monetary Assets in USD
Monetary Liabilities
in USD
Non- Monetary
Assets in USD
Non- Monetary Liabilities
in USD
Impact of forward
currency contracts
in USD
Net Exposures
in USD
As at 31 December 2021CAD 7,319 – 2,573,671 – – 2,580,990CHF – – 1,495,867 – – 1,495,867EUR 9,192 – 9,149,849 – – 9,159,041GBP 1,181 – 5,224,727 – – 5,225,908HKD – – 1,702,463 – – 1,702,463INR – (11,965) 392,341 – – 380,376JPY – – 839,198 – – 839,198
SEK – – 2,225,163 – – 2,225,163TWD 4,711 – 1,333,719 – – 1,338,430
22,403 (11,965) 24,936,998 – – 24,947,436
Janus Henderson Global Technology and Innovation Fund Currency
Monetary Assets in USD
Monetary Liabilities
in USD
Non- Monetary
Assets in USD
Non- Monetary Liabilities
in USD
Impact of forward
currency contracts
in USD
Net Exposures
in USD
As at 31 December 2021AUD 1,981 (943) – – – 1,038CAD – – 59 – – 59EUR 2,409,127 (324,844) 33,676,719 – – 35,761,002HKD 457,927 (6,424) – – – 451,503INR – – 550,440 – – 550,440
TWD 83,706 – 23,695,739 – – 23,779,445
2,952,741 (332,211) 57,922,957 – – 60,543,487
Janus Henderson US Contrarian Fund Currency
Monetary Assets in USD
Monetary Liabilities
in USD
Non- Monetary
Assets in USD
Non- Monetary Liabilities
in USD
Impact of forward
currency contracts
in USD
Net Exposures
in USD
As at 31 December 2021EUR 1,466 (4,188) – – – (2,722)GBP – – 761,504 – – 761,504
1,466 (4,188) 761,504 – – 758,782
DocuSign Envelope ID: 521655BF-9BE3-47DC-A9A3-494932954338

Notes to the Financial Statements (continued)
Janus Henderson Capital Funds plc / 31 December 2021356
Janus Henderson US Balanced 2026 Fund Currency
Monetary Assets in USD
Monetary Liabilities
in USD
Non- Monetary
Assets in USD
Non- Monetary Liabilities
in USD
Impact of forward
currency contracts
in USD
Net Exposures
in USD
As at 31 December 2021CHF 4 – – – – 4EUR 267 (29,459) – – – (29,192)
271 (29,459) – – – (29,188)
Janus Henderson US Forty Fund Currency
Monetary Assets in USD
Monetary Liabilities
in USD
Non- Monetary
Assets in USD
Non- Monetary Liabilities
in USD
Impact of forward
currency contracts
in USD
Net Exposures
in USD
As at 31 December 2021EUR 147,000 (186,997) 19,886,068 – – 19,846,071GBP 1,159 – – – – 1,159
148,159 (186,997) 19,886,068 – – 19,847,230
Janus Henderson US Research Fund Currency
Monetary Assets in USD
Monetary Liabilities
in USD
Non- Monetary
Assets in USD
Non- Monetary Liabilities
in USD
Impact of forward
currency contracts
in USD
Net Exposures
in USD
As at 31 December 2021EUR 108 – – – – 108GBP – – 90,465 – – 90,465
108 – 90,465 – – 90,573
Janus Henderson US Small-Mid Cap Value Fund Currency
Monetary Assets in USD
Monetary Liabilities
in USD
Non- Monetary
Assets in USD
Non- Monetary Liabilities
in USD
Impact of forward
currency contracts
in USD
Net Exposures
in USD
As at 31 December 2021EUR 1 (65,697) – – – (65,696)
1 (65,697) – – – (65,696)
Janus Henderson US Venture Fund Currency
Monetary Assets in USD
Monetary Liabilities
in USD
Non- Monetary
Assets in USD
Non- Monetary Liabilities
in USD
Impact of forward
currency contracts
in USD
Net Exposures
in USD
As at 31 December 2021CAD – – 7,788,628 – (7,047,290) 741,338EUR 24,414 (88,881) – – – (64,467)GBP – – – – (1,261,731) (1,261,731)
24,414 (88,881) 7,788,628 – (8,309,021) (584,860)
DocuSign Envelope ID: 521655BF-9BE3-47DC-A9A3-494932954338

Notes to the Financial Statements (continued)
357Janus Henderson Capital Funds plc / 31 December 2021
Janus Henderson Intech European Core Fund Currency
Monetary Assets in EUR
Monetary Liabilities
in EUR
Non- Monetary
Assets in EUR
Non- Monetary Liabilities
in EUR
Impact of forward
currency contracts
in EUR
Net Exposures
in EUR
As at 31 December 2021CHF – – 26,196,584 – – 26,196,584DKK 51,456 – 9,917,414 – – 9,968,870GBP 10,137 – 24,680,764 – – 24,690,901NOK 32,696 – 5,107,393 – – 5,140,089SEK 56,492 – 14,552,285 – – 14,608,777USD 52,546 (1) 10 – – 52,555
203,327 (1) 80,454,450 – – 80,657,776
Janus Henderson Intech US Core Fund Currency
Monetary Assets in USD
Monetary Liabilities
in USD
Non- Monetary
Assets in USD
Non- Monetary Liabilities
in USD
Impact of forward
currency contracts
in USD
Net Exposures
in USD
As at 31 December 2021EUR 22,756 (51) – – – 22,705
22,756 (51) – – – 22,705
Janus Henderson Global Real Estate Equity Income Fund Currency
Monetary Assets in USD
Monetary Liabilities
in USD
Non- Monetary
Assets in USD
Non- Monetary Liabilities
in USD
Impact of forward
currency contracts
in USD
Net Exposures
in USD
As at 31 December 2021AUD 60,992 – 12,246,669 – – 12,307,661CAD 35,310 – 16,942,567 – – 16,977,877EUR 129,957 (7,684) 17,213,774 – – 17,336,047GBP 112,242 (86,675) 17,252,229 – – 17,277,796HKD – – 6,539,957 – – 6,539,957INR – – 2,195,799 – – 2,195,799JPY 84,950 (4,146) 19,424,260 – – 19,505,064
NOK 2,862 – – – – 2,862SGD 101,196 – 7,015,574 – – 7,116,770
527,509 (98,505) 98,830,829 – – 99,259,833
Janus Henderson Absolute Return Income Fund Currency
Monetary Assets in USD
Monetary Liabilities
in USD
Non- Monetary
Assets in USD
Non- Monetary Liabilities
in USD
Impact of forward
currency contracts
in USD
Net Exposures
in USD
As at 31 December 2021AUD 645,491 – 52,667,018 – (53,189,589) 122,920CAD 774 – 89,384 – (90,514) (356)GBP 23,181 – – – – 23,181NZD – – 2,724,722 – (2,713,550) 11,172
669,446 – 55,481,124 – (55,993,653) 156,917
DocuSign Envelope ID: 521655BF-9BE3-47DC-A9A3-494932954338

Notes to the Financial Statements (continued)
Janus Henderson Capital Funds plc / 31 December 2021358
Janus Henderson Absolute Return Income Opportunities Fund Currency
Monetary Assets in USD
Monetary Liabilities
in USD
Non- Monetary
Assets in USD
Non- Monetary Liabilities
in USD
Impact of forward
currency contracts
in USD
Net Exposures
in USD
As at 31 December 2021AUD 371,243 – 15,638,420 – (16,007,810) 1,853EUR 14,211 (2,382) – – – 11,829
385,454 (2,382) 15,638,420 – (16,007,810) 13,682
Janus Henderson Flexible Income Fund Currency
Monetary Assets in USD
Monetary Liabilities
in USD
Non- Monetary
Assets in USD
Non- Monetary Liabilities
in USD
Impact of forward
currency contracts
in USD
Net Exposures
in USD
As at 31 December 2021EUR 57,512 (220,776) – – – (163,264)
57,512 (220,776) – – – (163,264)
Janus Henderson Global Investment Grade Bond Fund Currency
Monetary Assets in USD
Monetary Liabilities
in USD
Non- Monetary
Assets in USD
Non- Monetary Liabilities
in USD
Impact of forward
currency contracts
in USD
Net Exposures
in USD
As at 31 December 2021EUR 211,834 (16,908) 61,624,419 – (61,896,830) (77,485)GBP 144,847 – 22,238,858 – (22,544,973) (161,268)
356,681 (16,908) 83,863,277 – (84,441,803) (238,753)
Janus Henderson High Yield Fund Currency
Monetary Assets in USD
Monetary Liabilities
in USD
Non- Monetary
Assets in USD
Non- Monetary Liabilities
in USD
Impact of forward
currency contracts
in USD
Net Exposures
in USD
As at 31 December 2021AUD 291 (14,902) – – – (14,611)EUR 12,675 (92,145) – – – (79,470)HKD 714 – – – – 714
13,680 (107,047) – – – (93,367)
Janus Henderson Multi-Sector Income Fund Currency
Monetary Assets in USD
Monetary Liabilities
in USD
Non- Monetary
Assets in USD
Non- Monetary Liabilities
in USD
Impact of forward
currency contracts
in USD
Net Exposures
in USD
As at 31 December 2021EUR 71,395 – 8,626,402 – (8,819,113) (121,316)GBP 6,503 – 2,707,321 – (2,706,588) 7,236
77,898 – 11,333,723 – (11,525,701) (114,080)
Janus Henderson US Short-Term Bond Fund Currency
Monetary Assets in USD
Monetary Liabilities
in USD
Non- Monetary
Assets in USD
Non- Monetary Liabilities
in USD
Impact of forward
currency contracts
in USD
Net Exposures
in USD
As at 31 December 2021EUR – (63,286) – – – (63,286)
– (63,286) – – – (63,286)
DocuSign Envelope ID: 521655BF-9BE3-47DC-A9A3-494932954338

Notes to the Financial Statements (continued)
359Janus Henderson Capital Funds plc / 31 December 2021
Janus Henderson Balanced Fund Currency
Monetary Assets in USD
Monetary Liabilities
in USD
Non- Monetary
Assets in USD
Non- Monetary Liabilities
in USD
Impact of forward
currency contracts
in USD
Net Exposures
in USDAs at 31 December 2020
AUD 33,629 (33,937) – – – (308)CAD 91,884 – – – – 91,884EUR 6,855,088 (827,867) – – – 6,027,221HKD 368,175 (512,164) – – – (143,989)SGD 22,441 (5) – – – 22,436
7,371,217 (1,373,973) – – – 5,997,244
Janus Henderson Global Adaptive Capital Appreciation Fund Currency
Monetary Assets in USD
Monetary Liabilities
in USD
Non- Monetary
Assets in USD
Non- Monetary Liabilities
in USD
Impact of forward
currency contracts
in USD
Net Exposures
in USDAs at 31 December 2020
AUD – (986) – (7,844) – (8,830)BRL – – – – (23,462) (23,462)CAD 866 – – – (291,510) (290,644)EUR – (1,383) 3,032,578 – (3,026,632) 4,563GBP 1,888 – – (3,397) – (1,509)JPY 11,057 (4) 8,303,744 – (8,259,875) 54,922
KRW – – – – (1,174) (1,174)MXN – – 3,835,650 – (3,837,957) (2,307)SEK 23 – – (3,140) – (3,117)
TWD – – – – (112,266) (112,266)
13,834 (2,373) 15,171,972 (14,381) (15,552,876) (383,824)
Janus Henderson Global Adaptive Capital Preservation Fund Currency
Monetary Assets in USD
Monetary Liabilities
in USD
Non- Monetary
Assets in USD
Non- Monetary Liabilities
in USD
Impact of forward
currency contracts
in USD
Net Exposures
in USDAs at 31 December 2020
AUD – (2) – – – (2)CAD 4 – – – – 4EUR – (7) – – – (7)JPY 72 – 219,393 – (219,581) (116)
MXN 890 – 149,010 – (149,099) 801NOK 88 – – – – 88
1,054 (9) 368,403 – (368,680) 768
Janus Henderson Global Adaptive Multi-Asset Fund Currency
Monetary Assets in USD
Monetary Liabilities
in USD
Non- Monetary
Assets in USD
Non- Monetary Liabilities
in USD
Impact of forward
currency contracts
in USD
Net Exposures
in USDAs at 31 December 2020
AUD 1 – – (3,688) (37,024) (40,711)CAD 339 – – – (24,358) (24,019)CHF – – – – (20,367) (20,367)EUR 12,437 (389) 1,189,359 – (607,599) 593,808GBP 2 – – (795) (23,256) (24,049)HKD – – – – 34,576 34,576JPY – (425) 1,803,818 – (1,792,447) 10,946
KRW 33,396 – 13,374 – (212) 46,558MXN 1,186 – 1,318,650 – (962,555) 357,281SGD – – – – (21,187) (21,187)
47,361 (814) 4,325,201 (4,483) (3,454,429) 912,836
DocuSign Envelope ID: 521655BF-9BE3-47DC-A9A3-494932954338

Notes to the Financial Statements (continued)
Janus Henderson Capital Funds plc / 31 December 2021360
Janus Henderson Global Life Sciences Fund Currency
Monetary Assets in USD
Monetary Liabilities
in USD
Non- Monetary
Assets in USD
Non- Monetary Liabilities
in USD
Impact of forward
currency contracts
in USD
Net Exposures
in USDAs at 31 December 2020
AUD 3,096 (130,227) – – – (127,131)CHF – – 131,564,560 – – 131,564,560DKK 392,866 – 38,442,670 – – 38,835,536EUR 4,385,697 (1,280,556) 74,029,303 – – 77,134,444GBP 82,649 (611,635) 130,434,189 – – 129,905,203HKD 134,172 (84,801) 21,546,828 – – 21,596,199JPY – (2,006,258) 51,880,991 – – 49,874,733
SGD 96,476 (52,725) – – – 43,751
5,094,956 (4,166,202) 447,898,541 – – 448,827,295
Janus Henderson Global Research Fund Currency
Monetary Assets in USD
Monetary Liabilities
in USD
Non- Monetary
Assets in USD
Non- Monetary Liabilities
in USD
Impact of forward
currency contracts
in USD
Net Exposures
in USDAs at 31 December 2020
CAD 1,699 – 2,188,031 – – 2,189,730CHF – – 1,367,512 – – 1,367,512EUR 7,801 – 8,038,789 – – 8,046,590GBP 8,804 (365) 4,874,733 – – 4,883,172HKD – – 2,267,618 – – 2,267,618INR – (13,663) 635,814 – – 622,151JPY – – 1,678,762 – – 1,678,762
SEK – – 1,212,510 – – 1,212,510TWD 4,850 – 1,295,922 – – 1,300,772
23,154 (14,028) 23,559,691 – – 23,568,817
Janus Henderson Global Technology and Innovation Fund Currency
Monetary Assets in USD
Monetary Liabilities
in USD
Non- Monetary
Assets in USD
Non- Monetary Liabilities
in USD
Impact of forward
currency contracts
in USD
Net Exposures
in USDAs at 31 December 2020
AUD 16,091 – – – – 16,091CAD – – 1,976,388 – – 1,976,388EUR 1,259,482 (581,083) 17,451,929 – – 18,130,328HKD 20,511 (37,793) 6,201,852 – – 6,184,570TWD 80,622 – 21,542,359 – – 21,622,981
1,376,706 (618,876) 47,172,528 – – 47,930,358
Janus Henderson US Contrarian Fund Currency
Monetary Assets in USD
Monetary Liabilities
in USD
Non- Monetary
Assets in USD
Non- Monetary Liabilities
in USD
Impact of forward
currency contracts
in USD
Net Exposures
in USDAs at 31 December 2020
COP – – – – – –EUR 3,386 (472) – – 1 2,915GBP – – 467,594 – – 467,594
3,386 (472) 467,594 – 1 470,509
DocuSign Envelope ID: 521655BF-9BE3-47DC-A9A3-494932954338

Notes to the Financial Statements (continued)
361Janus Henderson Capital Funds plc / 31 December 2021
Janus Henderson US Balanced 2026 Fund Currency
Monetary Assets in USD
Monetary Liabilities
in USD
Non- Monetary
Assets in USD
Non- Monetary Liabilities
in USD
Impact of forward
currency contracts
in USD
Net Exposures
in USDAs at 31 December 2020
EUR 1,617 (29,301) – – – (27,684)
1,617 (29,301) – – – (27,684)
Janus Henderson US Forty Fund Currency
Monetary Assets in USD
Monetary Liabilities
in USD
Non- Monetary
Assets in USD
Non- Monetary Liabilities
in USD
Impact of forward
currency contracts
in USD
Net Exposures
in USDAs at 31 December 2020
EUR 182,277 (165,139) 17,289,064 – – 17,306,202GBP 456 – – – – 456
182,733 (165,139) 17,289,064 – – 17,306,658
Janus Henderson US Research Fund Currency
Monetary Assets in USD
Monetary Liabilities
in USD
Non- Monetary
Assets in USD
Non- Monetary Liabilities
in USD
Impact of forward
currency contracts
in USD
Net Exposures
in USDAs at 31 December 2020
EUR 18,535 (61,183) – – – (42,648)
18,535 (61,183) – – – (42,648)
Janus Henderson US Small-Mid Cap Value Fund Currency
Monetary Assets in USD
Monetary Liabilities
in USD
Non- Monetary
Assets in USD
Non- Monetary Liabilities
in USD
Impact of forward
currency contracts
in USD
Net Exposures
in USDAs at 31 December 2020
EUR 135 (6,219) – – – (6,084)
135 (6,219) – – – (6,084)
Janus Henderson US Venture Fund Currency
Monetary Assets in USD
Monetary Liabilities
in USD
Non- Monetary
Assets in USD
Non- Monetary Liabilities
in USD
Impact of forward
currency contracts
in USD
Net Exposures
in USDAs at 31 December 2020
CAD – – 3,485,446 – (3,929,255) (443,809)EUR 269,899 (99,848) 553,453 – (422,269) 301,235GBP 17,589 – – – (953,501) (935,912)
287,488 (99,848) 4,038,899 – (5,305,025) (1,078,486)
DocuSign Envelope ID: 521655BF-9BE3-47DC-A9A3-494932954338
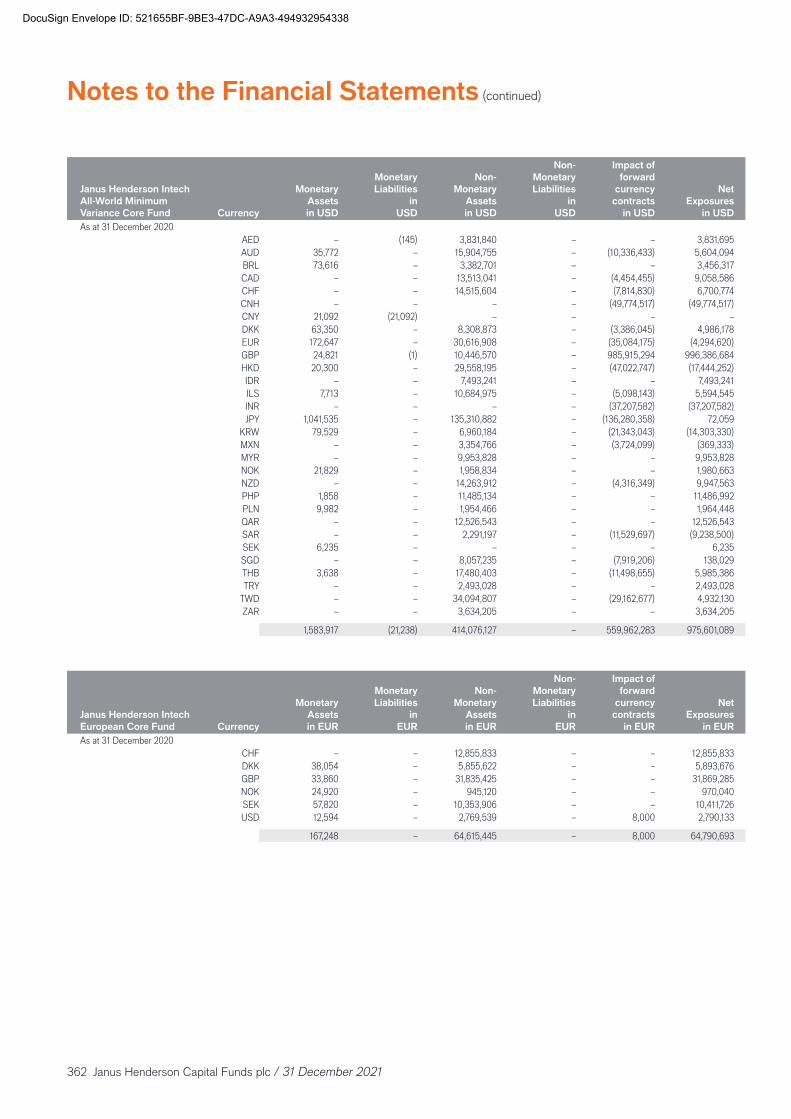
Notes to the Financial Statements (continued)
Janus Henderson Capital Funds plc / 31 December 2021362
Janus Henderson Intech All-World Minimum Variance Core Fund Currency
Monetary Assets in USD
Monetary Liabilities
in USD
Non- Monetary
Assets in USD
Non- Monetary Liabilities
in USD
Impact of forward
currency contracts
in USD
Net Exposures
in USDAs at 31 December 2020
AED – (145) 3,831,840 – – 3,831,695AUD 35,772 – 15,904,755 – (10,336,433) 5,604,094BRL 73,616 – 3,382,701 – – 3,456,317CAD – – 13,513,041 – (4,454,455) 9,058,586CHF – – 14,515,604 – (7,814,830) 6,700,774CNH – – – – (49,774,517) (49,774,517)CNY 21,092 (21,092) – – – –DKK 63,350 – 8,308,873 – (3,386,045) 4,986,178EUR 172,647 – 30,616,908 – (35,084,175) (4,294,620)GBP 24,821 (1) 10,446,570 – 985,915,294 996,386,684HKD 20,300 – 29,558,195 – (47,022,747) (17,444,252)IDR – – 7,493,241 – – 7,493,241ILS 7,713 – 10,684,975 – (5,098,143) 5,594,545INR – – – – (37,207,582) (37,207,582)JPY 1,041,535 – 135,310,882 – (136,280,358) 72,059
KRW 79,529 – 6,960,184 – (21,343,043) (14,303,330)MXN – – 3,354,766 – (3,724,099) (369,333)MYR – – 9,953,828 – – 9,953,828NOK 21,829 – 1,958,834 – – 1,980,663NZD – – 14,263,912 – (4,316,349) 9,947,563PHP 1,858 – 11,485,134 – – 11,486,992PLN 9,982 – 1,954,466 – – 1,964,448QAR – – 12,526,543 – – 12,526,543SAR – – 2,291,197 – (11,529,697) (9,238,500)SEK 6,235 – – – – 6,235SGD – – 8,057,235 – (7,919,206) 138,029THB 3,638 – 17,480,403 – (11,498,655) 5,985,386TRY – – 2,493,028 – – 2,493,028
TWD – – 34,094,807 – (29,162,677) 4,932,130ZAR – – 3,634,205 – – 3,634,205
1,583,917 (21,238) 414,076,127 – 559,962,283 975,601,089
Janus Henderson Intech European Core Fund Currency
Monetary Assets in EUR
Monetary Liabilities
in EUR
Non- Monetary
Assets in EUR
Non- Monetary Liabilities
in EUR
Impact of forward
currency contracts
in EUR
Net Exposures
in EURAs at 31 December 2020
CHF – – 12,855,833 – – 12,855,833DKK 38,054 – 5,855,622 – – 5,893,676GBP 33,860 – 31,835,425 – – 31,869,285NOK 24,920 – 945,120 – – 970,040SEK 57,820 – 10,353,906 – – 10,411,726USD 12,594 – 2,769,539 – 8,000 2,790,133
167,248 – 64,615,445 – 8,000 64,790,693
DocuSign Envelope ID: 521655BF-9BE3-47DC-A9A3-494932954338

Notes to the Financial Statements (continued)
363Janus Henderson Capital Funds plc / 31 December 2021
Janus Henderson Intech Global Absolute Return Fund Currency
Monetary Assets in USD
Monetary Liabilities
in USD
Non- Monetary
Assets in USD
Non- Monetary Liabilities
in USD
Impact of forward
currency contracts
in USD
Net Exposures
in USDAs at 31 December 2020
AUD – – 118,198 – – 118,198CAD – (15) 49,100 – – 49,085CHF – – 3,236 – – 3,236DKK 53 – 11,742 – – 11,795EUR 84 (1) 141,430 – – 141,513GBP – – 59,826 – – 59,826HKD – – 23,495 – – 23,495JPY 1,370 (72) 983,747 – – 985,045
NOK 173 – – – – 173NZD – – 32,980 – – 32,980SEK – – 1,793 – – 1,793
1,680 (88) 1,425,547 – – 1,427,139
Janus Henderson Intech Global All Country Low Volatility Fund Currency
Monetary Assets in USD
Monetary Liabilities
in USD
Non- Monetary
Assets in USD
Non- Monetary Liabilities
in USD
Impact of forward
currency contracts
in USD
Net Exposures
in USDAs at 31 December 2020
AUD – – 610,169 – – 610,169BRL 8,593 – 640,971 – – 649,564CAD 6,415 – 557,742 – – 564,157CHF – – 37,894 – – 37,894CLP – – 846,514 – – 846,514COP 498 – 65,118 – – 65,616DKK 9,948 – 1,007,135 – – 1,017,083EUR 99,352 – 1,682,649 – – 1,782,001GBP 12,956 – 3,899,697 – – 3,912,653HKD – – 11,965,118 – – 11,965,118HUF – – 49,514 – – 49,514IDR – (281,725) 784,128 – – 502,403ILS – – 314,340 – – 314,340JPY 539,478 (2,035) 38,361,584 – – 38,899,027
KRW 20,355 (127,479) 3,391,167 – – 3,284,043MXN – – 50,915 – – 50,915MYR 21,203 – 1,345,890 – – 1,367,093NOK 14,483 – – – – 14,483NZD – – 273,890 – – 273,890PHP 538 – 313,281 – – 313,819PLN 10,644 – – – – 10,644QAR – – 821,093 – – 821,093SAR 2,357 – 1,916,863 – – 1,919,220SEK – – 43,315 – – 43,315SGD 12,295 – 1,313,595 – – 1,325,890THB – – 1,141,939 – – 1,141,939TRY – – 88,499 – – 88,499
TWD 55,962 (53,502) 9,209,461 – – 9,211,921ZAR – – 103,654 – – 103,654
815,077 (464,741) 80,836,135 – – 81,186,471
Janus Henderson Intech US Core Fund Currency
Monetary Assets in USD
Monetary Liabilities
in USD
Non- Monetary
Assets in USD
Non- Monetary Liabilities
in USD
Impact of forward
currency contracts
in USD
Net Exposures
in USDAs at 31 December 2020
EUR 7,794 (12,685) – – – (4,891)
7,794 (12,685) – – – (4,891)
DocuSign Envelope ID: 521655BF-9BE3-47DC-A9A3-494932954338

Notes to the Financial Statements (continued)
Janus Henderson Capital Funds plc / 31 December 2021364
Janus Henderson Global Real Estate Equity Income Fund Currency
Monetary Assets in USD
Monetary Liabilities
in USD
Non- Monetary
Assets in USD
Non- Monetary Liabilities
in USD
Impact of forward
currency contracts
in USD
Net Exposures
in USDAs at 31 December 2020
AUD 48,678 – 7,698,501 – – 7,747,179EUR 429,584 (219,557) 21,367,081 – (1) 21,577,107GBP 95,747 – 9,149,826 – – 9,245,573HKD – – 17,954,729 – – 17,954,729INR – (31,002) 1,408,797 – – 1,377,795JPY 79,181 (1,764) 19,115,909 – – 19,193,326
SEK – – 3,092,596 – – 3,092,596SGD 6,690 – 5,523,631 – – 5,530,321
659,880 (252,323) 85,311,070 – (1) 85,718,626
Janus Henderson Absolute Return Income Fund Currency
Monetary Assets in USD
Monetary Liabilities
in USD
Non- Monetary
Assets in USD
Non- Monetary Liabilities
in USD
Impact of forward
currency contracts
in USD
Net Exposures
in USDAs at 31 December 2020
AUD 1,196,097 – 94,654,215 (11,454) (95,782,028) 56,830CAD 133,978 – 2,148,117 – (2,227,530) 54,565EUR 426 – 25,952 (2,944) – 23,434INR – – 833,060 – – 833,060
1,330,501 – 97,661,344 (14,398) (98,009,558) 967,889
Janus Henderson Absolute Return Income Fund (EUR) Currency
Monetary Assets in EUR
Monetary Liabilities
in EUR
Non- Monetary
Assets in EUR
Non- Monetary Liabilities
in EUR
Impact of forward
currency contracts
in EUR
Net Exposures
in EURAs at 31 December 2020
AUD 64,938 – 5,971,447 (584) (6,029,335) 6,466CAD 6,898 – 203,247 – (205,597) 4,548GBP 22,528 – 175,418 – (201,341) (3,395)INR – – 28,178 – – 28,178
USD 111,375 – 10,874,764 (5,143) (10,973,601) 7,395
205,739 – 17,253,054 (5,727) (17,409,874) 43,192
Janus Henderson Absolute Return Income Opportunities Fund Currency
Monetary Assets in USD
Monetary Liabilities
in USD
Non- Monetary
Assets in USD
Non- Monetary Liabilities
in USD
Impact of forward
currency contracts
in USD
Net Exposures
in USDAs at 31 December 2020
AUD 509,790 – 20,648,825 – (21,140,922) 17,693CAD 15,714 – 9,740 – – 25,454EUR 74 (16,659) 4,010 – – (12,575)INR – – 198,971 – – 198,971JPY 2,217,810 (388) – – (2,217,810) (388)
2,743,388 (17,047) 20,861,546 – (23,358,732) 229,155
DocuSign Envelope ID: 521655BF-9BE3-47DC-A9A3-494932954338

Notes to the Financial Statements (continued)
365Janus Henderson Capital Funds plc / 31 December 2021
Janus Henderson Flexible Income Fund Currency
Monetary Assets in USD
Monetary Liabilities
in USD
Non- Monetary
Assets in USD
Non- Monetary Liabilities
in USD
Impact of forward
currency contracts
in USD
Net Exposures
in USDAs at 31 December 2020
EUR 755,712 (144,837) – – – 610,875HKD – (6,457) – – – (6,457)
755,712 (151,294) – – – 604,418
Janus Henderson Global High Yield Fund Currency
Monetary Assets in USD
Monetary Liabilities
in USD
Non- Monetary
Assets in USD
Non- Monetary Liabilities
in USD
Impact of forward
currency contracts
in USD
Net Exposures
in USDAs at 31 December 2020
EUR 110,044 (1,423) 5,055,957 – (2,345,307) 2,819,271GBP 13,899 – 852,389 (1,779) (624,927) 239,582
123,943 (1,423) 5,908,346 (1,779) (2,970,234) 3,058,853
Janus Henderson Global Investment Grade Bond Fund Currency
Monetary Assets in USD
Monetary Liabilities
in USD
Non- Monetary
Assets in USD
Non- Monetary Liabilities
in USD
Impact of forward
currency contracts
in USD
Net Exposures
in USDAs at 31 December 2020
EUR 3,197,062 (4,094,812) 76,388,716 – (92,635,370) (17,144,404)GBP 150,320 (3,213,458) 23,312,072 – (28,187,645) (7,938,711)
3,347,382 (7,308,270) 99,700,788 – (120,823,015) (25,083,115)
Janus Henderson High Yield Fund Currency
Monetary Assets in USD
Monetary Liabilities
in USD
Non- Monetary
Assets in USD
Non- Monetary Liabilities
in USD
Impact of forward
currency contracts
in USD
Net Exposures
in USDAs at 31 December 2020
AUD 308 (10,381) – – – (10,073)EUR 176 (15,597) 882,051 – – 866,630
484 (25,978) 882,051 – – 856,557
Janus Henderson Multi-Sector Income Fund Currency
Monetary Assets in USD
Monetary Liabilities
in USD
Non- Monetary
Assets in USD
Non- Monetary Liabilities
in USD
Impact of forward
currency contracts
in USD
Net Exposures
in USDAs at 31 December 2020
EUR 102,146 – 12,554,722 – (12,564,830) 92,038
102,146 – 12,554,722 – (12,564,830) 92,038
Janus Henderson US Short-Term Bond Fund Currency
Monetary Assets in USD
Monetary Liabilities
in USD
Non- Monetary
Assets in USD
Non- Monetary Liabilities
in USD
Impact of forward
currency contracts
in USD
Net Exposures
in USDAs at 31 December 2020
EUR 9,998 (9,008) – – – 990
9,998 (9,008) – – – 990
DocuSign Envelope ID: 521655BF-9BE3-47DC-A9A3-494932954338

Notes to the Financial Statements (continued)
Janus Henderson Capital Funds plc / 31 December 2021366
The following table demonstrates the effect on net assets attributable to holders of shares at the years ended 31 December 2021 and 2020 of a movement in foreign currencies against the Funds’ functional currency by way of illustration. In the interests of providing consistent comparisons across the Funds the analysis assumes a 5% upward movement in the value of the local currencies (a negative 5% would have similar negative results).
Fund nameFunctional Currency
Increase(decrease) in net asset value in 2021
Increase(decrease) in net asset value in 2020
Janus Henderson Balanced Fund USD 451,397 299,862Janus Henderson Global Adaptive Capital Appreciation Fund USD – (19,191)Janus Henderson Global Adaptive Capital Preservation Fund USD 3,030 38Janus Henderson Global Adaptive Multi-Asset Fund USD 77,949 45,642Janus Henderson Global Life Sciences Fund USD 28,184,371 22,441,365Janus Henderson Global Research Fund USD 1,247,372 1,178,441Janus Henderson Global Technology and Innovation Fund USD 3,027,174 2,396,518Janus Henderson US Contrarian Fund USD 37,939 23,525Janus Henderson US Balanced 2026 Fund USD (1,459) (1,384)Janus Henderson US Forty Fund USD 992,362 865,333Janus Henderson US Research Fund USD 4,529 (2,132)Janus Henderson US Small-Mid Cap Value Fund USD (3,285) (304)Janus Henderson US Venture Fund USD (29,243) (53,924)Janus Henderson Intech All World Minimum Variance Core Fund USD – 48,780,054Janus Henderson Intech European Core Fund EUR 4,032,889 3,239,535Janus Henderson Intech Global Absolute Return Fund USD – 71,357Janus Henderson Intech Global All Country Low Volatility Fund USD – 4,059,324Janus Henderson Intech US Core Fund USD 1,135 (245)Janus Henderson Global Real Estate Equity Income Fund USD 4,962,992 4,285,931Janus Henderson Absolute Return Income Fund USD 7,846 48,394Janus Henderson Absolute Return Income Fund (EUR) EUR – 2,160Janus Henderson Absolute Return Income Opportunities Fund USD 684 11,458Janus Henderson Flexible Income Fund USD (8,163) 30,221Janus Henderson Global High Yield Fund USD – 152,943Janus Henderson Global Investment Grade Bond Fund USD (11,938) (1,254,156)Janus Henderson High Yield Fund USD (4,668) 42,828Janus Henderson Multi-Sector Income Fund USD (5,704) 4,602Janus Henderson US Short-Term Bond Fund USD (3,164) 50
Interest Rate Risk The Fixed Income investment process begins with an investment outlook that provides a broad framework of macroeconomic factors followed by JHIUS’s views on the valuation and expected performance of various sectors.
For interest rate sensitive portfolios, the Investment Adviser’s risk measurement tools quantify interest rate, curve, and sector risk versus the respective benchmarks. The Funds may utilise interest rate swaps and swap related products to manage interest rate risk. The Risk Management Group of the Investment Adviser also generates tracking error and scenario analysis reports. These reports quantify intended and unintended risks versus the respective benchmarks and enable the Sub Investment Adviser to structure optimal portfolios based on its investment outlook.
The Investment Adviser’s basic investment philosophy for the credit portfolios is to add value through in-depth fundamental research. The Investment Adviser has developed a proprietary system that brings together Relative Value, Quantitative Default analysis, Risk Management and Attribution for the Credit portfolio on one platform. This system gives the Investment Adviser the ability to look across analytics and quantitative scores across bonds
and bank loans and enables the Investment Adviser to have a consistent way to analyse credits. To maximise the Investment Adviser’s risk adjusted return within the sector, JHIUS and the Sub-Investment Advisers use a combination of fundamental analysis and the Investment Adviser’s proprietary system outputs.
The Investment Adviser’s risk management tool quantifies the tail risk for the Credit portfolio, sectors and issues. The output of this tool factors default frequency, correlations between sectors, seniority in capital structure and recovery values. The Investment Adviser also has credit reviews on a periodic basis where the analyst presents the credit analysis of the names held by a Fund to the group.
The Funds with a majority of financial assets held in equity shares which neither pay interest nor have a maturity date are not subject to significant amounts of risk due to fluctuations in prevailing levels of market interest rates. The cash positions are monitored daily by the Investment Adviser and any overdraft positions are on a short term basis. Any excess cash and cash equivalents are invested at short term interest rates.
DocuSign Envelope ID: 521655BF-9BE3-47DC-A9A3-494932954338

Notes to the Financial Statements (continued)
367Janus Henderson Capital Funds plc / 31 December 2021
At 31 December 2021 and 31 December 2020 the following Funds are exposed to material interest rate risk to the extent disclosed in the following Interest Risk Table. It includes for each Fund the assets and liabilities at fair value, categorised
by the earlier of contractual repricing or maturity dates. Results of the Funds that do not invest in floating and fixed rate bonds are not included as there was minimal interest rate risk for those Funds.
Janus Henderson Balanced Fund
Less than 1 year USD
1-5 years USD
Over 5 years
USD
Non interest bearing
USDTotal USD
AssetsFinancial assets at fair value through profit or loss 317,544,552 1,030,644,002 1,841,284,494 5,425,682,883 8,615,155,931Cash and foreign currency 68,584,742 – – – 68,584,742Debtors – – – 217,834,202 217,834,202
Total assets 386,129,294 1,030,644,002 1,841,284,494 5,643,517,085 8,901,574,875
LiabilitiesFinancial liabilities at fair value through profit or loss – – – 667,227 667,227Bank overdraft and foreign currency 323,732 – – – 323,732Creditors - amounts failing due within one year – – – 530,778,122 530,778,122
Total liabilities 323,732 – – 531,445,349 531,769,081
Total interest sensitivity gap 385,805,562 1,030,644,002 1,841,284,494
Janus Henderson Global Adaptive Capital Preservation Fund
Less than 1 year USD
1-5 years USD
Over 5 years
USD
Non interest bearing
USDTotal USD
AssetsFinancial assets at fair value through profit or loss 249,993 – – 2,661,224 2,911,217Cash and foreign currency 194,309 – – – 194,309Debtors 25,952 – – 4,454 30,406
Total assets 470,254 – – 2,665,678 3,135,932
LiabilitiesFinancial liabilities at fair value through profit or loss – – – 7,830 7,830Bank overdraft and foreign currency – – – – –Creditors - amounts failing due within one year – – – 59,167 59,167
Total liabilities – – – 66,997 66,997
Total interest sensitivity gap 470,254 – –
Janus Henderson Global Adaptive Multi-Asset Fund
Less than 1 year USD
1-5 years USD
Over 5 years
USD
Non interest bearing
USDTotal USD
AssetsFinancial assets at fair value through profit or loss 3,399,663 509,437 1,568,745 10,992,667 16,470,512Cash and foreign currency 901,573 – – – 901,573Debtors 389,251 – – 19,299 408,550
Total assets 4,690,487 509,437 1,568,745 11,011,966 17,780,635
LiabilitiesFinancial liabilities at fair value through profit or loss – – – 47,556 47,556Bank overdraft and foreign currency – – – – –Creditors - amounts failing due within one year 410,077 – – 96,077 506,154
Total liabilities 410,077 – – 143,633 553,710
Total interest sensitivity gap 4,280,410 509,437 1,568,745
DocuSign Envelope ID: 521655BF-9BE3-47DC-A9A3-494932954338

Notes to the Financial Statements (continued)
Janus Henderson Capital Funds plc / 31 December 2021368
Janus Henderson Global Life Sciences Fund
Less than 1 year USD
1-5 years USD
Over 5 years
USD
Non interest bearing
USDTotal USD
AssetsFinancial assets at fair value through profit or loss 12,200,012 – – 4,640,039,654 4,652,239,666Cash and foreign currency 9,483,669 – – – 9,483,669Debtors – – – 28,992,319 28,992,319
Total assets 21,683,681 – – 4,669,031,973 4,690,715,654
LiabilitiesFinancial liabilities at fair value through profit or loss – – – 358,951 358,951Bank overdraft and foreign currency 126 – – – 126Creditors - amounts failing due within one year – – – 22,028,712 22,028,712
Total liabilities 126 – – 22,387,663 22,387,789
Total interest sensitivity gap 21,683,555 – –
Janus Henderson Global Research Fund
Less than 1 year USD
1-5 years USD
Over 5 years
USD
Non interest bearing
USDTotal USD
AssetsFinancial assets at fair value through profit or loss 200,000 – – 84,327,918 84,527,918Cash and foreign currency 182,662 – – – 182,662Debtors – – – 125,595 125,595
Total assets 382,662 – – 84,453,513 84,836,175
LiabilitiesFinancial liabilities at fair value through profit or loss – – – 823 823Bank overdraft and foreign currency – – – – –Creditors - amounts failing due within one year – – – 84,739 84,739
Total liabilities – – – 85,562 85,562
Total interest sensitivity gap 382,662 – –
Janus Henderson Global Technology and Innovation Fund
Less than 1 year USD
1-5 years USD
Over 5 years
USD
Non interest bearing
USDTotal USD
AssetsFinancial assets at fair value through profit or loss 8,100,008 – – 521,287,662 529,387,670Cash and foreign currency 5,704,512 – – – 5,704,512Debtors – – – 3,847,555 3,847,555
Total assets 13,804,520 – – 525,135,217 538,939,737
LiabilitiesFinancial liabilities at fair value through profit or loss – – – 185,185 185,185Bank overdraft and foreign currency – – – – –Creditors - amounts failing due within one year – – – 2,968,207 2,968,207
Total liabilities – – – 3,153,392 3,153,392
Total interest sensitivity gap 13,804,520 – –
Janus Henderson US Contrarian Fund
Less than 1 year USD
1-5 years USD
Over 5 years
USD
Non interest bearing
USDTotal USD
AssetsFinancial assets at fair value through profit or loss 100,000 – – 33,872,049 33,972,049Cash and foreign currency 64,044 – – – 64,044Debtors – – – 67,476 67,476
Total assets 164,044 – – 33,939,525 34,103,569
LiabilitiesFinancial liabilities at fair value through profit or loss – – – 8,836 8,836Bank overdraft and foreign currency – – – – –Creditors - amounts failing due within one year – – – 180,193 180,193
Total liabilities – – – 189,029 189,029
Total interest sensitivity gap 164,044 – –
DocuSign Envelope ID: 521655BF-9BE3-47DC-A9A3-494932954338

Notes to the Financial Statements (continued)
369Janus Henderson Capital Funds plc / 31 December 2021
Janus Henderson US Balanced 2026 Fund
Less than 1 year USD
1-5 years USD
Over 5 years
USD
Non interest bearing
USDTotal USD
AssetsFinancial assets at fair value through profit or loss 2,580,735 11,058,689 26,067,087 31,789,810 71,496,321Cash and foreign currency 925,694 – – – 925,694Debtors – – – 1,774,635 1,774,635
Total assets 3,506,429 11,058,689 26,067,087 33,564,445 74,196,650
LiabilitiesFinancial liabilities at fair value through profit or loss – – – 17,006 17,006Bank overdraft and foreign currency 8,019 – – – 8,019Creditors - amounts failing due within one year – – – 5,387,160 5,387,160
Total liabilities 8,019 – – 5,404,166 5,412,185
Total interest sensitivity gap 3,498,410 11,058,689 26,067,087
Janus Henderson US Forty Fund
Less than 1 year USD
1-5 years USD
Over 5 years
USD
Non interest bearing
USDTotal USD
AssetsFinancial assets at fair value through profit or loss 18,900,018 – – 1,179,229,450 1,198,129,468Cash and foreign currency 9,449,159 – – – 9,449,159Debtors – – – 3,004,801 3,004,801
Total assets 28,349,177 – – 1,182,234,251 1,210,583,428
LiabilitiesFinancial liabilities at fair value through profit or loss – – – 82,099 82,099Bank overdraft and foreign currency – – – – –Creditors - amounts failing due within one year – – – 3,182,479 3,182,479
Total liabilities – – – 3,264,578 3,264,578
Total interest sensitivity gap 28,349,177 – –
Janus Henderson US Small-Mid Cap Value Fund
Less than 1 year USD
1-5 years USD
Over 5 years
USD
Non interest bearing
USDTotal USD
AssetsFinancial assets at fair value through profit or loss 4,700,005 – – 207,849,479 212,549,484Cash and foreign currency 953,122 – – – 953,122Debtors – – – 294,888 294,888
Total assets 5,653,127 – – 208,144,367 213,797,494
LiabilitiesFinancial liabilities at fair value through profit or loss – – – 12,086 12,086Bank overdraft and foreign currency – – – – –Creditors - amounts failing due within one year – – – 637,765 637,765
Total liabilities – – – 649,851 649,851
Total interest sensitivity gap 5,653,127 – –
Janus Henderson US Venture Fund
Less than 1 year USD
1-5 years USD
Over 5 years
USD
Non interest bearing
USDTotal USD
AssetsFinancial assets at fair value through profit or loss 3,200,003 – – 255,582,568 258,782,571Cash and foreign currency 3,417,661 – – – 3,417,661Debtors – – – 138,028 138,028
Total assets 6,617,664 – – 255,720,596 262,338,260
LiabilitiesFinancial liabilities at fair value through profit or loss – – – 92,425 92,425Bank overdraft and foreign currency 1 – – – 1Creditors - amounts failing due within one year – – – 4,322,520 4,322,520
Total liabilities 1 – – 4,414,945 4,414,946
Total interest sensitivity gap 6,617,663 – –
DocuSign Envelope ID: 521655BF-9BE3-47DC-A9A3-494932954338

Notes to the Financial Statements (continued)
Janus Henderson Capital Funds plc / 31 December 2021370
Janus Henderson Absolute Return Income Fund
Less than 1 year USD
1-5 years USD
Over 5 years
USD
Non interest bearing
USDTotal USD
AssetsFinancial assets at fair value through profit or loss 1,900,139 119,685,146 46,013,404 1,971,142 169,569,831Cash and foreign currency 731,185 – – – 731,185Debtors 799,315 – – 658,212 1,457,527
Total assets 3,430,639 119,685,146 46,013,404 2,629,354 171,758,543
LiabilitiesFinancial liabilities at fair value through profit or loss – – – 251,145 251,145Bank overdraft and foreign currency – – – – –Creditors - amounts failing due within one year 1 – – 179,047 179,048
Total liabilities 1 – – 430,192 430,193
Total interest sensitivity gap 3,430,638 119,685,146 46,013,404
Janus Henderson Absolute Return Income Opportunities Fund
Less than 1 year USD
1-5 years USD
Over 5 years
USD
Non interest bearing
USDTotal USD
AssetsFinancial assets at fair value through profit or loss 2,037,988 16,454,401 15,461,369 378,356 34,332,114Cash and foreign currency 525,673 – – – 525,673Debtors 132,698 – – 340,368 473,066
Total assets 2,696,359 16,454,401 15,461,369 718,724 35,330,853
LiabilitiesFinancial liabilities at fair value through profit or loss – – – 40,319 40,319Bank overdraft and foreign currency – – – – –Creditors - amounts failing due within one year 10,000 – – 96,811 106,811
Total liabilities 10,000 – – 137,130 147,130
Total interest sensitivity gap 2,686,359 16,454,401 15,461,369
Janus Henderson Flexible Income Fund
Less than 1 year USD
1-5 years USD
Over 5 years
USD
Non interest bearing
USDTotal USD
AssetsFinancial assets at fair value through profit or loss 61,376,996 196,829,177 553,147,626 483,469 811,837,268Cash and foreign currency 49,052,699 – – – 49,052,699Debtors 20,000 – – 39,113,638 39,133,638
Total assets 110,449,695 196,829,177 553,147,626 39,597,107 900,023,605
LiabilitiesFinancial liabilities at fair value through profit or loss – – – 15,127 15,127Bank overdraft and foreign currency 153,708 – – – 153,708Creditors - amounts failing due within one year 6,395 – – 142,295,022 142,301,417
Total liabilities 160,103 – – 142,310,149 142,470,252
Total interest sensitivity gap 110,289,592 196,829,177 553,147,626
Janus Henderson Global Investment Grade Bond Fund
Less than 1 year USD
1-5 years USD
Over 5 years
USD
Non interest bearing
USDTotal USD
AssetsFinancial assets at fair value through profit or loss 1,129,351 90,999,605 240,770,372 772,658 333,671,986Cash and foreign currency 9,453,825 – – – 9,453,825Debtors – – – 3,550,183 3,550,183
Total assets 10,583,176 90,999,605 240,770,372 4,322,841 346,675,994
LiabilitiesFinancial liabilities at fair value through profit or loss – – – 474,741 474,741Bank overdraft and foreign currency – – – – –Creditors - amounts failing due within one year – – – 10,669,758 10,669,758
Total liabilities – – – 11,144,499 11,144,499
Total interest sensitivity gap 10,583,176 90,999,605 240,770,372
DocuSign Envelope ID: 521655BF-9BE3-47DC-A9A3-494932954338

Notes to the Financial Statements (continued)
371Janus Henderson Capital Funds plc / 31 December 2021
Janus Henderson High Yield Fund
Less than 1 year USD
1-5 years USD
Over 5 years
USD
Non interest bearing
USDTotal USD
AssetsFinancial assets at fair value through profit or loss 3,700,004 88,684,464 431,384,088 24,147,999 547,916,555Cash and foreign currency 14,842,502 – – – 14,842,502Debtors 99,979 – – 10,022,872 10,122,851
Total assets 18,642,485 88,684,464 431,384,088 34,170,871 572,881,908
LiabilitiesFinancial liabilities at fair value through profit or loss – – – 7,902 7,902Bank overdraft and foreign currency 4 – – – 4Creditors - amounts failing due within one year 78,343 – – 8,170,365 8,248,708
Total liabilities 78,347 – – 8,178,267 8,256,614
Total interest sensitivity gap 18,564,138 88,684,464 431,384,088
Janus Henderson Multi-Sector Income Fund
Less than 1 year USD
1-5 years USD
Over 5 years
USD
Non interest bearing
USDTotal USD
AssetsFinancial assets at fair value through profit or loss 22,292,531 39,888,947 268,742,189 2,259,638 333,183,305Cash and foreign currency 20,258,688 – – – 20,258,688Debtors 751,012 – – 11,314,331 12,065,343
Total assets 43,302,231 39,888,947 268,742,189 13,573,969 365,507,336
LiabilitiesFinancial liabilities at fair value through profit or loss – – – 452,521 452,521Bank overdraft and foreign currency 415,394 – – – 415,394Creditors - amounts failing due within one year 99,677 – – 82,946,463 83,046,140
Total liabilities 515,071 – – 83,398,984 83,914,055
Total interest sensitivity gap 42,787,160 39,888,947 268,742,189
Janus Henderson US Short-Term Bond Fund
Less than 1 year USD
1-5 years USD
Over 5 years
USD
Non interest bearing
USDTotal USD
AssetsFinancial assets at fair value through profit or loss 31,179,140 205,758,757 69,049,639 305,861 305,293,397Cash and foreign currency 12,697,775 – – – 12,697,775Debtors 305,124 – – 12,798,409 13,103,533
Total assets 44,182,039 205,758,757 69,049,639 13,104,269 331,094,705
LiabilitiesFinancial liabilities at fair value through profit or loss – – – 87,608 87,608Bank overdraft and foreign currency 68,654 – – – 68,654Creditors - amounts failing due within one year – – – 45,041,982 45,041,982
Total liabilities 68,654 – – 45,129,590 45,198,244
Total interest sensitivity gap 44,113,385 205,758,757 69,049,639
DocuSign Envelope ID: 521655BF-9BE3-47DC-A9A3-494932954338

Notes to the Financial Statements (continued)
Janus Henderson Capital Funds plc / 31 December 2021372
Interest Rate Risk – 31 December 2020
Janus Henderson Balanced Fund
Less than 1 year USD
1-5 years USD
Over 5 years
USD
Non interest bearing
USDTotal USD
AssetsFinancial assets at fair value through profit or loss 35,768,512 447,759,871 1,512,678,420 3,492,078,394 5,488,285,197Cash and foreign currency 147,025,132 – – – 147,025,132Debtors – – – 43,908,209 43,908,209
Total assets 182,793,644 447,759,871 1,512,678,420 3,535,986,603 5,679,218,538
LiabilitiesFinancial liabilities at fair value through profit or loss – – – 189,672 189,672Bank overdraft and foreign currency 1 – – – 1Creditors - amounts failing due within one year – – – 143,531,607 143,531,607
Total liabilities 1 – – 143,721,279 143,721,280
Total interest sensitivity gap 182,793,643 447,759,871 1,512,678,420
Janus Henderson Global Adaptive Capital Appreciation Fund
Less than 1 year USD
1-5 years USD
Over 5 years
USD
Non interest bearing
USDTotal USD
AssetsFinancial assets at fair value through profit or loss 17,217,875 – 1,686,669 17,562,302 36,466,846Cash and foreign currency 717,952 – – – 717,952Debtors 1,825,495 – – 34,084 1,859,579
Total assets 19,761,322 – 1,686,669 17,596,386 39,044,377
LiabilitiesFinancial liabilities at fair value through profit or loss – – – 378,737 378,737Bank overdraft and foreign currency 3,911 – – – 3,911Creditors - amounts failing due within one year 587,946 – – 1,727,071 2,315,017
Total liabilities 591,857 – – 2,105,808 2,697,665
Total interest sensitivity gap 19,169,465 – 1,686,669
Janus Henderson Global Adaptive Capital Preservation Fund
Less than 1 year USD
1-5 years USD
Over 5 years
USD
Non interest bearing
USDTotal USD
AssetsFinancial assets at fair value through profit or loss 368,403 – – 206,963 575,366Cash and foreign currency 64,448 – – – 64,448Debtors 21,453 – – 11,917 33,370
Total assets 454,304 – – 218,880 673,184
LiabilitiesFinancial liabilities at fair value through profit or loss – – – 3,004 3,004Bank overdraft and foreign currency – – – – –Creditors - amounts failing due within one year 53 – – 43,508 43,561
Total liabilities 53 – – 46,512 46,565
Total interest sensitivity gap 454,251 – –
DocuSign Envelope ID: 521655BF-9BE3-47DC-A9A3-494932954338

Notes to the Financial Statements (continued)
373Janus Henderson Capital Funds plc / 31 December 2021
Janus Henderson Global Adaptive Multi-Asset Fund
Less than 1 year USD
1-5 years USD
Over 5 years
USD
Non interest bearing
USDTotal USD
AssetsFinancial assets at fair value through profit or loss 3,425,186 518,125 1,714,670 7,658,973 13,316,954Cash and foreign currency 598,719 – – – 598,719Debtors 596,798 – – 50,996 647,794
Total assets 4,620,703 518,125 1,714,670 7,709,969 14,563,467
LiabilitiesFinancial liabilities at fair value through profit or loss – – – 118,444 118,444Bank overdraft and foreign currency 857 – – – 857Creditors - amounts failing due within one year 82,111 – – 63,010 145,121
Total liabilities 82,968 – – 181,454 264,422
Total interest sensitivity gap 4,537,735 518,125 1,714,670
Janus Henderson US Balanced 2026 Fund
Less than 1 year USD
1-5 years USD
Over 5 years
USD
Non interest bearing
USDTotal USD
AssetsFinancial assets at fair value through profit or loss 1,222,458 7,549,653 30,643,270 33,430,715 72,846,096Cash and foreign currency 1,555,488 – – – 1,555,488Debtors – – – 245,490 245,490
Total assets 2,777,946 7,549,653 30,643,270 33,676,205 74,647,074
LiabilitiesFinancial liabilities at fair value through profit or loss – – – 489 489Bank overdraft and foreign currency – – – – –Creditors - amounts failing due within one year – – – 2,045,844 2,045,844
Total liabilities – – – 2,046,333 2,046,333
Total interest sensitivity gap 2,777,946 7,549,653 30,643,270
Janus Henderson Absolute Return Income Fund
Less than 1 year USD
1-5 years USD
Over 5 years
USD
Non interest bearing
USDTotal USD
AssetsFinancial assets at fair value through profit or loss 31,371,021 166,078,242 46,508,579 804,485 244,762,327Cash and foreign currency 1,902,943 – – – 1,902,943Debtors 1,738,099 – – 988,819 2,726,918
Total assets 35,012,063 166,078,242 46,508,579 1,793,304 249,392,188
LiabilitiesFinancial liabilities at fair value through profit or loss – 47,014 120,577 5,289,698 5,457,289Bank overdraft and foreign currency – – – – –Creditors - amounts failing due within one year 12,988 – – 277,600 290,588
Total liabilities 12,988 47,014 120,577 5,567,298 5,747,877
Total interest sensitivity gap 34,999,075 166,031,228 46,388,002
Janus Henderson Absolute Return Income Fund (EUR)
Less than 1 year
EUR1-5 years
EUR
Over 5 years
EUR
Non interest bearing
EURTotal EUR
AssetsFinancial assets at fair value through profit or loss 792,335 12,667,230 3,939,728 378,541 17,777,834Cash and foreign currency 186,523 – – – 186,523Debtors 165,740 – – 93,940 259,680
Total assets 1,144,598 12,667,230 3,939,728 472,481 18,224,037
LiabilitiesFinancial liabilities at fair value through profit or loss – 5,950 9,513 202,300 217,763Bank overdraft and foreign currency – – – – –Creditors - amounts failing due within one year 1,465 – – 56,448 57,913
Total liabilities 1,465 5,950 9,513 258,748 275,676
Total interest sensitivity gap 1,143,133 12,661,280 3,930,215
DocuSign Envelope ID: 521655BF-9BE3-47DC-A9A3-494932954338

Notes to the Financial Statements (continued)
Janus Henderson Capital Funds plc / 31 December 2021374
Janus Henderson Absolute Return Income Opportunities Fund
Less than 1 year USD
1-5 years USD
Over 5 years
USD
Non interest bearing
USDTotal USD
AssetsFinancial assets at fair value through profit or loss 6,431,970 14,427,595 17,423,770 322,255 38,605,590Cash and foreign currency 3,760,412 – – – 3,760,412Debtors 328,455 – – 333,426 661,881
Total assets 10,520,837 14,427,595 17,423,770 655,681 43,027,883
LiabilitiesFinancial liabilities at fair value through profit or loss – 9,529 21,791 1,539,351 1,570,671Bank overdraft and foreign currency – – – – –Creditors - amounts failing due within one year 12,888 – – 115,696 128,584
Total liabilities 12,888 9,529 21,791 1,655,047 1,699,255
Total interest sensitivity gap 10,507,949 14,418,066 17,401,979
Janus Henderson Flexible Income Fund
Less than 1 year USD
1-5 years USD
Over 5 years
USD
Non interest bearing
USDTotal USD
AssetsFinancial assets at fair value through profit or loss 40,356,968 214,274,631 686,637,052 8,050,070 949,318,721Cash and foreign currency 54,507,881 – – – 54,507,881Debtors 123,774 – – 16,275,131 16,398,905
Total assets 94,988,623 214,274,631 686,637,052 24,325,201 1,020,225,507
LiabilitiesFinancial liabilities at fair value through profit or loss – – – 94,746 94,746Bank overdraft and foreign currency – – – – –Creditors - amounts failing due within one year 573 – – 57,172,991 57,173,564
Total liabilities 573 – – 57,267,737 57,268,310
Total interest sensitivity gap 94,988,050 214,274,631 686,637,052
Janus Henderson Global High Yield Fund
Less than 1 year USD
1-5 years USD
Over 5 years
USD
Non interest bearing
USDTotal USD
AssetsFinancial assets at fair value through profit or loss 256,508 9,137,529 13,219,108 284,793 22,897,938Cash and foreign currency 902,007 – – – 902,007Debtors 101,052 – – 589,226 690,278
Total assets 1,259,567 9,137,529 13,219,108 874,019 24,490,223
LiabilitiesFinancial liabilities at fair value through profit or loss – – – 93,755 93,755Bank overdraft and foreign currency 1,445 – – – 1,445Creditors - amounts failing due within one year – – – 238,008 238,008
Total liabilities 1,445 – – 331,763 333,208
Total interest sensitivity gap 1,258,122 9,137,529 13,219,108
Janus Henderson Global Investment Grade Bond Fund
Less than 1 year USD
1-5 years USD
Over 5 years
USD
Non interest bearing
USDTotal USD
AssetsFinancial assets at fair value through profit or loss 6,580,155 70,393,821 284,802,280 3,578,653 365,354,909Cash and foreign currency 9,548,283 – – – 9,548,283Debtors – – – 6,344,899 6,344,899
Total assets 16,128,438 70,393,821 284,802,280 9,923,552 381,248,091
LiabilitiesFinancial liabilities at fair value through profit or loss – – – 1,784,334 1,784,334Bank overdraft and foreign currency 94 – – – 94Creditors - amounts failing due within one year – – – 11,053,126 11,053,126
Total liabilities 94 – – 12,837,460 12,837,554
Total interest sensitivity gap 16,128,345 70,393,821 284,802,280
DocuSign Envelope ID: 521655BF-9BE3-47DC-A9A3-494932954338

Notes to the Financial Statements (continued)
375Janus Henderson Capital Funds plc / 31 December 2021
Janus Henderson High Yield Fund
Less than 1 year USD
1-5 years USD
Over 5 years
USD
Non interest bearing
USDTotal USD
AssetsFinancial assets at fair value through profit or loss 7,603,858 125,696,932 315,417,985 15,849,439 464,568,214Cash and foreign currency 22,371,882 – – – 22,371,882Debtors 711,000 – – 12,775,819 13,486,819
Total assets 30,686,740 125,696,932 315,417,985 28,625,258 500,426,915
LiabilitiesFinancial liabilities at fair value through profit or loss – – – 15,887 15,887Bank overdraft and foreign currency – – – – –Creditors - amounts failing due within one year 504,476 – – 7,071,495 7,575,971
Total liabilities 504,476 – – 7,087,382 7,591,858
Total interest sensitivity gap 30,182,264 125,696,932 315,417,985
Janus Henderson Multi-Sector Income Fund
Less than 1 year USD
1-5 years USD
Over 5 years
USD
Non interest bearing
USDTotal USD
AssetsFinancial assets at fair value through profit or loss 1,890,908 57,485,820 216,808,713 3,291,938 279,477,379Cash and foreign currency 26,599,118 – – – 26,599,118Debtors 480,000 – – 6,030,877 6,510,877
Total assets 28,970,026 57,485,820 216,808,713 9,322,815 312,587,374
LiabilitiesFinancial liabilities at fair value through profit or loss – – – 159,089 159,089Bank overdraft and foreign currency – – – – –Creditors - amounts failing due within one year 59,935 – – 55,459,729 55,519,664
Total liabilities 59,935 – – 55,618,818 55,678,753
Total interest sensitivity gap 28,910,091 57,485,820 216,808,713
Janus Henderson US Short-Term Bond Fund
Less than 1 year USD
1-5 years USD
Over 5 years
USD
Non interest bearing
USDTotal USD
AssetsFinancial assets at fair value through profit or loss 48,918,896 182,235,239 54,103,776 513,962 285,771,873Cash and foreign currency 11,869,523 – – – 11,869,523Debtors 60,000 – – 3,137,405 3,197,405
Total assets 60,848,419 182,235,239 54,103,776 3,651,367 300,838,801
LiabilitiesFinancial liabilities at fair value through profit or loss – – – 9,918 9,918Bank overdraft and foreign currency – – – – –Creditors - amounts failing due within one year 9,582 – – 11,137,485 11,147,067
Total liabilities 9,582 – – 11,147,403 11,156,985
Total interest sensitivity gap 60,838,837 182,235,239 54,103,776
Janus Henderson US Balanced 2026 Fund, Janus Henderson Balanced Fund, Janus Henderson Absolute Return Income Fund, Janus Henderson Absolute Return Income Fund (EUR), Janus Henderson Flexible Income Fund, Janus Henderson Global High Yield Fund, Janus Henderson Global Investment Grade Bond Fund, Janus Henderson High Yield Fund, Janus Henderson Global Adaptive Capital Appreciation Fund, Janus Henderson Global Adaptive Capital Preservation Fund, Janus Henderson Global Adaptive Multi-Asset Fund, Janus Henderson Absolute Return Income Opportunities Fund, Janus Henderson Multi-Sector Income Fund, Janus Henderson Intech Global Absolute Return Fund and Janus Henderson US Short-Term Bond Fund invest in floating and fixed rate bonds. The basis of calculation for the floating
rate notes is based on the date of change of each coupon rate as opposed to the bond maturity date disclosed in the Portfolio Investments. The floating rate notes held by the Funds at the financial year end are tracking the US LIBOR one or three month indices.
The performance of the debt or interest bearing component depends primarily on interest rates. Generally, the value of debt securities will tend to decrease in value when interest rates rise and vice versa. Shorter-term securities are less sensitive to interest rate changes than longer-term securities, but they usually offer lower yields. Each of the above Funds varies the average maturity profile of its portfolio based on an analysis of interest rate trends and other factors.
DocuSign Envelope ID: 521655BF-9BE3-47DC-A9A3-494932954338

Notes to the Financial Statements (continued)
Janus Henderson Capital Funds plc / 31 December 2021376
Any change to the interest rates relevant for particular securities may result in either income increasing or decreasing, or the Sub-Investment Advisers being unable to secure similar returns on the expiry of contracts or the sale of securities. In addition, changes to prevailing rates or changes in expectations of future rates may result in an increase or decrease in the value of securities held.
The following table shows the corresponding +/- performance effect on each of the Fixed Income Funds and the Janus Henderson Balanced Fund of a +/- 1% move in interest rates calculated by reference to the duration of the respective portfolios as at 31 December 2021 and 2020 assuming no convexity. It also assumes that both the securities and derivatives held in these Funds as at 31 December 2021 and 31 December 2020 and the overall balance of long and short positions would remain unchanged in the event such a shift in interest rates was anticipated or actually occurred, which would not generally be the case. Furthermore, as with the analysis of market price risk, as the Funds’ portfolios are managed on an active and dynamic basis with frequent changes in the holdings, the Directors believe that this sensitivity should not be relied on as a measure of future performance. Finally, it should also be considered that although duration is widely used as a measure of portfolio interest rate sensitivity, it is only useful as a measure for interest rate changes which are relatively small in size and it is itself sensitive to changes in the level and term structure of interest rates, which may cause portfolio duration to change independently of changes in the actual portfolio held.
Fund name 2021 DurationImpact of a +/- 1% Interest rate move
Janus Henderson Balanced Fund 5.83 5.76Janus Henderson US Balanced 2026 Fund 6.16 6.12Janus Henderson Absolute Return Income Fund 0.32 0.29Janus Henderson Absolute Return Income Fund (EUR) 0.44 0.44Janus Henderson Absolute Return Income Opportunities Fund 0.61 0.61Janus Henderson Flexible Income Fund 6.30 6.27Janus Henderson Global High Yield Fund 4.20 4.19Janus Henderson Global Investment Grade Bond Fund 7.05 7.03Janus Henderson High Yield Fund 3.91 3.80Janus Henderson US Short-Term Bond Fund 2.30 2.27
Fund name 2020 DurationImpact of a +/- 1% Interest rate move
Janus Henderson Balanced Fund 6.26 6.23Janus Henderson US Balanced 2026 Fund 6.57 6.55Janus Henderson Absolute Return Income Fund 1.82 1.82Janus Henderson Absolute Return Income Fund (EUR) 1.86 1.86Janus Henderson Absolute Return Income Opportunities Fund 2.60 2.59Janus Henderson Flexible Income Fund 6.26 6.24Janus Henderson Global High Yield Fund 3.87 3.88Janus Henderson Global Investment Grade Bond Fund 7.60 7.58Janus Henderson High Yield Fund 3.03 3.00Janus Henderson US Short-Term Bond Fund 2.20 2.18
Liquidity RiskLiquidity risk is the risk that the Company may not be able to generate sufficient cash resources to settle its obligations in full as they fall due or can only do so on terms that are materially disadvantageous. The Company is exposed to daily cash redemptions of redeemable ordinary shares. Each Fund therefore invests the majority of its assets in investments that are traded in an active market and can be readily disposed of; it invests only a limited proportion of its assets in investments that are not actively traded on a listed exchange. Listed securities of each Fund are considered readily realisable, as they are listed on a regulated stock exchange. The Investment Adviser may use derivative instruments and debt securities, if appropriate, such as exchange traded futures contracts to allow exposure to markets whilst maintaining sufficient liquidity.
Where a Fund acquires securities on the over-the-counter markets, there is no guarantee that the Fund will be able to realise the fair value of such securities due to their tendency to have limited liquidity and comparatively high price volatility.
The Company has the ability to borrow in the short term to ensure settlement. In order to manage the Company’s overall liquidity and to facilitate an orderly disposition of securities the Directors are able to refuse to repurchase any shares in excess of one tenth of the shares in issue in a Fund on any one valuation day by way of the provisions in the prospectus.The Company did not withhold any redemptions during 2021 and 2020.
All securities investments present a risk of loss of capital. The maximum loss of capital on purchased options, long equity and debt securities is limited to the fair value of those positions. On written call options and short futures positions the maximum loss of capital can be unlimited. The maximum loss of capital on written put options, long futures and forward currency contracts is limited to the notional contract values of those positions.
The main liability of the Funds tends to be outstanding payables on the purchase of investments and the
DocuSign Envelope ID: 521655BF-9BE3-47DC-A9A3-494932954338

Notes to the Financial Statements (continued)
377Janus Henderson Capital Funds plc / 31 December 2021
redemption of any redeemable ordinary shares that investors wish to sell. Substantially all financial liabilities of each Fund are payable within two months.
The Investment Adviser has established a liquidity risk management policy to monitor and manage the liquidity risks of each Fund and to ensure that the liquidity profile of the investments held by each Fund will facilitate compliance with the Fund’s obligation to meet redemption requests. The Investment Adviser liquidity policy takes into account different factors including but not limited to the investment strategy; the liquidity profile; the redemption policy; the dealing frequency; the ability to enforce redemption limitations and the fair valuation policies of the relevant Fund. Please refer to the prospectus for further details on liquidity risk management.
Credit RiskThe Company is exposed to a credit risk on parties with whom it trades and bears the risk of settlement default. The Company minimises concentrations of credit risk by undertaking transactions with a number of counterparties on recognised and reputable exchanges.
Each Fund's exposure is limited to the contracts in which it currently has a financial asset position reduced by any collateral received from the counterparty, or to counterparties who have received collateral from each Fund or any margin arrangements in place with the counterparty.
Credit default swaps are transactions under which the parties’ obligations depend on whether a credit event has occurred in relation to the reference asset. The credit events are specified in the contract and are intended to identify the occurrence of a significant deterioration in the creditworthiness of the reference asset. The buyer in a credit default swap contract is obligated to pay the seller a periodic stream of payments over the term of the contract provided that no event of default on an underlying reference asset has occurred. If a credit event occurs, the seller must pay the buyer the full notional value of the reference asset that may have little or no value.
All Funds’ assets are currently held within J.P Morgan (Ireland) PLC's depositary network, with the exception of Tranche Loans and Financial Derivative Instruments as appropriate. Bankruptcy or insolvency of the Depositary may cause the Funds’ rights with respect to securities held by the Depositary to be delayed or limited. The Company monitors this risk by monitoring the credit quality and financial position of the Depositary. The Depositary’s credit rating at 31 December 2021 is A+ (31 December 2020: A+).
The table below shows the credit ratings of the derivative/tranche loans counterparties at 31 December 2021 and 31 December 2020.
2021 2020Alter Domus Unrated -Bank of America A- A+Bank of Montreal A+ A+Barclays A ABNP Paribas - A+Citibank A+ A+Credit Agricole - A+Credit Suisse A+ A+Deutsche Bank A- BBB+GLAS Unrated -Goldman Sachs BBB+ A+HSBC A- A-J.P. Morgan A+ A+Jefferies BBB+ -Jefferies Finance LLC BB- BB-KKR A AMorgan Stanley BBB+ BBB+Nomura BBB+ BBB+Royal Bank of Canada AA- AA-State Street A ATruist Bank A AUBS AG A+ A+Wells Fargo Bank A+ A+Wilmington Trust A- AWSFS Unrated Unrated
The Company may invest in financial assets which are rated (by well known rating agencies) or unrated. Unrated securities are treated by the Investment Adviser as non investment grade securities unless the Investment Adviser or the relevant Sub-Investment Adviser determines that such securities are the equivalent of investment grade securities.
Cash and non-cash collateral pledged are reflected as assets on the Statement of Financial Position, their use is restricted until the underlying contracts are closed out. See note 5 for details.
The Funds hold credit default swaps at year end which are centrally cleared through ICE (Central Counterparty Clearing House “CCP”). Centrally cleared credit default swaps are subject to the credit risk of the clearing broker which is Goldman Sachs through which the Funds hold the positions.
DocuSign Envelope ID: 521655BF-9BE3-47DC-A9A3-494932954338

Notes to the Financial Statements (continued)
Janus Henderson Capital Funds plc / 31 December 2021378
As at 31 December 2021 and 31 December 2020 the Funds which have a material exposure to credit risk due to their investment in asset backed securities, government obligations, certificate of deposits, commercial papers and corporate bonds, and their respective S&P credit ratings (if available) shown as a percentage of NAV are detailed below.
As at 31 December 2021Janus Henderson Balanced
Fund
Janus Henderson Global Adaptive Capital
Preservation FundJanus Henderson Global
Adaptive Multi-Asset FundJanus Henderson Global
Life Sciences Fund(% of Net Asset Value) % % % %
A 0.99 – – –AA 18.99 – 9.11 0.26
AAA 0.82 – – –B 0.24 – – –
BB 3.9 – – –BBB 5.93 8.15 16.02 –
C – – – –CC – – – –
CCC – – – –Unrated 6.3 – 6.67 –
As at 31 December 2021Janus Henderson Global
Research Fund
Janus Henderson Global Technology and Innovation
FundJanus Henderson US
Contrarian FundJanus Henderson US Balanced 2026 Fund
(% of Net Asset Value) % % % %
A – – – 1.92AA 0.24 1.51 0.29 23.17
AAA – – – 1.67B – – – 0.33
BB – – – 6.76BBB – – – 11.40
C – – – –CC – – – –
CCC – – – –Unrated – – – 11.23
As at 31 December 2021Janus Henderson US Forty
FundJanus Henderson US
Small-Mid Cap Value FundJanus Henderson US
Venture FundJanus Henderson Absolute
Return Income Fund(% of Net Asset Value) % % % %
A – – – 31.93AA 1.57 2.21 1.24 8.74
AAA – – – 3.61B – – – –
BB – – – –BBB – – – 43.49
C – – – –CC – – – –
CCC – – – –Unrated – – – 10.05
As at 31 December 2021
Janus Henderson Absolute Return Income
Opportunities FundJanus Henderson Flexible
Income Fund
Janus Henderson Global Investment Grade Bond
FundJanus Henderson High
Yield Fund(% of Net Asset Value) % % % %
A 9.53 2.10 13.81 –AA – 41.64 5.43 0.66
AAA 7.62 2.78 0.98 –B – 1.05 – 23.30
BB 5.67 10.47 9.57 49.77BBB 59.46 20.00 62.98 1.53
C – – – –CC – – – –
CCC – – – 12.61Unrated 14.23 25.69 5.39 0.61
DocuSign Envelope ID: 521655BF-9BE3-47DC-A9A3-494932954338

Notes to the Financial Statements (continued)
379Janus Henderson Capital Funds plc / 31 December 2021
As at 31 December 2021Janus Henderson Multi-
Sector Income FundJanus Henderson US
Short-Term Bond Fund(% of Net Asset Value) % %
A 1.86 0.98AA 8.44 53.98
AAA 3.24 0.49B 10.37 0.62
BB 20.48 14.04BBB 12.96 16.09
C – –CC – –
CCC 6.59 –Unrated 46.46 14.43
As at 31 December 2020Janus Henderson Balanced
Fund
Janus Henderson Global Adaptive Capital
Appreciation Fund
Janus Henderson Global Adaptive Capital
Preservation FundJanus Henderson Global
Adaptive Multi-Asset Fund(% of Net Asset Value) % % % %
A 2.68 – – –AA 0.15 – – –
AAA 0.46 – – –B 1.19 – – –
BB 4.33 – – –BBB 12.63 – – 3.62
C – – – –CC – – – –
CCC – – – –Unrated 14.50 52.01 58.79 35.95
As at 31 December 2020Janus Henderson US Balanced 2026 Fund
Janus Henderson Intech Global Absolute Return
FundJanus Henderson Absolute
Return Income FundJanus Henderson Absolute Return Income Fund (EUR)
(% of Net Asset Value) % % % %
A 4.72 – 31.17 31.45AA 0.42 – 10.09 9.62
AAA 0.85 – 2.68 2.32B 1.71 – – –
BB 6.60 – – –BBB 19.75 – 38.59 42.52
C – – – –CC – – – –
CCC – – – –Unrated 20.24 10.22 17.56 11.00
As at 31 December 2020
Janus Henderson Absolute Return Income
Opportunities FundJanus Henderson Flexible
Income FundJanus Henderson Global
High Yield Fund
Janus Henderson Global Investment Grade Bond
Fund(% of Net Asset Value) % % % %
A 13.93 6.09 – 16.78AA 0.98 0.18 – 0.79
AAA 9.76 1.10 – –B – 2.73 30.76 1.10
BB – 10.90 36.74 9.04BBB 46.48 34.58 6.21 65.91
C – – – –CC – – – –
CCC – – 12.17 –Unrated 21.43 41.82 7.09 4.57
DocuSign Envelope ID: 521655BF-9BE3-47DC-A9A3-494932954338

Notes to the Financial Statements (continued)
Janus Henderson Capital Funds plc / 31 December 2021380
As at 31 December 2020Janus Henderson High
Yield FundJanus Henderson Multi-
Sector Income FundJanus Henderson US
Short-Term Bond Fund(% of Net Asset Value) % % %
A – 2.12 5.94AA – 0.23 0.32
AAA – – 1.07B 34.00 18.03 1.78
BB 35.60 18.52 13.46BBB 2.83 18.37 36.48
C – – –CC – – –
CCC 14.56 6.98 –Unrated 0.78 37.93 36.62
Counterparty RiskThe Investment Adviser undertakes a detailed review of all counterparties before any arrangements are entered into. The credit quality of all counterparties is monitored on a regular basis. The Investment Adviser reports to the board on a commitment basis or value-at-risk basis depending on the Fund as part of the UCITS V monthly reporting.
Details of the counterparties are included in the Portfolio Investments.
Brexit RiskThe future application of EU-based legislation to the asset management industry in the United Kingdom will depend on the agreed future relationship and the actions of the United Kingdom government and it is possible that there will be divergence between the United Kingdom and EU regulations post-Brexit limiting what cross- border activities can take place. This may possibly affect the Company’s ability to receive investment advice or portfolio management services and/or increase the costs for such services and may also impact the ability to market the Funds to United Kingdom investors.
Unfunded commitments and contingent liabilitiesThe Fund invests in a number of private placement investments where there are unfunded future commitments at the year end date. These future commitments arise through the tranche structure of the investment process for
such securities and are dependent on future events that have not occurred at the year end date. These typically relate to future financial or commercial targets set in the investment agreement with the investee entity and it is not practicable to assign any probability of achieving these in the financial statement disclosures. When the triggers are met, there is a binding commitment to fund the additional purchase, at which point an investment purchase transaction is recognised. The unfunded commitments expose the Fund to certain risks.
The Fund’s exposure to price risk may be increased by such future commitments because there is a probability of increased exposure to investments already held in the portfolio.
There is also a liquidity risk because future tranches will become binding commitments at a future date and the Fund may need to liquidate other assets or raise further capital to meet these commitments. Such future commitments that may become payable are considered as part of the Fund’s investment strategy in such a way as to mitigate the risk of needing to liquidate portfolio holdings at an inopportune time. The fund manager will also be aware of future commitments that may crystallise and will receive regular communications from the investee entities so that fund raising to meet them can be planned. The Fund will also receive notice of the future commitment and can then make investment decisions on how to realise sufficient cash for the commitment to be met.
As at 31 December 2021, the funds had total unfunded commitments of USD 604,910 (31 December 2020: USD 2,675,516).
Security Total Commitment Tranches Funded Tranches Unfunded with Future Closing dates*Cost (USD) Cost (USD) % of total commitment Cost (USD) % of total commitment
Janus Henderson Global Life Sciences FundSonoma Biotherapeutics, Inc.,
Private Placement 2,846,483 2,241,573 78.75 604,910 21,25
*The conditions for the completion of future commitments are defined milestones documented in each of the related terms and conditions agreements. Janus Henderson has entered into an Investor Rights Agreement in each transaction that restricts disclosure of any non-public information received by Janus Henderson as an investor in each company.
DocuSign Envelope ID: 521655BF-9BE3-47DC-A9A3-494932954338

Notes to the Financial Statements (continued)
381Janus Henderson Capital Funds plc / 31 December 2021
Fair Value Estimation Under FR2 102 the Company is required to classify its investments using a fair value hierarchy that reflects the significance of the inputs used in making the measurements.
For financial instruments held at fair value in the statement of financial position, the Funds are required to disclose for each class of financial instrument, an analysis of the level in the following fair value hierarchy into which the fair value measurements are categorised. A fair value measurement is categorised in its entirety on the basis of the lowest level input that is significant to the fair value measurement in its entirety.
• Level 1: The unadjusted quoted price in an active market for identical assets or liabilities that the entity can access at the measurement date.
• Level 2: Inputs other than quoted prices included within Level 1 that are observable (i.e. developed using market data) for the asset or liability, either directly or indirectly.
• Level 3: Inputs are unobservable (i.e. for which market data is unavailable) for the asset or liability.
The inputs or methodologies used for valuing securities are not necessarily an indication of the risk associated with investing in those securities.
The tables providing a summary within the fair value hierarchy of the Funds' financial assets and liabilities measured at fair value at 31 December 2021 and 31 December 2020 are disclosed in the individual Fund sections.
15. Directors’ Remuneration
The Articles of Association provide that the Directors shall be entitled to a fee by way of remuneration for their services at a rate to be determined from time to time by the Directors. The Directors have agreed that the current aggregate amount of Directors’ remuneration in any one financial year may not exceed EUR 300,000. Directors’ fees incurred for the year ended 31 December 2021 were USD 96,025 (approximately EUR 85,000). Directors’ fees paid for the year ended 31 December 2020 were USD 103,845 (approximately EUR 85,000).
16. Auditor’s Remuneration
Fees and expenses paid to our statutory auditors, PricewaterhouseCoopers Ireland, in respect of the financial year are as follows:
31 December 2021 USD
31 December 2020 USD
Audit of financial statements 457,575 624,882Out of pocket expenses – 1,221
457,575 626,103
17. Significant Events During the Financial Year
The prospectus for the Company was restructured as a base prospectus, 37 fund supplements (each a “Supplement”) and a global supplement. The restructured offering documents were noted by the Central Bank on 8 January 2021.
The Supplements for Janus Henderson Global Technology and Innovation Fund, Janus Henderson Balanced Fund, Janus Henderson Global Investment Grade Bond Fund, Janus Henderson Multi-Sector Income Fund and Janus Henderson Flexible Income Fund were updated to include additional share classes on 25 February 2021.
The prospectus for the Company, the Supplements and the global supplement were updated for compliance with the Sustainable Finance Disclosure Regulation on 26 February 2021.
During the period the Board agreed to authorise certain legal fees paid to the external counsel in relation to litigation over the Contingent Value Rights (CVR). This impacted the Janus Henderson Global Life Science Fund and the Janus Henderson US Venture Fund.
The Janus Henderson Intech Global Absolute Return Fund closed on 3 March 2021.
Marc Pinto the portfolio manager, retired effective 2 April 2021.
New share classes were launched on 14 April 2021 for Janus Henderson Global Technology and Innovation Fund, Janus Henderson Global Life Sciences Fund, Janus Henderson US Venture Fund and Janus Henderson US Short-Term Bond Fund.
The Janus Henderson Intech Global All Country Low Volatility Fund closed on 18 May 2021.
The Janus Henderson Global Adaptive Capital Appreciation Fund closed on 27 May 2021.
New share classes were launched on 17 June 2021 for Janus Henderson US Contrarian Fund.
An updated Prospectus was issued wherein the Janus Henderson Global Real Estate Fund changed its name to the Janus Henderson Global Real Estate Equity Income Fund and its benchmark index has changed from FTSE EPRA Nareit Global Index to FTSE EPRA Nareit Global REITs TR on 30 June 2021.
The Janus Henderson Intech All World Minimum Variance Core Fund closed on 9 July 2021.
J.P. Morgan Chase Bank, National Association (London Branch) was appointed as the Securities Lending Agent of the Company with effect from 27 July 2021.
DocuSign Envelope ID: 521655BF-9BE3-47DC-A9A3-494932954338

Notes to the Financial Statements (continued)
Janus Henderson Capital Funds plc / 31 December 2021382
New share classes were launched on 28 September 2021 for Janus Henderson Global Technology and Innovation Fund and Janus Henderson Global Real Estate Equity Income Fund.
An updated Prospectus was issued on 30 September 2021 wherein the Janus Henderson Opportunistic Alpha Fund changed its name to the Janus Henderson US Contrarian Fund and Janus Henderson US Strategic Value Fund to Janus Henderson US Small-Mid Cap Value Fund. There is an addition of Class T Shares in the prospectus.
The relationship with Perkins was terminated with effect from 30 September 2021.
New share classes were launched on 08 October 2021 for Janus Henderson High Yield Fund and Janus Henderson Global Technology and Innovation Fund.
The Janus Henderson Global High Yield Fund merged with Janus Henderson High Yield Fund on 08 October 2021.
The Janus Henderson Absolute Return Income Fund (EUR) closed on 10 November 2021.
The United Kingdom (UK) left the European Union (EU) on 31 January 2020, a transition period was in place until 31 December 2020, during which all EU rules and laws continued to apply to the UK. On 1 January 2021, the transition period came to an end, and the new rules entered into force. The way in which Janus Henderson Investors operates will not be impacted by this change. The EU and the UK have agreed to establish a structured regulatory co-operation on financial services, with the aim of establishing a durable and stable relationship between autonomous jurisdictions. A Memorandum of Understanding, establishing the framework for the co-operation, allows the Company to continue to delegate investment management to a UK based firm.
The outbreak of the novel coronavirus (‘COVID-19’) and subsequent global pandemic began impacting financial markets and economies during the first quarter of 2020. The worldwide spread of the virus led to uncertainty on an unprecedented scale. The impact of COVID-19 has been taken into account in the recognition and measurement of the primary statements for the year to 31 December 2021.
There were no other significant events during the financial year ended 31 December 2021.
18. Subsequent Events
On 3 January 2022 Janus Capital Management LC changed its name to Janus Henderson Investors US LLC.
On 22 January 2022 (the “Merger Date”), J.P. Morgan Bank (Ireland) PLC was merged into J.P. Morgan AG, which at the same time changed its legal form from a German Stock Corporation (Aktiengesellschaft) to a European Company (Societas Europaea), being J.P. Morgan SE.
The merger does not change the scope of services provided to the Fund by J.P. Morgan Bank (Ireland) PLC. Since the Merger Date, J.P. Morgan SE continues to carry out the depositary functions through J.P. Morgan SE, Dublin Branch.
As legal successor of J.P. Morgan Bank (Ireland) PLC, J.P. Morgan SE, Dublin Branch has assumed all rights and obligations that J.P. Morgan Bank (Ireland) PLC has under the existing agreements with the Fund. Any agreements in place with J.P. Morgan Bank (Ireland) PLC have been transferred to J.P. Morgan SE, Dublin Branch by operation of law.
On 15 March 2022 Henderson Global Investors Limited changed its name to Janus Henderson Investors UK Limited (JHIUKL).
On 11 March 2022 Janus Capital International Limited changed its name to Janus Henderson Investors International Limited (JHIIL).
Janus Henderson Global Adaptive Capital Preservation closed on 25 March 2022.
The Russia/Ukraine conflict is closely monitored and assessed by various business units which has not required activation of the business continuity plans or a change from regular business processes up to the date of signing. The Funds did not have any direct exposure to Russia and /or Ukraine as at 31 December 2021. The secondary market impact resulting in an increase in overall market volatility influences risk levels of the Funds. The Funds continues to be managed according to their investment objective through this period of uncertainty with currently no areas of concern identified. The Funds valuations are carried out without any necessary deviation from the valuation policy. The situation is regularly changing and monitored by the Investment Manager. The overall impact is not yet known.
Janus Henderson completed the sale of Intech Investment Management LLC on 31 March 2022.
There were no other subsequent events since the financial year end.
19. Approval of the Financial Statements
The financial statements were approved by the Board on 28 April 2022.
DocuSign Envelope ID: 521655BF-9BE3-47DC-A9A3-494932954338

Fund Expense Limits (unaudited)
383Janus Henderson Capital Funds plc / 31 December 2021
The Maximum Expense Limits table shows the total fees and out-of-pocket expenses allocated to a Fund in any fiscal year, excluding transactions costs and trade commissions, expressed as a percentage of the average daily net assets, for each Share Class (“Maximum Expense Limits”) under the terms of the Prospectus as set out in the “Fees and Expenses” section.
Maximum Expense LimitsUSD/EUR/AUD/HKD/CHF/RMB(CNH)/SGD/CAD/JPY/SEK Share Classes
Investment Management Fees FundClass A Shares
Class B Shares
Class E Shares
Class G Shares
Class H Shares
Class I Shares
Class S Shares
Class T Shares
Class V Shares
Class Y Shares
Class Z Shares
Janus Henderson Balanced Fund 2.25% 3.25% 2.75% 1.05% 1.05% 1.05% 1.05% 3.00% 2.25% n/a n/aJanus Henderson Global Adaptive Capital Appreciation Fund 1.75% n/a 2.40% 1.05% 1.05% 1.05% 1.05% n/a 2.75% n/a n/aJanus Henderson Global Adaptive Capital Preservation Fund 1.45% n/a 2.40% 0.75% 0.75% 0.75% 0.75% n/a 1.90% n/a n/aJanus Henderson Global Adaptive Multi-Asset Fund 1.75% n/a 2.90% 1.05% 1.05% 1.05% 1.05% n/a 2.75% n/a n/aJanus Henderson Global Life Sciences Fund 2.75% 3.75% 3.25% 1.05% 1.05% 1.75% 1.05% 3.50% 2.75% n/a n/aJanus Henderson Global Research Fund 2.50% n/a 3.00% 1.05% 1.05% 1.25% 1.05% 3.25% 2.75% n/a n/aJanus Henderson Global Technology and Innovation Fund 2.75% 3.75% 3.50% 1.05% 1.05% 1.75% 1.05% 3.50% 3.00% n/a n/aJanus Henderson US Contrarian Fund 2.50% 3.50% 3.00% 1.05% 1.05% 1.20% 1.05% 3.25% 2.75% n/a n/aJanus Henderson US Balanced 2026 Fund n/a n/a n/a n/a n/a n/a n/a n/a n/a 1.80% n/aJanus Henderson US Forty Fund 2.50% 3.50% 3.00% 1.05% 1.05% 1.20% 1.05% 3.25% 2.50% n/a n/aJanus Henderson US Research Fund 2.25% 3.75% 3.50% 1.05% 1.05% 1.20% 1.05% 3.00% 3.00% n/a n/aJanus Henderson US Small-Mid Cap Value Fund 2.25% 3.75% 3.25% 1.05% 1.05% 1.20% 1.05% 3.00% 3.00% n/a n/aJanus Henderson US Venture Fund 2.75% 3.75% 3.50% 1.05% 1.05% 1.75% 1.05% 3.50% 3.00% n/a n/aJanus Henderson Intech All-World Minimum Variance Core Fund 1.85% n/a 2.60% 1.25% 1.25% 1.05% 1.05% n/a 1.85% n/a n/aJanus Henderson Intech European Core Fund 1.75% n/a 2.75% 1.25% 1.25% 1.25% 1.25% n/a 2.00% n/a n/aJanus Henderson Intech Global Absolute Return Fund 1.75% n/a 2.75% 1.25% 1.25% 1.25% 1.25% n/a 2.00% n/a n/aJanus Henderson Intech Global All Country Low Volatility Fund 1.75% n/a 2.50% 1.15% 1.15% 0.95% 0.95% n/a 1.75% n/a n/aJanus Henderson Intech US Core Fund 1.75% 2.75% 2.75% 1.25% 1.25% 1.20% 1.20% 2.75% 2.00% n/a n/aJanus Henderson Global Real Estate Equity Income Fund 2.50% 3.50% 3.00% 1.05% 1.05% 1.25% 1.05% 3.25% 2.75% n/a n/aJanus Henderson Absolute Return Income Fund 1.25% n/a 1.90% 0.55% 0.55% 0.70% 0.55% n/a n/a n/a n/aJanus Henderson US Short-Term Bond Fund 0.95% 2.10% 2.15% 0.75% 0.75% 0.75% 0.75% 1.95% 1.90% n/a n/aJanus Henderson Absolute Return Income Fund (EUR) 1.25% n/a 1.90% 0.55% 0.55% 0.70% 0.55% n/a n/a n/a n/aJanus Henderson Absolute Return Income Opportunities Fund 1.05% n/a 1.70% 0.55% 0.55% 0.70% 0.55% n/a 2.50% n/a n/aJanus Henderson Flexible Income Fund 2.25% 3.25% 2.50% 0.85% 0.85% 0.80% 0.80% 3.00% 2.25% n/a n/aJanus Henderson Global High Yield Fund 2.00% n/a 2.50% 1.05% 1.05% 1.05% 1.05% n/a 2.50% n/a n/aJanus Henderson Global Investment Grade Bond Fund 1.20% n/a 1.40% 0.85% 0.70% 0.60% 0.85% n/a 2.50% n/a n/aJanus Henderson High Yield Fund 2.25% 3.25% 2.50% 0.90% 0.90% 0.90% 0.90% 3.00% 2.25% n/a n/aJanus Henderson Multi-Sector Income Fund 1.35% n/a 1.85% 0.95% 0.95% 0.95% 0.95% n/a 2.50% n/a n/a
DocuSign Envelope ID: 521655BF-9BE3-47DC-A9A3-494932954338

Supplementary Notes (unaudited)
Janus Henderson Capital Funds plc / 31 December 2021384
Remuneration DisclosureIn line with the requirements of the UCITS Regulations, the Company has adopted a remuneration policy which is consistent with the principles outlined in the ESMA guidelines on sound remuneration policies under the UCITS Directive (the “Remuneration Guidelines”). The remuneration policy is appropriate to the Company’s size, internal organisation and the nature, scope and complexity of its activities.
The Company’s remuneration policy applies to certain identified staff whose professional activities have a material impact on the risk profile of the Company. As at 31 December 2021, the Company did not have any employees and the Company’s remuneration policy applies only to members of the Company’s management body (i.e. the board of directors). The directors not affiliated with the Investment Adviser receive a fixed annual fee which is inline with the fees paid by other Irish funds and compensates these directors for their tasks, expertise and responsibilities.
Directors that are employees of the Investment Adviser (or an affiliate) are not paid any fees for their services as directors.
For the financial year ended 31 December 2021, only the Independent Directors received a fixed fee from the Company in their roles as directors, which was in aggregate USD 96,025. None of the directors are entitled to receive any variable remuneration from the Company.
The remuneration policy was amended to take account of the issue of Remuneration Guidelines in October 2016, and the policy is reviewed on an annual basis with the most recent review to ensure that it remains consistent with the Remuneration Guidelines, with the most recent review being undertaken in February 2021.
Headcount1
Total Remuneration (£'000s)2,3,6
Janus Henderson Capital 2,018 12,864 of which Fixed Remuneration 2,018 5,034 Variable Remuneration 2,006 7,831 Janus Henderson Capital Remuneration Code Staff 84 5,745 of which Senior Management 4 25 1,046 Other Code Staff 5 59 4,699
1 The is the actual number of employees who are fully or partly involved in the activities of Janus Henderson Capital funds – no attempt has been made to apportion the time spent specifically in support of the company , as this data is not captured as part of the Company’s normal processes.
2 Please note that due to the employment structure and resourcing of the Janus Henderson Group, the staff indicated in this table may provide services to other companies in the Janus Henderson Group.
3 The remuneration disclosed is only in respect of the provision of services to each of the funds of Janus Henderson Capital Fund for the year, rather than the total remuneration for the year – for this purpose, remuneration has been apportioned between the provision of services to and to other entities in the Janus Henderson Group, as follows:
- in respect of fixed pay and annual/long term incentive bonuses:• where fixed pay is directly attributable to (for example, fees for Board members), 100% of those fees;• for fund managers, pro-rated using the average AUM of each fund within the Janus Henderson Capital Fund managed by the relevant fund
manager (as a proportion of the total AUM managed by that individual) as a proxy. • for other individuals, pro-rated using the average AUM of each fund within the Janus Henderson Capital Fund (as a proportion of the aggregate
average AUM of Janus Henderson Group PLC) as a proxy. 4 Senior Management includes the Janus Henderson Executive Committee and other Group Board members and the Board.
5 Other Code Staff includes all other JHIIL Code Staff not covered by the above, including Fund Managers who manage AUM within each of the funds of Janus Henderson Capital Fund.
6 Please note that rounding off of values could lead to a mismatch of individual numbers and their sum.
DocuSign Envelope ID: 521655BF-9BE3-47DC-A9A3-494932954338

Non-Financial Risks (unaudited)
385Janus Henderson Capital Funds plc / 31 December 2021
Political and Economic RiskInvestments in certain countries, particularly Developing Markets, may be subject to heightened political and economic risks. Subject to the limitations on investments set forth under “Investment Objective and Policies” in each Supplement, the Funds may invest in Developing Markets. Developing Markets involve risks such as immature economic structures, national policies restricting investments by foreigners, and different legal systems.
Special SituationsCertain Funds may invest in special situations or turnarounds such as development of a new product, a technological breakthrough or management change. A Fund’s performance could suffer if the anticipated development in a “special situation” investment does not occur or does not attract the expected attention.
Cyber Security and Identity TheftInformation and technology systems relied upon by the Company, a Fund, the Manager, the Investment Adviser, the Sub-Investment Advisers, a Fund’s service providers (including, but not limited to, the auditors, Depositary, Administrator, Transfer Agent and Distributor) and/or the issuers of securities in which a Fund invests may be vulnerable to damage or interruption from computer viruses, network failures, computer and telecommunication failures, infiltration by unauthorised persons and security breaches, usage errors by their respective professionals, power outages and catastrophic events such as fires, tornadoes, floods, hurricanes and earthquakes. Although the parties noted above have implemented measures to manage risks relating to these types of events, if these systems are compromised, become inoperable for extended periods of time or cease to function properly, significant investment may be required to fix or replace them. In addition, there are inherent limitations in such measures, including the possibility that certain risks have not been identified. The failure of these systems and/or of disaster recovery plans for any reason could cause significant interruptions in the operations of a Fund, the Manager, the Investment Adviser, a Sub- Investment Adviser, a service provider and/or the issuer of a security in which a Fund invests and may result in a failure to maintain the security, confidentiality or privacy of sensitive data, including personal information relating to investors (and the beneficial owners of investors). Such a failure could also harm a Fund’s, the Manager’s, the Investment Adviser’s, a Sub-Investment Adviser’s, a service provider’s and/or an issuer’s reputation, subject such entity and its affiliates to legal claims and otherwise affect their business and financial performance. When such issues are present with regard to an issuer of a security in which the Fund invests, the Fund’s investment in such securities may lose value.
Regulatory Risk and Legal FrameworkThere may be less government supervision of markets in Developing Markets, and issuers in such markets may not be subject to the uniform accounting, auditing, and financial reporting standards and practices applicable to issuers
in the developed countries. There may be less publicly available information about issuers in Developing Markets.
The legislative framework in Developing Markets for the purchase and sale of investments and in relation to the beneficial interests in those investments may be relatively new and untested and there can be no assurance regarding how the courts or agencies of Developing Markets will react to questions arising from a Fund’s investments in such countries and arrangements contemplated in relation thereto.
DocuSign Envelope ID: 521655BF-9BE3-47DC-A9A3-494932954338

Securities Financing Transactions Regulations (unaudited)
Janus Henderson Capital Funds plc / 31 December 2021386
The following disclosure follows the requirements of EU Securities Financing Transactions Regulation (“SFTR”) which came into effect on 12 January 2016. A Securities Financing Transaction (“SFT”) is defined as per Article 3(11) of the SFTR as:
• A repurchase transaction;
• Securities or commodities lending and securities or commodities borrowing;
• A buy-sell back transaction or sell-buy back transaction; or
• A margin lending transaction.
Total return swaps are also in the scope for the SFTR disclosure requirements. Only Janus Henderson Global Adaptive Capital Preservation Fund and Janus Henderson Global Adaptive Multi Asset Fund holds total return swaps as at 31 December 2021. All disclosures below relate to these Funds alone.
GLOBAL DATA:
As at 31 December 2021
Janus Henderson Global Adaptive Capital Preservation Fund
Type of AssetAbsolute Exposure
Amount (USD)Proportion of
AUM (USD)Total Return Swap 4,068 0.13
Janus Henderson Global Adaptive Multi-Asset Fund
Type of AssetAbsolute Exposure
Amount (USD)Proportion of
AUM (USD)Total Return Swap 13,398 0.08
CONCENTRATION DATA:
Ten largest collateral issuersThe Fund did not receive non-cash collateral by way of title transfer collateral arrangements as at 31 December 2021.
Top ten counterpartiesThe following table provides details of the top ten counterparties (based on gross volume of outstanding transactions, measured using exposure values) in respect of TRSs as at 31 December 2021.
Janus Henderson Global Adaptive Capital Preservation Fund Counterparty
Gross volume of outstanding
trades (USD)Total Return Swap J.P. Morgan 3,651Total Return Swap Bank of America 417
Janus Henderson Global Adaptive Multi-Asset Fund Counterparty
Gross volume of outstanding
trades (USD)Total Return Swap J.P. Morgan 10,050Total Return Swap Bank of America 3,348
AGGREGATE TRANSACTION DATA:
Janus Henderson Global Adaptive Multi-Asset Fund Counterparty
Type of collateral Quality Currency
Maturity tenor (collateral)
Maturity tenor (STFs/Total Return Swaps)
Country of counterparty establishment
Settlement and clearing
Total Return Swap J.P. Morgan Cash, received N/A - Cash USD Open maturity > 1 year United States Bilateral
There was no cash collateral received for Janus Henderson Global Adaptive Capital Preservation Fund.
COLLATERAL REUSE:Collateral is only used for the purpose of hypothecating back into other collateral, as such returns on reinvested collateral were nil during the financial year ended 31 December 2021.
SAFEKEEPING:Collateral cash received is held with JPMorgan under the same safe-custody arrangements as all other cash within the Fund.
RETURN/COSTS:All returns generated by the TRSs belong to the Fund itself. Transaction costs on the purchase and sales of TRSs are included in the purchase and sale price of the investment.
Realised Gains/(Losses)
USD% overall
returnsCollective Investment undertaking:Janus Henderson Global Adaptive Capital Preservation Fund 90,530 100Janus Henderson Global Adaptive Multi-Asset Fund 257,242 100
DocuSign Envelope ID: 521655BF-9BE3-47DC-A9A3-494932954338

Securities Financing Transactions Regulations (unaudited) (continued)
387Janus Henderson Capital Funds plc / 31 December 2021
Securities financing transactionsThe funds engage in securities financing transactions (SFTs) (as defined in Article 3 of Regulation (EU) 2015/2365, SFTs include repurchase transactions, securities or commodities lending and securities or commodities borrowing, buy-sell back transactions or sell-buy back transactions and margin lending transactions). In accordance with Article 13 of the Regulation (EU) 2015/2365, the funds’ involvement in and exposures related to securities lending for the year ended 31 December 2021 are detailed below.
Global dataThe following table lists the amount of securities on loan as a proportion of total lendable assets and the funds' AUM as at 31 December 2021:
Fund Market Value of securities on loan
(in Fund Currency)
% of lendable assets % of AUM
Janus Henderson Balanced Fund 78,764,954 0.96 0.94Janus Henderson Global Life Sciences Fund 29,752,376 0.66 0.64Janus Henderson Global Research Fund 1,015,498 1.22 1.20Janus Henderson Global Technology and Innovation Fund 2,086,729 0.42 0.39Janus Henderson US Contrarian Fund 500,433 1.48 1.48Janus Henderson US Balanced 2026 Fund 697,646 1.05 1.00Janus Henderson US Forty Fund 121,519 0.01 0.01Janus Henderson US Research Fund 102,948 0.99 0.98Janus Henderson US Small-Mid Cap Value Fund 340,560 0.16 0.16Janus Henderson US Venture Fund 6,295,468 2.49 2.44Janus Henderson Intech European Core Fund 2,358,365 1.70 1.66Janus Henderson Global Real Estate Equity Income Fund 3,184,565 1.08 0.99Janus Henderson Flexible Income Fund 9,115,910 1.32 1.20Janus Henderson High Yield Fund 874,995 0.17 0.15
Concentration dataThe following table lists the ten largest collateral issuers by value of collateral received (across all SFTs) for each fund as at 31 December 2021:
Issuer Market value of collateral received (in Fund Currency)
Janus Henderson Balanced Fund*Government of Germany 45,433,720Government of Austria 24,926,656Kingdom of Netherlands 6,177,591Government of Belgium 4,100,938Republic of Finland 1,476,255Government of France 473,151
Janus Henderson Global Life Sciences Fund*US Treasury 14,189,086Government of France 4,257,786Government of Austria 3,660,426Government of Belgium 2,929,640Government of Germany 1,876,708UK Treasury 1,675,326Republic of Finland 1,413,000Kingdom of Netherlands 1,149,451Government of Japan 446,269
Janus Henderson Global Research Fund*US Treasury 962,233UK Treasury 65,955Government of France 42,324Government of Belgium 37,232Government of Germany 15,252Republic of Finland 14,008Government of Austria 5,638Deutsche Bundesrepublik 47
Issuer Market value of
collateral received (in Fund Currency)
Janus Henderson Global Technology and Innovation Fund*US Treasury 1,425,431Government of Japan 527,352Government of France 125,551Government of Austria 75,284UK Treasury 30,220Government of Belgium 22,160Government of Germany 17,291Republic of Finland 13,018Kingdom of Netherlands 10,394
Janus Henderson US Contrarian Fund*US Treasury 449,512Government of France 28,222Government of Austria 20,684Government of Belgium 17,910Government of Germany 14,437UK Treasury 12,136Republic of Finland 10,870Kingdom of Netherlands 8,679
Janus Henderson US Balanced 2026 Fund*Government of Germany 402,421Government of Austria 220,783Kingdom of Netherlands 54,717Government of Belgium 36,323Republic of Finland 13,076Government of France 4,191
DocuSign Envelope ID: 521655BF-9BE3-47DC-A9A3-494932954338

Securities Financing Transactions Regulations (unaudited) (continued)
Janus Henderson Capital Funds plc / 31 December 2021388
Issuer Market value of
collateral received (in Fund Currency)
Janus Henderson US Forty Fund*Government of France 28,124Government of Austria 20,613Government of Belgium 17,848US Treasury 16,049Government of Germany 14,388UK Treasury 12,094Republic of Finland 10,833Kingdom of Netherlands 8,648
Janus Henderson US Research Fund*Government of France 22,288US Treasury 20,330Government of Austria 16,335Government of Belgium 14,144Government of Germany 11,402UK Treasury 9,584Republic of Finland 8,585Kingdom of Netherlands 6,854
Janus Henderson US Small-Mid Cap Value Fund*Government of France 78,819Government of Austria 57,768Government of Belgium 50,020US Treasury 44,979Government of Germany 40,322UK Treasury 33,894Republic of Finland 30,359Kingdom of Netherlands 24,237
Janus Henderson US Venture Fund*US Treasury 4,656,844Government of France 583,046Government of Austria 427,328Government of Belgium 370,013Government of Germany 298,272UK Treasury 250,726Republic of Finland 224,573Kingdom of Netherlands 179,295
Issuer Market value of
collateral received (in Fund Currency)
Janus Henderson Intech European Core FundGovernment of Japan 1,337,229Government of France 227,490UK Treasury 221,298US Treasury 212,427Government of Belgium 153,435Government of Austria 111,914Government of Germany 96,829Republic of Finland 87,806Kingdom of Netherlands 39,492Deutsche Bundesrepublik 405Janus Henderson Global Real Estate Equity Income Fund*Government of France 681,093US Treasury 637,399Government of Austria 504,474Government of Belgium 442,864Government of Germany 339,550UK Treasury 306,015Republic of Finland 256,528Kingdom of Netherlands 201,468Deutsche Bundesrepublik 16
Janus Henderson Flexible Income Fund*Government of Germany 5,258,299Government of Austria 2,884,902Kingdom of Netherlands 714,967Government of Belgium 474,625Republic of Finland 170,855Government of France 54,761
Janus Henderson High Yield Fund*Government of France 202,508Government of Austria 148,422Government of Belgium 128,515US Treasury 115,564Government of Germany 103,598UK Treasury 87,084Republic of Finland 78,000Kingdom of Netherlands 62,274
*All issuers have been included.
The following table details the top ten counterparties of each type of SFTs (based on gross volume of outstanding transactions), for each fund as at 31 December 2021:
Counterparty Market value of securities on loan
(in Fund Currency)
Settlement basis
Janus Henderson Balanced FundCitigroup Global Markets Ltd. 78,764,954 Triparty
78,764,954–
Janus Henderson Global Life Sciences FundUBS AG 17,518,021 TripartyCredit Suisse AG 12,234,355 Triparty
29,752,376–
Janus Henderson Global Research FundUBS AG 783,500 TripartyCitigroup Global Markets Ltd. 231,998 Triparty
1,015,498–
Janus Henderson Global Technology and Innovation FundCredit Suisse AG 1,411,352 TripartyUBS AG 675,377 Triparty
2,086,729–
Counterparty Market value of
securities on loan (in Fund Currency)
Settlement basis
Janus Henderson US Contrarian FundUBS AG 500,433 Triparty
500,433–
Janus Henderson US Balanced 2026 FundCitigroup Global Markets Ltd. 697,646 Triparty
697,646–
Janus Henderson US Forty FundUBS AG 121,519 Triparty
121,519–
Janus Henderson US Research FundUBS AG 102,948 Triparty
102,948–
Janus Henderson US Small-Mid Cap Value FundUBS AG 340,560 Triparty
340,560–
DocuSign Envelope ID: 521655BF-9BE3-47DC-A9A3-494932954338

Securities Financing Transactions Regulations (unaudited) (continued)
389Janus Henderson Capital Funds plc / 31 December 2021
Counterparty Market value of
securities on loan (in Fund Currency)
Settlement basis
Janus Henderson US Venture FundUBS AG 6,295,468 Triparty
6,295,468–
Janus Henderson Intech European Core FundCitigroup Global Markets Ltd. 1,807,295 TripartyUBS AG 551,070 Triparty
2,358,365–
Janus Henderson Global Real Estate Equity Income FundUBS AG 2,823,152 TripartyCredit Suisse AG 280,896 TripartyCitigroup Global Markets Ltd. 80,517 Triparty
3,184,565–
Janus Henderson Flexible Income FundCitigroup Global Markets Ltd. 9,115,910 Triparty
9,115,910–
Janus Henderson High Yield FundUBS AG 874,995 Triparty
874,995–
Maturity Tenor of securities on loan (remaining period to maturity)
Less than one day
Amount of securities
on loan (in Fund
Currency)
One day to one week
Amount of securities
on loan (in Fund
Currency)
One week to one month
Amount of securities
on loan (in Fund
Currency)
One to three months
Amount of securities
on loan (in Fund
Currency)
Three months to
one year Amount of securities
on loan (in Fund
Currency)
Above one year
Amounts of securities
on loan (in Fund
Currency)
Open maturity
Amount of securities
on loan (in Fund
Currency)
Total Amount of securities
on loan (in Fund
Currency)
Janus Henderson Balanced Fund – – – – – 78,764,954 – 78,764,954Janus Henderson Global Life Sciences Fund – – – – – – 29,752,376 29,752,376Janus Henderson Global Research Fund – – – – – – 1,015,498 1,015,498Janus Henderson Global Technology and Innovation Fund – – – – – – 2,086,729 2,086,729Janus Henderson US Contrarian Fund – – – – – – 500,433 500,433Janus Henderson US Balanced 2026 Fund – – – – – 697,646 – 697,646Janus Henderson US Forty Fund – – – – – – 121,519 121,519Janus Henderson US Research Fund – – – – – – 102,948 102,948Janus Henderson US Small-Mid Cap Value Fund – – – – – – 340,560 340,560Janus Henderson US Venture Fund – – – – – – 6,295,468 6,295,468Janus Henderson Intech European Core Fund – – – – – – 2,358,365 2,358,365Janus Henderson Global Real Estate Equity Income Fund – – – – – – 3,184,565 3,184,565Janus Henderson Flexible Income Fund – – – – – 9,115,910 – 9,115,910Janus Henderson High Yield Fund – – – – – – 874,995 874,995
The following tables provides an analysis of the collateral received by each fund in respect of each type of SFTs as at 31 December 2021:
Counterparty Counterparty country of origin
Type Quality Collateral Currency
Settlement basis
Custodian Market Value of collateral received (in
Fund Currency)
Janus Henderson Balanced FundCitigroup Global Markets Ltd. United Kingdom Government Bond Investment Grade EUR Triparty JPMorgan 82,588,311
82,588,311
Janus Henderson Global Life Sciences FundUBS AG Switzerland Government Bond Investment Grade EUR Triparty JPMorgan 13,103,109Credit Suisse AG Switzerland Government Bond Investment Grade USD Triparty JPMorgan 10,186,497
DocuSign Envelope ID: 521655BF-9BE3-47DC-A9A3-494932954338

Securities Financing Transactions Regulations (unaudited) (continued)
Janus Henderson Capital Funds plc / 31 December 2021390
Counterparty Counterparty country of origin
Type Quality Collateral Currency
Settlement basis
Custodian Market Value of collateral received (in
Fund Currency)UBS AG Switzerland Government Bond Investment Grade USD Triparty JPMorgan 4,002,589Credit Suisse AG Switzerland Government Bond Investment Grade EUR Triparty JPMorgan 2,183,901UBS AG Switzerland Government Bond Investment Grade GBP Triparty JPMorgan 1,577,553Credit Suisse AG Switzerland Government Bond Investment Grade JPY Triparty JPMorgan 446,269Credit Suisse AG Switzerland Government Bond Investment Grade GBP Triparty JPMorgan 97,774
31,597,692
Janus Henderson Global Research FundUBS AG Switzerland Government Bond Investment Grade USD Triparty JPMorgan 897,175Citigroup Global Markets Ltd. United Kingdom Government Bond Investment Grade EUR Triparty JPMorgan 114,502Citigroup Global Markets Ltd. United Kingdom Government Bond Investment Grade GBP Triparty JPMorgan 65,955Citigroup Global Markets Ltd. United Kingdom Government Bond Investment Grade USD Triparty JPMorgan 65,057
1,142,689
Janus Henderson Global Technology and Innovation FundCredit Suisse AG Switzerland Government Bond Investment Grade USD Triparty JPMorgan 800,000UBS AG Switzerland Government Bond Investment Grade USD Triparty JPMorgan 625,431Credit Suisse AG Switzerland Government Bond Investment Grade JPY Triparty JPMorgan 527,352Credit Suisse AG Switzerland Government Bond Investment Grade EUR Triparty JPMorgan 142,979UBS AG Switzerland Government Bond Investment Grade EUR Triparty JPMorgan 120,719Credit Suisse AG Switzerland Government Bond Investment Grade GBP Triparty JPMorgan 15,686UBS AG Switzerland Government Bond Investment Grade GBP Triparty JPMorgan 14,534
2,246,701
Janus Henderson US Contrarian FundUBS AG Switzerland Government Bond Investment Grade USD Triparty JPMorgan 449,512UBS AG Switzerland Government Bond Investment Grade EUR Triparty JPMorgan 100,802UBS AG Switzerland Government Bond Investment Grade GBP Triparty JPMorgan 12,136
562,450
Janus Henderson US Balanced 2026 FundCitigroup Global Markets Ltd. United Kingdom Government Bond Investment Grade EUR Triparty JPMorgan 731,511
731,511
Janus Henderson US Forty FundUBS AG Switzerland Government Bond Investment Grade EUR Triparty JPMorgan 100,454UBS AG Switzerland Government Bond Investment Grade USD Triparty JPMorgan 16,049UBS AG Switzerland Government Bond Investment Grade GBP Triparty JPMorgan 12,094
128,597
Janus Henderson US Research FundUBS AG Switzerland Government Bond Investment Grade EUR Triparty JPMorgan 79,608UBS AG Switzerland Government Bond Investment Grade USD Triparty JPMorgan 20,330UBS AG Switzerland Government Bond Investment Grade GBP Triparty JPMorgan 9,584
109,522
Janus Henderson US Small-Mid Cap Value FundUBS AG Switzerland Government Bond Investment Grade EUR Triparty JPMorgan 281,525UBS AG Switzerland Government Bond Investment Grade USD Triparty JPMorgan 44,979UBS AG Switzerland Government Bond Investment Grade GBP Triparty JPMorgan 33,894
360,398
Janus Henderson US Venture FundUBS AG Switzerland Government Bond Investment Grade USD Triparty JPMorgan 4,656,844UBS AG Switzerland Government Bond Investment Grade EUR Triparty JPMorgan 2,082,526UBS AG Switzerland Government Bond Investment Grade GBP Triparty JPMorgan 250,727
6,990,097
Janus Henderson Intech European Core FundCitigroup Global Markets Ltd. United Kingdom Government Bond Investment Grade JPY Triparty JPMorgan 1,337,229UBS AG Switzerland Government Bond Investment Grade EUR Triparty JPMorgan 455,544
DocuSign Envelope ID: 521655BF-9BE3-47DC-A9A3-494932954338

Securities Financing Transactions Regulations (unaudited) (continued)
391Janus Henderson Capital Funds plc / 31 December 2021
Counterparty Counterparty country of origin
Type Quality Collateral Currency
Settlement basis
Custodian Market Value of collateral received (in
Fund Currency)Citigroup Global Markets Ltd. United Kingdom Government Bond Investment Grade EUR Triparty JPMorgan 261,827Citigroup Global Markets Ltd. United Kingdom Government Bond Investment Grade GBP Triparty JPMorgan 166,453Citigroup Global Markets Ltd. United Kingdom Government Bond Investment Grade USD Triparty JPMorgan 139,645UBS AG Switzerland Government Bond Investment Grade USD Triparty JPMorgan 72,782UBS AG Switzerland Government Bond Investment Grade GBP Triparty JPMorgan 54,845
2,488,325
Janus Henderson Global Real Estate Equity Income FundUBS AG Switzerland Government Bond Investment Grade EUR Triparty JPMorgan 2,333,767UBS AG Switzerland Government Bond Investment Grade USD Triparty JPMorgan 372,865UBS AG Switzerland Government Bond Investment Grade GBP Triparty JPMorgan 280,975Credit Suisse AG Switzerland Government Bond Investment Grade USD Triparty JPMorgan 241,955Credit Suisse AG Switzerland Government Bond Investment Grade EUR Triparty JPMorgan 52,488Citigroup Global Markets Ltd. United Kingdom Government Bond Investment Grade EUR Triparty JPMorgan 39,739Citigroup Global Markets Ltd. United Kingdom Government Bond Investment Grade GBP Triparty JPMorgan 22,890Citigroup Global Markets Ltd. United Kingdom Government Bond Investment Grade USD Triparty JPMorgan 22,579Credit Suisse AG Switzerland Government Bond Investment Grade GBP Triparty JPMorgan 2,149
3,369,407
Janus Henderson Flexible Income FundCitigroup Global Markets Ltd. United Kingdom Government Bond Investment Grade EUR Triparty JPMorgan 9,558,409
9,558,409
Janus Henderson High Yield FundUBS AG Switzerland Government Bond Investment Grade EUR Triparty JPMorgan 723,317UBS AG Switzerland Government Bond Investment Grade USD Triparty JPMorgan 115,564UBS AG Switzerland Government Bond Investment Grade GBP Triparty JPMorgan 87,084
925,965
All collateral is held in segregated accounts.
The lending and collateral transactions are on an open basis and can be recalled on demand.
Re-use of collateralCash collateral may be reinvested during the loan transaction to generate additional returns for the benefit of the fund.
Maturity Tenor of Collateral (remaining period to maturity)
Less than one day
Amount of Collateral
(in Fund Currency)
One day to one week
Amount of Collateral
(in Fund Currency)
One week to one month
Amount of Collateral
(in Fund Currency)
One to three months
Amount of Collateral
(in Fund Currency)
Three months to
one year Amount of Collateral
(in Fund Currency)
Above one year
Amounts of Collateral
(in Fund Currency)
Open maturity
Amount of Collateral
(in Fund Currency)
Total Amount of Collateral
(in Fund Currency)
Janus Henderson Balanced Fund – – 2,692,215 15,839 13,718,319 66,161,938 – 82,588,311Janus Henderson Global Life Sciences Fund – 7,603 499,324 1,744,984 4,991,166 24,354,615 – 31,597,692Janus Henderson Global Research Fund – 3,573 3,484 47,860 41,681 1,046,091 – 1,142,689Janus Henderson Global Technology and Innovation Fund – 2,414 2,354 31,914 493,100 1,716,919 – 2,246,701Janus Henderson US Contrarian Fund – 1,726 1,683 23,194 20,545 515,302 – 562,450Janus Henderson US Balanced 2026 Fund – – 23,846 140 121,508 586,017 – 731,511Janus Henderson US Forty Fund – – – 2,601 8,298 117,698 – 128,597Janus Henderson US Research Fund – 30 30 2,423 6,791 100,248 – 109,522Janus Henderson US Small-Mid Cap Value Fund – – – 7,290 23,255 329,853 – 360,398Janus Henderson US Venture Fund – 17,220 16,794 259,295 293,930 6,402,858 – 6,990,097Janus Henderson Intech European Core Fund – – – 125,370 397,326 1,965,629 – 2,488,325
DocuSign Envelope ID: 521655BF-9BE3-47DC-A9A3-494932954338

Securities Financing Transactions Regulations (unaudited) (continued)
Janus Henderson Capital Funds plc / 31 December 2021392
Maturity Tenor of Collateral (remaining period to maturity)
Less than one day
Amount of Collateral
(in Fund Currency)
One day to one week
Amount of Collateral
(in Fund Currency)
One week to one month
Amount of Collateral
(in Fund Currency)
One to three months
Amount of Collateral
(in Fund Currency)
Three months to
one year Amount of Collateral
(in Fund Currency)
Above one year
Amounts of Collateral
(in Fund Currency)
Open maturity
Amount of Collateral
(in Fund Currency)
Total Amount of Collateral
(in Fund Currency)
Janus Henderson Global Real Estate Equity Income Fund – – 12,516 95,717 286,517 2,974,657 – 3,369,407Janus Henderson Flexible Income Fund – – 311,585 1,833 1,587,698 7,657,293 – 9,558,409Janus Henderson High Yield Fund – – – 18,731 59,749 847,485 – 925,965
Return and cost on securities lending activitiesThe following table details the funds' return and cost for each type of SFTs for the year ending 31 December 2021:
Fund Total gross amount of
stock lending revenue
(in Fund Currency)
Direct and indirect costs and fees
deducted by securities
lending agent (in Fund Currency)
Net stock lending revenue
retained by the fund
(in Fund Currency)
% return retained by
the securities lending agent
% return retained by
the fund
Securities LendingJanus Henderson Balanced Fund 1,327 152 1,175 8% 92%Janus Henderson Global Life Sciences Fund 63,340 6,887 56,453 8% 92%Janus Henderson Global Research Fund 1,420 129 1,291 8% 92%Janus Henderson Global Technology and Innovation Fund 67,516 7,717 59,799
8% 92%
Janus Henderson US Contrarian Fund 506 58 448 8% 92%Janus Henderson US Balanced 2026 Fund 111 12 99 8% 92%Janus Henderson US Forty Fund 71 8 63 8% 92%Janus Henderson US Research Fund 62 6 56 8% 92%Janus Henderson US Small-Mid Cap Value Fund 169 19 150 8% 92%Janus Henderson US Venture Fund 8,033 920 7,113 8% 92%Janus Henderson Intech European Core Fund 2,756 220 2,536 8% 92%Janus Henderson Global Real Estate Equity Income Fund 5,435 435 5,000
8% 92%
Janus Henderson Flexible Income Fund 2,225 254 1,971 8% 92%Janus Henderson High Yield Fund 355 40 315 8% 92%
DocuSign Envelope ID: 521655BF-9BE3-47DC-A9A3-494932954338

Share Classes (unaudited)
393Janus Henderson Capital Funds plc / 31 December 2021
The Company offers 11 Classes of Shares with various distribution policies, distribution frequencies, hedging policies and currencies in each Class. Furthermore, not all Funds or Classes of Shares are available in all jurisdictions. Applicants/Shareholders are requested to contact the relevant Distribution Agent for a list of Funds and Classes of Shares available to them and ensure that they only subscribe for the Classes of Shares that they are eligible to hold.
The name of each Class of Shares offered by the Company enables Shareholders to identify the distribution policy, distribution frequency, hedging policy and currency of a Class by reference to the following sub-classifications:
Share Class Distribution Policy Distribution Frequency Hedged Share Class CurrencyClass A Series 1 Annual -- * ** US Dollar (USD)Class B Series 2 Bi-Annual – s H Euro (EUR)Class E Series 3 Quarterly – q PH Pound Sterling (GBP)Class G Series 4 Monthly -- m Hong Kong Dollar (HKD)Class H Series 5 Japanese Yen (JPY)Class I Australian Dollar (AUD)Class S Swiss Franc (CHF)Class T Canadian Dollar (CAD)Class V Renminbi (CNH)Class Y Swedish Kronor (SEK)Class Z New Zealand Dollar (NZD)
Singapore Dollar (SGD)Norwegian Krone (NOK)
*Annually distributing share classes are identifiable by the absence of the distribution frequency sub-classification/series.
**Unhedged share classes are identifiable by the absence of the hedging policy sub-classification/series.
Each Class of Shares comprises five sub-classifications/series of Shares by reference to a Class' distribution policy. The five series and their corresponding distribution policies are set out below.
Accumulating share classes:
The Company will not declare or make dividend payments on any accumulating Class. All net income and net realised capital gains will not be distributed and will be reflected in the net asset value per Share.
All accumulating Classes of Shares are “Series 2 Shares” and are denoted by the number 2 in the name of the Class of Shares.
Distributing share classes:
The distributing share classes intend to declare and distribute dividends, which are comprised of all or some portion of investment income and net realised, and unrealised capital gains and/or capital as disclosed below.
Distributing Share Classes may be designated as one of four series of Shares depending on their distribution policy and will be denoted by the numbers 1, 3, 4 or 5 in the name of the Share Class.
Series 1 Shares
The distribution policy is to distribute substantially all of the investment income for the relevant accounting period after the deduction of fees, charges and expenses. Distributions will not include realised and unrealised capital gains.
Series 3 Shares
The distribution policy is to distribute substantially all of the investment income for the relevant accounting period before the deduction of fees, charges and expenses. Distributions will not include realised and unrealised capital gains.
DocuSign Envelope ID: 521655BF-9BE3-47DC-A9A3-494932954338

Share Classes (unaudited) (continued)
Janus Henderson Capital Funds plc / 31 December 2021394
Series 4 and 5 Shares
The distribution policy is to distribute substantially all of the investment income over the relevant accounting period and potentially a portion of capital before the deduction of fees, charges and expenses. To allow more investment income to be distributed, series 4 Share Classes will deduct fees, charges and expenses from capital and distributions may also include realised and unrealised capital gains and original capital invested.
The following table mark the changes in share class names in 31 December 2020, no share class name changes were made for the year 31 December 2021:
Old Share class New Share classA$acc A2 USD
A$acc Hedged A2 HUSD
A$dis A1 USD
A$inc A1m USD
A$inc A3 m USD
A$inc A3 q USD
A$inc A3m USD
A$inc A4m USD
A$inc A5m USD
AAUDacc Hedged A2 HAUD
AAUDinc Hedged A3 q HAUD
AAUDinc Hedged A3m HAUD
AAUDinc Hedged A5m HAUD
ACADinc Hedged A5m HCAD
ACHFacc Hedged A2 HCHF
ACHFinc Hedged A1m HCHF
ACNHacc Hedged A2 HCNH
ACNHinc Hedged A3m HCNH
ACNHinc Hedged A5m HCNH
AEacc A2 EUR
AEacc Hedged A2 HEUR
AEinc Hedged A3m HEUR
AEinc Hedged A4m HEUR
AEinc Hedged A5m HEUR
AEURacc A2 EUR
AEURacc Hedged A2 HEUR
AHKDacc A2 HKD
AHKDinc A3m HKD
AHKDinc A5m HKD
ASGDacc A2 SGD
ASGDacc Hedged A2 HSGD
ASGDinc A4m SGD
ASGDinc A5m SGD
ASGDinc Hedged A4m HSGD
ASGDinc Hedged A5m HSGD
B$acc B2 USD
B$inc B1 m USD
B$inc B1 q USD
B$inc B1m USD
BEinc Hedged B1m HEUR
E$acc E2 USD
E$acc Hedged E2 HUSD
E$inc E3 m USD
E$inc E4m USD
E$inc E5m USD
EEacc E2 EUR
EEacc Hedged E2 HEUR
Old Share class New Share classEEinc Hedged E3 m HEUR
EEinc Hedged E3 q HEUR
EEinc Hedged E3m HEUR
EEinc Hedged E4m HEUR
EEinc Hedged E5m HEUR
I$ inc I1 USD
I$acc I2 USD
I$acc Hedged I2 HUSD
I$dis I1 USD
I$inc I1 USD
I$inc I1 m USD
I$inc I1 q USD
I$inc I1m USD
I$inc I4m USD
ICADacc Hedged I2 HCAD
ICHFacc Hedged I2 HCHF
IEacc I2 EUR
IEacc Hedged I2 HEUR
IEinc Hedged I1 m HEUR
IEinc Hedged I1m HEUR
IEURacc I2 EUR
IEURacc Hedged I2 HEUR
IGBPinc Hedged I1m HGBP
ISGDacc Hedged I2 HSGD
S$acc S2 USD
SEURacc S2 EUR
SEURacc Hedged S2 HEUR
U$acc G2 USD
U$acc H2 USD
U$inc G1m USD
U$inc H1 USD
U$inc H1 q USD
U$inc H1m USD
U$inc H3m USD
UCHFacc Hedged G2 HCHF
UEacc G2 EUR
UEacc H2 EUR
UEacc Hedged G2 HEUR
UEacc Hedged H2 HEUR
UEacc Hedged H2 HEUR
UEURacc G2 EUR
UEURacc Hedged G2 HEUR
UEURacc Hedged H2 HEUR
UEURinc Hedged H1m HEUR
UGBPacc H2 GBP
UGBPacc Hedged G2 HGBP
UGBPacc Hedged H2 HGBP
DocuSign Envelope ID: 521655BF-9BE3-47DC-A9A3-494932954338

Share Classes (unaudited) (continued)
395Janus Henderson Capital Funds plc / 31 December 2021
Old Share class New Share classUGBPinc H1 GBP
UGBPinc H1 q GBP
UGBPinc Hedged H1 q HGBP
V$acc V2 USD
V$inc V3m USD
V$inc V5m USD
VAUDinc Hedged V3 m HAUD
VAUDinc Hedged V3m HAUD
VAUDinc Hedged V5m HAUD
VEacc Hedged V2 HEUR
YEURacc Hedged Y2 HEUR
YEURinc Hedged Y4 HEUR
Z JPYinc Hedged Z1 HJPY
Z$acc Z2 USD
Z$inc Z1 s USD
Z$inc Z1 USD
ZEinc Z1 EUR
ZGBPacc Z2 GBP
ZJPYinc Hedged Z3 HJPY
DocuSign Envelope ID: 521655BF-9BE3-47DC-A9A3-494932954338

Additional Information for Hong KongInvestors (unaudited)
Janus Henderson Capital Funds plc / 31 December 2021396
The additional information in this section is for the Funds which are authorised by the Hong Kong Securities and Futures Commission (“SFC”) as at 31 December 2021 to meet the disclosure requirements in Hong Kong.
Note: SFC authorisation is not a recommendation or endorsement of a product nor does it guarantee the commercial merits of a product or its performance. It does not mean the product is suitable for all investors nor is it an endorsement of its suitability for any particular investor or class of investors.
The following table details the past ten years highest and lowest net asset per share for each share class in issue and available to Hong Kong investors as at 31 December 2021:
Ten Years Highest and Lowest Net Asset Value per Share
Janus Henderson Balanced FundHigh 2012 2013 2014 2015 2016 2017 2018 2019 2020 2021A2 HAUD – 10.53 11.34 11.68 11.98 13.85 14.72 11.25 17.71 20.37A2 HSGD – – – – – – – – 12.31 14.25A5m SGD – – – – – – – – 11.53 12.96A5m HSGD – – – – – – – – 11.55 12.85A2 USD 19.13 22.09 23.30 23.62 23.87 27.64 25.39 32.82 36.84 42.67A5m USD – 10.35 10.60 10.53 9.88 10.94 11.34 11.99 12.93 14.39B2 USD 16.72 19.06 19.92 20.11 19.99 22.92 24.29 26.67 29.63 33.98A2 SGD – – – – – – – – 12.11 14.32E2 USD – – – – 10.24 11.79 12.55 – – –I2 USD 21.28 24.88 26.47 26.93 27.65 32.32 34.76 39.13 44.35 51.89H2 USD – – – – – 10.03 10.79 – – –H1m USD – – – – – 10.03 10.70 – – –V5m USD – 10.37 10.65 10.64 10.04 11.10 11.52 – – –E5m USD – – – – 10.10 11.12 11.51 – – –A5m HKD – 10.35 10.59 10.52 9.87 11.01 11.46 1.54 12.91 14.45A5m HAUD – 10.42 10.62 10.66 10.05 10.98 11.36 8.18 12.34 13.59V5m HAUD – 10.41 10.72 10.75 10.15 11.11 11.49 – – –A5m HCAD – 10.41 10.68 10.65 9.99 10.87 11.24 8.93 12.39 13.72I2 HCAD – – – – 10.97 12.72 13.56 11.54 16.85 19.64A5m HCNH – 10.38 10.72 10.84 10.70 12.26 12.84 – – –A2 HEUR 20.63 23.67 24.93 25.20 25.02 28.35 29.00 35.26 34.76 39.89A2 HKD 11.32 13.08 13.79 13.97 14.15 16.50 17.66 2.51 21.81 25.41A5m HEUR – 10.31 10.55 10.46 9.77 10.42 10.75 11.97 11.34 12.50E2 HEUR 11.19 12.76 13.38 13.52 13.31 15.00 15.59 – – –E5m HEUR – 10.33 10.58 10.47 9.74 10.30 10.61 – – –I2 HEUR 12.65 14.73 15.63 15.89 16.02 18.32 19.25 23.24 23.14 26.81H2 HEUR – – – – – 10.03 10.54 – – –H1m HEUR – – – – – 10.03 10.46 – – –
DocuSign Envelope ID: 521655BF-9BE3-47DC-A9A3-494932954338

397Janus Henderson Capital Funds plc / 31 December 2021
Additional Information for Hong KongInvestors (unaudited) (continued)
Janus Henderson Balanced FundLow 2012 2013 2014 2015 2016 2017 2018 2019 2020 2021A2 HAUD – 9.93 10.32 10.83 10.55 11.86 13.05 9.35 12.81 17.20A2 HSGD – – – – – – – – 8.86 11.96A5m SGD – – – – – – – – 9.24 11.09A5m HSGD – – – – – – – – 8.58 11.22A2 USD 17.03 18.98 21.60 21.76 21.12 23.62 21.76 26.87 26.37 35.78A5m USD – 9.88 10.09 9.48 9.07 9.74 9.98 10.22 9.54 12.56B2 USD 14.99 16.54 18.61 18.45 17.84 19.77 21.55 22.05 21.37 28.77A2 SGD – – – – – – – – 9.54 11.80E2 USD – – – – 9.71 10.13 11.15 – – –I2 USD 18.81 21.18 24.35 24.92 24.27 27.36 31.00 31.73 31.50 43.09H2 USD – – – – – 9.98 9.62 – – –H1m USD – – – – – 9.98 9.50 – – –V5m USD – 9.88 10.11 9.63 9.21 9.90 10.14 – – –E5m USD – – – – 9.60 9.95 10.09 – – –A5m HKD – 9.88 10.10 9.47 9.11 9.73 10.07 1.32 9.53 12.54A5m HAUD – 9.93 10.10 9.62 9.22 9.86 9.91 7.10 9.22 11.98V5m HAUD – 9.90 10.16 9.72 9.31 9.96 10.02 – – –A5m HCAD – 9.92 10.13 9.58 9.16 9.77 9.79 7.43 9.21 12.04I2 HCAD – – – – 10.00 10.85 12.05 9.14 12.05 16.37A5m HCNH – 9.88 10.11 9.93 9.63 10.56 11.32 – – –A2 HEUR 18.45 20.43 23.14 23.19 22.45 24.72 25.95 30.37 25.17 33.75A2 HKD 10.09 11.23 12.80 12.88 12.56 13.98 15.71 2.05 15.62 21.20A5m HEUR – 9.84 10.05 9.38 8.96 9.47 9.21 10.73 8.46 11.01E2 HEUR 10.05 11.07 12.47 12.41 11.99 13.15 13.73 – – –E5m HEUR – 9.87 10.07 9.37 8.93 9.40 9.06 – – –I2 HEUR 11.18 12.57 14.42 14.67 14.26 15.83 17.02 19.83 16.62 22.47H2 HEUR – – – – – 9.96 9.32 – – –H1m HEUR – – – – – 9.96 9.21 – – –
Janus Henderson Global Life Sciences FundHigh 2012 2013 2014 2015 2016 2017 2018 2019 2020 2021A2 USD 13.86 20.52 27.98 33.73 28.79 31.01 35.40 39.19 47.87 52.01Z2 USD – – – – 100.46 126.30 147.80 – – –V2 USD – – – 10.31 10.14 10.92 12.46 – – –H1 USD – – 100.00 14.19 12.19 13.47 15.60 17.57 21.78 23.96H2 USD – 10.97 15.17 18.45 15.85 17.51 20.28 22.86 28.35 31.19I2 HSGD – – – – – – – – 14.38 15.71H1 GBP – – 100.00 14.75 15.17 16.64 19.39 28.43 26.24 28.61H2 GBP 10.00 14.99 21.80 26.64 27.39 30.04 35.01 51.34 47.42 51.70V2 HEUR – – – 10.30 10.13 10.55 11.69 – – –H2 HEUR – 11.04 15.24 18.50 15.89 16.97 19.08 22.95 25.12 27.41H2 EUR – – 100.00 16.77 14.37 14.97 17.20 22.50 22.84 26.47I2 HEUR 13.08 19.40 26.50 32.09 27.47 28.99 32.37 38.60 41.93 45.49I1 USD – – – – 10.04 12.46 14.33 – – –I2 USD 15.49 23.19 31.84 38.56 33.03 36.04 41.45 46.31 57.02 62.37E2 HEUR – 10.72 14.53 17.42 14.83 15.31 16.88 – – –E2 USD – 10.81 14.66 17.62 15.01 16.02 18.21 – – –B2 USD 12.18 17.80 24.03 28.80 24.49 25.91 29.29 32.02 38.72 41.71A2 HKD – – – 11.24 9.60 10.41 11.92 1.69 15.96 17.41A2 HEUR 14.11 20.75 28.27 34.02 29.02 30.22 33.35 39.57 42.65 45.96A2 HCNH – – 100.00 13.81 12.17 13.92 16.11 – – –A2 HAUD – 10.93 15.22 18.54 15.85 17.06 19.36 14.59 25.04 27.04I2 EUR – – 100.00 16.69 14.25 14.71 16.76 – – –
DocuSign Envelope ID: 521655BF-9BE3-47DC-A9A3-494932954338

Janus Henderson Capital Funds plc / 31 December 2021398
Additional Information for Hong KongInvestors (unaudited) (continued)
Janus Henderson Global Life Sciences FundLow 2012 2013 2014 2015 2016 2017 2018 2019 2020 2021A2 USD 10.99 13.46 20.32 26.72 23.14 24.82 28.65 29.93 28.70 45.28Z2 USD – – – – 10.00 99.24 120.23 – – –V2 USD – – – 9.43 8.15 8.74 10.08 – – –H1 USD – – 10.00 11.27 9.82 10.66 12.67 13.23 12.92 20.67H2 USD – 9.80 10.91 14.65 12.76 13.87 16.47 17.21 16.80 26.91I2 HSGD – – – – – – – – 8.63 13.62H1 GBP – – 10.00 11.80 11.01 14.00 15.06 21.41 17.57 24.20H2 GBP 10.00 10.00 14.65 21.30 19.87 25.27 27.19 38.66 31.72 43.74V2 HEUR – – – 9.42 8.13 8.58 9.39 – – –H2 HEUR – 9.87 10.98 14.70 12.79 13.67 15.37 18.28 15.06 23.78H2 EUR – – 10.00 12.03 11.14 12.93 13.63 16.94 15.25 22.25I2 HEUR 10.18 12.70 19.19 25.46 22.09 23.47 26.03 30.95 25.29 39.64I1 USD – – – – 9.89 9.91 11.62 – – –I2 USD 12.18 15.07 23.02 30.58 26.57 28.68 33.60 35.11 33.98 54.04E2 HEUR – 9.41 10.59 13.79 11.90 12.51 13.54 – – –E2 USD – 9.46 10.69 13.95 12.06 12.88 14.72 – – –B2 USD 9.73 11.79 17.58 22.77 19.66 20.90 23.65 24.69 23.40 36.54A2 HKD – – – 8.90 7.76 8.28 9.65 1.29 9.57 15.12A2 HEUR 11.24 13.67 20.55 26.95 23.31 24.61 27.27 31.84 25.88 40.25A2 HCNH – – 9.28 10.87 9.90 10.83 13.05 – – –A2 HAUD – 9.50 10.89 14.66 12.75 13.68 15.58 11.40 15.22 23.62I2 EUR – – 10.00 12.02 11.04 12.74 13.34 – – –
Janus Henderson Global Research FundHigh 2012 2013 2014 2015 2016 2017 2018 2019 2020 2021A2 HEUR 11.05 13.22 14.09 14.86 13.39 15.51 16.62 18.65 19.17 22.62E2 HEUR 10.94 12.97 13.75 14.38 12.87 14.81 15.86 – – –A2 USD 12.19 14.74 15.75 16.68 15.22 18.19 19.54 20.90 24.51 29.17I2 USD 12.99 16.06 17.36 18.50 17.16 20.84 22.40 24.55 29.13 34.98H2 USD – – – – – 10.11 10.87 – – –Z1 USD – 121.39 130.80 140.21 130.37 156.41 169.38 – – –Class I€acc Hedged 11.75 14.37 15.30 15.77 14.43 17.00 18.23 – – –Class U£acc 10.00 12.03 13.76 15.45 17.05 19.36 21.58 – – –
Janus Henderson Global Research FundLow 2012 2013 2014 2015 2016 2017 2018 2019 2020 2021A2 HEUR 9.47 10.78 12.57 12.38 11.10 12.89 12.95 15.21 11.25 18.75E2 HEUR 9.38 10.61 12.29 11.96 10.70 12.37 12.31 – – –A2 USD 10.43 11.97 14.01 13.90 12.48 14.76 15.69 16.18 14.18 24.00I2 USD 11.08 12.88 15.28 15.49 13.97 16.70 18.20 18.78 16.71 28.54H2 USD – – – – – 10.00 8.84 – – –Z1 USD – 99.65 115.64 117.92 105.38 125.50 136.06 – – –Class I€acc Hedged 10.04 11.53 13.23 13.20 11.88 13.95 14.38 – – –Class U£acc 10.00 10.00 11.59 12.55 11.98 16.85 17.86 – – –
Janus Henderson Global Technology and Innovation FundHigh 2012 2013 2014 2015 2016 2017 2018 2019 2020 2021A2 HAUD – – 11.16 12.04 13.22 18.39 21.36 17.27 35.64 43.51A2 HEUR 5.14 6.62 7.14 7.53 8.15 11.10 12.68 16.08 20.90 25.47I2 HEUR 13.08 17.33 18.88 20.11 21.95 30.19 34.68 44.36 58.14 71.36H2 HEUR – 10.87 11.92 12.76 11.35 15.72 18.16 – – –V2 HEUR – – – 10.65 11.53 15.72 17.97 – – –A2 HKD – – 10.85 11.55 12.69 17.80 20.94 3.16 36.30 44.86A2 USD 4.98 6.48 7.00 7.40 8.13 11.34 13.27 15.73 23.28 28.67B2 USD 4.42 5.66 6.06 6.34 6.90 9.53 11.06 12.93 18.95 23.12I2 USD 5.54 7.32 7.99 8.51 9.42 13.27 15.62 18.70 27.89 34.59H2 USD – 10.80 11.87 12.73 14.18 20.12 23.81 – – –V2 USD – – – 10.65 11.69 16.30 19.08 – – –Class ARMB (CNH) acc Hedged – – 11.08 12.09 13.60 19.68 23.27 – – –
DocuSign Envelope ID: 521655BF-9BE3-47DC-A9A3-494932954338

399Janus Henderson Capital Funds plc / 31 December 2021
Additional Information for Hong KongInvestors (unaudited) (continued)
Janus Henderson Global Technology and Innovation FundLow 2012 2013 2014 2015 2016 2017 2018 2019 2020 2021A2 HAUD – – 9.71 10.21 9.42 12.76 16.33 11.82 19.47 34.05A2 HEUR 4.25 5.00 6.23 6.39 5.88 7.84 9.65 11.36 11.37 19.98I2 HEUR 10.70 12.81 16.33 17.02 15.73 21.17 26.45 31.12 31.45 55.66H2 HEUR – 9.98 10.25 9.69 8.09 10.96 13.90 – – –V2 HEUR – – – 9.89 8.32 11.10 13.68 – – –A2 HKD – – 9.53 9.80 9.08 12.26 16.08 2.12 19.52 34.85A2 USD 4.11 4.87 6.10 6.28 5.79 7.86 10.21 10.55 12.52 22.32B2 USD 3.66 4.30 5.32 5.40 4.95 6.66 8.48 8.76 10.26 18.12I2 USD 4.55 5.45 6.90 7.20 6.67 9.12 12.05 12.46 14.91 26.78H2 USD – 9.91 10.19 10.75 9.99 13.75 18.41 – – –V2 USD – – – 9.90 8.33 11.30 14.68 – – –Class ARMB (CNH) acc Hedged – – 9.62 10.23 9.54 13.20 17.92 – – –
Janus Henderson US Contrarian FundHigh 2012 2013 2014 2015 2016 2017 2018 2019 2020 2021A2 HEUR 15.83 16.28 19.74 20.08 19.25 19.59 20.85 26.06 28.84 35.03E2 HEUR 11.27 11.46 13.85 14.02 13.32 13.56 14.40 – – –I2 HEUR 11.49 12.01 15.06 15.26 14.90 15.21 16.58 20.98 23.52 28.79A2 USD 15.32 15.96 19.37 19.74 19.25 19.69 18.75 25.51 32.27 39.49A1 USD 11.86 12.36 15.01 15.29 14.91 15.25 17.03 – – –B2 USD 13.46 13.76 16.54 16.82 16.12 16.45 18.07 20.72 25.91 31.50I2 USD 16.94 18.02 22.12 22.60 22.48 23.04 26.18 30.98 39.65 48.92H2 USD – 10.66 13.11 13.39 13.36 13.70 15.60 – – –Class ARMB(CNH) acc Hedged – – 10.85 11.14 11.41 11.90 13.60 – – –Class I$dis 12.34 13.13 16.12 16.47 16.39 16.80 19.09 – – –Class U£acc 10.00 12.22 15.99 17.14 20.43 21.10 22.81 – – –Class U€acc Hedged 10.73 13.17 13.42 13.18 13.45 14.69 – – –
Janus Henderson US Contrarian FundLow 2012 2013 2014 2015 2016 2017 2018 2019 2020 2021A2 HEUR 12.06 13.03 15.39 16.54 14.51 17.71 16.20 19.03 14.47 27.92E2 HEUR 8.59 9.27 10.83 11.52 10.07 12.23 10.88 – – –I2 HEUR 8.80 9.50 11.36 12.62 11.17 13.84 12.62 15.14 11.68 22.79A2 USD 11.75 12.70 15.08 16.26 14.40 17.99 15.00 17.69 15.93 31.28A1 USD 9.09 9.83 11.68 12.60 11.16 13.94 12.98 – – –B2 USD 10.24 11.06 12.99 13.78 12.12 14.96 13.78 14.51 12.91 25.09I2 USD 13.09 14.17 17.05 18.73 16.72 21.19 20.13 21.21 19.41 38.46H2 USD – 9.94 10.09 11.11 9.93 12.61 12.00 – – –Class ARMB(CNH) acc Hedged – – 9.28 9.33 8.46 10.98 10.42 – – –Class I$dis 9.53 10.33 12.42 13.65 12.19 15.45 14.68 – – –Class U£acc 10.00 10.00 11.71 13.46 13.52 18.17 17.87 – – –Class U€acc Hedged – 10.00 10.15 11.13 9.86 12.25 11.20 – – –
Janus Henderson US Forty FundHigh 2012 2013 2014 2015 2016 2017 2018 2019 2020 2021A2 HAUD – 11.03 12.59 13.92 13.23 16.70 19.10 15.10 28.68 36.03A2 HEUR 15.40 20.21 22.49 24.51 23.27 28.40 31.64 39.45 47.23 59.20E2 HEUR 11.89 15.52 17.23 18.72 17.75 21.45 23.95 – – –I2 HEUR 17.77 23.52 26.44 29.02 27.68 34.38 38.88 48.77 59.03 74.71H2 HEUR – 10.83 12.18 13.38 12.76 15.95 18.06 – – –V2 HEUR – – – 10.47 10.04 12.25 13.73 – – –H2 GBP 10.00 13.16 15.74 17.74 21.06 24.99 29.79 – – –A2 USD 14.91 19.71 21.98 24.02 22.83 28.87 28.54 38.38 52.35 66.20B2 USD 13.01 16.97 18.75 20.35 19.24 23.89 27.27 31.12 42.03 52.68E2 USD – – – – 10.34 13.01 14.91 – – –I2 USD 16.36 21.92 24.67 27.15 26.17 33.45 38.81 45.42 62.64 79.97I1 USD 10.88 14.56 16.39 18.03 17.39 22.23 25.29 – – –H2 USD – 10.76 12.13 13.36 12.91 16.53 19.20 – – –V2 USD – – – 10.47 10.06 12.73 14.64 – – –Class ARMB(CNH)acc Hedged – – 100.00 12.01 11.88 15.56 18.05 – – –
DocuSign Envelope ID: 521655BF-9BE3-47DC-A9A3-494932954338

Janus Henderson Capital Funds plc / 31 December 2021400
Additional Information for Hong KongInvestors (unaudited) (continued)
Janus Henderson US Forty FundLow 2012 2013 2014 2015 2016 2017 2018 2019 2020 2021A2 HAUD – 9.63 10.40 11.98 11.02 12.88 15.05 11.05 16.38 27.74A2 HEUR 12.36 14.91 18.92 21.19 19.40 22.31 25.65 29.86 26.86 45.68E2 HEUR 9.65 11.49 14.53 16.18 14.79 16.93 18.80 – – –I2 HEUR 14.21 17.29 22.09 25.12 23.11 26.74 30.62 36.53 33.29 57.11H2 HEUR – 9.90 10.17 11.57 10.66 12.39 14.24 – – –V2 HEUR – – – 9.76 8.37 9.62 10.79 – – –H2 GBP 10.00 10.00 12.21 15.04 14.89 20.61 23.44 – – –A2 USD 11.92 14.47 18.46 20.73 19.02 22.22 22.90 27.59 29.38 50.65B2 USD 10.47 12.58 15.85 17.54 16.03 18.57 21.56 22.59 23.77 40.65E2 USD – – – – 9.66 10.06 11.80 – – –I2 USD 12.98 15.92 20.58 23.44 21.61 25.48 30.82 32.31 34.86 60.62I1 USD 8.63 10.58 13.67 15.57 14.36 16.93 20.08 – – –H2 USD – 9.84 10.11 11.53 10.65 12.57 15.26 – – –V2 USD – – – 9.76 8.39 9.79 11.60 – – –Class ARMB(CNH)acc Hedged – – 9.25 10.26 9.72 11.58 14.33 – – –
Janus Henderson US Research FundHigh 2012 2013 2014 2015 2016 2017 2018 2019 2020 2021*A2 HEUR 13.80 17.97 19.86 20.65 19.83 23.08 24.82 29.22 31.18 –A2 USD 15.28 20.04 22.15 23.11 22.54 26.81 25.59 32.47 39.43 –B2 USD 13.70 17.72 19.41 20.20 19.30 22.61 24.81 26.56 31.84 –I2 USD 17.16 22.91 25.72 26.91 26.83 32.21 36.06 39.70 48.76 –H2 USD – – – – – 10.04 11.25 – – –Z1 USD – 123.47 138.88 145.70 144.92 174.24 196.85 – – –Class I€acc Hedged 10.46 14.05 15.76 16.45 16.13 18.96 20.70 – – –
Janus Henderson US Research FundLow 2012 2013 2014 2015 2016 2017 2018 2019 2020 2021*A2 HEUR 11.67 13.64 17.10 17.89 16.32 19.43 20.10 23.38 17.87 –A2 USD 12.87 15.13 19.06 20.00 18.28 22.11 20.91 24.68 22.33 –B2 USD 11.61 13.52 16.84 17.40 15.85 18.92 19.70 20.49 18.20 –I2 USD 14.27 17.04 21.82 23.46 21.57 26.32 28.77 29.95 27.36 –H2 USD – – – – – 9.99 8.98 – – –Z1 USD – 98.21 117.73 127.89 116.59 142.25 155.92 – – –Class I€acc Hedged 8.74 10.36 13.38 14.34 13.16 15.81 16.38 – – –
Janus Henderson US Small-Mid Cap Value FundHigh 2012 2013 2014 2015 2016 2017 2018 2019 2020 2021A2 HEUR 14.49 17.31 18.90 18.78 20.26 22.14 22.98 26.40 23.96 28.39E2 HEUR 11.02 13.08 14.21 14.11 15.01 16.24 16.86 – – –I2 HEUR 11.03 13.30 14.64 14.57 15.92 17.54 18.25 21.23 19.29 –H2 HEUR – 10.45 11.56 11.53 12.62 13.92 14.49 – – –A2 USD 16.20 19.49 21.31 21.21 23.32 26.03 23.42 29.59 30.39 36.72A1 USD 11.14 13.41 14.66 14.59 16.04 17.90 18.83 – – –B2 USD 14.32 17.01 18.42 18.30 19.68 21.64 22.56 – 24.31 28.80E2 USD – – – – 10.78 11.91 12.43 – – –I2 USD 17.82 21.65 23.84 23.79 26.48 29.80 31.56 34.41 35.66 43.40H2 USD – 10.38 11.52 12.91 14.55 15.43 – – – –Class U$dis – – – – – 10.05 10.64 – – –Class U£acc 10.00 12.52 14.38 15.13 20.33 21.27 23.02 – – –Class I$dis 11.58 14.07 15.50 15.47 17.22 19.38 20.45 – – –
DocuSign Envelope ID: 521655BF-9BE3-47DC-A9A3-494932954338
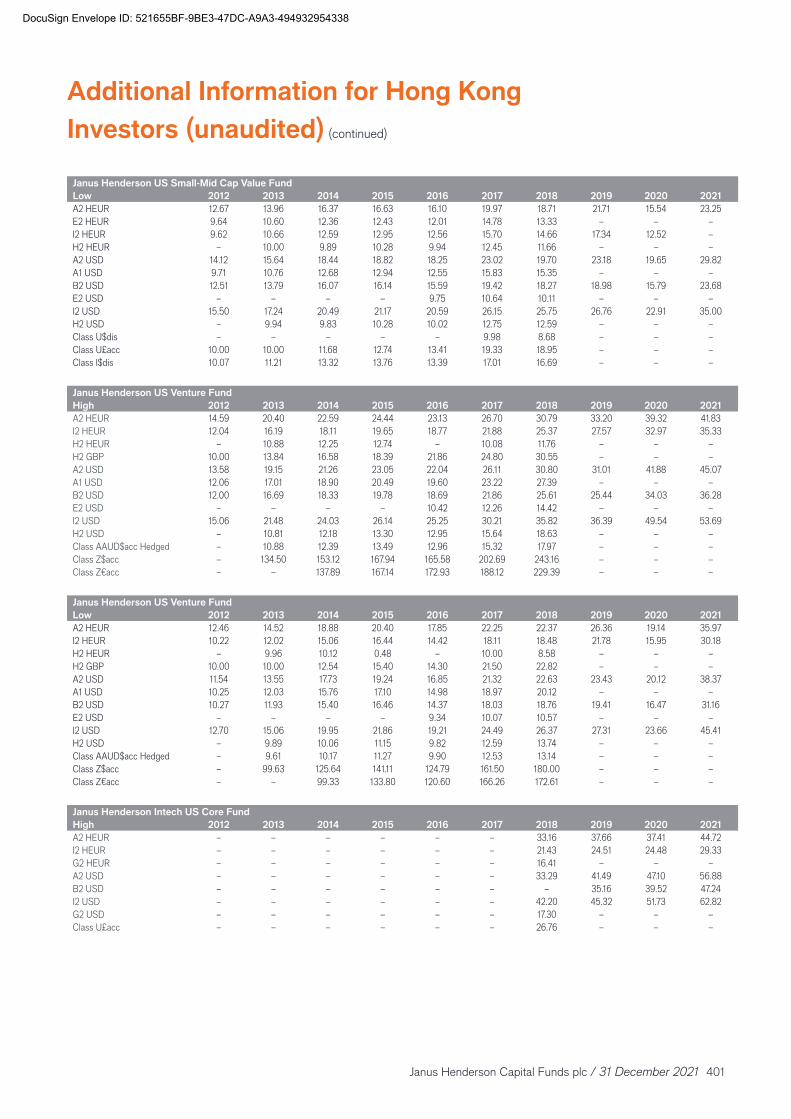
401Janus Henderson Capital Funds plc / 31 December 2021
Additional Information for Hong KongInvestors (unaudited) (continued)
Janus Henderson US Small-Mid Cap Value FundLow 2012 2013 2014 2015 2016 2017 2018 2019 2020 2021A2 HEUR 12.67 13.96 16.37 16.63 16.10 19.97 18.71 21.71 15.54 23.25E2 HEUR 9.64 10.60 12.36 12.43 12.01 14.78 13.33 – – –I2 HEUR 9.62 10.66 12.59 12.95 12.56 15.70 14.66 17.34 12.52 –H2 HEUR – 10.00 9.89 10.28 9.94 12.45 11.66 – – –A2 USD 14.12 15.64 18.44 18.82 18.25 23.02 19.70 23.18 19.65 29.82A1 USD 9.71 10.76 12.68 12.94 12.55 15.83 15.35 – – –B2 USD 12.51 13.79 16.07 16.14 15.59 19.42 18.27 18.98 15.79 23.68E2 USD – – – – 9.75 10.64 10.11 – – –I2 USD 15.50 17.24 20.49 21.17 20.59 26.15 25.75 26.76 22.91 35.00H2 USD – 9.94 9.83 10.28 10.02 12.75 12.59 – – –Class U$dis – – – – – 9.98 8.68 – – –Class U£acc 10.00 10.00 11.68 12.74 13.41 19.33 18.95 – – –Class I$dis 10.07 11.21 13.32 13.76 13.39 17.01 16.69 – – –
Janus Henderson US Venture FundHigh 2012 2013 2014 2015 2016 2017 2018 2019 2020 2021A2 HEUR 14.59 20.40 22.59 24.44 23.13 26.70 30.79 33.20 39.32 41.83I2 HEUR 12.04 16.19 18.11 19.65 18.77 21.88 25.37 27.57 32.97 35.33H2 HEUR – 10.88 12.25 12.74 – 10.08 11.76 – – –H2 GBP 10.00 13.84 16.58 18.39 21.86 24.80 30.55 – – –A2 USD 13.58 19.15 21.26 23.05 22.04 26.11 30.80 31.01 41.88 45.07A1 USD 12.06 17.01 18.90 20.49 19.60 23.22 27.39 – – –B2 USD 12.00 16.69 18.33 19.78 18.69 21.86 25.61 25.44 34.03 36.28E2 USD – – – – 10.42 12.26 14.42 – – –I2 USD 15.06 21.48 24.03 26.14 25.25 30.21 35.82 36.39 49.54 53.69H2 USD – 10.81 12.18 13.30 12.95 15.64 18.63 – – –Class AAUD$acc Hedged – 10.88 12.39 13.49 12.96 15.32 17.97 – – –Class Z$acc – 134.50 153.12 167.94 165.58 202.69 243.16 – – –Class Z€acc – – 137.89 167.14 172.93 188.12 229.39 – – –
Janus Henderson US Venture FundLow 2012 2013 2014 2015 2016 2017 2018 2019 2020 2021A2 HEUR 12.46 14.52 18.88 20.40 17.85 22.25 22.37 26.36 19.14 35.97I2 HEUR 10.22 12.02 15.06 16.44 14.42 18.11 18.48 21.78 15.95 30.18H2 HEUR – 9.96 10.12 0.48 – 10.00 8.58 – – –H2 GBP 10.00 10.00 12.54 15.40 14.30 21.50 22.82 – – –A2 USD 11.54 13.55 17.73 19.24 16.85 21.32 22.63 23.43 20.12 38.37A1 USD 10.25 12.03 15.76 17.10 14.98 18.97 20.12 – – –B2 USD 10.27 11.93 15.40 16.46 14.37 18.03 18.76 19.41 16.47 31.16E2 USD – – – – 9.34 10.07 10.57 – – –I2 USD 12.70 15.06 19.95 21.86 19.21 24.49 26.37 27.31 23.66 45.41H2 USD – 9.89 10.06 11.15 9.82 12.59 13.74 – – –Class AAUD$acc Hedged – 9.61 10.17 11.27 9.90 12.53 13.14 – – –Class Z$acc – 99.63 125.64 141.11 124.79 161.50 180.00 – – –Class Z€acc – – 99.33 133.80 120.60 166.26 172.61 – – –
Janus Henderson Intech US Core FundHigh 2012 2013 2014 2015 2016 2017 2018 2019 2020 2021A2 HEUR – – – – – – 33.16 37.66 37.41 44.72I2 HEUR – – – – – – 21.43 24.51 24.48 29.33G2 HEUR – – – – – – 16.41 – – –A2 USD – – – – – – 33.29 41.49 47.10 56.88B2 USD – – – – – – – 35.16 39.52 47.24I2 USD – – – – – – 42.20 45.32 51.73 62.82G2 USD – – – – – – 17.30 – – –Class U£acc – – – – – – 26.76 – – –
DocuSign Envelope ID: 521655BF-9BE3-47DC-A9A3-494932954338

Janus Henderson Capital Funds plc / 31 December 2021402
Additional Information for Hong KongInvestors (unaudited) (continued)
Janus Henderson Intech US Core FundLow 2012 2013 2014 2015 2016 2017 2018 2019 2020 2021A2 HEUR – – – – – – 26.02 30.18 21.73 36.72I2 HEUR – – – – – – 16.54 19.53 14.16 24.04G2 HEUR – – – – – – 12.70 – – –A2 USD – – – – – – 27.16 31.64 26.98 46.28B2 USD – – – – – – – 27.08 22.81 38.80I2 USD – – – – – – 33.12 34.37 29.51 50.85G2 USD – – – – – – 13.60 – – –Class U£acc – – – – – – 21.37 – – –
Janus Henderson Global Real Estate Equity Income FundHigh 2012 2013 2014 2015 2016 2017 2018 2019 2020 2021A3 q HAUD – 10.55 11.78 12.02 11.40 11.63 12.00 9.24 13.99 14.75Class ARMB (CNH) acc Hedged – – 100.00 11.25 11.75 13.16 13.82 – – –H1 q USD – – – – – 10.10 10.44 – – –H2 USD – – – – – 10.10 10.61 – – –I1 q USD 11.78 13.24 14.26 14.62 14.45 15.29 15.80 18.53 19.60 22.25I2 USD – – – – – – 10.13 – – –B1 q USD 11.76 13.18 14.12 14.37 14.18 14.96 15.44 18.01 19.07 21.34B2 USD 12.68 14.21 15.22 15.49 15.37 16.30 16.85 19.71 20.87 23.37A3 q USD 11.81 13.27 14.02 14.19 13.58 13.96 14.40 16.23 17.03 18.63A2 USD 13.89 15.62 16.97 17.38 17.48 18.78 19.54 23.13 24.56 28.02H1 q HGBP – – 10.27 10.53 10.26 10.65 10.98 – – –H1 q GBP – – 11.10 12.17 13.88 14.14 15.14 – – –I2 HEUR 10.11 14.28 15.63 15.76 15.65 16.56 17.05 21.85 20.64 23.27E3 q HEUR – 10.56 11.07 11.17 10.48 10.36 10.65 – – –E2 HEUR – 10.56 11.37 11.55 11.35 11.77 12.09 – – –A2 HEUR 12.13 13.60 14.70 14.98 14.83 15.48 15.91 20.01 18.88 20.88Class U€acc Hedged – – – – – 10.09 10.39 – – –A5m USD – – – – – – – – – 10.72
Janus Henderson Global Real Estate Equity Income FundLow 2012 2013 2014 2015 2016 2017 2018 2019 2020 2021A3 q HAUD – 9.92 10.19 10.20 9.15 10.43 10.34 7.32 8.41 12.18Class ARMB (CNH) acc Hedged – – 9.93 9.85 9.06 11.00 12.33 – – –H1 q USD – – – – – 9.90 9.28 – – –H2 USD – – – – – 9.90 9.47 – – –I1 q USD 8.92 11.44 12.20 12.56 11.36 13.37 14.04 14.20 11.95 17.93I2 USD – – – – – – 9.04 – – –B1 q USD 8.94 11.40 12.10 12.36 11.14 13.11 13.70 13.85 11.60 17.34B2 USD 9.59 12.29 13.04 13.36 12.04 14.23 14.95 15.12 12.70 18.99A3 q USD 8.94 11.47 12.18 12.07 10.84 12.48 12.52 12.66 10.37 15.29A2 USD 10.40 13.53 14.45 15.05 13.61 16.23 17.40 17.59 14.96 22.56H1 q HGBP – – 9.50 9.03 8.16 9.46 9.57 – – –H1 q GBP – – 9.99 10.01 9.69 13.13 12.80 – – –I2 HEUR 7.55 10.11 13.24 13.54 12.26 14.48 15.02 17.21 12.52 18.74E3 q HEUR – 9.13 9.65 9.47 8.46 9.47 8.95 – – –E2 HEUR – 9.13 9.69 9.96 8.97 10.45 10.50 – – –A2 HEUR 9.15 11.77 12.54 12.95 11.68 13.67 13.87 15.89 11.44 16.98Class U€acc Hedged – – – – – 9.90 9.17 – – –A5m USD – – – – – – – – – 9.91
DocuSign Envelope ID: 521655BF-9BE3-47DC-A9A3-494932954338

403Janus Henderson Capital Funds plc / 31 December 2021
Additional Information for Hong KongInvestors (unaudited) (continued)
Janus Henderson Flexible Income FundHigh 2012 2013 2014 2015 2016 2017 2018 2019 2020 2021A2 USD 19.83 19.99 20.26 20.55 20.84 20.79 20.59 21.84 23.65 23.65Z2 USD – – 103.83 106.21 110.70 112.57 112.18 – – –V3 m HAUD – 10.08 9.83 9.86 9.65 9.25 9.02 – – –V3 m USD 10.05 9.95 9.58 9.52 9.21 8.83 8.63 – – –H2 HEUR – 10.08 10.57 10.79 11.10 11.05 10.92 – – –H1 m USD – – – – – 10.00 9.99 – – –H2 USD – 10.00 10.48 10.68 11.00 11.11 11.04 – – –I2 HEUR 22.69 22.96 23.55 23.93 24.35 24.02 23.67 26.98 26.08 26.08I1 m USD 12.65 12.66 12.52 12.62 12.60 12.37 12.18 12.57 13.41 13.41I2 USD 10.41 10.54 10.88 11.10 11.44 11.55 11.49 12.43 13.68 13.70E2 HEUR 10.72 10.78 10.85 10.97 10.94 10.61 10.41 – – –E3 m USD – – – – 10.03 9.64 9.41 – – –E2 USD – – – – 10.04 10.00 9.89 – – –B1 m HEUR 11.70 11.69 11.54 11.60 11.41 10.95 10.68 11.67 10.91 10.85B1 m USD 12.60 12.61 12.48 12.57 12.54 12.31 12.14 12.51 13.35 13.33B2 USD 17.44 17.50 17.50 17.67 17.67 17.42 17.20 17.94 19.20 19.16A3 m HKD – 10.09 9.73 9.65 9.35 9.03 8.82 1.13 9.15 9.06A2 HEUR 22.41 22.55 22.78 23.06 23.08 22.45 21.88 24.70 23.47 23.44A3 m HAUD – 10.09 9.72 9.71 9.50 9.10 8.88 6.09 9.08 8.98A3 m USD 12.61 12.62 12.22 12.14 11.75 11.27 11.01 10.98 11.50 11.39E3 m HEUR 10.53 10.52 10.23 10.13 9.64 9.09 8.70 – – –
Janus Henderson Flexible Income FundLow 2012 2013 2014 2015 2016 2017 2018 2019 2020 2021A2 USD 18.52 19.08 19.48 19.89 19.92 20.05 19.84 20.14 20.69 21.48Z2 USD – – 99.93 103.52 104.38 107.55 109.47 – – –V3 m HAUD – 9.53 9.62 9.35 9.11 8.98 8.39 – – –V3 m USD 9.91 9.34 9.33 8.94 8.70 8.59 8.05 – – –H2 HEUR – 9.80 10.05 10.53 10.55 10.68 10.46 – – –H1 m USD – – – – – 9.94 9.49 – – –H2 USD – 9.95 9.98 10.42 10.44 10.65 10.74 – – –I2 HEUR 20.97 21.93 22.46 23.25 23.29 23.30 22.47 25.64 22.79 23.67I1 m USD 12.00 12.02 12.19 12.10 12.02 12.03 11.58 11.69 11.80 12.18I2 USD 9.96 10.10 10.36 10.83 10.85 11.08 11.17 11.38 11.85 12.43E2 HEUR 10.06 10.27 10.48 10.53 10.41 10.37 9.77 – – –E3 m USD – – – – 9.51 9.37 8.76 – – –E2 USD – – – – 9.64 9.65 9.50 – – –B1 m HEUR 11.12 11.09 11.24 11.04 10.81 10.66 9.90 11.19 9.66 9.84B1 m USD 11.95 11.97 12.15 12.05 11.98 11.97 11.53 11.66 11.76 12.10B2 USD 16.43 16.65 16.95 16.96 16.89 16.89 16.43 16.65 16.90 17.39A3 m HKD – 9.53 9.48 9.07 8.83 8.80 8.24 1.06 8.12 8.23A2 HEUR 20.97 21.49 21.93 22.18 21.98 21.90 20.66 23.56 20.69 21.27A3 m HAUD – 9.42 9.50 9.20 8.97 8.85 8.26 5.78 8.05 8.15A3 m USD 11.96 11.91 11.90 11.41 11.10 10.96 10.27 10.34 10.19 10.35E3 m HEUR 10.03 9.97 9.94 9.43 9.01 8.68 7.89 – – –
Janus Henderson Global Investment Grade Bond FundHigh 2012 2013 2014 2015 2016 2017 2018 2019 2020 2021*A2 HEUR 11.18 11.25 11.85 11.38 11.29 11.26 11.21 12.50 12.17 –Z1 USD – 104.51 111.63 104.73 106.07 107.04 105.04 – – –H1m USD – – – – – 10.04 10.12 – – –H2 USD – – – – – 10.04 10.14 – – –I1m USD 10.72 10.74 11.14 10.65 10.58 10.66 10.67 11.04 12.10 –I2 USD 11.45 11.68 12.42 12.03 12.42 12.86 12.98 14.03 15.69 –A3m USD 10.72 10.74 10.94 10.33 9.88 9.74 9.66 9.66 10.32 –I1m HEUR 10.73 10.75 11.09 10.54 10.25 10.09 9.99 10.93 10.49 –I2 HEUR 11.46 11.58 12.29 11.03 11.29 11.40 11.41 12.98 12.76 –E3m HEUR 10.59 10.60 10.70 10.06 9.35 8.95 8.77 – – –E2 HEUR 10.74 10.77 11.30 10.83 10.69 10.61 10.54 – – –A3m HEUR 10.72 10.73 10.89 10.26 9.60 9.24 9.07 9.59 8.96 –A2 USD 11.17 11.29 11.91 11.46 11.62 11.87 11.94 12.62 14.00 –
DocuSign Envelope ID: 521655BF-9BE3-47DC-A9A3-494932954338

Janus Henderson Capital Funds plc / 31 December 2021404
Additional Information for Hong KongInvestors (unaudited) (continued)
Janus Henderson Global Investment Grade Bond FundLow 2012 2013 2014 2015 2016 2017 2018 2019 2020 2021*A2 HEUR 10.04 10.67 11.18 10.57 10.48 10.54 10.22 11.68 10.09 –Z1 USD – 99.36 104.23 96.81 96.30 97.43 96.64 – – –H1m USD – – – – – 9.95 9.37 – – –H2 USD – – – – – 9.95 9.57 – – –I1m USD 9.78 10.19 10.60 9.87 9.79 9.93 9.88 10.00 10.02 –I2 USD 10.13 11.03 11.65 11.41 11.34 11.76 12.26 12.42 12.81 –A3m USD 9.77 10.18 10.31 9.36 9.13 9.17 8.78 8.86 8.66 –I1m HEUR 9.83 10.17 10.52 9.68 9.48 9.51 9.02 10.29 8.77 –I2 HEUR 10.20 10.96 11.00 10.49 10.41 10.60 10.50 12.03 10.52 –E3m HEUR 9.71 10.03 10.04 8.98 8.58 8.55 7.74 – – –E2 HEUR 9.73 10.22 10.69 10.03 9.92 9.95 9.57 – – –A3m HEUR 9.82 10.16 10.24 9.20 8.82 8.81 8.04 9.11 7.59 –A2 USD 9.99 10.69 11.23 10.76 10.68 10.95 11.17 11.31 11.50 –
Janus Henderson High Yield FundHigh 2012 2013 2014 2015 2016 2017 2018 2019 2020 2021A3m HAUD 11.16 11.50 11.33 10.58 10.00 10.09 9.84 6.66 9.33 9.17I1m USD 9.57 9.87 9.90 9.34 9.07 9.20 9.15 9.13 9.22 9.44I2 USD 14.03 15.05 15.91 15.81 16.79 17.81 18.08 19.82 21.06 22.25B1m USD 9.56 9.86 9.89 9.33 9.07 9.20 9.14 9.13 9.21 9.42B2 USD 20.02 21.03 22.00 21.44 22.03 22.98 23.06 24.42 25.40 26.41A3m USD 9.54 9.84 9.66 8.95 8.42 8.49 8.30 7.96 8.00 7.99A2 USD 22.75 24.15 25.38 24.97 26.06 27.40 27.57 29.77 31.29 32.76A3m HKD 10.71 11.06 10.84 10.06 9.46 9.55 9.41 1.15 9.02 8.98I2 HEUR 21.17 22.62 23.91 23.71 24.68 25.70 25.75 30.00 27.91 29.28E3m HEUR 10.69 10.96 10.82 9.98 9.17 9.17 8.77 – – –E2 HEUR 11.36 11.97 12.56 12.26 12.50 12.88 12.86 – – –B1m HEUR 9.86 10.16 10.17 9.55 9.12 9.20 8.95 9.55 8.45 8.48A2 HEUR 25.48 26.93 28.31 27.73 28.37 29.30 29.28 33.39 30.72 31.97A2 HKD 11.47 12.19 12.80 12.60 13.15 13.92 14.04 1.94 15.78 16.60
Janus Henderson High Yield FundLow 2012 2013 2014 2015 2016 2017 2018 2019 2020 2021A3m HAUD 10.31 10.74 10.12 9.44 9.12 9.69 8.70 6.13 7.14 8.59I1m USD 8.92 9.25 8.92 8.43 8.17 8.99 8.28 8.34 7.12 8.74I2 USD 12.27 14.00 14.77 14.78 14.41 16.79 17.14 17.26 15.64 19.98B1m USD 8.91 9.24 8.92 8.44 8.17 8.99 8.28 8.34 7.12 8.73B2 USD 17.88 19.78 20.23 19.82 19.27 22.03 21.58 21.72 19.17 24.08A3m USD 8.89 9.20 8.60 7.96 7.69 8.17 7.37 7.42 6.17 7.47A2 USD 20.12 22.59 23.45 23.20 22.59 26.06 26.04 26.21 23.43 29.67A3m HKD 10.00 10.34 9.66 8.94 8.68 9.25 8.37 1.08 6.93 8.40I2 HEUR 18.57 21.08 22.18 22.09 21.50 24.67 23.91 27.28 20.95 26.46E3m HEUR 10.06 10.27 9.61 8.80 8.48 8.68 7.55 – – –E2 HEUR 10.16 11.22 11.57 11.34 11.02 12.49 11.79 – – –B1m HEUR 9.22 9.51 9.16 8.60 8.32 8.85 7.88 8.99 6.51 7.89A2 HEUR 22.62 25.24 26.12 25.68 24.96 28.36 26.91 30.69 23.26 29.11A2 HKD 10.17 11.40 11.84 11.71 11.46 13.15 13.27 1.71 11.83 14.97
Janus Henderson Multi-Sector Income FundHigh 2012 2013 2014 2015 2016 2017 2018 2019 2020 2021A2 HEUR – – – – – – – – 11.80 12.08H3m USD – – – – – – – – 10.17 10.18H2 USD – – – – – – – – 10.55 10.90A2 USD – – – – – – – – 10.48 10.78A4m USD – – – – – – – – 10.14 10.00
Janus Henderson Multi-Sector Income FundLow 2012 2013 2014 2015 2016 2017 2018 2019 2020 2021A2 HEUR – – – – – – – – 9.41 10.64H3m USD – – – – – – – – 8.25 9.13H2 USD – – – – – – – – 8.34 9.53A2 USD – – – – – – – – 8.32 9.46A4m USD – – – – – – – – 8.20 8.98
DocuSign Envelope ID: 521655BF-9BE3-47DC-A9A3-494932954338

405Janus Henderson Capital Funds plc / 31 December 2021
Additional Information for Hong KongInvestors (unaudited) (continued)
Janus Henderson US Short-Term Bond FundHigh 2012 2013 2014 2015 2016 2017 2018 2019 2020 2021A1m HCHF 10.11 10.08 10.01 9.89 9.63 9.45 9.14 – – –Class Z$acc – 100.29 101.97 103.01 105.09 106.87 108.53 – – –Class U£inc Hedged 10.00 10.09 10.09 9.74 9.73 9.61 9.43 – – –Class U£acc Hedged 10.00 10.19 10.31 10.34 10.45 10.42 10.32 – – –Class AAUD$inc Hedged – 10.10 10.17 10.19 10.25 10.22 10.12 – – –H1m USD – 10.01 10.04 9.97 9.96 9.92 9.84 – – –H2 USD – 10.01 10.11 10.14 10.26 10.36 10.43 – – –I1m USD 11.36 11.35 11.33 11.25 11.24 11.20 11.10 11.20 11.51 11.51I2 USD 10.13 10.24 10.33 10.35 10.48 10.58 10.64 11.06 11.58 11.70E2 USD – – – – – – 10.00 – – –B1m USD 11.33 13.32 11.30 11.19 11.14 11.09 10.99 11.09 11.38 11.38B2 USD 14.78 14.82 14.81 14.68 14.61 14.55 14.43 14.75 15.19 15.19A1m USD 11.32 11.31 11.30 11.22 11.21 11.17 11.08 11.18 11.48 11.48A2 USD 16.43 16.54 16.65 16.61 16.72 16.85 16.91 17.54 18.32 18.37I1m HGBP 10.00 9.99 9.98 9.91 5.48 5.41 5.30 – – –H2 HEUR – – – – – 10.00 9.98 – – –I2 HEUR 12.41 12.49 12.57 12.59 12.59 12.46 12.27 13.90 12.48 12.48E3m HEUR 10.10 10.09 9.96 9.62 9.20 8.88 8.45 – – –E2 HEUR 10.23 10.26 10.28 10.21 10.07 9.90 9.66 – – –A2 HEUR 18.52 18.59 18.69 18.60 18.48 18.27 17.98 20.33 18.16 18.16
Janus Henderson US Short-Term Bond FundLow 2012 2013 2014 2015 2016 2017 2018 2019 2020 2021A1m HCHF 10.00 9.88 9.85 9.60 9.44 9.14 8.72 – – –Class Z$acc – 99.94 100.25 101.57 102.52 104.85 106.49 – – –Class U£inc Hedged 10.00 9.92 9.67 9.61 9.59 9.42 9.14 – – –Class U£acc Hedged 10.00 10.00 10.19 10.26 10.28 10.32 10.22 – – –Class AAUD$inc Hedged – 10.00 10.07 10.09 10.10 10.11 9.95 – – –H1m USD – 9.99 9.90 9.83 9.83 9.83 9.71 – – –H2 USD – 9.99 10.01 10.06 10.07 10.22 10.29 – – –I1m USD 11.16 11.16 11.17 11.09 11.09 11.09 10.96 10.98 10.65 10.92I2 USD 10.00 10.07 10.23 10.28 10.29 10.44 10.50 10.64 10.60 10.99E2 USD – – – – – – 9.99 – – –B1m USD 11.14 11.14 11.13 11.02 11.02 10.99 10.85 10.87 10.55 10.80B2 USD 14.47 14.59 14.60 14.45 14.44 14.43 14.31 14.37 14.06 14.41A1m USD 11.12 11.12 11.14 11.06 11.06 11.07 10.93 10.95 10.63 10.89A2 USD 15.98 16.29 16.48 16.44 16.45 16.65 16.71 16.91 16.79 17.38I1m HGBP 9.95 9.82 9.86 5.42 5.40 5.30 5.15 – – –H2 HEUR – – – – – 9.98 9.77 – – –I2 HEUR 11.99 12.29 12.42 12.44 12.43 12.27 12.00 13.22 11.52 11.84E3m HEUR 9.96 9.91 9.59 9.19 8.88 8.45 7.93 – – –E2 HEUR 9.97 10.11 10.13 10.01 9.89 9.65 9.35 – – –A2 HEUR 18.07 18.32 18.47 18.31 18.23 17.97 17.56 19.30 16.80 17.22
*From September 2021 Janus Henderson US Research Fund and Janus Henderson Global Investment Grade Bond Fund was no longer registered in Hong Kong.
Formation costs
There were no formation expenses being charged during the year.
DocuSign Envelope ID: 521655BF-9BE3-47DC-A9A3-494932954338

Janus Henderson Capital Funds plc / 31 December 2021406
Additional Information for Hong KongInvestors (unaudited) (continued)
Other Income Breakdown
The following table is a breakdown of Other income per each relevant sub-fund for the year ended 31 December 2021:
Janus Henderson Balanced Fund
Janus Henderson Global Life
Sciences Fund
Janus Henderson Global Research
Fund
Janus Henderson Global
Technology and Innovation Fund
Janus Henderson US Contrarian
FundJanus Henderson
US Forty Fund
Janus Henderson US Small-Mid
Cap Value Fund
Litigation income 108,731 3,311,803 4,381 11,969 50,912 273,413 14,096Securities lending income 1,175 56,453 1,291 59,799 448 63 150Other income 109,906 3,368,256 5,672 71,768 51,360 273,476 14,246
Janus Henderson US Venture Fund
Janus Henderson Intech US Core
Fund
Janus Henderson Global Real
Estate Equity Income Fund
Janus Henderson Flexible Income
FundJanus Henderson
High Yield Fund
Janus Henderson Multi-Sector
Income Fund
Janus Henderson US Short-Term
Bond Fund
Interest income – – – 5,096 168,741 41,708 –Litigation income 67,704 12,360 – 3,146 112,028 – 733Securities lending income 7,113 – 5,000 1,971 315 – –Other income 74,817 12,360 5,000 10,213 281,084 41,708 733
Transaction Costs
Transactions costs incurred during the year ended 31 December 2021 relate to brokerage and exchange and a breakdown of transaction costs is disclosed in note 12 of the financial statements.
Collateral
Janus Henderson Capital funds do not reinvest collateral received on OTC positions. A breakdown of collateral is disclosed below:
Funds Counterparty Collateral Pledged (USD) Maturity % NAVJanus Henderson Flexible Income Fund Goldman Sachs 20,000 Open 0.00Janus Henderson Multi-Sector Income Fund Goldman Sachs 539,000 Open 0.19Janus Henderson US Short-Term Bond Fund Goldman Sachs 250,000 Open 0.09
DocuSign Envelope ID: 521655BF-9BE3-47DC-A9A3-494932954338